Electrically Switched Cesium Ion Exchange - International ...
Upload
khangminh22Category
view
1download
0
D O E / E T / 1 5 4 2 0 — T l
DE03 0C4388
CESIUM-PLASMA-CONDUCTIVITY ENHANCEMENT IN THE
ADVANCED THERMIONIC ENERGY CONVERTER
Final Report
by
Constantine N. Manikopoulos, Pr inc ipal Invest iga tor Department of E lec t r i ca l Engineering
College of Engineering Rutgers, The State Univers i ty o f New Jersey
Piscataway, NJ 08854
NOTICE
PORTIONS OF THIS REPORT ARE ILLEGIBLE. It has been reproduced from the best available copy to permit the broadest possible avail-ability.
Sponsored by
U.S. Department of Energy Chicago Operations Office 9800 South Cass Avenue Argonne, IL 60439
Contract Identification Number DE-AC02-79ET 15420

DISCLAIMER
This report was prepared as an account of work sponsored by an agency of the United States Government. Neither the United States Government nor any agency Thereof, nor any of their employees, makes any warranty, express or implied, or assumes any legal liability or responsibility for the accuracy, completeness, or usefulness of any information, apparatus, product, or process disclosed, or represents that its use would not infringe privately owned rights. Reference herein to any specific commercial product, process, or service by trade name, trademark, manufacturer, or otherwise does not necessarily constitute or imply its endorsement, recommendation, or favoring by the United States Government or any agency thereof. The views and opinions of authors expressed herein do not necessarily state or reflect those of the United States Government or any agency thereof.

DISCLAIMER Portions of this document may be illegible in electronic image products. Images are produced from the best available original document.

TABLE OF CONTENTS
Abstract iii
1. Introduction 1
2. Resonance Photoabsorption in a Cesium Discharge 3
a. Theoretical Background 3
b. Experimental Results in Absorption of Resonance Radiation 11
3. Ionization Processes in a Cesium Discharge in the
Presence of Resonance Radiation 13
a. Theory 13
b. Experimental Method 23
c. Experimental Results 25
4. Cesium Plasma Sustenance by Application of
Microwave Power 25
a. Experimental Measurements 25
b. Theoretical Considerations 32 References 40
ii

ABSTRACT
Two methods of plasma conductivity enhancement in a cesium vapor thermionic
energy converter have been studied. The first involves resonance photoabsorption
of several cesium lines and the second utilizes cesium plasma sustenance by
application of microwave power.
An extensive study of ionization processes in a cesium discharge in the
presence of resonance ionization was made. Calculations were made of expected
percentage excitation levels for several cesium resonance transitions for
different values of neutral density and temperature as well as incident radiation
power levels. The results of some of these computations were tabulated. Several
ionization schemes were considered. A number of cesium transitions were investigated
in the range of 799 to 870 nanometers for four different cesium reservoir tempera
tures, 467, 511, 550 and 591 K. The related absorption coefficients of the radia
tion lines in the plasma were deduced and tabulated. The resulting plasma
conductivity increase was recorded and the associated ionization enhancement was
deduced.
A microwave cavity was built where the emitter and collector of a simple
thermionic converter made up two of the cavity walls and resonant microwave power
was externally applied. The I-V characteristics of the thermionic converter
were studied under several microwave power levels in the range of 0-2 watts.
Significant shifts to higher currents were observed as the microwave power levels
were raised. It was also found that the knee of the ignition point of the I-V
curves shifted to lower voltage as the microwave power increased and then dis
appeared completely at the level of about 1 watt.
In conclusion, both methods show promise as auxiliary ionization mechanisms
for the thermionic energy converter, especially at low emitter temperatures.
i i i
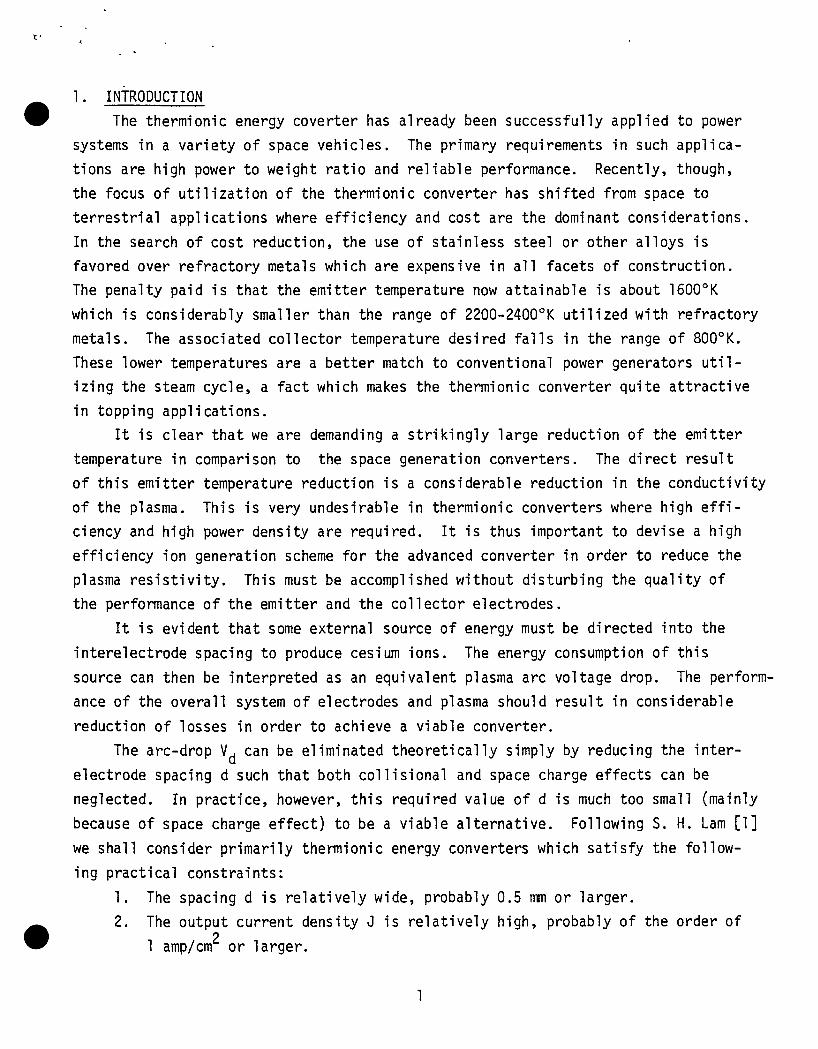
1. INTRODUCTION
The thermionic energy coverter has already been successfully applied to power
systems in a variety of space vehicles. The primary requirements in such applica
tions are high power to weight ratio and reliable performance. Recently, though,
the focus of utilization of the thermionic converter has shifted from space to
terrestrial applications where efficiency and cost are the dominant considerations.
In the search of cost reduction, the use of stainless steel or other alloys is
favored over refractory metals which are expensive in all facets of construction.
The penalty paid is that the emitter temperature now attainable is about 1600°K
which is considerably smaller than the range of 2200-2400°K utilized with refractory
metals. The associated collector temperature desired falls in the range of 800°K.
These lower temperatures are a better match to conventional power generators util
izing the steam cycle, a fact which makes the thermionic converter quite attractive
in topping applications.
It is clear that we are demanding a strikingly large reduction of the emitter
temperature in comparison to the space generation converters. The direct result
of this emitter temperature reduction is a considerable reduction in the conductivity
of the plasma. This is very undesirable in thermionic converters where high effi
ciency and high power density are required. It is thus important to devise a high
efficiency ion generation scheme for the advanced converter in order to reduce the
plasma resistivity. This must be accomplished without disturbing the quality of
the performance of the emitter and the collector electrodes.
It is evident that some external source of energy must be directed into the
interelectrode spacing to produce cesium ions. The energy consumption of this
source can then be interpreted as an equivalent plasma arc voltage drop. The perform
ance of the overall system of electrodes and plasma should result in considerable
reduction of losses in order to achieve a viable converter.
The arc-drop V. can be eliminated theoretically simply by reducing the inter
electrode spacing d such that both collisional and space charge effects can be
neglected. In practice, however, this required value of d is much too small (mainly
because of space charge effect) to be a viable alternative. Following S. H. Lam [1]
we shall consider primarily thermionic energy converters which satisfy the follow
ing practical constraints:
1. The spacing d is relatively wide, probably 0.5 mm or larger.
2. The output current density J is relatively high, probably of the order of 2
1 amp/cm or larger.
1

3.' The emitter temperature Tr is re lat ive ly low, probably in the range
1500°K-1800°K.
These practical constraints have the following immediate consequences. Items
(2) and (3) render the emitter impotent as a positive ion supplier; thus the con
verter must operate with other posit ive ion mechanisms. Items (1) and (2) set a
lower l im i t for pd (m i l - t o r r ) ; in general we expect pd to be a number larger than
unity. Thus, the electrons must suffer col l is ions as they flow across the converter.
I f ions are produced by an auxi l iary process, an equivalent plasma maintenance
voltage drop V . must be introduced as a converter voltage loss [2]
I V V V* - auxi l iary power _ a a _ a d ~ output current I A"
where V is of the order of the ionization potent ia l , V., for the ignited tr iode and
is the order of the difference between V. and the ionizer work function (J)T for the
unignited t r iode. A = I / I is the current amplif ication factor. The adjusted a
barrier index would thus read:
\ = •c - d * <
In summary, advanced performance in converters can be achieved through the
significant reduction of 41 or the suppression of V.. But these accomplishments
must be achieved in such a way that a negligible voltage loss (V .) is introduced
by the auxiliary ion production.
A very direct and informative method of achieving expected efficiency increases
in the operation of a thermionic converter is by laser line pumping of the thermionic
cesium plasma. Let us consider an atom pumped by a laser from the lower cesium
states to some upper level. If in this process, the "bottleneck" in ionization is
crossed, it is expected that the excited cesium atom will preferentially be collision-
ally excited by electrons in the plasma to higher levels eventually becoming an ion.
In order to produce ions, direct photoionization will not be necessary; laser pump
ing followed by step ionization in the plasma can accomplish this task. In principle,
such a laser line ionization process should be the most efficient in comparison to
all others, if for the moment we overlook the energy required to generate the laser
radiation. Furthermore, it is a "clean" method of studying the ionization require
ments and effects in the thermionic plasma because it essentially decouples ioniza
tion from the electron gas, i.e. no hot electrons are required for ionization.
2

Therefore, we can now increase the electron density without raising the electron
temperature. This is important in providing experimental verification to recent
theoretical predictions about the required level of the concentration in a converter
for significantly reducing the plasma arc drop losses.
A very intriguing, although admittedly very speculative, operating mode of a
thermionic converter could evolve in which a thermionic laser is combined with a
laser pumped region. In this design, part of the cesium plasma discharge would be
operating in the thermionic laser mode supplying laser radiation to another part
of the discharge where it would be used to enhance the ionization and thus efficiently
produce electrical power.
The cesium plasma resistivity in the thermionic converter has been the focus of
much attention in the past several years. Theoretical discussions and treatments
have been presented by several researchers in the field.
Laboratory experiments have been carried out in which we have achieved cesium
plasma sustenance or pumping by the application of either DC or pulsed microwave
power into a thermionic converter. External microwave power of high frequency and
high power are applied to the interelectrodes spacing. The electron temperature and
plasma density are thus raised while the plasma resistivity is lowered. By controlling
the input microwave power level and/or frequency, we may change the plasma density
and electron temperature. These changes can be achieved either in the DC or in
the pulsed mode.
There are several advantages in utilizing microwave power as an external source
of ionization, namely, simplicity of power coupling (electodeless), flexibility in
control (both input power level and frequency are easily adjustable), minimum dis
turbance to the thermionic surfaces, and the possibility in some modes (particularly
TEM modes) to couple power into very narrow emitter collector separations. Some
preliminary work has been done in the area with encouraging first results [3,4].
2. RESONANCE PHOTOABSORPTION IN A CESIUM DISCHARGE
a. Theoretical Background
The amount of radiant energy that a gas, occupying a known volume at a known
vapor pressure, can absorb may be computed if the absorption coefficient of the
gas as a function of frequency is known and if the spectral distribution of radia
tion incident on the sample is given. The observed profile or shape of an absorption
line of a monatomic gas is strongly influenced by a number of factors including,
for example, the neutral and plasma temperature, the frequency of collision between
3

the absorbing atom and atoms of the same or different kind, the frequency of collision
between the absorbing atom and positively charged ions or electrons, natural uncer
tainty in the energy levels involved in the optical transition and instrumental
broadening of the absorption line.
If a continuum of radiation is passed through an absorption cell containing a
monatomic gas at a given vapor pressure, an attenuation in the intensity of the
beam will be observed in the region of a resonance line of the atom. The intensity
of the transmitted radiation will exhibit a frequency distribution similar to that
depicted in Figure 1. The absorption coefficient of the gas (k ) is defined by
the relation:
I^=I„c-V (1)
where Lis the thickness of the absorbing layer.
If L is measured in cm, then k has the dimensions of cm" . Using Eq. (1) in
conjunction with the measured transmitted intensity, k may be determined as a function
of frequency and the relationship can be plotted graphically as is shown in Figure 2.
An experimental determination of the absorption coefficient frequency contour
is of fundamental importance not only because it serves as a measure of the amount
of radiation that the sample absorbs, but also by virtue of the fact that the half-
width, Av, is inversely proportional to the lifetime of the individual excited state.
In addition, the qualitative shape of the contour gives an indication of the relative
importance of the various perturbations that the absorbing atoms are subjected to.
The most interesting, but complicated, form of line broadening is that caused
by collisions between the absorbing atom and other neutral or electrically charged
particles. A great deal of experimental and theoretical work has been entered into
in recent years in an effort to understand this phenomenon.
While it is customary to reduce an experimentally determined absorption coeffi
cient (k ) to standard conditions, such a reduction is not always valid and is
essentially meaningless for pressure-broadened absorption lines of the type which
will be the subject of this discussion.
Once k has been determined for a given path length, L, the rate at which the
energy lying between \ and A + dx is removed from a light beam by a sample of dimen-
sions (1 x 1 X L)cm can be computed from:
^abs(x) = ^0^^) e-^L- (2)
4

X
o o UJ
5 z < a: h-
O >
z UJ
z 3
FIG.
1 0
FREQUENCY V IN CM*'
GENERALIZED ABSORPTION LINE SHOWING INTENSITY OF TRANSMITTED LIGHT AS A FUNCTION OF WAVE-NUMBER (FREQUENCY)
1 0 - i
FREQUENCY IN CM - ^
FIG. 2 GENERALIZED ABSORPTION COEFFICIENT-FREQUENCY CON 'GUR
5

providing that the value of k used in Eq. (2) was obtained experimentally by
measuring the transmittance of a gas sample which was under identical conditions of
temperature, pressure, and concentration of foreign gases as the gas for which the
calculation is made. This restriction is invoked for pressure-broadened lines but
is not generally necessary for atomic absorption lines. For example, within the
temperature and pressure range where the influence of interatomic forces are
negligible, the same k may be applied to gas samples under a variety of conditions
temperature, pressure, and concentration.
Generally speaking, at total vapor pressures of less than 1 atm, atomic absorp
tion lines can be expected to be characteristically narrow and the wavelength
interval over which energy may be removed from a beam of radiation passing through
an atomic gas is usually of the order of a few angsrom units or less, for any given
atomic transition.
The resonance absorption lines (that is, the first number of the principal
series of absorption lines) of the alkali metals present an exception to the
generalization stated above since relatively long-range interatomic perturbations
come into play which result in significant variations in the quantized energy levels
of the absorbing atoms. As a result, the resonance absorption lines are broadened
to an unusually large extent. The manner in which the interatomic forces give rise
to line broadening can be illustrated with the help of Figure 3, in which the
potential energy of a system composed of two cesium atoms is plotted against the
interatomic separation.
When a cesium atom is not subject to the perturbing fields due to the neighbor
ing atom, the energy difference E^-E, determines the wavelength of the radiation
which is absorbed by the atom. This is the case if the two atoms are separated by
an infinite distance. At this infinite separation the width of the absorption line
is determined by natural uncertainty and by the Doppler effect. The broadening due
to these two effects results in an increase in line width of the order of a hundredth
of an angstrom, and both of these broadening processes become negligible compared
to other broadening processes which occur at distances where the interatomic forces
become important.
The forces which occur between two neutral atoms of the same species which are o
in close proximity (i.e., at a separation of less than 300 A) are: (1) resonance
forces, (2) dispersion forces, and (3) exchange forces. The resonance and dispersion
forces occur at distances where the charge distribution of the two atoms do not
overlap. The exchange forces result from an overlapping of two charge distributions,
and give rise to the familiar valence or binding forces which result in a stable
6

POTENTIAL ENERGY
INTERATOMIC DISTANCE, r
FIG. 3 SCHEMATIC TRENDS OF POTENTIAL ENERGY CURVES DUE TO INTERATOMIC FORCES

diatomic molecule. It is important to emphasize, however, that exchange forces may
also be repulsive and, in fact, for two ground-state cesium atoms the probability
that a collision gives rise to repulsive forces is approximately three times as great
as the probability for attractive forces.
Expressions for resonance and dispersion forces can be obtained by expanding the
classical expression for the non-overlapping charge distributions and computing the
quantum mechanical interaction by means of perturbation theory. The resonance fores
are due fundamentally to the fact that the perturbing atom is essentially indis
tinguishable from the absorbing atom and dominates the dispersion forces when the
probability of an absorbing atom colliding with an atom of its own kind is very much
greater than the probability for a collision with a foreign atom. The dominance of
the resonance forces over the dispersion forces is due to the fact that the resonance
forces give rise to a first-order perturbation which can be shown to be proportional _3
to r where r. is the internuclear separation. The dispersion forces arise from a
second order effect and are proportional to r~ . Both the dispersion and resonance
forces are especially large for the resonance lines of alkali atoms as can be seen
by examining the main features in the expressions for the interaction energies. _3
In addition to the r dependence, the principal features of the resonance
forces are that: (1) their strength is proportional to a dimensionless quantity, f,
which is known as the oscillator strength of the atomic transition, and (2) their
sum over all magnetic quantum numbers of the two states involved in the transition,
vanishes in the mean. (1) explains why the cesium resonance lines are more apt to o
be broadened than any other absorption lines such as, for example, the mercury 2537 A
line, since the oscillator strength for the combined cesium resonance lines is about o
0.98 while the oscillator strength for the mercury 2537 A line is about 0.03. It
also explains why the broadening of the higher members of the cesium absorption
lines, due to resonance, decreases rapidly in importance since the f number for
these higher members is very small with respect to unity. (2) merely means that a
resonance interaction may cause the atomic absorption line to broaden symmetrically
since an increase in the transition energy is just as likely to result as a decrease
in transition energy.
The dispersion forces are abnormally large for the alkali atoms since the
expression for the second order perturbation energy involves a sum of terms, each
of which has a denominator which depends on the difference in energy between the
ground level and the excited atomic levels. These differences are relatively small
for the alkali atoms and accordingly a large number of terms contribute significant
amounts to the dispersion energy. The dispersion forces for sodium and potassium
8

are important even at relatively large interatomic distances. The dispersion forces
for cesium can be expected to be even stronger than for sodium and potassium since
the separations between the pertinent atomic energy levels are smaller for the cesium
atom than for the latter two.
In Figure 3, line a , the energy difference Eo'^i s'fsrs to the sharply quantized
transition that occurs when the cesium atom is not influenced by a neighboring atom.
The lines connecting the energy level curves may be various lengths depending on the
distance of approach of a pertubing atom at the instant of the electronic transition.
Line b_represents the modification in transition energy that results at distances
where the resonance forces come into play; line c_ represents the transition energy
when resonance and dispersion forces are of the same order of magnitude. Transitions
may also occur from any point on the repulsive energy curve (dashed line). For
example: line d^which refers to a transition from the repulsive state to the por
tion of the upper curve which corresponds to a region in which attractive dispersion
and resonance forces are important. The net effect of these various attractive and
repulsive forces on the lower and upper states of the atomic transition is a severe o o
broadening of the cesium absorption lines at 8521 A and 8943 A.
Line £ represents a transition from the stable ground state of the cesium
molecule to a stable upper state. It should be noted here that the upper potential
energy curve in Figure 3 has been greatly simplified. There are a total of eight
possible curves arising from a collision between an excited cesium atom and an atom o
in the ground state. Several molecular transitions which correspond to the 8521 A o
and 8943 A atomic transitions may result. Herzberg [5] has assigned the strong o o
7600 A and 9000 A molecular absorption bands to two of these transitions.
The molecular transitions can take on an important significance since they
provide an additional means to introducing energy into the vapor at higher pressures.
In the current studies it was observed that for pressures greater than about
1 mm Hg the contour of the atomic resonance absorption lines become assymetrically
broadened as the perturbations due to collisions become important. As the pressure
increases above a few mm Hg the atomic resonance lines become overlapped by diffuse
band-like absorption features which are undobutedly due to the CS2 molecule. The
net effect of the line broadening and molecular absorption is to cause absorption o o
in the 8521 A and 8943 A region to take place over a fairly broad wavelength region.
This is readily evident in the reproductions shown in Figure 4.
In addition to the diffuse absorption in the vicinity of the atomic resonance
lines, Cs« gives rise to many other absorption features. The most important of t o
these are a band system in the vicinity of 7600 A (Figure 5) and a number of 9

100% 1 INCH PATH t rsOTM « . , .wVtffti) .W
i'«fi»
^ /
J
Jl . . . , : : / , .
LAI .4^ .Vi,
1 7 6 . 7 A
;/j
f- • :^-—- — — r - - i t ;•» /./INCH
FIG. 4. ATOMIC RESONANCE AliSOKPTION AT 6321 t AS A FUNCTION OF PRESSURE
KX>%
PWEiSURE 4
tV • IT
r.
; ; 1 1 -
i
'• i , 1 ' •< I
^—7—K IMPURITY / - 0 1 %
i _
/
PRESSURt I 0 TORR
/ y^wA- i
f ' »
.ii
!|
k ]<..
ij;-
-RO iMPuRl" i ~ 0 I'l.
— / . .
- ^
^b' -* ?• & /c ' . ' - .'' A
FIG. 5. ch.oii:K *iou;cL'u.-u< .-.r.soKrno,^ AS A FI^ICCTIO;-. O,- i>';oS'.'ji;
10

diffuse absorption features on the long wavelength side of the 8943 A line. The o
band system at 7600 A shows up clearly in the spectra of cesium vapor at pressures
greater than 0.5 mm Hg. Several weak absorption bands have also been detected at o
other wavelengths but these are very weak in comparison with the 7600 A bands and
will not be considered at present. b. Experimental Results in Absorption of Resonance Radiation
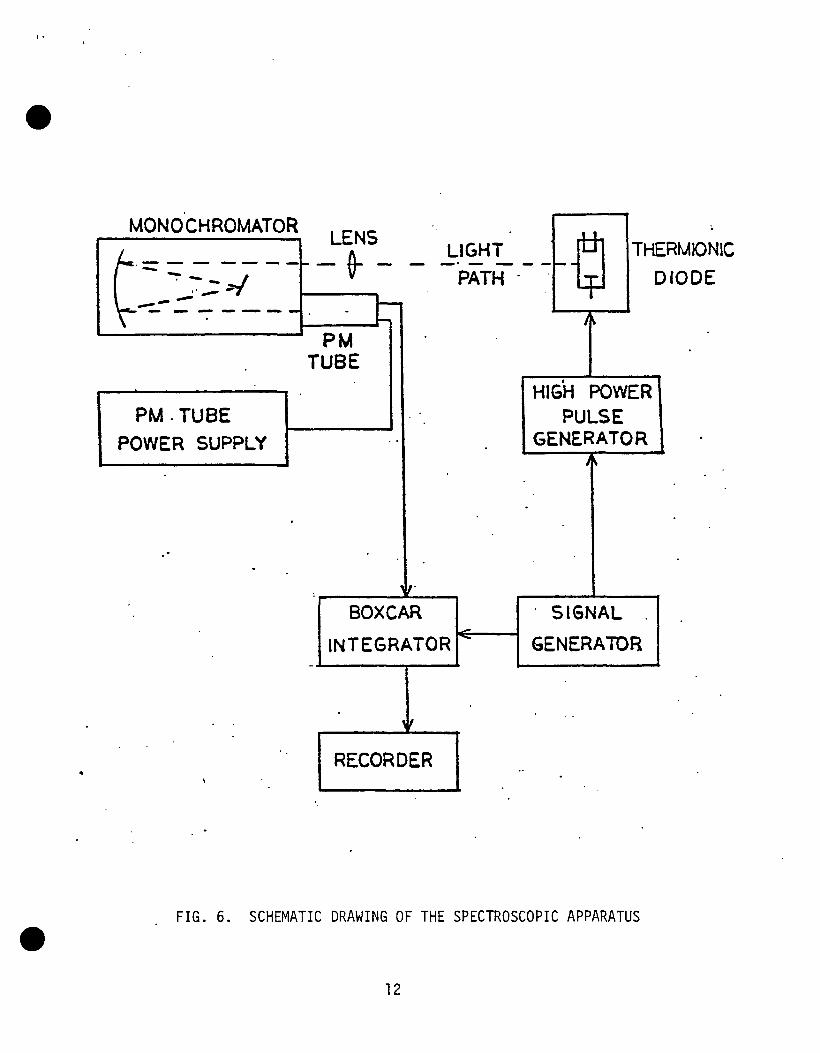
A schematic of the experimental setup with which all the absorption measurement
were made is shown in Figure 6. Preliminary measurements were taken using a Jarrel-
Ash grating spectrograph to determine the effect of lamp filament temperature on
resonance absorption bandwidth. It was found that there was no measurable effect
on bandwidth over a filament temperature range of 1800-2250°K at constant cesium
pressure. This indicates that the observed absorption broadening is completely a
pressure effect over the pressure range .06 to 8 mm Hg and is not dependent on
radiation intensity within this filament temperature range.
Figures 4 and 5 are densitometer recordings taken of spectra obtained with
constant lamp filament temperature and cell environment temperature with the cesium
pressure varied from .06 mm Hg to 4 mm Hg. Figure 4 shows the broadening of the o o
8521 A absorption band. The 8943 A bandwidth was only slightly less than that at o o
8521 A. The half height bandwidth of the 8521 A band at the highest pressure in o
Figure 4 is approximately 175 A. Figure 5 shows the absorption growth of the
molecular band over the same pressure range. The data presented in these figures
give an excellent indication of the extent of increase of the absorption coefficient
with vapor pressure.
It is interesting to note the rapid increase of molecular absorption at the
higher pressures. It has been shown that the ratio of the neutral cesium molecule -3 -2
density to atomic density is between 10 to 10 . Therefore, if the absorption
cross section of the molecule is of the same order of magnitude as the atomic
absorption cross section, the sudden increase in molecular absorption could be
explained by a mechanism involving the production of cesium molecules in the o o
vapor. The absorption at the resonance lines at 8521 A and 8943 A is producing
excited cesium atoms which can combine to form the molecular ion. Cs* + Cs* + KE -> Cs2 + e (3)
One of the possible complex ion loss mechanisms in the plasma will be recombina
tion of the molecular ion with thermal electrons. The product of this recombination
11
MONOCHROMATOR LENS
LIGHT^
PATH
PM . TUBE
POWER SUPPLY
THERMIONIC DIODE
HIGH POWER PULSE
GENERATOR X
^L. BOXCAR
INTEGRATOR
SIGNAL
GENERATOR
RECORDER
FIG. 6. SCHEMATIC DRAWING OF THE SPECTROSCOPIC APPARATUS
12

may be a neutral molecule. This process could then have the effect of increasing
the molecular to atomic ratio in the vapor. Absorption in the molecular band
can also cause excitation of the molecule resulting in dissociation in to an
excided atom and a ground state atom. It is further possible that the excited
cesium molecule produced by radiation absorption can produce ionic forms through
complex collision mechanisms with other excided species existing the the plasma.
Therefore, the molecular absorption may provide a further means of excitation and
ultimately ionization in cesium vapor plasmas.
The rubidium impurity which is observed in Figure 5 represents an impurity of
0.1 percent and, therefore, through the cesium pressure range indicated on the -5
figure, the rubidium constitutes a partial pressure range of 6 x 10 mm Hg to _3
4 X 10 mm Hg. It can be shown that for the pressure range of this work, there wi
be no overlap of the cesium molecular absorption bands with possible RbCs molecular
absorption bands.
3. IONIZATION PROCESSES IN A CESIUM DISCHARGE IN THE PRESENCE OF RESONANCE RADIATION
a. Theory
In a converter the resonance radiation is provided by the emitter where for o
gray body temperatures greater than approximately 1400°K, 8500 A is well within
the spectral range of the energy distribution. Figure 7 shows the total and
spectral emissivity of several refractory materials which are commonly used as
emitters. Notice that over the temperature range indicated, there can be almost
an increase of two in the total emissivity. Indicating that as the temperature
increases the radiating power will increase much more rapidly than its normal tem
perature dependence would allow. In order to calculate the percentage of atoms in
the vapor which are excited to the resonance level by the incident radiation, the
power available to be absorbed must first be determined.
The energy density (U ) radiated by a black body emitter which is the energy
available for absorption is: 3 r . 1-1
(4) II _ 8Trhv
V ^3
U, = Sl§^e,
e x p f i ^ - l
<P (- ^ ) (5)
13

7 ?ft7T6e
.30
.28
>-1 -
>
(O CO
:E LJ
_J <
o K
.26
.24
.22
.20
.18
.16
.14
10 1400
TUNGSTEN
MOLYBDENUM
1600 1800 2000 2200
EMITTER TEMPERATURE,(°K)
.60
.55
50
45
40
35
30
.25
4 . CO ^taO**
> H-
> CO 00
2 UJ
_ ) < QC K CJ Ld CL CO
<< \x;
.20
.15
.10
FIG. 7. EMISSIVITY OF SOME REFRACTORIES
14

where
h = Planck's constant V = radiation frequency
c = speed of light k = Boltzmann's constant T = emitter temperature in degrees K
The power radiated (P ) is. V
^ = 2r c U dv (6)
V
Since the resonance absorption bandwidth, 6v = V2 - v, used in the integral evaluation is for complete absorption, the power radiated in this bandwidth is the power absorbed in this bandwidth, therefore.
p _ 2Trh£
abs ^2 ^^ v\ -^ dv (7) ^1
where e = spectral emissivity of emitter near the resonance wav elength. To,evaluate equation (7), Simpson's rule was used since 6v is small compared to v = «
Therefore, the equation to determine power absorbed as a function of emitter temperature is:
2iThv „ ~hv.
the results are given in Figure 8. The percentage excitation is obtained by considering an energy balance mechanism within the plasma. It will be assumed that the power absorbed in the plasma is equal to the power reradiated by the plasma.
P = P ^abs ^rad
p - ^ ^rad T
where W . = the energy radiated into the plasma and T = the radiation capture time or in other words the time in which the radiation is held in the plasma by successive absorption"and decay before it reaches the side walls of the container. If we
o
consider only resonance radiation from one level, say 8521 A, then W , is equal
15
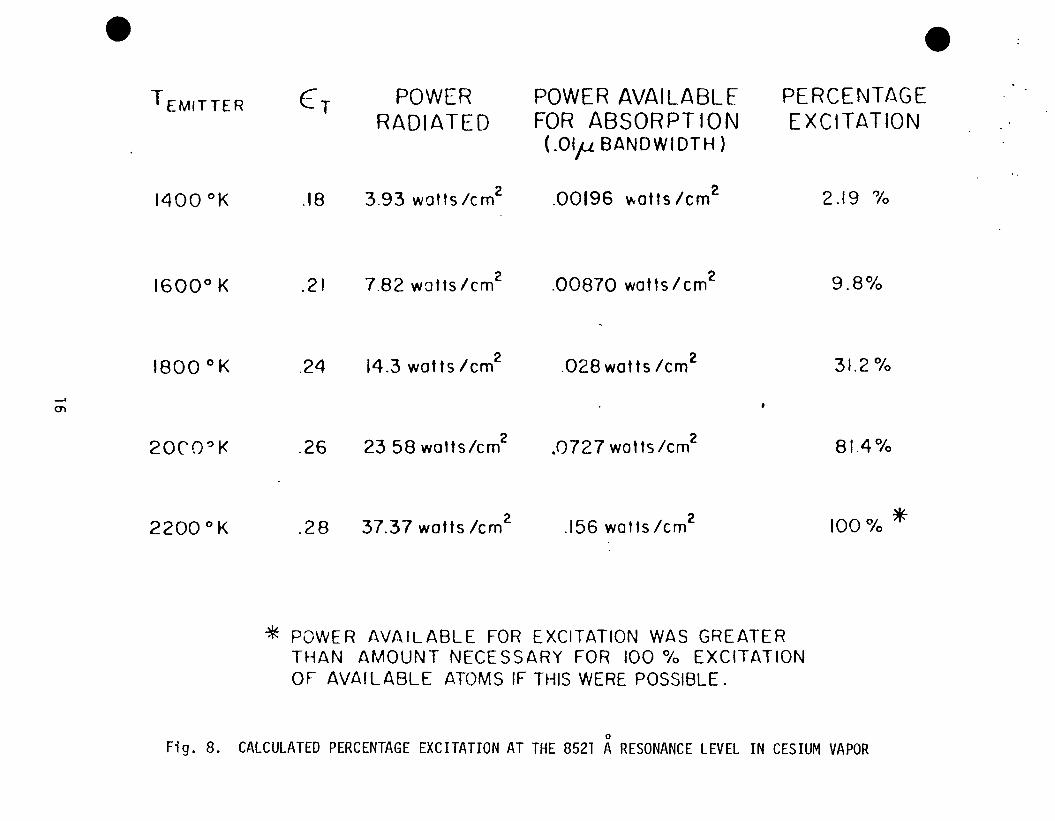
TEMITTER ^ T POWER POWER AVAILABLE PERCENTAGE RADIATED FOR ABSORPTION EXCITATION
(.Olyu BANDWIDTH)
1400 °K .18 3.93 watts/cm^ .00196 v^atts/cm^ 2.19 7o
1600° K .21 7 8 2 watts/cm^ .00870 watts/cm^ 9 . 8 %
1800 °K .24 14.3 wat ts /cm^ .028wat ts /cm^ 31.2%
2 0 C 0 ' K .26 23 58 watts/cm^ .0727 watts/cm^ 81.4%,
2 2 0 0 ° K .28 37.37 wat ts /cm^ .156 watts/cm^ lOOVo"^
^ POWER AVAILABLE FOR EXCITATION WAS GREATER THAN AMOUNT NECESSARY FOR 100 % EXCITATION OF AVAILABLE ATOMS IF THIS WERE POSSIBLE.
Fig. 8. CALCULATED PERCENTAGE EXCITATION AT THE 8521 A RESONANCE LEVEL IN CESIUM VAPOR

to the number of atoms in the excited state multiplied by the excitation energy.
Therefore,
P u-T 2 N = -r atoms excited in a volume of 1 cm xd gap (9)
ex _3
For the results shown in Figures 8 and 9 a value of 10 second for the capture
decay time and 1 mm Hg cesium vapor pressure were used.
It was observed that the maintenance voltage of low voltage, hot cathode
arcs in the alkali vapors decreased as filament temperature increased. This
appears to be in excellent correlation with the increase in excited state popula
tion shown in Figure 9.
When the possibility of increasing the electrical conductivity of a gas by
means of photoionization is considered, it is generally concluded that the rate
at which positive ions are formed through the process of photon absorption by an
atomic gas in an inter-electrode space is bound to be insignificant when compared
to the rates of other ionization processes, such as electron-atom impact. Only
if a layer is used of wavelength resonant to an atomic transition crossing the
ionization "bottleneck" can significant ionization levels be produced. We can
distinguish three processes by which it is possible to create cesium ions:
(a) direct single-step collisional ionization of cesium ions
(b) two-step processes leading to the formation of cesium molecular ions
(c) multi-step collisional ionization forming atomic ions.
We can represent collisional ionization of the ground atate of the cesium
atom by
CS(6S., ,2) + e + 3.893 eV Cs" + e + e (10)
while the two-step col l is ional ionization leading to molecular ions follows:
1.386 eV CS(6P I / 5 ) Cs(6S,/^) + e + - '^'^ + e (11)
'^ 1.455 eV Cs(6P3/2)
Cs(6P) + Cs(6P) + Q -V Cs2 + e
where Q is between 0.05 eV i f the two col l id ing excited states are both Cs(6P.] ,2)
and -0.09 eV i f the two states are Cs(6P2/2)- The concentration of CS2 has been
demonstrated by Wilkins [6] to be important only for plasma desnities N < 10 cm
17

0 0
90
80
70
60
50
4 0
30
20
10
n
—
—
—
—
—
—
—
—
^
1 1 1 ' 1 1
CONSTANT CESIUM PRESSURE / OF 1 TORR. . /
/
/
/
/
/
/
/
/
^ ^
1 1 1
1 1 1
]
— j
— J
—
\
-\
— j
— ]
—
1 1400 1600 1800 . 2 0 0 0 2 2 0 0
EMITTER TEMPERATURE,(°K)
FIG. 9 . EXCITED POPULATION AT 8521 A RESONANCE LEVEL IN CESIUM VAPOR DUE TO RADIATION FROM TUNGSTEN
18

Moreover, the formation of atomic ions via one-step electron collisions appears
to be statistically unfavorable if the electron gas near the emitter is Maxwellian;
very few emitted electrons (i.e. the high energy tail) have enough energy to
cause ionization.
Each step in the formation of atomic ions by multiple collisions can be
presented by
Cs(state k') + M - Cs(state k") + m (12)
where M may be an electron, a ground state or excited atom or an ion.
Multi-step processes are believed to be controlled by electron neutral colli
sions [7] but they are of course much more complex and difficult to unscramble.
We observe in Figure 10, energy level diagram for cesium, that the first few excited
levels of cesium are separated by several times the mean electron energy in typical
plasma conditions of our concern whereas the higher excited states are much more
closely spaced and would be expected to have populated densities in Saha equilibrium
with the free electrons. This implies that there exists an energy barrier, often
conveniently termed the "bottleneck," that must be crossed by an electron which
originating from the lower energy states is heading towards the continuum. There
fore, ionization and recombination depend upon the rate at which transitions occur
between the higher levels, in equilibrium with the free electrons, and the lower
levels, which tend to equilibrate with the ground state. Both radiative and
collisional transitions must be considered. Several authors have made calculations
of this type (Eq. (8)-(14)).
We can surmise from collisional radiative theory that above some particular
level S the number densities of the excited states are in equilibrium with the free
electron density at the electron temperature T according to the Saha equation
Nk(Ng.Tg) = 2.06 x 10-"'\N^Tg-2/2 exp(Ej-E,^)/kTg, k > s (13)
where N. is the density of the kth state, N is the plasma electron density, g.
is the state degeneracy, and Ej, Ej, are the ionization potential and the energy
of the kth level respectively.
The density distribution of the lower states, which are in equilibrium with
the ground state determined by electron neutral collisions, would be given by the
Boltzmann equation
19

ENERGY LEVEL DIAGRAM OF CESIUM
Cs Z=55 GROUND S T A T E : IS^ 25^ 2p® Ss^Sp'^Sd'" ^s^ Ap^ 4d'° Ss^ 5p^ 6s • i > 0 , l / 2
ev 3.e93>-
2.48 —
2.23 —
1.98 —
1.74 —
1.49 —
1.2 4 —
*t/2.0 ^3/2 1/2 ' D V 2 ' D
- I
3^^ 7 / 2 9 / 2 cm
- ( 3 I 4 0 G . 7 I
I3p I3p iZd I2a 4f Q»
i2s : r ± ^ i 2 p • -p^ i2pnTr^ iod--nry ' iod-^^- . f t t ~ - .
MAJOR LINES OF INTEREST
.8f —30000
— 28000
— 26000
— 2 4 0 0 0
— 22000
— 2 0 0 0 0
— 18000
— 16000
— 14000
— 12000
—10000
— 8 0 0 0
— 6 0 0 0
— 4 0 0 0
— 2 0 0 0
— 0
FIG. 10. CESIUM 1
20

N^(NQ,Tg) = NQ(g^/gQ)exp(-E,^/kTg) (14)
where NQ is the ground state number density. Suppose intense line radiation corresponding to some particular excitation
k' ^ k" from a level k' < s to some level k" > s is utilized to pump the plasma, where k' is in equilibrium with the ground state while state k" is in equilibrium with the continuum. We expect the free electron density as well as the recombination rate to exceed by a large amount the value sustained by collisional processes.
The free electron density can be related to the intensity of the incoming radiation according to a simple model by neglecting radiative decay and assuming that the net excitation rate must equal the net recombination rate, which is proportional to the frequency of electron collisions with atoms in the lowest state in equilibrium with the electron continuum.
Optical dN Excitation = -rr^ ^^N^N^v^a^ Rate ^ ^ ' ^ '
-Ne5jg-''exp(Ej-E3)/KTg 05)
here a is an average collision cross section for all transitions from the level s to lower states.
The transition k' •> k" effective in optically pumping the cesium ion density must satisfy three requirements: The oscillator strength must be large enough to provide sufficient absorption in the plasma. The excitation line must be broad enough to capture a significant portion of ground state or one of the lower excited states and the final state k" must be within a few kT of the continuum; this assures that the electron will be lifted across the "bottleneck" and will be close enough to the continuum to eventually become free.
The relationship between atomic, molecular, and ionic term levels can best be illustrated by means of a Franck-Condon diagram as in Figure 11. For an excited CSp molecule formed from a collision of two atoms in 2P states there exists a large density of states, consisting of a superposition of electronic and vibrational states, These states are characterized by a large variety of angular momentum and quantum mechanical symmetry properties, so that the requirements of energy coincidence and selection rules can be assumed to be satisfied for a significant number of these states.
In Figure 11 the total energy of a system composed of two cesium atoms in various states of excitation is plotted against the interatomic separation, r..
21

\ Cs (62s , / 2 )+C; ( 'Sp ) \
\ \ B
\
Cs 2
\ \
\ \
\ \
Cs(6^P|/2.3/2> + Cs(62p,/2,3/2)
Cs(6^S,/2) + Cs(6^S,/2)
r, INTERATOMIC SEPARATION
FIG. 11. POTENTIAL ENERGY CURVES OF THE CESIUM MOLECULE AND MOLECULAR ION
22

The zero of energy is taken as the energy of two ground state atoms at rest with
respect to one another and separated by an infinite distance. The solid and dashed
lines represent the potential energy of the systems as the two atoms approach one
another. The minima in the curves correspond to the fact that there is a net
attraction for two cesium atoms at distances in the vicinity of the equilibrium
bond distance of the diatomic molecule Cs^. The fact that repulsive states may
also result when two atoms approach one another is indicated by the dashed lines.
The energy level diagram is simplified in the sense that only two of the **
many possible resulting states of the excited molecule, CS2 , are included. If
it is assumed that one or the other of these two states is of the proper symmetry
to be perturbed by the ground state of the molecular ion, then in order for ionization
to occur it is only necessary to require that the potential energy curves of the
two interacting systems come into close proximity or cross one another as the pairs
of curves A and B, and B and C have been shown to do.
It should be emphasized that the details of the potential energy curves are
not known and Figure 11 is intended to indicate the general features of the rela
tionships that must exist between terms of the molecule and of the molecular ion
in order that ionization (and by inference also two-step ionization) may take place.
(b) Experimental Method
The experimental apparatus for ionization measurements is very similar to that
for the absorption measurements shown in Figure 6 except there is no need for the
monohromator. Identical tantalum emitter and collector electrodes are used.
In operation the spacing between the emitter and collector will be about .020"
so that saturation thermionic emission can be drawn from the emitter at very low
values of voltage. The graph of Figure 12 indicates the magnitude of applied
voltage which is required to draw saturation emission for various mesh spacings.
Since we seek saturation emission the applied voltage necessary to eliminate space
charge in the cell should be between 0.2 and 1.0 volts. Once saturation current
is being drawn, the potential distribution between the electrodes should be
approximately linear and the external applied voltage should then be the voltage
appearing between the vacuum levels of the emitter and collector. This approach
should allow a close determination of E/p in volts per centimeter-mm Hg in the
region between the electrodes. The measurement of the growth of current in the
cell as a function of applied voltage then will lead to the determination of the
first Townsend ionization coefficient in ion pairs per centimeter-mm Hg as a func
tion of E/p. The measurements will be made over a range of cesium pressures both
23

Arb
itra
ry
Un
its
en
ro
ro
.^
o
CO
1—t
-V
o
> o
o
m
m
o
m
jc
t-
3s
rr
i :x
3 O
CD
-
Hm
X
) o
r—
a
HH
mS
1—
1
CO
-H
•o
m
z cz
J= m
00
z:
J*
> IS "
O
m
r--I
3>
m
^ 73
m
73
rv3 b
r - —
—
^->
n o
o
31
re
< !
I ,
^>
"U
^"
1 !
1 1
t !
1

with and without injected resonance radiation in order to determine the role
which resonance radiation plays in the ionization of cesium vapor.
The electrodes serve as identical work function emitter and collector.
This latter property is due to the fact that the tantalum meshes are operated
at the same temperature and cesium arrival rate. The chamber body is constructed
from Kovar and the saphire windows are brazed to Kovar flanges as described in
Section 4.
c. Experimental Results
Typical values of the absorption coefficients that have been obtained for o
the broadened 8521 A cesium absorption line are included in Table 1 and Figure 13.
The absorption properties of a cesium vapor at a temperature, T, can be determined
by the equation:
l^ = I^ e"^(T)L (16)
where L is the length of the absorbing vapor. For example, at 318°C the value -1 °
of k is given as 1.25 cm for the wavelength 8579 A. Therefore, the attenuation A
of a beam of radiation at this wavelength passing through a cell length of 8mm
amounts to a factor of about 1/e, since
1 = I e-1-256 (.8) , 1 3-1 0 0
The absorption coefficients were obtained from photographic film which was
calibrated with the aid of a logarithmic sector disc, a 5000 RPM motor, a uniform
temperature tungsten ribbon lamp and a microdensitometer. These values of the
absorption coefficients are subject to verification by further measurements and
the studies are being extended to higher temperatures and shorter path length
absorption cells.
4. CESIUM PLASMA SUSTENANCE BY APPLICATION OF MICROWAVE P S W E ^
a. Experimental Measurements
In our effort to develop the second generation thermionic energy converter,
it becomes necessary to separate the emitter and collector electrode functions
from the ion generation task. The emitter at 1600°K can no longer supply sufficient
ionization generation levels. A very appealing concept in the generation and
25

in
CM
C»
^ o
CO
vo
cr>
^
00
vo
in
cvr
<
cc <
: cc
CT> C
O
cn r—
en
00
o o C
M
CT> in
CO
cn in
CO
CO
in
CO
I—
CO
C
O
O
o O
O
O
I—
o
oo
oo
oo
oo
^
CM
CO
in
CO
in
•!*•
—
lO
00
•—
ID
cri
in
CO
CT>
CO
r-
in
00
•—
r—
VD
in
CO
^
in
CM
in
CO
CO
CT>
00
<3-00
o
CM
r
^
00
CM
«3-in
^
CO
CO
ȣ>
CO
^
CO
in
CO
r—
^
CO
CTt I—
CM
lO
O
C
Ti CO
oc
Mi
nr
^i
—
cn
cT
ii—
oc
ov
o'
sa
-i
—
lo
oo
cn
«3
-c
oc
oc
oc
or
-o
cr
>
co
co
co
co
co
co
oo
r^
o
in
in
o
o C
D
•—
r>. r«.
in
CM CM CO
CM
r^ r— CM
r—
CO
O
"S- in cn
o
CO o
•a: <: in
CO
cn r
1^
1^
r«.
CO
ID
cn
CM
in
CO
r—
in
•si-CO
^
I—
«n CO CO
in o
in in
CO CO CM I— o
o
o
o
o
o
o
o
o
o
o
CO in
CO
^
CO O
CM
in
en CO 00 CM I— I—
I^
CM V£) CO o
CO in
o r>.
CO 1— o
CM vn
r^
ȣ> v
o vn lo in in
00 00
00 C
O
CO
C
O
00
cn
co
io
oo
oc
Mi
^m
i—
r
s>
cs
jco
<d
-C
Mc
nr
^L
n«
d-
cM
oc
oi
nc
n»
£)
r^
co
in
«a
-^
"«
-^
«a
-^
co
co
cM
CM
i—
o
co
co
co
oo
oo
co
co
oo
co
oo
co
co
co
OQ
•a:
in
wD
CM
cn
co
cn
o
oc
oo
co
V
DC
OI
-^
r—
C
Ml
O<
a:
e3
:0
"!
d-
^l
O
.—
CM
CM
^r
v.
cn
l—
(—
o
iO
'd
-c
o
in CO
m
^
cn O
lO
00
CM
CM
I—
O
O
o o
o o
o •—
I—
o
oo
oo
oo
ID
in
Cn
i—
C
M«
;:
i-
VD
00
Or
—
CO
in
CM
i—
cn
00
cn
a\ ID
00
o
r-~
ID
CO
CM
cn
in
CO
^
t^ cn I— CO
i~>. in CO CM
o
in in in in in
CO CO CO 00 CO
CO CO O
CM ^
CO
in ID in CO I—
•*
«^ ^- «d-
^
<^ CO
00 00 00 00 00 00
"sa- m
in vD
in ID
r>.
00
CM r— o cri
CO
CO 00 r^
:x
r
ID
II
u
1—
r— 1 E o f<
J)£ r<
CO
en
CM
o
ID
CO
in
<£> CO
VD
ID
O — •
o
o
CO
»D
CO
o
•*
CO
r"-.
o
•—
o o
<D
00
CM
00
CO
r— •
o
CO
CM
00
in
CO
o
«*
«a-CO •
o
in
«3-ID
in
00
in
in
t^ .
o
r
VD
«d-in
CO
•=r
1—
cn
00
CM
in
CO
<
1—
o ,
r—
in
00
o
cn
ID
CD
CM
CO
CTi
«;
CO
r-*~ 00
CO •
o
<3-
in
r»
^
CO
o
ID
CM .
O
ID
r
in
s
ID
O
CM •
O
CO
cn
CO
^
CO
^
00
^mm
•
O
en
,_
CM
«*
00
r^
CO
H— •
o
CM
1—
<a-o
•;rt-00
r-*
CO — •
o
CO
<
CO
CO
00
r
r
o
O
in
CM
r>.
f-m.
00
o
CO
«*
cn
cn
r>»
26

3.5
3.0
2.5
2 0
'E u
^ I 5
1.0
.5
o A 0 +
CESIUM TEMP f t M
•• •« M M
194'C 238 "C 277»C 318-C
7800 8000 8200 8400 8600 8800
X . ( A )
FIG. 13 . ABSORPTION COEFFICIENT AS A FUNCTION OF WAVELENGTH
27

sustenance of the thermionic plasma is the external application of microwave
power whose sole function is to support the plasma. It can thus be specifically
tailored to perform its assigned task in the most efficient manner. We expect
that highest efficiencies result when microwave power is fed into a resonant
system part of which is the thermionic plasma.
In order to examine this concept experimentally, we have built two microwave
coupling arrangements, a cavity and a waveguide insert shown in Figures 14 and 15
where the emitter and collector of a simple thermionic converter are part of two
of the flat walls of the cavity. The cavity is of the cylindrical reentrant type
with resonance microwave frequency about 1.5 GH . The emitter and collector
electrodes of the thermionic converter are housed in a pyrex glass envelope which
enters into the hollow inner cylindrical surface of the cavity. This inner surface
is completely enclosed except for a small gap as shown in the diagram. The size
of the gap can be adjusted continuously by sliding the inner metallic tube in
and out of the outer shell. This gap is the pathway through which the microwave
energy can be directed into the thermionic converter interelectrode spacing. The
length of the cylindrical cavity can also be varied continuously resulting in
changes of the resonant frequency of the microwave cavity. It is thus possible
to mechanically tune the cavity continuously over a wide range of frequencies and
so achieve a corresponding range of plasma densities. The plasma densities that
we can attain vary roughly at the square of the frequency of the applied microwave
power.
The coupling of power into the microwave cavity is accomplished by a magnetic
loop inserted from the top. In actual operation, we ignite the discharge by apply
ing a DC voltage between the emitter and the collector. Subsequently, we provide
microwave power into the cavity. The resonant frequency of the cavity is strongly
affected by the presence of plasma. It is actually the system of plasma and
cavity which is resonant. Absorption of microv/ave power is thus maximum at the
particular resonant frequency of the plasma-cavity system and we can adjust the
microwave frequency to achieve maximum absorption. Coupling adjustments are needed
as well in order to match the loaded cavity impedance to the transmission line
impedance.
The microwave hardware required to transmit the power from the generator to
the cavity and to make the power measurements of input and reflected power are
shown in Figure 16. A sweep generator in the 1-2 GH feeds a 20 watt TWT amplifier
which provides power into the microwave cavity. Directional couplers and a slotted
line are utilized to measure incident and reflected power. Several parameters
28

r e
a l
r Oven
C a v i t y LciiRth C o n t r o l —>^^
n
' ^ Cavi ty
^ C c s l
yir ... — h , — : - ! Bakablf
um Reservoir (Vertical)
Valve
•< Microwave
Oven
ITX. Y "3 Flexible
Diffusion Pump
Emi I Feeil-Tluouij;h
•> T u b i n g
Va 1 vc V a l v e
Ion Pump CauLrcl-MilLcr
I o n Pump
F I G . 1 4 . VACUUM SYSTEM SET UP

n B
V c
E
L
V
B
TO PUMPING LINE
/ \
^ ^ ^ = ^
W
TO PUMPING LINE
FIG. 15.
30

1-2 GHz AND 2 -4 GHz
OSCILLATOR
^f
VARIABLE
ATTENUATOR
V
DIRECTIONAL COUPLER
1'
TWT AMPLIFIER
POWER METER
CIRCULATOR
V
MATCHED LOAD
POWER METER
iL
ATTENUATOR
1
J
i
POWER METER
a
ATTENUATOR
i i
DIRECTIONAL COUPLER
SWR INDICATOR
a
SLOTTED LINE
M
SPECTRUM ANALYSER
- * TUNER MICROWAVE CAVITY AND PLASMA LOAD
FIG. 1 6 .

are measured which include resonant frequency, frequency shifts due to the
presence of the plasma and the loaded and unloaded Q of the cavity.
We have measured the I-V characteristics of the thermionic converter with
and without the application of microwave power under various conditions.
We expected that the application of microwave power would raise the plasma
density and temperature and thus significantly alter the characteristic I-V curves.
Numerous curves were obtained but it was found that the important features of the
results could be demonstrated by a detailed analysis of the I-V traces obtained
at microwave power levels of 0, 1 and 2 watts.
If we study the I-V curves shown in Figure 17, we observe a most dramatic
effect displayed by the ignition traces (i.e. increasing voltage) of the thermionic
converter. When no microwave power is applied we get, as expected, the usual I-V
curves characterized by a breakdown voltage as signified by the knee of the curve.
However, upon application of microwave power, the knee of the I-V curve disappears
completely and no breakdown voltage is indicated anymore. Indeed, we observe
current conduction at zero voltage and even at negative applied voltage indicating
that there is conversion of microwave power in DC electrical output power.
The return traces of the I-V curves (decreasing applied voltage) shown in
Figure 17 also show important differences revealed in the amount of current that
can be carried by the plasma under the same applied voltage; considerably more
current can be carried when microwave power is applied and this current enhance
ment is greatest at the low current levels. The high current ranges are affected
very little and,in fact, the value of the saturation current is not changed at all.
Moreover, it was also found that the knee of the ignition I-V curves indicat
ing the presence of a breakdown voltage was not affected at all at applied microwave
power levels below 0.5 watts, then it continuously shifted to lower voltages as
the power increased from about 0.5 to 1 watt, and completely disappeared when the
level of 1 watt was reached. In order to appreciate the effects of varying
the applied microwave power level we show in Figure 18, a family of ignition and
return curves at cesium pressure P = 0.01 Torr. At higher microwave power levels
only small changes occur mostly in the lower current region. In these lower
ranges the current carried at the same voltage rises as a function of the applied
microwave power; in particular at zero voltage the transmitted current increases
indicating that more microwave power is converted into DC power.
b. Ttieoretical Considerations
A qualitative understanding of the above results can be gained by considering
the potential energy diagrams for the converter in the presence or in the absence
32

(Amperes)
watt 001 torr
1 2 3 4 5 6 7
(Amperes)
1 watt 0.03 torr
V(V3lts) VCVblts)
(Amperes)
1 watt 001 torr
CAmperes)
0 1 2 3 4 5 6 7 V(VDlts)
watt 0.03 torr
VCVolts)
FIG. 17.
33

V(Volts)
(Amperes)
-3 V (Volts)
FIG. 18.
34

of applied microwave power. In Figure 18 we show an ignition curve in the absence of microwave power; three main regions can be distinguished characterized by different potential energy diagrams, the unignited mode, the obstructed region, and the saturation region. In the unignited mode no current flows, while in the obstructed region, the double sheath erected in front of the emitter dominates the behavior of the converter. The voltage must thus be raised to the breakdown value in order to overcome this motive peak. The souble sheath disappears in the saturagion region. When microwave power of a sufficiently high level is applied, no such breakdown voltage threshold is observed which immediately indicates that no motive peak exists; the structure of the potential energy diagram under these conditions is very simple, as seen in Figure 19. An interesting method of evaluating the performance of the thermionic converter is provided by Lam [1] who summarizes the plasma arc drop in terms on a single parameter, the normalized plasma resistand R. According to this theory, the converter arc drop V , is related to the plasma resistance R. In the case of no motive peak
3 - ^v-riR 07) 1 + exp -^
normalized plasma resistance R is defined by the expression
^Xohmic = Jf ( 2)
where ^XQV,^.;- is the normalized (again in units of kTr/e) ohmic (momentum scattering) contribution to the total plasma arc drop. The plasma electron temperature T is also included in dimensionless form T given by
T = Tg/T^ (19)
In the obstructed region, we have
J^ = 0^ exp (-Ax) (20)
where Ax = Ax/(kTr/e). If the emitter motive peak is suppressed, i.e. if Ax = 0, then Jc = Jp. Without external heating, R cannot be determined experimentally because Jr and T both change simultaneously below the transition point of the I-V curve, where the emitter motive exists. This can be explained by Figure 20 which
35

FIG. 19.

UNIGNITED MODE
V
FIG. 20.

shows the potential diagram between the electrodes at four points on the I-V
curve. At point 1, the plasma is unignited and the current density is very low.
At point 2, the plasma is in the negative resistance region where the plasma is
not completely ignited and the emitter motive peak still exists. At either point
1 or 2, the emitter net current density Jr cannot be determined because Jr is a
function of T and Ax which are both varying during the transition from point 1 to
point 3. It is only when point 3 is reached which is the transition point or the
"knww" of the I-V curve, that the plasma is completely ignited, the emitter motive
peak disappears, and Jr = Jp becomes a constant. At point 4, the plasma is in
the saturation region. In Figure 19 we see the I-V curve and the potential
diagrams of the converter diode with microwave heating. The "knee" of the I-V
curve disappears and the plasma is sustained at high current density when both
AC and microwave power are applied while at low current density the plasma is
sustained only by microwave power. Because of the disappearance of the emitter
motive peak, there is no sudden jump of the diode current and JR = Jc = constant
can be assumed. As a result, Eq. 17 can be used to relate j = (J/Jp) and V . at
a certain value of R and x. The normalized I-V characteristics of the diode
with external heating are plotted as j versus V .. The best fit of these experimental
I-V curves with respect ta the parameters R and into the curves provided by Lam's
theory can provide us with the best values of R and T. Some of the data thus
analyzed are shown in Figure 21.
We have seen a significant rise in the thermionic converter current level
upon application of microwave power. In the experiments described in this work
the improvement is limited to the lower current ranges due to the shielding effects
of the plasma at the higher current values. At these high current ranges the plasma
density is high and microwave propagation is cut off if the frequency is not high
enough. It is expected through that higher frequency microwave power would suffer
no such limitations and would provide current enhancement at high current levels
which would be of great interest in practical applications.
A very attractive possibility also is the pulsed mode of thermionic converter
where the input is microwave power. The advantages over other modes of pulsed
power are simplicity, flexibility, minimum disturbances to thermionic surfaces,
and the possibility in some modes of operation to supplying power at very short
separations between emitter and collector, a distinct practical possibility.
It is thus believed that microwave power shows great promise as a source of
energy to sustain the cesium plasma in a thermionic converter. At the lower
38

J/J.
CO
-4.0
Tp=935K PC5=8x10 Torr
Lam's Theory
r=io
Vd (Volts)-1.0 2.0
-60-55-50 -45 -40-35 -30 -25 -20 -15 -10 -5 0 15 20 25 30 35 40 45 50 55 60 VjCkT^/e)
FIG. 21.

operating temperature of 1600°K the emitter in the advanced converter can no
longer supply sufficient ionization levels. An external source of ion generation
is needed which does not interfere with the emitter and collector electrodes.
Externally supplied microwave power may prove to be the best agent to perform the
task. It is attractive in many ways. There is considerable flexibility in that
we may adjust both the power and the frequency of the applied microwave power to
achieve the desired plasma condition. In supplying microwave energy we do not
interfere with the interelectrode spacing by the insertion of extraneous electrodes.
We may operate in the continuous mode in contrast to pulsed systems which would
not be available for power generation during the pulse on condition. Furthermore,
the geometrical size of the emitter-collector distance envisioned is the correct
order of magnitude to allow support of the plasma by microwave fields in a
resonant mode. The energy expenditure of microwave power at a resonant plasma
system is expected to be smaller in comparison to alternative energy sources.
Moreover, the power requirements in the applied microwave field seem rather modest--
a few watts—easily available in present day technology even for large thermionic
converters. Subsequent experiments should be performed with microwave power of
high frequency, i.e. at 10 GH (X-band) and 20 GH (K-band). The technology of
microwave power generation and transmission is well advanced with many off-the-
shelf items available to utilize in our systems.
More work is needed in this area to provide a comprehensive understanding
of the plasma in the thermionic converter. The simplicity of a microwave supported
plasma in an optimum diode could allow for easily interpreted data from which
conclusions may be drawn about the proper plasma density level for highest overall
efficiency. We thus believe that microwave power sustenance of a thermionic plasma
in a resonant configuration is indeed a rather attractive choice.
REFERENCES
[1] S. H. Lam, Report prepared for the U. S. Energy Research and Development Administration - Contract AT(11-1)-2533, March 1976.
[2] N. S. Rasor et al, Advanced Thermionic Conversion Progress Report, COO-2263-4 (NSR 2-4), ERDA Contract No. E (11-1) 2263, August 1975.
[3] C. N. Manikopoulos et al, The Advanced Thermionic Energy Converter with Microwave Power as an Auxiliary Ionization Source. To be sumitted to the J. Energy Conversion.
[4] H. S.- Chiu et al, Advanced Thermionic Covnerter Developments with Microwave External Pumping, Proc. 12th lEEC, Vol. 2, AICE, pp. 1575-1581.
[5] 6. Herzberg, Spectra of Diatomic Molecules, Van Nostrand, Appendix I, 1958.
40

[6] R.'Wilkins, Report LA-3143-MS, Los Alamos Scientific Laboratory, Los Alamos, New Mexico, 1964.
[7] E. W. McDaniel, Collision Phenomena in Ionized Gases, John Wiley & Sons, Inc., New York, p. 594 ff, 1964.
[8] V. B. Moizhes, F. G. Baksht and M. G. Mikiya, Sov. Phys.-Tech. Phys, 10, 1252, 1966.
[9] S. Byron, R. C. Stabler and P. I. Bortzt, Phys. Lett. 8, 376, 1962.
[10] J. V. Dugan, Jr., F. A. Lyman and I. V. Albers, Electricity from MHD, Vol. II, International Atomic Energy Agency, Vienna, p. 85, 1966.
[11] J. V. Dugan, Jr., Journal of Applied Physics, 37, 5011, 1966.
[12] J. M. Zgorzelski, Fluid Mechanics Laboratory Publication, No. 68-1, MIT, Cambridge, 1968.
[13] D. R. Bates, A. E. Kingston and R. D. McWhirter, Proc. Royal Soc. (London), A267, 1962.
[14] T. A. Cool and E. E. Zukoski, Recombination, Ionization and Nonequilibrium Electrical Conductivity in Seeded Plasma, Phys. Fluids, 9:780-796, April 1966.
Copyright © 2022 FDOKUMEN


![$Tl]DH - E-Journal UIN Jakarta](https://static.fdokumen.com/doc/165x107/63260c1d051fac18490d904c/tldh-e-journal-uin-jakarta.jpg)