Documentation for the NCES Common Core of Data School ...
106
Common Core of Data Documentation for the NCES Common Core of Data School District Finance Survey (F-33), School Year 2018–19 (Fiscal Year 2019) Provisional File Version 1a NCES 2021 306 U.S. DEPARTMENT OF EDUCATION - A Publication of the National Center for Education Statistics at IES
-
Upload
khangminh22 -
Category
Documents
-
view
0 -
download
0
Transcript of Documentation for the NCES Common Core of Data School ...

Common Core of Data
Documentation for the NCES Common Core of Data School District Finance Survey (F-33), School Year 2018–19 (Fiscal Year 2019) Provisional File Version 1a
NCES 2021 306 U.S. DEPARTMENT OF EDUCATION
-
A Publication of the National Center for Education Statistics at IES

Documentation for the NCES Common Core of Data School District Finance Survey (F-33), School Year 2018–19 (Fiscal Year 2019)
Provisional File Version 1a
November 2021
Stephen Q. Cornman National Center for Education Statistics
Osei AmpaduKaitlin S. Hanak U.S. Census Bureau
NCES 2021-306 U.S. DEPARTMENT OF EDUCATION

U.S. Department of Education Miguel A. Cardona Secretary
Institute of Education Sciences Mark Schneider Director
National Center for Education Statistics Peggy Carr Commissioner Administrative Data Division Ross Santy Associate Commissioner The National Center for Education Statistics (NCES) is the primary federal entity for collecting, analyzing, and reporting data related to education in the United States and other nations. It fulfills a congressional mandate to collect, collate, analyze, and report full and complete statistics on the condition of education in the United States; conduct and publish reports and specialized analyses of the meaning and significance of such statistics; assist state and local education agencies in improving their statistical systems; and review and report on education activities in foreign countries.
NCES activities are designed to address high-priority education data needs; provide consistent, reliable, complete, and accurate indicators of education status and trends; and report timely, useful, and high-quality data to the U.S. Department of Education, the Congress, the states, other education policymakers, practitioners, data users, and the general public. Unless specifically noted, all information contained herein is in the public domain.
We strive to make our products available in a variety of formats and in language that is appropriate to a variety of audiences. You, as our customer, are the best judge of our success in communicating information effectively. If you have any comments or suggestions about this or any other NCES product or report, we would like to hear from you. Please direct your comments to
NCES, IES, U.S. Department of Education Potomac Center Plaza Washington, DC 20202
November 2021
The NCES Home Page address is https://nces.ed.gov. The NCES Publications and Products address is https://nces.ed.gov/pubsearch. This publication is only available online. To download, view, and print the report as a PDF file, go to the NCES Publications and Products address shown above.
This report was prepared in part under Interagency Agreement (IAA) No. ED-IES-14-J-0012 with the United States Census Bureau. Mention of trade names, commercial products, or organizations does not imply endorsement by the U.S. Government. Suggested Citation Cornman, S.Q., Ampadu, O., Hanak, K.S. (2021). Documentation for the NCES School District Finance Survey (F-33), School Year 2018–19 (Fiscal Year 2019), Provisional File Version 1a (NCES 2021-306). National Center for Education Statistics, Institute of Education Sciences, U.S. Department of Education. Washington, DC. Retrieved [date] from https://nces.ed.gov/ccd/pdf/2021306_FY19F33_Documentation.pdf. Content Contact Stephen Q. Cornman (202) 245-7753 [email protected]

Acknowledgments
The operations and product development for the School District Finance Survey (F-33) are supported through an interagency agreement with the U.S. Census Bureau. Specifically, a team of skilled analysts and statisticians from the Economic Reimbursable Surveys Division of the Census Bureau work closely with the National Center for Education Statistics (NCES) to conduct the School District Finance Survey. Additionally, a network of state education agency fiscal coordinators take responsibility for compiling and reporting finance data for public education activities within their respective states. While their names are too numerous to mention here, NCES and the Common Core of Data (CCD) team greatly appreciate their time, effort, and commitment toward providing timely and accurate school finance data. NCES would like to thank these talented individuals who have each contributed to the success of the CCD program.
iii

Contents
Page Acknowledgments.......................................................................................................................... iii
List of Tables .................................................................................................................................. v
I. Introduction to the NCES School District Finance Survey (F-33), School Year 2018–19 (Fiscal Year 2019) Provisional File Version 1a..................................................................... 1
II. User’s Guide .......................................................................................................................... 3
A. Methodology.................................................................................................................... 3
B. Accounting and Collection Methods ............................................................................... 4
C. Unit Identifiers ............................................................................................................... 10
C.1. Identification Variables ....................................................................................... 10
C. 2 Other Unit Characterization Codes ..................................................................... 15
D. Weights .......................................................................................................................... 17
E. Changes to the F-33 Survey........................................................................................... 18
F. Data File Formats, Names, and Versions....................................................................... 21
G. State Notes ..................................................................................................................... 22
H. Survey Form................................................................................................................... 22
References..................................................................................................................................... 23
Appendixes
Appendix A—Record Layout and Descriptions of Data Items .................................................. A-1
Appendix B—Glossary............................................................................................................... B-1
Appendix C—State Notes........................................................................................................... C-1
Appendix D—Value Distribution and Field Frequencies........................................................... D-1
Appendix E—Survey Form .........................................................................................................E-1
iv

List of Tables
Table Page
1. Destination of state payments on behalf of the Local Education Agency (LEA), by School District Finance Survey (F-33) item: Fiscal year 2019.......................................................... 7
2. LEAs on the School District Finance Survey (F-33) file that do not appear on the school year 2018-19 LEA Universe Survey file, by state and LEAID: Fiscal year 2019............... 11
3. Census Bureau state codes in the first two positions of CENSUSID, by state: Fiscal year 2019.............................................................................................................................. 13
4. State abbreviations and American National Standards Institute (ANSI) state codes, by state: Fiscal year 2019.......................................................................................................... 15
Appendix C—State Notes
C-1. California combined school districts in the School District Finance Survey (F-33) file and the corresponding component districts in the Common Core of Data (CCD) Local Education Agency (LEA) Universe Survey file: Fiscal year 2019 ……..... .....................C-4
Appendix D—Value Distribution and Field Frequencies
D-1. Frequencies of categorical variables: Fiscal year 2019 ................................................... D-2
D-2. Minimum, maximum, and mean for continuous variables, by variable: Fiscal year 2019 ............................................................................................................ D-14
D-3. Number of districts with zero and positive values for revenues, by revenue source and state: Fiscal year 2019 ............................................................................................ D-18
D-4. Number of districts with zero and positive values for current elementary/secondary expenditures, by type of expenditure and state: Fiscal year 2019 ................................. D-19
D-5. Number of districts with zero and positive values for expenditures and membership, by type of expenditure and state: Fiscal year 2019 ....................................................... D-20
D-6. Number of districts and minimum, maximum, and mean of districts’ local revenues, by state: Fiscal year 2019 ............................................................................................... D-21
D-7. Number of districts and minimum, maximum, and mean of districts’ state revenues, by state: Fiscal year 2019 ............................................................................................... D-22
D-8. Number of districts and minimum, maximum, and mean of districts’ federal revenues, by state: Fiscal year 2019 .............................................................................. D-23
v

List of TablesContinued
Page D-9. Number of districts and minimum, maximum, and mean of districts’ total revenues,
by state: Fiscal year 2019 .............................................................................................. D-24
D-10. Number of districts and minimum, maximum, and mean of districts’ current expenditures for instruction, by state: Fiscal year 2019 ................................................ D-25
D-11. Number of districts and minimum, maximum, and mean of districts’ current expenditures for support services, by state: Fiscal year 2019 ....................................... D-26
D-12. Number of districts and minimum, maximum, and mean of districts’ other current expenditures, by state: Fiscal year 2019 ........................................................................ D-27
D-13. Number of districts and minimum, maximum, and mean of districts’ total current expenditures for elementary/secondary education, by state: Fiscal year 2019 ............. D-28
D-14. Number of districts and minimum, maximum, and mean of districts’ capital outlays, by state: Fiscal year 2019 .............................................................................................. D-29
D-15. Number of districts and minimum, maximum, and mean of districts’ non-elementary/secondary expenditures, by state: Fiscal year 2019 .................................... D-30
D-16. Number of districts and minimum, maximum, and mean of districts’ total expenditures, by state: Fiscal year 2019 ........................................................................ D-31
vi

I. Introduction to the NCES School District Finance Survey (F-33), School Year 2018–19 (Fiscal Year 2019) Provisional File Version 1a
This documentation is for the Provisional File Version 1a of the School District Finance Survey (F-33)1 for school year (SY) 2018-19, fiscal year 2019 (FY 19) conducted by the National Center for Education Statistics (NCES). It contains a brief description of the data collection in conjunction with information required to understand and access the data file. The School District Finance Survey consists of data submitted annually to NCES by state education agencies (SEAs) in the 50 states and the District of Columbia. The survey provides finance data for all local education agencies (LEAs) that provide free public elementary and secondary (prekindergarten through grade 12) education in the United States. The School District Finance Survey data file does not include national and state totals.2
The finance data described in this documentation are from the F-33 survey, a component of the Common Core of Data (CCD). The CCD is the primary NCES database on public elementary and secondary education in the United States. The other five surveys in the CCD are the Public Elementary/Secondary School Universe Survey, the Local Education Agency Universe Survey, the State Nonfiscal Survey of Public Elementary/Secondary Education, the National Public Education Financial Survey (NPEFS), and the School-Level Finance Survey (SLFS). The principal users of CCD fiscal data are the federal government; the education research community; state and local government officials (including school boards and LEA administrators); and the general public.
NCES and the Economic Reimbursable Surveys Division of the U.S. Census Bureau collaborate to collect public education finance data. The U.S. Census Bureau conducts a Census of Governments and an Annual Survey of State and Local Government Finances. Congress authorizes NCES to collect school finance data through the Education Sciences Reform Act of 2002, section 151(b) (3), 20 U.S.C. 9541. The Census Bureau acts as the primary collection agent for the F-33 data collection and produces two data files: one for distribution and reporting by the Census Bureau;3 and the other for distribution and reporting by NCES. NCES refers to this data collection as the School District Finance Survey and the Census Bureau refers to this data collection as the Annual Survey of Local Government Finances: School Systems. Specific differences between the collections include:
• Inclusion of independent charter school districts—NCES requests that states report fiscal data in the F-33 survey for all independent charter school districts and all regular school districts that include charter schools. Most states comply with this request. By contrast, the Census Bureau F-33 data file and report include only school districts that
1 The term “F-33”' is the form number utilized for the School District Finance Survey collection instrument. The School District Finance Survey is commonly called the F-33. 2 Refer to the CCD National Public Education Financial Survey (NPEFS) for national- and state-level figures. The NPEFS, a key component of the CCD survey system, collects state totals of school finance data. Although both the NPEFS and the F-33 survey collect data from SEAs, the NPEFS includes expenditures for special state-run and federal-run schools that are not included in the F-33 survey. NPEFS data represent the total spending on public elementary and secondary education for states and the nation, and are used in determining state funding allocations for a number of federal education programs, including those authorized by Title I of the Elementary and Secondary Education Act of 1965. 3 https://www.census.gov/programs-surveys/school-finances.html
1
meet the Census Bureau’s definition of a government entity (U.S. Census Bureau 2021, pp. 1-2).4
• State payments on behalf of school districts—NCES combines state government expenditures for and on behalf of school districts with expenditures school districts make directly for all applicable data items (see table 1). By contrast, the Census Bureau reports state government expenditures on behalf of school districts and expenditures that school districts make directly as separate data items.
• Classification of state and local tax revenues—NCES classifies tax revenues as being from local or state sources, as identified by each state submitting data. The Census Bureau classifies tax revenues as local or state depending on which level of government (local or state) imposed, collected, and distributed the tax revenue.5 Some tax revenues that NCES categorizes as state are categorized as local by the Census Bureau. (For example, the variable Local Revenue/Census Bureau State Revenue (C24)6 records items is classified as local tax revenues by NCES, but as state tax revenues by the Census Bureau).
SEAs appoint state fiscal coordinators to work with NCES and the Census Bureau to provide accurate and comparable finance data across states and jurisdictions. NCES and the Census Bureau provide annual training to state fiscal coordinators to ensure that survey variable definitions are well communicated and that states understand how to report accurate and timely fiscal data for their state or jurisdiction.
The NCES accounting handbook, Financial Accounting for Local and State School Systems: 2014 Edition (Allison 2015), provides a set of standards and guidance for school system accounting. The handbook gives common definitions for detailed account classifications, which are aggregated to form the data items collected in the F-33 survey. The use of the accounting handbook by SEAs facilitates the comparability of data across states and school districts.
The CCD files include regular school districts, independent charter school districts, as well as a substantial number of administrative and other LEAs that are unlike regular school districts (e.g., education service agencies that provide specialized education services for regular school districts). The universe of LEAs changes from year to year. School districts may be newly incorporated, undergo boundary changes, consolidate, disaggregate, or dissolve. The nonfiscal LEA Universe Survey files and documentation located at https://nces.ed.gov/ccd/files.asp #Fiscal:2,LevelId:5,Page:1 present more detailed information on these changes.
The FY 19 School District Finance Survey data file contains 19,700 records representing the public elementary and secondary education agencies in the 50 states and the District of Columbia. The file includes variables for revenues by source, expenditures by function and object, indebtedness, assets, student membership counts, as well as identification variables. For a complete list of variables, see appendix A. Finance data are presented in whole dollar amounts.
4 Because independent charter school districts generally do not meet the Census Bureau’s criteria for classification as government entities, the Census Bureau excludes them from the F-33 data file. 5 The primary consideration is given to the government that imposed the tax (U.S. Census Bureau 2006). 6 Variable names are included in parentheses following variable labels at first reference. Subsequent references use variable names only.
2

The remainder of this documentation includes a user’s guide and five appendixes. The user’s guide contains information on the methodology of this survey, including certain conditions that are unique to the data file for the FY 19 survey cycle and information about changes to the survey that may be important to any data user planning longitudinal analyses.
The five appendixes are as follows:
Appendix A—Record Layout and Descriptions of Data Items gives the variable names and labels of the data items discussed throughout the documentation, as well as their location in the data file for the FY 19 survey cycle.
Appendix B—Glossary defines terms and variables used in the F-33 survey. Appendix C—State Notes provides comments related to unique state financial
reporting anomalies for FY 19 and how those anomalies relate to this data release. Appendix D—Value Distribution and Field Frequencies provides the frequency and
distribution of data items across local education agencies. Appendix E—Survey Form includes a facsimile of the data collection instrument.
II. User’s Guide
A. Methodology
The F-33 survey collects finance data from the entire universe of LEAs in each of the 50 states and the District of Columbia. In late January or early February of each year, the Census Bureau distributes the F-33 survey instrument to all SEAs. Representatives from each SEA collect and edit data from their LEAs and submit data to the Census Bureau usually between March 15th of the year that the collection opens, and October 31st of the following year. However, there is no official deadline for reporting data on the F-33 survey. The FY 19 F-33 collection opened on January 31, 2020 and closed on January 22, 2021. States report data to the Census Bureau in either the F-33 survey format or in the individual state agency’s financial accounting format. When SEAs report in their state agency format, Census Bureau staff evaluates the SEA’s chart of accounts and creates a “crosswalk” that translates the amounts states report in state agency format to amounts for each F-33 survey variable.
For the FY 19 collection, the following states submitted data in their own formats: Alabama, California, Indiana, Kentucky, Louisiana, Massachusetts, Mississippi, Montana, Nebraska, New Hampshire, New Jersey, New York, North Carolina, Oregon, South Carolina, Tennessee, and Utah. Idaho sent revenue data in the F-33 survey format and expenditure data in their own state format. All other states reported data in the F-33 survey format. Survey analysts monitor data quality by comparing the school district finance data to other CCD survey data and performing internal and longitudinal consistency checks.
The F-33 survey provides finance data for each school district in the United States at the school district level. The sum of school district-level data from F-33 data items to state-level totals may differ from state finance data provided from NPEFS, which collects total revenues and expenditures for public elementary and secondary education at the state level. This difference can occur because NPEFS includes expenditures for schools and programs operated by the states and federal government that are not reported at the school district level. There may also be differences in the sum of F-33 and NPEFS data items based on data collection techniques,
3

particularly for states where the data are subject to a “crosswalk” that conforms data in the state agency format to the F-33 data items.
B. Accounting and Collection Methods
The F-33 survey intends to provide a comprehensive picture of the financial activity associated with public elementary and secondary school systems. F-33 data include all financial transactions associated with revenues by source, expenditures by function and object, indebtedness, and assets.
The Census Bureau performs the data collection and reviews the data applying business rules and edits designed to identify data that may be erroneous. The Census Bureau and NCES work with state fiscal coordinators to resolve any inconsistent or unusual data. The Census Bureau may edit data based on supplemental information in the event that the LEA data do not strictly adhere to the reporting guidelines of the NCES accounting handbook. Census also imputes data items that are missing. Imputations provide a plausible substitution for cases where data are not reported or erroneous. Appendix C—State Notes provides a general record of data anomalies associated with state reporting and adaptations for the F-33 survey.
Data Editing
F-33 survey staff engages in data editing, which is an iterative and interactive process that includes procedures for detecting and correcting errors in the data. Data editing minimizes errors and ensures the data are complete, accurate, and consistent across the data file. In accordance with NCES Statistical Standard 4-1, F-33 data are checked for “credibility based on range tolerances to determine if responses fall within a prespecified reasonable range” and “consistency based on checks across variables within individual records for noncontradictory responses” (NCES 2014).
After an SEA submits data, the survey staff conducts a comprehensive review of the data, which include numerous edit checks. These edit checks include but are not limited to:
• trend analysis for multiple years; • large value and percentage fluctuations from prior year data; • “consistency” edit checks (e.g., for a given expenditure function, the sum of reported
salaries and employee benefits cannot be greater than the reported total); • outlier per pupil current expenditure amounts; • unreasonable zero dollar amounts; • comparison of current year data file record layouts to record layouts the SEA submitted
in the previous fiscal year; and • comparison of state-aggregated F-33 data with NPEFS data to ensure the F-33 data
amounts are within a reasonable range at the state level.
F-33 survey analysts prepare follow-up questions for SEA respondents based on the results of these edit checks. SEAs are asked to explain all undocumented data anomalies and correct any data errors. If the SEA is unable to provide an explanation or revision for these anomalies, F-33 survey analysts will edit or impute the data based on a set of business rules.
4

Imputations
Imputation is a procedure that uses available information and some plausible assumptions to derive substitute values for missing or incorrectly reported values in a data file. In some cases, an SEA may be able to report a subtotal of multiple F-33 data items at the state level but may be unable to report the data items separately at the LEA level. In other cases, an SEA may be able to provide a state total for a single F-33 data item but may not be able to report the data item at the LEA level.
For the F-33 survey, imputations are performed primarily on data items that include state payments on behalf expenditures. (See table 1 for a list of data items that include state payment of behalf expenditures.) Many states track the expenditures they make on behalf of LEAs (e.g., state contributions on behalf of the LEA to school district employee pension funds) at the state level, but are unable to accurately report these amounts at the LEA level.
When submitting finance data, SEAs inform the Census Bureau how state payments on behalf amounts are being reported so that any necessary imputations can be performed. If the SEA is only able to report a state-level subtotal of state payment on behalf expenditures to be distributed across multiple F-33 data items, a portion of the subtotal is distributed at the LEA level to each relevant state payment on behalf item listed in table 1. This distribution is based on the ratio of what the LEA reported for the corresponding salary data item to the total salary expenditures reported at the state level. If the SEA is able to provide a subtotal of state payment on behalf expenditures to be included in a single F-33 data item, a portion of the subtotal is distributed at the LEA level to that data item based on the ratio of what the LEA reported for the corresponding salary item to the total corresponding salary expenditures reported at the state level.
Appendix C—State Notes documents which states were subject to imputation of state payment on behalf expenditures.
Crosswalk Procedures
The Census Bureau has developed “crosswalk” procedures to assist some states in their reporting of F-33 data and to improve the comparability of this data across states. The Census Bureau utilizes in-house SAS programs to convert state account code amounts that state education agency format-reporting states submit to F-33 survey variable amounts. These crosswalk procedures may also include imputation in cases where the state’s account codes are unable to be directly crosswalked to an F-33 survey variable (and the state is otherwise unable to report the variable).
Section II.A of this documentation (above) lists the states that report in a format requiring a crosswalk for conversion to F-33 survey format. Appendix C—State Notes documents any imputation procedures that may have occurred for these states during the crosswalk process.
Fiscal Years
The fiscal year begins on July 1 and ends on June 30 for most states. The fiscal year for Alabama and the District of Columbia runs from October 1 through September 30; the fiscal year for
5

Nebraska, Texas, and Washington runs from September 1 through August 31. Survey analysts do not edit F-33 data to conform to a uniform fiscal year.
Transfer Items
The School District Finance Survey file contains several items involving the transfer of funds among school districts. Local Revenues From Other School Systems (D11) consist of payments received from other school districts for providing services. Payments to Other School Systems (Q11) are expenditures made to other school districts for providing services. For each school district, D11 is included in the summary variables for total local revenue (TLOCREV) and total revenue (TOTALREV), while Q11 is included in the summary variable for total expenditure (TOTALEXP). Data users should refer to NPEFS data for state and national totals; compiling state and national totals from the F-33 survey data would result in double counting, due to the inclusion of the D11 and Q11 transfer items.
Other transfer items include Local Revenues From Cities and Counties (D23), Payments to State Governments (L12), and Payments to Local Governments (M12). D23 revenue is included in the summary variables TLOCREV and TOTALREV. L12 and M12 expenditures are included in TOTALEXP.
Special Exhibit Items
Special exhibit items are separate data items that are included in, but do not summarize to, other data items.
• Expenditures for teacher salaries are defined as base salaries paid to certified teachers and certified substitute teachers. Expenditures for teacher salaries are reported in four educational program areas: Regular (Z35), Special (Z36), Vocational (Z37), and Other (Z38). The broader instructional salaries data item (Z33) includes both expenditures for teacher salaries by program area and salaries for instructional assistants and aides. Textbook expenditures for instructional purposes (V93) are also reported as an exhibit item.
• Payments to Private Schools (V91) and Payments to Charter Schools (V92) are special exhibit items used to identify LEA expenditures for private schools and charter schools outside of the LEA. V91 and V92 do not represent total private school and charter school expenditures. Prior to FY 09, V91 and V92 expenditures were included in Current Expenditures—Instruction (E13), Total Current Expenditures—Instruction (TCURINST), Total Current Expenditure for Elementary/Secondary Education (TCURELSC), and TOTALEXP. Beginning with FY 09, E13, TCURINST, and TCURELSC do not include V91 and V92. (V91 and V92 are still included in TOTALEXP.)
• State Revenue on Behalf—Employee Benefits (C38) and State Revenue on Behalf—Not Employee Benefits (C39) are included in the total state revenue (TSTREV) and total revenue (TOTALREV). State direct support expenditures for and on behalf of school districts are not reported separately in the F-33 file, but are included in the expenditure data item detail as shown below in table 1.
6

Table 1. Destination of state payments on behalf of the Local Education Agency (LEA), by School District Finance Survey (F-33) item: Fiscal year 2019 State payments on behalf item Instruction employee benefits (J13)
Destination items Employee Benefits - Instruction (V10) Current Expenditures - Instruction (E13)
Pupil support services employee benefits (J17) Employee Benefits - Support Services - Pupils (V12) Current Expenditures - Support Services - Pupils (E17)
Instructional staff support employee benefits (J07) Employee Benefits - Support Services - Instructional Staff (V14) Current Expenditures - Support Services - Instructional Staff (E07)
General administration employee benefits (J08) Employee Benefits - Support Services - General Administration (V16) Current Expenditures - Support Services - General Administration (E08)
School administration employee benefits (J09) Employee Benefits - Support Services - School Administration (V18) Current Expenditures - Support Services - School Administration (E09)
Operation/maintenance of plant employee benefits (J40) Employee Benefits - Support Services - Operation/Maintenance of Plant (V22) Current Expenditures - Support Services - Operation/Maintenance of Plant (V40)
Student transportation employee benefits (J45) Employee Benefits - Support Services - Student Transportation (V24) Current Expenditures - Support Services - Student Transportation (V45)
Business/central/other employee benefits (J90) Employee Benefits - Support Services - Business/Central/Other (V38) Current Expenditures - Support Services - Business/Central/Other (V90)
Other employee benefits (J10) Employee Benefits - Food Services (V30) Current Expenditures - Food Services (E11)
Instructional nonbenefits (J14) Current Expenditures - Instruction (E13)
Support services nonbenefits (J96)1 Current Expenditures - Support Services - Pupils (E17) Current Expenditures - Support Services - Instructional Staff (E07) Current Expenditures - Support Services - General Administration (E08) Current Expenditures - Support Services - School Administration (E09) Current Expenditures - Support Services - Operation/Maintenance of Plant (V40) Current Expenditures - Support Services - Student Transportation (V45) Current Expenditures - Support Services - Business/Central/Other (V90)
Capital outlay (J99)2 Capital Outlay - Instructional Equipment (K09) Capital Outlay - Other Equipment (K10)
1 Included in one or more of the corresponding current expenditure functions, varying from state to state. 2 Included in one or more of the corresponding capital outlay categories, varying from state to state. SOURCE: U.S. Department of Education, National Center for Education Statistics, “School District Finance Survey (F-33),” fiscal year 2019, Provisional File Version 1a.
Data Item Flags
Beginning with FY 99, the School District Finance Survey data file contains a flag for each data item (except summary items, such as TOTALREV, TLOCREV, and TOTALEXP). The flag identifies whether the item was reported by the state, missing, edited by F-33 survey staff, imputed, or was not applicable to that school district. These companion flags can be found at the end of the data file and are identified by the name of the original data item preceded by an “FL_” (e.g., FL_E13 or FL_19H).
7

The data item flags are as follows:
R—As reported by the state; A—Edited or suppressed by the analyst (formerly labeled “Adjusted”); I—Imputed; N—Not applicable; and M—Missing.
Missing, Nonapplicable, and Suppressed Data
Missing data are identified as “-1.” Sometimes it is difficult to determine whether a reported zero from a state respondent represents a missing data item or a true zero. For example, small school districts often have staff and other costs that span across multiple expenditure functions. The principal of a school in a one-school LEA may also serve as the LEA superintendent. In some cases, the state might report this person’s salary under LEA administration instead of allocating the salary to both LEA administration and school administration functions. In this scenario, the zero data reported for school administration would be assigned a flag of “R.”
In the School District Finance Survey data files, the original source for the fall student membership (V33) is the SY 2018-19 LEA Universe Survey. The Census Bureau and NCES may edit student membership counts from the LEA Universe Survey if the state reports revised membership information for the F-33 survey. States generally report nonfiscal October 1st
membership information for the LEA Universe Survey in the spring of the school year (e.g., report SY 2018-19 membership data in the spring of 2019). The timing of the F-33 collection is about one year after the LEA Universe Survey collection. Even though the membership data have the same reference date and definition, V33 values may not match student membership values from the LEA Universe Survey for some LEAs. In the F-33 data files, CCD identifies suppressed membership data by reporting the membership as “-3” and the membership flag as a value of “A.” NCES suppresses V33 values in cases where reported LEA finances do not reasonably reflect LEA universe survey student membership counts (as reported in the LEA Universe Survey). For example, special education and vocational LEAs may have suppressed membership values in the F-33 files if these LEAs report finance data associated with services provided to students that are not included in their student membership counts (i.e., because the students are instead counted within the membership of the regular school districts financially responsible for educating those students).
Beginning with FY 10, CCD identifies submitted School District Finance Survey data that do not meet NCES data quality standards by reporting the data item as “-9” and data item flag as “A.” This suppression would only occur with numeric data items. Data with positive values that have an “A” flag are adjusted or edited.
Nonapplicable data have a data value of “-2” and the data item flag as a value of “N.” Nonapplicable data are cases where a district does not have a particular type of revenue or expenditure. For example, for fiscally independent districts, the value for Local Revenues— Parent Government Contributions (T02) is “-2,” and the corresponding Flag—Local Revenues— Parent Government Contributions, Dependent School Systems (FL_T02) flag value is “N.”
Beginning with FY 10, the School District Finance Survey data file includes records for all LEAs in the CCD nonfiscal LEA Universe file that did not submit data for the F-33 survey. (These
8

LEAs were omitted from the School District Finance Survey data files in previous fiscal years.) All finance data items for these LEAs are reported as missing or nonapplicable as appropriate.
Nonsampling Error
Nonsampling error is the error in an estimate arising at any stage in the survey from sources exclusive of sampling error. Nonsampling error includes coverage errors, nonresponse error, data processing or data entry errors, and reporting errors that occur because respondents misinterpret survey questions, do not follow survey instructions, or do not follow the item definitions correctly. State education policies may differ in such a way that does not allow them to map their data exactly to the CCD definitions. For example, most states can report adult education expenditures separately from instruction expenditures (as the F-33 survey instructions request), but a few states cannot report adult education expenditures separately because these states require that LEAs account for adult education expenditures within instruction. Another source of nonsampling error may be variations in the reference period for the reported data. For example, CCD requests student membership data for October 1 of each school year, but a state may report their information for another date because they were not able to capture the data for October 1.
The universe for the F-33 survey includes all public elementary and secondary LEAs in the 50 states and the District of Columbia. All 51 state-level respondents reported F-33 data for FY 19. There are 19,700 LEAs on the FY 19 School District Finance Survey file. Finance data were reported for 18,815, or 95.5 percent, of these LEAs. Most of the LEAs that did not report finance data for the FY 19 survey are either charter school districts or other nontraditional LEAs (e.g., education service agencies), which states often do not subject to the same financial reporting requirements as regular school districts.
Charter school districts’ reporting requirements vary from state to state. As a result, SEAs do not report finance data for charter schools uniformly. Some independent charter school districts do not submit finance data to SEAs, and, as a result, fiscal data for these schools are reported as missing in the School District Finance Survey file.
Reference Sources for Data Definitions
Four reference sources are used in conjunction with F-33 variable descriptions and state reporting:
• Financial Accounting for Local and State School Systems: 2014 Edition (Allison 2015) can be accessed online at https://nces.ed.gov/pubsearch/pubsinfo.asp?pubid=2015347. This publication contains standard account codes, classification criteria, and definitions for reporting school system financial information, providing a system by which fiscal data can be reported in a comprehensive and uniform manner.
• Governmental Accounting, Auditing, and Financial Reporting (Gauthier 2005) can be purchased from the Government Finance Officers Association.
• Government Finance and Employment Classification Manual (U.S. Census Bureau 2006) can be accessed online at http://www2.census.gov/govs/pubs/classification/2006_classification_manual.pdf.
• F-33 Survey Form “Basic Instructions and Suggestions” includes a summary of definitions needed to respond to the survey (see the survey form in appendix E).
9

C. Unit Identifiers
Six variables serve as the primary identification variables for each LEA on this file:
• NCES 7-digit local education agency identification code (LEAID); • Census Bureau 14-digit government identification code (CENSUSID); • American National Standards Institute (ANSI)7 state code (FIPST); • ANSI county code (CONUM); • Consolidated Statistical Area code (CSA); and • Core-Based Statistical Area code (CBSA).
C.1. Identification Variables
LEAID
The NCES local education agency identification code (LEAID) is the most frequently used identifier within this data release. LEAID codes allow users to match LEA finance data with data from the nonfiscal CCD surveys (e.g., the LEA Universe Survey and the Public Elementary/Secondary School Universe Survey, which contain aggregate data on students, membership, staff, dropouts, and graduates). The LEAID code has seven characters: a two-digit state code followed by a five-digit number that is unique to each agency within the state. This identifier generally remains the same across the years of data collection.
LEAID Matching Issues
The LEAs reported on the F-33 file are assigned valid LEAIDs by being matched against the LEA Universe Survey file. Matches are first attempted against the LEA universe file for the corresponding school year (SY 2018-19 for the FY 19 F-33 file). If survey staff cannot match the LEAs to the LEA universe file for the corresponding school year, they attempt to match the LEAs to prior and subsequent year universe files. Matching to prior and subsequent year universe files allows for closed and future LEAs to be reported on the F-33 file under valid LEAIDs. Closed LEAs can still have financial activity after they close, but they are included on the F-33 file as closed only in the year that they closed. Similarly, future LEAs may have had start-up costs in years before becoming operational, but may not have been reported in the LEA universe file for those years.
Starting in FY 06, the Census Bureau assigned unique dummy LEAIDs to the LEAs without a valid LEAID. There are 9 dummy LEAIDs on the FY 19 file. Dummy LEAIDs are distinguished by a “D” in the third position of the LEAID. Dummy LEAIDs will remain the same across the years of data collection, unless a matching LEA is found in the LEA Universe in the subsequent year.
7 American National Standards Institute (ANSI) state codes replace the Federal Information Processing Standards (FIPS) codes previously issued by the National Institute of Standards and Technology (NIST) for the 50 states, the District of Columbia, and the U.S. Island Areas. ANSI state code values map directly to the retired FIPS code values.
10

The CCD Agency Nonfiscal File Match variable (CCDNF) indicates whether a record on the F-33 file matches a record on the LEA universe file. A value of “1” indicates that the record on the F-33 file matches a record on the LEA universe file; a value of “0” indicates that the record on the F-33 file does not match any records on the SY 2018-19 LEA universe file. The F-33 staff attempt to match every LEA there is data for, regardless of membership, even if the membership is reported as zero.
There are 42 LEAs on the FY 19 F-33 file that do not appear on the SY 2018-19 LEA Universe Survey file (see table 2). (These LEAs are also identified on the F-33 file by having a CCDNF value equal to “0.”). All 42 of these LEAs have been confirmed as school systems by the reporting SEAs and the Census Bureau. (These are generally education service agencies and nonoperating LEAs that were not reported by SEA respondents for the CCD LEA Universe Survey.)
Table 2. LEAs on the School District Finance Survey (F-33) file that do not appear on the school year 2018-19 LEA Universe Survey file, by state and LEAID: Fiscal year 2019
State LEAID LEA name on the F-33 file Connecticut 09D0001 COMMITTEE FOR SHARED SERVICES
09D0002 PROJECT OCEANOLOGY Illinois 1700215 SCHOOL ASSOCIATION SPECIAL EDUCATION DUPAGE (SASED)
17D0001 KENDALL COUNTY OUTDOOR EDUCATION Indiana 1800104 HANCOCK MADISON SHELBY ED SERVICES
1800206 KIPP INDY LEGACY HIGH 1800207 INVENT LEARNING HUB 1800208 PARAMOUNT ENGLEWOOD 1800209 EXCEL CENTER - BLOOMINGTON
Kansas 20D0001 SMOKY HILL-CENTRAL KANSAS EDUCATION SERVICE CENTER 20D0002 TECHNOLOGY EXCELLENCE IN EDUCATION NETWORK
CENTRAL KANSAS EDUCATIONAL SERVICES AND STAFF 20D0003 DEVELOPMENT AS 20D0631 LEARNING CONSORTIUM EDUCATIONAL COOPERATIVE
Maine 2300051 ME ED CTR FOR THE DEAF & HARD OF HEARING 2314774 CENTRAL LINCOLN COUNTY SCHOOL SYSTEM 2314781 HARMONY REGIONAL SCHOOL DISTRICT 2314786 MOUNT DESERT ISLAND REGIONAL SCHOOL SYSTEM 2314798 SUNRISE COUNTY SCHOOL SYSTEM 2314800 ROCKY CHANNELS SCHOOL SYSTEM 2314801 MACHIAS BAY AREA SCHOOL SYSTEM 2314804 EASTERN MAINE AREA SCHOOL SYSTEM 2314826 DEDHAM ORRINGTON SCHOOL SYSTEM (AOS 47) 2314828 AOS 43 23D0001 SOUTHERN MAINE ADMINISTRATIVE COLLABORATIVE (SMAC)
Michigan 2612000 DETROIT CITY SCHOOL DISTRICT Minnesota 2700033 OAKLAND VOCATIONAL CENTER 957
2700265 REGIONAL MANAGEMENT INFORMATION CENTER 5 See notes at end of table.
11

State LEAID LEA name on the F-33 file Minnesota 2700266 REGIONAL MANAGEMENT INFORMATION CENTER 4
2700267 REGIONAL MANAGEMENT INFORMATION CENTER 3 2700268 REGIONAL MANAGEMENT INFORMATION CENTER 2 2700269 REGIONAL MANAGEMENT INFORMATION CENTER 1 2700270 REGIONAL MANAGEMENT INFORMATION CENTER 7
New Jersey 3417040 WASHINGTON TWP SCH DIST New Mexico 3500115 CIEN AGUAS INTERNATIONAL SCHOOL
3500145 LA RESOLANA LEADERSHIP 3500149 WILLIAM W & JOSEPHINE DORN CHARTER COMMUNITY SCHOOL
New York 36D0001 SOUTH MOUNTAIN-HICKORY COMMON SCHOOL DIST Pennsylvania 4200002 LANCASTER COUNTY ACADEMY Virginia 5101230 FAIRFAX CITY SCHOOLS West Virginia 5400058 EASTERN PANHANDLE INSTRUCTIONAL COOPERATIVE
5400059 SOUTHERN EDUCATIONAL SERVICES COOPERATIVE 5400061 MOUNTAIN STATE EDUCATIONAL SERVICES COOPERATIVE
NOTE: LEAs listed in this table with valid LEAIDs (i.e., no “D” in the third position of the LEAID), appear in either a prior or future year of the LEA Universe Survey file. SOURCE: U.S. Department of Education, National Center for Education Statistics, Common Core of Data (CCD), "School District Finance Survey (F-33)," fiscal year 2019, Provisional File Version 1a; “Local Education Agency Universe Survey,” school year 2018-19, Provisional File Version 1a.
In most NCES research and publications, only those F-33 records matching the LEA universe file (CCDNF equal to “1” on the F-33 data file) and having student counts greater than zero are used in analyses. For more information on the LEAID code, please see the file documentation for the CCD school universe and LEA universe surveys, available at https://nces.ed.gov/ccd/pubagency.asp.
CENSUSID
The Census Bureau identification code (CENSUSID) consists of the following items by their position in a 14-character field:
1–2 = Census Bureau state code; 3 = Agency type code; 4–6 = County area code; 7–9 = Parent school district government identifier; and 10–14 = Subunit of parent school district government identifier.
Positions 1 and 2 of CENSUSID (for all survey cycles) represent the Census Bureau, Governments Division state codes. Table 3 includes a complete listing of these codes.
12

Table 3. Census Bureau state codes in the first two positions of CENSUSID, by state: Fiscal year 2019 Census Bureau Census Bureau
State name state code State name state code Alabama 01 Montana 27 Alaska 02 Nebraska 28 Arizona 03 Nevada 29 Arkansas 04 New Hampshire 30 California 05 New Jersey 31
Colorado 06 New Mexico 32 Connecticut 07 New York 33 Delaware 08 North Carolina 34 District of Columbia 09 North Dakota 35 Florida 10 Ohio 36
Georgia 11 Oklahoma 37 Hawaii 12 Oregon 38 Idaho 13 Pennsylvania 39 Illinois 14 Rhode Island 40 Indiana 15 South Carolina 41
Iowa 16 South Dakota 42 Kansas 17 Tennessee 43 Kentucky 18 Texas 44 Louisiana 19 Utah 45 Maine 20 Vermont 46
Maryland 21 Virginia 47 Massachusetts 22 Washington 48 Michigan 23 West Virginia 49 Minnesota 24 Wisconsin 50 Mississippi 25 Wyoming 51 Missouri 26
NOTE: CENSUSID is the Census Bureau identification code. SOURCE: U.S. Department of Education, National Center for Education Statistics, Common Core of Data (CCD), “School District Finance Survey (F-33),” fiscal year 2019, Provisional File Version 1a.
Position 3 of CENSUSID represents the school district’s type of government. It indicates whether a school district is an administratively and fiscally independent government and, if not, what level of government has administrative and fiscal authority over the school district. This characteristic has not remained constant over all survey cycles. For an explanation of CENSUSID changes, see the FY 02 F-33 file documentation (Berry and Cohen 2005). The agency type codes are as follows:
0 = State government school system; 1 = County-dependent school system; 2 = City-dependent school system; 3 = Township-dependent school system; and 5 = Independent school system.
The Census Bureau uses extensive criteria to determine whether an LEA is a government entity and, if so, the agency type of the LEA. This criteria includes, but is not limited to, the LEA’s authority to levy taxes, the LEA’s ability to determine its own budget without review from other
13

local governments, and how the members of the LEA’s school board were appointed (U.S. Census Bureau 2006). If the Census Bureau determined an LEA should not be classified as a government entity, the CENSUSID for the LEA is reported as “N” in the F-33 file.
Positions 4–6 of CENSUSID represent the county area code. County area codes generally reflect alphabetically ordered numbering of counties for each state. Positions 7–9 uniquely identify a government unit, regardless of type. After the FY 93 survey cycle, the Census Bureau added unique identifiers (positions 10 through 14) to further specify subunits of parent governments. For some districts, CENSUSID may change across survey cycles due to boundary changes or changes in governmental control.
Geographic Variables
Four variables in the School District Finance Survey file allow records to be identified with specific geographic areas:
FIPST is the two-digit ANSI state code. Each record on the School District Finance Survey file contains an ANSI state code based on the Federal Information Processing Series (FIPS). Table 4 presents ANSI state codes by state name and state abbreviation.
CONUM is the five-digit ANSI county number. It consists of a two-digit ANSI state code and a three-digit county identification number. County numbers for each state can be found at https://www.census.gov/geographies/reference-files/2019/demo/popest/2019-fips.html.
CBSA is the Core-Based Statistical Area code. CBSA refers collectively to metropolitan and micropolitan statistical areas. Each metropolitan statistical area must have at least one urbanized area of 50,000 or more inhabitants. Each micropolitan statistical area must have at least one urban cluster of at least 10,000 but less than 50,000 population.8
CSA is the Combined Statistical Area code. A CSA consists of two or more adjacent CBSAs.
For the CCD collections, ANSI state codes (FIPST) are assigned to LEAs based on the state or jurisdiction responsible for administration of the LEA, which is not necessarily the state or jurisdiction where the LEA is physically located (Geverdt 2018). Examples of this situation include states that operate LEAs in a neighboring state and charter school LEA operators/administrators based in one state that operate charter schools in one or more states other than the state in which they are based. Additionally, ANSI county codes (CONUM) are assigned to LEAs based on the physical location of the LEA’s administrative offices; therefore, the two-digit ANSI state code within the CONUM may differ from FIPST in cases where the LEA’s administrative offices are physically located outside the reporting state.9
8 For additional information about CBSA and CSA definitions, see https://www.census.gov/programs-surveys/geography/about/glossary.html. 9 For additional information on FIPST state code and CONUM county physical location discrepancies, see section 5.4 (page 5) of the CCD geographic file documentation, “Education Demographic and Geographic Estimates (EDGE) Geocodes: Public Schools and Local Education Agencies” (Geverdt 2018).
14
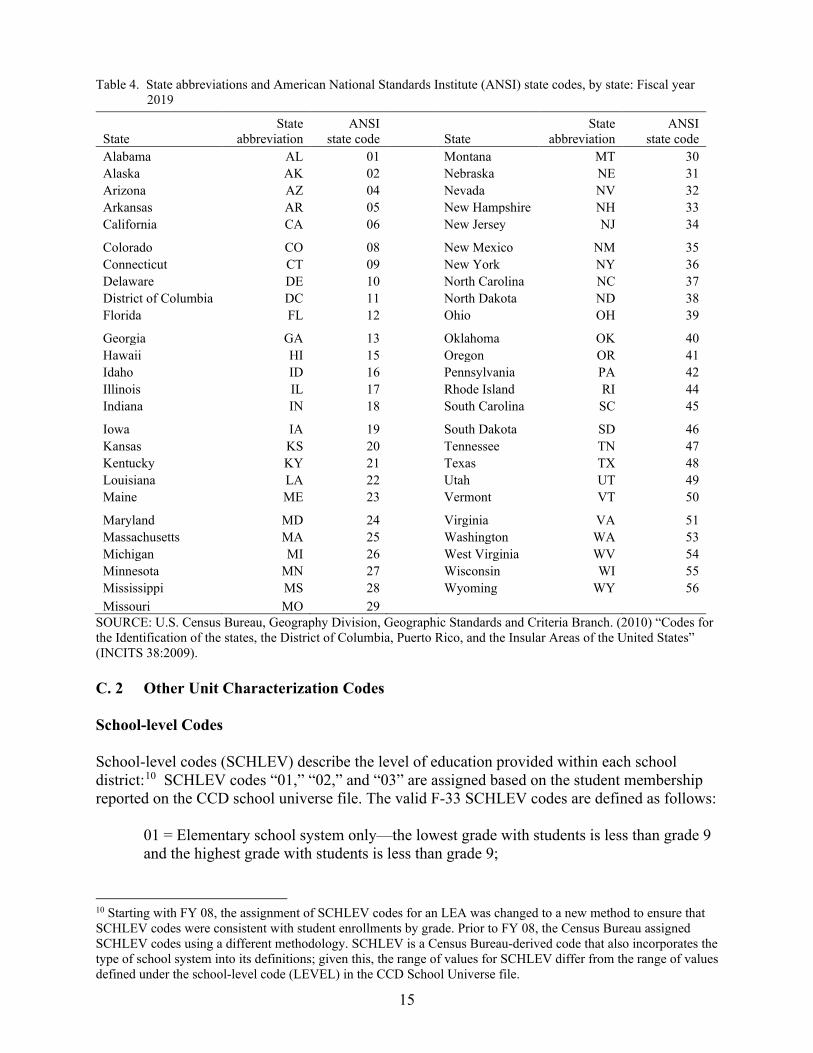
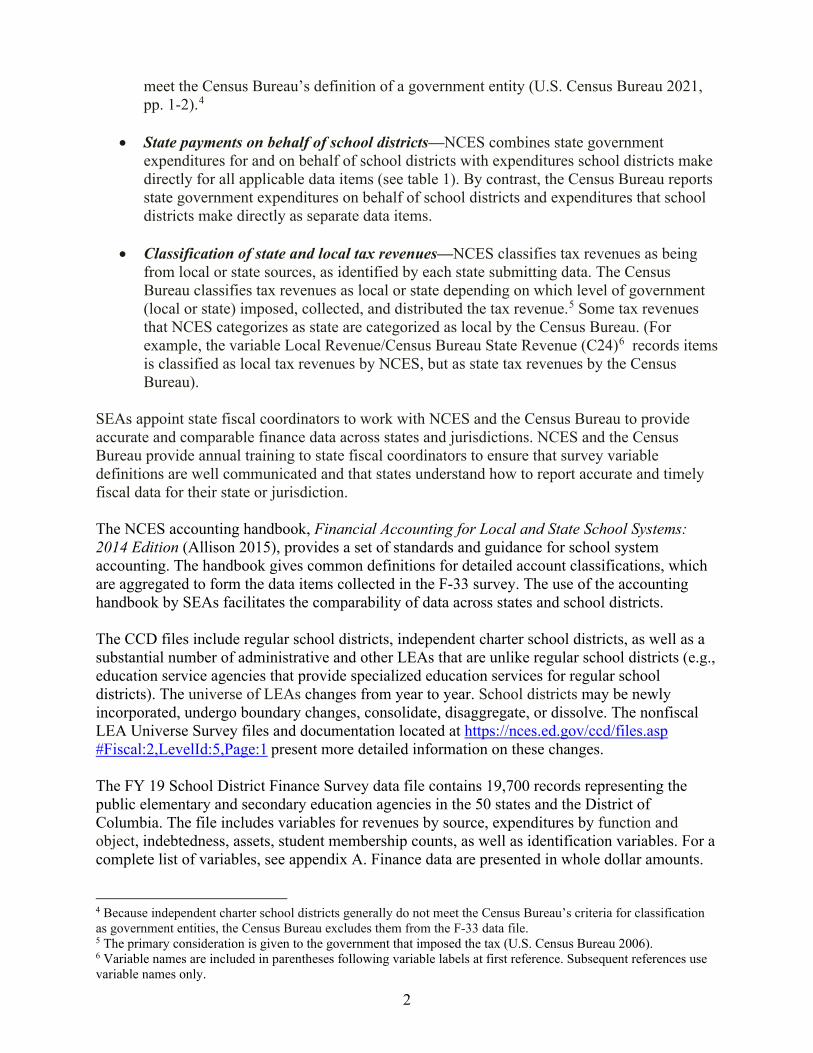
Table 4. State abbreviations and American National Standards Institute (ANSI) state codes, by state: Fiscal year 2019
State ANSI State ANSI State abbreviation state code State abbreviation state code Alabama AL 01 Montana MT 30 Alaska AK 02 Nebraska NE 31 Arizona AZ 04 Nevada NV 32 Arkansas AR 05 New Hampshire NH 33 California CA 06 New Jersey NJ 34
Colorado CO 08 New Mexico NM 35 Connecticut CT 09 New York NY 36 Delaware DE 10 North Carolina NC 37 District of Columbia DC 11 North Dakota ND 38 Florida FL 12 Ohio OH 39
Georgia GA 13 Oklahoma OK 40 Hawaii HI 15 Oregon OR 41 Idaho ID 16 Pennsylvania PA 42 Illinois IL 17 Rhode Island RI 44 Indiana IN 18 South Carolina SC 45
Iowa IA 19 South Dakota SD 46 Kansas KS 20 Tennessee TN 47 Kentucky KY 21 Texas TX 48 Louisiana LA 22 Utah UT 49 Maine ME 23 Vermont VT 50
Maryland MD 24 Virginia VA 51 Massachusetts MA 25 Washington WA 53 Michigan MI 26 West Virginia WV 54 Minnesota MN 27 Wisconsin WI 55 Mississippi MS 28 Wyoming WY 56 Missouri MO 29
SOURCE: U.S. Census Bureau, Geography Division, Geographic Standards and Criteria Branch. (2010) “Codes for the Identification of the states, the District of Columbia, Puerto Rico, and the Insular Areas of the United States” (INCITS 38:2009).
C. 2 Other Unit Characterization Codes
School-level Codes
School-level codes (SCHLEV) describe the level of education provided within each school district:10 SCHLEV codes “01,” “02,” and “03” are assigned based on the student membership reported on the CCD school universe file. The valid F-33 SCHLEV codes are defined as follows:
01 = Elementary school system only—the lowest grade with students is less than grade 9 and the highest grade with students is less than grade 9;
10 Starting with FY 08, the assignment of SCHLEV codes for an LEA was changed to a new method to ensure that SCHLEV codes were consistent with student enrollments by grade. Prior to FY 08, the Census Bureau assigned SCHLEV codes using a different methodology. SCHLEV is a Census Bureau-derived code that also incorporates the type of school system into its definitions; given this, the range of values for SCHLEV differ from the range of values defined under the school-level code (LEVEL) in the CCD School Universe file.
15

02 = Secondary school system only—the lowest grade with students is greater than grade 6 and the highest grade with students is greater than grade 8; 03 = Elementary/Secondary school system—the lowest grade with students is less than grade 7 and the highest grade with students is greater than grade 8; 05 = Vocational or special education system; 06 = Nonoperating school system that exists for administrative purposes only and does not operate its own schools. SCHLEV code “06” is also assigned for LEAs that closed shortly before the start of the fiscal year or are scheduled to open in a future fiscal year but still reported revenue or expenditure information for the current fiscal year; and 07 = Education service agency (ESA).
ESAs are coded as “07” regardless of whether or not they provide general, special, or vocational education services. Special, vocational, and alternative education schools are identified in the CCD school universe file; a count of schools within an LEA by type can help determine the type of services provided by that LEA. (The LEAID of the school’s agency is part of its record on the universe file.)
AGCHRT Codes
Charter schools provide free public elementary and/or secondary education to eligible students under a specific charter granted by the state legislature or other appropriate authority, and are designated by said authority to be a charter school. In some instances, charter schools do not have to comply with significant state or local rules that normally govern the operation and management of public schools. A developer creates a charter school as a public school or a charter school is adapted from an existing public school. A charter school provides a program of elementary or secondary education (or both), and operates in pursuit of a specific set of education objectives determined by the school’s developer and agreed to by the school’s chartering agency. Charter schools are subject to all applicable federal, state, and local health and safety requirements; federal civil rights laws; and are subject to all applicable state laws and regulations. Charter schools may be operated by a regular school district, a university, or a private organization or they may be independent, self-governing entities. CCD nonfiscal standards require all schools, including charter schools, to be associated with a school district. In cases where a charter school is not associated with another school district, the charter school is reported in the CCD nonfiscal universe as an independent entity under its own school district record.
The agency charter code (AGCHRT) is used to identify districts with charter schools. As of FY 17, the AGCHRT code is derived from the CHARTER_TEXT charter school indicator variable in the CCD School Universe file.11 The valid AGCHRT codes are as follows:
1 = All associated schools are charter schools; 2 = Some but not all associated schools are charters schools; 3 = No associated schools are charter schools; and N = Not applicable or code could not be determined (assigned to school systems in the F-33 file, such as ESAs, that do not operate schools, as well as to districts that are not in the CCD LEA universe files).
11 Prior to FY 17, the source of the AGCHRT code was the CCD LEA Universe file. The AGCHRT code was removed from the CCD LEA Universe Survey after the SY 2015-16 (FY 16) collection.
16

CCDNF
The CCDNF variable indicates whether a record in the School District Finance Survey file matches a record in the CCD LEA universe file: “0” indicates that the record does not match; “1” indicates that the record does match.
CENFILE
The CENFILE variable identifies records in the School District Finance Survey data file released by NCES that are not found in the Census Bureau’s version of the data file. All school districts in the Census Bureau release must meet the criteria for being a government entity or a dependent agency of a government entity. In certain cases, districts provide public education, but do not meet these criteria. As a result, CCD files include independent charter school districts that are not included in the Census Bureau data file. A CENFILE value of “0” identifies districts that are not in the Census Bureau file; a value of “1” identifies those that are in the Census Bureau file.
GSLO and GSHI
Agency Low Grade Offered (GSLO) and Agency High Grade Offered (GSHI) comprise the grade span for the LEA. The GSLO variable indicates the lowest grade offered; the GSHI variable indicates the highest grade offered. The source of the GSLO and GSHI variables is the SY 2018-19 CCD LEA Universe Survey, Provisional File Version 1a.
As of FY 15, the GSLO and GSHI variables have additional possible values of “13” and “AE” to reflect that data for grade 13 and adult education are now included in the CCD.12 Grade 13 designates high school students enrolled in programs to earn college credit in an extended high school environment, or career and technical education (CTE) students in a high school program continuing past grade 12. Corresponding enrollment counts for grade 13 students are also included in the V33 and MEMBERSCH student membership counts reported on the F-33 data file.
Although adult education is not part of public elementary/secondary education, “AE” is also now treated by the CCD as another grade level for LEAs that provide primarily adult education. Adult education students, however, are not included in the V33 and MEMBERSCH student membership counts reported on the F-33 data file.
D. Weights
The School District Finance Survey file includes a WEIGHT variable. For FY 91, FY 93, and FY 94, the F-33 survey was a sample survey, and the WEIGHT variable was used to create weighted estimates for these data releases. For FY 90, FY 92, and FY 95 through FY 19, the F-33 survey was a universe survey, and all records in these releases have a WEIGHT value of “1.” Despite F-33 being a universe survey in recent years, NCES maintains the WEIGHT variable to provide consistency across data files.
12 For additional information on grade 13 and the adult education grade level “AE,” see the EDFacts technical guide, “FS052 – Membership File Specifications – V15.1 (SY 2018-19)” (U.S. Department of Education 2019).
17

E. Changes to the F-33 Survey
Several changes to the F-33 survey, including a major expansion of the survey form beginning with the FY 92 collection, have been implemented over the life cycle of the survey. Data users interested in conducting longitudinal analysis should consult prior file documentation (Berry and Cohen 2005) for a summary of historical changes. The most recent changes to the survey are summarized below. File documentation from previous years can be found at https://nces.ed.gov/ccd/files.asp#Fiscal:1,LevelId:5,Page:1.
Unit Identifiers
Starting with FY 98, two variables that describe the nature of school districts and their relation to other surveys and data files were added: AGCHRT and CENFILE.
• AGCHRT identifies school districts with charter schools. • CENFILE identifies those districts that are available in the U.S. Census Bureau’s version
of the F-33 school district file. Starting with FY 06, dummy LEAIDs were assigned to agencies where a valid LEAID code was not available. The dummy LEAIDs can be recognized by having “D” in the third position of the LEAID. Dummy LEAIDs will remain the same across the years of data collection (see section C.1.).
Prior to FY 09, an LEA could have its name spelled differently in the F-33 file and in the CCD LEA Universe file (e.g., for the LEA with LEAID “0100005,” the name in the F-33 file was “Albertville City School District” and the name in the CCD LEA Universe file was “Albertville City”). Starting with FY 09, the name of an LEA in CCD LEA Universe file was used as the name of the LEA in the F-33 file.
Special Exhibit Items
In FY 04, teacher salary and textbook exhibit items were added to the survey form. These items are described in section II. B and in the glossary (see appendix B).
Federal Revenue Distributed by State Governments
In the FY 05 survey, the data item Federal Revenue—Bilingual Education (B11) was moved from the “federal revenue direct” section to the “federal revenue through the state” section. The change was made as a result of changes in the allocation of Bilingual Education funds by the U.S. Department of Education.
Suppressed Data
Starting in FY 06, NCES suppressed student membership (V33) in cases where reported LEA finances did not reasonably reflect CCD Local Education Agency Universe Survey student membership counts. A value of “-3” was used in the data file to represent student membership values suppressed by NCES if reported LEA finances did not reflect the student membership count for the LEA. (See section II. B for additional information on student membership suppression.)
18

Starting in FY 10, NCES also suppressed any numerical data that do not meet NCES data quality standards by reporting the data item as “-9” and data item flag as “A.”
Local Revenue Items
In FY 06, four local revenue items were added to the survey form. They are Local Revenue— Rents and Royalties (A40), Local Revenue—Sale of Property (U11), Local Revenue—Fines and Forfeits (U30), and Local Revenue—Private Contributions (U50).
Missing Data
Starting in FY 07, “-1” was used in the data file to represent missing values in student membership count (V33). There were only two LEAs with a missing membership value in the FY 19 F-33 data file.
Starting in FY 10, the School District Finance Survey data file includes records for all LEAs in the CCD LEA universe file (excluding LEAs located in U.S. territories) that did not submit data for the F-33 survey. In previous fiscal years, nonresponding LEAs were omitted from the School District Finance Survey file. All finance data items for these LEAs are now reported as missing or nonapplicable as appropriate.
Payments to Private Schools and Charter Schools
Because they are used to operate schools not part of the reporting LEA, Payments to Private Schools (V91) and Payments to Charter Schools (V92) are not part of current expenditures. Starting in FY 09, V91 and V92 were excluded from Current Expenditures-Instruction (E13), Total Current Expenditures-Instruction (TCURINST), and Total Current Expenditures for Elementary/Secondary Education (TCURELSC).
ARRA Data
In FY 09, three data items related to the American Recovery and Reinvestment Act of 2009 (ARRA) were added to the survey form. They are ARRA Revenues—Title I (HR1), Current Expenditures—ARRA (HE1), and Capital Outlay—ARRA (HE2). These data items were collected in FY 09, FY 10, FY 11, FY 12, FY 13, and FY 14. (As of FY 15, NCES no longer collects these data items separately.)
Title V, Part A Federal Revenue
In FY 10, the Federal Revenue—Thru State—Title V, Part A (C18) data item was removed from the F-33 survey form and data file. Federal funding for the Title V, Part A program expired September 30, 2009. Any residual funding LEAs received for Title V, Part A is included in the Federal Revenue—Thru State—Other (C20) data item.
19

CCD School Universe Student Membership
In FY 10, a Fall Membership—School Universe (MEMBERSCH) data item was added to the School District Finance Survey data file. For each LEA, MEMBERSCH is the sum of student membership for all schools in the LEA (as reported on the CCD School Universe Survey file) aggregated to the LEA level.
Per CCD student membership collection specifications, SEAs report a student’s membership for the CCD School Universe survey based on the school the student attends. Prior to SY 2017-18, SEAs reported student memberships for the CCD LEA Universe Survey based on the LEA that was financially responsible for the student; starting in SY 2017-18, LEA Universe Survey reporting guidance was revised to require that students “be reported in the LEA where [those] students are served” (rather than in the LEA financially responsible for the students) (NCES 2019). While some definitional differences still exist, this reporting change resulted in LEA membership (V33) aligning more closely with aggregated membership from the school universe (MEMBERSCH) than in previous years.13 NCES calculates per pupil finance amounts using V33 student membership counts. However, some researchers may still prefer to calculate current expenditures per pupil using the MEMBERSCH counts. The rationale for this is that current expenditures reflect the day-to-day costs of operating schools, so the denominator in calculations of per pupil current expenditures should be the count of students in schools within the reporting LEA and exclude students attending schools outside the reporting LEA (counts which V33 student membership still includes for certain students). The MEMBERSCH variables does not include imputations for missing or suppressed data.
Data Item Flags
In FY 11, the School District Finance Survey data file added “I” (Imputed) and removed “S” (Edited to include data for state payments made on behalf of school systems) as possible data item flag values. Prior to FY 11, imputed data items were assigned a data item flag of “A.” Data items previously assigned a data item flag of “S” will now be assigned a flag of “R,” “A,” or “I” as appropriate.
Utilities and Technology-Related Expenditure Data
In FY 15, three expenditure data items related to utilities and technology were added to the survey form. They are Utilities and Energy Services (V95), Technology-Related Supplies and Purchased Services (V02), and Technology-Related Equipment (K14).
Current Expenditures by Fund Type
In FY 16, two data items were added to the survey form to report current expenditures by source of revenue. They are Current Expenditures – State and Local Funds (CE1) and Current Expenditures – Federal Funds (CE2). The break-out of current expenditures by revenue source
13 For additional detail on differences between LEA and school student membership reporting, see section 2.4.4 of the EDFacts technical guide, “FS052 – Membership File Specifications – V15.1 (SY 2018-19)” (U.S. Department of Education 2019).
20

funds is intended to be consistent with school finance reporting requirements for state and local education agencies that were implemented under the Every Student Succeeds Act (ESSA).14
Current Expenditures for Regional Education Service Agencies (RESAs)
In FY 18, a RESA Current Expenditures on Behalf of the LEA (CE3) data item was added to the survey form. This data item includes current expenditures made by regional education service agencies (RESAs) and other specialized service agencies (e.g., supervisory unions) that benefit the reporting LEA. This category was added to the survey form for the purpose of incorporating these on behalf current expenditures into the current expenditures per pupil amounts calculated for the reporting LEA.
As of FY 18, CE3 is included in the school district-level total current expenditures and current expenditure per pupil amounts displayed in the annual Revenues and Expenditures for Public Elementary and Secondary School Districts web table report compiled from F-33 data. CE3, however, is not included in the Total Current Expenditure for Elementary/Secondary Education (TCURELSC) data item on the F-33 data file.
F. Data File Formats, Names, and Versions
File Formats
Data are available in two formats—SAS datasets (.sas7bdat) and tab-separated values text files (.txt).
File Names
The names of the FY 19 releases are as follows:
sdf19_1a.sas7bdat (SAS dataset) sdf19_1a.txt (text file)
The first five characters indicate the file contents and year, and the last two characters indicate the file version. “sdf” stands for school district finance, “19” stands for FY 19, “1” indicates that the file is a provisional version by NCES, and “a” indicates this is the first version of this provisional file released by NCES.
File Versions
NCES maintains strict version control of CCD files. File versions are identified by one numeric character and one alphabetic character. The number corresponds with the release version (e.g., “1” is the first release, “2” is the second release, etc.). The letter “a” also corresponds to a public release.15 For SY 2018-19 (FY 19), the “1a” file is the first provisional file release.
14 Elementary Secondary Education Act of 1965 (ESEA), as amended by the Every Student Succeeds Act of 2015 (ESSA) 20 U.S.C. §6311(h)(1)(C)(x) and (h)(2)(C) (2015). Under this law, state and local education agencies receiving Title I, Part A funds will be required to report current expenditures disaggregated by (1) Federal funds and (2) state and local funds. 15 Letters “b” through “z” are used for internal version control.
21

NCES releases a provisional data file (Version 1a) after a publication using the data has been released. (NCES standards require that an NCES publication using the data be released before the data are released.) Provisional data have undergone an extensive review and editing process. The data source for the web table report entitled Revenues and Expenditures for Public Elementary and Secondary School Districts: FY 19 is the FY 19 provisional data file. This report provides users with an opportunity to access provisional School District Finance Survey data that have been reviewed and edited. Provisional data are released in an effort to provide earlier access to the data. Revisions submitted after the provisional data file has been finalized will be incorporated in the final data file for each fiscal year. Final School District Finance Survey data files will be released at approximately the same time as the release of provisional data for the following fiscal year (e.g., the final FY 19 data file is scheduled to be released next year at approximately the same time as the provisional FY 20 data file).
Guidelines for Using the Flat ASCII Data File
When using the flat ASCII data file, care should be taken to label the identification number variables (e.g., the ANSI state code, CENSUSID, LEAID, etc.) as character fields. This is necessary in order to retain the leading zero in many of the identification numbers. It is necessary to keep the leading zeroes when merging these data with other files. This can be accomplished in Microsoft Excel by using the “Text Import Wizard” to select the identification number fields and set them as text fields.
G. State Notes
Appendix C—State Notes contains information from SEA respondents regarding any significant changes in the data they reported and the beginning and end dates of the fiscal year. This documentation includes these comments as stated by the respondent with minimal editing by NCES.
H. Survey Form
The F-33 survey form contains items that do not appear in the data file. They are referred to as “Special Processing Items” and are used in processing F-33 data. These items are listed in Part IX of the survey form and include T07, J13, J17, J07, J08, J09, J40, J45, J90, J10, J12, J11, B23, J14, J96, J97, J98, and J99. Appendix E provides this form, which can be viewed and printed using Adobe Reader.
22

References
Allison, G.S. (2015). Financial Accounting for Local and State School Systems: 2014 Edition (NCES 2015–347). National Center for Education Statistics, Institute of Education Sciences, U.S. Department of Education. Washington, DC. Retrieved June 29, 2017, from https://nces.ed.gov/pubsearch/pubsinfo.asp?pubid=2015347.
Berry, C. and Cohen, C. (2005). Documentation for the NCES Common Core of Data, School District Finance Survey (F-33), School Year 2001–02, Fiscal Year (FY) 2002, (NCES 2005-360). National Center for Education Statistics, Institute of Education Sciences, U.S. Department of Education. Washington, DC. Retrieved June 29, 2017, from https://nces.ed.gov/ccd/pdf/sdf021cgen.pdf.
Gauthier, Stephen J. (2005). Governmental Accounting, Auditing, and Financial Reporting 2005. Chicago, IL: Government Finance Officers Association.
Geverdt, D. (2018). Education Demographic and Geographic Estimates (EDGE) Geocodes: Public Schools and Local Education Agencies (NCES 2018-080). National Center for Education Statistics, Institute of Education Sciences, US. Department of Education. Washington, DC. Retrieved July 9, 2019, from https://nces.ed.gov/programs/edge/docs/ EDGE_GEOCODE_PUBLIC_FILEDOC.pdf.
U.S. Department of Education, National Center for Education Statistics, Common Core of Data (CCD), 2018-19 Common Core of Data (CCD) Universe Files, Provisional File Version 1a. Retrieved May 10, 2021 from https://nces.ed.gov/ccd/files.asp#Fiscal:2,LevelId:5,SchoolYearId:33,Page:1.
Office of the Federal Register, National Archives and Records Administration. (2009). Federal Register Vol. 74, No. 154. Vol. 74, No. 197. Washington, DC. Retrieved June 29, 2017, from http://www.gpo.gov/fdsys/browse/collection.action?collectionCode=FR&browsePath=2009.
U.S. Department of Education, National Center for Education Statistics. (2014). NCES Statistical Standards (NCES 2014-097). Washington, DC: U.S. Government Printing Office. Retrieved June 29, 2017, from https://nces.ed.gov/statprog/2012/.
U.S. Department of Education. (2019). FS052 – Membership File Specifications – V15.1 (SY 2018-19). Washington DC: EDFacts. Retrieved June 1, 2021, from http://www.ed.gov/edfacts.
U.S. Department of Education, National Center for Education Statistics. (2020). CCD Nonfiscal – Universe version 1a Release Notes: School Year (SY) 2018-19. Retrieved June 1, 2021 from https://nces.ed.gov/ccd/doc/SY_2019-20_Universe_1a_CCD_Nonfiscal_Release_Notes.docx.
U.S. Census Bureau (2006). Government Finance and Employment Classification Manual. Retrieved June 29, 2017, from http://www2.census.gov/govs/pubs/classification/2006_classification_manual.pdf.
U.S. Census Bureau (2021). Annual Survey of School System Finances. Public Elementary-Secondary Education Finance Data - Technical Documentation. Retrieved June 1, 2021, from https://www.census.gov/programs-surveys/school-finances/technical-documentation/complete/2019.html.
23

Appendix A—Record Layout and Descriptions of Data Items
A-1

Appendix A—Record Layout and Descriptions of Data Items
File name = sdf19_1a.sas7bdat, Fiscal year 2019 Number of variables = 262 Number of observations = 19,700 Release: Provisional 1a, November 2021
Name Order Type Label LEAID 1 Character NATIONAL CENTER FOR EDUCATION STATISTICS (NCES) 7-DIGIT
LOCAL EDUCATION AGENCY ID CENSUSID 2 Character CENSUS BUREAU 14-DIGIT GOVERNMENT ID FIPST 3 Character AMERICAN NATIONAL STANDARDS INSTITUTE (ANSI) STATE CODE CONUM 4 Character AMERICAN NATIONAL STANDARDS INSTITUTE (ANSI) COUNTY CODE
– digits 1 and 2 are the ANSI state code; digits 3–5 are the ANSI county code CSA 5 Character CONSOLIDATED STATISTICAL AREA CBSA 6 Character CORE-BASED STATISTICAL AREA NAME 7 Character NAME OF LOCAL EDUCATION AGENCY STNAME 8 Character STATE NAME STABBR 9 Character STATE ABBREVIATION SCHLEV 10 Character SCHOOL-LEVEL CODE
01 = Elementary school system only 02 = Secondary school system only 03 = Elementary/secondary school system 05 = Vocational or special education school system 06 = Nonoperating school system 07 = Education service agency
AGCHRT 11 Character AGENCY CHARTER CODE 1 = All associated schools are charter schools 2 = Some but not all associated schools are charter schools 3 = No associated schools are charter schools N = Not applicable or code could not be determined
YEAR 12 Character YEAR OF DATA CCDNF 13 Character COMMON CORE OF DATA (CCD) AGENCY NONFISCAL FILE MATCH
0 = Does not match CCD Local Education Agency Universe file 1 = Matches CCD Local Education Agency Universe file
CENFILE 14 Character CENSUS BUREAU FISCAL FILE MATCH 0 = Does not match Census Bureau fiscal file 1 = Matches Census Bureau fiscal file
GSLO 15 Character AGENCY LOW GRADE OFFERED GSHI 16 Character AGENCY HIGH GRADE OFFERED V33 17 Numeric FALL MEMBERSHIP MEMBERSCH 18 Numeric FALL MEMBERSHIP - SCHOOL UNIVERSE TOTALREV 19 Numeric TOTAL REVENUE
(equals TFEDREV + TSTREV + TLOCREV) TFEDREV 20 Numeric TOTAL FEDERAL REVENUE
(equals C14 + C15 + C16 + C17 + C19 + B11 + C20 + C25 + C36 + B10 + B12 + B13)
C14 21 Numeric FEDERAL REVENUE - THRU STATE TITLE I
A-2

25
30
35
40
45
50
55
Appendix A—Record Layout and Descriptions of Data Items
Name Order Type Label C15 22 Numeric FEDERAL REVENUE - THRU STATE - INDIVIDUALS WITH
DISABILITIES EDUCATION ACT (IDEA) C16 23 Numeric FEDERAL REVENUE - THRU STATE - MATH, SCIENCE, AND TEACHER
QUALITY C17 24 Numeric FEDERAL REVENUE - THRU STATE - NATIONAL ACTIVITIES FOR
SCHOOL SAFETY C19 Numeric FEDERAL REVENUE - THRU STATE - VOCATIONAL AND TECH
EDUCATION B11 26 Numeric FEDERAL REVENUE - THRU STATE - BILINGUAL EDUCATION C20 27 Numeric FEDERAL REVENUE - THRU STATE - OTHER C25 28 Numeric FEDERAL REVENUE - THRU STATE - CHILD NUTRITION ACT C36 29 Numeric FEDERAL REVENUE - NONSPECIFIED B10 Numeric FEDERAL REVENUE - DIRECT - IMPACT AID B12 31 Numeric FEDERAL REVENUE - DIRECT - INDIAN EDUCATION B13 32 Numeric FEDERAL REVENUE - DIRECT - OTHER TSTREV 33 Numeric TOTAL STATE REVENUE
(equals C01 + C04 + C05 + C06 + C07 + C08 + C09 + C10 + C11+ C12 + C13 + C35 + C38 + C39)
C01 34 Numeric STATE REVENUE - GENERAL FORMULA ASSISTANCE C04 Numeric STATE REVENUE - STAFF IMPROVEMENT PROGRAMS C05 36 Numeric STATE REVENUE - SPECIAL EDUCATION PROGRAMS C06 37 Numeric STATE REVENUE - COMPENSATORY AND BASIC SKILLS PROGRAMS C07 38 Numeric STATE REVENUE - BILINGUAL EDUCATION PROGRAMS C08 39 Numeric STATE REVENUE - GIFTED AND TALENTED PROGRAMS C09 Numeric STATE REVENUE - VOCATIONAL EDUCATION PROGRAMS C10 41 Numeric STATE REVENUE - SCHOOL LUNCH PROGRAMS C11 42 Numeric STATE REVENUE - CAPITAL OUTLAY AND DEBT SERVICES
PROGRAMS C12 43 Numeric STATE REVENUE - TRANSPORTATION PROGRAMS C13 44 Numeric STATE REVENUE - OTHER PROGRAMS C35 Numeric STATE REVENUE - NONSPECIFIED C38 46 Numeric STATE REVENUE ON BEHALF - EMPLOYEE BENEFITS C39 47 Numeric STATE REVENUE ON BEHALF - NOT EMPLOYEE BENEFITS TLOCREV 48 Numeric TOTAL LOCAL REVENUE
(equals T02 + T06 + T09 + T15 + T40 + T99 + D11 + D23 + A07 + A08 + A09 + A11 + A13 + A15 + A20 + A40 + U11 + U22 + U30 + U50 + U97 + C24)
T02 49 Numeric LOCAL REVENUE - PARENT GOVERNMENT CONTRIBUTIONS (DEPENDENT SCHOOL SYSTEMS)
T06 Numeric LOCAL REVENUE - PROPERTY TAXES T09 51 Numeric LOCAL REVENUE - GENERAL SALES TAXES T15 52 Numeric LOCAL REVENUE - PUBLIC UTILITY TAXES T40 53 Numeric LOCAL REVENUE - INDIVIDUAL AND CORPORATE INCOME TAXES T99 54 Numeric LOCAL REVENUE - ALL OTHER TAXES D11 Numeric LOCAL REVENUE - FROM OTHER SCHOOL SYSTEMS D23 56 Numeric LOCAL REVENUE - FROM CITIES AND COUNTIES A07 57 Numeric LOCAL REVENUE - TUITION FEES FROM PUPILS AND PARENTS
A-3
Appendix A—Record Layout and Descriptions of Data Items
Name Order Type Label A08 58 Numeric LOCAL REVENUE - TRANSPORTATION FEES FROM PUPILS AND
PARENTS A09 59 Numeric LOCAL REVENUE - SCHOOL LUNCH A11 60 Numeric LOCAL REVENUE - TEXTBOOK SALES AND RENTALS A13 61 Numeric LOCAL REVENUE - DISTRICT ACTIVITY RECEIPTS A15 62 Numeric LOCAL REVENUE - STUDENTS FEES, NONSPECIFIED A20 63 Numeric LOCAL REVENUE - OTHER SALES AND SERVICES A40 64 Numeric LOCAL REVENUE - RENTS AND ROYALTIES U11 65 Numeric LOCAL REVENUE - SALE OF PROPERTY U22 66 Numeric LOCAL REVENUE - INTEREST EARNINGS U30 67 Numeric LOCAL REVENUE - FINES AND FORFEITS U50 68 Numeric LOCAL REVENUE - PRIVATE CONTRIBUTIONS U97 69 Numeric LOCAL REVENUE - MISCELLANEOUS C24 70 Numeric NCES LOCAL REVENUE, CENSUS BUREAU STATE REVENUE TOTALEXP 71 Numeric TOTAL EXPENDITURES
(equals TCURELSC + TNONELSE + TCAPOUT + L12 + M12 + Q11 + I86 + V91 + V92)
TCURELSC 72 Numeric TOTAL CURRENT EXPENDITURES FOR ELEMENTARY/SECONDARY EDUCATION (equals TCURINST + TCURSSVC + TCUROTH)
TCURINST 73 Numeric TOTAL CURRENT EXPENDITURES - INSTRUCTION (equals E13)
E13 74 Numeric CURRENT EXPENDITURES - INSTRUCTION V91 75 Numeric PAYMENTS TO PRIVATE SCHOOLS V92 76 Numeric PAYMENTS TO CHARTER SCHOOLS TCURSSVC 77 Numeric TOTAL CURRENT EXPENDITURES - SUPPORT SERVICES
(equals E17 + E07 + E08 + E09 + V40 + V45 + V90 + V85) E17 78 Numeric CURRENT EXPENDITURES - SUPPORT SERVICES - PUPILS E07 79 Numeric CURRENT EXPENDITURES - SUPPORT SERVICES - INSTRUCTIONAL
STAFF E08 80 Numeric CURRENT EXPENDITURES - SUPPORT SERVICES - GENERAL
ADMINISTRATION E09 81 Numeric CURRENT EXPENDITURES - SUPPORT SERVICES - SCHOOL
ADMINISTRATION V40 82 Numeric CURRENT EXPENDITURES - SUPPORT SERVICES - OPERATION AND
MAINTENANCE OF PLANT V45 83 Numeric CURRENT EXPENDITURES - SUPPORT SERVICES - STUDENT
TRANSPORTATION V90 84 Numeric CURRENT EXPENDITURES - SUPPORT SERVICES
BUSINESS/CENTRAL/OTHER V85 85 Numeric CURRENT EXPENDITURES - SUPPORT SERVICES NONSPECIFIED TCUROTH 86 Numeric TOTAL CURRENT EXPENDITURES - OTHER
ELEMENTARY/SECONDARY (equals E11 + V60 + V65)
E11 87 Numeric CURRENT EXPENDITURES - FOOD SERVICES V60 88 Numeric CURRENT EXPENDITURES - ENTERPRISE OPERATIONS V65 89 Numeric CURRENT EXPENDITURES - OTHER ELEMENTARY/SECONDARY TNONELSE 90 Numeric TOTAL NON-ELEMENTARY/SECONDARY EXPENDITURES
A-4

Appendix A—Record Layout and Descriptions of Data Items
Name Order Type Label (equals V70 + V75 + V80)
V70 91 Numeric NON- ELEMENTARY/SECONDARY EXPENDITURES - COMMUNITY SERVICES
V75 92 Numeric NON- ELEMENTARY/SECONDARY EXPENDITURES - ADULT EDUCATION
V80 93 Numeric NON- ELEMENTARY/SECONDARY EXPENDITURES - OTHER TCAPOUT 94 Numeric TOTAL CAPITAL OUTLAY EXPENDITURES
(equals F12 + G15 + K09 + K10 + K11) F12 95 Numeric CAPITAL OUTLAY - CONSTRUCTION G15 96 Numeric CAPITAL OUTLAY - LAND AND EXISTING STRUCTURES K09 97 Numeric CAPITAL OUTLAY - INSTRUCTIONAL EQUIPMENT K10 98 Numeric CAPITAL OUTLAY - OTHER EQUIPMENT K11 99 Numeric CAPITAL OUTLAY - NONSPECIFIED EQUIPMENT L12 100 Numeric PAYMENTS TO STATE GOVERNMENTS M12 101 Numeric PAYMENTS TO LOCAL GOVERNMENTS Q11 102 Numeric PAYMENTS TO OTHER SCHOOL SYSTEMS I86 103 Numeric INTEREST ON DEBT Z32 104 Numeric TOTAL SALARIES Z33 105 Numeric SALARIES - INSTRUCTION Z35 106 Numeric TEACHER SALARIES - REGULAR EDUCATION PROGRAMS Z36 107 Numeric TEACHER SALARIES - SPECIAL EDUCATION PROGRAMS Z37 108 Numeric TEACHER SALARIES - VOCATIONAL EDUCATION PROGRAMS Z38 109 Numeric TEACHER SALARIES - OTHER EDUCATION PROGRAMS V11 110 Numeric SALARIES - SUPPORT SERVICES - PUPILS V13 111 Numeric SALARIES - SUPPORT SERVICES - INSTRUCTIONAL STAFF V15 112 Numeric SALARIES - SUPPORT SERVICES - GENERAL ADMINISTRATION V17 113 Numeric SALARIES - SUPPORT SERVICES - SCHOOL ADMINISTRATION V21 114 Numeric SALARIES - SUPPORT SERVICES - OPERATION AND MAINTENANCE OF
PLANT V23 115 Numeric SALARIES - SUPPORT SERVICES - STUDENT TRANSPORTATION V37 116 Numeric SALARIES - SUPPORT SERVICES - BUSINESS/CENTRAL/OTHER V29 117 Numeric SALARIES - FOOD SERVICES Z34 118 Numeric TOTAL EMPLOYEE BENEFITS V10 119 Numeric EMPLOYEE BENEFITS - INSTRUCTION V12 120 Numeric EMPLOYEE BENEFITS - SUPPORT SERVICES - PUPILS V14 121 Numeric EMPLOYEE BENEFITS - SUPPORT SERVICES - INSTRUCTIONAL STAFF V16 122 Numeric EMPLOYEE BENEFITS - SUPPORT SERVICES - GENERAL
ADMINISTRATION V18 123 Numeric EMPLOYEE BENEFITS - SUPPORT SERVICES - SCHOOL
ADMINISTRATION V22 124 Numeric EMPLOYEE BENEFITS - SUPPORT SERVICES - OPERATION AND
MAINTENANCE OF PLANT V24 125 Numeric EMPLOYEE BENEFITS - SUPPORT SERVICES - STUDENT
TRANSPORTATION V38 126 Numeric EMPLOYEE BENEFITS - SUPPORT SERVICES -
BUSINESS/CENTRAL/OTHER V30 127 Numeric EMPLOYEE BENEFITS - FOOD SERVICES
A-5

130
135
140
145
150
155
160
165
Appendix A—Record Layout and Descriptions of Data Items
Name Order Type Label V32 128 Numeric EMPLOYEE BENEFITS - ENTERPRISE OPERATIONS V93 129 Numeric TEXTBOOKS _19H Numeric LONG TERM DEBT - OUTSTANDING AT BEGINNING OF FISCAL YEAR _21F 131 Numeric LONG TERM DEBT - ISSUED DURING FISCAL YEAR _31F 132 Numeric LONG TERM DEBT - RETIRED DURING FISCAL YEAR _41F 133 Numeric LONG TERM DEBT - OUTSTANDING AT END OF FISCAL YEAR _61V 134 Numeric SHORT TERM DEBT - OUTSTANDING AT BEGINNING OF FISCAL YEAR _66V Numeric SHORT TERM DEBT - OUTSTANDING AT END OF FISCAL YEAR W01 136 Numeric ASSETS - SINKING FUND W31 137 Numeric ASSETS - BOND FUND W61 138 Numeric ASSETS - OTHER FUNDS V95 139 Numeric UTILITIES AND ENERGY SERVICES V02 Numeric TECHNOLOGY-RELATED SUPPLIES AND PURCHASED SERVICES K14 141 Numeric TECHNOLOGY-RELATED EQUIPMENT CE1 142 Numeric CURRENT EXPENDITURES - STATE AND LOCAL FUNDS CE2 143 Numeric CURRENT EXPENDITURES - FEDERAL FUNDS CE3 144 Numeric CURRENT EXPENDITURES - REGIONAL EDUCATION SERVICE
AGENCY (RESA) CURRENT EXPENDITURES ON BEHALF OF THE LEA WEIGHT Numeric WEIGHT FL_V33 146 Character FLAG - FALL MEMBERSHIP FL_MEMBERSCH 147 Character FLAG - FALL MEMBERSHIP - SCHOOL UNIVERSE FL_C14 148 Character FLAG - FEDERAL REVENUE - THRU STATE - TITLE I FL_C15 149 Character FLAG - FEDERAL REVENUE - THRU STATE - INDIVIDUALS WITH
DISABILITIES EDUCATION ACT (IDEA) FL_C16 Character FLAG - FEDERAL REVENUE - THRU STATE - MATH, SCIENCE, AND
TEACHER QUALITY FL_C17 151 Character FLAG - FEDERAL REVENUE - THRU STATE - NATIONAL ACTIVITIES
FOR SCHOOL SAFETY FL_C19 152 Character FLAG - FEDERAL REVENUE - THRU STATE - VOCATIONAL AND TECH
EDUCATION FL_B11 153 Character FLAG - FEDERAL REVENUE - THRU STATE - BILINGUAL EDUCATION FL_C20 154 Character FLAG - FEDERAL REVENUE - THRU STATE - OTHER FL_C25 Character FLAG - FEDERAL REVENUE - THRU STATE - CHILD NUTRITION ACT FL_C36 156 Character FLAG - FEDERAL REVENUE - NONSPECIFIED FL_B10 157 Character FLAG - FEDERAL REVENUE - DIRECT - IMPACT AID FL_B12 158 Character FLAG - FEDERAL REVENUE - DIRECT - INDIAN EDUCATION FL_B13 159 Character FLAG - FEDERAL REVENUE - DIRECT - OTHER FL_C01 Character FLAG - STATE REVENUE - GENERAL FORMULA ASSISTANCE FL_C04 161 Character FLAG - STATE REVENUE - STAFF IMPROVEMENT PROGRAMS FL_C05 162 Character FLAG - STATE REVENUE - SPECIAL EDUCATION PROGRAMS FL_C06 163 Character FLAG - STATE REVENUE - COMPENSATORY AND BASIC SKILLS
PROGRAMS FL_C07 164 Character FLAG - STATE REVENUE - BILINGUAL EDUCATION PROGRAMS FL_C08 Character FLAG - STATE REVENUE - GIFTED AND TALENTED PROGRAMS FL_C09 166 Character FLAG - STATE REVENUE - VOCATIONAL EDUCATION PROGRAMS FL_C10 167 Character FLAG - STATE REVENUE - SCHOOL LUNCH PROGRAMS
A-6

170
175
180
185
190
195
200
205
Appendix A—Record Layout and Descriptions of Data Items
Name Order Type Label FL_C11 168 Character FLAG - STATE REVENUE - CAPITAL OUTLAY AND DEBT SERVICES
PROGRAMS FL_C12 169 Character FLAG - STATE REVENUE - TRANSPORTATION PROGRAMS FL_C13 Character FLAG - STATE REVENUE - OTHER PROGRAMS FL_C35 171 Character FLAG - STATE REVENUE - NONSPECIFIED FL_C38 172 Character FLAG - STATE REVENUE ON BEHALF - EMPLOYEE BENEFITS FL_C39 173 Character FLAG - STATE REVENUE ON BEHALF - NOT EMPLOYEE BENEFITS FL_T02 174 Character FLAG - LOCAL REVENUE - PARENT GOVERNMENT CONTRIBUTIONS
(DEPENDENT SCHOOL SYSTEMS) FL_T06 Character FLAG - LOCAL REVENUE - PROPERTY TAXES FL_T09 176 Character FLAG - LOCAL REVENUE - GENERAL SALES TAXES FL_T15 177 Character FLAG - LOCAL REVENUE - PUBLIC UTILITY TAXES FL_T40 178 Character FLAG - LOCAL REVENUE - INDIVIDUAL AND CORPORATE INCOME
TAXES FL_T99 179 Character FLAG - LOCAL REVENUE - ALL OTHER TAXES FL_D11 Character FLAG - LOCAL REVENUE - FROM OTHER SCHOOL SYSTEMS FL_D23 181 Character FLAG - LOCAL REVENUE - FROM CITIES AND COUNTIES FL_A07 182 Character FLAG - LOCAL REVENUE - TUITION FEES FROM PUPILS AND PARENTS FL_A08 183 Character FLAG - LOCAL REVENUE - TRANSPORTATION FEES FROM PUPILS AND
PARENTS FL_A09 184 Character FLAG - LOCAL REVENUE - SCHOOL LUNCH FL_A11 Character FLAG - LOCAL REVENUE - TEXTBOOK SALES AND RENTALS FL_A13 186 Character FLAG - LOCAL REVENUE - DISTRICT ACTIVITY RECEIPTS FL_A15 187 Character FLAG - LOCAL REVENUE - STUDENT FEES, NONSPECIFIED FL_A20 188 Character FLAG - LOCAL REVENUE - OTHER SALES AND SERVICES FL_A40 189 Character FLAG - LOCAL REVENUE - RENTS AND ROYALTIES FL_U11 Character FLAG - LOCAL REVENUE - SALE OF PROPERTY FL_U22 191 Character FLAG - LOCAL REVENUE - INTEREST EARNINGS FL_U30 192 Character FLAG - LOCAL REVENUE - FINES AND FORFEITS FL_U50 193 Character FLAG - LOCAL REVENUE - PRIVATE CONTRIBUTIONS FL_U97 194 Character FLAG - LOCAL REVENUE - MISCELLANEOUS FL_C24 Character FLAG - NCES LOCAL REVENUE, CENSUS BUREAU STATE REVENUE FL_E13 196 Character FLAG - CURRENT EXPENDITURES - INSTRUCTION FL_V91 197 Character FLAG - PAYMENTS TO PRIVATE SCHOOLS FL_V92 198 Character FLAG - PAYMENTS TO CHARTER SCHOOLS FL_E17 199 Character FLAG - CURRENT EXPENDITURES - SUPPORT SERVICES - PUPILS FL_E07 Character FLAG - CURRENT EXPENDITURES - SUPPORT SERVICES -
INSTRUCTIONAL STAFF FL_E08 201 Character FLAG - CURRENT EXPENDITURES - SUPPORT SERVICES - GENERAL
ADMININSTRATION FL_E09 202 Character FLAG - CURRENT EXPENDITURES - SUPPORT SERVICES - SCHOOL
ADMINISTRATION FL_V40 203 Character FLAG - CURRENT EXPENDITURES - SUPPORT SERVICES - OPERATION
AND MAINTENANCE OF PLANT FL_V45 204 Character FLAG - CURRENT EXPENDITURES - SUPPORT SERVICES - STUDENT
TRANSPORT FL_V90 Character FLAG - CURRENT EXPENDITURES - SUPPORT SERVICES
BUSINESS/CENTRAL/ OTHER
A-7

210
215
220
225
230
235
240
Appendix A—Record Layout and Descriptions of Data Items
Name Order Type Label FL_V85 206 Character FLAG - CURRENT EXPENDITURES - SUPPORT SERVICES
NONSPECIFIED FL_E11 207 Character FLAG - CURRENT EXPENDITURES - FOOD SERVICES FL_V60 208 Character FLAG - CURRENT EXPENDITURES - ENTERPRISE OPERATIONS FL_V65 209 Character FLAG - CURRENT EXPENDITURES - OTHER ELEMENTARY/SECONDARY FL_V70 Character FLAG - NON-ELEMENTARY/SECONDARY EXPENDITURES -
COMMUNITY SERVICES FL_V75 211 Character FLAG - NON-ELEMENTARY/SECONDARY EXPENDITURES - ADULT
EDUCATION FL_V80 212 Character FLAG - NON-ELEMENTARY/SECONDARY EXPENDITURES - OTHER FL_F12 213 Character FLAG - CAPITAL OUTLAY - CONSTRUCTION FL_G15 214 Character FLAG - CAPITAL OUTLAY - LAND AND EXISTING STRUCTURES FL_K09 Character FLAG - CAPITAL OUTLAY - INSTRUCTIONAL EQUIPMENT FL_K10 216 Character FLAG - CAPITAL OUTLAY - OTHER EQUIPMENT FL_K11 217 Character FLAG - CAPITAL OUTLAY - NONSPECIFIED EQUIPMENT FL_L12 218 Character FLAG - PAYMENTS TO STATE GOVERNMENTS FL_M12 219 Character FLAG - PAYMENTS TO LOCAL GOVERNMENTS FL_Q11 Character FLAG - PAYMENTS TO OTHER SCHOOL SYSTEMS FL_I86 221 Character FLAG - INTEREST ON DEBT FL_Z32 222 Character FLAG - TOTAL SALARIES FL_Z33 223 Character FLAG - SALARIES - INSTRUCTION FL_Z35 224 Character FLAG - TEACHER SALARIES - REGULAR EDUCATION PROGRAMS FL_Z36 Character FLAG - TEACHER SALARIES - SPECIAL EDUCATION PROGRAMS FL_Z37 226 Character FLAG - TEACHER SALARIES - VOCATIONAL EDUCATION PROGRAMS FL_Z38 227 Character FLAG - TEACHER SALARIES - OTHER EDUCATION PROGRAMS FL_V11 228 Character FLAG - SALARIES - SUPPORT SERVICES - PUPILS FL_V13 229 Character FLAG - SALARIES - SUPPORT SERVICES - INSTRUCTIONAL STAFF FL_V15 Character FLAG - SALARIES - SUPPORT SERVICES - GENERAL ADMINISTRATION FL_V17 231 Character FLAG - SALARIES - SUPPORT SERVICES - SCHOOL ADMINISTRATION FL_V21 232 Character FLAG - SALARIES - SUPPORT SERVICES - OPERATION AND
MAINTENANCE OF PLANT FL_V23 233 Character FLAG - SALARIES - SUPPORT SERVICES - STUDENT TRANSPORTATION FL_V37 234 Character FLAG - SALARIES - SUPPORT SERVICES - BUSINESS/CENTRAL/ OTHER FL_V29 Character FLAG - SALARIES - FOOD SERVICE FL_Z34 236 Character FLAG - TOTAL EMPLOYEE BENEFITS FL_V10 237 Character FLAG - EMPLOYEE BENEFITS - INSTRUCTION FL_V12 238 Character FLAG - EMPLOYEE BENEFITS - SUPPORT SERVICES - PUPILS FL_V14 239 Character FLAG - EMPLOYEE BENEFITS - SUPPORT SERVICES - INSTRUCTION
STAFF FL_V16 Character FLAG - EMPLOYEE BENEFITS - SUPPORT SERVICES - GEN ADMIN FL_V18 241 Character FLAG - EMPLOYEE BENEFITS - SUPPORT SERVICES - SCHOOL
ADMINISTRATION FL_V22 242 Character FLAG - EMPLOYEE BENEFITS - SUPPORT SERVICES - OPERATION AND
MAINTENANCE OF PLANT FL_V24 243 Character FLAG - EMPLOYEE BENEFITS - SUPPORT SERVICES - STUDENT
TRANSPORTATION
A-8

Appendix A—Record Layout and Descriptions of Data Items
Name Order Type Label FL_V38 244 Character FLAG - EMPLOYEE BENEFITS - SUPPORT SERVICES -
BUSINESS/CENTRAL/ OTHER FL_V30 245 Character FLAG - EMPLOYEE BENEFITS - FOOD SERVICES FL_V32 246 Character FLAG - EMPLOYEE BENEFITS - ENTERPRISE OPERATIONS FL_V93 247 Character FLAG - TEXTBOOKS FL_19H 248 Character FLAG - LONG TERM DEBT - OUTSTANDING AT BEGINNING OF FISCAL
YEAR FL_21F 249 Character FLAG - LONG TERM DEBT - ISSUED DURING FISCAL YEAR FL_31F 250 Character FLAG - LONG TERM DEBT - RETIRED DURING FISCAL YEAR FL_41F 251 Character FLAG - LONG TERM DEBT - OUTSTANDING AT END OF FISCAL YEAR FL_61V 252 Character FLAG - SHORT TERM DEBT - OUTSTANDING AT BEGINNING OF
FISCAL YEAR FL_66V 253 Character FLAG - SHORT TERM DEBT - OUTSTANDING AT END OF FISCAL YEAR FL_W01 254 Character FLAG - ASSETS - SINKING FUND FL_W31 255 Character FLAG - ASSETS - BOND FUND FL_W61 256 Character FLAG - ASSETS - OTHER FUNDS FL_V95 257 Character FLAG - UTILITIES AND ENERGY SERVICES FL_V02 258 Character FLAG - TECHNOLOGY-RELATED SUPPLIES AND PURCHASED
SERVICES FL_K14 259 Character FLAG - TECHNOLOGY-RELATED EQUIPMENT FL_CE1 260 Character FLAG - CURRENT EXPENDITURES - STATE AND LOCAL FUNDS FL_CE2 261 Character FLAG - CURRENT EXPENDITURES - FEDERAL FUNDS FL_CE3 262 Character FLAG - CURRENT EXPENDITURES - REGIONAL EDUCATION SERVICE
AGENCY (RESA) CURRENT EXPENDITURES ON BEHALF OF THE LEA
A-9

Appendix B—Glossary
B-1

Appendix B—Glossary
This glossary applies to the Common Core of Data School District Finance Survey (F-33). When applicable, corresponding F-33 variables are listed in brackets. For additional detail, it is suggested that the data user consult the NCES accounting handbook, Financial Accounting for Local and State School Systems: 2014 Edition (Allison 2015).
bond funds: Funds established to account for the proceeds of bond issues pending their disbursement. [W31]
capital outlay: Direct expenditure for construction of buildings, roads, and other improvements, and for purchases of equipment, land, and existing structures. Includes amounts for additions, replacements, and major alterations to fixed works and structures. However, expenditure for repairs to such works and structures is classified as current expenditure. [TCAPOUT is the sum of F12, G15, K09, K10, and K11]
cash and investments: Cash, deposits, and government and private securities (bonds, notes, stocks, mortgages, etc.), except holdings of agency and private trust funds. Does not include interfund loans, receivables, and the value of real property and other fixed assets. [W01, W31, W61]
CCD: Common Core of Data. A group of public elementary/secondary education surveys of NCES. CCD data are collected from the administrative records systems of each state’s department of education. The CCDNF variable in the F-33 file indicates whether a record in that file matches a record in the nonfiscal CCD Local Education Agency Universe file.
Census Bureau state, NCES local revenue: See “local revenue—NCES local, Census Bureau state revenue.”
charter schools: Charter schools are public schools that are exempt from significant state or local rules that normally govern the operation and management of public schools. A charter school is created by a developer as a public school or is adapted by a developer from an existing public school. It operates in pursuit of a specific set of education objectives determined by the school’s developer and agreed to by the public chartering agency and provides a program of elementary or secondary education, or both. It meets all applicable federal, state, and local health and safety requirements; complies with federal civil rights laws; and operates in accordance with state law. Charter schools may be operated by a regular school district or they may be self-governing entities. [AGCHRT]
construction: Production of fixed works and structures and additions, replacements, and major alterations thereto, including the planning and design of specific projects, site improvements, and the provision of equipment and facilities that are integral parts of a structure. Includes construction undertaken either on a contractual basis by private contractors or through a government’s own staff (i.e., force account). [F12]
current expenditure: Expenditure for Instruction (TCURINST), Support Services (TCURSSVC), and Other Elementary/Secondary Programs (TCUROTH). Includes salaries, employee benefits, purchased services, and supplies, as well as payments made by states on
B-2

Appendix B—Glossary
behalf of school districts. Also includes transfers made by school districts into their own retirement system. Excludes expenditure for Non-Elementary/Secondary Programs (TNONELSE), debt service, capital outlay, and transfers to other governments or school districts. Beginning with FY 09, current expenditure excludes Payments to Private Schools (V91) and Payments to Charter Schools (V92). This item is formally called “Current Expenditures for Public Elementary/Secondary Education.” [TCURELSC is the sum of TCURINST, TCURSSVC, and TCUROTH]
current operation expenditure: Includes expenditure for instruction, support services, other elementary/secondary programs, and non-elementary/secondary programs. Excludes payments made by states on behalf of school districts and transfers by some school districts into their own retirement system.
current spending: Includes expenditure for instruction, support services, other elementary/secondary programs, and non-elementary/secondary programs. Also includes payments made by states on behalf of school districts and transfers by some school districts into their own retirement system.
debt: Long-term credit obligations of the school system or its parent government and all interest-bearing short-term (repayable within 1 year) credit obligations. Excludes non-interest-bearing short-term obligations, interfund obligations, amounts owed in a trust agency capacity, advances and contingent loans from other governments, and rights of individuals to benefits from school system employee retirement funds. [_19H, _21F, _31F, _41F, _61V, _66V]
debt outstanding: All debt obligations remaining unpaid at the end of the fiscal year. [_41F]
dependent LEA: A local education agency (LEA) that lacks either fiscal or administrative independence. Dependent LEAs are classified by the Census Bureau as subunits of other government units, such as a state, county, municipality, or township. (See “CENSUSID” in the “User’s Guide” section of this documentation.)
education service agency (ESA): An agency created for the purposes of providing specialized educational services to other education agencies. [Identified by a value of “07” for the SCHLEV variable]
elementary/secondary education: Programs providing instruction, or assisting in providing instruction, for students in prekindergarten, kindergarten, grades 1 through 12, and ungraded programs.
employee benefits expenditure: Amounts paid by the school system for fringe benefits. These amounts are not included in salaries and wages paid directly to employees. Includes contributions on behalf of employees for retirement coverage, social security, group health and life insurance, tuition reimbursement, worker’s compensation, and unemployment compensation. [Z34]
B-3

Appendix B—Glossary
enrollment: Count of pupils on pupil rolls in the fall of the school system’s fiscal year. Also called fall membership or student membership. The F-33 file contains two values based on student enrollment: Fall Membership (V33) and Fall Membership—School Universe (MEMBERSCH). V33 is the count of students served by the reporting LEA (generally as reported on the CCD Local Education Agency Universe Survey), whereas MEMBERSCH is the sum of the student counts for all schools in the reporting LEA (as reported on the CCD School Universe Survey) aggregated to the LEA level. [V33, MEMBERSCH]
equipment: Apparatus, furnishings, motor vehicles, office machines, and the like having an expected life of more than five years. Equipment expenditure consists only of amounts for purchase of equipment, including both additional equipment and replacements. Expenditures for facilities that are integral parts of structures are classified as expenditures for construction or for purchase of land and existing structures. [K09, K10, K11]
expenditure: All amounts of money paid out by a school system, net of recoveries and other correcting transactions, other than for retirement of debt, purchase of securities, extension of loans, and agency transactions. Includes only the external transactions of a school system; excludes noncash transactions such as the provision of perquisites or other payments in-kind.
fall membership: This comprises the total student enrollment on October 1 (or the closest school day to October 1) for all grade levels (including prekindergarten and kindergarten) and ungraded pupils. Membership includes students both present and absent on the measurement day. The F-33 file contains two membership values: Fall Membership (V33) and Fall Membership— School Universe (MEMBERSCH). V33 is the count of students served by the reporting LEA (generally as reported on the CCD Local Education Agency Universe Survey), whereas MEMBERSCH is the sum of the student counts for all schools in the reporting LEA (as reported on the CCD School Universe Survey) aggregated to the LEA level. [V33, MEMBERSCH]
federal revenue—direct: Aid from project grants for programs such as Impact Aid (P.L. 81-815 and P.L. 81-874), Indian Education, Head Start, Follow Through, Magnet Schools, Dropout Demonstration Assistance, and Gifted/Talented. [B10, B12, B13]
federal revenue distributed by state governments: Aid from formula grants distributed through state government agencies. This includes revenue from programs such as the following:
bilingual education: Includes project grants for bilingual education provided under Title III of the Elementary-Secondary Education Act (ESEA) (as amended through P.L. 115-224). These were formerly Title VII grants. [B11]
Child Nutrition Act: Includes revenues from National School Lunch, Special Milk, School Breakfast, and a la carte programs. Does not include the value of donated commodities. [C25]
Individuals with Disabilities Education Act (IDEA): Revenues awarded under the Individuals with Disabilities Education Act (P.L. 94-142) (20 U.S.C. §1400 et seq.). Includes formula grants authorized in Part B of this legislation. Excludes project grants
B-4

Appendix B—Glossary
authorized in Part D. These project grants are reported in Federal Revenue—Direct. [C15]
Title I: Revenues authorized by Title I of the Elementary and Secondary Education Act of 1965 (as amended through P.L. 115-224) (20 U.S.C. §6301 et seq.). Includes basic, concentration, targeted, and finance incentive grants. [C14]
vocational and technical education: Revenues from the Carl D. Perkins Career and Technical Education Act (P.L. 109-270) (20 U.S.C. §2301 et seq.). Includes revenues from State Basic formula grants. [C19]
other federal aid distributed by the state: Includes revenues from other formula grant programs distributed through state governments, as teacher and other school leader quality grants authorized under Title II of the ESEA (20 U.S.C. §6601 et seq.), school safety grants authorized under Title IV, part F of the ESEA (20 U.S.C. §2301), and workforce development grants authorized under the Workforce Innovation and Opportunity Act (29 U.S.C. §3101 et seq.). [C16, C17, C20]
nonspecified federal aid distributed by the state: Federal revenue amounts that pertain to more than one of the above categories, but which reporting units could not break out into these categories. These revenues are included in “Nonspecified” instead of “Other.” [C36]
fiscal year: The 12-month period to which the annual operating budget applies. At the end of the fiscal year, the agency determines its financial condition and the results of its operations.
independent LEA: A local education agency that has both fiscal and administrative independence. (See “CENSUSID” in the “User’s Guide” section of this documentation.)
instruction expenditure: Includes payments from all funds for salaries, employee benefits, supplies, materials, and contractual services for elementary/secondary instruction; excludes capital outlay, debt service, and interfund transfers for elementary/secondary instruction. Instruction covers regular, special, and vocational programs offered in both the regular school year and summer school; excludes instructional support activities as well as adult education and community services. Instruction salaries (Z33) includes salaries for teachers and teacher aides and assistants. Beginning with FY 09, instruction expenditure excludes Payments to Private Schools (V91) and Payments to Charter Schools (V92). [TCURINST, E13]
instructional equipment (only): Includes expenditure for all equipment recorded by school systems in general or operating funds under the “instruction” function. [K09]
interest earnings: Interest earned on deposits and securities, including amounts for accrued interest on investment securities sold. Receipts for accrued interest on bonds issued are classified as offsets to interest expenditure. Interest earnings shown under general revenue do not include earnings on assets of employee retirement systems. [U22]
B-5

Appendix B—Glossary
interest expenditure: Amounts paid for the use of borrowed money. [I86]
land and existing structures: Expenditure for the purchase of land, improvements to land, and existing buildings, including the purchase of rights-of-way, payments on capital leases, title searches, and similar activity associated with real property purchase transactions. [G15]
local education agency (LEA): The government agency at the local level whose primary responsibility is to operate public schools or to contract for public school services.
local revenue: Revenue raised within the boundaries of the LEA. These revenues are primarily raised through property taxes, but also come from other types of taxes and fees. [TLOCREV is the sum of A07, A08, A09, A11, A13, A15, A20, A40, C24, D11, D23, T02, T06, T09, T15, T40, T99, U11, U22, U30, U50, and U97]
cities and counties: Revenues from separate county and city governments that are transferred to the LEA. Assessments received by regional LEAs from independent school districts are included here. [D23]
fees: Fees and payments for services provided to students or the general public, including School Lunch [A09], District Activities [A13], Textbook Sales and Rentals [A11], Transportation Fees [A08], Tuition Fees [A07], Nonspecified Fees [A15], Rents and Royalties [A40], and Other Sales and Services [A20].
fines and forfeits: Revenues from penalties imposed for violations of law. [U30]
interest earnings: Interest earnings from all funds held by the LEA. [U22]
NCES local, Census Bureau state revenue: The C24 category is reserved for any tax item classified as state revenue by the U.S. Census Bureau and as local revenue by NCES. These taxes are identified in Appendix C—State Notes. [C24]
other school systems: Payments received from other school systems, both within and outside the state, for tuition, transportation, and other services. This item should be excluded from state and national totals. [D11]
parent government contributions: Tax receipts and any other amounts appropriated for the support of a dependent LEA by its parent government. This includes local property taxes collected. [T02]
private contributions: Gifts of cash or securities from private individuals or organizations. [U50]
property taxes: Taxes conditioned on ownership of property and measured by its value. This includes general property taxes relating to property as a whole, real and personal, tangible and intangible, whether taxed at a single rate or at classified rates. Property taxes reported here are from independent school districts. [T06] Property taxes collected by a
B-6

Appendix B—Glossary
parent government for dependent LEAs are reported as Parent Government Contributions.
rents and royalties: Revenues received from allowing temporary possession or granting rights to the use of school district buildings, land, or other properties. [A40]
sale of property: Amounts received from sale of real property, buildings (and improvements to them), land easements, rights-of-way, and other capital assets (buses, automobiles, etc.). [U11]
taxes (other than property taxes): Revenues raised by school districts that set their own tax rates (independent LEAs). These include General Sales Taxes [T09], Individual and Corporate Taxes [T40], Other Taxes [T99], and Public Utility Taxes [T15].
long-term debt: Debt payable more than 1 year after the date of issue.
long-term debt issued: The par value of long-term debt obligations incurred during the fiscal period concerned, including funding and refunding obligations. Debt obligations authorized but not actually incurred during the fiscal period are not included. [_21F]
long-term debt retired: The par value of long-term debt obligations liquidated by repayment or exchange, including debt retired by refunding operations. [_31F]
NCES: National Center for Education Statistics, an organization within the Institute of Education Sciences (IES), part of the U.S. Department of Education. NCES is the primary federal entity for collecting, analyzing, and reporting data related to education.
non-elementary/secondary expenditure: Expenditure for non-elementary/secondary education programs. Included in this category are community services, adult education, and other non-elementary/secondary programs. [TNONELSE is the sum of V70, V75, and V80]
other elementary/secondary current expenditure: Current expenditure for other than instruction and support service activities. Included in this category are food services, enterprise operations, and other elementary/secondary current expenditure. [TCUROTH is the sum of E11, V60, and V65]
payments to charter schools: This item includes charter school expenditures that are included in the reported amount for instruction when charter school students are not included in the student count. (See “Special Exhibit Items” in the “User’s Guide” section of this documentation.) [V92]
payments to other governments: Payments to state and local governments (except LEAs), including debt service payments to agencies that incur debt instead of the LEA. [L12, M12]
B-7

Appendix B—Glossary
payments to other school systems: Payments made to other school systems within the state and outside of the state, for tuition, transportation, and other services. This item should be excluded from state and national totals. [Q11]
payments to private schools: Expenditures to private schools (for tuition and other purposes) that are also included in instruction expenditures (TCURINST) and related totals (TCURELSC and TOTALEXP). Beginning with FY 09, payments to private schools are excluded from instruction expenditure (TCURINST) and current expenditure (TCURELSC). (See “Special Exhibit Items” in the “User’s Guide” section of this documentation.) [V91]
property taxes: See “local revenue—property taxes.”
public school system: The government agency at the local level whose primary responsibility is to operate public schools or to contract for public school services. (Synonymous with “local education agency.”)
revenue: All amounts of money received by a school system from external sources, or net of refunds and other correcting transactions other than from issuance of debt, liquidation of investments, or as agency and private trust transactions. Revenue on the F-33 excludes noncash transactions such as receipt of services, commodities, or other “receipts in-kind.”
salaries and wages: Amounts paid for compensation of school system officers and employees. Consists of gross compensation before deductions from withheld taxes, retirement contributions, etc. [Z32]
school lunch charges: Gross collections from cafeteria sales to children and adults. [A09]
short-term debt: Interest-bearing debt payable within 1 year from the date of issue, such as bond anticipation notes, bank loans, and tax anticipation notes and warrants. Includes obligations having no fixed maturity date if payable from a tax levied for collection in the year of their issuance. [_61V, _66V]
state education agency (SEA): An agency of the state charged with primary responsibility for coordinating and supervising public instruction, including setting standards for elementary and secondary instructional programs.
state revenue: State revenue paid to the school system for any purpose, restricted or unrestricted, including the following: [TSTREV is the sum of C01, C04, C05, C06, C07, C08, C09, C10, C11, C12, C13, C35, C38, and C39]
capital outlay/debt service: Revenue paid for school construction and building aid, including amounts to help school systems pay for servicing debt. [C11]
compensatory and basic skills programs: Revenues for “at risk” or other economically disadvantaged students, including migratory children. Also includes monies from state programs directed toward the attainment of basic skills and categorical education
B-8

Appendix B—Glossary
excellence and quality education programs that provide more than staff enhancements, such as materials, resource centers, and equipment. [C06]
payments on behalf of LEA: State payments that benefit school systems but are not paid directly to school systems. Includes amounts transferred into state teacher or public employee retirement funds as well as into funds for other kinds of employee benefits, such as group health, life, and unemployment compensation. This category includes state payments for textbooks and school buses that are provided to public school systems. [C38, C39]
special education programs: Revenues for the education of students with disabilities as defined by IDEA. [C05]
staff improvement programs: Revenues for programs designed to improve the quantity and quality of school system staff. Examples include programs for additional teacher units, teacher benefits such as retirement and social security contributions paid directly to the school system, mentor teachers, teacher induction, staff development contracts and stipends, career ladder contracts, and salaries for specific types of instructional and support staff. [C04]
transportation programs: Payments for various state transportation aid programs such as those that compensate the school system for part of its transportation expense and those that provide reimbursement for transportation salaries or school bus purchases. [C12]
vocational programs: Revenues for state vocational education assistance programs, including career education programs. [C09]
other programs: All other state revenues that are paid directly to school systems, including funds for bilingual education, gifted and talented programs, food services, instructional materials, textbooks, computer equipment, library resources, guidance and psychological services, driver education, energy conservation, enrollment increases and losses, health, alcohol and drug abuse, AIDS, child abuse, summer school, prekindergarten and early childhood, adult education (excluding vocational), desegregation, private schools, safety and law enforcement, and community services. Where these programs are covered under the state government’s general formula assistance program, revenues are shown under “General Formula Assistance” instead of “Other State Aid.” [C01, C07, C08, C10, C13]
nonspecified: State revenue amounts that pertain to more than one of the above categories, but for which reporting units could not provide distinct amounts by category. These revenues are included under “Nonspecified” instead of “Other.” [C35]
support services expenditure: Relates to the support services functions (series 2000) defined in Financial Accounting for Local and State School Systems (National Center for Education Statistics 2009). Includes payments from all funds for salaries, employee benefits, supplies,
B-9

Appendix B—Glossary
materials, and contractual services; excludes capital outlay, debt service, and interfund transfers. Includes expenditure for the following functions: [TCURSSVC is the sum of E17, E07, E08, E09, V40, V45, V90, and V85]
business/central/other support services: Expenditure for business support, central support, and other support services. Business support services include payments for fiscal services (budgeting, receiving and disbursing funds, payroll, internal auditing, and accounting), purchasing, warehousing, supply distribution, printing, publishing, and duplicating services. Central support services include planning, research, development, and evaluation services. They also include information services, staff services (recruitment, staff accounting, noninstructional in-service training, staff health services), and data processing services. [V90]
general administration: Expenditure for board of education and executive administration (office of the superintendent) services. [E08]
instructional staff support: Expenditure for supervision and instruction service improvements; curriculum development; instructional staff training; and instructional support services, such as libraries, multimedia centers, and computer stations for students that are outside of the classroom. [E07]
nonspecified support services: Expenditures that pertain to more than one of the above categories. In some cases, reporting units could not provide distinct expenditure amounts for each support services category. These expenditures are included in “nonspecified” instead of “other support services.” [V85]
operation and maintenance: Expenditure for building services (heating, electricity, air conditioning, property insurance), care and upkeep of grounds and equipment, nonstudent transportation vehicle operation and maintenance, and security services. [V40]
pupil support services: Expenditure for attendance record keeping, social work, student accounting, counseling, student appraisal, record maintenance, and placement services. This category also includes medical, dental, nursing, psychological, and speech services. [E17]
pupil transportation services: Expenditure for the transportation of public school students, including vehicle operation, monitoring riders, and vehicle servicing and maintenance. [V45]
school administration: Expenditure for the office of the principal services. [E09]
teacher salaries: Base salaries paid to certified teachers and certified substitute teachers are reported by program as exhibit items. [Z35, Z36, Z37, Z38] Teacher salaries, along with salaries for instructional assistants and aides, are also included in the broader instruction salaries data. [Z33]
B-10

Appendix B—Glossary
textbooks: Expenditures for books, textbooks, and periodicals used for classroom instruction. [V93] These items are also included in the total instruction data. [E13]
total expenditure: Total Expenditure is the sum of Current Expenditure (TCURELSC), Non-Elementary/Secondary Expenditure (TNONELSE), Capital Outlay (TCAPOUT), intergovernmental expenditure (i.e., payments to other state and local governments and other school systems), and debt service expenditure. [TOTALEXP is the sum of TCURELSC, TNONELSE, TCAPOUT, L12, M12, Q11, I86, V91, and V92]
total revenue: The sum of revenue contributions emerging from local, state, and federal sources. [TOTALREV is the sum of TFEDREV, TSTREV, and TLOCREV]
B-11

Appendix C—State Notes
C-1

Appendix C—State Notes
The following notes describe known anomalies in state data reported to the collection agent. Each anomaly recorded here applies to the current fiscal year. The absence of “Notes” for a state indicates that the state’s data did not contain any anomalies.
Alabama Fiscal Year: October 1–September 30 Notes: • Alabama reports F-33 data within the state education agency account codes
documented in the Alabama State Department of Education’s accounting manual for local education agencies (https://www.alsde.edu/sec/leaaccount/Pages/acctman-all.aspx). F-33 survey staff crosswalk Alabama’s reported account code amounts to each F-33 survey variable.
• Alabama local education agencies (LEAs) do not report long-term debt at the beginning of the fiscal year (_19H) or long-term debt at the end of the fiscal year (_41F). _19H is generally estimated for Alabama LEAs by setting _19H equal to prior fiscal year _41F. _41F is generally estimated for Alabama LEAs by setting _41F equal to _19H + long-term debt issued during the fiscal year (_21F) – long-term debt retired during the fiscal year (_31F).
• Students do not pay transportation fees (A08) in Alabama.
Alaska Fiscal Year: July 1–June 30 Notes: • The state reported State Payments on Behalf of the Local Education Agency data. • The Alaska financial reporting system cannot isolate payments to other school
systems (Q11). These amounts are usually small. They will slightly inflate the current expenditure amounts for individual school districts.
Arizona Fiscal Year: July 1–June 30 Notes: • Because the state does not report prekindergarten fiscal data, prekindergarten student
membership counts were subtracted from the student membership counts (V33, MEMBERSCH) reported on the F-33 data file to make those counts consistent with the reported fiscal data.
Arkansas Fiscal Year: July 1–June 30 Notes: • The state reported State Payments on Behalf of the Local Education Agency data. The
Census Bureau redistributed these data to the corresponding expenditure items for the state.
• Arkansas reported a half-cent sales tax collected by the state to reimburse local governments for a tax credit as NCES Local Revenue, Census State Revenue (C24) and included it in the local revenue subtotal (TLOCREV).
C-2

Appendix C—State Notes
California Fiscal Year: July 1–June 30 Notes: • California reports F-33 data within the state education agency account codes
documented in the California Department of Education’s accounting manual for LEAs, California School Accounting Manual (http://www.cde.ca.gov/fg/ac/sa/). F-33 survey staff crosswalk California’s reported account code amounts to each F-33 survey variable.
• California’s F-33 revenue, expenditure, and asset data are crosswalked from unaudited, actual data files posted annually to the California Department of Education’s website (http://www.cde.ca.gov/ds/fd/fd/). Long-term debt data are reported for the survey within a supplemental data file submitted separately by the state respondent.
• The state reported State Payments on Behalf of the Local Education Agency data. The Census Bureau redistributed these data to the corresponding expenditure items for the state. State government payments on behalf of California school districts to the state’s retirement system were prorated to function-level expenditure totals based on the reporting of salaries at the function level.
• Finances and student membership (V33, MEMBERSCH) for prekindergarten students are not included in California’s data.
• The state reports financial data for the Regional Occupational Programs (ROPs) and Joint Powers Authorities (JPAs) that do not report their financial data separately within the financial data of the regular school districts they serve. The financial data for these education service agencies are reported as “-2” (nonapplicable) on the F-33 data file.
• California school districts do not derive revenues from the sale or rental of textbooks (A11).
• California school districts do not receive district activity revenues (A13). In California, revenues for extracurricular activities are collected and managed by student organizations rather than by school districts.
• As of school year 2018-19 (FY 19), over 900 charter schools in California were reclassified in the Common Core of Data (CCD) Local Education Agency Universe Survey from being schools existing within larger local education agencies (LEAs) to being their own separate LEAs; finances for these newly separate charter school LEAs were also reported separately on the F-33 data file. This reporting change resulted in substantial variances in per pupil finances and student membership (V33, MEMBERSCH) for several California school districts from FY 18 to FY 19.
• Increases in State Payments on Behalf – Employee Benefits state revenues (C38) and employee benefit expenditures for California’s school districts from FY 18 to FY 19 reflect substantial increases in the state’s contributions to its school district employee retirement systems in FY 19.
• For five school districts in California, the state reports a single unified school district in the F-33 survey, but separate elementary and secondary school districts in the CCD Local Education Agency Universe Survey. California treats the two elementary and high school districts as one district in its financial accounting, but as separate districts in managing its student and staff data. The LEAID of the combined district in the
C-3

Appendix C—State Notes
F-33 file is the same as the LEAID of the administrative office for the component elementary and high school districts in the CCD LEA Universe file, so the combined district in the F-33 file may be matched to the CCD LEA Universe file.
On the F-33 data file, the V33 and MEMBERSCH enrollments of the component elementary and high school districts have also been combined to correspond to the financial data reported as a single unified district. Table C-1 (below) lists the combined districts and corresponding LEAIDs.
Table C-1. California combined school districts in the School District Finance Survey (F-33) file and the corresponding component districts in the Common Core of Data (CCD) Local Education Agency (LEA) Universe Survey file: Fiscal year 2019
Corresponding component district in the Combined school district in the F-33 file CCD LEA Universe Survey file District name LEAID District name LEAID Arena Union Elementary/ Point Arena Joint Union High
0601325 Arena Union Elementary Point Arena Joint Union High
0603090 0631230
Modesto City Schools 0601330 Modesto City Elementary Modesto City High
0625130 0625150
Petaluma City Elementary/Joint Union High
0601328 Petaluma City Elementary
Petaluma Joint Union High
0630230
0630250
Santa Cruz City Elementary/High
0601327 Santa Cruz City Elementary Santa Cruz City High
0635590 0635600
City of Santa Rosa Elementary/High
0601329 Santa Rosa Elementary Santa Rosa High
0635810 0635830
SOURCE: U.S. Department of Education, National Center for Education Statistics, Common Core of Data (CCD), “School District Finance Survey (F-33),” fiscal year 2019, Provisional File Version 1a; “Local Education Agency Universe Survey,” school year 2018–19, Provisional File Version 1a.
Colorado Fiscal Year: July 1–June 30 Notes: • The state reports financial data for Boards of Cooperative Educational Services
(BOCES) and other education service agencies within the financial data of the regular school districts they serve. The financial data for these education service agencies are reported as “-2” (nonapplicable) on the F-33 data file.
Connecticut Fiscal Year: July 1–June 30 Notes: • The state reported State Payments on Behalf of the Local Education Agency data. The
Census Bureau redistributed these data to the corresponding expenditure items for the state.
C-4

Appendix C—State Notes
• The state reported capital outlay payments for land and existing structures (G15) under construction (F12).
• Debt information for some dependent city and town school districts was not available and thus not reported in the data.
Delaware Fiscal Year: July 1–June 30 Notes: • The state reported capital outlay payments for land and existing structures (G15)
under construction (F12).
District of Columbia Fiscal Year: October 1–September 30 Notes: • District of Columbia Public Schools (LEAID = 1100030) reported capital outlay
payments for land and existing structures (G15) under construction (F12). • Variances in some support services expenditure categories from FY 18 to FY 19 for
District of Columbia Public Schools reflect improved alignment of internal accounting for the school system’s support services expenditures with corresponding F-33 expenditure categories.
Florida Fiscal Year: July 1–June 30 Notes: • The Florida financial reporting system cannot isolate payments to other school
systems (Q11). These amounts are usually small. They will slightly inflate the current expenditure amounts for individual school districts.
Georgia Fiscal Year: July 1–June 30 Notes: • The state reported the State Payments on Behalf of the Local Education Agency data.
Hawaii Fiscal Year: July 1–June 30 Notes: Hawaii’s school system (LEAID = 1500030) does not report finances for debt (_19H, _21F, _31F, _41F, _61V, _66V) or interest on debt (I86). The state of Hawaii issues debt to fund various school capital projects; however, the responsibility for that debt lies with the state government not the school system. Hawaii’s financial reporting system does not isolate debt for school capital projects from non-school capital projects, thus there are no debt amounts available to report.
C-5

Appendix C—State Notes
Idaho Fiscal Year: July 1–June 30 Notes: • Idaho reports F-33 expenditure, debt, and assets data within the state education
agency account codes documented in the Idaho State Department of Education’s uniform chart of accounts for public school districts, (https://sde.idaho.gov/finance/files/financial-info/ifarms/Summary-of-Codes.doc). F-33 survey staff crosswalk Idaho’s reported account code amounts to each F-33 survey variable.
• The state reported capital outlay payments for land and existing structures (G15) under construction (F12).
• The state reported State Payments on Behalf of the Local Education Agency data. • The Idaho financial reporting system cannot isolate payments to other school systems
(Q11). These amounts are usually small. They will slightly inflate the current expenditure amounts for individual school districts.
Illinois Fiscal Year: July 1–June 30 Notes: • The state reported capital outlay payments for land and existing structures (G15)
under construction (F12). • The state reported State Payments on Behalf of the Local Education Agency data. The
Census Bureau redistributed these data to the corresponding expenditure items for the state.
• The state reports financial data for Regional Offices of Education (ROEs) and other education service agencies within the financial data of the regular school districts they serve. The financial data for these education service agencies are reported as “-2” (nonapplicable) on the F-33 data file.
• The state reported corporate personal property replacement tax revenues as NCES Local Revenue, Census State Revenue (C24) and included them in the local revenue subtotal (TLOCREV).
Indiana Fiscal Year: July 1–June 30 Notes: • Indiana reports F-33 data within the state education agency account codes
documented in the Indiana State Board of Accounts’ accounting manual for LEAs, Accounting and Uniform Compliance Guidelines Manual for Indiana Public School Corporations (http://www.in.gov/sboa/4449.htm). F-33 survey staff crosswalk Indiana’s reported account code amounts to each F-33 survey variable.
• F-33 survey staff estimate long-term debt at the beginning of the fiscal year (_19H) for some Indiana LEAs by setting _19H equal to long-term debt at the end of the fiscal year (_41F) + long-term debt retired during the fiscal year (_31F) - long-term debt issued during the fiscal year (_21F).
• Per recommendation from the Indiana Department of Education, F-33 staff redistributed approximately 16.58% of local property tax revenue from Indiana’s
C-6

Appendix C—State Notes
General Fund and approximately 13.96% of local property tax revenue from all other school funds to state general formula assistance revenue (C01). This is due to Indiana’s State Property Tax Replacement Credit program, through which the state funds its school districts in lieu of local property tax revenue.
• The state reported State Payments on Behalf of the Local Education Agency data. The Census Bureau redistributed these data to the corresponding expenditure items for the state. State government payments on behalf of Indiana school corporations to the state’s retirement system were prorated to function-level expenditure totals based on the reporting of salaries at the function level.
Iowa Fiscal Year: July 1–June 30
Kansas Fiscal Year: July 1–June 30 Notes: • The state reported State Payments on Behalf of the Local Education Agency data. • As of FY 17, Kansas reports financial data for education cooperatives and other
education service agencies separately under the NCES LEAIDs for these LEAs. (In previous years these finances were reported only within the financial data of the regular school districts they serve.) Regular school districts in Kansas still include payments to these education service agencies within their own current expenditures which, in conjunction with the aforementioned separate education service agency reporting, results in minimal double counting when aggregating the expenditures of Kansas LEAs to the state level.
Kentucky Fiscal Year: July 1–June 30 Notes: • Kentucky reports F-33 data within the state education agency account codes
documented in the Kentucky Department of Education’s uniform chart of accounts for school districts (http://education.ky.gov/districts/FinRept/Pages/Fund Balances, Revenues and Expenditures, Chart of Accounts, Indirect Cost Rates and Key Financial Indicators.aspx). F-33 survey staff crosswalk Kentucky’s reported account code amounts to each F-33 survey variable.
• The state reported State Payments on Behalf of the Local Education Agency data. • The state reports financial data for education cooperatives and other education service
agencies within the financial data of the regular school districts they serve. The financial data for these education service agencies are reported as “-2” (nonapplicable) on the F-33 data file.
Louisiana Fiscal Year: July 1–June 30 Notes: • Louisiana reports F-33 data within the state education agency account codes
documented in the Louisiana Department of Education’s accounting manual for
C-7
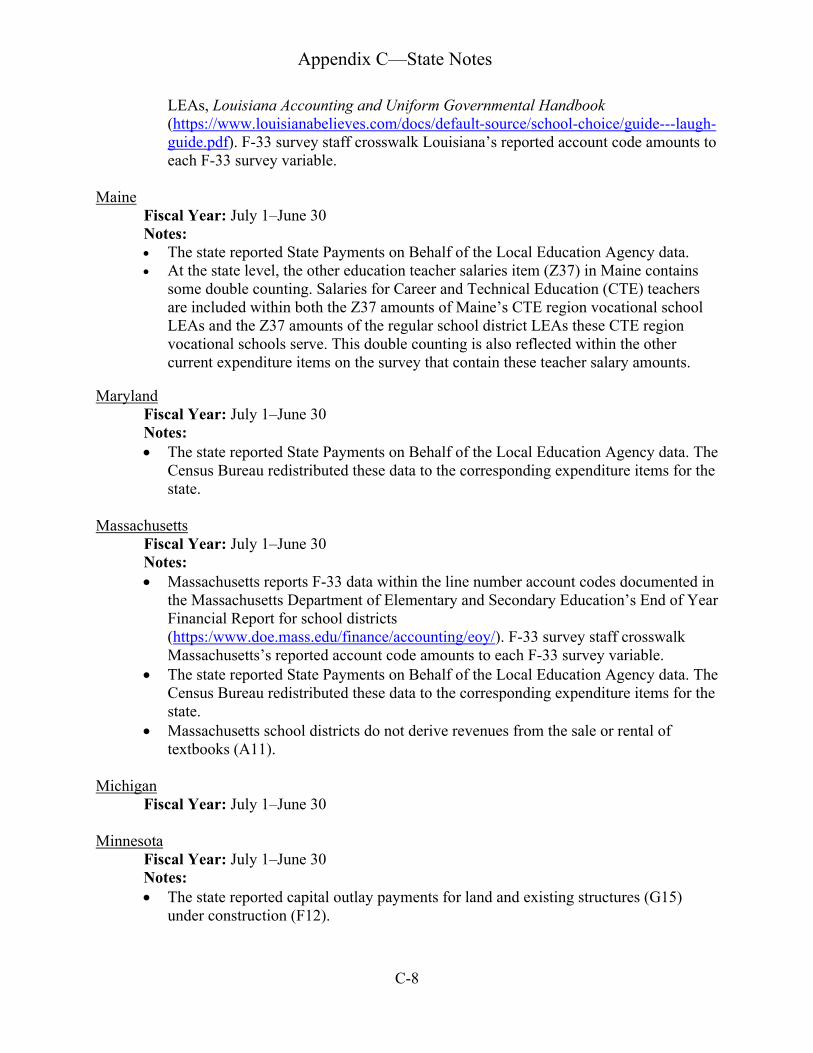
Appendix C—State Notes
LEAs, Louisiana Accounting and Uniform Governmental Handbook (https://www.louisianabelieves.com/docs/default-source/school-choice/guide---laugh-guide.pdf). F-33 survey staff crosswalk Louisiana’s reported account code amounts to each F-33 survey variable.
Maine Fiscal Year: July 1–June 30 Notes: • The state reported State Payments on Behalf of the Local Education Agency data. • At the state level, the other education teacher salaries item (Z37) in Maine contains
some double counting. Salaries for Career and Technical Education (CTE) teachers are included within both the Z37 amounts of Maine’s CTE region vocational school LEAs and the Z37 amounts of the regular school district LEAs these CTE region vocational schools serve. This double counting is also reflected within the other current expenditure items on the survey that contain these teacher salary amounts.
Maryland Fiscal Year: July 1–June 30 Notes: • The state reported State Payments on Behalf of the Local Education Agency data. The
Census Bureau redistributed these data to the corresponding expenditure items for the state.
Massachusetts Fiscal Year: July 1–June 30 Notes: • Massachusetts reports F-33 data within the line number account codes documented in
the Massachusetts Department of Elementary and Secondary Education’s End of Year Financial Report for school districts (https:/www.doe.mass.edu/finance/accounting/eoy/). F-33 survey staff crosswalk Massachusetts’s reported account code amounts to each F-33 survey variable.
• The state reported State Payments on Behalf of the Local Education Agency data. The Census Bureau redistributed these data to the corresponding expenditure items for the state.
• Massachusetts school districts do not derive revenues from the sale or rental of textbooks (A11).
Michigan Fiscal Year: July 1–June 30
Minnesota Fiscal Year: July 1–June 30 Notes: • The state reported capital outlay payments for land and existing structures (G15)
under construction (F12).
C-8

Appendix C—State Notes
• The state reports financial data for some area learning centers and other education service agencies that do not report data separately within the financial data of the regular school districts they serve. The financial data for these education service agencies are reported as “-2” (nonapplicable) on the F-33 data file.
Mississippi Fiscal Year: July 1–June 30 Notes: • Mississippi reports F-33 data within the state education agency account codes
documented in the Mississippi Department of Education’s school district accounting manual (https://www.mdek12.org/OSF/AccountingManual). F-33 survey staff crosswalk Mississippi’s reported account code amounts to each F-33 survey variable.
• The state reported capital outlay payments for land and existing structures (G15) under construction (F12).
• Long-term debt data are reported for the F-33 survey within a supplemental data file submitted separately by the state respondent. To supplement missing debt and debt of questionable quality, the F-33 survey also collects long-term debt directly from Mississippi school districts through supplemental survey forms mailed directly to these districts.
Missouri Fiscal Year: July 1–June 30 Notes: • Missouri’s Proposition C sales tax revenue is reported as NCES Local Revenue,
Census State Revenue (C24) and included in the local revenue subtotal (TLOCREV).
Montana Fiscal Year: July 1–June 30 Notes: • Montana reports F-33 data within the state education agency account codes
documented in the Montana Office of Public Instruction’s chart of accounts and school district accounting manual (http://opi.mt.gov/Leadership/Finance-Grants/School-Finance/School-Finance-Accounting). F-33 survey staff crosswalk Montana’s reported account code amounts to each F-33 survey variable.
• The state reports financial data for supervisory unions within the financial data of the regular school districts they serve. The financial data for supervisory unions in Montana are reported as “-2” (nonapplicable) on the F-33 data file.
Nebraska Fiscal Year: September 1–August 31 Notes: • Nebraska reports F-33 data within the state education agency account codes
documented in the Nebraska Department of Education’s accounting manual for school districts, Program Budgeting, Accounting, and Reporting System for Nebraska School Districts & ESUs: Accounting Structure & Users’ Manual
C-9

Appendix C—State Notes
(https://www.education.ne.gov/FOS/users-manual). F-33 survey staff crosswalk Nebraska’s reported account code amounts to each F-33 survey variable.
• Revenue and expenditure variances from FY 18 to FY 19 generally reflect substantial updates the Nebraska Department of Education made to its accounting manual for school district for FY 19; these updates necessitated several changes in how Nebraska’s account codes were crosswalked to F-33 survey variables.
Nevada Fiscal Year: July 1–June 30 Notes: • Nevada reported the Governmental Services motor vehicle privilege tax and Local
School Support sales tax levied by the state as NCES Local Revenue, Census State Revenue (C24) and included them in the local revenue subtotal (TLOCREV).
New Hampshire Fiscal Year: July 1–June 30 Notes: • New Hampshire reports F-33 data within the state education agency account codes
documented in the New Hampshire Department of Education’s accounting manual for LEAs, New Hampshire Financial Accounting Handbook for Local Education Agencies (https://www.education.nh.gov/sites/g/files/ehbemt326/files/inline-documents/fin_acct_handbk.pdf). F-33 survey staff crosswalk New Hampshire’s reported account code amounts to each F-33 survey variable.
• The state reports financial data for supervisory unions within the financial data of the regular school districts they serve. The financial data for supervisory unions in New Hampshire are reported as “-2” (nonapplicable) on the F-33 data file.
New Jersey Fiscal Year: July 1–June 30 Notes: • New Jersey reports F-33 data within the state education agency account codes
documented in the New Jersey Department of Education’s uniform minimum chart of accounts for public schools (http://www.nj.gov/education/finance/fp/af/coa/). F-33 survey staff crosswalk New Jersey’s reported account code amounts to each F-33 survey variable.
• The state reported State Payments on Behalf of the Local Education Agency data. . The Census Bureau redistributed these data to the corresponding expenditure items for the state.
• Substantial revenues from state sources for debt service programs are not included in New Jersey’s revenue amounts. The state financial reporting system is not able to allocate these revenues to the LEA level.
C-10

Appendix C—State Notes
New Mexico Fiscal Year: July 1–June 30 Notes: • For FY 19, after an internal data review performed jointly with the Census Bureau,
the New Mexico Public Education Department revised how several of their revenue and expenditure accounts were being crosswalked to F-33 survey variables. These changes explain many of the variances in some of their revenue and expenditure amounts from FY 18.
New York Fiscal Year: July 1–June 30 Notes: • New York reports F-33 data within the state education agency account codes
documented in the New York State Education Department’s accounting and reporting manual for school districts (http://osc.state.ny.us/localgov/pubs/arm_schools.pdf). F-33 survey staff crosswalk New York’s reported account code amounts to each F-33 survey variable.
• The state does not report financial data for charter school LEAs. The financial data for charter school LEAs in New York are reported as “-1” (missing) on the F-33 data file.
• The state reports financial data for Boards of Cooperative Educational Services (BOCES) and other education service agencies within the financial data of the regular school districts they serve. The financial data for these education service agencies are reported as “-2” (nonapplicable) on the F-33 data file.
• The financial data for New York City schools is reported as a single LEA on the F-33 data file. New York reports enrollment (V33, MEMBERSCH) and financial data for the New York City Special Schools district (LEAID = 3600135) and the 32 New York City geographic districts within the enrollment and financial data of NYC Chancellor’s Office (LEAID = 3620580), which is the administrative office record for the New York City Public Schools district. The financial data for the individual New York City Special Schools district and geographic districts’ records are reported as “-2” (nonapplicable) on the F-33 data file.
• The instructional expenditures for New York City Public Schools include guidance counselor expenditures. This will slightly overstate instructional expenditures and slightly understate pupil support services expenditures for New York City Public Schools.
North Carolina Fiscal Year: July 1–June 30 Notes: • North Carolina reports F-33 data within the state education agency account codes
documented in the North Carolina Department of Public Instruction’s Uniform Chart of Accounts (https://www.dpi.nc.gov/districts-schools/district-operations/financial-and-business-services/school-district-finance-operations/chart-accounts). F-33 survey staff crosswalk North Carolina’s reported account code amounts to each F-33 survey variable.
C-11

Appendix C—State Notes
• Long-term debt data are reported for the F-33 survey within a supplemental data file submitted to the Census Bureau by the North Carolina Department of State Treasurer.
• The state reported State Payments on Behalf of the Local Education Agency data.
North Dakota Fiscal Year: July 1–June 30 Notes: • The state reports financial data for some special education units and other education
service agencies that do not report data separately within the financial data of the regular school districts they serve. The financial data for these education service agencies are reported as “-2” (nonapplicable) on the F-33 data file.
Ohio Fiscal Year: July 1–June 30 Notes: • Revenues for Ohio have been adjusted in the reported F-33 data to eliminate double
counting of state funding for independent charter school LEAs. Ohio accounts for state funding of independent charter school LEAs within both the state revenues of those independent charter school LEAs and the state revenues of the (noncharter) regular local school districts that charter school students reside in. To mitigate this double counting, payments to charter schools (V92) were subtracted from general formula assistance state revenues (C01) for all regular, noncharter school districts. (Per the Ohio Department of Education, this adjustment fully eliminates the double counting in nearly all school districts where the double counting might occur.)
Oklahoma Fiscal Year: July 1–June 30 Notes: • The state reported State Payments on Behalf of the Local Education Agency data. The
Census Bureau redistributed these data to the corresponding expenditure items for the state.
• The state reports financial data for area vocational-technical school districts within the financial data of the regular school districts they serve. The financial data for these districts are reported as “-2” (nonapplicable) on the F-33 data file.
Oregon Fiscal Year: July 1–June 30 Notes: • Oregon reports F-33 data within the state education agency account codes
documented in the Oregon Department of Education’s Program Budgeting and Accounting Manual for its school districts and education service districts (https://www.oregon.gov/ode/schools-and-districts/grants/Pages/Financial-Budgeting-and-Accounting.aspx). F-33 survey staff crosswalk Oregon’s reported account code amounts to each F-33 survey variable.
C-12

Appendix C—State Notes
• Because the state does not report prekindergarten fiscal data, prekindergarten enrollments were subtracted from the enrollments (V33, MEMBERSCH) reported on the F-33 data file to make those enrollments consistent with the reported fiscal data.
Pennsylvania Fiscal Year: July 1–June 30 Notes: • The state reports financial data for some career and technology centers and other
education service agencies within the financial data of the regular school districts they serve. The financial data for these education service agencies are reported as “-2” (nonapplicable) on the F-33 data file.
Rhode Island Fiscal Year: July 1–June 30 Notes: • The state reported State Payments on Behalf of the Local Education Agency data. The
Census Bureau redistributed these data to the corresponding expenditure items for the state.
South Carolina Fiscal Year: July 1–June 30 Notes: • South Carolina reports F-33 data within the state education agency account codes
documented in the South Carolina Department of Education’s accounting manual for LEAs (http://ed.sc.gov/finance/auditing/manuals-handbooks-and-guidelines/financial-accounting-handbook/). F-33 survey staff crosswalk South Carolina’s reported account code amounts to each F-33 survey variable.
• The state reported State Payments on Behalf of the Local Education Agency data. The Census Bureau redistributed these data to the corresponding expenditure items for the state.
• South Carolina LEAs do not report long-term debt at the beginning of the fiscal year (_19H) or long-term debt at the end of the fiscal year (_41F). _19H is typically derived for South Carolina LEAs based on the amount of interest on debt expenditure (I86) the LEA reported. _41F is then typically estimated for South Carolina LEAs by setting _41F equal to _19H + long-term debt issued during the fiscal year (_21F) – long-term debt retired during the fiscal year (_31F).
South Dakota Fiscal Year: July 1–June 30 Notes: • The state reported State Payments on Behalf of the Local Education Agency data. • The state reported capital outlay payments for land and existing structures (G15)
under construction (F12). • South Dakota school districts do not derive revenues from the sale or rental of
textbooks (A11).
C-13

Appendix C—State Notes
• The state reports financial data for education cooperatives and other education service agencies within the financial data of the regular school districts they serve. The financial data for these education service agencies are reported as “-2” (nonapplicable) on the F-33 data file.
Tennessee Fiscal Year: July 1–June 30 Notes: • Tennessee reports F-33 data within the state education agency account codes
documented in the Tennessee Department of Education’s uniform chart of accounts for school districts (https://www.tn.gov/education/finance-and-monitoring/finance.html). F-33 survey staff crosswalk Tennessee’s reported account code amounts to each F-33 survey variable.
Texas Fiscal Year: September 1–August 31 Notes: • The state reported the State Payments on Behalf of the Local Education Agency data.
The Census Bureau redistributed these data to the corresponding expenditure items for the state.
Utah Fiscal Year: July 1–June 30 Notes: • Utah reports F-33 data within the state education agency account codes documented
in the Utah State Board of Education’s Uniform Chart of Accounts (https://www.schools.utah.gov/financialoperations/reporting). F-33 survey staff crosswalk Utah’s reported account code amounts to each F-33 survey variable.
• Because the state cannot isolate adult education in expenditure data, instruction and support services data may be slightly inflated.
Vermont Fiscal Year: July 1–June 30 Notes: • The state reported State Payments on Behalf of the Local Education Agency data. The
Census Bureau redistributed these data to the corresponding expenditure items for the state.
• The state reports financial data for some supervisory unions within the financial data of the regular school districts they serve. The financial data for these supervisory unions in Vermont are reported as “-2” (nonapplicable) on the F-33 data file.
Virginia Fiscal Year: July 1–June 30 Notes: • The state reports financial data for vocational-technical centers and other education
service agencies within the financial data of the regular school districts they serve.
C-14

Appendix C—State Notes
The financial data for these education service agencies are reported as “-2” (nonapplicable) on the F-33 data file.
• Virginia school districts do not receive district activity revenues (A13).
Washington Fiscal Year: September 1–August 31
West Virginia Fiscal Year: July 1–June 30 Notes: • The state reported State Payments on Behalf of the Local Education Agency data. The
Census Bureau redistributed these data to the corresponding expenditure items for the state.
• Small amounts of revenue were adjusted in West Virginia’s F-33 reporting to exclude accrued revenues. These finances were slightly adjusted to prevent reporting of negative amounts for some revenue items at the LEA level. This adjustment does not affect the aggregate amount of revenues these LEAs report across fiscal years, only the fiscal year in which the revenue is reported in a few instances.
Wisconsin Fiscal Year: July 1–June 30 Notes: • The state does not report financial data for charter school LEAs. The financial data
for charter school LEAs in Wisconsin are reported as “-1” (missing) on the F-33 data file.
• The state reports financial data for education cooperatives and other education service agencies within the financial data of the regular school districts they serve. The financial data for these education service agencies are reported as “-2” (nonapplicable) on the F-33 data file.
• Wisconsin reported revenues from the state’s School Levy Tax Credit property tax relief program as NCES Local Revenue, Census State Revenue (C24) and included them in the local revenue subtotal (TLOCREV).
Wyoming Fiscal Year: July 1–June 30
C-15

Appendix D—Value Distribution and Field Frequencies
D-1

Appendix D—Value Distribution and Field Frequencies
Table D-1. Frequencies of categorical variables: Fiscal year 2019
Cumulative Cumulative Categorical variable label Frequency Percent frequency percent
School-level Code (SCHLEV) 01 Elementary School System Only 4,472 22.7 4,472 22.7 02 Secondary School System Only 1,287 6.5 5,759 29.2 03 Elementary/Secondary School System 11,580 58.8 17,339 88.0 05 Vocational or Special Education School System 298 1.5 17,637 89.5 06 Nonoperating School System 126 0.6 17,763 90.2 07 Education Service Agency 1,075 5.5 18,838 95.6 N Data are not applicable 862 4.4 19,700 100.0
Agency Charter Code (AGCHRT) 1 All associated schools are charter schools 4,116 20.9 4,116 20.9 2 All associated schools are charter and noncharter schools 598 3.0 4,714 23.9 3 All associated schools are noncharter schools 13,620 69.1 18,334 93.1 N Not applicable or code could not be determined 1,366 6.9 19,700 100.0
Survey Year (YEAR) 2019 19,700 100.0 19,700 100.0
Common Core of Data (CCD) Agency Nonfiscal File Match (CCDNF) 0 Record does not match CCD LEA Universe Survey 42 0.2 42 0.2 1 Record matches CCD LEA Universe Survey 19,658 99.8 19,700 100.0
Census Bureau Fiscal File Match (CENFILE) 0 Does not match Census fiscal file 5,184 26.3 5,184 26.3 1 Matches Census fiscal file 14,516 73.7 19,700 100.0
Agency Low Grade Offered (GSLO) M Missing 530 2.7 530 2.7 PK Prekindergarten Students 10,873 55.2 11,403 57.9 KG Kindergarten Students 5,151 26.1 16,554 84.0 01 1st Grade Students 51 0.3 16,605 84.3 02 2nd Grade Students 20 0.1 16,625 84.4 03 3rd Grade Students 26 0.1 16,651 84.5 04 4th Grade Students 43 0.2 16,694 84.7 05 5th Grade Students 147 0.7 16,841 85.5 06 6th Grade Students 443 2.2 17,284 87.7 07 7th Grade Students 271 1.4 17,555 89.1 08 8th Grade Students 41 0.2 17,596 89.3 09 9th Grade Students 1,208 6.1 18,804 95.5 10 10th Grade Students 51 0.3 18,855 95.7 11 11th Grade Students 30 0.2 18,885 95.9 12 12th Grade Students 11 0.1 18,896 95.9 UG Students in Ungraded Classes 102 0.5 18,998 96.4 AE Adult Education Students 7 # 19,005 96.5 N Data are not applicable 695 3.5 19,700 100.0
Agency High Grade Offered (GSHI) M Missing 530 2.7 530 2.7 PK Prekindergarten Students 54 0.3 584 3.0 KG Kindergarten Students 10 0.1 594 3.0 01 1st Grade Students 19 0.1 613 3.1 02 2nd Grade Students 32 0.2 645 3.3 03 3rd Grade Students 37 0.2 682 3.5 04 4th Grade Students 82 0.4 764 3.9 05 5th Grade Students 330 1.7 1,094 5.6 06 6th Grade Students 522 2.6 1,616 8.2 07 7th Grade Students 93 0.5 1,709 8.7 08 8th Grade Students 3,135 15.9 4,844 24.6 09 9th Grade Students 73 0.4 4,917 25.0 10 10th Grade Students 46 0.2 4,963 25.2 11 11th Grade Students 47 0.2 5,010 25.4 See notes at end of table.
D-2

Appendix D—Value Distribution and Field Frequencies
Table D-1. Frequencies of categorical variables: Fiscal year 2019—Continued
Cumulative Cumulative Categorical variable label Frequency Percent frequency percent
12 12th Grade Students 13,801 70.1 18,811 95.5 13 13th Grade Students 85 0.4 18,896 95.9 UG Students in Ungraded Classes 102 0.5 18,998 96.4 AE Adult Education Students 7 # 19,005 96.5 N Data are not applicable 695 3.5 19,700 100.0
Flag - Fall Membership (FL_V33) A—Edited or suppressed by the analyst 501 2.5 501 2.5 M—Missing 2 # 503 2.6 N—Not applicable 1,736 8.8 2,239 11.4 R—As reported by the state 17,461 88.6 19,700 100.0
Flag - Fall Membership - School Universe (FL_MEMBERSCH) A—Edited or suppressed by the analyst 230 1.2 230 1.2 M—Missing 525 2.7 755 3.8 N—Not applicable 1,095 5.6 1,850 9.4 R—As reported by the state 17,850 90.6 19,700 100.0
Flag - Fed Rev - Thru State - Title I (FL_C14) M—Missing 890 4.5 890 4.5 N—Not applicable 961 4.9 1,851 9.4 R—As reported by the state 17,849 90.6 19,700 100.0
Flag - Fed Rev - Thru State - Individuals With Disabilities Education Act (Idea) (FL_C15) M—Missing 890 4.5 890 4.5 N—Not applicable 961 4.9 1,851 9.4 R—As reported by the state 17,849 90.6 19,700 100.0
Flag - Fed Rev - Thru State - Math, Science, and Teacher Quality (FL_C16) M—Missing 3,471 17.6 3,471 17.6 N—Not applicable 961 4.9 4,432 22.5 R—As reported by the state 15,268 77.5 19,700 100.0
Flag - Fed Rev - Thru State - National Activities For School Safety (FL_C17) M—Missing 3,422 17.4 3,422 17.4 N—Not applicable 1,847 9.4 5,269 26.7 R—As reported by the state 14,431 73.3 19,700 100.0
Flag - Fed Rev - Thru State - Vocational and Technical Education (FL_C19) M—Missing 1,196 6.1 1,196 6.1 N—Not applicable 961 4.9 2,157 10.9 R—As reported by the state 17,543 89.1 19,700 100.0
Flag - Fed Rev - Thru State - Bilingual Education (FL_B11) M—Missing 4,028 20.4 4,028 20.4 N—Not applicable 961 4.9 4,989 25.3 R—As reported by the state 14,711 74.7 19,700 100.0
Flag - Fed Rev - Thru State - Other (FL_C20) M—Missing 890 4.5 890 4.5 N—Not applicable 961 4.9 1,851 9.4 R—As reported by the state 17,849 90.6 19,700 100.0
Flag - Fed Rev - Thru State - Child Nutrition Act (FL_C25) I—Imputed 315 1.6 315 1.6 M—Missing 886 4.5 1,201 6.1 N—Not applicable 961 4.9 2,162 11.0 R—As reported by the state 17,538 89.0 19,700 100.0
Flag - Fed Rev - Nonspecified (FL_C36) M—Missing 885 4.5 885 4.5 See notes at end of table.
D-3
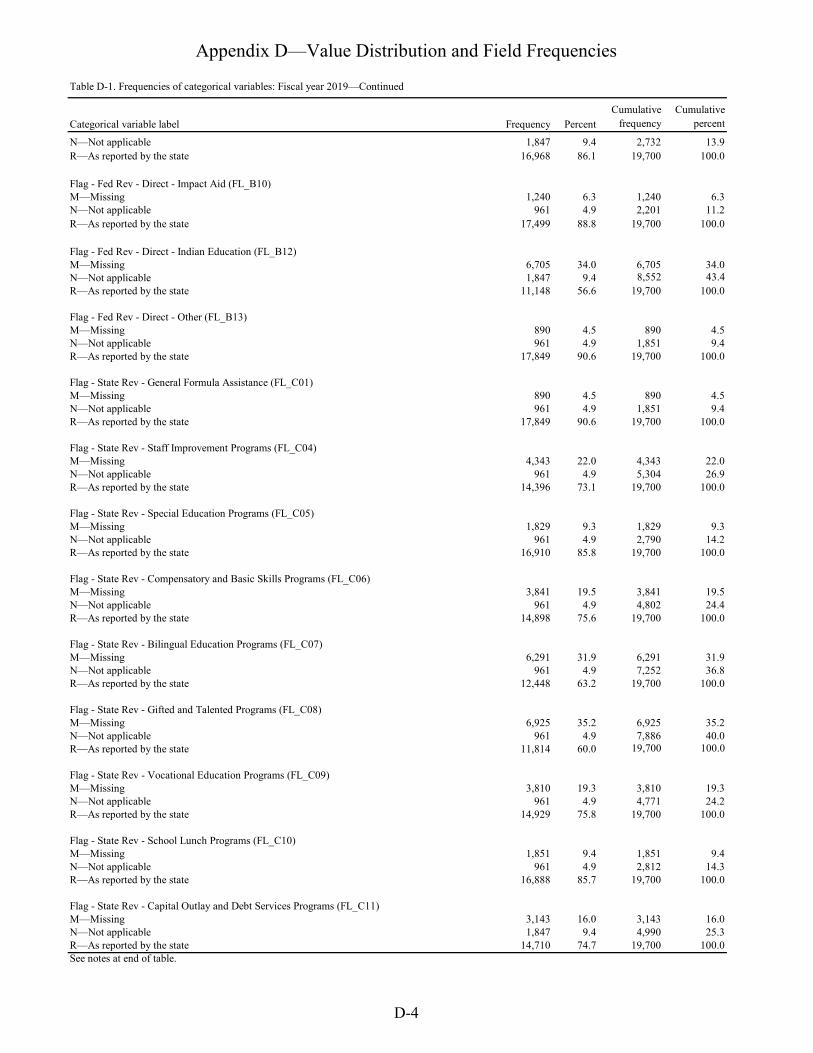
Appendix D—Value Distribution and Field Frequencies
Table D-1. Frequencies of categorical variables: Fiscal year 2019—Continued
Cumulative Cumulative Categorical variable label Frequency Percent frequency percent
N—Not applicable 1,847 9.4 2,732 13.9 R—As reported by the state 16,968 86.1 19,700 100.0
Flag - Fed Rev - Direct - Impact Aid (FL_B10) M—Missing 1,240 6.3 1,240 6.3 N—Not applicable 961 4.9 2,201 11.2 R—As reported by the state 17,499 88.8 19,700 100.0
Flag - Fed Rev - Direct - Indian Education (FL_B12) M—Missing 6,705 34.0 6,705 34.0 N—Not applicable 1,847 9.4 8,552 43.4 R—As reported by the state 11,148 56.6 19,700 100.0
Flag - Fed Rev - Direct - Other (FL_B13) M—Missing 890 4.5 890 4.5 N—Not applicable 961 4.9 1,851 9.4 R—As reported by the state 17,849 90.6 19,700 100.0
Flag - State Rev - General Formula Assistance (FL_C01) M—Missing 890 4.5 890 4.5 N—Not applicable 961 4.9 1,851 9.4 R—As reported by the state 17,849 90.6 19,700 100.0
Flag - State Rev - Staff Improvement Programs (FL_C04) M—Missing 4,343 22.0 4,343 22.0 N—Not applicable 961 4.9 5,304 26.9 R—As reported by the state 14,396 73.1 19,700 100.0
Flag - State Rev - Special Education Programs (FL_C05) M—Missing 1,829 9.3 1,829 9.3 N—Not applicable 961 4.9 2,790 14.2 R—As reported by the state 16,910 85.8 19,700 100.0
Flag - State Rev - Compensatory and Basic Skills Programs (FL_C06) M—Missing 3,841 19.5 3,841 19.5 N—Not applicable 961 4.9 4,802 24.4 R—As reported by the state 14,898 75.6 19,700 100.0
Flag - State Rev - Bilingual Education Programs (FL_C07) M—Missing 6,291 31.9 6,291 31.9 N—Not applicable 961 4.9 7,252 36.8 R—As reported by the state 12,448 63.2 19,700 100.0
Flag - State Rev - Gifted and Talented Programs (FL_C08) M—Missing 6,925 35.2 6,925 35.2 N—Not applicable 961 4.9 7,886 40.0 R—As reported by the state 11,814 60.0 19,700 100.0
Flag - State Rev - Vocational Education Programs (FL_C09) M—Missing 3,810 19.3 3,810 19.3 N—Not applicable 961 4.9 4,771 24.2 R—As reported by the state 14,929 75.8 19,700 100.0
Flag - State Rev - School Lunch Programs (FL_C10) M—Missing 1,851 9.4 1,851 9.4 N—Not applicable 961 4.9 2,812 14.3 R—As reported by the state 16,888 85.7 19,700 100.0
Flag - State Rev - Capital Outlay and Debt Services Programs (FL_C11) M—Missing 3,143 16.0 3,143 16.0 N—Not applicable 1,847 9.4 4,990 25.3 R—As reported by the state 14,710 74.7 19,700 100.0 See notes at end of table.
D-4

Appendix D—Value Distribution and Field Frequencies
Table D-1. Frequencies of categorical variables: Fiscal year 2019—Continued
Cumulative Cumulative Categorical variable label Frequency Percent frequency percent
Flag - State Rev - Transportation Programs (FL_C12) M—Missing 2,378 12.1 2,378 12.1 N—Not applicable 1,847 9.4 4,225 21.4 R—As reported by the state 15,475 78.6 19,700 100.0
Flag - State Rev - Other Programs (FL_C13) M—Missing 890 4.5 890 4.5 N—Not applicable 961 4.9 1,851 9.4 R—As reported by the state 17,849 90.6 19,700 100.0
Flag - State Rev - Nonspecified (FL_C35) M—Missing 885 4.5 885 4.5 N—Not applicable 1,847 9.4 2,732 13.9 R—As reported by the state 16,968 86.1 19,700 100.0
Flag - State Rev on Behalf - Employee Benefits (FL_C38) I—Imputed 1,926 9.8 1,926 9.8 M—Missing 8,014 40.7 9,940 50.5 N—Not applicable 961 4.9 10,901 55.3 R—As reported by the state 8,799 44.7 19,700 100.0
Flag - State Rev on Behalf - Not Employee Benefits (FL_C39) I—Imputed 1,004 5.1 1,004 5.1 M—Missing 11,158 56.6 12,162 61.7 N—Not applicable 961 4.9 13,123 66.6 R—As reported by the state 6,577 33.4 19,700 100.0
Flag - Local Rev - Parent Government Contributions (Dependent School Systems) (FL_T02) I—Imputed 11 0.1 11 0.1 M—Missing 55 0.3 66 0.3 N—Not applicable 18,480 93.8 18,546 94.1 R—As reported by the state 1,154 5.9 19,700 100.0
Flag - Local Rev - Property Taxes (FL_T06) I—Imputed 524 2.7 524 2.7 M—Missing 155 0.8 679 3.4 N—Not applicable 7,194 36.5 7,873 40.0 R—As reported by the state 11,827 60.0 19,700 100.0
Flag - Local Rev - General Sales Taxes (FL_T09) M—Missing 4,326 22.0 4,326 22.0 N—Not applicable 7,791 39.5 12,117 61.5 R—As reported by the state 7,583 38.5 19,700 100.0
Flag - Local Rev - Public Utility Taxes (FL_T15) M—Missing 4,326 22.0 4,326 22.0 N—Not applicable 7,791 39.5 12,117 61.5 R—As reported by the state 7,583 38.5 19,700 100.0
Flag - Local Rev - Individual and Corporate Income Taxes (FL_T40) M—Missing 4,412 22.4 4,412 22.4 N—Not applicable 7,791 39.5 12,203 61.9 R—As reported by the state 7,497 38.1 19,700 100.0
Flag - Local Rev - All Other Taxes (FL_T99) I—Imputed 1 # 1 # M—Missing 3,928 19.9 3,929 19.9 N—Not applicable 7,790 39.5 11,719 59.5 R—As reported by the state 7,981 40.5 19,700 100.0
Flag - Local Rev - From Other School Systems (FL_D11) I—Imputed 18 0.1 18 0.1 M—Missing 1,285 6.5 1,303 6.6 See notes at end of table.
D-5

Appendix D—Value Distribution and Field Frequencies
Table D-1. Frequencies of categorical variables: Fiscal year 2019—Continued
Cumulative Cumulative Categorical variable label Frequency Percent frequency percent
N—Not applicable 961 4.9 2,264 11.5 R—As reported by the state 17,436 88.5 19,700 100.0
Flag - Local Rev - From Cities and Counties (FL_D23) I—Imputed 81 0.4 81 0.4 M—Missing 889 4.5 970 4.9 N—Not applicable 962 4.9 1,932 9.8 R—As reported by the state 17,768 90.2 19,700 100.0
Flag - Local Rev - Tuition Fees From Pupils and Parents (FL_A07) M—Missing 1,196 6.1 1,196 6.1 N—Not applicable 961 4.9 2,157 10.9 R—As reported by the state 17,543 89.1 19,700 100.0
Flag - Local Rev - Transportation Fees From Pupils and Parents (FL_A08) M—Missing 2,394 12.2 2,394 12.2 N—Not applicable 961 4.9 3,355 17.0 R—As reported by the state 16,345 83.0 19,700 100.0
Flag - Local Rev - School Lunch (FL_A09) I—Imputed 311 1.6 311 1.6 M—Missing 886 4.5 1,197 6.1 N—Not applicable 961 4.9 2,158 11.0 R—As reported by the state 17,542 89.0 19,700 100.0
Flag - Local Rev - Textbook Sales and Rentals (FL_A11) M—Missing 4,023 20.4 4,023 20.4 N—Not applicable 1,847 9.4 5,870 29.8 R—As reported by the state 13,830 70.2 19,700 100.0
Flag - Local Rev - District Activity Receipts (FL_A13) M—Missing 1,196 6.1 1,196 6.1 N—Not applicable 961 4.9 2,157 10.9 R—As reported by the state 17,543 89.1 19,700 100.0
Flag - Local Rev - Student Fees, Nonspecified (FL_A15) M—Missing 885 4.5 885 4.5 N—Not applicable 1,847 9.4 2,732 13.9 R—As reported by the state 16,968 86.1 19,700 100.0
Flag - Local Rev - Other Sales and Services (FL_A20) M—Missing 1,977 10.0 1,977 10.0 N—Not applicable 961 4.9 2,938 14.9 R—As reported by the state 16,762 85.1 19,700 100.0
Flag - Local Rev - Rents and Royalties (FL_A40) M—Missing 1,281 6.5 1,281 6.5 N—Not applicable 961 4.9 2,242 11.4 R—As reported by the state 17,458 88.6 19,700 100.0
Flag - Local Rev - Sale of Property (FL_U11) M—Missing 2,436 12.4 2,436 12.4 N—Not applicable 961 4.9 3,397 17.2 R—As reported by the state 16,303 82.8 19,700 100.0
Flag - Local Rev - Interest Earnings (FL_U22) M—Missing 890 4.5 890 4.5 N—Not applicable 961 4.9 1,851 9.4 R—As reported by the state 17,849 90.6 19,700 100.0
Flag - Local Rev - Fines and Forfeits (FL_U30) M—Missing 5,853 29.7 5,853 29.7 N—Not applicable 961 4.9 6,814 34.6 See notes at end of table.
D-6

Appendix D—Value Distribution and Field Frequencies
Table D-1. Frequencies of categorical variables: Fiscal year 2019—Continued
Cumulative Cumulative Categorical variable label Frequency Percent frequency percent
R—As reported by the state 12,886 65.4 19,700 100.0
Flag - Local Rev - Private Contributions (FL_U50) M—Missing 1,138 5.8 1,138 5.8 N—Not applicable 961 4.9 2,099 10.7 R—As reported by the state 17,601 89.3 19,700 100.0
Flag - Local Rev - Miscellaneous (FL_U97) I—Imputed 2 # 2 # M—Missing 890 4.5 892 4.5 N—Not applicable 961 4.9 1,853 9.4 R—As reported by the state 17,847 90.6 19,700 100.0
Flag - NCES Local Revenue, Census State Revenue (FL_C24) I—Imputed 643 3.3 643 3.3 M—Missing 885 4.5 1,528 7.8 N—Not applicable 1,847 9.4 3,375 17.1 R—As reported by the state 16,325 82.9 19,700 100.0
Flag - Current Exp - Instruction (FL_E13) A—Edited or suppressed by the analyst 183 0.9 183 0.9 I—Imputed 345 1.8 528 2.7 M—Missing 890 4.5 1,418 7.2 N—Not applicable 961 4.9 2,379 12.1 R—As reported by the state 17,321 87.9 19,700 100.0
Flag - Payments to Private Schools (FL_V91) I—Imputed 11 0.1 11 0.1 M—Missing 4,430 22.5 4,441 22.5 N—Not applicable 1,847 9.4 6,288 31.9 R—As reported by the state 13,412 68.1 19,700 100.0
Flag - Payments to Charter Schools (FL_V92) A—Edited or suppressed by the analyst 1 # 1 # I—Imputed 1 # 2 # M—Missing 5,754 29.2 5,756 29.2 N—Not applicable 1,847 9.4 7,603 38.6 R—As reported by the state 12,097 61.4 19,700 100.0
Flag - Current Exp - Support Services - Pupils (FL_E17) I—Imputed 149 0.8 149 0.8 M—Missing 890 4.5 1,039 5.3 N—Not applicable 961 4.9 2,000 10.2 R—As reported by the state 17,700 89.8 19,700 100.0
Flag - Current Exp - Support Services - Instructional Staff (FL_E07) I—Imputed 154 0.8 154 0.8 M—Missing 890 4.5 1,044 5.3 N—Not applicable 961 4.9 2,005 10.2 R—As reported by the state 17,695 89.8 19,700 100.0
Flag - Current Exp - Support Services - General Administration (FL_E08) I—Imputed 155 0.8 155 0.8 M—Missing 890 4.5 1,045 5.3 N—Not applicable 961 4.9 2,006 10.2 R—As reported by the state 17,694 89.8 19,700 100.0
Flag - Current Exp - Support Services - School Administration (FL_E09) I—Imputed 147 0.7 147 0.7 M—Missing 890 4.5 1,037 5.3 N—Not applicable 961 4.9 1,998 10.1 R—As reported by the state 17,702 89.9 19,700 100.0
See notes at end of table.
D-7

Appendix D—Value Distribution and Field Frequencies
Table D-1. Frequencies of categorical variables: Fiscal year 2019—Continued
Cumulative Cumulative Categorical variable label Frequency Percent frequency percent
Flag - Current Exp - Support Services - Operation and Maintenance of Plant (FL_V40) I—Imputed 159 0.8 159 0.8 M—Missing 890 4.5 1,049 5.3 N—Not applicable 961 4.9 2,010 10.2 R—As reported by the state 17,690 89.8 19,700 100.0
Flag - Current Exp - Support Services - Student Transportation (FL_V45) A—Edited or suppressed by the analyst 1 # 1 # I—Imputed 161 0.8 162 0.8 M—Missing 890 4.5 1,052 5.3 N—Not applicable 961 4.9 2,013 10.2 R—As reported by the state 17,687 89.8 19,700 100.0
Flag - Current Exp - Support Services - Business/Central/Other (FL_V90) A—Edited or suppressed by the analyst 1 # 1 # I—Imputed 177 0.9 178 0.9 M—Missing 890 4.5 1,068 5.4 N—Not applicable 961 4.9 2,029 10.3 R—As reported by the state 17,671 89.7 19,700 100.0
Flag - Current Exp - Support Services Nonspecified (FL_V85) M—Missing 885 4.5 885 4.5 N—Not applicable 1,847 9.4 2,732 13.9 R—As reported by the state 16,968 86.1 19,700 100.0
Flag - Current Exp - Food Services (FL_E11) I—Imputed 139 0.7 139 0.7 M—Missing 890 4.5 1,029 5.2 N—Not applicable 961 4.9 1,990 10.1 R—As reported by the state 17,710 89.9 19,700 100.0
Flag - Current Exp - Enterprise Operations (FL_V60) I—Imputed 3 # 3 # M—Missing 3,335 16.9 3,338 16.9 N—Not applicable 1,847 9.4 5,185 26.3 R—As reported by the state 14,515 73.7 19,700 100.0
Flag - Current Exp - Other Elementary/Secondary (FL_V65) M—Missing 8,394 42.6 8,394 42.6 N—Not applicable 961 4.9 9,355 47.5 R—As reported by the state 10,345 52.5 19,700 100.0
Flag - Non-Elementary/Secondary Exp - Community Services (FL_V70) M—Missing 890 4.5 890 4.5 N—Not applicable 961 4.9 1,851 9.4 R—As reported by the state 17,849 90.6 19,700 100.0
Flag - Non-Elementary/Secondary Exp - Adult Education (FL_V75) M—Missing 1,188 6.0 1,188 6.0 N—Not applicable 961 4.9 2,149 10.9 R—As reported by the state 17,551 89.1 19,700 100.0
Flag - Non-Elementary/Secondary Exp - Other (FL_V80) M—Missing 6,455 32.8 6,455 32.8 N—Not applicable 1,847 9.4 8,302 42.1 R—As reported by the state 11,398 57.9 19,700 100.0
Flag - Capital Outlay - Construction (FL_F12) A—Edited or suppressed by the analyst 314 1.6 314 1.6 I—Imputed 2 # 316 1.6 M—Missing 892 4.5 1,208 6.1 N—Not applicable 961 4.9 2,169 11.0 R—As reported by the state 17,531 89.0 19,700 100.0 See notes at end of table.
D-8

Appendix D—Value Distribution and Field Frequencies
Table D-1. Frequencies of categorical variables: Fiscal year 2019—Continued
Cumulative Cumulative Categorical variable label Frequency Percent frequency percent
Flag - Capital Outlay - Land and Existing Structures (FL_G15) A—Edited or suppressed by the analyst 315 1.6 315 1.6 I—Imputed 3 # 318 1.6 M—Missing 2,202 11.2 2,520 12.8 N—Not applicable 961 4.9 3,481 17.7 R—As reported by the state 16,219 82.3 19,700 100.0 Flag - Capital Outlay - Instructional Equipment (FL_K09) I—Imputed 1 # 1 # M—Missing 890 4.5 891 4.5 N—Not applicable 961 4.9 1,852 9.4 R—As reported by the state 17,848 90.6 19,700 100.0
Flag - Capital Outlay - Other Equipment (FL_K10) A—Edited or suppressed by the analyst 1 # 1 # I—Imputed 43 0.2 44 0.2 M—Missing 890 4.5 934 4.7 N—Not applicable 961 4.9 1,895 9.6 R—As reported by the state 17,805 90.4 19,700 100.0
Flag - Capital Outlay - Nonspecified Equipment (FL_K11) M—Missing 885 4.5 885 4.5 N—Not applicable 1,847 9.4 2,732 13.9 R—As reported by the state 16,968 86.1 19,700 100.0
Flag - Payments to State Governments (FL_L12) M—Missing 6,551 33.3 6,551 33.3 N—Not applicable 1,847 9.4 8,398 42.6 R—As reported by the state 11,302 57.4 19,700 100.0
Flag - Payments to Local Governments (FL_M12) M—Missing 6,390 32.4 6,390 32.4 N—Not applicable 1,847 9.4 8,237 41.8 R—As reported by the state 11,463 58.2 19,700 100.0
Flag - Payments to Other School Systems (FL_Q11) M—Missing 1,202 6.1 1,202 6.1 N—Not applicable 961 4.9 2,163 11.0 R—As reported by the state 17,537 89.0 19,700 100.0
Flag - Interest on Debt (FL_I86) A—Edited or suppressed by the analyst 1 # 1 # I—Imputed 299 1.5 300 1.5 M—Missing 1,115 5.7 1,415 7.2 N—Not applicable 961 4.9 2,376 12.1 R—As reported by the state 17,324 87.9 19,700 100.0
Flag - Total Salaries (FL_Z32) I—Imputed 492 2.5 492 2.5 M—Missing 889 4.5 1,381 7.0 N—Not applicable 961 4.9 2,342 11.9 R—As reported by the state 17,358 88.1 19,700 100.0
Flag - Salaries - Instruction (FL_Z33) I—Imputed 207 1.1 207 1.1 M—Missing 889 4.5 1,096 5.6 N—Not applicable 961 4.9 2,057 10.4 R—As reported by the state 17,643 89.6 19,700 100.0
Flag - Teacher Salaries - Regular Education Programs (FL_Z35) I—Imputed 2 # 2 # M—Missing 2,026 10.3 2,028 10.3 N—Not applicable 961 4.9 2,989 15.2 R—As reported by the state 16,711 84.8 19,700 100.0 See notes at end of table.
D-9

Appendix D—Value Distribution and Field Frequencies
Table D-1. Frequencies of categorical variables: Fiscal year 2019—Continued
Cumulative Cumulative Categorical variable label Frequency Percent frequency percent
Flag - Teacher Salaries - Special Education Programs (FL_Z36) I—Imputed 1 # 1 # M—Missing 2,026 10.3 2,027 10.3 N—Not applicable 961 4.9 2,988 15.2 R—As reported by the state 16,712 84.8 19,700 100.0
Flag - Teacher Salaries - Vocational Education Programs (FL_Z37) M—Missing 2,026 10.3 2,026 10.3 N—Not applicable 961 4.9 2,987 15.2 R—As reported by the state 16,713 84.8 19,700 100.0
Flag - Teacher Salaries - Other Educational Programs (FL_Z38) M—Missing 2,026 10.3 2,026 10.3 N—Not applicable 961 4.9 2,987 15.2 R—As reported by the state 16,713 84.8 19,700 100.0
Flag - Salaries - Support Services - Pupils (FL_V11) I—Imputed 1 # 1 # M—Missing 890 4.5 891 4.5 N—Not applicable 961 4.9 1,852 9.4 R—As reported by the state 17,848 90.6 19,700 100.0
Flag - Salaries - Support Services - Instructional Staff (FL_V13) M—Missing 890 4.5 890 4.5 N—Not applicable 961 4.9 1,851 9.4 R—As reported by the state 17,849 90.6 19,700 100.0
Flag - Salaries - Support Services - General Administration (FL_V15) I—Imputed 1 # 1 # M—Missing 890 4.5 891 4.5 N—Not applicable 961 4.9 1,852 9.4 R—As reported by the state 17,848 90.6 19,700 100.0
Flag - Salaries - Support Services - School Administration (FL_V17) M—Missing 890 4.5 890 4.5 N—Not applicable 961 4.9 1,851 9.4 R—As reported by the state 17,849 90.6 19,700 100.0
Flag - Salaries - Support Services - Operation and Maintenance of Plant (FL_V21) M—Missing 890 4.5 890 4.5 N—Not applicable 961 4.9 1,851 9.4 R—As reported by the state 17,849 90.6 19,700 100.0
Flag - Salaries - Support Services - Student Transportation (FL_V23) I—Imputed 57 0.3 57 0.3 M—Missing 890 4.5 947 4.8 N—Not applicable 961 4.9 1,908 9.7 R—As reported by the state 17,792 90.3 19,700 100.0
Flag - Salaries - Support Services - Business/Central/Other (FL_V37) I—Imputed 1 # 1 # M—Missing 890 4.5 891 4.5 N—Not applicable 961 4.9 1,852 9.4 R—As reported by the state 17,848 90.6 19,700 100.0
Flag - Salaries - Food Service (FL_V29) M—Missing 891 4.5 891 4.5 N—Not applicable 961 4.9 1,852 9.4 R—As reported by the state 17,848 90.6 19,700 100.0
Flag - Total Employee Benefits (FL_Z34) I—Imputed 286 1.5 286 1.5 M—Missing 889 4.5 1,175 6.0 See notes at end of table.
D-10

Appendix D—Value Distribution and Field Frequencies
Table D-1. Frequencies of categorical variables: Fiscal year 2019—Continued
Cumulative Cumulative Categorical variable label Frequency Percent frequency percent
N—Not applicable 961 4.9 2,136 10.8 R—As reported by the state 17,564 89.2 19,700 100.0
Flag - Employee Benefits - Instruction (FL_V10) I—Imputed 196 1.0 196 1.0 M—Missing 889 4.5 1,085 5.5 N—Not applicable 961 4.9 2,046 10.4 R—As reported by the state 17,654 89.6 19,700 100.0
Flag - Employee Benefits - Support Services - Pupils (FL_V12) I—Imputed 139 0.7 139 0.7 M—Missing 893 4.5 1,032 5.2 N—Not applicable 961 4.9 1,993 10.1 R—As reported by the state 17,707 89.9 19,700 100.0
Flag - Employee Benefits - Support Services - Instructional Staff (FL_V14) I—Imputed 138 0.7 138 0.7 M—Missing 893 4.5 1,031 5.2 N—Not applicable 961 4.9 1,992 10.1 R—As reported by the state 17,708 89.9 19,700 100.0
Flag - Employee Benefits - Support Services - General Administration (FL_V16) I—Imputed 139 0.7 139 0.7 M—Missing 893 4.5 1,032 5.2 N—Not applicable 961 4.9 1,993 10.1 R—As reported by the state 17,707 89.9 19,700 100.0
Flag - Employee Benefits - Support Services - School Administration (FL_V18) I—Imputed 138 0.7 138 0.7 M—Missing 893 4.5 1,031 5.2 N—Not applicable 961 4.9 1,992 10.1 R—As reported by the state 17,708 89.9 19,700 100.0
Flag - Employee Benefits - Support Services - Operation and Maintenance of Plant (FL_V22) I—Imputed 139 0.7 139 0.7 M—Missing 893 4.5 1,032 5.2 N—Not applicable 961 4.9 1,993 10.1 R—As reported by the state 17,707 89.9 19,700 100.0
Flag - Employee Benefits - Support Services - Student Transportation (FL_V24) I—Imputed 111 0.6 111 0.6 M—Missing 893 4.5 1,004 5.1 N—Not applicable 961 4.9 1,965 10.0 R—As reported by the state 17,735 90.0 19,700 100.0
Flag - Employee Benefits - Support Services - Business/Central/Other (FL_V38) I—Imputed 139 0.7 139 0.7 M—Missing 893 4.5 1,032 5.2 N—Not applicable 961 4.9 1,993 10.1 R—As reported by the state 17,707 89.9 19,700 100.0
Flag - Employee Benefits - Food Services (FL_V30) I—Imputed 139 0.7 139 0.7 M—Missing 891 4.5 1,030 5.2 N—Not applicable 961 4.9 1,991 10.1 R—As reported by the state 17,709 89.9 19,700 100.0
Flag - Employee Benefits - Enterprise Operations (FL_V32) M—Missing 4,023 20.4 4,023 20.4 N—Not applicable 1,847 9.4 5,870 29.8 R—As reported by the state 13,830 70.2 19,700 100.0
Flag - Textbooks (Function 1000) (FL_V93) See notes at end of table.
D-11

Appendix D—Value Distribution and Field Frequencies
Table D-1. Frequencies of categorical variables: Fiscal year 2019—Continued
Cumulative Cumulative Categorical variable label Frequency Percent frequency percent
I—Imputed 2 # 2 # M—Missing 2,545 12.9 2,547 12.9 N—Not applicable 961 4.9 3,508 17.8 R—As reported by the state 16,192 82.2 19,700 100.0
Flag - Long Term Debt - Outstanding at Beginning of Fiscal Year (FL_19H) A—Edited or suppressed by the analyst 1,504 7.6 1,504 7.6 I—Imputed 109 0.6 1,613 8.2 M—Missing 2,723 13.8 4,336 22.0 N—Not applicable 961 4.9 5,297 26.9 R—As reported by the state 14,403 73.1 19,700 100.0
Flag - Long Term Debt - Issued During Fiscal Year (FL_21F) A—Edited or suppressed by the analyst 251 1.3 251 1.3 I—Imputed 11 0.1 262 1.3 M—Missing 2,362 12.0 2,624 13.3 N—Not applicable 961 4.9 3,585 18.2 R—As reported by the state 16,115 81.8 19,700 100.0
Flag - Long Term Debt - Retired During Fiscal Year (FL_31F) A—Edited or suppressed by the analyst 248 1.3 248 1.3 I—Imputed 93 0.5 341 1.7 M—Missing 2,360 12.0 2,701 13.7 N—Not applicable 961 4.9 3,662 18.6 R—As reported by the state 16,038 81.4 19,700 100.0
Flag - Long Term Debt - Outstanding at End of Fiscal Year (FL_41F) A—Edited or suppressed by the analyst 231 1.2 231 1.2 I—Imputed 1,235 6.3 1,466 7.4 M—Missing 2,675 13.6 4,141 21.0 N—Not applicable 961 4.9 5,102 25.9 R—As reported by the state 14,598 74.1 19,700 100.0
Flag - Short Term Debt - Outstanding at Beginning of Fiscal Year (FL_61V) A—Edited or suppressed by the analyst 416 2.1 416 2.1 I—Imputed 1 # 417 2.1 M—Missing 5,365 27.2 5,782 29.4 N—Not applicable 961 4.9 6,743 34.2 R—As reported by the state 12,957 65.8 19,700 100.0
Flag - Short Term Debt - Outstanding at End of Fiscal Year (FL_66V) M—Missing 5,366 27.2 5,366 27.2 N—Not applicable 961 4.9 6,327 32.1 R—As reported by the state 13,373 67.9 19,700 100.0
Flag - Assets - Sinking Fund (FL_W01) I—Imputed 1 # 1 # M—Missing 2,126 10.8 2,127 10.8 N—Not applicable 961 4.9 3,088 15.7 R—As reported by the state 16,612 84.3 19,700 100.0
Flag - Assets - Bond Fund (FL_W31) A—Edited or suppressed by the analyst 1 # 1 # I—Imputed 4 # 5 # M—Missing 2,402 12.2 2,407 12.2 N—Not applicable 961 4.9 3,368 17.1 R—As reported by the state 16,332 82.9 19,700 100.0
Flag - Assets - Other Funds (FL_W61) A—Edited or suppressed by the analyst 1 # 1 # I—Imputed 29 0.1 30 0.2 M—Missing 1,601 8.1 1,631 8.3 N—Not applicable 961 4.9 2,592 13.2 See notes at end of table.
D-12

Appendix D—Value Distribution and Field Frequencies
Table D-1. Frequencies of categorical variables: Fiscal year 2019—Continued
Cumulative Cumulative Categorical variable label Frequency Percent frequency percent
R—As reported by the state 17,108 86.8 19,700 100.0
Flag - Utilities and Energy Services (FL_V95) I—Imputed 15 0.1 15 0.1 M—Missing 6,674 33.9 6,689 34.0 N—Not applicable 961 4.9 7,650 38.8 R—As reported by the state 12,050 61.2 19,700 100.0
Flag - Technology-Related Supplies and Purchased Services (FL_V02) I—Imputed 1 # 1 # M—Missing 8,554 43.4 8,555 43.4 N—Not applicable 961 4.9 9,516 48.3 R—As reported by the state 10,184 51.7 19,700 100.0
Flag - Technology-Related Equipment (FL_K14) I—Imputed 71 0.4 71 0.4 M—Missing 8,599 43.6 8,670 44.0 N—Not applicable 961 4.9 9,631 48.9 R—As reported by the state 10,069 51.1 19,700 100.0
Flag - Current Expenditures - State and Local Funds (FL_CE1) A—Edited or suppressed by the analyst 1 # 1 # I—Imputed 2,258 11.5 2,259 11.5 M—Missing 8,815 44.7 11,074 56.2 N—Not applicable 961 4.9 12,035 61.1 R—As reported by the state 7,665 38.9 19,700 100.0
Flag - Current Expenditures - Federal Funds (FL_CE2) I—Imputed 1,666 8.5 1,666 8.5 M—Missing 8,815 44.7 10,481 53.2 N—Not applicable 961 4.9 11,442 58.1 R—As reported by the state 8,258 41.9 19,700 100.0
Flag - Regional Education Service Agency (RESA) Current Exp on Behalf of The LEA (FL_CE3) I—Imputed 318 1.6 318 1.6 M—Missing 14,344 72.8 14,662 74.4 N—Not applicable 961 4.9 15,623 79.3 R—As reported by the state 4,077 20.7 19,700 100.0 # Rounds to zero. SOURCE: U.S. Department of Education, National Center for Education Statistics, Common Core of Data (CCD), "School District Finance Survey (F-33)," Fiscal year 2019, Provisional File Version 1a.
D-13

Appendix D—Value Distribution and Field Frequencies
Table D-2. Minimum, maximum, and mean of continuous variables, by variable: Fiscal year 2019 Number of Not
districts Missing applicable Suppressed Suppressed Variable Label reported Minimum Maximum Mean (-1) (-2) (-3) (-9)
V33 Fall Membership 17,694 0 960,484 2,850 2 1,735 269 0 MEMBERSCH Fall Membership - School Universe 18,022 0 947,919 2,787 72 1,095 453 58 TOTALREV Total Revenue 17,854 0 $33,788,513,000 $44,307,284 885 961 0 0 TFEDREV Total Federal Revenue 17,854 0 1,959,483,000 3,358,539 885 961 0 0 C14 Fed Rev - Thru State - Title I 17,854 0 637,844,000 819,864 885 961 0 0 C15 Fed Rev - Thru State - Individuals With Disabilities Education Act (IDEA) 17,854 0 469,057,000 673,071 885 961 0 0 C16 Fed Rev - Thru State - Math, Science, and Teacher Quality 17,854 0 33,240,000 74,580 885 961 0 0 C17 Fed Rev - Thru State - National Activities For School Safety 17,854 0 7,061,000 8,847 885 961 0 0 C19 Fed Rev - Thru State - Vocational and Tech Education 17,854 0 11,546,000 32,448 885 961 0 0 B11 Fed Rev - Thru State - Bilingual Education 17,854 0 13,525,000 19,109 885 961 0 0 C20 Fed Rev - Thru State - Other 17,854 0 332,833,000 448,787 885 961 0 0 C25 Fed Rev - Thru State - Child Nutrition Act 17,854 0 500,242,000 960,280 885 961 0 0 C36 Fed Rev - Nonspecified 17,854 0 31,478,000 48,667 885 961 0 0 B10 Fed Rev - Direct - Impact Aid 17,854 0 61,871,000 99,026 885 961 0 0 B12 Fed Rev - Direct - Indian Education 17,854 0 3,318,000 6,236 885 961 0 0 B13 Fed Rev - Direct - Other 17,854 0 154,904,000 167,624 885 961 0 0 TSTREV Total State Revenue 17,854 0 11,852,988,000 20,254,691 885 961 0 0 C01 State Rev - General Formula Assistance 17,854 0 8,336,719,000 14,019,373 885 961 0 0 C04 State Rev - Staff Improvement Programs 17,854 0 228,512,000 360,904 885 961 0 0 C05 State Rev - Special Education Programs 17,854 0 1,571,872,000 1,213,023 885 961 0 0 C06 State Rev - Compensatory and Basic Skills Programs 17,854 0 288,578,000 371,552 885 961 0 0 C07 State Rev - Bilingual Education Programs 17,854 0 107,415,000 78,082 885 961 0 0 C08 State Rev - Gifted and Talented Programs 17,854 0 94,318,000 74,165 885 961 0 0 C09 State Rev - Vocational Education Programs 17,854 0 20,974,000 78,500 885 961 0 0 C10 State Rev - School Lunch Programs 17,854 0 39,423,000 35,162 885 961 0 0 C11 State Rev - Capital Outlay and Debt Services Programs 17,854 0 191,702,000 354,712 885 961 0 0 C12 State Rev - Transportation Programs 17,854 0 92,811,000 274,626 885 961 0 0 C13 State Rev - Other Programs 17,854 0 1,407,982,000 2,022,571 885 961 0 0 C35 State Rev - Nonspecified 17,854 0 525,266,000 101,601 885 961 0 0 C38 State Rev On Behalf - Employee Benefits 17,854 0 359,038,000 1,230,800 885 961 0 0 C39 State Rev On Behalf - Not Employee Benefits 17,854 0 15,974,000 39,620 885 961 0 0 TLOCREV Total Local Revenue 17,854 0 19,976,042,000 20,694,055 885 961 0 0 T02 Local Rev - Parent Government Contributions (Dependent School Systems) 1,181 0 18,071,662,000 53,557,964 39 18,480 0 0 T06 Local Rev - Property Taxes 12,436 0 2,984,026,000 17,778,515 70 7,194 0 0 T09 Local Rev - General Sales Taxes 11,839 0 448,447,000 496,618 70 7,791 0 0 T15 Local Rev - Public Utility Taxes 11,839 0 20,755,000 35,671 70 7,791 0 0 T40 Local Rev - Individual and Corporate Income Taxes 11,839 0 165,755,000 211,001 70 7,791 0 0 T99 Local Rev - All Other Taxes 11,840 0 92,564,000 140,022 70 7,790 0 0 D11 Local Rev - From Other School Systems 17,854 0 275,835,000 994,881 885 961 0 0 D23 Local Rev - From Cities and Counties 17,854 0 145,653,000 631,501 885 961 0 0 See notes at end of table.
D-14

Appendix D—Value Distribution and Field Frequencies
Table D-2. Minimum, maximum, and mean of continuous variables, by variable: Fiscal year 2019—Continued Number of Not
districts Missing applicable Suppressed Suppressed Variable Label reported Minimum Maximum Mean (-1) (-2) (-3) (-9)
A07 Local Rev - Tuition Fees From Pupils and Parents 17,854 0 38,536,000 77,772 885 961 0 0 A08 Local Rev - Transportation Fees From Pupils and Parents 17,854 0 5,708,000 6,856 885 961 0 0 A09 Local Rev - School Lunch 17,854 0 40,791,000 318,141 885 961 0 0 A11 Local Rev - Textbook Sales and Rentals 17,854 0 12,000,000 13,320 885 961 0 0 A13 Local Rev - District Activity Receipts 17,854 0 94,787,000 261,480 885 961 0 0 A15 Local Rev - Student Fees, Nonspecified 17,854 0 16,060,000 9,205 885 961 0 0 A20 Local Rev - Other Sales and Services 17,854 0 90,412,000 137,394 885 961 0 0 A40 Local Rev - Rents and Royalties 17,854 0 31,101,000 57,918 885 961 0 0 U11 Local Rev - Sale of Property 17,854 0 31,500,000 32,951 885 961 0 0 U22 Local Rev - Interest Earnings 17,854 0 90,754,000 320,129 885 961 0 0 U30 Local Rev - Fines and Forfeits 17,854 0 20,949,000 24,400 885 961 0 0 U50 Local Rev - Private Contributions 17,854 0 170,305,000 93,152 885 961 0 0 U97 Local Rev - Miscellaneous 17,854 0 1,676,706,000 870,664 885 961 0 0 C24 NCES Local Revenue, Census State Revenue 17,854 0 1,155,813,000 332,404 885 961 0 0 TOTALEXP Total Expenditures 17,854 0 33,799,629,000 44,418,718 885 961 0 0 TCURELSC Total Current Exp For Elementary/Secondary Education 17,854 0 26,897,529,000 36,823,300 885 961 0 0 TCURINST Total Current Exp - Instruction 17,854 0 19,973,803,000 22,182,918 885 961 0 0 E13 Current Exp - Instruction 17,854 0 19,973,803,000 22,182,918 885 961 0 0 V91 Payments to Private Schools 17,854 0 922,947,000 252,549 885 961 0 0 V92 Payments to Charter Schools 17,854 0 2,203,690,000 413,581 885 961 0 0 TCURSSVC Total Current Exp - Support Services 17,854 0 6,346,293,000 13,186,341 885 961 0 0 E17 Current Exp - Support Services - Pupils 17,854 0 479,828,000 2,266,141 885 961 0 0 E07 Current Exp - Support Services - Instructional Staff 17,854 0 588,872,000 1,776,302 885 961 0 0 E08 Current Exp - Support Services - General Administration 17,854 0 155,403,000 747,427 885 961 0 0 E09 Current Exp - Support Services - School Administration 17,854 0 1,213,363,000 2,100,675 885 961 0 0 V40 Current Exp - Support Services - Operation and Maintenance of Plant 17,854 0 2,296,940,000 3,383,563 885 961 0 0 V45 Current Exp - Support Services - Student Transportation 17,854 0 1,417,038,000 1,555,543 885 961 0 0 V90 Current Exp - Support Services - Business/Central/Other 17,854 0 831,378,000 1,356,690 885 961 0 0 V85 Current Exp - Support Services Nonspecified 17,854 0 0 0 885 961 0 0 TCUROTH Total Current Expenditures - Other Elementary/Secondary 17,854 0 577,433,000 1,454,041 885 961 0 0 E11 Current Exp - Food Services 17,854 0 537,735,000 1,383,767 885 961 0 0 V60 Current Exp - Enterprise Operations 17,854 0 39,698,000 67,684 885 961 0 0 V65 Current Exp - Other Elementary/Secondary 17,854 0 14,406,000 2,590 885 961 0 0 TNONELSE Total Non-Elementary/Secondary Expenditures 17,854 0 342,812,000 413,879 885 961 0 0 V70 Non-Elementary/Secondary Exp - Community Services 17,854 0 85,016,000 237,338 885 961 0 0 V75 Non-Elementary/Secondary Exp - Adult Education 17,854 0 257,796,000 116,934 885 961 0 0 V80 Non-Elementary/Secondary Exp - Other 17,854 0 79,431,000 59,607 885 961 0 0 TCAPOUT Total Capital Outlay Expenditures 17,854 0 2,980,684,000 4,350,374 885 961 0 0 F12 Capital Outlay - Construction 17,854 0 2,829,691,000 3,458,884 885 961 0 0 G15 Capital Outlay - Land and Existing Structures 17,854 0 127,178,000 259,818 885 961 0 0 See notes at end of table.
D-15

Appendix D—Value Distribution and Field Frequencies
Table D-2. Minimum, maximum, and mean of continuous variables, by variable: Fiscal year 2019—Continued Number of Not
districts Missing applicable Suppressed Suppressed Variable Label reported Minimum Maximum Mean (-1) (-2) (-3) (-9)
K09 Capital Outlay - Instructional Equipment 17,854 0 84,470,000 135,261 885 961 0 0 K10 Capital Outlay - Other Equipment 17,854 0 104,949,000 480,585 885 961 0 0 K11 Capital Outlay - Nonspecified Equipment 17,854 0 7,948,000 15,825 885 961 0 0 L12 Payments to State Governments 17,854 0 665,252,000 192,276 885 961 0 0 M12 Payments to Local Governments 17,854 0 20,545,000 11,361 885 961 0 0 Q11 Payments to Other School Systems 17,854 0 466,884,000 812,824 885 961 0 0 I86 Interest On Debt 17,854 0 532,711,000 1,148,574 885 961 0 0 Z32 Total Salaries 17,854 0 12,535,679,000 20,783,977 885 961 0 0 Z33 Salaries - Instruction 17,854 0 10,603,718,000 13,863,230 885 961 0 0 Z35 Teacher Salaries - Regular Education Programs 17,854 0 4,021,211,000 8,277,056 885 961 0 0 Z36 Teacher Salaries - Special Education Programs 17,854 0 2,894,472,000 1,916,090 885 961 0 0 Z37 Teacher Salaries - Vocational Education Programs 17,854 0 788,663,000 361,801 885 961 0 0 Z38 Teacher Salaries - Other Educational Programs 17,854 0 153,832,000 611,770 885 961 0 0 V11 Salaries - Support Services - Pupils 17,854 0 304,812,000 1,394,819 885 961 0 0 V13 Salaries - Support Services - Instructional Staff 17,854 0 350,057,000 988,919 885 961 0 0 V15 Salaries - Support Services - General Administration 17,854 0 76,842,000 303,002 885 961 0 0 V17 Salaries - Support Services - School Administration 17,854 0 755,238,000 1,411,488 885 961 0 0 V21 Salaries - Support Services - Operation and Maintenance of Plant 17,854 0 323,532,000 1,081,501 885 961 0 0 V23 Salaries - Support Services - Student Transportation 17,854 0 81,572,000 512,698 885 961 0 0 V37 Salaries - Support Services - Business/Central/Other 17,854 0 335,007,000 598,167 885 961 0 0 V29 Salaries - Food Service 17,854 0 242,663,000 427,642 885 961 0 0 Z34 Total Employee Benefits 17,854 0 7,773,759,000 9,049,147 885 961 0 0 V10 Empl Benefits - Instruction 17,854 0 6,904,791,000 6,054,190 885 961 0 0 V12 Empl Benefits - Support Services - Pupils 17,854 0 167,111,000 594,247 885 961 0 0 V14 Empl Benefits - Support Services - Instructional Staff 17,854 0 173,191,000 399,492 885 961 0 0 V16 Empl Benefits - Support Services - General Administration 17,854 0 31,274,000 137,039 885 961 0 0 V18 Empl Benefits - Support Services - School Administration 17,854 0 458,125,000 589,145 885 961 0 0 V22 Empl Benefits - Support Services - Operation and Maintenance of Plant 17,854 0 200,066,000 504,896 885 961 0 0 V24 Empl Benefits - Support Services - Student Transportation 17,854 0 44,700,000 232,873 885 961 0 0 V38 Empl Benefits - Support Services - Business/Central/Other 17,854 0 203,215,000 280,193 885 961 0 0 V30 Empl Benefits - Food Services 17,854 0 97,180,000 187,831 885 961 0 0 V32 Empl Benefits - Enterprise Operations 17,854 0 8,445,000 7,041 885 961 0 0 V93 Textbooks (Function 1000) 17,854 0 100,176,000 166,459 885 961 0 0 _19H Long Term Debt - Outstanding at Beginning of Fiscal Year 17,854 0 14,012,182,000 26,300,126 885 961 0 0 _21F Long Term Debt - Issued During Fiscal Year 17,854 0 1,165,360,000 3,315,749 885 961 0 0 _31F Long Term Debt - Retired During Fiscal Year 17,854 0 1,416,517,000 2,287,127 885 961 0 0 _41F Long Term Debt - Outstanding at End of Fiscal Year 17,854 0 13,761,026,000 27,336,146 885 961 0 0 _61V Short Term Debt - Outstanding at Beginning of Fiscal Year 17,854 0 599,911,000 530,627 885 961 0 0 _66V Short Term Debt - Outstanding at End of Fiscal Year 17,854 0 449,445,000 521,584 885 961 0 0 W01 Assets - Sinking Fund 17,854 0 890,643,000 1,460,073 885 961 0 0 See notes at end of table.
D-16

Appendix D—Value Distribution and Field Frequencies
Table D-2. Minimum, maximum, and mean of continuous variables, by variable: Fiscal year 2019—Continued Number of Not
districts Missing applicable Suppressed Suppressed Variable Label reported Minimum Maximum Mean (-1) (-2) (-3) (-9)
W31 Assets - Bond Fund 17,854 0 1,046,817,000 4,465,976 885 961 0 0 W61 Assets - Other Funds 17,854 0 3,037,399,000 9,788,817 885 961 0 0 V95 Utilities and Energy Services 17,854 0 85,315,000 496,648 885 961 0 0 V02 Technology-Related Supplies and Purchased Services 17,854 0 163,538,000 294,727 885 961 0 0 K14 Technology-Related Equipment 17,854 0 32,880,000 86,442 885 961 0 0 CE1 Current Expenditures - State and Local Funds 9,924 0 3,011,695,000 30,034,258 8,815 961 0 0 CE2 Current Expenditures - Federal Funds 9,924 0 453,335,000 2,766,575 8,815 961 0 0 CE3 Regional Education Service Agency (RESA) Current Exp On Behalf of The LEA 17,854 0 478,596,000 88,117 885 961 0 0 SOURCE: U.S. Department of Education, National Center for Education Statistics, Common Core of Data (CCD), "School District Finance Survey (F-33)," Fiscal year 2019, Provisional File Version 1a.
D-17

Appendix D—Value Distribution and Field Frequencies
Table D-3. Number of districts with zero and positive values for revenues, by revenue source and state: Fiscal year 2019
Revenues Total Federal State Local
State Positive Zero Positive Zero Positive Zero Positive Zero Total 17,848 6 17,417 437 17,695 159 17,728 126
Alabama Alaska Arizona Arkansas California
139 54
659 276
1,988
0 0 0 0 0
139 54
615 274
1,870
0 0
44 2
118
139 54
658 275
1,965
0 0 1 1
23
139 54
634 274
1,987
0 0
25 2 1
Colorado Connecticut Delaware District of Columbia Florida
199 201
42 57 67
0 0 0 0 0
196 198
42 56 66
3 3 0 1 1
199 198
42 0
67
0 3 0
57 0
199 198
42 57 67
0 3 0 0 0
Georgia Hawaii Idaho Illinois Indiana
225 1
163 986 429
0 0 0 0 0
225 1
160 975 417
0 0 3
11 12
225 1
163 984 423
0 0 0 2 6
225 1
162 980 420
0 0 1 6 9
Iowa Kansas Kentucky Louisiana Maine
339 313 173 194 276
0 0 0 0 0
339 312 173 191 246
0 1 0 3
30
339 300 173 194 275
0 13
0 0 1
339 313 173 192 274
0 0 0 2 2
Maryland Massachusetts Michigan Minnesota Mississippi
24 405 886 567 146
0 0 0 1 3
24 405 875 543 146
0 0
11 25
3
24 391 886 546 146
0 14
0 22
3
24 404 882 563 146
0 1 4 5 3
Missouri Montana Nebraska Nevada New Hampshire
554 420 261
20 177
0 0 0 0 0
554 413 260
19 171
0 7 1 1 6
554 419 261
20 177
0 1 0 0 0
554 420 261
20 175
0 0 0 0 2
New Jersey New Mexico New York North Carolina North Dakota
676 143 692 305 206
0 0 0 1 0
668 140 687 302 197
8 3 5 4 9
676 143 692 304 202
0 0 0 2 4
675 143 692 305 205
1 0 0 1 1
Ohio Oklahoma Oregon Pennsylvania Rhode Island
1,036 547 216 774
63
1 0 0 0 0
1,022 546 215 767
62
15 1 1 7 1
1,036 546 216 771
63
1 1 0 3 0
1,004 545 216 774
62
33 2 0 0 1
South Carolina South Dakota Tennessee Texas Utah
94 149 143
1,225 155
0 0 0 0 0
94 149 143
1,213 153
0 0 0
12 2
94 149 143
1,225 154
0 0 0 0 1
93 149 143
1,217 153
1 0 0 8 2
Vermont Virginia Washington West Virginia Wisconsin Wyoming
198 133 317
60 427
48
0 0 0 0 0 0
121 132 315
60 424
48
77 1 2 0 3 0
198 133 317
60 427
48
0 0 0 0 0 0
191 133 316
60 425
48
7 0 1 0 2 0
NOTE: This table excludes school districts in the School District Finance Survey (F-33) data file that did not submit finance data for the survey. SOURCE: U.S. Department of Education, National Center for Education Statistics, Common Core of Data (CCD), "School District Finance Survey (F-33)," Fiscal year 2019, Provisional File Version 1a.
D-18

Appendix D—Value Distribution and Field Frequencies
Table D-4. Number of districts with zero and positive values for current elementary/secondary expenditures, by type of expenditure and state: Fiscal year 2019
State Total
Positive Zero
Current expenditures Instruction Support services
Positive Zero Positive Zero Other
Positive Zero
Total 17,827 27 17,696 158 17,795 59 16,072 1,782
Alabama Alaska Arizona Arkansas California
139 54
656 276
1,985
0 0 3 0 3
139 54
655 275
1,964
0 0 4 1
24
139 54
656 276
1,982
0 0 3 0 6
139 52
466 264
1,802
0 2
193 12
186
Colorado Connecticut Delaware District of Columbia Florida
199 197
42 57 67
0 4 0 0 0
198 197
42 57 67
1 4 0 0 0
199 195
42 57 67
0 6 0 0 0
181 175
33 54 66
18 26
9 3 1
Georgia Hawaii Idaho Illinois Indiana
225 1
163 985 429
0 0 0 1 0
224 1
163 976 413
1 0 0
10 16
225 1
163 983 429
0 0 0 3 0
204 1
136 879 393
21 0
27 107
36
Iowa Kansas Kentucky Louisiana Maine
339 313 173 194 276
0 0 0 0 0
339 312 173 194 250
0 1 0 0
26
339 313 173 194 276
0 0 0 0 0
330 292 173 191 191
9 21
0 3
85
Maryland Massachusetts Michigan Minnesota Mississippi
24 401 886 568 149
0 4 0 0 0
24 401 884 551 149
0 4 2
17 0
24 401 886 558 149
0 4 0
10 0
24 315 731 486 146
0 90
155 82
3
Missouri Montana Nebraska Nevada New Hampshire
554 420 261
20 176
0 0 0 0 1
554 414 261
20 169
0 6 0 0 8
554 420 261
20 176
0 0 0 0 1
553 304 241
19 161
1 116
20 1
16
New Jersey New Mexico New York North Carolina North Dakota
675 143 691 306 206
1 0 1 0 0
673 143 690 306 205
3 0 2 0 1
675 143 691 306 206
1 0 1 0 0
650 143 666 251 171
26 0
26 55 35
Ohio Oklahoma Oregon Pennsylvania Rhode Island
1,037 547 216 774
62
0 0 0 0 1
1,036 546 215 773
62
1 1 1 1 1
1,025 547 216 773
62
12 0 0 1 1
942 538 183 683
60
95 9
33 91
3
South Carolina South Dakota Tennessee Texas Utah
94 149 143
1,221 155
0 0 0 4 0
94 149 143
1,218 154
0 0 0 7 1
94 149 143
1,220 155
0 0 0 5 0
88 148 143
1,173 126
6 1 0
52 29
Vermont Virginia Washington West Virginia Wisconsin Wyoming
195 133 317
60 426
48
3 0 0 0 1 0
187 132 317
59 426
48
11 1 0 1 1 0
195 133 317
59 426
48
3 0 0 1 1 0
145 132 302
57 421
48
53 1
15 3 6 0
NOTE: This table excludes school districts in the School District Finance Survey (F-33) data file that did not submit finance data for the survey. SOURCE: U.S. Department of Education, National Center for Education Statistics, Common Core of Data (CCD), "School District Finance Survey (F-33)," Fiscal year 2019, Provisional File Version 1a.
D-19

Appendix D—Value Distribution and Field Frequencies
Table D-5. Number of districts with zero and positive values for expenditures and membership, by type of expenditure and state: Fiscal year 2019
State Total
Positive Zero
Expenditures Non-elementary/secondary
Positive Zero Capital outlay
Positive Zero Membership (V33) Positive Zero
Total 17,837 17 9,676 8,178 16,235 1,619 16,821 100
Alabama Alaska Arizona Arkansas California
139 54
658 276
1,986
0 0 1 0 2
138 24
102 150 704
1 30
557 126
1,284
136 50
469 266
1,609
3 4
190 10
379
139 54
642 261
1,901
0 0 1 0
11
Colorado Connecticut Delaware District of Columbia Florida
199 197
42 57 67
0 4 0 0 0
73 149
20 3
65
126 52 22 54
2
197 186
34 52 67
2 15
8 5 0
180 192
42 57 67
0 0 0 0 0
Georgia Hawaii Idaho Illinois Indiana
225 1
163 986 429
0 0 0 0 0
64 1
32 593 335
161 0
131 393
94
208 1
153 963 426
17 0
10 23
3
208 1
159 853 398
0 0 0 0 0
Iowa Kansas Kentucky Louisiana Maine
339 313 173 194 276
0 0 0 0 0
105 55
170 61
112
234 258
3 133 164
339 312 173 169 212
0 1 0
25 64
330 287 173 194 203
0 0 0 0 7
Maryland Massachusetts Michigan Minnesota Mississippi
24 401 886 568 149
0 4 0 0 0
22 176 665 394 102
2 229 221 174
47
24 388 777 546 149
0 17
109 22
0
24 404 827 495 149
0 0 1 0 0
Missouri Montana Nebraska Nevada New Hampshire
554 420 261
20 177
0 0 0 0 0
531 192
45 15 41
23 228 216
5 136
534 339 259
20 163
20 81
2 0
14
553 398 244
20 161
1 0 9 0 0
New Jersey New Mexico New York North Carolina North Dakota
675 143 692 306 206
1 0 0 0 0
316 31
615 113
81
360 112
77 193 125
641 143 689 279 196
35 0 3
27 10
651 140 682 306 174
0 0 0 0 0
Ohio Oklahoma Oregon Pennsylvania Rhode Island
1,037 547 216 774
62
0 0 0 0 1
591 170 128 658
47
446 377
88 116
16
874 515 200 752
62
163 32 16 22
1
934 542 196 677
59
50 0 8 2 0
South Carolina South Dakota Tennessee Texas Utah
94 149 143
1,221 155
0 0 0 4 0
86 106 125 692
55
8 43 18
533 100
92 149 143
1,010 139
2 0 0
215 16
85 149 143
1,201 154
1 0 0 0 0
Vermont Virginia Washington West Virginia Wisconsin Wyoming
198 133 317
60 427
48
0 0 0 0 0 0
40 95
190 56
320 22
158 38
127 4
107 26
170 133 296
60 423
48
28 0
21 0 4 0
147 132 307
55 423
48
6 0 0 0 3 0
NOTE: This table excludes school districts in the School District Finance Survey (F-33) data file that did not submit finance data for the survey. The Membership (V33) column in this table also excludes school districts that submitted finance data, but had a membership value of missing, nonapplicable, or suppressed. SOURCE: U.S. Department of Education, National Center for Education Statistics, Common Core of Data (CCD), "School District Finance Survey (F-33)," Fiscal year 2019, Provisional File Version 1a.
D-20

Appendix D—Value Distribution and Field Frequencies
Table D-6. Number of districts and minimum, maximum, and mean of districts' local revenues, by state: Fiscal year 2019
State Number of districts Minimum Maximum Mean
Total 17,854 $0 $19,976,042,000 $20,694,055
Alabama Alaska Arizona Arkansas California
139 54
659 276
1,988
553,000 14,000
0 0 0
197,065,000 225,524,000 264,296,000 180,632,000
2,955,704,000
20,555,489 10,475,315
6,919,024 8,110,290
19,018,927
Colorado Connecticut Delaware District of Columbia Florida
199 201
42 57 67
39,000 0
33,000 2,387,000 2,585,000
1,037,798,000 292,419,000 123,052,000
1,393,459,000 2,280,729,000
31,915,975 36,690,373 18,209,024 41,583,123
239,143,537
Georgia Hawaii Idaho Illinois Indiana
225 1
163 986 429
12,000 65,629,000
0 0 0
999,499,000 65,629,000
116,621,000 3,648,717,000
152,787,000
46,836,338 65,629,000
4,298,521 21,430,293 10,049,184
Iowa Kansas Kentucky Louisiana Maine
339 313 173 194 276
96,000 2,000
512,000 0 0
168,260,000 186,422,000 730,723,000 371,656,000
90,007,000
9,556,177 6,980,259
16,976,913 23,344,077
6,249,105
Maryland Massachusetts Michigan Minnesota Mississippi
24 405 886 568 149
10,984,000 0 0 0 0
2,288,278,000 985,493,000 272,386,000 241,463,000 110,886,000
347,049,750 28,679,464
9,538,560 7,609,289
12,062,054
Missouri Montana Nebraska Nevada New Hampshire
554 420 261
20 177
141,000 3,000
220,000 1,251,000
0
327,670,000 57,870,000
322,635,000 2,241,602,000
102,126,000
13,294,220 2,202,943
10,938,372 154,058,900
12,454,802
New Jersey New Mexico New York North Carolina North Dakota
676 143 692 306 206
0 12,000
196,000 0 0
228,442,000 200,717,000
19,976,042,000 540,388,000
69,713,000
28,003,377 5,649,545
61,562,652 14,770,016
3,361,252
Ohio Oklahoma Oregon Pennsylvania Rhode Island
1,037 547 216 774
63
0 0
10,000 200,000
0
597,783,000 215,873,000 556,671,000
1,588,490,000 138,679,000
13,810,448 5,387,653
17,366,389 28,784,775 22,488,508
South Carolina South Dakota Tennessee Texas Utah
94 149 143
1,225 155
0 202,000 550,000
0 0
580,437,000 140,376,000 769,790,000
2,147,156,000 272,578,000
50,187,585 5,958,846
32,687,140 31,159,296 15,981,761
Vermont Virginia Washington West Virginia Wisconsin Wyoming
198 133 317
60 427
48
0 2,347,000
0 58,000
0 692,000
15,632,000 2,243,012,000
442,098,000 116,199,000 334,018,000 139,707,000
1,472,975 72,524,571 15,919,104 19,801,617 14,479,637 14,622,292
NOTE: This table excludes school districts in the School District Finance Survey (F-33) data file that did not submit finance data for the survey. SOURCE: U.S. Department of Education, National Center for Education Statistics, Common Core of Data (CCD), "School District Finance Survey (F-33)," Fiscal year 2019, Provisional File Version 1a.
D-21

Appendix D—Value Distribution and Field Frequencies
Table D-7. Number of districts and minimum, maximum, and mean of districts' state revenues, by state: Fiscal year 2019
State Number of districts Minimum Maximum Mean
Total 17,854 $0 $11,852,988,000 $20,254,691
Alabama Alaska Arizona Arkansas California
139 54
659 276
1,988
1,816,000 527,000
0 0 0
334,434,000 449,958,000 290,398,000 149,847,000
5,848,248,000
33,869,568 29,627,759
8,571,335 10,585,254 29,324,207
Colorado Connecticut Delaware District of Columbia
199 201
42 57
18,000 0
2,359,000 0
433,249,000 386,654,000 188,834,000
0
27,257,251 22,857,592 38,030,905
0 Florida 67 2,817,000 1,175,143,000 182,149,522
Georgia Hawaii Idaho Illinois Indiana
225 1
163 986 429
740,000 2,760,298,000
143,000 0 0
1,025,006,000 2,760,298,000
237,734,000 2,303,111,000
289,913,000
45,840,702 2,760,298,000
11,591,080 14,591,312 19,803,662
Iowa Kansas Kentucky Louisiana Maine
339 313 173 194 276
803,000 0
1,332,000 96,000
0
303,527,000 483,334,000 608,017,000 228,997,000
65,241,000
11,316,224 14,149,278 27,827,029 20,698,830
4,364,076
Maryland Massachusetts Michigan Minnesota Mississippi
24 405 886 568 149
11,694,000 0
5,000 0 0
1,287,575,000 415,944,000 521,123,000 457,900,000 165,199,000
284,864,417 18,564,205 14,514,167 16,611,241 16,222,013
Missouri Montana Nebraska Nevada New Hampshire
554 420 261
20 177
95,000 0
94,000 469,000
21,000
97,324,000 61,003,000
338,153,000 1,029,851,000
83,296,000
7,009,904 2,053,795 5,753,077
93,000,550 5,688,130
New Jersey New Mexico New York North Carolina North Dakota
676 143 692 306 206
12,000 255,000
2,000 0 0
989,653,000 757,050,000
11,852,988,000 970,675,000 112,603,000
20,174,436 19,487,580 43,698,777 32,888,951
4,962,481
Ohio Oklahoma Oregon Pennsylvania Rhode Island
1,037 547 216 774
63
0 0
6,000 0
86,000
388,642,000 193,138,000 368,029,000
1,661,857,000 306,682,000
10,205,053 6,564,707
21,284,639 16,320,367 18,237,635
South Carolina South Dakota Tennessee Texas Utah
94 149 143
1,225 155
251,000 3,000
1,662,000 2,000
0
471,322,000 107,725,000 544,415,000 417,277,000 419,320,000
57,747,947 3,868,745
34,849,329 19,835,738 23,099,994
Vermont Virginia Washington West Virginia Wisconsin Wyoming
198 133 317
60 427
48
20,000 1,541,000
329,000 626,000 120,000 700,000
82,351,000 696,992,000 657,740,000 177,736,000 717,319,000 171,281,000
8,941,874 53,193,692 42,391,603 33,140,283 13,816,328 20,094,854
NOTE: This table excludes school districts in the School District Finance Survey (F-33) data file that did not submit finance data for the survey. SOURCE: U.S. Department of Education, National Center for Education Statistics, Common Core of Data (CCD), "School District Finance Survey (F-33)," Fiscal year 2019, Provisional File Version 1a.
D-22

Appendix D—Value Distribution and Field Frequencies
Table D-8. Number of districts and minimum, maximum, and mean of districts' federal revenues, by state: Fiscal year 2019
State Number of districts Minimum Maximum Mean
Total 17,854 $0 $1,959,483,000 $3,358,539
Alabama Alaska Arizona Arkansas California
139 54
659 276
1,988
204,000 28,000
0 0 0
79,975,000 88,207,000 79,178,000 40,937,000
1,069,606,000
6,248,022 7,258,426 2,161,524 2,251,109 4,232,630
Colorado Connecticut Delaware District of Columbia Florida
199 201
42 57 67
0 0
132,000 0 0
112,534,000 53,447,000 21,806,000
132,899,000 451,377,000
3,637,101 2,614,721 3,803,738 3,629,579
51,560,284
Georgia Hawaii Idaho Illinois Indiana
225 1
163 986 429
57,000 298,818,000
0 0 0
150,077,000 298,818,000
21,139,000 691,325,000
66,969,000
8,411,218 298,818,000
1,623,190 2,366,023 2,404,063
Iowa Kansas Kentucky Louisiana Maine
339 313 173 194 276
86,000 0
159,000 0 0
53,591,000 75,461,000
141,051,000 90,094,000 10,185,000
1,480,437 1,852,169 5,517,006 5,999,031
674,978
Maryland Massachusetts Michigan Minnesota Mississippi
24 405 886 568 149
3,193,000 3,000
0 0 0
162,921,000 82,318,000
167,033,000 74,966,000 47,989,000
37,802,167 2,145,331 1,978,475 1,303,056 4,585,732
Missouri Montana Nebraska Nevada New Hampshire
554 420 261
20 177
39,000 0 0 0 0
50,062,000 18,365,000 85,570,000
329,814,000 20,365,000
1,720,904 614,690
1,269,130 23,453,250
931,994
New Jersey New Mexico New York North Carolina North Dakota
676 143 692 306 206
0 0 0 0 0
86,154,000 114,897,000
1,959,483,000 145,136,000
17,161,000
2,047,766 3,649,839 5,318,691 5,318,428
951,427
Ohio Oklahoma Oregon Pennsylvania Rhode Island
1,037 547 216 774
63
0 0 0 0 0
122,783,000 55,121,000 48,761,000
355,468,000 52,245,000
1,776,959 1,370,627 2,789,449 3,026,434 3,162,746
South Carolina South Dakota Tennessee Texas Utah
94 149 143
1,225 155
33,000 81,000
2,000 0 0
68,141,000 26,619,000
223,523,000 334,912,000
67,388,000
9,420,681 1,551,591 8,232,503 5,899,856 2,898,716
Vermont Virginia Washington West Virginia Wisconsin Wyoming
198 133 317
60 427
48
0 0 0
857,000 0
76,000
7,898,000 128,541,000
44,612,000 43,988,000
183,476,000 17,704,000
575,813 8,795,827 3,382,319 6,737,367 1,936,255 2,751,250
NOTE: This table excludes school districts in the School District Finance Survey (F-33) data file that did not submit finance data for the survey. SOURCE: U.S. Department of Education, National Center for Education Statistics, Common Core of Data (CCD), "School District Finance Survey (F-33)," Fiscal year 2019, Provisional File Version 1a.
D-23

Appendix D—Value Distribution and Field Frequencies
Table D-9. Number of districts and minimum, maximum, and mean of districts' total revenues, by state: Fiscal year 2019
State Number of districts Minimum Maximum Mean
Total 17,854 $0 $33,788,513,000 $44,307,284
Alabama Alaska Arizona Arkansas California
139 54
659 276
1,988
2,693,000 594,000
7,000 660,000
2,000
585,972,000 763,689,000 617,569,000 320,691,000
9,873,558,000
60,673,079 47,361,500 17,651,883 20,946,652 52,575,765
Colorado Connecticut Delaware District of Columbia Florida
199 201
42 57 67
716,000 4,000
3,182,000 2,592,000 8,586,000
1,529,328,000 559,126,000 326,774,000
1,526,358,000 3,907,249,000
62,810,327 62,162,687 60,043,667 45,212,702
472,853,343
Georgia Hawaii Idaho Illinois Indiana
225 1
163 986 429
1,525,000 3,124,745,000
175,000 180,000
5,000
2,174,582,000 3,124,745,000
352,100,000 6,643,153,000
509,669,000
101,088,258 3,124,745,000
17,512,791 38,387,629 32,256,909
Iowa Kansas Kentucky Louisiana Maine
339 313 173 194 276
2,354,000 8,000
2,091,000 478,000
10,000
525,378,000 686,934,000
1,479,791,000 626,268,000 122,900,000
22,352,838 22,981,706 50,320,948 50,041,938 11,288,159
Maryland Massachusetts Michigan Minnesota Mississippi
24 405 886 568 149
33,178,000 3,000
133,000 0 0
3,336,163,000 1,463,463,000
775,695,000 733,288,000 301,793,000
669,716,333 49,389,000 26,031,202 25,523,586 32,869,799
Missouri Montana Nebraska Nevada New Hampshire
554 420 261
20 177
683,000 3,000
1,911,000 3,000,000
21,000
468,354,000 129,272,000 746,358,000
3,601,267,000 194,501,000
22,025,029 4,871,429
17,960,579 270,512,700
19,074,927
New Jersey New Mexico New York North Carolina North Dakota
676 143 692 306 206
135,000 511,000 198,000
0 72,000
1,242,393,000 1,072,664,000
33,788,513,000 1,604,813,000
188,612,000
50,225,580 28,786,965
110,580,120 52,977,395
9,275,160
Ohio Oklahoma Oregon Pennsylvania Rhode Island
1,037 547 216 774
63
0 524,000
32,000 253,000 227,000
941,998,000 441,456,000 869,088,000
3,605,815,000 497,606,000
25,792,460 13,322,987 41,440,477 48,131,576 43,888,889
South Carolina South Dakota Tennessee Texas Utah
94 149 143
1,225 155
1,753,000 413,000
2,762,000 2,000 8,000
957,121,000 274,720,000
1,307,173,000 2,889,281,000
709,831,000
117,356,213 11,379,181 75,768,972 56,894,891 41,980,471
Vermont Virginia Washington West Virginia Wisconsin Wyoming
198 133 317
60 427
48
20,000 4,290,000
345,000 4,370,000 1,507,000 3,517,000
93,413,000 3,068,545,000 1,144,450,000
337,923,000 1,202,208,000
251,224,000
10,990,662 134,514,090
61,693,025 59,679,267 30,232,220 37,468,396
NOTE: This table excludes school districts in the School District Finance Survey (F-33) data file that did not submit finance data for the survey. SOURCE: U.S. Department of Education, National Center for Education Statistics, Common Core of Data (CCD), "School District Finance Survey (F-33)," Fiscal year 2019, Provisional File Version 1a.
D-24

Appendix D—Value Distribution and Field Frequencies
Table D-10. Number of districts and minimum, maximum, and mean of districts' current expenditures for instruction, by state: Fiscal year 2019
State Number of districts Minimum Maximum Mean
Total 17,854 $0 $19,973,803,000 $22,182,918
Alabama Alaska Arizona Arkansas California
139 54
659 276
1,988
1,357,000 197,000
0 0 0
286,017,000 407,937,000 299,530,000 167,792,000
4,593,004,000
30,414,712 23,741,148
8,017,991 10,374,960 25,549,193
Colorado Connecticut Delaware District of Columbia Florida
199 201
42 57 67
0 0
427,000 1,254,000 6,675,000
543,627,000 254,729,000 180,336,000 537,647,000
2,255,342,000
27,740,332 31,111,577 32,105,690 16,695,789
248,953,269
Georgia Hawaii Idaho Illinois Indiana
225 1
163 986 429
0 1,700,085,000
64,000 0 0
1,152,477,000 1,700,085,000
167,458,000 3,722,312,000
191,881,000
52,917,933 1,700,085,000
8,994,693 19,465,983 14,393,364
Iowa Kansas Kentucky Louisiana Maine
339 313 173 194 276
168,000 0
998,000 187,000
0
264,803,000 324,016,000 756,039,000 314,813,000
64,174,000
10,854,802 11,588,597 25,872,665 23,985,273
5,595,486
Maryland Massachusetts Michigan Minnesota Mississippi
24 405 886 568 149
18,833,000 0 0 0
837,000
1,713,144,000 781,920,000 375,272,000 393,881,000 158,763,000
354,427,292 26,122,427 11,641,254 13,404,518 16,642,738
Missouri Montana Nebraska Nevada New Hampshire
554 420 261
20 177
205,000 0
931,000 1,200,000
0
236,853,000 74,055,000
433,780,000 1,742,334,000
124,399,000
10,422,489 2,481,343 9,879,536
131,465,750 10,470,768
New Jersey New Mexico New York North Carolina North Dakota
676 143 692 306 206
0 166,000
0 299,000
0
404,955,000 523,599,000
19,973,803,000 1,018,338,000
104,870,000
24,271,300 13,395,000 64,095,276 31,098,059
4,654,558
Ohio Oklahoma Oregon Pennsylvania Rhode Island
1,037 547 216 774
63
0 0 0 0 0
431,260,000 199,965,000 371,791,000 928,428,000 207,325,000
12,818,619 6,610,313
19,437,731 22,438,133 22,473,460
South Carolina South Dakota Tennessee Texas Utah
94 149 143
1,225 155
970,000 204,000 568,000
0 0
419,493,000 145,827,000 746,816,000
1,077,247,000 392,756,000
52,953,372 5,591,430
42,074,294 25,517,015 21,697,355
Vermont Virginia Washington West Virginia Wisconsin Wyoming
198 133 317
60 427
48
0 0
172,000 0 0
1,763,000
52,153,000 1,840,088,000
551,256,000 184,267,000 590,065,000 132,098,000
5,204,212 74,365,925 30,169,420 31,239,033 14,755,115 18,929,667
NOTE: This table excludes school districts in the School District Finance Survey (F-33) data file that did not submit finance data for the survey. SOURCE: U.S. Department of Education, National Center for Education Statistics, Common Core of Data (CCD), "School District Finance Survey (F-33)," Fiscal year 2019, Provisional File Version 1a.
D-25

Appendix D—Value Distribution and Field Frequencies
Table D-11. Number of districts and minimum, maximum, and mean of districts' current expenditures for support services, by state: Fiscal year 2019
State Number of districts Minimum Maximum Mean
Total 17,854 $0 $6,346,293,000 $13,186,341
Alabama Alaska Arizona Arkansas California
139 54
659 276
1,988
997,000 409,000
0 1,000
0
215,780,000 281,585,000 212,333,000 118,093,000
2,861,095,000
19,626,302 19,249,204
5,986,687 7,143,866
15,842,867
Colorado Connecticut Delaware District of Columbia Florida
199 201
42 57 67
385,000 0
1,316,000 921,000 683,000
578,568,000 166,144,000 123,117,000 519,283,000
1,044,294,000
20,655,296 19,657,124 18,070,333 16,406,965
137,010,493
Georgia Hawaii Idaho Illinois Indiana
225 1
163 986 429
577,000 1,079,519,000
2,000 0
45,000
750,947,000 1,079,519,000
95,911,000 1,671,708,000
167,760,000
30,175,729 1,079,519,000
5,340,374 11,928,424
9,626,235
Iowa Kansas Kentucky Louisiana Maine
339 313 173 194 276
226,000 7,000
719,000 248,000
3,000
158,896,000 239,184,000 560,297,000 243,540,000
42,464,000
6,486,985 6,604,144
15,597,272 16,886,675
3,762,290
Maryland Massachusetts Michigan Minnesota Mississippi
24 405 886 568 149
11,651,000 0
29,000 0
885,000
910,570,000 483,621,000 341,636,000 184,573,000
93,013,000
194,984,208 14,449,119
8,069,614 6,423,442
10,969,356
Missouri Montana Nebraska Nevada New Hampshire
554 420 261
20 177
197,000 3,000
801,000 1,383,000
0
184,586,000 41,320,000
201,559,000 1,077,026,000
54,333,000
7,299,606 1,543,152 5,363,920
85,046,750 5,873,435
New Jersey New Mexico New York North Carolina North Dakota
676 143 692 306 206
0 287,000
0 61,000 22,000
396,849,000 320,555,000
6,346,293,000 454,527,000
50,270,000
16,640,964 9,045,007
26,842,311 15,991,281
2,515,631
Ohio Oklahoma Oregon Pennsylvania Rhode Island
1,037 547 216 774
63
0 150,000
8,000 0 0
336,057,000 166,970,000 297,358,000 625,901,000 188,405,000
8,205,491 4,340,099
12,930,407 12,979,487 15,292,714
South Carolina South Dakota Tennessee Texas Utah
94 149 143
1,225 155
626,000 165,000 807,000
0 7,000
286,525,000 76,646,000
459,802,000 884,549,000 203,492,000
36,912,181 3,342,356
23,697,860 15,635,134 11,090,026
Vermont Virginia Washington West Virginia Wisconsin Wyoming
198 133 317
60 427
48
0 966,000 114,000
0 0
1,284,000
31,046,000 1,002,472,000
342,862,000 105,053,000 428,636,000
81,721,000
3,394,182 43,528,436 18,633,322 19,661,517
9,470,693 11,918,708
NOTE: This table excludes school districts in the School District Finance Survey (F-33) data file that did not submit finance data for the survey. SOURCE: U.S. Department of Education, National Center for Education Statistics, Common Core of Data (CCD), "School District Finance Survey (F-33)," Fiscal year 2019, Provisional File Version 1a.
D-26

Appendix D—Value Distribution and Field Frequencies
Table D-12. Number of districts and minimum, maximum, and mean of districts' other current expenditures, by state: Fiscal year 2019
State Number of districts Minimum Maximum Mean
Total 17,854 $0 $577,433,000 $1,454,041
Alabama Alaska Arizona Arkansas California
139 54
659 276
1,988
119,000 0 0 0 0
36,359,000 21,625,000 28,660,000 12,933,000
367,533,000
3,582,468 1,618,481
755,847 990,406
1,600,936
Colorado Connecticut Delaware District of Columbia Florida
199 201
42 57 67
0 0 0 0 0
41,086,000 23,301,000 13,505,000 42,423,000
165,394,000
1,767,352 1,633,473 2,253,548 1,230,386
21,029,149
Georgia Hawaii Idaho Illinois Indiana
225 1
163 986 429
0 144,715,000
0 0 0
91,720,000 144,715,000
11,065,000 210,748,000
22,041,000
4,727,524 144,715,000
689,331 889,163
1,175,380
Iowa Kansas Kentucky Louisiana Maine
339 313 173 194 276
0 0
124,000 0 0
19,026,000 27,036,000 67,744,000 33,091,000
4,956,000
741,319 820,019
2,758,260 2,334,381
392,272
Maryland Massachusetts Michigan Minnesota Mississippi
24 405 886 568 149
1,191,000 0 0 0 0
71,819,000 53,886,000 39,685,000 27,655,000 17,478,000
16,394,542 1,219,119
726,633 903,470
1,805,450
Missouri Montana Nebraska Nevada New Hampshire
554 420 261
20 177
0 0 0 0 0
16,588,000 6,226,000
29,757,000 127,980,000
5,824,000
792,195 180,012 672,828
9,067,250 407,379
New Jersey New Mexico New York North Carolina North Dakota
676 143 692 306 206
0 25,000
0 0 0
36,277,000 42,850,000
577,433,000 65,121,000 13,109,000
1,334,136 1,288,042 1,929,309 2,355,461
566,325
Ohio Oklahoma Oregon Pennsylvania Rhode Island
1,037 547 216 774
63
0 0 0 0 0
28,150,000 25,976,000 19,117,000 91,751,000 17,731,000
695,832 753,344
1,110,361 1,393,941 1,030,413
South Carolina South Dakota Tennessee Texas Utah
94 149 143
1,225 155
0 0
1,000 0 0
52,936,000 15,056,000 72,109,000
118,204,000 31,280,000
4,741,638 500,624
3,625,154 2,234,523 1,652,510
Vermont Virginia Washington West Virginia Wisconsin Wyoming
198 133 317
60 427
48
0 0 0 0 0
104,000
3,123,000 104,024,000
20,246,000 18,895,000 48,256,000
7,087,000
262,717 4,631,677 1,754,142 3,272,483
905,033 990,188
NOTE: This table excludes school districts in the School District Finance Survey (F-33) data file that did not submit finance data for the survey. SOURCE: U.S. Department of Education, National Center for Education Statistics, Common Core of Data (CCD), "School District Finance Survey (F-33)," Fiscal year 2019, Provisional File Version 1a.
D-27

Appendix D—Value Distribution and Field Frequencies
Table D-13. Number of districts and minimum, maximum, and mean of districts' total current expenditures for elementary/secondary education, by state: Fiscal year 2019
State Number of districts Minimum Maximum Mean
Total 17,854 $0 $26,897,529,000 $36,823,300
Alabama Alaska Arizona Arkansas California
139 54
659 276
1,988
2,812,000 613,000
0 1,000
0
538,156,000 711,147,000 540,523,000 297,321,000
7,821,632,000
53,623,482 44,608,833 14,760,525 18,509,232 42,992,995
Colorado Connecticut Delaware District of Columbia Florida
199 201
42 57 67
685,000 0
3,217,000 2,288,000 7,376,000
1,163,281,000 403,241,000 312,544,000
1,099,353,000 3,465,030,000
50,162,980 52,402,174 52,429,571 34,333,140
406,992,910
Georgia Hawaii Idaho Illinois Indiana
225 1
163 986 429
1,198,000 2,924,319,000
133,000 0
45,000
1,995,144,000 2,924,319,000
274,041,000 5,604,768,000
381,682,000
87,821,187 2,924,319,000
15,024,399 32,283,570 25,194,979
Iowa Kansas Kentucky Louisiana Maine
339 313 173 194 276
1,218,000 7,000
1,841,000 435,000
3,000
442,725,000 590,236,000
1,384,080,000 569,845,000 111,025,000
18,083,106 19,012,760 44,228,197 43,206,330
9,750,047
Maryland Massachusetts Michigan Minnesota Mississippi
24 405 886 568 149
31,675,000 0
107,000 15,000
1,890,000
2,682,600,000 1,319,427,000
756,593,000 599,459,000 264,490,000
565,806,042 41,790,664 20,437,501 20,731,430 29,417,544
Missouri Montana Nebraska Nevada New Hampshire
554 420 261
20 177
430,000 3,000
1,970,000 2,644,000
0
422,297,000 115,375,000 665,096,000
2,947,340,000 178,046,000
18,514,291 4,204,507
15,916,284 225,579,750
16,751,582
New Jersey New Mexico New York North Carolina North Dakota
676 143 692 306 206
0 577,000
0 366,000
51,000
831,840,000 887,004,000
26,897,529,000 1,519,907,000
164,963,000
42,246,401 23,728,049 92,866,896 49,444,801
7,736,515
Ohio Oklahoma Oregon Pennsylvania Rhode Island
1,037 547 216 774
63
29,000 459,000
8,000 89,000
0
795,467,000 392,911,000 688,266,000
1,646,080,000 413,461,000
21,719,942 11,703,755 33,478,500 36,811,561 38,796,587
South Carolina South Dakota Tennessee Texas Utah
94 149 143
1,225 155
1,642,000 369,000
2,314,000 0
7,000
758,954,000 237,529,000
1,278,727,000 2,080,000,000
576,475,000
94,607,191 9,434,409
69,397,308 43,386,672 34,439,890
Vermont Virginia Washington West Virginia Wisconsin Wyoming
198 133 317
60 427
48
0 966,000 325,000
2,997,000 0
3,170,000
85,228,000 2,946,584,000
914,364,000 308,215,000
1,066,957,000 220,906,000
8,861,111 122,526,038
50,556,883 54,173,033 25,130,841 31,838,563
NOTE: This table excludes school districts in the School District Finance Survey (F-33) data file that did not submit finance data for the survey. SOURCE: U.S. Department of Education, National Center for Education Statistics, Common Core of Data (CCD), "School District Finance Survey (F-33)," Fiscal year 2019, Provisional File Version 1a.
D-28

Appendix D—Value Distribution and Field Frequencies
Table D-14. Number of districts and minimum, maximum, and mean of districts' capital outlays, by state: Fiscal year 2019
State Number of districts Minimum Maximum Mean
Total 17,854 $0 $2,980,684,000 $4,350,374
Alabama Alaska Arizona Arkansas California
139 54
659 276
1,988
0 0 0 0 0
78,320,000 38,095,000
121,806,000 71,621,000
928,393,000
4,273,259 2,317,759 2,421,947 2,684,812 5,190,368
Colorado Connecticut Delaware District of Columbia Florida
199 201
42 57 67
0 0 0 0
9,000
187,656,000 73,980,000 70,106,000
404,196,000 359,453,000
9,364,794 3,629,403 4,396,643 8,354,649
39,217,507
Georgia Hawaii Idaho Illinois Indiana
225 1
163 986 429
0 271,300,000
0 0 0
179,175,000 271,300,000
52,117,000 617,744,000
70,224,000
9,553,231 271,300,000
1,178,632 2,833,013 5,208,263
Iowa Kansas Kentucky Louisiana Maine
339 313 173 194 276
51,000 0
1,000 0 0
81,158,000 116,857,000
97,635,000 46,885,000 30,170,000
2,673,637 3,171,412 4,690,486 2,808,041
772,797
Maryland Massachusetts Michigan Minnesota Mississippi
24 405 886 568 149
1,230,000 0 0 0
47,000
342,879,000 67,249,000 42,393,000
122,226,000 61,511,000
66,462,917 2,750,370 1,921,988 3,850,113 2,367,188
Missouri Montana Nebraska Nevada New Hampshire
554 420 261
20 177
0 0 0
30,000 0
77,493,000 50,800,000
125,802,000 430,666,000
23,149,000
1,852,099 757,636
1,969,705 46,649,800
1,180,266
New Jersey New Mexico New York North Carolina North Dakota
676 143 692 306 206
0 3,000
0 0 0
55,983,000 167,082,000
2,980,684,000 335,453,000
30,149,000
2,135,451 4,032,399 8,869,634 4,866,418 1,062,927
Ohio Oklahoma Oregon Pennsylvania Rhode Island
1,037 547 216 774
63
0 0 0 0 0
121,105,000 69,225,000
168,457,000 220,712,000
6,141,000
2,280,944 1,499,466 7,371,167 2,928,689 1,011,238
South Carolina South Dakota Tennessee Texas Utah
94 149 143
1,225 155
0 3,000
52,000 0 0
236,948,000 24,004,000
119,555,000 374,476,000 189,520,000
16,152,894 1,235,570 6,165,343 8,113,706 6,456,955
Vermont Virginia Washington West Virginia Wisconsin Wyoming
198 133 317
60 427
48
0 26,000
0 14,000
0 160,000
5,832,000 255,627,000 202,688,000
27,221,000 89,599,000 23,852,000
280,864 11,098,406 11,271,707
3,622,783 3,166,185 3,787,813
NOTE: This table excludes school districts in the School District Finance Survey (F-33) data file that did not submit finance data for the survey. SOURCE: U.S. Department of Education, National Center for Education Statistics, Common Core of Data (CCD), "School District Finance Survey (F-33)," Fiscal year 2019, Provisional File Version 1a.
D-29

Appendix D—Value Distribution and Field Frequencies
Table D-15. Number of districts and minimum, maximum, and mean of districts' non-elementary/secondary expenditures, by state: Fiscal year 2019
State Number of districts Minimum Maximum Mean
Total 17,854 $0 $342,812,000 $413,879
Alabama Alaska Arizona Arkansas California
139 54
659 276
1,988
0 0 0 0 0
9,769,000 1,744,000
10,434,000 2,823,000
143,316,000
978,741 138,241 175,675 112,670 773,420
Colorado Connecticut Delaware District of Columbia Florida
199 201
42 57 67
0 0 0 0 0
47,150,000 4,848,000
48,251,000 8,889,000
85,939,000
413,477 205,915
1,560,619 288,123
8,437,328
Georgia Hawaii Idaho Illinois Indiana
225 1
163 986 429
0 18,390,000
0 0 0
10,005,000 18,390,000
1,683,000 66,218,000
5,821,000
177,653 18,390,000
28,957 193,908 202,986
Iowa Kansas Kentucky Louisiana Maine
339 313 173 194 276
0 0 0 0 0
6,859,000 612,000
10,166,000 2,646,000 3,521,000
102,699 13,173
404,584 57,320
117,518
Maryland Massachusetts Michigan Minnesota Mississippi
24 405 886 568 149
0 0 0 0 0
6,933,000 5,903,000 7,662,000
38,032,000 2,664,000
1,068,667 183,652 345,462
1,011,407 114,040
Missouri Montana Nebraska Nevada New Hampshire
554 420 261
20 177
0 0 0 0 0
15,163,000 1,403,000
439,000 17,766,000
1,156,000
325,475 23,407
7,368 1,266,350
31,887
New Jersey New Mexico New York North Carolina North Dakota
676 143 692 306 206
0 0 0 0 0
55,763,000 527,000
342,812,000 13,084,000
4,596,000
659,419 14,727
800,588 224,356
81,539
Ohio Oklahoma Oregon Pennsylvania Rhode Island
1,037 547 216 774
63
0 0 0 0 0
27,358,000 5,385,000 3,395,000
86,112,000 12,641,000
308,971 50,746
167,088 768,686 957,937
South Carolina South Dakota Tennessee Texas Utah
94 149 143
1,225 155
0 0 0 0 0
10,539,000 2,202,000
12,724,000 19,925,000 11,003,000
443,000 46,450
643,825 314,963 420,787
Vermont Virginia Washington West Virginia Wisconsin Wyoming
198 133 317
60 427
48
0 0 0 0 0 0
4,437,000 26,582,000 13,540,000
7,854,000 33,437,000
1,364,000
59,475 559,053 308,890 598,300 312,698
83,792 NOTE: This table excludes school districts in the School District Finance Survey (F-33) data file that did not submit finance data for the survey. SOURCE: U.S. Department of Education, National Center for Education Statistics, Common Core of Data (CCD), "School District Finance Survey (F-33)," Fiscal year 2019, Provisional File Version 1a.
D-30

Appendix D—Value Distribution and Field Frequencies
Table D-16. Number of districts and minimum, maximum, and mean of districts' total expenditures, by state: Fiscal year 2019
State Number of districts Minimum Maximum Mean
Total 17,854 $0 $33,799,629,000 $44,418,718
Alabama Alaska Arizona Arkansas California
139 54
659 276
1,988
2,812,000 616,000
0 612,000
0
563,725,000 762,030,000 600,189,000 392,115,000
9,430,968,000
60,267,050 47,789,426 17,951,841 21,967,116 52,357,161
Colorado Connecticut Delaware District of Columbia Florida
199 201
42 57 67
685,000 0
3,218,000 2,288,000 7,418,000
1,541,916,000 556,975,000 317,140,000
1,575,938,000 3,908,117,000
63,329,136 60,099,109 59,319,714 44,688,526
463,579,910
Georgia Hawaii Idaho Illinois Indiana
225 1
163 986 429
1,757,000 3,214,009,000
134,000 175,000
55,000
2,156,140,000 3,214,009,000
315,392,000 6,877,368,000
508,250,000
98,662,836 3,214,009,000
16,661,227 37,703,128 32,150,828
Iowa Kansas Kentucky Louisiana Maine
339 313 173 194 276
2,204,000 7,000
2,167,000 437,000
6,000
504,329,000 647,394,000
1,508,557,000 654,210,000 118,068,000
22,152,413 23,064,981 50,541,994 49,838,026 11,325,975
Maryland Massachusetts Michigan Minnesota Mississippi
24 405 886 568 149
33,047,000 0
161,000 15,000
1,971,000
3,131,052,000 1,636,623,000
767,200,000 778,963,000 281,746,000
652,940,083 49,654,504 25,491,905 26,880,285 32,275,537
Missouri Montana Nebraska Nevada New Hampshire
554 420 261
20 177
591,000 3,000
1,992,000 3,140,000
3,000
442,925,000 122,272,000 819,519,000
3,535,301,000 185,847,000
22,111,865 5,158,769
18,510,510 284,111,800
19,291,531
New Jersey New Mexico New York North Carolina North Dakota
676 143 692 306 206
0 580,000 138,000 368,000
72,000
1,218,673,000 1,081,410,000
33,799,629,000 1,921,768,000
201,922,000
49,639,652 28,346,042
111,057,000 55,529,977
9,383,107
Ohio Oklahoma Oregon Pennsylvania Rhode Island
1,037 547 216 774
63
29,000 459,000
38,000 243,000
0
1,086,170,000 470,752,000 941,400,000
3,568,713,000 480,045,000
26,270,400 13,379,581 44,454,477 47,689,261 44,374,048
South Carolina South Dakota Tennessee Texas Utah
94 149 143
1,225 155
1,706,000 374,000
2,586,000 0
12,000
930,570,000 271,436,000
1,424,602,000 2,884,039,000
794,762,000
116,882,574 11,067,262 77,986,881 57,390,374 42,598,877
Vermont Virginia Washington West Virginia Wisconsin Wyoming
198 133 317
60 427
48
20,000 4,289,000
325,000 5,090,000 1,507,000 3,435,000
93,035,000 3,244,371,000 1,119,380,000
328,584,000 1,203,845,000
244,816,000
11,074,212 137,532,383
64,299,025 58,795,017 30,681,297 36,138,583
NOTE: This table excludes school districts in the School District Finance Survey (F-33) data file that did not submit finance data for the survey. SOURCE: U.S. Department of Education, National Center for Education Statistics, Common Core of Data (CCD), "School District Finance Survey (F-33)," Fiscal year 2019, Provisional File Version 1a.
D-31

Appendix E—Survey Form
E-1

F-33 (2019) OMB No. 0607-0700: Approval Expires 9/30/2021
Educational Finance Branch at 888–891–2099
FORM F-33 (12-17-2019)
U.S. DEPARTMENT OF COMMERCE Economics and Statistics Administration
U.S. CENSUS BUREAU
2019 ANNUAL SURVEY OF SCHOOL SYSTEM FINANCES
RETURN BY FAX TO
In correspondence pertaining to this report,please refer to the Census File Number aboveyour address.
(Please correct any error in name, address, and ZIP Code)
Please note that this is a national form that applies to governments with wide differences in the size of their service areas, the amount of populationserved, and the extent and complexity of their financial accounts. We estimate public reporting burden for this collection of information to be an average of 86.5 hours if responding using the codes on this form, or 14.5 hours using state education agency account codes, including time forreviewing instructions, searching existing data sources, gathering and maintaining data needed, and completing and reviewing the collection ofinformation. Send comments regarding the burden estimate or any other aspect of this collection of information, including suggestions for reducingthis burden, to: ERD Survey Comments 0607-0700, U.S. Census Bureau, 4600 Silver Hill Road, ERD-6H151, Washington, D.C. 20233. You maye-mail comments to [email protected]. Be sure to use "ERD Survey Comments 0607-0700" as the subject.
Reference numbers pertain to revenue and expenditure codes contained in Financial Accounting for Local and State School Systems: 2014 Edition, National Center for Education Statistics (2015).
Amount Omit cents
Part I REVENUE
Section A – FROM LOCAL SOURCES
4.
1. Property taxes (1110, 1140)
2. General sales or gross receipts tax (1120)
3. Public utility taxes (1190)
Individual and corporate income taxes (1130)
5. All other taxes (1190)
6. Parent government contributions (dependent school systems only – 1200)
7. Revenue from cities and counties (1200, 1320, 1330, 1420, 1430, 1960, 2100, 2200, 2800)
8. Revenue from other school systems (within state – 1321, 1421, 1951; out of state – 1331, 1350, 1431, 1952)
9. Tuition fees from pupils, parents, and other private sources (1310, 1340)
10. Transportation fees from pupils, parents, and other private sources (1410, 1440)
11. Textbook sales and rentals (1940)
12. School lunch revenues (1600)
13. District activity receipts (1700)
TØ6
TØ9
T15
T4Ø
T99
TØ2
D23
D11
AØ7
A11
AØ9
A13
AØ8
14. Other sales and service revenues (1800)
15. Rents and royalties (1910) A4Ø
A2Ø
16. Sale of property U11
NOTE ➙ Please read the instructions on pages 6 through 9 before completing this form.

Amount Omit cents
Part I REVENUE – Continued
Section A – FROM LOCAL SOURCES – Continued
17. Interest earnings (1510)
18. Fines and forfeits
19. Private contributions (1920)
Section B – FROM STATE SOURCES (3100, 3200, 3800)
1. General formula assistance
2. Staff improvement programs
3. Special education programs
4. Compensatory and basic skills attainment programs
5. Bilingual education programs
6. Gifted and talented programs
7. Vocational education programs
8. School lunch programs
9. Capital outlay and debt service programs
10. Transportation programs
11. All other revenues from state sources
Section C – FROM FEDERAL SOURCES THROUGH THE STATE GOVERNMENT (4200, 4500)
1. Title I
2. Children with disabilities – IDEA
3. Math, science, and teacher quality
4. National activities for school safety
5. Vocational and technical education
6. Child nutrition act – exclude commodities
7. Bilingual education
8.
Section D – FROM FEDERAL SOURCES DIRECTLY (4100, 4300, 4700, 4800)
1. Impact aid
All other federal aid through the state
2. Indian education
3. All other direct federal aid
CONTINUE WITH PART II ON PAGE 3
U22
U3Ø
U5Ø
CØ1
CØ4
CØ5
CØ6
CØ7
CØ8
CØ9
C1Ø
C11
C12
C13
C14
C15
C16
C17
C19
C25
B11
B1Ø
C2Ø
B12
B13
20. Miscellaneous other local revenue (1980, 1990) U97
Page 2 FORM F-33 (12-17-2019)

TOTAL (ALL currentoperation objects)
Part II CURRENT OPERATION EXPENDITURE
1. Instruction (1000)
2. Support services, pupils (2100)
3. Support services, instructional staff (2200)
CONTINUE WITH PART V ON PAGE 4
FORM F-33 (2-19-2015) Page 3
Employee benefits only(Object series 200,
except 240)
Salaries only(Object series 100)
4. Support services, general administration (2300)
5. Support services, school administration (2400)
6. Support services, operation and maintenance of plant (2600)
7. Support services, student transportation(2700)
8. Business/central/other support services (2500 and 2900)
Section B 261ELEMENTARY-SECONDARY NONINSTRUCTIONAL PROGRAMS
9. Food services (3100)
10. Enterprise operations (3200)
11. Other
Section C 261NONELEMENTARY-SECONDARY PROGRAMS
Section A 261ELEMENTARY-SECONDARY EDUCATION INSTRUCTIONALPROGRAMS261PREKINDERGARTENTHROUGH GRADE 12
12. Community services (3300)
13. Adult education
14. Other
Part III CAPITAL OUTLAY EXPENDITURES AmountOmit cents
1. Construction (object 450)
2. Land and existing structures (objects 710, 720, 740)
Z33 V1Ø E13
V11 V12 E17
V13 V14 EØ7
V15 V16 EØ8
V17 V18 EØ9
V21 V22 V4Ø
V23 V24 V45
V37 V38 V9Ø
V29 V3Ø E11
V32 V6Ø
V65
V7Ø
V75
V8Ø
F12
G15
(1) (2) (3)
3. Instructional equipment (object 730, function 1000)
4. All other equipment (object 730, functions 2000, 3000, 4000)
KØ9
K1Ø
6.Part IV OTHER EXPENDITURES BY LOCAL EDUCATION AGENCY
1. Payments to other school systems (objects 511, 512, 561, 562, 564, 565, 567, 591, 592)
2. Payments to state governments (object 569)
Q11
L12
Payments to local governments (object 920)3.M12
4. Interest on school system indebtedness (object 832)h86
TOTAL (ALL currentoperation objects)
Part II CURRENT OPERATION EXPENDITURE
1. Instruction (1000)
2. Support services, pupils (2100)
3. Support services, instructional staff (2200)
CONTINUE WITH PART V ON PAGE 4
Employee benefits only(Object series 200,
except 240) Salaries only
(Object series 100)
4. Support services, general administration (2300)
5. Support services, school administration (2400)
6. Support services, operation and maintenance of plant (2600)
7. Support services, student transportation(2700)
8. Business/central/other support services (2500 and 2900)
Section B – ELEMENTARY-SECONDARY NONINSTRUCTIONAL PROGRAMS
9. Food services (3100)
10. Enterprise operations (3200)
11. Other
Section C – NONELEMENTARY-SECONDARY PROGRAMS
Section A – ELEMENTARY-SECONDARY EDUCATION INSTRUCTIONAL PROGRAMS – PREKINDERGARTEN THROUGH GRADE 12
12. Community services (3300)
13. Adult education
14. Other Part III CAPITAL OUTLAY EXPENDITURES Amount
Omit cents
1. Construction (object 450)
2. Land and existing structures (objects 710, 720, 740)
Z33 V1Ø E13
V11 V12 E17
V13 V14 EØ7
V15 V16 EØ8
V17 V18 EØ9
V21 V22 V4Ø
V23 V24 V45
V37 V38 V9Ø
V29 V3Ø E11
V32 V6Ø
V65
V7Ø
V75
V8Ø
F12
G15
(1) (2) (3)
3. Instructional equipment (object 730, function 1000)
4. All other equipment (object 730, functions 2000, 3000, 4000)
KØ9
K1Ø
6.Part IV OTHER EXPENDITURES BY LOCAL EDUCATION AGENCY
1. Payments to other school systems (objects 511, 512, 561, 562, 566, 567, 591, 592)
2. Payments to state governments (objects 565, 569)
Q11
L12
Payments to local governments (objects 565, 569) 3. M12
4. Interest on school system indebtedness (object 832) I86
FORM F-33 (12-17-2019) Page 3

Part V STATE PAYMENTS ON BEHALF OF THE LOCAL EDUCATION AGENCY (Revenue source code 3900)
1. For employee benefits
Amount Omit cents
C38
2. All other (textbooks, school bus purchases, etc.) C39
Part VI DEBT
Section A – LONG TERM – Term of more than one year
1. Outstanding at beginning of the fiscal year
19H
2. Issued during fiscal year (revenue code 5110) 21F
3. Retired during fiscal year (object 831) 31F
4. Outstanding at end of fiscal year (line 1 plus line 2 minus line 3) 41F
Section B – SHORT TERM – Term of one year or less
1. Outstanding at beginning of fiscal year
61V
2. Outstanding at end of fiscal year 66V
Part VII CASH AND INVESTMENTS HELD AT END OF FISCAL YEAR
Type of asset Funds
Debt service Bond Other
Cash and deposits (include CDs and security holdings) WØ1 W31 W61
Part VIII FALL MEMBERSHIP – October 2018
Enter the count of pupils enrolled on the school day closest to October 1, 2018
Membership V33
Part IX SPECIAL PROCESSING ITEMS
Item Code Amount
1. Student fees, nonspecified A15
2. Census local, NCES state revenue TØ7
3. Census state, NCES local revenue C24
4. State revenue, nonspecified C35
5. Federal revenue, nonspecified C36
6. State payment on behalf of the LEA, instruction employee benefits J13
7. State payment on behalf of the LEA, pupil support services employee benefits J17
8. State payment on behalf of the LEA, instructional staff support employee benefits JØ7
9. State payment on behalf of the LEA, general administration employee benefits JØ8
10. State payment on behalf of the LEA, school administration employee benefits JØ9
11. State payment on behalf of the LEA, operation and maintenance of plant employee benefits J4Ø
12. State payment on behalf of the LEA, student transportation employee benefits J45
13. State payment on behalf of the LEA, business/central/other employee benefits J9Ø
14. State payment on behalf of the LEA, other employee benefits J1Ø
15. Support services expenditures, nonspecified V85
CONTINUE WITH PART IX ON PAGE 5 Page 4 FORM F-33 (12-17-2019)

Part IX SPECIAL PROCESSING ITEMS – Continued
Item Code Amount
Remarks – Please use this space for any explanation that may be essential in understanding your reported data.If additional space is required, please attach a separate sheet.
16. Equipment expenditure, nonspecified
17. Own retirement system transfer, instruction
18. Own retirement system transfer, support services
19. Federal revenue on behalf of school system
20. State payment on behalf of the LEA, instructional nonbenefits
21. State payment on behalf of the LEA, support services nonbenefits
22. State payment on behalf of the LEA, noninstructional programs nonbenefits
23. State payment on behalf of the LEA, nonelementary-secondary programs
24. State payment on behalf of the LEA, capital outlay
K11
J12
J11
B23
J14
J96
J97
J98
J99
Part X EXHIBITS OF SELECTED ITEMS REPORTED ABOVE IN II-A, II-B, and III
1. Payments to private schools (objects 563, 566)
2. Payments to charter schools (objects 562, 564, 567)
V91
V92
3. Total salaries and wages (object 100 – ALL functions) Z32
4. Total employee benefit payments (object 200 – ALL functions) Z34
5. Teacher salaries – Regular education programs (program 100) Z35
6. Teacher salaries – Special education programs (program 200) Z36
7. Teacher salaries – Vocational education programs (program 300) Z37
8. Teacher salaries – Other education programs (programs 400, 900) Z38
9. Textbooks (object 640, function 1000) V93
10. Utilities and energy services (objects 410, 620 – function 2600) V95
11. Technology-related supplies and purchased services (objects 351, 352, 432,443, 530, 650 – ALL functions) VØ2
12. Technology-related equipment (objects 734, 735 – ALL functions) K14
Part XI ESSA: CURRENT EXPENDITURES BY FUND TYPE
Current expenditures for elementary-secondary education programs paid from stateand local funds, excluding private funds, and including current expenditures paidfrom federal funds intended to replace local tax revenues (objects 100-600, 810, 820, and 890 for functions 1000, 2000, 3100, and 3200 - state funds, local funds, and federal funds intended to replace local tax revenues only, excluding private funds) CE1
CE2
Current expenditures for elementary-secondary education programs paid fromfederal funds, excluding federal funds intended to replace local tax revenues (objects 100-600, 810, 820, and 890 for functions 1000, 2000, 3100, and 3200 -federal funds only, excluding federal funds intended to replace local tax revenues)
1.
2.
13. RESA current expenditures on behalf of the LEA (objects 100-600, 810, 820, and890 for functions 1000, 2000, 3100, and 3200)
CE3
FORM F-33 (12-17-2019) Page 5

BASIC INSTRUCTIONS AND SUGGESTIONS
FINAL AUDITED FIGURES ARE UNNECESSARY. If substantially accuratefigures can be supplied on a preliminary basis, please do not delay submitting this report. 1. INCLUDE the unduplicated revenues and expenditures from all funds:
a. General fund e. Capital projects funds
b. Special revenue funds f. Food service fund
c. Federal projects funds g. District activity funds d. Debt service fund
2. EXCLUDE transfers of monies between funds, agency transactions,transactions of private trust funds, purchase of commodities, and purchase of securities for investment purposes. 3. In cases where revenues were not received, no expenditures made, or no debt or assets, report "0" for the items. Please describe the basisof any estimates or prorations used to report amounts requested on this form in the "Remarks" section. 4. For help with questions, contact the Educational Finance Branch ofthe U.S. Census Bureau at 1–800–622–6193 or [email protected].
Part I – REVENUE Section A – FROM LOCAL SOURCES
Lines 1–5. Independent school districts should report their tax receiptshere. Line 1 (property taxes) will be applicable to most independent school districts. Lines 2 through 5 will be applicable to only a relativelysmall number of districts. Taxes reported here should be those which the district has the power to levy. State taxes and state property tax relief payments should be excluded here and reported instead in section B. Include current and delinquent tax revenues and penalties. Line 6. Dependent school systems should report their tax receipts and any other amounts appropriated by their parent government on line 6 (Census code T02).
Line 7. Report taxes for education levied by separate county and citygovernments and transferred to the school system. Include moniesreceived from debt issued in the name of a local (nonschool system)government and transferred to the school system. Regional schoolsystems should report assessments received from cities and towns here.Assessments received from independent school districts should bereported on line 8.
Line 8. Report payments received from other school systems, both within and outside the state, for tuition, transportation, and other services (such as purchasing and data processing). Regional school systems should report assessments received from independent schooldistricts here. Assessments received from cities and towns should be reported on line 7. Lines 9–14. Report all student fees on these lines. Gross receipts from sale of school breakfasts, lunches, and milk (from students, teachers, adults, but not from state or federal funds) should be entered on line 12. Gross district activity receipts for those funds under control of the custodian of district funds should be included on line 13. Revenues from other sales and services, including community services activitiesshould be entered on line 14. Report in Part IX the amount of anystudent fee that cannot be reported because the fee covers more than one of the items on lines 9 through 14, such as lump sum fees for both tuition and transportation.
Line 15–20. Include revenues received from allowing temporary possession or granting rights to the use of school district buildings, land, or other properties on line 15. Report amounts received fromsale of real property, buildings (and improvements to them), landeasements, rights-of-way, and other capital assets (buses,automobiles, etc.) on line 16. Include interest earnings from all fundsheld by the school system on line 17. Report revenues from penalties imposed for violations of law on line 18. Report gifts of cash or securities from private individuals or organizations on line 19. Report receipts from refunds of prior year expenditures andother revenue from local sources not provided for elsewhere on line 20. Report in Part VI the amount of monies from debt issuances.
Section B – FROM STATE SOURCES
Include all state payments made directly to the localeducation agency. Exclude state payments made on behalf of the local education agency and report instead in Part V.
Line 1. Include revenue from general noncategorical state assistance programs such as foundation, minimum or basic formula support, principal apportionment, equalization, flat or block grants, and state public school fund distributions. Also include state revenue dedicated from major state taxes, such as income and sales taxes. Revenues from minor state taxes should be included on line 11.
Line 2. Report revenues from programs designed to improve the quality andquantity of local education agency staff. Examples include additional teacherunits, teacher benefits, retirement and social security paid directly to localeducation agencies, mentor teachers, teacher induction, staff developmentcontracts and stipends, career ladder contracts, in-service training, healthinsurance, principal leadership, teacher quality contracts, and salaries forspecific types of instructional and support staff (other than for staff directlyassociated with the programs described on lines 3 through 10). Line 3. Enter revenues for the education of physically and mentally disabled students. Line 4. Include revenues from state compensatory education for "at risk" or other economically disadvantaged students, includingmigratory children (unless bilingual –– see line 5) and orphans. Alsoinclude amounts from state programs directed toward the attainment ofbasic skills. Include categorical education excellence and qualityeducation programs that provide more than staff enhancements –– such as materials, resource centers, and equipment. Programs that focus on staff should be reported on line 2. Lines 5–10. Enter state revenues for the type of program indicated. Include career education programs on line 7; school lunch matching payments on line 8; school construction, building aid, and interest andprincipal payments on line 9; and bus driver salaries and bus replacements on line 10. Line 11. Report amounts for specific programs not described above on lines 1 through 10 including instructional materials, textbooks, computer equipment,library resources, guidance and psychological services, driver education,energy conservation, enrollment increases and losses, health, alcohol and drugabuse, AIDS, child abuse, summer school, prekindergarten and early childhood,adult education (excluding vocational), desegregation, private schools, safetyand law enforcement, and community services. Also include on line 11 those items financed by relatively minor state taxes,licenses, fees, and funds such as severance and license taxes, timber andmotor vehicle excise taxes, payments in lieu of taxes, refunds, landreimbursement, and forest funds. Report in Part IX the amount of any state revenue item that cannot be reported because the item covers more than one of the items on lines 1 through 11, such as "total state revenues" not broken down by program. Section C – FROM FEDERAL SOURCES THROUGH THE STATE GOVERNMENT Line 1. Include federal revenues distributed through Title I of theElementary-Secondary Education Act (ESEA) as reauthorized by the EveryStudent Succeeds Act (ESSA). Report basic, concentration, targeted, andeducation finance incentive grants.
Line 2. Report federal revenues awarded under the Individuals with Disabilities Education Act (IDEA 2004). Include formula grants authorized in Part B of thislegislation. Exclude project grants authorized in Part D of this law; report thesegrants in Part I-D3 of this form instead.
Line 3. Report math, science, and teacher quality formula and project grantsprovided under Title II-A and B of the Elementary-Secondary Education Act(ESEA) as reauthorized by the Every Student Succeeds Act (ESSA).
Line 4. Report National Activities for School Safety grants distributed underTitle IV-F, subpart 3, section 4631 of the Elementary-Secondary Education Act(ESEA) as reauthorized by the Every Student Succeeds Act (ESSA).
Line 5. Report formula grants authorized by the Carl D. Perkins Career andTechnical Education Improvement Act of 2006. Include revenues from Basic State formula grants authorized under this law. Line 6. Report revenues from Child Nutrition Act programs (e.g., NationalSchool Lunch Act, School Breakfast Program, Special Milk Program, a la carte sales, etc.). Report cash payments only – exclude the value of donated commodities. Line 7. Include project grants for bilingual education provided under Title IIIof the Elementary-Secondary Education Act (ESEA) as reauthorized by the Every Student Succeeds Act (ESSA). Line 8. Enter the total of all other federal funds disbursed through the state tothe local education agency not included in lines 1 through 7 above. Includegrants for the 21st Century Community Learning Center programs providedunder Title IV-B of the Elementary-Secondary Education Act (ESEA) as reauthorized by the Every Student Succeeds Act (ESSA) and formula grantsauthorized by the Workforce Innovation and Opportunity Act. Section D – FROM FEDERAL SOURCES DIRECTLY Line 1. Include federal Impact Aid payments for construction and formaintenance and operation provided under Title VIII of theElementary-Secondary Education Act (ESEA) as reauthorized by the Every Student Succeeds Act (ESSA). Line 2. Include both project and formula grants for Indian educationdistributed under Title VI of the Elementary-Secondary Education Act(ESEA) as reauthorized by the Every Student Succeeds Act (ESSA).
CONTINUE ON PAGE 7
Page 6 FORM F-33 (12-17-2019)

Line 3. Report the total of all other federal grants awarded directly to thelocal education agency not included in lines 1 or 2 above. Include project grants authorized under Part D of IDEA, as well as federal Head Start, magnetschools, and gifted and talented program grants provided directly to thelocal education agency. Report in Part IX the amount of any federal revenue item that cannot be reported because the item covers more than one of the items in Part IC1-9 and ID1-3, such as "total federal revenues" not broken down by program. Part II – CURRENT OPERATION EXPENDITURE Include for the functions shown on lines 1 though 14 expenditures for salariesand wages only (column (1)), employee benefits only (column (2)), and allcurrent operation expenditure (column (3)). Column (3) totals shouldinclude amounts entered in columns (1) and (2). Additionally,column (3) totals should include such objects as contracts, rent, insurance,utilities, maintenance services, printing, tuition paid to private schools,purchase of food, supplies, and materials.
Exclude from Part II Include instead in:
Capital outlay expenditures Part III
Payments to other school systems Part IV, line 3 Payments to the state, cities,counties, or special districts Part IV, lines 4 and 5
Debt service payments Part IV, line 6 and Part VI, Section, A line 3
State payments on behalf of school systems Part IX, lines 6–14
Also exclude interfund transfers and the purchase of stocks, bonds,securities, and other investment assets.
Handbook references pertain to function codes contained inFinancial Accounting for Local and State School Systems: 2014Edition, National Center for Education Statistics (2015). Section A – ELEMENTARY-SECONDARY EDUCATION INSTRUCTION PROGRAMS – PREKINDERGARTEN THROUGH GRADE 12 Line 1. Instruction (1000). Total current operation expenditure foractivities dealing with the interaction of teachers and students in theclassroom, home, or hospital as well as co-curricular activities. Reportamounts for activities of teachers and instructional aides or assistants engaged in regular instruction, special education, and vocational education programs. Exclude adult education programs (report on line 13). Line 2. Pupil support (2100). Report expenditures for administrative,guidance, health, and logistical support that enhance instruction.Include attendance, social work, student accounting, counseling,student appraisal, information, record maintenance, and placementservices. Also include medical, dental, nursing, psychological, andspeech services. Line 3. Instructional staff support (2200). Include expenditures forsupervision of instruction service improvements, curriculum development,instructional staff training, academic assessment, and media, library, andinstruction-related technology services. Line 4. General administration (2300). Expenditure for board ofeducation and executive administration (office of the superintendent)services. Line 5. School administration (2400). Report expenditure for the office of the principal services. Line 6. Operation and maintenance of plant (2600). Expenditure forbuildings services (heating, electricity, air conditioning, property insurance), care and upkeep of grounds and equipment, nonstudenttransportation vehicle operation and maintenance, and security services. Line 7. Student transportation (2700). Report expenditure for vehicleoperation, monitoring riders, and vehicle servicing and maintenance. Line 8. Business/central/other support services (2500 and 2900).Include business support expenditures for fiscal services (budgeting,receiving and disbursing funds, payroll, internal auditing, andaccounting), purchasing, warehousing, supply distribution, printing,publishing, and duplicating services. Also include central supportexpenditures for planning, research and development, evaluation,information, management services, and expenditures for other supportservices not included on lines 2 through 7. Report in Part IX, line 15(support service expenditures, nonspecified) any item that cannot bereported because it covers more than one of the items on lines 2 through 8, such as "total support services" not broken down by function. Section B – ELEMENTARY-SECONDARY NONINSTRUCTIONAL PROGRAMS Line 9. Food services (3100). Gross expenditure for cafeteria operations to include the purchase of food but excluding the value of donated commodities and purchase of food service equipment (reportequipment in Part III-4).
Line 10. Enterprise operations (3200). Include expenditure for business-like activities (such as a bookstore) where the costs are recouped largely with user charges. Line 11. Other. Report the expenditure for other elementary-secondary non-instructional activities not related to food services or enterpriseoperations. Nonenterprise student activities should be included with"instruction" on line 1. Section C – NONELEMENTARY-SECONDARY PROGRAMS Line 12. Community services (3300). Include any local educationagency expenditure for providing noneducation services such as, operationof a swimming pool, public library, programs for the elderly, and child care centers. Line 13. Adult education. Expenditures for basic adult education classes, such as GED or high school equivalency. Post-secondaryprograms for adults should be reported on line 14. Line 14. Other. All other nonelementary-secondary programs such as any post-secondary programs for adults. Nonpublic school programexpenditures should also be reported here - payments made directly toprivate schools should be reported in Parts II-A and II-B, as well as Part X, line 1 of this form, but include all other payments associated withnonpublic school programs (e.g., payments made to private businessesfor the transportation of nonpublic school students) here. Part III – CAPITAL OUTLAY EXPENDITURES Include expenditures for construction of fixed assets (line 1);purchasing fixed assets including land and existing buildings andgrounds (line 2); and equipment (lines 3 and 4). Instructional equipment(line 3) consists of all equipment (or capital outlay) recorded in generaland operating funds under "instruction" – function code 1000. Report in Part IX the amount of any equipment expenditure that cannot bebroken down into the categories of "instructional" and "other equipment."
Part IV – OTHER EXPENDITURES BY LOCAL EDUCATION AGENCY
Line 1. Payments to other school systems. Report payments toin-state and out-of-state public school systems for tuition, transportation,computer and purchasing services, etc. Payments made to dependentschool systems or to parent governments of dependent school systemsshould be included here. Please only report applicable portions of objectcodes 562, 566, and 567 here. Amounts for private or charter schools utilizing these object codes should be reported in either Part X, Line 1 or Part X, Line 2. Lines 2 and 3. Report payments to state and local governments, including repayments of loans. Also include debt service payments to state and localgovernments and school building authorities that incur debt instead of theschool system. Report amounts for tuition to post-secondary institutionsoperated by state governments on line 2. Report amounts for tuition for tuition to post-secondary institutions operated by local governments on line 3. Line 4. Interest on school system debt. Expenditure for interest incurred on both long-term and short-term indebtedness of the schoolsystem. Exclude principal payments, which should be reported in Part VI. Part V – STATE PAYMENTS ON BEHALF OF THE LOCAL EDUCATION AGENCY Include state payments that benefit the local education agency but which are not paid directly. Report on line 1 amounts transferred by the state into state teacher or public employee retirement funds. Also include otheremployee benefit transfers, such as health, life, or unemploymentcompensation insurance payments. Include on line 2 any other payments on behalf of the school system, such as for the purchase of textbooks or school buses purchased by the state and given to the local education agency. Part VI – DEBT Report in section A bonded indebtedness and any other school district interest-bearing debt with a term of more than one year. Include general obligation bonds, revenue bonds, refunding bonds, and certificates ofparticipation. Do not include lease purchase agreements, compensatedabsences, accounts payable, or any noninterest-bearing obligations.Report in section B interest-bearing tax anticipation and bond anticipationnote balances and other short-term debt with a term of one year or less. Part VII – CASH AND INVESTMENTS HELD AT END OF FISCAL YEAR Report the total amount of cash on hand and on deposit and investments infederal government, federal agency, state and local government andnongovernment securities. Report all investments at market value. Excludeaccounts receivable, value of real property, and all nonsecurity assets.
Part VIII – FALL MEMBERSHIP – OCTOBER, 2018 Include an unduplicated head count of pupils enrolled in the school system on the closest date to October 1, 2018 as possible. Include pupilstransferred into the school system and exclude pupils transferred out. Alsoexclude pupils attending private schools. You do not have to report any information in this part if you report the same information in the National Center for Education Statistics’ Common Core of Data Local Education AgencyUniverse Survey.
CONTINUE ON PAGE 8
FORM F-33 (12-17-2019) Page 7

Part IX – SPECIAL PROCESSING ITEMS These are special use items. Amounts should only be reported in this partif all pertinent financial data cannot be reported in Parts I through VIII.Before entering data in this part, please contact the Educational FinanceBranch of the U.S. Census Bureau at 1–800–622–6193 or [email protected] 1. Student fees, nonspecified. Report here any item in your chartof accounts that cannot be crosswalked into the items identified in Part I,Lines 9 (tuition), 10 (transportation), 11 (textbook sales), 12 (school foodservice sales), or 13 (district activities). An example would be total studentfees not broken down into these separate categories. Line 2. Census local, NCES state revenue. This category is reserved for any tax item classified as local by the U.S. Census Bureau and as state by the National Center for Education Statistics. Line 3. Census state, NCES local revenue. This category is reserved for any tax item classified as state by the U.S. Census Bureau and as local by the National Center for Education Statistics. Line 4. State revenue, nonspecified. Report here any item in your chartof accounts that cannot be crosswalked into the items identified in Part I-B,lines 1 through 11. An example would be total state revenue not broken down into separate state aid programs. Line 5. Federal revenue, nonspecified. Report here any item in yourchart of accounts that cannot be crosswalked into the items identified in Part I-C, lines 1 through 8, and Part I-D, lines 1 through 3. An examplewould be total federal aid not broken down into separate federal grant programs. Line 6. State payment on behalf of the LEA, instruction. Reportexpenditures from the revenues reported in Part V, lines 1 and 2, that were made for instruction. See definition for Part II-A, line 1. Line 7. State payment on behalf of the LEA, pupil support services.This item consists of the actual or estimated expenditure from the revenues reported in Part V, line 1, for pupil support services. See definitions for Part II-A, line 2. Line 8. State payment on behalf of the LEA, instructional staff services. This item consists of the actual or estimated expenditure from the revenue reported in Part V, line 1, for instructional staff services. Seedefinitions for Part II-A, line 3. Line 9. State payment on behalf of the LEA, general administration. This item consists of the actual or estimated expenditure from the revenues reported in Part V, line 1, for generaladministration. See definitions for Part II-A, line 4.
Line 10. State payment on behalf of the LEA, school administration. This item consists of the actual or estimated expenditure from the revenues reported in Part V, line 1, for schooladministration. See definitions for Part II-A, line 5. Line 11. State payment on behalf of the LEA, operation and maintenance of plant. This item consists of the actual or estimated expenditure from the revenues reported in Part V, line 1, for operation andmaintenance of plant. See definitions for Part II-A, line 6. Line 12. State payment on behalf of the LEA, student transportation. This item consists of the actual or estimated expenditure from the revenues reported in Part V, line 1, for studenttransportation. See definitions for Part II-A, line 7. Line 13. State payment on behalf of the LEA, business/ central/other. This item consists of the actual or estimated expenditure from the revenues reported in Part V, line 1, for business, central andother support services. See definitions for Part II-A, line 8. Line 14. State payment on behalf of the LEA, other. Reportexpenditures from the revenues reported in Part V, line 1, that were made for other than instruction or support services. See definitions for Part II-B.
Line 15. Support services, nonspecified. Report here any item inyour chart of accounts that cannot be crosswalked into the itemsidentified in Part II-A, lines 2 through 8.
Line 16. Equipment expenditure, nonspecified. Report here any itemin your chart of accounts that cannot be crosswalked into the itemsidentified in Part III, line 3 (instructional equipment) or line 4 (otherequipment). An example would be total equipment not broken down byfunction. Line 17. Own retirement system transfer, instruction. If the school system administers its own employee retirement fund (rather than participating in a state government retirement system), please report theemployer contribution for instructional employees. Line 18. Own retirement system transfer, support services. If the school system administers its own employee retirement fund (rather than participating in a state government retirement system), please report theemployer contribution for support services and other noninstructionalemployees.
Line 19. Federal revenue on behalf of school system. Report any item in your chart of accounts identified as received through federal payments made on behalf of the school system.
Line 20. State payment on behalf of the LEA, instructional nonbenefits. Report expenditures from the revenues reported in Part V, line 2, that were made for instruction. See definition for Part II-A, line 1.
Line 21. State payment on behalf of the LEA, support services nonbenefits. Report expenditures from the revenues reported in Part V, line 2, that were made for support services. See definitions for Part II-A, lines 2 through 8. Line 22. State payment on behalf of the LEA, noninstructional programs nonbenefits. Report expenditures from the revenues reportedin Part V, line 2, that were made for noninstructional programs. See definitions for Part II-B. Line 23. State payment on behalf of the LEA, nonelementary-secondary programs. Report expenditures from the revenues reported in Part V, lines 1 and 2, that were made for nonelementary-secondary programs. See definitions for Part II-C.
Line 24. State payment on behalf of the LEA, capital outlay. Reportexpenditures from the revenues reported in Part V, line 2, that were made for capital outlay. See definitions for Part III. Part X – EXHIBITS OF SELECTED ITEMS REPORTED ABOVE IN II-A, II-B, AND III
Line 1. Payments to private schools (objects 563, 566). Report allexpenditures to private schools for tuition and for any other purpose.These payments will be deducted from the amounts reported in Parts II-Aand II-B when calculating per pupil expenditures for the school system.The fall membership count of students supported by public school moneybut attending private schools should be excluded from the fallmembership reported in Part VIII. Identify in the remarks section theexpenditure functions for which the private school payment was made, if possible. If no information is provided, this amount will be deducted frominstruction expenditure reported in Part II-A1 when calculating per pupilexpenditures. Please only report applicable portions of object code 566here. Amounts for other public school systems should be reported in PartIV, Line 1. Line 2. Payments to charter schools (objects 562, 564, 567).Indicate in the remarks section whether fall membership counts ofstudents attending charter schools are included in the school system’smembership reported in the National Center for Education Statistics’Common Core of Data Local Education Agency Universe Survey or in Part VIII of this form. Also identify in the remarks section the expenditurefunctions for which the charter school payment was made, if possible.This information will be used in determining per pupil expenditureamounts for the school system. Please only report applicable portions ofobject codes 562 and 567 here. Amounts for other public school systemsshould be reported in Part IV, Line 1.
Line 3. Total salaries and wages. Enter the total expenditure for allsalaries and wages paid by the local education agency during the fiscalyear. Include both here and in Part II-A, column 1, gross salaries withoutdeduction of withholdings for income tax, employee contributions toSocial Security and retirement coverage, etc. Do not include employerpaid employee benefits in these figures. The total entered for salaries andwages should at least be equal to the sum of the entries made in Part II-A,column 1, and be larger if the local education agency paid salaries forenterprise operations and for nonelementary-secondary programactivities. Line 4. Total employee benefit payments. Enter the total expenditurefor all employee benefits paid by the local education agency during thefiscal year. Include both here and in Part II-A, column 2, the employershare of state or local employee retirement contributions, social securitycontributions, group life and health insurance, unemployment andworker’s compensation, and any tuition reimbursements. Exclude (andreport in Part V) state payments made on behalf of the local education agency. The total entered for employee benefits should at least be equalto the sum of the entries made in Part II-A, column 2, and be larger if thelocal education agency paid employee benefits fornonelementary-secondary program activities. Lines 5–8. Teacher salaries. Report base salaries paid to certifiedteachers (object 111) and certified substitute teachers (object 113). Do notinclude salaries paid to instructional aides or assistants. Report salaries paid for regular programs (program 100) on line 5, special education programs (program 200) on line 6, vocational programs (program 300) on line 7, and other programs (programs 400, 900) on line 8. These amounts should also be included with the instruction salaries and total instruction amounts reported in Part II-A.
Line 9. Textbooks. Report expenditures for textbooks used for classroominstruction (object 640, function 1000).
CONTINUE ON PAGE 9
Page 8 FORM F-33 (12-17-2019)

Line 10. Utilities and energy services (objects 410, 620 – function 2600). Report expenditures for utility services (object 410), such as water and sewerage services, and energy expenditures (object 620), such as gas, oil, coal, and gasoline. Services received from public or private utilitycompanies should also be included here. Exclude expenditures fortelephone or internet services.
Line 11. Technology-related supplies and purchased services(objects 351, 352, 432, 443, 530, 650 – ALL functions). Reportexpenditures for supplies and purchased services that are technology-related. For technology-related supplies, include expenditures on supplies that are typically used in conjunction with technology-related hardware or software (e.g., compact discs, flash drives, cables, andmonitor stands). Technology-related hardware and software costs belowthe capitalization threshold (e.g., laptop, Kindle, and iPad costs that fallbelow the capitalization threshold) should also be reported here.
For technology-related purchased services, include expenditures on data processing, coding, and other technical services; repairs andmaintenance services for technology equipment that are not directly provided by school district personnel; and rentals or leases of computersand related equipment. Purchased communications services, such as all costs associated with voice, data (i.e., Internet), and videocommunications charges should also be reported here.
Expenditures for technology-related equipment should not be reportedhere, butinstead be reported in the “Technology-related equipment”category (Part X, line 12).
Line 12. Technology-related equipment (objects 734, 735 – ALL functions). Report expenditures for technology-related hardwareand software used for educational or administrative purposes that exceedthe capitalization threshold. Include purchases of network equipment,servers, personal computers, printers, scanners, other peripherals, andother electronic devices. Do not include expenditures fornontechnology-related equipment such as machinery (object 731),vehicles (object 732), and furniture (object 733). Expenditures fortechnology-related supplies should not be reported here, but instead bereported in the “Technology-related supplies and purchased services”category (Part X, line 11).
Line 13. RESA current expenditures on behalf of the LEA (objects100-600, 810, 820, and 890 for functions 1000, 2000, 3100, and3200). Report current expenditures made by regional education serviceagencies (RESAs) and other specialized service agencies (e.g.,supervisory unions) that benefit this local education agency (LEA). If a RESA (or other specialized service agency) provides services to multipleLEAs, only include current expenditures that benefit this specific LEA.Include current expenditures made by RESAs corresponding to column(3) of Part II – Sections A and B of this form; exclude other expenditures such as nonelementary-secondary (e.g., community services, adulteducation) and capital outlay expenditures. To avoid duplication, do notinclude current expenditures made by RESAs on behalf of this LEA here if those expenditures are already reported by this LEA in Part II – Sections A and B of this form.
Part XI – ESSA: CURRENT EXPENDITURES BY FUND TYPE
Line 1. Current expenditures for elementary-secondary educationprograms paid from state and local funds, excluding privatefunds, and including current expenditures paid from federal fundsintended to replace local tax revenues (objects 100-600, 810,820, and 890 for functions 1000, 2000, 3100, and 3200 - state funds, local funds, and federal funds intended to replace local tax revenues only, excluding private funds) Report all currentexpenditures for the LEA paid from state and local funds, includingfederal funds intended to replace local tax revenues. Include both current expenditures paid directly by the LEA from state and local funds andexpenditures paid by the state on behalf of the LEA. Exclude current expenditures for the LEA paid from federal funds, current expenditurespaid from private funds, and state and local fund payments to charterschools outside the LEA and to private schools. Also exclude any stateand local fund payments to other school districts. This amount should beequal to the sum of all state and local fund expenditures reported incolumn (3) of Part II -Sections A and B of this form, less state and localfund payments to charter schools outside the LEA and to private schools.
Line 2. Current expenditures for elementary-secondary educationprograms paid from federal funds, excluding federal fundsintended to replace local tax revenues (objects 100-600, 810,820, and 890 for functions 1000, 2000, 3100, and 3200 - federal funds only, excluding federal funds intended to replace local taxrevenues) Report all current expenditures for the LEA paid from federalfunds, excluding federal funds intended to replace local tax revenues. Include current expenditures paid directly by the LEA from federal funds,excluding federal funds intended to replace local tax revenues. Exclude current expenditures for the LEA from state and local funds, as well as federal fund payments to charter schools outside the LEA and to privateschools. Also exclude any state and local fund payments to other schooldistricts. This amount should be equal to the sum of all federal fund expenditures reported in column (3) of Part II - Sections A and B of this form, less federal fund payments to charter schools outside the LEA andto private schools.
FORM F-33 (12-17-2019) Page 9