DNA microarray technology for the microbiologist: an overview
19
MINI-REVIEW DNA microarray technology for the microbiologist: an overview Armin Ehrenreich Received: 11 July 2006 /Revised: 11 July 2006 /Accepted: 11 July 2006 / Published online: 17 October 2006 # Springer-Verlag 2006 Abstract DNA microarrays have found widespread use as a flexible tool to investigate bacterial metabolism. Their main advantage is the comprehensive data they produce on the transcriptional response of the whole genome to an environmental or genetic stimulus. This allows the micro- biologist to monitor metabolism and to define stimulons and regulons. Other fields of application are the identifica- tion of microorganisms or the comparison of genomes. The importance of this technology increases with the number of sequenced genomes and the falling prices for equipment and oligonucleotides. Knowledge of DNA microarrays is of rising relevance for many areas in microbiological research. Much literature has been published on various specific aspects of this technique that can be daunting to the casual user and beginner. This article offers a comprehensive outline of microarray technology for transcription analysis in microbiology. It shortly discusses the types of DNA microarrays available, the printing of custom arrays, common labeling strategies for targets, hybridization, scanning, normalization, and clustering of expression data. Introduction DNA microarrays are a powerful tool for the investigation of various aspects of prokaryotic biology because they allow the simultaneous monitoring of the expression of all genes in any bacterium. They offer a more holistic approach to study cellular physiology and therefore complement the traditional “gene-by-gene” approaches (Wildsmith and Elcock 2001). Because the term DNA microarray was coined in publications from the laboratory of DeRisi et al. (1996) and Schena et al. (1995), this technique evolved from a very specialized method that is only available to few people (Bowtell 1999; Cheung et al. 1999; DeRisi et al. 1997; Lashkari et al. 1997) to a common tool with many different applications that became important in microbiology (Dharmadi and Gonzalez 2004). There are several other types of microarrays, like protein microarrays, but the DNA microarray is by far the most widespread and will simply be termed microarray in this review. The essence of microarray technology is the parallel hybridization of a mixture of labeled nucleic acids called target, with thousands of individual nucleic acid species called probes, that can be identified by their spatial position in a single experiment. The location of a specific probe on the array is termed spot or feature. Whereas the probes are immobilized on a solid support, the targets are applied as a solution onto the array for hybridization after fluorescent labeling (Brown and Botstein 1999). The nomenclature of probes and targets sometimes got mixed up in literature, but the definition used in this review was given in a special issue of nature genetics (Phimister 1999) and is now commonly agreed upon. Transcription analysis with microarrays is a complex process. Figure 1 gives a brief overview on the steps involved and discussed in this review. Much literature has been published on specific aspects, but the complexity of the topic and the amount of literature are sometimes daunting to the people starting to approach the topic. This review wants to give an overview and explain the major applications of DNA microarrays in microbiology. It tries to clarify important points, but will not go into special experimental approaches, details of equipment, or advanced statistical methods that are not commonly used in microbiology. Appl Microbiol Biotechnol (2006) 73:255–273 DOI 10.1007/s00253-006-0584-2 A. Ehrenreich (*) Institute of Microbiology and Genetics, Georg August University, 37077 Göttingen, Germany e-mail: [email protected]
-
Upload
independent -
Category
Documents
-
view
0 -
download
0
Transcript of DNA microarray technology for the microbiologist: an overview
MINI-REVIEW
DNA microarray technology for the microbiologist:an overview
Armin Ehrenreich
Received: 11 July 2006 /Revised: 11 July 2006 /Accepted: 11 July 2006 / Published online: 17 October 2006# Springer-Verlag 2006
Abstract DNA microarrays have found widespread use asa flexible tool to investigate bacterial metabolism. Theirmain advantage is the comprehensive data they produce onthe transcriptional response of the whole genome to anenvironmental or genetic stimulus. This allows the micro-biologist to monitor metabolism and to define stimulonsand regulons. Other fields of application are the identifica-tion of microorganisms or the comparison of genomes. Theimportance of this technology increases with the number ofsequenced genomes and the falling prices for equipmentand oligonucleotides. Knowledge of DNA microarrays is ofrising relevance for many areas in microbiological research.Much literature has been published on various specificaspects of this technique that can be daunting to the casualuser and beginner. This article offers a comprehensiveoutline of microarray technology for transcription analysisin microbiology. It shortly discusses the types of DNAmicroarrays available, the printing of custom arrays,common labeling strategies for targets, hybridization,scanning, normalization, and clustering of expression data.
Introduction
DNA microarrays are a powerful tool for the investigationof various aspects of prokaryotic biology because theyallow the simultaneous monitoring of the expression of allgenes in any bacterium. They offer a more holisticapproach to study cellular physiology and thereforecomplement the traditional “gene-by-gene” approaches
(Wildsmith and Elcock 2001). Because the term DNAmicroarray was coined in publications from the laboratoryof DeRisi et al. (1996) and Schena et al. (1995), thistechnique evolved from a very specialized method that isonly available to few people (Bowtell 1999; Cheung et al.1999; DeRisi et al. 1997; Lashkari et al. 1997) to a commontool with many different applications that became importantin microbiology (Dharmadi and Gonzalez 2004). There areseveral other types of microarrays, like protein microarrays,but the DNA microarray is by far the most widespread andwill simply be termed microarray in this review.
The essence of microarray technology is the parallelhybridization of a mixture of labeled nucleic acids calledtarget, with thousands of individual nucleic acid speciescalled probes, that can be identified by their spatial positionin a single experiment. The location of a specific probe onthe array is termed spot or feature. Whereas the probes areimmobilized on a solid support, the targets are applied as asolution onto the array for hybridization after fluorescentlabeling (Brown and Botstein 1999). The nomenclature ofprobes and targets sometimes got mixed up in literature,but the definition used in this review was given in aspecial issue of nature genetics (Phimister 1999) and isnow commonly agreed upon. Transcription analysis withmicroarrays is a complex process. Figure 1 gives a briefoverview on the steps involved and discussed in thisreview. Much literature has been published on specificaspects, but the complexity of the topic and the amount ofliterature are sometimes daunting to the people starting toapproach the topic. This review wants to give an overviewand explain the major applications of DNA microarrays inmicrobiology. It tries to clarify important points, but willnot go into special experimental approaches, details ofequipment, or advanced statistical methods that are notcommonly used in microbiology.
Appl Microbiol Biotechnol (2006) 73:255–273DOI 10.1007/s00253-006-0584-2
A. Ehrenreich (*)Institute of Microbiology and Genetics, Georg August University,37077 Göttingen, Germanye-mail: [email protected]

Types of DNA microarrays
Microarrays evolved from Southern blots (Southern 1975,2001), colony filters (Nguyen et al. 1995), to dot blots(Kafatos et al. 1979). “DNA macroarrays” or “filterarrays”were made in a next step of miniaturization by usingrobotic devices for spotting thousands of probes on a nylonmembrane. This number was already enough to probe eachgene of a bacterial genome. The targets were labeledradioactively (Granjeaud et al. 1999), thereby allowing onlyone hybridization at a time. The disadvantage of so-calledone-channel experiments is that the variance of each singlearray is affecting the final expression ratios. This problemwas solved by two-channel experiments in which twomRNA populations are labeled with different fluorescentdyes and are hybridized simultaneously on one array. Glassslides are commonly used as support because of their lowbackground fluorescence (Schena et al. 1995, 1996).Moreover, the rigid glass slides allow much higher probedensity than the flexible membranes of macroarrays,thereby reducing the amount of target required. Addition-ally, glass allows covalent linkage of DNA to the surfaceand is inert to high ionic strength washing and hightemperature.
There are three main types of DNA microarrays inwidespread use: (1) microarrays where the probes are
synthesized in situ directly onto the surface of the chip.The further two types have in common that independentsynthesized probes are printed on special glass slides.According to the nature of the probe, they can be classifiedas (2) double-stranded DNA microarrays and (3) oligonu-cleotide DNA microarrays.
Affymetrix GeneChips The most prominent microarrayswith in situ synthesized probes are the GeneChips manu-factured by Affymetrix (Santa Clara, CA, USA). They areproduced by chemical synthesis of the oligonucleotidesdirectly on the coated quartz surface of the array (Hughes etal. 2001; Lipshutz et al. 1999; Lockhart et al. 1996;Warrington et al. 2000). This technology allows very highfeature densities. It is typical to have 400,000 features on acommercial array (Lander 1999; Ramsay 1998). Therefore,they are called high-density oligonucleotide arrays. Gene-Chips are produced in a unique photolithographic processanalogous to the methods used for production of micro-electronics chips in combination with chemical reactionsdeveloped for combinatorial chemistry (Fodor et al. 1991).A quartz wafer is coated with a narrow layer of a light-sensitive compound. This coating prevents the covalentcoupling of an activated nucleotide. Exposure to lightcauses the removal of the chemical protection groups fromthe surface. Subsequently applied reactive derivates of
sample 1 sample 2
extract totalRNA
label RNA usingfluorescent dyes
scan flourescencesignal
image analysis
PCR amplifyprobes
annotated genomic structure
spotting the PCRproducts
hybridize labeledtargets
raw images ofeach channel
a Image analysis: Placementof feature indicators and
quantification of flourescencedata
Background correction andquality filtering
Data normalization
Data transformation
Testing for differential geneexpression
Cluster analysis orbiological interpretation
Data storage in localor public databases
b
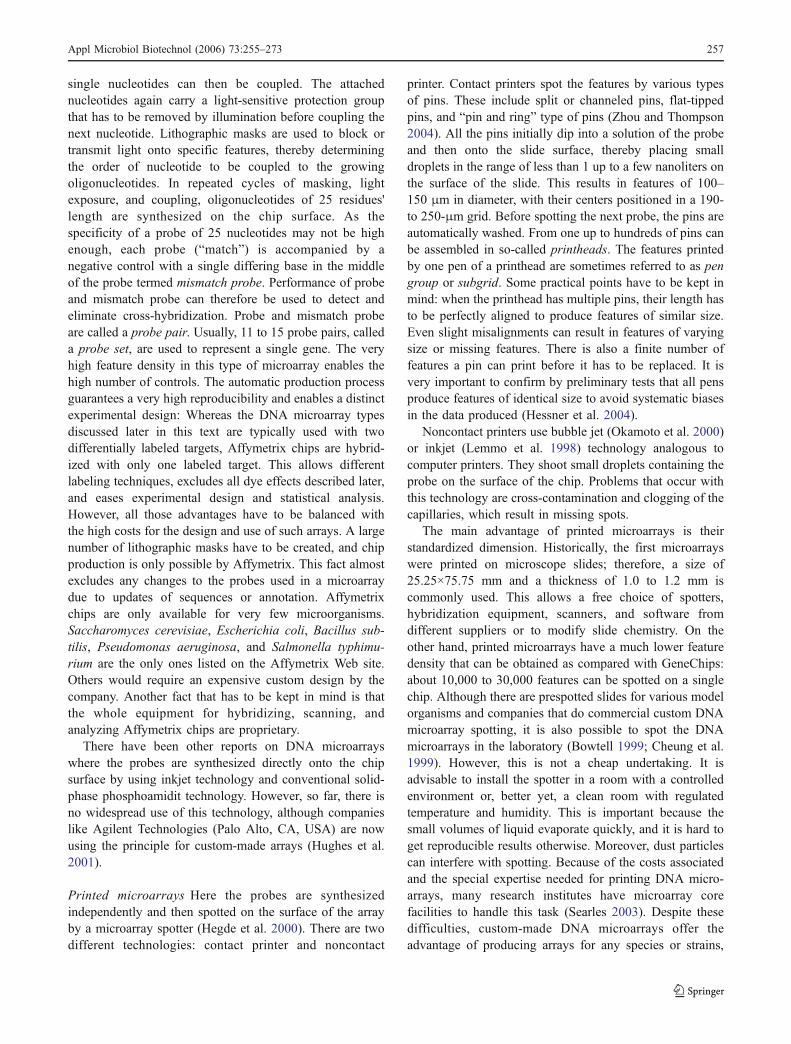
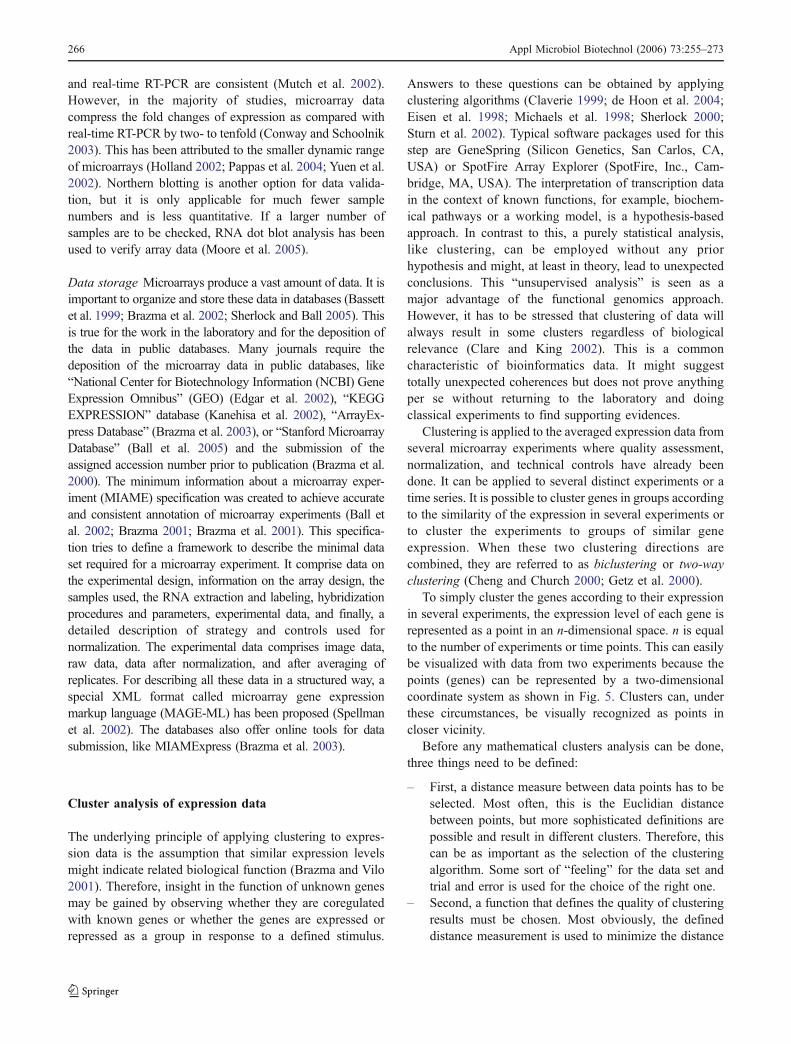
Fig. 1 Main steps in transcription analysis with microarrays. a Probes aregenerated from an annotated genome sequence and spotted on amicroarray slide. For target preparation, RNA is extracted from twoexperimental conditions and labeled with fluorescent dyes by reversetranscription. The labeled target is then hybridized with the array, and the
fluorescence of the features is determined using an array scanner. b Afterimage analysis, quality filtering, data transformation, and normalizationare done. The remaining steps are dependent on the experiment, but inmost cases, the data are tested for different gene expression, clustered,and finally stored in a database
256 Appl Microbiol Biotechnol (2006) 73:255–273
single nucleotides can then be coupled. The attachednucleotides again carry a light-sensitive protection groupthat has to be removed by illumination before coupling thenext nucleotide. Lithographic masks are used to block ortransmit light onto specific features, thereby determiningthe order of nucleotide to be coupled to the growingoligonucleotides. In repeated cycles of masking, lightexposure, and coupling, oligonucleotides of 25 residues'length are synthesized on the chip surface. As thespecificity of a probe of 25 nucleotides may not be highenough, each probe (“match”) is accompanied by anegative control with a single differing base in the middleof the probe termed mismatch probe. Performance of probeand mismatch probe can therefore be used to detect andeliminate cross-hybridization. Probe and mismatch probeare called a probe pair. Usually, 11 to 15 probe pairs, calleda probe set, are used to represent a single gene. The veryhigh feature density in this type of microarray enables thehigh number of controls. The automatic production processguarantees a very high reproducibility and enables a distinctexperimental design: Whereas the DNA microarray typesdiscussed later in this text are typically used with twodifferentially labeled targets, Affymetrix chips are hybrid-ized with only one labeled target. This allows differentlabeling techniques, excludes all dye effects described later,and eases experimental design and statistical analysis.However, all those advantages have to be balanced withthe high costs for the design and use of such arrays. A largenumber of lithographic masks have to be created, and chipproduction is only possible by Affymetrix. This fact almostexcludes any changes to the probes used in a microarraydue to updates of sequences or annotation. Affymetrixchips are only available for very few microorganisms.Saccharomyces cerevisiae, Escherichia coli, Bacillus sub-tilis, Pseudomonas aeruginosa, and Salmonella typhimu-rium are the only ones listed on the Affymetrix Web site.Others would require an expensive custom design by thecompany. Another fact that has to be kept in mind is thatthe whole equipment for hybridizing, scanning, andanalyzing Affymetrix chips are proprietary.
There have been other reports on DNA microarrayswhere the probes are synthesized directly onto the chipsurface by using inkjet technology and conventional solid-phase phosphoamidit technology. However, so far, there isno widespread use of this technology, although companieslike Agilent Technologies (Palo Alto, CA, USA) are nowusing the principle for custom-made arrays (Hughes et al.2001).
Printed microarrays Here the probes are synthesizedindependently and then spotted on the surface of the arrayby a microarray spotter (Hegde et al. 2000). There are twodifferent technologies: contact printer and noncontact
printer. Contact printers spot the features by various typesof pins. These include split or channeled pins, flat-tippedpins, and “pin and ring” type of pins (Zhou and Thompson2004). All the pins initially dip into a solution of the probeand then onto the slide surface, thereby placing smalldroplets in the range of less than 1 up to a few nanoliters onthe surface of the slide. This results in features of 100–150 μm in diameter, with their centers positioned in a 190-to 250-μm grid. Before spotting the next probe, the pins areautomatically washed. From one up to hundreds of pins canbe assembled in so-called printheads. The features printedby one pen of a printhead are sometimes referred to as pengroup or subgrid. Some practical points have to be kept inmind: when the printhead has multiple pins, their length hasto be perfectly aligned to produce features of similar size.Even slight misalignments can result in features of varyingsize or missing features. There is also a finite number offeatures a pin can print before it has to be replaced. It isvery important to confirm by preliminary tests that all pensproduce features of identical size to avoid systematic biasesin the data produced (Hessner et al. 2004).
Noncontact printers use bubble jet (Okamoto et al. 2000)or inkjet (Lemmo et al. 1998) technology analogous tocomputer printers. They shoot small droplets containing theprobe on the surface of the chip. Problems that occur withthis technology are cross-contamination and clogging of thecapillaries, which result in missing spots.
The main advantage of printed microarrays is theirstandardized dimension. Historically, the first microarrayswere printed on microscope slides; therefore, a size of25.25×75.75 mm and a thickness of 1.0 to 1.2 mm iscommonly used. This allows a free choice of spotters,hybridization equipment, scanners, and software fromdifferent suppliers or to modify slide chemistry. On theother hand, printed microarrays have a much lower featuredensity that can be obtained as compared with GeneChips:about 10,000 to 30,000 features can be spotted on a singlechip. Although there are prespotted slides for various modelorganisms and companies that do commercial custom DNAmicroarray spotting, it is also possible to spot the DNAmicroarrays in the laboratory (Bowtell 1999; Cheung et al.1999). However, this is not a cheap undertaking. It isadvisable to install the spotter in a room with a controlledenvironment or, better yet, a clean room with regulatedtemperature and humidity. This is important because thesmall volumes of liquid evaporate quickly, and it is hard toget reproducible results otherwise. Moreover, dust particlescan interfere with spotting. Because of the costs associatedand the special expertise needed for printing DNA micro-arrays, many research institutes have microarray corefacilities to handle this task (Searles 2003). Despite thesedifficulties, custom-made DNA microarrays offer theadvantage of producing arrays for any species or strains,
Appl Microbiol Biotechnol (2006) 73:255–273 257

irrespective of commercial interests. Moreover, it ispossible to print varying numbers of arrays, change slidechemistry, quickly adjust to progress in annotation, excludeprobes for genes of no interest, or include probes of specificrelevance such as intergenic regions.
Double-stranded DNA microarrays There are two majortypes of probes that are used with DNA microarray printers:double-stranded DNA and oligonucleotides. Double-strandedDNA commonly results from polymerase chain reaction(PCR) amplification (Duggan et al. 1999). A 200- to 800-bplength of amplified DNA is recommended, but largerfragments of up to 1.3-kb length also work (Heller et al.1997). In typical microarray design, each probe DNAcorresponds to one gene. This represents the original typeof DNA microarrays where cDNA molecules from Arabi-dopsis thaliana were amplified by PCR and spotted(Schena et al. 1995). In prokaryotes, two specific primerstogether with chromosomal DNA as template are used toamplify genes or parts thereof. However, there are alsonumerous variations to this strategy. For example, clonesfrom a shotgun library that originates from a sequencingproject can be used as a template, thereby permitting theusage of shorter primers. Such clones allow the amplifica-tion of parts of the genes with only one specific primer.This way, it is possible to amplify about 80% of the genes
of a typical prokaryote with only one specific primer,thereby greatly reducing the costs. Moreover, it increasesthe accuracy because only the correct combination ofprimers and template results in a PCR product of theexpected size. Nevertheless, the generation of whole-genome DNA microarrays by high-throughput PCR ampli-fication is a very laborious and logistically demandingprocess. Extensive quality control by gel electrophoresis,purification of products, and repetition of dropout reactionsis necessary.
The double-stranded DNA is printed on slides withpositively charged coating (Aboytes et al. 2003). In mostcases, they are coated with poly-L-lysine or 3-aminopropyl-trimethoxysilane (APS). Spotting is typically done with a1:1 solution of purified PCR products at a final concentra-tion of 0.2 to 1 mg/ml and dimethylsulfoxide (DMSO)(Hegde et al. 2000). The DNA is bound to the slide surfaceby electrostatic interaction with the negatively chargedphosphate backbone of the nucleic acid as shown in Fig. 2a(Sanchez-Cortes et al. 2002). This also helps to separate thetwo strands of the double-stranded DNA. Additional bakingat approximately 80°C or UV cross-linking is thought tointroduce covalent links primarily of thymine residues inthe DNA to the amino groups of the slide surface (Reed andMann 1985; Saito et al. 1981). An additional blocking stepis required to prevent nonspecific interaction of the slide
NH3+
NH3+
NH3+
NH3+
--- - - -
NH3+
NH3+
NH3+
NH3+
--- - - -
NH3+
NH3+
NH3 NH3+--- - -
C HH
N H
CHO
NH2
C HHO
N H
a
b
H2O
Covalent couplingby UV or heat
Formation of Schiff base
Nucleophilic addition
electrostatic interaction
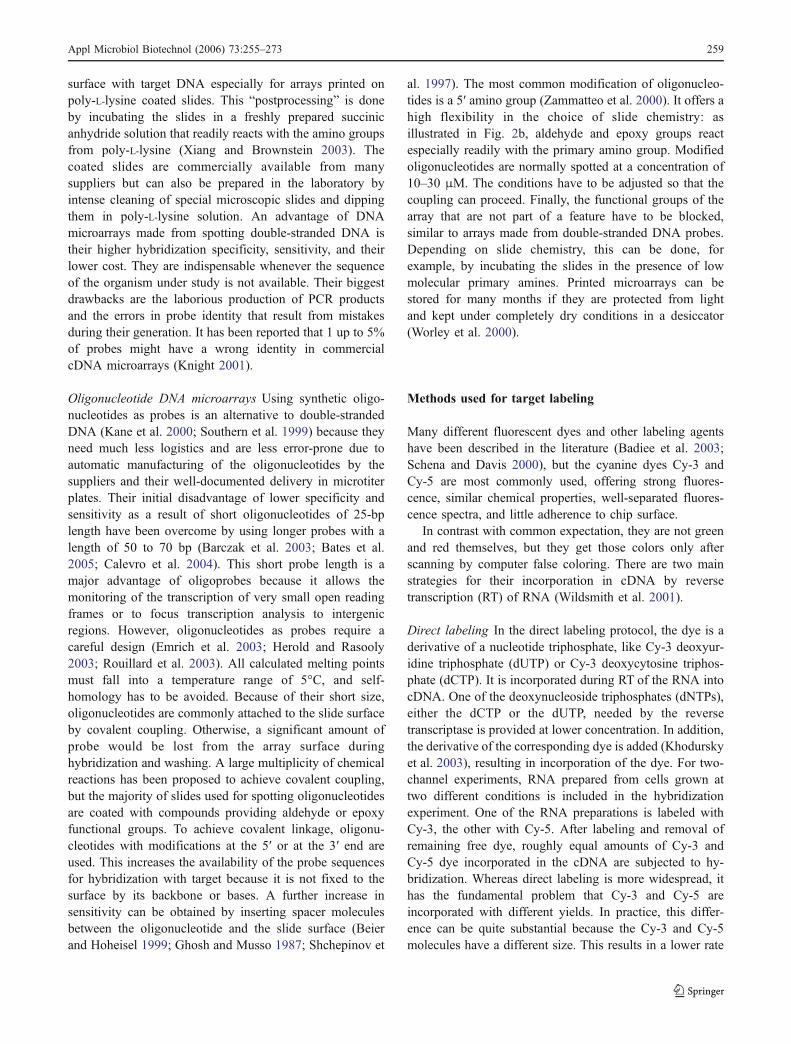
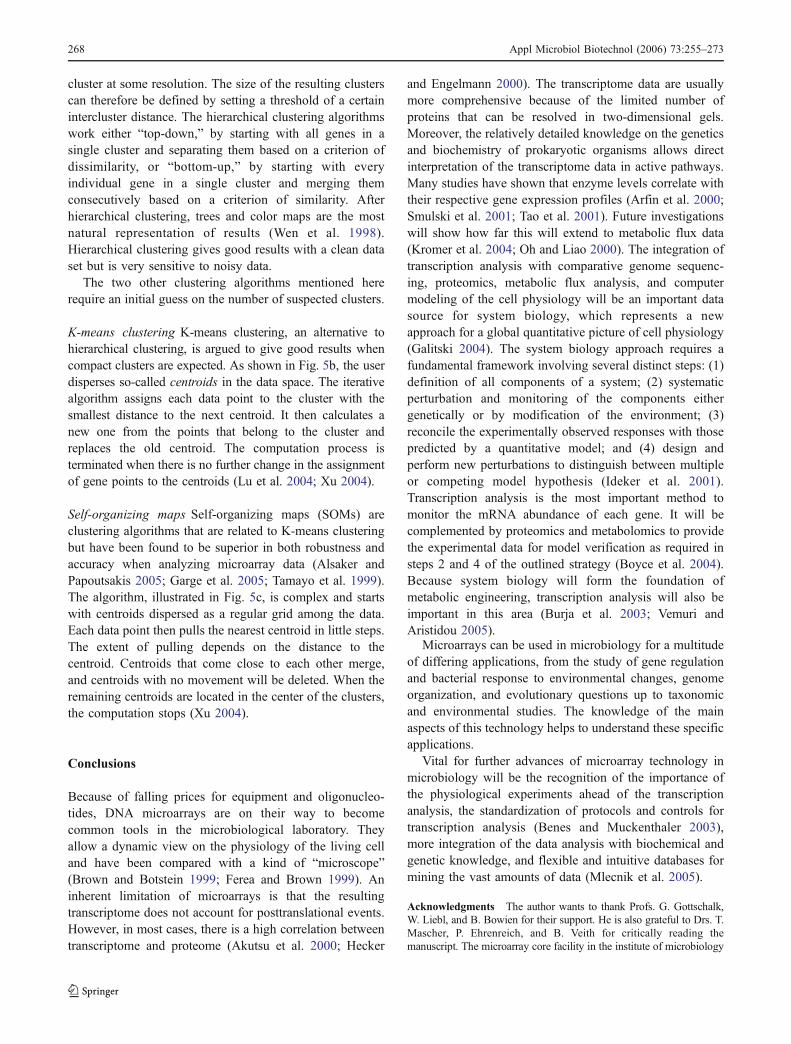
Fig. 2 Modes of probe immobilization on microarray slides. a Im-mobilization of double-stranded DNA on a slide coated with amino-silane. The negatively charged phosphate backbone is attached to thepositively charged slide surface by electrostatic interaction. Additional
covalent linkage is achieved by backing or UV irradiation. b Covalentattachment of oligonucleotides with a 5′ amino linker to a slide surfacethat exposes aldehyde groups
258 Appl Microbiol Biotechnol (2006) 73:255–273
surface with target DNA especially for arrays printed onpoly-L-lysine coated slides. This “postprocessing” is doneby incubating the slides in a freshly prepared succinicanhydride solution that readily reacts with the amino groupsfrom poly-L-lysine (Xiang and Brownstein 2003). Thecoated slides are commercially available from manysuppliers but can also be prepared in the laboratory byintense cleaning of special microscopic slides and dippingthem in poly-L-lysine solution. An advantage of DNAmicroarrays made from spotting double-stranded DNA istheir higher hybridization specificity, sensitivity, and theirlower cost. They are indispensable whenever the sequenceof the organism under study is not available. Their biggestdrawbacks are the laborious production of PCR productsand the errors in probe identity that result from mistakesduring their generation. It has been reported that 1 up to 5%of probes might have a wrong identity in commercialcDNA microarrays (Knight 2001).
Oligonucleotide DNA microarrays Using synthetic oligo-nucleotides as probes is an alternative to double-strandedDNA (Kane et al. 2000; Southern et al. 1999) because theyneed much less logistics and are less error-prone due toautomatic manufacturing of the oligonucleotides by thesuppliers and their well-documented delivery in microtiterplates. Their initial disadvantage of lower specificity andsensitivity as a result of short oligonucleotides of 25-bplength have been overcome by using longer probes with alength of 50 to 70 bp (Barczak et al. 2003; Bates et al.2005; Calevro et al. 2004). This short probe length is amajor advantage of oligoprobes because it allows themonitoring of the transcription of very small open readingframes or to focus transcription analysis to intergenicregions. However, oligonucleotides as probes require acareful design (Emrich et al. 2003; Herold and Rasooly2003; Rouillard et al. 2003). All calculated melting pointsmust fall into a temperature range of 5°C, and self-homology has to be avoided. Because of their short size,oligonucleotides are commonly attached to the slide surfaceby covalent coupling. Otherwise, a significant amount ofprobe would be lost from the array surface duringhybridization and washing. A large multiplicity of chemicalreactions has been proposed to achieve covalent coupling,but the majority of slides used for spotting oligonucleotidesare coated with compounds providing aldehyde or epoxyfunctional groups. To achieve covalent linkage, oligonu-cleotides with modifications at the 5′ or at the 3′ end areused. This increases the availability of the probe sequencesfor hybridization with target because it is not fixed to thesurface by its backbone or bases. A further increase insensitivity can be obtained by inserting spacer moleculesbetween the oligonucleotide and the slide surface (Beierand Hoheisel 1999; Ghosh and Musso 1987; Shchepinov et
al. 1997). The most common modification of oligonucleo-tides is a 5′ amino group (Zammatteo et al. 2000). It offers ahigh flexibility in the choice of slide chemistry: asillustrated in Fig. 2b, aldehyde and epoxy groups reactespecially readily with the primary amino group. Modifiedoligonucleotides are normally spotted at a concentration of10–30 μM. The conditions have to be adjusted so that thecoupling can proceed. Finally, the functional groups of thearray that are not part of a feature have to be blocked,similar to arrays made from double-stranded DNA probes.Depending on slide chemistry, this can be done, forexample, by incubating the slides in the presence of lowmolecular primary amines. Printed microarrays can bestored for many months if they are protected from lightand kept under completely dry conditions in a desiccator(Worley et al. 2000).
Methods used for target labeling
Many different fluorescent dyes and other labeling agentshave been described in the literature (Badiee et al. 2003;Schena and Davis 2000), but the cyanine dyes Cy-3 andCy-5 are most commonly used, offering strong fluores-cence, similar chemical properties, well-separated fluores-cence spectra, and little adherence to chip surface.
In contrast with common expectation, they are not greenand red themselves, but they get those colors only afterscanning by computer false coloring. There are two mainstrategies for their incorporation in cDNA by reversetranscription (RT) of RNA (Wildsmith et al. 2001).
Direct labeling In the direct labeling protocol, the dye is aderivative of a nucleotide triphosphate, like Cy-3 deoxyur-idine triphosphate (dUTP) or Cy-3 deoxycytosine triphos-phate (dCTP). It is incorporated during RT of the RNA intocDNA. One of the deoxynucleoside triphosphates (dNTPs),either the dCTP or the dUTP, needed by the reversetranscriptase is provided at lower concentration. In addition,the derivative of the corresponding dye is added (Khodurskyet al. 2003), resulting in incorporation of the dye. For two-channel experiments, RNA prepared from cells grown attwo different conditions is included in the hybridizationexperiment. One of the RNA preparations is labeled withCy-3, the other with Cy-5. After labeling and removal ofremaining free dye, roughly equal amounts of Cy-3 andCy-5 dye incorporated in the cDNA are subjected to hy-bridization. Whereas direct labeling is more widespread, ithas the fundamental problem that Cy-3 and Cy-5 areincorporated with different yields. In practice, this differ-ence can be quite substantial because the Cy-3 and Cy-5molecules have a different size. This results in a lower rate
Appl Microbiol Biotechnol (2006) 73:255–273 259
of integration of the Cy-5-modified nucleotide in cDNA ascompared with the Cy-3-modified one. This artificial biashas to be corrected by normalization to obtain relevantbiological data.
Indirect labeling To circumvent this major source of error, adifferent strategy of labeling called indirect labeling is used.In this case, both RNA preparations are reverse-transcribedto cDNA in the presence of an aminoallyl-modifieddUTP or dCTP, respectively. Since both preparations arelabeled with the same molecule, there is no bias.Additionally, this modification is much smaller than Cy dyesand, thus, better incorporated in the cDNA. In a second step,N-hydroxysuccinylimidyl ester (NHS ester) derivatives ofCy-3 or Cy-5 are coupled to the aminoallyl-modified cDNAmolecules by a chemical reaction that is far less sensitive tothe molecule size of the dye. The disadvantages of thisprotocol are the extreme moisture sensitivity of the NHSester–modified dyes and the requirement of significantlymore bench work. The often-stated advantage of requiringless RNA as starting material is neutralized by the losses dueto the two purification steps.
Labeling of genomic DNA Labeled genomic DNA is usedfor comparative genomic studies (Borucki et al. 2003; Chanet al. 2003; Salama et al. 2000) as a reference target innormalization or for slide quality control. The labeling isusually done by direct incorporation of Cy-3- or Cy-5-labeled nucleotides in a nick translation or by randompriming with the Klenow fragment of DNA polymerase.For the random priming, DNA fragments of 1- to 3-kb sizesare usually generated by sonication, nebulization, or bydigestion with restriction enzymes with a four-base recog-nition site, like AluI or Sau3AI. For a single hybridization,a labeling reaction contains 0.5–2 μg of genomic DNA(Amon and Ivanov 2003; Ye et al. 2001).
Target preparation A specific problem of working withprokaryotic organisms is that there are no widely adoptedprotocols for selectively labeling the mRNA. Whereas themRNA of eukaryotic organisms has a poly(A) tail that canbe utilized to specifically label mRNA with oligo(dT)primers, prokaryotic mRNA lacks the poly(A) tails, andrandom priming either with hexamers or nonamers has to beused. Therefore, only total RNA can be labeled. But only 4%of the total RNA is mRNA, the rest being mainly rRNA andtRNA (Neidhard et al. 1990; Talaat et al. 2000). The largeamount of labeled RNA results in a higher background inDNA microarray experiments with prokaryotic organismsand requires a substantial higher amount of total RNA to beadded to the labeling reaction. Although lower numbershave been published for certain protocols, as a rule ofthumb, 20 to 25 μg of total RNA have to be included in a
labeling reaction of a prokaryotic organism whereas only 2to 5 μg of total RNA are needed for a eukaryote (Duggan etal. 1999). Numerous attempts to circumvent this problemhave been published such as preparation of polyadenylatedmRNA from prokaryotes (Wendisch et al. 2001) or primingwith a primer set that has a higher probability of primingthe RT of mRNA than of rRNA (Talaat et al. 2000).However, none of them has been widely adopted. Anadditional major problem when working with prokaryoticmRNA as compared with eukaryotic mRNA is its distinctinstability. Prokaryotic mRNA only has a half-life in therange of 40 s to 20 min for individual transcripts (Kushner1996). The average, as measured with isotopic labeling, isaround 1 min (Baracchini and Bremer 1987; Neidhard et al.1990), whereas microarray experiments indicate that 80%of E. coli transcripts have half-lives ranging from 3 to8 min (Bernstein et al. 2002). Because bacterial RNAses areresponsible for this rapid turnover (Kushner 2002), thisclearly indicates that prokaryotic mRNA is much harder tohandle than eukaryotic mRNA. This instability demandsspecial care during preparation of prokaryotic RNA toavoid artifacts. It is possible to fail to observe theexpression of certain genes simply because of degradationof the corresponding mRNA during the experiment. It alsohas to be kept in mind that depending on the promotor andits regulation in E. coli transcription initiation takes placeat a rate of once per second to once per generation (Recordet al. 1996). The transcript elongation proceeds at a rate of40–50 nucleotides per second (Richardson and Greenblatt1996). This means that even for a relatively large protein,like lacZ, the first β-galactosidase proteins appear 1 minafter the initial signal for gene induction occurred. Thisshould illustrate how quickly microorganisms adjust theirtranscription to environmental changes that might occurduring harvesting the culture and cell disruption. Therefore,to prevent observing mainly the Save Our Souls (SOS)response or the response to oxygen limitation, it is criticalto immediately cool cells carefully during harvest and usean appropriate method for cell disruption and RNAextraction that minimizes RNA degradation. Traditionalmethods of cell disruption, like incubation with lysozyme,french pressing, or sonification, are often not suitablebecause they take too much time. A very flexible solutionthat works for many organisms is to freeze cells usingliquid nitrogen and grind the frozen cells in a cooled ballmill. The resulting powder of grounded cells is dissolved ina buffer containing a high concentration of the strong pro-tein denaturant guanidinium isothiocyanate before thawing,thereby inhibiting any RNAse activity. Alternatively, a cold“stop solution” composed, for example, of ethanol andphenol at a low pH can be used to stop any transcriptionimmediately and prevent RNA breakdown (Moore et al.2005). Total bacterial RNA can then be prepared with
260 Appl Microbiol Biotechnol (2006) 73:255–273
commercial kits such as RNeasy from Qiagen (Hilden,Germany). The quality of RNA is pivotal for transcriptionanalysis, and RNA quality should be controlled, forexample, by denaturing formaldehyde agarose gel electro-phoresis or RT PCR.
Hybridization and data acquisition
Hybridization Hybridization of DNA microarrays can bedone in two different ways. The “classical” approachincludes placing labeled, denatured target on a slide andcarefully covering it with a coverslip. This requires someskillfulness because the coverslip needs to be level toprevent gradients in hybridization and avoid trapped airbubbles. The slide is then placed in a humid chamber toprevent desiccation during hybridization and incubated atthe hybridization temperature. The hybridization tempera-ture ranges mostly from 40 to 65°C for 5 to 12 h. It dependson the organism studied and the composition of thehybridization buffer (Cheung et al. 1999). In most cases,saline sodium citrate (SSC) buffer with added detergent isused. Addition of Denhardt's solution, sheared salmonsperm DNA, or tRNA reduces the background. Theaddition of formamide, dextran sulfate, or polyethyleneglycol can improve binding of low-copy number transcripts(Cheung et al. 1999; Wildsmith and Elcock 2001).Hybridization temperature is critical for oligonucleotideslides and has to be carefully optimized. As a rule ofthumb, the optimization can start at a hybridizationtemperature 15°C below the mean melting temperature ofthe oligonucleotides used. Following hybridization, theslides are washed to remove unspecific bound target. Morestringent washing steps are performed at the end of thewashing procedure. This can be achieved either bydecreasing the ionic strength or increasing the washingtemperature (Wildsmith and Elcock 2001). Typical proto-cols use decreasing SSC buffer concentrations first withsmall concentrations of sodium dodecyl sulfate (SDS) thenwithout SDS. The slides are finally dried by centrifugation.It is important to scan the arrays within several hours afterhybridization because the fluorescence signal deteriorateswith time.
As an alternative to this classical approach, automaticarray hybridization stations can be used (Wildsmith andElcock 2001). They provide hassle-free hybridization andwashing of the slides by running programmed protocols.The results do not depend on the ability of the researcherand are very reproducible. However, hybridization andwashing conditions have to be fine-tuned in earlier experi-ments to the probes and slide chemistry used. They aretherefore most adequate when a large number of arrays
based on the same chemistry have to be handled identically.They are not well suited to deal with small number arraysbased on varying chemistries.
Scanning The microarrays are scanned with microarrayscanners. Their appropriate driver and image analysissoftware determines the raw values (Bassett et al. 1999).GenePix (Axon Instruments, Inc., Union City, CA, USA)and ArrayVision (Imaging Research, Ontario, Canada)software are examples of widely used softwares for imageanalysis and raw data acquisition. In principle, it is possibleto scan standard-sized slides with any scanner. Exceptionsare a few slide types with a nonplanar surface that excludeconfocal scanners. For successful data acquisition, a datafile is needed that identifies the features and defines theirdimensions and locations. The GenePix array list (.gal) fileformat is often used for this purpose. The scanners mostlyuse lasers for exciting the surface of the hybridizedmicroarray with a resolution of a few micrometers (Bowtell1999). The resolution of scanning should be better than10% of the spot size, that is, features of 150-μm size needto be scanned at least at 15 μm resolution. The fluorescenceemitted from the dyes hybridized to the features is collectedand quantified by photomultiplier tubes or charge-coupleddevice (CCD) cameras. There is a variety of scanners on themarket differing in their technological configurations(Ramdas et al. 2001). Normally, the scanner generatesgray-scale images of the fluorescence at 532 and 635 nm.The data are stored in a lossless tagged image file format(TIFF) that is used for quantification by image analysis. Acolor depth of 2 byte is characteristic for most scanners,which means that each pixel can assume 65,535 differentintensity levels. The sensitivity of the scanner has to beadjusted to ensure that most of the pixels in the picture donot saturate its dynamic range. It is convenient to roughlyadjust the sensitivity of the scanner during a prescan so thatconstitutive controls result in roughly equal signals. Formicroarrays made from double-stranded DNA, this can alsobe done by spotting chromosomal DNA and adjusting thesespots to a ratio of 1 during scanning.
Image analysis To quantify the fluorescence of the featuresvia image analysis, pixels have to be assigned either to aspot or the background. This resulting boundary is oftenvisualized in the software for acquiring raw values by acircle surrounding the feature and is then called a featureindicator. In most cases, the image analysis software allowsthe placement of the feature indicators in a semiautomaticor automatic manner. Even if an algorithm places thefeature indicators automatically, it is advisable to manuallycontrol this placement. In real life, the spots might beirregular, or fluorescent impurities on the chip surface mayconfuse algorithms. It is common to define all pixels inside
Appl Microbiol Biotechnol (2006) 73:255–273 261
a feature indicator as foreground and all adjacent pixelswithin a radius of three times the feature diameter as thelocal background. The next step is the quantification of theimage data by calculating the arithmetic mean (Zhou et al.2000) or better median (Petrov et al. 2002) of the intensitiesof the foreground and background pixels. This resultingdata are stored in form of a table. Common spreadsheetprograms and all sorts of commercial and free softwaretools can be used for the next steps of data analysis(Brazma and Vilo 2001; Conway et al. 2002).
Background correction and filtering First, the so-calledbackground correction has to be made. That simply meanssubtracting the local background value from the foregroundintensity (Benes and Muckenthaler 2003; Dharmadi andGonzalez 2004). Additionally, an intensity-based filteringof the data should be done to ensure the quality of thesignals and to prevent artifacts. The first and mostimportant of these quality assessments is to exclude featureswith intensity smaller than the background or assign them a“floor” value, which is often the local or global back-ground. The assignment of a floor value allows interpreta-tion of genes that are transcribed at one condition but aretotally switched off at the other condition. This is notuncommon with bacteria where some operons are specifi-cally induced by an inducer but are not transcribed in itsabsence. Because the data at the lower range of intensitiestend to be much more variable, it is good practice to acceptonly the intensity of features that lie significantly abovebackground and assign floor values to the rest. Significantlyabove background means that they should have intensitiesthat are more than one or two standard deviations above thelocal background. Two standard deviations above back-ground mean that they represent valid data with aconfidence level of 95.5% (Quackenbush 2002). Afterpassing this filtering, the ratio of means or the ratio ofmedians is calculated from the background-correctedintensities in the “red” and “green” channels and results inthe actual raw data from a DNA microarray experiment. Afurther filtering that can be applied to verify quality andprevent experimental artifacts would be the comparison ofthe ratio of means, the ratio of medians, and the regressionratio for each feature. The regression ratio is the linearregression between the intensities of pixels within a circleof twice the diameter of the feature. The slope of the line ofbest fit according to the least-square method is theregression ratio. The distinct feature of this ratio is itsindependence of rigidly defining the background orforeground pixels. Whenever the regression ratio, the ratioof means, and the ratio of medians deviate too much fromeach other, there is a problem with spot morphology orfeature indicator placement. These data should be omittedfrom further analysis. For example, the GenePix software
exports all values needed for the quality assessmentsdescribed.
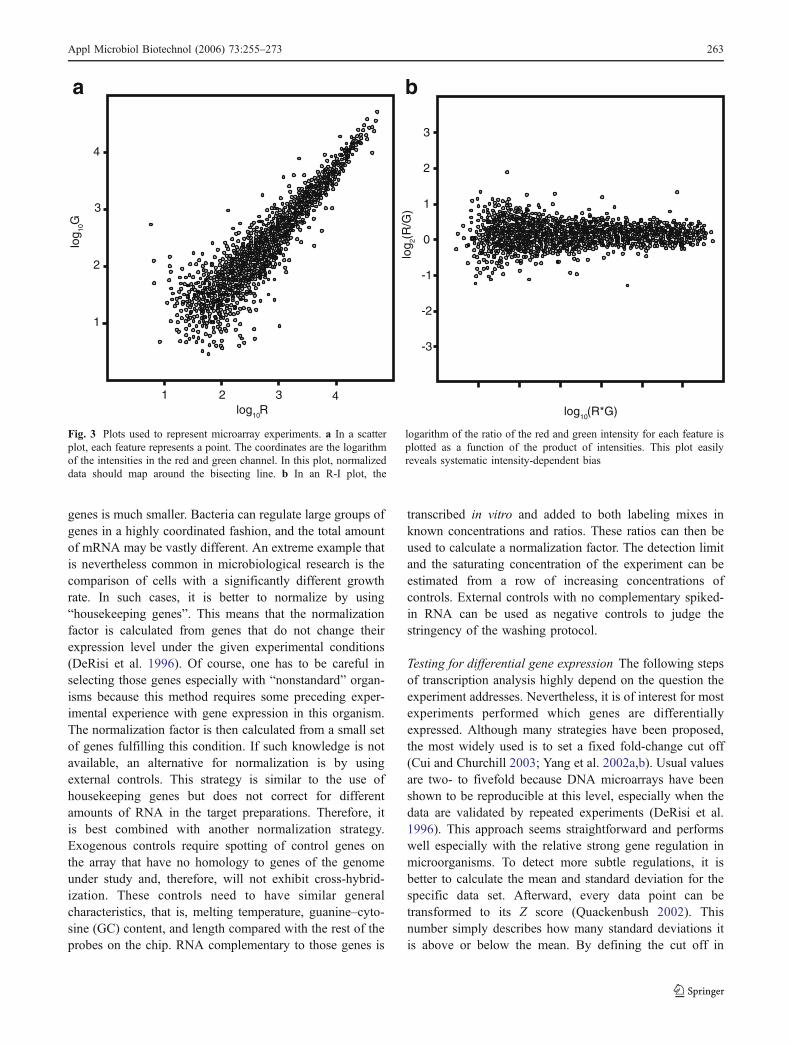
Data transformation The untransformed values of expres-sion ratios have the disadvantage of treating up- anddownregulated genes differently. That means that a fourfoldupregulated gene has an expression ratio of 4, whereas afourfold downregulated gene has an expression ratio of0.25. To circumvent this problem, the expression ratios areoften handled as their logarithms to the base 2. This resultsin the values 2 and (−2) for a fourfold up- and down-regulated gene, which has a number of practical advan-tages. There is another important reason for transformingdata to their logarithms: most statistical methods applied onthe data afterward expect normal distribution. Log-trans-forming data is a mathematically simple strategy to achievethis (Dharmadi and Gonzalez 2004). Figure 3 shows twocommon types of plots that are used to visualize microarraydata.
Methods for normalization and testing for differentialgene expression
Normalization Before it is possible to draw biologicalconclusions or to apply sophisticated statistics, it isimportant to normalize the data. This corrects for systematicbiases resulting basically from different amounts of RNAused for labeling, different incorporation efficiencies of theCy-3 and Cy-5 dyes in the labeling protocols, and differentdetection efficiencies of the dyes (Yang et al. 2002a,b). Anumber of normalization methods have been proposed inthe literature (Duggan et al. 1999; Kroll and Wolfl 2002;Quackenbush 2002). The most widely used method isbased on the assumption that the total sum of intensitiesshould be equal in both channels, and therefore, the ratiobetween them should be one. A normalization factor iscalculated from overall ratio, and ratios for all features arescaled accordingly. A somehow similar approach usesspotted chromosomal DNA for normalization, although thisstrategy is confined to microarrays made by spottingdouble-stranded DNA (DeRisi et al. 1997). In addition, anumber of other approaches are in use such as linearregression analysis and the intensity-dependent locallyweighted linear regression (LOWESS) normalization thatcorrects for intensity-dependent effects sometimes observedin the data. A microbiologist has to be cautious with thesenormalization strategies because they imply statistically thatthere must be a downregulated gene for every upregulatedone. This assumption might be more appropriate from astatistical point of view with large eukaryotic genomes. It isnot necessarily correct for bacteria because the number of
262 Appl Microbiol Biotechnol (2006) 73:255–273
genes is much smaller. Bacteria can regulate large groups ofgenes in a highly coordinated fashion, and the total amountof mRNA may be vastly different. An extreme example thatis nevertheless common in microbiological research is thecomparison of cells with a significantly different growthrate. In such cases, it is better to normalize by using“housekeeping genes”. This means that the normalizationfactor is calculated from genes that do not change theirexpression level under the given experimental conditions(DeRisi et al. 1996). Of course, one has to be careful inselecting those genes especially with “nonstandard” organ-isms because this method requires some preceding exper-imental experience with gene expression in this organism.The normalization factor is then calculated from a small setof genes fulfilling this condition. If such knowledge is notavailable, an alternative for normalization is by usingexternal controls. This strategy is similar to the use ofhousekeeping genes but does not correct for differentamounts of RNA in the target preparations. Therefore, itis best combined with another normalization strategy.Exogenous controls require spotting of control genes onthe array that have no homology to genes of the genomeunder study and, therefore, will not exhibit cross-hybrid-ization. These controls need to have similar generalcharacteristics, that is, melting temperature, guanine–cyto-sine (GC) content, and length compared with the rest of theprobes on the chip. RNA complementary to those genes is
transcribed in vitro and added to both labeling mixes inknown concentrations and ratios. These ratios can then beused to calculate a normalization factor. The detection limitand the saturating concentration of the experiment can beestimated from a row of increasing concentrations ofcontrols. External controls with no complementary spiked-in RNA can be used as negative controls to judge thestringency of the washing protocol.
Testing for differential gene expression The following stepsof transcription analysis highly depend on the question theexperiment addresses. Nevertheless, it is of interest for mostexperiments performed which genes are differentiallyexpressed. Although many strategies have been proposed,the most widely used is to set a fixed fold-change cut off(Cui and Churchill 2003; Yang et al. 2002a,b). Usual valuesare two- to fivefold because DNA microarrays have beenshown to be reproducible at this level, especially when thedata are validated by repeated experiments (DeRisi et al.1996). This approach seems straightforward and performswell especially with the relative strong gene regulation inmicroorganisms. To detect more subtle regulations, it isbetter to calculate the mean and standard deviation for thespecific data set. Afterward, every data point can betransformed to its Z score (Quackenbush 2002). Thisnumber simply describes how many standard deviations itis above or below the mean. By defining the cut off in
1
2
3
4
1 2 3 4log10R
log 10
G
0
1
2
3
-1
-2
-3
log10(R*G)lo
g 2(R
/G)
a b
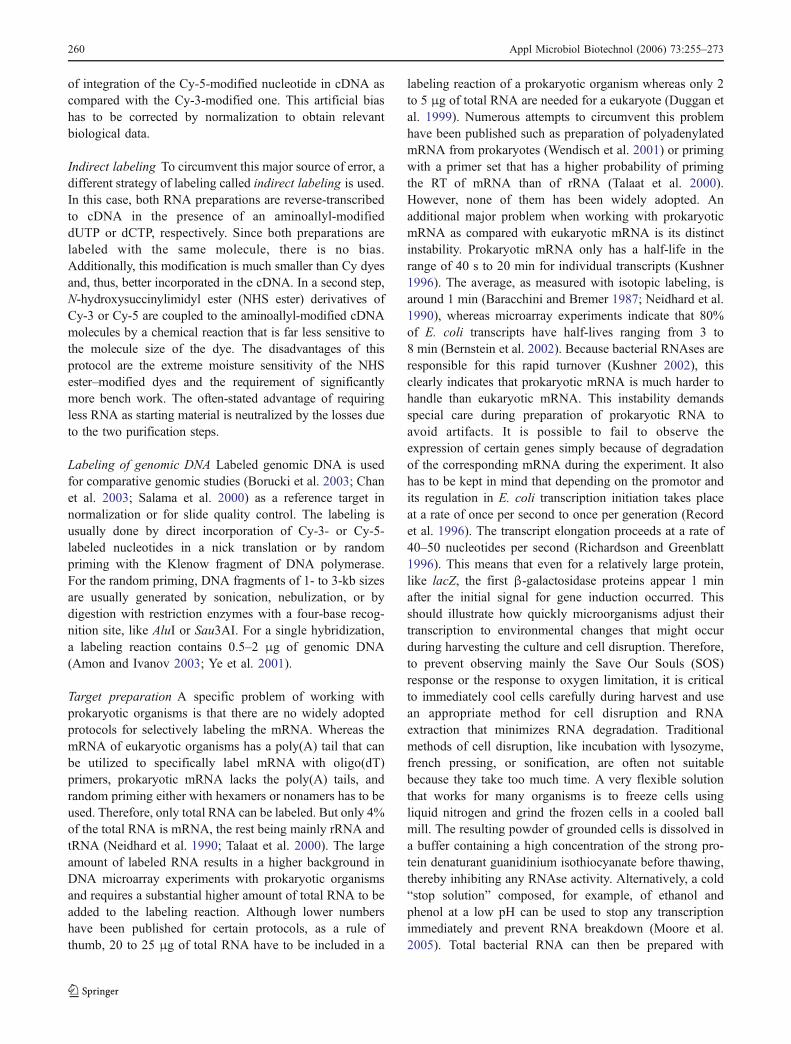
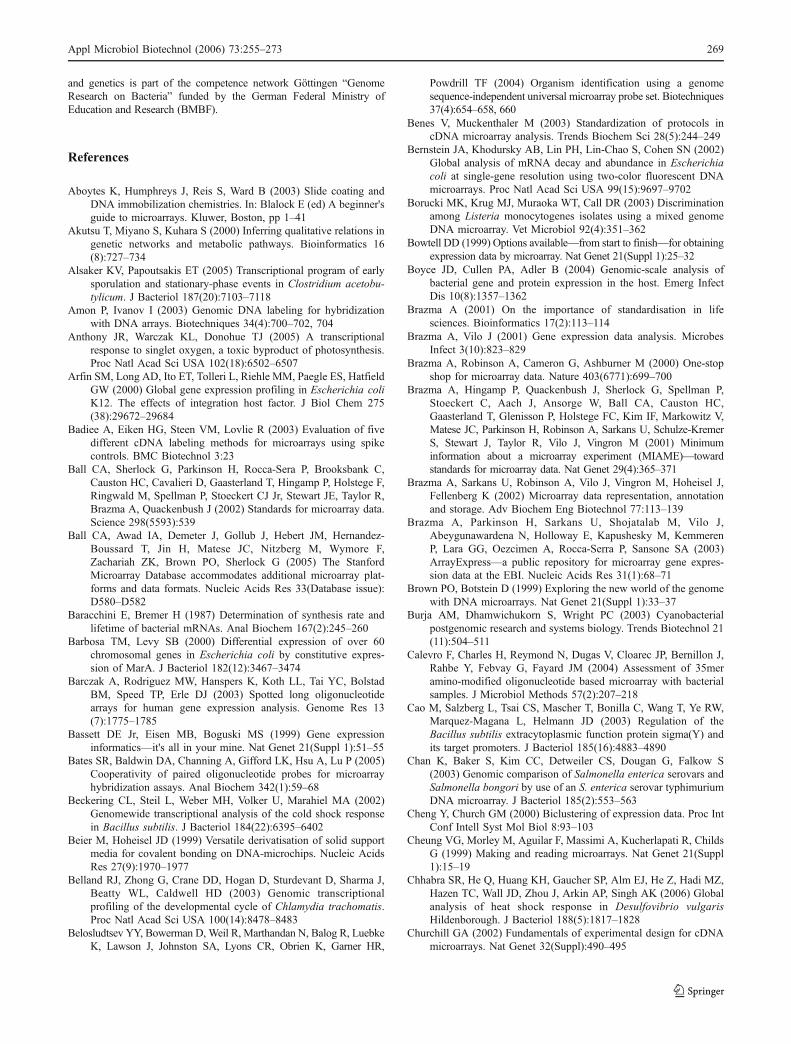
Fig. 3 Plots used to represent microarray experiments. a In a scatterplot, each feature represents a point. The coordinates are the logarithmof the intensities in the red and green channel. In this plot, normalizeddata should map around the bisecting line. b In an R-I plot, the
logarithm of the ratio of the red and green intensity for each feature isplotted as a function of the product of intensities. This plot easilyreveals systematic intensity-dependent bias
Appl Microbiol Biotechnol (2006) 73:255–273 263
terms of a Z score, the threshold is more specific to theparticular data set. DNA microarray data tend to be morevariable at lower than at higher intensity levels. Therefore,it is better to define an intensity-dependent Z scorethreshold for the data set. For this, the mean and standarddeviation are calculated in a sliding window to establish alocal intensity-dependent Z score for each data point (Yanget al. 2002a,b). Values with an associated Z score largerthan 1.96 can be regarded as differentially expressed genesat a 95% confidence level (Quackenbush 2002).
Design of experiments and data verification
Replication Replication is crucial to achieve reliable datafor microarrays (Spruill et al. 2002). There are threedifferent kinds of replication that have to be distinguished.Spotting the same probes multiple times on each array isthe first one. This provides some backup in case a spotcannot be evaluated due to technical artifacts, like dyeprecipitations or dust particles, and allows the calculation ofthe “on chip variance” (Worley et al. 2000). Moreover, itimproves the data quality by calculating the averageexpression ratios on the chip. The next important type ofreplication is to label and hybridize RNA that has beenprepared from one biological experiment several times.This corrects variance that results from differences in thelabeling reactions. The most important replication in thiscategory is the so-called dye switch or dye swap. In a dyeswitch, the RNA sample that was first Cy-3-labeled isCy-5-labeled next and vice versa (Kerr and Churchill2001a,b; Tseng et al. 2001; Yang and Speed 2002). Thisis important because there are gene-specific dye effects.Additionally, the intensity of Cy-3 and Cy-5 fluorescence isdiffering depending on the amount of dye that is bound to afeature by hybridization (Rhodius et al. 2002).
All replications mentioned so far are often calledtechnical replications. They are only used to correcttechnical sources of error during the transcription analysis.An additional “technical” source of variability is the RNApreparation. However, it should be kept in mind that themajor varieties come from the biological experiment thathas to be planned and conducted with great care. Micro-arrays monitor the mRNA concentration of all genes of acell with considerable precision. Bacteria in turn can detectenvironmental changes with extreme sensitivity, andmRNA concentrations show a rapid change in response tothem. Therefore, the major task when trying to getreproducible microarrays is to perform highly reproduciblephysiological or genetic experiments. Good array datadepend as much upon good microbial physiology techniqueas they do on good DNA array technique (Conway andSchoolnik 2003).
A statistical estimation deduces that at least threereplicates should be done (Lee et al. 2000). The ratios ofreplicate experiments are averaged or better the geometricmean is calculated (Quackenbush 2002).
Design of experiments The experimental design is alsocritical (Churchill 2002; Kerr and Churchill 2001a,b;Nadon and Shoemaker 2002). For example, many genesin a bacterial cell are growth-rate-dependent. Therefore, onehas to be very cautious to attribute the gene expressionmeasured on different growth substrates if the growth ratesof the cultures are too different. A possibility to circumventthis problem is to work with cells grown in continuouscultures where the growth rates can be adjusted to besimilar. However, this approach excludes the observation ofdynamic responses.
The common case in microarray research is to comparetranscription of two cell populations. Three groups of thesetwo-condition experiments can be generally distinguished(Conway and Schoolnik 2003): (1) differential response togrowth parameters. Examples for this would be studies ofgrowing cells either in batch or in continuous culture onvarious carbon sources or other varying growth conditionssuch as aerobic vs fermentative growth (DeRisi et al. 1997;Oh et al. 2002; Pappas et al. 2004; Pashalidis et al. 2005;Paustian et al. 2002; Polen et al. 2003, 2005; Rossignol etal. 2003). (2) Treated vs untreated cultures. These experi-ments monitor the response of a cell population to variousphysiologic challenges such as, for example, heat shock orantibiotic treatment. They define genes belonging to certainstimulons in the cells and provide a picture on how the cellcopes with certain stress situations (Alsaker and Papoutsakis2005; Anthony et al. 2005; Beckering et al. 2002; Chhabra etal. 2006; Gao et al. 2004; Mascher et al. 2003). (3) Wild-typevs mutant strains. This group summarizes studies where theconsequences of genetic mutations are monitored. They areoften employed to define regulons, but special care must betaken to separate direct consequences of the mutation fromindirect ones (Barbosa and Levy 2000; Cao et al. 2003; denHengst et al. 2005; Ogura et al. 2002; Salmon et al. 2005).
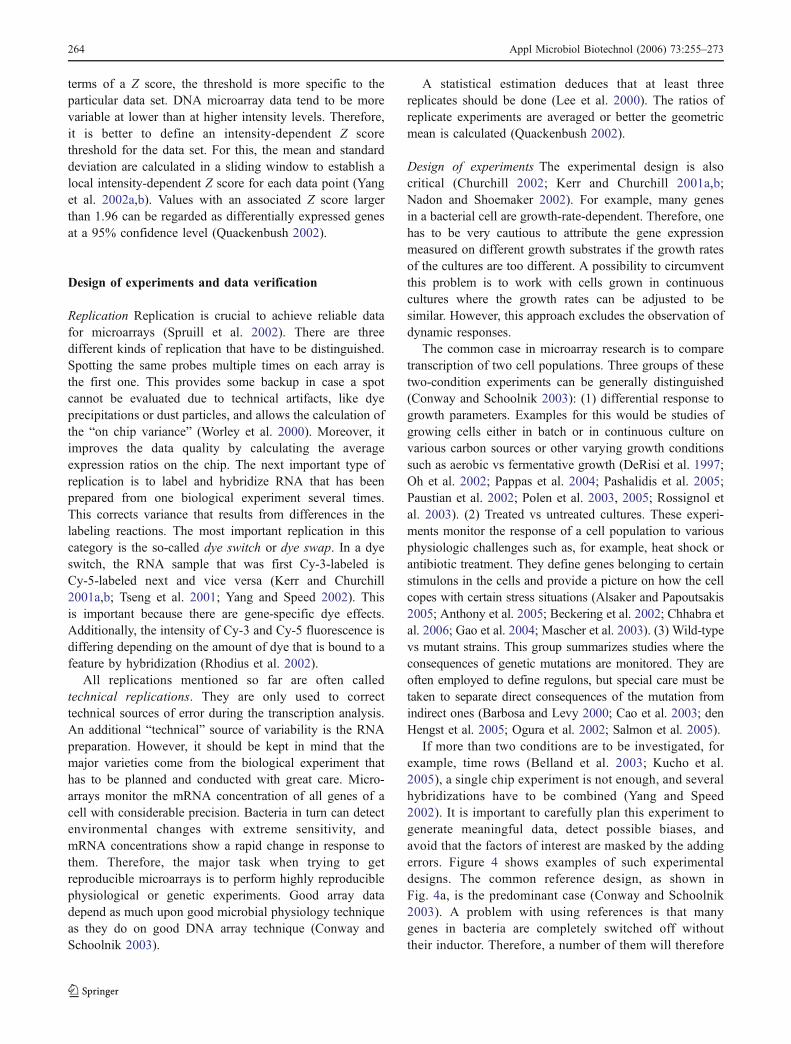
If more than two conditions are to be investigated, forexample, time rows (Belland et al. 2003; Kucho et al.2005), a single chip experiment is not enough, and severalhybridizations have to be combined (Yang and Speed2002). It is important to carefully plan this experiment togenerate meaningful data, detect possible biases, andavoid that the factors of interest are masked by the addingerrors. Figure 4 shows examples of such experimentaldesigns. The common reference design, as shown inFig. 4a, is the predominant case (Conway and Schoolnik2003). A problem with using references is that manygenes in bacteria are completely switched off withouttheir inductor. Therefore, a number of them will therefore
264 Appl Microbiol Biotechnol (2006) 73:255–273

not be expressed under the condition the reference wasmade. If any of those genes are expressed under otherconditions, this will lead to infinite induction ratios forthose genes. Some studies suggest using a mixture ofreference RNAs obtained from several sampling condi-tions (Kucho et al. 2005; Laub et al. 2000), labeledoligonucleotides complementary to each probe (Dudley etal. 2002), or to use labeled chromosomal DNA asreference (Belland et al. 2003). Another strategy wouldbe to define a base value in case there is a strong signalon one channel but no signal for that feature on the otherto be able to calculate a ratio.
Other experimental approaches with microarrays Besidetranscription analysis and many other minor applications,microarrays are routinely used in microbiology to compare
genomes and identify microorganisms. These fields ofapplication require the labeling of chromosomal DNA thatis hybridized with the array. For the comparison ofgenomes, also called genomotyping, the chromosomalDNA from the bacterium that has to be typed is labeled.This labeled DNA is hybridized with a whole genome arrayfrom a reference strain. The chromosomal DNA from thereference strain is labeled with a second dye and includedin the hybridization. If genes are present in both strains, thecorresponding probe will yield a signal in both channels,whereas when the gene is absent in the typed strain, thesignal in one channel is missing. Threshold values aredefined on the basis of the data set to decide whether a geneis absent. This decision is often done with the GACKsoftware (Kim et al. 2002; Stabler et al. 2005). Theapproach works only with closely related organisms andhas the inherent limitation that is only possible to decidewhich genes are missing from the typed strain as comparedwith the reference strain, not which ones the typed strainshas more than the reference strain (Coenye et al. 2005;Lindroos et al. 2005; Molenaar et al. 2005; Paustian et al.2005; Reen et al. 2005).
For the identification of microorganisms, probes specificto certain taxons are spotted on arrays. Mostly, 16S and 23Sribosomal RNA genes are used for this purpose. The labeledchromosomal DNA of the organism under investigation ishybridized with this chip in a one-channel experiment. Bysophisticated design of these probes, it is possible to classifythe organism depending on the probes that hybridize withthe target (Belosludtsev et al. 2004; Lehner et al. 2005; Loyet al. 2002, 2005; Mitterer et al. 2004).
Data verification Microarray data can easily contain errorsoriginating from probe interchange, array production,labeling reactions, hybridization, and data acquisition.Therefore, it is crucially advisable to validate data of themost important genes with independent methods to quantifymRNA. Real-time RT-PCR (Gibson et al. 1996; Heid et al.1996; Helmann et al. 2001; Wurmbach et al. 2003) orNorthern blotting (Heller et al. 1997; Schuchhardt et al.2000) are the most common options. In prokaryoticorganisms, the operon structure can also give some hints:operons are expressed as coordinated and often show apolar effect in the direction of transcription (Pappas et al.2004). However, more indirect methods, like proteomicsdata, lacZ fusions, or enzyme activities, can also be used toback up transcription data (Rhodius et al. 2002). Moreover,they proof the relevance of the transcription data for theselevels of cellular physiology. The best option to verifymicroarray expression data is real-time RT–PCR, alsocalled QRT-PCR (quantitative RT-PCR). This PCR methodallows to quantify dozens of samples simultaneously. It hasbeen shown that in most cases, the data from microarrays
a
b
sample 1 sample 2
sample 1
sample 3
sample 2
sample 4
sample 3sample 4
sample 5
reference
sample 1
sample 2
sample 3sample 4
sample 5
c
Fig. 4 Basic types of experimental design schemes with multiplesamples. Each box represents one sample, and each arrow points fromthe green-labeled sample to the red-labeled sample. a Referencedesign; b loop design; c all-pair design
Appl Microbiol Biotechnol (2006) 73:255–273 265
and real-time RT-PCR are consistent (Mutch et al. 2002).However, in the majority of studies, microarray datacompress the fold changes of expression as compared withreal-time RT-PCR by two- to tenfold (Conway and Schoolnik2003). This has been attributed to the smaller dynamic rangeof microarrays (Holland 2002; Pappas et al. 2004; Yuen et al.2002). Northern blotting is another option for data valida-tion, but it is only applicable for much fewer samplenumbers and is less quantitative. If a larger number ofsamples are to be checked, RNA dot blot analysis has beenused to verify array data (Moore et al. 2005).
Data storage Microarrays produce a vast amount of data. It isimportant to organize and store these data in databases (Bassettet al. 1999; Brazma et al. 2002; Sherlock and Ball 2005). Thisis true for the work in the laboratory and for the deposition ofthe data in public databases. Many journals require thedeposition of the microarray data in public databases, like“National Center for Biotechnology Information (NCBI) GeneExpression Omnibus” (GEO) (Edgar et al. 2002), “KEGGEXPRESSION” database (Kanehisa et al. 2002), “ArrayEx-press Database” (Brazma et al. 2003), or “Stanford MicroarrayDatabase” (Ball et al. 2005) and the submission of theassigned accession number prior to publication (Brazma et al.2000). The minimum information about a microarray exper-iment (MIAME) specification was created to achieve accurateand consistent annotation of microarray experiments (Ball etal. 2002; Brazma 2001; Brazma et al. 2001). This specifica-tion tries to define a framework to describe the minimal dataset required for a microarray experiment. It comprise data onthe experimental design, information on the array design, thesamples used, the RNA extraction and labeling, hybridizationprocedures and parameters, experimental data, and finally, adetailed description of strategy and controls used fornormalization. The experimental data comprises image data,raw data, data after normalization, and after averaging ofreplicates. For describing all these data in a structured way, aspecial XML format called microarray gene expressionmarkup language (MAGE-ML) has been proposed (Spellmanet al. 2002). The databases also offer online tools for datasubmission, like MIAMExpress (Brazma et al. 2003).
Cluster analysis of expression data
The underlying principle of applying clustering to expres-sion data is the assumption that similar expression levelsmight indicate related biological function (Brazma and Vilo2001). Therefore, insight in the function of unknown genesmay be gained by observing whether they are coregulatedwith known genes or whether the genes are expressed orrepressed as a group in response to a defined stimulus.
Answers to these questions can be obtained by applyingclustering algorithms (Claverie 1999; de Hoon et al. 2004;Eisen et al. 1998; Michaels et al. 1998; Sherlock 2000;Sturn et al. 2002). Typical software packages used for thisstep are GeneSpring (Silicon Genetics, San Carlos, CA,USA) or SpotFire Array Explorer (SpotFire, Inc., Cam-bridge, MA, USA). The interpretation of transcription datain the context of known functions, for example, biochem-ical pathways or a working model, is a hypothesis-basedapproach. In contrast to this, a purely statistical analysis,like clustering, can be employed without any priorhypothesis and might, at least in theory, lead to unexpectedconclusions. This “unsupervised analysis” is seen as amajor advantage of the functional genomics approach.However, it has to be stressed that clustering of data willalways result in some clusters regardless of biologicalrelevance (Clare and King 2002). This is a commoncharacteristic of bioinformatics data. It might suggesttotally unexpected coherences but does not prove anythingper se without returning to the laboratory and doingclassical experiments to find supporting evidences.
Clustering is applied to the averaged expression data fromseveral microarray experiments where quality assessment,normalization, and technical controls have already beendone. It can be applied to several distinct experiments or atime series. It is possible to cluster genes in groups accordingto the similarity of the expression in several experiments orto cluster the experiments to groups of similar geneexpression. When these two clustering directions arecombined, they are referred to as biclustering or two-wayclustering (Cheng and Church 2000; Getz et al. 2000).
To simply cluster the genes according to their expressionin several experiments, the expression level of each gene isrepresented as a point in an n-dimensional space. n is equalto the number of experiments or time points. This can easilybe visualized with data from two experiments because thepoints (genes) can be represented by a two-dimensionalcoordinate system as shown in Fig. 5. Clusters can, underthese circumstances, be visually recognized as points incloser vicinity.
Before any mathematical clusters analysis can be done,three things need to be defined:
– First, a distance measure between data points has to beselected. Most often, this is the Euclidian distancebetween points, but more sophisticated definitions arepossible and result in different clusters. Therefore, thiscan be as important as the selection of the clusteringalgorithm. Some sort of “feeling” for the data set andtrial and error is used for the choice of the right one.
– Second, a function that defines the quality of clusteringresults must be chosen. Most obviously, the defineddistance measurement is used to minimize the distance
266 Appl Microbiol Biotechnol (2006) 73:255–273

of each point in a cluster to the center of the cluster.But again, other methods are possible and necessary,depending on how noisy the data are.
– Finally, the algorithm for clustering needs to be selected.These algorithms try to find the best possible clusteringresults using the function that defines the quality ofclustering. There is a vast collection of clusteringalgorithms described in the literature. The major onescan be separated into two groups depending on whether
the user needs to make assumptions on the clusters apriori and specify the number of clusters to be found.
Hierarchical clustering Hierarchical clustering as illustratedin Fig. 5a is a widely used method that does not need apriori information and results in a tree structure ofincreasing similarity (Khan et al. 1998; Lashkari et al.1997; Schena et al. 1996). Every tree node represents a
Experiment 1
Experiment 1
Exp
erim
ent 2
Exp
erim
ent 2
Experiment 1
Exp
erim
ent 2
Experiment 1
Exp
erim
ent 2
Experiment 1
Exp
erim
ent 2
a
b
c
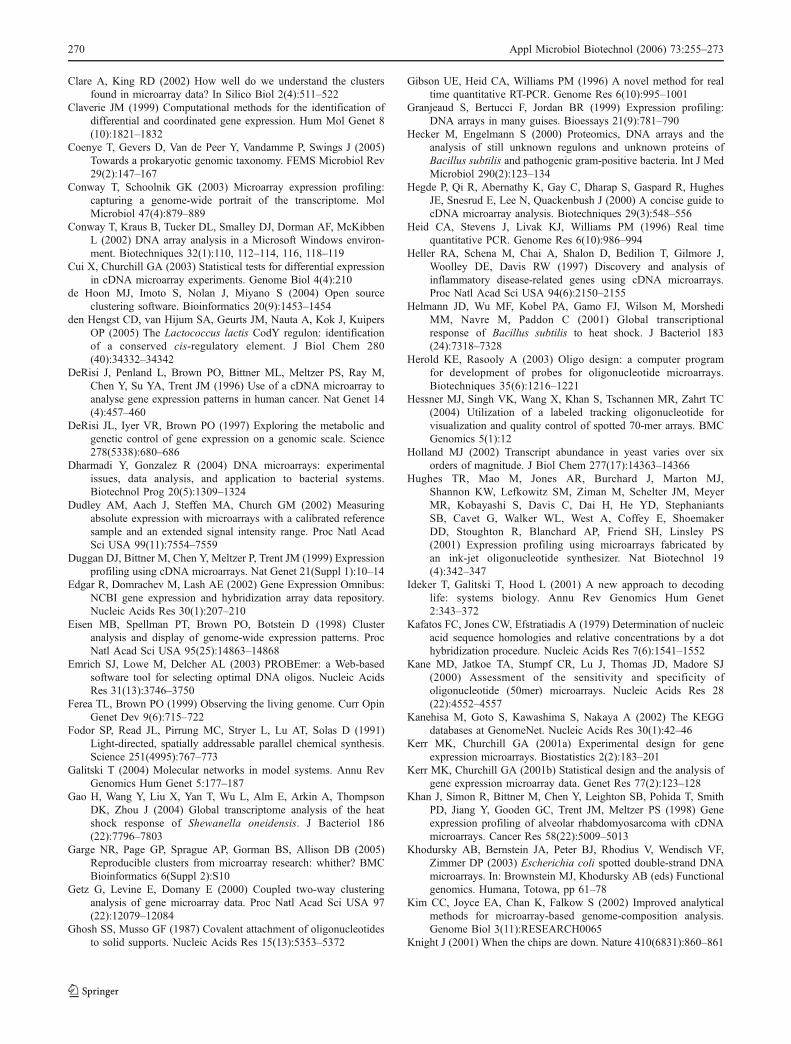
Fig. 5 Schematic illustratinghow clustering algorithms work.In this example, data from onlytwo experiments result in a two-dimensional data set. a Hierar-chical data clustering produces atree structure. b In K-meansclustering, centroids, drawn asstars, are dispersed by the user,and data points are assigned tothe clusters in an iterative algo-rithm. c Self-organizing mapsstart with a regular grid ofcentroids, represented as stars.Pulling the centroids to thecenters of the clusters they rep-resent in an iterative algorithmidentifies the clusters
Appl Microbiol Biotechnol (2006) 73:255–273 267
cluster at some resolution. The size of the resulting clusterscan therefore be defined by setting a threshold of a certainintercluster distance. The hierarchical clustering algorithmswork either “top-down,” by starting with all genes in asingle cluster and separating them based on a criterion ofdissimilarity, or “bottom-up,” by starting with everyindividual gene in a single cluster and merging themconsecutively based on a criterion of similarity. Afterhierarchical clustering, trees and color maps are the mostnatural representation of results (Wen et al. 1998).Hierarchical clustering gives good results with a clean dataset but is very sensitive to noisy data.
The two other clustering algorithms mentioned hererequire an initial guess on the number of suspected clusters.
K-means clustering K-means clustering, an alternative tohierarchical clustering, is argued to give good results whencompact clusters are expected. As shown in Fig. 5b, the userdisperses so-called centroids in the data space. The iterativealgorithm assigns each data point to the cluster with thesmallest distance to the next centroid. It then calculates anew one from the points that belong to the cluster andreplaces the old centroid. The computation process isterminated when there is no further change in the assignmentof gene points to the centroids (Lu et al. 2004; Xu 2004).
Self-organizing maps Self-organizing maps (SOMs) areclustering algorithms that are related to K-means clusteringbut have been found to be superior in both robustness andaccuracy when analyzing microarray data (Alsaker andPapoutsakis 2005; Garge et al. 2005; Tamayo et al. 1999).The algorithm, illustrated in Fig. 5c, is complex and startswith centroids dispersed as a regular grid among the data.Each data point then pulls the nearest centroid in little steps.The extent of pulling depends on the distance to thecentroid. Centroids that come close to each other merge,and centroids with no movement will be deleted. When theremaining centroids are located in the center of the clusters,the computation stops (Xu 2004).
Conclusions
Because of falling prices for equipment and oligonucleo-tides, DNA microarrays are on their way to becomecommon tools in the microbiological laboratory. Theyallow a dynamic view on the physiology of the living celland have been compared with a kind of “microscope”(Brown and Botstein 1999; Ferea and Brown 1999). Aninherent limitation of microarrays is that the resultingtranscriptome does not account for posttranslational events.However, in most cases, there is a high correlation betweentranscriptome and proteome (Akutsu et al. 2000; Hecker
and Engelmann 2000). The transcriptome data are usuallymore comprehensive because of the limited number ofproteins that can be resolved in two-dimensional gels.Moreover, the relatively detailed knowledge on the geneticsand biochemistry of prokaryotic organisms allows directinterpretation of the transcriptome data in active pathways.Many studies have shown that enzyme levels correlate withtheir respective gene expression profiles (Arfin et al. 2000;Smulski et al. 2001; Tao et al. 2001). Future investigationswill show how far this will extend to metabolic flux data(Kromer et al. 2004; Oh and Liao 2000). The integration oftranscription analysis with comparative genome sequenc-ing, proteomics, metabolic flux analysis, and computermodeling of the cell physiology will be an important datasource for system biology, which represents a newapproach for a global quantitative picture of cell physiology(Galitski 2004). The system biology approach requires afundamental framework involving several distinct steps: (1)definition of all components of a system; (2) systematicperturbation and monitoring of the components eithergenetically or by modification of the environment; (3)reconcile the experimentally observed responses with thosepredicted by a quantitative model; and (4) design andperform new perturbations to distinguish between multipleor competing model hypothesis (Ideker et al. 2001).Transcription analysis is the most important method tomonitor the mRNA abundance of each gene. It will becomplemented by proteomics and metabolomics to providethe experimental data for model verification as required insteps 2 and 4 of the outlined strategy (Boyce et al. 2004).Because system biology will form the foundation ofmetabolic engineering, transcription analysis will also beimportant in this area (Burja et al. 2003; Vemuri andAristidou 2005).
Microarrays can be used in microbiology for a multitudeof differing applications, from the study of gene regulationand bacterial response to environmental changes, genomeorganization, and evolutionary questions up to taxonomicand environmental studies. The knowledge of the mainaspects of this technology helps to understand these specificapplications.
Vital for further advances of microarray technology inmicrobiology will be the recognition of the importance ofthe physiological experiments ahead of the transcriptionanalysis, the standardization of protocols and controls fortranscription analysis (Benes and Muckenthaler 2003),more integration of the data analysis with biochemical andgenetic knowledge, and flexible and intuitive databases formining the vast amounts of data (Mlecnik et al. 2005).
Acknowledgments The author wants to thank Profs. G. Gottschalk,W. Liebl, and B. Bowien for their support. He is also grateful to Drs. T.Mascher, P. Ehrenreich, and B. Veith for critically reading themanuscript. The microarray core facility in the institute of microbiology
268 Appl Microbiol Biotechnol (2006) 73:255–273
and genetics is part of the competence network Göttingen “GenomeResearch on Bacteria” funded by the German Federal Ministry ofEducation and Research (BMBF).
References
Aboytes K, Humphreys J, Reis S, Ward B (2003) Slide coating andDNA immobilization chemistries. In: Blalock E (ed) A beginner'sguide to microarrays. Kluwer, Boston, pp 1–41
Akutsu T, Miyano S, Kuhara S (2000) Inferring qualitative relations ingenetic networks and metabolic pathways. Bioinformatics 16(8):727–734
Alsaker KV, Papoutsakis ET (2005) Transcriptional program of earlysporulation and stationary-phase events in Clostridium acetobu-tylicum. J Bacteriol 187(20):7103–7118
Amon P, Ivanov I (2003) Genomic DNA labeling for hybridizationwith DNA arrays. Biotechniques 34(4):700–702, 704
Anthony JR, Warczak KL, Donohue TJ (2005) A transcriptionalresponse to singlet oxygen, a toxic byproduct of photosynthesis.Proc Natl Acad Sci USA 102(18):6502–6507
Arfin SM, Long AD, Ito ET, Tolleri L, Riehle MM, Paegle ES, HatfieldGW (2000) Global gene expression profiling in Escherichia coliK12. The effects of integration host factor. J Biol Chem 275(38):29672–29684
Badiee A, Eiken HG, Steen VM, Lovlie R (2003) Evaluation of fivedifferent cDNA labeling methods for microarrays using spikecontrols. BMC Biotechnol 3:23
Ball CA, Sherlock G, Parkinson H, Rocca-Sera P, Brooksbank C,Causton HC, Cavalieri D, Gaasterland T, Hingamp P, Holstege F,Ringwald M, Spellman P, Stoeckert CJ Jr, Stewart JE, Taylor R,Brazma A, Quackenbush J (2002) Standards for microarray data.Science 298(5593):539
Ball CA, Awad IA, Demeter J, Gollub J, Hebert JM, Hernandez-Boussard T, Jin H, Matese JC, Nitzberg M, Wymore F,Zachariah ZK, Brown PO, Sherlock G (2005) The StanfordMicroarray Database accommodates additional microarray plat-forms and data formats. Nucleic Acids Res 33(Database issue):D580–D582
Baracchini E, Bremer H (1987) Determination of synthesis rate andlifetime of bacterial mRNAs. Anal Biochem 167(2):245–260
Barbosa TM, Levy SB (2000) Differential expression of over 60chromosomal genes in Escherichia coli by constitutive expres-sion of MarA. J Bacteriol 182(12):3467–3474
Barczak A, Rodriguez MW, Hanspers K, Koth LL, Tai YC, BolstadBM, Speed TP, Erle DJ (2003) Spotted long oligonucleotidearrays for human gene expression analysis. Genome Res 13(7):1775–1785
Bassett DE Jr, Eisen MB, Boguski MS (1999) Gene expressioninformatics—it's all in your mine. Nat Genet 21(Suppl 1):51–55
Bates SR, Baldwin DA, Channing A, Gifford LK, Hsu A, Lu P (2005)Cooperativity of paired oligonucleotide probes for microarrayhybridization assays. Anal Biochem 342(1):59–68
Beckering CL, Steil L, Weber MH, Volker U, Marahiel MA (2002)Genomewide transcriptional analysis of the cold shock responsein Bacillus subtilis. J Bacteriol 184(22):6395–6402
Beier M, Hoheisel JD (1999) Versatile derivatisation of solid supportmedia for covalent bonding on DNA-microchips. Nucleic AcidsRes 27(9):1970–1977
Belland RJ, Zhong G, Crane DD, Hogan D, Sturdevant D, Sharma J,Beatty WL, Caldwell HD (2003) Genomic transcriptionalprofiling of the developmental cycle of Chlamydia trachomatis.Proc Natl Acad Sci USA 100(14):8478–8483
Belosludtsev YY, Bowerman D, Weil R, Marthandan N, Balog R, LuebkeK, Lawson J, Johnston SA, Lyons CR, Obrien K, Garner HR,
Powdrill TF (2004) Organism identification using a genomesequence-independent universal microarray probe set. Biotechniques37(4):654–658, 660
Benes V, Muckenthaler M (2003) Standardization of protocols incDNA microarray analysis. Trends Biochem Sci 28(5):244–249
Bernstein JA, Khodursky AB, Lin PH, Lin-Chao S, Cohen SN (2002)Global analysis of mRNA decay and abundance in Escherichiacoli at single-gene resolution using two-color fluorescent DNAmicroarrays. Proc Natl Acad Sci USA 99(15):9697–9702
Borucki MK, Krug MJ, Muraoka WT, Call DR (2003) Discriminationamong Listeria monocytogenes isolates using a mixed genomeDNA microarray. Vet Microbiol 92(4):351–362
Bowtell DD (1999) Options available—from start to finish—for obtainingexpression data by microarray. Nat Genet 21(Suppl 1):25–32
Boyce JD, Cullen PA, Adler B (2004) Genomic-scale analysis ofbacterial gene and protein expression in the host. Emerg InfectDis 10(8):1357–1362
Brazma A (2001) On the importance of standardisation in lifesciences. Bioinformatics 17(2):113–114
Brazma A, Vilo J (2001) Gene expression data analysis. MicrobesInfect 3(10):823–829
Brazma A, Robinson A, Cameron G, Ashburner M (2000) One-stopshop for microarray data. Nature 403(6771):699–700
Brazma A, Hingamp P, Quackenbush J, Sherlock G, Spellman P,Stoeckert C, Aach J, Ansorge W, Ball CA, Causton HC,Gaasterland T, Glenisson P, Holstege FC, Kim IF, Markowitz V,Matese JC, Parkinson H, Robinson A, Sarkans U, Schulze-KremerS, Stewart J, Taylor R, Vilo J, Vingron M (2001) Minimuminformation about a microarray experiment (MIAME)—towardstandards for microarray data. Nat Genet 29(4):365–371
Brazma A, Sarkans U, Robinson A, Vilo J, Vingron M, Hoheisel J,Fellenberg K (2002) Microarray data representation, annotationand storage. Adv Biochem Eng Biotechnol 77:113–139
Brazma A, Parkinson H, Sarkans U, Shojatalab M, Vilo J,Abeygunawardena N, Holloway E, Kapushesky M, KemmerenP, Lara GG, Oezcimen A, Rocca-Serra P, Sansone SA (2003)ArrayExpress—a public repository for microarray gene expres-sion data at the EBI. Nucleic Acids Res 31(1):68–71
Brown PO, Botstein D (1999) Exploring the new world of the genomewith DNA microarrays. Nat Genet 21(Suppl 1):33–37
Burja AM, Dhamwichukorn S, Wright PC (2003) Cyanobacterialpostgenomic research and systems biology. Trends Biotechnol 21(11):504–511
Calevro F, Charles H, Reymond N, Dugas V, Cloarec JP, Bernillon J,Rahbe Y, Febvay G, Fayard JM (2004) Assessment of 35meramino-modified oligonucleotide based microarray with bacterialsamples. J Microbiol Methods 57(2):207–218
Cao M, Salzberg L, Tsai CS, Mascher T, Bonilla C, Wang T, Ye RW,Marquez-Magana L, Helmann JD (2003) Regulation of theBacillus subtilis extracytoplasmic function protein sigma(Y) andits target promoters. J Bacteriol 185(16):4883–4890
Chan K, Baker S, Kim CC, Detweiler CS, Dougan G, Falkow S(2003) Genomic comparison of Salmonella enterica serovars andSalmonella bongori by use of an S. enterica serovar typhimuriumDNA microarray. J Bacteriol 185(2):553–563
Cheng Y, Church GM (2000) Biclustering of expression data. Proc IntConf Intell Syst Mol Biol 8:93–103
Cheung VG, Morley M, Aguilar F, Massimi A, Kucherlapati R, ChildsG (1999) Making and reading microarrays. Nat Genet 21(Suppl1):15–19
Chhabra SR, He Q, Huang KH, Gaucher SP, Alm EJ, He Z, Hadi MZ,Hazen TC, Wall JD, Zhou J, Arkin AP, Singh AK (2006) Globalanalysis of heat shock response in Desulfovibrio vulgarisHildenborough. J Bacteriol 188(5):1817–1828
Churchill GA (2002) Fundamentals of experimental design for cDNAmicroarrays. Nat Genet 32(Suppl):490–495
Appl Microbiol Biotechnol (2006) 73:255–273 269
Clare A, King RD (2002) How well do we understand the clustersfound in microarray data? In Silico Biol 2(4):511–522
Claverie JM (1999) Computational methods for the identification ofdifferential and coordinated gene expression. Hum Mol Genet 8(10):1821–1832
Coenye T, Gevers D, Van de Peer Y, Vandamme P, Swings J (2005)Towards a prokaryotic genomic taxonomy. FEMS Microbiol Rev29(2):147–167
Conway T, Schoolnik GK (2003) Microarray expression profiling:capturing a genome-wide portrait of the transcriptome. MolMicrobiol 47(4):879–889
Conway T, Kraus B, Tucker DL, Smalley DJ, Dorman AF, McKibbenL (2002) DNA array analysis in a Microsoft Windows environ-ment. Biotechniques 32(1):110, 112–114, 116, 118–119
Cui X, Churchill GA (2003) Statistical tests for differential expressionin cDNA microarray experiments. Genome Biol 4(4):210
de Hoon MJ, Imoto S, Nolan J, Miyano S (2004) Open sourceclustering software. Bioinformatics 20(9):1453–1454
den Hengst CD, van Hijum SA, Geurts JM, Nauta A, Kok J, KuipersOP (2005) The Lactococcus lactis CodY regulon: identificationof a conserved cis-regulatory element. J Biol Chem 280(40):34332–34342
DeRisi J, Penland L, Brown PO, Bittner ML, Meltzer PS, Ray M,Chen Y, Su YA, Trent JM (1996) Use of a cDNA microarray toanalyse gene expression patterns in human cancer. Nat Genet 14(4):457–460
DeRisi JL, Iyer VR, Brown PO (1997) Exploring the metabolic andgenetic control of gene expression on a genomic scale. Science278(5338):680–686
Dharmadi Y, Gonzalez R (2004) DNA microarrays: experimentalissues, data analysis, and application to bacterial systems.Biotechnol Prog 20(5):1309–1324
Dudley AM, Aach J, Steffen MA, Church GM (2002) Measuringabsolute expression with microarrays with a calibrated referencesample and an extended signal intensity range. Proc Natl AcadSci USA 99(11):7554–7559
Duggan DJ, Bittner M, Chen Y, Meltzer P, Trent JM (1999) Expressionprofiling using cDNA microarrays. Nat Genet 21(Suppl 1):10–14
Edgar R, Domrachev M, Lash AE (2002) Gene Expression Omnibus:NCBI gene expression and hybridization array data repository.Nucleic Acids Res 30(1):207–210
Eisen MB, Spellman PT, Brown PO, Botstein D (1998) Clusteranalysis and display of genome-wide expression patterns. ProcNatl Acad Sci USA 95(25):14863–14868
Emrich SJ, Lowe M, Delcher AL (2003) PROBEmer: a Web-basedsoftware tool for selecting optimal DNA oligos. Nucleic AcidsRes 31(13):3746–3750
Ferea TL, Brown PO (1999) Observing the living genome. Curr OpinGenet Dev 9(6):715–722
Fodor SP, Read JL, Pirrung MC, Stryer L, Lu AT, Solas D (1991)Light-directed, spatially addressable parallel chemical synthesis.Science 251(4995):767–773
Galitski T (2004) Molecular networks in model systems. Annu RevGenomics Hum Genet 5:177–187
Gao H, Wang Y, Liu X, Yan T, Wu L, Alm E, Arkin A, ThompsonDK, Zhou J (2004) Global transcriptome analysis of the heatshock response of Shewanella oneidensis. J Bacteriol 186(22):7796–7803
Garge NR, Page GP, Sprague AP, Gorman BS, Allison DB (2005)Reproducible clusters from microarray research: whither? BMCBioinformatics 6(Suppl 2):S10
Getz G, Levine E, Domany E (2000) Coupled two-way clusteringanalysis of gene microarray data. Proc Natl Acad Sci USA 97(22):12079–12084
Ghosh SS, Musso GF (1987) Covalent attachment of oligonucleotidesto solid supports. Nucleic Acids Res 15(13):5353–5372
Gibson UE, Heid CA, Williams PM (1996) A novel method for realtime quantitative RT-PCR. Genome Res 6(10):995–1001
Granjeaud S, Bertucci F, Jordan BR (1999) Expression profiling:DNA arrays in many guises. Bioessays 21(9):781–790
Hecker M, Engelmann S (2000) Proteomics, DNA arrays and theanalysis of still unknown regulons and unknown proteins ofBacillus subtilis and pathogenic gram-positive bacteria. Int J MedMicrobiol 290(2):123–134
Hegde P, Qi R, Abernathy K, Gay C, Dharap S, Gaspard R, HughesJE, Snesrud E, Lee N, Quackenbush J (2000) A concise guide tocDNA microarray analysis. Biotechniques 29(3):548–556
Heid CA, Stevens J, Livak KJ, Williams PM (1996) Real timequantitative PCR. Genome Res 6(10):986–994
Heller RA, Schena M, Chai A, Shalon D, Bedilion T, Gilmore J,Woolley DE, Davis RW (1997) Discovery and analysis ofinflammatory disease-related genes using cDNA microarrays.Proc Natl Acad Sci USA 94(6):2150–2155
Helmann JD, Wu MF, Kobel PA, Gamo FJ, Wilson M, MorshediMM, Navre M, Paddon C (2001) Global transcriptionalresponse of Bacillus subtilis to heat shock. J Bacteriol 183(24):7318–7328
Herold KE, Rasooly A (2003) Oligo design: a computer programfor development of probes for oligonucleotide microarrays.Biotechniques 35(6):1216–1221
Hessner MJ, Singh VK, Wang X, Khan S, Tschannen MR, Zahrt TC(2004) Utilization of a labeled tracking oligonucleotide forvisualization and quality control of spotted 70-mer arrays. BMCGenomics 5(1):12
Holland MJ (2002) Transcript abundance in yeast varies over sixorders of magnitude. J Biol Chem 277(17):14363–14366
Hughes TR, Mao M, Jones AR, Burchard J, Marton MJ,Shannon KW, Lefkowitz SM, Ziman M, Schelter JM, MeyerMR, Kobayashi S, Davis C, Dai H, He YD, StephaniantsSB, Cavet G, Walker WL, West A, Coffey E, ShoemakerDD, Stoughton R, Blanchard AP, Friend SH, Linsley PS(2001) Expression profiling using microarrays fabricated byan ink-jet oligonucleotide synthesizer. Nat Biotechnol 19(4):342–347
Ideker T, Galitski T, Hood L (2001) A new approach to decodinglife: systems biology. Annu Rev Genomics Hum Genet2:343–372
Kafatos FC, Jones CW, Efstratiadis A (1979) Determination of nucleicacid sequence homologies and relative concentrations by a dothybridization procedure. Nucleic Acids Res 7(6):1541–1552
Kane MD, Jatkoe TA, Stumpf CR, Lu J, Thomas JD, Madore SJ(2000) Assessment of the sensitivity and specificity ofoligonucleotide (50mer) microarrays. Nucleic Acids Res 28(22):4552–4557
Kanehisa M, Goto S, Kawashima S, Nakaya A (2002) The KEGGdatabases at GenomeNet. Nucleic Acids Res 30(1):42–46
Kerr MK, Churchill GA (2001a) Experimental design for geneexpression microarrays. Biostatistics 2(2):183–201
Kerr MK, Churchill GA (2001b) Statistical design and the analysis ofgene expression microarray data. Genet Res 77(2):123–128
Khan J, Simon R, Bittner M, Chen Y, Leighton SB, Pohida T, SmithPD, Jiang Y, Gooden GC, Trent JM, Meltzer PS (1998) Geneexpression profiling of alveolar rhabdomyosarcoma with cDNAmicroarrays. Cancer Res 58(22):5009–5013
Khodursky AB, Bernstein JA, Peter BJ, Rhodius V, Wendisch VF,Zimmer DP (2003) Escherichia coli spotted double-strand DNAmicroarrays. In: Brownstein MJ, Khodursky AB (eds) Functionalgenomics. Humana, Totowa, pp 61–78
Kim CC, Joyce EA, Chan K, Falkow S (2002) Improved analyticalmethods for microarray-based genome-composition analysis.Genome Biol 3(11):RESEARCH0065
Knight J (2001) When the chips are down. Nature 410(6831):860–861
270 Appl Microbiol Biotechnol (2006) 73:255–273
Kroll TC, Wolfl S (2002) Ranking: a closer look on globalisationmethods for normalisation of gene expression arrays. NucleicAcids Res 30(11):e50
Kromer JO, Sorgenfrei O, Klopprogge K, Heinzle E, Wittmann C(2004) In-depth profiling of lysine-producing Corynebacteriumglutamicum by combined analysis of the transcriptome, metab-olome, and fluxome. J Bacteriol 186(6):1769–1784
Kucho K, Okamoto K, Tsuchiya Y, Nomura S, Nango M, KanehisaM, Ishiura M (2005) Global analysis of circadian expression inthe cyanobacterium Synechocystis sp. strain PCC 6803.J Bacteriol 187(6):2190–2199
Kushner SR (1996) mRNA decay. In: Neidhard FC, Curtiss R,Ingraham JL et al (eds) Escherichia coli and Salmonella: cellularand molecular biology. ASM, Washington, DC, pp 849–860
Kushner SR (2002) mRNA decay in Escherichia coli comes of age.J Bacteriol 184(17):4658–4665; discussion 4657
Lander ES (1999) Array of hope. Nat Genet 21(Suppl 1):3–4Lashkari DA, DeRisi JL, McCusker JH, Namath AF, Gentile C,
Hwang SY, Brown PO, Davis RW (1997) Yeast microarrays forgenome wide parallel genetic and gene expression analysis. ProcNatl Acad Sci USA 94(24):13057–13062
Laub MT, McAdams HH, Feldblyum T, Fraser CM, Shapiro L (2000)Global analysis of the genetic network controlling a bacterial cellcycle. Science 290(5499):2144–2148
Lee ML, Kuo FC, Whitmore GA, Sklar J (2000) Importance ofreplication in microarray gene expression studies: statisticalmethods and evidence from repetitive cDNA hybridizations.Proc Natl Acad Sci USA 97(18):9834–9839
Lehner A, Loy A, Behr T, Gaenge H, Ludwig W, Wagner M, SchleiferKH (2005) Oligonucleotide microarray for identification ofEnterococcus species. FEMS Microbiol Lett 246(1):133–142
Lemmo AV, Rose DJ, Tisone TC (1998) Inkjet dispensing technol-ogy: applications in drug discovery. Curr Opin Biotechnol 9(6):615–617
Lindroos HL, Mira A, Repsilber D, Vinnere O, Naslund K, DehioM, Dehio C, Andersson SG (2005) Characterization of thegenome composition of Bartonella koehlerae by microarraycomparative genomic hybridization profiling. J Bacteriol 187(17):6155–6165
Lipshutz RJ, Fodor SP, Gingeras TR, Lockhart DJ (1999) Highdensity synthetic oligonucleotide arrays. Nat Genet 21(Suppl1):20–24
Lockhart DJ, Dong H, Byrne MC, Follettie MT, Gallo MV, Chee MS,Mittmann M, Wang C, Kobayashi M, Horton H, Brown EL(1996) Expression monitoring by hybridization to high-densityoligonucleotide arrays. Nat Biotechnol 14(13):1675–1680
Loy A, Lehner A, Lee N, Adamczyk J, Meier H, Ernst J, SchleiferKH, Wagner M (2002) Oligonucleotide microarray for 16SrRNA gene-based detection of all recognized lineages ofsulfate-reducing prokaryotes in the environment. Appl EnvironMicrobiol 68(10):5064–5081
Loy A, Schulz C, Lucker S, Schopfer-Wendels A, Stoecker K,Baranyi C, Lehner A, Wagner M (2005) 16S rRNA gene-based oligonucleotide microarray for environmental monitoringof the betaproteobacterial order “Rhodocyclales”. Appl EnvironMicrobiol 71(3):1373–1386
Lu Y, Lu S, Fotouhi F, Deng Y, Brown SJ (2004) Incremental geneticK-means algorithm and its application in gene expression dataanalysis. BMC Bioinformatics 5:172
Mascher T, Margulis NG, Wang T, Ye RW, Helmann JD (2003)Cell wall stress responses in Bacillus subtilis: the regulatorynetwork of the bacitracin stimulon. Mol Microbiol 50(5):1591–1604
Michaels GS, Carr DB, Askenazi M, Fuhrman S, Wen X, Somogyi R(1998) Cluster analysis and data visualization of large-scale geneexpression data. Pac Symp Biocomput 42–53
Mitterer G, Huber M, Leidinger E, Kirisits C, Lubitz W, MuellerMW, Schmidt WM (2004) Microarray-based identification ofbacteria in clinical samples by solid-phase PCR amplificationof 23S ribosomal DNA sequences. J Clin Microbiol 42(3):1048–1057
Mlecnik B, Scheideler M, Hackl H, Hartler J, Sanchez-Cabo F,Trajanoski Z (2005) PathwayExplorer: Web service for visualiz-ing high-throughput expression data on biological pathways.Nucleic Acids Res 33(Web Server issue):W633–W637
Molenaar D, Bringel F, Schuren FH, de Vos WM, Siezen RJ,Kleerebezem M (2005) Exploring Lactobacillus plantarumgenome diversity by using microarrays. J Bacteriol 187(17):6119–6127
Moore CM, Gaballa A, Hui M, Ye RW, Helmann JD (2005) Geneticand physiological responses of Bacillus subtilis to metal ionstress. Mol Microbiol 57(1):27–40
Mutch DM, Berger A, Mansourian R, Rytz A, Roberts MA (2002)The limit fold change model: a practical approach for selectingdifferentially expressed genes from microarray data. BMCBioinformatics 3:17
Nadon R, Shoemaker J (2002) Statistical issues with microarrays:processing and analysis. Trends Genet 18(5):265–271
Neidhard FC, Ingraham JL, Schaechter M (1990) Physiology of thebacterial cell. Sinauer, Sunderland
Nguyen C, Rocha D, Granjeaud S, Baldit M, Bernard K, Naquet P,Jordan BR (1995) Differential gene expression in the murinethymus assayed by quantitative hybridization of arrayed cDNAclones. Genomics 29(1):207–216
Ogura M, Yamaguchi H, Kobayashi K, Ogasawara N, Fujita Y,Tanaka T (2002) Whole-genome analysis of genes regulated bythe Bacillus subtilis competence transcription factor ComK.J Bacteriol 184(9):2344–2351
Oh MK, Liao JC (2000) Gene expression profiling by DNA micro-arrays and metabolic fluxes in Escherichia coli. Biotechnol Prog16(2):278–286
Oh MK, Rohlin L, Kao KC, Liao JC (2002) Global expressionprofiling of acetate-grown Escherichia coli. J Biol Chem 277(15):13175–13183
Okamoto T, Suzuki T, Yamamoto N (2000) Microarray fabricationwith covalent attachment of DNA using bubble jet technology.Nat Biotechnol 18(4):438–441
Pappas CT, Sram J, Moskvin OV, Ivanov PS, Mackenzie RC,Choudhary M, Land ML, Larimer FW, Kaplan S, Gomelsky M(2004) Construction and validation of the Rhodobacter sphaer-oides 2.4.1 DNA microarray: transcriptome flexibility at diversegrowth modes. J Bacteriol 186(14):4748–4758
Pashalidis S, Moreira LM, Zaini PA, Campanharo JC, Alves LM,Ciapina LP, Vencio RZ, Lemos EG, Da Silva AM, Da SilvaAC (2005) Whole-genome expression profiling of Xylellafastidiosa in response to growth on glucose. OMICS 9(1):77–90
Paustian ML, May BJ, Cao D, Boley D, Kapur V (2002) Transcrip-tional response of Pasteurella multocida to defined iron sources.J Bacteriol 184(23):6714–6720
Paustian ML, Kapur V, Bannantine JP (2005) Comparativegenomic hybridizations reveal genetic regions within theMycobacterium avium complex that are divergent from Myco-bacterium avium subsp. paratuberculosis isolates. J Bacteriol187(7):2406–2415
Petrov A, Shah S, Draghici S, Shams S (2002) Microarray imageprocessing and quality control. In: Shah S, Kamberova G (eds)DNA array image analysis—nuts & bolts. DNA, Eagleville, pp99–130
Phimister B (1999) Going global. Nat Genet 21(Suppl 1):1Polen T, Rittmann D, Wendisch VF, Sahm H (2003) DNA micro-
array analyses of the long-term adaptive response of Escher-
Appl Microbiol Biotechnol (2006) 73:255–273 271
ichia coli to acetate and propionate. Appl Environ Microbiol 69(3):1759–1774
Polen T, Kramer M, Bongaerts J, Wubbolts M, Wendisch VF (2005)The global gene expression response of Escherichia coli toL-phenylalanine. J Biotechnol 115(3):221–237
Quackenbush J (2002) Microarray data normalization and transfor-mation. Nat Genet 32(Suppl):496–501
Ramdas L, Wang J, Hu L, Cogdell D, Taylor E, Zhang W (2001)Comparative evaluation of laser-based microarray scanners.Biotechniques 31(3):546, 548, 550, passim
Ramsay G (1998) DNA chips: state-of-the art. Nat Biotechnol 16(1):40–44
Record MT, Reznikoff WS, Craig ML, McQuade KL, Schlax PJ(1996) Escherichia coli RNA polymerase, sigma70, promotors,and the kinetics of the steps of transcription initiation. In:Neidhard FC, Curtiss R, Ingraham JL et al (eds) Escherichiacoli and Salmonella: cellular and molecular biology. ASM,Washington, DC, pp 792–821
Reed KC, Mann DA (1985) Rapid transfer of DNA from agarosegels to nylon membranes. Nucleic Acids Res 13(20):7207–7221
Reen FJ, Boyd EF, Porwollik S, Murphy BP, Gilroy D, Fanning S,McClelland M (2005) Genomic comparisons of Salmonellaenterica serovar Dublin, Agona, and Typhimurium strainsrecently isolated from milk filters and bovine samples fromIreland, using a Salmonella microarray. Appl Environ Microbiol71(3):1616–1625
Rhodius V, Van Dyk TK, Gross C, LaRossa RA (2002) Impact ofgenomic technologies on studies of bacterial gene expression.Annu Rev Microbiol 56:599–624
Richardson JP, Greenblatt J (1996) Control of RNA chain elongationand termination. In: Neidhard FC, Curtiss R, Ingraham JL et al(eds) Escherichia coli and Salmonella: cellular and molecularbiology. ASM, Washington, DC, pp 822–848
Rossignol T, Dulau L, Julien A, Blondin B (2003) Genome-widemonitoring of wine yeast gene expression during alcoholicfermentation. Yeast 20(16):1369–1385
Rouillard JM, Zuker M, Gulari E (2003) OligoArray 2.0: design ofoligonucleotide probes for DNA microarrays using a thermody-namic approach. Nucleic Acids Res 31(12):3057–3062
Saito I, Sugiyama H, Furukawa N, Matsuura T (1981) Photoreactionof thymidine with primary amines. Application to specificmodification of DNA. Nucleic Acids Symp Ser 10:61–64
Salama N, Guillemin K, McDaniel TK, Sherlock G, Tompkins L,Falkow S (2000) A whole-genome microarray reveals geneticdiversity among Helicobacter pylori strains. Proc Natl Acad SciUSA 97(26):14668–14673
Salmon KA, Hung SP, Steffen NR, Krupp R, Baldi P, Hatfield GW,Gunsalus RP (2005) Global gene expression profiling inEscherichia coli K12: effects of oxygen availability and ArcA.J Biol Chem 280(15):15084–15096
Sanchez-Cortes S, Berenguel RM, Madejon A, Perez-Mendez M(2002) Adsorption of polyethyleneimine on silver nanoparticlesand its interaction with a plasmid DNA: a surface-enhancedRaman scattering study. Biomacromolecules 3(4):655–660
Schena M, Davis RW (2000) Technology standards for microarrayresearch. In: Schena M (ed) Microarray biochip technology.Eaton, Natick, pp 1–18
Schena M, Shalon D, Davis RW, Brown PO (1995) Quantitativemonitoring of gene expression patterns with a complementaryDNA microarray. Science 270(5235):467–470
Schena M, Shalon D, Heller R, Chai A, Brown PO, Davis RW (1996)Parallel human genome analysis: microarray-based expressionmonitoring of 1000 genes. Proc Natl Acad Sci USA 93(20):10614–10619
Schuchhardt J, Beule D, Malik A, Wolski E, Eickhoff H, Lehrach H,Herzel H (2000) Normalization strategies for cDNA microarrays.Nucleic Acids Res 28(10):E47
Searles RP (2003) Arrays for the masses-setting up a microarrayfacility. In: Blalock E (ed) A beginner's guide to microarrays.Kluwer, Boston, pp 123–149
Shchepinov MS, Case-Green SC, Southern EM (1997) Steric factorsinfluencing hybridisation of nucleic acids to oligonucleotidearrays. Nucleic Acids Res 25(6):1155–1161
Sherlock G (2000) Analysis of large-scale gene expression data. CurrOpin Immunol 12(2):201–205
Sherlock G, Ball CA (2005) Storage and retrieval of microarray dataand open source microarray database software. Mol Biotechnol30(3):239–251
Smulski DR, Huang LL, McCluskey MP, Reeve MJ, Vollmer AC, VanDyk TK, LaRossa RA (2001) Combined, functional genomic-biochemical approach to intermediary metabolism: interaction ofacivicin, a glutamine amidotransferase inhibitor, with Escher-ichia coli K-12. J Bacteriol 183(11):3353–3364
Southern EM (1975) Detection of specific sequences among DNAfragments separated by gel electrophoresis. J Mol Biol 98(3):503–517
Southern EM (2001) DNA microarrays. History and overview.Methods Mol Biol 170:1–15
Southern E, Mir K, Shchepinov M (1999) Molecular interactions onmicroarrays. Nat Genet 21(Suppl 1):5–9
Spellman PT, Miller M, Stewart J, Troup C, Sarkans U, Chervitz S,Bernhart D, Sherlock G, Ball C, Lepage M, Swiatek M, MarksWL, Goncalves J, Markel S, Iordan D, Shojatalab M, Pizarro A,White J, Hubley R, Deutsch E, Senger M, Aronow BJ, RobinsonA, Bassett D, Stoeckert CJ Jr, Brazma A (2002) Design andimplementation of microarray gene expression markup language(MAGE-ML). Genome Biol 3(9):RESEARCH0046
Spruill SE, Lu J, Hardy S, Weir B (2002) Assessing sources ofvariability in microarray gene expression data. Biotechniques 33(4):916–920, 922–923
Stabler RA, Marsden GL, Witney AA, Li Y, Bentley SD, Tag CMM,Hinds J (2005) Identification of pathogen-specific genes throughmicroarray analysis of pathogenic and commensal Neisseriaspecies. Microbiology 151(Pt 9):2907–2922
Sturn A, Quackenbush J, Trajanoski Z (2002) Genesis: cluster analysisof microarray data. Bioinformatics 18(1):207–208
Talaat AM, Hunter P, Johnston SA (2000) Genome-directed primersfor selective labeling of bacterial transcripts for DNA microarrayanalysis. Nat Biotechnol 18(6):679–682
Tamayo P, Slonim D, Mesirov J, Zhu Q, Kitareewan S, Dmitrovsky E,Lander ES, Golub TR (1999) Interpreting patterns of geneexpression with self-organizing maps: methods and application tohematopoietic differentiation. Proc Natl Acad Sci USA 96(6):2907–2912
Tao H, Gonzalez R, Martinez A, Rodriguez M, Ingram LO, PrestonJF, Shanmugam KT (2001) Engineering a homo-ethanol pathwayin Escherichia coli: increased glycolytic flux and levels ofexpression of glycolytic genes during xylose fermentation.J Bacteriol 183(10):2979–2988
Tseng GC, Oh MK, Rohlin L, Liao JC, Wong WH (2001) Issues incDNA microarray analysis: quality filtering, channel normaliza-tion, models of variations and assessment of gene effects. NucleicAcids Res 29(12):2549–2557
Vemuri GN, Aristidou AA (2005) Metabolic engineering in the-omicsera: elucidating and modulating regulatory networks. MicrobiolMol Biol Rev 69(2):197–216
Warrington JA, Dee S, Trulson M (2000) Large-scale genomic analysisusing Affymetrix GeneChip probe arrays. In: Schena M (ed)Microarray biochip technology. Eaton, Natick, pp 119–148
272 Appl Microbiol Biotechnol (2006) 73:255–273
Wen X, Fuhrman S, Michaels GS, Carr DB, Smith S, Barker JL,Somogyi R (1998) Large-scale temporal gene expressionmapping of central nervous system development. Proc Natl AcadSci USA 95(1):334–339
Wendisch VF, Zimmer DP, Khodursky A, Peter B, Cozzarelli N,Kustu S (2001) Isolation of Escherichia coli mRNA andcomparison of expression using mRNA and total RNA onDNA microarrays. Anal Biochem 290(2):205–213
Wildsmith SE, Elcock FJ (2001) Microarrays under the microscope.Mol Pathol 54(1):8–16
Wildsmith SE, Archer GE, Winkley AJ, Lane PW, Bugelski PJ (2001)Maximization of signal derived from cDNA microarrays.Biotechniques 30(1):202–206, 208
Worley J, Bechtol J, Penn S, Roach D (2000) A systems approach tofabricating and analyzing DNA microarrays. In: Schena M (ed)Microarray biochip technology. Eaton, Natick, pp 65–85
Wurmbach E, Yuen T, Sealfon SC (2003) Focused microarrayanalysis. Methods 31(4):306–316
Xiang CC, Brownstein MJ (2003) Fabrication of cDNA microarrays.In: Brownstein MJ, Khodursky A (eds) Functional genomics:methods and protocols. Humana, Totowa, pp 1–7
Xu Y (2004) Microarray gene expression data analysis. In: Zhou J,Thompson DK, Xu Y, Tiedje JM (eds) Microbial functionalgenomics. Wiley, Hoboken, pp 177–206
Yang YH, Speed T (2002) Design issues for cDNA microarrayexperiments. Nat Rev Genet 3(8):579–588
Yang IV, Chen E, Hasseman JP, Liang W, Frank BC, Wang S, SharovV, Saeed AI, White J, Li J, Lee NH, Yeatman TJ, Quackenbush J(2002a) Within the fold: assessing differential expressionmeasures and reproducibility in microarray assays. Genome Biol3(11):research0062
Yang YH, Dudoit S, Luu P, Lin DM, Peng V, Ngai J, Speed TP(2002b) Normalization for cDNA microarray data: a robustcomposite method addressing single and multiple slide system-atic variation. Nucleic Acids Res 30(4):e15
Ye RW, Wang T, Bedzyk L, Croker KM (2001) Applications of DNAmicroarrays in microbial systems. J Microbiol Methods 47(3):257–272
Yuen T, Wurmbach E, Pfeffer RL, Ebersole BJ, Sealfon SC (2002)Accuracy and calibration of commercial oligonucleotide andcustom cDNA microarrays. Nucleic Acids Res 30(10):e48
Zammatteo N, Jeanmart L, Hamels S, Courtois S, Louette P, Hevesi L,Remacle J (2000) Comparison between different strategies ofcovalent attachment of DNA to glass surfaces to build DNAmicroarrays. Anal Biochem 280(1):143–150
Zhou J, Thompson DK (2004) DNA microarray technology. In: ZhouJ, Thompson DK, Xu Y, Tiedje JM (eds) Microbial functionalgenomics. Wiley, Hoboken, pp 141–176
Zhou YX, Kalocsai P, Chen JY, Shams S (2000) Informationprocessing issues and solutions associated with microarraytechnology. In: Schena M (ed) Microarray biochip technology.Eaton, Natick, pp 167–200
Appl Microbiol Biotechnol (2006) 73:255–273 273