Overview Features
492
ISBN: 0-767-43022-0 Description: ©2003 / Softcover / 528 pages Publication Date: July 2002 Overview This general introduction to contemporary physical anthropology presents balanced coverage of the major components of the field: genetics and evolutionary theory, human variation, human evolution, and the biology, behavior, and evolution of primates. Features • All areas of contemporary biological anthropology are covered: genetics, evolutionary theory, primate behavior, the fossil record, and material often neglected in introductory texts such as adaptation, human health and disease and demography, and human growth. • The relationship between biology and culture is a major focus throughout the text. • Behavioris discussed in an evolutionary context. • The emphasis is on the human species within the primate order. Discussions of mammals and nonhuman primates continually refer back to their potential relevance for understanding the human species. • Hypothesis testing is emphasized throughout.
-
Upload
khangminh22 -
Category
Documents
-
view
0 -
download
0
Transcript of Overview Features

ISBN: 0-767-43022-0
Description: ©2003 / Softcover / 528 pages
Publication Date: July 2002
OverviewThis general introduction to contemporary physical anthropology presents balanced coverage of themajor components of the field: genetics and evolutionary theory, human variation, humanevolution, and the biology, behavior, and evolution of primates.
Features• All areas of contemporary biological anthropology are covered: genetics, evolutionary
theory, primate behavior, the fossil record, and material often neglected in introductory textssuch as adaptation, human health and disease and demography, and human growth.
• The relationship between biology and culture is a major focus throughout the text.
• Behavioris discussed in an evolutionary context.
• The emphasis is on the human species within the primate order. Discussions of mammalsand nonhuman primates continually refer back to their potential relevance for understandingthe human species.
• Hypothesis testing is emphasized throughout.
Relethford: The Human Species: An Introduction to Biological Anthropology, 5/e
Front Matter Preface © The McGraw−Hill Companies, 2003
Preface
xiii
This text introduces the field of biological anthropology (also known asphysical anthropology), the science concerned with human biological
evolution and variation. The text addresses the major questions that concernbiological anthropologists: “What are humans?” “How are we similar to anddifferent from other animals?” “Where are our origins?” “How did we evolve?”“Are we still evolving?” “How are we different from one another?” and “Whatdoes the future hold for the human species?”
ORGANIZATION
This book is divided into four parts. Part I, “Evolutionary Background,” pro-vides basic background in genetics and evolutionary theory used through-out the remainder of the book. Chapter 1 provides a general introduction tothe science of biological anthropology, the nature of science, and the historyof evolutionary thought. Chapter 2 reviews molecular and Mendelian genet-ics as applied to humans, providing genetic background for later chaptersand including a basic review of cell biology for those whose high school biol-ogy is a bit rusty. Chapter 3 focuses on the evolutionary forces, the mecha-nisms that produce evolutionary change within populations. Chapter 4 looksat evolution over longer periods of time, focusing on the origin of newspecies, and includes a brief review of the history of life on our planet.
Part II, “Human Biological Variation,” examines biological variation inour species today from an evolutionary perspective. Chapter 5 focuses on theanalysis of human variation, including a contrast between racial and evolu-tionary approaches to variation. Chapter 6 reviews a number of case studiesof human microevolution, with particular emphasis on natural selection.Chapter 7 continues examining human variation from the broad perspectiveof human adaptation, both biological and cultural.
Part III, “Our Place in Nature,” examines the biology, behavior, and evo-lution of the primates, the group of mammals to which humans belong. A

Relethford: The Human Species: An Introduction to Biological Anthropology, 5/e
Front Matter Preface © The McGraw−Hill Companies, 2003
main focus of this section are the questions “What are humans?” and “Howare we related to other living creatures?” Chapter 8 examines issues in classi-fication and looks at the basic biology and behavior of mammals in general,and primates in particular. Chapter 9 looks at the different types of primatesin terms of classification, biology, and behavior, with particular attentiongiven to our close relatives, the apes. Chapter 10 looks specifically at thehuman species and includes a comparison of human traits with those ofapes. Chapter 11 provides some background on the analysis of the fossilrecord and summarizes the major events of primate origins and evolution,from the time of the disappearance of the dinosaurs 65 million years ago tothe split of ape and human lines 6–5 million years ago.
Part IV deals with “Human Evolution” in both a biological and a cul-tural sense. Chapter 12 begins with a brief review of human evolutionary his-tory and follows with a detailed summary of the earliest hominids and theorigin of bipedalism. Chapter 13 examines the origin and biological and cul-tural evolution of the genus Homo. Chapter 14 looks at the fossil, archaeo-logical, and genetic evidence for the origin of modern humans and includesa discussion of current controversies (Did modern humans evolve through-out the world, or are our recent ancestors exclusively from Africa?). Chap-ter 15 examines recent human evolution (over the past 12,000 years) and fo-cuses on the biological impact of culture change, with particular emphasison changing patterns of disease, mortality, fertility, and population growth.
The organization of this text reflects my own teaching preference for fourunits arranged in the same sequence. Not all instructors will use the same se-quence of chapters. Some may prefer a different arrangement of topics. I haveattempted to write chapters in such a way as to accommodate such changeswhenever possible. Although I prefer to discuss human variation (Chapters 5–7)before the fossil record of human evolution (Chapters 12–14), others preferthe reverse, and the chapters have been written and revised so that this alter-native organizational structure can be used.
FEATURES
Throughout the text, I have attempted to provide new material relevant tothe field and fresh treatments of traditional material. Key features includethe following:
■ All areas of contemporary biological anthropology are covered. In addi-tion to traditional coverage of areas such as genetics, evolutionary the-ory, primate behavior, and the fossil record, the text includes materialoften neglected in introductory texts, including human growth, epide-miology, and demography.
■ The relationship between biology and culture is a major focus. The bio-cultural framework is introduced in the first chapter and integratedthroughout the text.
■ Behavior is discussed in an evolutionary context. The evolutionary natureof primate and human behavior is emphasized in a number of chap-
xiv Preface

Relethford: The Human Species: An Introduction to Biological Anthropology, 5/e
Front Matter Preface © The McGraw−Hill Companies, 2003
ters, including those on primate biology and behavior (Chapters 8–10)and the fossil record of human evolution (Chapters 12–14).
■ Emphasis is on the human species in its context within the primateorder. Discussions of mammals and nonhuman primates continuallyrefer to their potential relevance for understanding the human species.In fact, Chapter 10 is devoted entirely to treating our species from acomparative perspective.
■ Hypothesis testing is emphasized. From the first chapter, where stu-dents are introduced to the scientific method, I emphasize how varioushypotheses are tested. Rather than provide a dogmatic approach with all the “right” answers, the text examines evidence in the context ofhypothesis testing. With this emphasis, readers can see how new datacan lead to changes in basic models and can better understand the “bigpicture” of biological anthropology.
NEW TO THIS EDITION
Every chapter has been revised in light of new findings in the field and com-ments from users of the fourth edition. In addition, certain parts of the text’sstructure have been changed based on the helpful feedback I received fromcolleagues. To make the text as clear, accessible, and up-to-date as possible,I’ve made the following specific changes:
■ The chapter on macroevolution and the origin of species has beenplaced earlier in the book (Chapter 4) to better link the evolutionaryforces with long-term patterns of evolutionary change.
■ The chapters on disease and demography have been streamlined andcombined into a single chapter (Chapter 15) organized around the bio-logical impact of culture change.
■ Discussion of the human fossil record has been substantially rewrittento include three new species (Orrorin tugenensis, Kenyanthropus platyops,and Australopithecus garhi) and new information, such as Homo erectusin Europe, Acheulian-like tools in Asia, and new studies of NeandertalDNA.
■ A number of new topics have been added. Additions include the HumanGenome Project, quantitative genetics and sexual orientation, the evolu-tion of cystic fibrosis genes, an entire section on nutritional adaptation(Chapter 7), critiques of the “small but healthy” hypothesis, primatebehavioral ecology, evolutionary significance of parent–child cosleeping,pollution and human biology, and the emergence and reemergence ofinfectious disease.
STUDY HELPS
To make the text more accessible and interesting, I have included frequentexamples and illustrations of basic ideas as well as abundant maps to help
Preface xv

Relethford: The Human Species: An Introduction to Biological Anthropology, 5/e
Front Matter Preface © The McGraw−Hill Companies, 2003
orient students. I have kept the technical jargon to a minimum, yet every in-troductory text contains a number of specialized terms that students mustlearn. The first mention of these terms in the text appears in boldface typeand accompanying short definitions appear in the text margins. A glossary isprovided at the end of the book, often with more detailed definitions.
Each chapter ends with a summary and a list of supplemental readings.A short list of useful Internet resources has been added to each chapter. Sev-eral appendices provide additional reference material, including a primer onmathematical population genetics, a list of primate species, and a short re-view of comparative primate anatomy. A list of references appears at the endof the book, providing the complete reference for studies cited in the text.
ANCILLARIES
The Instructor’s Manual includes a test bank of more than 700 questions, aswell as chapter overviews and outlines, topics for class discussion, andsources for laboratory equipment. A Computerized Test Bank is availablefree of charge to qualifying adopters. Also available to qualifying adopters isa package of 80 color and black-and-white transparency acetates. In addi-tion, an Online Learning Center is available to both instructors and studentsat www.mhhe.com/relethford5.
ACKNOWLEDGMENTS
My thanks go to the dedicated and hardworking people at McGraw-Hill,both those I have dealt with personally and the others behind the scenes. I givespecial thanks to Jan Beatty, my initial sponsoring editor, for continued en-couragement and support throughout the history of this text. Thanks alsoto Phil Butcher, the publisher at McGraw-Hill, for providing a smooth tran-sition to a new company. I also appreciate Kevin Witt, my new sponsoringeditor, for his help and insight. Special thanks to Holly Paulsen, productioneditor, for her excellence and professionalism and her uncanny ability to readmy scribbled notes. Thanks also to Marty Granahan, permissions editor; KayMikel, manuscript editor; Jean Mailander, design manager; Robin Mouat, artmanager; and Brian Pecko, photo researcher.
I also thank my colleagues who served as reviewers:
David Begun, University of Toronto Susan Pfieffer, University of TorontoRichard Davis, Bryn Mawr College Brian Richmond, University of IllinoisGreg Laden, University of Minnesota Robert Shanafelt, University of FloridaWilliam Leonard, Northwestern University Richard Sherwood, University of WisconsinDebra Overdorff, University of Texas Andrea Wiley, James Madison University
Having been a reviewer myself, I appreciate the extensive time and effort theseindividuals have taken. I also thank other colleagues who have offered manyvaluable suggestions regarding structure and/or content: Gary Heathcote, Uni-
xvi Preface
Relethford: The Human Species: An Introduction to Biological Anthropology, 5/e
Front Matter Preface © The McGraw−Hill Companies, 2003
versity of Guam; Lorena Madrigal, University of South Florida; Brandy O’Neill,University of Pennsylvania; and J. Kenneth Smail, Kenyon College. I onlyknow one of you in person, but thank you all for your valuable suggestions.
Last, but not least, I dedicate this as always to my family. To my wonder-ful sons, David, Benjamin, and Zane—thanks for all the smiles and hugs, whichmake it all worthwhile. Thanks also for all those questions that really makeme think (the ones I couldn’t answer as well as those I could). Finally, to mywife, Hollie, love of my life and best friend—thanks for love, friendship, andsupport. I couldn’t have done this without you.
Preface xvii
Relethford: The Human Species: An Introduction to Biological Anthropology, 5/e
I. Evolutionary Background Introduction © The McGraw−Hill Companies, 2003
PA R T I
EvolutionaryBackground
How does life change over time? A variety of evidence,ranging from the fossil record to anatomic and ge-netic comparisons of living organisms, shows us thatall life has a common origin and that the diversity inliving creatures (including humans) is the result ofbiological evolution. The science of biological an-thropology is one of a number of fields that deal withevolution: in this case, the evolution of humans andtheir close relatives. How does evolution occur? Thefirst section of this book looks at the evolutionaryprocess. Chapter 1 provides background on the rela-tionship of evolutionary science to biological anthro-pology and the historical development of evolution-ary thought. Chapter 2 provides a review of somebasic concepts of human genetics that are necessaryfor understanding evolution. Chapter 3 builds onthis background to focus on the details of the evolu-tionary process. Chapter 4 extends these ideas to evo-lution over long periods of time, including the originof new species.

Relethford: The Human Species: An Introduction to Biological Anthropology, 5/e
I. Evolutionary Background 1. Biological Anthropology and Evolution
© The McGraw−Hill Companies, 2003
C H A P T E R 1Biological Anthropologyand Evolution
3
What is anthropology? To many people, it is the study of the exotic extremes of human nature. To others, it is the study of ancient ruins
and lost civilizations. The study of anthropology seems strange to many, andthe practitioners of this field, the anthropologists, seem even stranger. Thestereotype of an anthropologist is a pith-helmeted, pipe-smoking eccentric,tracking chimpanzees through the forest, digging up the bones of million-year-old ancestors, interviewing lost tribes about their sexual customs, andrecording the words of the last speakers of a language. Another popularimage presented in the media is Indiana Jones, the intrepid archaeologist ofthe film Raiders of the Lost Ark. Here is a man who is versed in the customsand languages of many societies past and present, feels at home anywhere inthe world, and makes a living teaching, finding lost treasures, rescuing beau-tiful women in distress, and fighting Nazis (Figure 1.1).
Of course, Indiana Jones is a fictional character and more a treasurehunter than a scientific archaeologist. However, some real-life anthropolo-gists are almost as well known: Jane Goodall, the late Margaret Mead, thelate Louis Leakey, and the late Dian Fossey. These anthropologists have stud-ied chimpanzees, Samoan culture, the fossils of human ancestors, and goril-las. Their research conjures up images of anthropology every bit as varied asthe imaginary adventures of Indiana Jones. Anthropologists do study allthese things and more. The sheer diversity of topics investigated by anthro-pologists seems almost to defy any sort of logic. The methods of data collec-tion and analysis are almost as diverse. What pulls these different subjectstogether?
Paleoanthropologist Bill Kimble of the Institute of Human Origins examines a fossil of a human ancestor from Ethiopia. Biological anthropology is thestudy of the biological evolution and variation of the human species. The fossilrecord is one source of information on our evolution. (© Enrico Ferorelli)
▲

Relethford: The Human Species: An Introduction to Biological Anthropology, 5/e
I. Evolutionary Background 1. Biological Anthropology and Evolution
© The McGraw−Hill Companies, 2003
In one obvious sense, they all share an interest in the same subject—human beings. In fact, the traditional textbook definition of anthropology isthe “study of humans.” Though this definition is easy to remember, it is notterribly useful. After all, scientists in other fields, such as researchers inanatomy and biochemistry, also study humans. And there are many fieldswithin the social sciences whose sole interest is humans. History, geography,political science, economics, sociology, and psychology are all devoted to thestudy of human beings, and no one would argue that these fields are merelybranches of anthropology.
WHAT IS ANTHROPOLOGY?
What, then, is a suitable definition of anthropology? Anthropology couldbe described as the science of human cultural and biological variation andevolution. The first part of this definition includes both human culture andbiology. Culture is shared learned behavior. Culture includes social and eco-nomic systems, marriage customs, religion, philosophy, and all other behav-iors that are acquired through the process of learning rather than throughinstinct. The joint emphasis on culture and biology is an important featureof anthropology, and one that sets it apart from many other fields. A bio-chemist may be interested in specific aspects of human biology and may con-sider the study of human cultural behaviors less important. To a sociologist,cultural behaviors and not human biology are the main focus of attention.Anthropology, however, is characterized by a concern with both culture andbiology as vital in understanding the human condition.
4 PART I ■ Evolutionary Background
FIGURE 1.1
Indiana Jones, the fictionalarchaeologist who serves as many people’s model for an anthropologist. (EverettCollection)
anthropology The sciencethat investigates humanbiological and culturalvariation and evolution.
culture Behavior that isshared, learned, and sociallytransmitted.
I I I I I I I

Relethford: The Human Species: An Introduction to Biological Anthropology, 5/e
I. Evolutionary Background 1. Biological Anthropology and Evolution
© The McGraw−Hill Companies, 2003
Biology and CultureTo the anthropologist, humans must be understood in terms of sharedlearned behavior as well as biology. We rely extensively on learned behaviorsin virtually all aspects of our lives. Even the expression of our sexual drivesmust be understood in light of human cultural systems. Although the actualbasis of our sex drive is biological, the ways in which we express it are shapedby behaviors we have learned. The very inventiveness of humans, with ourvast technology, is testimony to the powerful effect of learning. However, weare not purely cultural creatures. We are also biological organisms. We needto eat and breathe, and we are affected by our external environment. In addi-tion, our biology sets certain limits on our potential behaviors. For example,all human cultures have some type of social structure that provides for thecare of children until they are old enough to fend for themselves. This is notsimply kindness to children; our biological position as mammals requiressuch attentiveness to children for survival. In contrast with other animalspecies, whose infants need little or no care, human infants are physically in-capable of taking care of themselves.
Anthropology is concerned not only with culture and biology but alsowith their interaction. Just as humans are not solely cultural or solely biolog-ical, we are not simply the sum of these two either. Humans are bioculturalorganisms, which means that our culture and biology influence each other.The biocultural approach to studying human beings is a main theme ofthis book, and you will examine many examples of biocultural interaction.For now, however, consider one—population growth (which will be coveredin greater detail in Chapter 15). The growth of a population depends, in part,on how many people are born relative to how many die. If more people areborn than die in a given period of time, then the population will grow. Obvi-ously, population growth is in part caused by biological factors affecting thebirth and death rates. A variety of cultural factors, such as economic systemand marriage patterns, also affect population growth. Many factors, includ-ing technological changes and ideological outlooks, affect the birth rate. De-velopments in medicine and medical care change the death rate. The entireprocess of population growth and its biological and cultural implications isconsiderably more complicated than described here. The basic point, how-ever, should be clear: By studying the process of population growth, we cansee how cultural factors affect biological factors and vice versa.
The biocultural perspective of anthropology points to one of the uniquestrengths of anthropology as a science: It is holistic, meaning that it takesinto consideration all aspects of human existence. Population growth againprovides an example. Where the sociologist may be concerned with effects ofpopulation growth on social structure and the psychologist may be concernedwith effects of population growth on psychological stress, the anthropolo-gist is interested potentially in all aspects of population growth. In a givenstudy, this analysis may include the relationship among diet, fertility, reli-gion, disease, social systems, and political systems, to name but a few factors.
CHAPTER 1 ■ Biological Anthropology and Evolution 5
biocultural approachStudying humans in termsof the interaction betweenbiology and culture inevolutionary adaptation.
holistic Integrating allaspects of existence inunderstanding humanvariation and evolution.
I I I I I I I

Relethford: The Human Species: An Introduction to Biological Anthropology, 5/e
I. Evolutionary Background 1. Biological Anthropology and Evolution
© The McGraw−Hill Companies, 2003
The biocultural nature of anthropology makes it a difficult subject toclassify in college catalogs. By now you are aware that different academic de-partments are grouped under the arts, humanities, natural sciences, mathe-matics, and social sciences. Where does anthropology, with its interest inboth human culture and biology, fit in? Is it a natural science or a social sci-ence? Most colleges and universities place departments of anthropology withthe social sciences, primarily because historically most anthropologists havebeen concerned with cultural anthropology. Many schools, however, allowcompletion of a biological anthropology course to fulfill a natural science re-quirement. The distinctions drawn between different branches of learningshould not prevent you from seeing that anthropology has strong ties withboth the natural and social sciences.
VariationA major characteristic of anthropology is its concern with variation. In ageneral sense, variation refers to differences among individuals or popula-tions. The anthropologist is interested in differences and similarities amonghuman groups in terms of both biology and culture. Anthropologists usethe comparative approach to attempt to generalize about those aspects ofhuman behavior and biology that are similar in all populations and thosethat are unique to specific environments and cultures. How do groups of peo-ple differ from one another? Why do they differ? These are questions aboutvariation, and they apply equally to cultural and biological traits (Figure 1.2).For example, do all human cultures practice the same marriage customs?(They don’t.) Are there discernible reasons one group has a certain type ofmarriage system? An example of a biological trait that raises questions aboutvariation is skin color. Can groups be characterized by a certain skin color,or does skin color vary within groups? Is there any pattern in the distribu-tion of skin color that makes sense in terms of environmental differences?
EvolutionEvolution is change in living organisms over time. Both cultural and biolog-ical evolution interest anthropologists. How and why do human culture andbiology change? For example, anthropologists may be interested in the ori-gin of marriage systems. When, how, and why did certain marriage systemsevolve? For that matter, when did the custom of marriage first originate, andwhy? As for skin color, an anthropologist would be interested in what skincolor the first humans may have had and where, when, how, and why otherskin colors may have evolved.
AdaptationIn addition to the concepts of variation and evolution, the anthropologist isinterested in the process of adaptation. At the broadest level, adaptations
6 PART I ■ Evolutionary Background
variation The differencesthat exist among individualsor populations.
comparative approachComparing humanpopulations to determinecommon and uniquebehaviors or biologicaltraits.
evolution Change inpopulations of organismsfrom one generation to the next.
adaptation The process of successful interactionbetween a population andan environment.
I I I I I I I

Relethford: The Human Species: An Introduction to Biological Anthropology, 5/e
I. Evolutionary Background 1. Biological Anthropology and Evolution
© The McGraw−Hill Companies, 2003
are advantageous changes. Any aspect of biology or behavior that conferssome advantage on an individual or population can be considered an adap-tation. Cultural adaptations include technological devices such as clothing,shelter, and methods of food production. Such technologies can improve thewell-being of humans. Cultural adaptations also include social systems andrules for behaviors. For example, the belief in certain societies that sexual re-lations with a woman must be avoided for some time after she gives birthcan be adaptive in the sense that these behaviors influence the rate of popu-lation growth.
Cultural adaptations may vary in their effect on different members of apopulation. What is adaptive for some people may not be adaptive for oth-ers. For example, changes in certain tax laws may be advantageous for cer-tain income groups and disadvantageous for others. Beliefs that reduce pop-ulation growth can be adaptive in certain environments but nonadaptive inothers.
Adaptations can also be biological. Some biological adaptations are physio-logical in nature and involve metabolic changes. For example, when you aretoo hot, you will sweat. Sweating is a short-term physiological response thatremoves excess heat through the process of evaporation. Within limits, itaids in maintaining a constant body temperature. Likewise, shivering is anadaptive response to cold. The act of shivering increases metabolic rate andprovides more heat.
Biological adaptations can also be genetic in nature. Here, changes in genesover many generations produce variation in biological traits. The darker skincolor of many humans native to regions near the equator is one example of along-term genetic adaptation. The darker skin provides protection from the
FIGURE 1.2
Biological variation in a groupof children. (© Jeffry Myers/StockBoston)
CHAPTER 1 ■ Biological Anthropology and Evolution 7

Relethford: The Human Species: An Introduction to Biological Anthropology, 5/e
I. Evolutionary Background 1. Biological Anthropology and Evolution
© The McGraw−Hill Companies, 2003
harmful effects of ultraviolet radiation (see Chapter 6 for more informationon skin color and variation).
Anthropologists look at patterns of human variation and evolution inorder to understand the nature of cultural and biological adaptations. Insome cases, explanations are relatively clear, whereas in others we still seekexplanations for the adaptive value of any given behavior or trait. In such aquest, we must always remember two important rules about adaptation.First, adaptations are often specific to a particular environment. What isadaptive in one environment may not be in another environment. Second, wemust keep in mind that not all aspects of behavior or biology are adaptive.Some people have earlobes that are attached to the skin of their skulls,whereas others have earlobes that hang free. There is no adaptive significanceto either trait.
The Subfields of AnthropologyIn a general sense, anthropology is concerned with determining what hu-mans are, how they evolved, and how they differ from one another. Whereother disciplines focus on specific issues of humanity, anthropology isunique in dealing simultaneously with questions of origins, evolution, varia-tion, and adaptation.
Even though anthropology has a wide scope and appears to encompassanything and everything pertaining to humans, the study of anthropologyin North America is often characterized by four separate subfields, each witha specific focus. These four subfields are cultural anthropology, archaeology,linguistic anthropology, and biological anthropology. Some anthropologistsadd a fifth subfield—applied anthropology, which is concerned with the ap-plication of anthropological findings to contemporary matters and issues.Whether one characterizes applied anthropology as a separate subfield or asthe practical extension of research in the four subfields, there is growing interest (and employment) in areas in which anthropological ideas and methods can add value. Some examples include public health, economic pol-icy, agricultural and industrial development, and population control, toname a few.
Cultural Anthropology Cultural anthropology deals primarily with vari-ation in the cultures of populations in the present or recent past. Its subjectsinclude social, political, economic, and ideological aspects of human cul-tures. Cultural anthropologists look at all aspects of behavior within a soci-ety. Even when they are interested in a specific aspect of a culture, such asmarriage systems, they look at how these behaviors relate to all other aspectsof culture. Marriage systems, for example, may have an effect on the sys-tem of inheritance and may also be closely related to religious views. Com-parison of cultures is used to determine common and unique features amongdifferent cultures. Information from this subfield will be presented later inthe book to aid in the interpretation of the relationship between human cul-ture and biology.
8 PART I ■ Evolutionary Background
cultural anthropology Thesubfield of anthropologythat focuses on variations incultural behaviors amonghuman populations.
I I I I I I I

Relethford: The Human Species: An Introduction to Biological Anthropology, 5/e
I. Evolutionary Background 1. Biological Anthropology and Evolution
© The McGraw−Hill Companies, 2003
Archaeology Archaeology is the study of cultural behaviors in the his-toric and prehistoric past. The archaeologist deals with such remains of pastsocieties as tools, shelters, remains of animals eaten for food, and other ob-jects that have survived. These remains, termed artifacts, are used to recon-struct past behavior. To help fill in the gaps, the archaeologist makes use ofthe findings of cultural anthropologists who have studied similar societies.Archaeological findings are critical in understanding the behavior of earlyhumans and their evolution. Some of these findings for the earliest humansare presented later in this text.
Linguistic Anthropology Linguistic anthropology is the study of lan-guage. Spoken language is a behavior that appears to be uniquely human.This subfield of anthropology deals with the analysis of languages usually innonliterate societies and with general trends in the evolution of languages. Amajor question raised by linguistic anthropology concerns the extent towhich language shapes culture. Is language necessary for the transmission ofculture? Does a language provide information about the beliefs and prac-tices of a human culture?
Biological anthropology must consider many of the findings of linguis-tic anthropology in the analysis of human variation and evolution. Whencomparing humans and apes, we must ask whether language is a uniquehuman characteristic. If it is, then what biological and behavioral differencesexist between apes and humans that lead to the fact that one species has lan-guage and the other lacks it? Linguistics is also important in consideringhuman evolution. When did language begin? Why?
Biological Anthropology The subject of this book is the subfield of bio-logical anthropology, which is concerned with the biological evolution andvariation of the human species, past and present. Biological anthropology isoften referred to by another name—physical anthropology. The course you arecurrently enrolled in might be known by either name. Actually, the twonames refer to the same field. Early in the twentieth century the field wasfirst known as physical anthropology, reflecting its then primary interest inthe physical variation of past and present humans and our primate relatives.Much of the research in the field focused on descriptive studies of physicalvariations, with little theoretical background. Starting in the 1950s, physicalanthropologists became more familiar with the rapidly growing fields of ge-netics and evolutionary science. As a result, the field of physical anthropol-ogy became more concerned with biological processes, particularly with ge-netics. After a while, many in the field began using the term biologicalanthropology to emphasize the new focus on biological processes. In most cir-cles today, the two terms are used more or less interchangeably.
It is useful to consider the field of biological anthropology in terms of fourmajor questions it seeks to answer. First, What are humans? That is, how are werelated to other living creatures? Who are our closest living relatives? Whatmakes us similar to other living creatures? How are we unique? A secondmajor question concerns our past. What is the fossil record for human evolution?
CHAPTER 1 ■ Biological Anthropology and Evolution 9
archaeology The subfieldof anthropology that focuseson cultural variation inprehistoric (and somehistoric) populations byanalyzing the culture’sremains.
linguistic anthropologyThe subfield of anthropologythat focuses on the natureof human language, therelationship of language toculture, and the languagesof nonliterate peoples.
biological anthropologyThe subfield of anthropologythat focuses on the biologicalevolution of humans andhuman ancestors, therelationship of humans to other organisms, and patterns of biologicalvariation within and amonghuman populations. Alsoreferred to as physicalanthropology.
I I I I I I I
Relethford: The Human Species: An Introduction to Biological Anthropology, 5/e
I. Evolutionary Background 1. Biological Anthropology and Evolution
© The McGraw−Hill Companies, 2003
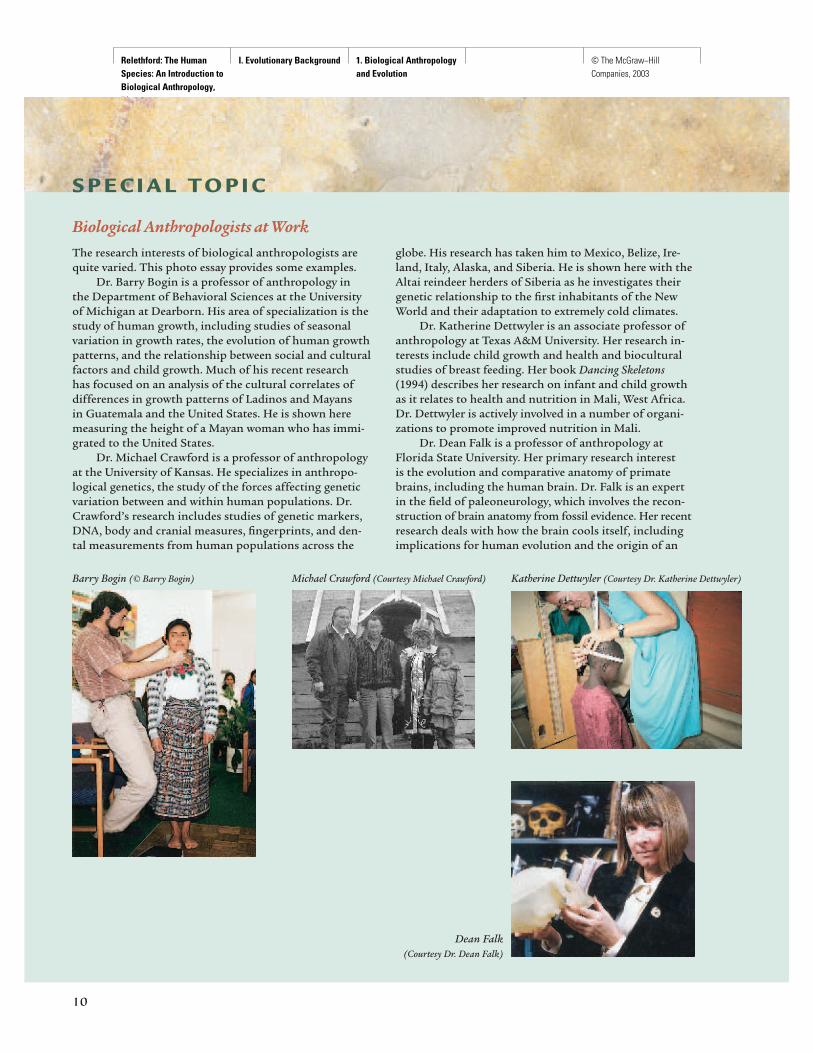
S P E C I A L T O P I C
Biological Anthropologists at WorkThe research interests of biological anthropologists arequite varied. This photo essay provides some examples.
Dr. Barry Bogin is a professor of anthropology in the Department of Behavioral Sciences at the Universityof Michigan at Dearborn. His area of specialization is thestudy of human growth, including studies of seasonalvariation in growth rates, the evolution of human growthpatterns, and the relationship between social and culturalfactors and child growth. Much of his recent research has focused on an analysis of the cultural correlates ofdifferences in growth patterns of Ladinos and Mayans in Guatemala and the United States. He is shown heremeasuring the height of a Mayan woman who has immi-grated to the United States.
Dr. Michael Crawford is a professor of anthropologyat the University of Kansas. He specializes in anthropo-logical genetics, the study of the forces affecting geneticvariation between and within human populations. Dr.Crawford’s research includes studies of genetic markers,DNA, body and cranial measures, fingerprints, and den-tal measurements from human populations across the
globe. His research has taken him to Mexico, Belize, Ire-land, Italy, Alaska, and Siberia. He is shown here with theAltai reindeer herders of Siberia as he investigates theirgenetic relationship to the first inhabitants of the NewWorld and their adaptation to extremely cold climates.
Dr. Katherine Dettwyler is an associate professor ofanthropology at Texas A&M University. Her research in-terests include child growth and health and bioculturalstudies of breast feeding. Her book Dancing Skeletons(1994) describes her research on infant and child growthas it relates to health and nutrition in Mali, West Africa.Dr. Dettwyler is actively involved in a number of organi-zations to promote improved nutrition in Mali.
Dr. Dean Falk is a professor of anthropology atFlorida State University. Her primary research interest is the evolution and comparative anatomy of primatebrains, including the human brain. Dr. Falk is an expertin the field of paleoneurology, which involves the recon-struction of brain anatomy from fossil evidence. Her recentresearch deals with how the brain cools itself, includingimplications for human evolution and the origin of an
Barry Bogin (© Barry Bogin) Michael Crawford (Courtesy Michael Crawford)
Dean Falk (Courtesy Dr. Dean Falk)
Katherine Dettwyler (Courtesy Dr. Katherine Dettwyler)
10
Relethford: The Human Species: An Introduction to Biological Anthropology, 5/e
I. Evolutionary Background 1. Biological Anthropology and Evolution
© The McGraw−Hill Companies, 2003
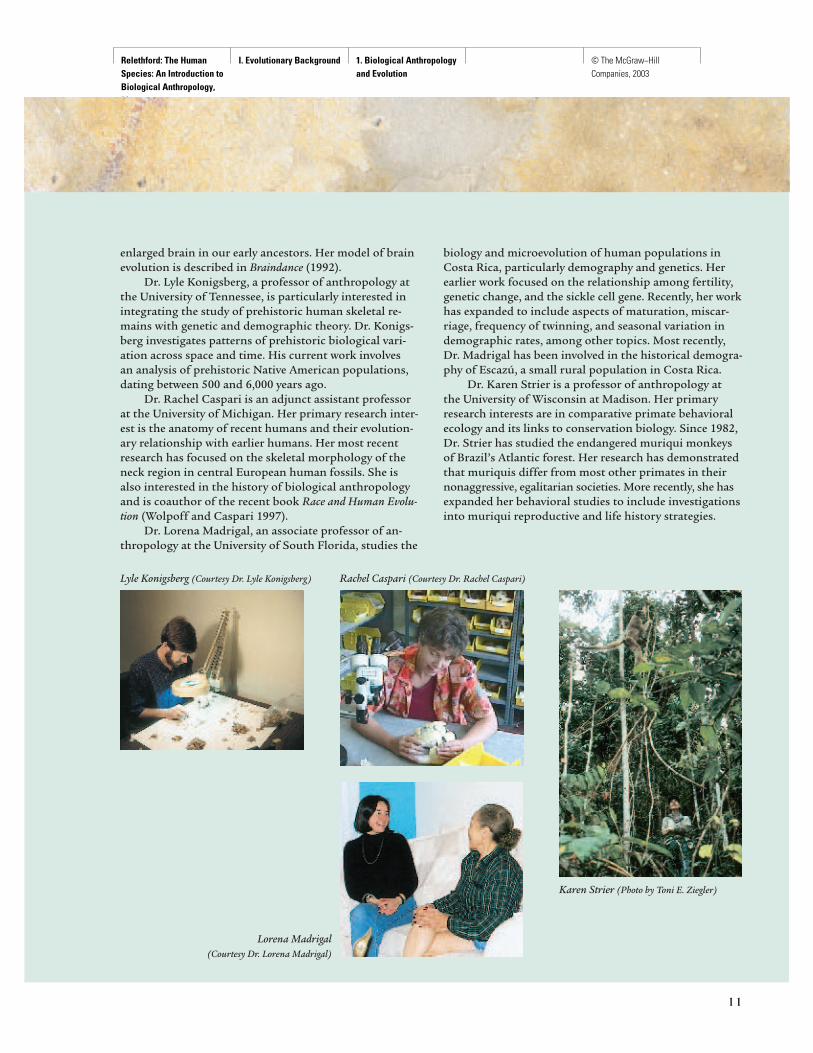
enlarged brain in our early ancestors. Her model of brainevolution is described in Braindance (1992).
Dr. Lyle Konigsberg, a professor of anthropology atthe University of Tennessee, is particularly interested inintegrating the study of prehistoric human skeletal re-mains with genetic and demographic theory. Dr. Konigs-berg investigates patterns of prehistoric biological vari-ation across space and time. His current work involves an analysis of prehistoric Native American populations,dating between 500 and 6,000 years ago.
Dr. Rachel Caspari is an adjunct assistant professorat the University of Michigan. Her primary research inter-est is the anatomy of recent humans and their evolution-ary relationship with earlier humans. Her most recentresearch has focused on the skeletal morphology of theneck region in central European human fossils. She isalso interested in the history of biological anthropologyand is coauthor of the recent book Race and Human Evolu-tion (Wolpoff and Caspari 1997).
Dr. Lorena Madrigal, an associate professor of an-thropology at the University of South Florida, studies the
biology and microevolution of human populations inCosta Rica, particularly demography and genetics. Herearlier work focused on the relationship among fertility,genetic change, and the sickle cell gene. Recently, her workhas expanded to include aspects of maturation, miscar-riage, frequency of twinning, and seasonal variation indemographic rates, among other topics. Most recently,Dr. Madrigal has been involved in the historical demogra-phy of Escazú, a small rural population in Costa Rica.
Dr. Karen Strier is a professor of anthropology at the University of Wisconsin at Madison. Her primaryresearch interests are in comparative primate behavioralecology and its links to conservation biology. Since 1982,Dr. Strier has studied the endangered muriqui monkeysof Brazil’s Atlantic forest. Her research has demonstratedthat muriquis differ from most other primates in theirnonaggressive, egalitarian societies. More recently, she hasexpanded her behavioral studies to include investigationsinto muriqui reproductive and life history strategies.
11
Lyle Konigsberg (Courtesy Dr. Lyle Konigsberg)
Lorena Madrigal (Courtesy Dr. Lorena Madrigal)
Rachel Caspari (Courtesy Dr. Rachel Caspari)
Karen Strier (Photo by Toni E. Ziegler)
Relethford: The Human Species: An Introduction to Biological Anthropology, 5/e
I. Evolutionary Background 1. Biological Anthropology and Evolution
© The McGraw−Hill Companies, 2003
Where have we come from? What does the history of our species look like? Athird question concerns variation among modern humans. How are humansaround the world like, or unlike, each other? What causes the patterns of humanvariation that we see? The fourth question relates back to the biocultural na-ture of human beings: How does culture affect biology, and vice versa? What impacthave the rapid and amazing cultural changes in our species’ recent past hadon our biology? Are our biological and cultural adaptations out of synch?
There are several traditionally defined areas within biological anthro-pology, such as primate studies, paleoanthropology, and human variation.Primate studies are concerned with defining humans in the natural world,specifically in terms of the primates (a group of mammals that includesmonkeys, apes, and humans). Primate studies look at the anatomy, behavior,and evolution of the other primates as a standard of comparison with thoseaspects of humans. In this way, we can learn something about what it is to behuman.
Paleoanthropology is the study of the fossil remains of human evolu-tion. Researchers in this field are interested in determining who our ances-tors were and when, how, and why they evolved. Paleoanthropologists workclosely with archaeologists to reconstruct the behaviors of our ancestors.
The study of human variation is concerned with how and why humansdiffer from each other in their biological makeup. This subfield considersthe ways in which culture and biology interact in the modern world, includ-ing such topics as the genetics of populations, demography (the study ofpopulation size and composition), physical growth and development, andhuman health and disease. Several decades ago, human variation was theconcern of only a few biological anthropologists. Today it is perhaps thelargest research area within biological anthropology.
SCIENCE AND EVOLUTION
Biological anthropology is an evolutionary science. All the major questionsjust presented may be addressed using modern evolutionary theory. Biologi-cal evolution simply refers to change in the genetic makeup of populationsover time.
Characteristics of ScienceBefore we consider how evolution works, it is important to understand ex-actly what a science is.
Facts At one time or another, you have probably heard someone make thestatement that evolution is a theory, not a fact. Or you might have heard thatit is a fact, not a theory. Which is it, theory or fact? The truth of the matter isthat someone who makes either of these statements does not understandwhat a theory or a fact is. Evolution is both fact and theory. A fact is simply averifiable truth. It is a scientific fact that the earth is round. It is a fact that
12 PART I ■ Evolutionary Background

Relethford: The Human Species: An Introduction to Biological Anthropology, 5/e
I. Evolutionary Background 1. Biological Anthropology and Evolution
© The McGraw−Hill Companies, 2003
when you drop something, it falls to the ground (assuming you are in thepresence of a gravitational field and you are not dropping something thatfloats or flies away!). Evolution is a fact. Living organisms have changed inthe past and they continue to change today. There are forms of life livingtoday that did not exist millions of years ago. There are also forms of lifethat did live in the past but are not around today, such as our ancestors (Fig-ure 1.3). Certain organisms have shown definite changes in their biologicalmakeup. Horses, for example, used to have five toes, then three, and todaythey have one. Human beings have larger brains and smaller teeth today thanthey did a million years ago. Some changes are even apparent over shorter in-tervals of time. For example, human teeth are on average smaller today thanthey were only 10,000 years ago. All of these statements and many others areverifiable truths. They are facts.
Hypotheses What is a hypothesis? A hypothesis is simply an explanationof observed facts. For example, consider gravity. Gravity is a fact. It is observ-able. Many hypotheses could be generated to explain gravity. You could hy-pothesize that gravity is caused by a giant living in the core of our planetdrawing in air, thus causing a pull on all objects on the earth’s surface.Bizarre as it sounds, this is a scientific hypothesis because it can be tested. Itis, however, easily shown to be incorrect (air movement can be measured andit does not flow in the postulated direction).
Testability To be scientific, a hypothesis must be testable. The potential mustexist for a hypothesis to be rejected. Just as the presence of the hypothetical
CHAPTER 1 ■ Biological Anthropology and Evolution 13
hypothesis An explanationof observed facts.
I I I I I I I
FIGURE 1.3
A skull of Australopithecusafricanus, a human ancestorthat lived 2 to 3 million yearsago. (© K. Cannon-Bonventure/Anthro-Photo)

Relethford: The Human Species: An Introduction to Biological Anthropology, 5/e
I. Evolutionary Background 1. Biological Anthropology and Evolution
© The McGraw−Hill Companies, 2003
giant in the earth can be tested (it doesn’t exist!), predictions made aboutgravitational strength can also be tested. Not all hypotheses can be tested,however, and for this reason they are not scientific hypotheses. That doesn’tnecessarily mean they are true or false but only that they cannot be tested.For example, you might come up with a hypothesis that all the fossils we haveever found were put in the ground by God to confuse us. This is not a scien-tific hypothesis because we have no objective way of testing the statement.
Many evolutionary hypotheses, however, are testable. For example, spe-cific predictions about the fossil record can be made based on our knowledgeof evolution. One such prediction is that humans evolved after the extinc-tion of the dinosaurs. The potential exists for this statement to be rejected;all we need is evidence that humans existed before, or at the same time as, thedinosaurs. Because we have found no such evidence, we cannot reject the hy-pothesis. We can, however, imagine a situation in which the hypothesis couldbe rejected. If we cannot imagine such a situation, then the hypothesis can-not be tested. For example, imagine that someone tells you that all the peo-ple on the earth were created 5 minutes ago, complete with memories! Anyevidence you muster against this idea could be explained away. Therefore,this hypothesis is not scientific because there is no possible way to reject it.
Theories What is the difference between a theory and a hypothesis? In somedisciplines, the two terms are sometimes used to mean the same thing. Inthe natural and physical sciences, however, theory means something differ-ent from hypothesis. A theory is a set of hypotheses that have been tested re-peatedly and that have not been rejected. Evolution falls into this category.Evidence from many sources has confirmed the basic hypotheses making upevolutionary theory (discussed later in the chapter).
The Development of Evolutionary TheoryAs with all general theories, modern evolutionary theory is not static. Scien-tific research is a dynamic process, with new evidence being used to support,clarify, and, most important, reject previous ideas. There will always be con-tinual refinements in specific aspects of the theory and its applications. Be-cause science is a dynamic process, evolutionary theory did not come aboutovernight. Charles Darwin (1809–1882) is most often credited as the “fatherof evolutionary thought” (Figure 1.4). It is true that Darwin provided a power-ful idea that forms the center of modern evolutionary thought. He did notwork in an intellectual vacuum, however, but rather built on the ideas of ear-lier scholars. Darwin’s model was not the first evolutionary theory; it forms,rather, the basis of the one that has stood the test of time.
Pre-Darwinian Thought To understand Darwin’s contribution and evolu-tion in general, it is necessary to take a look at earlier ideas. For many cen-turies the concept of change, biological or otherwise, was rather unusual in
14 PART I ■ Evolutionary Background
theory A set of hypothesesthat have been testedrepeatedly and that have not been rejected. This term is sometimes used in a different sense in socialscience literature.
I I I I I I I

Relethford: The Human Species: An Introduction to Biological Anthropology, 5/e
I. Evolutionary Background 1. Biological Anthropology and Evolution
© The McGraw−Hill Companies, 2003
Western thought. Much of Greek philosophy, for example, posits a static,unchanging view of the world. In later Western thought, the universe, earth,and all living creatures were regarded as having been created by God in theirpresent form, showing little if any change over many generations. Many biol-ogists (then called natural historians) shared this view, and their science con-sisted mainly of description and categorization. A good example is CarolusLinnaeus (1707–1778), a Swedish naturalist who compiled one of the firstformal classifications of all known living creatures. Taxonomy is the scienceof describing and classifying organisms. Linnaeus’s taxonomic research pro-duced a classification of all known living creatures into meaningful groups.For example, humans, dogs, cats, and many other animals are mammals,characterized primarily by the presence of mammary glands to feed off-spring. Linnaeus used a variety of traits to place all then-known creaturesinto various categories. Such a classification helps clarify relationships be-tween different organisms. For example, bats are classified as mammals be-cause they possess mammary glands—and not as birds simply because theyhave wings.
Linnaeus also gave organisms a name reflecting their genus and species. Aspecies is a group of populations whose members can interbreed and producefertile offspring. A genus is a group of similar species, often sharing certaincommon forms of adaptation. Modern humans, for example, are known by the name Homo sapiens. The first word is the genus and the second word is the species (more detail on genus and species is given in Chapters 4 and 8).
The reason for the relationships among organisms, however, was notoften addressed by early natural historians. The living world was felt to bethe product of God’s work, and the task of the natural historian was descrip-tion and classification. This static view of the world began to change in theeighteenth and nineteenth centuries. One important reason for this changewas that excavations began to produce many fossils that did not fit neatlyinto the classification system. For example, imagine that you found the re-mains of a modern horse. This would pose no problem in interpretation; thebones are those of a dead horse, perhaps belonging to a farmer several yearsago. Now suppose you found what at first glance appeared to be a horse butwas somewhat smaller and had five toes instead of the single hoof of a mod-ern horse. If you found more and more of these five-toed horses, you wouldask what creature the toes belonged to. Because horses do not have five toestoday, your only conclusion would be that there once existed horses with fivetoes and that they do not exist anymore. This conclusion, though hardlystartling now, was a real thunderbolt to those who believed the world wascreated as it is today, with no change.
Apart from finding fossil remains of creatures that were somewhat simi-lar to modern-day forms, excavations also uncovered fossil remnants of trulyunusual creatures, such as the dinosaurs. Discovery of the fossil record beganto chip away at the view that the world is as it always had been, and the con-cept of change began to be incorporated into explanations of the origin oflife. Not all scholars, however, came up with the same hypotheses.
CHAPTER 1 ■ Biological Anthropology and Evolution 15
FIGURE 1.4
Charles Darwin. (© StapletonCollection/Corbis)
taxonomy The science ofdescribing and classifyingorganisms.
species A group ofpopulations whose memberscan interbreed naturally andproduce fertile offspring.
genus Groups of specieswith similar adaptations.
I I I I I I I

Relethford: The Human Species: An Introduction to Biological Anthropology, 5/e
I. Evolutionary Background 1. Biological Anthropology and Evolution
© The McGraw−Hill Companies, 2003
One French anatomist, Georges Cuvier (1769–1832), analyzed many ofthe fossil remains found in quarries. He showed that many of these belongedto animals that no longer existed; that is, they had become extinct. Cuvierused a hypothesis called catastrophism to explain these extinctions. The hy-pothesis posited a series of catastrophes in the planet’s past, during whichmany living creatures were destroyed. Following these catastrophes, organ-isms from unaffected areas moved in. The changes over time observed in thefossil record could therefore be explained as a continual process of catastro-phes followed by repopulation from other regions (Mayr 1982).
The work of the French scientist Jean-Baptiste Lamarck (1744–1829)more explicitly attempted an explanation of evolution. He believed that theenvironment would affect the future shape and organization of animals(Mayr 1982). His specific mechanism stressed the use and disuse of bodyparts. For example, a jungle cat that developed stronger legs through con-stant running and jumping would pass these changes on to its offspring. Al-though we now know that Lamarck’s ideas are not genetically correct, it isimportant to note that he was quite astute in noticing the relationship be-tween organisms, their environment, and evolution.
Charles Darwin and Natural Selection Cuvier and Lamarck are perhapsthe best-known examples of what many have called “pre-Darwinian” theo-
16 PART I ■ Evolutionary Background
FIGURE 1.5
Darwin’s observations ofvariation in the differentregions he visited aboard theH.M.S. Beagle shaped histheory of natural selection.
A F R I C A
AUSTRALIA
S O U T H
A M E R I C A
N O R T H
A M E R I C AE U R O P E
P A C I F I C
O C E A N
A T L A N T I C
O C E A N P A C I F I C
O C E A N
I N D I A N
O C E A N
A R C T I C O C E A N
BRITISHISLES
INDIA
CHINA
JAPAN
Dec. 1831Oct. 1836
Tierra del FuegoFalkland Is.Port Desire
Montevideo
Rio de JaneiroSt. Helena
Ascension Is.
Cape Verde Is.
Azore Is.
Bahia(Salvador)
Cape of Good Hope Hobart
MauritiusSydney
Madagascar
King George’sSound
Keeling Is.
Bay ofIslands
Cape HornStraits of Magellan
Marquesas
Society Is.Tahiti
Valparaiso
Galapagos Is.
NEW
ZEALAND
Pernambuco(Recife)
Outward voyage
Return voyage
Relethford: The Human Species: An Introduction to Biological Anthropology, 5/e
I. Evolutionary Background 1. Biological Anthropology and Evolution
© The McGraw−Hill Companies, 2003
rists. Evolution was well accepted, and various models were being developedto explain this fact, before Darwin. Charles Darwin developed the theory ofnatural selection that has since been supported by testing. His major contri-bution was to combine information from a variety of different fields, such asgeology and economics, to form his theory.
With this background in mind, let us look at Darwin and his accom-plishment. Charles Darwin had been interested in biology and geology sincehe was a small child. Born to well-to-do parents, Darwin attended collegeand had planned to enter the ministry, although he was not as enthusiasticabout this career as he was about his studies of natural history. Because ofhis scientific and social connections, Darwin was able to accompany the scien-tific survey ship Beagle as an unpaid naturalist. The Beagle conducted a 5-yearjourney around the world collecting plant and animal specimens in SouthAmerica and the Galapagos Islands (in the Pacific Ocean near Ecuador),among other places (Figure 1.5).
During these travels, Darwin came to several basic conclusions aboutvariation in living organisms. First, he found a tremendous amount of ob-servable variation in most living species. Instead of looking at the world interms of fixed, rigid categories (as did mainstream biology in his time), Dar-win saw that individuals within species varied considerably from place toplace. With careful attention, you can see the world in much the same waythat Darwin did. You will see, for example, that people around you vary toan incredible degree. Some are tall, some are short, some are dark, and someare light. Facial features, musculature, hair color, and many other character-istics come in many different forms, even in a single classroom. Remember,too, that what you see are only those visible characteristics. With the righttype of equipment, you could look at genetic and biochemical variationwithin your classroom and find even more evidence of tremendous diversity.
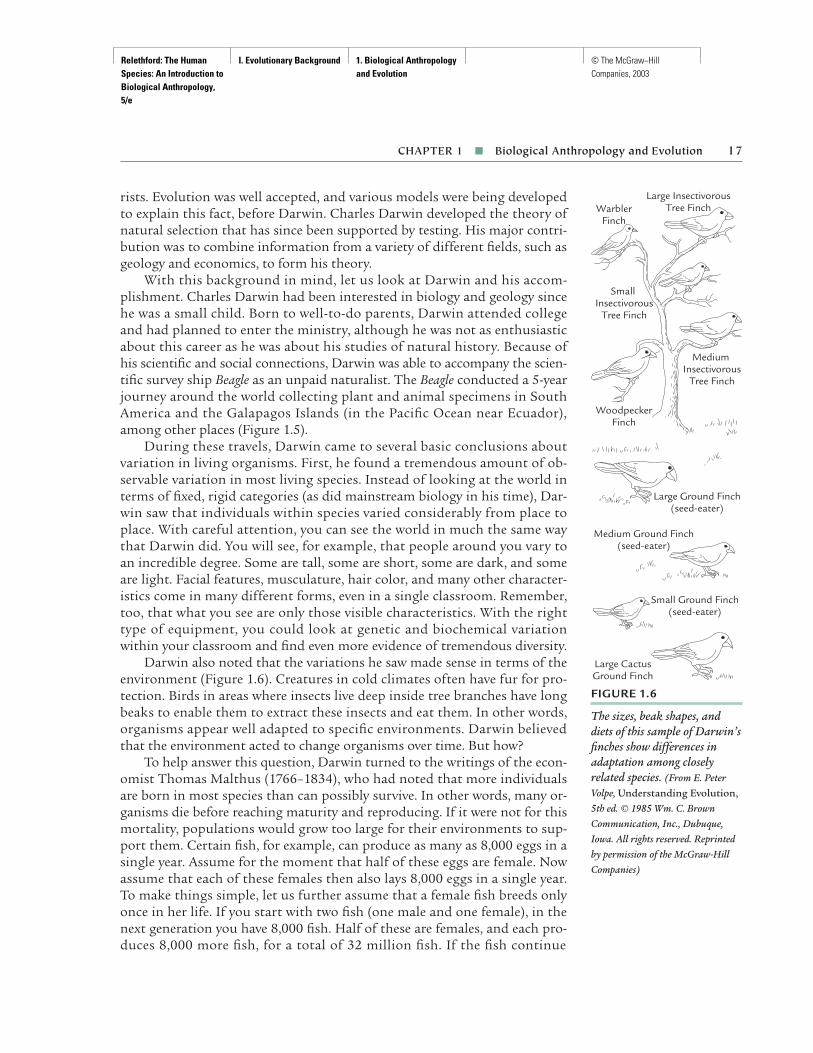
Darwin also noted that the variations he saw made sense in terms of theenvironment (Figure 1.6). Creatures in cold climates often have fur for pro-tection. Birds in areas where insects live deep inside tree branches have longbeaks to enable them to extract these insects and eat them. In other words,organisms appear well adapted to specific environments. Darwin believedthat the environment acted to change organisms over time. But how?
To help answer this question, Darwin turned to the writings of the econ-omist Thomas Malthus (1766–1834), who had noted that more individualsare born in most species than can possibly survive. In other words, many or-ganisms die before reaching maturity and reproducing. If it were not for thismortality, populations would grow too large for their environments to sup-port them. Certain fish, for example, can produce as many as 8,000 eggs in asingle year. Assume for the moment that half of these eggs are female. Nowassume that each of these females then also lays 8,000 eggs in a single year.To make things simple, let us further assume that a female fish breeds onlyonce in her life. If you start with two fish (one male and one female), in thenext generation you have 8,000 fish. Half of these are females, and each pro-duces 8,000 more fish, for a total of 32 million fish. If the fish continue
CHAPTER 1 ■ Biological Anthropology and Evolution 17
FIGURE 1.6
The sizes, beak shapes, anddiets of this sample of Darwin’sfinches show differences inadaptation among closelyrelated species. (From E. PeterVolpe, Understanding Evolution,5th ed. © 1985 Wm. C. BrownCommunication, Inc., Dubuque,Iowa. All rights reserved. Reprintedby permission of the McGraw-HillCompanies)
Small Insectivorous
Tree Finch
Large InsectivorousTree FinchWarbler
Finch
Large CactusGround Finch
Medium Insectivorous
Tree Finch
Medium Ground Finch(seed-eater)
Small Ground Finch(seed-eater)
Large Ground Finch(seed-eater)
WoodpeckerFinch

Relethford: The Human Species: An Introduction to Biological Anthropology, 5/e
I. Evolutionary Background 1. Biological Anthropology and Evolution
© The McGraw−Hill Companies, 2003
reproducing in this way, there will be roughly 2.1 × 1036 fish (that is, 2.1 fol-lowed by 36 zeroes) after only 10 generations! Suppose these are relativelysmall fish, each one weighing only 100 grams (a little less than a quarter of apound). The total weight of all fish after 10 generations would be roughly 2.1 × 1038 grams (or roughly 2.3 × 1032 tons).
To give you an idea of exactly how large these numbers are, consider thefact that the total weight of our sun is 1.99 × 1033 grams (Pasachoff 1979). Ifthe cycle begins with two fish, after 10 generations the total weight of thefish will be greater than the weight of the sun. Because we are not all cur-rently smothered in fish, something is wrong with this simple model.
Malthus provided the answer. Most of the fish will die before they repro-duce. Some eggs will become diseased and die, and others will be eaten bypredators. Only a small number of the eggs will actually survive long enoughto reproduce. Malthus is best known for extrapolating the principle of popu-lation growth into human terms; his lesson is that unless we control ourgrowth, there will soon be too many of us to feed.
To Charles Darwin, the ideas of Malthus provided the needed informa-tion to solve the problem of adaptation and evolution. Not all individuals ina species survive and reproduce. Some failure to reproduce may be random,but some is related to specific characteristics of an individual. If there aretwo birds, one with a short beak and one with a long beak, in an environ-ment that requires reaching inside branches to feed, it stands to reason thatthe bird with the longer beak is more likely to feed itself, survive, and repro-duce. In certain environments, some individuals possess traits that enhancetheir probability of survival and reproduction. If these traits are due, in partor whole, to inherited characteristics, then they will be passed on to the nextgeneration.
In some ways, Darwin’s idea was not new. Animal and plant breeders hadused this principle for centuries. Controlled breeding and artificial selectionhad resulted in many traits in domesticated plants and animals, such as live-stock size, milk production in cows, and a variety of other traits. The sameprinciple is used in producing pedigreed dogs and many forms of tropicalfish. The difference is that Darwin saw that nature (the environment) couldselect those individuals that survived and reproduced. Hence, he called hisconcept natural selection.
Although the theory of evolution by natural selection is most often asso-ciated with Charles Darwin, another English natural historian, Alfred RusselWallace (1823–1913), came up with essentially the same idea. In fact, Darwinand Wallace communicated their ideas to each other and first presented thetheory of natural selection in a joint paper in 1858. Many scholars feel thatWallace’s independent work urged Darwin finally to put forward the ideashe had developed years earlier but had not published. To ensure timely pub-lication, Darwin condensed his many years of work into a book titled On theOrigin of Species by Means of Natural Selection, published in 1859.
Examples of Natural Selection One excellent example of how natural se-lection works is the story of populations of the peppered moth in England
18 PART I ■ Evolutionary Background
natural selection Amechanism for evolutionarychange favoring the survivaland reproduction of someorganisms over othersbecause of their biologicalcharacteristics.
I I I I I I I

Relethford: The Human Species: An Introduction to Biological Anthropology, 5/e
I. Evolutionary Background 1. Biological Anthropology and Evolution
© The McGraw−Hill Companies, 2003
over the last few centuries (Figure 1.7). These moths come in two distinctcolors, dark and light. Early observations found that most of these mothswere light-colored, thus allowing them to camouflage themselves on treetrunks covered by light-colored lichen. By blending in, they had a betterchance of avoiding the birds that tried to eat them. Roughly 1 percent of themoths, however, were dark-colored and thus at an obvious disadvantage. Inthe century following the beginning of the Industrial Revolution in England,naturalists noted that the frequency of dark-colored moths increased to al-most 90 percent (Grant 1985). This change was due to the massive pollutionin the surrounding countryside that industrialization brought about. Thepollution killed the lichen, exposing the dark tree trunks. The light mothswere at a disadvantage, and the dark moths, now better camouflaged, werebetter off. Proportionately, more dark moths survived and passed their darkcolor to the next generation. In evolutionary terminology, the dark mothswere selected for and the light moths were selected against. After antipollutionlaws were passed and the environment began to recover, the situation was re-versed: once again light moths survived better, and were selected for, whereasdark moths were selected against.
This well-known study shows us more than just the workings of naturalselection. It also illustrates several important principles of evolution. First,we cannot always state with absolute certainty which traits are “good” andwhich are “bad.” It depends on the specific environment. When the trees werelight in color, the light-colored moths were at an advantage, but when thesituation changed, the dark-colored moths gained the advantage. Second,evolution does not proceed unopposed in one direction. Under certain situa-tions, biological traits can change in a different direction. In the case of themoths, evolution produced a change from light to dark to light again. Third,evolution does not occur in a vacuum. It is affected by changes in the envi-ronment and by changes in other species. In this example, changes in the
CHAPTER 1 ■ Biological Anthropology and Evolution 19
FIGURE 1.7
Adaptation in the pepperedmoth. The dark-colored moth is more visible on light-coloredtree trunks and therefore atgreater risk of being seen andeaten by a bird ( left). Thelight-colored moth is at greaterrisk of being eaten on dark-colored tree trunks (right). (© Michael Tweedie/PhotoResearchers, Inc.)

Relethford: The Human Species: An Introduction to Biological Anthropology, 5/e
I. Evolutionary Background 1. Biological Anthropology and Evolution
© The McGraw−Hill Companies, 2003
cultural evolution of humans led to a change in the environment, which fur-ther affected the evolution of the moths. Finally, the moth study shows usthe critical importance of variation to the evolutionary process. If the origi-nal population of moths did not possess the dark-colored variation, theymight have been wiped out after the trees turned darker in color. Variationmust exist for natural selection to operate effectively.
Another example of natural selection is found in P. R. Grant’s continu-ing work on the variation and evolution of Galapagos finches. Grant foundthat average beak size changed over time in direct response to changes in theenvironment. In drought years, the average beak is larger. Why? The simplestexplanation is that drought conditions make those finches with larger beaksbetter able to crack the larger seeds that are more common under drought con-ditions. Grant has observed these changes over several decades. The changesin beak size over time shows that the changing environment affects the prob-ability of survival and reproduction (Grant 1991, Weiner 1994).
Modern Evolutionary Thought Darwin provided part of the answer ofhow evolution worked, but he did not have all the answers. Many early criticsof Darwin’s work focused on certain questions that Darwin could not an-swer. One important question concerns the origins of variation: Given thatnatural selection operates on existing variation, then where do those varia-tions come from? Why, at the outset, were some moths light and others dark?Natural selection can act only on preexisting variation; it cannot create newvariations. Another question is, How are traits inherited? The theory of nat-ural selection states that certain traits are selected for and passed on to fu-ture generations. How are these traits passed on? Darwin knew that traitswere inherited, but he did not know the mechanism. Still another questioninvolves how new forms and structures come into being.
Darwin is to be remembered and praised for his work in providing thecritical base from which evolutionary science developed. He did not, how-ever, have all the answers, as no scientist does. Even today people tend toequate evolutionary science with Darwin to the exclusion of all work sincethat time. Some critics of evolutionary theory point to a single aspect of Dar-win’s work, show it to be in error, and then proceed to claim all of evolution-ary thought suspect. In reality, a scientific theory will continue to change asnew evidence is gathered and as further tests are constructed.
Modern evolutionary theory relies not only on the work of Darwin andWallace but also on developments in genetics, zoology, embryology, physiol-ogy, and mathematics, to name but a few fields. The basic concept of naturalselection as stated by Darwin has been tested and found to be valid. Refine-ments have been added, and some aspects of the original idea have beenchanged. We now have answers to many of Darwin’s questions.
Biological evolution consists of changes in the genetic composition ofpopulations. As shown in Chapter 3, the relative frequencies of genes changeover time because of four mechanisms, or evolutionary forces. Natural selec-tion is one of these mechanisms. Those individuals with genetic characteris-
20 PART I ■ Evolutionary Background

Relethford: The Human Species: An Introduction to Biological Anthropology, 5/e
I. Evolutionary Background 1. Biological Anthropology and Evolution
© The McGraw−Hill Companies, 2003
tics that improve their relative survival or reproduction pass their geneticmaterial on to the next generation. In the peppered moth example discussedearlier, the dark moths were more likely to survive in an environment wherepollution made the trunks of trees darker in color. Thus, the relative fre-quency of genes for dark moth color increased over time (at least until theenvironment changed again).
Evolutionary change from one generation to the next, or over many gen-erations, is the product of the joint effect of the four evolutionary forces.Our discussion here simplifies a complex idea, but it does suggest that evolu-tion is more than simply natural selection. Modern evolutionary theory en-compasses all four evolutionary forces and will be discussed in greater detailin the next three chapters.
Evidence for EvolutionBecause this book is concerned with human variation and evolution, youwill be provided with numerous examples of how evolution works in humanpopulations, past and present. It is important to understand from the startthat biological evolution is a documented fact and that the modern theoryof evolution has stood up under many scientific tests.
The fossil record provides evidence of evolution. The story the fossils tellis one of change. Creatures existed in the past that are no longer with us. Se-quential changes are found in many fossils showing the change of certainfeatures over time from a common ancestor, as in the case of the horse. Apartfrom demonstrating that evolution did occur, the fossil record also providestests of the predictions made from evolutionary theory. For example, thetheory predicts that single-celled organisms evolved before multicelled or-ganisms. The fossil record supports this prediction—multicelled organismsare found in layers of earth millions of years after the first appearance ofsingle-celled organisms. Note that the possibility always remains that the op-posite could be found. If multicelled organisms were indeed found to haveevolved before single-celled organisms, then the theory of evolution wouldbe rejected. A good scientific theory always allows for the possibility of rejec-tion. The fact that we have not found such a case in countless examinationsof the fossil record strengthens the case for evolutionary theory. Remember,in science you do not prove a theory; rather, you fail to reject it.
The fossil record is not the only evidence we have that evolution has oc-curred. Comparison of living organisms provides further confirmation. Forexample, the African apes are the closest living relatives of humans. We seethis in a number of characteristics. African apes and humans share the sametype of dental pattern, have a similar shoulder structure, and have DNA (thegenetic code) that is over 98 percent identical. Even though any one of thesetraits, or others, could be explained as coincidental, why do so many inde-pendent traits show the same pattern? One possibility, of course, is that theywere designed that way by an ultimate Creator. The problem with this idea isthat it cannot be tested. It is a matter of faith and not of science. Another
CHAPTER 1 ■ Biological Anthropology and Evolution 21

Relethford: The Human Species: An Introduction to Biological Anthropology, 5/e
I. Evolutionary Background 1. Biological Anthropology and Evolution
© The McGraw−Hill Companies, 2003
problem is that we must then ask ourselves why a Creator would use the samebasic pattern for so many traits in different creatures. Evolution, on the otherhand, offers an explanation. Apes and humans share many characteristicsbecause they evolved from a common ancestor (Figure 1.8).
Another example of shared characteristics is the python, a large snake.Like many vertebrates, the python has a pelvis, the skeletal structure thatconnects the lower legs to the upper body (Futuyma 1983). From a struc-tural standpoint, of what possible use is a pelvis to a creature that has nolegs? If the python was created, then what purpose would there have been togive it a pelvis? We can of course argue that no one can understand the moti-vations of a Creator, but that is hardly a scientific explanation. Evolutionaryreasoning provides an answer: The python has retained the pelvis from anearlier ancestor that did have legs. In fact, new fossil discoveries dating back95 million years provide evidence of early snakes that actually had limbs(Tchernov et al. 2000).
Further, fascinating evidence of shared characteristics is the discovery offossils of early whales with reduced hind limbs (Gingerich et al. 1990).Whales are aquatic mammals that have lost hind limbs and pelvic bones sincetheir evolutionary separation from other mammals more than 50 millionyears ago. The discovery of fossil whales with small, and perhaps somewhatfunctional, hind limbs provides another example of shared characteristics
22 PART I ■ Evolutionary Background
FIGURE 1.8
The percentage of geneticdifference between humans andthe great apes (chimpanzee,gorilla, and orangutan).Combined with other biologicalevidence, genetic data show us how closely related we are to the apes, especially thechimpanzee. (From HumanEvolution: An IllustratedIntroduction by Roger Lewin, © 1984 by Blackwell ScientificPublications. Reprinted bypermission by W. H. Freeman and Company)
Gorilla
Orangutan
Chimpanzee
Human
1.2 percentgenetic difference
2.4 percentgenetic difference
1.4 percentgenetic difference

Relethford: The Human Species: An Introduction to Biological Anthropology, 5/e
I. Evolutionary Background 1. Biological Anthropology and Evolution
© The McGraw−Hill Companies, 2003
that can be explained only through evolution. This discovery also providesan excellent illustration of a transitional form—a fossil that links both earlyand modern forms.
Another line of evidence supporting evolution is the laboratory and fieldstudies of living organisms. Ongoing evolutionary change has been docu-mented in many organisms, including humans. Specific predictions of theeffect of evolutionary mechanisms have been tested and verified in controlledexperiments and observational studies. The study of moth color is but oneof many examples of this kind of analysis.
Science and ReligionThe subject of evolution has always been controversial, and the implicationsof evolution have sometimes frightened people. For example, the fact thathumans and apes evolved from a common ancestor has always upset somepeople who feel that their humanity is somehow degraded by having ances-tors supposedly less worthy than ourselves. Another conflict lies in the impli-cations evolution has for religious views. In the United States, a number oflaws prohibited teaching evolution in public schools. Many of these lawsstayed on the books until the late 1960s.
Numerous legal battles have been fought over these anti-evolution laws.Perhaps the most famous of these was the “Scopes Monkey Trial” in 1925.John Scopes, a high school teacher in Dayton, Tennessee, was arrested for vi-olating the state law prohibiting the teaching of evolution. The town andtrial quickly became the center of national attention, primarily because ofthe two celebrities in the case—William Jennings Bryan, a former U.S. Secre-tary of State, who represented the state of Tennessee, and Clarence Darrow,one of the most famous American trial lawyers ever, who represented Scopes.The battle between these two eloquent speakers captured the attention ofthe country (Figure 1.9). In the end, Scopes was found guilty of violating thelaw, and he was fined $100. The fine was later suspended on a legal technical-ity. The story of this trial, which has been dramatized in play and movie ver-sions as Inherit the Wind, is a powerful story portraying the fight of those whofeel strongly about academic freedom and freedom of speech against igno-rance and oppression. In reality, the original arrest of Scopes was planned byseveral local people to gain publicity for the town (Larson 1997).
Creation Science In retrospect, the Scopes trial may seem amusing. Welaugh at early attempts to control subject matter in classrooms and oftenfeel that we have gone beyond such battles. Nothing could be further fromthe truth, however. For many people, evolution represents a threat to theirbeliefs in the sudden creation of all life by a creator. Attempts to legislate theteaching of the Biblical view of creation in science classes, however, violatethe First Amendment of the Constitution as an establishment of religion. Tocircumvent this problem, opponents of evolution have devised the strategyof calling their teachings “creation science,” supposedly the scientific study
CHAPTER 1 ■ Biological Anthropology and Evolution 23

Relethford: The Human Species: An Introduction to Biological Anthropology, 5/e
I. Evolutionary Background 1. Biological Anthropology and Evolution
© The McGraw−Hill Companies, 2003
of special creation. The word God does not always appear in definitions ofcreation science, but the word creator often does.
In March 1981, the Arkansas state legislature passed a law (Act 590) re-quiring that creation science be taught in public schools for equal amountsof time as evolution. The American Civil Liberties Union challenged this law,and it was overturned in a federal district court in 1982. A similar law passedin Louisiana in 1981 was later overturned. The Louisiana case has since beenappealed and brought to the U.S. Supreme Court, which upheld the rulingof the lower court in 1987. Among other legal problems they raise, both theArkansas and Louisiana laws have been found to be unconstitutional underthe First Amendment.
What is “creation science”? Why shouldn’t it be taught in science classes?Shouldn’t science be open to new ideas? These questions all center on theissue of whether creation science is a science or not. As typically applied, cre-ation science is not a science; at best, it is a grab bag of ideas spruced up withscientific jargon. One of the original definitions is found in Act 590 of theArkansas law, which defines creation science as
the scientific evidence for creation and inferences from these scientific evidences.Creation-science includes the scientific evidences and related inferences thatindicate: (1) Sudden creation of the universe, energy, and life from nothing; (2) The insufficiency of mutation and natural selection in bringing about de-velopment of all living kinds from a single organism; (3) Changes only withinfixed limits of originally created kinds of plants and animals; (4) Separate ances-try for man and apes; (5) Explanation of the earth’s geology by catastrophism,including the occurrence of a worldwide flood; and (6) A relatively recent incep-tion of the earth and living kinds. (Montagu 1984: 376–377)
24 PART I ■ Evolutionary Background
FIGURE 1.9
The Scopes trial. WilliamJennings Bryan (right)represented the state ofTennessee, and ClarenceDarrow ( left) representedJohn Scopes. (© AP/Wide World Photos)

Relethford: The Human Species: An Introduction to Biological Anthropology, 5/e
I. Evolutionary Background 1. Biological Anthropology and Evolution
© The McGraw−Hill Companies, 2003
None of these statements is supported by scientific evidence, and cre-ationist writers generally use very little actual evidence to support their views.Some have written that the Biblical Flood can be supported by the fossilrecord. Earth’s past is essentially recorded by the order in which different lev-els of earth and fossils are found. In general, that is, the deeper a fossil isfound, the older it is. Creationists explain this order as being caused by theflight of animals from the Flood. As the waters rose, they say, birds flew andsmall mammals ran up mountains to escape drowning; these creatures weretherefore drowned at higher elevations.
According to creationists, then, you will find fish at lower levels and birdsand mammals at higher levels. The fossil record does show this phenom-enon. Isn’t this proof for “creation science”? No. Think about the Flood scenario for a moment and you will see that it just doesn’t make sense. Whydidn’t the winged reptiles fly away like the birds did? Why are single-celledorganisms found earlier than multicelled organisms of similar size and over-all shape? Why did large, heavy creatures such as giant tortoises and hip-popotami survive instead of sinking? Why didn’t the small, fast dinosaurssurvive? Why did certain fish die before others, when they were just as swiftand just as good at swimming? Many challenges can be raised to the idea ofa single gigantic flood causing the order found in the fossil record (Kitcher1982; Futuyma 1983). The fossil record, in short, provides ample evidence toreject the Flood hypothesis.
Another example cited by creationists as “proof” of special creation isthe “fact” that dinosaur and human footprints have been found at the samegeological level along the Paluxy River in Texas. Closer examination has shownthat the human footprints were actually eroded dinosaur tracks as well ashuman-made carvings.
The main “scientific” work of the creationists consists of attempting tofind fault with evolutionary theory. The reasoning is that if evolution can berejected, then special creation must be true. This strategy actually uses animportant feature of scientific research by attempting to reject a given hy-pothesis. The problem is that none of the creationists’ attacks on evolutionhas been supported by scientific evidence. Certainly some predictions of evo-lutionary theory have been proven incorrect, but that is to be expected be-cause science is a dynamic process. The basic finds of evolution, however,have been supported time and time again.
Another problem is that this method works only when the hypothesisand its alternative cover all possible cases. Are evolution and special creationby a single creator the only possible explanations? Perhaps the universe wascreated by several creators. Perhaps the universe and natural law were createdby a creator, but life evolved from natural law. You might try to think upother alternatives. Remember, however, that to be scientific a hypothesismust be testable.
On an emotional level, the doctrines of “creation science” attract manypeople. Given the concept of free speech, why shouldn’t creation science begiven equal time? The problem with equal time is that it assumes that bothideas have equal merit. Consider that some people still believe the earth is
CHAPTER 1 ■ Biological Anthropology and Evolution 25

Relethford: The Human Species: An Introduction to Biological Anthropology, 5/e
I. Evolutionary Background 1. Biological Anthropology and Evolution
© The McGraw−Hill Companies, 2003
flat. They are certainly entitled to their opinion, but it would be absurd tomandate “equal time” in geography and geology classes for this idea. Also,the concept of equal time is not really that fair-minded after all. The specificstory many creationists refer to is the Biblical story of Genesis. Many othercultures have their own creation stories. Shouldn’t they receive equal time aswell? In one sense, they should, though the proper forum for such discus-sions is probably a course in comparative religions, not a science class.
Perhaps the biggest problem advocates of “creation science” have intro-duced is that they appear to place religion and science at odds with eachother. Religion and science both represent ways of looking at the world, andthough they work on different levels, they are not contradictory. You can bereligious and believe in God and still accept the fact of evolution and evolu-tionary theory. Only if you take the story of Genesis as a literal, historical ac-count does a conflict exist. Most major religions in the world accept the find-ings of evolution. Many people, including some scientists, look to theevolutionary process as evidence of God’s work, an idea known as theisticevolution. As such, many religions support the teaching of evolution in sci-ence education rather than creation science (Table 1.1). As further evidencethat there is no necessary conflict between religion and evolution, Pope JohnPaul II stated in his October 22, 1996, message to the Pontifical Academy ofSciences that “knowledge has led to the recognition of the theory of evolu-tion as more than a hypothesis” (Gould 1999: 81).
Intelligent Design In recent years, another approach to creationism has become popular within the United States. Known as intelligent design creationism, this approach stresses the idea that the biological world wascreated by an intelligent Creator. Supporters of this view claim that many ofthe characteristics of biological organisms, such as the structure of DNA orthe anatomy of the eye, are too complex to have occurred through naturalprocesses and that, therefore, life must have been created. The basic idea ofintelligent design creationism is often expressed by the “watchmaker anal-
26 PART I ■ Evolutionary Background
TA B L E 1.1 Some Religious OrganizationsOpposed to Creation Science
American Jewish CongressCentral Conference of American RabbisGeneral Convention of the Episcopal ChurchLutheran World FederationRoman Catholic ChurchUnitarian Universalist AssociationUnited Methodist ChurchUnited Presbyterian Church
Source: National Center for Science Education Web page(www.ncseweb.org)
theistic evolution Thebelief that God operatesthrough the natural processof evolution.
intelligent designcreationism The idea thatthe biological world wascreated by an intelligententity and did not arisefrom natural processes.
I I I I I I I

Relethford: The Human Species: An Introduction to Biological Anthropology, 5/e
I. Evolutionary Background 1. Biological Anthropology and Evolution
© The McGraw−Hill Companies, 2003
ogy” of eighteenth-century theologian William Paley, who argued that a com-plex mechanical object such as a watch, with all of its intricate mechanisms,could not arise naturally and therefore automatically implied the existenceof a watchmaker (Dawkins 1987).
Much of the substance of intelligent design creationism is similar to thatof biblical creation science. The basic methodology is to attack the claimsand findings of evolutionary science with this goal: If evolution is rejected,then there must be a designer. As such, intelligent design creationism usesthe same either-or dichotomy employed by biblical creation science. Any-thing that is not explained by evolutionary theory must therefore be proofof a creation, even though science never claims to have all of the answers atany given point in time.
From a scientific perspective, there are no testable hypotheses regardingthe specific actions of a creator, or any way to check on the proposed hypoth-esis. The bottom line is that anything and everything is explained simply asthe result of the actions of a creator (Pennock 1999). The reliance on sup-posed disproof of evolution further weakens the case, as a number of re-searchers have shown that complex structures can indeed arise through nat-ural processes (Dawkins 1987; Pennock 1999). It is important to note againthat science deals with testable hypotheses about natural processes. Super-natural actions or entities do not fall within the realm of science. Sciencedoes not require a creator or creation, but it does not rule them out; creation-ism, on the other hand, requires both.
Science and Society Despite scientific, legal, and theological objections,creationism has not gone away. There remains considerable support withinthe United States for the inclusion of some form of creationism in the pub-lic school curriculum. Some local communities and states continue to insiston a “balanced” treatment, including modification of school curriculum,changes in existing textbooks, and adoption of more creationism-orientedtexts. Perhaps one of the more noticeable casualties of this debate has beenthe erosion in science education. Due to continued and often very vocal op-position to the teaching of evolution, educational standards have been al-tered to avoid confrontation. In a recent analysis of state science standards,Lerner (2000) found that 19 out of 50 states do a poor job in dealing withevolution in their published standards, including 12 that avoid using theword evolution and 4 that do not teach evolution at all.
The arguments about creationism and evolution also play a role in indi-viduals’ views on ethics, morality, and social philosophy. Many creationistsfear that science has eroded our faith in God and has therefore led to a declinein morals and values. They imply that science (and evolution in particular)makes statements about human morality. It does not. Science has nothing tosay about right and wrong; that is the function of social ethics, philosophies,and religion. Religion and science are important to many people. To put themat odds with each other does both a disservice. It is no surprise that manyministers, priests, and rabbis have joined in the fight against creationism.
CHAPTER 1 ■ Biological Anthropology and Evolution 27
Relethford: The Human Species: An Introduction to Biological Anthropology, 5/e
I. Evolutionary Background 1. Biological Anthropology and Evolution
© The McGraw−Hill Companies, 2003
SUMMARY
Anthropology is the study of human biological and cultural variation andevolution. Anthropology asks questions that focus on what humans are andthe origins, evolution, and variation of our biology and behaviors, becausehumans are both biological and cultural organisms. In the United States, an-thropology is characterized by four subfields with specific concerns: culturalanthropology (the study of cultural behavior), anthropological archaeology(the study of past cultures), linguistic anthropology (the study of languageas a human characteristic), and biological anthropology (the study of humanbiological evolution and variation).
As a science, anthropology has certain requirements and characteristics.Hypotheses must be testable and verifiable. The main theoretical base of bio-logical anthropology is the theory of evolution. A major feature of evolution-ary theory is Darwin’s idea of natural selection. In any environment in whichresources are necessarily limited, some organisms are more likely to surviveand reproduce than others because of their biological characteristics. Thosewho survive pass these traits on to the next generation.
A current controversy involves the efforts of people who advocate thatcreationism be taught in public schools. Examination of this field shows thatit is not a science at all. Apart from these debates, it should be noted that todaythere is little conflict between religion and science in the United States. Eachperspective addresses different questions in different ways.
SUPPLEMENTAL READINGS
Futuyma, D. J. 1995. Science on Trial: The Case for Evolution, rev. ed. Sunderland, Mass.: Sinauer Associates. An excellent review and critique of creationism that is particularlystrong in its discussion of scientific method and evidence for evolution. Originallypublished in 1983, this revised edition includes a postscript with updated informationon evolution and creationism.
Larson, E. J. 1997. Summer for the Gods: The Scopes Trial and America’s Continuing Debate overScience and Religion. Cambridge, Mass.: Harvard University Press. Winner of the PulitzerPrize in History, an excellent book that provides a comprehensive description andanalysis of the Scopes trial and creationism in the United States.
Pennock, R. T. 1999. Tower of Babel: The Evidence against the New Creationism. Cambridge,Mass.: MIT Press. A detailed description and critique of intelligent design creationism.
Weiner, J. 1994. The Beak of the Finch. New York: Vintage Books. A highly readable accountof the work of Peter and Rosemary Grant on natural selection and evolution amongfinch populations.
28 PART I ■ Evolutionary Background
Relethford: The Human Species: An Introduction to Biological Anthropology, 5/e
I. Evolutionary Background 1. Biological Anthropology and Evolution
© The McGraw−Hill Companies, 2003
INTERNET RESOURCES
http://physanth.orgWeb page for the American Association of Physical Anthropologists, theworld’s leading professional organization for biological anthropologists.This site contains news about publications, meetings, and careers.
http://www.talkorigins.orgThe Talk.Origins Archive, a Web page that includes much information aboutevolutionary theory as well as critiques of scientific creationism and intelli-gent design creationism.
http://www.ncseweb.orgWeb page for the National Center for Science Education, an organizationthat defends teaching evolution in public schools. This site includes infor-mation on evolution, critiques of creationism, and current events.
CHAPTER 1 ■ Biological Anthropology and Evolution 29

Relethford: The Human Species: An Introduction to Biological Anthropology, 5/e
I. Evolutionary Background 2. Human Genetics © The McGraw−Hill Companies, 2003
C H A P T E R 2Human Genetics
31
Is human behavior the result of biology or culture? This question has beenasked countless times in human history, often with serious cultural and
political consequences. To anthropologists, the question is somewhat mean-ingless; we recognize both biological and cultural factors as important andlook at the relative potential contributions of both. It is hard to untanglethese effects.
To understand human biological variation and evolution, we must con-sider the science of genetics. The study of genetics actually encompasses anumber of different areas, depending on the level of analysis. Genetics canbe studied on the molecular level, with the focus on what genes are and howthey act to produce biological structures.
Genetics also involves the process of inheritance. To what extent are we areflection of our parents? How are traits inherited? This branch of the field iscalled Mendelian genetics, after the scientist Gregor Mendel, who firstworked out many of the principles of inheritance.
Finally, genetics can be studied at the level of a population. Here we areinterested in describing the patterns of genetic variation within and amongdifferent populations and their relationship with biological evolution. Thechanges that take place in the frequency of genes within a population consti-tute the process of microevolution. At the level of the population, we seekthe reasons for evolutionary change from one generation to the next. Projec-tion of these findings allows us to better understand the long-term pattern
Computer-generated model of DNA, the molecule that provides the geneticcode. The study of human genetics includes the biochemical makeup of DNAand the transmission of genes from one generation to the next. (© Ken Edward/Photo Researchers, Inc.)
▲
Mendelian genetics Thebranch of genetics concernedwith patterns and processesof inheritance. This fieldwas named after GregorMendel, the first scientist towork out these principles.
microevolution Short-term evolutionary change.
I I I I I I I

Relethford: The Human Species: An Introduction to Biological Anthropology, 5/e
I. Evolutionary Background 2. Human Genetics © The McGraw−Hill Companies, 2003
of evolution over thousands and millions of years and the origin of newspecies (macroevolution).
MOLECULAR GENETICSDNA: The Genetic CodeThe study of genetics at the molecular level concerns the amazing propertiesof a molecule known as deoxyribonucleic acid, or DNA for short. The DNAmolecule provides the codes for biological structures and the means to trans-late this code. It is perhaps best to think of DNA as a set of instructions fordetermining the makeup of biological organisms. Quite simply, DNA pro-vides information for building, operating, and repairing organisms. In thiscontext, the process of genetic inheritance is seen as the transmission of thisinformation or the passing on of the instructions needed for biological struc-tures. Evolution can be viewed in this context as the transfer of informationfrom one generation to the next, along with the possibility that this infor-mation will change.
An understanding of both the structure and function of DNA is neces-sary to understand the processes of genetic inheritance and evolution. Theexact biochemistry of DNA is beyond the scope of this text, but its basic na-ture can be discussed in the context of information transfer.
The Structure of DNA The physical appearance of the DNA molecule re-sembles a ladder that has been twisted into the shape of a helix (Figure 2.1).In biochemical terms, the rungs of the ladder are of major importance. Theserungs are made up of chemical units called bases. There are four possibletypes of bases, identified by the first letter of their longer chemical names: A(adenine), T (thymine), G (guanine), and C (cytosine). These bases form the“alphabet” used in specifying and carrying out genetic instructions.
FIGURE 2.1
Computer representation of theDNA molecule (left) and thestructure of the DNA molecule(right). DNA consists of twostrands arranged in a helixjoined together by chemicalbases. (Photo © Will & DeniMcIntyre/Photo Researchers, Inc.)
macroevolution Long-term evolutionary change.
DNA The molecule thatprovides the genetic code forbiological structures and themeans to translate this code.
base Chemical units(adenine, thymine, guanine,cytosine) that make up partof the DNA molecule andspecify genetic instructions.
I I I I I I I
32
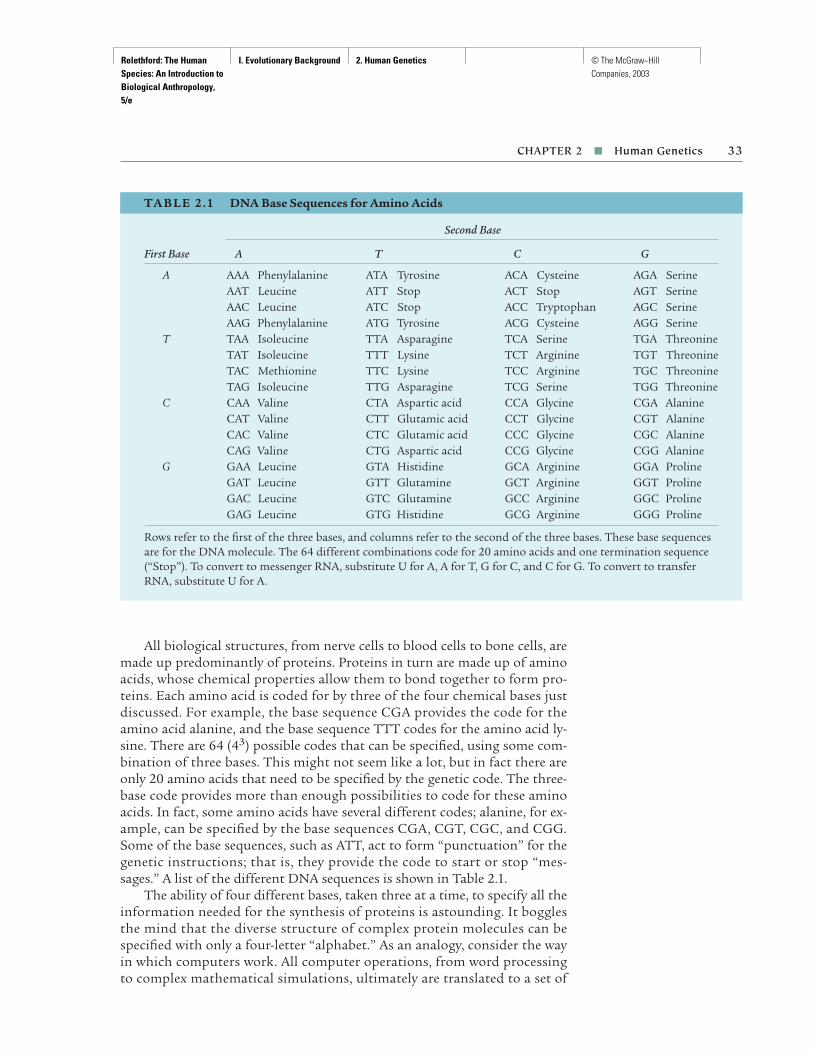
Relethford: The Human Species: An Introduction to Biological Anthropology, 5/e
I. Evolutionary Background 2. Human Genetics © The McGraw−Hill Companies, 2003
All biological structures, from nerve cells to blood cells to bone cells, aremade up predominantly of proteins. Proteins in turn are made up of aminoacids, whose chemical properties allow them to bond together to form pro-teins. Each amino acid is coded for by three of the four chemical bases justdiscussed. For example, the base sequence CGA provides the code for theamino acid alanine, and the base sequence TTT codes for the amino acid ly-sine. There are 64 (43) possible codes that can be specified, using some com-bination of three bases. This might not seem like a lot, but in fact there areonly 20 amino acids that need to be specified by the genetic code. The three-base code provides more than enough possibilities to code for these aminoacids. In fact, some amino acids have several different codes; alanine, for ex-ample, can be specified by the base sequences CGA, CGT, CGC, and CGG.Some of the base sequences, such as ATT, act to form “punctuation” for thegenetic instructions; that is, they provide the code to start or stop “mes-sages.” A list of the different DNA sequences is shown in Table 2.1.
The ability of four different bases, taken three at a time, to specify all theinformation needed for the synthesis of proteins is astounding. It bogglesthe mind that the diverse structure of complex protein molecules can bespecified with only a four-letter “alphabet.” As an analogy, consider the wayin which computers work. All computer operations, from word processing to complex mathematical simulations, ultimately are translated to a set of
CHAPTER 2 ■ Human Genetics 33
TA B L E 2 .1 DNA Base Sequences for Amino Acids
Second Base
First Base A T C G
A AAA Phenylalanine ATA Tyrosine ACA Cysteine AGA SerineAAT Leucine ATT Stop ACT Stop AGT SerineAAC Leucine ATC Stop ACC Tryptophan AGC SerineAAG Phenylalanine ATG Tyrosine ACG Cysteine AGG Serine
T TAA Isoleucine TTA Asparagine TCA Serine TGA ThreonineTAT Isoleucine TTT Lysine TCT Arginine TGT ThreonineTAC Methionine TTC Lysine TCC Arginine TGC ThreonineTAG Isoleucine TTG Asparagine TCG Serine TGG Threonine
C CAA Valine CTA Aspartic acid CCA Glycine CGA AlanineCAT Valine CTT Glutamic acid CCT Glycine CGT AlanineCAC Valine CTC Glutamic acid CCC Glycine CGC AlanineCAG Valine CTG Aspartic acid CCG Glycine CGG Alanine
G GAA Leucine GTA Histidine GCA Arginine GGA ProlineGAT Leucine GTT Glutamine GCT Arginine GGT ProlineGAC Leucine GTC Glutamine GCC Arginine GGC ProlineGAG Leucine GTG Histidine GCG Arginine GGG Proline
Rows refer to the first of the three bases, and columns refer to the second of the three bases. These base sequencesare for the DNA molecule. The 64 different combinations code for 20 amino acids and one termination sequence(“Stop”). To convert to messenger RNA, substitute U for A, A for T, G for C, and C for G. To convert to transferRNA, substitute U for A.
Relethford: The Human Species: An Introduction to Biological Anthropology, 5/e
I. Evolutionary Background 2. Human Genetics © The McGraw−Hill Companies, 2003
computer instructions that use only a simple two-letter alphabet—on or off!These two instructions make up a larger set of codes that provide informa-tion on computer operations. These operations are combined to generatecomputer languages that can be used to write a variety of programs.
The ability of the DNA molecule to use the different amino acid codeslies in a simple property of the chemical bases. The base A bonds with thebase T, and the base G bonds with the base C. This chemical property en-ables the DNA molecule to carry out a number of functions, including theability to make copies of itself and to direct the synthesis of proteins.
Functions of DNA The DNA molecule can make copies of itself. Remem-ber that the DNA molecule is made up of two strands that form the longarms of the ladder. Each rung of the ladder consists of two bases. If one partof the rung contains the base A, then the other part of the rung will containthe base T because A and T bond together.
To understand how DNA can make copies of itself, consider the follow-ing sequence of bases on one strand of the DNA molecule—GGTCTC. Be-cause A and T bond together and G and C bond together, the correspondingsequence of bases on the other strand of the DNA molecule is CCAGAG. TheDNA molecule can separate into two distinct strands. Once separate, eachstrand attracts free-floating bases. The strand GGTCTC attracts the basesCCAGAG, and the strand CCAGAG attracts the bases GGTCTC. When thenew bases have attached themselves to the original strands, the result is twoidentical DNA molecules. This process is diagrammed in Figure 2.2. Keep inmind that this description is somewhat oversimplified—in reality, the processis biochemically much more complex.
The ability of the DNA molecule to control protein synthesis also in-volves the attraction of complementary bases but with the help of anothermolecule—ribonucleic acid, or RNA for short. In simple terms, RNA servesas the messenger for the information coded by the DNA molecule. One majordifference between DNA and RNA is that in RNA the base A attracts a basecalled U (uracil) instead of T.
Consider the DNA base sequence GGT. In protein synthesis, the DNAmolecule separates into two strands and one strand (containing CCA) be-comes inactive. The active strand, GGT, attracts free-floating bases to form astrand of messenger RNA. Because A bonds with T and G bonds with C,this strand consists of the sequence CCA. The strand then travels to the siteof protein synthesis. Once there, the strand of messenger RNA transfers itsinformation via transfer RNA, which is a free-floating molecule. The se-quence of messenger RNA containing the sequence CCA attracts a transferRNA molecule with a complementary sequence—GGU. The result is that theamino acid proline (specified by the RNA sequence GGU or the DNA se-quence GGT) is included in the chain of amino acids making up a particularprotein. To summarize, one strand of the DNA molecule produces the com-plementary strand of messenger RNA, which attracts a complementarystrand of transfer RNA, which carries the specified amino acid. This processis illustrated for the DNA sequence GGT in Figure 2.3.
34 PART I ■ Evolutionary Background
RNA The molecule thatfunctions to carry out theinstructions for proteinsynthesis specified by theDNA molecule.
messenger RNA The formof RNA that transports thegenetic instructions fromthe DNA molecule to thesite of protein synthesis.
transfer RNA A free-floating molecule that isattracted to a strand ofmessenger RNA, resulting in the synthesis of a protein chain.
I I I I I I I

Relethford: The Human Species: An Introduction to Biological Anthropology, 5/e
I. Evolutionary Background 2. Human Genetics © The McGraw−Hill Companies, 2003
This simplified discussion shows the basic nature of the structure andfunctions of the DNA molecule. More advanced discussion can be found inmost genetics textbooks. For our purposes, however, the broad view will suf-fice. If we consider DNA as a “code,” we can then look at the processes oftransmission and change of information without actually having to considerthe exact biochemical mechanisms.
Chromosomes and GenesIn many organisms (including humans), most of the DNA is contained in aseparate part of the cell (the nucleus). Another form of DNA, contained in a part of the cell called the mitochondrion, is discussed later in Chapter 5.The DNA sequences are bound together by proteins in long strands calledchromosomes that are found within the nucleus of each cell. With the
CHAPTER 2 ■ Human Genetics 35
FIGURE 2.2
Replication of the DNAmolecule.
Section of initialDNA molecule
Two identicalDNA molecules
Each strandattracts free-
floatingcomplementary
bases (A pairs with T;C pairs with G)
The molecule separates intotwo strands
C
C
A
G
A
G
C
C
A
G
A
G
G
G
T
C
T
C
G
G
T
C
T
C
C
C
A
G
A
G
G
G
T
C
T
C
C
C
A
G
A
G
G
G
T
C
T
C
C
C
A
G
A
G
G
G
T
C
T
C
C
C
A
G
A
G
G
G
T
C
T
C
chromosome A long strandof DNA sequences.
I I I I I I I

Relethford: The Human Species: An Introduction to Biological Anthropology, 5/e
I. Evolutionary Background 2. Human Genetics © The McGraw−Hill Companies, 2003
36 PART I ■ Evolutionary Background
FIGURE 2.3
Protein synthesis.
C G
C G
C
C
C
C G
G
A
DNA molecule temporarily separates and one strand becomes active. Free-floating complementary bases (with U replacing T) are attracted to form messenger RNA.
2.Section of initial DNA molecule
Base sequenceGGT
MessengerRNA
AsparagineTransfer
RNA
Arginine
Transfer
RNA
Serine
Transfer
RNA
Proline
Transfer
RNA
MessengerRNA Amino acids
Ribosome
DNA
1.
Messenger RNA travels to the ribosomes, the site of protein synthesis. As ribosomes move along messenger RNA, transfer RNA picks up amino acids and lines up according to the base complements. Each transfer RNA molecule transfers its amino acid to the next active transfer RNA as it leaves, resulting in a chain of amino acids.
3. This chain of amino acidsforms a protein.
Proline
Serine
Arginine
Asparagine
Prol
ine
Seri
neA
rgin
ine
Aspa
ragi
ne4.
U
U
U
U
C
C G
CG
G
A AAT T
A
T A
T
T
A
A
T
T
A
A
T
C
C
G
T
T
A
T
A
T
C
C G
CG
G
A
A
T
A
A
TA
A
U
U
U
U
U
U
C
C
C
CG
G
G
G
GC
A
A
A
A
A
U
A
Inactive strand
Active strand

Relethford: The Human Species: An Introduction to Biological Anthropology, 5/e
I. Evolutionary Background 2. Human Genetics © The McGraw−Hill Companies, 2003
exception of those in the sex cells (egg and sperm), chromosomes occur in pairs. Most body cells contain both members of these pairs. Differentspecies have different numbers of chromosomes. For example, humans have23 pairs, chimpanzees have 24 pairs, fruit flies have 4 pairs, and certain plantspecies have thousands of pairs. There is no relationship between the num-ber of chromosome pairs a species has and its intelligence or biological complexity.
With certain exceptions, each cell in the human body contains a com-plete set of chromosomes and DNA. Nerve cells contain the same DNA asbone cells, for example, and vice versa. Some type of regulation takes placewithin different cells to ensure that only certain genes are expressed in theright places, but the exact nature of this regulation is not known completelyat present.
Genes The term gene can have a number of different meanings dependingon context. Used here, gene refers to a DNA sequence that includes the codefor a functional polypeptide (a compound containing many amino acids) orRNA product (Strachan and Read 1996), that is, a section of DNA that hasan identifiable function, such as the gene that determines a particular bloodgroup. One example, referred to in later chapters, is the hemoglobin mole-cule in your blood (that transports oxygen), which is made up of four pro-tein chains. For each chain, a section of DNA (the gene) contains the geneticcode for the proteins in that chain.
Not all DNA contains genes; much of our DNA is made up of noncod-ing sequences of DNA whose purpose (if any) is not known. Even withingenes, not all of the DNA sequence results in a polypeptide product. TheDNA sequence of a gene can contain both sections that code for amino acidsthat make up proteins (called exons) and sections that do not code for aminoacids that make up proteins (called introns). The formation of mature RNAinvolves removal of the noncoding sections and splicing together of the cod-ing sections (Figure 2.4).
CHAPTER 2 ■ Human Genetics 37
FIGURE 2.4
Diagram of messenger RNA(mRNA) showing regions of coding (exons) andnoncoding (introns). Theintrons are removed fromthe pre-mRNA, and theexons then splice together to form the mature mRNA.
Pre-mRNA consists of exons (green) and introns (red).
Introns are removed.
Exons are spliced together to form mature mRNA.
gene A DNA sequence that codes for a functionalpolypeptide or RNA product.
hemoglobin The moleculein blood cells that transportsoxygen.
exon A section of DNA thatcodes for the amino acidsthat make up proteins. It iscontrasted with an intron.
intron A section of DNAthat does not code for theamino acids that make upproteins. It is contrastedwith an exon.
I I I I I I I

Relethford: The Human Species: An Introduction to Biological Anthropology, 5/e
I. Evolutionary Background 2. Human Genetics © The McGraw−Hill Companies, 2003
Aside from the manufacture of proteins, another function of genes isthe regulation of biological processes. For example, in many humans the en-zyme needed to digest milk sugar stops being produced several years afterbirth. Or consider the fact that sexual maturation in humans occurs duringadolescence and not in infancy. The expression of many biological character-istics is regulated to take effect at particular times. Genes that are responsi-ble for this regulation are known as regulatory genes, and they act by turn-ing other genes on or off at the appropriate time.
Regulatory genes may have great evolutionary significance. For example,regulatory genes may help explain the great physical differences betweenchimpanzees and humans even though more than 98 percent of our struc-tural genes are identical. The major genetic difference between humans andchimpanzees may be caused by regulatory genes, which act on the timing ofgrowth and development and could lead to differences in brain size, facialstructures, and other physical features.
A possible example of regulatory genes is the absence of teeth in birds.Evolutionary analysis has concluded that modern birds evolved from primi-tive reptiles. One major change in this evolution is that birds have no teeth(other than the egg tooth they use in hatching). In 1980, however, scientistswere able to induce the tissue of a hen to grow teeth! Teeth are produced bycertain outer embryonic tissues that form the enamel and other inner tis-sues that form the dentin underneath. In what appears at first to be a bizarreexperiment, Kollar and Fisher (1980) combined the outer tissues of a henwith the inner tissues of a mouse. These grafts produced dentin and teeth.Modern birds lack the necessary type of tissue to form dentin but still havethe capacity to form it when we combine their tissue in the laboratory withthe appropriate tissue from another animal (the mouse, in this case). Thisexperiment shows that the genetic code for teeth still exists in birds, but it isturned off, most likely by some combination of regulatory genes.
Another example suggesting the action of regulatory genes is the num-ber of toes in horses. Modern horses have one single toe, although occasion-ally horses are born with two or three toes (Gould 1983). It appears thathorses still have the genetic code for additional toes but that these instruc-tions are turned off.
During the 1980s, a group of regulatory genes known as homeoboxgenes was discovered. These genes encode a sequence of 60 amino acids thatregulate embryonic development. Specifically, they subdivide a developingembryo into different regions from head to tail that then form limbs andother structures. One fascinating aspect of this discovery is that these genesare similar in many organisms, such as insects, mice, and humans. Prelimi-nary research suggests that the process of embryonic development into head,trunk, and tail may have occurred only once in evolution (De Robertis et al.1990). Another example of homeobox genes was found in a study of the de-velopment of wings in insects. Some insects have wings and some do not. Re-cent analyses suggest that wings developed once in the common ancestor ofall insects, but in some later forms homeobox genes repressed their develop-
38 PART I ■ Evolutionary Background
regulatory gene Gene thatcodes for the regulation ofbiological processes such asgrowth and development.
homeobox genes A groupof regulatory genes thatencode a sequence of 60amino acids regulatingembryonic development.
I I I I I I I
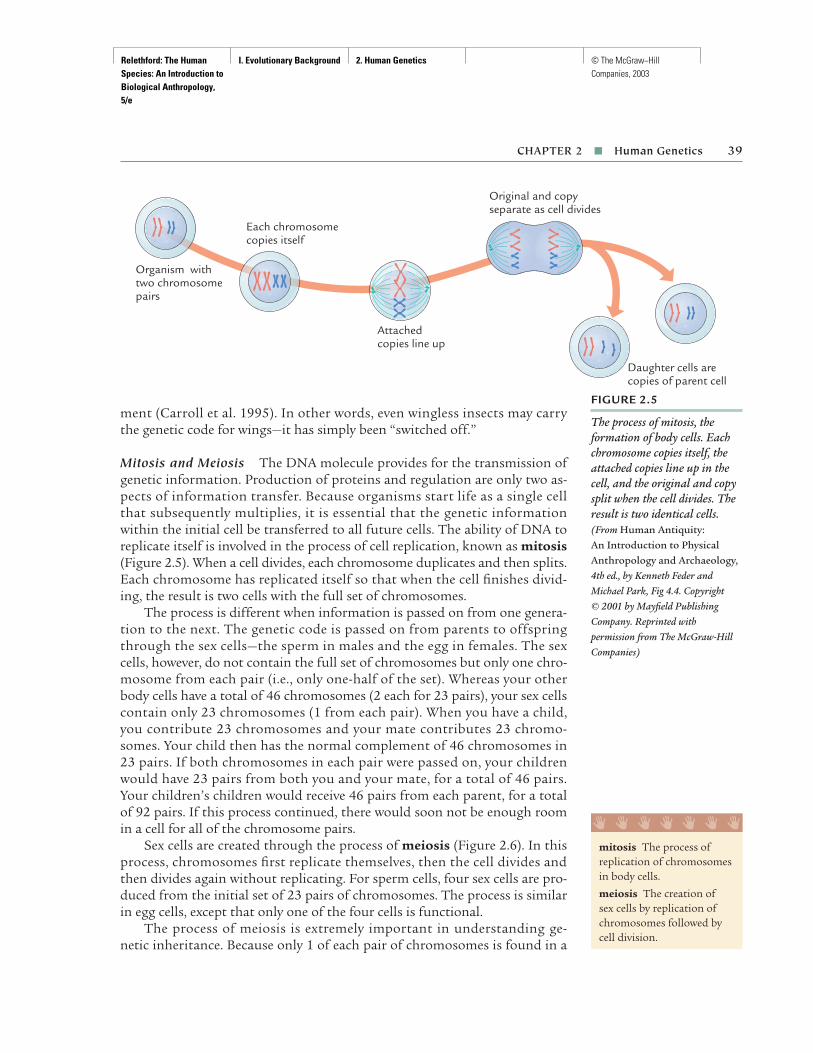
Relethford: The Human Species: An Introduction to Biological Anthropology, 5/e
I. Evolutionary Background 2. Human Genetics © The McGraw−Hill Companies, 2003
ment (Carroll et al. 1995). In other words, even wingless insects may carrythe genetic code for wings—it has simply been “switched off.”
Mitosis and Meiosis The DNA molecule provides for the transmission ofgenetic information. Production of proteins and regulation are only two as-pects of information transfer. Because organisms start life as a single cellthat subsequently multiplies, it is essential that the genetic informationwithin the initial cell be transferred to all future cells. The ability of DNA toreplicate itself is involved in the process of cell replication, known as mitosis(Figure 2.5). When a cell divides, each chromosome duplicates and then splits.Each chromosome has replicated itself so that when the cell finishes divid-ing, the result is two cells with the full set of chromosomes.
The process is different when information is passed on from one genera-tion to the next. The genetic code is passed on from parents to offspringthrough the sex cells—the sperm in males and the egg in females. The sexcells, however, do not contain the full set of chromosomes but only one chro-mosome from each pair (i.e., only one-half of the set). Whereas your otherbody cells have a total of 46 chromosomes (2 each for 23 pairs), your sex cellscontain only 23 chromosomes (1 from each pair). When you have a child,you contribute 23 chromosomes and your mate contributes 23 chromo-somes. Your child then has the normal complement of 46 chromosomes in23 pairs. If both chromosomes in each pair were passed on, your childrenwould have 23 pairs from both you and your mate, for a total of 46 pairs.Your children’s children would receive 46 pairs from each parent, for a totalof 92 pairs. If this process continued, there would soon not be enough roomin a cell for all of the chromosome pairs.
Sex cells are created through the process of meiosis (Figure 2.6). In thisprocess, chromosomes first replicate themselves, then the cell divides andthen divides again without replicating. For sperm cells, four sex cells are pro-duced from the initial set of 23 pairs of chromosomes. The process is similarin egg cells, except that only one of the four cells is functional.
The process of meiosis is extremely important in understanding ge-netic inheritance. Because only 1 of each pair of chromosomes is found in a
CHAPTER 2 ■ Human Genetics 39
FIGURE 2.5
The process of mitosis, theformation of body cells. Eachchromosome copies itself, theattached copies line up in thecell, and the original and copysplit when the cell divides. Theresult is two identical cells.(From Human Antiquity: An Introduction to PhysicalAnthropology and Archaeology,4th ed., by Kenneth Feder andMichael Park, Fig 4.4. Copyright © 2001 by Mayfield PublishingCompany. Reprinted withpermission from The McGraw-HillCompanies)
Attached copies line up
Each chromosomecopies itself
Organism with two chromosome pairs
Original and copyseparate as cell divides
Daughter cells arecopies of parent cell
mitosis The process ofreplication of chromosomesin body cells.
meiosis The creation of sex cells by replication ofchromosomes followed bycell division.
I I I I I I I
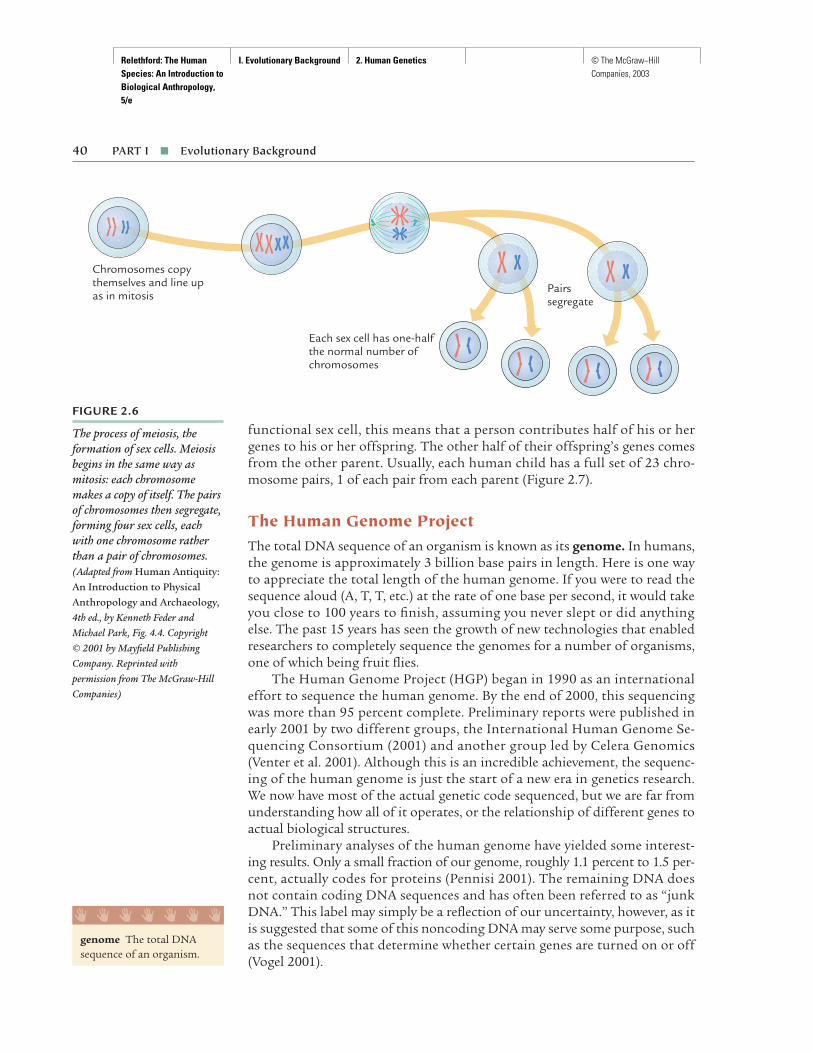
Relethford: The Human Species: An Introduction to Biological Anthropology, 5/e
I. Evolutionary Background 2. Human Genetics © The McGraw−Hill Companies, 2003
functional sex cell, this means that a person contributes half of his or hergenes to his or her offspring. The other half of their offspring’s genes comesfrom the other parent. Usually, each human child has a full set of 23 chro-mosome pairs, 1 of each pair from each parent (Figure 2.7).
The Human Genome ProjectThe total DNA sequence of an organism is known as its genome. In humans,the genome is approximately 3 billion base pairs in length. Here is one wayto appreciate the total length of the human genome. If you were to read thesequence aloud (A, T, T, etc.) at the rate of one base per second, it would takeyou close to 100 years to finish, assuming you never slept or did anythingelse. The past 15 years has seen the growth of new technologies that enabledresearchers to completely sequence the genomes for a number of organisms,one of which being fruit flies.
The Human Genome Project (HGP) began in 1990 as an internationaleffort to sequence the human genome. By the end of 2000, this sequencingwas more than 95 percent complete. Preliminary reports were published inearly 2001 by two different groups, the International Human Genome Se-quencing Consortium (2001) and another group led by Celera Genomics(Venter et al. 2001). Although this is an incredible achievement, the sequenc-ing of the human genome is just the start of a new era in genetics research.We now have most of the actual genetic code sequenced, but we are far fromunderstanding how all of it operates, or the relationship of different genes toactual biological structures.
Preliminary analyses of the human genome have yielded some interest-ing results. Only a small fraction of our genome, roughly 1.1 percent to 1.5 per-cent, actually codes for proteins (Pennisi 2001). The remaining DNA doesnot contain coding DNA sequences and has often been referred to as “junkDNA.” This label may simply be a reflection of our uncertainty, however, as itis suggested that some of this noncoding DNA may serve some purpose, suchas the sequences that determine whether certain genes are turned on or off(Vogel 2001).
40 PART I ■ Evolutionary Background
FIGURE 2.6
The process of meiosis, theformation of sex cells. Meiosisbegins in the same way asmitosis: each chromosomemakes a copy of itself. The pairsof chromosomes then segregate,forming four sex cells, eachwith one chromosome ratherthan a pair of chromosomes.(Adapted from Human Antiquity:An Introduction to PhysicalAnthropology and Archaeology,4th ed., by Kenneth Feder andMichael Park, Fig. 4.4. Copyright © 2001 by Mayfield PublishingCompany. Reprinted withpermission from The McGraw-HillCompanies)
Each sex cell has one-half the normal number of chromosomes
Chromosomes copy themselves and line up as in mitosis
Pairssegregate
genome The total DNAsequence of an organism.
I I I I I I I

Relethford: The Human Species: An Introduction to Biological Anthropology, 5/e
I. Evolutionary Background 2. Human Genetics © The McGraw−Hill Companies, 2003
One of the most unexpected results to date is the estimated number ofgenes in the human genome. Previous work had suggested a total of roughly100,000 genes, but the Human Genome Project has yielded estimates of only30,000 to 40,000 genes, which is only twice the number of genes found inworms or flies (International Human Genome Sequencing Consortium 2001).However, human genes are more complex and are able to serve multiple func-tions. Rather than the older view that a single gene codes for a single pro-tein, it appears that human genes can code for three proteins on average byusing different combinations of exons in a given gene (Pennisi 2001). The es-timated number of genes is still tentative, and Wright et al. (2001) have sug-gested that the actual number might be higher, perhaps around 70,000.
Although the news media have focused attention of the results of theHuman Genome Project on possible biomedical applications, such as genetictherapies for disease, we must keep in mind that we are still far from under-standing the complexity of our genetic code. In addition, the genetic se-quence tells us only a portion of the story; we also need to understand howgenetic information is expressed in different environments. It would be overlysimplistic to view genetics, and genetics alone, as determining our biology orbehavior. Still, it is likely that continuing work on the human genome willcontribute to our understanding of such complex issues and provide us witha clearer understanding of genetics in relationship to morphology, disease,behavior, population history, and other aspects of humanity.
MENDELIAN GENETICS
Many of the facts about genetic inheritance were discovered over a century be-fore the structure of DNA was known. Although people knew where babies
CHAPTER 2 ■ Human Genetics 41
FIGURE 2.7
All 23 pairs of chromosomestypically found in a humanbeing. This set of chromosomescame from a man—note that the 23rd pair has an X chromosome and a Y chromosome. (© CNRI/Science Photo Library/PhotoResearchers, Inc.)

Relethford: The Human Species: An Introduction to Biological Anthropology, 5/e
I. Evolutionary Background 2. Human Genetics © The McGraw−Hill Companies, 2003
came from and noted the close resemblance of parents and children, themechanisms of inheritance were unknown until the nineteenth century. AnAustrian priest, Gregor Mendel (1822–1884), carried out an extensive seriesof experiments in plant breeding. His carefully tabulated results providedthe basis of what we know about the mechanisms of genetic inheritance.
Before Mendel’s research, it was commonly assumed that inheritance in-volved the blending together of genetic information in the egg and sperm.The genetic material was thought to mix together in the same way that dif-ferent color paints mix together. Mendel’s experiments showed a differentpattern of inheritance—that the genetic information is inherited in discreteunits (genes). These genes do not blend together in an offspring.
In one experiment, Mendel crossed pea plants whose seeds were yellowwith pea plants whose seeds were green (Figure 2.8). Under the idea of blend-ing, one might expect all offspring to have mustard-colored seeds—a mixtureof the yellow and green. In reality, Mendel found that all the offspring plantshad yellow seeds. This discovery suggested that somehow one trait (yellowseed color) dominated in its effects.
When Mendel crossed the plants in this new generation together, hefound that some of their offspring had yellow seeds and some had greenseeds. Somehow the genetic information for green seeds had been hidden fora generation and then appeared again. Mendel counted how many there wereof each color. The ratio of plants with yellow seeds to those with green seedswas very close to 3:1. This finding suggested to Mendel that a regular processoccurred during inheritance that could be explained in terms of simple
42 PART I ■ Evolutionary Background
FIGURE 2.8
The seven phenotypiccharacteristics investigated by Gregor Mendel in hisexperiments on breeding in pea plants. Each of the seventraits has two distinctphenotypes.
Seeds SeedInteriors
SeedCoats
Ripe Pods
Unripe Pods
Flowers Stems
Round
or
Yellow
or
Gray
or
Inflated
or
Green
or
Axial
or
Long
or
Wrinkled Green White Constricted Yellow Terminal Short
Relethford: The Human Species: An Introduction to Biological Anthropology, 5/e
I. Evolutionary Background 2. Human Genetics © The McGraw−Hill Companies, 2003
mathematical principles. With these and other results, Mendel formulatedseveral principles of inheritance. Though Mendel’s work remained virtuallyunknown during his lifetime, his work was rediscovered in 1900. In recogni-tion of his accomplishments, the science of genetic inheritance is calledMendelian genetics.
Genotypes and PhenotypesThe specific position of a gene or DNA sequence on a chromosome is calleda locus (plural loci). The alternative forms of a gene or DNA sequence at alocus are called alleles. For example, a number of different genetic systemscontrol the types of molecules present on the surface of red blood cells. Oneof these blood groups, known as the MN system, determines whether or notyou have M molecules, N molecules, or both on the surface of your red bloodcells. The MN system has two forms, or alleles—M and N. Another bloodgroup system, the ABO system, has three alleles—A, B, and O. Even thoughthree different forms of this gene are found in the human species, each indi-vidual has only two genes at the ABO locus. Some genetic loci have only oneallele, some have two, and some have three or more.
Mendel’s Law of Segregation The genetic basis of any trait is determinedby an allele from each parent. At any given locus there are two alleles, one oneach member of the chromosome pair. One allele came from the mother, andone allele came from the father. Within body cells, alleles occur in pairs, andwhen sex cells are formed, only one of each pair is passed on (Mendel’s Lawof Segregation).
The two alleles at a locus in an individual specify the genotype, the ge-netic endowment of an individual. The two alleles might be the same formor might be different. If the alleles from both parents are the same, the geno-type is homozygous. If the alleles from the parents are different, the geno-type is heterozygous.
The actual observable trait is known as the phenotype. The relationshipbetween genotype and phenotype is affected by the relationship between thetwo alleles present at any locus. If the genotype is homozygous, both allelescontain the same genetic information. What happens in heterozygotes, wherethe two alleles are different?
Dominant and Recessive Alleles In a heterozygote, an allele is dominantwhen it masks the effect of the other allele at a given locus. The opposite of adominant allele is a recessive allele, whose effect may be masked. A simpleexample helps make these concepts clearer. One genetic trait in human be-ings is the ability to taste certain substances, including a chemical known asPTC. The ability to taste PTC appears to be controlled by a single locus andis also affected to some extent by environmental factors such as diet. Thereare two alleles for the PTC-tasting trait: the allele T, which is also called the“taster” allele, and the allele t, which is also called the “nontaster” allele.Given these two alleles, three combinations of alleles can be present in an
CHAPTER 2 ■ Human Genetics 43
locus The specific locationof a gene or DNA sequenceon a chromosome.
allele The alternative formof a gene or DNA sequencethat occurs at a given locus.Some loci have only oneallele, some have two, andsome have many alternativeforms. Alleles occur in pairs,one on each chromosome.
Mendel’s Law ofSegregation Sex cellscontain one of each pair of alleles.
genotype The geneticendowment of an individualfrom the two alleles presentat a given locus.
homozygous Both allelesat a given locus are identical.
heterozygous The twoalleles at a given locus aredifferent.
phenotype The observableappearance of a givengenotype in the organism.
dominant allele An allelethat masks the effect of the other allele (which isrecessive) in a heterozygousgenotype.
recessive allele An allelewhose effect is masked by the other allele (which is dominant) in aheterozygous genotype.
I I I I I I I

Relethford: The Human Species: An Introduction to Biological Anthropology, 5/e
I. Evolutionary Background 2. Human Genetics © The McGraw−Hill Companies, 2003
individual. A person could have the T allele from both parents, which wouldgive the genotype TT. A person could have a t allele from both parents, givingthe genotype tt. Both TT and tt are homozygous genotypes because both al-leles are the same. The third possible genotype occurs when the allele fromone parent is T and the allele from the other parent is t. This gives the het-erozygous genotype of Tt. It does not matter which parent provided the T al-lele and which provided the t allele; the genotype is the same in both cases.
What phenotype is associated with each genotype? The phenotype is af-fected both by the relationship of the two alleles and by the environment.For the moment, let us ignore possible environmental effects. Consider the T allele as providing instructions that allow tasting and the t allele as provid-ing instructions for nontasting. If the genotype is TT, then both alleles codefor tasting and the phenotype is obviously “taster.” Likewise, if the genotypeis tt, then both alleles code for nontasting and the phenotype is “nontaster.”What of the heterozygote Tt? One allele codes for tasting and one codes fornontasting. Does this mean that both will be expressed and that a person willhave the tasting ability but not to as great a degree as a person with genotypeTT ? Or does it mean that only one of the alleles is expressed? If so, which one?
There is no way you can answer this question using only the data pro-vided so far. You must know if either the T or t allele is dominant, and thiscan be determined only through experimentation. For this trait, it turns outthat the T allele is dominant and the t allele is recessive. When both allelesare present in a genotype, the T allele masks the effect of the t allele. There-fore, a person with the genotype Tt has the “taster” phenotype (Table 2.2).The relationship between genotype and phenotype does not take into con-sideration known environmental effects on PTC tasting. Under certain typesof diet, some “tasters” will show less ability to taste weaker concentrations ofthe PTC chemical.
The action of dominant and recessive alleles explains why Mendel’s second-generation pea plants all had yellow seeds. The allele for yellow seed color isdominant, and the allele for green seed color is recessive.
Dominance and recessiveness refer only to the effect an allele has in pro-ducing a phenotype. These terms say nothing about the frequency or valueof an allele. Dominant alleles can be common or rare, harmful or helpful.
44 PART I ■ Evolutionary Background
TA B L E 2 . 2 Genotypes and Phenotypesfor PTC Tasting
Genotype Phenotype
TT TasterTt Tastertt Nontaster
Because T is dominant, the genotypes TT and Ttboth produce the taster phenotype. This exampleis somewhat oversimplified because in reality thephenotype can also be affected by diet.
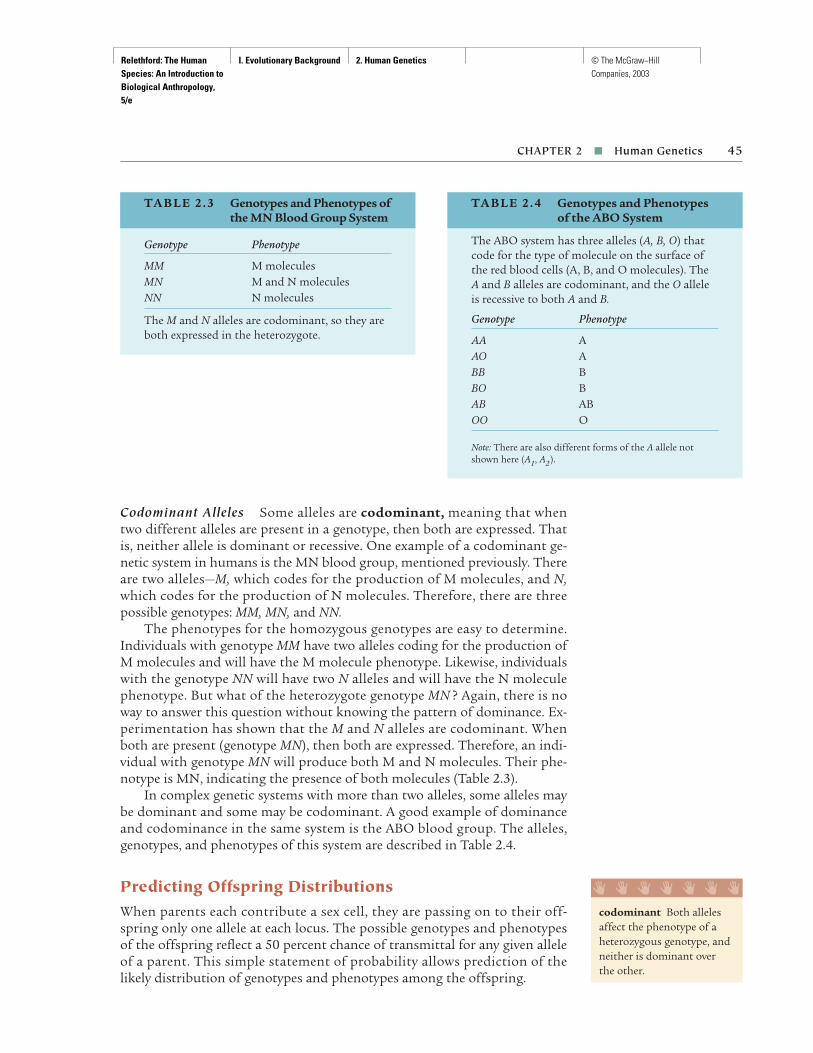
Relethford: The Human Species: An Introduction to Biological Anthropology, 5/e
I. Evolutionary Background 2. Human Genetics © The McGraw−Hill Companies, 2003
Codominant Alleles Some alleles are codominant, meaning that whentwo different alleles are present in a genotype, then both are expressed. Thatis, neither allele is dominant or recessive. One example of a codominant ge-netic system in humans is the MN blood group, mentioned previously. Thereare two alleles—M, which codes for the production of M molecules, and N,which codes for the production of N molecules. Therefore, there are threepossible genotypes: MM, MN, and NN.
The phenotypes for the homozygous genotypes are easy to determine.Individuals with genotype MM have two alleles coding for the production ofM molecules and will have the M molecule phenotype. Likewise, individualswith the genotype NN will have two N alleles and will have the N moleculephenotype. But what of the heterozygote genotype MN ? Again, there is noway to answer this question without knowing the pattern of dominance. Ex-perimentation has shown that the M and N alleles are codominant. Whenboth are present (genotype MN), then both are expressed. Therefore, an indi-vidual with genotype MN will produce both M and N molecules. Their phe-notype is MN, indicating the presence of both molecules (Table 2.3).
In complex genetic systems with more than two alleles, some alleles maybe dominant and some may be codominant. A good example of dominanceand codominance in the same system is the ABO blood group. The alleles,genotypes, and phenotypes of this system are described in Table 2.4.
Predicting Offspring DistributionsWhen parents each contribute a sex cell, they are passing on to their off-spring only one allele at each locus. The possible genotypes and phenotypesof the offspring reflect a 50 percent chance of transmittal for any given alleleof a parent. This simple statement of probability allows prediction of thelikely distribution of genotypes and phenotypes among the offspring.
CHAPTER 2 ■ Human Genetics 45
TA B L E 2 . 4 Genotypes and Phenotypesof the ABO System
The ABO system has three alleles (A, B, O) thatcode for the type of molecule on the surface ofthe red blood cells (A, B, and O molecules). TheA and B alleles are codominant, and the O alleleis recessive to both A and B.
Genotype Phenotype
AA AAO ABB BBO BAB ABOO O
Note: There are also different forms of the A allele notshown here (A1, A2).
TA B L E 2 . 3 Genotypes and Phenotypes ofthe MN Blood Group System
Genotype Phenotype
MM M moleculesMN M and N moleculesNN N molecules
The M and N alleles are codominant, so they areboth expressed in the heterozygote.
codominant Both allelesaffect the phenotype of aheterozygous genotype, andneither is dominant over the other.
I I I I I I I

Relethford: The Human Species: An Introduction to Biological Anthropology, 5/e
I. Evolutionary Background 2. Human Genetics © The McGraw−Hill Companies, 2003
Figure 2.9 illustrates this method using the MN blood group system fortwo hypothetical parents, each with the genotype MN. Each parent has a 50 percent chance of passing on an M allele and a 50 percent chance of passingon an N allele. Given these probabilities, we expect one out of four offspring(25 percent) to have genotype MM, and therefore phenotype M. In two out offour cases (50 percent), we expect the offspring to have genotype MN, andtherefore phenotype MN. Finally, in one out of four cases (25 percent), we ex-pect the offspring to have genotype NN, and therefore phenotype N. Of course,different parental genotypes will give a different set of offspring probabilities.
Remember that these distributions give the expected probabilities. Theexact distributions will not always occur because each offspring is an indepen-dent event. If the hypothetical couple first has a child with the genotype MN,this will not influence the genotype of their next child. The distributionsgive the proportions expected for a very large number of offspring.
To help understand the difference between expected and actual distribu-tion, consider coin flipping. If you flip a coin, you expect to get heads 50 per-cent of the time and tails 50 percent of the time. If you flip 10 coins one afteranother, you expect to get five heads and five tails. You may, however, get fourheads and six tails.
Analysis of possible offspring shows that recessive alleles can produce aninteresting effect; it is possible for children to have a different phenotypefrom either of the parents. For example, consider two parents, both with thegenotype Tt for the PTC-tasting locus. Both parents have the “taster” pheno-type. What genotypes and phenotypes will their children be likely to have? Theexpected genotype distribution is 25 percent TT, 50 percent Tt, and 25 per-cent tt (Figure 2.10).
Given this distribution of genotypes, what is the probable distributionof phenotypes? Genotypes TT and Tt are both “tasters,” and therefore 75 per-cent of the children are expected to also be “tasters.” Twenty-five percent of
46 PART I ■ Evolutionary Background
FIGURE 2.9
Inheritance of MN blood groupgenotypes for two parents, both withMN genotype.
Parent 2Genotype MN
Pare
nt 1
Gen
otyp
e M
N
or
N
M MM MN
NNMN
or NM
FIGURE 2.10
Inheritance of PTC-tasting genotypes andphenotypes for two parents, both with the Ttgenotype. Phenotypes are shown in parentheses.
Parent 2Genotype Tt
(Taster)
TT 25%Tt 50%tt 25%Pa
rent
1G
enot
ype
Tt(T
aste
r)
or
or
tT
t
TTT
(Taster)Tt
(Taster)
tt(Nontaster)
Tt(Taster)

Relethford: The Human Species: An Introduction to Biological Anthropology, 5/e
I. Evolutionary Background 2. Human Genetics © The McGraw−Hill Companies, 2003
the children, however, are expected to have the genotype tt and will thereforehave the “nontaster” phenotype. These children would have a different pheno-type from either parent. An additional example, also using the PTC-tastinglocus, is shown in Figure 2.11, which looks at the genotype and phenotypeoffspring distributions in the case where one parent has the Tt genotype andthe other has the tt genotype.
A recessive trait, then, can remain hidden in one generation. This facthas great implications for genetic disease. For example, the disease cystic fi-brosis occurs when a person is homozygous for a recessive allele. Therefore,two parents who have the heterozygous genotype do not manifest the dis-ease, but they have a 25 percent chance of giving birth to a child who has therecessive homozygous condition and therefore the disease.
Chromosomes and InheritanceAlleles occur in pairs. Mendel showed that when alleles are passed on fromparents to offspring, only one of each pair is contributed by each parent. Thespecific chromosome at any pair that is passed on is random. There is a 50 percent chance of either chromosome being passed on each time a sex cellis created.
Mendel’s Law of Independent Assortment Mendel’s experiments revealedanother aspect of probability in inheritance and the creation of sex cells.Mendel’s Law of Independent Assortment states that the segregation ofany pair of chromosomes does not influence the segregation of any otherpair of chromosomes. In other words, chromosomes from separate pairs areinherited independently.
For example, imagine an organism with three chromosome pairs that wewill label 1, 2, and 3. To keep the members of each pair straight in our minds,we label each chromosome of each pair as A or B. This hypothetical organ-ism has six chromosomes: 1A, 1B, 2A, 2B, 3A, and 3B. During the creation ofa sex cell, the 1A chromosome has a 50 percent chance of occurring, and sodoes the 1B chromosome. This same logic applies to chromosome pairs 2
CHAPTER 2 ■ Human Genetics 47
FIGURE 2.11
Inheritance of PTC-tastinggenotypes and phenotypes for two parents, one with theTt genotype and one with the tt genotype. Phenotypes are shown in parentheses.
Parent 2Genotype tt(Nontaster)
TT 0%Tt 50%tt 50%Pa
rent
1G
enot
ype
Tt(T
aste
r)
or
or
tt
t
TTt
(Taster)Tt
(Taster)
tt(Nontaster)
tt(Nontaster)
Mendel’s Law ofIndependent AssortmentThe segregation of any pairof chromosomes does notaffect the probability ofsegregation for other pairsof chromosomes.
I I I I I I I

Relethford: The Human Species: An Introduction to Biological Anthropology, 5/e
I. Evolutionary Background 2. Human Genetics © The McGraw−Hill Companies, 2003
and 3. Mendel’s Law of Independent Assortment states that the segregationof one pair of chromosomes does not affect the segregation of any other pairof chromosomes. It is just as likely to have a sex cell containing chromosomes1A, 2A, and 3A as it is to have a sex cell containing chromosomes 1A, 2A,and 3B. There are eight possible and equally likely outcomes for the sex cells:1A-2A-3A, 1A-2A-3B, 1A-2B-3A, 1A-2B-3B, 1B-2A-3A, 1B-2A-3B, 1B-2B-3A,and 1B-2B-3B (Figure 2.12). Given that any individual could have any one ofthe eight possible sex cells from both parents, the total number of combina-tions of offspring in this hypothetical organism is 8 × 8 = 64.
Independent assortment provides a powerful mechanism for shufflingdifferent combinations of chromosomes and thus introduces great potentialfor genetic diversity. In humans, who have 23 chromosome pairs, the num-bers are even more impressive. From any given individual, there are 223 =8,388,608 possible combinations of chromosomes in sex cells. This meansthat two parents could produce a maximum of 70,368,744,177,664 geneti-cally unique offspring!
Linkage A major implication of Mendel’s Law of Independent Assortmentis that genes are inherited independently. This is true only to the extent thatgenes are on different chromosomes. Remember, it is the pairs of chromo-somes that separate during meiosis, not each individual pair of alleles. Whenalleles are on the same chromosome, they are inherited together. This iscalled linkage. Linked alleles are not inherited independently because theyare, by definition, on the same chromosome.
48 PART I ■ Evolutionary Background
FIGURE 2.12
Schematic diagram illustratingMendel’s Law of IndependentAssortment. This hypotheticalorganism has three pairs ofchromosomes (1, 2, and 3),each of which has twochromosomes indicated by the letters A and B. Forexample, the chromosomes for chromosome pair 1 are 1Aand 1B. During meiosis, onlyone of each pair is passed on to a sex cell, that is, 1A or 1B,2A or 2B, and 3A or 3B. Theprobability of a particularchromosome being passed onfrom any pair is independentof the other pairs so that thereare eight possible combinations.
1A 2A 3A 1B
1A
1A
2A
2B 3A
3B 1B
1B
2A
2B 3A
3B
1A 2B 1B 2B 3B
1A 1B 3A 3B
Chromosomepair 1
Chromosomepair 2
Chromosomepair 3
Chromosomes
During meiosis, only one of each pair is passed on to a sex cell.
Possible combinationsof chromosomes insex cells
1A 1B 2A 2B 3A 3Bor or or
3B
3A2A
2A 2B
linkage Alleles on the samechromosome are inheritedtogether.
I I I I I I I
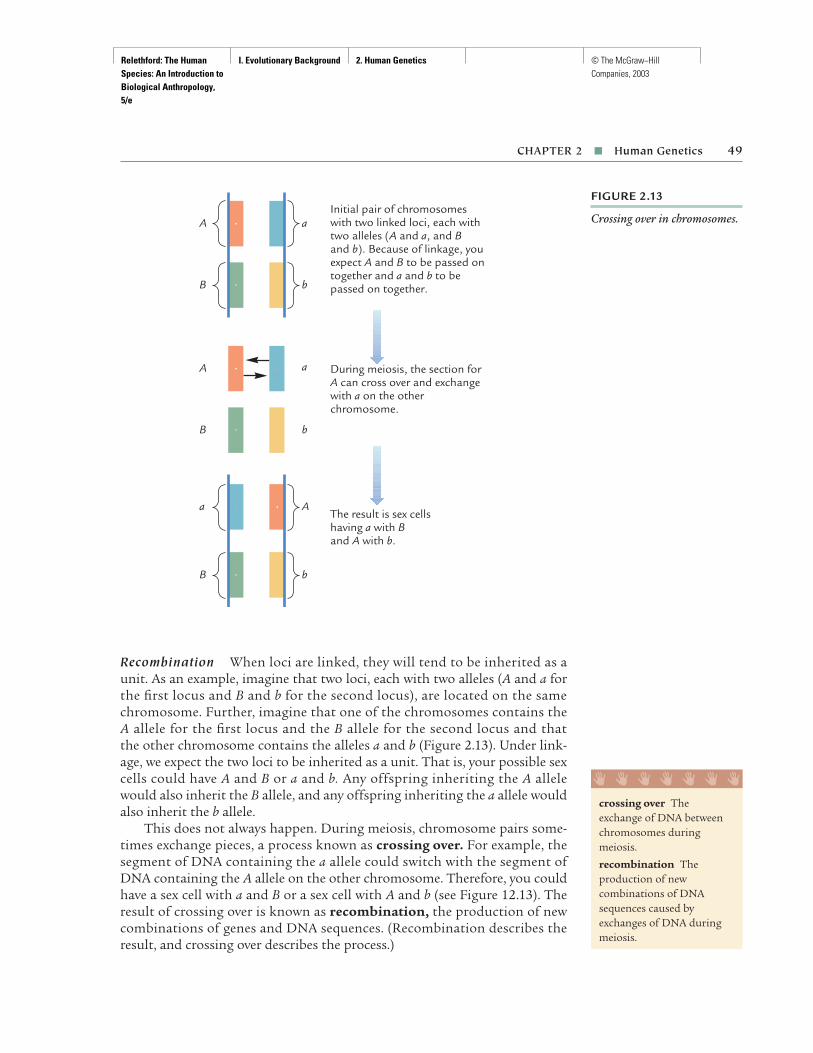
Relethford: The Human Species: An Introduction to Biological Anthropology, 5/e
I. Evolutionary Background 2. Human Genetics © The McGraw−Hill Companies, 2003
Recombination When loci are linked, they will tend to be inherited as aunit. As an example, imagine that two loci, each with two alleles (A and a forthe first locus and B and b for the second locus), are located on the samechromosome. Further, imagine that one of the chromosomes contains the A allele for the first locus and the B allele for the second locus and that the other chromosome contains the alleles a and b (Figure 2.13). Under link-age, we expect the two loci to be inherited as a unit. That is, your possible sexcells could have A and B or a and b. Any offspring inheriting the A allelewould also inherit the B allele, and any offspring inheriting the a allele wouldalso inherit the b allele.
This does not always happen. During meiosis, chromosome pairs some-times exchange pieces, a process known as crossing over. For example, thesegment of DNA containing the a allele could switch with the segment ofDNA containing the A allele on the other chromosome. Therefore, you couldhave a sex cell with a and B or a sex cell with A and b (see Figure 12.13). Theresult of crossing over is known as recombination, the production of newcombinations of genes and DNA sequences. (Recombination describes theresult, and crossing over describes the process.)
CHAPTER 2 ■ Human Genetics 49
FIGURE 2.13
Crossing over in chromosomes. A
B
a
b
A
B b
During meiosis, the section forA can cross over and exchange with a on the other chromosome.
a
B
A
b
The result is sex cells having a with B and A with b.
a
Initial pair of chromosomes with two linked loci, each with two alleles (A and a, and B and b). Because of linkage, you expect A and B to be passed on together and a and b to be passed on together.
crossing over Theexchange of DNA betweenchromosomes duringmeiosis.
recombination Theproduction of newcombinations of DNAsequences caused byexchanges of DNA duringmeiosis.
I I I I I I I

Relethford: The Human Species: An Introduction to Biological Anthropology, 5/e
I. Evolutionary Background 2. Human Genetics © The McGraw−Hill Companies, 2003
Recombination does not change the genetic material. The alleles are stillthe same, but they can occur in different combinations. Recombination pro-vides yet another mechanism for increasing genetic variation by providingnew combinations of alleles.
Sex Chromosomes and Sex Determination One of the 23 pairs of humanchromosomes is called the sex chromosome pair because these chromosomescontain the genetic information determining the individual’s sex. There aretwo forms of sex chromosomes, X and Y. Females have two X chromosomes(XX), and males have one X and one Y chromosome (XY).
The Y chromosome is much smaller than the X chromosome. Therefore,almost all genes found on X are not found on Y. This means that males pos-sess only one allele for certain traits because their Y chromosome lacks thecorresponding section of DNA. Therefore, males will manifest a trait forwhich they have only one allele, whereas females require the same allele fromboth parents to show the trait. An example of this sex difference is hemo-philia, a genetic disorder that interferes with the normal process of bloodclotting. The allele for hemophilia is recessive and is found on the segmentof the X chromosome that has no corresponding portion on the Y chromo-some. For females to be hemophiliac, they must inherit two copies of this al-lele, one from each parent. This is unlikely because the hemophilia allele israre. Males, however, need to inherit only one copy of the X chromosome fromthe mother. As a result, hemophilia is more common in males than females.
The Genetics of Complex Physical TraitsThe discussion of genetics thus far has focused on simple discrete genetictraits. Traits such as the MN blood group are genetically “simple” becausethey result from the action of a single locus with a clear-cut mode of inheri-tance. These traits are also discrete, meaning that they produce a finite num-ber of phenotypes. For example, you have the M or the N or the MN pheno-type for the MN blood group system; you cannot have an intermediatephenotype. Your MN phenotype is also produced entirely from genetic fac-tors. It is not influenced by the environment. Except for a complete bloodtransfusion, your MN blood group phenotype is the same all of your life.
These simple discrete traits are very useful for demonstrating the basicprinciples of Mendelian inheritance. It is not wise, however, to think of allbiological traits as resulting from a single locus, exhibiting a finite numberof phenotypes, or not being affected by the environment. Many of the char-acteristics of interest in human evolution, such as skin color, body size, brainsize, and intelligence, do not fall into this simple category. Such traits have acomplex mode of inheritance in that one or more genes may contribute tothe phenotype and they may be affected by the environment. The combinedaction of genetics and environment produces traits with a continuous distri-bution. An example is human height. People do not come in three different
50 PART I ■ Evolutionary Background

Relethford: The Human Species: An Introduction to Biological Anthropology, 5/e
I. Evolutionary Background 2. Human Genetics © The McGraw−Hill Companies, 2003
heights (short, medium, and tall), nor five, nor twenty. Height can take on aninfinite number of phenotypes. People can be 1,700 mm tall, 1,701 mm tall,and any value in between, such as 1,700.3 mm or 1,700.65 mm.
Complex traits tend to produce more individuals with average valuesthan extreme values. It is not uncommon to find human males between 1,676and 1,981 mm (5.5 and 6.5 feet) tall. It is much rarer to find someone tallerthan 2,134 mm (7 feet). A typical distribution of a complex trait, humanheight, is shown in Figure 2.14.
Polygenic Traits and Pleiotropy Many complex traits are polygenic, theresult of two or more loci. When several loci act to control a trait, many dif-ferent genotypes and phenotypes can result. A number of physical character-istics, such as human skin color and height, may be polygenic. A single allelecan also have multiple effects on an organism. When an allele has effects onmultiple traits, this is referred to as pleiotropy. In chickens, one of the alle-les that causes white feather color also acts to slow down overall body growth(Lerner and Libby 1976). In humans, the sickle cell allele affects the structureof the blood’s hemoglobin and also leads to changes in overall body growthand health.
The concepts of polygenic traits and pleiotropy are important in consid-ering the interrelated nature of biological systems. Analysis of simple dis-crete traits on a gene-by-gene basis is useful in understanding genetics, but itshould not lead you to think that any organism is simply a collection ofsingle, independent loci.
CHAPTER 2 ■ Human Genetics 51
FIGURE 2.14
The distribution of a normallydistributed continuous trait.This figure is based on theactual distribution of height(mm) of 1,986 Irish women(author’s unpublished data).The height of the curverepresents the proportion ofwomen with any given height.Most individuals have a valueclose to the average for thepopulation (the highest pointon the curve, whichcorresponds to a height of1,589 mm). The solid line isthe fit of the normaldistribution.
Prop
ortio
n of
indi
vidu
als
0.00
1360 1460 1560 1660 1760 1860
Height (mm)
0.05
0.10
0.15
polygenic A complexgenetic trait affected by twoor more loci.
pleiotropy A single allelethat has multiple effects onan organism.
I I I I I I I

Relethford: The Human Species: An Introduction to Biological Anthropology, 5/e
I. Evolutionary Background 2. Human Genetics © The McGraw−Hill Companies, 2003
Figure 2.15 shows several different models of genetic interaction. Fig-ure 2.15a represents the nature of some simple genetic traits, whereby eachcause has a single effect. Figure 2.15b represents a polygenic trait, wherebymany loci contribute to a single effect. Pleiotropic effects are shown in Fig-ure 2.15c, whereby a single allele has multiple effects. Figure 2.15d is the mostrealistic model for many complex traits; each allele has multiple effects, andeach effect has multiple causes. In this case, the trait is caused by polygenicand pleiotropic effects. To complicate matters, consider variations of thismodel in which not all alleles have the same effect, some alleles are domi-nant and some are not, and environmental factors act to obscure what we ac-tually observe. It is no wonder that the study of the genetics of complex traitsis extremely difficult, requiring sophisticated mathematical methods.
Heritability Complex traits reflect the joint effect of genetics and the envi-ronment. A common measure in studies of complex traits is heritability,which is the proportion of total variance in a trait that is attributable to ge-netic variation in a specific population (the value can be different in differ-ent populations). Complex traits show variation; for example, some peopleare taller than others, and some people have longer heads than others. Thevariation that we see is the total phenotypic variation. Some of this variationis due to genetic factors; some people may have a genetic potential for beingtaller, for example. The variation caused by genetic factors is called the geneticvariation. Some of the total variation is also due to differences in environ-mental factors. For example, some people may have different diets, whichwould affect their height. We call this the environmental variation. Thus, totalvariation is made up of two components: genetic variation and environmen-tal variation (or, in mathematical terms, total variation = genetic variation +environmental variation). Heritability is simply the proportion of total varia-tion that is due to genetic variation. That is,
Heritability � �Genetic variation
Heritability is computed with this formula using complex methods of com-paring relatives and environmental factors to estimate the genetic and envi-ronmental components. Heritability can range from 0 (no genetic variation)to 1 (no environmental variation). A high heritability, say greater than 0.5,indicates that the majority of variation is caused by genetic variation.
Although useful, the concept of heritability can be misleading. When wehear of a trait that has a high heritability, we are tempted to conclude thatthe trait is controlled almost exclusively by genetic factors and that environ-mental factors have little effect. The problem with reading too much intothe concept of heritability is that it is a relative measure of the degree of ge-netic variation in a specific environment. Consider, for example, an estimateof heritability for human height. If the specific population we are looking athas little variation in diet, disease, and other environmental factors that canaffect height, then the environmental variation will be low. As a result, the
Genetic � Environmental variation variation
Genetic variation��
Total variation
52 PART I ■ Evolutionary Background
FIGURE 2.15
The relationship between a gene and a biological effect. (a) Single gene, singleeffect. (b) Polygenic trait. (c) Pleiotropy. (d) A polygenictrait and pleiotropy.
c. Pleiotropy: a gene has multiple effects.
gene effect
d. Polygenic traits and pleiotropy.
gene effect
a. Each gene has a distinct biological effect.
gene effect
b. Polygenic trait: many genes contribute to a single effect.
gene effect
heritability The proportionof total variation of a traitdue to genetic variation.
I I I I I I I

Relethford: The Human Species: An Introduction to Biological Anthropology, 5/e
I. Evolutionary Background 2. Human Genetics © The McGraw−Hill Companies, 2003
heritability will be high. If, however, the environmental variation changes, re-sulting in greater differences within the population in terms of diet andother factors, then the environmental variation increases and heritabilitywill be lower. Heritability, then, is a relative measure that can vary from onepopulation to the next. It is not a measure of the extent to which geneticscontrols a trait; it is only a relative measure of variation.
Major Genes Recently, more attention has been given to major genes. In amajor gene model, a discernible portion of genetic variation is due to a singlelocus. The continuous distribution of the trait is the result of environmentaleffects and can be enhanced by the smaller effect of other loci. In contrast tocertain polygenic models whereby all loci contribute equally, a major genemodel postulates that a single locus has the greatest effect. A trait controlledby a major gene often shows the same type of distribution as a polygenic trait(see Figure 2.14). Developments in statistical analysis have allowed tests formajor genes. Examples of major genes that have been discovered in humansinclude oxygen saturation of arterial hemoglobin (Beall et al. 1994) and obe-sity (Comuzzie et al. 1997). In each case, however, there was evidence thatphenotypic variation was not due solely to a single gene and that other geneshad a residual effect.
MUTATIONS
As shown earlier, the process of genetic inheritance produces genetic varia-tion in offspring. The independent assortment of chromosomes duringmeiosis and the action of crossing over both act to create new genetic combi-nations. They do not act to create any new genetic material, however. To ex-plain past evolution, we need a mechanism for introducing new alleles andvariation. The origin of new genetic variation was a problem to Darwin, butwe now know new alleles are brought about through the process of mutation.
Evolutionary Significance of MutationsA mutation is a change in the genetic code. Mutations are the ultimatesource of all genetic variation. Mutations are caused by a number of environ-mental factors such as background radiation, which includes radiation fromthe earth’s crust and cosmic rays. Such background radiation is all aroundus, in the air we breathe and the food we eat. Mutations may also be causedby heat and ingested substances such as caffeine.
A growing concern is the effect of environmental changes on mutationrates. Human-made radiation, as from certain industries, not only might bedangerous to exposed individuals but also might affect their future offspringby creating mutational effects in sex cells. Numerous studies of laboratoryanimals, such as fruit flies, have shown clearly that the mutation rate in-creases with exposure to radiation. Less is known about the effect of increased
CHAPTER 2 ■ Human Genetics 53
major genes Genes thathave the primary effect onthe phenotypic distributionof a complex trait.
mutation A mechanism for evolutionary changeresulting from a randomchange in the genetic code;the ultimate source of allgenetic variation.
I I I I I I I

Relethford: The Human Species: An Introduction to Biological Anthropology, 5/e
I. Evolutionary Background 2. Human Genetics © The McGraw−Hill Companies, 2003
radiation on mutations in humans and other mammals. Studies of the chil-dren of survivors of the atomic bomb attacks in Japan at the end of WorldWar II have so far failed to show definite evidence of any increase in the rateof mutations in sex cells (although mutations in body cells in the exposedparents were frequent). Given the definite evidence of radiation effects fromexperimental animals, this failure may reflect an inadequate sample size orother methodological difficulties in the human studies. Another possibilityis that mammalian cells have a high capacity for DNA repair.
Mutations can take place in any cell of the body. To have evolutionaryimportance, however, the mutation must occur in a sex cell. A mutation in askin cell on the end of your finger has no evolutionary significance because itwill not be passed on to your offspring.
Mutations are random. That is, there is no way of predicting when a spe-cific mutation will take place or what, if any, phenotypic effect it will have.All we can do is estimate the probability of a mutation occurring at a givenlocus over a given amount of time. The randomness of mutations also meansthat mutations do not appear when they might be needed. Many mosquitoeshave adapted to insecticides because a mutation was present in the popula-tion that acted to confer some resistance to the insecticide. If that mutationhad not been present, the mosquitoes would have died. The mosquitoes’ needfor a certain genetic variant had no effect on whether or not the mutationappeared.
Mutations can have different effects depending on the specific type ofmutation and the environment. The conventional view of mutations haslong been that they are mostly harmful. A classic analogy is the comparisonof the genetic code with the engine of an automobile. If an engine part ischanged at random, the most likely result is that the car will not operate, orat least not as well as it did before the change.
Some mutations, however, are advantageous. They lead to change thatimproves the survival and reproduction of organisms. In recent decades, wehave also discovered that some mutations are neutral; that is, the geneticchange has no detectable effect on survival or reproduction. There is contin-ued controversy among geneticists about the relative frequency of neutralmutations. Some claim that many mutations are neutral in their effect. Oth-ers note the difficulties in detecting the effects of many mutations.
Whether or not a mutation is neutral, advantageous, or disadvantageousdepends in large part on the environment. Genetic variants that are harmfulin certain environments might actually be helpful in other environments.
Types of MutationsWe now recognize that there are a variety of ways in which mutations occur.Mutations can involve changes in a single DNA base, in larger sections ofDNA, and in entire chromosomes. One example is the substitution of oneDNA base for another, such as the widely studied sickle cell allele. The redblood cells produced in individuals with two copies of this allele (one from
54 PART I ■ Evolutionary Background
sickle cell allele An alleleof the hemoglobin locus.Individuals homozygous forthis allele have sickle cellanemia.
I I I I I I I

Relethford: The Human Species: An Introduction to Biological Anthropology, 5/e
I. Evolutionary Background 2. Human Genetics © The McGraw−Hill Companies, 2003
each parent) are misshapen and do not transport oxygen efficiently. The re-sult is a severe form of anemia (sickle cell anemia) that leads to sickness anddeath. The specific cause of this allele is a mutation in the sixth amino acid(out of 146 amino acids) of the beta chain of hemoglobin. The DNA for thenormal beta hemoglobin allele contains instructions for the amino acid, glu-tamic acid, at this position (CTC). The sickle cell mutation occurs when thebase T is changed to an A, which specifies the amino acid valine (CAC). Thissmall change affects the entire structure of the red blood cells and, in turn,the well-being of the individual.
Substitution of one base for another is only one type of mutation. Muta-tions can also involve the addition or deletion of a base or of large sectionsof DNA. In these cases, the genetic message is changed. Also, sections of DNAcan be duplicated or moved from one place to another, and sections of DNAcan be added or lost when crossing over is not equal.
The genetic information contained in the chromosomes can also be al-tered by the deletion or duplication of part or all of the chromosome. For ex-ample, an entire chromosome from a pair can be lost (monosomy = onechromosome) or can occur in duplicate, giving three chromosomes (trisomy).One result of the latter is Down syndrome, a condition characterized by cer-tain cranial features (Figure 2.16), poor physical growth, and mental retarda-tion (usually mild). Down syndrome is caused by the duplication of one ofthe 21st chromosome pair. Affected individuals have a total of 47 chromo-somes, one more than the normal 46. Down syndrome can also be caused bymutations of the 21st chromosome. In some individuals, the change involvesthe exchange of parts of the 21st chromosome with other chromosomes.
CHAPTER 2 ■ Human Genetics 55
FIGURE 2.16
Facial appearance of a childwith Down syndrome. (CourtesyMarch of Dimes)
monosomy A condition inwhich one chromosomerather than a pair is presentin body cells.
trisomy A condition inwhich three chromosomesrather than a pair occur in body cells.
I I I I I I I

Relethford: The Human Species: An Introduction to Biological Anthropology, 5/e
I. Evolutionary Background 2. Human Genetics © The McGraw−Hill Companies, 2003
Several chromosomal mutations involve the sex chromosomes. One,known as Turner’s syndrome, occurs when an individual has only one X chro-mosome instead of two. These individuals thus have only 45 chromosomesand develop as females. Those with Turner’s syndrome are generally short,have undeveloped ovaries, and are sterile. Another condition, known as Kline-felter’s syndrome, occurs in males with an extra X chromosome. Instead of thenormal XY combination, these males have an XXY combination for a total of47 chromosomes. They are characterized by small testes and reduced fertility.
Rates of MutationsSpecific mutations are relatively rare events, although the exact rate of muta-tions is difficult to determine in many cases. Part of the problem in deter-mining the rate of mutations is the fact that several different base sequencescan specify the same amino acid. For example, the amino acid glycine is spec-ified by the sequence CCA. If a mutation occurs in which the third basechanges from an A to a G, the net result is the sequence CCG, which alsospecifies glycine. This hypothetical mutation leads to no biochemical changeand is considered neutral. If there is no observable change, then the muta-tion will usually go unnoticed.
A mutation is also more apparent if it involves a dominant allele, becausea heterozygote receiving one copy of the mutant allele will show the mutantphenotype. If a mutant allele is recessive, then phenotypic expression will re-quire two copies of the mutant allele, which is a less common event. Reces-sive mutant alleles go unnoticed under these circumstances.
Another problem in identifying mutations is that harmful mutationsmay result in spontaneous abortion (miscarriage) before pregnancy has beendetected. Roughly 15 percent of all recognized conceptions result in sponta-neous abortion, of which 50 percent can be traced to specific chromosomalmutations (Sutton and Wagner 1985). For such an event to be recorded, how-ever, a woman must be aware that she is pregnant, which she usually doesn’tknow until a month or more after conception. Some researchers feel that alarge number of unrecognized conceptions are expelled spontaneously dur-ing the first few weeks after conception. If so, any prediction of mutationrates based on recognized conceptions will be an underestimate.
Despite these problems, research has provided estimates of a range inthe rates of mutation. For single-base mutations in humans, this range isfrom 1 to 100 mutations per million sex cells (Lerner and Libby 1976). Thistranslates to a probability between 0.000001 and 0.0001 of a mutation oc-curring at a given locus for a given sex cell. Certain types of DNA sequences,such as repeated units, have higher rates.
Regardless of the specific mutation rates for a given gene or chromo-some, one thing is clear—mutation rates are generally low. Given these lowprobabilities, it may be tempting to regard mutation as so rare that it has nospecial evolutionary significance. The problem with this reasoning is thatthe estimated rates refer to a single specific locus. Human chromosomes havemany loci. The probability that a specific locus will show a mutation in any
56 PART I ■ Evolutionary Background

Relethford: The Human Species: An Introduction to Biological Anthropology, 5/e
I. Evolutionary Background 2. Human Genetics © The McGraw−Hill Companies, 2003
S P E C I A L T O P I C
PCR and Ancient DNAIn the summer of 1994, filmgoers were thrilled by themovie Jurassic Park, based on the novel of the same nameby Michael Crichton (who studied anthropology as anundergraduate). The plot revolves around the construc-tion of a dinosaur theme park—with live dinosaurs! InJurassic Park, scientists recover amber dating back to thetime of the dinosaurs. Trapped in the amber are mos-quitoes who, prior to being encased in the tree sap thatbecomes amber, had drunk the blood of dinosaurs. Usingthis blood, the fictional scientists reconstruct the DNA of the original dinosaurs and bring a number of extinctspecies back to life.
A fascinating story, but how accurate is it? Could wereconstruct sufficient DNA sequences of ancient crea-tures to bring them back to life? At present, we lack thetechnology to do so. However, we can reconstruct someancient DNA sequences (although not well enough torecreate a dinosaur). Fragments of ancient DNA have beenreconstructed, including some from amber many mil-lions of years old. We also have been able to obtain DNAfragments from human populations many thousands of years old (Stone and Stoneking 1993; Hagelberg 1994).
The heart of these achievements is a relatively newtechnique called the polymerase chain reaction (PCR). Thistechnique involves the laboratory synthesis of millions of
copies of DNA fragments from very small initial amounts(Erlich et al. 1991). The process is essentially cyclical—theDNA strands are separated and form the template for newstrands, thus resulting in a doubling of the DNA eachtime through the cycle (see adjoining figure). This methodis very efficient in extracting DNA sequences from verysmall samples. In fact, it is so efficient that one of the tech-nical problems is that it often picks up DNA from peo-ple’s cells floating around the lab as dust (Hagelberg 1994).The PCR method is also useful to anthropologists work-ing on living human populations. Samples can be collectedand transported easily—such as single plucked hairs.
The PCR method has also proven valuable in thefield of forensics. Very small samples can yield sufficientDNA to help identify skeletal remains of murder victims.One notorious case involved the skeletal remains thatwere attributed to the infamous Nazi doctor Joseph Men-gele. Extracts of bone were taken, and the DNA was am-plified using PCR and then compared to the known sur-viving relatives of Mengele. Based on this comparison,the skeletal remains were definitely identified as havingbeen Mengele (Hagelberg 1994). DNA analysis also hasbeen used to look at the genetics of ancient humansdating back many tens of thousands of years. These studies are described in more detail in Chapter 13.
Simplified diagram of the polymerase chainreaction (PCR) used to amplify smallamounts of DNA. Each time through thecycle the amount of DNA doubles.
New double-strandedDNA sample
Separate DNA into twostrands
Synthesize new strands
Initial DNA sample
57

Relethford: The Human Species: An Introduction to Biological Anthropology, 5/e
I. Evolutionary Background 2. Human Genetics © The McGraw−Hill Companies, 2003
individual is low, but the probability of any locus showing a mutation ismuch higher.
Even though mutation is a rare event for any given locus, there is a highprobability of at least one new mutation in each individual. When we con-sider the genetics of an entire population or species, the net result is thatmutation is common within a single generation. In fact, many studies esti-mate that all of us carry at least one lethal recessive mutant allele.
GENETICS AND BEHAVIOR
Perhaps the most controversial topic in genetics is the question of the extentto which behavior is governed by genetic factors. The controversy arises notso much from academic debate but from the social implications, real andimagined, of this question. Problems arise out of a misunderstanding of thebasic concepts of genetics or are produced by those seeking any “scientific”fact, regardless of truth, to support and further their own social or politicalagenda. Much of this controversy revolves around the concept of race, whichis discussed in Chapter 5. The present section focuses on basic strategies in-volved in relating genes and behavior.
Is a behavior, such as intelligence or shyness, caused by genes (“nature”)or by the physical and cultural environment (“nurture”)? The debate over na-ture versus nurture has a long history in Western civilization. The prevalentview among scientists reflects not only current research but also the socialand cultural climate of the times. Scientists are people too, as susceptible tobiases and prejudices as everyone else. A major lesson of the history of sci-ence is that cultural beliefs influence the methodology and interpretation ofscientific results.
At the beginning of the twentieth century, the prevalent view was that“nature” was the more important determinant of many behaviors, particu-larly intelligence. This emphasis shifted to “nurture” during the period fromthe 1930s to the 1960s, when environmental factors were seen as being themost, if not the only, important factor.
Much of the debate over nature versus nurture is nonsense, however. Anyattempt to relegate human behaviors to either genetics or environment isfruitless. Genes and environment are both important in their effect on humanbehaviors. The proper question is not which is more important but ratherhow they interact.
Evidence of some genetic influence has been found for a variety of humanbehaviors, including intelligence test scores, autism, reading and languagedisabilities, eating disorders, schizophrenia, and sexual orientation, amongothers. These studies do not support a view that behavior is caused by genesbut rather that genes can influence behavior. In a review of genetic studies ofhuman behavior, Plomin et al. (1994) note that these analyses have consis-tently shown that there is at least as much environmental variation relatedto phenotypic variation as there is genetic variation. In other words, both ge-
58 PART I ■ Evolutionary Background
Relethford: The Human Species: An Introduction to Biological Anthropology, 5/e
I. Evolutionary Background 2. Human Genetics © The McGraw−Hill Companies, 2003
netic and environmental variation have been related to behavioral variation.Further, because environmental effects can be different in different popula-tions, the relative influence of genetic and environmental variation will alsodiffer from one population to the next.
What are the implications of the joint interaction between genetics andenvironment? If a behavior is affected to some extent by genetics, then isthere an innate difference between people with different alleles? Not neces-sarily. Even if genetic differences in a behavior exist, this does not mean thatthose differences will override environmental factors. Studies of male sexualorientation, for example, have suggested a moderate heritability for homo-sexual orientation (Pillard and Bailey 1998), and some have suggested geneticsusceptibility for male homosexuality is linked to a gene (or genes) on the X chromosome (Hamer et al. 1993; Hu et al. 1995). These results do not meanthat there is a “gay gene” but rather that genetic factors can influence malesexual orientation in certain cases. Such studies also show that environmen-tal factors play a large role in sexual orientation. As Pattatucci (1998) notes,sexual orientation is related to many factors, and “it is highly improbablethat any single genetic variation or allele will be present in all homosexualindividuals and absent from all heterosexual individuals” (p. 368). As is thecase with many behavioral traits, the phenotype reflects a complex interac-tion of genetic and environmental factors.
SUMMARY
The DNA molecule specifies the genetic code or set of instructions needed toproduce biological structures. DNA acts along with a related molecule, RNA,to translate these instructions into proteins. The DNA is contained alongstructures within the cell called chromosomes. Chromosomes come in pairs.A segment of DNA that codes for a certain product is called a gene. The dif-ferent forms of genes present at a locus are called alleles. The DNA moleculehas the ability to make copies of itself, allowing transmission of genetic in-formation from cell to cell and from generation to generation.
Meiosis is the process of sex cell formation that results in one of eachchromosome pair being transmitted from parent to offspring. Each individ-ual receives half of his or her alleles from each parent. The two alleles to-gether specify the genetic constitution of an individual—the genotype. Thephysical manifestation of the genotype is known as the phenotype. The rela-tionship between genotype and phenotype depends on whether an allele isdominant, recessive, or codominant. In complex physical traits, the pheno-type is the result of the combined effect of genetics and environment.
The ultimate source of all genetic variation is mutation—a random changein the genetic code. Some mutations are neutral in effect; others are helpfulor harmful. The effect of any mutation often depends on the specific envi-ronmental conditions. Mutations for any given allele are relatively rare events,but given the large number of loci in many organisms, it is highly probablethat each individual has at least one mutant allele.
CHAPTER 2 ■ Human Genetics 59

Relethford: The Human Species: An Introduction to Biological Anthropology, 5/e
I. Evolutionary Background 2. Human Genetics © The McGraw−Hill Companies, 2003
Genetic factors have been linked to human behaviors. Such behaviorsappear to be influenced by both genetics and environment. Given the biocul-tural nature of human beings, it should be no surprise that both genes andenvironment have an effect on both biology and behavior.
SUPPLEMENTAL READINGS
Jones, S. 1993. The Language of Genes: Solving the Mysteries of Our Genetic Past, Present and Future. New York: Doubleday. A well-written general introduction to human genetics.
Marks, J. 1995. Human Biodiversity: Genes, Race, and History. New York: Aldine de Gruyter. Ahistorically oriented review of different approaches to human biological variation,with many discussions of the nature of genes and the mechanisms of human genetics.
Nature, vol. 409, no. 6822 (February 15, 2001); Science, vol. 291, no. 5507 (February 16,2001). These two specific issues of leading science journals both contain preliminaryanalyses of the human genome and include many commentaries regarding the history,current status, and possible use of data obtained from the Human Genome Project.
INTERNET RESOURCES
http://anthro.palomar.edu/biobasis/default.htmBiological Basis of Heredity, an online tutorial about basic cell biology foranthropology students.
http://vector.cshl.org/dnaftbDNA from the Beginning, an online tutorial of DNA.
http://www.nhgri.nih.gov/educationkitThe Human Genome Project: Exploring Our Molecular Selves, an educationalWeb site dealing with the Human Genome Project.
http://anthro.palomar.edu/mendel/default.htmThe Basic Principles of Genetics: An Introduction to Mendelian Genetics.
http://www3.ncbi.nlm.nih.gov/OmimOMIM—Online Mendelian Inheritance in Man. This Web page provides acomprehensive catalog of human genes and genetic disorders.
60 PART I ■ Evolutionary Background

Relethford: The Human Species: An Introduction to Biological Anthropology, 5/e
I. Evolutionary Background 2. Human Genetics © The McGraw−Hill Companies, 2003
61
This section, which focuses onthe structure of the cell and onthe processes of mitosis andmeiosis, can be used as a supple-ment for students wishing toreview the basic biology neces-sary for an understanding of the fundamental principles ofMendelian genetics.
THE CELL
All living creatures are made upof cells. Humans, like many or-ganisms, are multicelled. Figure2.17 shows some of the compo-nents of a typical cell. Two majorstructures are the nucleus and thecytoplasm; the latter contains anumber of other structures. Theentire body of the cell is enclosedby a cell membrane.
Within the cytoplasm, mito-chondria convert some cellularmaterial into energy that is thenused for cellular activity (seeChapter 5 for further discus-sion). Ribosomes are small parti-cles that are frequently attachedto a larger structure known asthe endoplasmic reticulum. Com-posed of RNA and proteins,ribosomes serve as sites for themanufacture of proteins.
As discussed in Chapter 2, the DNA sequences that makeup the genetic code are boundtogether by proteins in longstrands known as chromosomes.In body cells, chromosomes comein pairs; humans have 23 pairsof chromosomes. The chromo-somes within the nucleus of the cell contain all of the DNA,with the exception of somethingcalled mitochondrial DNA (seeChapter 5).
MITOSIS
DNA has the ability to makecopies of itself. This ability is vitalfor transmitting genetic infor-mation from cell to cell and fortransmitting genetic informationfrom generation to generation.The replication of DNA is part of the process of cell replication.We will examine two basic pro-cesses: mitosis, the replication ofbody cells, and meiosis, the rep-lication of sex cells.
Mitosis produces two identi-cal body cells from one original.Between cell divisions, eachchromosome produces an exactcopy of itself, resulting in twopairs with two chromosomes
Cell BiologyA Review
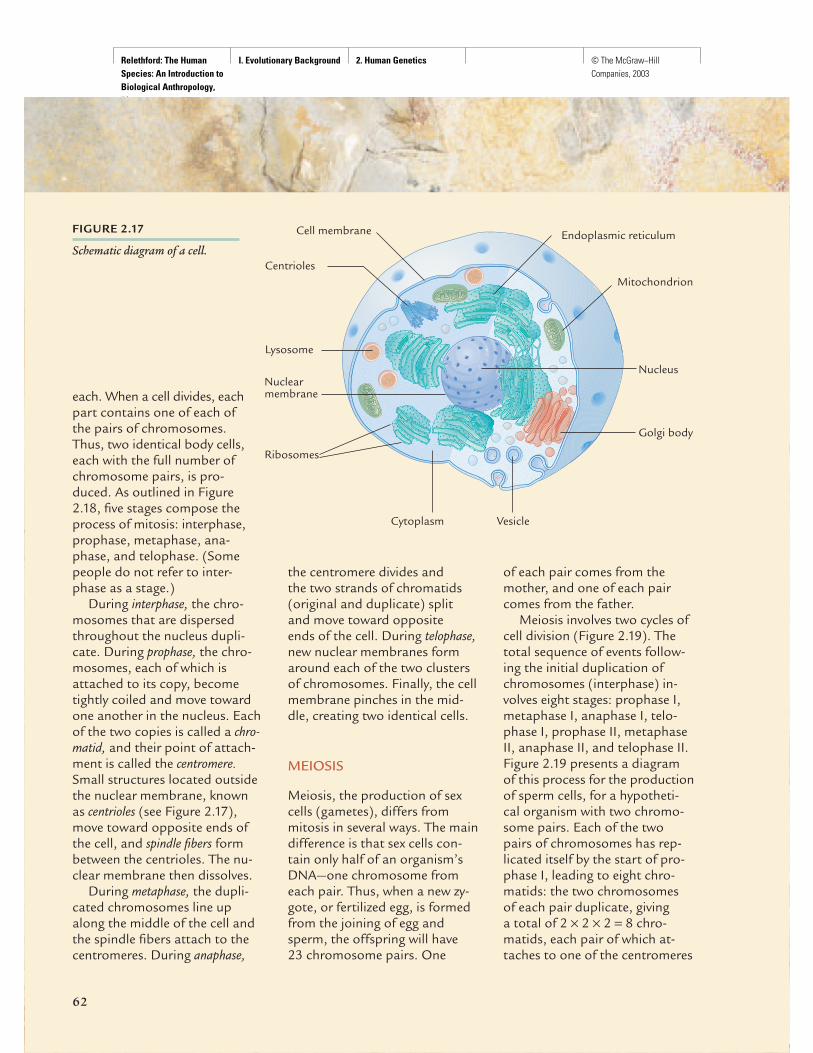
Relethford: The Human Species: An Introduction to Biological Anthropology, 5/e
I. Evolutionary Background 2. Human Genetics © The McGraw−Hill Companies, 2003
62
each. When a cell divides, eachpart contains one of each ofthe pairs of chromosomes.Thus, two identical body cells,each with the full number ofchromosome pairs, is pro-duced. As outlined in Figure2.18, five stages compose theprocess of mitosis: interphase,prophase, metaphase, ana-phase, and telophase. (Somepeople do not refer to inter-phase as a stage.)
During interphase, the chro-mosomes that are dispersedthroughout the nucleus dupli-cate. During prophase, the chro-mosomes, each of which is attached to its copy, becometightly coiled and move towardone another in the nucleus. Eachof the two copies is called a chro-matid, and their point of attach-ment is called the centromere.Small structures located outsidethe nuclear membrane, knownas centrioles (see Figure 2.17),move toward opposite ends ofthe cell, and spindle fibers formbetween the centrioles. The nu-clear membrane then dissolves.
During metaphase, the dupli-cated chromosomes line upalong the middle of the cell andthe spindle fibers attach to thecentromeres. During anaphase,
the centromere divides and the two strands of chromatids(original and duplicate) split and move toward opposite ends of the cell. During telophase,new nuclear membranes formaround each of the two clustersof chromosomes. Finally, the cellmembrane pinches in the mid-dle, creating two identical cells.
MEIOSIS
Meiosis, the production of sexcells (gametes), differs frommitosis in several ways. The maindifference is that sex cells con-tain only half of an organism’sDNA—one chromosome fromeach pair. Thus, when a new zy-gote, or fertilized egg, is formedfrom the joining of egg andsperm, the offspring will have 23 chromosome pairs. One
of each pair comes from themother, and one of each paircomes from the father.
Meiosis involves two cycles ofcell division (Figure 2.19). Thetotal sequence of events follow-ing the initial duplication ofchromosomes (interphase) in-volves eight stages: prophase I,metaphase I, anaphase I, telo-phase I, prophase II, metaphaseII, anaphase II, and telophase II.Figure 2.19 presents a diagramof this process for the productionof sperm cells, for a hypotheti-cal organism with two chromo-some pairs. Each of the twopairs of chromosomes has rep-licated itself by the start of pro-phase I, leading to eight chro-matids: the two chromosomes of each pair duplicate, giving a total of 2 × 2 × 2 = 8 chro-matids, each pair of which at-taches to one of the centromeres
FIGURE 2.17
Schematic diagram of a cell. Centrioles
Lysosome
Mitochondrion
Cytoplasm
Cell membrane
Vesicle
Golgi body
NucleusNuclearmembrane
Endoplasmic reticulum
Ribosomes
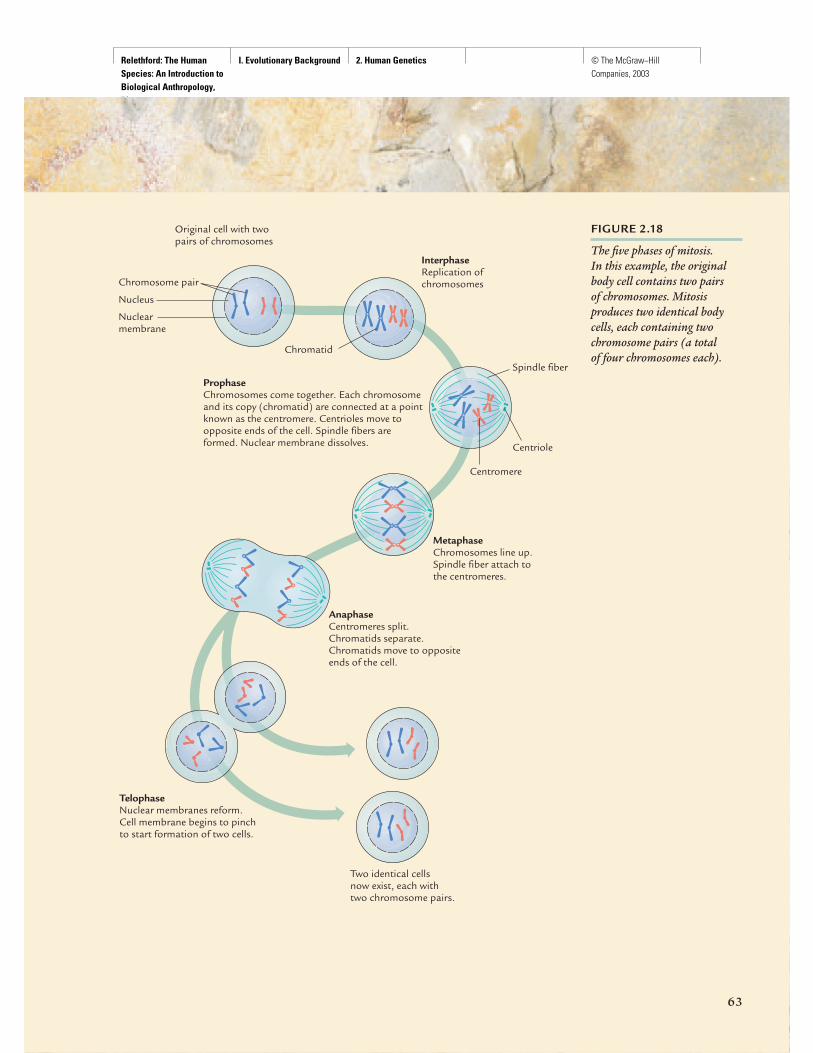
Relethford: The Human Species: An Introduction to Biological Anthropology, 5/e
I. Evolutionary Background 2. Human Genetics © The McGraw−Hill Companies, 2003
63
FIGURE 2.18
The five phases of mitosis. In this example, the originalbody cell contains two pairs of chromosomes. Mitosisproduces two identical bodycells, each containing twochromosome pairs (a total of four chromosomes each).
Chromosome pair
Nucleus
Nuclear membrane
Spindle fiber
Two identical cellsnow exist, each withtwo chromosome pairs.
AnaphaseCentromeres split.Chromatids separate.Chromatids move to opposite ends of the cell.
Original cell with two pairs of chromosomes
InterphaseReplication of chromosomes
Metaphase Chromosomes line up.Spindle fiber attach to the centromeres.
ProphaseChromosomes come together. Each chromosomeand its copy (chromatid) are connected at a point known as the centromere. Centrioles move toopposite ends of the cell. Spindle fibers are formed. Nuclear membrane dissolves.
TelophaseNuclear membranes reform.Cell membrane begins to pinchto start formation of two cells.
Chromatid
Centromere
Centriole

Relethford: The Human Species: An Introduction to Biological Anthropology, 5/e
I. Evolutionary Background 2. Human Genetics © The McGraw−Hill Companies, 2003
FIGURE 2.19
The phases of meiosis for asperm cell. In this example,the original cell containedtwo chromosome pairs. As aresult of meiosis, four spermcells were produced, each with two chromosomes. Theprocess is similar for egg cells,except that one egg cell andthree polar bodies areproduced.
Four sperm cells, eachwith two chromosomes
Telophase INuclear membranes reform. Cell divides.
Anaphase ICopies separate.
Original cell with two pairs of chromosomes
Anaphase IICentromeres split.Chromatids separate.
Metaphase IIChromosomes line up.
InterphaseReplication of chromosomes
Prophase IMetaphase IPaired chromosomesline up. Spindle fibers form.
Prophase II
Telophase II
64

Relethford: The Human Species: An Introduction to Biological Anthropology, 5/e
I. Evolutionary Background 2. Human Genetics © The McGraw−Hill Companies, 2003
65
through a process known assynapsis. At the end of prophase Ithe nuclear membrane dissolves.Then, during metaphase I, thepaired chromosomes line up andspindle fibers form. The copiesseparate during anaphase I.During telophase I, the nuclearmembranes reform and the celldivides. The realization of twocells, each containing eight chro-matids, constitutes prophase II.During metaphase II, the chro-mosomes line up, after whichthe centromeres split and thechromatids separate, completinganaphase II. The nuclear mem-branes reform during telophaseII, and the cell divides. The netresult of this sequence of two cell divisions is four sperm cells,each with two chromosomes—half of the genetic material ofthe father. The process is similarfor the production of egg cellsfrom the female, except that thenet result is one egg cell andthree structures known as polarbodies that do not function as sex cells.
Meiosis thus allows half of aparent’s genetic material to bepassed on to the next genera-tion. When a sperm cell fertilizesan egg cell, the total number ofchromosomes is restored. For
humans, the resulting zygotecontains 23 + 23 = 46 chromo-somes, or 23 chromosome pairs.
Sex cells may also containgenetic combinations not pres-ent in the parent. When synapsisoccurs during prophase I and the chromosomes pair with theircopies, becoming attached toone another at several places,the potential exists for geneticmaterial to be exchanged, a pro-cess known as crossing over. Theresulting genetic combinationsallow for variation in each sexcell from its source.
Independent assortment alsoenhances genetic variability. Asdiscussed in Chapter 2, accord-ing to this principle, the segrega-tion of any pair of chromosomesdoes not affect the probability of segregation of any other pairof chromosomes. If you had twochromosome pairs, A and B,with two chromosomes each (A1and A2, and B1 and B2), onlyone of each pair will be found in any sex cell. However, youmight have one sex cell with A1and B1 and another sex cell withA1 and B2. Whichever memberof the first pair of chromosomesis found in any given sex cell hasno bearing on whichever mem-ber of the second pair is also
found in that sex cell. Indepen-dent assortment results fromprocesses occurring duringmetaphase I. When the pairedchromosomes line up, they do so at random and are not influ-enced by whether they originallycame from the person’s motheror father. This process allows for tremendous genetic variabil-ity in potential offspring.

Relethford: The Human Species: An Introduction to Biological Anthropology, 5/e
I. Evolutionary Background 3. Evolutionary Forces © The McGraw−Hill Companies, 2003
C H A P T E R 3Evolutionary Forces
67
Biological evolution is genetic change through time and can be studied attwo different levels. Microevolution consists of changes in the frequency
of alleles in a population from one generation to the next. Macroevolutioncomprises long-term patterns of genetic change over thousands and millionsof generations, as well as the process of species formation. This chapter dealswith the general principles of microevolution. Macroevolution is discussedin Chapter 4.
POPULATION GENETICS
Microevolution takes into account changes in the frequency of alleles fromone generation to the next. The focus is generally not on the specific geno-types or phenotypes of individuals but rather on the total pattern of an entire biological population. We are interested in defining the relative fre-quencies of different alleles, genotypes, and phenotypes for the entire popu-lation being studied. We then seek to determine if any apparent change inthese frequencies has occurred over time. If changes have occurred, we try toexplain them.
Two closely related species, a wolf and a dog. Similarities and differencesbetween species, and between populations within a species, are the focus ofevolutionary investigation. Changes over time reflect the action of severalevolutionary forces: mutation, natural selection, genetic drift, and gene flow.(© Robert Clark)
▲
Relethford: The Human Species: An Introduction to Biological Anthropology, 5/e
I. Evolutionary Background 3. Evolutionary Forces © The McGraw−Hill Companies, 2003
68 PART I ■ Evolutionary Background
What Is a Population?The term breeding population is used frequently in evolutionary theory. Inan abstract sense, a breeding population is a group of organisms that tend tochoose mates from within the group. This definition is a bit tricky because it is not clear what proportion of mating within a group defines a breedingpopulation.
For example, suppose you travel to a village in a remote mountain re-gion. You find that 99 percent of all the people in the village are married toothers who were born in the same village. In this case, the village would ap-pear to fit our ideal definition. But what if only 80 percent of the peoplechoose their mates from within the village? What if the number were 50 per-cent? At what point do you stop referring to the population as a “breedingpopulation”? There is no quick and ready answer to this question.
On a practical level, human populations are initially most often definedon the basis of geographic and political boundaries. A small isolated island,for example, easily fits the requirements of a defined population. In mostcases, the local geographic unit (such as town or village) is used. Becausemany human populations have distinct geographic boundaries, this solu-tion often provides the best approach. We must take care, however, to ensurethat a local geographic unit, such as a town, is not composed of distinct sub-populations, such as groups belonging to different religious sects. A ruralIrish village fits this criterion because most of its residents belong to thesame religion, social class, and occupational group. New York City, on theother hand, clearly contains a number of subpopulations defined in terms ofethnicity, religion, social class, and other factors. In this case, subpopula-tions defined on the basis of these factors would serve as our units of analysis.
In many cases, the definition of a population depends on the specific re-search question asked. For example, if the goal of a study is to look at spatialvariation of biological variation, populations defined on the basis of geogra-phy are most suitable. If, however, the goal of a study is to look at geneticvariation among ethnic groups, then ethnicity should be used to define thepopulations.
Another potential problem in defining populations is determining thedifference between the total census population and the breeding population.Microevolutionary theory specifically concerns those individuals who con-tribute to the next generation. The total population refers to everybody,whether or not they are likely to breed. The breeding population is smallerthan the total population because of a number of factors. First, some indi-viduals in the total population will be too young or too old to mate. Second,cultural factors and geographic distribution may act to limit an individual’schoice of mate, and as a consequence some individuals will not breed. If, forexample, you live in an isolated area, there may not be enough individuals ofthe opposite sex from which to choose a mate. Such factors must be takeninto consideration in defining a breeding population.
Once a population has been defined, the next step in microevolutionaryanalysis is to determine the frequencies of genotypes and alleles within thepopulation.
breeding population Agroup of organisms thattend to choose mates fromwithin the group.
I I I I I I I

Relethford: The Human Species: An Introduction to Biological Anthropology, 5/e
I. Evolutionary Background 3. Evolutionary Forces © The McGraw−Hill Companies, 2003
Genotype Frequencies and Allele FrequenciesThe genotype frequency is a measure of the relative proportions of differentgenotypes within a population. Likewise, an allele frequency is simply a mea-sure of the relative proportion of alleles within a population. Genotype fre-quencies are obtained by dividing the number of individuals with each geno-type by the total number of individuals. For example, consider a hypotheticalpopulation of 200 people for the MN blood group system in which there are98 people with genotype MM, 84 people with genotype MN, and 18 peoplewith genotype NN. The genotype frequencies are therefore:
Frequency of MM = 98/200 = 0.49Frequency of MN = 84/200 = 0.42Frequency of NN = 18/200 = 0.09
Note that the total frequency of all genotypes adds up to 1 (0.49 + 0.42 +0.09 = 1).
Allele frequencies are computed by counting the number of each alleleand dividing that number by the total number of alleles. In the example here,the total number of alleles is 400 because there are 200 people, each withtwo alleles. To find out the number of M alleles for each genotype, count upthe number of alleles for each genotype and multiply that number by thenumber of people with that genotype. Finally, add up the number for allgenotypes. In the example, 98 people have the MM genotype, and therefore98 people each have two M alleles. The total number of M alleles for peoplewith the MM genotype is 98 × 2 = 196. For the MN genotype, 84 people haveone M allele, giving a total of 84 × 1 = 84 M alleles. For the NN genotype, 18 people have no M alleles, for a total of 18 × 0 = 0 M alleles. Adding the num-ber of M alleles for all genotypes gives a total of 196 + 84 + 0 = 280 M alleles.The frequency of the M allele is therefore 280/400 = 0.7. The frequency of theN allele can be computed in the same way, giving an allele frequency of 0.3.Note that the frequencies of all alleles must add up to 1. Another example ofallele frequency computation is given in Table 3.1.
The method of counting alleles to determine allele frequencies can beused only when the number of individuals with each genotype can be deter-mined. If one of the alleles is dominant, this will not be possible and we mustuse other methods. We may also need to use special methods to compute al-lele frequencies when more than two alleles are present at a given locus. Suchmethods are beyond the scope of this text but may be found in any compre-hensive text on population genetics (e.g., Cavalli-Sforza and Bodmer 1971).
Hardy-Weinberg EquilibriumAt the beginning of the twentieth century, geneticists were faced with the prob-lem of explaining why dominant alleles were not necessarily the most com-mon. Some argued that, over time, recessive alleles would become less frequentwhile dominant alleles would increase in frequency. One case of particular
CHAPTER 3 ■ Evolutionary Forces 69

Relethford: The Human Species: An Introduction to Biological Anthropology, 5/e
I. Evolutionary Background 3. Evolutionary Forces © The McGraw−Hill Companies, 2003
interest was a genetic condition known as brachydactyly (abnormally short fin-gers), which is due to a dominant allele. If someone inherits at least one of thedominant alleles, that person will show this condition. Some scientists arguedthat this dominant allele should therefore increase in frequency over timesuch that the majority of humans would have this condition, which is notthe case. Two scientists, G. H. Hardy and W. Weinberg, showed independentlythat this is not the case, and there is no inherent tendency for a dominant alleleto become more frequent or a recessive allele to be come less frequent (Hardy1908). Given certain assumptions, the frequencies of these alleles will remainconstant over time. Their solution, now known as the Hardy-Weinbergequilibrium, shows that, given certain assumptions, genotype and allele fre-quencies will remain constant from one generation to the next.
The Hardy-Weinberg equilibrium model is a mathematical statement re-lating allele frequencies to the expected genotype frequencies in the next gen-eration. It is best explained using a simple model of a single locus with twoalleles, A and a. By convention, the symbol p is used to represent the fre-quency of the A allele and the symbol q is used to represent the frequency ofthe a allele. These symbols are a form of shorthand; it is easier to use the sym-bol p than to say “the frequency of the A allele.”
The Hardy-Weinberg equilibrium model states that, given allele frequen-cies of p and q, the expected genotype frequencies in the next generation are:
Frequency of the AA genotype = p2
Frequency of the Aa genotype = 2pqFrequency of the aa genotype = q2
70 PART I ■ Evolutionary Background
TA B L E 3 .1 Example of Allele Frequency Computation
Imagine you have just collected information on MN blood group genotypes for250 humans in a given population. Your data are:Number of MM genotype = 40Number of MN genotype = 120Number of NN genotype = 90The allele frequencies are computed as follows:
Number of Total Number Number of Number ofGenotype People of Alleles M Alleles N Alleles
MM 40 80 80 0MN 120 240 120 120NN 90 180 0 180Total 250 500 200 300
The relative frequency of the M allele is computed as the number of M allelesdivided by the total number of alleles: 200/500 = 0.4.The relative frequency of the N allele is computed as the number of N allelesdivided by the total number of alleles: 300/500 = 0.6.As a check, note that the relative frequencies of the alleles must add up to 1.0(0.4 + 0.6 = 1.0).
Hardy-Weinbergequilibrium In the absenceof nonrandom mating andevolutionary forces, genotypeand allele frequencies willremain the same from onegeneration to the next.
I I I I I I I

Relethford: The Human Species: An Introduction to Biological Anthropology, 5/e
I. Evolutionary Background 3. Evolutionary Forces © The McGraw−Hill Companies, 2003
The mathematical proof of this relationship is given in Appendix 1. As an ex-ample, assume a population with two alleles (A and a) with allele frequenciesof p = 0.6 and q = 0.4. Using the Hardy-Weinberg equilibrium model, the ex-pected genotype frequencies in the next generation are:
AA = (0.6)2 = 0.36Aa = 2(0.6)(0.4) = 0.48aa = (0.4)2 = 0.16
Further, application of the Hardy-Weinberg model to future generations (seeAppendix 1) shows that, given certain assumptions, the genotype and allele fre-quencies will remain the same from one generation to the next. In the pre-vious example, a population at Hardy-Weinberg equilibrium will have thesame allele frequencies ( p = 0.6, q = 0.4) in the next generation, in the gener-ation after that, and so on into the future. The genotype frequencies will be AA = 0.36, Aa = 0.48, and aa = 0.16, and these, too, will remain the sameover time.
This may not appear to make a lot of sense because the model appears topredict no evolution! After all, if we define microevolution as a change in al-lele frequencies over time, and if Hardy-Weinberg predicts no change, thenwhat relevance does this have? The relevance becomes clear when we go backand examine that critical phrase—given certain assumptions.
When Hardy and Weinberg showed that there was no inherent tendencyof the frequencies of dominant and recessive alleles to change over time, theyused a simple model that had a number of assumptions. Simply put, themodel makes a prediction—no change in allele frequency over time. In thereal world, however, we have countless examples of allele frequencies chang-ing over time in many species. When observed reality does not match the pre-dictions of the model, this means that one or more of the assumptions ofthe model is incorrect. By framing the process of evolution in terms of theequilibrium model, population geneticists were able to discover exactly whatdoes cause evolutionary changes.
What are the assumptions that Hardy-Weinberg makes? First, the modelassumes random mating with respect to the locus of study. That is, every in-dividual has an equal chance of mating with any individual of the oppositesex (both sexes are assumed to have equal allele frequencies). The Hardy-Weinberg equilibrium model also assumes that no new alleles are introducedby mutation; that there is no difference in fertility or survival of the differ-ent genotypes (no natural selection); that there are no changes caused bymovement into or out of the population (no gene flow); and that there is novariation caused by random sampling (no genetic drift). Given all of theseassumptions, there will be no change in the genotype frequencies or al-lele frequencies over time. If there is an observed change, then that meansthat one or more of these assumptions is incorrect. By extending the Hardy-Weinberg model mathematically, population geneticists have determinedhow these changes could take place and provided us with an understandingof the real world.
CHAPTER 3 ■ Evolutionary Forces 71

Relethford: The Human Species: An Introduction to Biological Anthropology, 5/e
I. Evolutionary Background 3. Evolutionary Forces © The McGraw−Hill Companies, 2003
A population might not be in Hardy-Weinberg equilibrium for two basicreasons. Observed and expected genotype frequencies may differ because ofthe effects of evolutionary forces and/or nonrandom mating. Evolutionaryforces are those mechanisms that can actually lead to a change in allele fre-quency over time. There are four evolutionary forces: mutation, natural se-lection, genetic drift, and gene flow (each is described in detail in the follow-ing section). These four forces are the only mechanisms that can cause thefrequency of an allele to change over time. For example, if you observed apopulation with an allele frequency of 0.5 in a given population and returneda generation later to find that the allele frequency is 0.4, then you have ob-served evolution. This change could be due to mutation, natural selection,genetic drift, and/or gene flow. Given the large amount of change in a singlegeneration, it is unlikely that mutation would be responsible because muta-tion usually causes much lower amounts of change in a single generation. Inthat case, you could conclude that the observed change was due to naturalselection, genetic drift, and/or gene flow. You would need to examine moreinformation, such as migration rates, population size, and environmentalvariation, to determine which factors were responsible for the change.
When allele frequencies change, so do genotype frequencies, but geno-type frequencies can change without altering the underlying allele frequen-cies. This happens when there is significant nonrandom mating, whichrefers to the patterns of mate choice within a population and its genetic ef-fects. One form of nonrandom mating is inbreeding, which occurs whenthere is mating between biologically related individuals (Figure 3.1). Anotherform of nonrandom mating is assortative mating, which is mating basedon phenotypic similarity or dissimilarity (such as blondes having a prefer-ence to mate only with other blondes or tall people preferring to mate only
72 PART I ■ Evolutionary Background
FIGURE 3.1
Inbreeding is used with many domesticated animals to produce certain types ofcharacteristics. (© C. Seghers/Photo Researchers, Inc.)
evolutionary forces Fourmechanisms that can causechanges in allele frequenciesfrom one generation to thenext: mutation, naturalselection, genetic drift, andgene flow.
nonrandom matingPatterns of mate choice thatinfluence the distributionsof genotype and phenotypefrequencies.
inbreeding Matingbetween biologically relatedindividuals.
assortative mating Matingbetween phenotypicallysimilar or dissimilarindividuals.
I I I I I I I

Relethford: The Human Species: An Introduction to Biological Anthropology, 5/e
I. Evolutionary Background 3. Evolutionary Forces © The McGraw−Hill Companies, 2003
with other tall people). In both inbreeding and assortative mating, there isno change in the actual allele frequency, but there is a change in the geno-type frequencies. Thus, nonrandom mating does not cause evolution (becausethe allele frequencies do not change), but it can affect the rate of evolution-ary change, as discussed later in this chapter.
EVOLUTIONARY FORCESMutationMutation introduces new alleles into a population. Therefore, the frequencyof different alleles will change over time. For example, consider a geneticlocus with a single allele, A, for a population of 100 people (and therefore200 alleles, because each person has two alleles). Everyone in the populationwill have genotype AA, and the frequency of the A allele is 1.0 (100 percent).Now, assume that one of the A alleles being passed on to the next generationchanges into a new form, a. Assuming the population stays the same size (tomake the mathematics a bit easier), there will be 199 A alleles and 1 a allelein the next generation. The frequency of A will have changed from 1.0 to 0.995(199/200), and the frequency of a will have changed from 0.0 to 0.005 (1/200).
If there is no further evolutionary change, the allele frequencies will re-main the same in future generations. If this mutation continues to recur, thefrequency of the a allele will slowly increase, assuming no other evolutionaryforces are operating. For typical mutation rates, such a process would take avery long time.
Mutations can also occur in the reverse direction; that is, an a allele couldmutate back to the original form A. Not much information is available onback mutation rates in human populations, but they do appear to be muchrarer than the usual mutation rate.
Although mutations are vital to evolution because they provide new vari-ations, mutation rates are low and do not lead, by themselves, to major changesin allele frequency. The other evolutionary forces increase or decrease the fre-quencies of mutant alleles. If you visited a population over two generationsand noted that the frequency of a given allele changed from 0.30 to 0.40, itwould be extremely unlikely that this magnitude of change would be due solelyto mutation. The other evolutionary forces would be responsible for such largechanges.
Many discrete genetic traits are polymorphisms (many forms). A ge-netic polymorphism is a locus with two or more alleles having frequenciestoo large to be a result of mutation alone. The usual, somewhat arbitrary,cutoff point for these allele frequencies is 0.01. If an allele has a frequencygreater than 0.01, we can safely assume this relatively high frequency is causedby factors other than mutation. For example, a locus with allele frequenciesof A = 1.0 and a = 0.0 would not be polymorphic because only one allele (A)is present in the population. Likewise, a locus with frequencies of A = 0.999and a = 0.001 would also not be a genetic polymorphism because only one al-lele has a frequency greater than 0.01. If the allele frequencies were A = 0.2
CHAPTER 3 ■ Evolutionary Forces 73
polymorphism A discretegenetic trait in which thereare at least two alleles at a locus having frequenciesgreater than 0.01.
I I I I I I I
Relethford: The Human Species: An Introduction to Biological Anthropology, 5/e
I. Evolutionary Background 3. Evolutionary Forces © The McGraw−Hill Companies, 2003
and a = 0.8, this would be evidence of genetic polymorphism. Both alleleshave frequencies greater than 0.01. Such frequencies are explained by naturalselection, genetic drift, and/or gene flow.
Natural SelectionAs discussed in Chapter 1, natural selection filters genetic variation. Individ-uals with certain biological characteristics that allow them to survive to re-produce pass on the alleles for such characteristics to the next generation.Natural selection does not create new genetic variation (only mutation cando that), but it can change the relative frequencies of different alleles.
The analysis of natural selection focuses on fitness, the probability ofsurvival and reproduction of an organism. For any locus, fitness is measuredas the relative genetic contribution of a genotype to the next generation.Imagine a locus with two alleles, A and a, and the genotypes AA, Aa, and aa.If all individuals with genotypes AA and Aa survive and reproduce but onlyhalf of those with genotypes aa do, then the fitness of genotype aa is half ofthat of genotypes AA and Aa. Fitness refers to the proportion of individualswith a given genotype who survive and reproduce.
Depending on the fitness of each genotype, natural selection can havedifferent effects. Some of the more common forms of natural selection arediscussed here, along with a few examples from human populations. Addi-tional examples will be presented in Chapter 6.
Selection against Recessive Homozygotes Even simple genetic traits withonly two alleles have a number of different models of natural selection to in-vestigate. The result of natural selection depends on the initial allele frequen-cies, whether one allele is dominant or not, and the exact fitness values foreach genotype.
Consider what happens when one allele is dominant and one is recessive.Let A be the dominant allele and a be the recessive allele. As you learned in Chap-ter 2, the genotypes AA and Aa will both give rise to the same phenotype be-cause A is dominant. Because AA and Aa specify the same phenotype, they havethe same fitness. For this hypothetical example, let us assume that the fitness ofAA and Aa is 100 percent. That is, all individuals with these genotypes surviveand reproduce in equal numbers. Now, let us further assume that the fitness ofpeople with the recessive phenotype (those with the genotype aa) have a fitnessof 0 percent; that is, no one with this genotype will survive and reproduce. Thishypothetical example corresponds to a situation in which a recessive allele (a)is fatal for those who have two copies (aa). Now, assume a population of 200people before selection with the following distribution of genotypes: AA =50, Aa = 100, aa = 50. Using the methods discussed earlier, the allele frequen-cies can be found: the frequency of A is 0.5, and the frequency of a is 0.5.
Table 3.2 shows the process of natural selection using these hypotheti-cal numbers. After selection, the number of individuals in each genotype isAA = 50, Aa = 100, aa = 0. All individuals with genotypes AA and Aa survive,and none of those with genotype aa survive. After selection, there are 150 in-dividuals and the allele frequencies are A = 0.6667 and a = 0.3333.
74 PART I ■ Evolutionary Background
fitness An organism’sprobability of survival andreproduction.
I I I I I I I
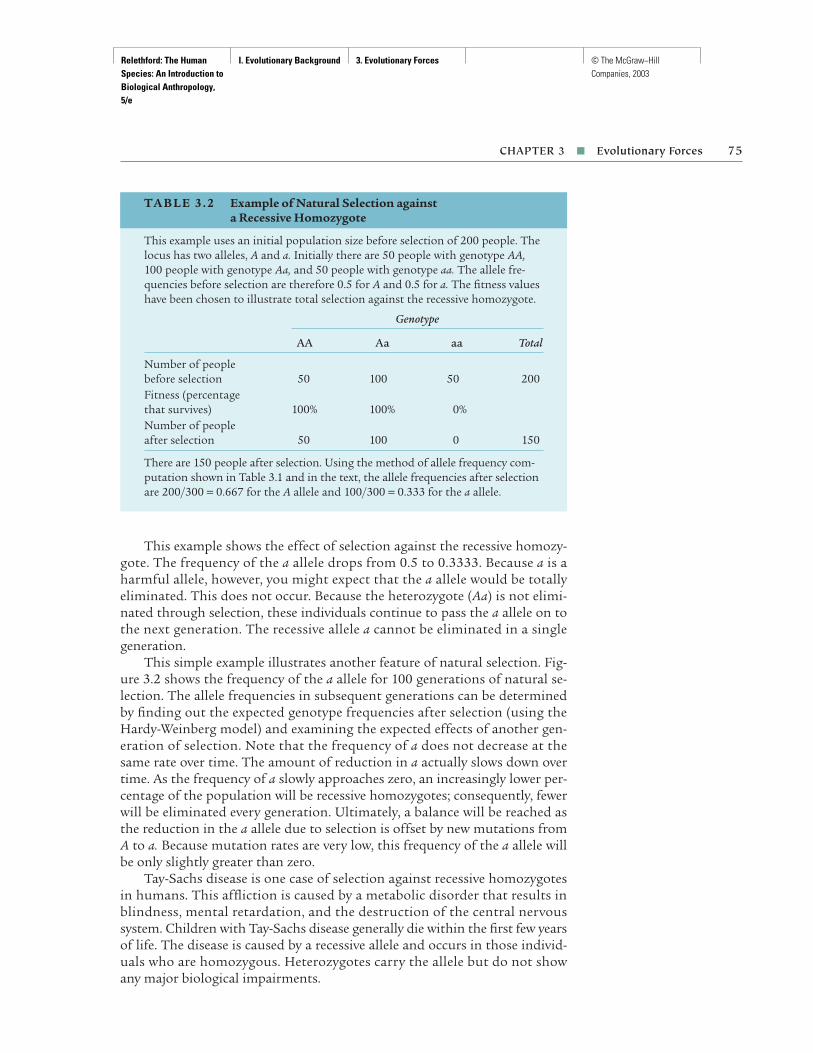
Relethford: The Human Species: An Introduction to Biological Anthropology, 5/e
I. Evolutionary Background 3. Evolutionary Forces © The McGraw−Hill Companies, 2003
This example shows the effect of selection against the recessive homozy-gote. The frequency of the a allele drops from 0.5 to 0.3333. Because a is aharmful allele, however, you might expect that the a allele would be totallyeliminated. This does not occur. Because the heterozygote (Aa) is not elimi-nated through selection, these individuals continue to pass the a allele on tothe next generation. The recessive allele a cannot be eliminated in a singlegeneration.
This simple example illustrates another feature of natural selection. Fig-ure 3.2 shows the frequency of the a allele for 100 generations of natural se-lection. The allele frequencies in subsequent generations can be determinedby finding out the expected genotype frequencies after selection (using theHardy-Weinberg model) and examining the expected effects of another gen-eration of selection. Note that the frequency of a does not decrease at thesame rate over time. The amount of reduction in a actually slows down overtime. As the frequency of a slowly approaches zero, an increasingly lower per-centage of the population will be recessive homozygotes; consequently, fewerwill be eliminated every generation. Ultimately, a balance will be reached asthe reduction in the a allele due to selection is offset by new mutations fromA to a. Because mutation rates are very low, this frequency of the a allele willbe only slightly greater than zero.
Tay-Sachs disease is one case of selection against recessive homozygotesin humans. This affliction is caused by a metabolic disorder that results inblindness, mental retardation, and the destruction of the central nervoussystem. Children with Tay-Sachs disease generally die within the first few yearsof life. The disease is caused by a recessive allele and occurs in those individ-uals who are homozygous. Heterozygotes carry the allele but do not showany major biological impairments.
CHAPTER 3 ■ Evolutionary Forces 75
TA B L E 3 . 2 Example of Natural Selection against a Recessive Homozygote
This example uses an initial population size before selection of 200 people. Thelocus has two alleles, A and a. Initially there are 50 people with genotype AA,100 people with genotype Aa, and 50 people with genotype aa. The allele fre-quencies before selection are therefore 0.5 for A and 0.5 for a. The fitness valueshave been chosen to illustrate total selection against the recessive homozygote.
Genotype
AA Aa aa Total
Number of peoplebefore selection 50 100 50 200Fitness (percentagethat survives) 100% 100% 0%Number of peopleafter selection 50 100 0 150
There are 150 people after selection. Using the method of allele frequency com-putation shown in Table 3.1 and in the text, the allele frequencies after selectionare 200/300 = 0.667 for the A allele and 100/300 = 0.333 for the a allele.

Relethford: The Human Species: An Introduction to Biological Anthropology, 5/e
I. Evolutionary Background 3. Evolutionary Forces © The McGraw−Hill Companies, 2003
When deleterious alleles are recessive, such as with Tay-Sachs disease, thefrequency is generally not zero, because heterozygotes continue to pass theallele on from generation to generation. Nonetheless, the frequency of aharmful recessive allele will still be very low. This low frequency is maintainedby mutation but is kept from increasing by natural selection.
Selection for Recessive Homozygotes What if a dominant allele is selectedagainst? As an example, consider the same starting point as in the previousexample: AA = 50, Aa = 100, and aa = 50, giving initial allele frequencies of A = 0.5 and a = 0.5. Complete selection against the dominant allele (A) willmean a fitness of 0 percent for genotypes AA and Aa and a fitness of 100 per-cent for the genotype aa. After selection, there are no AA individuals, no Aaindividuals, and 50 aa individuals (Table 3.3). The allele frequencies after se-lection are A = 0.0 and a = 1.0. The dominant allele has been completely elim-inated after one generation of selection. There will be no further change un-less the allele is reintroduced into the population by mutation or migrationfrom an area where fitness is not zero. If the fitness values of AA and Aa weregreater than zero but less than 100 percent, then the A allele would not beeliminated, because some individuals with this allele would survive.
Achondroplastic dwarfism is an example of a dominant allele in humanbeings. This type of dwarfism (small body size and abnormal body propor-tions) is caused by a dominant allele found in very low frequencies in humanpopulations—roughly 0.00005 (Figure 3.3). Because the achondroplastic al-lele is dominant, individuals with one or two of the alleles will show the dis-ease. Virtually all achondroplastic dwarfs are heterozygotes. The condition isusually caused by a mutation occurring in the sex cells of one parent. Weknow that a mutation is involved in a majority of these cases because roughly80 percent of dwarfs have two normal parents. Because the condition is caused
76 PART I ■ Evolutionary Background
FIGURE 3.2
Change over time in thefrequency of a recessive allelewhen there is completeselection against the recessivehomozygote and the initialallele frequency is 0.5.
0.5
Alle
le fr
eque
ncy
0.4
0.3
0.2
0.1
00.0
100755025
Generation

Relethford: The Human Species: An Introduction to Biological Anthropology, 5/e
I. Evolutionary Background 3. Evolutionary Forces © The McGraw−Hill Companies, 2003
by a dominant allele, the only way a child could receive the allele would be froma parent or through mutation. If the parent had the allele, he or she wouldalso be a dwarf. Therefore, when both parents of a dwarf are not dwarfs, weknow the offspring’s dwarfism is the result of a mutation. In cases wheretwo dwarfs mate, the offspring can be homozygous for the disease, and suchoffspring generally die before, or shortly after, birth.
The low frequency of achondroplastic dwarfs is the result of natural se-lection acting to remove the harmful allele from the population. Althoughthere is no major risk of mortality for a heterozygous achondroplastic dwarf,selection acts on differential reproduction. Given their physical appearance,these dwarfs have few opportunities to mate. The most likely mating is be-tween two dwarfs. In these cases, there is additional selection because theyhave an increased risk of having children with two copies of the achondro-plastic allele; these children generally die early in life. Thus, both differencesin mortality and fertility can affect the degree of selection against an allele.
Selection for the Heterozygote The previous examples discussed selectionagainst recessive and dominant homozygotes, which acts to increase the fre-quency of one allele and decrease the frequency of another. Selection couldalso occur for recessive or dominant homozygotes, which would act to in-crease the frequency of an allele. With time, the allele frequencies will ap-proach 0 or 1, depending on which allele is selected against.
These models might lead us to expect patterns of genetic variation wherebymost populations have allele frequencies close to either 0 or 1 and few popu-lations have intermediate values. However, studies of human genetic variation
CHAPTER 3 ■ Evolutionary Forces 77
TA B L E 3 . 3 Example of Natural Selection for the Recessive Homozygote
This example uses an initial population size before selection of 200 people. Thelocus has two alleles, A and a. Initially there are 50 people with genotype AA,100 people with genotype Aa, and 50 people with genotype aa. The allele fre-quencies before selection are therefore 0.5 for A and 0.5 for a. The fitness valueshave been chosen to illustrate total selection against the dominant homozygoteand the heterozygote.
Genotype
AA Aa aa Total
Number of peoplebefore selection 50 100 50 200Fitness (percentagethat survives) 0% 0% 100%Number of peopleafter selection 0 0 50 50
There are 50 people after selection. Based on the method of allele frequencycomputation shown in Table 3.1 and in the text, the allele frequencies afterselection are 0/100 = 0.0 for the A allele and 100/100 = 1.0 for the a allele. Thedominant allele A has been eliminated in one generation of natural selection.
FIGURE 3.3
Achondroplastic dwarfism is a genetic disorder caused by adominant allele. This toddlerhas very short arms and legs.(Courtesy March of Dimes)

Relethford: The Human Species: An Introduction to Biological Anthropology, 5/e
I. Evolutionary Background 3. Evolutionary Forces © The McGraw−Hill Companies, 2003
have found that for many loci the allele frequencies are intermediate, withvalues such as 0.3, 0.5, or 0.8. We could argue that selection is not yet com-plete and that given enough time all allele frequencies would be close to 0 or1, but the wealth of information regarding allele frequencies in humangroups makes this very unlikely. Why, then, do many loci show intermediatefrequencies? Is there a way that natural selection can produce such values?
A classic example of an intermediate allele frequency in human popula-tions is the sickle cell allele, discussed briefly in the previous chapter. Becausepeople homozygous for this allele have sickle cell anemia and are likely to dieearly in life, this appears to be a classic situation of selection against a ho-mozygote. If this were the case, we might expect most human populations tohave frequencies of the sickle cell allele close to 0, and, in fact, many do. How-ever, a number of populations in parts of Africa, India, and the Mediterra-nean show higher frequencies. In some African groups, the frequency of thesickle cell allele is greater than 20 percent (Roychoudhury and Nei 1988).How can a harmful allele exist at such a high frequency?
The answer is a form of selection known as selection for the hetero-zygote (and therefore against the homozygotes). Consider fitness values ofAA = 70 percent, Aa = 100 percent, and aa = 20 percent. Here, only 70 percentof those with genotype AA and 20 percent of those with genotype aa survivefor every 100 people with genotype Aa (the heterozygote). Selection is for theheterozygote and against the homozygotes. Let the frequency of both the Aand a alleles equal 0.5. In a population of 200 people, this means we start with50 AA people, 100 Aa people, and 50 aa people before selection. Given thesefitness values, there will be 35 people with AA, 100 with Aa, and 10 with aa
78 PART I ■ Evolutionary Background
TA B L E 3 . 4 Example of Natural Selection for the Heterozygote
This example uses an initial population size before selection of 200 people. Thelocus has two alleles, A and a. Initially there are 50 people with genotype AA,100 people with genotype Aa, and 50 people with genotype aa. The allele fre-quencies before selection are therefore 0.5 for A and 0.5 for a. The fitness valueshave been chosen to illustrate selection for the heterozygote and partial selec-tion against both homozygotes. Note that because this is a codominant system,each genotype specifies a different phenotype.
Genotype
AA Aa aa Total
Number of peoplebefore selection 50 100 50 200Fitness (percentagethat survives) 70% 100% 20%Number of peopleafter selection 35 100 10 145
There are 145 people after selection. Using the method of allele frequency com-putation shown in Table 3.1 and in the text, the allele frequencies after selectionare 170/290 = 0.586 for the A allele and 120/290 = 0.414 for the a allele.
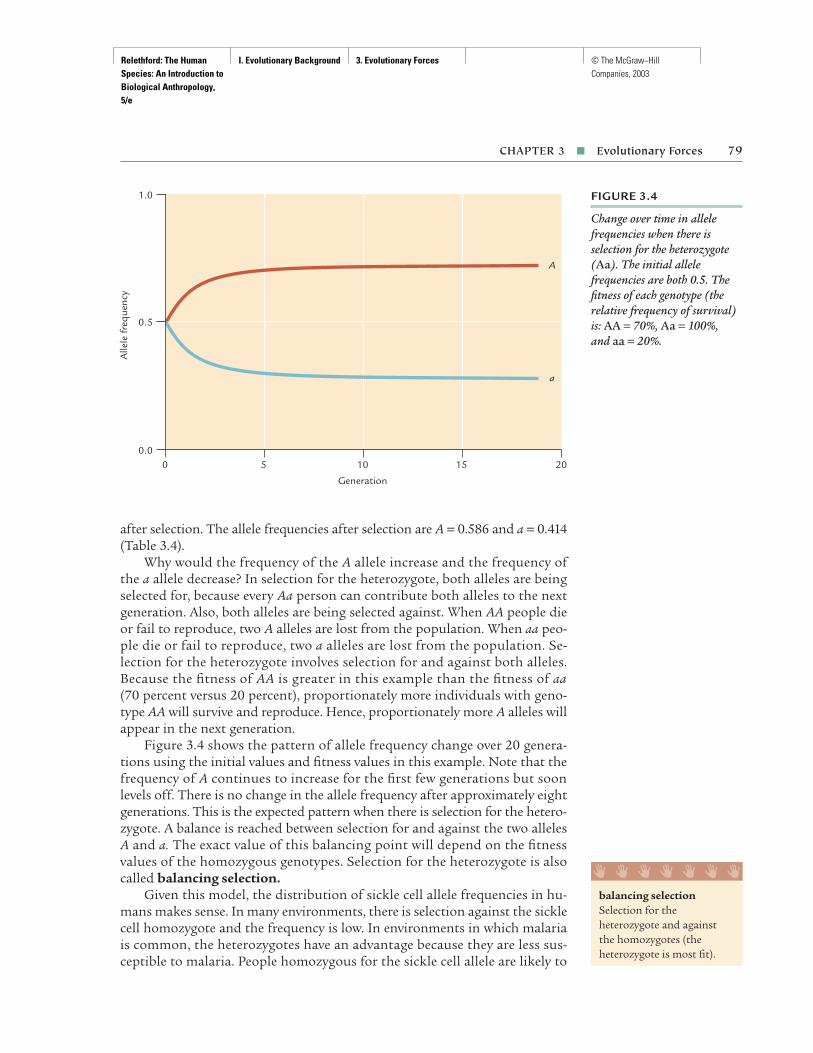
Relethford: The Human Species: An Introduction to Biological Anthropology, 5/e
I. Evolutionary Background 3. Evolutionary Forces © The McGraw−Hill Companies, 2003
after selection. The allele frequencies after selection are A = 0.586 and a = 0.414(Table 3.4).
Why would the frequency of the A allele increase and the frequency ofthe a allele decrease? In selection for the heterozygote, both alleles are beingselected for, because every Aa person can contribute both alleles to the nextgeneration. Also, both alleles are being selected against. When AA people dieor fail to reproduce, two A alleles are lost from the population. When aa peo-ple die or fail to reproduce, two a alleles are lost from the population. Se-lection for the heterozygote involves selection for and against both alleles.Because the fitness of AA is greater in this example than the fitness of aa(70 percent versus 20 percent), proportionately more individuals with geno-type AA will survive and reproduce. Hence, proportionately more A alleles willappear in the next generation.
Figure 3.4 shows the pattern of allele frequency change over 20 genera-tions using the initial values and fitness values in this example. Note that thefrequency of A continues to increase for the first few generations but soonlevels off. There is no change in the allele frequency after approximately eightgenerations. This is the expected pattern when there is selection for the hetero-zygote. A balance is reached between selection for and against the two allelesA and a. The exact value of this balancing point will depend on the fitnessvalues of the homozygous genotypes. Selection for the heterozygote is alsocalled balancing selection.
Given this model, the distribution of sickle cell allele frequencies in hu-mans makes sense. In many environments, there is selection against the sicklecell homozygote and the frequency is low. In environments in which malariais common, the heterozygotes have an advantage because they are less sus-ceptible to malaria. People homozygous for the sickle cell allele are likely to
CHAPTER 3 ■ Evolutionary Forces 79
FIGURE 3.4
Change over time in allelefrequencies when there isselection for the heterozygote(Aa). The initial allelefrequencies are both 0.5. Thefitness of each genotype (therelative frequency of survival)is: AA = 70%, Aa = 100%, and aa = 20%.
1.0
Alle
le fr
eque
ncy
0.5
00.0
2015105
Generation
a
A
balancing selectionSelection for theheterozygote and againstthe homozygotes (theheterozygote is most fit).
I I I I I I I

Relethford: The Human Species: An Introduction to Biological Anthropology, 5/e
I. Evolutionary Background 3. Evolutionary Forces © The McGraw−Hill Companies, 2003
suffer from sickle cell anemia and die. People homozygous for the normal al-lele are more likely to suffer from malaria. Thus, there is selection againstboth homozygotes (although more selection against those with sickle cellanemia) and selection for the heterozygote. A balance of allele frequencies ispredicted and has been found in many human populations. A more com-plete discussion of the sickle cell example is given in Chapter 6.
Another possible example of balancing selection in humans concernscystic fibrosis, a genetic disease caused by a recessive allele. Studies haveshown that individuals heterozygous for the cystic fibrosis allele are resistantto other diseases, such as cholera (Rodman and Zamudio 1991) and typhoidfever (Pier et al. 1998). If so, then heterozygotes would have the greatest fit-ness and the optimal frequency of the cystic fibrosis allele would be deter-mined by the balance between selection relating to cystic fibrosis and theseother diseases.
Selection and Complex Traits The previous examples used simple genetictraits to illustrate basic principles of natural selection. Selection also affectscomplex traits, however, such as those discussed in Chapter 2. For complextraits, we focus on measures of the average value and variation around thisaverage. Because complex traits are continuous, we look at the effects of se-lection on the average value of a trait and on the lower and higher extremes.
There are several forms of selection on complex traits. Stabilizing selec-tion refers to selection against both extremes of a trait’s range in values. In-dividuals with extreme high or low values of a trait are less likely to surviveand reproduce, and those with values closer to the average are more likely tosurvive and reproduce. The effect of stabilizing selection is to maintain thepopulation at the same average value over time. Extreme values are selectedagainst each generation, but the average value in the population does notchange.
Human birth weight is a good example of stabilizing selection. The weightof a newborn child is the result of a number of environmental factors, suchas mother’s age, weight, and history of smoking, among many others. Thereis also a genetic component to birth weight. Newborns who are very small(less than 2.5 kg) are less likely to survive than newborns who are heavier.Very small babies are more prone to disease and have weaker systems, mak-ing their survival more difficult. Newborns who are too large are also likelyto be selected against, because a very large child may create complicationsduring childbirth and both mother and child may die. Thus, there is selec-tion against both extremes, small and large.
Stabilizing selection on birth weight has been documented for a numberof human populations. These studies show a definite relationship betweenbirth weight and mortality. The results of one study based on 13,730 new-borns (Karn and Penrose 1951) are shown in Figure 3.5. Mortality rates arehighest for those newborns with low (less than 2.7 kg) and high (greater than4.5 kg) birth weights.
Another type of selection for complex traits is known as directional se-lection, selection against one extreme and/or for the other extreme. In other
80 PART I ■ Evolutionary Background
stabilizing selectionSelection against extremevalues, large or small, in a continuous trait.
directional selectionSelection against oneextreme in a continuoustrait and/or selection for the other extreme.
I I I I I I I

Relethford: The Human Species: An Introduction to Biological Anthropology, 5/e
I. Evolutionary Background 3. Evolutionary Forces © The McGraw−Hill Companies, 2003
words, a direct relationship exists between survival and reproduction on onehand and the value of a trait on the other. The result is a change over time inone direction. The average value for a trait moves in one direction or the other.Perhaps the most dramatic example of directional selection in human evolu-tion has been the threefold increase in brain size over the last 4 million years.Another example is the lighter skin that probably evolved in prehistoric hu-mans as they moved north out of Africa (see Chapter 6).
Genetic DriftGenetic drift is the random change in allele frequency from one generationto the next. These random changes are the result of the nature of probabil-ity. Think for a moment about flipping a coin in the air. What is the proba-bility of its landing with the head facing up? It is 50 percent. The coin has twopossible values, heads and tails, and when you flip it you will get one or theother. Suppose you flip a coin 10 times. How many heads and how many tailsdo you expect to get? Because the probability of getting a head or a tail is 50 percent, you expect to get five heads and five tails. Try this experimentseveral times. Did you always get five tails and five heads? Sometimes you getfive heads and five tails, but sometimes you get different numbers. You mayget six heads and four tails, or three heads and seven tails, or, much less likely,all heads.
The probability for different combinations of heads and tails from flip-ping a coin 10 times is shown in Table 3.5. The probability of getting allheads (or all tails) is rather low—0.001. Note, however, that the probability of
CHAPTER 3 ■ Evolutionary Forces 81
FIGURE 3.5
Stabilizing selection for humanbirth weight based on datafrom Karn and Penrose (1951).Babies born smaller or largerthan the optimum birth weighthave increased mortality. (FromE. Peter Volpe, UnderstandingEvolution, 5th ed. Copyright © 1985Wm. C. Brown Communications,Inc., Dubuque, Iowa. All RightsReserved. Reprinted by permission of the McGraw-Hill Companies)
100
Perc
ent m
orta
lity
(log
sca
le)
70
50
30
20
10
7
5
3
2
1110987654321
Birth weight (lbs)
0
0
genetic drift A mechanismfor evolutionary changeresulting from the randomfluctuations of genefrequencies from onegeneration to the next.
I I I I I I I
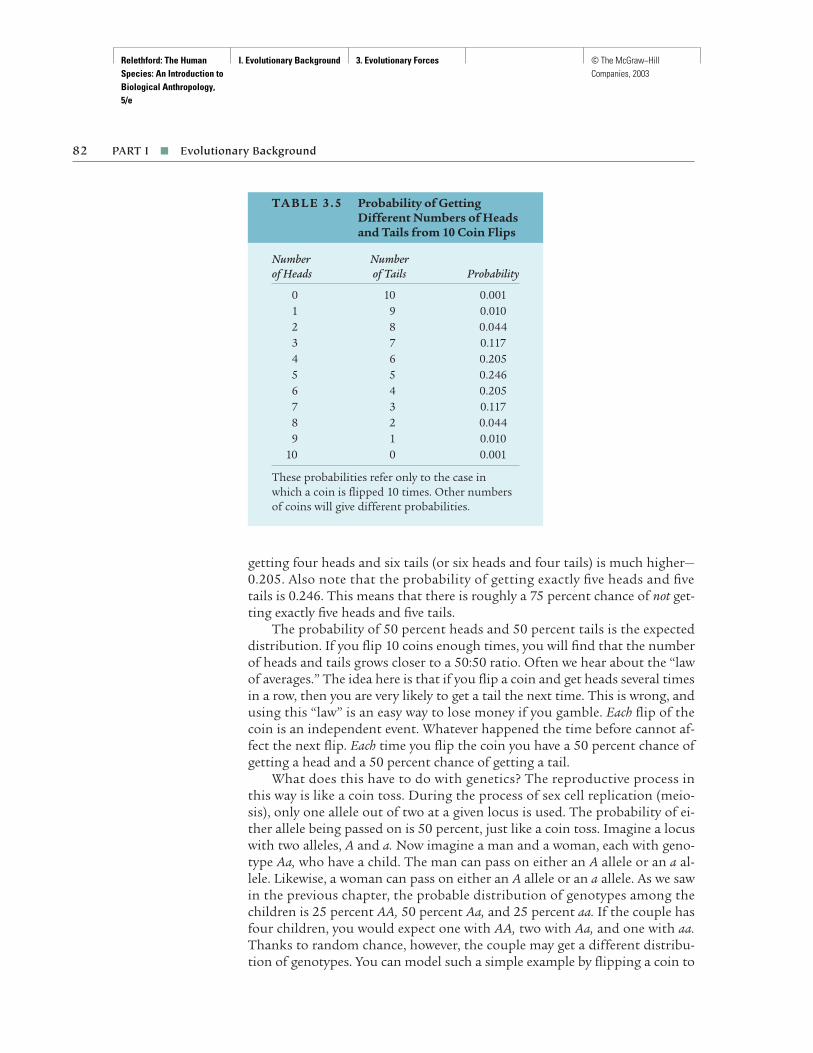
Relethford: The Human Species: An Introduction to Biological Anthropology, 5/e
I. Evolutionary Background 3. Evolutionary Forces © The McGraw−Hill Companies, 2003
getting four heads and six tails (or six heads and four tails) is much higher—0.205. Also note that the probability of getting exactly five heads and fivetails is 0.246. This means that there is roughly a 75 percent chance of not get-ting exactly five heads and five tails.
The probability of 50 percent heads and 50 percent tails is the expecteddistribution. If you flip 10 coins enough times, you will find that the numberof heads and tails grows closer to a 50:50 ratio. Often we hear about the “lawof averages.” The idea here is that if you flip a coin and get heads several timesin a row, then you are very likely to get a tail the next time. This is wrong, andusing this “law” is an easy way to lose money if you gamble. Each flip of thecoin is an independent event. Whatever happened the time before cannot af-fect the next flip. Each time you flip the coin you have a 50 percent chance ofgetting a head and a 50 percent chance of getting a tail.
What does this have to do with genetics? The reproductive process inthis way is like a coin toss. During the process of sex cell replication (meio-sis), only one allele out of two at a given locus is used. The probability of ei-ther allele being passed on is 50 percent, just like a coin toss. Imagine a locuswith two alleles, A and a. Now imagine a man and a woman, each with geno-type Aa, who have a child. The man can pass on either an A allele or an a al-lele. Likewise, a woman can pass on either an A allele or an a allele. As we sawin the previous chapter, the probable distribution of genotypes among thechildren is 25 percent AA, 50 percent Aa, and 25 percent aa. If the couple hasfour children, you would expect one with AA, two with Aa, and one with aa.Thanks to random chance, however, the couple may get a different distribu-tion of genotypes. You can model such a simple example by flipping a coin to
82 PART I ■ Evolutionary Background
TA B L E 3 . 5 Probability of GettingDifferent Numbers of Headsand Tails from 10 Coin Flips
Number Numberof Heads of Tails Probability
0 10 0.0011 9 0.0102 8 0.0443 7 0.1174 6 0.2055 5 0.2466 4 0.2057 3 0.1178 2 0.0449 1 0.010
10 0 0.001
These probabilities refer only to the case inwhich a coin is flipped 10 times. Other numbersof coins will give different probabilities.

Relethford: The Human Species: An Introduction to Biological Anthropology, 5/e
I. Evolutionary Background 3. Evolutionary Forces © The McGraw−Hill Companies, 2003
simulate a child receiving an A allele or an a allele from either parent. Let“heads” represent the A allele and “tails” represent the a allele.
I performed this experiment four times to simulate four children bornto these parents. Two of the children had genotype AA, and two had genotypeAa. Note that the allele frequencies have changed from the parent’s genera-tion to the children’s generation. The allele frequencies of the parents were A = 0.5 and a = 0.5. The four children have a total of eight alleles, of whichsix are A and two are a. The frequency of A in the children is 6/8 = 0.75, andthe frequency of a is 2/8 = 0.25. You might want to try this experiment sev-eral times to see the range of allele frequencies that can result.
When genetic drift occurs in populations, the same principle applies. Al-lele frequencies can change because of random chance. Sometimes the allelefrequency will increase, and sometimes it will decrease. The direction of al-lele frequency change caused by genetic drift is random. The only time driftwill not produce a change in allele frequency is when only one allele is pres-ent at a given locus. For example, if each parent passed on an A allele to eachof the four children, the frequency of the A allele would be 1.0 among thechildren. The a allele would have been lost.
Genetic drift occurs in each generation. Such a process is too compli-cated to simulate by using coins, but computers or random number tablescan be used to model the effects of drift over time (see Cavalli-Sforza andBodmer 1971:389). Figure 3.6 shows the results of three computer simula-tions of drift. In each case, the initial allele frequency was 0.5 and the popu-lation size was equal to 10 individuals (20 alleles) in each generation. The sim-ulation was allowed to continue in each case for 20 generations. The graphsshow the changes in allele frequency over time. Note that each of the threesimulations shows a different pattern. This is expected because genetic driftis a random process. Each simulation is an independent event.
In each of these three graphs, the allele frequency fluctuates up and down.In Figure 3.6a, the allele frequency after 20 generations is 0.3. In Figure 3.6b,the allele frequency after 20 generations is 0.75. In Figure 3.6c, the allele fre-quency is equal to 1.0 after 10 generations and it does not change any fur-ther. Given enough time, and assuming no other evolutionary forces affect
CHAPTER 3 ■ Evolutionary Forces 83
FIGURE 3.6
Three computer simulations of 20 generations of geneticdrift for populations of 10individuals. Each simulationstarted with an initial allelefrequency of 0.5.
1.0
0.5
0
0.0
2015105Generation
a.
Alle
le fr
eque
ncy
1.0
0.5
0
0.0
2015105Generation
b.
Alle
le fr
eque
ncy
1.0
0.5
0
0.0
2015105Generation
c.
Alle
le fr
eque
ncy

Relethford: The Human Species: An Introduction to Biological Anthropology, 5/e
I. Evolutionary Background 3. Evolutionary Forces © The McGraw−Hill Companies, 2003
allele frequencies, genetic drift will ultimately lead to an allele’s becomingfixed at a value of 0.0 or 1.0. Thus, genetic drift leads to the reduction of vari-ation within a population, given enough time.
Population Size and Genetic Drift The effect of genetic drift depends onthe size of the breeding population. The larger the population size, the lesschange will occur from one generation to the next. Thinking back to the cointoss analogy will show you that this makes sense. If you flip a coin 10 timesand get three heads and seven tails, it is not that unusual. If you flip a coin 1 million times, however, it would be much less likely that you would get thesame proportions—300,000 heads and 700,000 tails. This is because of a basicprinciple of probability: the greater the number of events, the fewer devia-tions from the expected frequencies (50 percent heads and 50 percent tails).
The effect of population size on genetic drift is shown in Figure 3.7.These graphs show the results of 1,000 simulations of genetic drift for fourdifferent values of breeding population size: N = 10, 50, 100, 1,000. In eachcomputer run, the initial allele frequency was set to 0.5 and the simulationwas allowed to continue for 20 generations. The four graphs show the distri-bution of allele frequency values after 20 generations of genetic drift. Fig-ure 3.7a shows this distribution for a population size of N = 10. Note that
84 PART I ■ Evolutionary Background
FIGURE 3.7
Allele frequency distributionsfor 1,000 computer simulationsof 20 generations of geneticdrift. The distributions showthe number of times a givenallele frequency was reachedafter 20 generations of drift. In all cases, the initial allelefrequency was 0.5. Each graphrepresents a different value of population size: (a) = 10,(b) = 50, (c) = 100, (d) = 1,000.
Num
ber o
f sim
ulat
ions
a.0.0 0.2 0.4 0.6 0.8 1.0
0
100
200
300
400
500
b.0.0 0.2 0.4 0.6 0.8 1.0
0
100
200
300
400
500
Num
ber o
f sim
ulat
ions
Final allele frequency
Final allele frequency
c.
0.0 0.2 0.4 0.6 0.8 1.0
0
100
200
300
400
500
Final allele frequency
Final allele frequency
d.
0.0 0.2 0.4 0.6 0.8 1.0
0
100
200
300
400
500
N=10 N=50
N=100 N=1000

Relethford: The Human Species: An Introduction to Biological Anthropology, 5/e
I. Evolutionary Background 3. Evolutionary Forces © The McGraw−Hill Companies, 2003
the majority of the 1,000 simulations resulted in final allele frequencies ofless than 0.1 or greater than 0.9. In small populations, genetic drift moreoften results in a quick loss of one allele or another. Figure 3.7b shows thedistribution of final allele frequencies for a population size of N = 50. Herethere are fewer extreme values and more values falling between 0.3 and 0.7.Figures 3.7c and 3.7d show the distributions for population sizes of N = 100and N = 1,000. It is clear from these graphs that the larger the populationsize, the fewer deviations in allele frequency caused by genetic drift. The mainpoint here is that genetic drift has the greatest evolutionary effect in relativelysmall breeding populations.
Examples of Genetic Drift Genetic drift in human populations is shownin a case study of a group known as the Dunkers, a religious sect that emi-grated from Germany to the United States in the early 1700s. Approximately50 families composed the initial group. Glass (1953) studied the genetic char-acteristics of the descendants of the original founding group living in Penn-sylvania. These populations have never been greater than several hundredpeople and thus provide a unique opportunity to study genetic drift in a smallhuman group. Glass found that the Dunker population differed in a num-ber of genetic traits from both the modern German and U.S. populations.Furthermore, the allele frequencies of Germany and the United States werealmost identical, suggesting that other factors such as natural selection wereunlikely. For example, the allele frequencies for the MN blood group wereroughly M = 0.55 and N = 0.45 for both the United States and German sam-ples. In the Dunker population, however, the allele frequencies were M =0.655 and N = 0.345. Based on these and additional data, Glass concludedthat the genetics of the Dunker population were shaped to a large extent bygenetic drift over two centuries. Although 200 years seems like a long time toyou and me, it is a fraction of an instant in evolutionary time. Genetic driftcan clearly produce rapid changes under the proper circumstances.
Genetic drift in human populations has also been found on Tristan daCunha, a small island in the south Atlantic Ocean. In 1816, the English es-tablished a small garrison on the island. When they left, one man and hiswife remained, to be joined later by a handful of other settlers. Given such asmall number of original settlers, what do you suppose is the probabilitythat the families represented all the genetic variation present in the popula-tion they came from? The probability would be very low. Genetic drift isoften caused when a small number of founders form a new population: thistype of genetic drift is known as founder effect. An analogy would be a bar-rel containing thousands of red and blue beads, mixed in equal proportions.If you reached into the barrel and randomly pulled out a handful of beads,you might not get 50 percent red and 50 percent blue. Because of randomchance, founders are not likely to be an exact genetic representation of theoriginal population. The smaller the number of founders, the greater the de-viation will be.
Over time, the population of Tristan da Cunha remained small. The pop-ulation size was further reduced twice because of emigration and disaster.
CHAPTER 3 ■ Evolutionary Forces 85
founder effect A type of genetic drift caused bythe formation of a newpopulation by a smallnumber of individuals.
I I I I I I I

Relethford: The Human Species: An Introduction to Biological Anthropology, 5/e
I. Evolutionary Background 3. Evolutionary Forces © The McGraw−Hill Companies, 2003
Given its initial small population, combined with two further reductionsand a maximum population size less than 300, the island had the opportu-nity to experience considerable genetic drift. This effect is seen dramaticallythrough analysis of historical records for the island; for example, it was foundthat two of the original founders contributed genetically to more than 29 per-cent of the 1961 population (Roberts 1968; Underwood 1979).
Gene FlowThe fourth evolutionary force is gene flow, the movement of alleles fromone population to another. The term migration is often used to mean the samething as gene flow. From a conservative standpoint, however, this is not com-pletely accurate. Migration refers to the more or less permanent movementof individuals from one place to another. Why the confusion? After all, ex-cepting artificial insemination, your alleles do not move unless you do. Youcan migrate, though, without passing on any alleles. You can also be involvedin gene flow without actually making a permanent move to a new place. Inmany texts on microevolution, the terms gene flow and migration are used inter-changeably. Keep in mind, however, that there are certain distinctions in thereal world.
Genetic Effects of Gene Flow Gene flow involves the movement of allelesbetween at least two populations. When gene flow occurs, the two popula-tions mix genetically and tend to become more similar. Under most condi-tions, the more the two populations mix, the more similar they will becomegenetically (assuming that the two environments are not different enough toproduce different effects of natural selection).
Consider a genetic locus with two alleles, A and a. Assume two popula-tions, 1 and 2. Now assume that all the alleles in population 1 are A and allthe alleles in population 2 are a. The allele frequencies of these two imagi-nary populations are:
Population 1 Population 2
Frequency of A = 1.0 Frequency of A = 0.0Frequency of a = 0.0 Frequency of a = 1.0
Now imagine a situation in which 10 percent of the people in popula-tion 1 move to population 2, and vice versa. This movement constitutes geneflow. What effect will the gene flow have? After gene flow has taken place,population 1 is made up of 90 percent A alleles and 10 percent a alleles. Pop-ulation 2 is made up of 10 percent A alleles and 90 percent a alleles. The al-lele frequencies of the two populations, though still different, have becomemore similar as the consequence of gene flow. If the same rate of gene flow(10 percent) continues generation after generation, the two populations willbecome more and more similar genetically. After 20 generations of gene flow,the two populations will be almost identical. The accumulated effects of geneflow over time are shown for this hypothetical example in Figure 3.8.
86 PART I ■ Evolutionary Background
gene flow A mechanism for evolutionary changeresulting from themovement of genes fromone population to another.
I I I I I I I

Relethford: The Human Species: An Introduction to Biological Anthropology, 5/e
I. Evolutionary Background 3. Evolutionary Forces © The McGraw−Hill Companies, 2003
Apart from making populations more similar, gene flow can also introducenew variation within a population. In the example, a new allele (a) was intro-duced into population 1 as the result of gene flow. A new mutation arising inone population can be spread throughout the rest of a species by gene flow.
Compared to many other organisms, humans are relatively mobile crea-tures. Human populations show a great deal of variation in degree of migra-tion. Even today, many humans live and work within a small area and choosemates from nearby. Some people are more mobile than others, the extent oftheir mobility depending on a number of factors such as available technol-ogy, occupation, income, and other social factors.
In spite of local and regional differences, humans today all belong to thesame species. Even though genetic variation exists among populations, theyare in fact characterized more by their similarity. A critical factor in the cohe-siveness of the human species, gene flow acts to reduce differences amonggroups.
Determinants of Gene Flow The amount of gene flow between humanpopulations depends on a variety of environmental and cultural factors. Ge-ographic distance is a major determinant of migration and gene flow. Thefarther two populations are apart geographically, the less likely they are toexchange mates. Even in today’s modern world, with access to jet airplanesand other devices, you are still more likely to choose a spouse from nearbythan from across the country. Exceptions to the rule do occur, of course, butthe influence of geographic distance is still very strong.
Studies of migration and gene flow often look at distance between birth-places or premarital residences of married couples. If you had been born in New York City and your spouse had been born in Chicago, the distance
CHAPTER 3 ■ Evolutionary Forces 87
FIGURE 3.8
Effects of gene flow over time.Population 1 started with anallele frequency of 1.0, andpopulation 2 started with anallele frequency of 0.0. The two populations exchange 10 percent of their genes witheach generation. Over time, the continued gene flow acts tomake the two populations moresimilar genetically.
1.0
Alle
le fr
eque
ncy
0.8
0.6
0.4
0.2
00.0
2015105
Generation
Population 1
Population 2

Relethford: The Human Species: An Introduction to Biological Anthropology, 5/e
I. Evolutionary Background 3. Evolutionary Forces © The McGraw−Hill Companies, 2003
between your birthplaces would be approximately 1,300 km (roughly 800 miles).If both you and your spouse had come from the same neighborhood in thesame city, your marital distance would be close to zero. The relationship be-tween migration and geographic distance is similar in most human popula-tions (Relethford 1992). Most marriages take place within a few kilometers,and the number of marriages quickly decreases as the distance between pop-ulations increases. This indicates that the majority of genes flowing intohuman populations come from a local area and a small proportion from far-ther distances.
The relationship between the frequency of marriages and geographic dis-tance is shown in Figure 3.9. This graph presents the results of a historicalstudy of migration into the town of Leominster, Massachusetts, using mar-riage records from the year 1800 through 1849. A total of 1,602 marriagestook place in the population over the 50-year period. Of these, almost half(49.2 percent) were between a bride and groom who were both native toLeominster. An additional 16.5 percent of the marriages took place betweencouples whose premarital residences were between 5 and 10 km (roughlyfrom 8 to 16 miles) apart. Note that the percentage of marriages diminishesquickly after a distance of 5 km. Also note that almost 10 percent of the cou-ples come from distances greater than 50 km. This type of long-range migra-tion (and gene flow) acts to keep populations from diverging too much fromthe rest of the species.
Geographic distance is a major determinant of human migration andgene flow, but it is not the only one. Ethnic differences also act to limit them.Most large cities have distinct neighborhoods that correspond to differentethnic communities. A large proportion of marriages takes place within thesegroups because of the common human preference for marrying within one’s
88 PART I ■ Evolutionary Background
FIGURE 3.9
Percentage of marriages takingplace at various maritaldistances (the distance betweenthe premarital residences ofbride and groom) for the townof Leominster, Massachusetts,1800–1849. (Source: author’sunpublished data)
50
Perc
enta
ge o
f mar
riage
s40
30
20
10
0 0
>50
Marital distance (kilometers)
20 50454035302515105

Relethford: The Human Species: An Introduction to Biological Anthropology, 5/e
I. Evolutionary Background 3. Evolutionary Forces © The McGraw−Hill Companies, 2003
own social and cultural group. Likewise, religious differences also act as bar-riers to gene flow because many, though not all, people prefer to marry withinthe same religion. Further, social class and educational differences can alsolimit gene flow.
In other parts of the world, we see other cultural differences that restrictgene flow. In many Pacific islands, for example, several different languagegroups coexist within a small geographic area. Differences in language en-hance the cultural distances among populations and act to limit the numberof marriages across language groups. Friedlaender’s (1975) study of migra-tion on Bougainville Island in Melanesia shows the effect of language differ-ences on marriage frequency. He looked at marriages within and amongsmall villages belonging to eight different language groups within roughly a100-km range. The percentage of marriages within each language group arelisted in Table 3.6. For the entire island, 90 percent of all marriages took placewithin the same language group (the percentage varies from 70 percent to98 percent for the eight groups).
Interaction of the Evolutionary ForcesIt is convenient to discuss each of the four evolutionary forces separately, butin reality they act together to produce allele frequency change. Mutation actsto introduce new genetic variants; natural selection, genetic drift, and geneflow act to change the frequency of the mutant allele. Sometimes the evolu-tionary forces act together, and sometimes they act in opposition. Their exactinteraction depends on a wide variety of factors, such as the biochemical andphysical effects of different alleles, presence or absence of dominance, popu-lation size, population distribution, and the environment, to name but a few.
CHAPTER 3 ■ Evolutionary Forces 89
TA B L E 3 . 6 Rates of Marriage withinLanguage Groups onBougainville Island
Percentage of MarriagesLanguage Occurring withinGroup Language Group
Aita 95Eivo 85Nasioi 95Rotokas 98Simeku 90Siwai 94Torau 96Uruava 70
Source: Friedlaender (1975:76).

Relethford: The Human Species: An Introduction to Biological Anthropology, 5/e
I. Evolutionary Background 3. Evolutionary Forces © The McGraw−Hill Companies, 2003
Many biological anthropologists attempt to unravel some of these factors inhuman population studies.
In general, we look at how natural selection, genetic drift, and gene flowact to increase or decrease genetic variation within and between groups. (Mu-tation gets less attention because, even though it introduces new genetic vari-ants, the change in allele frequency in one generation is low.) An increase invariation within a population means that individuals within the populationwill be more genetically different from one another. A decrease in variationwithin a population means the reverse; individuals will become more similarto one another genetically. An increase in variation among populations meansthat two or more populations will become more different from one anothergenetically, and a decrease in variation within populations means the reverse.
Let us first consider the effects of genetic drift, gene flow, and natural se-lection on allele frequency variation. Genetic drift tends to remove allelesfrom a population and therefore acts to reduce variation within a popula-tion. On the other hand, because genetic drift is a random event and occursindependently in different populations, the pattern of genetic drift will tendto be different on average in different populations. On average, then, geneticdrift will act to increase variation between populations. Gene flow acts to in-troduce new alleles into a population and can have the effect of increasingvariation within a population. Gene flow also acts to reduce variation be-tween populations in most cases.
Natural selection can either increase or decrease variation within a pop-ulation, depending on the specific type of selection and the initial allele fre-quencies. Selection against recessive homozygotes, for example, will lead tothe gradual decrease of one allele and consequently reduce variation. Selec-tion for an advantageous mutation, however, will result in an increase in thefrequency of the mutant and act to increase variation within the population.Selection can also either increase or decrease variation between populations,depending on environmental variation. If two populations have similar envi-ronments, then natural selection will take place in the same way in bothgroups and therefore will act to reduce genetic differences between them. Onthe other hand, if the two populations are in different enough environmentsthat natural selection operates in different ways, then variation between thepopulations may be increased. Table 3.7 summarizes the effects of differentevolutionary forces on variation within and among populations.
Different evolutionary forces can produce the same, or opposite, effects.Different forces can also act in opposition to one another. Genetic drift andgene flow, for example, have opposite effects on variation within and betweenpopulations. If both of these forces operate at the same time, they can coun-teract each other.
Several examples help illustrate the ways in which different evolutionaryforces can interact. Consider the forces of mutation and genetic drift. Howmight these two forces interact? Mutation acts to change allele frequency bythe introduction of a new allele, whereas genetic drift causes random fluctu-ations in allele frequency from one generation to the next. If both operate at
90 PART I ■ Evolutionary Background
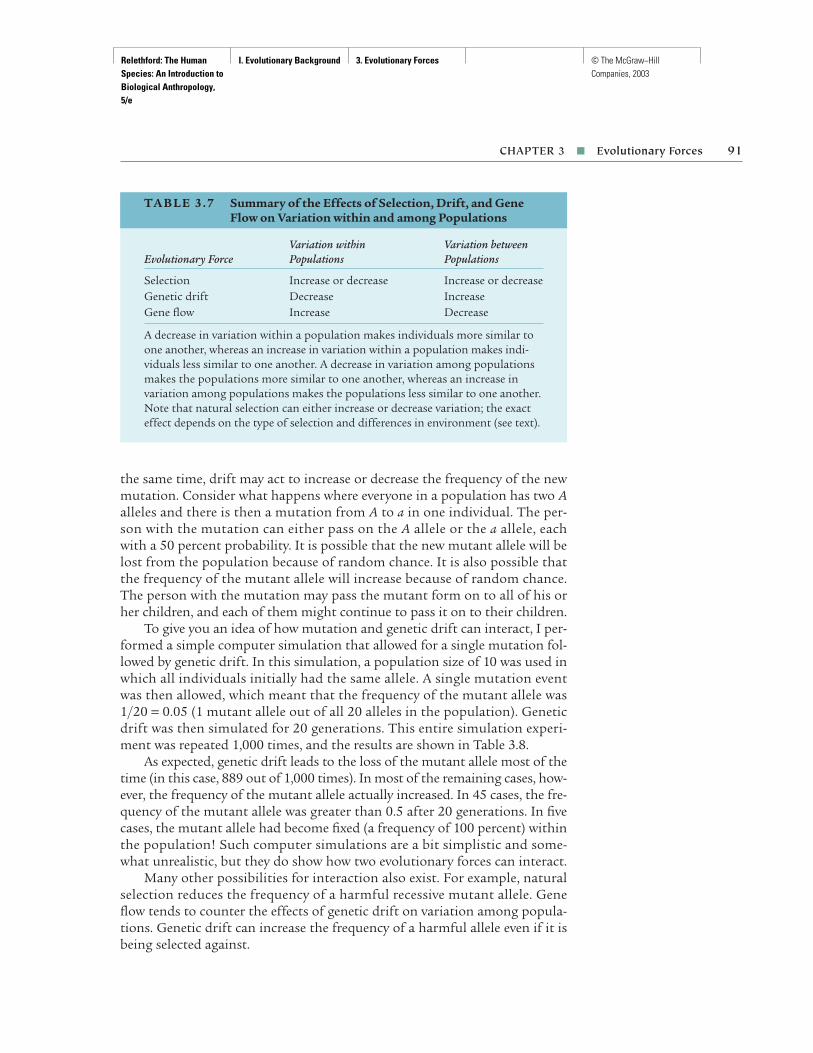
Relethford: The Human Species: An Introduction to Biological Anthropology, 5/e
I. Evolutionary Background 3. Evolutionary Forces © The McGraw−Hill Companies, 2003
the same time, drift may act to increase or decrease the frequency of the newmutation. Consider what happens where everyone in a population has two Aalleles and there is then a mutation from A to a in one individual. The per-son with the mutation can either pass on the A allele or the a allele, eachwith a 50 percent probability. It is possible that the new mutant allele will belost from the population because of random chance. It is also possible thatthe frequency of the mutant allele will increase because of random chance.The person with the mutation may pass the mutant form on to all of his orher children, and each of them might continue to pass it on to their children.
To give you an idea of how mutation and genetic drift can interact, I per-formed a simple computer simulation that allowed for a single mutation fol-lowed by genetic drift. In this simulation, a population size of 10 was used inwhich all individuals initially had the same allele. A single mutation eventwas then allowed, which meant that the frequency of the mutant allele was1/20 = 0.05 (1 mutant allele out of all 20 alleles in the population). Geneticdrift was then simulated for 20 generations. This entire simulation experi-ment was repeated 1,000 times, and the results are shown in Table 3.8.
As expected, genetic drift leads to the loss of the mutant allele most of thetime (in this case, 889 out of 1,000 times). In most of the remaining cases, how-ever, the frequency of the mutant allele actually increased. In 45 cases, the fre-quency of the mutant allele was greater than 0.5 after 20 generations. In fivecases, the mutant allele had become fixed (a frequency of 100 percent) withinthe population! Such computer simulations are a bit simplistic and some-what unrealistic, but they do show how two evolutionary forces can interact.
Many other possibilities for interaction also exist. For example, naturalselection reduces the frequency of a harmful recessive mutant allele. Geneflow tends to counter the effects of genetic drift on variation among popula-tions. Genetic drift can increase the frequency of a harmful allele even if it isbeing selected against.
CHAPTER 3 ■ Evolutionary Forces 91
TA B L E 3 . 7 Summary of the Effects of Selection, Drift, and GeneFlow on Variation within and among Populations
Variation within Variation betweenEvolutionary Force Populations Populations
Selection Increase or decrease Increase or decreaseGenetic drift Decrease IncreaseGene flow Increase Decrease
A decrease in variation within a population makes individuals more similar toone another, whereas an increase in variation within a population makes indi-viduals less similar to one another. A decrease in variation among populationsmakes the populations more similar to one another, whereas an increase invariation among populations makes the populations less similar to one another.Note that natural selection can either increase or decrease variation; the exacteffect depends on the type of selection and differences in environment (see text).
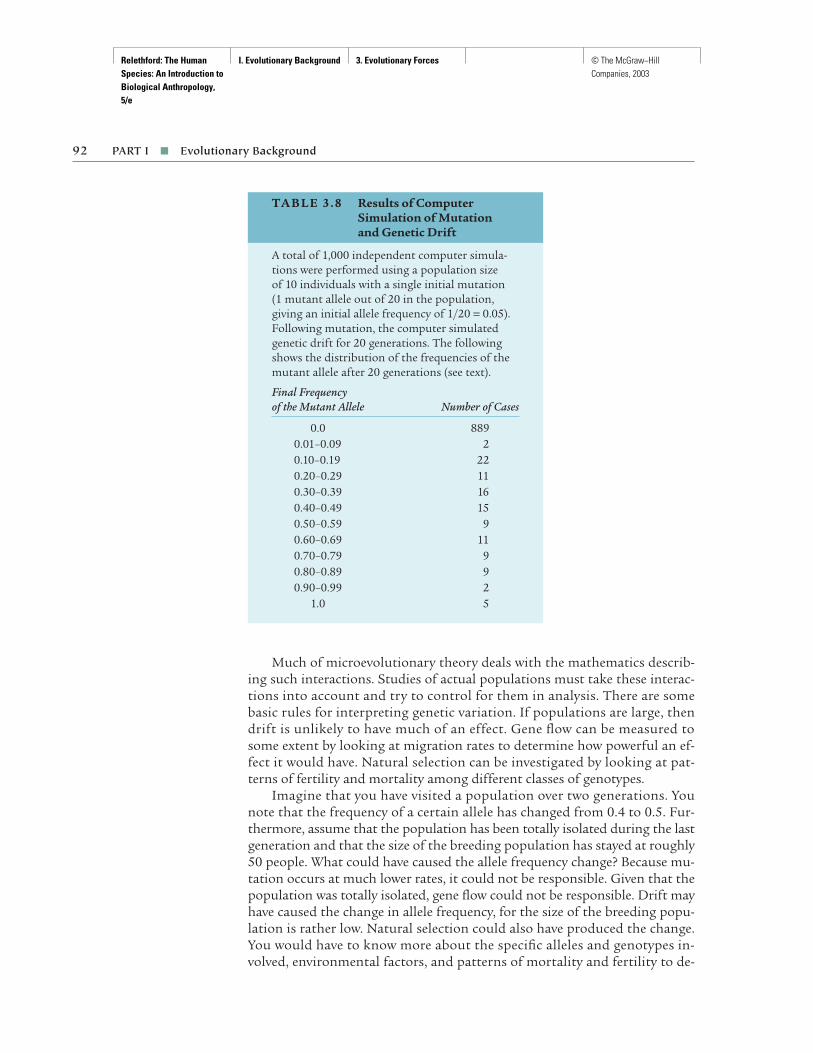
Relethford: The Human Species: An Introduction to Biological Anthropology, 5/e
I. Evolutionary Background 3. Evolutionary Forces © The McGraw−Hill Companies, 2003
Much of microevolutionary theory deals with the mathematics describ-ing such interactions. Studies of actual populations must take these interac-tions into account and try to control for them in analysis. There are somebasic rules for interpreting genetic variation. If populations are large, thendrift is unlikely to have much of an effect. Gene flow can be measured tosome extent by looking at migration rates to determine how powerful an ef-fect it would have. Natural selection can be investigated by looking at pat-terns of fertility and mortality among different classes of genotypes.
Imagine that you have visited a population over two generations. Younote that the frequency of a certain allele has changed from 0.4 to 0.5. Fur-thermore, assume that the population has been totally isolated during the lastgeneration and that the size of the breeding population has stayed at roughly50 people. What could have caused the allele frequency change? Because mu-tation occurs at much lower rates, it could not be responsible. Given that thepopulation was totally isolated, gene flow could not be responsible. Drift mayhave caused the change in allele frequency, for the size of the breeding popu-lation is rather low. Natural selection could also have produced the change.You would have to know more about the specific alleles and genotypes in-volved, environmental factors, and patterns of mortality and fertility to de-
92 PART I ■ Evolutionary Background
TA B L E 3 . 8 Results of ComputerSimulation of Mutation and Genetic Drift
A total of 1,000 independent computer simula-tions were performed using a population size of 10 individuals with a single initial mutation (1 mutant allele out of 20 in the population,giving an initial allele frequency of 1/20 = 0.05).Following mutation, the computer simulatedgenetic drift for 20 generations. The followingshows the distribution of the frequencies of themutant allele after 20 generations (see text).
Final Frequencyof the Mutant Allele Number of Cases
0.0 8890.01–0.09 20.10–0.19 220.20–0.29 110.30–0.39 160.40–0.49 150.50–0.59 90.60–0.69 110.70–0.79 90.80–0.89 90.90–0.99 2
1.0 5

Relethford: The Human Species: An Introduction to Biological Anthropology, 5/e
I. Evolutionary Background 3. Evolutionary Forces © The McGraw−Hill Companies, 2003
termine whether selection had an effect. Even given this rather limited infor-mation, you can rule out mutation and gene flow and proceed to develop teststo determine the relative influence of drift and selection.
The study of any natural population is much more complex. With labo-ratory animals, you can control for a variety of factors to help your analysis.In dealing with human populations, however, you must rely on observationsas they occur in nature.
Nonrandom MatingRecall that one of the assumptions of the Hardy-Weinberg equilibriummodel is random mating. Populations often show deviations from randommating, such as inbreeding, where mates are closely related. Actually, we areall inbred to some extent, but we generally reserve the term for “close” bio-logical relatedness, such as between first cousins or closer. What is the ge-netic effect of inbreeding? Closely related individuals are more likely to havesimilar alleles inherited from a common ancestor. Thus, inbreeding increasesthe probability of having a homozygous genotype. For example, if two first
93
S P E C I A L T O P I C
Tay-Sachs Disease: Genetic Drift or Natural Selection?Tay-Sachs disease is an example of a lethal recessive allele—people with two Tay-Sachs alleles generally die very earlyin life. As expected, the frequency of this disease tends to be rather low around the world, affecting roughly 1 inevery 500,000 births. What is unusual about Tay-Sachsdisease is the fact that among Jews of Eastern Europeanancestry (Ashkenazi Jews) the rate is much higher: Tay-Sachs affects roughly 1 in every 2,500 births in thesepopulations (Molnar 1998). The occurrence of Tay-Sachsis also high in some other human populations.
What would be responsible for higher frequencies of a lethal allele in certain populations? Is it somethingrelated to their history, their environment, or some com-plex set of factors? One suggestion is genetic drift. Jewishpopulations have tended to be rather small and isolated,factors that increase the likelihood of genetic drift. Al-though selection acts to reduce the frequency of theallele, the random nature of genetic drift might havecaused an increase relative to larger populations, whichexperienced less genetic drift.
Closer examination, however, argues against the ge-netic drift hypothesis. The Tay-Sachs disease is not due to a specific mutant allele but actually can arise fromseveral different mutations. All of these mutant alleleshave elevated frequencies in Ashkenazi populations. It
seems unlikely that all of these mutant forms would driftto higher frequencies (Marks 1995).
What else could be responsible for the elevated fre-quency of Tay-Sachs disease? There is some evidencesuggesting that people who carry one Tay-Sachs allele(heterozygotes) have increased resistance to tuberculosis.If so, then the heterozygotes would have greater fitnessthan either the normal homozygote (who would be moresusceptible to tuberculosis) or those homozygous for theTay-Sachs allele (who have zero fitness). This is a case ofbalancing selection and, as discussed in the text, wouldlead to a balance in allele frequencies.
However, why would this type of selection take placeonly among the Ashkenazi? Cultural and historical dataprovide a possible answer. Due to discrimination, theJewish populations of Eastern Europe were frequentlyisolated into overcrowded ghettos under conditions thatwould increase the threat of tuberculosis (Marks 1995).
The tuberculosis hypothesis is just that—a possibleexplanation that remains to be fully tested. If correct, itprovides us with yet another example of the compromisesthat occur during evolution. There is no “perfect” geno-type. Everything has a price in terms of fitness, and nat-ural selection often reflects this balance between cost andbenefit.
Relethford: The Human Species: An Introduction to Biological Anthropology, 5/e
I. Evolutionary Background 3. Evolutionary Forces © The McGraw−Hill Companies, 2003
cousins mate, the probability that their offspring will have a homozygousgenotype is 6.25 percent greater than that for a noninbred mating (this num-ber is called the inbreeding coefficient and is discussed further in Appendix 1).
The genetic effects of inbreeding are often harmful. Studies have shownthat the incidence of congenital birth defects and mortality during the firstyear of life is higher among inbred offspring than among the offspring ofothers (Bittles et al. 1991). Some studies have suggested higher rates of men-tal retardation among inbred children, but others have not confirmed this.For the most part, overall rates of inbreeding in human populations tend tobe low compared to rates among other organisms. These lower rates appearin part due to the high mobility of the human species (more gene flow) andin part reflect the fact that most societies have cultural rules discouraging, orprohibiting, mating with close relatives.
At a broader level, the evolutionary effect of inbreeding is to change geno-type frequencies, but not allele frequencies. Inbreeding results in more ho-mozygotes and fewer heterozygotes but does not change the frequency of thealleles (only their distribution into genotypes). As such, inbreeding does notchange allele frequencies over time. Inbreeding can, however, affect the rateof allele frequency change. If, for example, there is selection against a ho-mozygote, then inbreeding will produce more homozygotes to be selectedagainst and the rate of selection will change.
Assortative mating is another form of nonrandom mating. With thistype of mating, individuals choose mates who are biologically similar tothemselves. Humans typically choose mates similar to themselves for a vari-ety of social and biological traits (Buss 1985). A typical example is assortativemating for skin color; on average, people tend to choose mates with similarskin color. Evolutionarily, the effect is the same as for inbreeding—genotypefrequencies are changed, but not allele frequencies.
SUMMARY
The study of microevolution looks at changes in the frequencies of allelesfrom one generation to the next. Such analyses allow detailed examinationof the factors that can alter allele frequencies in the short term and also pro-vide us with inferences about long-term patterns of evolution. Changes in al-lele frequencies stem from four evolutionary forces: mutation, natural selec-tion, genetic drift, and gene flow.
Mutation is the ultimate source of all genetic variation but occurs at lowenough rates that additional factors are needed to explain polymorphic fre-quencies (whereby two or more alleles have frequencies greater than 0.01).The other three evolutionary forces are responsible for increasing or decreas-ing the frequency of a mutant allele. Natural selection changes allele frequen-cies through the process of differential survival and reproduction of individ-uals having certain genotypes. Genetic drift is the random change in allelefrequencies from one generation to the next and has the greatest effect insmall populations. Gene flow, the movement of alleles between populations,acts to reduce genetic differences between different groups.
94 PART I ■ Evolutionary Background

Relethford: The Human Species: An Introduction to Biological Anthropology, 5/e
I. Evolutionary Background 3. Evolutionary Forces © The McGraw−Hill Companies, 2003
The rate of allele frequency change is affected by nonrandom matingpatterns such as inbreeding and assortative mating. The allele frequencies donot change, but the genotype frequencies are affected. More homozygotesoccur than expected from random mating, which can result in more rapidchange in allele frequencies because of natural selection.
SUPPLEMENTAL READINGS
Gillespie, J. H. 1998. Population Genetics: A Concise Guide. Baltimore: Johns Hopkins Univer-sity Press.
Hartl, D. L. 2000. A Primer of Population Genetics, 2d ed. Sunderland, Mass.: Sinauer Associ-ates. These two books are good short introductions to population genetics with a min-imum of mathematical background needed (basic algebra).
Hartl, D. L., and A. G. Clark. 1997. Principles of Population Genetics, 3d ed. Sunderland,Mass.: Sinauer Associates.
Hedrick, P. W. 2000. Genetics of Populations, 2d ed. Sudbury, Mass.: Jones and Bartlett. Thesetwo books are more comprehensive and advanced treatments of population genetics.
INTERNET RESOURCES
http://anthro.palomar.edu/synthetic/Default.htmSynthetic Theory of Evolution, a tutorial covering Hardy-Weinberg equilib-rium and the evolutionary forces.
http://www.utm.edu/∼rirwin/NaturalSelection.htmThe Natural Selection Model, an interactive simulation of natural selection.
http://www.utm.edu/∼rirwin/Drift.htmThe Genetic Drift Model, an interactive simulation of genetic drift.
http://www.mhhe.com/mayfieldpub/relethford/student_resources/micro/index.htmDownload MICRO, a microevolution simulation program for Windows 9x.
CHAPTER 3 ■ Evolutionary Forces 95

Relethford: The Human Species: An Introduction to Biological Anthropology, 5/e
I. Evolutionary Background 4. The Origin and Evolution of Species
© The McGraw−Hill Companies, 2003
C H A P T E R 4The Origin and Evolutionof Species
97
When so-called creation scientists dispute evolution, they generallymean macroevolution. Few doubt the existence of short-term, micro-
evolutionary changes when we can see such changes in our daily lives, fromchanging patterns of disease to the kinds of alterations brought about byanimal and plant breeding. The long-term pattern of evolution, however, isgenerally more difficult to grasp. Creationism argues that we cannot directlyobserve changes over millions of years and therefore cannot make scientifictests. It is true that we cannot undertake laboratory tests lasting for millionsof years, but we can still make scientific predictions. Many sciences, includ-ing geology and astronomy, are historical in nature. That is, we rely on somerecord (geologic strata or stellar configurations, for example) to note whathas happened. We can establish the facts of change. The same is true ofmacroevolution. The fossil record provides us with information about whathas happened. We must then utilize other information available to us to de-termine why such change has occurred. A geologist makes use of the fact thatgeologic processes occur in a regular manner and therefore occurred in thesame way in ancient times. Geologists use available information about cur-rent geologic processes to explain patterns of change in the past. In muchthe same way, evolutionary science takes what we know about microevolu-tion and extends it to explain the long-term pattern of macroevolution.
The fossil remains of Confuciusornis sanctus, the earliest known bird,found in China and dating to 130 million years ago. The study of long-termevolution, or macroevolution, is centered on the origin and evolution of newspecies. (© O. Louis Mazzatenta/National Geographic Society Image Collection)
▲

Relethford: The Human Species: An Introduction to Biological Anthropology, 5/e
I. Evolutionary Background 4. The Origin and Evolution of Species
© The McGraw−Hill Companies, 2003
98 PART I ■ Evolutionary Background
THE BIRTH AND DEATH OF SPECIES
The origin of new species has been observed in historical times and in thepresent. Some new species have been brought about by human interventionand controlled breeding; examples include many species of tropical fish. Newspecies have also arisen naturally in the recent past, such as certain types offruit flies. In addition, we have information on populations in the process offorming new species, such as certain groups of snails. We also have seen (andcontributed to) many examples of extinction—the death of a species.
How do new species come into being? Why do some species die out? Eventhough the title of Darwin’s book is On the Origin of Species, it is ironic thatDarwin did not focus much on this question. Instead, Darwin sought to ex-plain the basic nature of evolutionary change, believing that extension ofthese principles could explain the formation of new species.
What Is a Species?The term species is used in a number of different ways in evolutionary biology(Ereshefsky 1992). In this chapter, the emphasis is on the biological speciesconcept, which defines species in terms of reproductive capability. If organ-isms from two populations are capable of breeding naturally and can pro-duce fertile offspring, then they are classified in the same species. Note thatthis definition has several parts. First, organisms from different populationsmust be capable of interbreeding. Second, these matings must occur in na-ture. Recent advances in biology have allowed individuals usually consideredto belong to separate species to produce offspring under laboratory condi-tions. In understanding evolutionary history, we are interested in breedingthat takes place naturally. Third, the offspring must be fertile—that is, capa-ble of producing further offspring.
Perhaps the best-known example of an application of the biologicalspecies concept is the mule. Mules are farm animals produced as the offspringof a horse bred with a donkey. The horse and donkey interbreed naturally,which satisfies the first and second parts of the species definition. However,the offspring (mules) are sterile and cannot produce further offspring. Theonly way to get a mule is to mate a horse and a donkey. Because the offspringare not fertile, the horse and the donkey are considered separate species (Fig-ure 4.1). All human populations around the world belong to the same species(Homo sapiens) because members can interbreed and produce fertile offspring.
The biological species concept assumes that two organisms either be-long or do not belong to the same species. It does not allow for any kind ofintermediate state. Why should this be a problem? Consider as an exampletwo modern species that had a common ancestor at some point in the past.We usually draw an evolutionary “tree,” showing the point at which a new“branch,” or species, comes into being. If some populations of species Aevolved into species B, then at what point did those populations stop beingspecies A and start being species B? The species concept suggests that thischange was instantaneous, because a creature either belongs to one species
biological species conceptA definition of species thatfocuses on reproductivecapabilities, where organismsfrom different populationsare considered to be in thesame species if they naturallyinterbreed and producefertile offspring.
I I I I I I I
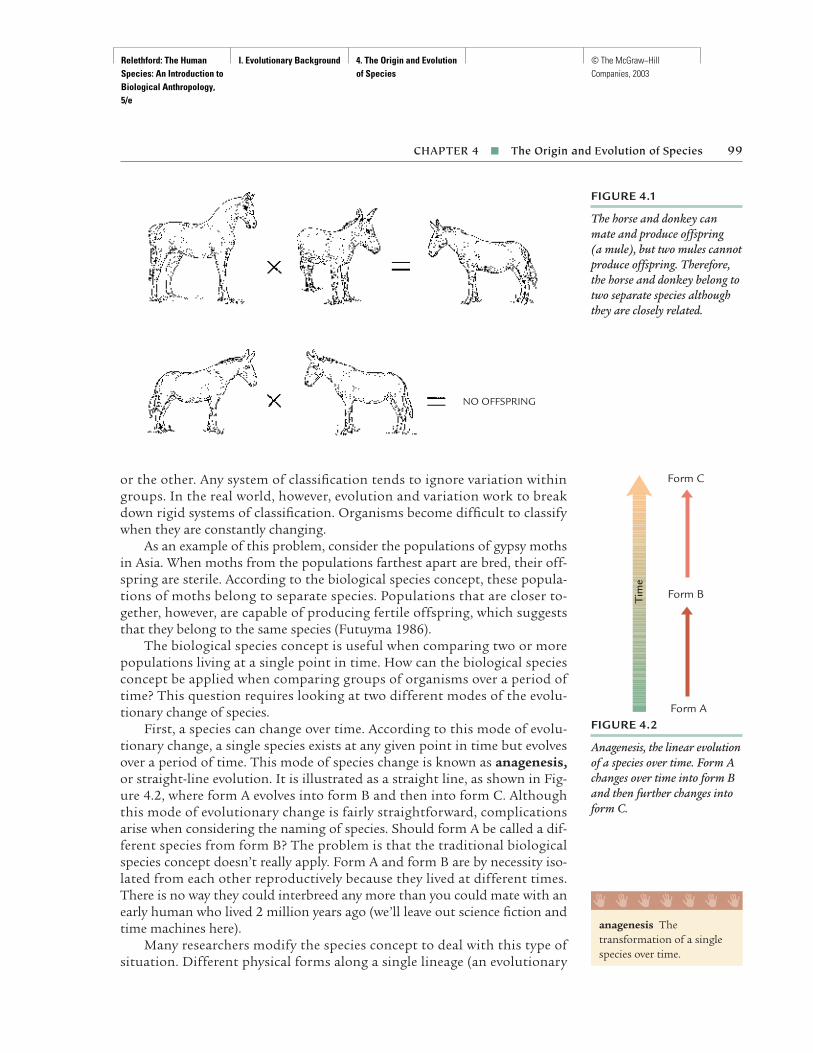
Relethford: The Human Species: An Introduction to Biological Anthropology, 5/e
I. Evolutionary Background 4. The Origin and Evolution of Species
© The McGraw−Hill Companies, 2003
or the other. Any system of classification tends to ignore variation withingroups. In the real world, however, evolution and variation work to breakdown rigid systems of classification. Organisms become difficult to classifywhen they are constantly changing.
As an example of this problem, consider the populations of gypsy mothsin Asia. When moths from the populations farthest apart are bred, their off-spring are sterile. According to the biological species concept, these popula-tions of moths belong to separate species. Populations that are closer to-gether, however, are capable of producing fertile offspring, which suggeststhat they belong to the same species (Futuyma 1986).
The biological species concept is useful when comparing two or morepopulations living at a single point in time. How can the biological speciesconcept be applied when comparing groups of organisms over a period oftime? This question requires looking at two different modes of the evolu-tionary change of species.
First, a species can change over time. According to this mode of evolu-tionary change, a single species exists at any given point in time but evolvesover a period of time. This mode of species change is known as anagenesis,or straight-line evolution. It is illustrated as a straight line, as shown in Fig-ure 4.2, where form A evolves into form B and then into form C. Althoughthis mode of evolutionary change is fairly straightforward, complicationsarise when considering the naming of species. Should form A be called a dif-ferent species from form B? The problem is that the traditional biologicalspecies concept doesn’t really apply. Form A and form B are by necessity iso-lated from each other reproductively because they lived at different times.There is no way they could interbreed any more than you could mate with anearly human who lived 2 million years ago (we’ll leave out science fiction andtime machines here).
Many researchers modify the species concept to deal with this type ofsituation. Different physical forms along a single lineage (an evolutionary
CHAPTER 4 ■ The Origin and Evolution of Species 99
FIGURE 4.1
The horse and donkey canmate and produce offspring (a mule), but two mules cannotproduce offspring. Therefore,the horse and donkey belong totwo separate species althoughthey are closely related.
NO OFFSPRING
FIGURE 4.2
Anagenesis, the linear evolutionof a species over time. Form Achanges over time into form Band then further changes intoform C.
Tim
e
Form C
Form A
Form B
anagenesis Thetransformation of a singlespecies over time.
I I I I I I I

Relethford: The Human Species: An Introduction to Biological Anthropology, 5/e
I. Evolutionary Background 4. The Origin and Evolution of Species
© The McGraw−Hill Companies, 2003
line such as that shown in Figure 4.2) are given different species names outof convenience and as a label to represent the types of physical change shownover time. Such forms are referred to as paleospecies and are used more aslabels than as units representing the species concept. In recent years, therehas been a tendency to move away from the use of paleospecies, at least amongsome evolutionary biologists.
Anagenesis is not the only mode of species change. If you think about it,anagenesis is not completely sufficient as an explanation of macroevolution.Where do new species come from? The other mode of species change iscladogenesis, or branching evolution. Cladogenesis involves the formationof new species (speciation) whereby one or more new species branch off froman original species. In Figure 4.3, a portion of species A first branches off toproduce species B (living at the same time), then a portion of species Bbranches to produce species C. This example starts with one species and endsup with three. The factors responsible for speciation will be discussed laterin this chapter.
The problem of species naming is complicated by the fact that evolu-tionary relationships among fossil forms are not always clear. Some of theseproblems will be addressed later. For now, keep in mind that species namesoften mean different things to different people. The naming of species mightadhere to an evolutionary model or might serve only as convenient labels ofphysical variation.
SpeciationThe fossil record shows many examples of new species arising. How? Youknow that genetic differences between populations come about as a result ofevolutionary forces. For a population to become a new species, these genetic
100 PART I ■ Evolutionary Background
FIGURE 4.3
Cladogenesis, the origin of newspecies. Species A splits andforms a new species B, whichlater splits to form species C.The process begins with a singlespecies (A) and ends with threespecies (A, B, C).
Species A
Species B
Species C
CBA
Tim
e
paleospecies Speciesidentified from fossil remainsbased on their physicalsimilarities and differencesrelative to other species.
cladogenesis The formationof one or more new speciesfrom another over time.
I I I I I I I

Relethford: The Human Species: An Introduction to Biological Anthropology, 5/e
I. Evolutionary Background 4. The Origin and Evolution of Species
© The McGraw−Hill Companies, 2003
differences must be great enough to prevent successful interbreeding withthe original parent species. For this to occur, the population must becomereproductively isolated from the original parent species.
Reproductive Isolation Reproductive isolation is genetic change that canlead to an inability to produce fertile offspring. How does this happen? Evo-lutionary forces can produce such a situation. The first step in speciation(the formation of a new species from a parent species) is the elimination orreduction of gene flow between populations. Because gene flow acts to re-duce differences between populations, its continued action tends to keep allpopulations in the same species. Gene flow does not need to be eliminatedaltogether, but it must be reduced sufficiently to allow the other evolution-ary forces to make the populations genetically different. Populations mustbecome genetically isolated from one another for speciation to occur.
The most common form of isolation in animal species is geographic iso-lation. When two populations are separated by a physical barrier, such as ariver or mountain range, or by great distances, gene flow is cut off betweenthe populations. As long as the populations remain isolated, genetic changesoccurring in one group will not spread to other groups. As we saw in Chap-ter 3, geographic distance limits gene flow even in our own highly mobilespecies. The effects of geographic distance in causing reproductive isolationare even more dramatic in other species.
Geographic separation is the most common means of producing repro-ductive isolation among animal populations, but other mechanisms mayalso cause isolation. Some of these can operate within a single geographic re-gion. Populations may be isolated by behavioral differences such as feedinghabits. Some groups may eat during the day and others at dusk. Because thegroups are not in frequent contact with one another, there is opportunityfor isolation to develop. Although geographic isolation is in theory not re-quired, the actual probability of speciation occurring in geographically adja-cent groups remains highly controversial. One reviewer notes that there islittle evidence to date of speciation occurring without geographic isolation(Coyne 1992).
Genetic Divergence Isolation is the first step in the speciation process. Byitself, this isolation does not guarantee speciation. Elimination of gene flowprovides the opportunity for speciation. Other evolutionary forces must thenact upon this isolation to produce a situation in which the isolated groupshave changed sufficiently to make fertile interbreeding no longer possible.Isolation, however, does not always lead to speciation.
How can the evolutionary forces lead to speciation? Mutation might actto increase variation among populations because it occurs independently inthe genetic composition of separate groups. Without gene flow to spreadthem, individual mutations will accumulate in each group, making isolatedpopulations genetically divergent. Genetic drift also contributes to differ-ences in allele frequencies among small populations. In addition, if the two
CHAPTER 4 ■ The Origin and Evolution of Species 101
reproductive isolationThe genetic isolation ofpopulations that mayrender them incapable ofproducing offspring.
speciation The origin of anew species.
I I I I I I I

Relethford: The Human Species: An Introduction to Biological Anthropology, 5/e
I. Evolutionary Background 4. The Origin and Evolution of Species
© The McGraw−Hill Companies, 2003
populations are in separate environments, then natural selection will lead togenetic differences. Once gene flow has been eliminated, the other evolution-ary forces will act to make the populations genetically divergent. When thisprocess continues to the point where the two populations can no longer in-terbreed and produce fertile offspring, they have become separate species.
There is continued debate over the role of the various evolutionary forcesin producing genetic divergence. For many years, speciation was felt to besolely the by-product of natural selection. That is, as two populations cameto occupy separate environments, the action of natural selection would causethese groups to become different. Speciation has been viewed as a conse-quence of this differential adaptation. In recent years, however, more atten-tion has been given to the contributions to speciation of mutation and ge-netic drift in small populations. In the former view, the old species graduallyformed two or more species, with natural selection operating on large popu-lations. The more recent view is that new species often form from small pop-ulations and, as such, are affected extensively by mutation and genetic drift.
Adaptive RadiationThe process of speciation minimally results in two species: the original par-ent species and the new offspring species. Under certain circumstances, manynew species can come into being in a short period of time. This rapid diversi-fication of species is associated with changing environmental conditions.When new environments open up, or when new adaptations to a specific en-vironment develop, many new species can form—a process known as adap-tive radiation.
The Tempo and Mode of MacroevolutionDuring the past 30 years, considerable attention has been given to the tempo(how fast?) and mode (the mechanism) of macroevolutionary change. Howquickly do new species form? Does speciation occur in large or small popula-tions? What are the effects of natural selection and the other evolutionaryforces in producing new species? These are all questions about the tempoand mode of macroevolution.
Gradualism Charles Darwin saw speciation as a slow and gradual process,taking thousands or millions of years. To Darwin, natural selection acted onpopulations ultimately to produce new species. The view that macroevolu-tion is a slow and gradual process is called gradualism. According to thisview, small changes in each generation over time result in major biologicalchanges.
Gradualism, then, regards speciation as a slow process that takes a longtime to occur. New species form from large portions of an original species.In such large populations, genetic drift and mutation have little impact in
102 PART I ■ Evolutionary Background
adaptive radiationThe formation of many new species following the availability of newenvironments or thedevelopment of a newadaptation.
gradualism A model ofmacroevolutionary changewhereby evolutionarychanges occur at a slow,steady rate over time.
I I I I I I I

Relethford: The Human Species: An Introduction to Biological Anthropology, 5/e
I. Evolutionary Background 4. The Origin and Evolution of Species
© The McGraw−Hill Companies, 2003
each generation. Natural selection, slowly operating on some initial muta-tion(s), is primarily responsible for speciation.
The gradualistic model predicts that, given a suitable fossil record, we willsee a smooth and gradual transition from one species into another. Althoughthere are examples of such change in the fossil record, it is not always appar-ent. In some cases, we lack transitional forms. Does this lack of evidence in-dicate problems in the fossil record or in the theory of gradualism itself?
Punctuated Equilibrium An alternative hypothesis has been suggested byNiles Eldredge and Stephen Jay Gould in the form of a model known aspunctuated equilibrium (Eldredge and Gould 1972; Gould and Eldredge1977). This hypothesis suggests that the pattern of macroevolution consistsof long periods of time when little evolutionary change occurs (stasis) andshort periods of time when rapid evolutionary change occurs. To Eldredgeand Gould, the tempo of macroevolution is not gradual; rather, it is static attimes and rapid at other times. Long periods of stasis are punctuated by shortperiods of rapid evolutionary change. Examples of gradualism and punctu-ated equilibrium are given in Figure 4.4.
Eldredge and Gould also view speciation as a rapid event occurring withinsmall isolated populations on the periphery of a species range. Mutationscan spread quickly in small populations as a consequence of inbreeding andgenetic drift. If such genetic changes are adaptive and if the newly formedspecies gains access to the parental species’ range, it may then spread through-out an area, replacing the original parent species. According to this model,most biological change occurs during speciation. Once a species has been es-tablished, it changes little throughout time. Eldredge and Gould argue thatstabilizing selection and other factors act to keep a species the same over time.This view contrasts with the gradualistic model, which sees biological changeoccurring at a slow rate, ultimately leading to separate species.
Punctuated equilibrium makes a prediction about how the fossil recordshould look. Given stasis, we should see long periods of time when little evo-lutionary change takes place. Certain organisms, such as the cockroach andcoelacanth, seem to follow this pattern—they have not changed much overmany millions of years. The punctuated equilibrium model also predicts thatnew species will appear rather quickly, often without any evidence of a tran-sitional state. Because the model predicts that speciation occurs within smallisolated populations, there is little chance that we will have fossil evidenceactually documenting the initial stages of the origin of a new species.
CHAPTER 4 ■ The Origin and Evolution of Species 103
FIGURE 4.4
The tempo of macroevolution:gradualism and punctuatedequilibrium. Each portion ofthis figure has a line showingthe change in value of aphysical trait over time. (a) Gradualism: the changeover time is linear andconstant. (b) A geometric,gradual pattern. The rate ofchange increases with time, but the curve is still smooth;there are no discontinuities. (c) Punctuated equilibrium:there are periods of no change(stasis) punctuated by periodsof rapid change; the net result is a “staircase” pattern.
Time
Valu
e
Valu
e
Valu
e
Time Time
a. b. c.
punctuated equilibrium Amodel of macroevolutionarychange in which long periodsof little evolutionary change(stasis) are followed byrelatively short periods ofrapid evolutionary change.
I I I I I I I

Relethford: The Human Species: An Introduction to Biological Anthropology, 5/e
I. Evolutionary Background 4. The Origin and Evolution of Species
© The McGraw−Hill Companies, 2003
Extinctions and Mass ExtinctionsIn considering macroevolutionary trends, we must not forget the most com-mon pattern of them all—extinction. It is estimated that more than 99 per-cent of all species that ever existed have become extinct (Futuyma 1986). Inhistoric times, humans have witnessed (and helped cause) the extinction of anumber of organisms, such as the passenger pigeon.
What causes extinction? When a species is no longer adapted to a changedenvironment, it may die. The exact causes of a species’ death vary from situa-tion to situation. Rapid ecological change may render an environment hos-tile to a species. For example, temperatures may change and a species may notbe able to adapt. Food resources may be affected by environmental changes,which will then cause problems for a species requiring these resources. Otherspecies may become better adapted to an environment, resulting in competi-tion and ultimately the death of a species.
Extinction seems, in fact, to be the ultimate fate of all species. Naturalselection is a remarkable mechanism for providing a species with the abilityto adapt to change, but it does not always work. When the environmentchanges too rapidly or when the appropriate genetic variations do not exist,a species can become extinct.
The fossil record shows that extinction has occurred throughout the his-tory of the planet. Recent analysis has also revealed that on some occasions alarge number of species became extinct at the same time—a mass extinction.One of the best-known examples of mass extinction occurred 65 million yearsago with the demise of dinosaurs and many other forms of life. Perhaps themost severe mass extinction occurred roughly 250 million years ago when morethan 90 percent of marine species, about 70 percent of terrestrial vertebrates,and most land plants became extinct (Becker et al. 2001). Mass extinctionscan be caused by a relatively rapid change in the environment, compoundedby the close interrelationship of many species. If, for example, somethingwere to happen to destroy much of the plankton in the oceans, then the oxy-gen content of our planet would drop, affecting even organisms not living inthe oceans. Such a change would probably lead to a mass extinction.
MISCONCEPTIONS ABOUT EVOLUTION
Evolution is a frequently misunderstood subject. Many of our basic ideas re-garding evolution are misconceptions that have become part of the generalculture. The often used phrase “survival of the fittest” conjures up images thatare sometimes at odds with the actual findings of evolutionary science. It iscommon for such misconceptions to continue even after initial exposure toevolutionary theory.
The Nature of SelectionMany people have a basic understanding of the general principles of naturalselection. The problem lies in our misinterpretation of the nature of naturalselection.
104 PART I ■ Evolutionary Background
mass extinction Manyspecies becoming extinct atabout the same time.
I I I I I I I

Relethford: The Human Species: An Introduction to Biological Anthropology, 5/e
I. Evolutionary Background 4. The Origin and Evolution of Species
© The McGraw−Hill Companies, 2003
Misconception: Bigger Is Better A common misconception is that naturalselection will always lead to larger structures. According to this idea, the big-ger the brain, the better, and the bigger the body, the better. At first, this ideaseems reasonable. After all, larger individuals may be more likely to survivebecause they can compete more successfully for food and sexual partners.Therefore, larger individuals are more likely to survive and pass their geneson to the next generation. Natural selection is expected to lead to an increasein the size of the body, brain, and other structures. However, this isn’t alwaystrue. There are numerous examples of species in which smaller body size orstructures were more adaptive and selected for. Keep in mind that in evolu-tion nothing is free. A larger body may be more adaptive because of sheersize, but a larger body also has greater energy needs. Any advantage gainedby a larger body may be offset by the disadvantage of needing more food.What we have to focus on is a balance between the adaptive and nonadaptive
105
S P E C I A L T O P I C
Science Fiction and OrthogenesisEvolution, especially human evolution, is a commontheme in science fiction. Although a good many sciencefiction stories have a strong scientific base, others—mostlikely due to plot needs—do not. Even these stories,though, are valuable in terms of what they tell us aboutmisconceptions about evolution, one of the themes ofthis chapter.
A personal favorite of mine is an episode of the1960s science fiction television show The Outer Limits. Theepisode, entitled “The Sixth Finger,” is an entertainingtreatment of a popular science fiction question: What willhumans evolve into? The story, aired in 1963, begins witha young coal miner, Gwyllm Griffiths, who yearns forsomething more than a life of manual labor. Through his girlfriend, Cathy, he meets a local scientist, Profes-sor Mathers, who had once worked on an atomic bombproject. Because of guilt, the scientist is seeking an end to violence and war—through evolution. Reasoning thathumans will someday evolve beyond the need for vio-lence, and tormented by the “slow pace of evolution,”Mathers invents a machine that will move an organisminto its own predestined evolutionary future.
Gwyllm volunteers as a human subject, and theresults are predictable. With each exposure to the ma-chine, his head and brain increase in size, as does hisintelligence. Additionally, he “evolves” a sixth finger (for“increased dexterity”) and assorted mental powers (thesixth finger is particularly interesting because some peo-ple today are born with a sixth finger, and there does notappear to be any evolutionary advantage). Gwyllm alsodevelops a dislike for the people around him and eventu-
ally decides to destroy them. On his way to demolish thetown with his mental powers, he suddenly “evolves be-yond the need for violence.” He returns to the professor’slaboratory and enlists the help of Cathy to operate themachinery while he evolves into “the man of the future.”Once Gwyllm is in the machine’s chamber, Cathy cannotbear to lose him forever and pushes the machine’s leverto “Backward” rather than “Forward.” For a brief mo-ment she pushes too much and the viewer sees Gwyllmevolve back to some sort of subhuman ape, but she quicklycorrects the lever and they live happily ever after (in onealternate ending, the script called for Gwyllm to continueevolving back to protoplasm) (Schow and Frentzen 1986).
This episode is quite entertaining and also providessome good examples of evolutionary misconceptions. Forexample, the doctrine of orthogenesis, the notion thatevolution follows a particular path, is central to the entireplot. This message is not subtle—at one point, Gwyllmspeaks about “the goal of evolution.” The professor’smachine embodies the idea of orthogenesis, with its levermarked “Forward” and “Backward,” implying that all oflife evolves along a fixed path from past to present. Or-thogenesis is also apparent in the continued expansion of the brain and mental powers as Gwyllm evolves “for-ward,” enabling him to read massive volumes at a glanceand become a concert pianist overnight.
Despite the scientific inaccuracies, “The Sixth Fin-ger” remains a captivating story. It was also somewhatcontroversial in that it dealt, on television, with evolution,a theme that had drawn criticism from the network’scensor.

Relethford: The Human Species: An Introduction to Biological Anthropology, 5/e
I. Evolutionary Background 4. The Origin and Evolution of Species
© The McGraw−Hill Companies, 2003
aspects of any biological characteristic. By walking upright, humans have theirhands free, which is rather advantageous. However, we pay the price withvaricose veins, back pain, fallen arches, and other nonadaptive consequencesof walking on two legs. Again, we need to focus on the relative costs and ben-efits of any evolutionary change. Of course, this balance will vary in differentenvironments.
Misconception: Newer Is Better There is a tendency to believe that traitsmore recent in origin are superior because they are newer. Humans walk ontwo legs, a trait that appeared close to 6 million years ago. We also have fivedigits (fingers and toes) that date back many hundreds of millions of years.Is upright walking better because it is newer? Of course not. Both featuresare essential to our toolmaking way of life. The age of a structure has no bear-ing on its usefulness.
Misconception: Natural Selection Always Works The idea that naturalselection will always provide an opportunity for some members of a speciesto survive is not accurate. Occasionally I have heard statements such as “wewill evolve to tolerate air pollution.” Such statements are absurdities. Nat-ural selection only operates on variations that are present. If no genetic vari-ation occurs to aid in breathing polluted air, natural selection will not helpus. Even in cases where genetic variation is present, the environment maychange too quickly for us to respond through natural selection. All we haveto do is to examine the fossil record to see how inaccurate this misconcep-tion is—that 99 percent of all past species are extinct shows us that naturalselection obviously doesn’t always work!
Misconception: There Is an Inevitable Direction in Evolution An idea pop-ular in the nineteenth century was orthogenesis, the notion that evolutionwould continue in a given direction because of a vaguely defined nonphysical“force” (Mayr 1982). As an alternative to the theory of natural selection, or-thogenesis suggested that evolutionary change would continue in the samedirection until either a perfect structure was attained or a species became ex-tinct. Apart from the problems of dealing with metaphysical “forces,” ortho-genesis has long been rejected by analysis of the fossil record and the tri-umph of natural selection as an explanatory mechanism for evolutionarychange. Some of its basic notions, however, are still perpetuated. A commonbelief is that humans will evolve larger and larger brains, as a continuationof earlier trends (Figure 4.5). The view of orthogenesis is tied in with notionsof “progress” and with the misconception that bigger is better. There are manyexamples from the fossil record of nonlinear change and many examples ofreversals in sizes of structures. In the case of human evolution, brains actu-ally stopped getting larger 50,000 years ago. In fact, the average brain size ofhumans since that time has decreased slightly as a consequence of a generaldecrease in skeletal size and ruggedness (Henneberg 1988).
Is it possible for a trend to continue to change in a given direction underthe right circumstances? Of course, but change comes through the action of
106 PART I ■ Evolutionary Background
orthogenesis A discreditedidea that evolution wouldcontinue in a given directionbecause of some vaguelydefined “force.”
I I I I I I I

Relethford: The Human Species: An Introduction to Biological Anthropology, 5/e
I. Evolutionary Background 4. The Origin and Evolution of Species
© The McGraw−Hill Companies, 2003
natural selection, not some mysterious internal force. Continuation of anytrend depends on the environment, present genetic variation, and basic bio-logical limits. (A 50-foot spider can’t exist because it wouldn’t be able to ab-sorb enough oxygen for its volume.) Such change also depends on the rela-tive cost and benefits of change. Suppose that an increase in human brain sizewas combined somehow with an increase in pelvic size (assuming geneticvariation was present for both features). A larger pelvis would make walkingdifficult or even impossible. Evolution works on the entire organism and notone trait at a time. Any change can have both positive and negative effects,but it is the net balance that is critical to the operation of natural selection.
Structure, Function, and EvolutionA number of misconceptions about evolution focus on the relationship be-tween biological structures and their adaptive (or nonadaptive) functions.
Misconception: Natural Selection Always Produces Perfect StructuresThere is a tendency to view nature as the product of perfect natural engi-neering. Granted, there are many marvelous and wondrous phenomena inthe natural world, but a closer examination shows that biological structuresare often far from perfect. Consider human beings. Is the human body per-fect? Hardly. Just to note one aspect, consider your skeleton when you standupright. What is holding in your internal organs? Skin and muscles. Your ribcage provides little support for lower internal organs because it reflects an-cestry from a four-legged form. When humans stood up (adaptive), the ribcage offered less support. The result—a variety of complaints and complica-tions, such as hernias. The human skeleton is not perfect but rather is the re-sult of natural selection operating on the variation that was present.
Misconception: All Structures Are Adaptive Natural selection is such apowerful model that it is tempting to apply it to all biological structures. In-deed, many anthropologists and biologists have done so. They examine astructure and explain its function in terms of natural selection. Are all struc-tures adaptive? Many structures simply reflect a by-product of other biologi-cal changes and have no adaptive value of their own (Gould and Lewontin1979). Other structures, such as the human appendix, may have served afunction in the past but appear to have no present function.
A classic example of a presumably nonadaptive trait is the chin of mod-ern human beings. The jutting chin is relatively modern (see Chapter 14).Earlier forms of Homo sapiens lacked the jutting chin in most cases. Accord-ing to a strict adaptationist perspective, we would become concerned withthe function of the jutting chin and attempt to explain it in terms of naturalselection. Actually, the jutting chin is simply a by-product of different growthpatterns in the human face and jaw. When the face receded, the lower jaw,under a different pattern of growth, stayed at its previous size. The result—ajutting chin that has nothing to do with adaptive value, except as a by-prod-uct of adaptive changes in the rest of the face.
CHAPTER 4 ■ The Origin and Evolution of Species 107
FIGURE 4.5
The theory of orthogenesispredicts continued change in agiven direction. Illustrated hereis the popular but incorrectnotion that humans in thefuture will have progressivelylarger brains.

Relethford: The Human Species: An Introduction to Biological Anthropology, 5/e
I. Evolutionary Background 4. The Origin and Evolution of Species
© The McGraw−Hill Companies, 2003
Another example deals with an old question: “Why do human men havenipples?” Earlier explanations suggesting that in ancient times men couldassist women in breast feeding are ludicrous. The true explanation is simple.Both male and female develop from the same basic body plan during the em-bryonic stage of prenatal life. Under the influence of sex hormones, variousstructures develop in different ways (just as the same structure develops intoa penis in men and a clitoris in women). The basic body plan for nipples ispresent in both sexes; for women, these structures develop into breasts capa-ble of lactation. In men, nipples serve no functional purpose. Thus, malenipples are a by-product of the fact that males and females share a similardevelopmental path and not the result of some adaptive value (Gould 1991).
Misconception: Current Structures Always Reflect Initial AdaptationsThe idea here is that any given structure, with an associated function, origi-nally evolved specifically for that function. Human beings, for example, walkon two legs; this allows them to hold tools and other objects that are con-structed with the aid of an enlarged brain. Although it is tempting to saythat both upright walking and a larger brain evolved at the same time be-cause of the adaptive value of having both structures, this is not what hap-pened. Upright walking evolved roughly 3.5 million years before the use ofstone tools and the expansion of the brain (Chapter 12).
As another example, consider your fingers. You have five of these digitson each hand, which enable you to perform a variety of manipulative tasks.Humans use their hands to manipulate both natural and human-made ob-jects. Manipulative digits are essential to our nature as tool-using creatures.We might therefore suggest that our grasping hands first evolved to meet thisneed; this is not the case. Grasping hands first developed in early primate an-cestors to meet the needs of living in the trees (Chapter 11). Even though wedon’t live in trees, we have retained this trait and use it for a different purpose.Natural selection operates on the variation that is present. Structures are fre-quently modified for different uses.
A BRIEF HISTORY OF LIFE
The remainder of this book will deal with the biological variation and evolu-tion of humans and their close relatives. This section provides some briefbackground on the history of life on our planet.
Perspectives on Geologic TimeWe lose sight of the immense age of the universe (roughly 15 billion years)and earth (4.6 billion years) because we are not used to dealing with suchlarge numbers. To many people, the difference between a million and a bil-lion does not seem great because both numbers are so extremely large. Theastronomer Carl Sagan (1977) used an analogy he called the “Cosmic Calen-dar” to help put these dates into perspective. Imagine the entire history of
108 PART I ■ Evolutionary Background
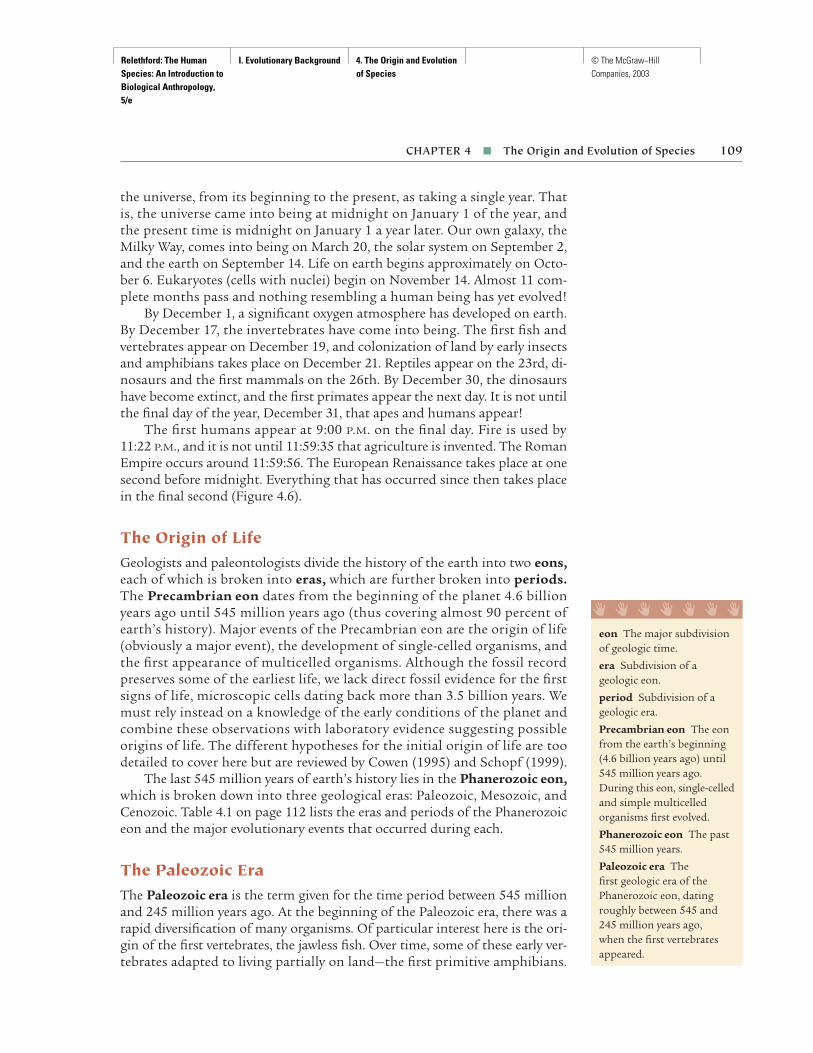
Relethford: The Human Species: An Introduction to Biological Anthropology, 5/e
I. Evolutionary Background 4. The Origin and Evolution of Species
© The McGraw−Hill Companies, 2003
the universe, from its beginning to the present, as taking a single year. Thatis, the universe came into being at midnight on January 1 of the year, andthe present time is midnight on January 1 a year later. Our own galaxy, theMilky Way, comes into being on March 20, the solar system on September 2,and the earth on September 14. Life on earth begins approximately on Octo-ber 6. Eukaryotes (cells with nuclei) begin on November 14. Almost 11 com-plete months pass and nothing resembling a human being has yet evolved!
By December 1, a significant oxygen atmosphere has developed on earth.By December 17, the invertebrates have come into being. The first fish andvertebrates appear on December 19, and colonization of land by early insectsand amphibians takes place on December 21. Reptiles appear on the 23rd, di-nosaurs and the first mammals on the 26th. By December 30, the dinosaurshave become extinct, and the first primates appear the next day. It is not untilthe final day of the year, December 31, that apes and humans appear!
The first humans appear at 9:00 P.M. on the final day. Fire is used by 11:22 P.M., and it is not until 11:59:35 that agriculture is invented. The RomanEmpire occurs around 11:59:56. The European Renaissance takes place at onesecond before midnight. Everything that has occurred since then takes placein the final second (Figure 4.6).
The Origin of LifeGeologists and paleontologists divide the history of the earth into two eons,each of which is broken into eras, which are further broken into periods.The Precambrian eon dates from the beginning of the planet 4.6 billionyears ago until 545 million years ago (thus covering almost 90 percent ofearth’s history). Major events of the Precambrian eon are the origin of life(obviously a major event), the development of single-celled organisms, andthe first appearance of multicelled organisms. Although the fossil recordpreserves some of the earliest life, we lack direct fossil evidence for the firstsigns of life, microscopic cells dating back more than 3.5 billion years. Wemust rely instead on a knowledge of the early conditions of the planet andcombine these observations with laboratory evidence suggesting possibleorigins of life. The different hypotheses for the initial origin of life are toodetailed to cover here but are reviewed by Cowen (1995) and Schopf (1999).
The last 545 million years of earth’s history lies in the Phanerozoic eon,which is broken down into three geological eras: Paleozoic, Mesozoic, andCenozoic. Table 4.1 on page 112 lists the eras and periods of the Phanerozoiceon and the major evolutionary events that occurred during each.
The Paleozoic EraThe Paleozoic era is the term given for the time period between 545 millionand 245 million years ago. At the beginning of the Paleozoic era, there was arapid diversification of many organisms. Of particular interest here is the ori-gin of the first vertebrates, the jawless fish. Over time, some of these early ver-tebrates adapted to living partially on land—the first primitive amphibians.
CHAPTER 4 ■ The Origin and Evolution of Species 109
eon The major subdivisionof geologic time.
era Subdivision of ageologic eon.
period Subdivision of ageologic era.
Precambrian eon The eonfrom the earth’s beginning(4.6 billion years ago) until545 million years ago.During this eon, single-celledand simple multicelledorganisms first evolved.
Phanerozoic eon The past545 million years.
Paleozoic era The first geologic era of thePhanerozoic eon, datingroughly between 545 and245 million years ago, when the first vertebratesappeared.
I I I I I I I

Relethford: The Human Species: An Introduction to Biological Anthropology, 5/e
I. Evolutionary Background 4. The Origin and Evolution of Species
© The McGraw−Hill Companies, 2003
Later in the Paleozoic era, complete adaptation to living on land occurred inthe first primitive reptiles. The evolutionary changes that allowed coloniza-tion of the land are too detailed to discuss here but can be found in any cur-rent treatment of the fossil record (e.g., Cowen 1995).
Mammals (and birds) eventually evolved from reptiles. The evolution ofmammals from reptiles suggests an intermediate form of animal. To many,an intermediate form implies some sort of “missing link,” or a creature witha mixture of modern reptilian and mammalian features. This is an incorrectview of evolution. Modern reptiles and mammals represent millions of yearsof evolution from a common ancestor. The first reptiles did not look exactlylike modern-day reptiles. In fact, some of the earliest primitive reptiles in-cluded a group referred to as the therapsids, or mammal-like reptiles. By theend of the Paleozoic era, reptiles had begun evolution in two different direc-tions. One group ultimately led to modern-day reptiles, as well as dinosaursand birds. The other group was the mammal-like reptiles.
The therapsids are classified as reptiles because they have more featuresthat we would call reptilian. However, they also possessed certain mammalianfeatures, such as different types of teeth (see Chapter 8). We therefore callthem, for lack of a better term, mammal-like reptiles. Therapsids underwentan adaptive radiation during the Permian period of the Paleozoic era, with awide variety of shapes and sizes emerging.
110 PART I ■ Evolutionary Background
FIGURE 4.6
Carl Sagan’s “CosmicCalendar.” The history of the universe is compressed intoa single year, with the origin of the universe happening onJanuary 1 and the present dayoccurring at midnight on thefollowing January 1. See thetext for additional dates. Thefollowing abbreviations areused: ya = years ago, Ma =millions of years ago, and Ba =billions of years ago. (Source:Sagan [1977], with recent updates)
March 20 (12 Ba):Galaxies form
September 2 (5 Ba):Formation of our solar system
September 14 (4.5 Ba):Earth formed
October 6 (3.6 Ba):Life established, first fossils,photosynthesis (?)
November 14 (2 Ba):Complex single cells
November 19 (1.8 Ba): Free oxygen
November 21 (1.7 Ba):Evidence of multicellular organisms (?)
January 1 (15 Ba): Big Bang
1 minute 30,000 years1 hour 1.75 million years1 day 42 million years
therapsid An early groupof mammal-like reptiles;therapsids were the ancestorsof later mammals.
I I I I I I I

Relethford: The Human Species: An Introduction to Biological Anthropology, 5/e
I. Evolutionary Background 4. The Origin and Evolution of Species
© The McGraw−Hill Companies, 2003
CHAPTER 4 ■ The Origin and Evolution of Species 111
1:00 A.M. (40 Ma): First monkeys
11:00 A.M. (23 Ma): First apes
9:00 P.M. (5–6 Ma): First hominids
10:30 P.M. (2.5 Ma): First stone tools
11:22 P.M. (0.5 Ma): First use of fire
11:59 P.M. (30,000 ya): Cave paintings
11:59:35 P.M. (12,000 ya): Farming
11:59:55 P.M. (2,000 ya): Common Era begins
11:59:59 P.M. (500 ya): Renaissance

Relethford: The Human Species: An Introduction to Biological Anthropology, 5/e
I. Evolutionary Background 4. The Origin and Evolution of Species
© The McGraw−Hill Companies, 2003
The dental adaptations of the therapsids were well suited to life on land,allowing them to forage and hunt. Although this group was highly success-ful, they ultimately declined following an adaptive radiation of dinosaursduring the Mesozoic era.
The Mesozoic EraThe Mesozoic era, lasting from 245 million to 65 million years ago, is oftencalled the “Age of Reptiles” because it was the time when reptiles became thedominant form of life on the earth’s surface. One of the most successfulgroups of reptiles was the dinosaurs (Figure 4.7). The major characteristic ofthe dinosaurs was the modification of the leg and pelvic structures. Many di-nosaurs were bipedal, and some appear to have been extremely quick moversand efficient walkers and runners (Wilford 1985). The therapsids, on theother hand, did not change much beyond the earliest land vertebrates exceptfor modifications in their teeth. Therapsids were not fast movers and hadfew defensive or offensive abilities. In the Permian period, they did not needsuch adaptations. The world lay open for them to colonize.
Unfortunately for the therapsids, the ancestors of the dinosaurs devel-oped quicker and more efficient locomotion, and many species further devel-oped powerful hands and teeth to capture prey. Ultimately, the dinosaursemerged as the dominant form of animal life on land, and the therapsids de-
112 PART I ■ Evolutionary Background
Mesozoic era The second geologic era of thePhanerozoic eon, datingroughly between 245 and 65 million years ago, whenthe first mammals and birds appeared.
I I I I I I I
TA B L E 4 .1 Geological Eras and Periods of the Phanerozoic Eon
Millions ofEra Period Years Ago Some Major Evolutionary Events
Cenozoic Quaternary 1.7–today Evolution of the genus HomoTertiary 65–1.8 Origin and evolution of the
primates; origin of hominidsMesozoic Cretaceous 145–65 Extinction of the dinosaurs; first
birds and placental mammalsJurassic 210–145 Dinosaurs dominate; first birdlike
reptilesTriassic 245–210 First dinosaurs; egg-laying mammals
Paleozoic Permian 290–245 Radiation of reptiles; mammal-likereptiles
Carboniferous 360–290 Radiation of amphibians; firstreptiles and insects
Devonian 410–360 Many fish; first amphibians; firstforests
Silurian 440–410 First fish with jaws; land plantsOrdovician 505–440 Early vertebrates, including jawless
fish; trilobites and many otherinvertebrates
Cambrian 545–505 “Explosion” of life; marineinvertebrates
Sources: Cowen (1995), Fleagle (1999), Schopf (1992)

Relethford: The Human Species: An Introduction to Biological Anthropology, 5/e
I. Evolutionary Background 4. The Origin and Evolution of Species
© The McGraw−Hill Companies, 2003
clined in number. Eventually the therapsids became extinct, but before thishappened some of the therapsids evolved into what we call “true mammals.”
During the Triassic period, the monotremes, or egg-laying mammals,evolved. Some, such as the platypus, have survived until the present day. Thefirst placental mammals evolved during the Jurassic period, which was theheyday of the dinosaurs. Birdlike reptiles also evolved during this time pe-riod. At the end of the Cretaceous period, the dinosaurs became extinct andmammals became the dominant animal life.
Why did the dinosaurs (and many other organisms) become extinct? Someof the more fanciful suggestions include excessive constipation because ofchanges in plant life. Most theories of dinosaur extinction rely on environ-mental change, such as the cooling of the earth. If the temperature dropped,then the warm-blooded mammals would seem to be better adapted than thecold-blooded reptiles. A problem with this idea is that there is evidence thatat least some of the dinosaurs were warm-blooded. Recent explanations ofdinosaur extinction have relied on the idea that an asteroid or comet hit theearth with tremendous force, kicking up clouds of dust and blocking thesun. Temperatures dropped, and many plant forms became extinct. As plantsdied, so did the plant eaters and those who ate the plant eaters. In other words,the entire ecology of the planet was altered. There is considerable geologicevidence for such a catastrophic event (e.g., Sheehan et al. 1991).
The Cenozoic EraWhen the dinosaurs died out, a variety of new opportunities opened up forthe mammals, and they began a series of adaptive radiations that filled va-cant environmental niches. The last 65 million years of earth’s history is the
CHAPTER 4 ■ The Origin and Evolution of Species 113
FIGURE 4.7
Two well-known dinosaurs:Triceratops (top) andTyrannosaurus (bottom).

Relethford: The Human Species: An Introduction to Biological Anthropology, 5/e
I. Evolutionary Background 4. The Origin and Evolution of Species
© The McGraw−Hill Companies, 2003
Cenozoic era, often called the “Age of Mammals.” It is during this time thatall modern groups of mammals evolved, including the primates, the group ofmammals to which humans belong. The earliest primates appear by 50 mil-lion years ago. Early apelike primates evolve by about 20 million to 25 mil-lion years ago, and the first bipeds (early human ancestors) appear about 6 million years ago. Other changes in human evolution, such as the increasein brain size and the manufacture of stone tools, have taken place only withinthe past 2.5 million years. The history of primate and human evolution isdescribed in later chapters. For the moment, it is sufficient to simply under-stand the long span of time of earth’s history and to remember that humansare a recent evolutionary development.
SUMMARY
Macroevolution, the process of long-term evolution, can occur in two ways:anagenesis, the evolution of a single species over time, or cladogenesis, thesplitting off of one or more new species from the original parent species. Incladogenesis, new species form through the process of reproductive isolationfollowed by genetic divergence. Both steps are understood in terms of evolu-tionary forces. Reduction or elimination of gene flow provides for the begin-ning of reproductive isolation. Mutation, genetic drift, and selection can thenact on this isolation to produce a new species. The relative importance of theevolutionary forces in speciation is still debated.
Two models of macroevolutionary change can be applied to the fossilrecord. Gradualism states that most evolutionary change is the result of slowbut constant change over many generations. New species are believed to formas a by-product of natural selection operating over time. Punctuated equilib-rium states that there are long periods of time with little evolutionary change(stasis), punctuated by rapid evolutionary events. New species are seen as form-ing in small, isolated populations.
The most common evolutionary pattern is extinction. Some scientistshave argued that the evolutionary record is best understood as the process ofnew species forming from old, with many species becoming extinct. The evo-lutionary trends we observe in the fossil record may reflect the differentialsurvival of species with certain adaptations.
There are many misconceptions regarding natural selection and evolu-tion. Some of the more common of these are that bigger is better, that neweris better, that natural selection always works, and that there is an inevitabledirection to natural selection. There are also misconceptions regarding therelationship of biological structures, their functions, and their evolutionaryorigin.
Life on earth began following a period of chemical evolution. The earli-est life forms evolved in ancient oceans. The first vertebrates were the jawlessfish, which evolved into fish with jaws. One group of jawed fish, the lobe-fins,were the ancestors of all later land vertebrates. After the amphibians con-quered the land, an adaptive radiation of reptiles fully adapted to land con-ditions began. One of the first sort of reptiles was the therapsids, or mammal-
114 PART I ■ Evolutionary Background
Cenozoic era The third,and most recent, geologicera of the Phanerozoic eon,dating roughly to the last 65 million years. The firstprimates appeared duringthe Cenozoic era.
I I I I I I I
Relethford: The Human Species: An Introduction to Biological Anthropology, 5/e
I. Evolutionary Background 4. The Origin and Evolution of Species
© The McGraw−Hill Companies, 2003
like reptiles. These forms possessed certain dental traits that allowed themto exploit new types of food. The later adaptive radiation of the dinosaurs ul-timately led to the extinction of the therapsids. Before they disappeared, how-ever, some therapsids evolved into the first true mammals. For millions ofyears, the dinosaurs were the dominant land animals and the mammals ex-isted in the fringe environmental niche of arboreal nocturnal life. When the di-nosaurs disappeared during the mass extinction at the end of the Mesozoicera, the mammals had the opportunity to expand into newly available niches.
SUPPLEMENTAL READINGS
Cowen, R. 1995. History of Life. 2d ed. Boston: Blackwell Scientific Publications. An up-to-date and very thorough review of the fossil record from the origins of life to the present.
Futuyma, D. J. 1997. Evolutionary Biology. 3d ed. Sunderland, Mass.: Sinauer Associates. Acomprehensive treatment of evolutionary theory and the history of life.
Schopf, J. W. 1999. Cradle of Life: The Discovery of Earth’s Earliest Fossils. Princeton: PrincetonUniversity Press. A highly readable summary of the fossil evidence for the earliest lifeon our planet and a discussion of different models of the origin of life.
INTERNET RESOURCES
http://www.talkorigins.org/faqs/faq-intro-to-biology.htmlIntroduction to Evolutionary Biology, a review of microevolution andmacroevolution.
http://anthro.palomar.edu/synthetic/synth_9.htmMicro and Macro Evolution, a tutorial on evolutionary theory with an em-phasis on speciation.
http://www.talkorigins.org/faqs/punc-eq.htmlPunctuated Equilibria, a summary of the model, including discussion of somecommon misinterpretations.
http://seaborg.nmu.edu/earth/Life.htmlA Pictorial History of Life on Earth, a Web page with many links organizedaround geologic eras and periods.
CHAPTER 4 ■ The Origin and Evolution of Species 115
Relethford: The Human Species: An Introduction to Biological Anthropology, 5/e
II. Human Biological Variation
Introduction © The McGraw−Hill Companies, 2003
PA R T II
HumanBiologicalVariation
How and why are human beings different from oneanother? We all encounter biological variation (diver-sity) every day of our lives. Some people are taller thanothers or have rounder heads or lighter skin color. Ad-ditional diversity exists in many genetic traits that arenot visible to the naked eye, such as blood groups andDNA sequences. Biological anthropologists are inter-ested in describing and explaining such variation. Afterreading the previous four chapters, it should come asno surprise to you that biological anthropologists ex-amine diversity from an evolutionary perspective. Thevariation that we see in living humans is a reflection ofpast evolutionary events. Furthermore, the study ofbiological variation provides us with a context withinwhich to judge variation in the past (see Parts III andIV). Chapter 5 describes the different data and meth-ods used by biological anthropologists to study hu-man diversity. Chapter 6 provides a number of casestudies of human microevolution that illustrate howwe draw evolutionary conclusions from data from liv-ing peoples. Finally, Chapter 7 examines biological di-versity from the perspective of biocultural adaptation.

Relethford: The Human Species: An Introduction to Biological Anthropology, 5/e
II. Human Biological Variation
5. The Study of Human Variation
© The McGraw−Hill Companies, 2003
C H A P T E R 5The Study of Human Variation
119
Every day we encounter human biological diversity (Figure 5.1), but we sel-dom speak of what we see in evolutionary terms. On a day-to-day basis,
most people think about variation in terms of the widely used but impreciseword race. People are often surprised to learn that anthropologists todaylook at variation in terms of evolutionary forces and are not concerned (ex-cept in a historical sense) with race or racial classifications. Race is a descrip-tive concept and not an analytic tool. At best, it provides a crude and oftenmisleading label for variation and explains nothing.
However, because the concept of race is so ingrained in society and struc-tures many of our ideas on variation, we need to review exactly what race isand is not. Throughout much of this chapter, then, we review the concept ofrace and then examine the evolutionary alternative. As we shall see, the evo-lutionary forces discussed in Chapter 3 form the basis for our understandingof the patterns and causes of human biological variation.
MEASURING HUMAN VARIATION
Exactly what are we talking about? Whether we approach human variationfrom a racial perspective or an evolutionary perspective, we need to know whatwe mean by “human variation.” Variation, of course, means the differences
Lapp people of northern Europe during the spring migration of their reindeerherd. The Lapps are genetically similar to populations in both Europe andAsia. Human variation and the biological relationship between differentgroups of humans and their origin has long been a focus of biologicalanthropology. (© George F. Mobley/National Geographic Society Image Collection)
▲
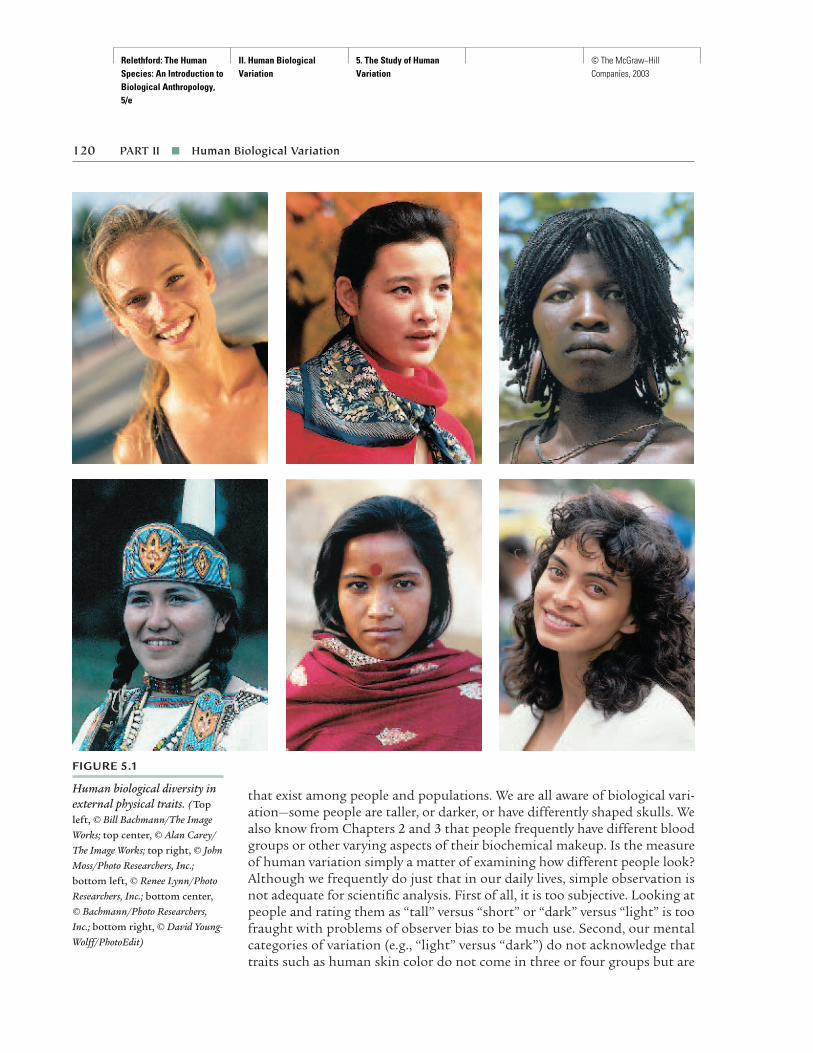
Relethford: The Human Species: An Introduction to Biological Anthropology, 5/e
II. Human Biological Variation
5. The Study of Human Variation
© The McGraw−Hill Companies, 2003
120 PART II ■ Human Biological Variation
that exist among people and populations. We are all aware of biological vari-ation—some people are taller, or darker, or have differently shaped skulls. Wealso know from Chapters 2 and 3 that people frequently have different bloodgroups or other varying aspects of their biochemical makeup. Is the measureof human variation simply a matter of examining how different people look?Although we frequently do just that in our daily lives, simple observation isnot adequate for scientific analysis. First of all, it is too subjective. Looking atpeople and rating them as “tall” versus “short” or “dark” versus “light” is toofraught with problems of observer bias to be much use. Second, our mentalcategories of variation (e.g., “light” versus “dark”) do not acknowledge thattraits such as human skin color do not come in three or four groups but are
FIGURE 5.1
Human biological diversity inexternal physical traits. (Topleft, © Bill Bachmann/The ImageWorks; top center, © Alan Carey/The Image Works; top right, © JohnMoss/Photo Researchers, Inc.;bottom left, © Renee Lynn/PhotoResearchers, Inc.; bottom center,© Bachmann/Photo Researchers,Inc.; bottom right, © David Young-Wolff/PhotoEdit)
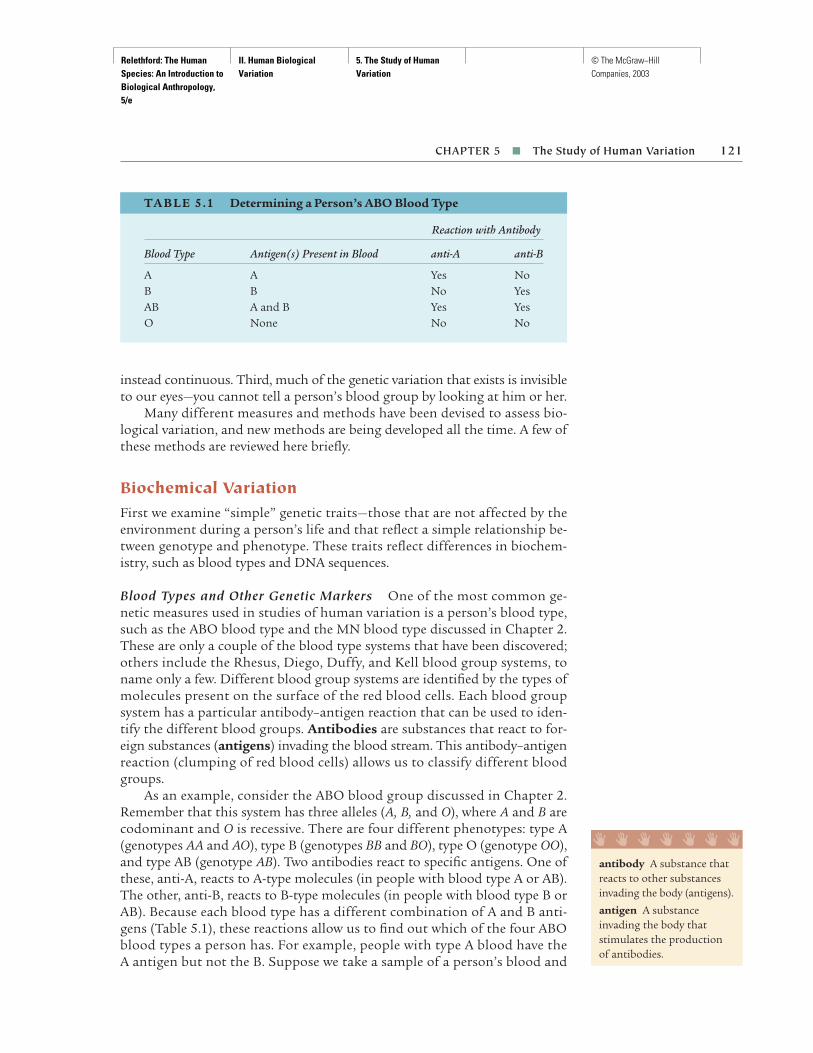
Relethford: The Human Species: An Introduction to Biological Anthropology, 5/e
II. Human Biological Variation
5. The Study of Human Variation
© The McGraw−Hill Companies, 2003
instead continuous. Third, much of the genetic variation that exists is invisibleto our eyes—you cannot tell a person’s blood group by looking at him or her.
Many different measures and methods have been devised to assess bio-logical variation, and new methods are being developed all the time. A few ofthese methods are reviewed here briefly.
Biochemical VariationFirst we examine “simple” genetic traits—those that are not affected by theenvironment during a person’s life and that reflect a simple relationship be-tween genotype and phenotype. These traits reflect differences in biochem-istry, such as blood types and DNA sequences.
Blood Types and Other Genetic Markers One of the most common ge-netic measures used in studies of human variation is a person’s blood type,such as the ABO blood type and the MN blood type discussed in Chapter 2.These are only a couple of the blood type systems that have been discovered;others include the Rhesus, Diego, Duffy, and Kell blood group systems, toname only a few. Different blood group systems are identified by the types ofmolecules present on the surface of the red blood cells. Each blood groupsystem has a particular antibody–antigen reaction that can be used to iden-tify the different blood groups. Antibodies are substances that react to for-eign substances (antigens) invading the blood stream. This antibody–antigenreaction (clumping of red blood cells) allows us to classify different bloodgroups.
As an example, consider the ABO blood group discussed in Chapter 2.Remember that this system has three alleles (A, B, and O), where A and B arecodominant and O is recessive. There are four different phenotypes: type A(genotypes AA and AO), type B (genotypes BB and BO), type O (genotype OO),and type AB (genotype AB). Two antibodies react to specific antigens. One ofthese, anti-A, reacts to A-type molecules (in people with blood type A or AB).The other, anti-B, reacts to B-type molecules (in people with blood type B orAB). Because each blood type has a different combination of A and B anti-gens (Table 5.1), these reactions allow us to find out which of the four ABOblood types a person has. For example, people with type A blood have the A antigen but not the B. Suppose we take a sample of a person’s blood and
CHAPTER 5 ■ The Study of Human Variation 121
TA B L E 5 .1 Determining a Person’s ABO Blood Type
Reaction with Antibody
Blood Type Antigen(s) Present in Blood anti-A anti-B
A A Yes NoB B No YesAB A and B Yes YesO None No No
antibody A substance thatreacts to other substancesinvading the body (antigens).
antigen A substanceinvading the body thatstimulates the productionof antibodies.
I I I I I I I

Relethford: The Human Species: An Introduction to Biological Anthropology, 5/e
II. Human Biological Variation
5. The Study of Human Variation
© The McGraw−Hill Companies, 2003
find that the blood clumps when exposed to anti-A antibodies but not whenexposed to anti-B antibodies. This means the person has A antigens but notB antigens and therefore has type A blood. The same basic method (althoughsometimes more complex) is used for determining the phenotypes of otherblood group systems.
In addition to red blood cell groups, genetic analyses have been done onmany populations for red blood cell enzymes and proteins and for proteinsin blood serum (the fluid part of the blood). One method used for detectingvariants of such traits is electrophoresis. With this method, blood samplesare placed on a gel that is electrically charged. Proteins move along the flowof electrons from negative to positive, and some proteins move at faster rates.This difference in movement allows us to determine a person’s genotype.
DNA Analysis Many new methods focus on the direct examination of se-quences of DNA that can be extracted from body tissues (Figure 5.2). Onemethod of DNA analysis focuses on restriction fragment length polymor-phisms (RFLPs). Certain enzymes produced by different species of bacteria,known as restriction enzymes, bind to sections of DNA and cut the DNA se-quence at a given point. A difference in a person’s DNA sequence will changethe location where it is cut, and hence change the length of the DNA frag-ment (White and Lalouel 1988). Differences in the length of DNA sequencesprovide us with yet another measure of human variation.
A recent development in genetics is the analysis of noncoding DNA se-quences that are repeated. One example is microsatellite DNA, which con-sists of repeated short sections of DNA (2–5 bases). One type of analysis countsthe number of repeats. For example, the DNA sequence CACACACACA con-tains five repeats of the CA sequence, and the DNA sequence CACACA con-
122 PART II ■ Human Biological Variation
FIGURE 5.2
Dr. Michael Crawfordcollecting hair samples fromthe Evenki, a group of reindeerherders in Siberia. DNA can be extracted from hair samples.(Courtesy of Michael Crawford)
electrophoresis Alaboratory method that useselectric current to separateproteins, allowing genotypeto be determined.
restriction fragment lengthpolymorphism (RFLP)A genetic trait defined interms of the length of DNAfragments produced whencertain enzymes cut theDNA sequence.
microsatellite DNARepeated short sequences ofDNA; the number of repeatsis highly variable.
I I I I I I I

Relethford: The Human Species: An Introduction to Biological Anthropology, 5/e
II. Human Biological Variation
5. The Study of Human Variation
© The McGraw−Hill Companies, 2003
tains three repeats. The number of such repeats is highly variable and of usein detecting population relationships (e.g., Jorde et al. 1997).
Another interesting method of analysis focuses on Alu insertions, whichare short DNA sequences that have replicated and moved to different loca-tions on different chromosomes. It is estimated that roughly 5 percent ofhuman DNA consists of these repeated elements (Stoneking et al. 1997).Polymorphisms are identified by noting the presence or absence of an Alu in-sertion at a given chromosome location. This trait has proven useful in analy-ses of human population history.
Recent investigations in genetics have focused on single-nucleotidepolymorphisms (SNPs), loci where DNA sequences differ by one base. Forexample, consider the following two DNA sequences:
Sequence 1: GAACCTTTASequence 2: GAATCTTTA
These two sequences differ in the fourth position, where sequence 1 has a Cand sequence 2 has a T. Preliminary results from the Human Genome Projectestimate that there are between 1.4 million and 2.1 million SNPs in thehuman genome, much within noncoding DNA (International Human Ge-nome Sequencing Consortium 2001; Venter et al. 2001). The existence of somany SNPs provides geneticists with the ability to map the genome and lookfor linkages with a number of traits, including genes that might influencedisease susceptibility.
Geneticists and anthropologists also compare entire DNA sequences acrossindividuals and populations. One method of analysis consists of examiningthe “mismatch,” the number of differences between sequences. Consider, forexample, the following DNA sequences from three different individuals:
Individual 1 GGTGGTGAATCCIndividual 2 GGTCGTGAATCCIndividual 3 GGTGGTGTTTCC
If you look closely at each sequence, you will see that individual 1 and indi-vidual 2 differ at one position. Further, individual 1 and 3 differ by two posi-tions, and individuals 2 and 3 differ by three positions. From such compar-isons (performed on much longer sequences), we can make inferences regardinggenetic similarity and the evolutionary history of DNA sequences.
One genetic locus that has been important in the debate over modernhuman origins (which will be covered in Chapter 14) is mitochondrial DNA.As discussed in Chapter 2, almost all of our DNA is contained in the chro-mosomes within the nuclei of our cells. Mitochondrial DNA (mtDNA) is anexception—it is a small section of DNA that exists within the mitochondrion,a part of the cell outside of the nucleus that is involved in energy production.Mitochondrial DNA is particularly interesting because of its mode of inheri-tance. For most traits both parents contribute genetically to the child. FormtDNA, however, only the female contributes genetically (Stoneking 1993).This happens because female sex cells contain mitochondria, whereas male
CHAPTER 5 ■ The Study of Human Variation 123
Alu insertion A sequenceof DNA repeated atdifferent locations ondifferent chromosomes.
single-nucleotidepolymorphisms (SNPs)Specific positions in a DNAsequence that differ at onebase. For example, the DNAsequences CCTGAA andCCCGAA differ in the thirdposition—one sequence hasthe base T and the other thebase C.
mitochondrial DNA Asmall amount of DNA that islocated in the mitochondriaof cells. Mitochondrial DNAis inherited only throughthe mother.
I I I I I I I

Relethford: The Human Species: An Introduction to Biological Anthropology, 5/e
II. Human Biological Variation
5. The Study of Human Variation
© The McGraw−Hill Companies, 2003
sex cells contain only the nucleus. In other words, mtDNA is inherited onlyfrom the mother. Your mtDNA came only from your mother, who obtainedit from her mother, and so on. You inherit the rest of your DNA from bothparents, who each inherited from two parents, and so forth. For most traits,the number of ancestors doubles every generation you go back: two parents,four grandparents, eight great-grandparents, and so forth. For mtDNA, youhave only one ancestor in any given generation. This property allows patternsof genetic relationship to be reconstructed without the complication of thegene shuffling that occurs every generation for the rest of your DNA. Similaranalyses are done with Y-chromosomes, which are inherited through the fa-ther’s line (Hammer and Zegura 1996).
Complex TraitsMany of the traits of interest in studying human variation are complex traits—those that are frequently affected by growth and the environment and that re-flect a much more complicated relationship between genotype and phenotype.
Anthropometrics Measurements of the human body, including the headand the face, are known as anthropometrics. Two of the most commonlyused anthropometric measures are height and weight (Figure 5.3). Othermeasurements of the body include the length of limbs and limb segmentsand the width of the body at different places, such as the shoulders and thehips. There are many measurements of the skull, such as the length, width,and height of the head, the relative width of the head at different points, andthe size of the nose. Anthropometrics are applied to skeletal data as well asto living people.
124 PART II ■ Human Biological Variation
FIGURE 5.3
The author measures his son’sstature. Stature and weight are two of the most commonanthropometric measures.(Photograph by Hollie Jaffe)
anthropometricsMeasurements of the humanbody, skull, and face.
I I I I I I I

Relethford: The Human Species: An Introduction to Biological Anthropology, 5/e
II. Human Biological Variation
5. The Study of Human Variation
© The McGraw−Hill Companies, 2003
Skin Color In the past, skin color was often measured by comparing a per-son’s skin to a set of standardized tiles. This method is too subjective and in-accurate, and the more common method today involves the use of a reflectancespectrophotometer—a device that measures the percentage of light reflectedback from a given source at different wavelengths. To minimize the effects oftanning, we measure skin color on the inside of the upper arm, which is gen-erally not as exposed to the sun as other parts of the body. The more lightthat is bounced back off the skin, the lighter the person is. Instead of tryingto shove people into categories such as “light” or “dark,” we can measure skincolor precisely.
Other Measures Measures of the size of the teeth are known as odonto-metrics. From a cast made of a person’s upper and lower jaws, researcherscan measure the length and width of each tooth. Finger and palm prints arealso useful in studying human variation; these measures are called dermato-glyphics. They include classification of different types of prints, as well ascounts of the number of ridge lines on each digit. In addition to all thesemeasures (and others), anthropologists often measure a variety of physio-logic traits, such as blood pressure, heart rate, and aerobic functioning.
THE RACIAL APPROACH TO VARIATION
Given all these different measures, how do we make sense of it all? Althoughwe focus today on evolutionary forces, the dominant perspective in the past,as noted earlier, was one of race and racial classification. This approach isalso used by most people today in their daily exposure to human variation. Aproblem here is that we use such words as race without defining them. Whatdo phrases like the “white race,” the “Japanese race,” and the “Jewish race”mean to you? They are extremely confusing because the term race is used tostand for a variety of factors, such as skin color, national origin, and religion.Sometimes we use the term in a biological sense, sometimes in a social sense.
The definition of race is no mere academic issue. Race is discussed dailyin the newspapers and other media. Race has been used to justify discrimi-nation and persecution of people, as well as to grant favored status. Statis-tics on race are gathered by local, state, federal, and international organiza-tions. Economic and political decisions are often based on race.
Obviously, race is an important concept in our lives. But what exactly isit? How many races are there? What are the differences between races?
The Biological Concept of RaceFrom a biological standpoint, a race is generally defined as “a division of aspecies that differs from other divisions by the frequency with which certainhereditary traits appear among its members” (Brues 1977:1). Race in this de-finition has two characteristics. First, it is a group of populations that share
CHAPTER 5 ■ The Study of Human Variation 125
odontometricsMeasurements of the size ofteeth.
dermatoglyphicsMeasurements of finger andpalm prints, including typeclassification and ridgecounts.
race A group of populationssharing certain biologicaltraits that make themdistinct from other groupsof populations. In practice,the concept of race is verydifficult to apply to patternsof human variation.
I I I I I I I
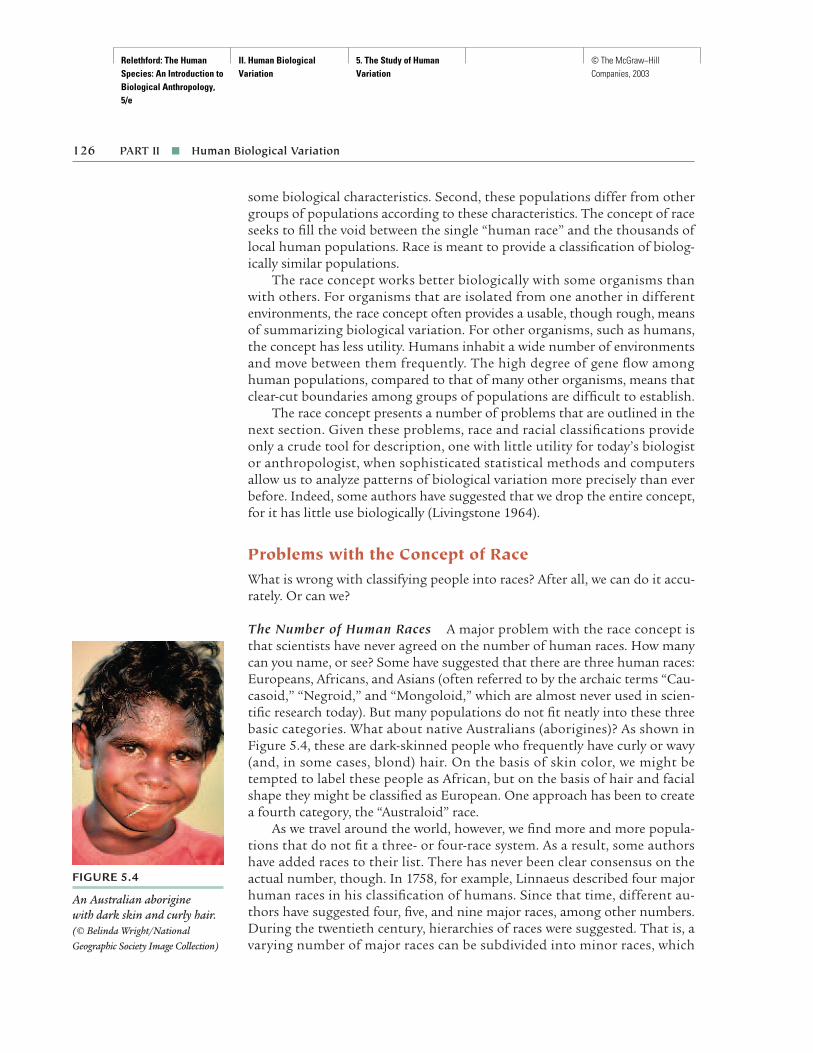
Relethford: The Human Species: An Introduction to Biological Anthropology, 5/e
II. Human Biological Variation
5. The Study of Human Variation
© The McGraw−Hill Companies, 2003
some biological characteristics. Second, these populations differ from othergroups of populations according to these characteristics. The concept of raceseeks to fill the void between the single “human race” and the thousands oflocal human populations. Race is meant to provide a classification of biolog-ically similar populations.
The race concept works better biologically with some organisms thanwith others. For organisms that are isolated from one another in differentenvironments, the race concept often provides a usable, though rough, meansof summarizing biological variation. For other organisms, such as humans,the concept has less utility. Humans inhabit a wide number of environmentsand move between them frequently. The high degree of gene flow amonghuman populations, compared to that of many other organisms, means thatclear-cut boundaries among groups of populations are difficult to establish.
The race concept presents a number of problems that are outlined in thenext section. Given these problems, race and racial classifications provideonly a crude tool for description, one with little utility for today’s biologistor anthropologist, when sophisticated statistical methods and computersallow us to analyze patterns of biological variation more precisely than everbefore. Indeed, some authors have suggested that we drop the entire concept,for it has little use biologically (Livingstone 1964).
Problems with the Concept of RaceWhat is wrong with classifying people into races? After all, we can do it accu-rately. Or can we?
The Number of Human Races A major problem with the race concept isthat scientists have never agreed on the number of human races. How manycan you name, or see? Some have suggested that there are three human races:Europeans, Africans, and Asians (often referred to by the archaic terms “Cau-casoid,” “Negroid,” and “Mongoloid,” which are almost never used in scien-tific research today). But many populations do not fit neatly into these threebasic categories. What about native Australians (aborigines)? As shown inFigure 5.4, these are dark-skinned people who frequently have curly or wavy(and, in some cases, blond) hair. On the basis of skin color, we might betempted to label these people as African, but on the basis of hair and facialshape they might be classified as European. One approach has been to createa fourth category, the “Australoid” race.
As we travel around the world, however, we find more and more popula-tions that do not fit a three- or four-race system. As a result, some authorshave added races to their list. There has never been clear consensus on theactual number, though. In 1758, for example, Linnaeus described four majorhuman races in his classification of humans. Since that time, different au-thors have suggested four, five, and nine major races, among other numbers.During the twentieth century, hierarchies of races were suggested. That is, avarying number of major races can be subdivided into minor races, which
126 PART II ■ Human Biological Variation
FIGURE 5.4
An Australian aborigine with dark skin and curly hair.(© Belinda Wright/National Geographic Society Image Collection)

Relethford: The Human Species: An Introduction to Biological Anthropology, 5/e
II. Human Biological Variation
5. The Study of Human Variation
© The McGraw−Hill Companies, 2003
are further subdivided into even smaller races. Some anthropologists havedivided “primary races” into “primary subraces” (Hooton 1946). Others havesuggested subdividing major “geographic races” into “local races,” which arefurther subdivided into “microraces” (Garn 1965). Additional populationsthat are the result of admixture, such as African Americans, are often referredto as “composite races.” In each case there has been little agreement on thenumber of races or subraces.
Two points emerge from a study of the history of attempts to classifyand apply the race concept to human populations. First, the lack of agree-ment among different researchers indicates that the entire concept of race isarbitrary as it applies to humans. If clearly discernible races existed, theirnumber should have long since been determined without argument. Howuseful is a classification system when there is so much disagreement aboutthe number of units? Second, something is being described here, although ina crude manner. All racial classifications, for example, note the wide range inskin color among human populations and further note an association withgeography. The native peoples of Africa tend to have darker skin than thoseof northern Europe. The geographic distribution of many traits, such as skincolor, is well known. Then why doesn’t the race concept work well when de-scribing biological variation?
The Nature of Continuous Variation Biological variation is real; the orderwe impose on this variation by using the concept of race is not. One reasonrace fails to describe variation accurately is that much variation is continu-ous, whereas race is a discrete unit. In other words, we must reduce variationinto a few small categories.
Consider human height as an example. Most of us cannot describe a per-son’s height to the nearest centimeter without actually measuring that per-son. When we look at someone, we are unlikely to know exactly how tall thatperson is. We would not, however, describe everyone as the same height sim-ply because we do not know the exact values. Instead, we use relative termssuch as “short,” “medium,” and “tall.” Often our definitions of these cate-gories do not agree with other people’s (many people call anyone shorterthan themselves “short” regardless of their actual height). Also, some peoplemight add categories, such as “medium tall” or “very short.” In any case,these categories have some limited use. When we say that a basketball playeris “tall,” most people know roughly how tall we mean. But are these cate-gories real? When we forget that these are only convenient crude levels forclassification, we can fall into the trap of thinking that they have a reality oftheir own. Do you actually think all people fall into one of three categories—“short,” “medium,” or “tall”? Height is a continuous trait that can have aninfinite number of values within a certain range.
The same problem applies to races. Many racial classifications in West-ern societies use skin color as a major distinguishing feature. The races cor-respond to different measures of skin color—“white,” “yellow,” “red,” “brown,”and “black,” for example. We know, however, that skin color does not fall
CHAPTER 5 ■ The Study of Human Variation 127

Relethford: The Human Species: An Introduction to Biological Anthropology, 5/e
II. Human Biological Variation
5. The Study of Human Variation
© The McGraw−Hill Companies, 2003
128 PART II ■ Human Biological Variation
FIGURE 5.5
Variation in skin color in threeselected human populations(males). Dots indicate the meanskin reflectance measured at awavelength of 685 nanometers;lines indicate 1 standarddeviation on each side of themean. Compare this withFigure 5.6, which shows morepopulations. The discontinuityin skin color shown heredisappears when more ofhumanity is sampled. (All datafrom published literature. Originalreferences listed in Relethford 1997)
Netherlands(Europe)
Jirel (Asia)
Chopi (sub-Saharan Africa)
10 30
Darker Lighter
Percentage of light reflected
50 70 90
into 5, or even 50, different categories. Skin color is a continuous variable.This means that any attempt to divide the continuous range into discreteunits (races) is going to be arbitrary.
Figure 5.5 shows the average skin reflectance for three samples of males—one from sub-Saharan Africa (Chopi), one from Asia (Jirels), and one fromEurope (the Netherlands). For each sample, the dot represents the average valueand the lines represent 1 standard deviation below and above the average. (Astandard deviation is a statistical measure of variation. Roughly 68 percentof the cases in each sample lie between the ends of the lines drawn in the fig-ure. Each sample contains some individuals who are lighter or darker.) Thesethree samples are quite distinct from one another. There is no overlap in skincolor, and it would be very easy to classify a given person into one of the threegroups based on his skin color. Isn’t this an accurate reflection of three dis-tinct races?
No. The appearance of three distinct races is a biased reflection becausehumanity is made up of more than simply these three populations. When weadd more populations to the picture, the interpretation changes. Figure 5.6shows the average skin reflectance and standard deviations for 22 male sam-ples from Africa, Asia, and Europe. Note that there are no longer discreteboundaries that can be used to identify different races. The ranges in skin re-flectance overlap one another. In other words, on the basis of skin color, it isnot possible to tell where one “race” ends and another starts. We can identifythe extremes, but there are no discrete clusters.
Despite these arguments, many people are still convinced that humanraces are easily identifiable. After all, they say, you can walk down any city streetin the United States and point out who is “white” and who is “black” (ignor-ing for the moment those people who are difficult to classify). Under suchcircumstances, race is easily identifiable (or is it?). This may be true in a lim-ited area, such as a street in a medium-sized American city, but it does nothold true when we look at the world in general. Races seem distinct in certainsituations because disproportionate numbers of peoples from different geo-
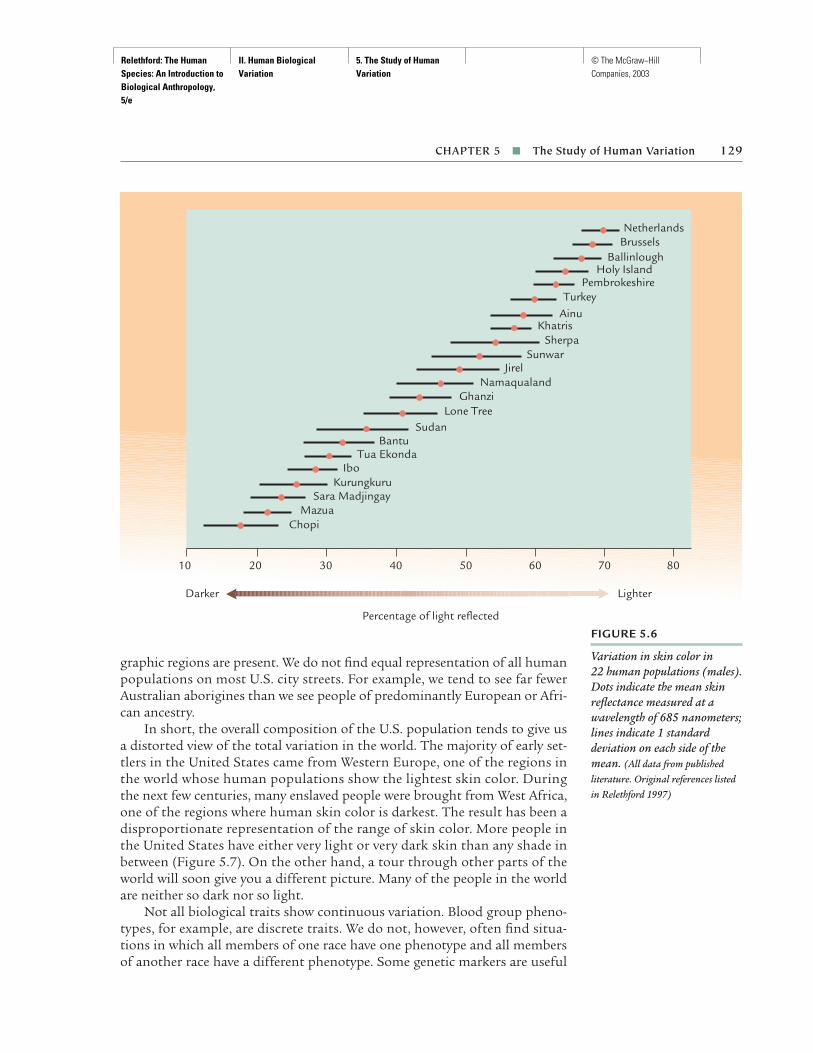
Relethford: The Human Species: An Introduction to Biological Anthropology, 5/e
II. Human Biological Variation
5. The Study of Human Variation
© The McGraw−Hill Companies, 2003
graphic regions are present. We do not find equal representation of all humanpopulations on most U.S. city streets. For example, we tend to see far fewerAustralian aborigines than we see people of predominantly European or Afri-can ancestry.
In short, the overall composition of the U.S. population tends to give usa distorted view of the total variation in the world. The majority of early set-tlers in the United States came from Western Europe, one of the regions inthe world whose human populations show the lightest skin color. Duringthe next few centuries, many enslaved people were brought from West Africa,one of the regions where human skin color is darkest. The result has been adisproportionate representation of the range of skin color. More people inthe United States have either very light or very dark skin than any shade inbetween (Figure 5.7). On the other hand, a tour through other parts of theworld will soon give you a different picture. Many of the people in the worldare neither so dark nor so light.
Not all biological traits show continuous variation. Blood group pheno-types, for example, are discrete traits. We do not, however, often find situa-tions in which all members of one race have one phenotype and all membersof another race have a different phenotype. Some genetic markers are useful
CHAPTER 5 ■ The Study of Human Variation 129
FIGURE 5.6
Variation in skin color in 22 human populations (males).Dots indicate the mean skinreflectance measured at awavelength of 685 nanometers;lines indicate 1 standarddeviation on each side of themean. (All data from publishedliterature. Original references listedin Relethford 1997)
Netherlands Brussels
BallinloughHoly Island
PembrokeshireTurkey
AinuKhatris
SherpaSunwar
JirelNamaqualand
GhanziLone Tree
SudanBantu
Tua EkondaIbo
KurungkuruSara Madjingay
MazuaChopi
10 20 30
Darker Lighter
Percentage of light reflected
40 50 60 70 80

Relethford: The Human Species: An Introduction to Biological Anthropology, 5/e
II. Human Biological Variation
5. The Study of Human Variation
© The McGraw−Hill Companies, 2003
in separating populations in certain geographic areas, but many such traitsshow patterns of variation that are not well described by racial classification.For example, the frequency of the a allele for a trait known as the Diego bloodgroup is moderately high in native South American populations, ranging upto 0.32. In both Africa and Europe, however, the frequency is 0 (Roychoudhuryand Nei 1988). This allele is useful in separating South America from otherregions but does not separate Africa and Europe—two regions typically assignedto different races. In addition, some populations in South America have anear-zero allele frequency. If we used the Diego blood group, we would have toassign these South American populations to a mixed European/African race!
Another example of a discrete trait is eye form. The so-called slanted eyesof Asians are caused in part by a fold of skin at the inner corner of the eye.(This shape is also related to the size and projection of the root of the nose.)This eye shape is found in many Asian populations and to a lesser extent inother groups as well. At first this trait might seem like a good “racial” traitbecause its presence allows us to separate populations of Asian ancestry fromother groups. It does not, however, separate other groups, such as those ofAfrican or European ancestry.
Correspondence of Different Traits If race were to be a useful biologicalconcept, the classifications would have to work for a number of independenttraits. A classification developed from skin color would also need to showthe same racial pattern in other traits, such as head shape, nasal shape, andhair color. If each trait produces a different set of races, then the race con-cept is not very useful as a description of overall biological similarity. In fact,racial classifications vary according to the biological trait used.
High frequencies of the sickle cell allele are found not only in populationsbelonging to “African races” but also in parts of Europe and India. Any racialclassification based on high or low frequencies of the sickle cell allele in apopulation would not produce the same distribution as skin color. Anotherexample is the frequency of lactase persistence, which refers to the ability toproduce the lactase enzyme into adulthood. Although lactase persistence is
130 PART II ■ Human Biological Variation
FIGURE 5.7
Original settlement of theUnited States from theperspective of skin color. Fromthe continuous range of skincolor in the human species, themajority of earliest settlers werefrom the two extreme ends—dark-colored West CoastAfricans and light-coloredWestern Europeans. Thisdifferential settlement givesrise to the seeming existence oftwo distinct races in the UnitedStates based on skin color.
Dark Light
Range of human skin color variation
Dark Light
The majority of early settlers to the United States
Skin color variations in the United States for earliest settlers
Enslaved peoplefrom West Africa
Settlers fromWestern Europe
Relethford: The Human Species: An Introduction to Biological Anthropology, 5/e
II. Human Biological Variation
5. The Study of Human Variation
© The McGraw−Hill Companies, 2003
found in some European populations, it is not found in all of them. Further,it is also found in some African populations. Lactase persistence is not a“racial” trait but instead is found in populations that have a long history ofdairy farming (as discussed in Chapter 6).
Using different traits often results in different groupings of populations.For examples such as sickle cell and lactase persistence, we expect this to bethe case because the variation in a trait is related to natural selection, whichwill operate differently in diverse environments. In using racial classifica-tions, however, we often find that as we add more traits the situation be-comes even more complex. The fact that traits show different distributionsargues against the utility of the race concept for describing human variation.
With the proper choice of variables, however, we can find combinationsthat are useful in looking at the relationships between populations on a world-wide basis. By examining a number of traits presumed neutral in terms ofnatural selection, we try to come up with an average pattern that reflects thetendency of gene flow and genetic drift to affect all loci to the same extent.Often we find clusters of populations that agree in a limited sense with geog-raphy. That is, we can identify some separation between sub-Saharan Africanpopulations, European populations, Middle Eastern populations, and so on.This is expected, given the close relationship of geographic distance and geneflow in human populations. Sub-Saharan African populations should be moresimilar to each other, on average, than they are to European populations. Wecan identify large geographic regions that have a rough correspondence withthe usual definitions of race. But how useful are these labels for describingvariation? To answer that, we must look closely at the difference betweenvariation within a population and variation between populations.
Variation between and within Groups Racial classifications focus on dif-ferences between groups. This is apparent in the use of group stereotypes(e.g., “they are short,” or “they have broad heads”). Such statements provideinformation about the average in a group but say nothing about variationwithin the group. For example, consider the statement that adult males inthe United States tend to be taller than adult females in the United States. Noone can argue with this basic fact regarding the average height of adult menand women. However, does it imply that all males are taller than all females?Of course not. There is variation within both sexes and a great deal of overlap.
The problem with the biological race concept is that it does not repre-sent this overlap in genetic characteristics; the focus is on differences betweenpopulations and not within populations. This focus would be permissible tosome extent if the majority of genetic variation actually existed between pop-ulations, and much less within populations. In fact, however, the oppositepattern applies to most genetic characteristics—there is much more geneticvariation within populations than between them.
A number of studies have quantified the relative amount of genetic vari-ation between and within different groupings of humanity. We start by ac-knowledging that genetic variation exists within our species. Our questionhere is how this variation is partitioned. If everyone is genetically the same
CHAPTER 5 ■ The Study of Human Variation 131
Relethford: The Human Species: An Introduction to Biological Anthropology, 5/e
II. Human Biological Variation
5. The Study of Human Variation
© The McGraw−Hill Companies, 2003
within a race and the races are genetically different, then the percentage ofvariation between the races will equal 100 percent and the percentage of vari-ation within the races will equal 0 percent. On the other hand, if there are ge-netic differences between individuals within each race but the allele frequen-cies are the same across races, then the percentage of variation between raceswill be 0 percent and the percentage of variation within races will be 100 per-cent (Figure 5.8). The main point here is that the race concept works bestwhen most of the variation exists between groups (thus conforming to thestereotypic statement that “they all look alike”).
Anthropologists and geneticists have computed these percentages basedon data on indigenous populations from various large geographic regions ofthe world (e.g., sub-Saharan Africa, Europe, eastern Asia, and North Amer-ica) that have often been suggested by proponents of the race concept as rep-resenting different major “racial” groupings. Studies of blood groups andother genetic polymorphisms show that roughly 10 percent to 12 percent ofthe total variation in our species exists between these regions, with the remain-ing 88 percent to 90 percent existing within regions (Brown and Armelagos2001; Relethford 2001c). Analysis of DNA polymorphisms shows the samebasic pattern (Barbujani et al. 1997). The same pattern also applies to cranialand facial measurements (Relethford 1994). The bottom line is that geographicrace explains only 10 percent to 12 percent of the total variation in the humanspecies. This fact, combined with the arbitrary nature of geographic classifi-cations, shows that the race concept is not very useful in describing humanbiological diversity.
What Use Is the Race Concept? In view of the many problems associatedwith using race to explain human variation, does the concept have any use?In the scientific study of human variation, the answer is little, if any. It is adescriptive tool, not an analytic one. If we examine the biological characteris-tics of a population and then assign the population to a given race, all wehave accomplished is to label some observed phenomenon. We have not ex-plained the causes of variation nor why some groups are similar to or differ-ent from others. The name explains nothing. The race concept does not askor answer any interesting questions.
Until the 1950s, much of biological anthropology was devoted to racialdescription and classification. Most sciences go through a descriptive phase,followed later by an explanatory phase in which hypotheses are proposedand tested. Indeed, at least until the work of Charles Darwin, much of biol-ogy was basically a descriptive science. Today biological anthropologists rarelytreat race as a concept. It has no utility for explanation, and its value for de-scription is limited.
In contemporary society, however, race is still a common category. In thiscontext the term has a social connotation more than a biological one. Instate and federal government reports, “race” identifies some aspect of geo-graphic origin and ethnic identity. For example, “black” refers to African orAfrican American descent. “Hispanic” refers to Spanish speakers but actually
132 PART II ■ Human Biological Variation

Relethford: The Human Species: An Introduction to Biological Anthropology, 5/e
II. Human Biological Variation
5. The Study of Human Variation
© The McGraw−Hill Companies, 2003
encompasses a wide variety of peoples from Mexicans to Bolivians. Such clas-sifications have their use, particularly in defining groups of people who havesuffered social inequities, but they are not without their own problems. Clas-sification into discrete groups always means that we obscure the subtle gra-dations of human variation.
CHAPTER 5 ■ The Study of Human Variation 133
FIGURE 5.8
Three different examples showing how variation is partitioned between and within populations.The circles each enclose a population with a specific number of two alleles, A and B. In case 1,population 1 consists entirely of A alleles and population 2 consists entirely of B alleles. Thereis no variation within either population, but the two populations are completely different interms of the frequencies of the A and B alleles. As such, 100 percent of the variation is betweenthe populations and 0 percent is within populations. Case 2 shows the opposite pattern. Thegenetic composition of both populations is the same—50 percent A alleles and 50 percent B alleles. There is therefore no variation between the populations, and all of the variationoccurs within populations. Case 3 shows a less extreme condition, where the frequency of theA allele is 8/12 = 0.67 in population 1 and 4/12 = 0.33 in population 2. There is variationwithin each population, and there is some variation between the populations. The actualpartitioning of variation (11 percent between populations and 89 percent within populations)is of the magnitude seen among major geographic regions of humans (see text)—most geneticvariation exists within populations. Both populations have A and B alleles but differ in theirrelative frequency. Note: the percentage of variation within and between populations wascomputed using a measure known as FST, which relates allele frequencies to the proportionof variation between populations (Harpending and Jenkins 1973).
A A A A
A A A A
A A A A
B B B B
B B B B
B B B B
A A A A
A A
A A A A
A A A A B B B B
B B B BB B B B
B B
B B B B
A A A A
A A B B
B B B B
A A A A
Population 1 Population 2
Case 1
Case 2
Case 3
Variation between populations = 100%Variation within populations = 0%
Variation between populations = 0%Variation within populations = 100%
Variation between populations = 11%Variation within populations = 89%

Relethford: The Human Species: An Introduction to Biological Anthropology, 5/e
II. Human Biological Variation
5. The Study of Human Variation
© The McGraw−Hill Companies, 2003
Human variation is best analyzed using an approach that focuses on mi-croevolutionary forces and uses individuals or local populations as the unitof analysis. This approach, aided by modern statistical and computer meth-ods, allows better description than the race concept, avoids the problems ofclassification, and provides a focus for explanation.
In any case, we should not confuse social and biological categories, nordraw biological inferences from social identity. Race as a concept has littleutility for analyzing human biological variation. Although we still distin-guish “social” races, the term tends to generate misunderstanding even whenused in this sense.
THE EVOLUTIONARY APPROACH TO VARIATION
When dealing with human biological variation, we need methods to describeand analyze patterns that we observe. As noted in the last section, the raceconcept is at best a crude description of variation, and it provides nothing interms of explanation. The alternative approach stressed by biological anthro-pologists for the past 30–40 years or so is an evolutionary one. Here we lookat the pattern of biological variation in terms of the evolutionary forces: mu-tation, selection, gene flow, and genetic drift.
Different methods are used to analyze human variation depending onthe specific questions being asked. Are we interested in the history of a set ofpopulations? If so, we want to consider factors such as gene flow, which inturn might be related to patterns of marriage, migration, and changes inpopulation size. In such cases, we would want as much information from asmany different traits as possible in order to obtain some measure of overallgenetic similarity. Or are we interested in the patterns of variation of a spe-cific trait, such as the ABO blood group or skin color? In that case, we wouldfocus on that specific trait.
Given this contrast, we can draw a distinction between univariate analy-sis (one trait at a time) and multivariate analysis (many traits at one time).The differences in these approaches relate to the goals of a given study andwhether the focus is on the forces of gene flow and genetic drift on one handor on natural selection on the other.
The basic starting point is that gene flow and genetic drift are expectedto affect all loci to the same degree, whereas natural selection is expected toaffect each locus differently. For example, if you move from one populationto another and have offspring in your new population, all of your geneticmaterial moves with you: gene flow should affect all loci the same. Likewise,the average effect of genetic drift is expected to be the same for all loci. (Nu-merous loci or traits must be used for this to work. Genetic drift will lead todeviations for each individual locus or trait, and many of them need to besampled to obtain an average.) Natural selection, however, should affect eachlocus differently—unless, of course, the loci are both related to the same se-lective force.
134 PART II ■ Human Biological Variation
univariate analysis Theanalysis of human biologicalvariation focusing on asingle trait at a time.
multivariate analysis Theanalysis of human biologicalvariation that considers theinterrelationships of severaltraits at a time.
I I I I I I I

Relethford: The Human Species: An Introduction to Biological Anthropology, 5/e
II. Human Biological Variation
5. The Study of Human Variation
© The McGraw−Hill Companies, 2003
As a result, we tend to study natural selection one locus or trait at a time,unless we are looking at related traits. If we wish to study the effects of ge-netic drift and gene flow, we try to sample as many loci or traits as possiblewith the goal of getting the best estimate of overall effect. Of course, anystudy must consider all of the evolutionary forces. The univariate and multi-variate approaches together often provide us with information regarding anumber of these evolutionary forces.
An example of the multivariate approach is Workman and colleagues’(1963) study of allele frequencies of African Americans in Claxton, Georgia.Table 5.2 lists the frequencies of seven alleles from six loci for the AfricanAmerican and European American populations of Claxton and those of theWest Coast of Africa (a presumed source of many ancestors for the ClaxtonAfrican Americans). In all cases, the allele frequencies for the Claxton AfricanAmericans lie between those of West Coast Africans and the Claxton EuropeanAmericans. In most cases, the allele frequencies of the Claxton African Amer-icans are more similar to those of West Coast Africans. This is expected, giventhe predominantly African ancestry of the Claxton African American popula-tion. European gene flow, however, has caused the Claxton African Americanallele frequencies to move further away from the West African frequencies.This example shows how admixture of Europeans has occurred in the AfricanAmerican population of Claxton.
Is gene flow the only factor operating on the Claxton African Americanallele frequencies? If so, then the relative position of the Claxton AfricanAmericans should be the same for all alleles because gene flow is expected tohave the same effect on all loci. Figure 5.9 plots their relative positions forthe seven alleles. Most of the Claxton African American allele frequenciesplot in a similar location, as expected from gene flow. The allele frequencyfor the sickle cell allele (S) is quite different. It does not fit the pattern of theother alleles, which suggests that natural selection has been operating onthis locus.
CHAPTER 5 ■ The Study of Human Variation 135
TA B L E 5 . 2 Allele Frequencies of African American and European American Populations in Claxton, Georgia
Claxton ClaxtonWest Coast African European
Locus Allele African Americans Americans
Rhesus d 0.211 0.230 0.358ABO A 0.148 0.158 0.246ABO B 0.151 0.129 0.050MN M 0.476 0.485 0.508Duffy Fya 0.000 0.046 0.422P P 0.780 0.757 0.526Hemoglobin S 0.110 0.043 0.000
Source: Workman et al. (1963:451)
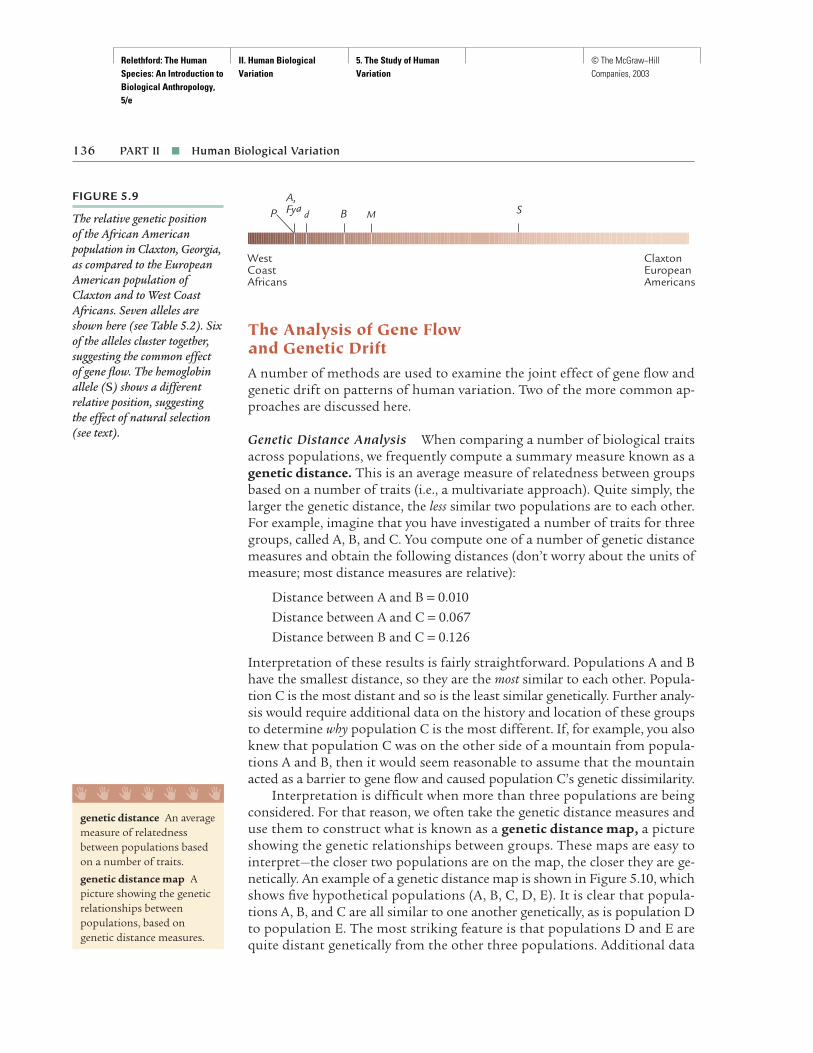
Relethford: The Human Species: An Introduction to Biological Anthropology, 5/e
II. Human Biological Variation
5. The Study of Human Variation
© The McGraw−Hill Companies, 2003
The Analysis of Gene Flow and Genetic DriftA number of methods are used to examine the joint effect of gene flow andgenetic drift on patterns of human variation. Two of the more common ap-proaches are discussed here.
Genetic Distance Analysis When comparing a number of biological traitsacross populations, we frequently compute a summary measure known as agenetic distance. This is an average measure of relatedness between groupsbased on a number of traits (i.e., a multivariate approach). Quite simply, thelarger the genetic distance, the less similar two populations are to each other.For example, imagine that you have investigated a number of traits for threegroups, called A, B, and C. You compute one of a number of genetic distancemeasures and obtain the following distances (don’t worry about the units ofmeasure; most distance measures are relative):
Distance between A and B = 0.010Distance between A and C = 0.067Distance between B and C = 0.126
Interpretation of these results is fairly straightforward. Populations A and Bhave the smallest distance, so they are the most similar to each other. Popula-tion C is the most distant and so is the least similar genetically. Further analy-sis would require additional data on the history and location of these groupsto determine why population C is the most different. If, for example, you alsoknew that population C was on the other side of a mountain from popula-tions A and B, then it would seem reasonable to assume that the mountainacted as a barrier to gene flow and caused population C’s genetic dissimilarity.
Interpretation is difficult when more than three populations are beingconsidered. For that reason, we often take the genetic distance measures anduse them to construct what is known as a genetic distance map, a pictureshowing the genetic relationships between groups. These maps are easy tointerpret—the closer two populations are on the map, the closer they are ge-netically. An example of a genetic distance map is shown in Figure 5.10, whichshows five hypothetical populations (A, B, C, D, E). It is clear that popula-tions A, B, and C are all similar to one another genetically, as is population Dto population E. The most striking feature is that populations D and E arequite distant genetically from the other three populations. Additional data
136 PART II ■ Human Biological Variation
FIGURE 5.9
The relative genetic position of the African Americanpopulation in Claxton, Georgia,as compared to the EuropeanAmerican population ofClaxton and to West CoastAfricans. Seven alleles areshown here (see Table 5.2). Sixof the alleles cluster together,suggesting the common effect of gene flow. The hemoglobinallele (S) shows a differentrelative position, suggesting the effect of natural selection(see text).
S
WestCoast Africans
PA,Fya d B M
ClaxtonEuropean Americans
genetic distance An averagemeasure of relatednessbetween populations basedon a number of traits.
genetic distance map Apicture showing the geneticrelationships betweenpopulations, based ongenetic distance measures.
I I I I I I I

Relethford: The Human Species: An Introduction to Biological Anthropology, 5/e
II. Human Biological Variation
5. The Study of Human Variation
© The McGraw−Hill Companies, 2003
would be needed to determine why. Are D and E separated geographicallyfrom the other three populations? This would be easy to check: simply com-pare the genetic distance map with a geographic distance map. Other hypothe-ses, such as differences in religion or other cultural variables, could also betested using a comparative approach. Several examples of genetic distancemaps from actual studies will be presented in Chapter 6.
Demographic Measures Much information regarding the effect of geneticdrift and gene flow can be extracted from analysis of demographic measures,especially population size and migration. These measures can be used to es-timate the likely effect of genetic drift and gene flow by means of a variety of complex mathematical methods. If information is available for genetictraits, then these estimates can be compared with observed reality. This typeof comparison allows us to test various assumptions of models and to de-termine the relative effect of gene flow and genetic drift. When genetic traitsare not available, the analysis of demographic measures still provides us with an idea of the relative magnitude of genetic change likely under certainconditions.
The relationship between demographic measures and microevolution isrelatively straightforward. Because the magnitude of genetic drift is relatedto population size (the smaller the population, the greater the effect of drift),a knowledge of population size can give us an estimate of the effects of ge-netic drift. Much gene flow is related to migration, so an analysis of marriagerecords and other vital statistical data can provide us with an idea of the rela-tive magnitude of gene flow. Using appropriate models, scientists can considerthe effects of gene flow and genetic drift simultaneously to predict geneticdistances and then compare them with actual genetic distances. This approachalso gives us an opportunity to study demographic shifts in historical popu-lations—groups for which we have no genetic data but do have demographicinformation.
The Analysis of Natural SelectionThe analysis of natural selection in human populations is complex. Ratherthan set up laboratory experiments, most of the time we must rely on com-parisons of situations existing in nature. Consider the following hypotheti-cal situation. You are interested in testing the hypothesis that mammalian
CHAPTER 5 ■ The Study of Human Variation 137
FIGURE 5.10
Example of a genetic distancemap for five hypotheticalpopulations (A, B, C, D, E).The closer populations aregenetically, the closer they plotnear each other on the map.
D
EB
C
A
Relethford: The Human Species: An Introduction to Biological Anthropology, 5/e
II. Human Biological Variation
5. The Study of Human Variation
© The McGraw−Hill Companies, 2003
body size is related to temperature. If you were dealing with laboratory ani-mals such as mice, you would set up an experiment in which you would ex-pose different groups of mice to different ambient temperatures and thendetermine what change, if any, takes place from one generation to the next.But what if you were interested in testing this hypothesis on elephants? It isunlikely you would be able to overcome the large number of practical diffi-culties involved in such a project. Where would you get enough space? Howmany elephants would you need? Could you obtain these elephants? Finally,you would also have to deal with the problem of a long generation length.
If you were interested in humans, the whole laboratory approach wouldbe immoral and illegal, as well as impractical. Does this mean that the hy-potheses cannot be tested? No, because you could examine a natural experi-ment. You would collect data on body size and temperature from humanpopulations across the world to determine if a relationship in fact existed.Your study could be improved by trying to control for other effects. For ex-ample, you would not want to select an undernourished population fromAfrica and a well-nourished population from northern Europe because thedifferences in body size could be the result of both temperature and nutri-tion. Careful choice of samples in this type of natural experiment is critical.Though research on human populations is extremely difficult, the challengeis also part of the appeal for many biological anthropologists.
There are several approaches to measuring natural selection in humanpopulations. The most direct method involves comparing measures of sur-vival and reproduction (fitness) among individuals with different genotypes.Another method is to look at regional or worldwide variation in a trait to de-termine if it has any relationship with climate or other environmental fac-tors. A third method is to look at the potential for natural selection by usingmeasures of births and deaths from demographic data.
Genetic Associations Because natural selection refers to the process bywhich individuals with certain genetic characteristics are more likely to sur-vive or reproduce, we want to determine whether individuals with certaingenotypes have a greater probability of surviving or reproducing. If you wereinterested in looking at the potential effects of natural selection on the MNblood group system, you would want to separate your sample into groups ofindividuals with the same genotype (MM, MN, or NN ). You would then at-tempt to determine if there were any differences in mortality or fertility amongthese groups. For instance, do individuals with one genotype live longer thanthose with other genotypes? Is there any relationship between genotype andthe individual’s history of disease? Do individuals with certain genotypes havemore surviving children than those with other genotypes? Are individualswith one genotype more likely to be sterile than others?
These questions and others can be answered in principle by looking atthe associations among some measure of health, survival, or fertility and dif-ferent genotypes. Suppose you were interested in whether or not differentMN genotypes have different susceptibilities to diseases. You could select agroup, determine its MN genotypes, and monitor its members for the rest of
138 PART II ■ Human Biological Variation
Relethford: The Human Species: An Introduction to Biological Anthropology, 5/e
II. Human Biological Variation
5. The Study of Human Variation
© The McGraw−Hill Companies, 2003
their lives to track their disease histories. Alternatively, you could select a groupof individuals who have had a given disease and compare their MN genotypeswith those of a random sample of people who have not had the disease.
Environmental Correspondence One way of looking for the effects of nat-ural selection is to analyze patterns of variation over a large geographic region.Given that natural selection is related to environmental variation, differencesamong locations might reflect changes in environment and in genotype. Thegoal is to determine the level of correspondence between some aspect or as-pects of the physical environment and a genotype. To test the idea that cli-mate is related to body size, you would look at the distribution of body sizeand see how well it matches the distribution of climatic variables. Again,proper selection of your samples is necessary to ensure that you do not mea-sure some other factor affecting biological variation. This method has otherpotential problems, such as the fact that migration can affect the level ofcorrespondence. For example, if you were looking at the relationship of skincolor and latitude, you would not want to include African Americans or Euro-pean Americans in your analysis because they are relatively recent migrantsto the United States.
Demographic Measures Natural selection operates on differences in mor-tality and fertility, both of which may be measured from demographicrecords. The death rate of a population is a measure of the proportion ofdeaths occurring within a given period of time. The birth rate measures fer-tility within a population. These measures can provide an idea of the overallpotential for natural selection. They do not tell us what specific effect nat-ural selection will have on a particular set of loci. These measures are also sohighly dependent on cultural variation that we cannot always extrapolate togenetic factors. For example, two populations may show different diseaserates. Even though it might be tempting to suggest that the difference in dis-ease patterns is due to genetic differences, we must first control for othersources of this variation, cultural and environmental.
Nonetheless, demographic measures do provide us with some informa-tion about the potential for natural selection to operate (Crow 1958). Withproper controls and research strategies, such measures can even be used to test biological hypotheses in the absence of any direct biological data. Agood example of this approach is Meindl and Swedlund’s (1977) study ofmortality in the populations of Deerfield and Greenfield in historical Massa-chusetts. Historical data indicated that both populations experienced epi-demics of childhood dysentery, a serious disease, between 1802 and 1803.Meindl and Swedlund used death records to determine the effect of theseepidemics on the mortality of those who survived the disease. They foundthat the individuals who survived the disease actually lived longer than thosewho were not exposed to it. They concluded that the greater longevity ofthose individuals reflected, in part, genetic differences. One possible inter-pretation is that those who survived had genetic characteristics that gavethem greater resistance to dysentery; this is natural selection in action.
CHAPTER 5 ■ The Study of Human Variation 139

Relethford: The Human Species: An Introduction to Biological Anthropology, 5/e
II. Human Biological Variation
5. The Study of Human Variation
© The McGraw−Hill Companies, 2003
Another possibility is that those exposed to the disease developed strongerimmune systems as a response. Such augmented resistance is a physiologicalresponse, although there is most likely also a genetic component involved.Though such demographic analyses cannot provide any definite answers re-garding natural selection, they do provide useful supplements to traditionalgenetic analysis.
Problems in Analysis Some problems are common to any study of naturalselection in human populations, regardless of the specific methods of study.The methods described here can demonstrate a relationship between somemeasure of fitness and some environmental factor. Correlation does not nec-essarily imply causation, however. We still need to document the link amonggenetics, environment, and the action of natural selection.
For example, a high degree of association between a specific blood groupgenotype and a given disease is suggestive but not conclusive. To completethe analysis, it is necessary to look at the specific biochemical nature of theblood group genotype. What changes in biological structure are related tothis genotype, and how do these changes relate to the specific disease? Aknowledge of the biochemical nature of the blood groups is required to an-swer these questions.
Another potential problem is that whatever association we detect maynot have been present in the past. It is also possible that natural selectionoperated on a specific allele in the past but no longer does so. Certain bloodgroup genotypes, for example, are associated with susceptibility to the dis-ease smallpox. Today, smallpox has been eradicated as the result of intensivehealth care and immunization programs. In the past, however, smallpox wasdevastating. Thus, smallpox may have been a factor in the natural selectionof certain blood types in the past, but it is not at present.
We have an unfortunate tendency to view natural selection in terms ofmajor differences between different genotypes. Natural selection is oftenlooked at as an all-or-none phenomenon—one individual survives and an-other does not. In reality, natural selection often operates on very small dif-ferences between different genotypes. One genotype may have only a slightadvantage—1 percent, or 2 percent, or even lower—relative to another.If natural selection works with small differences, then how can substantialchange result? The key to understanding this problem is to realize that smallchanges can have a large impact over a long period of time. Like compoundinterest in a bank account, the effects of even small levels of natural selectioncan add up over long periods. Of course, such low amounts of natural selec-tion may be difficult to detect in a single generation. Imagine a populationof organisms in which the average body weight is 10 kg (22 lb). Suppose thereis a small amount of selection for those individuals with larger body sizes.Each generation, the average body size would increase in the population as aresult of natural selection. Suppose the change is only one-tenth of 1 per-cent. The change in the first generation would be only from 10 kg to 10.001kg, which is not noticeable. If this selection continues for 1,000 generations,however, the average body size would be over 27 kg (almost 60 lb). Also, re-member that 1,000 generations is a very short time in evolution. Of course,
140 PART II ■ Human Biological Variation
Relethford: The Human Species: An Introduction to Biological Anthropology, 5/e
II. Human Biological Variation
5. The Study of Human Variation
© The McGraw−Hill Companies, 2003
S P E C I A L T O P I C
Genetics, Race, and IQPerhaps the most controversial topic in the study ofhuman variation is the question of the relationship ofgenetics, race, and intelligence. What is intelligence? AreIQ tests an accurate measure of intelligence? Are IQscores due to genetic inheritance or environmental fac-tors or both? Are there “racial” differences in IQ scores?If so, do they reflect genetics or environment or both?
Over time, as observations were collected that showed“racial” differences in intelligence test scores, severalresearchers argued that this difference is at least partiallydue to genetic differences between the races. A commonline of argument goes as follows:
1. IQ scores are a measure of intelligence.2. Differences in IQ scores are partly due to genetic
differences.3. The races have different average IQ scores.4. Because races are by definition genetically different,
the racial differences in IQ scores are genetic.
It is worthwhile to examine briefly each of these claims.What is IQ? It stands for “intelligence quotient” and
is a measure derived by dividing a person’s “mental age”by her or his chronological age; it is designed so that theaverage score for a reference population is 100. The IQtest was developed in France by Alfred Binet, who soughta means by which to identify children with learning dis-abilities. The purpose of the test was not to measureintelligence per se but rather to identify those childrenwho would most likely require special education. The testwas not meant to provide a ranking of intelligence amongthe rest of the students. That is, someone with an IQscore of 120 was not to be considered inherently “better”or “smarter” than someone with a score of 110.
Is intelligence a single “thing” that can be measuredaccurately by an IQ test? Although some argue that IQ is a fair measure of intelligence (Herrnstein and Murray1994), others note that there are many different types ofintelligence, some of which may not be assessed as well byconventional IQ tests (Bodmer and Cavalli-Sforza 1976;Hunt 1995). There is an unfortunate tendency to assumethat intelligence is a single thing, measurable with asingle test (Gould 1981).
These problems change the questions somewhat.Instead of looking at genetic and environmental factorsaffecting intelligence, what we are really doing is looking atgenetic and environmental factors affecting IQ test scores,which might not be the same thing. In terms of IQ, thereis evidence for a strong inherited component (Bouchardet al. 1990) and strong environmental components, includ-
ing diet, education, social class, and health, among others(Gould 1981). The exact heritability of IQ has been widelydebated. Some have suggested that up to 60–80 percentof the variation in IQ scores may be due to genetic varia-tion. More recent work suggests that heritability might becloser to 34–48 percent (Devlin et al. 1997).
The third point in the list is that there are “racial”differences in IQ test scores. In the United States, forexample, European Americans tend to score, on average,roughly 15 points higher than African Americans. AsianAmericans tend to score, on average, several points higherthan European Americans. However, is this what we meanby a “racial” difference? Categories such as “EuropeanAmerican,” “African American,” and “Asian American”are broad groupings based on ethnicity and nationalorigin, but they are not by any stretch of the imaginationhomogeneous populations. People within any of thesebroad ancestral groupings can come from a wide varietyof countries and environments. Does it make sense totalk about a “European American race”? Problems arisewhen we take our labels as accurate reflections for thetrue nature of biological variation.
Putting aside for the moment the utility of evenlooking at IQ by “race,” the largest problem is point 4 inthe list. We assume that any group differences of a traitthat has a genetic basis must be genetic in nature. How-ever, we also know of genetic traits that do not vary acrosshumanity. Some traits vary among groups, and some donot. We have no way of knowing beforehand which kindof trait IQ test performance will turn out to be. The an-swer requires testing. The other problem with analysis isthat we also know that different groups have differentenvironmental conditions (e.g., education, income, andothers) that affect performance on IQ tests. To date, thebulk of the evidence supports an environmental explana-tion of “racial” difference in IQ test scores (Loehlin et al.1975; Gould 1981; Mackintosh 1998). Direct tests havealso been made of the hypothesis that group differencesare genetic. If this were true, then IQ test scores amongAfrican Americans should vary proportionately accord-ing to the degree of European admixture; those withgreater European ancestry should score higher. An analy-sis of this hypothesis, however, showed no relationshipbetween amount of European component and IQ scores(Scarr and Weinberg 1978).
The entire debate over “race” and IQ is obviouslyinfluenced by political, economic, and social ideologies.From a scientific viewpoint, much of the debate is flawedbecause of overreliance on the biological race concept.
141

Relethford: The Human Species: An Introduction to Biological Anthropology, 5/e
II. Human Biological Variation
5. The Study of Human Variation
© The McGraw−Hill Companies, 2003
change is not likely to occur in a steady, uniform manner. This hypotheticalexample, which is very simple, does show the cumulative nature of naturalselection over long periods of time.
Slight differences in survival and reproduction, then, can add up overtime. Slow change over time, however, poses a problem for our analyses ofnatural selection. If differences are slight, we may not be able to detect themin a short period of time or we might require extremely large samples. Otherevolutionary forces, such as drift and gene flow, would also alter the degreeof change from one generation to the next. In many studies of human popu-lations, we find that gene flow “swamps” the effect of natural selection. Thisdoes not mean that we cannot study natural selection; it merely shows usone of the potential problems we must take into account.
SUMMARY
The study of human variation looks at the patterns and causes of biologicaldiversity among living human beings. Human variation has been studiedusing a racial approach and an evolutionary approach. The biological con-cept of race emphasizes differences between groups and deemphasizes varia-tion within groups. In the past, race was used as a crude means by which todescribe patterns of human variation. A major problem in using race as aconcept is that distinct “races” take on a reality of their own in people’sminds. The race concept has limited use in analyses of biological variation,however, particularly for widespread species such as human beings. The raceconcept uses arbitrary classifications of predominantly continuous varia-tion, does not account for patterns of variation among different traits, anddoes not account for variation within groups. These problems aside, the raceconcept is further limited because it is purely descriptive and offers no expla-nation of variation.
The evolutionary approach looks at biological variation in terms of theevolutionary forces of mutation, natural selection, gene flow, and geneticdrift. The focus of microevolutionary studies depends on the specific prob-lem being analyzed. If the purpose is to look at average patterns reflectinggene flow and genetic drift, then many traits are analyzed at the same time(multivariate) because these two evolutionary forces affect all loci the same.If the purpose is to look at natural selection, then one trait is analyzed at atime (univariate) in order to find correlations with survival and/or reproduc-tion. The microevolutionary approach is somewhat difficult to use for hu-mans, as compared to laboratory animals, because there are no controls.Nonetheless, various methods have been developed to extract as much infor-mation as possible from patterns of human biological diversity.
SUPPLEMENTAL READINGS
Corcos, A. F. 1997. The Myth of Human Races. East Lansing: Michigan State University Press.A short introduction to the problems of using the biological race concept to describepatterns of human variation.
142 PART II ■ Human Biological Variation

Relethford: The Human Species: An Introduction to Biological Anthropology, 5/e
II. Human Biological Variation
5. The Study of Human Variation
© The McGraw−Hill Companies, 2003
Gould, S. J. 1981. The Mismeasure of Man. New York: W. W. Norton. An excellent review ofthe historical controversies regarding intelligence tests, which also addresses problemswith the race concept.
Mackintosh, N. J. 1998. IQ and Human Intelligence. Oxford: Oxford University Press. A com-prehensive review of IQ testing, including discussions of genetic and environmentalhypotheses regarding ethnic group differences in IQ.
INTERNET RESOURCES
http://anthro.palomar.edu/vary/vary_2.htmModels of Classification, a tutorial comparing racial and evolutionary ap-proaches to human variation.
http://www-sul.stanford.edu/depts/ssrg/misc/race.htmlRace, Genes and Anthropology, a collection of links on a variety of topics, in-cluding race in anthropology, genetics and behavior, and racism.
http://webusers.anet-stl.com/∼civil/bellcurveillustration2.htmlThe Bell Curve Workbook, a collection of links relating to the controversialbook The Bell Curve by Herrnstein and Murray.
CHAPTER 5 ■ The Study of Human Variation 143

Relethford: The Human Species: An Introduction to Biological Anthropology, 5/e
II. Human Biological Variation
6. Microevolution in Human Populations
© The McGraw−Hill Companies, 2003
C H A P T E R 6Microevolution in Human Populations
145
In this chapter we examine several case studies of human microevolution inorder to illustrate the different evolutionary approaches discussed in the
previous chapter. The first part deals with studies that look primarily at thejoint effects of gene flow and genetic drift. The remainder of the chapterlooks at several studies focusing on natural selection.
CASE STUDIES OF GENE FLOW AND GENETIC DRIFT
Many studies of human microevolution are concerned with population his-tory. How are different populations related? Did they have different historiesin terms of settlement or contact with other groups? Did invaders leavetraces of their genes behind? Were populations always the same size, or didsome grow and expand, while others shrank or became isolated? These arebut a few of the types of questions that we deal with when we use biologicaldata to answer questions of human history.
When we look at the biological history of human populations, we arelooking primarily at the joint effects of gene flow and genetic drift. Any pastmigrations, invasions, or contacts between peoples ultimately involves geneflow, so we can analyze gene flow in such a way as to reconstruct these pastevents. Because the history of human populations also involves changes inpopulation size, we must also consider the effect of genetic drift. Looking at
A Yanamamo Indian hunting. The Yanamamo live in the rain forests of South America. Their social organization, with frequent splits and mergers of different groups, has a noticeable effect on their patterns of genetic variation.(© Michael Nichols/National Geographic Society Image Collection)
▲

Relethford: The Human Species: An Introduction to Biological Anthropology, 5/e
II. Human Biological Variation
6. Microevolution in Human Populations
© The McGraw−Hill Companies, 2003
gene flow and genetic drift at the same time can be somewhat tricky. Imag-ine, for example, that you find two small, isolated populations that appearrather genetically distinct. Is this distinctiveness due to cultural or geograph-ical isolation (low gene flow), or might it be due to the small size of the pop-ulations and the increased effect of genetic drift?
We must also remember that any attempt to reconstruct population his-tory must involve as many traits as possible to have the best chance of seeingaverage patterns. In other words, we must use the multivariate approach dis-cussed in the previous chapter. Again, the reason we do this is that gene flowand genetic drift are expected to have the same average effect on all traits.
Two case studies are presented here to illustrate how we can analyze pastpatterns of gene flow and genetic drift. The first focuses on variation on alocal level—small tribes in South America. The second looks at patterns ofvariation on a regional level—Irish counties.
Social Organization and Genetics of South American Indians of the Rain ForestA number of genetic studies have been carried out on the tribal populationsliving in the rain forests of South America. Studies of these populations haveallowed investigation into the ways in which the social structure of smalltribes contributes to genetic diversity. Of course, the small size of the popu-lations and their general isolated nature act to increase the likelihood of ge-netic drift. What makes these studies so fascinating is the specific social andpolitical structures that act in certain ways to increase drift and in other waysto counter it.
Many of these populations have a fission–fusion structure. As popula-tions grow, the limits of the environment are soon reached. Political factionsdevelop, creating unrest within the local villages resulting from too manypeople in one place. When populations become too large, they will often fis-sion into separate groups. Some of these separate groups will be too small toremain viable villages, and smaller groups may then undergo fusion to forma large group (Figure 6.1).
The formation of new, smaller villages from old (fission) is expected tolead to increased opportunity for genetic drift. The merging of smaller vil-lages to form large ones (fusion) acts to some extent to counter the effects ofgenetic drift. Adding to this complex situation is the fact that all villagespractice exogamy (finding a mate in another group) to some extent. Exoga-mous marriage results in gene flow between villages, which also acts tocounter the effects of genetic drift.
Village fissioning is a form of the founder effect and is expected to leadto group differences because of genetic drift. The amount of genetic driftcan be predicted and then compared to observed allele frequencies to test thehypothesis that genetic variation is being affected by drift. Following up onpioneering work by James Neel, Peter Smouse (1982) and colleagues per-
146 PART II ■ Human Biological Variation
exogamy The tendency tochoose mates from outsidethe local population.
I I I I I I I
FIGURE 6.1
Fission–fusion social structure.Fissioning is the splitting of apopulation into two or moresmaller populations. Fusioningis the merging of two or morepopulations into a largerpopulation. Circles in thisfigure indicate the relative sizesof each population: populationsA and B both split into twosmaller populations; populationsA2 and B1 then merge to forma larger population, C.
A1
A2
B1
B2
A
B
C
Time
Fission Fusion

Relethford: The Human Species: An Introduction to Biological Anthropology, 5/e
II. Human Biological Variation
6. Microevolution in Human Populations
© The McGraw−Hill Companies, 2003
formed extensive analyses on a number of genetic systems for several tribalpopulations, such as the Yanomamo (Figure 6.2), and found that the ob-served level of genetic differences between groups exceeded the level expectedunder random genetic drift. Closer analysis has shown that the village fis-sions were not random. Rather, many fissions take place along kinship lines.Instead of a random group of individuals forming a new village, often agroup of related individuals does so. This nonrandom splitting actually en-hances the effects of genetic drift because new villages are less likely to havean equal representation of alleles from the original population. Thus, the in-dividual pattern of village fissioning adds to the effect of genetic drift.
Complicating matters further, mating practices add to the process of ge-netic drift in these populations. Under the marriage system in these soci-eties, the more politically powerful and wealthy men often have multiplewives. Differences in local political power mean that some men have morewives than others and therefore contribute in greater frequencies to the nextgeneration. Though the entire analysis of Smouse and colleagues is toolengthy to discuss here, it should be clear that the complexity of human pop-ulations can affect genetic drift in many ways.
The Population History of IrelandFrom the perspective of biological variation, the population history of Ire-land is fascinating because of the numerous possibilities for gene flow in theisland’s past (“Ireland” refers here to the entire island, which is currentlymade up of two countries—the Republic of Ireland and Northern Ireland).In the past, Ireland has seen many different invasions and settlements from
CHAPTER 6 ■ Microevolution in Human Populations 147
FIGURE 6.2
The Yanomamo Indians of theSouth American rain forest. (© Michael K. Nichols/NationalGeographic Society ImageCollection)

Relethford: The Human Species: An Introduction to Biological Anthropology, 5/e
II. Human Biological Variation
6. Microevolution in Human Populations
© The McGraw−Hill Companies, 2003
England, Scotland, Wales, and Scandinavia. What was the impact of thesedifferent sources of gene flow?
Relethford and Crawford (1995) investigated the patterns of biologicalvariation among Irish populations using ten anthropometric measures ofthe head and face. With appropriate methods, anthropometric data can beused to derive genetic distances (Relethford and Blangero 1990). These datawere originally collected during the 1930s on more than 7,000 adult Irishmen. Relethford and Crawford used the data to look at genetic distances be-tween 31 Irish counties (political units). Figure 6.3 shows the geographic lo-cation of the 31 counties, and Figure 6.4 shows the genetic distance map. Foreasy comparison of these two figures, counties have been grouped into sixmajor geographic units (west coast, southwest, midlands, northern, eastern,and southern counties). As discussed in Chapter 5, genetic distance maps areinterpreted based on the relative proximity of the populations to each otheron the map. Populations plotting closer together on the map are geneticallymore similar to each other than populations that plot farther away from oneanother. The major pattern shown in Figure 6.4 is the distinctiveness of thefour midland counties (M1–M4), which are dissimilar from the rest of Ire-land. Looking at Figure 6.3, we see that these four counties are right in themiddle of the island, posing an interesting question—if genetic variation isrelated to geography, we would expect the midland counties to be geographi-cally and genetically similar to all other counties because they are right inthe middle of all possible migration patterns from one part of Ireland to an-other. This is clearly not the case. What then accounts for the genetic distinc-tiveness of the midlands?
148 PART II ■ Human Biological Variation
FIGURE 6.3
Geographic map of Irishcounties used in the geneticdistance analysis. The labelscorrespond to six regions: W = west coast, SW = southwest,M = midlands, N = north, E =east, S = south. This map canbe compared with the geneticdistance map in Figure 6.4.One county in the east is notlabeled because data were notavailable for that county.(Relethford and Crawford 1995)
0 50 miles
0 50 kilometers
N1
N3
E2
E1M2W3
W2
W1
S1
S2
SW2
SW3
SW4SW1
S3
S4
S5
M3
M4
M1 E3
E4
E6E5
E7
E8
N4 N6
N7N5N2
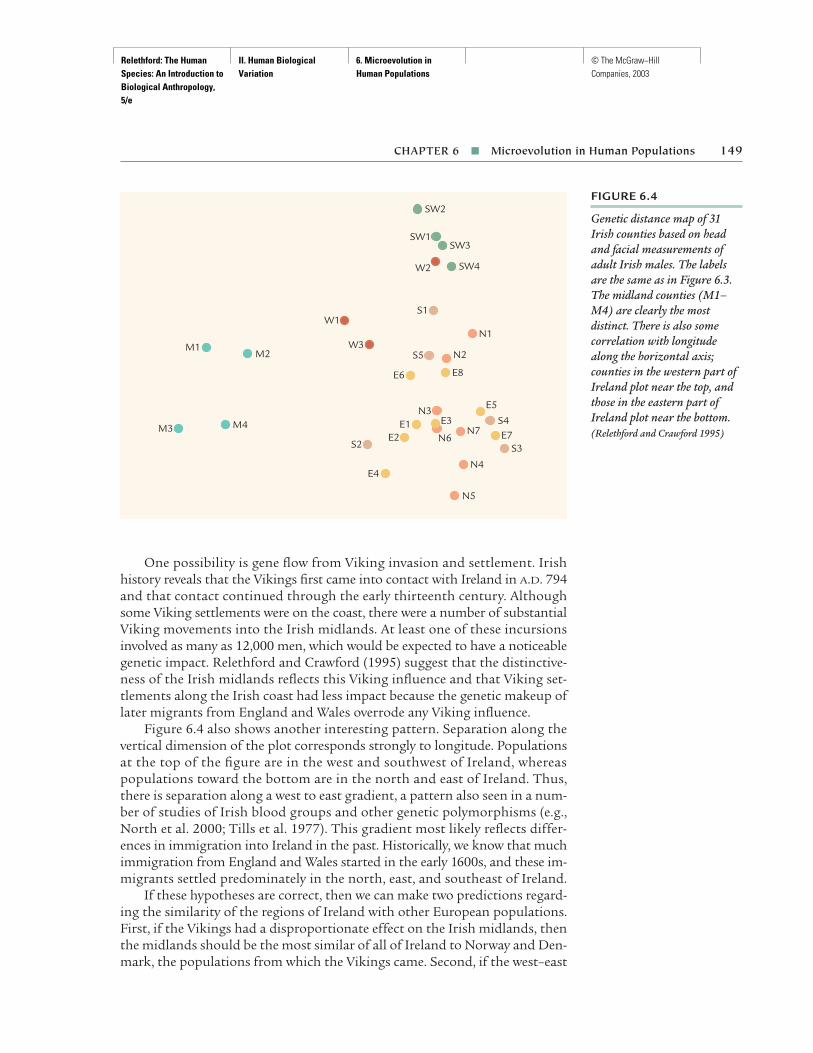
Relethford: The Human Species: An Introduction to Biological Anthropology, 5/e
II. Human Biological Variation
6. Microevolution in Human Populations
© The McGraw−Hill Companies, 2003
One possibility is gene flow from Viking invasion and settlement. Irishhistory reveals that the Vikings first came into contact with Ireland in A.D. 794and that contact continued through the early thirteenth century. Althoughsome Viking settlements were on the coast, there were a number of substantialViking movements into the Irish midlands. At least one of these incursionsinvolved as many as 12,000 men, which would be expected to have a noticeablegenetic impact. Relethford and Crawford (1995) suggest that the distinctive-ness of the Irish midlands reflects this Viking influence and that Viking set-tlements along the Irish coast had less impact because the genetic makeup oflater migrants from England and Wales overrode any Viking influence.
Figure 6.4 also shows another interesting pattern. Separation along thevertical dimension of the plot corresponds strongly to longitude. Populationsat the top of the figure are in the west and southwest of Ireland, whereaspopulations toward the bottom are in the north and east of Ireland. Thus,there is separation along a west to east gradient, a pattern also seen in a num-ber of studies of Irish blood groups and other genetic polymorphisms (e.g.,North et al. 2000; Tills et al. 1977). This gradient most likely reflects differ-ences in immigration into Ireland in the past. Historically, we know that muchimmigration from England and Wales started in the early 1600s, and these im-migrants settled predominately in the north, east, and southeast of Ireland.
If these hypotheses are correct, then we can make two predictions regard-ing the similarity of the regions of Ireland with other European populations.First, if the Vikings had a disproportionate effect on the Irish midlands, thenthe midlands should be the most similar of all of Ireland to Norway and Den-mark, the populations from which the Vikings came. Second, if the west–east
CHAPTER 6 ■ Microevolution in Human Populations 149
FIGURE 6.4
Genetic distance map of 31Irish counties based on headand facial measurements ofadult Irish males. The labelsare the same as in Figure 6.3.The midland counties (M1–M4) are clearly the mostdistinct. There is also somecorrelation with longitudealong the horizontal axis;counties in the western part ofIreland plot near the top, andthose in the eastern part ofIreland plot near the bottom.(Relethford and Crawford 1995)
M2M1
M3 M4
N5
E4
S2E2
E1
N4
S3E7N7
N6
E3N3 E5
S4
E8E6
N2S5
N1
S1
W3
W1
SW4W2
SW3SW1
SW2

Relethford: The Human Species: An Introduction to Biological Anthropology, 5/e
II. Human Biological Variation
6. Microevolution in Human Populations
© The McGraw−Hill Companies, 2003
gradient is due to immigrants from England and Wales, then the easterncounties of Ireland should be the most similar to those populations. Releth-ford and Crawford (1995) compared their data with those from several otherEuropean countries. The genetic distance map, shown in Figure 6.5, confirmstheir hypotheses. The midlands plot more closely to Norway and Denmarkthan any other Irish sample, whereas the eastern part of Ireland is the mostsimilar to England.
CASE STUDIES OF NATURAL SELECTION
In this section we look at several examples of natural selection in human pop-ulations. Because natural selection operates differently on different loci, thefocus will be on individual loci or traits rather than on specific populations.
Hemoglobin, Sickle Cell, and MalariaPerhaps the best-known example of natural selection operating on a discretegenetic trait is the relationship of hemoglobin variants to malaria. One ofthe proteins in red blood cells is hemoglobin, which functions to transportoxygen to body tissues (see Chapter 2). The normal structure of the betachain of hemoglobin is coded for by an allele usually called hemoglobin A. In
150 PART II ■ Human Biological Variation
FIGURE 6.5
Genetic distance mapcomparing six regions ofIreland with data fromDenmark, Norway, andEngland. The genetic distanceswere based on head and facialmeasurements. The Irishmidlands are closest to Norway and Denmark, whosepopulations represent thesource of Viking invaders toIreland. This analysis supportsthe hypothesis of Viking geneflow. The closer proximity ofthe eastern, northern, andsouthern counties to Englandsupport the hypothesis thatEnglish immigration occurredprimarily in these parts ofIreland, and less so in the west.(Relethford and Crawford 1995)
Denmark
Norway
England
Irish midlands
West coast Ireland
North Ireland South Ireland
Southwest Ireland
East Ireland

Relethford: The Human Species: An Introduction to Biological Anthropology, 5/e
II. Human Biological Variation
6. Microevolution in Human Populations
© The McGraw−Hill Companies, 2003
many human populations, the A allele is the only one present, and as a resulteveryone has the AA, or normal adult hemoglobin, genotype.
Hemoglobin Variants Many hemoglobin variants are produced by the mu-tation of an A allele to another form. The most widely studied mutations in-clude hemoglobin S, C, and E. The S allele is also known as the sickle cell al-lele. A person who has two S alleles (genotype SS) has sickle cell anemia, acondition whereby the structure of the red blood cells is altered and oxygentransport is severely impaired (Figure 6.6). Untreated, few people with sicklecell anemia survive to adulthood.
If the S allele is harmful in homozygotes, we expect natural selection toeliminate S alleles from the population in such a way that the frequency of Sshould be relatively low. Mutation introduces the S allele, but natural selec-tion eliminates it. Indeed, in many parts of the world the frequency of S is ex-tremely low, fitting the model of mutation balanced by selection. In a numberof populations, however, the frequency of S is much higher—often between 5 percent and 20 percent. Such high frequencies seem paradoxical, given theharmful effect of the S allele in the homozygous genotype. Why does S reachsuch high frequencies? Genetic drift might seem likely, except for the defi-nite association of geography and higher frequencies of S. That is, higher fre-quencies of S occur only in certain environments. Genetic drift is randomand influenced by population size, not environment. If genetic drift were re-sponsible for the high frequencies of S, we would expect to see high frequen-cies in isolated groups in many different environments.
Distribution of the Sickle Cell Allele and Malaria The distribution of thesickle cell allele is related to the prevalence of a certain form of malaria. Malaria
CHAPTER 6 ■ Microevolution in Human Populations 151
FIGURE 6.6
Sickle cell anemia. The bloodcell to the left is twisted anddeformed compared to theround, normal red blood cells.(© Meckes/Ottawa/PhotoResearchers, Inc.)
sickle cell anemia A geneticdisease that occurs in aperson homozygous for thesickle cell allele, which altersthe structure of red bloodcells.
I I I I I I I

Relethford: The Human Species: An Introduction to Biological Anthropology, 5/e
II. Human Biological Variation
6. Microevolution in Human Populations
© The McGraw−Hill Companies, 2003
is an infectious disease—that is, a disease caused by the introduction intothe body of an organic foreign substance, such as a virus or parasite (a dis-ease that is not caused by an organic foreign substance is a noninfectiousdisease). Malaria is caused by a parasite that enters an organism’s body, andfour different species of the malarial parasite can affect humans. Malaria re-mains one of the major infectious diseases in the world today. The WorldHealth Organization (1997) estimates that there are between 300 million and500 million people in the world who have some form of malaria, of which anestimated 1.5 million to 2.7 million people die each year.
The Old World shows a striking correspondence between higher frequen-cies of the S allele (Figure 6.7) and the prevalence of malaria caused by theparasite Plasmodium falciparum (Figure 6.8). This parasite is spread throughthe bites of certain species of mosquitoes. Except through blood transfu-sions, humans cannot give malaria to one another directly. Those areas withfrequent cases of malaria, such as Central Africa, also have the highest fre-quencies of the sickle cell allele. The falciparum form of malaria, the mostserious of all forms of malaria, is often fatal.
152
S P E C I A L T O P I C
The Biological History of the Ancient EgyptiansThe ancient Egyptians have long been a source of fascina-tion. Egyptian civilization dates back roughly 5,000 yearsand is best known because of its many pyramids. Therehave been many debates over the origin of the ancientEgyptians. Some argue that this population is distinctlyrelated to Europeans, whereas others favor a sub-Saharanorigin. Still others suggest that the ancient Egyptians didnot come from any one specific group but rather repre-sent an in-place evolution in northeastern Africa, withcontact with other populations.
The origin of the ancient Egyptians has been arguedon the basis of archaeology and other clues. Here, we ex-amine what inferences can be made from patterns of bio-logical variation. One example is given. Genetic distanceswere computed among 13 samples of ancient skulls—three populations each from sub-Saharan Africa, Europe,the Far East, and Australia, and a sample from the an-cient Egyptians (26th–30th dynasties, dating between2550 and 2150 years B.P.). The data consisted of 57 mea-surements of the skull and face, provided by Dr. W. W.Howells (Howells 1989). These data were used to estimategenetic distances (Relethford and Blangero 1990).
Different patterns of genetic distances would resultdepending on which historical hypothesis was correct. If,for example, the ancient Egyptians came primarily fromEurope, then they should be most similar to Europeanpopulations. If they came from sub-Saharan Africa, then
they should be most similar to sub-Saharan African popu-lations. If, however, the ancient Egyptians were not theresult of primary movement from one region or another,then their biological relationships would be somewhereintermediate between other geographic regions.
The figure here shows the results very clearly. Theancient Egyptian sample does not cluster with either Euro-peans or sub-Saharan Africans. More extensive analyseshave shown similar results (Brace et al. 1993)—the ancientEgyptians are Egyptian. Their biological affinities reflecttheir geographic position more than anything else. Thefact that Egypt is part of the African continent does notmean that they are closer to other African populationsthan to non-African groups.
This analysis reveals an important feature of humanvariation. If we ignore Egypt for the moment, we can seefour recognizable clusters—Europe, sub-Saharan Africa,the Far East, and Australia. The clear separation of theseclusters seems to argue strongly for four distinct “races.”Or does it? By adding Egypt to the analysis, we see theproblem of inferring race from widespread geographicsamples; other populations fall in between, thus forcingus to add a fifth “race.” Of course, if we add still othergroups, we have to continually increase our number ofraces. Our image of distinct races often results from notusing a full sampling of humanity.
infectious disease A diseasecaused by the introductionof an organic foreignsubstance into the body.
noninfectious disease Adisease caused by factorsother than the introductionof an organic foreignsubstance into the body.
I I I I I I I

Relethford: The Human Species: An Introduction to Biological Anthropology, 5/e
II. Human Biological Variation
6. Microevolution in Human Populations
© The McGraw−Hill Companies, 2003
The strong geographic correspondence suggests that sickle cell anemiaand malaria are both related to the high frequencies of the S allele. Furtherexperimental work has confirmed this hypothesis. Because the S allele affectsthe structure of the red blood cells, it makes the blood an inhospitable placefor the malaria parasite.
In a malarial environment, people who are heterozygous (genotype AS)actually have an advantage. The presence of one S allele does not give theperson sickle cell anemia, but it does change the blood cells sufficiently sothat the malaria parasite does not have as serious an effect. Overall, the het-erozygote has the greatest fitness in a malarial environment. As discussed inChapter 3, this is a case of balancing selection, in which selection occurs forthe heterozygote (AS) and against both homozygotes (AA from malaria andSS from sickle cell anemia).
In addition to greater survival of the heterozygote in malarial environ-ments, it has also been suggested that women with genotype AS have greaterfertility. If so, then is selection for the heterozygote in environments withmalaria a function of differential mortality, differential fertility, or both?
153
Far East Egypt
Europe
Australia
Sub-Saharan Africa

Relethford: The Human Species: An Introduction to Biological Anthropology, 5/e
II. Human Biological Variation
6. Microevolution in Human Populations
© The McGraw−Hill Companies, 2003
Madrigal (1989) studied this problem by examining the hemoglobin geno-type and reproductive histories of women in Limon, Costa Rica. She foundthat there was no difference between AA and AS women for a number of mea-sures of differential fertility (family size, number of pregnancies, number oflive births, and number of spontaneous abortions). More recently, Hoff et al.(2001) conducted a study on almost 10,000 African American women in Mo-bile, Alabama, and found that women with the AS genotype had a highernumber of live births, suggesting the possibility that fertility does influenceselection for the S allele in some populations.
If the effects of sickle cell anemia and malaria were equal, then we wouldexpect the frequencies of the normal allele (A) and the sickle cell allele (S) ul-timately to reach equal frequencies. The two diseases, however, are not equalin their effects. Sickle cell anemia is much worse. The balance between thesetwo diseases is such that the maximum fitness of an entire population occurs
154 PART II ■ Human Biological Variation
FIGURE 6.7
Distribution of the sickle cell allele in the Old World.Compare high-frequency areaswith the high-frequency areasof malaria in Figure 6.8.
Frequency
<0.01 or 0
0.01–0.05
0.05–0.20
≥0.20

Relethford: The Human Species: An Introduction to Biological Anthropology, 5/e
II. Human Biological Variation
6. Microevolution in Human Populations
© The McGraw−Hill Companies, 2003
when the frequency of S is somewhere between 10 percent and 20 percent(Figure 6.9).
An analysis of one African population suggests that for every 100 peoplewith AS who survive to adulthood, 88 people with AA and only 14 of thosewith SS survive (Bodmer and Cavalli-Sforza 1976). Clearly, the relationshipamong hemoglobin, sickle cell anemia, and malaria represents a very strongcase of natural selection. Instead of a difference in survival between geno-types of only several percent, the differences are quite striking. Such differ-ences can lead to major changes in allele frequencies in a very short period oftime. To illustrate the rapidity of such change, Figure 6.10 shows a hypothet-ical example of changes in the frequency of the sickle cell allele. In this exam-ple, the initial frequency of S from mutation was set equal to a reasonable es-timate of 0.00001. The fitness values mentioned earlier were used to examinethe kind of change in the frequency of S that could take place. Because the
CHAPTER 6 ■ Microevolution in Human Populations 155
FIGURE 6.8
Regions where falciparummalaria is common (shown in green).
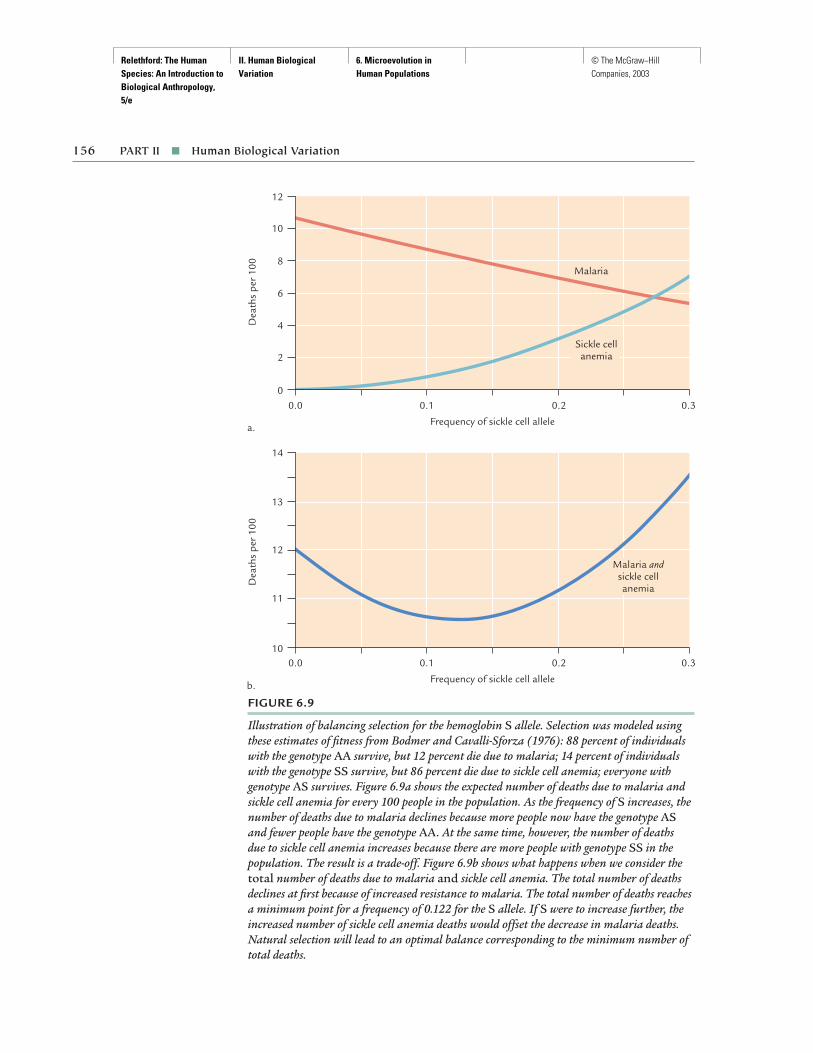
Relethford: The Human Species: An Introduction to Biological Anthropology, 5/e
II. Human Biological Variation
6. Microevolution in Human Populations
© The McGraw−Hill Companies, 2003
156 PART II ■ Human Biological Variation
FIGURE 6.9
Illustration of balancing selection for the hemoglobin S allele. Selection was modeled usingthese estimates of fitness from Bodmer and Cavalli-Sforza (1976): 88 percent of individualswith the genotype AA survive, but 12 percent die due to malaria; 14 percent of individualswith the genotype SS survive, but 86 percent die due to sickle cell anemia; everyone withgenotype AS survives. Figure 6.9a shows the expected number of deaths due to malaria andsickle cell anemia for every 100 people in the population. As the frequency of S increases, thenumber of deaths due to malaria declines because more people now have the genotype ASand fewer people have the genotype AA. At the same time, however, the number of deaths due to sickle cell anemia increases because there are more people with genotype SS in thepopulation. The result is a trade-off. Figure 6.9b shows what happens when we consider thetotal number of deaths due to malaria and sickle cell anemia. The total number of deathsdeclines at first because of increased resistance to malaria. The total number of deaths reachesa minimum point for a frequency of 0.122 for the S allele. If S were to increase further, theincreased number of sickle cell anemia deaths would offset the decrease in malaria deaths.Natural selection will lead to an optimal balance corresponding to the minimum number oftotal deaths.
14
Dea
ths
per 1
00
13
12
11
0.010
0.30.20.1
Frequency of sickle cell allele
12
Dea
ths
per 1
00
10
6
8
4
2
0.00
0.30.20.1
Frequency of sickle cell allele
Malaria
Sickle cellanemia
Malaria andsickle cellanemia
b.
a.

Relethford: The Human Species: An Introduction to Biological Anthropology, 5/e
II. Human Biological Variation
6. Microevolution in Human Populations
© The McGraw−Hill Companies, 2003
initial allele frequency is low, there is little change for the first 40 generationsor so. (Of course, if the initial allele frequency were higher, the rate of changewould be greater; a higher initial frequency could occur due to genetic driftor the initial occurrence of the mutation in a small population.) As the fre-quency of S increases, change takes place more rapidly because there are morepeople with the AS genotype to be selected for. After 100 generations, there islittle change in the frequency of the S allele because it has reached an equilib-rium based on the balance between the effects of sickle cell anemia andmalaria. In this example, the sickle cell allele would reach an equilibrium fre-quency of 0.122. Of course, this simple illustration does not take other evo-lutionary forces into account, but it does show how quickly allele frequen-cies can change under strong natural selection.
The sickle cell example clearly shows the importance of the specific envi-ronment on the process of natural selection. In a nonmalarial environment,the AS genotype has no advantage in terms of differential survival and the AAgenotype has the greatest evolutionary fitness. In such cases, the frequencyof the S allele is very low, approaching zero. In a malarial environment, how-ever, the situation is different and the heterozygote has the advantage. Clearly,we cannot label the S allele as intrinsically “good” or “bad”; it depends oncircumstances.
The example of sickle cell also shows that evolution has a price. The equi-librium is one in which the fitness for the entire population is at a maximum.The cost of the adaptation, however, is an increased proportion of individu-als with sickle cell anemia, because the frequency of S has increased. Peoplewith the heterozygous genotype AS have the greatest fitness, but they alsocarry the S allele. When two people with the AS genotype mate, they have a
CHAPTER 6 ■ Microevolution in Human Populations 157
FIGURE 6.10
Reconstruction of past changesin sickle cell allele frequency in malarial Africa. Thissimulation assumes an initialallele frequency of 0.00001caused by mutation. Relativefitness values are assumedconstant over time: AA = 88%,AS = 100%, SS = 14%. Thefirst 40 generations would showlittle change because the initialallele frequency was so low.After 40 generations, the allelefrequency would increaserapidly, reaching an equilibriumafter roughly 100 generations.
0.15
Freq
uenc
y of
sic
kle
cell
alle
le
00.00
200Generation
0.10
0.05
15010050

Relethford: The Human Species: An Introduction to Biological Anthropology, 5/e
II. Human Biological Variation
6. Microevolution in Human Populations
© The McGraw−Hill Companies, 2003
25 percent chance of having a child with sickle cell anemia (in the previous ex-ample, 1.5 percent of all children in a population are expected to have the SSgenotype). This is not advantageous from the perspective of the individualwith the disease. From the perspective of the entire population, however, it isthe most adaptive outcome. Every benefit in evolution is likely to carry a price.
Effects of Culture Change on Sickle Cell Frequency Sickle cell anemiaalso provides an excellent example of the interaction of biology and culture.Livingstone (1958) and others have taken information on the distributionand ecology of the malaria parasite and the mosquito that transmits it, alongwith information on the prehistory and history of certain regions in Africa,and have presented a hypothesis about changes in the frequency of the sicklecell allele. Several thousand years ago, the African environment was not con-ducive to the spread of malaria. Large areas of the continent consisted ofdense forests. The mosquito that spreads malaria thrives best in ample sun-light and pools of stagnant water. Neither condition then existed in theAfrican forests. The extensive foliage prevented much sunlight from reach-ing the floor of the forest. In addition, the forest environment was very ab-sorbent, so water did not tend to accumulate in pools. In other words, theenvironment was not conducive to large populations of mosquitoes. Conse-quently, the malaria parasite did not have a hospitable environment, either.
This situation changed several thousand years ago when prehistoricAfrican populations brought horticulture into the area. Horticulture is aform of farming employing only hand tools and no animal labor or irriga-tion. As the land was cleared for crops, the entire ecology shifted. Withoutthe many trees, it was easier for sunlight to reach the land surface. Contin-ued use of the land changed the soil chemistry, allowing pools of water to ac-cumulate. Both changes led to an environment ideal for the growth andspread of mosquito populations and therefore the spread of the malaria par-asite. The growth of the human population also provided more hosts for themosquitoes to feed on, thus increasing the spread of malaria.
Before the development of horticulture in Africa, the frequency of thesickle cell allele was probably low, as it is in nonmalarial environments today.When the incidence of malaria increased, it became evolutionarily advanta-geous to have the heterozygote AS genotype because those who had it wouldhave greater resistance to malaria without suffering the effects of sickle cellanemia. As shown earlier, this change could have taken place in a short pe-riod of time, roughly 100 generations, because of the large differences in fit-ness among hemoglobin genotypes. The initial introduction of the sickle cellallele, through mutation or gene flow, was followed by a rapid change, reach-ing an equilibrium point in which the fitness of the entire human popula-tion was at a maximum.
This scenario shows that human cultural adaptations (horticulture) canaffect the ecology of other organisms (the mosquito and malaria parasite),which can then cause genetic change in the human population (an increasein the frequency of the sickle cell allele). This sequence of events is summa-rized in Figure 6.11.
158 PART II ■ Human Biological Variation
horticulture A form offarming in which only simplehand tools are used.
I I I I I I I

Relethford: The Human Species: An Introduction to Biological Anthropology, 5/e
II. Human Biological Variation
6. Microevolution in Human Populations
© The McGraw−Hill Companies, 2003
Of course, we cannot observe these events directly because they occurredin the past. Nonetheless, all available evidence supports this hypothesis. Weknow the physiological differences between different hemoglobin types. Wealso know that low frequencies of S occur in nonmalarial environments andhigher frequencies occur where there is malaria. Archaeological evidenceshows when and where the spread of horticulture took place in Africa. Fromstudies of modern-day agriculture, we also know that malaria spreads quicklyfollowing the clearing of land. Taking all this information together, we findthat the scenario for changes in the frequency of the sickle cell allele in Africais most reasonable.
The study of human history also provides another example of the evolu-tion of the sickle cell allele. In African American populations, the frequencyof S ranges from 0.02 to 0.06, which is higher than the frequency in Euro-pean Americans (essentially zero) but less than that in malarial regions ofAfrica (Workman et al. 1963). The biological history of African Americansexplains part of this difference; some degree of European admixture hastaken place. This admixture would have the effect of reducing the frequencyof S in African Americans. Extensive calculations have shown, however, thatadmixture is not the only factor involved. Researchers found that if admix-ture alone were operating, then the frequency of S in African Americans shouldbe higher than it actually is. Another reason that the frequencies of the sicklecell allele are lower in African Americans than in West Africans is that nat-ural selection has been operating to remove the S allele from the population.In general, malaria has not been epidemic in the United States. The enslaved
CHAPTER 6 ■ Microevolution in Human Populations 159
FIGURE 6.11
Sequence of cultural andenvironmental changes leadingto changes in the frequency ofthe sickle cell allele in malarialAfrica.
Initial forest with few mosquitoes and little malaria
Humans arrive with horticulture
Forest ecology changes
Land is cleared Stagnant pools of water develop
Mosquito population increases
Malaria increases
Increased selection forAS heterozygotes
Frequency of the sickle cellallele increases
A balance is reachedbetween selection against
A and S alleles

Relethford: The Human Species: An Introduction to Biological Anthropology, 5/e
II. Human Biological Variation
6. Microevolution in Human Populations
© The McGraw−Hill Companies, 2003
people brought into the United States came from areas in Africa with highfrequencies of malaria and the sickle cell allele. When they arrived in theUnited States, there was no longer the same evolutionary advantage for highfrequencies of S because there was less malaria. As a result, the frequency of Shas been reduced through natural selection, along with European admixture.We might expect that the S allele will continue to decrease in frequency. How-ever, Hoff et al. (2001) suggest that selection for the heterozygote may con-tinue, even in the absence of selection due to malaria, because of higher fer-tility of women with the AS genotype.
Sickle cell anemia is a health problem among modern African Americans.During the 1960s there was a tendency to label sickle cell anemia as a “blackdisease.” The reason for higher levels of sickle cell anemia among AfricanAmericans has nothing to do with skin color but is rather the result of theirancestors coming from a malarial environment with high frequencies of theS allele. Sickle cell anemia is not confined to dark-skinned populations inAfrica. High frequencies of S are also found in malarial environments in partsof Europe, India, and South Asia.
Other Relationships with Malaria A number of other genetic loci appearto have been affected by natural selection from malaria. Two different allelesof the hemoglobin locus, C and E, appear in high frequencies in certainmalarial environments. Several inherited biochemical disorders, collectivelyknown as thalassemia, are also related to malaria. These disorders do not di-rectly affect the structure of the adult hemoglobin molecule but do interferewith its production. Another genetic trait, G6PD deficiency, leads to a defi-ciency of a certain enzyme and also appears to confer some resistance tomalaria. It is not surprising to find a number of loci related to malaria be-cause it is a severe disease, and any trait that alters the blood sufficiently toconfer resistance to the parasite might be selected for over time.
Blood Groups and Natural SelectionThe relationship between the sickle cell allele and malaria is the most well-studied example of natural selection for a discrete genetic trait in humanpopulations. It is often frustrating that the situation is not as clear for othertraits. The differences in fitness between different genotypes are often muchless than those seen for the hemoglobin locus. Also, we often find evidenceof multiple relationships between genetic traits and natural selection. It isoften difficult to determine which factor is the most important or which wasinitially responsible for the evolution of a trait.
The human blood groups have been the subject of many investigationsof natural selection. There are many different blood groups, defined on thebasis of the type of molecules present on the surface of the red blood cells.Some blood groups are associated with different antibodies that react to var-ious substances invading the blood stream (foreign antigens). Two bloodgroups—MN and ABO—have already been mentioned in previous chapters.
160 PART II ■ Human Biological Variation

Relethford: The Human Species: An Introduction to Biological Anthropology, 5/e
II. Human Biological Variation
6. Microevolution in Human Populations
© The McGraw−Hill Companies, 2003
Other red blood cell groups include Rhesus, Diego, Duffy, Lutheran, Lewis,and Xg, to name but a few. Some of these blood groups appear to be neutralin terms of natural selection, or perhaps we just have not been able to detectany effects. Also, some may have been selected for or against in the past, butnot at present. Others are definitely related to natural selection but in waysthat are difficult to discern.
Rhesus Blood Group The Rhesus blood group (also called the Rh bloodgroup) has a complicated mode of genetic inheritance involving three linkedloci called C, D, and E. One locus, D, is particularly important in terms ofnatural selection. This locus has two alleles, D and d, where D is dominant.Individuals with genotypes DD or Dd are called Rh positive, and those withgenotype dd are called Rh negative. Those with Rh positive blood have certainantigens in their red blood cells (D), and those with Rh negative blood canproduce an opposing antibody (anti-D). In terms of blood chemistry, anti-Dantibodies can destroy red blood cells with D molecules on their surface.
Selection occurs for the Rhesus blood group through Rhesus incom-patibility, a condition in which a pregnant woman and her fetus have in-compatible Rhesus blood groups. Rhesus incompatibility occurs when anRh negative mother has an Rh positive fetus. Normally, the circulatory systemsof mother and fetus are separate, but some fetal blood may enter the mother’sbloodstream at the time of delivery. The fetus’s blood carries D molecules.When these molecules enter the mother’s bloodstream, the mother’s im-mune system produces anti-D antibodies to destroy the red blood cells carry-ing these “invaders.” Once produced, the antibodies can leak back to destroyblood cells of a fetus. The destruction of fetal blood cells leads to a form ofanemia that can be fatal (Figure 6.12). Interestingly, Rhesus incompatibility
CHAPTER 6 ■ Microevolution in Human Populations 161
FIGURE 6.12
Sequence of events in Rhesusincompatibility between anRh− mother and an Rh+ fetus.Because it normally takes timeto produce anti-D antibodies,the first Rh+ fetus is notaffected. Subsequent Rh+
fetuses, however, are affected.
1. 2. Anti-D antibodiesfrom mother’s blood enter fetalblood, causing destruction ofred blood cells
Rh– mother
Rh+ fetus
Fetal blood containing D molecules enters mother’s bloodstream, causing production of anti-D antibodies
Rhesus incompatibilityA condition in which apregnant woman and herfetus have incompatibleRhesus blood groupphenotypes.
I I I I I I I

Relethford: The Human Species: An Introduction to Biological Anthropology, 5/e
II. Human Biological Variation
6. Microevolution in Human Populations
© The McGraw−Hill Companies, 2003
is generally not a problem for the first Rh positive fetus born to the mother.The antibodies need time to be produced, and the first Rh positive infant’sblood is rarely affected.
Today, Rhesus incompatibility is less of a problem than it once was be-cause we can check blood types and use various techniques to control its ef-fects. In the past, and even in many parts of the world today, this anemiaoften resulted in death. From an evolutionary standpoint, this is selectionagainst the heterozygote. An Rh negative mother has genotype dd, which meansthat the fetus will receive a d allele from her. A fetus with a d allele from themother requires a D allele from the father to be Rh positive. The fetus willthen have the heterozygous genotype Dd. We also know that the father of aheterozygous fetus is Rh positive because that is the only way he could con-tribute a D allele to the fetus. Table 6.1 lists all possible matings between a manand woman according to their genotypes.
Selection against the heterozygote eliminates both alleles (D and d ) fromthe population in equal amounts, since each heterozygote contains, by defin-ition, one of each allele (Dd ). Given enough time, this type of selection willresult in the loss of the allele that was initially less common. Therefore, weshould see the total elimination of one allele or the other. Although the D al-lele is more common in human populations today, the d allele has not beeneliminated; in fact, it is relatively high in a number of human populations.This observation shows that selection against the heterozygote is not theonly factor that has affected the evolution of the Rhesus blood group. It ispossible that there might be some sort of balancing selection acting to keepthe d allele from disappearing.
ABO Blood Group The ABO blood group is the most widely studied sim-ple genetic trait in human populations. As shown in Chapters 2 and 3, thereare three different alleles (A, B, O) in this group: A and B are codominant andO is recessive. There are four possible phenotypes: type A (genotypes AA and
162 PART II ■ Human Biological Variation
TA B L E 6 .1 Possible Rhesus-incompatible Matings
Mother FatherIncompatible
Genotype Phenotype Genotype Phenotype Mating
DD Rh+ DD Rh+ NoDD Rh+ Dd Rh+ NoDD Rh+ dd Rh− NoDd Rh+ DD Rh+ NoDd Rh+ Dd Rh+ NoDd Rh+ dd Rh− Nodd Rh− DD Rh+ Yes, 100%dd Rh− Dd Rh+ Yes, 50%dd Rh− dd Rh− No

Relethford: The Human Species: An Introduction to Biological Anthropology, 5/e
II. Human Biological Variation
6. Microevolution in Human Populations
© The McGraw−Hill Companies, 2003
AO), type B (genotypes BB and BO), type O (genotype OO), and type AB (geno-type AB).
Worldwide, the O allele is the most common in almost all human popu-lations, followed by A and B. There is considerable variation in the ABO al-leles among populations. The frequency of the O allele ranges from 0.46 to1.0, the frequency of the A allele ranges from 0 to 0.5, and the frequency ofthe B allele ranges from 0 to 0.34 (Roychoudhury and Nei 1988). These allelefrequencies cannot be explained solely by mutation. Although there are nu-merous examples of the influence of genetic drift and gene flow on the ABOfrequencies, there is also strong evidence that natural selection has contrib-uted significantly to the observed variation.
One possible clue to the effects of natural selection on the ABO bloodgroups is that certain antibodies are associated with different blood groups.Recall from Chapter 5 that there are two antibodies in the ABO system: anti-Aand anti-B. Unlike the Rhesus system, the ABO antibodies are present through-out an individual’s life. The anti-A antibody reacts to destroy A-type mole-cules, and the anti-B antibody reacts to destroy B-type molecules. There is noantibody for O. People with blood type A have the anti-B antibody, peoplewith blood type B have the anti-A antibody, people with blood type O haveboth, and people with blood type AB have neither (Table 6.2).
The fact that different blood types have different antibodies also has im-plications for natural selection and susceptibility to different diseases. If youhave blood type A, and hence anti-B antibodies, your immune system willtend to fight off any microorganisms that are biochemically similar to type Bmolecules. For example, the microorganism that causes venereal syphilis isbiochemically similar to A molecules. Therefore, people with blood types Band O will have greater resistance to syphilis because they have the anti-A antibodies. People with blood types A and AB will not have this resistancebecause they lack the anti-A antibodies. It has been suggested that a link ex-ists between various ABO blood types and a number of infectious diseases,such as smallpox, typhoid, influenza, bubonic plague, and others. Many ofthese diseases were indeed serious in the past, and differential resistancecould be a possible factor in explaining the range of allele frequencies for theABO system.
CHAPTER 6 ■ Microevolution in Human Populations 163
TA B L E 6 . 2 ABO Blood Group Phenotypes and Antibodies
Genotypes Phenotypes Antigens Antibodies
AA A A anti-BAOBB B B anti-ABOAB AB A, B noneOO O none anti-A, anti-B

Relethford: The Human Species: An Introduction to Biological Anthropology, 5/e
II. Human Biological Variation
6. Microevolution in Human Populations
© The McGraw−Hill Companies, 2003
In any case, the action of natural selection is complex because of the widevariety of different disease microorganisms and their relationships to ABOblood types. It has been suggested that each blood type is more susceptiblethan others to certain diseases. For example, type A seems more susceptibleto smallpox, type B seems more susceptible to infantile diarrhea, and type Oseems more susceptible to bubonic plague. If these hypotheses are verified, itseems that the frequencies of the ABO alleles are subject to a variety of differ-ent types of selection. This makes analysis extremely difficult.
ABO blood types also appear to be related to noninfectious diseases. Somehospital studies have suggested that people with blood type O have a greaterchance of getting duodenal and stomach ulcers (this might be related to an-tibodies because recent work has confirmed that some ulcers are actually in-fectious in nature, being caused by bacteria). People with blood type A have agreater chance of getting certain forms of cancer. The differences betweenthe phenotypes appear strong, but we do not understand the reasons for theseassociations. In any case, it is unclear what evolutionary importance theseassociations have. Most of the noninfectious diseases have severe effects latein life and therefore should not be subject to natural selection because theyusually occur after an individual’s reproductive life is over. Some people,however, do acquire these diseases early enough in life so that at least thepossibility exists that natural selection could be operating through differentialsurvival to noninfectious diseases. We must demonstrate, however, that suchselection did (or does) in fact take place, and not merely that it is possible.
Natural selection may also be operating on ABO blood groups becauseof incompatibility between mother and fetus, leading to destruction of redblood cells in the fetus. Incompatibility occurs when the fetus has an antigennot present in the mother, such as the mother having type A blood and thefetus having type B blood. Here, the fetus has an antigen (B) not present inthe mother, and the mother has the antibody (anti-B) that destroys thesefetal red blood cells. Often, ABO incompatibility will lead to spontaneousabortion of the fetus (miscarriage). All possible types of incompatibility areshown in Table 6.3. Note that in each case the fetal genotype is a heterozy-gote. Under selection against heterozygotes we would ultimately expect tosee the less common alleles (A, B) disappear, and this has not happened.
164 PART II ■ Human Biological Variation
TA B L E 6 . 3 ABO Blood Group Maternal-Fetal Incompatibilities
Mother’s IncompatibleGenotype Fetal Genotypes
AA ABAO AB, BOBB ABBO AB, AOAB noneOO AO, BO

Relethford: The Human Species: An Introduction to Biological Anthropology, 5/e
II. Human Biological Variation
6. Microevolution in Human Populations
© The McGraw−Hill Companies, 2003
However, there might be some selective advantage in some incompatiblepregnancies. Bottini et al. (2001) looked at the blood types of infants born towomen who had a history of recurrent spontaneous abortion and comparedthese with infants born to a sample of healthy pregnancies. They found thatthere were a greater number of infants born to mothers with the anti-B anti-body than born to mothers with the anti-A antibody. Thus, ABO incompati-ble pregnancies, where the mother had anti-B, seem to be at an advantage.Bottini et al. suggest that there is some sort of protective effect in such preg-nancies, although it is not yet clear how this works. Differential fitness mightexplain some of the variation in ABO allele frequencies seen in our species.
Duffy Blood Group A striking association has been found between infec-tious disease and the Duffy blood group system. There are three alleles forthe Duffy blood group: Fya, Fyb, and Fy. The Fy allele is also referred to asthe Duffy negative allele and is recessive. Individuals with two Duffy nega-tive alleles (the genotype FyFy) are completely resistant to a form of malariacaused by the parasite Plasmodium vivax (the earlier example of sickle celldealt with a different parasite—Plasmodium falciparum). It has been suggestedthat the vivax parasite enters the blood by clinging to Fya or Fyb molecules.Individuals with the FyFy genotype lack both of these molecules and aretherefore resistant to the vivax parasite.
The worldwide distribution of the Duffy negative allele, however, is some-what confusing. The highest frequencies are found in West and Central Africa,often reaching 100 percent, but it is virtually absent in most of Europe andAsia. In areas where the frequency of the Duffy negative allele is high, vivaxmalaria is absent. At first glance, we might expect the opposite—given the re-sistance of the Duffy negative allele, we might expect higher frequencies inareas where vivax malaria was common. Livingstone (1984) has suggestedthat this negative correlation is a reflection of past evolution. By chance, somepopulations developed higher frequencies of the Duffy negative allele (per-haps because of genetic drift). The preexisting high frequency of the Duffynegative allele prevented the introduction and spread of vivax malaria inthese populations. This is a good example of how chance variations may pro-vide an evolutionary advantage in some environments.
Lactase Persistence and Lactose IntoleranceAs mammals, human infants receive nourishment from mothers’ milk. In-fants produce an enzyme, lactase, which allows milk sugar to be digested. Inmost human populations, lactase production stops by around 5 years of age.Some individuals, however, possess a dominant allele that results in the abil-ity to produce lactase throughout their adult life, a condition known as lac-tase persistence. Individuals with the recessive homozygote (who do nothave the dominant allele) will not produce lactase later in life and have dif-ficulty digesting milk, a condition known as lactose intolerance, which leadsto diarrhea, cramps, and other intestinal problems (Beall and Steegmann 2000).
CHAPTER 6 ■ Microevolution in Human Populations 165
lactase persistenceThe ability to produce theenzyme lactase after 5 yearsof age.
lactose intolerance Acondition characterized bydiarrhea, cramps, and otherintestinal problems resultingfrom the ingestion of milk.
I I I I I I I
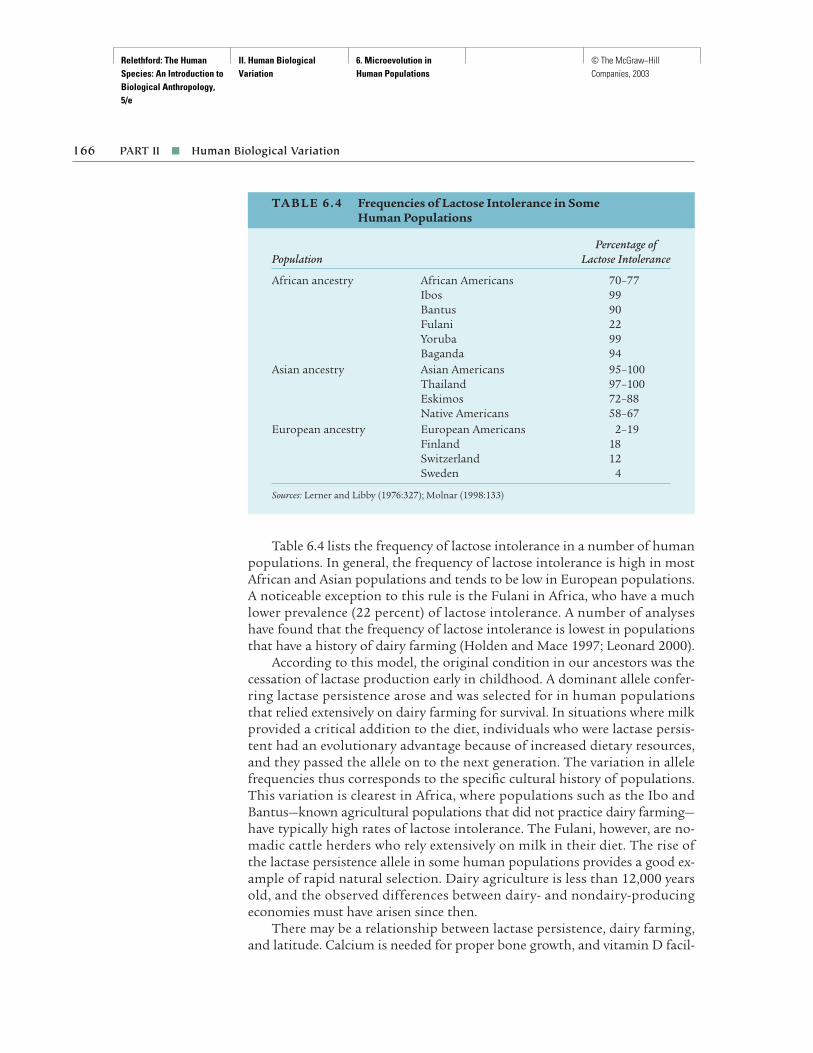
Relethford: The Human Species: An Introduction to Biological Anthropology, 5/e
II. Human Biological Variation
6. Microevolution in Human Populations
© The McGraw−Hill Companies, 2003
Table 6.4 lists the frequency of lactose intolerance in a number of humanpopulations. In general, the frequency of lactose intolerance is high in mostAfrican and Asian populations and tends to be low in European populations.A noticeable exception to this rule is the Fulani in Africa, who have a muchlower prevalence (22 percent) of lactose intolerance. A number of analyseshave found that the frequency of lactose intolerance is lowest in populationsthat have a history of dairy farming (Holden and Mace 1997; Leonard 2000).
According to this model, the original condition in our ancestors was thecessation of lactase production early in childhood. A dominant allele confer-ring lactase persistence arose and was selected for in human populationsthat relied extensively on dairy farming for survival. In situations where milkprovided a critical addition to the diet, individuals who were lactase persis-tent had an evolutionary advantage because of increased dietary resources,and they passed the allele on to the next generation. The variation in allelefrequencies thus corresponds to the specific cultural history of populations.This variation is clearest in Africa, where populations such as the Ibo andBantus—known agricultural populations that did not practice dairy farming—have typically high rates of lactose intolerance. The Fulani, however, are no-madic cattle herders who rely extensively on milk in their diet. The rise ofthe lactase persistence allele in some human populations provides a good ex-ample of rapid natural selection. Dairy agriculture is less than 12,000 yearsold, and the observed differences between dairy- and nondairy-producingeconomies must have arisen since then.
There may be a relationship between lactase persistence, dairy farming,and latitude. Calcium is needed for proper bone growth, and vitamin D facil-
166 PART II ■ Human Biological Variation
TA B L E 6 . 4 Frequencies of Lactose Intolerance in Some Human Populations
Percentage ofPopulation Lactose Intolerance
African ancestry African Americans 70–77Ibos 99Bantus 90Fulani 22Yoruba 99Baganda 94
Asian ancestry Asian Americans 95–100Thailand 97–100Eskimos 72–88Native Americans 58–67
European ancestry European Americans 2–19Finland 18Switzerland 12Sweden 4
Sources: Lerner and Libby (1976:327); Molnar (1998:133)

Relethford: The Human Species: An Introduction to Biological Anthropology, 5/e
II. Human Biological Variation
6. Microevolution in Human Populations
© The McGraw−Hill Companies, 2003
itates the absorption of calcium. Before the introduction of vitamin D intofood products, the major source of vitamin D was the sun, as ultraviolet ra-diation is needed for the synthesis of vitamin D. Ultraviolet radiation isstrongest at the equator and less strong further north or south of the equa-tor. Populations living farther from the equator would thus be at increasedrisk for inadequate vitamin D production and would therefore have prob-lems with calcium absorption and bone growth. In such environments, theability to digest lactose throughout one’s life would be an advantage becauselactose increases calcium absorption (Allen and Cheer 1996; Beall and Steeg-mann 2000). Although the frequency of lactose intolerance does correlate tosome extent with latitude, the relationship is far from perfect, as illustratedby the Fulani case. It may be the case that specific dietary requirements relat-ing to calcium absorption influenced selection for lactase persistence in somepopulations, while the general need for improved nutrition was a factor inothers.
Research by Allen and Cheer (1996) suggests that the evolution of lactasepersistence may be evolutionarily related to rates of noninsulin-dependentdiabetes mellitus (NIDDM, also sometimes referred to as adult-onset dia-betes), a disease characterized by the inability to metabolize glucose, a simplesugar. NIDDM has often been viewed as due to a “thrifty genotype” that ledto metabolic efficiency in earlier times when the diet was low on simple sugar.When human diet changed, this genotype was no longer beneficial and re-sulted in diabetes. Allen and Cheer argue that as human populations dev-eloped dairy farming, there was an increase in the amount of lactose in thediet, thus leading to an increased risk of diabetes. According to Allen andCheer, diabetes became the “price” paid by the development of dairy farm-ing; a good potential example of how human cultural change can rapidly af-fect our biology.
Studies of lactase persistence illustrate that we need to consider biologi-cal variation and evolutionary change when making policy decisions. In theUnited States, which has a large dairy economy, milk is regarded as an essen-tial part of a “normal” diet. We think of milk as intrinsically good and in thepast have sent milk to people in less developed nations in the belief that whatis good for us must be good for them. It soon became clear, however, thatmany of these people were lactose intolerant and that milk was not good forthem. Health and dietary policies must always consider biological and cul-tural diversity.
Skin ColorHuman skin color is a complex trait. It has a strong genetic component(Williams-Blangero and Blangero 1992) and is also affected by the environ-ment, particularly the amount of direct sunlight.
The Biology of Skin Color One pigment, melanin, is responsible for themajority of variation in lightness and darkness in skin color. Melanin is a
CHAPTER 6 ■ Microevolution in Human Populations 167

Relethford: The Human Species: An Introduction to Biological Anthropology, 5/e
II. Human Biological Variation
6. Microevolution in Human Populations
© The McGraw−Hill Companies, 2003
168 PART II ■ Human Biological Variation
FIGURE 6.13
Geographic distribution ofhuman skin color for 102 maleOld World samples. Circlesindicate the mean skinreflectance measured at awavelength of 685 nanometersplotted against latitude.Negative values of latitudecorrespond to the SouthernHemisphere (below theequator), and positive values of latitude correspond to theNorthern Hemisphere (abovethe equator). The solid lineindicates the best-fitting curve relating skin color andlatitude. Closer analysis showsthat skin color is darker in theSouthern Hemisphere than inthe Northern Hemisphere atequivalent distance from theequator. (Adapted from Relethford1997)
SouthernHemisphere
NorthernHemisphere
Latitude
–40 –30 –20 –10 0 10 20 30 40 50 60
45
35
25
15
75
65
55
Dar
ker
Ligh
ter
Skin
ref
lect
ance
(%
)
brown pigment secreted by cells in the bottom layer of the skin. Much of thevariation in melanin may be due to variation in two major genes that affectthe tyrosinase enzyme, which affects melanin production (Sturm et al. 1998).
Another pigment affecting skin color is hemoglobin, which gives oxy-genated blood cells their red color. Light-skinned people have little melaninnear the surface of the skin and so the red color shows through. Because ofthis effect, “white” people are actually “pink.”
Skin color is also affected to a certain extent by sex and age. In general,males are darker than females, probably because of differential effects of sexhormones on melanin production. Age also produces variation. The skin dark-ens somewhat during adolescence, particularly in females.
The Distribution of Human Skin Color As mentioned in the previouschapter, human skin color is measured by the percentage of light reflectedoff the skin at a given wavelength of light. Figure 6.13 shows the worldwidedistribution of human skin color based on data from 102 male samples fromthe Old World. Skin color is darkest at the equator and tends to be lighterwith the increasing distance from the equator, north or south. Closer inves-tigation shows that there is also a hemispheric difference—skin color tendsto be darker in the Southern Hemisphere (below the equator) than in theNorthern Hemisphere, even at equivalent latitudes (Relethford 1997). Thedistribution of skin color and latitude corresponds to the amount of ultra-violet radiation received at the earth’s surface. Because of the way sunlightstrikes the earth, ultraviolet radiation is strongest at the equator and dimin-ishes in strength away from the equator. Further, ultraviolet radiation tends
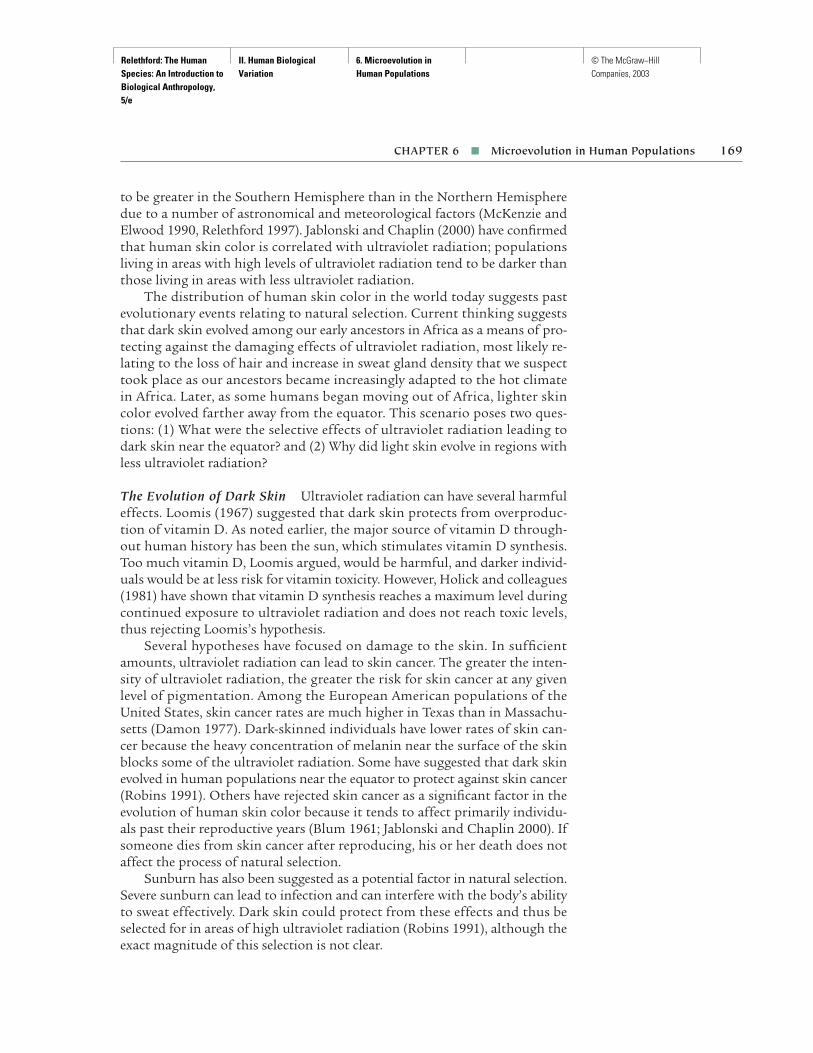
Relethford: The Human Species: An Introduction to Biological Anthropology, 5/e
II. Human Biological Variation
6. Microevolution in Human Populations
© The McGraw−Hill Companies, 2003
to be greater in the Southern Hemisphere than in the Northern Hemispheredue to a number of astronomical and meteorological factors (McKenzie andElwood 1990, Relethford 1997). Jablonski and Chaplin (2000) have confirmedthat human skin color is correlated with ultraviolet radiation; populationsliving in areas with high levels of ultraviolet radiation tend to be darker thanthose living in areas with less ultraviolet radiation.
The distribution of human skin color in the world today suggests pastevolutionary events relating to natural selection. Current thinking suggeststhat dark skin evolved among our early ancestors in Africa as a means of pro-tecting against the damaging effects of ultraviolet radiation, most likely re-lating to the loss of hair and increase in sweat gland density that we suspecttook place as our ancestors became increasingly adapted to the hot climatein Africa. Later, as some humans began moving out of Africa, lighter skincolor evolved farther away from the equator. This scenario poses two ques-tions: (1) What were the selective effects of ultraviolet radiation leading todark skin near the equator? and (2) Why did light skin evolve in regions withless ultraviolet radiation?
The Evolution of Dark Skin Ultraviolet radiation can have several harmfuleffects. Loomis (1967) suggested that dark skin protects from overproduc-tion of vitamin D. As noted earlier, the major source of vitamin D through-out human history has been the sun, which stimulates vitamin D synthesis.Too much vitamin D, Loomis argued, would be harmful, and darker individ-uals would be at less risk for vitamin toxicity. However, Holick and colleagues(1981) have shown that vitamin D synthesis reaches a maximum level duringcontinued exposure to ultraviolet radiation and does not reach toxic levels,thus rejecting Loomis’s hypothesis.
Several hypotheses have focused on damage to the skin. In sufficientamounts, ultraviolet radiation can lead to skin cancer. The greater the inten-sity of ultraviolet radiation, the greater the risk for skin cancer at any givenlevel of pigmentation. Among the European American populations of theUnited States, skin cancer rates are much higher in Texas than in Massachu-setts (Damon 1977). Dark-skinned individuals have lower rates of skin can-cer because the heavy concentration of melanin near the surface of the skinblocks some of the ultraviolet radiation. Some have suggested that dark skinevolved in human populations near the equator to protect against skin cancer(Robins 1991). Others have rejected skin cancer as a significant factor in theevolution of human skin color because it tends to affect primarily individu-als past their reproductive years (Blum 1961; Jablonski and Chaplin 2000). Ifsomeone dies from skin cancer after reproducing, his or her death does notaffect the process of natural selection.
Sunburn has also been suggested as a potential factor in natural selection.Severe sunburn can lead to infection and can interfere with the body’s abilityto sweat effectively. Dark skin could protect from these effects and thus beselected for in areas of high ultraviolet radiation (Robins 1991), although theexact magnitude of this selection is not clear.
CHAPTER 6 ■ Microevolution in Human Populations 169

Relethford: The Human Species: An Introduction to Biological Anthropology, 5/e
II. Human Biological Variation
6. Microevolution in Human Populations
© The McGraw−Hill Companies, 2003
Jablonski and Chaplin (2000) argue that the potential selective effects ofskin cancer and sunburn are minimal and that the most significant factorleading to darker skin in equatorial populations was the damaging effect ofultraviolet radiation on folate levels in the body. Folic acid, a necessary nutri-ent, is converted into folate in the body. Ultraviolet radiation can destroy fo-late, leading to several serious consequences. Folate deficiency has been linkedto disorders in developing fetuses, including an increase in neutral tube de-fects, which reduces survivability. Folate levels also affect reproductive capa-bilities; folate deficiency can disrupt the production of sperm and lead tomale infertility. Jablonski and Chaplin suggest that photodestruction of fo-late has serious consequences for both mortality and fertility and that darkskin evolved for protection in areas with high levels of ultraviolet radiation.Although it remains possible that there were selective consequences result-ing from skin cancer and sunburn, the evidence to date suggests that photo-destruction of folate was the primary mechanism.
The Evolution of Light Skin As some humans moved farther from equato-rial regions, they lived in areas with lower levels of ultraviolet radiation andconsequently the risks from ultraviolet radiation decreased. Lighter skinnedindividuals would be at less risk from folate deficiency (as well as sunburnand skin cancer if they are indeed selective factors). This does not explainwhy light skin evolved farther from the equator, however, only that it couldevolve. To construct a complete model for the evolution of human skin colorvariation, we need to have one or more reasons why light skin would havebeen adaptive farther from the equator. In the absence of such reasons, wewould not expect a strong correlation with latitude. Factors that explain theevolution of dark skin near the equator do not explain light skin farther fromthe equator.
The most widely accepted model for the evolution of light skin focuses onthe synthesis of vitamin D. As noted earlier, the major source of vitamin Dthroughout human history and prehistory has been the sun because ultra-violet radiation stimulates vitamin D synthesis. Today we may receive vita-min D through vitamin supplements or through the injection of vitamin Dinto our milk. Both of these dietary modifications are recent human inven-tions, however. Formerly, humans had to obtain their vitamin D throughdiet or through stimulation of chemical compounds by ultraviolet radiation.Some foods, such as fish oils, are high in vitamin D but are not found in allenvironments. For most human populations in the past, the major source ofvitamin D was the sun.
Vitamin D deficiency can cause a number of problems relating to poorbone development and maintenance, including diseases such as rickets,which leads to deformed bones. Such health hazards can affect fertility aswell as mortality. One frequent consequence of childhood rickets is the de-formation of a woman’s pelvis, an effect which can hinder or prevent suc-cessful childbirth. In one U.S. study, only 2 percent of European Americanwomen had such pelvic deformities as compared to 15 percent of African
170 PART II ■ Human Biological Variation

Relethford: The Human Species: An Introduction to Biological Anthropology, 5/e
II. Human Biological Variation
6. Microevolution in Human Populations
© The McGraw−Hill Companies, 2003
American women (Molnar 1998). This difference presumably relates to skincolor; darker women are unable to absorb enough vitamin D for healthy bonegrowth.
Vitamin D deficiency can be linked to the evolution of light skin. As dis-cussed previously, dark skin protects against the harmful effects of ultra-violet radiation in populations near the equator where ultraviolet radiationis the most intense. As human populations moved away from the equator,these risks declined and the risk for vitamin D deficiency increased becausedarker skin blocked too much ultraviolet radiation. Natural selection thusproduced a change toward lighter skin color that would be adaptive in suchenvironments.
Temperature has also been suggested as a factor in the evolution of lightskin. Because temperature is roughly correlated with latitude, some have sug-gested that the correlation between human skin color and latitude is actuallya reflection of a link between skin color and cold adaptation. Reviewing awide range of data, Post and colleagues (1975) noted that, in cold climates,dark-skinned individuals are at greater risk for frostbite than light-skinnedindividuals. Data reporting this difference are available on soldiers duringthe first and second World Wars and the Korean War. During the KoreanWar, African American soldiers were more than four times as likely to getfrostbite as European American soldiers. Closer analysis of the data showsthat this difference persists even after controlling for other sociological andhealth factors. These observations suggest that in the colder northern cli-mates darker skin is more prone to cold injury than lighter skin, a hypothe-sis supported by laboratory experiments on piebald guinea pigs (having bothlight and dark skin). Cold injury could be induced more frequently and moreseverely in the darker patches of skin. Beall and Steegmann (2000) questionthe cold-injury hypothesis, noting that the higher rates of frostbite amongAfrican and African American soldiers reflect differences in vascular re-sponses to cold, and not skin color. They also note that the guinea pig dataare not useful because the temperatures involved in the lab experiments arenot typical of those experienced during human evolution and are thereforenot relevant.
There has been considerable debate over causal factors in the evolutionof human skin color and their relative importance. As noted by Jablonskiand Chaplin (2000), current evidence suggests that the primary reason forthe evolution of human skin color is the balance between the need for darkerskin to protect against photodestruction of folate and the need for lighterskin to facilitate vitamin D synthesis. At any given latitude, the optimal skincolor reflects the balance between these risks. Near the equator, the primaryrisk is folate deficiency, leading to darker skin for protection. As we go far-ther from the equator, this risk decreases and the risk for vitamin D defi-ciency increases, thus leading to lighter and lighter skin color farther andfarther from the equator (Figure 6.14). It is possible that other factors, suchas protection against sunburn near the equator, also contribute to the ob-served correspondence between skin color and latitude.
CHAPTER 6 ■ Microevolution in Human Populations 171
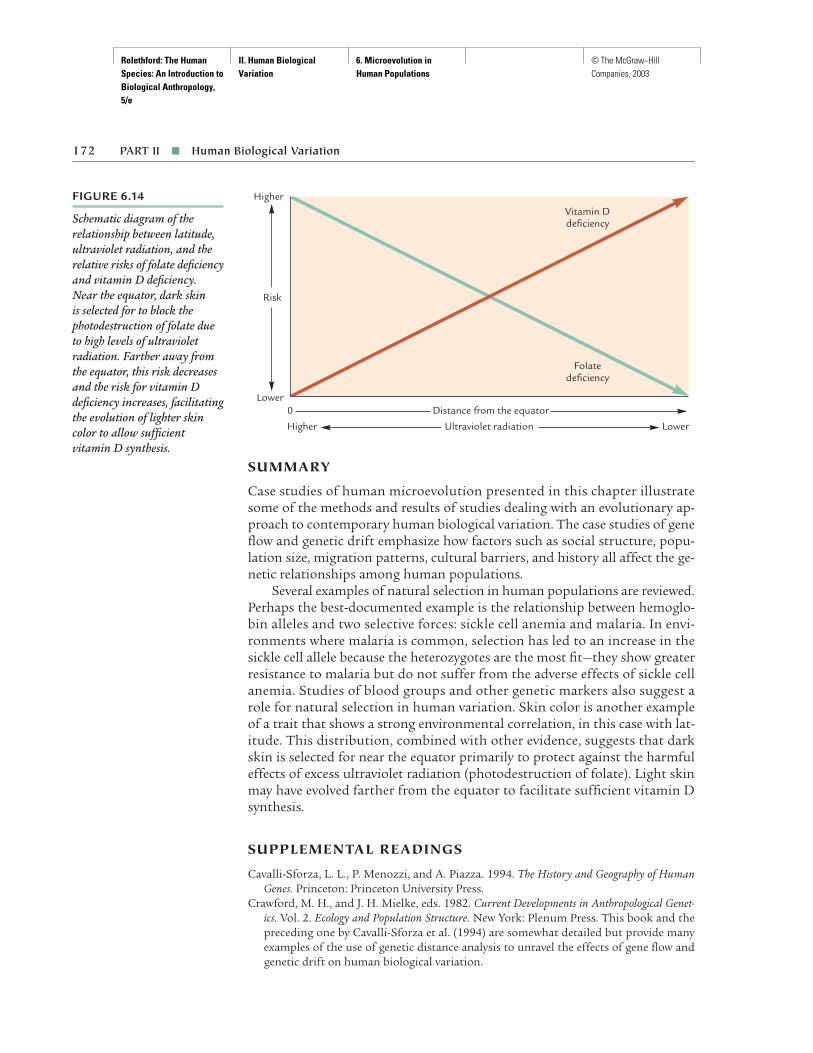
Relethford: The Human Species: An Introduction to Biological Anthropology, 5/e
II. Human Biological Variation
6. Microevolution in Human Populations
© The McGraw−Hill Companies, 2003
172 PART II ■ Human Biological Variation
FIGURE 6.14
Schematic diagram of therelationship between latitude,ultraviolet radiation, and therelative risks of folate deficiencyand vitamin D deficiency.Near the equator, dark skin is selected for to block thephotodestruction of folate dueto high levels of ultravioletradiation. Farther away fromthe equator, this risk decreasesand the risk for vitamin Ddeficiency increases, facilitatingthe evolution of lighter skincolor to allow sufficientvitamin D synthesis.
Higher
Risk
0Lower
Distance from the equator
Ultraviolet radiationHigher Lower
Vitamin Ddeficiency
Folatedeficiency
SUMMARY
Case studies of human microevolution presented in this chapter illustratesome of the methods and results of studies dealing with an evolutionary ap-proach to contemporary human biological variation. The case studies of geneflow and genetic drift emphasize how factors such as social structure, popu-lation size, migration patterns, cultural barriers, and history all affect the ge-netic relationships among human populations.
Several examples of natural selection in human populations are reviewed.Perhaps the best-documented example is the relationship between hemoglo-bin alleles and two selective forces: sickle cell anemia and malaria. In envi-ronments where malaria is common, selection has led to an increase in thesickle cell allele because the heterozygotes are the most fit—they show greaterresistance to malaria but do not suffer from the adverse effects of sickle cellanemia. Studies of blood groups and other genetic markers also suggest arole for natural selection in human variation. Skin color is another exampleof a trait that shows a strong environmental correlation, in this case with lat-itude. This distribution, combined with other evidence, suggests that darkskin is selected for near the equator primarily to protect against the harmfuleffects of excess ultraviolet radiation (photodestruction of folate). Light skinmay have evolved farther from the equator to facilitate sufficient vitamin Dsynthesis.
SUPPLEMENTAL READINGS
Cavalli-Sforza, L. L., P. Menozzi, and A. Piazza. 1994. The History and Geography of HumanGenes. Princeton: Princeton University Press.
Crawford, M. H., and J. H. Mielke, eds. 1982. Current Developments in Anthropological Genet-ics. Vol. 2. Ecology and Population Structure. New York: Plenum Press. This book and thepreceding one by Cavalli-Sforza et al. (1994) are somewhat detailed but provide manyexamples of the use of genetic distance analysis to unravel the effects of gene flow andgenetic drift on human biological variation.

Relethford: The Human Species: An Introduction to Biological Anthropology, 5/e
II. Human Biological Variation
6. Microevolution in Human Populations
© The McGraw−Hill Companies, 2003
Jablonski, N.G., and G. Chaplin. 2000. The evolution of human skin coloration. Journal ofHuman Evolution 39: 57–106. This long article provides the best current review and syn-thesis regarding the evolution of human skin color.
Stinson, S., B. Bogin, R. Huss-Ashmore, and D. O’Rourke. 2000. Human Biology: An Evolu-tionary and Biocultural Perspective. New York: John Wiley & Sons. A comprehensive vol-ume consisting of review chapters on a variety of topics relating to human populationbiology. Many chapters include valuable summaries of topics considered here, includ-ing population history, genetic polymorphisms, lactase persistence, and skin color.
INTERNET RESOURCES
http://anthro.palomar.edu/blood/default.htmHuman Blood, a review of the genetics of ABO and Rh blood groups.
http://anthro.palomar.edu/vary/vary_3.htmDistribution of Blood Types, including maps of the distribution of the ABOalleles.
http://jove.prohosting.com/∼scarfex/blood/groups.htmlHuman Blood Group Systems, which provides information on the geneticsof 26 different blood group systems.
CHAPTER 6 ■ Microevolution in Human Populations 173

Relethford: The Human Species: An Introduction to Biological Anthropology, 5/e
II. Human Biological Variation
7. Human Adaptation © The McGraw−Hill Companies, 2003
C H A P T E R 7Human Adaptation
175
As discussed in Chapter 1, adaptation is the successful interaction of apopulation with its environment. Thus far, adaptation has been dis-
cussed in terms of genetic adaptation—that is, natural selection. In this chap-ter, we examine a broader perspective. Central to the study of adaptation isthe concept of stress, broadly defined as any factor that interferes with thenormal limits of operation of an organism. Organisms maintain these limitsthrough an ability known as homeostasis. As ways of dealing with thestresses that alter your body’s functioning, adaptations restore homeostasis.For example, within normal limits, your body maintains a relatively constantbody temperature. When you stand outside in a cold wind, you may shiver.This is your body’s way of adapting to cold stress. You might also choose toput on a heavy jacket.
As human beings, we can adapt both biologically and culturally. It is im-portant to note, however, that our biocultural nature can work against us. Inadapting to stresses culturally, we can introduce other stresses as a result ofour behavior. Pollution, for example, is a consequence of cultural change thathas had a negative impact on our physical environment in numerous ways.
Key to the interaction between human biology and culture, human adap-tation operates on a number of levels—physiologic, developmental, genetic,and cultural—all of which are interrelated, for better or for worse. Thus, coun-tering a biological stress such as disease by the cultural adaptation of medi-cine can lower the death rate for human populations but can also increase
Sherpas in Nepal returning from a trip to Mount Everest. The Sherpa are anexample of a population that has adapted, both biologically and culturally, tothe stresses of living at high altitudes. (© Bobby Model/National Geographic SocietyImage Collection)
▲
stress Any factor thatinterferes with the normallimits of operation of anorganism.
homeostasis In aphysiologic sense, themaintenance of normallimits of body functioning.
I I I I I I I
Relethford: The Human Species: An Introduction to Biological Anthropology, 5/e
II. Human Biological Variation
7. Human Adaptation © The McGraw−Hill Companies, 2003
population size, which in turn can lead to further stresses, such as foodshortages and environmental degradation.
TYPES OF ADAPTATION
How do humans adapt? What are the different ways we have to cope with thestresses of the physical and cultural environments?
Physiologic, Genetic, and Cultural AdaptationBesides genetic and cultural adaptation, humans are capable of three otherforms of adaptation that are physiologic in nature: acclimation, acclimatiza-tion, and developmental acclimatization. Acclimation refers to short-termchanges that occur very quickly after exposure to a stress, such as sweatingwhen you are hot. Acclimatization refers to physiologic changes that takelonger, from days to months, such as an increase in red blood cell produc-tion after moving to a high-altitude environment. When a change occursduring the physical growth of any organism, it is known as developmentalacclimatization. An example (covered later in the chapter) is the increase inchest size that occurs when a person grows up in high altitudes. The abilityof organisms to respond physiologically or developmentally to environmen-tal stresses is often referred to as plasticity.
Adaptation to Ultraviolet Radiation: An ExampleA focus on ultraviolet radiation is a useful way of coming to grips with someof the basic concepts of adaptation. As mentioned in Chapter 6, excessive ul-traviolet radiation can cause a number of problems. How have humansadapted, or attempted to adapt, to this stress?
Short-term exposure to ultraviolet radiation results in darkening of theskin, or tanning, which can take two different forms. Immediate tanning dark-ens the skin within 1 to 2 hours and fades away during the first 24 hoursafter exposure. Delayed tanning is a more gradual process caused by repeatedexposure. Delayed tanning begins within 2 to 3 days of initial exposure andreaches a maximum after 19 days. The effects of delayed tanning can last aslong as 9.5 months (Robins 1991). From a physiologic perspective, tanning isa response to skin cell damage. Delayed tanning is an adaptive responsewhereby darkening of the skin provides some protection against further dam-age. Immediate tanning does not appear to be effective in this respect.
Tanning is not the only form of adaptation to ultraviolet radiation. Thereis strong evidence that in equatorial regions dark skin evolved in response tothe stress of excessive levels of ultraviolet radiation (Chapter 6). Individualswith darker skin were more likely to survive and therefore more likely to pass
176 PART II ■ Human Biological Variation
acclimation Short-termphysiologic responses to astress, usually within minutesor hours.
acclimatization Long-termphysiologic responses to astress, usually taking fromdays to months.
developmentalacclimatization Changesin organ or body structurethat occur during thephysical growth of anyorganism.
plasticity The ability of an organism to respond physiologically or developmentally toenvironmental stress.
I I I I I I I

Relethford: The Human Species: An Introduction to Biological Anthropology, 5/e
II. Human Biological Variation
7. Human Adaptation © The McGraw−Hill Companies, 2003
on the genes for darker skin to the next generation. In other words, naturalselection produced a genetic adaptation.
Cultural adaptations can also deal with exposure to ultraviolet radiation.If your occupation or leisure activity increases your risk of exposure, you canwear protective clothing, such as hats or long-sleeved garments, or applychemical sunscreens. Changes in the hours you work or play outdoors can alsohelp minimize exposure. With the growing concern about skin cancer in theUnited States, increasing numbers of people are turning to behaviors thatprovide protection from ultraviolet radiation, or at least minimize exposure.
CLIMATE AND HUMAN ADAPTATION
Though originally tropical primates, we humans have managed to expandinto virtually every environment on our planet. Such expansion has beenpossible largely because of multiple adaptations to the range of tempera-tures around the world.
Physiologic Responses to Temperature StressAs warm-blooded creatures, humans have the ability to maintain a constantbody temperature. This homeostatic quality works well only under certainlimits.
Cold Stress When you are cold, your body is losing heat too rapidly. Oneresponse is to increase heat production temporarily through shivering, whichalso increases your metabolic rate. This response is not very efficient and iscostly in terms of energy. A more efficient physiologic response to cold stressis minimization of heat loss through alternate constriction and dilation ofblood vessels. Vasoconstriction, the narrowing of blood vessels, reducesblood flow and heat loss. Vasodilation, the opening of the blood vessels,serves to increase blood flow and heat loss. These responses are examples ofacclimation to cold stress.
When a person is first subjected to cold stress, vasoconstriction acts tominimize the loss of heat from the body to the extremities (i.e., the hands,feet, and face). As a result, skin temperature drops. This response becomesdangerous, however, if it continues too long. Should this start to happen, vaso-dilation begins, causing blood and heat to flow from the interior of the bodyto the extremities. The increased blood flow prevents damage to the extremi-ties, but now the body is losing heat again! Neither vasoconstriction nor vaso-dilation by itself provides an effective physiologic response to cold stress. Bothmust operate, back and forth, to maintain a balance between heat loss anddamage to the extremities.
An interesting phenomenon occurs after initial exposure to cold stress.The cycles of alternating vasoconstriction and vasodilation, accompanied by
CHAPTER 7 ■ Human Adaptation 177
vasoconstriction Thenarrowing of blood vessels,which reduces blood flowand heat loss.
vasodilation The openingof the blood vessels, whichincreases blood flow andheat loss.
I I I I I I I

Relethford: The Human Species: An Introduction to Biological Anthropology, 5/e
II. Human Biological Variation
7. Human Adaptation © The McGraw−Hill Companies, 2003
alternating cycles of cold and warm skin temperatures, begin to level out, be-coming more frequent and less extreme. Skin temperature changes morequickly, but the increases and decreases are not as great. This pattern, calledthe Lewis hunting phenomenon, demonstrates how effective the body’s ability isto adapt. The smaller and more frequent cycles are more efficient (Figure 7.1).
Heat Stress When experiencing heat stress, your body is not removing heatquickly enough. There are four ways in which heat is lost from the body, threeof which can also increase heat (Frisancho 1993). Radiation is heat flow fromobjects in the form of electromagnetic radiation. The body removes heatthrough radiation but also picks up heat radiated by other objects. Convec-tion refers to the removal or gain of heat through air molecules. Heat flowsfrom a warm object to a cooler object. Conduction is heat exchange throughphysical contact with another object, such as the ground or clothes. Conduc-tion generally accounts for a very small proportion of heat exchange. Evapo-ration is the loss of heat through the conversion of water to vapor. In the pro-cess of sweat evaporation, heat energy is consumed. Evaporation is the onlyone of these four mechanisms that results in heat loss without heat gain.
The amount of heat loss through these mechanisms varies according toboth temperature and humidity. As the temperature increases, the only wayyour body can cope is to increase the amount of evaporation (your body can’tamplify any of the other three mechanisms). As a result, evaporation is themost effective mechanism for heat removal in excessively hot temperatures.At comfortable temperatures, most heat is lost through radiation, and evap-oration accounts for only 23 percent of the total lost. At hot temperatures(35° C = 95° F), evaporation accounts for 90 percent. Vasodilation is also im-portant in heat loss. The opening of the blood vessels helps remove internalheat to the outside skin. The heat can then be transferred to the environmentthrough radiation, convection, and evaporation.
178 PART II ■ Human Biological Variation
FIGURE 7.1
The Lewis huntingphenomenon. Initial exposureof a finger into ice waterproduces a decrease in skintemperature, caused byvasoconstriction. After a while,this response gives way tovasodilation, which causes skintemperature to increase. Thecycles continue over time butbecome more frequent and lessextreme, thus providing moreefficient adaptation. (Modifiedafter Frisancho [1993:85])
Warm
Time after exposure to ice water
Cold
Skin
tem
pera
ture
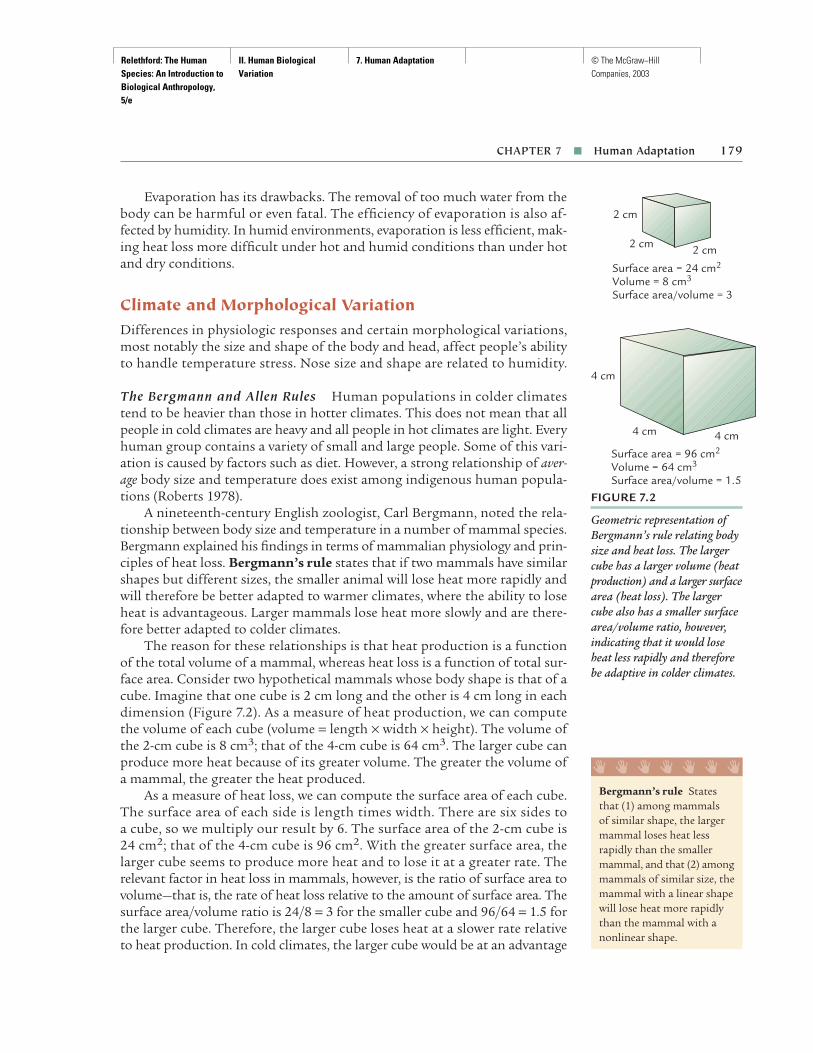
Relethford: The Human Species: An Introduction to Biological Anthropology, 5/e
II. Human Biological Variation
7. Human Adaptation © The McGraw−Hill Companies, 2003
Evaporation has its drawbacks. The removal of too much water from thebody can be harmful or even fatal. The efficiency of evaporation is also af-fected by humidity. In humid environments, evaporation is less efficient, mak-ing heat loss more difficult under hot and humid conditions than under hotand dry conditions.
Climate and Morphological VariationDifferences in physiologic responses and certain morphological variations,most notably the size and shape of the body and head, affect people’s abilityto handle temperature stress. Nose size and shape are related to humidity.
The Bergmann and Allen Rules Human populations in colder climatestend to be heavier than those in hotter climates. This does not mean that allpeople in cold climates are heavy and all people in hot climates are light. Everyhuman group contains a variety of small and large people. Some of this vari-ation is caused by factors such as diet. However, a strong relationship of aver-age body size and temperature does exist among indigenous human popula-tions (Roberts 1978).
A nineteenth-century English zoologist, Carl Bergmann, noted the rela-tionship between body size and temperature in a number of mammal species.Bergmann explained his findings in terms of mammalian physiology and prin-ciples of heat loss. Bergmann’s rule states that if two mammals have similarshapes but different sizes, the smaller animal will lose heat more rapidly andwill therefore be better adapted to warmer climates, where the ability to loseheat is advantageous. Larger mammals lose heat more slowly and are there-fore better adapted to colder climates.
The reason for these relationships is that heat production is a functionof the total volume of a mammal, whereas heat loss is a function of total sur-face area. Consider two hypothetical mammals whose body shape is that of acube. Imagine that one cube is 2 cm long and the other is 4 cm long in eachdimension (Figure 7.2). As a measure of heat production, we can computethe volume of each cube (volume = length × width × height). The volume ofthe 2-cm cube is 8 cm3; that of the 4-cm cube is 64 cm3. The larger cube canproduce more heat because of its greater volume. The greater the volume ofa mammal, the greater the heat produced.
As a measure of heat loss, we can compute the surface area of each cube.The surface area of each side is length times width. There are six sides to a cube, so we multiply our result by 6. The surface area of the 2-cm cube is24 cm2; that of the 4-cm cube is 96 cm2. With the greater surface area, thelarger cube seems to produce more heat and to lose it at a greater rate. Therelevant factor in heat loss in mammals, however, is the ratio of surface area tovolume—that is, the rate of heat loss relative to the amount of surface area. Thesurface area/volume ratio is 24/8 = 3 for the smaller cube and 96/64 = 1.5 forthe larger cube. Therefore, the larger cube loses heat at a slower rate relativeto heat production. In cold climates, the larger cube would be at an advantage
CHAPTER 7 ■ Human Adaptation 179
FIGURE 7.2
Geometric representation ofBergmann’s rule relating bodysize and heat loss. The largercube has a larger volume (heatproduction) and a larger surfacearea (heat loss). The largercube also has a smaller surfacearea/volume ratio, however,indicating that it would loseheat less rapidly and thereforebe adaptive in colder climates.
2 cm
2 cm 2 cm
Surface area = 24 cm2
Volume = 8 cm3
Surface area/volume = 3
4 cm
4 cm 4 cm
Surface area = 96 cm2
Volume = 64 cm3
Surface area/volume = 1.5
Bergmann’s rule Statesthat (1) among mammals of similar shape, the largermammal loses heat lessrapidly than the smallermammal, and that (2) amongmammals of similar size, themammal with a linear shapewill lose heat more rapidlythan the mammal with anonlinear shape.
I I I I I I I

Relethford: The Human Species: An Introduction to Biological Anthropology, 5/e
II. Human Biological Variation
7. Human Adaptation © The McGraw−Hill Companies, 2003
because it loses heat less quickly. In hot climates, the reverse would be true;hot climates would favor the smaller cube, with its quicker rate of heat loss.
Another aspect of Bergmann’s rule involves the shape of an object andits relationship to heat production and loss. Figure 7.3 shows two objectswith the same volume but different shapes. The first object is a 4-cm cubewith a volume of 64 cm3, a surface area of 96 cm2, and a surface area/volumeratio of 1.5. The second object is a rectangular block 2 cm wide, 4 cm deep,and 8 cm high. The volume of this block is also 64 cm3. The surface area is112 cm2, and the surface area/volume ratio is 112/64 = 1.75. Even thoughboth objects produce the same amount of heat as measured by their volumes,the rectangular block loses heat more quickly. Linear objects such as the blockwould be at an advantage in hot climates, whereas less linear objects such asthe cube would be at an advantage in cold climates. Accordingly, Bergmann’srule predicts that mammals in hot climates will have linear body shapes andmammals in cold climates will have less linear body shapes. Another zoolo-gist, J. Allen, applied these principles to body limbs and other appendages.Allen’s rule predicts that mammals in cold climates should have shorter,bulkier limbs, whereas mammals in hot climates should have longer, nar-rower ones.
Body Size and Shape Do the Bergmann and Allen rules hold for humanbody size and shape? Figure 7.4 shows a Masai cattle herder from Africa andan Inuit (Eskimo) man. Note the thinness and length of the Masai’s bodyand limbs. Those of the Inuit are shorter and bulkier. These physiques do infact conform to Bergmann’s and Allen’s predictions. Analysis of data frommany human populations has found the rules to be accurate in describing theaverage trends among populations in the world today as well as in the past(Ruff 1994). Again, don’t forget that extensive variation exists within popu-lations. Also, some populations are exceptions to the general rule. Africanpygmies, for example, are short and have short limbs, yet they live in a hotclimate. The pygmy’s short size appears to be due to a hormonal deficiency(Shea and Gomez 1988).
The Bergmann and Allen rules apply to adult human body size and shape.Are these average patterns the result of natural selection (i.e., genetic adapta-tion) or changes in size and shape during the growth process (i.e., develop-mental acclimatization)? Do infants born elsewhere who move into an envi-ronment attain the same adult size and shape as native-born infants? If so,this suggests a direct influence of the environment on growth. If not, then thegrowth pattern leading to a certain adult size and shape may be genetic in na-ture and determined by natural selection. If the growth pattern is entirely ge-netic, then we may expect to see the same ultimate size and shape regardlessof environment. That is, an infant born in a cold climate but raised in a hotclimate would still show the characteristic size and shape of humans born incold climates. Of course, if both environmental and genetic factors are respon-sible for adult size and shape, then the expected pattern is more complex. Un-raveling the potential genetic and climatic effects is a difficult process becauseother contributing influences, such as nutrition, also vary with climate.
180 PART II ■ Human Biological Variation
FIGURE 7.3
Geometric representation ofBergmann’s rule relating bodyshape and heat loss. The cubehas a lower surface area/volumeratio than the rectangularblock and would therefore loseheat less rapidly.
Surface area = 96 cm2
Volume = 64 cm3
Surface area/volume = 1.5
2 cm
8 cm
4 cm
Surface area = 112 cm2
Volume = 64 cm3
Surface area/volume = 1.75
4 cm
4 cm4 cm
Allen’s rule States thatmammals in cold climatestend to have short, bulkylimbs, allowing less loss of body heat, whereasmammals in hot climatestend to have long, slenderlimbs, allowing greater loss of body heat.
I I I I I I I
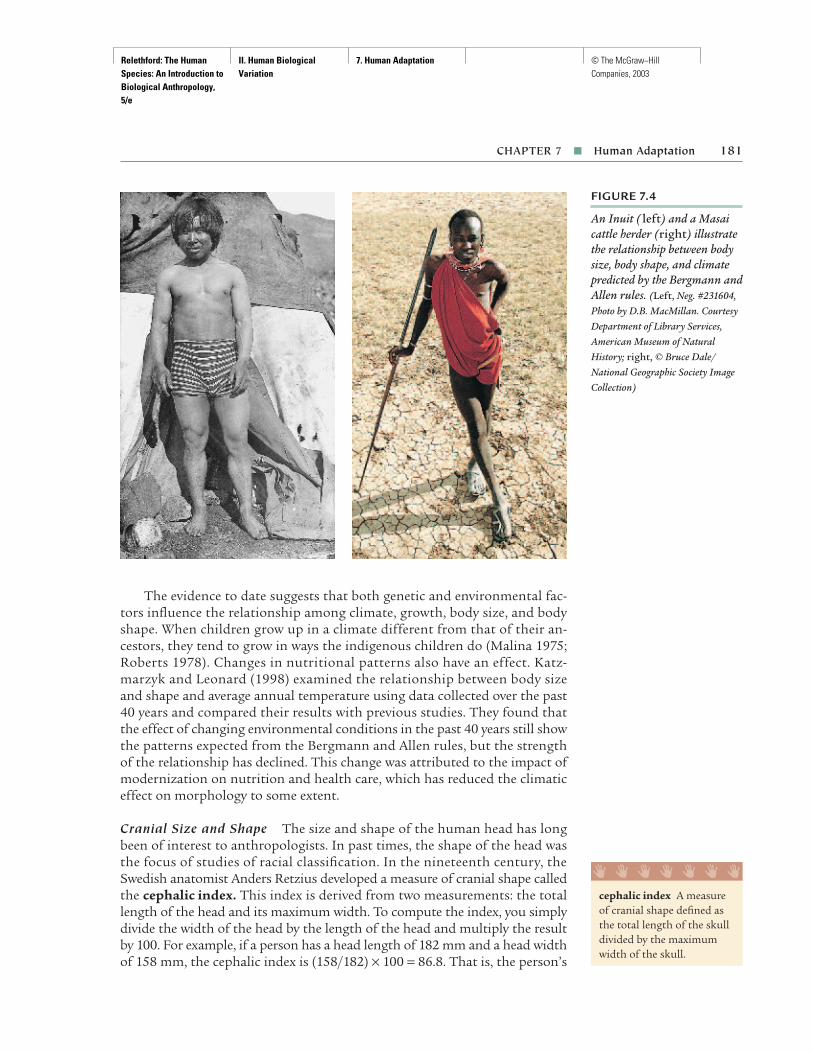
Relethford: The Human Species: An Introduction to Biological Anthropology, 5/e
II. Human Biological Variation
7. Human Adaptation © The McGraw−Hill Companies, 2003
The evidence to date suggests that both genetic and environmental fac-tors influence the relationship among climate, growth, body size, and bodyshape. When children grow up in a climate different from that of their an-cestors, they tend to grow in ways the indigenous children do (Malina 1975;Roberts 1978). Changes in nutritional patterns also have an effect. Katz-marzyk and Leonard (1998) examined the relationship between body sizeand shape and average annual temperature using data collected over the past40 years and compared their results with previous studies. They found thatthe effect of changing environmental conditions in the past 40 years still showthe patterns expected from the Bergmann and Allen rules, but the strengthof the relationship has declined. This change was attributed to the impact ofmodernization on nutrition and health care, which has reduced the climaticeffect on morphology to some extent.
Cranial Size and Shape The size and shape of the human head has longbeen of interest to anthropologists. In past times, the shape of the head wasthe focus of studies of racial classification. In the nineteenth century, theSwedish anatomist Anders Retzius developed a measure of cranial shape calledthe cephalic index. This index is derived from two measurements: the totallength of the head and its maximum width. To compute the index, you simplydivide the width of the head by the length of the head and multiply the resultby 100. For example, if a person has a head length of 182 mm and a head widthof 158 mm, the cephalic index is (158/182) × 100 = 86.8. That is, the person’s
CHAPTER 7 ■ Human Adaptation 181
FIGURE 7.4
An Inuit ( left) and a Masaicattle herder (right) illustratethe relationship between bodysize, body shape, and climatepredicted by the Bergmann andAllen rules. (Left, Neg. #231604,Photo by D.B. MacMillan. CourtesyDepartment of Library Services,American Museum of NaturalHistory; right, © Bruce Dale/National Geographic Society ImageCollection)
cephalic index A measureof cranial shape defined asthe total length of the skulldivided by the maximumwidth of the skull.
I I I I I I I

Relethford: The Human Species: An Introduction to Biological Anthropology, 5/e
II. Human Biological Variation
7. Human Adaptation © The McGraw−Hill Companies, 2003
head width is almost 87 percent of head length. Among human populationstoday, the cephalic index ranges from roughly 70 percent to 90 percent.
At first, cranial shape was felt to be a measurement capable of determin-ing racial groupings. For example, African skulls were found to have lowercephalic indices than European skulls. Further study showed rough agree-ment but also produced many examples of overlap and similar values in dif-ferent populations. For example, both Germans and Koreans have averagecephalic indices of about 83 percent. Likewise, both African pygmies andGreenland Eskimos have average cephalic indices of approximately 77 per-cent (Harrison et al. 1988). These values do not correspond to any racial clas-sification; they represent averages for each population. There is also consider-able variation within each population.
As more data were obtained and compared geographically, a differentpattern emerged—a correspondence was found to exist between cranial shapeand climate. Beals (1972) examined the cephalic index and climate around theworld. He found a direct relationship: Populations in colder climates tend tohave wider skulls relative to length than those in hot climates (Figure 7.5). Inparticular, he found the average cephalic index for populations that experi-enced winter frost to be higher than for those in tropical environments.
This correspondence makes sense in terms of the Bergmann and Allenrules. The shape of the upper part of the skull is related to heat loss.Rounded heads (those with a high cephalic index) lose heat slowly and there-fore are at an advantage in cold climates. Narrow heads lose heat morequickly and are therefore at an advantage in hot climates. It appears that ashuman populations moved into colder climates, natural selection led to achange in the relative proportions of the skull. Beals and colleagues (1983)have extended this analysis to fossil human crania over the past 1.5 millionyears and found similar results.
Nasal Size and Shape The shape of the nasal opening in the skull is an-other morphological variation that has a strong relationship to climate. Thenasal index is the width of the nasal opening divided by the height of the
182 PART II ■ Human Biological Variation
FIGURE 7.5
Relationship between cranialshape (cephalic index) andaverage annual temperatureacross the world. The solid lineindicates the best-fitting linearequation. The cephalic index is greater (broader head) incolder climates because a roundshape has a lower surface area/volume ratio, which minimizesheat loss. (Source of data: KennethBeals, unpublished data)
75
80
85
90
Broaderheads
Narrowerheads
95
Cep
halic
inde
x (%
)
70
-7.5 0.0 7.5 15.0 22.5 30.0-15.0
Average annual temperature (ºC)
nasal index A measure of the shape of the nasalopening, defined as thewidth of the nasal openingdivided by the height.
I I I I I I I

Relethford: The Human Species: An Introduction to Biological Anthropology, 5/e
II. Human Biological Variation
7. Human Adaptation © The McGraw−Hill Companies, 2003
nasal opening, multiplied by 100. Typical values of the nasal index range fromroughly 64 percent to 104 percent (Molnar 1998). Stereotypic racial views as-sociate wide noses (large nasal indices) with African peoples. Although it istrue that some African populations have very wide noses, others have long,narrow noses.
Numerous studies have found positive associations between the averagenasal index of populations and average temperature. Populations in cold cli-mates tend to have narrow noses; those in hot climates tend to have widenoses. Relationships have also been found between average nasal index andaverage humidity. Populations in dry climates tend to have narrow noses;those in humid climates tend to have wide noses (Franciscus and Long 1991).The mucous membranes of the nose serve to warm and moisten incomingair. High, narrow noses can warm air to a greater extent than low, wide nosesand therefore may be more adaptive in cold climates. High, narrow noses alsohave a greater internal surface area with which to moisten air and are thusmore adaptive in dry climates.
Cultural AdaptationsIn Western societies, we tend to take cultural adaptations to temperaturestress for granted. Housing, insulated clothing, heaters, air conditioners, andother technologies are all around us. How do people in other cultures adaptto excessive cold or heat?
Cold Stress The Inuit, or Eskimo people, of the Arctic have realized effec-tive cultural adaptations to cold stress, most notably in their clothing andshelter. It is not enough just to wear a lot of clothes to stay warm; if you workhard, you tend to overheat. The Inuit wear layered clothing, trapping air be-tween layers to act as an insulator. Outer layers can be removed if a personoverheats. Also, the Inuit design their clothing with multiple flaps that canbe opened to prevent buildup of sweat while working.
While out hunting or fishing, the Inuit frequently construct temporarysnow shelters, or igloos, that are quite efficient protection from the cold. Theice is an excellent insulator, and its reflective surface helps retain heat (Fig-ure 7.6). More permanent shelters also provide ample protection from thecold. Inuit houses have an underground entry, which is curved to reduce in-coming wind. Inside, the main living area lies at a higher level than the fire-place; this architectural feature serves to increase heat and minimize drafts(Moran 1982).
Not all cold-weather housing is as effective as the types constructed by theInuit. Among the Quechua Indians of the Peruvian highlands, the tempera-ture inside temporary houses is often not much warmer than it is outside.However, these shelters do provide protection against rain and to some ex-tent the cold. The bedding used by the Quechua is their most effective protec-tion against heat loss (Frisancho 1993).
Heat Stress Human populations live in environments that are dry and hot(i.e., deserts) and that are humid and hot (i.e., tropical rain forests). Moran
CHAPTER 7 ■ Human Adaptation 183

Relethford: The Human Species: An Introduction to Biological Anthropology, 5/e
II. Human Biological Variation
7. Human Adaptation © The McGraw−Hill Companies, 2003
(1982) has summarized some basic principles of clothing and shelter thatare used in desert environments, where the objectives are fourfold: to reduceheat production, to reduce heat gain from radiation, to reduce heat gain fromconduction, and to increase evaporation. Clothing is important because itprotects from both solar radiation and hot winds. Typical desert clothing islight and loose, thus allowing circulation of air to increase evaporation. Theair between the clothing and the body also provides excellent insulation.
Shelters are frequently built compactly to minimize the surface area ex-posed to the sun. Light colors on the outside help reflect heat. Doors andwindows are kept closed during the day to keep the interior cool. Buildingmaterials are also adaptive. Adobe, for example, is efficient in absorbing heat
184 PART II ■ Human Biological Variation
FIGURE 7.6
Forms of human shelter such as this igloo (top) and thisPueblo house (bottom) reflectadaptation to a wide range of climatic conditions. (Top,© Fred Bruemmer/Peter Arnold, Inc.;bottom, © Owen Franken/Corbis)

Relethford: The Human Species: An Introduction to Biological Anthropology, 5/e
II. Human Biological Variation
7. Human Adaptation © The McGraw−Hill Companies, 2003
during the day and radiating it at night (see Figure 7.6); nighttime tempera-tures may drop precipitously in desert environments.
Heat stress in tropical environments is often a problem because the ex-treme humidity greatly reduces the efficiency of evaporation through sweat-ing. Cultural adaptations to tropical environments are similar throughoutthe world. Clothing is minimal, helping to increase the potential for evapo-ration. In some cultures, shelters are built in an open design, without walls,to augment cooling during the day; in others, shelters are built closed to in-crease warmth at night. The combination of high heat and humidity obvi-ously affects daily routines. Generally, people start work early in the day, tak-ing long midday breaks to keep from overheating.
In sum, humans have adapted to a number of environments that pro-duce temperature stress. Humans have managed to adapt to extremes of hotand cold through physiologic changes, long-term genetic adaptations, andadaptive behaviors, particularly those manifested in clothing and shelter tech-nology and in the pace of daily life.
HIGH-ALTITUDE ADAPTATION
Some human populations have lived for long periods of time at elevations ofover 2,500 meters, or roughly 8,200 feet. An estimated 25 million people cur-rently live between 2,500 and 5,000 meters (Harrison et al. 1988).
High-Altitude StressesHigh-altitude environments produce several stresses, including oxygen star-vation, cold, and sometimes poor nutrition. Studies of high-altitude popula-tions have provided insight into how humans cope with multiple stresses.
Hypoxia Oxygen starvation, or hypoxia, is more common at high altitudesbecause of the relationship of barometric pressure and altitude. Althoughthe percentage of oxygen in the atmosphere is relatively constant up to al-most 70 miles above the earth, barometric pressure decreases quickly with al-titude (Figure 7.7). Because air is less compressed at high altitudes, its oxygencontent is less concentrated, and less oxygen is thus available to the hemo-globin in the blood. The percentage of arterial oxygen saturation decreasesrapidly with altitude (Figure 7.8). For persons at rest, hypoxia generally oc-curs above 3,000 meters; for active persons, it can occur as low as 2,000 meters(Frisancho 1993).
Other Stresses Because the air is thinner at high altitudes, the concentra-tion of ultraviolet radiation is greater and the air itself offers less protectionagainst it. The thinner air also causes considerable heat loss from the atmo-sphere, resulting in cold stress. In many high-altitude environments, condi-tions are also extremely dry because of mountain winds and low humidity. Inaddition, hypoxia affects plants and animals; for lack of oxygen, trees cannot
CHAPTER 7 ■ Human Adaptation 185
hypoxia Oxygen starvation,which occurs frequently athigh altitudes.
I I I I I I I

Relethford: The Human Species: An Introduction to Biological Anthropology, 5/e
II. Human Biological Variation
7. Human Adaptation © The McGraw−Hill Companies, 2003
grow above 4,000 meters. The limited availability of plants and animalsmeans that nutritional stress is likely in many high-altitude environments.
Numerous studies have compared the physiology and morphology ofhigh-altitude and low-altitude populations. Early research tended to attrib-ute any differences to the effects of hypoxia on the human body. More recent
186 PART II ■ Human Biological Variation
FIGURE 7.7
The relationship betweenbarometric pressure andaltitude. Barometric pressuredecreases as altitude increases,causing a decrease in thepercentage of arterial oxygensaturation (see Figure 7.8).(Source of data: Frisancho[1979:104])
100
200
300
400
500
600
700
800
Bar
omet
ric p
ress
ure
(mm
Hg)
0
0 10,000 20,000 30,000 40,000 50,000
Altitude
(feet)
0 3,048 6,096 9,144 12,192 15,240(meters)
FIGURE 7.8
The relationship betweenarterial oxygen saturation and altitude. (Source of data:Frisancho [1979:104])
0
Perc
ent a
rter
ial o
xyge
n sa
tura
tion
0
10,000 20,000 30,000 40,000 50,000
Altitude
10
20
30
40
50
60
70
80
90
100
(feet)
0 3,048 6,096 9,144 12,192 15,240(meters)
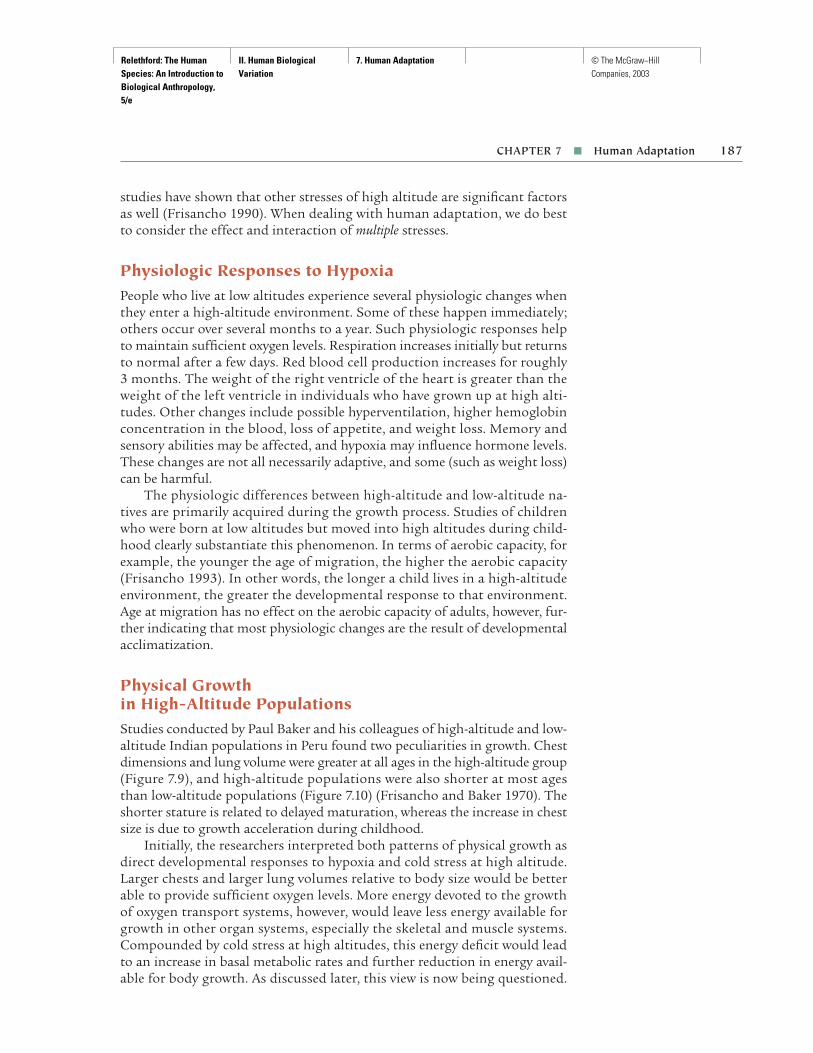
Relethford: The Human Species: An Introduction to Biological Anthropology, 5/e
II. Human Biological Variation
7. Human Adaptation © The McGraw−Hill Companies, 2003
studies have shown that other stresses of high altitude are significant factorsas well (Frisancho 1990). When dealing with human adaptation, we do bestto consider the effect and interaction of multiple stresses.
Physiologic Responses to HypoxiaPeople who live at low altitudes experience several physiologic changes whenthey enter a high-altitude environment. Some of these happen immediately;others occur over several months to a year. Such physiologic responses helpto maintain sufficient oxygen levels. Respiration increases initially but returnsto normal after a few days. Red blood cell production increases for roughly 3 months. The weight of the right ventricle of the heart is greater than theweight of the left ventricle in individuals who have grown up at high alti-tudes. Other changes include possible hyperventilation, higher hemoglobinconcentration in the blood, loss of appetite, and weight loss. Memory andsensory abilities may be affected, and hypoxia may influence hormone levels.These changes are not all necessarily adaptive, and some (such as weight loss)can be harmful.
The physiologic differences between high-altitude and low-altitude na-tives are primarily acquired during the growth process. Studies of childrenwho were born at low altitudes but moved into high altitudes during child-hood clearly substantiate this phenomenon. In terms of aerobic capacity, forexample, the younger the age of migration, the higher the aerobic capacity(Frisancho 1993). In other words, the longer a child lives in a high-altitudeenvironment, the greater the developmental response to that environment.Age at migration has no effect on the aerobic capacity of adults, however, fur-ther indicating that most physiologic changes are the result of developmentalacclimatization.
Physical Growth in High-Altitude PopulationsStudies conducted by Paul Baker and his colleagues of high-altitude and low-altitude Indian populations in Peru found two peculiarities in growth. Chestdimensions and lung volume were greater at all ages in the high-altitude group(Figure 7.9), and high-altitude populations were also shorter at most agesthan low-altitude populations (Figure 7.10) (Frisancho and Baker 1970). Theshorter stature is related to delayed maturation, whereas the increase in chestsize is due to growth acceleration during childhood.
Initially, the researchers interpreted both patterns of physical growth asdirect developmental responses to hypoxia and cold stress at high altitude.Larger chests and larger lung volumes relative to body size would be betterable to provide sufficient oxygen levels. More energy devoted to the growthof oxygen transport systems, however, would leave less energy available forgrowth in other organ systems, especially the skeletal and muscle systems.Compounded by cold stress at high altitudes, this energy deficit would leadto an increase in basal metabolic rates and further reduction in energy avail-able for body growth. As discussed later, this view is now being questioned.
CHAPTER 7 ■ Human Adaptation 187

Relethford: The Human Species: An Introduction to Biological Anthropology, 5/e
II. Human Biological Variation
7. Human Adaptation © The McGraw−Hill Companies, 2003
Studies in high-altitude environments around the world show a similarpattern of growth in chest dimensions, although the extent of growth varies.Migrants to high-altitude populations also show an increase in chest di-mensions, particularly among those that migrate at an early age. Increasedgrowth of oxygen transport systems appears to be a developmental responseto hypoxia.
Are the developmental changes in chest and lung growth in high-altitudepopulations genetic in nature? Were they shaped by natural selection? Mostresearch to date assigns a relatively minor role to genetic factors. One studyexamined high-altitude and low-altitude populations of European ancestry inBolivia (Greksa 1990). Because these groups do not have a long history ofresidence at high altitude, they would not possess any genetic predispositionfor high-altitude adaptations. The study showed there was an increased ca-pacity of the oxygen transport system in these populations at high altitudeeven though they were not of high-altitude ancestry. The observed changeswere instead direct effects of a chronic hypoxic stress. Weitz and colleagues
188 PART II ■ Human Biological Variation
FIGURE 7.9
Distance curves for chestcircumference for high-altitudeand low-altitude PeruvianIndian populations. At all ages, the high-altitudepopulation has the greatestchest circumference. (Courtesy A. R. Frisancho) 70
Age (years)
6 10 14 18 Adult
High altitude
Sea level
60
80
90
Che
st c
ircum
fere
nce
(cm
)
FIGURE 7.10
Distance curve for stature forhigh-altitude and low-altitudePeruvian Indian populations.At most ages, the low-altitudepopulation is taller. (Courtesy A. R. Frisancho)
180
140
120
100
6 10 14 18
Stat
ure
(cm
)
Sea level
Age (years)
160
Adult
High altitude
Relethford: The Human Species: An Introduction to Biological Anthropology, 5/e
II. Human Biological Variation
7. Human Adaptation © The McGraw−Hill Companies, 2003
(2000) did not find any such effect in low-altitude Han Chinese who had mi-grated to a high-altitude environment, however, suggesting that there mightbe genetic differences between populations that underlie their differential re-sponse to hypoxia. It appears that chest dimensions and size of the lungs areaffected by both developmental and genetic factors that interact differentlyin different human populations (Greksa 1996).
The delayed maturation and small stature of the Peruvians have not beenfound in all studies of growth in high-altitude populations. As a result, someresearchers have questioned the initial premise that hypoxia and cold stresshave necessarily led to these characteristics, suggesting instead that othercausal factors might be at work. A study undertaken in Peru has in fact shownthat nutrition has had a major influence on stature (Leonard et al. 1990).Though high altitude may play a role in nutritional stress in the Peruvian high-lands, income levels and access to land are of greater consequence. Also, otherhigh-altitude populations, such as those found in Ethiopia, have a higherstandard of living and do not show the growth deficits observed in Peru.Thus, it appears that although increased chest growth is a functional adap-tation to hypoxia, the smaller body size is not necessarily related to high alti-tude. These results amply illustrate the complexity in assessing the relativevalue of stresses in any given environment.
NUTRITIONAL ADAPTATION
The previous examples of human adaptation have focused on adaptive re-sponses to the stresses imposed by the physical environment, specificallytemperature and high-altitude stress. This section examines adaptation tonutritional needs and differences in the availability of food resources.
Basic Nutritional NeedsProper nutrition is needed for body maintenance, growth, and the energyneeds of daily activity. Ingested nutrients provide the energy for these. Dur-ing infancy, childhood, and adolescence, a greater proportion of nutrient en-ergy goes into physical growth. Too little energy can result in a reduction inoverall size and speed of maturation. Too much nutrient energy can result inaccumulation of fat and acceleration of maturation. Inadequate amounts ofcertain critical nutrients can also affect basic biological processes, such as in-sufficiency in vitamin A or C, both of which can increase susceptibility tocertain diseases.
Ingested energy (measured in calories) comes from carbohydrates, pro-teins, and fats. Dietary proteins are also necessary for certain metabolic func-tions. Proteins provide amino acids, of which 20 are needed by the body forsynthesis and repair of body tissues. Although the body synthesizes someamino acids, adult humans require 8 amino acids available only through diet(children need 9). Without adequate sources of protein in the diet, lack ofthese amino acids can lead to growth retardation, illness, and death. The ma-jor sources of proteins in Western human populations are animal products,
CHAPTER 7 ■ Human Adaptation 189

Relethford: The Human Species: An Introduction to Biological Anthropology, 5/e
II. Human Biological Variation
7. Human Adaptation © The McGraw−Hill Companies, 2003
including meat, eggs, fish, and milk. Plants provide proteins, but they arelacking in one or more amino acids and must be eaten in combination withother plants to ensure adequate nutrition.
As an example, the recommended daily intake of calories and proteinsfor infants and children in the United States is shown in Table 7.1. Note thatboth energy and protein needs increase with age, corresponding to bodygrowth. Table 7.2 reports the recommended daily intake of calories and pro-teins for adolescents and adults in the United States. Energy needs generallydecline with age, whereas recommended protein intake increases somewhatwith age. Recommended intake of both calories and proteins is considerablyhigher for women who are pregnant or breast-feeding, as both activities re-quire additional nutrients. The recommended daily intake of calories increases
190 PART II ■ Human Biological Variation
TA B L E 7.1 Recommended DailyAllowances (RDA) of Calories and Proteins for Infants and Children in the United States
Energy ProteinAge (years) (kilocalories) (grams)
0–0.5 650 130.5–1.0 850 14
1–3 1300 164–6 1800 247–10 2000 28
Source: National Academy of Sciences (1989)
TA B L E 7. 2 Recommended Daily Allowances (RDA) of Calories andProteins for Adolescents and Adults in the United States
Energy Protein(kilocalories) (grams)
Age (years) Males Females Males Females
11–14 2500 2200 45 4615–18 3000 2200 59 4419–24 2900 2200 58 4625–50 2900 2200 63 5051+ 2300 1900 63 50
Note: For pregnant women, add 300 kilocalories per day of energy and increase protein intaketo 60 grams per day. For women who are breast-feeding, add 500 kilocalories per day of energyand increase protein intake to 65 grams per day for the first 6 months (62 grams per day for the second 6 months).
Source: National Academy of Sciences (1989)

Relethford: The Human Species: An Introduction to Biological Anthropology, 5/e
II. Human Biological Variation
7. Human Adaptation © The McGraw−Hill Companies, 2003
14 percent during pregnancy and 23 percent while breast-feeding, and therecommended daily intake of protein increases 20 percent during pregnancyand 30 percent during breast-feeding.
There is, of course, variation in these figures depending on specific con-ditions and individual needs; these figures represent averages for the U.S. pop-ulation. In addition, keep in mind that other agencies and countries havesomewhat different standards (Leonard 2000).
Our bodies also require other nutrients, such as fatty acids, vitamins, andminerals. A diet lacking in one or more of these nutrients can lead to med-ical problems. A lack of iodine, for example, can lead to thyroid problems,and a lack of vitamin C can lead to the disease scurvy.
Variation in Human DietHuman nutritional needs have been shaped by evolution. In a general sense,the nutritional needs of humans are similar to other omnivorous primatespecies. Our physiology reflects the general primate adaptation to a diet com-prised of large amounts of fruit and vegetation, such as our shared inabilityto synthesize vitamin C, forcing us to acquire it from our diet (Leonard 2000).Humans, however, have a considerably more diverse diet, reflecting the broadrange of environments we have adapted to and the diversity in cultural adap-tations developed to acquire food.
As is discussed in detail in later chapters, the primary means of acquiringfood throughout most of human evolution has been hunting and gathering.This way of life began close to 2 million years ago and was the only way hu-mans obtained food until about 12,000 years ago, when an increasing num-ber of human populations became reliant on agriculture. As discussed fur-ther in Chapter 15, this shift in subsistence has had a noticeable biologicalimpact on our health as we frequently eat a diet quite unlike that which weadapted to in the past.
Hunting and Gathering Hunting and gathering populations do not allhave the same type of diet; their specific patterns of resource utilization areshaped by their specific environments (e.g., you can’t fish if there are no fish around). Australian aborigines must cope with a very dry environmentwith little water. Migration of groups tends to be structured around theavailability of water. Hunting provides only a portion of their caloric intake;most comes from tubers, seeds, and small fruits. Among the San of the Kala-hari Desert in Africa, water resources also restrict migration. More hunt-ing is available than in central Australia, but the bulk of the diet still comesfrom plants, especially nuts and seeds (Molnar and Molnar 2000). In general,hunting-gathering populations obtain a greater proportion of their caloriesfrom gathering, averaging about 70 percent to 80 percent, than from hunt-ing. Among the San, for example, about two-thirds of the daily caloric intakecame from nuts and other vegetable foods (Lee 1968). Across cultures, how-ever, there is considerable variation. All hunting-gathering societies obtain atleast 20 percent of their diet from hunting, but some, particularly those in
CHAPTER 7 ■ Human Adaptation 191
Relethford: The Human Species: An Introduction to Biological Anthropology, 5/e
II. Human Biological Variation
7. Human Adaptation © The McGraw−Hill Companies, 2003
arctic environments with fewer plant resources, derive most of their caloriesfrom hunting.
Agriculture There is also variation among agricultural populations, de-pendent largely on available resources and the level of technology. Some pop-ulations practice simple horticulture, such as slash and burn agriculture;other populations rely on intensive agriculture. The specific food crop(s) ex-ploited is dependent upon the environment; rice is a main crop in SoutheastAsia, wheat in Europe, and corn in the Americas.
Different ways of processing food can improve its quality. Leonard (2000)discusses one example, corn among Native American populations. Corn (maize)has advantages and disadvantages; it is high in protein but lacks two aminoacids (lysine and tyrptophan) and niacin. Many Native American populationsuse alkali substances, such as ash or lime, when cooking corn, which acts toincrease amino acid and niacin concentrations. Comparative research hasshown that the more a society relies on corn, the more they use such methods.
MalnutritionWe tend to equate the term malnutrition with a diet deficient in calories, pro-teins, or other nutrients, but it literally means “bad nutrition.” Malnutritionoften does refer to too little food (quantity and/or quality), but it can alsorefer to having too much. If you ingest more calories than are needed forgrowth, body maintenance, or physical activity, the excess is deposited as fatin your body. Obesity can lead to medical problems such as high blood pres-sure, heart disease, and diabetes. Obesity is a growing problem in industrial-ized nations such as the United States.
Throughout much of the world, however, the major nutritional problemis the lack of food, or at least the lack of a balanced diet. Poor nutrition actsto slow down the growth process, leading to small adult body size. In onesense, this change in growth is adaptive, because a smaller adult body sizewill require fewer nutrients. By focusing on this relationship, however, we ig-nore the problem that the slowing of growth is an indication of potentialharm. Severe undernutrition, especially in infancy and childhood, can havesevere effects. Not only is physical growth stunted but mental retardationalso may result, and susceptibility to infectious disease increases. Severe un-dernutrition is common in much of the Third World, compounded by prob-lems of poverty, overpopulation, inadequate sewage disposal, contaminatedwater, and economic and political conflicts.
A number of nutritional problems, collectively known as protein-caloriemalnutrition, result from an inadequate amount of proteins and/or calo-ries in the diet. Protein-calorie malnutrition is the most serious nutritionalproblem on the planet. Its various forms have different physical symptoms,but all stem from the basic problems of an inadequate diet and have the sameultimate effects, ranging from growth retardation to death.
The most severe types of protein-calorie malnutrition are kwashiorkor(a severe deficiency in proteins but not calories) and marasmus (severe defi-
192 PART II ■ Human Biological Variation
malnutrition Poornutrition, either from toomuch or too little food or the improper balance of nutrients.
protein-caloriemalnutrition A group ofnutritional diseases resultingfrom inadequate amountsof proteins and/or calories.
kwashiorkor An extremeform of protein-caloriemalnutrition resulting froma severe deficiency inproteins but not calories.
marasmus An extremeform of protein-caloriemalnutrition resulting fromsevere deficiencies in bothproteins and calories.
I I I I I I I

Relethford: The Human Species: An Introduction to Biological Anthropology, 5/e
II. Human Biological Variation
7. Human Adaptation © The McGraw−Hill Companies, 2003
ciencies in both proteins and calories). Kwashiorkor occurs most often in in-fants and young children who are weaned from their mother’s breast onto adiet lacking in proteins. The infant suffers growth retardation, muscle wast-ing, and lowered resistance to disease. One of the symptoms of kwashiorkoris the swelling of the body due to water retention (Figure 7.11). Marasmus isalso most prevalent during infancy and similarly leads to growth retardation,muscle wasting, and death. A child suffering from marasmus typically looksemaciated (Figure 7.12).
Although the physical appearance of children with kwashiorkor andmarasmus differs, both suffer from an inadequate diet. Population pressureand poverty certainly play a major role in much of protein-calorie malnutri-tion, but they are not the only factors. Some researchers, such as anthropolo-gist Katherine Dettwyler, have argued that cultural beliefs regarding nutritionare at least as important. Such beliefs include stressing quantity over quality,postponing the age at which children eat solid foods, and other practicesthat compromise proper nutrition. Thus, the elimination of protein-caloriemalnutrition will require more than an attack on population growth andthe reduction of poverty and disease; it will also require nutritional educa-tion (Dettwyler 1994). Her work also shows us the folly of assuming that allcultural behaviors are necessarily adaptive.
The devastating impact of malnutrition should not be underestimated.More than 200 million children under the age of 5 in developing countriesare undernourished. More than half of all deaths of children under the ageof 5 in these countries are linked to poor nutrition (UNICEF 1998).
S P E C I A L T O P I C
The “Small But Healthy” Hypothesis and the Cost of AdaptationA central focus of much current work in human adapta-tion is the study of nutritional adaptation, looking at theinterrelationship between diet, human biology, culture,and the environment (Leonard 2000). One controversialtopic is the “small but healthy” hypothesis, originallydeveloped by economist David Seckler (1980), who sug-gested that roughly 90 percent of the world’s populationlabeled as malnourished are actually “small but healthy”people. This hypothesis considers small body size as anadaptation to limited nutritional resources. In environ-ments with limited nutrition, smaller individuals will be at an advantage because they can function on fewercalories than those with a larger body size. In this view,smaller body size results from a developmental adapta-tion due to nutritional stress.
Considering small body size only in terms of a potential advantage carries with it an assumption thatreduced body size is without any biological cost. Thesmall but healthy hypothesis ignores the fact that there
are other biological consequences of reduced nutrition.Bogin (1995b) notes among the serious consequences of malnutrition are impairments in cognitive function-ing, work capacity, and school performance. Further, the small but healthy hypothesis does not consider othercauses of reduced body size that are harmful, such asinfectious diseases.
The small but healthy hypothesis has policy impli-cations far beyond the academic world. If small size isregarded as “normal,” then no interventions, economicor otherwise, are needed for these populations (Bogin1995b). Some anthropologists have argued that hypoth-eses about human adaptation, such as the small buthealthy hypothesis, are not simply academic concerns buthave a direct impact on the populations being studied.Some have further argued that the study of human adap-tation needs to be informed by a political-economic per-spective that takes such issues into account (Goodmanand Leatherman 1998).
FIGURE 7.11
Child with kwashiorkor inMali, West Africa. (CourtesyKatherine Dettwyler)
193
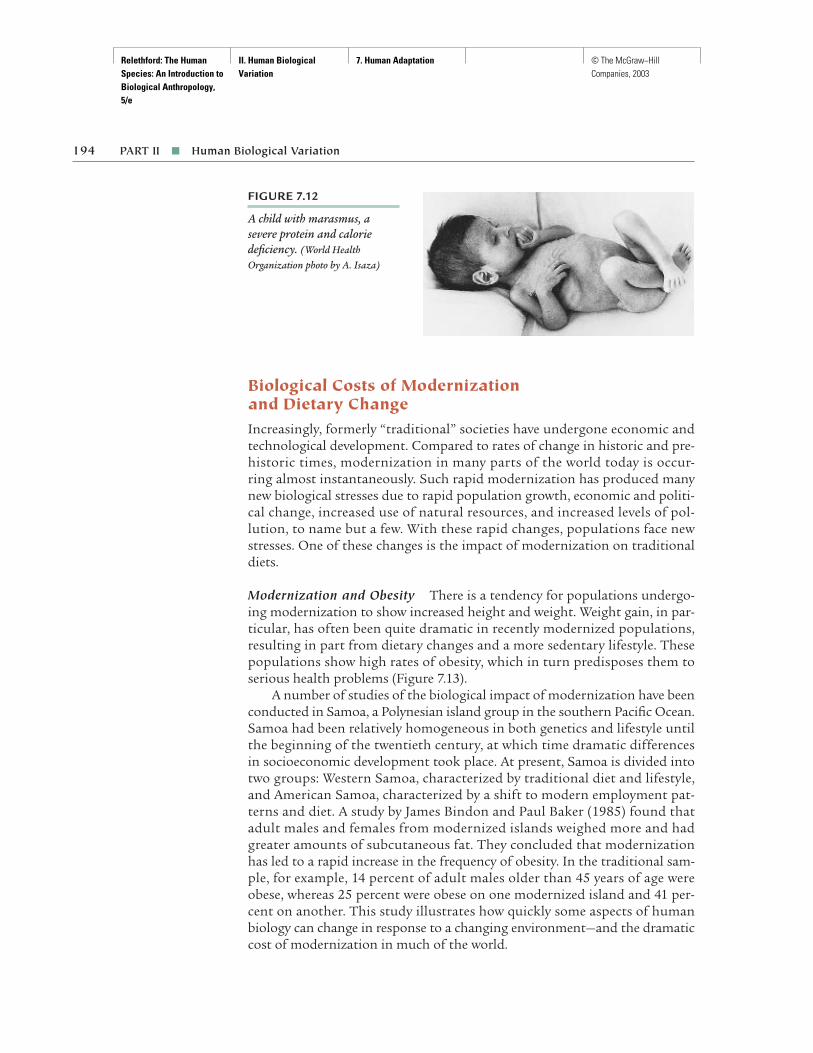
Relethford: The Human Species: An Introduction to Biological Anthropology, 5/e
II. Human Biological Variation
7. Human Adaptation © The McGraw−Hill Companies, 2003
Biological Costs of Modernizationand Dietary ChangeIncreasingly, formerly “traditional” societies have undergone economic andtechnological development. Compared to rates of change in historic and pre-historic times, modernization in many parts of the world today is occur-ring almost instantaneously. Such rapid modernization has produced manynew biological stresses due to rapid population growth, economic and politi-cal change, increased use of natural resources, and increased levels of pol-lution, to name but a few. With these rapid changes, populations face newstresses. One of these changes is the impact of modernization on traditionaldiets.
Modernization and Obesity There is a tendency for populations undergo-ing modernization to show increased height and weight. Weight gain, in par-ticular, has often been quite dramatic in recently modernized populations,resulting in part from dietary changes and a more sedentary lifestyle. Thesepopulations show high rates of obesity, which in turn predisposes them toserious health problems (Figure 7.13).
A number of studies of the biological impact of modernization have beenconducted in Samoa, a Polynesian island group in the southern Pacific Ocean.Samoa had been relatively homogeneous in both genetics and lifestyle untilthe beginning of the twentieth century, at which time dramatic differencesin socioeconomic development took place. At present, Samoa is divided intotwo groups: Western Samoa, characterized by traditional diet and lifestyle,and American Samoa, characterized by a shift to modern employment pat-terns and diet. A study by James Bindon and Paul Baker (1985) found thatadult males and females from modernized islands weighed more and hadgreater amounts of subcutaneous fat. They concluded that modernizationhas led to a rapid increase in the frequency of obesity. In the traditional sam-ple, for example, 14 percent of adult males older than 45 years of age wereobese, whereas 25 percent were obese on one modernized island and 41 per-cent on another. This study illustrates how quickly some aspects of humanbiology can change in response to a changing environment—and the dramaticcost of modernization in much of the world.
194 PART II ■ Human Biological Variation
FIGURE 7.12
A child with marasmus, asevere protein and caloriedeficiency. (World HealthOrganization photo by A. Isaza)
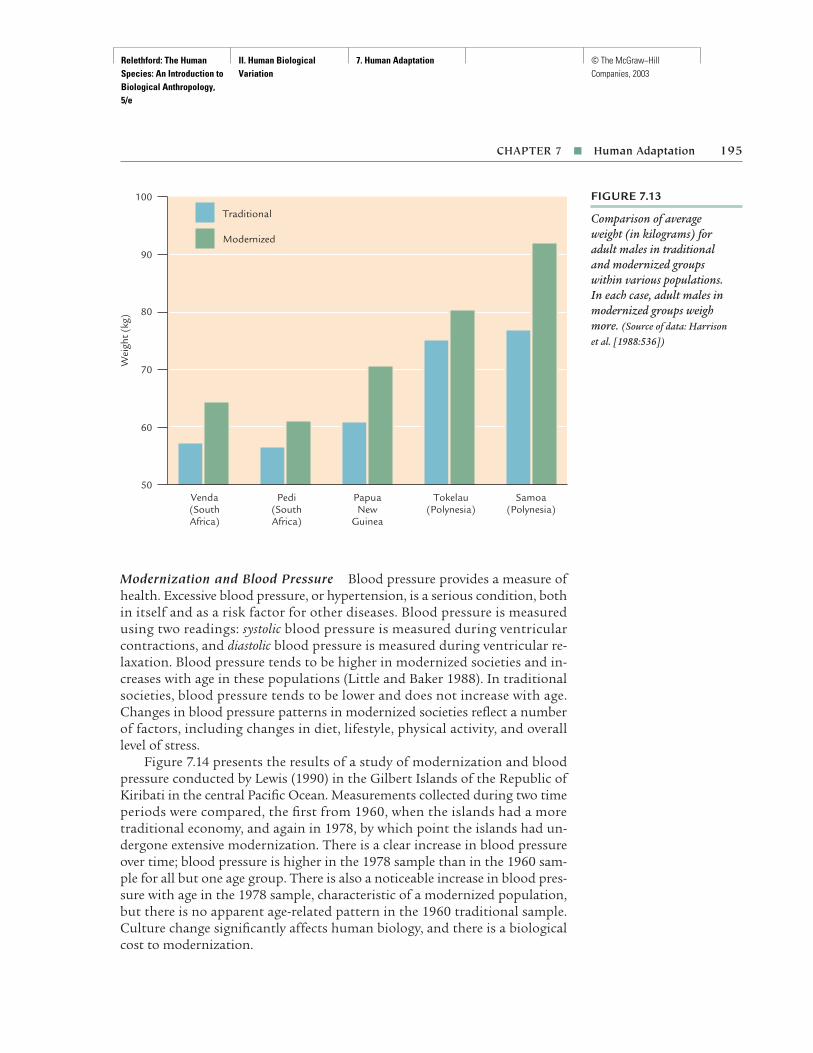
Relethford: The Human Species: An Introduction to Biological Anthropology, 5/e
II. Human Biological Variation
7. Human Adaptation © The McGraw−Hill Companies, 2003
Modernization and Blood Pressure Blood pressure provides a measure ofhealth. Excessive blood pressure, or hypertension, is a serious condition, bothin itself and as a risk factor for other diseases. Blood pressure is measuredusing two readings: systolic blood pressure is measured during ventricularcontractions, and diastolic blood pressure is measured during ventricular re-laxation. Blood pressure tends to be higher in modernized societies and in-creases with age in these populations (Little and Baker 1988). In traditionalsocieties, blood pressure tends to be lower and does not increase with age.Changes in blood pressure patterns in modernized societies reflect a numberof factors, including changes in diet, lifestyle, physical activity, and overalllevel of stress.
Figure 7.14 presents the results of a study of modernization and bloodpressure conducted by Lewis (1990) in the Gilbert Islands of the Republic ofKiribati in the central Pacific Ocean. Measurements collected during two timeperiods were compared, the first from 1960, when the islands had a moretraditional economy, and again in 1978, by which point the islands had un-dergone extensive modernization. There is a clear increase in blood pressureover time; blood pressure is higher in the 1978 sample than in the 1960 sam-ple for all but one age group. There is also a noticeable increase in blood pres-sure with age in the 1978 sample, characteristic of a modernized population,but there is no apparent age-related pattern in the 1960 traditional sample.Culture change significantly affects human biology, and there is a biologicalcost to modernization.
CHAPTER 7 ■ Human Adaptation 195
FIGURE 7.13
Comparison of average weight (in kilograms) for adult males in traditional and modernized groups within various populations. In each case, adult males inmodernized groups weighmore. (Source of data: Harrison et al. [1988:536])
100
90
70
60
50Venda(SouthAfrica)
Pedi(SouthAfrica)
PapuaNew
Guinea
Tokelau(Polynesia)
Wei
ght (
kg)
Traditional
80
Samoa(Polynesia)
Modernized
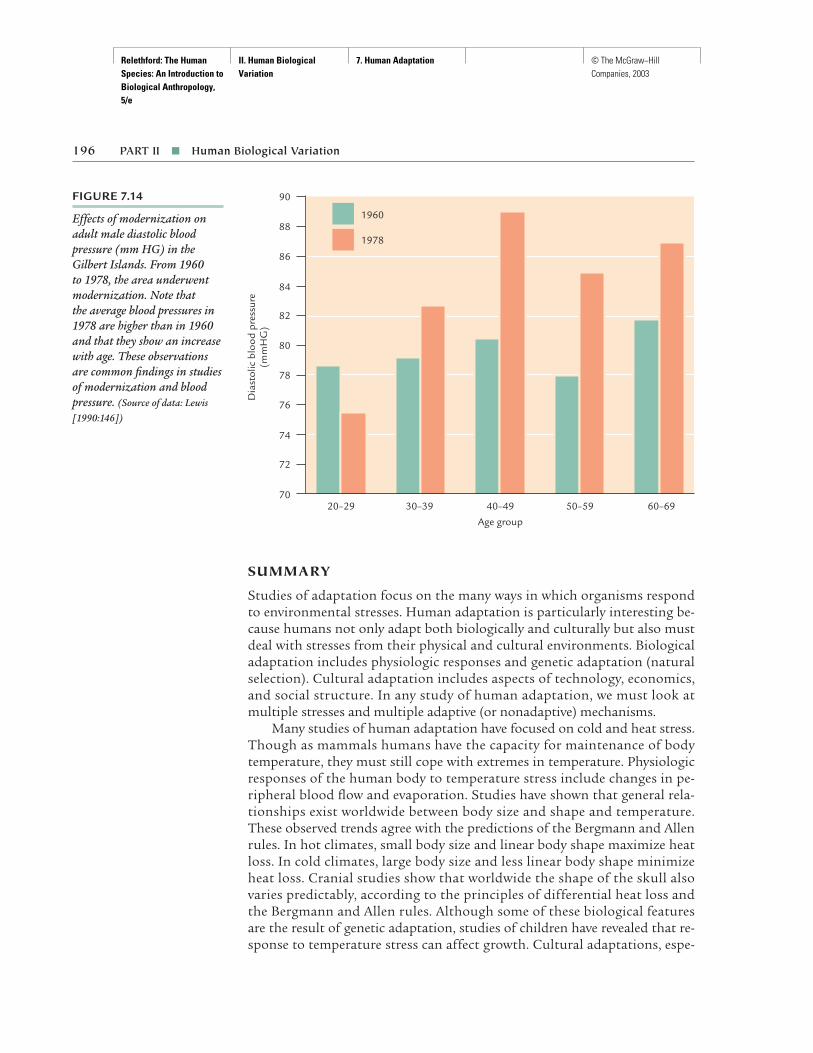
Relethford: The Human Species: An Introduction to Biological Anthropology, 5/e
II. Human Biological Variation
7. Human Adaptation © The McGraw−Hill Companies, 2003
SUMMARY
Studies of adaptation focus on the many ways in which organisms respondto environmental stresses. Human adaptation is particularly interesting be-cause humans not only adapt both biologically and culturally but also mustdeal with stresses from their physical and cultural environments. Biologicaladaptation includes physiologic responses and genetic adaptation (naturalselection). Cultural adaptation includes aspects of technology, economics,and social structure. In any study of human adaptation, we must look atmultiple stresses and multiple adaptive (or nonadaptive) mechanisms.
Many studies of human adaptation have focused on cold and heat stress.Though as mammals humans have the capacity for maintenance of bodytemperature, they must still cope with extremes in temperature. Physiologicresponses of the human body to temperature stress include changes in pe-ripheral blood flow and evaporation. Studies have shown that general rela-tionships exist worldwide between body size and shape and temperature.These observed trends agree with the predictions of the Bergmann and Allenrules. In hot climates, small body size and linear body shape maximize heatloss. In cold climates, large body size and less linear body shape minimizeheat loss. Cranial studies show that worldwide the shape of the skull alsovaries predictably, according to the principles of differential heat loss andthe Bergmann and Allen rules. Although some of these biological featuresare the result of genetic adaptation, studies of children have revealed that re-sponse to temperature stress can affect growth. Cultural adaptations, espe-
196 PART II ■ Human Biological Variation
FIGURE 7.14
Effects of modernization onadult male diastolic bloodpressure (mm HG) in theGilbert Islands. From 1960 to 1978, the area underwentmodernization. Note that the average blood pressures in1978 are higher than in 1960and that they show an increasewith age. These observationsare common findings in studiesof modernization and bloodpressure. (Source of data: Lewis[1990:146])
90
88
86
84
80
78
76
70
72
74
20–29 30–39 40–49
Age group
50–59
Dia
stol
ic b
lood
pre
ssur
e(m
mH
G)
1960
82
60–69
1978

Relethford: The Human Species: An Introduction to Biological Anthropology, 5/e
II. Human Biological Variation
7. Human Adaptation © The McGraw−Hill Companies, 2003
cially those involving clothing, shelter, and physical activity, are also impor-tant in climatic adaptation.
More than 25 million people around the world live at high altitudes. Themajor stresses of a high-altitude population are hypoxia (oxygen shortage)and cold stress. Many physiologic changes have been documented in high-altitude peoples, including short-term responses and long-term increases inthe size of the lungs and other components of the oxygen transport system.These changes are caused by hypoxic stress during the growth period, andtheir degree of change is related to the time spent living at high altitudes:the longer one has lived there as a child, the more adapted one is. Early stud-ies of high-altitude populations also noted small body size that, along withdelayed maturation, could be due to insufficient energy levels for body growthbecause of hypoxia and cold stress. More recent studies have shown that thisis not always the case, because some high-altitude groups do not show thisgrowth deficit. Instead, variation in diet appears to be the key factor.
Humans have adapted culturally to basic nutritional demands in a varietyof ways. For millions of years, human ancestors utilized different methods ofhunting and gathering to feed themselves, and about 12,000 years ago humansadopted agriculture as their primary means of subsistence. Although hu-mans have a number of ways of adapting to their nutritional needs, there aresome basic biological limits to adaptation, and an increasing number of chil-dren are malnourished. Modernization has altered traditional diets as well asother aspects of lifestyle, resulting in an increased biological cost in many cases.
SUPPLEMENTAL READINGS
Frisancho, A. R. 1993. Human Adaptation and Accommodation. Ann Arbor: University ofMichigan Press. This text is a thorough review of adaptation studies, focusing on phys-iologic adaptation.
Moran, E. F. 1982. Human Adaptability: An Introduction to Ecological Anthropology. Boulder,Colo.: Westview Press. This general text provides another review of human adaptationbut focuses more on cultural adaptations.
Stinson, S., B. Bogin, R. Huss-Ashmore, and D. O’Rourke. 2000. Human Biology: An Evolu-tionary and Biocultural Perspective. New York: John Wiley & Sons. A comprehensive vol-ume consisting of review chapters on a variety of topics relating to human populationbiology. Several chapters deal with climatic, high-altitude, nutritional, and infectiousdisease adaptation.
INTERNET RESOURCES
http://anthro.palomar.edu/adapt/default.htmHuman Biological Adaptability, a tutorial including information on climatic,high-altitude, and nutritional adaptation.
http://www.princeton.edu/∼oa/safety/altitude.htmlOutdoor Action Guide to High Altitude, which provides information onhigh-altitude illness and acclimatization.
CHAPTER 7 ■ Human Adaptation 197

Relethford: The Human Species: An Introduction to Biological Anthropology, 5/e
III. Our Place in Nature Introduction © The McGraw−Hill Companies, 2003
PA R T IIIOur Place in Nature
What are humans? This question has been asked overand over again throughout human history by scien-tists, artists, philosophers, and others. Where do wefit into the animal world? In this section we look athuman beings in a comparative framework, consider-ing our species as part of the total diversity of life.The emphasis in this section is on the primates, agroup of mammals to which humans belong. Chap-ter 8 starts by considering the nature of classificationof living organisms and proceeds to a discussion ofmammals and primates. Chapter 9 looks more closelyat variation in the biology and behavior of living pri-mates. In Chapter 10, I consider the human species,emphasizing the similarities and differences with ourclosest living relatives, the African apes. Chapter 11reviews the fossil record of primate origins and evo-lution from their initial appearance to the split of apeand human lines roughly 6 million years ago.
Relethford: The Human Species: An Introduction to Biological Anthropology, 5/e
III. Our Place in Nature 8. Primates in Nature © The McGraw−Hill Companies, 2003
C H A P T E R 8Primates in Nature
201
To understand the place of humans in nature, it is first necessary to un-derstand the group of mammals to which humans belong—the pri-
mates. Humans are primates, as are other creatures such as the apes, themonkeys, and the primitive primates known as prosimians. The basic natureof primate biology and behavior is discussed in this chapter. However, be-cause primates belong to a group known as mammals, who in turn belongto a larger group known as vertebrates, it is first necessary to understand thebasic characteristics of these larger taxonomic groups. We begin, therefore,by first discussing vertebrates and then mammals and then go on to discussthe special characteristics of primates.
TAXONOMIC CLASSIFICATION
In Chapter 1, you read about Linnaeus’s system of classification for all livingcreatures. Instead of simply making up a list of all known organisms, Lin-naeus developed a scheme by which creatures could be grouped together ac-cording to certain shared characteristics. Even though we now make use ofLinnaeus’s scheme to describe patterns of evolution, Linnaeus himself didnot have this objective in mind. Rather, he sought to understand the natureof God’s design in living organisms.
We use systems of classification every day, often without being awarethat we do so. We all have the tendency to label objects and people according
A slow loris (Nycticebus coucang), one of the species of prosimian. The prosimians, along with monkeys, apes, and humans, make up the Order Primates, a group of mammals possessing grasping hands and depth perception. (© OSF/David Haring/Animals Animals)
▲
primates The order ofmammals that has a complexof characteristics related toan initial adaptation to lifein the trees.
I I I I I I I

Relethford: The Human Species: An Introduction to Biological Anthropology, 5/e
III. Our Place in Nature 8. Primates in Nature © The McGraw−Hill Companies, 2003
to certain characteristics. We often use terms such as “liberal” and “conserv-ative” to describe people’s political views and terms such as “white” and“black” to describe people’s skin color. Movies are classified into differentgroups by a rating, such as G, PG, PG-13, and R.
If you think for a moment, you will realize that a great deal of your dailylife revolves around your use and understanding of different systems of clas-sification. In biology, we are interested in a system of classification that showsrelationships between different groups of organisms. This may sound sim-ple enough but can actually be rather difficult. For example, consider the following list of organisms: flounder, bat, shark, canary, lizard, horse, andwhale. How would you classify these creatures? One way might be to put cer-tain animals together according to size: the flounder, bat, canary, and lizardin a “small” category; the shark and horse in a “medium” category; and thewhale in a “large” category. Another method would be to put the animals in groups according to where they live: the flounder, shark, and whale in the water; the bat and canary in the air; and the lizard and horse on the land. Still another method would be to put the shark in a separate categoryfrom all the others because the shark’s skeleton is made of cartilage insteadof bone.
The problem with this example is that none of these three ways of classi-fication agrees with the other two. There is no consistency. Biologists actu-ally classify these animals into the following groups: fish (flounder and shark),reptiles (lizard), birds (canary), and mammals (bat, horse, whale). These groupsreflect certain common characteristics, such as mammary glands for themammals. But what makes this system of classification any better than thosebased on size or habitat? For our purposes, we require classifications that reflect evolutionary patterns. As we will see, organisms can have similar traitsbecause they inherited these traits from a common ancestor. Thus, the pres-ence of mammary glands in the bat, horse, and whale represents a trait thathas been inherited from a common ancestral species.
Classifications are useful in trying to understand evolutionary relation-ships. In order to reflect the evolutionary process, the classifications must re-flect evolutionary changes. The groups of mammals, birds, reptiles, and fishare based on characteristics that reflect evolutionary relationships. The batand the whale are placed in the same group because they have a more recentcommon ancestor than either does with the lizard, as reflected by certainshared characteristics such as mammary glands. Biological classificationshould reflect evolutionary processes, but only careful analysis of both livingand extinct life forms allows us to discover what characteristics reflect evolu-tionary relationships.
Taxonomic CategoriesThe Linnaean system is a hierarchical classification. That is, each categorycontains a number of subcategories, which contain further subcategories,and so on. Biological classification uses a number of categories. The morecommonly used categories are: kingdom, phylum (plural phyla), class, order,
202 PART III ■ Our Place in Nature
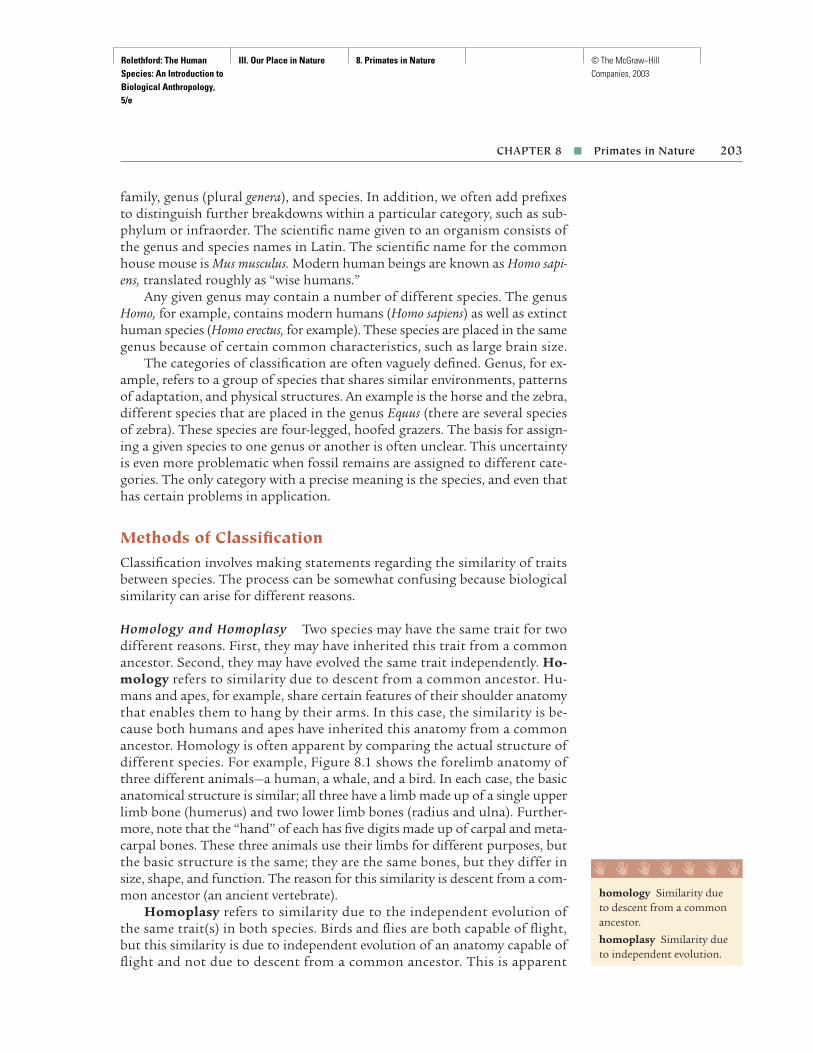
Relethford: The Human Species: An Introduction to Biological Anthropology, 5/e
III. Our Place in Nature 8. Primates in Nature © The McGraw−Hill Companies, 2003
family, genus (plural genera), and species. In addition, we often add prefixesto distinguish further breakdowns within a particular category, such as sub-phylum or infraorder. The scientific name given to an organism consists ofthe genus and species names in Latin. The scientific name for the commonhouse mouse is Mus musculus. Modern human beings are known as Homo sapi-ens, translated roughly as “wise humans.”
Any given genus may contain a number of different species. The genusHomo, for example, contains modern humans (Homo sapiens) as well as extincthuman species (Homo erectus, for example). These species are placed in the samegenus because of certain common characteristics, such as large brain size.
The categories of classification are often vaguely defined. Genus, for ex-ample, refers to a group of species that shares similar environments, patternsof adaptation, and physical structures. An example is the horse and the zebra,different species that are placed in the genus Equus (there are several speciesof zebra). These species are four-legged, hoofed grazers. The basis for assign-ing a given species to one genus or another is often unclear. This uncertaintyis even more problematic when fossil remains are assigned to different cate-gories. The only category with a precise meaning is the species, and even thathas certain problems in application.
Methods of ClassificationClassification involves making statements regarding the similarity of traitsbetween species. The process can be somewhat confusing because biologicalsimilarity can arise for different reasons.
Homology and Homoplasy Two species may have the same trait for twodifferent reasons. First, they may have inherited this trait from a commonancestor. Second, they may have evolved the same trait independently. Ho-mology refers to similarity due to descent from a common ancestor. Hu-mans and apes, for example, share certain features of their shoulder anatomythat enables them to hang by their arms. In this case, the similarity is be-cause both humans and apes have inherited this anatomy from a commonancestor. Homology is often apparent by comparing the actual structure ofdifferent species. For example, Figure 8.1 shows the forelimb anatomy ofthree different animals—a human, a whale, and a bird. In each case, the basicanatomical structure is similar; all three have a limb made up of a single upperlimb bone (humerus) and two lower limb bones (radius and ulna). Further-more, note that the “hand” of each has five digits made up of carpal and meta-carpal bones. These three animals use their limbs for different purposes, butthe basic structure is the same; they are the same bones, but they differ insize, shape, and function. The reason for this similarity is descent from a com-mon ancestor (an ancient vertebrate).
Homoplasy refers to similarity due to the independent evolution of the same trait(s) in both species. Birds and flies are both capable of flight,but this similarity is due to independent evolution of an anatomy capable offlight and not due to descent from a common ancestor. This is apparent
CHAPTER 8 ■ Primates in Nature 203
homology Similarity dueto descent from a commonancestor.
homoplasy Similarity dueto independent evolution.
I I I I I I I

Relethford: The Human Species: An Introduction to Biological Anthropology, 5/e
III. Our Place in Nature 8. Primates in Nature © The McGraw−Hill Companies, 2003
when considering their anatomy (Figure 8.2); both creatures can fly, but theiranatomy is quite different and reflects independent origins.
There are two different types of homoplasy. Parallel evolution is the in-dependent evolution of similar traits in closely related species, such as theincrease in dental size among a number of early human ancestors (see Chap-ter 12). Convergent evolution is the independent evolution of similar traitsin more distantly related species, such as the evolution of flight in both birdsand flies.
If we want our classification system to reflect evolutionary relationships,we need to focus on traits that exhibit homology. We would not want to in-clude traits that reflect homoplasy, because those reflect independent evolu-tionary origins. For this reason, we classify birds and flies into different taxo-nomic categories because their similarity does not tell us anything aboutevolutionary relationships.
As an example, consider three of the organisms mentioned earlier in thischapter—a horse, a shark, and a whale. Which two are more similar to eachother than to the third? Looking at overall similarity (including body shape,presence of fins rather than limbs, and where they live), you might concludethat the shark and the whale are more similar to each other than either is tothe horse. The problem here is that these similarities all reflect homoplasy,specifically the independent evolution of characteristics related to living inthe water in the shark and the whale. Focusing on homologous structures,such as the limb structure described previously, we would see that the horseand the whale are actually more closely related, and for that reason we clas-sify them both as mammals, whereas the shark is classified as a fish.
Primitive and Derived Traits Homologous biological traits can also becharacterized as primitive or derived. When a trait has been inherited froman earlier form, we refer to that trait as primitive. Traits that have changedfrom an ancestral state are referred to as derived. As an example, considerthe number of digits in humans and horses. Both humans and horses are
204 PART III ■ Our Place in Nature
FIGURE 8.1
An example of homology; theforelimbs of a human, whale,and bird. Note that the samebones are found in all threevertebrates. Even though thelimbs are used differently by allthree organisms, the bones showa structural correspondence,reflecting common ancestry.(Adapted with permission from T. Dobzhansky, F. J. Ayala, G. L.Stebbins, and U. W. Valentine,Evolution, 1977, page 264,publisher W. H. Freeman)
HUMAN
Humerus
Radius
Carpals
PhalangesMetacarpals
Ulna
WHALE BIRD
parallel evolutionIndependent evolution oftraits in closely relatedspecies.
convergent evolutionIndependent evolution ofsimilar traits in ratherdistinct evolutionary lines.
primitive trait A trait thathas not changed from anancestral state. The five digitsof the human hand and footare primitive traits inheritedfrom earlier vertebrateancestors.
I I I I I I I

Relethford: The Human Species: An Introduction to Biological Anthropology, 5/e
III. Our Place in Nature 8. Primates in Nature © The McGraw−Hill Companies, 2003
mammals. From fossil evidence we know that the first mammals had fivedigits on each hand and foot (as did other early land vertebrates). Humanshave retained this condition, and we refer to the five digits of the humanhand and foot as primitive traits. The horse’s single digit (a toe), however, isa derived trait relative to the first mammals.
The concept of primitive and derived traits is relative. What is consid-ered primitive at one level of comparison might be considered derived at an-other level. For example, neither modern apes nor modern humans have atail. If apes are compared to humans, the absence of a tail is a primitive char-acteristic—they share this absence because they inherited this characteristicfrom a common ancestor. Monkeys, however, do have tails. If modern mon-keys are compared to modern apes, the lack of a tail in the modern apes is aderived condition—it has changed since the common ancestor of monkeysand apes. The relative nature of primitive and derived traits must always bekept in mind.
To make any comparison, we must have information on modern and fos-sil forms so that we can determine whether a trait is primitive or derived. Wecannot assume that any given organism will be primitive or derived for agiven trait without knowing something about the ancestral condition. Inother words, we cannot equate the terms primitive and derived with biased no-tions of “higher” or “lower” forms. In the past, there was a tendency to re-gard all traits of modern humans as derived relative to the apes. For sometraits, such as increased brain size and upright walking, this holds true. Forother traits, such as certain features of the teeth, the opposite is true.
Approaches to ClassificationThe problem of biological classification may be approached in many differ-ent ways. Though most agree that such classification should reflect evolu-tionary history, opinions differ about how this should be accomplished.
Phenetics The classification of organisms on the basis of overall similarityis termed phenetics. According to this method, it doesn’t matter whethersuch similarity is the result of common ancestry or parallel evolution. If par-allel evolution is fairly common, phenetic classification may suggest a closer
CHAPTER 8 ■ Primates in Nature 205
FIGURE 8.2
The wings of a bird and a fly.Even though both structuresprovide the same function( flight), they are structurallydifferent, reflecting independentevolutionary origin. (Adaptedwith permission from T. Dobzhansky,F. J. Ayala, G. L. Stebbins, and U. W.Valentine, Evolution, 1977, page264, publisher W. H. Freeman)
FLYBIRD
derived trait A trait that has changed from an ancestral state.
phenetics A school ofthought that stresses theoverall physical similaritiesamong organisms in formingbiological classifications.
I I I I I I I
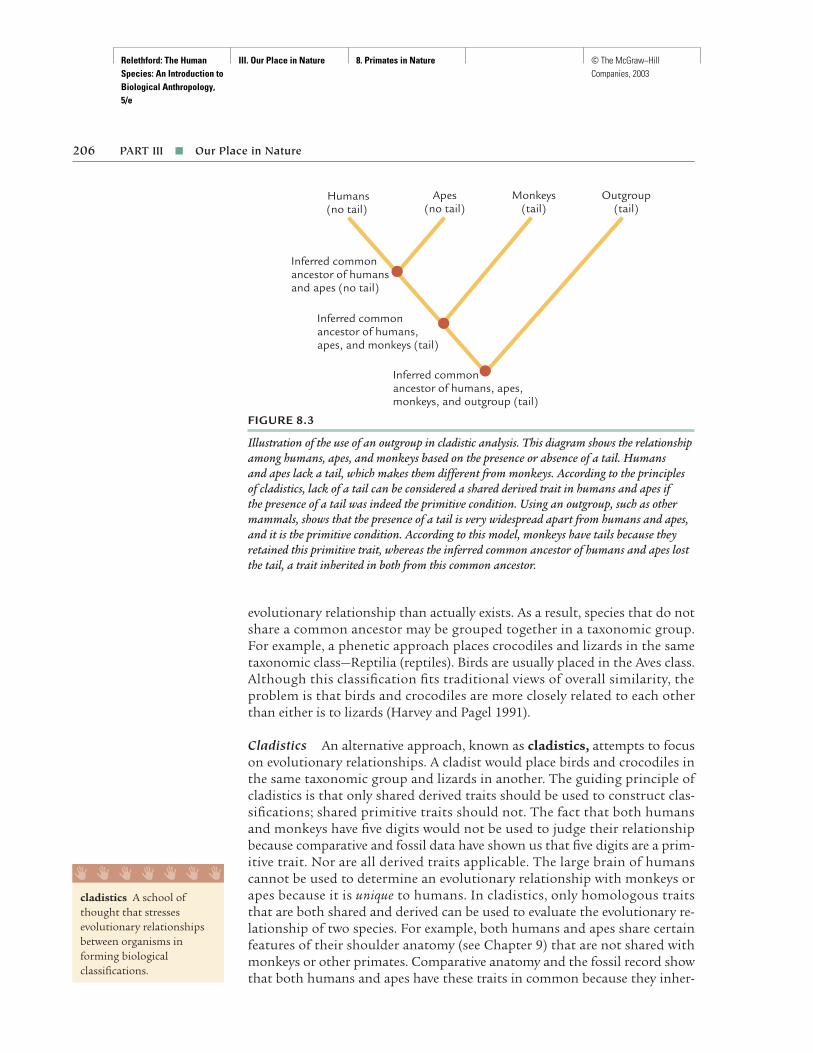
Relethford: The Human Species: An Introduction to Biological Anthropology, 5/e
III. Our Place in Nature 8. Primates in Nature © The McGraw−Hill Companies, 2003
evolutionary relationship than actually exists. As a result, species that do notshare a common ancestor may be grouped together in a taxonomic group.For example, a phenetic approach places crocodiles and lizards in the sametaxonomic class—Reptilia (reptiles). Birds are usually placed in the Aves class.Although this classification fits traditional views of overall similarity, theproblem is that birds and crocodiles are more closely related to each otherthan either is to lizards (Harvey and Pagel 1991).
Cladistics An alternative approach, known as cladistics, attempts to focuson evolutionary relationships. A cladist would place birds and crocodiles inthe same taxonomic group and lizards in another. The guiding principle ofcladistics is that only shared derived traits should be used to construct clas-sifications; shared primitive traits should not. The fact that both humansand monkeys have five digits would not be used to judge their relationshipbecause comparative and fossil data have shown us that five digits are a prim-itive trait. Nor are all derived traits applicable. The large brain of humanscannot be used to determine an evolutionary relationship with monkeys orapes because it is unique to humans. In cladistics, only homologous traitsthat are both shared and derived can be used to evaluate the evolutionary re-lationship of two species. For example, both humans and apes share certainfeatures of their shoulder anatomy (see Chapter 9) that are not shared withmonkeys or other primates. Comparative anatomy and the fossil record showthat both humans and apes have these traits in common because they inher-
FIGURE 8.3
Illustration of the use of an outgroup in cladistic analysis. This diagram shows the relationshipamong humans, apes, and monkeys based on the presence or absence of a tail. Humans and apes lack a tail, which makes them different from monkeys. According to the principlesof cladistics, lack of a tail can be considered a shared derived trait in humans and apes if the presence of a tail was indeed the primitive condition. Using an outgroup, such as othermammals, shows that the presence of a tail is very widespread apart from humans and apes,and it is the primitive condition. According to this model, monkeys have tails because theyretained this primitive trait, whereas the inferred common ancestor of humans and apes lostthe tail, a trait inherited in both from this common ancestor.
Monkeys(tail)
Humans(no tail)
Apes(no tail)
Outgroup(tail)
Inferred commonancestor of humans and apes (no tail)
Inferred commonancestor of humans, apes, and monkeys (tail)
Inferred commonancestor of humans, apes, monkeys, and outgroup (tail)
cladistics A school ofthought that stressesevolutionary relationshipsbetween organisms informing biologicalclassifications.
I I I I I I I
206 PART III ■ Our Place in Nature

Relethford: The Human Species: An Introduction to Biological Anthropology, 5/e
III. Our Place in Nature 8. Primates in Nature © The McGraw−Hill Companies, 2003
ited them from a common ancestor that had changed from an ancestral state.That is, humans and apes are similar because of shared derived characteristics.
How do we tell if a given trait is primitive or derived? A commonly usedmethod is to compare the groups of interest with an outgroup, a group thatis more distantly related to the species being classified. For example, considerthe presence or absence of a tail in three different related groups—humans,apes, and monkeys. Humans and apes do not have tails, but monkeys do. Ac-cording to the cladistic method, we would place humans and apes in thesame group if the absence of a tail were a shared derived trait—that is, onethat was present in the common ancestor of humans and apes but not in thecommon ancestor of humans, apes, and monkeys. How do we know whetherthe common ancestor of all three groups had a tail or not? An appropriateoutgroup for this example might be more distantly related primates or othermammals. Because the presence of a tail is found in most of these mammals,we would conclude that the primitive state was the presence of a tail and theabsence of a tail in both humans and apes reflects their descent from a com-mon ancestor not shared with monkeys (Figure 8.3).
The VertebratesAs with all living creatures, human beings can be classified according to thedifferent levels of Linnaean taxonomy—kingdom, phylum, class, and so on. Atraditional taxonomic description of modern humans is given in Table 8.1.
The Animal Kingdom Kingdom is the most inclusive taxonomic category.All living organisms can be placed into one of five kingdoms: plants, ani-mals, fungi, nucleated single-celled organisms, and bacteria. Major differences
CHAPTER 8 ■ Primates in Nature 207
TA B L E 8 .1 Traditional Classification of Humans
Taxonomic Category Taxonomic Name Common Name
Kingdom Animalia AnimalsPhylum Chordata ChordatesSubphylum Vertebrata VertebratesClass Mammalia MammalsSubclass Eutheria Placental mammalsOrder Primates PrimatesSuborder Anthropoidea AnthropoidsInfraorder Catarrhini Old World anthropoidsSuperfamily Hominoidea HominoidsFamily Hominidae HominidsGenus/Species Homo sapiens Humans
Note: This “traditional” classification is found in many texts but is not without controversy, inparticular with regard to the placement of humans as hominids. Some advocate that humansand the African apes should be classified as hominids and that humans should be considered a tribe (a subgroup of family) known as the hominins. This is discussed at greater length inChapter 9.
outgroup A group used for comparison in cladisticanalyses to determinewhether the ancestral stateof a trait is primitive orderived.
I I I I I I I

Relethford: The Human Species: An Introduction to Biological Anthropology, 5/e
III. Our Place in Nature 8. Primates in Nature © The McGraw−Hill Companies, 2003
among these kingdoms are their source of food and their mobility. Whereasplants produce their own food through photosynthesis, animals must in-gest food. Humans belong to the animal kingdom. Given that animals mustingest food, it is no surprise to see that most animals have well-developednervous, sensory, and movement systems to enable them to sense and ac-quire food.
Vertebrate Characteristics Humans belong to the phylum Chordata (thechordates, animals with a spinal cord). Perhaps the most important charac-teristic of chordates is that they possess at some point in their life a noto-chord, a flexible internal rod that runs along the back of the animal. Thisrod acts to strengthen and support the body. In humans, it is present early ingestation and is later reabsorbed.
Humans belong to the subphylum Vertebrata (the vertebrates, animalswith backbones). One characteristic of vertebrates is that they have bilateralsymmetry, which means that the left and right sides of their bodies are ap-proximately mirror images. Imagine a line running down a human being fromthe top of the head to a spot between the feet. This line divides the body intotwo mirror images. This pattern contrasts with other phyla of animals suchas starfish.
Another characteristic of vertebrates is an internal spinal cord coveredby a series of bones known as vertebrae. The nerve tissue is surrounded bythese bones and has an enlarged area of nerve tissue at the front end of thecord—the brain.
The general biological structure of human beings can be found in manyother vertebrates. Figure 8.1 shows the limb bones of three vertebrates—human, whale, and bird. It is important to note the similarity among thesethree different organisms. Like most vertebrates, all have the same basicskeletal pattern: a single upper bone and two lower bones in each limb, andfive digits. Some vertebrates have changed considerably from this basic pat-tern. For example, a modern horse has one digit (a toe) on the end of eachlimb. Humans may seem to be rather specialized and sophisticated creatures,but actually they have retained much of the earliest basic vertebrate skeletalstructure.
The subphylum of vertebrates also includes several classes of fish alongwith the amphibians, reptiles, birds, and mammals. Humans belong to theclass of mammals, and much of our biology and behavior can be understoodin terms of what it is to be a mammal.
CHARACTERISTICS OF MAMMALS
The first primitive mammals evolved from early reptiles approximately 200 mil-lion years ago. The distinctive features of modern mammals and modern rep-tiles are the result of that long period of separate evolution in the two classes.It is important to realize that the further back in time we look, the more dif-ficult it is to tell one form from another. Keep in mind that the definition
208 PART III ■ Our Place in Nature
Chordata A vertebratephylum consisting oforganisms that possess anotochord at some periodduring their life.
notochord A flexibleinternal rod that runs alongthe back of an animal.
Vertebrata A subphylum of the phylum Chordata,defined by the presence of an internal, segmentedspinal column and bilateralsymmetry.
bilateral symmetrySymmetry in which theright and left sides of thebody are approximatelymirror images.
I I I I I I I

Relethford: The Human Species: An Introduction to Biological Anthropology, 5/e
III. Our Place in Nature 8. Primates in Nature © The McGraw−Hill Companies, 2003
and characteristics of any modern form reflect continued evolution from anearlier ancestor.
Because mammals and reptiles are related through evolution, it is logicaland useful to compare these two classes to determine the unique features ofeach. Modern mammals differ from modern reptiles in reproduction, tem-perature regulation, diet, skeletal structure, and behavior. As we look at eachof these factors separately, do not forget that they are interrelated.
ReproductionMammals are often identified as animals that give birth to live offspring,whereas other vertebrates lay eggs. This is not completely accurate. Somefish, such as guppies, give birth to live infants. Also, some mammals, such asthe platypus, lay eggs. Others, such as kangaroos, give birth to an extremelyimmature fetus that completes development inside a pouch in the mother.The most common mammal found today belongs to the subclass of placen-tal mammals, characterized by the development of the fetus inside of themother’s body. Humans are placental mammals.
Placental Mammals The placenta is an organ that develops inside the fe-male during pregnancy. It functions as a link between the circulatory systemsof the mother and child, acting to transport food, oxygen, and antibodies, aswell as to filter out waste products. The efficiency of the placenta means thatthe developing offspring of placental mammals have a much greater chanceof survival than does a reptile developing in an egg or in a nonplacental mam-mal (both egg layers and marsupials, Figures 8.4 and 8.5). Development in-side the mother provides warmth and protection along with proper nutrition.
FIGURE 8.4
The spiny anteater, an egg-laying mammal. (© GerardLacz/Animals Animals)
placenta An organ thatdevelops inside a pregnantplacental mammal thatprovides the fetus withoxygen and food and helps filter out harmfulsubstances.
I I I I I I I
CHAPTER 8 ■ Primates in Nature 209

Relethford: The Human Species: An Introduction to Biological Anthropology, 5/e
III. Our Place in Nature 8. Primates in Nature © The McGraw−Hill Companies, 2003
Although placental mammals appear at first glance to be superior to egg-layingreptiles, the presence of a placenta has a cost as well as a benefit. Pregnantmammals consume a great deal of energy, making ample food resources vitalto successful birth. Also, the demand on energy sets a limit on the numberof offspring any female mammal can have at one time.
A main feature of mammals is the female mammary glands, which pro-vide food for the newborn infant. Important immunities are also provided inmother’s milk. The ready availability of food increases the child’s chance ofsurvival. Although advantageous, nursing also has a price; energy is expendedby the mother during this process, and only a limited number of offspringcan be taken care of at one time.
Parental Care The prenatal (before birth) and postnatal (after birth) pat-terns of parental care in mammals contrast with those of reptiles, which ex-pend less energy during reproduction and care of offspring. Pregnancy andraising offspring take energy; the more offspring an organism has, the lesscare a parent can give each of them. Consequently, some animals have manyoffspring but provide little care to them, whereas other animals have few off-spring and provide much more care to each.
Species vary in terms of the balance between number of offspring anddegree of parental care. One extreme example is the oyster, which produces
210 PART III ■ Our Place in Nature
FIGURE 8.5
The wallaby, a marsupialmammal. (© Hans & Judy Beste/Animals Animals)
prenatal The period of lifefrom conception until birth.
postnatal The period of lifefrom birth until death.
I I I I I I I

Relethford: The Human Species: An Introduction to Biological Anthropology, 5/e
III. Our Place in Nature 8. Primates in Nature © The McGraw−Hill Companies, 2003
roughly half a billion eggs a year and provides no parental care. Fish can pro-duce 8,000 eggs a year with a slight amount of parental care. Frogs can lay200 eggs a year with slightly more parental care.
Compared to other animals, mammals have relatively few offspring butprovide much more parental care. The development of the placenta and themammary glands are biological features that maximize the amount of caregiven to an offspring. A female lion, for example, has only two offspring peryear and provides a great deal of care to them. An extreme example amongmammals is the orangutan, an ape that has roughly one offspring every eightyears (Galdikas and Wood 1990).
From an evolutionary viewpoint, which strategy is better: having manyoffspring but providing little care, or having fewer offspring and providinggreater care? Each strategy has its advantages and disadvantages. In general,those species that have many offspring tend to be at an advantage in rapidlychanging environments, whereas those that provide greater care are at an ad-vantage in more stable environments (Pianka 1983).
Temperature RegulationModern mammals are homeotherms; they are able to maintain a constantbody temperature under most circumstances. Modern reptiles are cold-blooded and cannot keep their body temperature constant; they need to usethe heat of the sun’s rays to keep them warm and their metabolism active.Mammals maintain a constant body temperature in several ways. Mammalsare covered with fur or hair that insulates the body, preventing heat loss incold weather and reducing overheating in hot weather. Temporary changesin the size of blood vessels also aid in temperature regulation. When bloodvessels contract, blood flow is reduced and less heat is lost from the mam-mal’s extremities. When blood vessels dilate, blood flow is increased to theextremities, thus allowing greater heat loss.
Mammals also maintain a constant body temperature by ingesting largequantities of food and converting the food to energy in the form of heat.When you feel hot, your body is not losing the produced heat quickly enough.When you feel cold, you are losing heat too quickly. The ability to convertfood energy to heat enables mammals to live comfortably in many environ-ments where reptiles would slow down or even die.
Mammals are thus able to exploit a large number of environments. Heatproduction and temperature regulation, however, though obviously usefuladaptations in certain environments, are not without a price. To obtain en-ergy, mammals need to consume far greater quantities of food than reptiles.In environments where food resources are limited, mammals may be worseoff than reptiles. Again, the evolutionary benefit of any trait must be lookedat in terms of its cost.
Humans, of course, have gone beyond the basic temperature-regulatingabilities of other mammals. We have developed a variety of technologies thathelp keep us warm or cool. Fire and clothes were the earliest inventions of
CHAPTER 8 ■ Primates in Nature 211
homeotherm Organismcapable of maintaining aconstant body temperatureunder most circumstances.
I I I I I I I

Relethford: The Human Species: An Introduction to Biological Anthropology, 5/e
III. Our Place in Nature 8. Primates in Nature © The McGraw−Hill Companies, 2003
this sort. Today we have all sorts of heating and cooling devices that enableus to live in virtually any environment on the earth, as well as in outer space.Our culture has allowed us to go beyond our biological limits.
TeethThe saying “You are what you eat” is not usually made literally, but in fact itembodies an important truth of ecology and evolution. The nutritional re-quirements of organisms dictate, in part, their environmental needs. Also,diet is reflected in the physical structure of organisms, particularly the teethand jaws. Because mammals maintain a constant body temperature by con-verting food energy to heat, they require a considerable amount of food. Thephysical features of mammalian teeth reflect this need.
The teeth of modern reptiles are all the same (homodontic); they allhave sharp sides and are continually replaced throughout life. A major func-tion of reptilian teeth is to hold and kill prey. The food is then most ofteneaten whole. Mammals, on the other hand, have different types of teeth intheir jaws (heterodontic). Mammals usually have two sets of teeth duringtheir lives: a set of deciduous (“baby”) teeth and a set of permanent teeth. Asa mammal grows and matures, the baby teeth fall out and are replaced withthe adult teeth. In modern humans, this replacement normally starts aroundage 6 and takes the first 18 or 20 years of life to complete.
Types of Teeth Most mammals have four types of teeth: incisors, canines,premolars, and molars. These teeth in a chimpanzee and a human are shownin Figure 8.6. The incisor teeth are chisel- or spatula-shaped and located inthe front of the jaw. Both the human and the chimpanzee (and other higherprimates) have a total of four incisors in each jaw. These teeth are used forcutting and slicing food. You use your incisors when you eat an apple or cornon the cob. Behind the incisors are the canine teeth, which are often longand sharp, resembling fangs or tusks. Apes and humans have two canine teethin each jaw. In many mammals, the canine teeth are used as weapons or tokill prey. Although the canine teeth of most mammals are rather large and
212 PART III ■ Our Place in Nature
FIGURE 8.6
The lower jaws and teeth of a chimpanzee and a modernhuman.
Molars
Premolars
Canine
Incisors
HUMANCHIMPANZEE
Molars
Premolars
Canine
Incisors
homodontic All teeth arethe same.
heterodontic Havingdifferent types of teeth.
incisor The chisel-shapedfront teeth used for cutting,slicing, and gnawing food.
canine The teeth located infront of the jaw behind theincisors, which are normallyused by mammals forpuncturing and defense.
premolar One of the typesof back teeth, used forcrushing and grinding food.
molar The teeth furthestback in the jaw used forcrushing and grinding food.
I I I I I I I

Relethford: The Human Species: An Introduction to Biological Anthropology, 5/e
III. Our Place in Nature 8. Primates in Nature © The McGraw−Hill Companies, 2003
project beyond the level of the rest of the teeth, human canines are usuallysmall and nonprojecting.
The premolar and molar teeth are also known collectively as the backteeth or cheek teeth. Both of these types of teeth are often large in surfacearea and are used for grinding and chewing food. When you chew food be-tween your back teeth, you do not simply move your lower jaw up and down.Instead, your upper and lower back teeth grind together in a circular motionas your jaw moves up and down and sideways as well. The structures of thepremolar and molar teeth are different, and in some mammals these teethhave different functions as well.
Dental Formulae Mammals can be characterized by the number of eachtype of tooth they have. The usual method of counting teeth is to considerthe number of each type of tooth in one-half of one jaw, upper or lower. Onlyone-half of the jaw is considered because both right and left sides of the jawcontain the same number of teeth. These numbers are expressed using a dental formula, which lists the number of incisors, canines, premolars, andmolars in one-half of a jaw. A dental formula looks like this: I-C-PM-M. HereI = number of incisors, C = number of canines, PM = number of premolars,and M = number of molars. For example, the typical dental formula of hu-mans (as well as apes and some monkeys) is 2-1-2-3. This means that in one-half of either jaw there are two incisors, one canine, two premolars, and threemolars. Each half of each jaw therefore contains 2 + 1 + 2 + 3 = 8 teeth. Thetypical number of teeth in humans is therefore 8 × 4 = 32 (two sides of eachof two jaws). Some mammals have different numbers of teeth in the top andbottom jaws. In these cases, we use two dental formulae. For example, a dentalformula of 2-1-2-3/2-1-2-2 would indicate two fewer molars in the lower jaw.
Diet and Teeth The basic description of the types of teeth is somewhatsimplistic. Many mammals have evolved specialized uses of one or more ofthese tooth types. As noted earlier, human canines are rather different inform and function from those of many other mammals. The general descrip-tion is useful, however, in showing the importance of differentiated teeth inmammals. By having different types of teeth capable of slicing, cutting, andgrinding, mammals are able to eat a wide variety of different foods in an effi-cient way. In addition, the ability to chew the food rather than swallow it wholeallows greater efficiency in eating. By chewing, mammals break down thefood into smaller pieces that can be digested more easily and efficiently. Also,saliva released in the mouth during chewing begins the process of digestion.
The nature of mammalian diet and teeth relates to their warm-blooded-ness. Mammals need more food than reptiles, and their teeth allow them toutilize a wider range of food and to process it more productively. The bene-fits of differentiated teeth lie in these abilities. The cost is the fact that theteeth tend to wear out over time. When a mammal’s adult teeth are worn down,it may not be able to eat or may develop serious dental problems, which couldlead to death. As far as recent humans are concerned, we can circumvent thesepotential problems to a certain extent with dental technology, hygiene, and
CHAPTER 8 ■ Primates in Nature 213
dental formula Ashorthand method ofdescribing the number ofeach type of tooth in onehalf of one jaw on amammal.
I I I I I I I

Relethford: The Human Species: An Introduction to Biological Anthropology, 5/e
III. Our Place in Nature 8. Primates in Nature © The McGraw−Hill Companies, 2003
processed foods. Even so, dental problems continue to pose serious difficul-ties to human health.
Skeletal StructureBoth mammals and reptiles share the basic skeletal structure of all vertebrates,but there are some differences, especially in movement. In reptiles, the fourlimbs come out from the side of the body for support and movement (Fig-ure 8.7). In four-legged mammals, the limbs slope downward from the shoul-ders and hips. Having the limbs tucked in under the body allows more effi-cient and quicker movement. The weight of the body is supported better.Humans differ from the pattern of many mammals by using only two limbsfor movement. Even so, the configuration of the legs follows the basic pat-tern; the legs slope inward from the hips and are not splayed out to the sides.
BehaviorThe brains of all vertebrates have similar structures but differ in size, relativeproportions, and functions. All vertebrates have a hindbrain, a midbrain,and a forebrain. In most vertebrates, the hindbrain is associated with hear-ing, balance, reflexive behaviors, and control of the autonomic functions ofthe body, such as breathing. The midbrain is associated with vision, and theforebrain is associated with chemical sensing, such as smelling ability. Com-
214 PART III ■ Our Place in Nature
FIGURE 8.7
The orientation of the limbs to the body in reptiles and inmammals.
REPTILE MAMMAL
Relethford: The Human Species: An Introduction to Biological Anthropology, 5/e
III. Our Place in Nature 8. Primates in Nature © The McGraw−Hill Companies, 2003
pared to fish, reptiles have a relatively larger midbrain and hindbrain becausethey rely more extensively on vision and hearing. The midbrain of a reptile isparticularly enlarged because it functions to coordinate sensory informationand body movements.
The brain of a mammal reveals several important shifts in structure andfunction. The mammalian brain has a greatly enlarged forebrain that is re-sponsible for processing sensory information and coordination. In particu-lar, the forebrain contains the cerebrum, the outermost layer of brain cells,which is associated with learning, memory, and intelligence. The cerebrumbecomes increasingly convoluted, which allows huge numbers of intercon-nections between brain cells. It accounts for the largest proportion of themammalian brain.
The overall functions of a brain include basic body maintenance, as wellas the ability to process information and respond accordingly. Mammals relymore on learning and flexible responses than do reptiles. Behaviors are lessinstinctual and rigid. Previous experiences (learning) become more impor-tant in responding to stimuli. As a consequence, mammals are more capableof developing new responses to different situations and are capable of learn-ing from past mistakes. New behaviors are more likely to develop and can bepassed on to offspring through the process of learning. Humans have takenthis process even further; our very existence depends on flexible behaviorsthat must be learned. Although our behavior is to a large extent cultural, ourability to transfer information through learning relies on a biological trait:the mammalian brain.
The behavioral flexibility of mammals ties in with their pattern of repro-duction. In general, the more a species relies on parental care, the more intel-ligent it is and the more it relies on learning rather than instinct. Extensiveparental care requires increased intelligence and the ability to learn new be-haviors in order to provide maximum care for infants. The increased empha-sis on learning requires, in turn, an extended period of growth during whichto absorb the information needed for the adult life. Furthermore, the exten-sion of childhood requires more extensive child care so that offspring areprotected during the time they need to complete their growth and learning.
The major characteristics of mammals are all interrelated. Reproductivebehaviors are associated with learning, intelligence, and social behaviors.The ability to maintain body temperature is related to diet and teeth; warm-bloodedness requires vast amounts of energy that in turn is made availablefrom differentiated teeth and a wide dietary base. Also, the reproductive pat-tern of placental mammals requires great amounts of energy, which in turnrelates to diet. In fact, the major characteristics of any group of animals arenot merely a list of independent traits; they represent an integrated complexof traits.
PRIMATE CHARACTERISTICS
There are many different forms of mammals—they are as diverse as mice,whales, giraffes, cats, dogs, and apes. Patterns of biology and behavior vary
CHAPTER 8 ■ Primates in Nature 215
cerebrum The area of the forebrain that consistsof the outermost layer of brain cells, associatedwith memory, learning, andintelligence.
I I I I I I I
Relethford: The Human Species: An Introduction to Biological Anthropology, 5/e
III. Our Place in Nature 8. Primates in Nature © The McGraw−Hill Companies, 2003
considerably, although all mammals share to some extent the basic charac-teristics outlined in the last section.
Recall that the mammalian class is broken down into a number of orders.Humans, as noted, are primates, as are the apes, such as the chimpanzee,bonobo, and gorilla, which are our closest living relatives. Monkeys are alsoprimates, as are more biologically primitive forms known as prosimians. Thebasic characteristics of primates are discussed in this section. The next chap-ter describes variation in the biology and behavior of primates, including adiscussion of different types of primates.
No single characteristic identifies primates; rather, they share a set offeatures. Many of these features relate to living in the trees. Though it is clearthat humans, as well as a few other modern primates, do not live in the trees,they still retain certain features inherited from ancestors who did.
An arboreal (tree-living) environment presents different challenges thana terrestrial (ground-living) environment. Living in the trees requires an ori-entation to a three-dimensional environment. Animals that live on the groundgenerally contend with only two dimensions: length and width. Arboreal ani-mals must also deal with the third dimension, height. Perception of distanceand depth is vital to a tree-living form, which moves quickly from one branchto the next and from one level of the forest to another. Agility is also impor-tant, as is the ability to anchor oneself in space.
Many forms of animals, such as squirrels and birds, have adapted to liv-ing in the trees. Primates, however, are capable of extensive rapid movementthrough the trees and are able to move to all areas of a tree, including smallterminal branches. A squirrel can climb up and down the trunk of a tree andeven large branches, but primates are better equipped to move out to feed oneven the smallest branches. The two major characteristics of primates thataccount for their success in the trees are the ability to use hands and feet tograsp branches (rather than digging in with claws) and the ability to perceivedistance and depth.
Although many primate characteristics relate to living in the trees, somecontroversy has arisen over whether the initial evolution of these traits wasthe result of arboreal adaptations. Noting that other mammals, such assquirrels, have adapted to the trees without having grasping hands or depthperception, Cartmill (1974) has suggested an alternative for the origin of pri-mate characteristics. He suggests that grasping hands and depth perceptionfirst evolved as adaptations for insect hunting in low branches. Later, thesefeatures were adapted for life in the trees. In this section we examine both thearboreal adaptation and insect predation models. The fossil evidence bearingon these models is discussed in Chapter 11.
Not all modern primates have kept the original adaptations of the firstprimates. For example, humans can still use their hands to grasp objects butcannot do so with their feet. We do not normally use our hands to grasp andhang onto branches. We have taken our inherited ability to grasp and put itto work in another arena: we hold tools, weapons, food, and children. Thegrasping hands of a human and a tree-living monkey are homologous—thatis, they are similar structures because of common descent. The different func-
216 PART III ■ Our Place in Nature
arboreal Living in trees.
terrestrial Living on theground.
I I I I I I I
Relethford: The Human Species: An Introduction to Biological Anthropology, 5/e
III. Our Place in Nature 8. Primates in Nature © The McGraw−Hill Companies, 2003
tions of the hands of humans and tree-living monkeys reflect adaptive changesfrom the original primate ancestors. Even though humans do things differ-ently, we are still primates and have the basic set of primate characteristics.
The SkeletonFirst let us consider some general characteristics in the primate skeletalstructure.
Grasping Hands A characteristic of the earliest known mammals (and rep-tiles) is five digits on each hand or foot. Certain mammals, such as the horse,have changed from this ancestral condition and only have a single toe oneach limb. Other mammals, such as the primates, have kept the ancestralcondition.
In the case of primates, the retention of the primitive characteristics offive digits on the hands and feet turned out to be an important adaptation.The hands and feet of primates are prehensile, meaning that they are capa-ble of being used to grasp objects. The ability to grasp involves the movementof the fingers to the palm, thus allowing the fingers to wrap around an ob-ject. In many primates, the toes can also wrap around an object. This grasp-ing ability is a remarkable adaptation to living in the trees. Primates can grabonto branches to move about, to provide support while eating, and in gen-eral to allow for a high degree of flexibility in moving about their environ-ment. More specialized structures, such as the horse’s single hoof, would beuseless in the trees because there would be no way to grasp branches.
Another feature of primate hands and feet is their expanded tactile pads(such as the ball of your thumb) and nails instead of claws. Nails serve to pro-tect the sensitive skin at the ends of the fingers and the toes. The numerousnerve endings in the tips of fingers and toes of primates provide an enhancedsense of touch that is useful in manipulating objects.
As mentioned earlier, the characteristics possessed by primates are notthe only possible solution to the challenge of living in the trees. Squirrels,for example, use their claws to dig into the bark of limbs and branches whenthey climb in the trees. The grasping ability of primate hands, however, pro-vides much greater flexibility. Food can be reached at the end of small branchesby grasping surrounding branches for support, using a free arm to reach outand grab the food, and then bringing it to the mouth. A small branch mightnot provide enough surface area for a squirrel to dig its claws into, but a pri-mate can use its grasping hands and feet to hold onto it.
Variations on these themes occur even within primates. Humans differfrom the general primate conditions. We have lost the ability to use our feetfor grasping as a result of anatomical changes relating to our ability to walkon two legs.
Generalized Structure Biological structures are often classified as special-ized or generalized. Specialized structures are used in a highly specific way,whereas generalized structures can be used in a variety of ways. The hooves
CHAPTER 8 ■ Primates in Nature 217
prehensile Capable ofgrasping.
specialized structure Abiological structure adaptedto a narrow range ofconditions and used in very specific ways.
generalized structure Abiological structure adaptedto a wide range of conditionsand used in very generalways.
I I I I I I I

Relethford: The Human Species: An Introduction to Biological Anthropology, 5/e
III. Our Place in Nature 8. Primates in Nature © The McGraw−Hill Companies, 2003
of a horse, for example, are a specialization that allows rapid running overland surfaces. The basic skeletal structure of primates is generalized becauseit allows movement flexibility in a wide variety of circumstances.
The arm and leg bones of primates follow the basic pattern of many ver-tebrates: each limb consists of an upper bone and two lower bones (refer backto Figure 8.1). This structure allows limbs to bend at the elbows or knees. Inclimbing or jumping in a tree, you must have this flexibility or you wouldnot be able to move about (imagine trying to jump from one branch to an-other with your arms and legs made up of one long bone). That the lowerpart of the limb is made up of two bones provides even greater flexibility.Hold your arm out straight in front of you with your palm down. Now turnyour hand so that the palm side is up. This is easy to do, but only because wehave two lower arm bones. When turning the hand over, one lower arm bonecrosses over the other. Imagine trying to climb in a tree without the ability tomove your hand into different positions. This flexibility is obtained by theretention of a generalized skeletal structure.
Although the grasping hands and generalized skeletons of primates canbe interpreted as arboreal adaptations, Cartmill (1974) raises the possibilitythat they first arose as adaptations to insect predation. Grasping hands andfeet would be valuable for running along the ground and on small branchesin search of insects. Once these traits evolved, they could then have been valu-able for further use in arboreal environments.
VisionThe three-dimensional nature of arboreal life requires keen eyesight, particu-larly depth perception. This feature has evolved from the need to judge dis-tances successfully. (Jumping through the air from branch to branch demandsthe ability to judge distances. After all, it is not very adaptive to fall short ofyour target and plunge to the ground!)
Depth perception involves binocular stereoscopic vision. Binocular refersto overlapping fields of vision. The eyes of many animals are located at thesides of the skull so that each eye receives a different image with no overlap.The eyes of primates are located in the front of the skull so that the fields ofvision overlap (Figure 8.8). Primates see objects in front of them with botheyes. The stereoscopic nature of primate vision refers to the way in which thebrain processes visual signals. In nonstereoscopic animals, the informationfrom one eye is received in only one hemisphere of the brain. In primates, thevisual signals from both eyes are received in both hemispheres of the brain.The result is an image that has depth. Moving quickly and safely in three di-mensions makes use of depth perception.
Many primates also have the ability to perceive colors. Color vision is ex-tremely useful in detecting objects in moderate-contrast environments. Infact, color vision is found in other animals for this reason, including whales,fish, bumblebees, and certain birds. Color vision is also important in primatespecies that use color as a visual signal of various emotional states, such asanger or receptivity to sexual relations.
218 PART III ■ Our Place in Nature
binocular stereoscopicvision Overlapping fields ofvision with both sides of thebrain receiving images fromboth eyes, thereby providingdepth perception.
I I I I I I I

Relethford: The Human Species: An Introduction to Biological Anthropology, 5/e
III. Our Place in Nature 8. Primates in Nature © The McGraw−Hill Companies, 2003
Primates are vision-oriented. On average, their sense of smell is less keen.As a result, the areas of the face devoted to smelling are reduced in primates.Compared to other mammals, primates have short snouts.
The Brain and BehaviorPrimates have expanded on the basic pattern of mammalian brains. Theirbrains are even larger relative to body size. Primate brains have larger visualareas and smaller areas for smelling, corresponding to their increased em-phasis of vision over smell as the main sense. Also, primate brains are evenmore complex than those of most other mammals. Primates have larger pro-portions of the brain associated with learning and intelligence. Areas of thebrain associated with body control and coordination are also proportion-ately larger, as expected from the demands of arboreal life. Hand–eye coordi-nation, for example, is crucial for moving about in the trees.
Learning The greater size and complexity of primate brains are reflected intheir behaviors. Many primates rely extensively on learned behaviors. As a re-sult, it is often difficult to assign specific behaviors to a given species of pri-mate because the increased emphasis on learning allows a great deal of flexi-bility in behavior patterns.
The increased emphasis on learning means that primates spend a greaterproportion of their lives growing up, both biologically and socially, thanother animals. The more an animal needs to learn, the longer the period oftime needed for learning. An increase in the amount of time spent as an in-fant or child further means that greater amounts of attention and care arerequired from parents. Again, we see the intimate relationship among repro-duction, care of offspring, learning, and intelligence.
CHAPTER 8 ■ Primates in Nature 219
FIGURE 8.8
Binocular stereoscopic visionin primates. The fields of visionfor each eye overlap, and theoptic nerve from each eye isconnected to both hemispheresof the brain. (From HumanAntiquity: An Introduction toPhysical Anthropology andArchaeology, 4th ed., by KennethFeder and Michael Park. Fig. 5.1.Copyright © 2001 by MayfieldPublishing Company. Reprinted withpermission from The McGraw-HillCompanies)
Left hemisphereof brain
Eye
Optic nerve
Right hemisphereof brain
Visual cortex
Overlapping fields of vision

Relethford: The Human Species: An Introduction to Biological Anthropology, 5/e
III. Our Place in Nature 8. Primates in Nature © The McGraw−Hill Companies, 2003
The basic pattern of primate learning provides a means by which new be-haviors can be passed on from one generation to the next. If we define culturesimply as learned behavior, it is obvious that all primates can be said to haveculture. Most of the time, however, the distinctive nature of human cultureis identified as its reliance on language for transmission. Within this frame-work, the cultural behaviors and social organization of nonhuman primatesare often referred to as protoculture. No matter what terms we use, however,or how we define human and nonhuman culture, the fact remains that sociallearning provides a means by which behaviors are passed on from one gener-ation to the next in all primates (and, indeed, in many other mammals).
An Example of Learned Behavior in Primates Primate studies have pro-vided many good examples of the introduction of new behaviors to a groupby one or more individuals that are then learned by other individuals. Stud-ies of the Japanese macaque monkeys on the island of Koshima during the1950s revealed a number of cases of cultural transmission of new behaviors.The Koshima troop has been provisioned (provided with food) since the early1950s to keep all the monkeys out in the open for observation purposes (Fig-ure 8.9).
In 1953, a young female macaque named Imo began washing sweet pota-toes in a stream before eating them. Within three years, this behavior hadbeen learned by almost half of the troop. Two years later, only two adults con-
220 PART III ■ Our Place in Nature
FIGURE 8.9
A macaque washing food inwater. (© Steve Gaulin/Anthro-Photo)

Relethford: The Human Species: An Introduction to Biological Anthropology, 5/e
III. Our Place in Nature 8. Primates in Nature © The McGraw−Hill Companies, 2003
tinued this practice. Of the 19 younger monkeys, 15 had adopted this behav-ior, however, and thereafter almost all newborn infants acquired it by observ-ing their mothers (Bramblett 1976).
Another food-related behavior developed among the troop in 1956 whenscientists began feeding the monkeys grains of wheat. The wheat was scat-tered on a sandy beach to slow down the monkeys’ eating so that researcherswould have more time to study them. Imo developed a new method of eatingthe grains of wheat. She took handfuls of sand and wheat down to the waterand threw them in. The sand sank while the wheat floated, thus letting herskim the grains off the surface of the water. This new behavior provided amuch quicker way of getting the wheat than picking out grains from thesand. The young female’s method of wheat washing spread quickly throughmost of the rest of the troop (Bramblett 1976).
The studies of cultural transmission among the Japanese macaques showthe importance of learning in primate societies. Washing sweet potatoes andseparating wheat from sand are not innate behaviors in Japanese macaques.These behaviors are transmitted through learning, not genetic inheritance.The studies also show the importance of individual behavior: in both cases,the same monkey introduced the behaviors. If that monkey were not presentin that troop, these behaviors might not have developed.
Reproduction and Care of OffspringAs with all mammals, primates are characterized by a small number of off-spring and a great deal of parental care. Almost all primates have a reproduc-tive pattern of having one offspring at a time. The next offspring is not bornuntil the previous one is mature enough, biologically and socially, to surviveon its own. In some primates, such as the apes, there may be as many as fiveor more years between offspring. As mentioned earlier, humans are an excep-tion to this rule because we can have overlapping births without sacrificingthe quality of parental care.
The Mother–Infant Bond Primates have a strong and long-lasting bondbetween mother and infant. Unlike some mammals, infant primates are en-tirely helpless. They depend on their mothers for food, warmth, protection,affection, and knowledge, and they remain dependent for a long time. Of allthe different types of social bonds in primate societies, the mother–infantbond is the strongest. In many primate species, this bond continues well pastinfancy. Chimpanzees, for example, regularly associate with their mothersthroughout their adult lives (Goodall 1986).
The biological importance of the mother–infant bond is easy to see: theinfants are dependent on mother’s milk for nourishment. Is that all there isto it? Earlier in this century, some researchers suggested that the entire basisof “mother love” seen in primate infants arose from the infant’s need forfood. Laboratory experiments and field observations soon showed that thisis not the case; the social aspects of the mother–infant bond are also crucialfor survival.
CHAPTER 8 ■ Primates in Nature 221
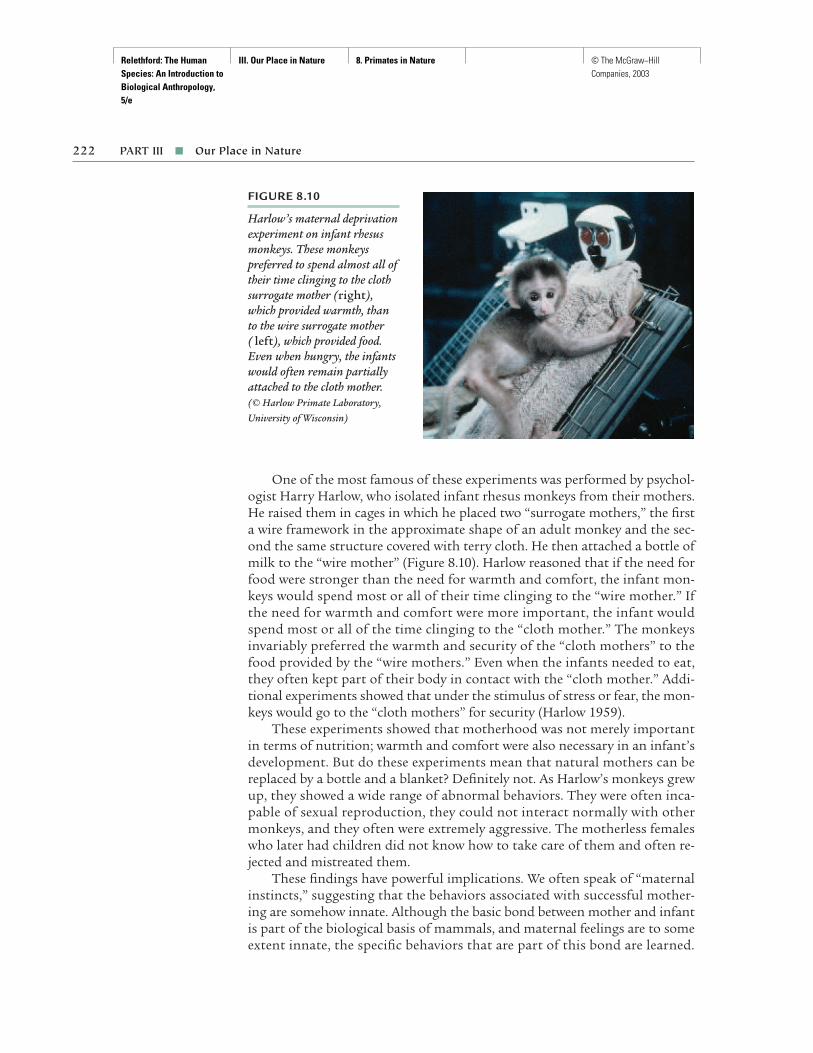
Relethford: The Human Species: An Introduction to Biological Anthropology, 5/e
III. Our Place in Nature 8. Primates in Nature © The McGraw−Hill Companies, 2003
One of the most famous of these experiments was performed by psychol-ogist Harry Harlow, who isolated infant rhesus monkeys from their mothers.He raised them in cages in which he placed two “surrogate mothers,” the firsta wire framework in the approximate shape of an adult monkey and the sec-ond the same structure covered with terry cloth. He then attached a bottle ofmilk to the “wire mother” (Figure 8.10). Harlow reasoned that if the need forfood were stronger than the need for warmth and comfort, the infant mon-keys would spend most or all of their time clinging to the “wire mother.” Ifthe need for warmth and comfort were more important, the infant wouldspend most or all of the time clinging to the “cloth mother.” The monkeysinvariably preferred the warmth and security of the “cloth mothers” to thefood provided by the “wire mothers.” Even when the infants needed to eat,they often kept part of their body in contact with the “cloth mother.” Addi-tional experiments showed that under the stimulus of stress or fear, the mon-keys would go to the “cloth mothers” for security (Harlow 1959).
These experiments showed that motherhood was not merely importantin terms of nutrition; warmth and comfort were also necessary in an infant’sdevelopment. But do these experiments mean that natural mothers can bereplaced by a bottle and a blanket? Definitely not. As Harlow’s monkeys grewup, they showed a wide range of abnormal behaviors. They were often inca-pable of sexual reproduction, they could not interact normally with othermonkeys, and they often were extremely aggressive. The motherless femaleswho later had children did not know how to take care of them and often re-jected and mistreated them.
These findings have powerful implications. We often speak of “maternalinstincts,” suggesting that the behaviors associated with successful mother-ing are somehow innate. Although the basic bond between mother and infantis part of the biological basis of mammals, and maternal feelings are to someextent innate, the specific behaviors that are part of this bond are learned.
222 PART III ■ Our Place in Nature
FIGURE 8.10
Harlow’s maternal deprivationexperiment on infant rhesusmonkeys. These monkeyspreferred to spend almost all oftheir time clinging to the clothsurrogate mother (right),which provided warmth, thanto the wire surrogate mother( left), which provided food.Even when hungry, the infantswould often remain partiallyattached to the cloth mother. (© Harlow Primate Laboratory,University of Wisconsin)

Relethford: The Human Species: An Introduction to Biological Anthropology, 5/e
III. Our Place in Nature 8. Primates in Nature © The McGraw−Hill Companies, 2003
Mammals, and especially primates, rely extensively on learned behaviors. Asa result, variation in behavior is often great and can be influenced by a vari-ety of other factors. Observations of the behavior of primates in their nat-ural environments confirm the fact that maternal behaviors are to a large ex-tent learned. Studies of chimpanzee mothers have shown that young femalestend to model their own later parental behaviors after those of their moth-ers. Similar patterns are seen in humans. For example, the children of abu-sive parents often tend to be abusive parents themselves. Such research showsus that the study of animal behavior, especially that of other primates, is notan esoteric subject but rather helps us in understanding ourselves.
Paternal Care Maternal care is found throughout the primate order. Themother–infant bond is the strongest social tie within primate groups. Whatrole does the father play in child care among primates? Paternal care is highlyvariable among primate species. In general, primates that are monogamous
223
S P E C I A L T O P I C
What Will Happen to the Primates?There are approximately 250 different species of primatesin the world today, but many are living a precarious exis-tence. More than half of these species are estimated to bein potential danger from a conservation perspective, and20 percent are currently considered endangered or criti-cally endangered. Although the past decade has seen thediscovery of several previously unknown primate species,it has also seen the extinction of one—the red colobusmonkey subspecies Procolobus badius waldroni (Chapmanand Peres 2001). Some estimates suggest that as much as20 percent of primate species will become extinct at somepoint during the twenty-first century (Mittermeier andSterling 1992).
What has caused this danger to living primates? Onemajor factor is the destruction of native habitats. Morethan 90 percent of all primate species live in tropical for-ests, which are disappearing at an alarming rate as for-est is cleared for human use (Chapman and Peres 2001;Wright 1992). Other species, such as the highly endan-gered mountain gorilla, have had their habitat reducedthrough farming to meet the demands for food of grow-ing human populations. Toward the end of the twen-tieth century, it was estimated that there were fewer than400 surviving mountain gorillas (Mittermeier and Ster-ling 1992).
Hunting by humans is another threat to primatesurvival. In addition to being a food resource, primatesare hunted in many parts of the world to use as bait for
other animals, for sale of their body parts for ornaments,and because they are considered agricultural pests. An-other threat to primates is the capture of live animals for sale, although international efforts have reduced thisdemand to some extent. Live capture is a particular prob-lem when infants are sought because their mothers arefrequently shot during capture of the infant. Logging isanother human activity that has endangered many primatespecies, as the loss of habitat contributes significantly tothe endangered status of many primates (Chapman andPeres 2001).
What can be done? There is no single solution; aseries of conservation efforts must be applied at an inter-national level. Strier (2000) lists several general strategies,including developing economic incentives for conserva-tion, increasing public awareness of the potential prob-lems, and increasing the role of nongovernmental organi-zations that have provided an opportunity for interactionand information exchange among conservationists, pri-mate researchers, and policy makers. Other approaches to primate conservation include developing protectedparks and preserves, developing less harmful agricul-tural practices, and breeding endangered primates incaptivity (Mittermeier and Sterling 1992; Wright 1992).Chapman and Peres (2001) emphasize the role scientistscan play in such conservation efforts. All of these efforts,and more, are needed if we are to save these remarkablerelatives of ours.
monogamy An exclusivesexual bond between an adultmale and an adult femalefor a long period of time.
I I I I I I I
Relethford: The Human Species: An Introduction to Biological Anthropology, 5/e
III. Our Place in Nature 8. Primates in Nature © The McGraw−Hill Companies, 2003
(characterized by a more or less permanent bond forming between a singlemale and female) are most likely to show high levels of paternal care. In fact,in some species the fathers do most of the carrying of infants (Jolly 1985). Bycontrast, species that are polygamous tend, on average, to show less paternalinvolvement with offspring. In a polygamous species, paternal behaviors maybe less appropriate from a genetic perspective because a male can never be sureif he is the father.
As with many primate behaviors, there is a great deal of variation fromone situation to the next. In one study of baboons (an African monkey), Con-nie Anderson (1992) found regularity in the degree of paternal behaviors. Incases where females mated with a single male more than 70 percent of thetime, that male was much more likely to help by carrying the infant. Thisfinding shows that it is difficult, if not impossible, to ascribe a given behav-ior to an entire species because there is often a great deal of variation evenwithin single populations. These results also suggest that adult males areaware of the frequency of mating, thus providing them with some idea of thelikely paternity of an infant. From an evolutionary perspective, we would ex-pect males to invest time and effort in their own infants, at least infants witha high probability of having been sired by them.
Growing Up The importance of the extended period of infant and juvenilegrowth in primates cannot be overstated. The long period of growth is nec-essary for learning motor skills and social behaviors. The close bond betweenmother and infant provides the first important means by which an infantprimate learns. It is not the only important social contact for a growing pri-mate, however. The process of socialization in most primates depends to alarge extent on close contact with peers. Interaction with other individualsof the same age provides the opportunity to learn specific types of social be-haviors, as well as how to interact socially in general.
Experiments by Harlow clearly demonstrate the importance of socialcontact with peers. Monkeys raised by their mothers but kept apart fromother infants often grew up showing a range of abnormal behaviors. Theywould stare at their cages for long periods of time, were often self-destructive,and did not show normal patterns of sexual behavior (Harlow and Harlow1962). Although some primate species are basically solitary apart from themother–infant bond, most belong to larger social groups and require contactwith peers during their growth.
Growing up and learning as a primate also requires that infants and ju-veniles play a great deal of the time. Play behaviors have often been ignoredin studies of human and nonhuman behavior because they are regarded asnonproductive behavior. In truth, play behaviors are essential to the properbiological and social development of primates.
Play behavior can serve several functions. First, physical play allows aninfant to develop and practice necessary motor skills. Second, social play pro-vides the opportunity to learn how to behave with others. Needed social skillsare learned through play. The importance of play becomes very obvious whenwe consider what happened to the monkeys that Harlow had separated from
224 PART III ■ Our Place in Nature
polygamy A sexual bondbetween an adult male andan adult female in whicheither individual may havemore than one mate at thesame time.
I I I I I I I

Relethford: The Human Species: An Introduction to Biological Anthropology, 5/e
III. Our Place in Nature 8. Primates in Nature © The McGraw−Hill Companies, 2003
their peers. Without normal contact and the opportunity to develop socially,these monkeys became sociopathic.
Social StructurePrimates are essentially social creatures. The close bond between mother andinfant, the importance of learning, and the great flexibility in behaviors all pointto this fact. Apart from this general need, primates show an amazing amountof variation in the ways in which their societies are structured. The main socialgroup of primates can range in size from two individuals up to several hun-dred and can have different proportions of males, females, young, and old.
A social group is generally defined as a group within which there is fre-quent communication or interaction among members. This definition is abit arbitrary, but it provides us with a starting point for looking at variationin primate societies. Social structure consists of the composition of the so-cial group and the way in which it is organized. There are five basic types ofprimate social structure, with variations on most of these.
Social Groups The smallest social group is the solitary group, which con-sists of the mother and dependent offspring. Adult males and adult femaleshave infrequent contact, generally for mating. A slightly larger social groupis the monogamous family group, consisting of an adult male, an adult fe-male, and their immature offspring. The adult male and female form a long-term pair bond and are sexually active only with each other. Although thiscorresponds to a typical Western notion of “family,” it is not that commonamong primates. The social unit of a few primate species is the polyandrousgroup, a small group of adult males and one or more adult females and theiroffspring. Although there may be more than one adult female in the group,only one is reproductively active. A uni-male group consists of one adultmale, several adult females, and their offspring. The most common socialstructure in nonhuman primate societies is the multimale/multifemalegroup, which consists of more than one adult of each sex and the offspring.Given multiple adult males and adult females, these are complex social groupsthat are often quite large. Given multiple adults, mating tends to be promis-cuous. There is considerable variation in this type of social structure, in termsof size, composition, and distribution (Wolfe 1995).
Social Organization and Dominance Nonhuman primate societies rankindividuals in terms of their relative dominance in the group. A dominancehierarchy is the ranking system within the society and reflects which indi-viduals are most and least dominant (Figure 8.11). Dominance hierarchiesare found in most nonhuman primate societies, but they vary widely in theiroverall importance in everyday life. The dominance hierarchy provides stabil-ity in social life. All individuals know their place within the society, eliminat-ing to some extent uncertainty about what to do or whom to follow.
The dominance hierarchy in nonhuman primates is usually ruled bythose individuals with the greatest access to food or sex or those that control
CHAPTER 8 ■ Primates in Nature 225
social structure Thecomposition of a socialgroup and the way it isorganized, including size,age structure, and numberof each sex in the group.
solitary group The smallestprimate social group,consisting of the motherand her dependent offspring.
monogamous familygroup Social structure inwhich the primary socialgroup consists of an adultmale, an adult female, andtheir immature offspring.
polyandrous group A raretype of primate socialstructure, consisting of asmall number of adultmales, one reproductivelyactive adult female, andtheir offspring. Other adult females may belong to the group but are notreproductively active.
uni-male group Socialstructure in which theprimary social groupconsists of a single adultmale, several adult females,and their offspring.
multimale/multifemalegroup A type of socialstructure in which theprimary social group ismade up of several adultmales, several adult females,and their offspring.
dominance hierarchy Theranking system within asociety that indicates whichindividuals are dominant insocial behaviors.
I I I I I I I

Relethford: The Human Species: An Introduction to Biological Anthropology, 5/e
III. Our Place in Nature 8. Primates in Nature © The McGraw−Hill Companies, 2003
social behaviors to the greatest extent. Societies with strong male dominancehierarchies are likely to show a moderate to large difference in the sizes ofadult males and adult females. The sexual dimorphism in body size hasoften been considered the result of competition among males for breedingfemales. The males that are larger and stronger are considered more likely togain access to females and hence pass on their genetic potential for largersize and greater strength.
This pattern does not always hold, however. The adult male most likelyto attract mates may not be the male most likely to have access to food. Fedi-gan (1983) has reviewed the literature on the relationship between dominancerank of males and access to breeding females for a number of primate speciesand has found that this expected relationship is not always present.
We also see that dominance may reflect additional factors. In the Japanesemacaque monkeys, for example, the rank of a male’s mother has an influenceon the male’s dominance rank (Eaton 1976). Males born to high-rankingmothers have a greater chance of achieving high dominance themselves, allother factors being equal.
In a number of primate societies, the dominance hierarchy of females ismore stable over time than that of the males. Whereas the position of mostdominant males can change quickly, the hierarchy among females remainsmore constant. Even in cases in which all males are dominant over females, the
226 PART III ■ Our Place in Nature
FIGURE 8.11
Two adult male baboonsengaged in a dominancedispute. Though physicalviolence does occur in suchencounters, much of the display is bluff. (© M. Peardon/Photo Researchers, Inc.)
sexual dimorphism Theaverage difference in bodysize between adult malesand adult females.
I I I I I I I

Relethford: The Human Species: An Introduction to Biological Anthropology, 5/e
III. Our Place in Nature 8. Primates in Nature © The McGraw−Hill Companies, 2003
female dominance hierarchy exerts an effect on social behaviors within thegroup, as in the case in which mother’s rank affects the rank of male offspring.
MODELS OF PRIMATE BEHAVIOR
In terms of both biology and behavior, primates are an extremely variablegroup of mammals. The exact nature of this variability is explored in thenext chapter, which reviews the different subgroups of living primates. Fornow, however, it is useful to consider the types of evolutionary models thatwe use to make some sense of this variation. The ultimate objective is to pro-vide explanations of primate behavior from an evolutionary perspective, par-ticularly the complex interaction of nature and nurture.
Behavioral EcologyStudies of primate behavior have often applied an ecological approach, relat-ing social structure and organization to environmental factors, includinghabitat, diet, presence of predators, and other aspects of the ecology withinwhich primate groups live. One basic question is this: To what extent are dif-ferences in social behaviors related to environmental factors as opposed togenetic ancestry?
Early ecological studies of primates focused on the contrast between spe-cies that live in the trees and those that live on the ground (DeVore 1963).This arboreal–terrestrial contrast suggested some basic relationships betweenhabitat and aspects of social organization, territoriality, group size, andhome range (the size of the geographic area normally occupied by a group).Additional study showed that this simple contrast in habitats did not fullyexplain variation in primate behavior. Crook and Gartlan (1966) later ex-panded on this idea by breaking down primate species into five groups definedprimarily by habitat and diet. Jolly (1972) later modified this approach anddefined six groups: (1) nocturnal insect eaters, (2) arboreal leaf eaters, (3) ar-boreal omnivores, (4) semiterrestrial leaf eaters, (5) semiterrestrial omnivores,and (6) primates living in arid environments.
Since the middle of the 1980s, the focus has shifted toward the field ofbehavioral ecology, the study of behavior from an ecological and evolution-ary perspective. The primary concern of primate behavioral ecology is theevolutionary analysis of behaviors as strategies for adapting to specific con-ditions, with specific focus on feeding strategies, social strategies, and repro-ductive strategies (Fedigan and Strum 1999; Strier 2000). This focus relatesprimate behavior to the basic problems of adaptation from an evolutionaryperspective: finding food, getting along with others, and reproducing. Analy-sis of primate behavior needs to take into account multiple costs and bene-fits of various behaviors. For example, why live in groups? Some advantagesof group living include more successful defense against predators and coop-erative defense of valuable food resources (Fedigan and Strum 1999; Wrang-ham 1987). However, larger groups may be disadvantageous if food resources
CHAPTER 8 ■ Primates in Nature 227
home range The size of the geographic area that isnormally occupied and usedby a social group.
behavioral ecology Thestudy of behavior from anecological and evolutionaryperspective.
I I I I I I I

Relethford: The Human Species: An Introduction to Biological Anthropology, 5/e
III. Our Place in Nature 8. Primates in Nature © The McGraw−Hill Companies, 2003
are too limited. To what extent is group size and structure (or any social be-havior for that matter) a trade-off between the costs and benefits of differentbehavioral strategies?
An example of the behavioral ecology approach concerns the relation-ships between adult females in primate societies (Strier 2000). These rela-tionships often vary even among groups within the same species, and theyhave a number of environmental correlates. Female kin that live together ingroups have an advantage in that they can cooperate with each other againstothers, but they suffer from the potential disadvantage of having to competewith their own kin for food resources. Likewise, physically remaining in closeproximity offers an advantage in terms of defense but increases the likeli-hood of conflict within the group. If conflict continues, it can be detrimen-tal to both the social group and the individuals within it. In such cases, thereis a tendency for an increase in reconciliatory behaviors—that is, makingpeace after an aggressive conflict. The nature of a social group often leads toconflict, but the actions of reconciliation deter the negative consequences ofgroup living.
The actual data on female relationships are more complex than presentedhere but provide an example of how a given adaptation (living in groups) canhave a cost (conflict) that leads to another adaptation (reconciliation). Otherstudies of primate behavioral ecology have focused on a wide range of topics,including the relationship between foraging patterns and the distribution offood resources (Oates 1987), the relationship between social structure andpredator pressure (Cheney and Wrangham 1987), and the relationship be-tween group cohesiveness and diet (Goldsmith 1999), among many others.
SociobiologyThe study of sociobiology also deals with evolutionary explanations for be-havior but tends to focus more on genetic determinants of behavior, whereasbehavioral ecology considers both genetic and environmental factors (Fedi-gan and Strum 1999). According to one of its main proponents, sociobiol-ogy is defined as “the systematic study of the biological basis of all social be-havior” (Wilson 1980:322). Most of the work done in sociobiology focuseson natural selection. We assume that a given behavior has at least a partialgenetic basis. Given this genetic basis, it is easy to see how certain behaviorscould be selected for. If they increase an individual’s chance of survival and/orreproduction, then the alleles influencing these behaviors will be passed onto the next generation. Behaviors that seem nonadaptive at first may also beexplained by sociobiological hypotheses.
Principles of Sociobiology Central to much sociobiological theory is theconcept of maximizing fitness. This refers to behaviors that increase the prob-ability that an individual’s alleles will be passed on to the next generation. Ifsuch behaviors are determined even partially by genes, then natural selectionwill cause those behaviors to increase in frequency. A related concept is the
228 PART III ■ Our Place in Nature
sociobiology The study of behavior from anevolutionary perspective,particularly the role ofnatural selection.
I I I I I I I

Relethford: The Human Species: An Introduction to Biological Anthropology, 5/e
III. Our Place in Nature 8. Primates in Nature © The McGraw−Hill Companies, 2003
idea of parental investment, which refers to parental behaviors that increasethe probability that the offspring will survive. According to sociobiologicaltheory, mammalian (and especially primate) females invest a great deal of timeand energy in reproduction and care of offspring (Figure 8.12). Even thoughthis investment reduces the number of offspring a female can have, the bene-fits outweigh the costs.
Mammalian males, however, often contribute only sperm. From the malestandpoint of maximizing fitness, it would seem more advantageous to im-pregnate many females rather than just one. This argument may explain thelarge number of primate species in which the fathers contribute little to off-spring and are not bonded permanently to any one female. However, a num-ber of primate species are monogamous, showing that this relationship is not as simple as it first appears. In certain environments, it may be moreadaptive for a primate male to be monogamous and involved in child care, soas to maximize his fitness. Obviously, we should not expect to see a universalpattern but rather one that varies according to environmental circumstances.Thus, an emphasis on sociobiology cannot exclude analysis of environmen-tal factors.
One area of particular interest in sociobiology is the evolution of altru-ism. At first glance, such behaviors do not appear to make evolutionary sense.
CHAPTER 8 ■ Primates in Nature 229
FIGURE 8.12
Female chimpanzee and heroffspring. The great amount of care and attention given bythe mother can be interpretedas maximizing reproductivesuccess by increasing parentalinvestment. (© Gerard Lacz/PeterArnold, Inc.)
parental investmentParental behaviors thatincrease the probability thatoffspring will survive.
I I I I I I I

Relethford: The Human Species: An Introduction to Biological Anthropology, 5/e
III. Our Place in Nature 8. Primates in Nature © The McGraw−Hill Companies, 2003
If, for example, you die in an attempt to rescue a child from an oncomingcar, then your alleles, including any hypothetical alleles responsible for youraltruistic action, will not be passed on. Natural selection would be expectedto eliminate any tendencies in future generations.
Is there any evolutionary benefit in sacrificing oneself? Sociobiology hasproposed an answer in the form of kin selection. Altruistic behaviors maybe selected for when they are directed toward one’s biological relatives. If youdie saving your own child, this act will have two genetic consequences. First,because you die, you will no longer pass alleles on to the next generation. Sec-ond, your child will live and have the opportunity to pass on his or her alleles,of which 50 percent came from you. Thus, by saving your child you actuallycontribute to the survival of some of your own alleles. If your altruistic ac-tion was at least partially affected by genetic factors, this behavior also willbe passed on through the survival of your child. Sociobiological theory hasdeveloped a number of mathematical models that deal with the cost andbenefit of altruistic behaviors in terms of the degree of biological relationshipbetween the altruist and the recipient of the action. For example, it is moreadvantageous to you to save the life of your nephew than your first cousinbecause you share more alleles with your nephew.
Although the models of sociobiology are often intuitively correct andlogical, there remains great difficulty in testing many of their predictions.Perhaps the greatest problem is in demonstrating the genetic predispositionof behaviors. Further, we often lack sufficient information over enough gen-erations to actually demonstrate a direct relationship between fitness andthe behavior in question.
An Example of Primate Sociobiology Some of the most interesting issuesin sociobiology focus on behaviors that do not at first seem to be adaptive.One classic example of this problem is from Sarah Hrdy’s (1977) study of in-fanticide in a particular group of primates—a species of monkey known aslangurs. Langurs typically live in uni-male groups. There is frequently com-petition between adult males in such groups when a challenger seeks to dis-place an adult male. When a new male successfully takes over the group, heoften then attempts to kill all the infants fathered by the previous male (Fig-ure 8.13). At first, such behavior seems abnormal and contrary to the sur-vival of the group. The sociobiological explanation, however, is that the newmale is increasing his own fitness. First, killing the infants from other malescan increase the proportion of one’s offspring in the next generation. Thecompetition has been eliminated. Second, females who are still nursing in-fants are not yet able to become pregnant by the new male, and he has to wait.By killing the infants, the new male ensures that the females are more quicklyable to have offspring with him. The bottom line is that if infanticide hassome genetic basis, then this act would be selected for because it maximizesthe fitness of the killer.
This interpretation poses a number of problems. First, we do not knowhow widespread this behavior is and whether it occurs under different envi-
230 PART III ■ Our Place in Nature
kin selection A conceptused in sociobiologicalexplanations of altruism.Sacrificial behaviors, forexample, can be selected for if they increase theprobability of survival ofclose relatives.
infanticide The killing ofinfants.
I I I I I I I

Relethford: The Human Species: An Introduction to Biological Anthropology, 5/e
III. Our Place in Nature 8. Primates in Nature © The McGraw−Hill Companies, 2003
ronmental conditions. Second, we do not know the extent to which such be-haviors are affected by genetic factors. Finally, the hypothesis that differencesin fitness are associated with infanticide needs to be tested. To do this, weneed to know something about relative survival and differential reproduction,which requires detailed observations over many groups and generations.
The infanticide hypothesis has been controversial and challenged. Oneof the critiques focused on problems with both the data and hypothesis(Bartlett et al. 1993; Sussman et al. 1995). First, there have been few directobservations of infanticide by langurs—only 21 (and 27 other cases of infan-ticide in other primate species). Further, few of these observations involvedthe expected attack of an incoming male directly on an infant. In many cases,the infant’s death was accidental, often the result of clinging to a motherwho was being attacked. In terms of the sociobiological hypothesis, Suss-man and colleagues (1995) note that there is no evidence for genetic in-heritance of this behavior or for increased fitness following the act. Althoughacknowledging that the data are scanty, Hrdy and her colleagues (1995) ar-gue that there is sufficient evidence to date to make the infanticide hypothe-sis viable.
Although sociobiological hypotheses can be constructed that are logicaland consistent, this does not make them correct. Clearly, more data need tobe collected from primate societies to verify or support such hypotheses.
SUMMARY
Taxonomic classification imposes order on the diversity of living creatures.The biological and behavioral nature of human beings is revealed in the dif-ferent levels of classification to which humans belong. Humans are animals,
CHAPTER 8 ■ Primates in Nature 231
FIGURE 8.13
Adult female langurs attemptingto rescue an infant from anadult male langur. (Sarah BlafferHrdy/Anthro-Photo)

Relethford: The Human Species: An Introduction to Biological Anthropology, 5/e
III. Our Place in Nature 8. Primates in Nature © The McGraw−Hill Companies, 2003
chordates, and vertebrates. We share certain characteristics, such as a moredeveloped nervous system, with other creatures in these categories.
Humans are mammals, which means we rely a great deal on a reproduc-tive strategy of few births and extensive parental care. This reproductive pat-tern is associated with higher intelligence and a greater capacity for learnedbehaviors. Other adaptations of mammals include differentiated teeth, askeletal structure capable of swift movement, and the ability to maintain aconstant body temperature.
Humans belong to a specific order of mammals known as primates. Theprimates have certain characteristics, such as skeletal flexibility, graspinghands, and keen eyesight, that evolved in order to meet the demands of lifein the trees. Though many primate species no longer live in the trees, theyhave retained these basic characteristics and use them in new ways to adaptto the environment. Most humans no longer use their grasping hands tomove about in trees but use them instead for tool manufacture and use.
Primates show a great deal of variation in the size and structure of theirsocial groups, ranging from solitary groups consisting of a female and heroffspring to large communities with many adults and offspring. Several dif-ferent approaches are used to understand the variety of primate social orga-nization. Two approaches seek to place primate behavior in an evolutionarycontext. The study of sociobiology emphasizes genetic determinants of be-havior, whereas the study of primate behavioral ecology has a broader evolu-tionary approach emphasizing the relationship between ecological factorsand social behavior.
SUPPLEMENTAL READINGS
Dolhinow, P., and A. Fuentes, ed. 1999. The Nonhuman Primates. Mountain View, Calif.:Mayfield. A textbook on primate behavior with individual chapters written by manyleading primatologists. Individual chapters focus on both specific groups of primatesand general topics.
Falk, D. 2000. Primate Diversity. New York: W. W. Norton. A textbook on primate biologyand behavior with most chapters organized by specific types of primates.
Strier, K. B. 2000. Primate Behavioral Ecology. Boston: Allyn and Bacon. This text is a com-prehensive review of basic principles of primate behavioral ecology.
232 PART III ■ Our Place in Nature

Relethford: The Human Species: An Introduction to Biological Anthropology, 5/e
III. Our Place in Nature 8. Primates in Nature © The McGraw−Hill Companies, 2003
INTERNET RESOURCES
http://anthro.palomar.edu/animal/default.htmClassification of Living Things, a tutorial on taxonomic classification.
http://www.ucmp.berkeley.edu/mammal/mammal.htmlHall of Mammals, a discussion of different types of mammals.
http://www.primate.wisc.edu/pinPrimate InfoNet, a comprehensive collection of links to sites on primate tax-onomy, biology, and behavior.
CHAPTER 8 ■ Primates in Nature 233

Relethford: The Human Species: An Introduction to Biological Anthropology, 5/e
III. Our Place in Nature 9. The Biology and Behavior of the Living Primates
© The McGraw−Hill Companies, 2003
C H A P T E R 9The Biology and Behaviorof the Living Primates
235
This chapter looks more closely at the biology and behavior of the livingprimates, with particular attention to the apes, our closest living relatives.
PRIMATE SUBORDERS
The two major subgroups of the living primates are the suborder Prosimiiand the suborder Anthropoidea. These are the official scientific names (inLatin) for the two suborders, although here we will use the more commonterms prosimians and anthropoids. Each of these suborders is broken down intosmaller taxonomic units, such as infraorders, superfamilies, families, and soon. Figure 9.1 shows the traditional primate taxonomy used throughoutmost of this chapter. Keep in mind that the cladistic approach (Chapter 8)has challenged parts of this classification; some of the controversies are dis-cussed later.
ProsimiansThe word prosimian means literally “before simians” (monkeys and apes). Inbiological terms, prosimians are more primitive, or more like early primateancestors, than are monkeys and apes.
Japanese macaques, one of many species of Old World monkeys, and one ofseveral groups of living primates. (© Steven Kaufman/Peter Arnold, Inc.)
▲
Prosimii (prosimians) Thesuborder of primates thatare biologically primitivecompared to anthropoids.
Anthropoidea(anthropoids) The suborderof primates consisting ofmonkeys, apes, and humans.
I I I I I I I

Relethford: The Human Species: An Introduction to Biological Anthropology, 5/e
III. Our Place in Nature 9. The Biology and Behavior of the Living Primates
© The McGraw−Hill Companies, 2003
Prosimian Characteristics The prosimians often lack one or more of thegeneral characteristics of primates. For example, some prosimians lack colorvision, and some have a single claw on each hand or foot.
Another primitive characteristic of prosimians is that they rely to a muchgreater extent on the sense of smell than do the anthropoids. Prosimianbrains are also generally smaller relative to body size than are the brains ofanthropoids. Prosimians are usually small in size and tend to be solitary, andmany are nocturnal (active at night). These characteristics and others pointto the basic primitive nature of most prosimians. Many prosimians are verti-cal clingers and leapers. That is, they cling to tree trunks until they are readyto move and then they propel themselves through the air.
Prosimians themselves show considerable variation. Some prosimianshave larger body sizes, some have larger social groups, and some are diurnal(active in daylight). This variation makes classification difficult, but it doesshow us both the general trends of the prosimians and specific differencesamong them.
Types of Prosimians There are three different groups of prosimians in theworld today, each with a number of different species. One group, the lorises,are small, solitary, nocturnal prosimians found in Asia and Africa (Figure 9.2).Another group, the tarsiers, also small, solitary, and nocturnal, are found inIndonesia. The nocturnal nature of tarsiers is evidenced by their large eyes,the size of which serves to gather available light (Figure 9.3).
The most biologically diverse group of prosimians is the lemurs, whichare found only on the island of Madagascar off the southeast coast of Africa(Figure 9.4). Some species of lemurs are nocturnal and some are diurnal. Thelemurs depart from the typical pattern of prosimians as nocturnal, solitaryprimates. Their wide range of biological and behavioral characteristics prob-ably reflects their isolation on the island of Madagascar. Because the island
236 PART III ■ Our Place in Nature
FIGURE 9.1
Summary of traditionalprimate classification. Nameswithin parentheses are commonnames. A more detailedclassification is provided inAppendix 2.
Primates
Prosimii(prosimians)
Anthropoidea(anthropoids)
Lemuriformes Tarsiiformes(tarsiers)
Platyrrhini(New World anthropoids)
Catarrhini(Old World anthropoids)
Lemuroidea(lemurs)
Ceboidea(New World
monkeys)
Cercopithecoidea(Old World
monkeys)
Hominoidea(apes and humans)
Lorisoidea(lorises)
Superfamily
Infraorder
Suborder
Order
nocturnal Active duringthe night.
diurnal Active during theday.
loris Nocturnal prosimianfound today in Asia andAfrica.
tarsier Nocturnal prosimianfound today in Indonesia.
lemur A prosimian foundtoday on the island ofMadagascar.
I I I I I I I

Relethford: The Human Species: An Introduction to Biological Anthropology, 5/e
III. Our Place in Nature 9. The Biology and Behavior of the Living Primates
© The McGraw−Hill Companies, 2003
FIGURE 9.2
A loris, a prosimian fromSoutheast Asia. (© MarkStouffer/Animals Animals)
FIGURE 9.3
A tarsier, a prosimian fromSoutheast Asia. Unlike otherprosimians, the tarsier does nothave a moist nose. (© ZoologicalSociety of San Diego)
FIGURE 9.4
Ring-tailed lemur from theisland of Madagascar. (© Zoological Society of San Diego)
237
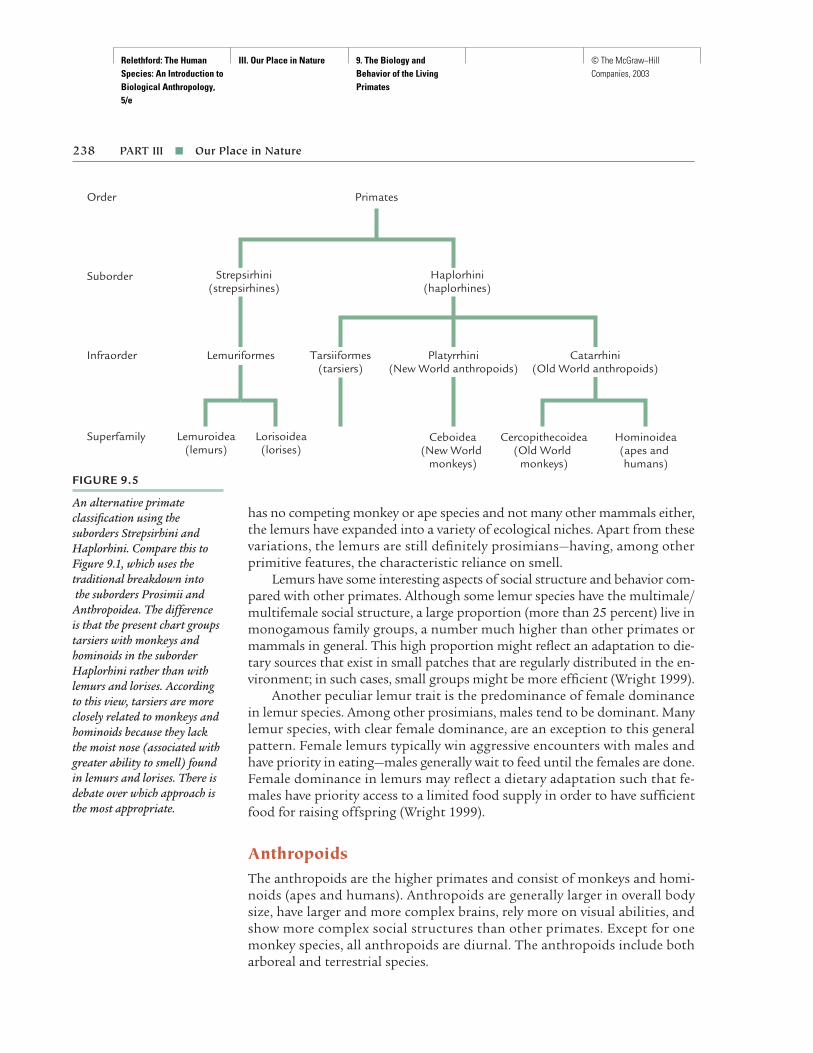
Relethford: The Human Species: An Introduction to Biological Anthropology, 5/e
III. Our Place in Nature 9. The Biology and Behavior of the Living Primates
© The McGraw−Hill Companies, 2003
has no competing monkey or ape species and not many other mammals either,the lemurs have expanded into a variety of ecological niches. Apart from thesevariations, the lemurs are still definitely prosimians—having, among otherprimitive features, the characteristic reliance on smell.
Lemurs have some interesting aspects of social structure and behavior com-pared with other primates. Although some lemur species have the multimale/multifemale social structure, a large proportion (more than 25 percent) live inmonogamous family groups, a number much higher than other primates ormammals in general. This high proportion might reflect an adaptation to die-tary sources that exist in small patches that are regularly distributed in the en-vironment; in such cases, small groups might be more efficient (Wright 1999).
Another peculiar lemur trait is the predominance of female dominancein lemur species. Among other prosimians, males tend to be dominant. Manylemur species, with clear female dominance, are an exception to this generalpattern. Female lemurs typically win aggressive encounters with males andhave priority in eating—males generally wait to feed until the females are done.Female dominance in lemurs may reflect a dietary adaptation such that fe-males have priority access to a limited food supply in order to have sufficientfood for raising offspring (Wright 1999).
AnthropoidsThe anthropoids are the higher primates and consist of monkeys and homi-noids (apes and humans). Anthropoids are generally larger in overall bodysize, have larger and more complex brains, rely more on visual abilities, andshow more complex social structures than other primates. Except for onemonkey species, all anthropoids are diurnal. The anthropoids include botharboreal and terrestrial species.
238 PART III ■ Our Place in Nature
FIGURE 9.5
An alternative primateclassification using thesuborders Strepsirhini andHaplorhini. Compare this toFigure 9.1, which uses thetraditional breakdown intothe suborders Prosimii andAnthropoidea. The difference is that the present chart groupstarsiers with monkeys andhominoids in the suborderHaplorhini rather than withlemurs and lorises. Accordingto this view, tarsiers are moreclosely related to monkeys andhominoids because they lackthe moist nose (associated withgreater ability to smell) foundin lemurs and lorises. There isdebate over which approach isthe most appropriate.
Primates
Strepsirhini(strepsirhines)
Haplorhini(haplorhines)
Lemuriformes Catarrhini(Old World anthropoids)
Ceboidea(New World
monkeys)
Cercopithecoidea(Old World
monkeys)
Hominoidea(apes and humans)
Superfamily
Infraorder
Suborder
Order
Tarsiiformes(tarsiers)
Lemuroidea(lemurs)
Lorisoidea(lorises)
Platyrrhini(New World anthropoids)

Relethford: The Human Species: An Introduction to Biological Anthropology, 5/e
III. Our Place in Nature 9. The Biology and Behavior of the Living Primates
© The McGraw−Hill Companies, 2003
All living prosimians are found in the Old World, but anthropoids are found in both the New World and the Old World. (The Old World con-sists of the continents of Africa, Asia, and Europe; the New World is theAmericas.) New World anthropoids are found today in Central and SouthAmerica. Old World anthropoids are found today in Africa and Asia (andone monkey species in Europe). The only native New World anthropoids aremonkeys, whereas native Old World anthropoids include monkeys, apes, andhumans.
Alternative ClassificationsThe traditional division of primates into prosimians and anthropoids isbeing challenged by a number of scientists. The problem with the traditionalclassification is that tarsiers, usually classified as prosimians, show several bi-ological characteristics of anthropoids. Lorises and lemurs have moist noses,a trait related to their keen sense of smell. Tarsiers, like anthropoids, lack themoist nose. In addition, recent biochemical investigations have supportedthe idea that tarsiers are more like anthropoids than prosimians.
Many researchers now advocate placing the lemurs and lorises in onesuborder, Strepsirhini, characterized by moist noses, and the tarsiers andanthropoids in another suborder, Haplorhini, which lacks the moist nose.In this text I will continue to use the traditional division between prosimiansand anthropoids because it provides a useful contrast when discussing pri-mate evolution. However, the alternative classification shows that there isconsiderable debate regarding the taxonomic placement of the tarsiers. Thesuborders Strepsirhini and Haplorhini are shown in the alternative primatetaxonomy in Figure 9.5 and can be contrasted with the traditional scheme ofFigure 9.1. The major difference is the placement of the tarsiers. Are they moresimilar evolutionarily to lemurs and lorises or to monkeys and apes?
What is the relevance of alternative classifications? Once again, this con-troversy demonstrates the difficulty of taxonomic classification. It is not al-ways possible to place living creatures unambiguously in certain categories.Such problems actually provide us with strong evidence of the evolutionaryprocess. The tarsiers, for example, suggest what a transitional form betweenprosimians and anthropoids might have looked like.
THE MONKEYS
Anthropoids include monkeys and hominoids (apes and humans). Monkeysand apes are often confused in the popular imagination. In reality, they areeasy to tell apart. Most monkeys have tails, whereas apes and humans do not.In general, monkeys also have smaller brains relative to body size than apes orhumans. The typical pattern of monkey movement is on all fours (quadru-pedal), and their arms and legs are generally of similar length so that theirspines are parallel to the ground. By contrast, apes have longer arms thanlegs and humans have longer legs than arms.
CHAPTER 9 ■ The Biology and Behavior of the Living Primates 239
Strepsirhini (strepsirhines)One of two suborders ofprimates suggested to replacethe prosimian/anthropoidsuborders (the other is thehaplorhines). Strepsirhinesare primates that have amoist nose (lemurs andlorises).
Haplorhini (haplorhines)One of two suborders ofprimates suggested to replacethe prosimian/anthropoidsuborders (the other is thestrepsirhines). Haplorhinesare primates without amoist nose (tarsiers,monkeys, apes, and humans).
quadrupedal A form ofmovement in which all fourlimbs are of equal size andmake contact with theground, and the spine isroughly parallel to theground.
I I I I I I I

Relethford: The Human Species: An Introduction to Biological Anthropology, 5/e
III. Our Place in Nature 9. The Biology and Behavior of the Living Primates
© The McGraw−Hill Companies, 2003
New World MonkeysThe only form of anthropoids found native to the New World are the NewWorld monkeys (there are no New World apes). Although they share manysimilarities with Old World monkeys, several important differences reflectseparate lines of evolution over the past 30 million years or so.
Characteristics Some of the differences between the New World and OldWorld monkeys are useful in reconstructing evolutionary relationships. Forexample, New World monkeys have four more premolar teeth than Old Worldmonkeys. The dental formulae for many New World monkeys is 2-1-3-3,compared to the 2-1-2-3 dental formula of all Old World monkeys. Otherdifferences relate to the way in which the monkeys live; for example, manyNew World monkeys have prehensile tails.
Because the tail of many New World monkeys is capable of grasping, it ishighly useful in moving about and feeding in the trees (Figure 9.6). Typically,the monkey uses this “fifth limb” to anchor itself while feeding on the endsof small branches. Old World monkeys have tails, but none of them have pre-hensile tails. Those New World monkeys with prehensile tails are thus moreproficient in terms of acrobatic agility. This difference probably relates to thefact that all New World monkeys are arboreal, whereas some Old World mon-keys are terrestrial. The prehensile tail of many New World monkeys is a de-rived trait that did not develop in the Old World monkeys.
240 PART III ■ Our Place in Nature
FIGURE 9.6
A spider monkey, capable ofusing its tail as a “fifth limb.”(© Zoological Society of San Diego)

Relethford: The Human Species: An Introduction to Biological Anthropology, 5/e
III. Our Place in Nature 9. The Biology and Behavior of the Living Primates
© The McGraw−Hill Companies, 2003
Case Study: Howler Monkeys One interesting group of New World mon-keys are the howler monkeys, consisting of six species in the genus Alouatta.Howler monkeys are found in Mexico and in South America (Figure 9.7).Their name reflects their most unusual characteristic—an enlarged hyoid bone(the bone in the throat), which creates a large resonating chamber capable ofmaking loud sounds that can be heard at a considerable distance. Howlershave prehensile tails and are quite at home in the trees, where they eat pri-marily fruit and leaves. Adult howlers weigh between 6 and 8 kilograms(13–18 pounds), with males larger than females. Males are capable of mak-ing deeper and louder howls (Bramblett 1994). Howlers live in multimale/multifemale groups with an average of about 15 members per group (Falk2000). Some groups have been observed to have only one adult male andcould rightly be called uni-male groups (Crockett and Eisenberg 1987). Again,variation is typical of primate social structure.
The loud howling of howler monkeys serves many purposes, includingwarning and defense. These howls often serve to warn away competitors forfood and space, and it has been suggested that these vocalizations are a sub-stitute for active fighting (Carpenter 1965; Crockett and Eisenberg 1987). Because groups are widely separated, fighting may be avoided, and thus thespacing may be a group defense. This spacing has also often been interpretedas evidence that howlers have specific territories, which they defend. A strict
CHAPTER 9 ■ The Biology and Behavior of the Living Primates 241
FIGURE 9.7
A Bolivian red howler monkey, one of the New Worldmonkeys with a prehensile tail. (© Zoological Society of San Diego)

Relethford: The Human Species: An Introduction to Biological Anthropology, 5/e
III. Our Place in Nature 9. The Biology and Behavior of the Living Primates
© The McGraw−Hill Companies, 2003
definition of territory is a home range that is actively defended and does notoverlap with another group’s home range. Actually, few primates are territo-rial in this sense. Carpenter (1965) noted that howlers do not defend specificand constant boundaries but rather defend wherever they are at a given time.Crockett and Eisenberg (1987) suggest that howlers cannot actually be con-sidered territorial because the overlap in home ranges is often quite large, butthey also note that others interpret the data as showing some territoriality.(Perhaps the most telling observation is the variation that howlers [and manyprimates] show from study to study.) Although much is still unknown abouthowler monkeys, it is clear that they are not easily pigeonholed into different
242 PART III ■ Our Place in Nature
FIGURE 9.8
Japanese macaques, adapted to living in the snow. (© StevenKaufman/Peter Arnold, Inc.)
territory A home rangethat is actively defended.
I I I I I I I

Relethford: The Human Species: An Introduction to Biological Anthropology, 5/e
III. Our Place in Nature 9. The Biology and Behavior of the Living Primates
© The McGraw−Hill Companies, 2003
categories such as uni-male versus multimale or territorial versus nonterri-torial (Crockett and Eisenberg 1987).
Old World MonkeysCharacteristics Old World monkeys are biochemically and physically moresimilar to humans than are New World monkeys. For example, Old Worldmonkeys have the same number of teeth as apes and humans (a dental for-mula of 2-1-2-3). Old World monkeys inhabit a wide range of environments.Many species live in tropical rain forests, but other species have adapted tothe savanna (open grasslands). One species has even learned to survive in thesnowy environment of the Japanese mountains (Figure 9.8).
The Old World monkeys, like the New World monkeys, are quadrupedal,running on the ground and branches on all fours. Though Old World mon-keys are agile in the trees, many species have adapted to spending more timeon the ground in search of food. Most Old World species eat a mixed diet offruits and leaves (Figure 9.9), although some show dental and digestive spe-cializations for leaf eating. Some Old World species occasionally supplementtheir primarily vegetarian diet with insects or small animals that they hunt.
Social structure is highly variable among Old World monkeys. Most knownspecies have been characterized as having either multimale/multifemale oruni-male social groups. However, a large proportion of Old World monkeyspecies has been observed with more than one social structure, depending
CHAPTER 9 ■ The Biology and Behavior of the Living Primates 243
FIGURE 9.9
A mandrill, an Old Worldmonkey. (© Zoological Society of San Diego)
savanna An environmentconsisting of opengrasslands in which foodresources tend to be spreadout over large areas.
I I I I I I I

Relethford: The Human Species: An Introduction to Biological Anthropology, 5/e
III. Our Place in Nature 9. The Biology and Behavior of the Living Primates
© The McGraw−Hill Companies, 2003
on the specific group, once again showing behavioral variation (Figure 9.10).One contributing factor to this variation is the availability of food. In speciesthat have less available food, the uni-male structure is more common, per-haps because additional males would consume food without adding muchto group survival.
Case Study: Baboons Baboons are one of the most widely studied and in-teresting of the Old World monkeys (technically, several different monkeysare given the general label of “baboon”; here we refer to the “savanna baboon”).Baboons live in relatively large (20–200) multimale/multifemale groups onthe African savanna (Figure 9.11). The savanna is composed primarily ofopen grasslands, in which food resources tend to be spread out over largeareas. Clusters of trees in the savanna provide additional opportunities forfood, as well as for protection. Even though baboons are essentially terres-trial, they still have the basic primate adaptations that allow them to climbeffectively, which proves useful in hiding from predators, and for shelterwhen sleeping. Because food resources are spread out over large areas of thesavanna, baboons tend to have rather large home ranges, and they cover thisarea by foraging as a group. The baboon diet is quite diverse, including grass,leaves, fruit, and occasionally meat that has been obtained from huntingsmall mammals and birds.
A primary reason baboons are so widely studied is that they live on thesavanna. Our analysis of the first humans shows that they too lived in or neara savanna environment (Chapter 12), and thus many scientists have advo-cated using the baboon as a possible model for the evolution of human be-havior. Today we recognize many problems with this simple approach, and“baboon models” are seldom used (Strum and Mitchell 1987). Still, the ba-boon makes an interesting species to study in its own right, and the more we
244 PART III ■ Our Place in Nature
FIGURE 9.10
Variation in social structureamong Old World monkeys.Numbers represent thepercentage of species that havea particular social structure(species for which thisinformation is not known have been excluded). Note that 17 percent of Old Worldmonkey species have beenobserved with more than onetype of social structure. (Sourceof data: Jolly 1985:129, Table 6.5a) Variable: Family group
and uni-male(2%)
Uni-male(34%)
Variable: Uni-maleand multimale/multifemale
(15%)
Multimale/multifemale(45%)
Family group(4%)

Relethford: The Human Species: An Introduction to Biological Anthropology, 5/e
III. Our Place in Nature 9. The Biology and Behavior of the Living Primates
© The McGraw−Hill Companies, 2003
find out about their society, the more we again see the variable nature of pri-mate behavior.
Much of the focus in baboon studies has been on social organization.Adult males are dominant over adult females, and there is a constant shift inthe relative position of the most dominant males. Aggressive actions play a role in this continual struggle (Figure 9.12). Adult males are considerably
FIGURE 9.12
An adult male baboon“yawning”—an expression that is interpreted by others asan aggressive display and awarning. Such threat gesturesare used in disputes overdominance. (© Irven DeVore,Anthro-Photo)
FIGURE 9.11
Baboons on the savanna. (© E. R. Degginger/AnimalsAnimals)
245
Relethford: The Human Species: An Introduction to Biological Anthropology, 5/e
III. Our Place in Nature 9. The Biology and Behavior of the Living Primates
© The McGraw−Hill Companies, 2003
larger than adult females, and the largest and strongest males often have agreater chance of being the most dominant.
Size and strength are not, however, the only factors affecting male domi-nance in baboon society. Coalitions of two or more lower-ranking males haveoften been observed to displace a more dominant male who was actuallylarger and stronger than either of the lower-ranking males. The ability to aidothers is an important determinant of dominance rank.
Environmental factors also affect the pattern of dominance within ba-boon society. For example, Rowell (1966) found that forest-living baboonshave less rigid dominance hierarchies than groups living on the savanna. Inaddition, the daily life of the forest baboons was more relaxed, as the level ofaggression was lower. In forest environments, food is generally more avail-able and there is less threat from predators. Quite simply, a rigid social orga-nization is not needed in this environment.
In the initial years of baboon research, most of the attention was on thedominance hierarchies of the adult males and less attention was given to thebehaviors of adult females. We now realize that the continuity of baboon so-ciety revolves around the females and that adult males quite frequently movefrom one social group to another. The dominance hierarchy of the adult fe-males is generally more stable over time. The importance of female continu-ity in baboon society must be acknowledged because they are responsible forthe care of infants and provide the needed socialization prior to maturity.
THE HOMINOIDS
In addition to the monkeys, the other major group of living anthropoids arethe hominoids, which is a group composed of apes and humans. The simi-larity of apes and humans (hence their placement in the same superfamily)has long been a source of interest and fascination. Perhaps one of our mostmemorable images of this relatedness comes from the classic 1933 movieKing Kong. The giant gorilla discovered on “Skull Island” is captured andbrought to New York City for display as the eighth wonder of the world. Ig-noring the fantastic nature of some of the plot elements (gorillas could notbe that large and still walk), the film draws close comparisons between Kong’sbehavior and that of the humans in the film. Kong shows love, curiosity, andanger, among other emotions and behaviors. Kong is a mirror for the hu-mans, and the humans are a mirror for Kong. We see ourselves in the beastand the beast in ourselves.
Hominoid CharacteristicsWhether we choose to look at apes as humanlike, or humans as apelike, thefact remains that of all living creatures the apes are the most similar to hu-mans in both biology and behavior. Before considering the biology and be-havior of living apes (the remainder of this chapter) and humans (next chap-ter), it is necessary to examine some of the general characteristics of all livinghominoids.
246 PART III ■ Our Place in Nature
hominoid A superfamily of anthropoids consisting of apes and humans.
I I I I I I I

Relethford: The Human Species: An Introduction to Biological Anthropology, 5/e
III. Our Place in Nature 9. The Biology and Behavior of the Living Primates
© The McGraw−Hill Companies, 2003
Unlike monkeys, hominoids do not have tails. Another hominoid char-acteristic is size: in general, most hominoid species are larger than monkeys.Hominoid brains as a rule are larger than monkey brains, both in terms ofabsolute size and in relationship to body size. Their brains are also more com-plex, which correlates with the hominoid characteristics of greater intelli-gence and learning abilities. Hominoids also invest the most time and effortin raising their young.
Hominoids share with Old World monkeys the 2-1-2-3 dental formula(two incisors, one canine, two premolars, and three molars in each half ofthe upper and lower jaws). The structure of the molar teeth, however, is dif-ferent in monkeys and hominoids. The most noticeable difference is that thelower molar teeth of hominoids tend to have five cusps (raised areas) as com-pared to the four cusps in the lower molars of monkeys. The deeper groovesbetween these five cusps form the shape of the letter Y. As such, this charac-teristic shape is called the “Y-5” pattern (Figure 9.13). This difference mayseem trivial, but it does help us in identifying fossils because we can often tellwhether a form is a monkey or a hominoid on the basis of the molar teeth.
Perhaps one of the most important characteristics of hominoids is theirupper body and shoulder anatomy. Hominoids can raise their arms abovetheir heads with little trouble, whereas a monkey would find this difficult.This ability of hominoids to raise their arms above their heads is based onthree basic anatomical features. First, hominoids have a larger and strongercollarbone than monkeys. Second, the hominoid shoulder joint is very flexibleand capable of a wide angle of movement. Third, hominoid shoulder bladesare located more toward the back. By contrast, monkeys’ shoulder blades arelocated more toward the sides of the chest (Figure 9.14). Hominoid shoulderjoints face outward, compared to the shoulder joints of monkeys, which aredownward-facing.
Most hominoids have longer front limbs than back limbs. Modern hu-mans are an exception to this rule, with longer legs than arms. This trait fa-cilitates upright walking (discussed later). In apes, the longer front limbsrepresent an adaptation to hanging from tree limbs. In addition, hominoidsgenerally have long fingers that help them hang suspended from branches.The wrist joint of hominoids contains a disc of cartilage (called a meniscus)between the lower arm bones and the wrist bones. This disc cuts down oncontact between bones. As a result, the wrist joints of hominoids are moreflexible than those of monkeys, allowing greater hanging ability.
Hominoid anatomy allows them a different type of movement from thatof monkeys. Hominoids are adept at climbing and hanging from branches.They are suspensory climbers. As hominoids, humans have retained thisability, although we seldom use it in our daily lives. One exception is chil-dren playing on so-called monkey bars at playgrounds (which should moreproperly be called “hominoid bars”). The ability to suspend by the arms andthen swing from one rung of the bars to the next is a basic hominoid trait.
Living hominoids all share this basic ability but vary quite a bit in termsof their normal patterns of movement. Some apes, for example, are profi-cient arm swingers, whereas others are expert climbers. Humans have evolveda totally different pattern in which the arms are not used for movement; this
CHAPTER 9 ■ The Biology and Behavior of the Living Primates 247
FIGURE 9.13
The Y-5 lower molar pattern ofhominoids. Circles representcusps. The heavier line resemblesthe letter Y on its side.
Front
CheekTongue
Back
cusp A raised area on thechewing surface of a tooth.
suspensory climbing Theability to raise the armsabove the head and hang on branches and to climb in this position.
I I I I I I I
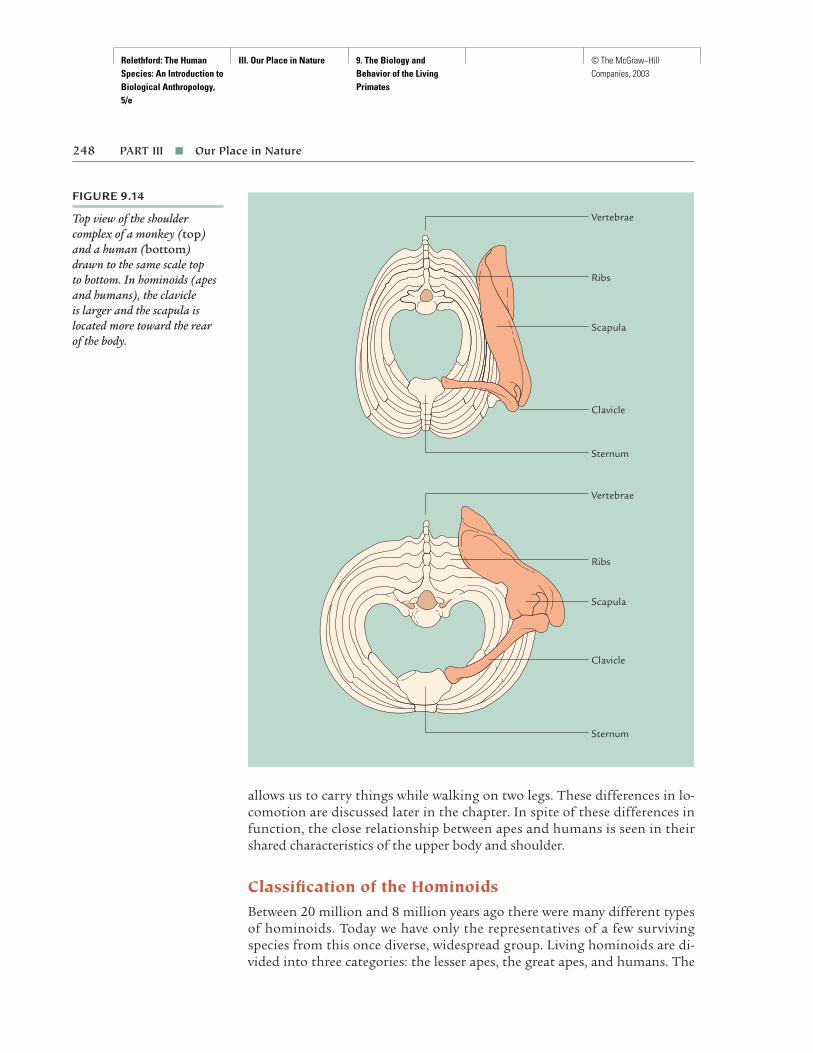
Relethford: The Human Species: An Introduction to Biological Anthropology, 5/e
III. Our Place in Nature 9. The Biology and Behavior of the Living Primates
© The McGraw−Hill Companies, 2003
allows us to carry things while walking on two legs. These differences in lo-comotion are discussed later in the chapter. In spite of these differences infunction, the close relationship between apes and humans is seen in theirshared characteristics of the upper body and shoulder.
Classification of the HominoidsBetween 20 million and 8 million years ago there were many different typesof hominoids. Today we have only the representatives of a few survivingspecies from this once diverse, widespread group. Living hominoids are di-vided into three categories: the lesser apes, the great apes, and humans. The
248 PART III ■ Our Place in Nature
FIGURE 9.14
Top view of the shouldercomplex of a monkey (top)and a human (bottom)drawn to the same scale top to bottom. In hominoids (apesand humans), the clavicle is larger and the scapula islocated more toward the rear of the body.
Vertebrae
Ribs
Scapula
Clavicle
Sternum
Vertebrae
Ribs
Scapula
Clavicle
Sternum
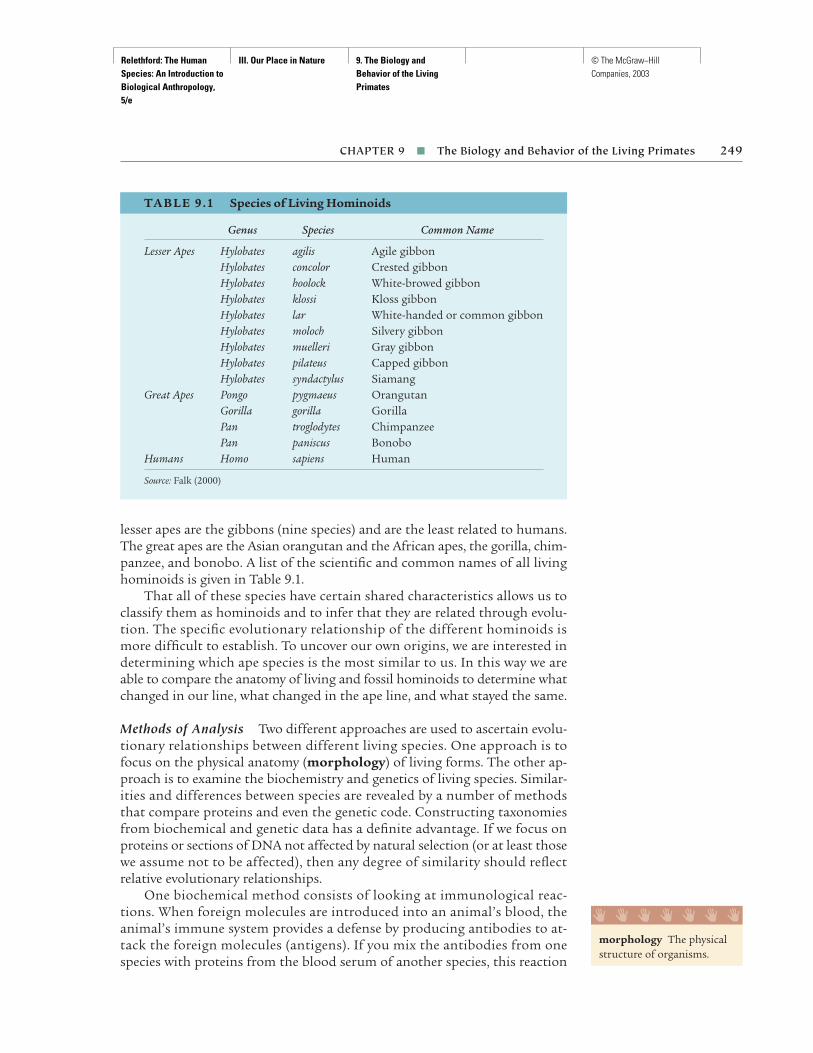
Relethford: The Human Species: An Introduction to Biological Anthropology, 5/e
III. Our Place in Nature 9. The Biology and Behavior of the Living Primates
© The McGraw−Hill Companies, 2003
lesser apes are the gibbons (nine species) and are the least related to humans.The great apes are the Asian orangutan and the African apes, the gorilla, chim-panzee, and bonobo. A list of the scientific and common names of all livinghominoids is given in Table 9.1.
That all of these species have certain shared characteristics allows us toclassify them as hominoids and to infer that they are related through evolu-tion. The specific evolutionary relationship of the different hominoids ismore difficult to establish. To uncover our own origins, we are interested indetermining which ape species is the most similar to us. In this way we areable to compare the anatomy of living and fossil hominoids to determine whatchanged in our line, what changed in the ape line, and what stayed the same.
Methods of Analysis Two different approaches are used to ascertain evolu-tionary relationships between different living species. One approach is tofocus on the physical anatomy (morphology) of living forms. The other ap-proach is to examine the biochemistry and genetics of living species. Similar-ities and differences between species are revealed by a number of methodsthat compare proteins and even the genetic code. Constructing taxonomiesfrom biochemical and genetic data has a definite advantage. If we focus onproteins or sections of DNA not affected by natural selection (or at least thosewe assume not to be affected), then any degree of similarity should reflectrelative evolutionary relationships.
One biochemical method consists of looking at immunological reac-tions. When foreign molecules are introduced into an animal’s blood, theanimal’s immune system provides a defense by producing antibodies to at-tack the foreign molecules (antigens). If you mix the antibodies from onespecies with proteins from the blood serum of another species, this reaction
CHAPTER 9 ■ The Biology and Behavior of the Living Primates 249
TA B L E 9 .1 Species of Living Hominoids
Genus Species Common Name
Lesser Apes Hylobates agilis Agile gibbonHylobates concolor Crested gibbonHylobates hoolock White-browed gibbonHylobates klossi Kloss gibbonHylobates lar White-handed or common gibbonHylobates moloch Silvery gibbonHylobates muelleri Gray gibbonHylobates pilateus Capped gibbonHylobates syndactylus Siamang
Great Apes Pongo pygmaeus OrangutanGorilla gorilla GorillaPan troglodytes ChimpanzeePan paniscus Bonobo
Humans Homo sapiens Human
Source: Falk (2000)
morphology The physicalstructure of organisms.
I I I I I I I
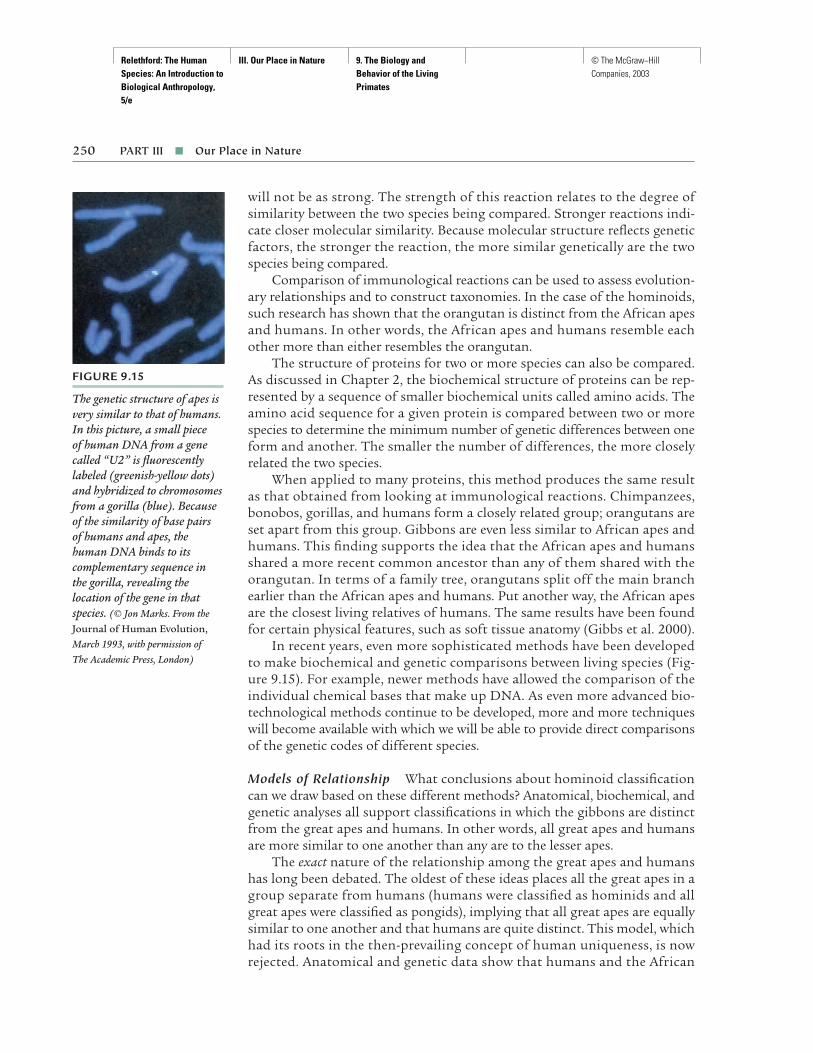
Relethford: The Human Species: An Introduction to Biological Anthropology, 5/e
III. Our Place in Nature 9. The Biology and Behavior of the Living Primates
© The McGraw−Hill Companies, 2003
will not be as strong. The strength of this reaction relates to the degree ofsimilarity between the two species being compared. Stronger reactions indi-cate closer molecular similarity. Because molecular structure reflects geneticfactors, the stronger the reaction, the more similar genetically are the twospecies being compared.
Comparison of immunological reactions can be used to assess evolution-ary relationships and to construct taxonomies. In the case of the hominoids,such research has shown that the orangutan is distinct from the African apesand humans. In other words, the African apes and humans resemble eachother more than either resembles the orangutan.
The structure of proteins for two or more species can also be compared.As discussed in Chapter 2, the biochemical structure of proteins can be rep-resented by a sequence of smaller biochemical units called amino acids. Theamino acid sequence for a given protein is compared between two or morespecies to determine the minimum number of genetic differences between oneform and another. The smaller the number of differences, the more closelyrelated the two species.
When applied to many proteins, this method produces the same resultas that obtained from looking at immunological reactions. Chimpanzees,bonobos, gorillas, and humans form a closely related group; orangutans areset apart from this group. Gibbons are even less similar to African apes andhumans. This finding supports the idea that the African apes and humansshared a more recent common ancestor than any of them shared with theorangutan. In terms of a family tree, orangutans split off the main branchearlier than the African apes and humans. Put another way, the African apesare the closest living relatives of humans. The same results have been foundfor certain physical features, such as soft tissue anatomy (Gibbs et al. 2000).
In recent years, even more sophisticated methods have been developed to make biochemical and genetic comparisons between living species (Fig-ure 9.15). For example, newer methods have allowed the comparison of theindividual chemical bases that make up DNA. As even more advanced bio-technological methods continue to be developed, more and more techniqueswill become available with which we will be able to provide direct comparisonsof the genetic codes of different species.
Models of Relationship What conclusions about hominoid classificationcan we draw based on these different methods? Anatomical, biochemical, andgenetic analyses all support classifications in which the gibbons are distinctfrom the great apes and humans. In other words, all great apes and humansare more similar to one another than any are to the lesser apes.
The exact nature of the relationship among the great apes and humanshas long been debated. The oldest of these ideas places all the great apes in agroup separate from humans (humans were classified as hominids and allgreat apes were classified as pongids), implying that all great apes are equallysimilar to one another and that humans are quite distinct. This model, whichhad its roots in the then-prevailing concept of human uniqueness, is now rejected. Anatomical and genetic data show that humans and the African
250 PART III ■ Our Place in Nature
FIGURE 9.15
The genetic structure of apes isvery similar to that of humans.In this picture, a small piece of human DNA from a genecalled “U2” is fluorescentlylabeled (greenish-yellow dots)and hybridized to chromosomesfrom a gorilla (blue). Becauseof the similarity of base pairs of humans and apes, thehuman DNA binds to itscomplementary sequence in the gorilla, revealing thelocation of the gene in thatspecies. (© Jon Marks. From theJournal of Human Evolution,March 1993, with permission of The Academic Press, London)

Relethford: The Human Species: An Introduction to Biological Anthropology, 5/e
III. Our Place in Nature 9. The Biology and Behavior of the Living Primates
© The McGraw−Hill Companies, 2003
apes are more similar to one another than any are to the Asian great ape, theorangutan.
Biochemical and genetic comparisons clearly demonstrate that the Afri-can apes and humans are most similar to one another. In a classic study ofprotein differences and DNA sequences between chimpanzees and humans,King and Wilson (1975) found that the two species are more than 98 percentidentical. Subsequent research confirmed this finding and extended it to thebonobo and the gorilla. This finding implies that humans and African apesall split from a common ancestor at roughly the same time.
It is now clear that humans and African apes are more closely related toeach other than either is to the Asian great ape, the orangutan. There is also anindication that chimpanzees and bonobos are even more closely related to hu-mans than either is to gorillas (e.g., Gagneux et al. 1999; Horai et al. 1995). Ifso, then we can reconstruct a family tree of the relationships of the great apesand humans. As shown in Figure 9.16, this tree suggests that the orangutansplit off from the common ancestor of African apes and humans. The nextsplit was between the line leading to the gorilla and the line leading to thecommon ancestor of humans and chimpanzees and bonobos, the latter two ofwhich diverged later in time. Not everyone agrees with the specific order ofsplitting within the African apes (some suggest that gorillas, chimpanzees, andbonobos diverged after the human line diverged), but there is consensus re-garding the closer kinship of African apes with humans than with orangutans.
What then is the best way to classify the living hominoids? A traditionalclassification, shown in Figure 9.17, is based on a phenetic approach thatconsiders overall physical similarity, grouping the great apes together in onefamily (Pongidae) and placing humans in their own family (Hominidae, orhominids). This classification is problematic. Although separation of thegreat apes from humans is useful in some discussions of anatomy and be-havior, it clearly does not reflect evolutionary relationships. We know from anumber of analyses of genetics and anatomy that some of the great apes are
CHAPTER 9 ■ The Biology and Behavior of the Living Primates 251
FIGURE 9.16
An evolutionary “tree”showing the relationshipsamong the living great apesand humans. Note that humans,chimpanzees, and bonobos are more closely related to each other than any are to theorangutan. There is still somedisagreement regarding therelationship of the gorilla to the other African apes; somesuggest that the gorilla,chimpanzee, and bonobo aremore closely related to eachother than to humans.
Orangutan Gorilla Chimpanzee Bonobo Human
African Apes

Relethford: The Human Species: An Introduction to Biological Anthropology, 5/e
III. Our Place in Nature 9. The Biology and Behavior of the Living Primates
© The McGraw−Hill Companies, 2003
more closely related to humans than they are to the other great apes. If ourfocus in classification is cladistic, rather than phenetic, then the classifica-tion must place humans and African apes in the same group to the exclusionof the orangutan.
There is considerable controversy at present regarding the best solutionto this problem. Some advocate keeping the traditional classification and notbeing concerned about the lack of correspondence with evolutionary relation-ships. Others advocate that classification should follow cladistic principlesand that the classification should be revised to reflect the greater kinship ofAfrican apes and humans. One possible solution is shown in Figure 9.18,which redefines the family Hominidae to consist of humans and all of thegreat apes. Humans, chimpanzees, and bonobos are placed within their ownsubfamily, and humans are a tribe within this subfamily. This is only one ofmany proposals that have been suggested to make hominoid classificationadhere to cladistic principles. Although many scientists agree that the systemneeds revising, there is much debate at present on how to go about it. Mostagree that grouping all of the great apes under a single family (pongids) makeslittle sense, but there is little consensus on how to classify humans with re-spect to the apes (Cela-Conde et al. 2000).
The continuing debate over hominoid classification is apt to seem a bitconfusing, particularly because different schemes often wind up using thesame name in different ways. Consider, for example, the term hominid, tradi-tionally used as a label for humans and humanlike ancestors that have livedsince the divergence of the African apes. Under the system proposed in Fig-ure 9.18, the term instead refers to humans and the great apes, whereas theterm hominin is used to describe humans and humanlike ancestors. Becausethere is no consensus yet, this book will continue to use the term hominid torefer to humans and humanlike ancestors. Just keep in mind that you mightencounter the term hominin as well. In any event, do not read too much intothe debate over names. There is agreement on the basic facts regarding the evo-lutionary relationships of hominoids; the debate is over what names to use.
252 PART III ■ Our Place in Nature
FIGURE 9.17
Traditional taxonomicclassification of hominoids.Names in italics refer tocommon names. To emphasizecertain aspects of behavior andphysical characteristics, theorangutan, gorilla, chimpanzee,and bonobo are all placed in aseparate category from humans.Although useful for somepurposes, this classificationdoes not reflect the fact thathumans and the African apesare more genetically similar to each other than any are tothe orangutan. Compare thisclassification with Figure 9.18.
Hominoidea(hominoids)
Hylobatids or lesser apes
Gibbon
Common names
Family
Superfamily
Pongidae
Pongids or great apes
OrangutanGorilla
ChimpanzeeBonobo
Hominids
Human
Hylobatidae Hominidae
hominid Humans andhumanlike ancestors sincethe time of divergence fromthe African apes.
hominin Under sometaxonomic classifications,this term is used instead ofhominid to refer to humansand humanlike ancestors.
I I I I I I I

Relethford: The Human Species: An Introduction to Biological Anthropology, 5/e
III. Our Place in Nature 9. The Biology and Behavior of the Living Primates
© The McGraw−Hill Companies, 2003
THE LIVING APES
To provide a better comparison of the biology and behavior of the apes andhumans, it is necessary to consider briefly the physical characteristics, distri-bution, environment, and social structure of all of the hominoids. Althoughthe living hominoids all share a number of features, they also show a greatdeal of biological and behavioral variation.
GibbonsPhysical Characteristics The gibbon is the smallest of the living apes.There are nine recognized species of gibbon.
The physical characteristics of gibbons reflect adaptation to life in thetrees. The climbing and hanging adaptations of hominoids have evolved inthe gibbon to allow highly agile movement through trees. The gibbon’s usualform of movement, known as brachiation, consists of hand-over-handswinging from branch to branch. Many primates are portrayed as arm swing-ers, but only the gibbon can perform this movement quickly and efficiently(Figure 9.19).
A number of anatomical adaptations allow gibbons efficient arm swing-ing. Body size ranges from about 5.5 kg (12 lb) to 13.5 kg (30 lb) (Falk 2000;Richard 1985). Their arms are extremely long relative to their trunks andlegs. Gibbon fingers are elongated and their thumbs are relatively short. Thelong fingers enable gibbons to form a hook with their hands while swingingfrom branch to branch. The thumb is short enough to prevent its getting inthe way while swinging but still long enough to allow manipulation.
CHAPTER 9 ■ The Biology and Behavior of the Living Primates 253
FIGURE 9.18
Revised taxonomicclassification of hominoids to emphasize genetic andevolutionary relationships (see Figure 9.16). Humans,chimpanzees, and bonobosform a group separate from thegorilla and orangutan. Thisclassification does not fit ourusual informal notion of “ape” and “human” and does not reflect commonaspects of behavior or physicalappearance. Compare thisclassification with the one inFigure 9.17. (Wood and Richmond2000)
Hominoidea(hominoids)
Gibbon Common names
Family
Superfamily
Subfamily
Tribe
Ponginae(pongines)
Gorillinae(gorillines)
Panini(panins)
Hominini(hominins)
Homininae(hominines)
Orangutan Human
Hylobatidae(hylobatids)
Hominidae(hominids)
ChimpanzeeBonoboGorilla
brachiation A method ofmovement that uses thearms to swing from branchto branch.
I I I I I I I

Relethford: The Human Species: An Introduction to Biological Anthropology, 5/e
III. Our Place in Nature 9. The Biology and Behavior of the Living Primates
© The McGraw−Hill Companies, 2003
On the ground, gibbons walk on two legs, though their arms are so longthey look awkward to us. These long arms they use for balance. Gibbons alsowalk on two legs when they move along a branch, often using their arms tograb onto overhead branches for support.
Gibbons show almost no sexual dimorphism in body size. Males and fe-males are the same body size, and both have large canine teeth, with male ca-nines slightly larger on average than females.
Distribution and Environment Gibbons are found in the tropical rain for-ests of Southeast Asia, specifically Thailand, Vietnam, Burma, and the MalayPeninsula. The rain forest environment is characterized by heavy rainfall thatis relatively constant throughout the year. Rain forests have incredibly richand diverse vegetation. The gibbons’ diet consists primarily of fruits supple-mented by leaves.
Social Structure Gibbons have long been characterized as having a monog-amous family structure—an adult male, an adult female, and their offspring—where the adult male and female form a mating pair for long periods. Fuentes(2000) suggests that this is not always the case, and gibbon groups do notnecessarily always form nuclear family units. Instead, he argues that gibbons(like most other primates) originally had a multimale/multifemale socialstructure but now have a more variable system. Often, the small social groupsresult in a typical family structure, but not always. Once again, continued re-search has shown us the variable nature of primate social behavior.
Gibbons actively defend territories. They do this by making loud vocal-izations and putting on aggressive displays to warn off other groups. Whengroups come into contact in overlapping areas, the males often fight to drivethe other group away. Females often aid in these fights.
254 PART III ■ Our Place in Nature
FIGURE 9.19
Gibbons brachiating. Gibbonsare the most acrobatic of theapes and can swing by theirarms easily. (© Gerard Lacz/Animals Animals)

Relethford: The Human Species: An Introduction to Biological Anthropology, 5/e
III. Our Place in Nature 9. The Biology and Behavior of the Living Primates
© The McGraw−Hill Companies, 2003
Though it may be interesting to speculate on the nature of gibbon ag-gression and territorial behavior as it relates to primate behavior, in realityterritorial behavior is rather rare among primates, including the hominoids.Territorial behavior is most often a function of the environment. In tropicalrain forests, food is abundant and spread throughout the region. Becausefood resources are not clumped together, neither are the animal populations.Food is spread out over a large area, so family groups come into frequent con-tact with one another, necessitating territorial boundaries to establish groupboundaries (Denham 1971). In environments where food resources are clus-tered, social groups tend to cluster as well and are spaced apart from one an-other at the outset.
OrangutansThe orangutan is a large ape found only in certain areas of Southeast Asia.The word orangutan translates from Malay as “man of the forest.”
Physical Characteristics One of the orangutan’s most obvious physicalfeatures is its reddish brown hair (Figure 9.20). Males are roughly twice thesize of females; an average adult male weighs between 80 and 90 kg (roughly175–200 lb), and an average adult female weighs between 33 and 45 kg(roughly 73–99 lb) (Markham and Groves 1990). Males also have large padsof fat on their faces. The high degree of sexual dimorphism in orangutans hasoften been thought surprising because this trait occurs most often in terres-trial species. More recent evidence, however, suggests that orangutans spendmore time on the ground than we had once thought. The orangutan is re-sponsible, with the gorilla and chimpanzee, for many reports by early explor-ers of “wild men,” “monsters,” and “subhumans.”
Orangutans are agile climbers and hangers. In the trees, they use botharms and legs to climb in a slow, cautious manner. They will use one or morelimbs to anchor themselves to branches while using the other limbs to feed(Figure 9.21). Younger orangutans occasionally brachiate, but the larger adultsgenerally move through the trees in a different manner. A large orangutan willnot swing from one tree to the next; rather, it will rock the tree it is on slowlyin the direction of the next tree and then move over when the two trees areclose together. The orangutan’s great agility in climbing is due, in part, to itsbasic hominoid shoulder structure.
Orangutans are largely arboreal. Males, however, frequently come to theground and travel along the forest floor for long distances. On the ground,orangutans walk on all fours but with their fists partially closed. Unlike mon-keys, who rest their weight on their palms, orangutans rest on their fists: aform of movement often called fist walking.
Recent data suggest that orangutans produce offspring more slowly thanthe other great apes (Galdikas and Wood 1990). The average birth interval(the time between successive births) for orangutans is 7.7 years, compared tobirth intervals of 3.8 years for gorillas and 5.6 years for chimpanzees.
CHAPTER 9 ■ The Biology and Behavior of the Living Primates 255

Relethford: The Human Species: An Introduction to Biological Anthropology, 5/e
III. Our Place in Nature 9. The Biology and Behavior of the Living Primates
© The McGraw−Hill Companies, 2003
FIGURE 9.20
Mother and infant orangutans.(© Zoological Society of San Diego)
FIGURE 9.21
A young orangutan foraging.(© Mickey Gibson/AnimalsAnimals)
256

Relethford: The Human Species: An Introduction to Biological Anthropology, 5/e
III. Our Place in Nature 9. The Biology and Behavior of the Living Primates
© The McGraw−Hill Companies, 2003
In some ways, orangutans are very similar to humans. Schwartz (1987)has drawn attention to a number of dental and skeletal traits humans andorangutans share that are not found in the African apes. Humans and orang-utans also share certain aspects of their reproductive physiology. For exam-ple, both humans and orangutans have the same gestation length (270 days),which is longer than that of the African apes. Also, neither humans nor orang-utans have a distinct mating cycle. Most primates have a definite time duringthe month (estrus) when the female is in “heat”—that is, sexually responsive.Neither humans nor orangutans have an estrus cycle. Orangutans are alsogenetically very similar to humans; the DNA of humans and orangutans dif-fers by slightly more than 2 percent.
Distribution and Environment The orangutan is found today only in Su-matra and Borneo in Southeast Asia. Orangutans are vegetarians, with morethan 60 percent of their diet consisting of fruit ( Jolly 1985). As does the gib-bon, the orangutan lives in tropical rain forests.
The natural range of the orangutan was probably greater in the past, judg-ing from the fact that fossil apes similar to orangutans have been found inAsia dating from 12 million years ago (see Chapter 11). Some of the reduceddistribution is the result of climatic change in the past. The limited range oforangutans—and of the other apes—today is also due in part to human inter-vention. As its natural habitats continue to be destroyed, the orangutan is anendangered species and faces extinction.
Social Structure Orangutans have the solitary social group structure, con-sisting of a mother and infant. Males are not needed for protection becausethere is little danger from predators (Horr 1972). Adult males generally liveby themselves, interacting only during times of mating. Orangutans are polyg-amous; they do not form long-term bonds with any one partner. The smallgroup size of orangutans appears to be related to the nature of the environ-ment; when food resources are widely scattered, there is not enough food inany one place for large groups (Denham 1971).
GorillasGorillas, the largest living primates, are found only in equatorial Africa.
Physical Characteristics An adult male gorilla weighs 160 kg (roughly 350 lb) on average. Adult females weigh less but are still very large for pri-mates (70 kg/155 lb) (Leutenegger 1982). Besides a much larger body size,the adult males also have larger canine teeth and often large crests of boneon top of their skulls for anchoring their large jaw muscles. Gorillas usuallyhave blackish hair; fully mature adult males have silvery gray hair on theirbacks. These adult males are called “silverbacks.”
Their large size makes gorillas predominantly terrestrial. Their typi-cal means of movement is called knuckle walking: they move about on allfours, resting their weight on the knuckles of their front limbs. This form of
CHAPTER 9 ■ The Biology and Behavior of the Living Primates 257
estrus A time during themonth when females aresexually receptive.
knuckle walking A form of movement used bychimpanzees and gorillasthat is characterized by allfour limbs touching theground, with the weight of the arms resting on theknuckles of the hands.
I I I I I I I

Relethford: The Human Species: An Introduction to Biological Anthropology, 5/e
III. Our Place in Nature 9. The Biology and Behavior of the Living Primates
© The McGraw−Hill Companies, 2003
movement is different from the fist walking of orangutans. Gorilla handshave well-developed muscles and strengthened joints to handle the stress ofresting on their knuckles. Because their arms are longer than their legs, go-rilla spines are at an angle to the ground (Figure 9.22). In contrast, the spineof a typical quadrupedal animal, such as a monkey, is roughly parallel to theground when walking.
Distribution and Environment Gorillas are only found in three forestedareas in Africa. Their range is disappearing rapidly, primarily as the result ofreplacement of forests by human farmland and human poaching (Fossey1983). Three recognized subspecies of gorilla live in different regions in west-ern Africa: the western lowland gorilla, the eastern lowland gorilla, and themountain gorilla.
Many myths have circulated regarding the gorilla’s lust for human andnonhuman flesh, but the truth of the matter is that gorillas eat a diet almostentirely made up of leaves and fruit. Diet varies by location; the lowland go-rillas eat more fruit than the mountain gorillas. Differences in diet may af-fect social organization in the different gorilla subspecies, but it is not yet clearexactly how (Doran and McNeilage 1998).
Social Structure Gorillas live in small social groups of about a dozen indi-viduals. The social group consists of an adult male (the silverback), severaladult females, and their immature offspring (Figure 9.23). Occasionally, oneor more younger adult males are part of the group, but they tend not to matewith the females. Though dominance rank varies among the females andsubadult males, the adult silverback male is the most dominant individualin the group and is the leader. The silverback sets the pace for the rest of thegroup, determining when and how far to move in search of food.
FIGURE 9.22
An adult male gorilla knucklewalking. Note the angle of thespine relative to the groundbecause of the longer frontlimbs. (© Zoological Society of San Diego)
258

Relethford: The Human Species: An Introduction to Biological Anthropology, 5/e
III. Our Place in Nature 9. The Biology and Behavior of the Living Primates
© The McGraw−Hill Companies, 2003
A typical day for a gorilla group consists of eating and resting. Giventheir large body size and the limited nutritional value of leaves, it is not won-der that gorillas spend most of their day eating. Because of their size, gorillashave few problems with predators (except for humans with weapons). Thelife of a gorilla is for the most part peaceful, a dramatic contrast to theirstereotypical image as aggressive, evil creatures.
Because gorillas are rather peaceful and slow-moving, we have a tendencyto think they are “slow” in a mental sense as well. This is another myth ofgorilla behavior. Laboratory and field studies of gorillas have shown them tobe extremely intelligent creatures. As discussed later, they have even learnedsign language.
ChimpanzeesThe chimpanzee is perhaps the best known of all of the nonhuman primates.Most of our experience with chimpanzees, however, is with captive or trainedanimals. We like to watch chimpanzees perform “just like humans” and de-light in a chimpanzee’s smile (which actually signals tension, not pleasure).
From a scientific perspective, chimpanzees are equally fascinating. Geneticstudies during the past 20 years have shown that humans and chimpanzees
CHAPTER 9 ■ The Biology and Behavior of the Living Primates 259
FIGURE 9.23
A gorilla social group. (© Michael K. Nichols/MagnumPhotos, Inc.)
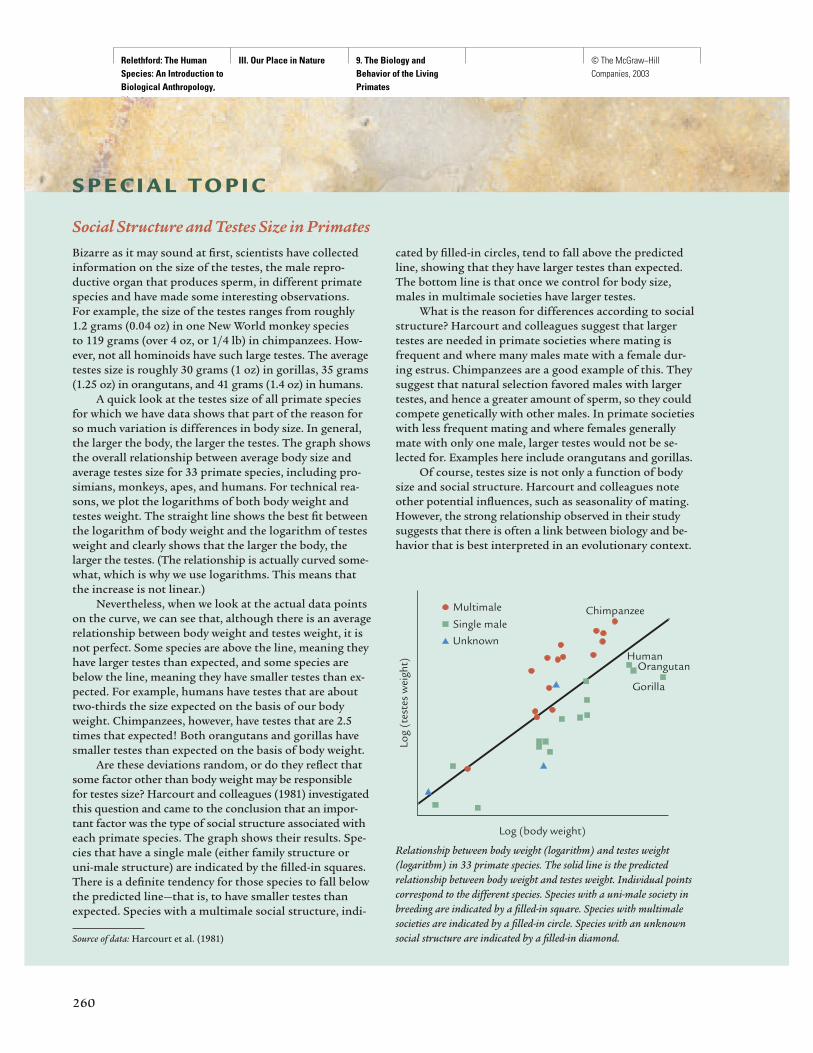
Relethford: The Human Species: An Introduction to Biological Anthropology, 5/e
III. Our Place in Nature 9. The Biology and Behavior of the Living Primates
© The McGraw−Hill Companies, 2003
260
S P E C I A L T O P I C
Social Structure and Testes Size in PrimatesBizarre as it may sound at first, scientists have collectedinformation on the size of the testes, the male repro-ductive organ that produces sperm, in different primatespecies and have made some interesting observations. For example, the size of the testes ranges from roughly1.2 grams (0.04 oz) in one New World monkey species to 119 grams (over 4 oz, or 1/4 lb) in chimpanzees. How-ever, not all hominoids have such large testes. The averagetestes size is roughly 30 grams (1 oz) in gorillas, 35 grams(1.25 oz) in orangutans, and 41 grams (1.4 oz) in humans.
A quick look at the testes size of all primate speciesfor which we have data shows that part of the reason forso much variation is differences in body size. In general,the larger the body, the larger the testes. The graph showsthe overall relationship between average body size andaverage testes size for 33 primate species, including pro-simians, monkeys, apes, and humans. For technical rea-sons, we plot the logarithms of both body weight andtestes weight. The straight line shows the best fit betweenthe logarithm of body weight and the logarithm of testesweight and clearly shows that the larger the body, thelarger the testes. (The relationship is actually curved some-what, which is why we use logarithms. This means thatthe increase is not linear.)
Nevertheless, when we look at the actual data pointson the curve, we can see that, although there is an averagerelationship between body weight and testes weight, it isnot perfect. Some species are above the line, meaning theyhave larger testes than expected, and some species arebelow the line, meaning they have smaller testes than ex-pected. For example, humans have testes that are abouttwo-thirds the size expected on the basis of our bodyweight. Chimpanzees, however, have testes that are 2.5times that expected! Both orangutans and gorillas havesmaller testes than expected on the basis of body weight.
Are these deviations random, or do they reflect thatsome factor other than body weight may be responsible for testes size? Harcourt and colleagues (1981) investigatedthis question and came to the conclusion that an impor-tant factor was the type of social structure associated witheach primate species. The graph shows their results. Spe-cies that have a single male (either family structure oruni-male structure) are indicated by the filled-in squares.There is a definite tendency for those species to fall belowthe predicted line—that is, to have smaller testes thanexpected. Species with a multimale social structure, indi-
cated by filled-in circles, tend to fall above the predictedline, showing that they have larger testes than expected.The bottom line is that once we control for body size,males in multimale societies have larger testes.
What is the reason for differences according to socialstructure? Harcourt and colleagues suggest that largertestes are needed in primate societies where mating isfrequent and where many males mate with a female dur-ing estrus. Chimpanzees are a good example of this. Theysuggest that natural selection favored males with largertestes, and hence a greater amount of sperm, so they couldcompete genetically with other males. In primate societieswith less frequent mating and where females generallymate with only one male, larger testes would not be se-lected for. Examples here include orangutans and gorillas.
Of course, testes size is not only a function of bodysize and social structure. Harcourt and colleagues noteother potential influences, such as seasonality of mating.However, the strong relationship observed in their studysuggests that there is often a link between biology and be-havior that is best interpreted in an evolutionary context.
Relationship between body weight (logarithm) and testes weight(logarithm) in 33 primate species. The solid line is the predictedrelationship between body weight and testes weight. Individual pointscorrespond to the different species. Species with a uni-male society inbreeding are indicated by a filled-in square. Species with multimalesocieties are indicated by a filled-in circle. Species with an unknownsocial structure are indicated by a filled-in diamond.
Log
(tes
tes
wei
ght)
Log (body weight)
Chimpanzee
HumanOrangutan
Gorilla
Multimale
Single male
Unknown
Source of data: Harcourt et al. (1981)

Relethford: The Human Species: An Introduction to Biological Anthropology, 5/e
III. Our Place in Nature 9. The Biology and Behavior of the Living Primates
© The McGraw−Hill Companies, 2003
are even more similar than they were previously thought to be. Laboratoryand field studies have shown that chimpanzees are capable of behaviors weonce thought of as unique to humans, such as toolmaking and language ac-quisition. Any examination of the human condition must take these remark-able creatures’ accomplishments into account.
Physical Characteristics Chimpanzees are found in Africa. They are smallerthan gorillas and show only slight sexual dimorphism. Adult males weighabout 45 kg (99 lb) on average and adult females weigh about 37 kg (82 lb)on average (Leutenegger 1982). Chimpanzees have extremely powerful shoul-ders and arms. Like humans, chimpanzees show great variation in facial fea-tures and overall physical appearance (Figure 9.24).
Chimpanzees, like gorillas, are knuckle walkers, with longer arms thanlegs. Chimpanzees, however, are more active and agile than gorillas. Chim-panzees are both terrestrial and arboreal. They spend considerable time inthe trees, either sleeping or looking for food. They often hang by their armsin the trees. On the ground, they sometimes stand on two legs to carry foodor sticks.
Distribution and Environment Most chimpanzees are found in the Africanrain forests, although some groups are also found in the mixed forest–savanna environments on the fringe of the rain forests. The chimpanzee diet
CHAPTER 9 ■ The Biology and Behavior of the Living Primates 261
FIGURE 9.24
Variation in chimpanzee faces.(© Mike Birkhead/Oxford ScientificFilms/Animals Animals)
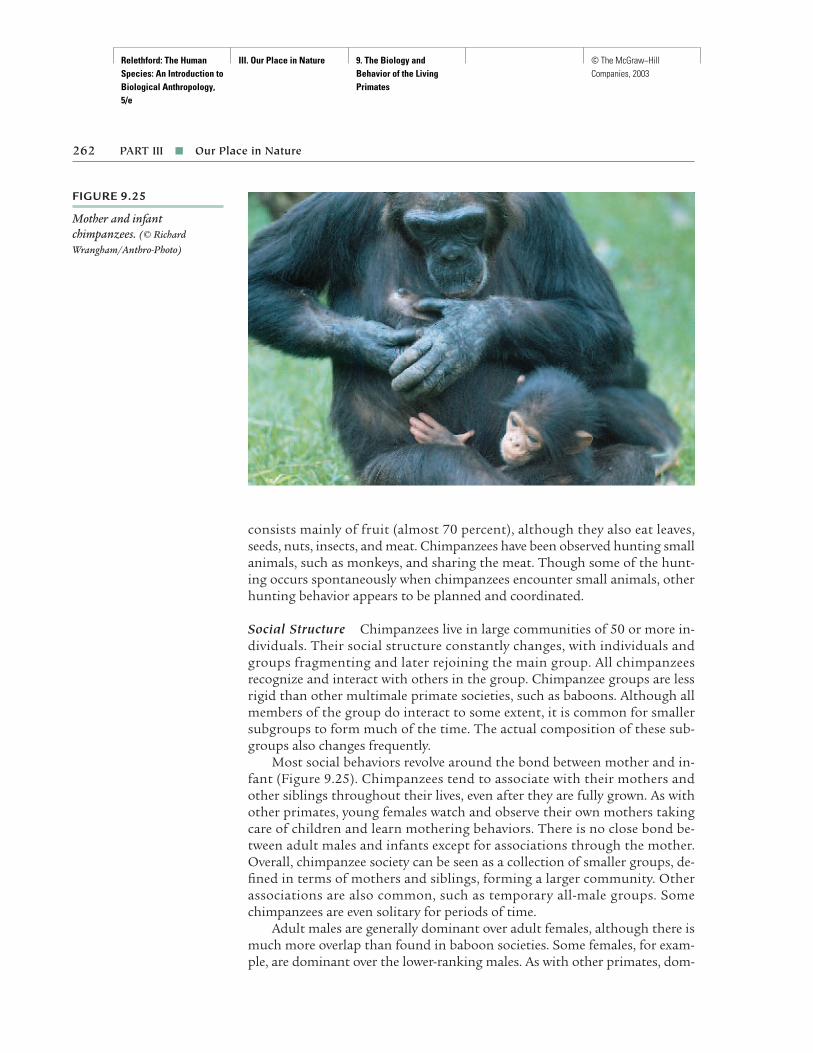
Relethford: The Human Species: An Introduction to Biological Anthropology, 5/e
III. Our Place in Nature 9. The Biology and Behavior of the Living Primates
© The McGraw−Hill Companies, 2003
consists mainly of fruit (almost 70 percent), although they also eat leaves,seeds, nuts, insects, and meat. Chimpanzees have been observed hunting smallanimals, such as monkeys, and sharing the meat. Though some of the hunt-ing occurs spontaneously when chimpanzees encounter small animals, otherhunting behavior appears to be planned and coordinated.
Social Structure Chimpanzees live in large communities of 50 or more in-dividuals. Their social structure constantly changes, with individuals andgroups fragmenting and later rejoining the main group. All chimpanzeesrecognize and interact with others in the group. Chimpanzee groups are lessrigid than other multimale primate societies, such as baboons. Although allmembers of the group do interact to some extent, it is common for smallersubgroups to form much of the time. The actual composition of these sub-groups also changes frequently.
Most social behaviors revolve around the bond between mother and in-fant (Figure 9.25). Chimpanzees tend to associate with their mothers andother siblings throughout their lives, even after they are fully grown. As withother primates, young females watch and observe their own mothers takingcare of children and learn mothering behaviors. There is no close bond be-tween adult males and infants except for associations through the mother.Overall, chimpanzee society can be seen as a collection of smaller groups, de-fined in terms of mothers and siblings, forming a larger community. Otherassociations are also common, such as temporary all-male groups. Somechimpanzees are even solitary for periods of time.
Adult males are generally dominant over adult females, although there ismuch more overlap than found in baboon societies. Some females, for exam-ple, are dominant over the lower-ranking males. As with other primates, dom-
262 PART III ■ Our Place in Nature
FIGURE 9.25
Mother and infantchimpanzees. (© RichardWrangham/Anthro-Photo)
Relethford: The Human Species: An Introduction to Biological Anthropology, 5/e
III. Our Place in Nature 9. The Biology and Behavior of the Living Primates
© The McGraw−Hill Companies, 2003
inance is influenced by a variety of factors such as size, strength, and the abilityto form alliances. Individual intelligence also appears to affect dominance,as was revealed in Jane Goodall’s study of the chimpanzees in the GombeStream National Park near Lake Tanganyika. In 1964, the community stud-ied by Goodall had 14 adult males. The lowest-ranking male (Mike) replacedthe most dominant male (Goliath) after inventing a particularly innovativedisplay of dominance. There were a number of empty kerosene cans lyingaround Goodall’s camp that the chimpanzees generally ignored. Mike wouldcharge other males while hitting the cans in front of him, creating an unusualand very noisy display. This behavior was so intimidating to other males thatMike rose from the lowest to the highest rank at once (Goodall 1986). Thisstudy shows not only the changing nature of dominance hierarchy but alsothe role of individual intelligence and initiative; all the males had access to thecans, but only Mike used them.
Although adult males are generally dominant over adult females, domi-nance rank among the females also has an influence on the group. Becausefemale dominance is less noticeable, some have suggested that it is of littleimportance. However, Anne Pusey, Jennifer Williams, and Jane Goodall (1997)found that female dominance rank correlated with reproductive success. Usingdata from 35 years of observation, they found that the higher-ranking adultfemale chimpanzees tended to have more offspring. In addition, they foundthat infants born to the higher-ranking females also tended to have higherrates of survival through infancy.
Studies of the Gombe Stream chimpanzee community have also revealeda number of other interesting features of chimpanzee social behaviors andintelligence. The chimpanzees have been observed making and using tools (dis-cussed at length in Chapter 10), hunting in cooperative groups, and some-times engaging in widespread aggression against other groups. We examinesome of these findings when we consider what behaviors may be considereduniquely human.
BonobosThe bonobo is the third and least well known of the African apes. The bonobois closely related to the chimpanzee and is commonly considered a separatespecies of chimpanzee known as the “pygmy chimpanzee” (compared to whatis often termed the “common chimpanzee”). The close similarity of chim-panzees and bonobos is reflected in their assignment to the same genus—Pan(the scientific names are Pan troglodytes for the chimpanzee and Pan paniscusfor the bonobo).
Physical Characteristics At first glance, bonobos seem quite similar tochimpanzees (Figure 9.26). On closer examination, however, we see that thebonobo has relatively longer legs, a higher center of gravity, and a narrowerchest. It tends to have a higher forehead and differently shaped face (Savage-Rumbaugh and Lewin 1994). Like gorillas and chimpanzees, bonobos arefrequent knuckle walkers. Of particular interest is the fact that bonobos can
CHAPTER 9 ■ The Biology and Behavior of the Living Primates 263

Relethford: The Human Species: An Introduction to Biological Anthropology, 5/e
III. Our Place in Nature 9. The Biology and Behavior of the Living Primates
© The McGraw−Hill Companies, 2003
walk upright more easily than other apes (Figure 9.27). This observation,combined with other evidence, suggests that the first hominids may have beenquite similar in many ways to bonobos. There is some sexual dimorphism—adult males average 43 kg (95 lb) compared to adult females, which average33 kg (73 lb) (de Waal 1995).
Distribution and Environment Bonobos are found only in a restricted rainforest region in Zaire in central Africa. It is estimated that there are fewerthan 10,000 bonobos alive today. Their diet consists primarily of fruit, sup-plemented with plants. Unlike chimpanzees, bonobos consume little animalprotein and do not hunt monkeys (de Waal 1995).
Social Structure As with chimpanzees, bonobos live in multimale/multi-female groups. However, there are important differences in the social organi-zation of these two species. In chimpanzee society, males are dominant overfemales, and some of the strongest bonds in the social order are between
FIGURE 9.26
A bonobo mother and infant.(© Zoological Society of San Diego)
264

Relethford: The Human Species: An Introduction to Biological Anthropology, 5/e
III. Our Place in Nature 9. The Biology and Behavior of the Living Primates
© The McGraw−Hill Companies, 2003
adult males. In bonobo society, things are quite different. Here the strongestsocial bonds are between adult females (White 1996), and even though theyare physically smaller, it is the females who are most dominant. In addition,the dominance status of a male depends in large part on the dominance ofhis mother (de Waal 1995).
CHAPTER 9 ■ The Biology and Behavior of the Living Primates 265
FIGURE 9.27
A bonobo. (© FransLanting/Minden Pictures)
Relethford: The Human Species: An Introduction to Biological Anthropology, 5/e
III. Our Place in Nature 9. The Biology and Behavior of the Living Primates
© The McGraw−Hill Companies, 2003
Some of the most interesting observations of bonobo behavior have todo with the function of sexual activity in their social interactions. In additionto sexual intercourse, bonobos also engage in a variety of sex play, includingrubbing of genitals and oral sex. Continued observation of bonobo groupshas revealed that such sex play is frequently used to reduce tension and avoidconflict. Researchers have shown repeatedly that bonobos will engage in abrief period of sex play in a tense social situation. In bonobo society, sexualplay is a method of peacemaking (de Waal 1995).
SUMMARY
There is a great deal of biological and behavioral variation among the livingprimates. The order Primates is composed of the more biologically primitiveprosimians and the anthropoids, which consist of monkeys (New World andOld World), apes, and humans. Monkeys are quadrupedal (four-footed) andhave a tail. Although New World monkeys are exclusively arboreal, somespecies of Old World monkeys are arboreal and others are terrestrial.
The hominoids (apes and humans) are a group of anthropoids that sharecertain characteristics, such as the lack of a tail, similar dental features, largerbrains, and a shoulder complex suitable for climbing and hanging. Homi-noids consist of the “lesser apes” (gibbons) and the “great apes.” The great apesconsist of an Asian species (orangutan) and three African species (gorilla,chimpanzee, bonobo). The African apes are the most similar to humans, al-though it is not clear which of these three is the most similar.
The living apes show a great deal of environmental and anatomical vari-ation. Some are arm swingers (gibbon), others are knuckle walkers (gorilla,chimpanzee, bonobo), and one is primarily a climber (orangutan). Althoughthe great apes are all similar genetically and have a fairly recent common an-cestor (roughly 20 million years ago), they show a great deal of social variation.
SUPPLEMENTAL READINGS
In addition to the primate texts listed in Chapter 8, some other useful sources include:Ciochon, R. L., and R. A. Nisbett, eds. 1998. The Primate Anthology: Essays on Primate
Behavior, Ecology, and Conservation from Natural History. A collection of 33 short articleson primate behavior that originally appeared in the magazine Natural History.
Fossey, D. 1983. Gorillas in the Mist. Boston: Houghton Mifflin. A popular and well-writtenaccount of the late Dian Fossey’s researches on the behavior of the mountain gorilla.Deals specifically with the problem of human intervention and the likely extinction ofthe mountain gorilla.
Goodall, J. 1986. The Chimpanzees of Gombe: Patterns of Behavior. Cambridge, Mass.: HarvardUniversity Press. A comprehensive review of Jane Goodall’s research since the early 1960s,this is a well-written and superbly illustrated description of chimpanzee behavior.
266 PART III ■ Our Place in Nature

Relethford: The Human Species: An Introduction to Biological Anthropology, 5/e
III. Our Place in Nature 9. The Biology and Behavior of the Living Primates
© The McGraw−Hill Companies, 2003
INTERNET RESOURCES
The Web pages listed in Chapter 8 provide many links to information on spe-cific primate species and should be consulted. In addition, here are some otheruseful links.
http://anthro.palomar.edu/primateThe Primates, a general tutorial that provides information on prosimians,New World monkeys, Old World monkeys, and apes.
http://anthro.palomar.edu/behavior/default.htmPrimate Behavior, a general tutorial on selected aspects of comparative pri-mate behavior.
http://www.janegoodall.orgThe Jane Goodall Institute, a comprehensive site containing much informa-tion on chimpanzees.
CHAPTER 9 ■ The Biology and Behavior of the Living Primates 267
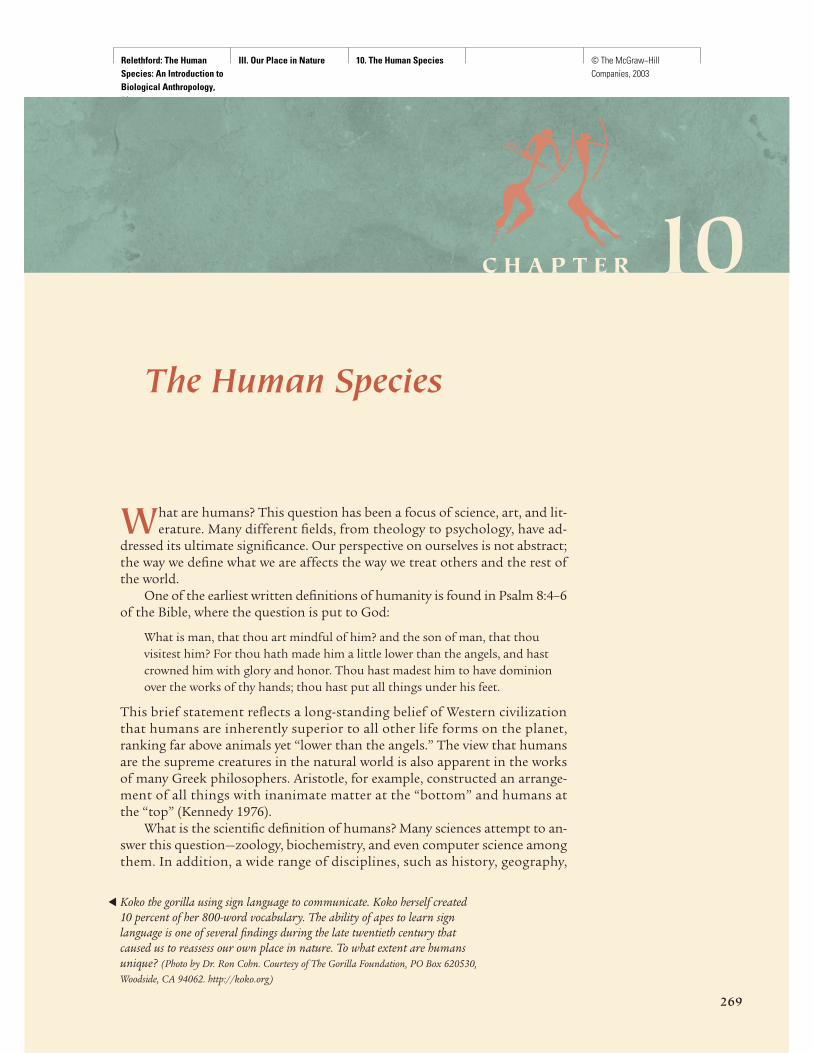
Relethford: The Human Species: An Introduction to Biological Anthropology, 5/e
III. Our Place in Nature 10. The Human Species © The McGraw−Hill Companies, 2003
C H A P T E R 10The Human Species
269
What are humans? This question has been a focus of science, art, and lit-erature. Many different fields, from theology to psychology, have ad-
dressed its ultimate significance. Our perspective on ourselves is not abstract;the way we define what we are affects the way we treat others and the rest ofthe world.
One of the earliest written definitions of humanity is found in Psalm 8:4–6of the Bible, where the question is put to God:
What is man, that thou art mindful of him? and the son of man, that thouvisitest him? For thou hath made him a little lower than the angels, and hastcrowned him with glory and honor. Thou hast madest him to have dominionover the works of thy hands; thou hast put all things under his feet.
This brief statement reflects a long-standing belief of Western civilizationthat humans are inherently superior to all other life forms on the planet,ranking far above animals yet “lower than the angels.” The view that humansare the supreme creatures in the natural world is also apparent in the worksof many Greek philosophers. Aristotle, for example, constructed an arrange-ment of all things with inanimate matter at the “bottom” and humans atthe “top” (Kennedy 1976).
What is the scientific definition of humans? Many sciences attempt to an-swer this question—zoology, biochemistry, and even computer science amongthem. In addition, a wide range of disciplines, such as history, geography,
Koko the gorilla using sign language to communicate. Koko herself created 10 percent of her 800-word vocabulary. The ability of apes to learn signlanguage is one of several findings during the late twentieth century thatcaused us to reassess our own place in nature. To what extent are humansunique? (Photo by Dr. Ron Cohn. Courtesy of The Gorilla Foundation, PO Box 620530,Woodside, CA 94062. http://koko.org)
▲
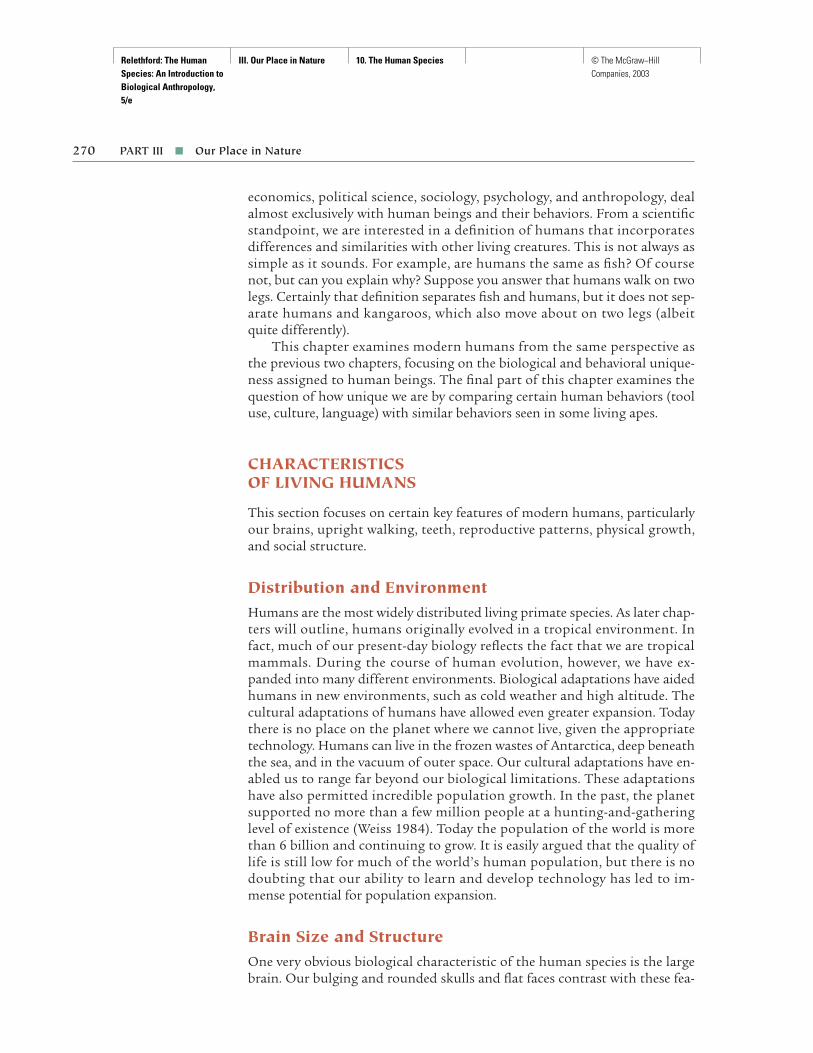
Relethford: The Human Species: An Introduction to Biological Anthropology, 5/e
III. Our Place in Nature 10. The Human Species © The McGraw−Hill Companies, 2003
economics, political science, sociology, psychology, and anthropology, dealalmost exclusively with human beings and their behaviors. From a scientificstandpoint, we are interested in a definition of humans that incorporatesdifferences and similarities with other living creatures. This is not always assimple as it sounds. For example, are humans the same as fish? Of coursenot, but can you explain why? Suppose you answer that humans walk on twolegs. Certainly that definition separates fish and humans, but it does not sep-arate humans and kangaroos, which also move about on two legs (albeitquite differently).
This chapter examines modern humans from the same perspective asthe previous two chapters, focusing on the biological and behavioral unique-ness assigned to human beings. The final part of this chapter examines thequestion of how unique we are by comparing certain human behaviors (tooluse, culture, language) with similar behaviors seen in some living apes.
CHARACTERISTICS OF LIVING HUMANS
This section focuses on certain key features of modern humans, particularlyour brains, upright walking, teeth, reproductive patterns, physical growth,and social structure.
Distribution and EnvironmentHumans are the most widely distributed living primate species. As later chap-ters will outline, humans originally evolved in a tropical environment. Infact, much of our present-day biology reflects the fact that we are tropicalmammals. During the course of human evolution, however, we have ex-panded into many different environments. Biological adaptations have aidedhumans in new environments, such as cold weather and high altitude. Thecultural adaptations of humans have allowed even greater expansion. Todaythere is no place on the planet where we cannot live, given the appropriatetechnology. Humans can live in the frozen wastes of Antarctica, deep beneaththe sea, and in the vacuum of outer space. Our cultural adaptations have en-abled us to range far beyond our biological limitations. These adaptationshave also permitted incredible population growth. In the past, the planetsupported no more than a few million people at a hunting-and-gatheringlevel of existence (Weiss 1984). Today the population of the world is morethan 6 billion and continuing to grow. It is easily argued that the quality oflife is still low for much of the world’s human population, but there is nodoubting that our ability to learn and develop technology has led to im-mense potential for population expansion.
Brain Size and StructureOne very obvious biological characteristic of the human species is the largebrain. Our bulging and rounded skulls and flat faces contrast with these fea-
270 PART III ■ Our Place in Nature

Relethford: The Human Species: An Introduction to Biological Anthropology, 5/e
III. Our Place in Nature 10. The Human Species © The McGraw−Hill Companies, 2003
tures in other animals, including the rest of the hominoids. Whereas an ape’sskull is characterized by a relatively small brain and large face, modern hu-mans have relatively large brains and small faces.
Table 10.1 lists the brain size (in cubic centimeters) for a number of pri-mate species. There is a clear relationship between taxonomic status andbrain size: monkeys have the smallest brains, followed by the lesser apes, greatapes, and humans. Absolute brain size is not as useful a measure of intellec-tual ability because larger animals tend to have larger brains. Elephants andwhales, for example, have brains that are four to five times the size of the av-erage human brain.
An alternative way of looking at brain size is to express the weight of thebrain as a ratio of body weight. The larger this ratio, the larger the brain isrelative to body size. For humans, this ratio is 1/49 = 0.020. However, thisratio is not very useful: many other primates have larger ratios, but we tendnot to think of them as more intelligent (for example, the ratio for the squir-rel monkey is 1/31 = 0.032) (Passingham 1982).
Among mammals, however, the relationship of brain and body weight isnot linear. That is, as the body size increases, the brain size increases—butnot at the same rate. Differences in relative size because of disparate growthrates among various parts of the body (known as allometry) are common.Parts of the body grow at different rates. Brain size increases at a nonlinearrate with body size. For example, consider two species of primates in whichone species is twice the body weight of the other. If the ratio of brain size tobody size were linear, we would expect the brain size of the species with thelarger body size to be twice that of the smaller species. Actually, the brain sizeof the larger-bodied species is on average only 1.6 times as large. Because ofthis relationship, larger species appear to have smaller brain/body size ratios.
This allometric relationship between brain size and body size is quiteregular among almost all primates. The most notable exception is humans.We have brains that are three times the size we would expect for a primate of
CHAPTER 10 ■ The Human Species 271
TA B L E 10 .1 Brain Volume of Selected Living Primates (in Cubic Centimeters)
Primate Species Range Average
Macaque monkey 100Baboon 200White-handed gibbon 82–125 102Siamang 100–152 124Orangutan 276–540 404Gorilla 340–752 495Common chimpanzee 282–500 385Modern human 900–2000 1345
Source: Averages for macaque and baboon from Campbell(1985:233). Hominoid data from Tobias (1971:34–40), wherethe averages were taken as the means of males and females.
allometry The study of the change in proportion of various body parts as a consequence of differentgrowth rates.
I I I I I I I
Relethford: The Human Species: An Introduction to Biological Anthropology, 5/e
III. Our Place in Nature 10. The Human Species © The McGraw−Hill Companies, 2003
our body size (Figure 10.1). In addition, our brains have proportionatelymore cerebral cortex than other primate brains. The cerebral cortex is thepart of the brain involved in forming complex associations.
These comparisons are across different species. Humans are presumablysmarter than other primates because we have a much larger than expectedbrain size relative to our body. Does this relationship, however, apply to vari-ation within our species? That is, do differences in relative brain size amongliving humans translate to differences in intelligence (at least as assessedusing standard IQ tests)?
Most texts state there is no relationship between relative brain size andintelligence within the human species, although only a few studies are with-out methodological flaws. It is problematic, however, whether the fossilrecord of human evolution shows an increase in absolute and relative brainsize that corresponds to an increase in mental abilities. Could there be a rela-tionship between relative brain size and intelligence between species, but notwithin species? A study by Willerman and colleagues (1991) helps resolvesome of the conflict. They measured the brain size of 40 adults using mag-netic resonance imaging (MRI) and compared these values, adjusted for bodysize, with IQ test scores. Adjusting their results to the general population,they found a correlation of 0.35 between relative brain size and IQ scores (apositive correlation can take on a value from 0 to 1; the higher the value, thecloser the correspondence). Several other studies have shown similar results,with an average correlation between relative brain size and IQ of roughly 0.4.In statistical terms, this means that roughly 16 percent of the observed varia-tion in IQ is related to variation in relative brain size. (Without getting intothe technical details, this number is derived by squaring the correlation co-efficient and multiplying by 100—consult most any introductory statisticsbook for an explanation.)
If 16 percent of the observed variation in IQ is related to brain size, then84 percent of the observed variation in IQ is not related to brain size. Further,there is now evidence showing that the 16 percent figure is an overestimateof the actual relationship between brain size and IQ. P. Thomas Schoene-mann and colleagues (2000) note that the MRI studies are potentially con-
272 PART III ■ Our Place in Nature
FIGURE 10.1
Relationship between bodyweight and brain weight inprimates. The line indicates the average relationship among various primate speciesexcluding humans. The twodots show expected and observedbrain weight for humans. Ourbrains are three times theweight expected if we followedthe typical primate curve.(Source: Harvey et al. 1987)
Bra
in w
eigh
t (g)
0
200 40 60 80 100
200
600
400
800
1200
1000
1400
Observed brain weightfor humans
Expected brain weightfor humans
Body weight (kg)

Relethford: The Human Species: An Introduction to Biological Anthropology, 5/e
III. Our Place in Nature 10. The Human Species © The McGraw−Hill Companies, 2003
founded by environmental differences between families. That is, the correla-tion between brain size and IQ might be affected by environmental factorsthat vary from one family to the next. To get around this difficulty, they ana-lyzed correlations within families and found that the correlation betweengeneral IQ and brain size is close to zero. They acknowledge the possibilitythat correlations between brain size and cognitive tests could be very smalland still have an evolutionary impact over long periods of time. But thesecorrelations cannot be used to make any predictions regarding IQ in livinghumans. That is, differences in brain size between people today are not re-lated to differences in IQ scores.
Studies have also looked at the relationship among brain size, body size,and metabolism. Larger mammals have larger brain sizes and produce greateramounts of metabolic energy. Mammals show a great deal of variation, how-ever, in the amount of energy used by the brain. The brains of many mam-mals, such as dogs and cats, use from 4 percent to 6 percent of their bodymetabolism. Primate brains use a considerably greater proportion of energy;the Old World macaque uses 9 percent and modern humans use 20 percent(Armstrong 1983).
What does all this mean? The human brain is not merely large; it alsohas a different structure than in other primates, with the cortex being dis-proportionately larger. This difference in structure is also probably related tothe higher proportion of metabolic energy used by the human brain. Thebottom line is that brain size does not tell the whole story. Thus, the humanbrain is not only larger than the brain of a chimpanzee; it is also structurallydifferent. The increased convolution of the human cerebral cortex (the fold-ing of brain tissue) means that the brain of a human child with the samevolume of that of a chimpanzee has more cerebral cortex.
Discussion of brain size and its relationship to intellectual prowess hashistorically been part of debates about relative differences in the mental abil-ities of male and female humans. When absolute brain size is used to assessthese differences, male brains tend on average to be larger. This finding hasbeen used in the past to support ill-conceived beliefs in the mental superior-ity of males. However, as pointed out by Gould (1981), researchers did nottake into account the fact that body size is on average larger in human malesand that absolute brain size is closely related to body size. That is, men oftenhave larger brains because they tend to be larger overall. This fact, combinedwith an understanding of some of the methodological problems of earlierstudies, has led Gould to conclude there is no gender difference in relativebrain size or overall intellectual ability.
Certain studies, however, do indicate that average gender differences mayinfluence specific mental abilities. Falk (1992) has reviewed evidence that fe-males tend on average to score higher on tests of verbal ability and males toscore higher on tests of spatial and mathematical abilities. Falk suggests thatthese findings may be due to gender differences in patterns of brain lateraliza-tion. Of course, these tests and measures must be replicated cross-culturally toensure that various forms of bias are not responsible for such observed differ-ences (such as the fact that females in many cultures are actively discouraged
CHAPTER 10 ■ The Human Species 273

Relethford: The Human Species: An Introduction to Biological Anthropology, 5/e
III. Our Place in Nature 10. The Human Species © The McGraw−Hill Companies, 2003
from mathematics). Also, we must never forget that these results focus on average test scores and not on total distribution. Both male and female testscore distributions overlap each other. For example, some males score higherin verbal skills than some females. As with many comparisons of biology andbehavior between the sexes, we do not find exclusively separate distributions,but instead a great deal of overlap.
BipedalismAnother striking difference between humans and apes is the fact that hu-mans walk on two legs. We are bipedal (meaning “two legs”). This does notmean that apes cannot walk on two legs. They can, but not as well and not asoften. The physical structure of human beings shows adaptations for up-right walking as the normal mode of movement.
Humans are not the only animal that is routinely bipedal. The kangarooalso moves about on two legs but in a totally different manner from hu-mans. Consider walking in slow motion. What happens? First, you stand balanced on two legs. Then you move one leg forward. You shift your bodyweight so that your weight is transferred to the moving leg. As that legtouches the ground on its heel, all of your body weight has been shifted. Yourother leg is then free to swing forward. As it does so, you push off with yourother foot.
Human walking is more graceful than a slow-motion description sounds.The act of walking consists of alternating legs from swinging free to stand-ing still. We balance on one leg while the other leg moves forward to con-tinue our striding motion. We tend to take these acts for granted, but theyare actually quite complicated, requiring both balance and coordination. Forexample, when you pick up one leg to move it forward, what keeps your bodyfrom falling over?
Human bipedalism is made possible by anatomical changes involvingthe toes, legs, spine, pelvis, and muscles. In terms of actual anatomy, thesechanges are not major: after all, no bones are added or deleted; the samebones can be found in humans and in apes. The changes involve shape, posi-tioning, and function. The net effect of these changes, however, is dramatic.Humans can move about effectively on two legs, allowing the other limbs tobe free for other activities.
The feet of human beings reflect adaptation to bipedalism. The feet of ahuman and a chimp are shown in Figure 10.2. The big toe of the chimp sticksout in the same way that the thumb of all hominoids sticks out from theother fingers. The divergent big toe allows chimps to grasp with their feet.The big toe of the human is tucked in next to the other toes. When we walk,we use the nondivergent big toe to push off during our strides.
Our balance while we stand and walk is partly the result of changes inour legs. Figure 10.3 shows a human skeleton from the frontal view. Notethat the width of the body at the knees is less than the width of the body atthe hips. Humans are literally “knock-kneed.” Our upper leg bones (the fe-murs) slope inward from the hips. When we stand on one leg, the angle of
274 PART III ■ Our Place in Nature
bipedal Moving about on two legs. Unlike themovement of other bipedalanimals such as kangaroos,human bipedalism isfurther characterized by a striding motion.
I I I I I I I

Relethford: The Human Species: An Introduction to Biological Anthropology, 5/e
III. Our Place in Nature 10. The Human Species © The McGraw−Hill Companies, 2003
CHAPTER 10 ■ The Human Species 275
FIGURE 10.2
The skeletal structure of thefeet of a chimpanzee ( left) anda modern human (right). Notehow the big toe of the humanlies parallel to the other toes.
FIGURE 10.3
The modern human skeletonfrom a frontal view.
Cranial bones
Facial bones
MandibleClavicle
Sternum
Ribs
VertebraeSacrum
Femur
Patella
Tibia
Fibula
Scapula
Humerus
UlnaRadiusCarpals
MetacarpalsPhalanges
Tarsals
Metatarsals
Phalanges
Innominates

Relethford: The Human Species: An Introduction to Biological Anthropology, 5/e
III. Our Place in Nature 10. The Human Species © The McGraw−Hill Companies, 2003
the femur transmits our weight directly underneath us. The result is that wecontinue to be balanced while one leg is moving. In contrast, the angle of anape femur is very slight. The legs of an ape are almost parallel from hips tofeet. When an ape stands on two legs and moves one of them, the ape is offbalance and tends to fall toward one side (more so than humans, because wecompensate more quickly). When an ape walks on two legs, it must shift itswhole body weight over the supporting leg to stay on balance. This shiftingexplains the characteristic waddling when apes walk on two legs.
The human spine also allows balance when we walk upright (Figure 10.4).The spinal column of humans is vertical, allowing weight to be transmitteddown through the center of the body. In knuckle-walking apes, the spine isbent in an arc so that when the apes stand on two legs, the center of gravityis shifted in front of the body. The ape is off balance and must compensategreatly to stay upright. What is difficult for apes is easy for humans. Thehuman spine is vertical but not straight. It curves in several places, allowingit to absorb the shocks occurring while we walk.
The human pelvis is shaped differently from an ape pelvis (Figure 10.5).It is shorter top to bottom and wider side to side. The sides of the pelvis arebroader and flair out more to the sides, providing changes in muscle attach-ment that permit striding bipedalism. The shortness of the human pelvis al-lows greater stability when we stand upright.
The changes in the human pelvis also involve changes in the positioningof various muscles. For example, certain leg muscles attach more on the sidesof the pelvis. This change allows humans to maintain their balance while
276 PART III ■ Our Place in Nature
FIGURE 10.4
Side view of the skeletons of a chimpanzee ( left) and amodern human (right),illustrating the shape andorientation of the spine. (Adaptedwith permission from BernardCampbell, Human Evolution, 3rded., New York: Aldine de Gruyter, © 1985 Benard Campbell)

Relethford: The Human Species: An Introduction to Biological Anthropology, 5/e
III. Our Place in Nature 10. The Human Species © The McGraw−Hill Companies, 2003
standing without having to bend their knees. The gluteus minimus and glu-teus medius muscles have also shifted position relative to apes, allowing thepelvis to remain stable when one leg is lifted during walking.
Canine TeethAs we saw in Chapter 8, human canine teeth are different from canine teethin many other mammals. Human canines are small and do not project be-yond the level of the other teeth. Human canine teeth serve much the samefunction as the incisor teeth.
That we have small nonprojecting canines has led to much speculationconcerning causes and effects of human evolution. Given that canine teethserve as weapons in many primate species, the lack of large canine teeth inhumans seems to imply that we do not need them for weapons anymore. Onescenario is that when human ancestors began using tools, they no longer re-quired large canines. As you will see in later chapters, the uniqueness of humancanine teeth is a more complex topic than we once thought.
Sex and ReproductionWe humans consider ourselves the sexiest primates. That is, we are more con-cerned with sex than is any other primate. The fact that humans do not havethe estrus cycle has often been cited as a unique aspect of human sexuality. Forthe most part, temperate-zone domestic animals breed only during certainseasons and mate around the time of ovulation. Human females, in contrast,cycle throughout the year and often mate at any time during the cycle. Thisdistinction between humans and other primates may not be as clear as oftensuggested. Orangutans, for example, also lack an estrus cycle. Bonobos do havean estrus cycle but have been observed to mate outside of it to some extent.
CHAPTER 10 ■ The Human Species 277
FIGURE 10.5
The trunk skeletons of achimpanzee ( left) and amodern human (right) drawnto the same size. Note theproportionately shorter andwider pelvis of the humanbeing, reflecting adaptations to upright walking (see text).(Adapted with permission fromBenard Campbell, HumanEvolution, 3rd ed., New York:Aldine de Gruyter, © 1985 BenardCampbell)

Relethford: The Human Species: An Introduction to Biological Anthropology, 5/e
III. Our Place in Nature 10. The Human Species © The McGraw−Hill Companies, 2003
Much has been made of the fact that humans have sexual relations whilefacing each other (the so-called missionary position), whereas other primatestypically engage in sex with the male behind the female. One explanation isthat there is some social benefit to facing each other during sexual intercourse;it is said to increase emotional bonds between male and female. A problemwith this suggestion is that most studies of human sexual behavior havefound that humans engage in a wide variety of sexual positions. Though themissionary position has been cited as the most common sexual position forcertain societies at certain times, it is not the most common everywhere.Human bipedal anatomy may influence the fact that humans use the mis-sionary position, whereas other primates rarely use it. The changes in thehuman pelvis have shifted the position of the vagina so that the missionaryposition is easier to attain. Apes rarely have sex in this manner simply be-cause it is not comfortable for them. An exception is the bonobo, which hasbeen observed to have sexual intercourse face to face.
Some authors claim that female orgasm is unique in human beings andhave constructed a number of explanations for this fact. There is growing evidence, however, that nonhuman primate females also experience orgasm(de Waal 1995; Jolly 1985).
Human females have relatively large breasts, whereas other primate fe-males do not. One hypothesis is that large breasts developed to resemble but-tocks. Given that face-to-face sex is desirable in reinforcing emotional bondsand that males prefer the buttocks (both questionable assumptions), largebreasts would serve to attract human males to the female’s front. Anothersuggestion is that large breasts in human females is a by-product of the evo-lution of fat in human females. Fat reserves are important for females inhunting-and-gathering societies because fat is stored energy that can be usedfor reproduction in times of food shortage. It has been hypothesized thathormonal changes accompanying increased fat reserves led to increased breastsize in human females (Mascia-Lees et al. 1986). Pawlowski (1999) has alsosuggested that permanent breast enlargement in humans was a by-productof increased selection for subcutaneous fat but for a different reason. Ac-cording to Pawlowski, increased amounts of subcutaneous fat served as in-sulation against the cool nights that occurred even in tropical Africa. Thishypothesis views the increase in subcutaneous fat as a replacement for densehair that has disappeared during the course of human evolution. Althoughreasonable, these hypotheses still need to be tested.
Another unique feature of human sexual anatomy is the large relativesize of the penis in males. Both penis and testes size varies among apes andhumans, with chimpanzees having the largest testes of any hominoid species,as expected given their polygamous mating patterns (see Chapter 9). Humanshave the longest erect penises of all hominoids (Diamond 1992b), but nosatisfactory evolutionary reason has been proposed. Some have argued thatthe long penis serves some sort of display function when threatening othermales or marks status, but there is no supporting evidence for this.
The human pattern of reproduction is basically the same as that of mostprimates: single births. Unlike apes, humans have additional infants before
278 PART III ■ Our Place in Nature

Relethford: The Human Species: An Introduction to Biological Anthropology, 5/e
III. Our Place in Nature 10. The Human Species © The McGraw−Hill Companies, 2003
the previous offspring have grown up socially or physically. Because of cul-tural adaptations, humans have increased reproduction without sacrificingparental care. Compared to apes, a greater proportion of the human life cycleis taken up by physical and social growth prior to maturity. Consider, for ex-ample, that a chimpanzee is sexually mature at about 10 years and lives roughly40 years ( Jolly 1985). This means that approximately 25 percent of the chimp’slife is spent growing up. Further consider that a human matures at about 15 years and that throughout most of history and prehistory, we estimate thathumans had an average length of life of roughly 20 to 30 years. Compared toother primates, we mature more slowly and require a greater amount of ourlife for growing and learning. This logic may seem strange, because the aver-age life expectancy at birth today in the United States is approximately 77years, not 30. However, keep in mind that our relatively long life is neitheruniversal nor very old. Most of the increase in our average length of life hascome only in the past century or so (see Chapter 15).
Social StructureHuman social structure is a topic of almost infinite complexity. One obser-vation is obvious—there is extensive variation. Because variation in socialstructure is great even among monkeys and apes, it should come as no sur-prise that humans also show considerable variation.
A common Western assumption is that the “normal” social structure ofhuman beings is the nuclear monogamous family group: mother, father, andchildren. Actually, the majority of human societies studied have a stated pref-erence for polygyny—a pattern in which one husband has several wives (Har-ris 1987)—and a few cultures practice polyandry, in which one woman hasseveral husbands. Because of this, anthropologists have often argued thatthe basic human pattern is polygyny. However, it must be noted that althoughmany societies state a preference for polygyny, it is still much more commonfor men to have a single wife. In many cases, only the most wealthy or power-ful have multiple wives. Helen Fisher (1992) concludes that for all practicalpurposes monogamy is the predominant marriage pattern for humans (al-though with considerable infidelity in many societies). Clearly it is necessaryto consider the difference between stated cultural ideals and actual practices.
Humans show a great deal of variation in other aspects of their cultureas well, such as economic systems, political systems, and legal systems. Thedramatic changes in such institutions in the past 12,000 years—since the ori-gin of agriculture (see Chapter 14)—shows exactly how variable our species’behavior can be. During this time, humans developed state-level societies, so-cial stratification, formal legal codes, and many other aspects of culture thatwe take for granted today. Biological needs, such as for food and sex, placesome limits on our behavior. One such limitation is the need for a family ofsome sort to care for dependent children. All humans live in families, althoughthe actual structure can vary considerably depending on circumstances andtradition, including nuclear families, extended families, monogamous andpolygamous marriage, single-parent families, and same-sex families.
CHAPTER 10 ■ The Human Species 279
polygyny A form ofmarriage in which a husbandhas several wives.
polyandry A form ofmarriage in which a wife has several husbands.
I I I I I I I

Relethford: The Human Species: An Introduction to Biological Anthropology, 5/e
III. Our Place in Nature 10. The Human Species © The McGraw−Hill Companies, 2003
THE HUMAN LIFE CYCLE
The major stages of growth and development are prenatal (before birth) andpostnatal (after birth). The general nature of these two stages is reviewed briefly,followed by consideration of what is unique about human growth.
Prenatal GrowthPrenatal life is the period from fertilization through childbirth. After fertil-ization, the fertilized egg (zygote) develops into a cluster of identical cellsderiving from the initial fertilized egg. During the first week, the fertilizedegg multiplies as it travels into the uterus. By this time, there are roughly150 cells arranged in a hollow ball that implants itself into the wall of theuterus. Cell differentiation begins. During the second week, the outer layerof this ball forms the beginning of the placenta. Some early differentiationof cells can be seen in the remainder of the ball.
The embryonic stage stretches from roughly two to eight weeks afterconception. The embryo is very small during this time, reaching an averagelength of 25 mm (1 in.) by the eighth week. During this time, the basic bodystructure is completed and many of the different organ systems develop; theembryo has a recognizably human appearance, although it is still not com-plete (Figure 10.6). The fetal stage lasts from this point until birth. Develop-ment of body parts and organ systems continues, along with a tremendousamount of body growth and changes in proportions. During the secondtrimester of pregnancy, the fetus shows rapid growth in overall length. Dur-
280 PART III ■ Our Place in Nature
FIGURE 10.6
A 2-month-old embryo. Thefingers have developed and theeye is oval in shape. The totalbody length at this stage is 3.18 cm (1.25 in.). (© LennartNilsson/Albert Bonniers Förlag AB)
zygote A fertilized egg.
embryo The stage ofhuman prenatal life lastingfrom roughly two to eightweeks following conception;characterized by structuraldevelopment.
fetus The stage of humanprenatal growth fromroughly eight weeksfollowing conception until birth; characterized by further development and rapid growth.
I I I I I I I

Relethford: The Human Species: An Introduction to Biological Anthropology, 5/e
III. Our Place in Nature 10. The Human Species © The McGraw−Hill Companies, 2003
ing the third trimester, the fetus shows rapid growth in body weight, headsize, and brain growth.
The Pattern of Human Postnatal GrowthWe can identify five basic stages in growth from birth until adulthood (Bogin1999, 2001). The first stage, infancy, refers to the time from birth until wean-ing (typically up to 3 years in nonindustrialized societies) and is charac-terized by rapid growth. The second stage, childhood, refers to the time fromweaning until the end of growth in brain weight, which takes place at about7 years (Cabana et al. 1993). The juvenile stage is from this point until the be-ginning of the fourth stage, adolescence, which is the time of sexual matura-tion and a spurt in body growth. Adolescence begins at about age 10 in fe-males and age 12 in males, although there is considerable variation acrosspeople and populations. The fifth stage is labeled adulthood.
Human growth is usually studied by looking at growth curves. One typeof growth curve, the distance curve, is a measure of size over time—it showshow big someone is at any given age. Figure 10.7 is a typical distance curvefor human height. As we all know, until you reach adulthood, the older youget, the taller you get. However, note that this is not a straight line—you donot grow the same amount each year. This shows that the rate of body growthis not the same from year to year. Changes in the rate of growth are best il-lustrated by a velocity curve, which plots the rate of change over time. Thedifference between a distance curve and velocity curve can be illustrated by asimple analogy—driving a car. Imagine driving a car on a highway betweentwo cities. How far you have come is your distance, and how fast you are goingis your velocity.
CHAPTER 10 ■ The Human Species 281
FIGURE 10.7
Typical distance curve forhuman height. (Adapted fromGrowth and Developmentby Robert M. Malina, © 1975,publisher Burgess PublishingCompany, Minneapolis, MN,modified as per Bogin 1995a)
180
Hei
ght (
cm)
40
160
140
120
100
80
60
Infa
ncy
Chi
ldho
od
Juve
nile
Ado
lesc
ence
Adu
lthoo
d (m
atur
ity)
20
Age (years)
181614121086420
distance curve A measureof size over time, for example,a person’s height at differentages.
velocity curve A measure ofthe rates of change in growthover time.
I I I I I I I

Relethford: The Human Species: An Introduction to Biological Anthropology, 5/e
III. Our Place in Nature 10. The Human Species © The McGraw−Hill Companies, 2003
A typical velocity curve for human height is shown in Figure 10.8. Therate of growth is greatest immediately after birth, followed by a rapid decel-eration during infancy. Even though the rate of growth decreases, we stillcontinue to grow. Referring again to the car analogy, if you decelerate from 50 miles per hour to 30 miles per hour, you are still going forward, although
282
S P E C I A L T O P I C
Should Infants Sleep with Their Parents? An Evolutionary ViewExamination of presumed unique characteristics of hu-mans is complicated by the fact that we often attempt to draw species-wide conclusions based on the behaviorsof one or more select groups. This becomes particularlyproblematic when making species-wide statements basedon contemporary Western culture. This approach has twoproblems. First, it ignores cultural variation among therest of our species, making it difficult at best to deter-mine if the way we do things is actually characteristic ofour species as opposed to being specific to our culture.Second, the world has changed considerably over the past century or so (see Chapter 15); what we find perfectlynormal in today’s world may not actually characterize the long-term patterns of our species. Failure to acknowl-edge variation across cultures and time can lead to inac-curate portrayals of humanity.
An example of this problem is how different groupsdeal with sleeping infants at night. A common pattern inWestern cultures is to have infants sleep separately fromtheir parents at night in their own cribs. This contrastswith the sleeping patterns of nonhuman primates, wheremothers and infants sleep together. Is the nighttime sepa-ration of mothers and infants a unique human character-istic? If so, then one wonders why this behavior evolved in our species, given the importance of the mother–infantbond across the entire primate order.
If we examine human cross-cultural patterns ininfant sleeping, it turns out that the Western pattern ofseparate sleeping is not typical. Some form of cosleeping,either in the same bed or in the same room, is character-istic of the majority of human cultures (Mosko et al.1997). Separate sleeping is only a century or two old andis not characteristic of human behavior in general but isinstead a recent change. During the 1960s, American par-ents were often encouraged to have infants sleep apartfrom them under the view that infant sleeping practicesshould accommodate the needs of the parent and not the child (Small 1992).
The reduction of parent–infant cosleeping appearsto have some serious implications for the health of the
infant. In addition to breaking from a basic primate pat-tern of close bonding, there is also suggestive evidencethat infant sleeping patterns are related to the incidenceof Sudden Infant Death Syndrome (SIDS), the leadingcause of nonaccidental death in infants under 1 year of age in industrialized nations (McKenna 1996). SIDS(also known as crib death) occurs in otherwise healthyinfants during sleep; many cases are related to ceasing to breathe.
By the mid-1990s it was realized that infant sleeppatterns could have a dramatic effect on the frequency of SIDS. McKenna (1996) reports that the simple changein having infants sleep on their backs rather than ontheir stomachs could reduce SIDS rates by as much as 90 percent. McKenna and colleagues suggest that SIDSmay also be related to the presence or absence of parent–infant cosleeping. When sleeping together, the breath-ing of the parent and infant affect one another; when the parent rouses during sleep, the infant tends to do thesame. The interaction between parent and infant breath-ing may prevent situations where the infant is less likelyto recover from a disruption of normal breathing, there-fore decreasing the probability of SIDS. Observations of mothers and infants sleeping together suggest thatsleeping together also minimizes the chances that aninfant will lay on its stomach, thus also lowering thelikelihood of SIDS. Close proximity of mother and in-fant also increases low-level exposure of carbon dioxideemitted from the mother, which in turn appears to stim-ulate infant respiration (Mosko et al. 1997). Anotheradvantage of cosleeping is increased nocturnal breast-feeding, which has also been linked to a decrease in SIDS(McKenna 1996).
These studies show us that human behavior changesquickly, and what is normal or accepted for a given cul-ture may not be characteristic of our entire species. Further,the proposed links between sleeping patterns and SIDSshow that recent cultural changes, which may be adaptivefrom the point of view of parental comfort, may not behealthy for infants.
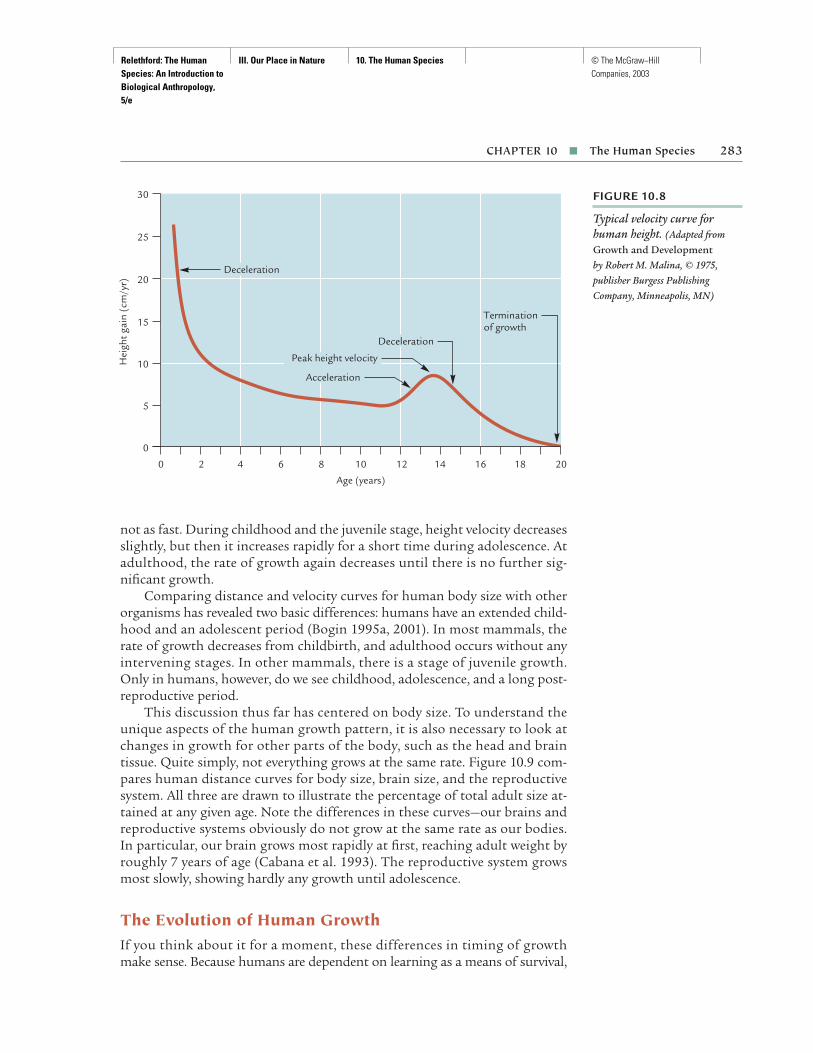
Relethford: The Human Species: An Introduction to Biological Anthropology, 5/e
III. Our Place in Nature 10. The Human Species © The McGraw−Hill Companies, 2003
not as fast. During childhood and the juvenile stage, height velocity decreasesslightly, but then it increases rapidly for a short time during adolescence. Atadulthood, the rate of growth again decreases until there is no further sig-nificant growth.
Comparing distance and velocity curves for human body size with otherorganisms has revealed two basic differences: humans have an extended child-hood and an adolescent period (Bogin 1995a, 2001). In most mammals, therate of growth decreases from childbirth, and adulthood occurs without anyintervening stages. In other mammals, there is a stage of juvenile growth.Only in humans, however, do we see childhood, adolescence, and a long post-reproductive period.
This discussion thus far has centered on body size. To understand theunique aspects of the human growth pattern, it is also necessary to look atchanges in growth for other parts of the body, such as the head and braintissue. Quite simply, not everything grows at the same rate. Figure 10.9 com-pares human distance curves for body size, brain size, and the reproductivesystem. All three are drawn to illustrate the percentage of total adult size at-tained at any given age. Note the differences in these curves—our brains andreproductive systems obviously do not grow at the same rate as our bodies.In particular, our brain grows most rapidly at first, reaching adult weight byroughly 7 years of age (Cabana et al. 1993). The reproductive system growsmost slowly, showing hardly any growth until adolescence.
The Evolution of Human GrowthIf you think about it for a moment, these differences in timing of growthmake sense. Because humans are dependent on learning as a means of survival,
CHAPTER 10 ■ The Human Species 283
FIGURE 10.8
Typical velocity curve forhuman height. (Adapted fromGrowth and Developmentby Robert M. Malina, © 1975,publisher Burgess PublishingCompany, Minneapolis, MN)
30
Hei
ght g
ain
(cm
/yr)
0
20
Age (years)
181614121086420
25
20
15
10
5
Termination of growth
Acceleration
Peak height velocity
Deceleration
Deceleration
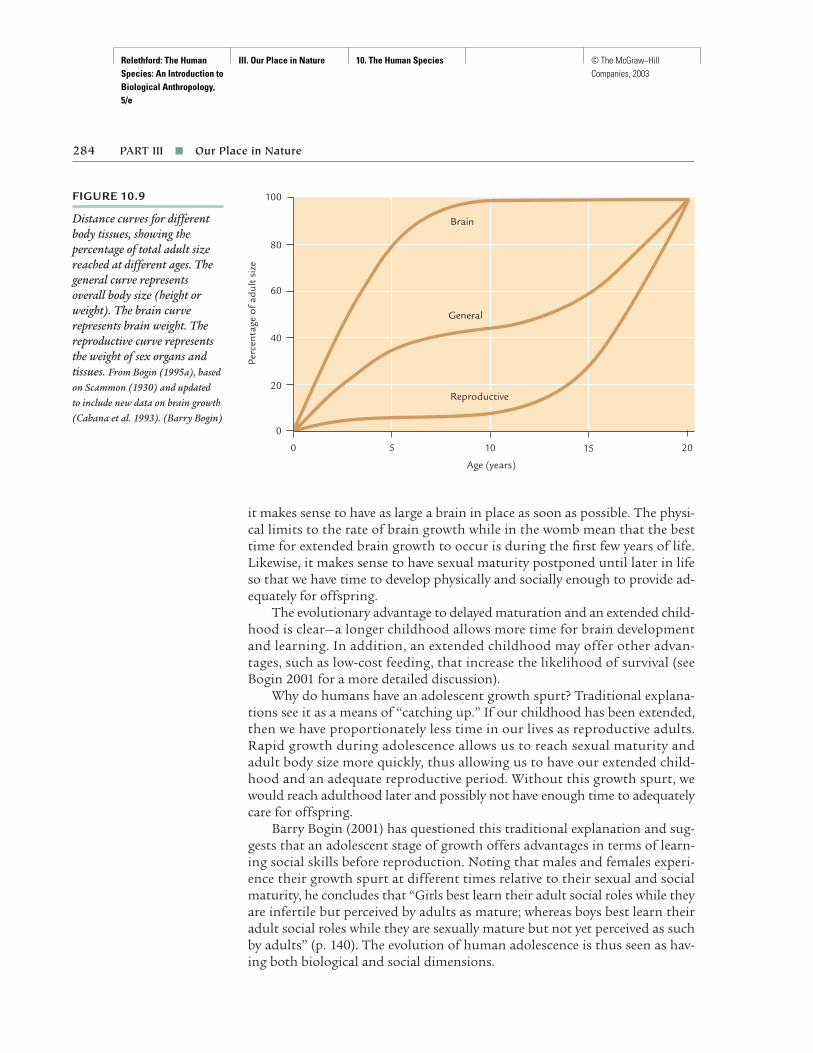
Relethford: The Human Species: An Introduction to Biological Anthropology, 5/e
III. Our Place in Nature 10. The Human Species © The McGraw−Hill Companies, 2003
it makes sense to have as large a brain in place as soon as possible. The physi-cal limits to the rate of brain growth while in the womb mean that the besttime for extended brain growth to occur is during the first few years of life.Likewise, it makes sense to have sexual maturity postponed until later in lifeso that we have time to develop physically and socially enough to provide ad-equately for offspring.
The evolutionary advantage to delayed maturation and an extended child-hood is clear—a longer childhood allows more time for brain developmentand learning. In addition, an extended childhood may offer other advan-tages, such as low-cost feeding, that increase the likelihood of survival (seeBogin 2001 for a more detailed discussion).
Why do humans have an adolescent growth spurt? Traditional explana-tions see it as a means of “catching up.” If our childhood has been extended,then we have proportionately less time in our lives as reproductive adults.Rapid growth during adolescence allows us to reach sexual maturity andadult body size more quickly, thus allowing us to have our extended child-hood and an adequate reproductive period. Without this growth spurt, wewould reach adulthood later and possibly not have enough time to adequatelycare for offspring.
Barry Bogin (2001) has questioned this traditional explanation and sug-gests that an adolescent stage of growth offers advantages in terms of learn-ing social skills before reproduction. Noting that males and females experi-ence their growth spurt at different times relative to their sexual and socialmaturity, he concludes that “Girls best learn their adult social roles while theyare infertile but perceived by adults as mature; whereas boys best learn theiradult social roles while they are sexually mature but not yet perceived as suchby adults” (p. 140). The evolution of human adolescence is thus seen as hav-ing both biological and social dimensions.
284 PART III ■ Our Place in Nature
FIGURE 10.9
Distance curves for differentbody tissues, showing thepercentage of total adult sizereached at different ages. Thegeneral curve representsoverall body size (height orweight). The brain curverepresents brain weight. Thereproductive curve representsthe weight of sex organs andtissues. From Bogin (1995a), basedon Scammon (1930) and updated to include new data on brain growth(Cabana et al. 1993). (Barry Bogin)
Age (years)
Brain
General
Perc
enta
ge o
f adu
lt si
ze
0
0
5 10 15 20
80
100
60
40
20Reproductive

Relethford: The Human Species: An Introduction to Biological Anthropology, 5/e
III. Our Place in Nature 10. The Human Species © The McGraw−Hill Companies, 2003
MenopauseMenopause is the permanent cessation of menstrual cycles that occurs be-fore the aging of other body systems and before the end of the average lifespan. Other mammals show a decline in reproductive function with age, butthis is not usually considered menopause because it occurs near the end oflife or is associated with the decline in other body functions. As defined here,menopause has been found only in humans and in one species of toothedwhales (Pavelka and Fedigan 1991; Peccei 2001). Menopause is universalamong human societies and generally occurs at about 50 years of age in in-dustrialized populations and somewhat earlier in nonindustrialized popula-tions (Bogin and Smith 1996).
A continuing question concerns the origin of menopause in humans. Isit adaptive (that is, shaped by natural selection) or a by-product of other bio-logical processes? Adaptive explanations generally focus on the presumedbenefits of a mother living past her reproductive years. One model, known asthe “mother hypothesis,” suggests that rather than having additional chil-dren, it makes more sense for a woman to invest time and energy in her exist-ing children for the remainder of her life, thus increasing their probability ofsurvival. After a certain point in life, the odds are against a mother living longenough to raise her children. One variant of this model extends the adaptivebenefit of menopause to the next generation. This explanation, known as the“grandmother hypothesis,” suggests that menopause evolved to provide aperiod for females to help take care of their slow-growing and big-brainedgrandchildren. Peccei (2001) argues that the “mother hypothesis” is morelikely to be true than the “grandmother hypothesis” but notes that the evi-dence is inconclusive and testing difficult. Other researchers have argued thatmenopause is not the result of natural selection but instead represents a by-product of the aging process. Lynnette Leidy (1998), for example, has suggestedthat menopause is simply the result of humans living beyond their egg supply.
IS HUMAN BEHAVIOR UNIQUE?
Humans and apes show a great many similarities, as well as a great many dif-ferences. When we ask whether humans are unique, we do not suggest thatwe cannot tell an ape and a human apart. Rather, we ask what the extent ofthese differences is. Are the behaviors of apes and humans completely differ-ent, or are differences present only in the expression of specific behaviors?Can we say, for example, that humans make tools and apes do not? Or shouldwe say instead that there are differences in the ways in which these twogroups make and use tools?
According to the view that apes and humans show distinct and majordifferences, humans possess culture and apes do not. Any cultural behaviorsfound in apes are labeled as fundamentally different from human culturalbehaviors. According to the view that ape–human differences are variationson something that is fundamentally similar, both humans and apes possess
CHAPTER 10 ■ The Human Species 285
menopause The permanentcessation of menstrual cycles.
I I I I I I I

Relethford: The Human Species: An Introduction to Biological Anthropology, 5/e
III. Our Place in Nature 10. The Human Species © The McGraw−Hill Companies, 2003
culture—the only difference being that humans rely more on culture or thathumans have a more developed culture. This debate is semantic to a large ex-tent. A more worthwhile approach is to examine some of the suggested dif-ferences between apes and humans in an effort to determine what is trulydifferent.
Tool Use and ManufactureTool use has often been cited as a unique human behavior. As defined here, atool is an object that is not part of the animal. Human tools include pencils,clothes, eating utensils, books, and houses. All of these are objects that arenot part of the biological organism (humans) but are used for a specific pur-pose. Tool use, however, does not seem to be even a unique primate character-istic. Birds use sticks for nests, and beavers use dirt in their dams. Both sticksand dirt can be considered tools by this definition.
A more common definition of modern humans focuses on humans astoolmakers (this definition is complicated by the fact that the earliest homi-nids may not have made tools—see Chapter 12). The key element of this defi-nition is that some object is taken from the environment and modified tomeet a new function. Humans take trees to make lumber to build houses. Itcan be argued that birds modify sticks and beavers modify dirt, but tool man-ufacture implies something different. Birds, for example, use sticks for build-ing nests, but they do not use these sticks for defensive or offensive weapons.Humans, however, can take sticks and use them to make shelters, defend them-selves, hunt, dig up roots, and draw pictures in the sand. When we discuss toolmanufacture, we mean the new and different ways to modify an object for atask. Humans can apply the same raw materials to a variety of tasks.
In this sense, tool manufacture has long been considered a unique humanactivity. But research on apes, particularly Goodall’s work on chimpanzees,has since shown that this is not true. Apes make and use tools. Though theirtools are extremely simple by modern human standards, it is clear that thedifference between apes and humans cannot be reduced to humans makingtools and apes not making tools. Differences exist in the method and use ofmanufactured tools, but not in the presence or absence of toolmaking.
Chimpanzee Termite Fishing In the early 1960s, Jane Goodall reported aremarkable finding—chimpanzees were making and using tools! Thoughchimpanzees are predominantly fruit eaters, they also enjoy a variety of otherfoods, including termites. One group of chimpanzees demonstrated a methodfor capturing termites. They took a grass stem or a stick, went up to a ter-mite mound, and uncovered one of the entrance holes left by the termites.They inserted the stick into the hole, twirled the stick a bit to attract termitesdown in the mound, and then withdrew the stick. Termites had attachedthemselves to the stick, and the chimpanzees ate them directly off the stick(Figure 10.10).
Close analysis of this “termite fishing” behavior shows it to be true toolmanufacture along with rather complex tool use. Chimpanzees often spent a
286 PART III ■ Our Place in Nature
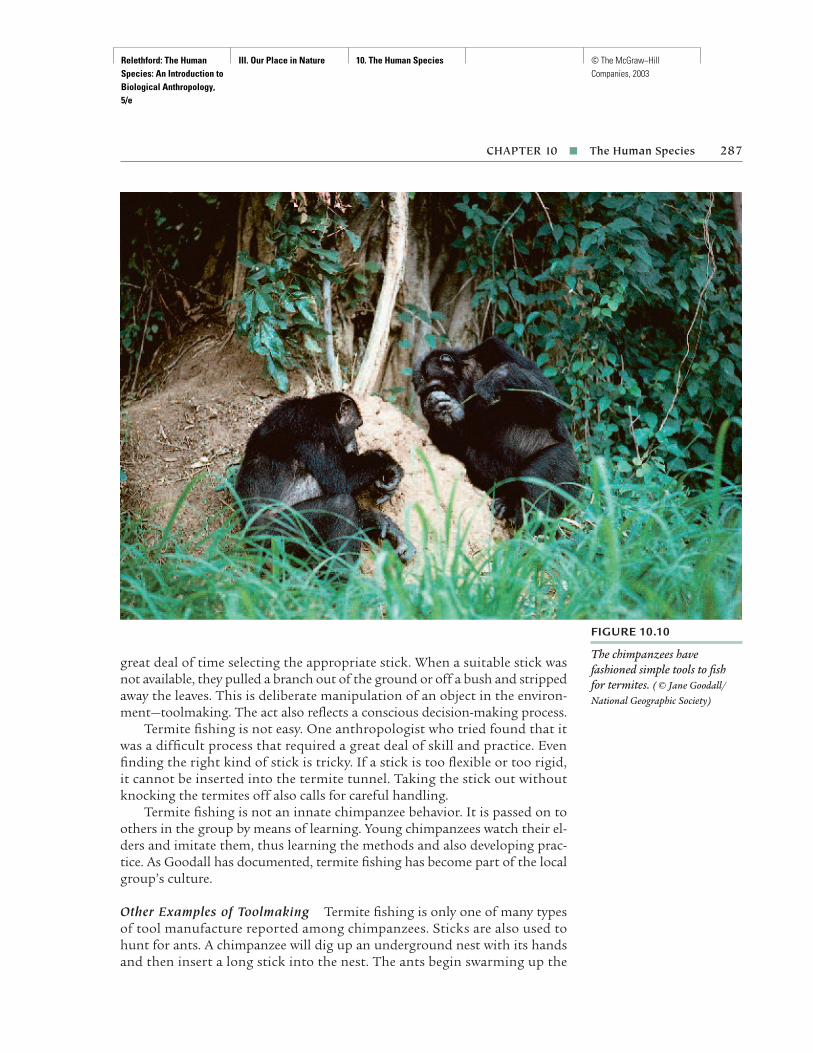
Relethford: The Human Species: An Introduction to Biological Anthropology, 5/e
III. Our Place in Nature 10. The Human Species © The McGraw−Hill Companies, 2003
great deal of time selecting the appropriate stick. When a suitable stick wasnot available, they pulled a branch out of the ground or off a bush and strippedaway the leaves. This is deliberate manipulation of an object in the environ-ment—toolmaking. The act also reflects a conscious decision-making process.
Termite fishing is not easy. One anthropologist who tried found that itwas a difficult process that required a great deal of skill and practice. Evenfinding the right kind of stick is tricky. If a stick is too flexible or too rigid, it cannot be inserted into the termite tunnel. Taking the stick out withoutknocking the termites off also calls for careful handling.
Termite fishing is not an innate chimpanzee behavior. It is passed on toothers in the group by means of learning. Young chimpanzees watch their el-ders and imitate them, thus learning the methods and also developing prac-tice. As Goodall has documented, termite fishing has become part of the localgroup’s culture.
Other Examples of Toolmaking Termite fishing is only one of many typesof tool manufacture reported among chimpanzees. Sticks are also used tohunt for ants. A chimpanzee will dig up an underground nest with its handsand then insert a long stick into the nest. The ants begin swarming up the
CHAPTER 10 ■ The Human Species 287
FIGURE 10.10
The chimpanzees havefashioned simple tools to fish for termites. ( © Jane Goodall/National Geographic Society)

Relethford: The Human Species: An Introduction to Biological Anthropology, 5/e
III. Our Place in Nature 10. The Human Species © The McGraw−Hill Companies, 2003
stick, and the chimpanzee withdraws it to eat the ants. Sticks have also beenused to probe holes in dead wood and to break into bee nests (Goodall 1986).
In addition, chimpanzees have been observed making sponges out ofleaves. After a rainfall, a chimpanzee often drinks out of pools of water thatcollect in the holes of tree branches. Often the holes are too small for thechimp to fit its head into, so the chimp creates a tool to soak up the water:he takes a leaf, puts it into his mouth, and chews it slightly. (Chewing in-creases the ability of the leaf to absorb water.) The chimp inserts this “sponge”into the hole in the branch to soak up the water.
Other examples of chimpanzee toolmaking and tool use include usingleaves as napkins and toilet paper, using sticks as weapons, using branchesand rocks to crack open nuts, and using a bone pick to dig out marrow froma bone, among others (Goodall 1986, McGrew 1992).
An interesting finding is that bonobos do not engage in tool use in theirnative environments to any great extent. Although a captive bonobo has beentaught to make stone tools (Savage-Rumbaugh and Lewin 1994), the onlyobservation of bonobo tool use in the wild has been the use of leafy twigs asshelter from the rain (McGrew 1992). Recent observations in Sumatra showthat, although rare, orangutans also use tools (van Schaik and Knott 1998).
Human and Chimpanzee Toolmaking It is obvious that chimpanzees makeand use tools in a systematic manner. It is also clear that they use genuineproblem-solving abilities in their toolmaking. They see a problem (e.g., ter-mites in the mound) and create a tool to solve the problem. The implication ofthese studies is that we can no longer define humans as the only toolmakers.
This does not imply that there are no differences between human andchimpanzee toolmaking. Humans, for example, save their tools and use themagain, whereas chimpanzees start over each time (an exception is saving rocksthat were used to crack open nuts). Chimpanzees who “fish” for termites donot save the sticks they have made. Humans also have a more elaborate tech-nology, using tools to make other tools.
Regardless of these specific differences, it is clear that we cannot definemodern humans solely in terms of the ability to make tools. The observationsmade by Goodall and others regarding chimpanzee tool manufacture havecaused us to redefine human behavior and reconsider our relationship withthe apes. We now acknowledge much closer genetic and behavioral similari-ties than was the case in the middle of the twentieth century.
Do Chimpanzees Have Culture?Observations of chimpanzee toolmaking have narrowed the perceived gapbetween humans and apes. Our understanding of the ways in which thesebehaviors develop and are passed on from one generation to the next throughlearning (recall the infant chimpanzee watching the adults fish for termites)has led to an interesting question: Is this cultural behavior?
A growing body of evidence suggests that a number of nonhuman spe-cies exhibit cultural behavior. That is, certain behaviors are shared among a
288 PART III ■ Our Place in Nature

Relethford: The Human Species: An Introduction to Biological Anthropology, 5/e
III. Our Place in Nature 10. The Human Species © The McGraw−Hill Companies, 2003
group and are transmitted from one generation to the next through learningrather than genetically. Certain species of whales and birds, for example, havecharacteristic songs that are transmitted culturally (e.g., Noad et al. 2000). Inaddition, as noted in Chapter 8, one group of Japanese macaques developedthe sweet-potato washing behavior. It has been argued, however, that thesecases are not conclusive demonstrations of culture because they concern onlya single behavior, whereas human culture is characterized by a combinationof behavior patterns (de Waal 1999).
In 1999, Andrew Whiten and colleagues published a landmark review ofcultural behavior in chimpanzees based on observations made in seven chim-panzee communities. They examined 65 different behaviors in an effort tofind behaviors that were specific to some, but not all, communities. Theirgoal was to identify a set of behaviors in some communities that were notseen species-wide. Of the 65 behaviors, 26 were excluded because they wererare in all communities, could be explained by local ecological conditions(e.g., no termites to fish), or were present in all communities, suggestingspecies-wide behaviors best explained by genetic rather than cultural trans-mission. The remaining 39 behaviors were found in high frequencies in some,but not all, communities and were therefore likely to be examples of localculture. For example, ant-fishing using a probe was found in four communi-ties but was absent in the other three. Picking marrow out of bones wasfound in one community but not the other six.
This study confirmed earlier work (e.g., McGrew 1992) showing thatmany chimpanzee behaviors are not species-wide but are confined to specificcommunities and passed on to each generation culturally. Further, some be-haviors were found to be unique to a single community, whereas others werefound in two or more communities. In addition, the cultural profiles of eachcommunity were distinct from others, a pattern typical of human culturesand unlike that found in other species.
The answer to the question “Do chimpanzees have culture?” now appearsto be “Yes.” As noted by primatologist Frans de Waal (1999) in a commen-tary on the Whiten et al. paper, “The ‘culture’ label befits any species, such asthe chimpanzee, in which one community can readily be distinguished fromanother by its unique suite of behavioral characteristics. Biologically speaking,humans have never been alone—now the same can be said of culture” (p. 636).Although there are differences between human and chimpanzee culture, suchas the use of language in the former, this is a difference of degree and not adifference in kind (McGrew 1998). Of course, these conclusions depend onthe definition of culture being used. Some anthropologists prefer to use a morespecific definition that could exclude apes.
Language CapabilitiesLanguage has long been considered a unique human property. Language isnot merely communication but rather a symbolic form of communication.The nonhuman primates communicate basic emotions in a variety of ways.Chimpanzees, for example, use a large number of vocalizations to convey
CHAPTER 10 ■ The Human Species 289
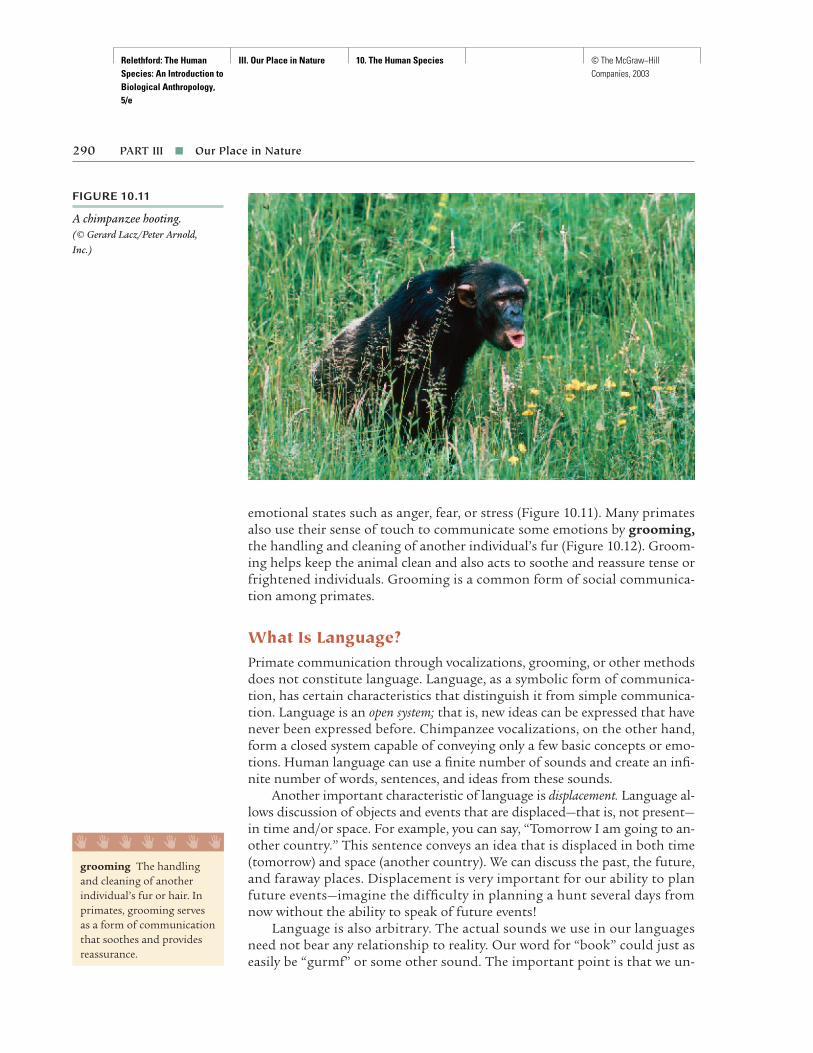
Relethford: The Human Species: An Introduction to Biological Anthropology, 5/e
III. Our Place in Nature 10. The Human Species © The McGraw−Hill Companies, 2003
emotional states such as anger, fear, or stress (Figure 10.11). Many primatesalso use their sense of touch to communicate some emotions by grooming,the handling and cleaning of another individual’s fur (Figure 10.12). Groom-ing helps keep the animal clean and also acts to soothe and reassure tense orfrightened individuals. Grooming is a common form of social communica-tion among primates.
What Is Language?Primate communication through vocalizations, grooming, or other methodsdoes not constitute language. Language, as a symbolic form of communica-tion, has certain characteristics that distinguish it from simple communica-tion. Language is an open system; that is, new ideas can be expressed that havenever been expressed before. Chimpanzee vocalizations, on the other hand,form a closed system capable of conveying only a few basic concepts or emo-tions. Human language can use a finite number of sounds and create an infi-nite number of words, sentences, and ideas from these sounds.
Another important characteristic of language is displacement. Language al-lows discussion of objects and events that are displaced—that is, not present—in time and/or space. For example, you can say, “Tomorrow I am going to an-other country.” This sentence conveys an idea that is displaced in both time(tomorrow) and space (another country). We can discuss the past, the future,and faraway places. Displacement is very important for our ability to planfuture events—imagine the difficulty in planning a hunt several days fromnow without the ability to speak of future events!
Language is also arbitrary. The actual sounds we use in our languagesneed not bear any relationship to reality. Our word for “book” could just aseasily be “gurmf” or some other sound. The important point is that we un-
290 PART III ■ Our Place in Nature
FIGURE 10.11
A chimpanzee hooting. (© Gerard Lacz/Peter Arnold, Inc.)
grooming The handlingand cleaning of anotherindividual’s fur or hair. Inprimates, grooming servesas a form of communicationthat soothes and providesreassurance.
I I I I I I I
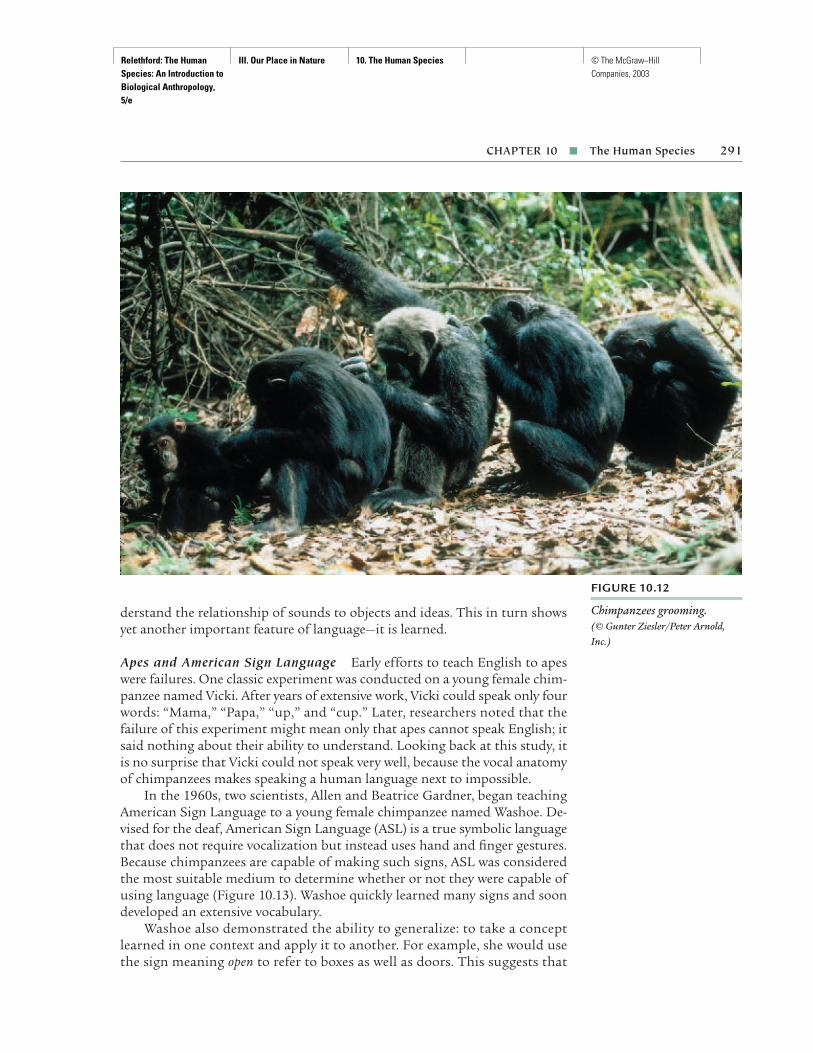
Relethford: The Human Species: An Introduction to Biological Anthropology, 5/e
III. Our Place in Nature 10. The Human Species © The McGraw−Hill Companies, 2003
derstand the relationship of sounds to objects and ideas. This in turn showsyet another important feature of language—it is learned.
Apes and American Sign Language Early efforts to teach English to apeswere failures. One classic experiment was conducted on a young female chim-panzee named Vicki. After years of extensive work, Vicki could speak only fourwords: “Mama,” “Papa,” “up,” and “cup.” Later, researchers noted that thefailure of this experiment might mean only that apes cannot speak English; itsaid nothing about their ability to understand. Looking back at this study, itis no surprise that Vicki could not speak very well, because the vocal anatomyof chimpanzees makes speaking a human language next to impossible.
In the 1960s, two scientists, Allen and Beatrice Gardner, began teachingAmerican Sign Language to a young female chimpanzee named Washoe. De-vised for the deaf, American Sign Language (ASL) is a true symbolic languagethat does not require vocalization but instead uses hand and finger gestures.Because chimpanzees are capable of making such signs, ASL was consideredthe most suitable medium to determine whether or not they were capable ofusing language (Figure 10.13). Washoe quickly learned many signs and soondeveloped an extensive vocabulary.
Washoe also demonstrated the ability to generalize: to take a conceptlearned in one context and apply it to another. For example, she would usethe sign meaning open to refer to boxes as well as doors. This suggests that
CHAPTER 10 ■ The Human Species 291
FIGURE 10.12
Chimpanzees grooming. (© Gunter Ziesler/Peter Arnold,Inc.)

Relethford: The Human Species: An Introduction to Biological Anthropology, 5/e
III. Our Place in Nature 10. The Human Species © The McGraw−Hill Companies, 2003
Washoe truly understood the general concept of open and not just the use ofthe sign in one specific context. Washoe also invented new signs and “talked”to herself while playing alone, an act human children perform when learninglanguage. Washoe was even observed to swear!
One of the most intriguing findings of the Gardners’ research was thatWashoe would form simple two- and three-word sentences (for example, “Youtickle me”). Early observations suggested that Washoe was not only capableof symbolism but also of grammar and sentence construction.
Washoe was the first ape taught American Sign Language. Since thenthere have been many experiments into the nature of the language capabili-ties of apes. Gorillas, as well as chimpanzees, have been taught ASL. Otherlanguages were also invented, including one based on plastic tiles and an-other using a computer keyboard. Experiments were devised that requiredtwo chimpanzees to interact with each other using language. These experi-ments confirmed the ability to generalize signs and to create new ones. Forexample, one chimpanzee named Lucy combined the signs drink and fruit torefer to a watermelon for which she had not been taught a sign. She also in-vented the phrase “cry hurt food” to refer to radishes, which presumably shefound bitter.
As Washoe grew older, it became natural to wonder whether she wouldsome day have an infant that would then learn ASL from her, thus showingcultural transmission of language. During the 1970s, Washoe’s adopted in-fant, Loulis, began using ASL, learning two dozen signs within 18 months.Because care was taken to ensure that Loulis was not exposed to humans sign-ing, the results of the study suggest strongly that chimpanzees can learn ASLfrom each other (Fouts and Mills 1997).
292 PART III ■ Our Place in Nature
FIGURE 10.13
A chimpanzee is usingAmerican Sign Language. (© H. S. Terrace/Animals Animals)

Relethford: The Human Species: An Introduction to Biological Anthropology, 5/e
III. Our Place in Nature 10. The Human Species © The McGraw−Hill Companies, 2003
Human and Ape Language Abilities The purpose of the original researchwith Washoe was to determine what was unique about the way in which ahuman child learns language. It was suggested that a comparison of humanand chimpanzee language acquisition would reveal at what point human abil-ities surpassed those of the ape. Washoe’s abilities exceeded early expecta-tions, and soon the research focus shifted to the language capabilities of theapes themselves. The ability of Washoe and other apes to learn a symboliclanguage suggested that language acquisition could no longer be regarded asa unique human feature.
There is considerable debate about the meaning of these studies. Someclaim that many of the positive results are the result of unconscious cuesgiven to the apes by humans. Also, there is the problem of interpreting thedata and seeing what one wants to see. For example, Washoe signed “waterbird” the first time she saw a swan. Some researchers have interpreted this asa true invention. Others have suggested that Washoe simply saw the waterand then the bird and responded with the two signs in sequence. Obviously,much of this research is fraught with the danger of speculation and exces-sive interpretations for the simple reason that we cannot get inside the chim-panzee’s mind.
In spite of the debates, however, there is little doubt that apes can learnand understand the meaning of many signs. Chimpanzees, gorillas, andorangutans have all mastered a certain number. Some chimps have learnedmore than 150 signs by the time they were 7 years old (Snowden 1990). Care-fully controlled experiments have shown that the basic vocabulary of apes isnot a reflection of unconscious cues given by the scientists. The behavior ofsigning correctly while playing alone strongly suggests that the apes actuallydo understand, in some manner, the meaning of signs.
Much of the controversy over language acquisition in apes revolves aroundtwo different training approaches. Many studies, including the Washoe proj-ect, attempted to teach language in an environment similar to that in whichhuman children develop linguistic skills, one offering continued exposure inan unstructured environment with many opportunities for creativity and ex-pression. Other ape studies used controlled, less flexible environments. Thecontrolled experiments were of course designed to minimize cues from hu-mans and to provide more definitive measurements. The problem is that thistype of sterile approach is not the most conducive to learning language.
One of the most interesting observations came about by accident duringa study conducted by Savage-Rumbaugh, in which researchers were attempt-ing to teach a female bonobo a keyboard-based language. At the time, thebonobo was caring for an infant, Kanzi, who frequently interrupted hismother. Later, when the mother was returned to the breeding colony, Kanzibegan to use the keyboard to make requests. Over time, he performed wellon a variety of measures (Savage-Rumbaugh and Lewin 1994). Significantly,he learned language by observation, and not through direct training. (Afterall, the experiment was not designed to teach him; he was simply there to benursed.) In other words, Kanzi learned elements of language in the same waythat human children do.
CHAPTER 10 ■ The Human Species 293

Relethford: The Human Species: An Introduction to Biological Anthropology, 5/e
III. Our Place in Nature 10. The Human Species © The McGraw−Hill Companies, 2003
The suggested ability of apes to understand grammar and to constructsentences is also controversial. Though apes do create correct two- and three-word sentences, the few longer sentences they create are often grammaticallyincorrect. There has also been evidence that the apes respond to unconsciouscues in constructing sentences (as opposed to simple vocabulary identifica-tion). Though some see definite evidence of grammar (e.g., Linden 1981),others see little evidence (e.g., Terrace 1979). The debate continues.
Regardless of the outcome, it is clear that the difference between humanand ape is not as great as we once thought. We can no longer define modernhumans in terms of the capability to learn certain aspects of symbolic lan-guage. Apes are certainly capable of symbolic behavior, even if we can debateover exactly how much. Both humans and apes can learn symbols, thoughhumans are clearly better at it. Perhaps one of the major differences is thefact that humans rely on language and apes do not. In their natural habitat,apes do not use sign language. The fact that they are capable of learning lan-guage to a certain extent should not detract from the point that they do notuse language in their natural environment. As with tool manufacture, we seeevidence of capabilities in the apes for behaviors that are optional for thembut mandatory for modern humans.
The question of human uniqueness becomes more complicated when weconsider possible behaviors of our fossil ancestors. Given a common ances-try with the African apes, at what point did our own patterns of toolmakingand language acquisition begin? Studies of modern apes help answer suchquestions because we can see the potential for such behaviors in the modernapes. Using these potentials as a guide to the behavior of the common ances-tor of African apes and humans, we can attempt to determine what changeswere necessary to arrive at the modern human condition.
SUMMARY
Humans share many features with the other hominoids but also show anumber of differences. The main biological characteristics of humans are alarge and complex brain, three times its expected value; bipedalism; and smallcanine teeth. In addition, humans have a growth pattern that is differentfrom other primates in its extended childhood and adolescent growth spurt.Behaviorally, humans are quite variable.
Past behavioral definitions of humans have often focused on humans astoolmakers. However, studies of apes in their native habitat show that theyalso make and use simple tools. Accumulated data on chimpanzee behavior inthe wild show that they, like humans, possess culture. Another oft-cited humancharacteristic is the use of symbolic language. Although apes are unable physi-cally to speak a human language, studies of American Sign Language andother symbolic, visually oriented languages show that apes have some lan-guage acquisition capabilities. Studies of toolmaking and language acquisi-tion show that the difference between apes and humans may be more a mat-ter of degree than kind. Modern humans remain unique in the specific ways
294 PART III ■ Our Place in Nature
Relethford: The Human Species: An Introduction to Biological Anthropology, 5/e
III. Our Place in Nature 10. The Human Species © The McGraw−Hill Companies, 2003
they use tools and language and in their reliance on these behaviors for sur-vival. What is mandatory for humans is optional for apes. Still, the capabili-ties shown by apes provide us with possible clues regarding human origins.
SUPPLEMENTAL READINGS
Bogin, B. 2001. The Growth of Humanity. New York: John Wiley & Sons. This book includesa detailed review of the human life cycle with particular attention to the evolution ofhuman growth.
Fisher, H. 1992. Anatomy of Love: A Natural History of Mating, Marriage, and Why We Stray.New York: Ballantine. A well-written and fascinating account of evolutionary explana-tions of human marriage and mating.
Fouts, R., and S. T. Mills. 1997. Next of Kin: What Chimpanzees Have Taught Me About Who WeAre. New York: William Morrow.
Savage-Rumbaugh, S., and R. Lewin. 1994. Kanzi: The Ape at the Brink of the Human Mind.New York: John Wiley & Sons.
These last two books are excellent popular accounts of the studies of ape language acquisition.
INTERNET RESOURCES
http://www.gwc.maricopa.edu/class/bio201/index.htmlAnatomy and Physiology Home Page, containing tutorials on human anatomyand physiology.
http://www.csuchico.edu/anth/Module/skull.htmlThe Skull Module, a graphic tutorial on the bones of the human skull thathas rotation and zoom capabilities.
http://www.emory.edu/LIVING_LINKSLiving Links, a Web site focusing on the comparison of human and ape behavior.
http://chimp.st-and.ac.uk/culturesChimpanzee Cultures, featuring an online database describing the culturalbehaviors discussed in Whiten et al.’s 1999 paper in Nature.
http://www.brown.edu/Departments/Anthropology/apelang.htmlChimpanzee and Great Apes Language Resources on the Internet, a collec-tion of links on all aspects of language acquisition in apes.
CHAPTER 10 ■ The Human Species 295

Relethford: The Human Species: An Introduction to Biological Anthropology, 5/e
III. Our Place in Nature 11. Primate Origins and Evolution
© The McGraw−Hill Companies, 2003
C H A P T E R 11Primate Origins and Evolution
297
The previous three chapters provided a survey of living primates conclud-ing with the discussion of the human species in Chapter 10. The current
chapter places this information in an evolutionary context by examining themajor aspects of primate evolution over the past 65 million years.
As discussed in Chapter 4, the dinosaurs became extinct at the end ofthe Mesozoic Era, 65 million years ago. Their demise opened up numerousopportunities for other animals, particularly the mammals, to expand intonew environments. This adaptive radiation of mammals included the ances-tors of modern-day primates.
Modern primates did not appear instantaneously 65 million years ago.There were no monkeys, apes, or humans at that time. Rather, a group ofmammals began adapting to life in the trees. This change provided a base forfurther evolution, leading ultimately to modern-day primates. It is impor-tant to realize that the definitions of modern forms discussed in Chapters 8and 9 do not always apply to early fossil forms. Any classification based onmodern characteristics reflects many millions of years of evolution. The far-ther back in time we go, the harder it is to distinguish between different formsof primates.
Also, primate and primate-like forms in the past exhibited an amazingdiversity. In the past few decades, we have realized it is not a simple matter todraw family trees connecting earlier forms with modern forms. We now knowthere were many species of prosimians, monkeys, and apes that have no liv-ing counterpart.
The fossil remains of Proconsul, one of the earliest known apes, which livedin Africa 20 million years ago. Proconsul had a mixture of ape-like andmonkey-like traits, showing the origin of the first apes. (© David L. Brill)
▲
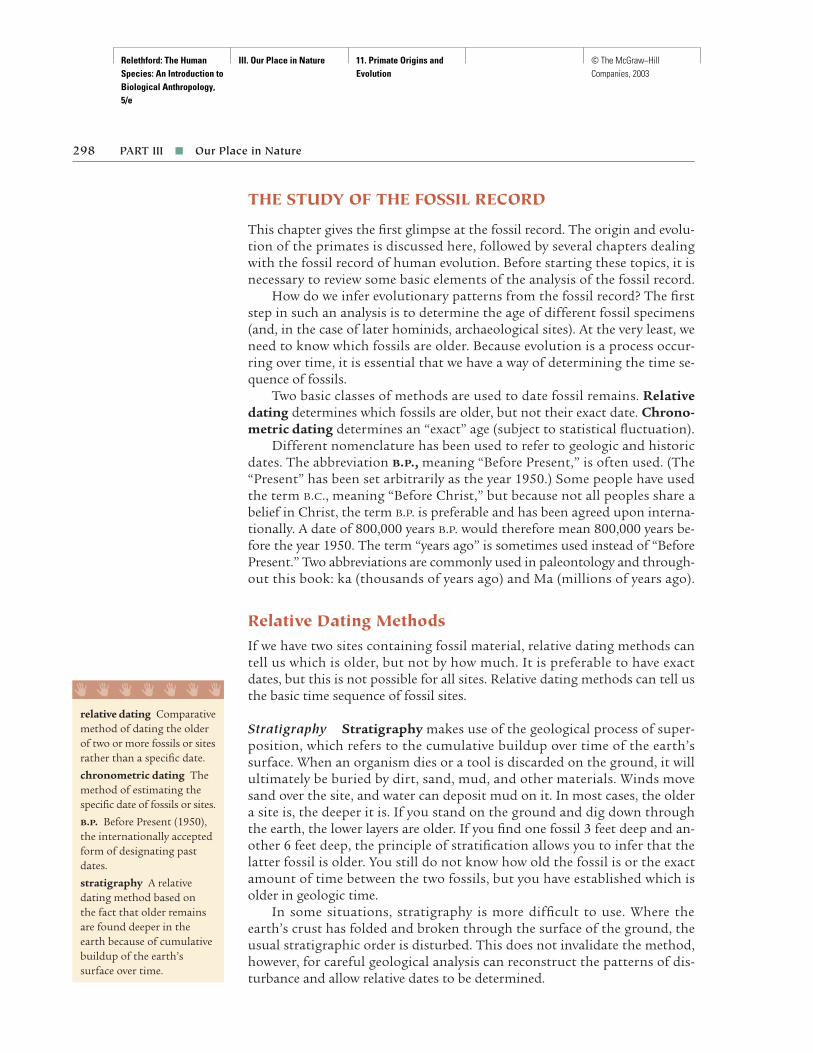
Relethford: The Human Species: An Introduction to Biological Anthropology, 5/e
III. Our Place in Nature 11. Primate Origins and Evolution
© The McGraw−Hill Companies, 2003
THE STUDY OF THE FOSSIL RECORD
This chapter gives the first glimpse at the fossil record. The origin and evolu-tion of the primates is discussed here, followed by several chapters dealingwith the fossil record of human evolution. Before starting these topics, it isnecessary to review some basic elements of the analysis of the fossil record.
How do we infer evolutionary patterns from the fossil record? The firststep in such an analysis is to determine the age of different fossil specimens(and, in the case of later hominids, archaeological sites). At the very least, weneed to know which fossils are older. Because evolution is a process occur-ring over time, it is essential that we have a way of determining the time se-quence of fossils.
Two basic classes of methods are used to date fossil remains. Relativedating determines which fossils are older, but not their exact date. Chrono-metric dating determines an “exact” age (subject to statistical fluctuation).
Different nomenclature has been used to refer to geologic and historicdates. The abbreviation B.P., meaning “Before Present,” is often used. (The“Present” has been set arbitrarily as the year 1950.) Some people have usedthe term B.C., meaning “Before Christ,” but because not all peoples share abelief in Christ, the term B.P. is preferable and has been agreed upon interna-tionally. A date of 800,000 years B.P. would therefore mean 800,000 years be-fore the year 1950. The term “years ago” is sometimes used instead of “BeforePresent.” Two abbreviations are commonly used in paleontology and through-out this book: ka (thousands of years ago) and Ma (millions of years ago).
Relative Dating MethodsIf we have two sites containing fossil material, relative dating methods cantell us which is older, but not by how much. It is preferable to have exactdates, but this is not possible for all sites. Relative dating methods can tell usthe basic time sequence of fossil sites.
Stratigraphy Stratigraphy makes use of the geological process of super-position, which refers to the cumulative buildup over time of the earth’s surface. When an organism dies or a tool is discarded on the ground, it willultimately be buried by dirt, sand, mud, and other materials. Winds movesand over the site, and water can deposit mud on it. In most cases, the oldera site is, the deeper it is. If you stand on the ground and dig down throughthe earth, the lower layers are older. If you find one fossil 3 feet deep and an-other 6 feet deep, the principle of stratification allows you to infer that thelatter fossil is older. You still do not know how old the fossil is or the exactamount of time between the two fossils, but you have established which isolder in geologic time.
In some situations, stratigraphy is more difficult to use. Where theearth’s crust has folded and broken through the surface of the ground, theusual stratigraphic order is disturbed. This does not invalidate the method,however, for careful geological analysis can reconstruct the patterns of dis-turbance and allow relative dates to be determined.
298 PART III ■ Our Place in Nature
relative dating Comparativemethod of dating the olderof two or more fossils or sitesrather than a specific date.
chronometric dating Themethod of estimating thespecific date of fossils or sites.
B.P. Before Present (1950),the internationally acceptedform of designating pastdates.
stratigraphy A relativedating method based on the fact that older remainsare found deeper in theearth because of cumulativebuildup of the earth’ssurface over time.
I I I I I I I

Relethford: The Human Species: An Introduction to Biological Anthropology, 5/e
III. Our Place in Nature 11. Primate Origins and Evolution
© The McGraw−Hill Companies, 2003
Other Relative Dating Methods A number of other methods provide rela-tive dates for fossils. One such method is biostratigraphy, which involvescomparison of animal remains found at different sites to determine any sim-ilarity in time levels. Imagine that you have discovered a site that contains acertain species of fossil pig. Suppose that you know from previous studiesthat this species of pig has always been found between 2.0 million and 1.5 million years ago. Logically, this suggests that your newly discovered siteis also between 2.0 million and 1.5 million years old. The only other possibil-ity would be that patterns of evolution occurred in the same way but at dif-ferent rates in different areas—an unlikely proposition. Plant pollens some-times can be used in a similar manner.
Another dating method involves paleomagnetic reversals. The mag-netic field of the earth runs between the poles, and the polarity of this fieldchanges at irregular intervals over long periods of geological time (Brown1992). Sedimentary rocks preserve a record of such past changes. By calibrat-ing against known ages derived from other methods (see the next section),we have been able to assign dates to past records of paleomagnetic reversal.When a new site is uncovered that has a good stratigraphic section recordingpast reversals, we are able to compare it with a known sequence to obtain anapproximate date.
Chemical methods also provide relative dates. Fluorine dating, for exam-ple, is a method that looks at the accumulation of fluorine in bones. Whenan organism dies, its bones lose nitrogen and gain fluorine. The rate at whichthis process occurs varies, so we cannot tell exactly how old a bone is by usingthe method. The method does, however, allow us to determine if two bonesfound at the same site are the same age. Other relative dating methods canbe applied to human cultural remains. Much like biostratigraphy, these meth-ods assign a range of dates based on a comparison with similar sites withknown dates.
Chronometric Dating MethodsChronometric dating methods provide an “exact” date, subject to statisticalvariation. Chronometric dating relies on constant physical and chemicalprocesses in the universe. Many of these methods utilize the fact that the av-erage rate of radioactive decay is constant for a given radioactive atom nomatter what chemical reaction it might be involved in. If we know that a cer-tain element decays into another at a constant rate, and if we can measurethe relative proportions of the original and new elements in some object, thenwe can mathematically determine the age of the object. Radioactive decay is aprobabilistic phenomenon, meaning that we know the average time for decayover many atoms. Such processes allow us to specify an average date withinthe limits of statistical certainty.
Carbon-14 Dating Living organisms take in the element carbon through-out their lives. Ordinary carbon, carbon-12 (12C), is absorbed by plants, whichtake in carbon dioxide gas from the air, and by animals, which eat the plants (oranimals that eat the animals that eat the plants). Because of cosmic radiation,
CHAPTER 11 ■ Primate Origins and Evolution 299
biostratigraphy A relativedating method in whichsites can be assigned anapproximate age based onthe similarity of animalremains with those fromother dated sites.
paleomagnetic reversal Amethod of dating sites basedon the fact that the earth’smagnetic field has shiftedback and forth from thenorth to the south in thepast at irregular intervals.
I I I I I I I

Relethford: The Human Species: An Introduction to Biological Anthropology, 5/e
III. Our Place in Nature 11. Primate Origins and Evolution
© The McGraw−Hill Companies, 2003
some of the carbon in the atmosphere is a radioactive isotope known as carbon-14 (14C). An organism takes in both 14C and 12C, and the proportionof 12C to 14C is constant during the organism’s life because the proportionis constant in the atmosphere. When an organism dies, no additional 14C isingested and the accumulated 14C begins to decay. The rate at which 14C de-cays is constant; it takes 5,730 years for one-half of the 14C to decay into 14N(nitrogen-14). Carbon-14 is therefore said to have a half-life of 5,730 years.The half-life is the time it takes for half of a radioactive substance to decay.
Carbon-14 dating uses this constant rate of decay to determine the ageof materials containing carbon. The process of the radioactive decay of 14Cresults in the emission of radioactive particles that can be measured. We lookat the rate of radioactive emissions for a sample and compare it to the rate ofemissions expected in a living organism (a rate of 15 particles per minute pergram of carbon). For example, suppose a sample is analyzed and is found toemit 3.75 particles per minute per gram of carbon. Compared to a living or-ganism, two half-lives have elapsed (one half-life results in 7.5 particles, and asecond half-life results in half of this number = 7.5/2 = 3.75). Because thehalf-life of 14C is 5,730 years, the age of our sample is 5,730 × 2 = 11,460 yearsago. If the sample were analyzed in 2003, its date would be 11,407 years B.P.(or, in abbreviated form, 11.407 ka). Because 53 years have passed since 1950(the “Present”), the date is 11,460 − 53 = 11,407.
In theory, any sample containing carbon can be used. In practice, how-ever, bone tends not to be reliable in all cases because of the chemical changesduring fossilization, in which carbon is replaced. In most circumstances,charcoal is the best material to use. If we find that a fire occurred at a certainsite, either naturally or human-made, we can use the charcoal for carbon-14dating. Careful attention must be given to possible contaminants at any givensite. Another problem is that there has been a certain amount of variabilityin the proportions of atmospheric carbon over the last few centuries becauseof industrial pollution. Techniques exist for partial controlling of this factor.
Carbon-14 dating is only useful for sites dating back over the past 50,000years at most. Any older samples would contain too little 14C to be detected.Though carbon-14 dating is extremely valuable in studies of recent hominidevolution, it is not useful for dating most of earth’s geological history.
Potassium-Argon Dating Another chronometric dating method that uti-lizes the process of radioactive decay is potassium-argon dating. Here anisotope of potassium (40K) decays into argon gas (40Ar) with a half-life of ap-proximately 1.31 billion years. This rate of radioactive decay means that thismethod is best used on samples older than 100,000 years (Figure 11.1).
Potassium-argon dating requires rocks that did not possess any argongas to begin with. The best material for this method is volcanic rock, for theheat generated by volcanic eruptions removes any initial argon gas. Thus, weare sure that any argon gas we find in a sample of volcanic rock is the resultof radioactive decay. By looking at the proportions of 40K and 40Ar, we candetermine the number of elapsed half-lives and therefore the age of the vol-canic rock.
300 PART III ■ Our Place in Nature
half-life The average lengthof time it takes for half of a radioactive substance todecay into another form.
carbon-14 dating Achronometric dating methodbased on the half-life ofcarbon-14 that can be appliedto organic remains, such ascharcoal, dating back overthe past 50,000 years.
potassium-argon dating Achronometric dating methodbased on the half-life ofradioactive potassium thatcan be used to date volcanicrock older than 100,000years.
I I I I I I I
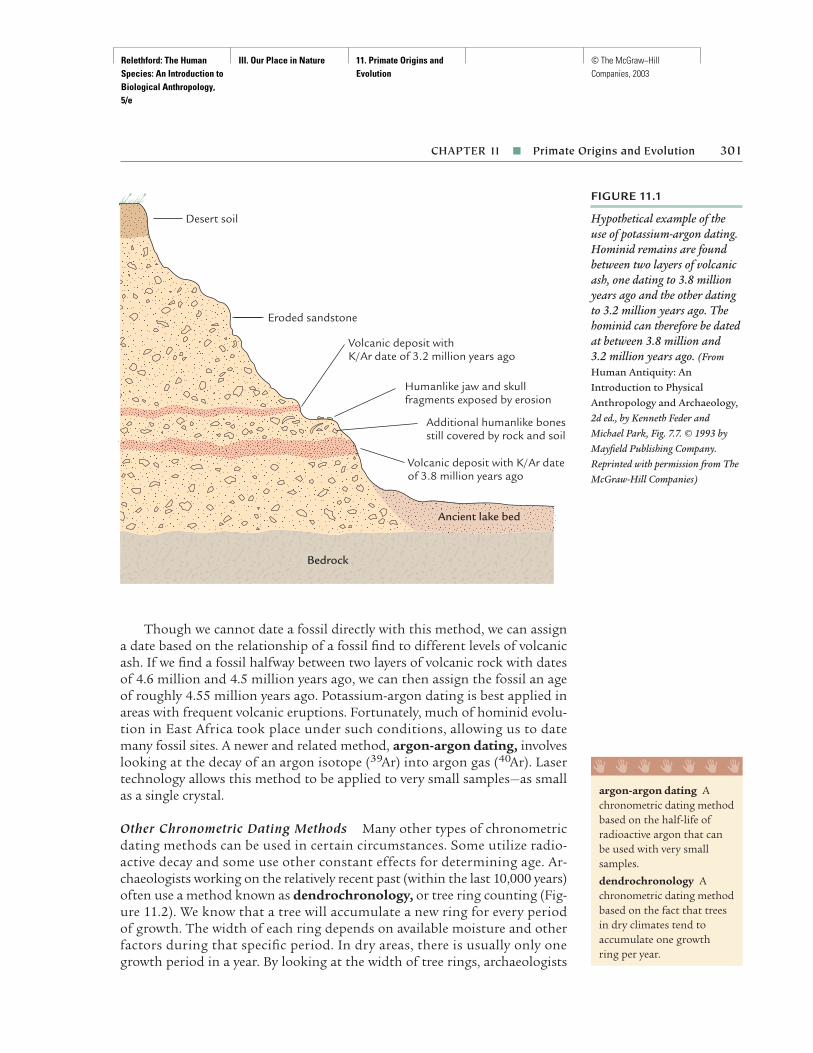
Relethford: The Human Species: An Introduction to Biological Anthropology, 5/e
III. Our Place in Nature 11. Primate Origins and Evolution
© The McGraw−Hill Companies, 2003
Though we cannot date a fossil directly with this method, we can assigna date based on the relationship of a fossil find to different levels of volcanicash. If we find a fossil halfway between two layers of volcanic rock with datesof 4.6 million and 4.5 million years ago, we can then assign the fossil an ageof roughly 4.55 million years ago. Potassium-argon dating is best applied inareas with frequent volcanic eruptions. Fortunately, much of hominid evolu-tion in East Africa took place under such conditions, allowing us to datemany fossil sites. A newer and related method, argon-argon dating, involveslooking at the decay of an argon isotope (39Ar) into argon gas (40Ar). Lasertechnology allows this method to be applied to very small samples—as smallas a single crystal.
Other Chronometric Dating Methods Many other types of chronometricdating methods can be used in certain circumstances. Some utilize radio-active decay and some use other constant effects for determining age. Ar-chaeologists working on the relatively recent past (within the last 10,000 years)often use a method known as dendrochronology, or tree ring counting (Fig-ure 11.2). We know that a tree will accumulate a new ring for every period of growth. The width of each ring depends on available moisture and otherfactors during that specific period. In dry areas, there is usually only onegrowth period in a year. By looking at the width of tree rings, archaeologists
CHAPTER 11 ■ Primate Origins and Evolution 301
FIGURE 11.1
Hypothetical example of theuse of potassium-argon dating.Hominid remains are foundbetween two layers of volcanicash, one dating to 3.8 millionyears ago and the other datingto 3.2 million years ago. Thehominid can therefore be datedat between 3.8 million and 3.2 million years ago. (FromHuman Antiquity: AnIntroduction to PhysicalAnthropology and Archaeology,2d ed., by Kenneth Feder andMichael Park, Fig. 7.7. © 1993 byMayfield Publishing Company.Reprinted with permission from TheMcGraw-Hill Companies)
Desert soil
Eroded sandstone
Volcanic deposit withK/Ar date of 3.2 million years ago
Humanlike jaw and skullfragments exposed by erosion
Additional humanlike bones still covered by rock and soil
Volcanic deposit with K/Ar date of 3.8 million years ago
Ancient lake bed
Bedrock
argon-argon dating Achronometric dating methodbased on the half-life ofradioactive argon that canbe used with very smallsamples.
dendrochronology Achronometric dating methodbased on the fact that treesin dry climates tend toaccumulate one growth ring per year.
I I I I I I I

Relethford: The Human Species: An Introduction to Biological Anthropology, 5/e
III. Our Place in Nature 11. Primate Origins and Evolution
© The McGraw−Hill Companies, 2003
have constructed a master chart of tree ring changes. Any new sample, suchas a log from a prehistoric dwelling, can be compared to this chart to deter-mine its age.
In addition to radioactive decay, other physical constants allow an esti-mate of age to be assigned to a sample. Fission-track dating relies on thefact that when uranium decays into lead in volcanic glass (obsidian), it leavessmall “tracks” across the surface of the glass. We can count the number oftracks and determine the age of the obsidian from the fact that these tracksoccur at a constant rate.
Thermoluminescence is a dating method that relies on the fact thatcertain heated objects accumulate trapped electrons over time, thus allowingus to determine, in some cases, when the object was initially heated. Thismethod has been applied to pottery, bronze, and burned flints. Thermolumi-nescence can be used to date objects as far back as 1 million years.
Electron spin resonance is a fairly new method that provides an esti-mate of dating from observation of radioactive atoms trapped in the calcitecrystals present in a number of materials, such as bones and shells. Althoughthis method can be used for sites over a million years old, it works best fordates under 300,000 years (Grün 1993).
Reconstructing the PastIn addition to dating fossil and archaeological sites, we also need to considerother sources of evidence when putting together a sequence of evolutionaryevents and interpreting them.
Taphonomy When describing the behavior of early hominids or other or-ganisms, we rely on a wide variety of data to reconstruct their environment
302 PART III ■ Our Place in Nature
FIGURE 11.2
Tree rings can be dated by themethod of dendrochronology.(Courtesy of The Laboratory of Tree-Research, The University ofArizona)
fission-track dating Achronometric dating methodbased on the number oftracks made across volcanicrock as uranium decays into lead.
thermoluminescence Achronometric dating methodthat uses the fact that certainheated objects accumulatetrapped electrons over time,which allows the date whenthe object was initiallyheated to be determined.
electron spin resonance Achronometric dating methodthat estimates dates fromobservation of radioactiveatoms trapped in the calcitecrystals present in a numberof materials such as bonesand shells.
I I I I I I I
Relethford: The Human Species: An Introduction to Biological Anthropology, 5/e
III. Our Place in Nature 11. Primate Origins and Evolution
© The McGraw−Hill Companies, 2003
and to provide information on population size, diet, presence or absence ofpredators, and other ecological aspects. Quite often, we rely on what else isfound at a given site other than the fossil. For example, the presence of ani-mal bones, particularly those that are fractured, might indicate hunting. Thedistribution of animal bones might also give us a clue regarding behavior.The types of animal bones found at human hunting sites are different fromthose found at carnivore sites. A major problem is figuring out how animalbones and other objects got there and what happened to them. Imagine find-ing the leg bone of a fossil antelope and the leg bone of a fossil hominid atthe same site. How did these bones wind up in the same place? Did the hom-inid hunt and kill the antelope? Did a predator hunt and kill both the ante-lope and the hominid? Did both bones wash down a river and land at the sameplace even though they might have originally been separate in time and space?
Some of these questions can be answered by methods developed withinthe field of taphonomy, the study of what happens to plants and animals afterthey die. This field provides us with valuable information about which bonesare more likely to fossilize, which bones are more likely to wash away, the dis-tribution of bones left over by a predator, the likely route of pollen dispersalin the air, and many other similar topics. Taphonomic studies also provideus with ways of finding out whether objects or fossils have been disturbed orwhether they have stayed where they were first deposited. Such studies canalso help us distinguish between human and natural actions. A fractured legbone of a deer might result from normal wear and tear on a fossil or reflectthe action of a prehistoric hunter. By understanding what happens to fossilsin general, we are in a better position to infer what happened to specific fossils.
Paleoecology When reconstructing the past, we need to know more thanjust what early organisms looked like. We also need to know about the en-vironment in which they lived. What did they eat? Were they predators orprey? What types of vegetation were available? Where were water sources?These questions, and many others, involve paleoecology, the study of an-cient environments.
One example of the many methods used in reconstructing ancient envi-ronments is palynology, the study of fossil pollen. By looking at the types ofpollen found at a given site, experts can identify the specific types of plantsthat existed at that time. They can then make inferences about yearly and sea-sonal changes in temperature and rainfall based on the relative proportionof plant species. Further information on vegetation can be extracted fromanalysis of fossil teeth. Microscopic analysis of scratch patterns on teeth cantell us whether an organism relied more heavily on leaves, fruits, or meat.Chemical analysis of teeth can also tell us something about diet. For example,the ratio of the element strontium to the element calcium can reveal whetheran organism primarily ate plants or meat. Strontium ratios are higher inplant eaters.
Additional examples of the numerous methods for investigating past en-vironments will be given in the following chapters, where applicable.
CHAPTER 11 ■ Primate Origins and Evolution 303
taphonomy The study ofwhat happens to plants andanimals after they die.
paleoecology The study ofancient environments.
palynology The study offossil pollen.
I I I I I I I

Relethford: The Human Species: An Introduction to Biological Anthropology, 5/e
III. Our Place in Nature 11. Primate Origins and Evolution
© The McGraw−Hill Companies, 2003
Identifying Species Assuming that we have good dates for a sample of fos-sils and that we know as much as possible about their biology and environ-ment, what do we do next? How do we know which organisms are related toone another? Which species became extinct and which evolved into otherspecies? Some of these issues will be dealt with in later chapters. For now, weconcentrate on certain problems in the analysis of fossil remains.
As noted earlier, assignment of fossil specimens into species groups isdifficult because we have no direct evidence on which forms were capable ofinterbreeding. Instead, we have to rely on inferences made from the physicalappearance, or morphology, of the fossils. Briefly, we examine physical struc-ture and compare it with other fossils and living organisms, keeping in mindthe ranges of variation. When we find two specimens that exceed the normalrange of variation for similar organisms, we can make a stronger case for as-signing the two specimens into different species.
This approach has problems. Individuals within a species can be mis-takenly assigned to different species if care is not taken to consider range ofvariation. For example, the skulls of adult male and female gorillas are quitedifferent in size and other features (Figure 11.3). When we encounter suchdifferences among fossil specimens, we must rely on a knowledge of varia-tion in similar living organisms to determine whether sexual dimorphism islikely to be the cause.
Species identification is further complicated by philosophical differencesamong scientists. Some feel that the range of variation within species is oftenrather large and suggest that it is simpler to assign fossils to species alreadyknown and described rather than create new categories. A scientist with thisview is often called a “lumper” because of the preference for lumping new fos-sils into preexisting categories. Others take a different approach, seeing theevolutionary record as one of frequent speciation. In this case, they antici-pate numerous species and tend to call any new fossil that is somewhat differ-ent a new species. Scientists with this view are often referred to as “splitters.”Identification of species is also complicated by scientists’ view as to whether
304 PART III ■ Our Place in Nature
FIGURE 11.3
Sexual dimorphism in gorillaskulls. The skull of a malegorilla ( left) is larger thanthat of the female gorilla(right) and also shows heavycrests of bones on top of theskull for muscle attachment.Such sexual differences must be taken into account inanalyzing fossil remains andassigning such remains topaleospecies.
cm
0 5
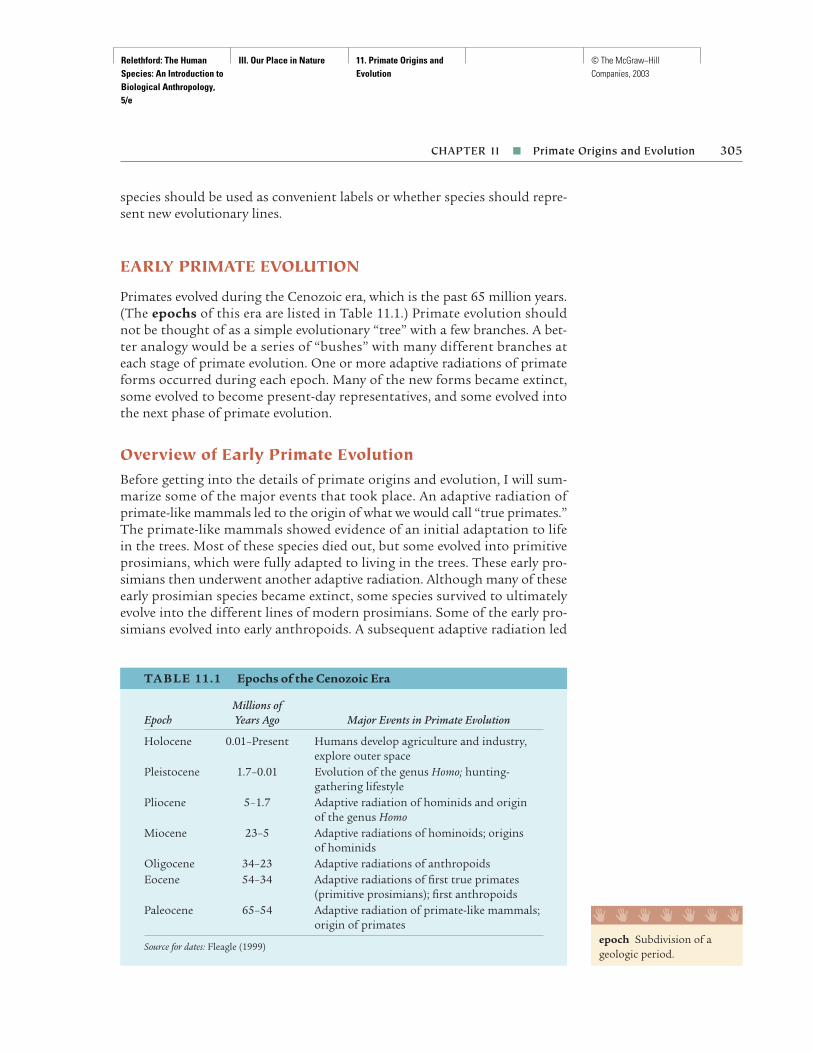
Relethford: The Human Species: An Introduction to Biological Anthropology, 5/e
III. Our Place in Nature 11. Primate Origins and Evolution
© The McGraw−Hill Companies, 2003
species should be used as convenient labels or whether species should repre-sent new evolutionary lines.
EARLY PRIMATE EVOLUTION
Primates evolved during the Cenozoic era, which is the past 65 million years.(The epochs of this era are listed in Table 11.1.) Primate evolution shouldnot be thought of as a simple evolutionary “tree” with a few branches. A bet-ter analogy would be a series of “bushes” with many different branches ateach stage of primate evolution. One or more adaptive radiations of primateforms occurred during each epoch. Many of the new forms became extinct,some evolved to become present-day representatives, and some evolved intothe next phase of primate evolution.
Overview of Early Primate EvolutionBefore getting into the details of primate origins and evolution, I will sum-marize some of the major events that took place. An adaptive radiation ofprimate-like mammals led to the origin of what we would call “true primates.”The primate-like mammals showed evidence of an initial adaptation to lifein the trees. Most of these species died out, but some evolved into primitiveprosimians, which were fully adapted to living in the trees. These early pro-simians then underwent another adaptive radiation. Although many of theseearly prosimian species became extinct, some species survived to ultimatelyevolve into the different lines of modern prosimians. Some of the early pro-simians evolved into early anthropoids. A subsequent adaptive radiation led
CHAPTER 11 ■ Primate Origins and Evolution 305
TA B L E 11.1 Epochs of the Cenozoic Era
Millions of Epoch Years Ago Major Events in Primate Evolution
Holocene 0.01–Present Humans develop agriculture and industry, explore outer space
Pleistocene 1.7–0.01 Evolution of the genus Homo; hunting-gathering lifestyle
Pliocene 5–1.7 Adaptive radiation of hominids and origin of the genus Homo
Miocene 23–5 Adaptive radiations of hominoids; origins of hominids
Oligocene 34–23 Adaptive radiations of anthropoidsEocene 54–34 Adaptive radiations of first true primates
(primitive prosimians); first anthropoidsPaleocene 65–54 Adaptive radiation of primate-like mammals;
origin of primates
Source for dates: Fleagle (1999)epoch Subdivision of ageologic period.
I I I I I I I
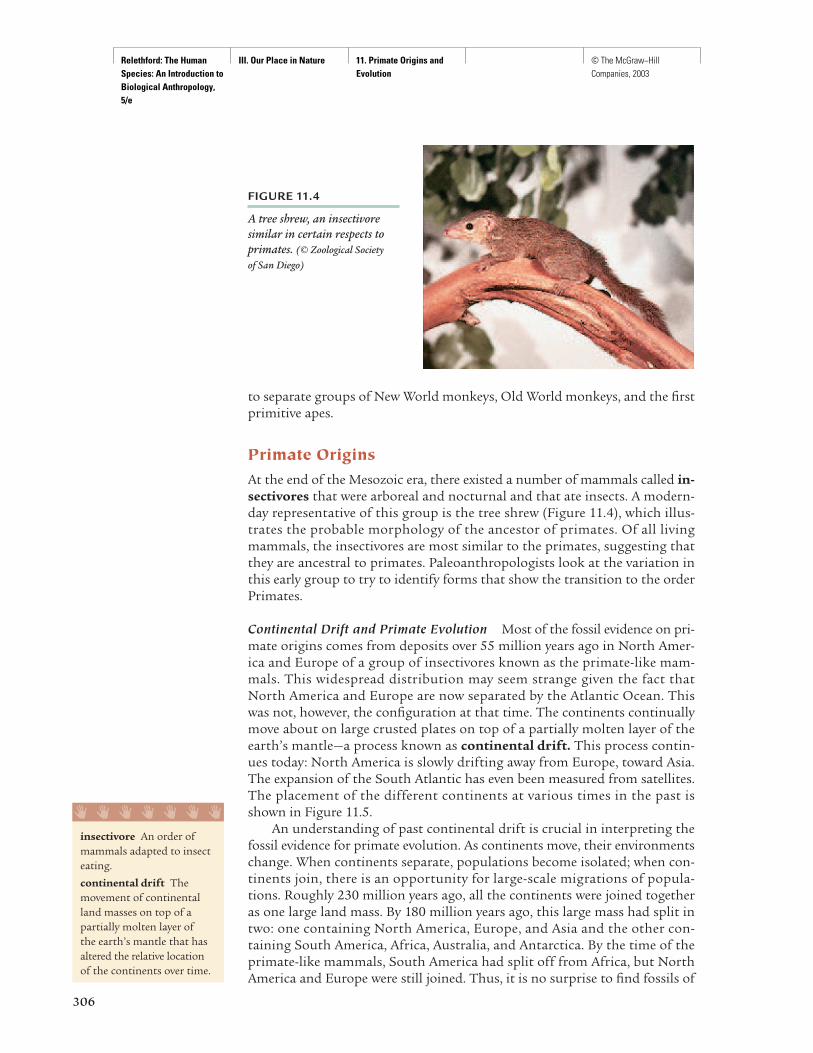
Relethford: The Human Species: An Introduction to Biological Anthropology, 5/e
III. Our Place in Nature 11. Primate Origins and Evolution
© The McGraw−Hill Companies, 2003
to separate groups of New World monkeys, Old World monkeys, and the firstprimitive apes.
Primate OriginsAt the end of the Mesozoic era, there existed a number of mammals called in-sectivores that were arboreal and nocturnal and that ate insects. A modern-day representative of this group is the tree shrew (Figure 11.4), which illus-trates the probable morphology of the ancestor of primates. Of all livingmammals, the insectivores are most similar to the primates, suggesting thatthey are ancestral to primates. Paleoanthropologists look at the variation inthis early group to try to identify forms that show the transition to the orderPrimates.
Continental Drift and Primate Evolution Most of the fossil evidence on pri-mate origins comes from deposits over 55 million years ago in North Amer-ica and Europe of a group of insectivores known as the primate-like mam-mals. This widespread distribution may seem strange given the fact thatNorth America and Europe are now separated by the Atlantic Ocean. Thiswas not, however, the configuration at that time. The continents continuallymove about on large crusted plates on top of a partially molten layer of theearth’s mantle—a process known as continental drift. This process contin-ues today: North America is slowly drifting away from Europe, toward Asia.The expansion of the South Atlantic has even been measured from satellites.The placement of the different continents at various times in the past isshown in Figure 11.5.
An understanding of past continental drift is crucial in interpreting thefossil evidence for primate evolution. As continents move, their environmentschange. When continents separate, populations become isolated; when con-tinents join, there is an opportunity for large-scale migrations of popula-tions. Roughly 230 million years ago, all the continents were joined togetheras one large land mass. By 180 million years ago, this large mass had split intwo: one containing North America, Europe, and Asia and the other con-taining South America, Africa, Australia, and Antarctica. By the time of theprimate-like mammals, South America had split off from Africa, but NorthAmerica and Europe were still joined. Thus, it is no surprise to find fossils of
FIGURE 11.4
A tree shrew, an insectivoresimilar in certain respects toprimates. (© Zoological Society of San Diego)
insectivore An order ofmammals adapted to insecteating.
continental drift Themovement of continentalland masses on top of apartially molten layer of the earth’s mantle that hasaltered the relative locationof the continents over time.
I I I I I I I
306

Relethford: The Human Species: An Introduction to Biological Anthropology, 5/e
III. Our Place in Nature 11. Primate Origins and Evolution
© The McGraw−Hill Companies, 2003
primate-like mammals on both continents—they represent part of the group’srange on a single land mass.
The Primate-like Mammals During the Paleocene epoch (65–54 millionyears ago), we find evidence of what are referred to as “primate-like mammals”(technically known as plesiadapiforms), which were small creatures, usuallyno larger than a cat and often smaller. They were quadrupedal (four-footed)mammals whose arms and legs were well adapted for climbing. Within thisgeneral group there was considerable diversity. Fleagle (1999) lists 70 speciesin 25 different genera. Most of this extensive variation was in body size anddental specializations. Some of the primate-like mammals had large incisors
CHAPTER 11 ■ Primate Origins and Evolution 307
FIGURE 11.5
Continental drift. More than200 million years ago, all ofthe continents formed a singleland mass (called Pangea). By180 million years ago, twomajor land masses had formed(Laurasia and Gondwana). By 65 million years ago (thebeginning of primate evolution),South America had split fromAfrica, but North America and Europe were still joined.(From Human Antiquity: An Introduction to PhysicalAnthropology and Archaeology,4th ed., by Kenneth Feder andMichael Park. Fig. 3.6. Copyright2001 by Mayfield PublishingCompany. Reprinted with permissionfrom The McGraw-Hill Companies)
More than 200 million years ago
PANGEA
LAURASIA
GONDWANA
180 million years ago
65 million years ago
Present
Paleocene epoch The firstepoch of the Cenozoic era,dating roughly between 65 million and 54 millionyears ago, when the primate-like mammals appeared.
I I I I I I I

Relethford: The Human Species: An Introduction to Biological Anthropology, 5/e
III. Our Place in Nature 11. Primate Origins and Evolution
© The McGraw−Hill Companies, 2003
for heavy gnawing, others had teeth better adapted for slicing, and still oth-ers had teeth adapted for eating nectar and insects. Such variation is expectedfrom an adaptive radiation. These small insectivores had some ability toclimb and thus were able to exploit many different types of food.
In spite of their arboreal adaptations, these creatures are not consideredtrue primates. A picture of the skull of one of these creatures (Figure 11.6)shows why. The front teeth are far apart from the rest of the teeth, a featurenot found in primates. The eyes are located more toward the sides of the skull,unlike the forward-facing eyes of primates. In addition, the primate-likemammals lack a postorbital bar, a bony ring separating the orbit of the eyefrom the back of the skull. Primates have a postorbital bar. Also, the handsand feet of these animals did not have the grasping ability of primates, andthey had claws instead of nails.
Despite these differences, there are some similarities of this group to mod-ern primates, including certain dental traits and some grasping tendency(Gingerich 1986). However, all species found to date tend to be too special-ized to be the actual ancestors of later primates (Fleagle 1999); they appearto be a related group that provides us with a general view of the morphologythat preceded the origin of primates.
The First Primates The first “true” primates appeared roughly 50 millionto 55 million years ago at the beginning of the Eocene epoch (54–34 millionyears ago). The climate during this time was warm and humid, and the pre-dominant land environment was tropical and subtropical. Initially, the con-tinents of Europe and North America were still joined, resulting in migra-tion and similarity among the fossils we find in this region. Many orders ofmodern-day mammals first appeared during this time, including aquaticmammals (whales, porpoises, and dolphins), rodents, and horses.
Fossil primates from the Eocene epoch have been found both in NorthAmerica and in Europe. During the Eocene, there was an adaptive radiation ofthe first true primates—the early prosimians. This adaptive radiation was partof the general increase in the diversity of mammals associated with the warm-ing of the climate and related environmental changes, and almost 200 differ-ent primate species have been discovered (Fleagle 1999).
The Eocene forms possessed stereoscopic vision, grasping hands, andother anatomical features characteristic of primates. A picture of the skull ofan Eocene primate (Figure 11.7) shows many of these changes. Compared tothe Paleocene primate-like mammals, the snout is reduced and the teeth arecloser together. These forms possessed a postorbital bar and had larger braincases and features of cerebral blood supply similar to that of modern primates.The large size of the eyes of some of the Eocene primates suggests they werestill nocturnal.
These early primitive primates were similar, in a general sense, to livingprosimians. In a rough sense, there are two basic groups of early Eocene pri-mates. One group, primarily diurnal leaf and fruit eaters, is broadly similarto modern lemurs and lorises. The other group, primarily smaller nocturnalfruit and insect eaters, is broadly similar to modern tarsiers.
308 PART III ■ Our Place in Nature
FIGURE 11.6
Side view of a skull of aPaleocene primate-likemammal. (Redrawn from Fleagle, Primate Adaptation and Evolution, 1988, withpermission, Academic Press, Inc.)
postorbital bar The bonyring that separates the eyeorbit from the back of theskull in primates.
Eocene epoch The secondepoch of the Cenozoic era,dating roughly between 54 million and 34 millionyears ago, when the firsttrue primates, earlyprosimians, appeared.
I I I I I I I
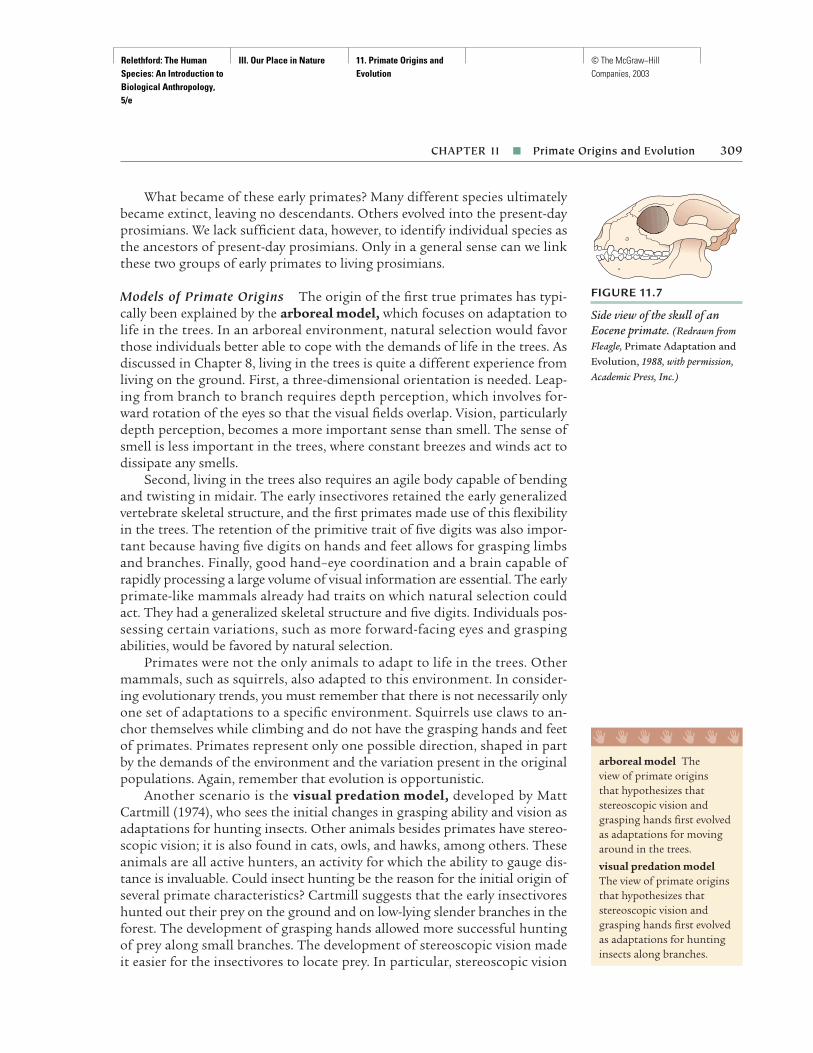
Relethford: The Human Species: An Introduction to Biological Anthropology, 5/e
III. Our Place in Nature 11. Primate Origins and Evolution
© The McGraw−Hill Companies, 2003
What became of these early primates? Many different species ultimatelybecame extinct, leaving no descendants. Others evolved into the present-dayprosimians. We lack sufficient data, however, to identify individual species asthe ancestors of present-day prosimians. Only in a general sense can we linkthese two groups of early primates to living prosimians.
Models of Primate Origins The origin of the first true primates has typi-cally been explained by the arboreal model, which focuses on adaptation tolife in the trees. In an arboreal environment, natural selection would favorthose individuals better able to cope with the demands of life in the trees. Asdiscussed in Chapter 8, living in the trees is quite a different experience fromliving on the ground. First, a three-dimensional orientation is needed. Leap-ing from branch to branch requires depth perception, which involves for-ward rotation of the eyes so that the visual fields overlap. Vision, particularlydepth perception, becomes a more important sense than smell. The sense ofsmell is less important in the trees, where constant breezes and winds act todissipate any smells.
Second, living in the trees also requires an agile body capable of bendingand twisting in midair. The early insectivores retained the early generalizedvertebrate skeletal structure, and the first primates made use of this flexibilityin the trees. The retention of the primitive trait of five digits was also impor-tant because having five digits on hands and feet allows for grasping limbsand branches. Finally, good hand–eye coordination and a brain capable ofrapidly processing a large volume of visual information are essential. The earlyprimate-like mammals already had traits on which natural selection couldact. They had a generalized skeletal structure and five digits. Individuals pos-sessing certain variations, such as more forward-facing eyes and graspingabilities, would be favored by natural selection.
Primates were not the only animals to adapt to life in the trees. Othermammals, such as squirrels, also adapted to this environment. In consider-ing evolutionary trends, you must remember that there is not necessarily onlyone set of adaptations to a specific environment. Squirrels use claws to an-chor themselves while climbing and do not have the grasping hands and feetof primates. Primates represent only one possible direction, shaped in partby the demands of the environment and the variation present in the originalpopulations. Again, remember that evolution is opportunistic.
Another scenario is the visual predation model, developed by MattCartmill (1974), who sees the initial changes in grasping ability and vision asadaptations for hunting insects. Other animals besides primates have stereo-scopic vision; it is also found in cats, owls, and hawks, among others. Theseanimals are all active hunters, an activity for which the ability to gauge dis-tance is invaluable. Could insect hunting be the reason for the initial origin ofseveral primate characteristics? Cartmill suggests that the early insectivoreshunted out their prey on the ground and on low-lying slender branches in theforest. The development of grasping hands allowed more successful huntingof prey along small branches. The development of stereoscopic vision madeit easier for the insectivores to locate prey. In particular, stereoscopic vision
CHAPTER 11 ■ Primate Origins and Evolution 309
FIGURE 11.7
Side view of the skull of anEocene primate. (Redrawn fromFleagle, Primate Adaptation andEvolution, 1988, with permission,Academic Press, Inc.)
arboreal model The view of primate origins that hypothesizes thatstereoscopic vision andgrasping hands first evolvedas adaptations for movingaround in the trees.
visual predation modelThe view of primate originsthat hypothesizes thatstereoscopic vision andgrasping hands first evolvedas adaptations for huntinginsects along branches.
I I I I I I I

Relethford: The Human Species: An Introduction to Biological Anthropology, 5/e
III. Our Place in Nature 11. Primate Origins and Evolution
© The McGraw−Hill Companies, 2003
allowed them to judge the distance to potential prey without moving theirheads (which could alert the prey). Cartmill notes that a similar developmentof stereoscopic vision occurred in cats. According to Cartmill’s model, primateadaptations first arose as adaptations to more successful insect predation.Once these traits were established, these adaptations later allowed furtherexploitation of the trees. As is often the case in evolution, preexisting struc-tures can be used for different purposes. The fossil record is not completeenough to fully test Cartmill’s model, but the dental evidence does show thatmany of the early primate-like mammals were insect eaters. This observationis consistent with the insect predation idea, but it is not conclusive.
Yet another alternative has been proposed by Sussman (1991), who sug-gests that primate origins might be related to eating fruit rather than insects.In Sussman’s model, grasping hands are seen as an adaptation for efficientlyeating the fruit that grows at the ends of long branches. Other mammals,such as squirrels, take food back to the main trunk of a tree to eat in safety.Grasping hands could have allowed early primates to eat more fruit in lesstime and to do so more safely. A problem with this model, however, is that itdoes not explain binocular stereoscopic vision (Cartmill 1992).
Primates became extremely successful in adapting to an arboreal environ-ment because of their biological and behavioral flexibility. This flexibility is evenmore important when considering the subsequent evolution of the primates.
Anthropoid OriginsWhat of the anthropoids? Although living anthropoids are more similar totarsiers than to lemurs or lorises, identification of the first anthropoids andtheir relationship to other fossil primates is not as clear. Recent fossil discov-eries have suggested that anthropoids first evolved during the Eocene epoch,perhaps as much as 50 million years ago. Debate continues over whether an-thropoids first evolved in Asia or Africa. Although some fossil evidence sup-ports the view that the first anthropoids evolved in Asia (e.g., Jaeger et al.1999), some paleontologists argue that the fossil record is still too incom-plete to be certain (e.g., Gunnell and Miller 2001).
It is possible that anthropoids developed not from the lemur–loris groupor the tarsier group, but from a third, independent line in early primate evo-lution. It is too soon to determine which of these ideas (if any) is correct. Themajor lesson we have learned from recent fossil discoveries is that past diver-sity was much greater than we once thought, and even given our recent accu-mulation of data, we are unlikely to have sampled more than a fraction ofearly primate diversity.
Old World Anthropoids We have evidence of anthropoid fossils from thestart of the Oligocene epoch (34–23 million years ago) at several locationsin the Old World and the New World. The climate cooled during this time,and there was an expansion of grasslands and a reduction in forests. Thischange in climate seems to have resulted in the southward movement of pri-mate populations, and we find little evidence of further evolution in NorthAmerica or Europe. Most of the fossil evidence for anthropoid evolution is
310 PART III ■ Our Place in Nature
Oligocene epoch The thirdepoch of the Cenozoic era,dating roughly between 34 million and 23 millionyears ago, when there was an adaptive radiation ofanthropoids.
I I I I I I I

Relethford: The Human Species: An Introduction to Biological Anthropology, 5/e
III. Our Place in Nature 11. Primate Origins and Evolution
© The McGraw−Hill Companies, 2003
found in southern climates in Africa and South America and in parts of east-ern Asia (Covert 1997; Fleagle 1995).
The Oligocene primates show the continued radiation of anthropoidforms in both the Old World and the New World. The Oligocene anthropoidsshow continued reduction of the snout and nasal area, indicating greater re-liance on vision than on smell. In addition to the postorbital bar shared withall primates, the Oligocene anthropoids have a fully enclosed eye socket, char-acteristic of modern anthropoids. All of the Oligocene anthropoids were smalland arboreal and were generalized quadrupeds; none show signs of special-ized locomotion. Their diet appears to have consisted primarily of fruit sup-plemented with insects and leaves.
The smaller eye orbits of many early anthropoids suggests that theseforms were diurnal (Figure 11.8). The transition from a nocturnal lifestyle toa diurnal lifestyle was extremely important in the later evolution of the an-thropoids. Given variation in the daily schedule of living creatures, we canimagine a situation in which some ancestral primates began feeding duringdaylight hours. As this new environmental niche was exploited, natural selec-tion would act to favor individuals that possessed the abilities needed for sucha way of life, such as improved vision. Daylight living also offers increasedopportunities for social interactions because animals can see one another atgreater distances. As a result, we would expect the development of larger so-cial groups and an increase in social behaviors.
Evolution of the New World Monkeys What about the New World mon-keys? The earliest fossil record of New World monkeys dates back roughly 30 million years (Fleagle 1999). Most of this evidence consists of fragmentary
CHAPTER 11 ■ Primate Origins and Evolution 311
FIGURE 11.8
Three-quarters view of theOligocene anthropoidAegyptopithecus, which lived about 33 million yearsago. The smaller eye orbit,relative to the size of the skull, shows that this form was diurnal (nocturnalcreatures have bigger eyes).Aegyptopithecus was onceconsidered a possible early apebut is now recognized as ananthropoid that lived prior to the split of the Old Worldmonkey and ape lines. (© David L. Brill/Brill Atlanta)

Relethford: The Human Species: An Introduction to Biological Anthropology, 5/e
III. Our Place in Nature 11. Primate Origins and Evolution
© The McGraw−Hill Companies, 2003
dental remains. Many of these fossils resemble living New World monkeys.Other forms have unusual features, such as narrow jaws and protruding in-cisors, and do not appear to have any living counterparts.
Where did the New World monkeys come from? Decades ago, it wasthought that New and Old World monkeys represented a good example ofparallel evolution from prosimians. However, current evidence points toenough similarities between the two groups of monkeys to make it more reasonable to assume a single origin for anthropoids somewhere in the Old World. How did the New World monkeys get to the New World? By thistime, continental drift had resulted in the separation of the Old and NewWorlds.
One explanation is that anthropoids reached South America by “raft-ing.” No, this does not mean that these early primates built rafts and sailedto South America! Ocean storms often rip up clumps of land near the shore,which are then pulled out into the ocean. Sometimes these “floating islands”contain helpless animals. Often they drown, but occasionally they will bewashed up on an island or continent. Based on what we know of AtlanticOcean currents and winds, Houle (1999) has calculated that small populationsof monkeys could have survived long enough on these floating islands tocomplete a trans-Atlantic trip.
Present geological evidence supports this rafting hypothesis, with someresearchers advocating that the monkeys rafted from North America to SouthAmerica and others suggesting they rafted from Africa to South America orfrom Antarctica. At present, the evidence supports an African origin for threereasons. First, no suitable early anthropoid ancestors have been discovered inNorth America. Second, there is evidence of other animals (rats) rafting fromAfrica (Fleagle 1995). Third, New World fossil evidence points to a close sim-ilarity with African anthropoids (Flynn et al. 1995).
EVOLUTION OF THE MIOCENE HOMINOIDS
Continued evolution of the Old World anthropoids led to two major branches,one line leading to the modern Old World monkeys and the other line lead-ing to the modern hominoids (apes and humans). The oldest evidence forfossil hominoids is based primarily on dental evidence and comes from OldWorld sites dating to the Miocene epoch (23–5 million years ago). MostMiocene mammals are fairly modern in form, and roughly half of all mod-ern mammals were present during this time. South America and Australiawere isolated due to continental drift. The land mass of Eurasia (a termgiven to the combined land masses of Europe and Asia) and Africa joinedduring part of the Miocene, roughly 16 million to 17 million years ago.
The early and middle Miocene (before 16 million years ago) was a time ofheavy tropical forests, particularly in Africa. Subsequently, the climate be-came cooler and drier and there was an increase in open grasslands and mixedenvironments consisting of open woodlands, bushlands, and savannas.
312 PART III ■ Our Place in Nature
Miocene epoch The fourthepoch of the Cenozoic era,dating between 23 millionand 5 million years ago,when there was greatdiversity in hominoids.
Eurasia The combined landmasses of Europe and Asia.
I I I I I I I

Relethford: The Human Species: An Introduction to Biological Anthropology, 5/e
III. Our Place in Nature 11. Primate Origins and Evolution
© The McGraw−Hill Companies, 2003
The Diversity of Miocene HominoidsLooking at modern primates, it is apparent that there are more genera andspecies of monkeys than there are of apes. Monkeys are more diverse than apes.During the Miocene epoch, however, just the reverse was true—apes were in-credibly diverse until the past 5 million to 10 million years. Since that time,the number of ape species has been declining. This decline is evident when weconsider the diversity of fossil Miocene hominoids now known. Dozens ofspecies are known from Africa, Asia, and Europe (Table 11.2). Compare this tothe few apes alive today (see Chapter 9). In addition, remember that the list inTable 11.2 is incomplete—we find new fossils, and often new genera and species,all the time. In fact, this list could be out of date by the time you look at it!
Why have the number of apes declined and monkeys flourished since theMiocene? One possibility is the slow reproduction rate of modern apes. IfMiocene apes were as nurturing of their offspring as modern apes are, thenthey may have reproduced too slowly and died out. This problem would havebeen exacerbated by environmental changes over time.
For the purpose of reconstructing the evolution of the apes, this past di-versity creates a problem. Given that there were more species in the past thanare alive today, this means that many fossil species have no living descendants.Decades ago, when the fossil record was less complete, it was tempting toidentify any newly discovered fossil ape as the Miocene ancestor of one of theliving apes, such as the chimpanzee or gorilla (Fleagle 1995). Today we haveevidence of greater diversity in the past, but we now realize that evolutionoften produces initial diversity followed by later extinction of many branches.It therefore becomes more difficult to find the ancestors of modern apes. Wecan certainly recognize fossil apes in a general sense and see general evolution-ary trends, but it is much more difficult to arrange the known fossils into adefinitive evolutionary tree.
The Fossil EvidenceIn general, the identification of the Miocene forms listed in Table 11.2 ashominoid is based on dental and cranial features. In most cases, much less isknown about the postcranial skeleton (the skeleton below the skull), andsuch evidence that does exist shows characteristics different from those ofmodern apes. Overall, it appears that the postcranial structure of Miocenehominoids was often more generalized than that of modern apes, whose par-ticular adaptations (e.g., knuckle walking) may be more recent. In light ofthe great diversity of Miocene hominoids, only a few selected forms are dis-cussed here. Keep in mind that many other forms existed.
Proconsul One early Miocene hominoid that appears to have evolutionarysignificance is the genus Proconsul, which lived in Africa between 23 millionand 17 million years ago. Specimens placed in this genus show considerablevariation, particularly in overall size, making assignment to specific speciessomewhat difficult. The skeletal structure of Proconsul shows a mixture of
CHAPTER 11 ■ Primate Origins and Evolution 313
postcranial Referring tothat part of the skeletonbelow the skull.
Proconsul A genus of fossilhominoid that lived in Africabetween 23 million and 17 million years ago andthat shows a number ofmonkey characteristics.
I I I I I I I
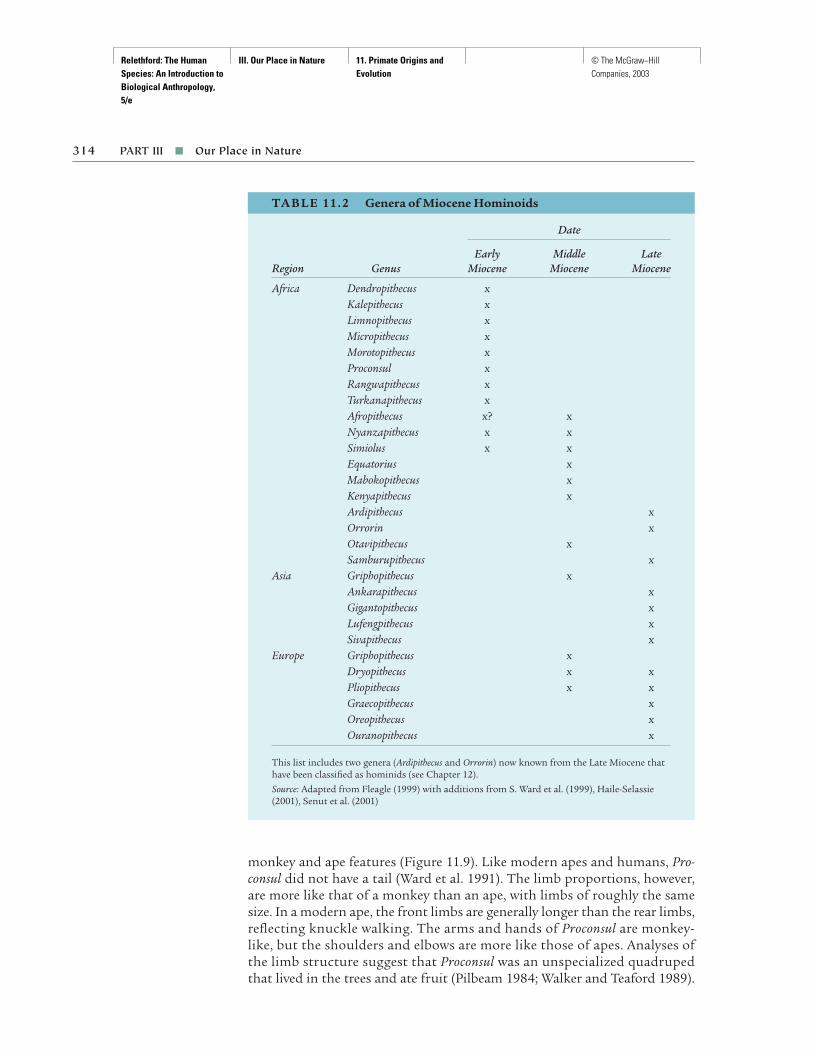
Relethford: The Human Species: An Introduction to Biological Anthropology, 5/e
III. Our Place in Nature 11. Primate Origins and Evolution
© The McGraw−Hill Companies, 2003
monkey and ape features (Figure 11.9). Like modern apes and humans, Pro-consul did not have a tail (Ward et al. 1991). The limb proportions, however,are more like that of a monkey than an ape, with limbs of roughly the samesize. In a modern ape, the front limbs are generally longer than the rear limbs,reflecting knuckle walking. The arms and hands of Proconsul are monkey-like, but the shoulders and elbows are more like those of apes. Analyses ofthe limb structure suggest that Proconsul was an unspecialized quadrupedthat lived in the trees and ate fruit (Pilbeam 1984; Walker and Teaford 1989).
314 PART III ■ Our Place in Nature
TA B L E 11. 2 Genera of Miocene Hominoids
Date
Early Middle LateRegion Genus Miocene Miocene Miocene
Africa Dendropithecus xKalepithecus xLimnopithecus xMicropithecus xMorotopithecus xProconsul xRangwapithecus xTurkanapithecus xAfropithecus x? xNyanzapithecus x xSimiolus x xEquatorius xMabokopithecus xKenyapithecus xArdipithecus xOrrorin xOtavipithecus xSamburupithecus x
Asia Griphopithecus xAnkarapithecus xGigantopithecus xLufengpithecus xSivapithecus x
Europe Griphopithecus xDryopithecus x xPliopithecus x xGraecopithecus xOreopithecus xOuranopithecus x
This list includes two genera (Ardipithecus and Orrorin) now known from the Late Miocene thathave been classified as hominids (see Chapter 12).
Source: Adapted from Fleagle (1999) with additions from S. Ward et al. (1999), Haile-Selassie(2001), Senut et al. (2001)

Relethford: The Human Species: An Introduction to Biological Anthropology, 5/e
III. Our Place in Nature 11. Primate Origins and Evolution
© The McGraw−Hill Companies, 2003
The skull of a typical Proconsul specimen (Figure 11.10) is more like thatof an ape in that it is large relative to overall body size. The teeth also demon-strate that these forms were hominoid (Figure 11.11). The shape of the lowerpremolar is like that of modern apes, with a single dominant cusp rather thantwo more or less equal-sized cusps, as found in humans. In apes, the singlelarge cusp rubs against, and sharpens, the upper canine tooth. Ape jaws alsohave noticeable gaps (called diastema) next to the canine teeth, which allow thejaws to close. Imagine the problem you would have if your canines were longand protruding and you did not have a gap between the teeth in the oppositejaw for them to fit into. You would not be able to close your mouth or chew!
Overall, the teeth and jaws of Proconsul are similar enough to those ofmodern African apes that they were once thought to be direct ancestors ofthe chimpanzee and gorilla. Today we realize that the situation is more com-plex than this. Environmental reconstructions show that Proconsul lived in
CHAPTER 11 ■ Primate Origins and Evolution 315
FIGURE 11.9
Reconstructed skeleton ofProconsul. (Redrawn fromFleagle, Primate Adaptation andEvolution, 1988, with permission,Academic Press, Inc.)
FIGURE 11.10
Side view of the skull ofProconsul heseloni, thesmallest of several species ofProconsul. (Courtesy of MilfordWolpoff, University of Michigan,Ann Arbor)
diastema A gap next to thecanine tooth that allowsspace for the canine on theopposing jaw.
I I I I I I I
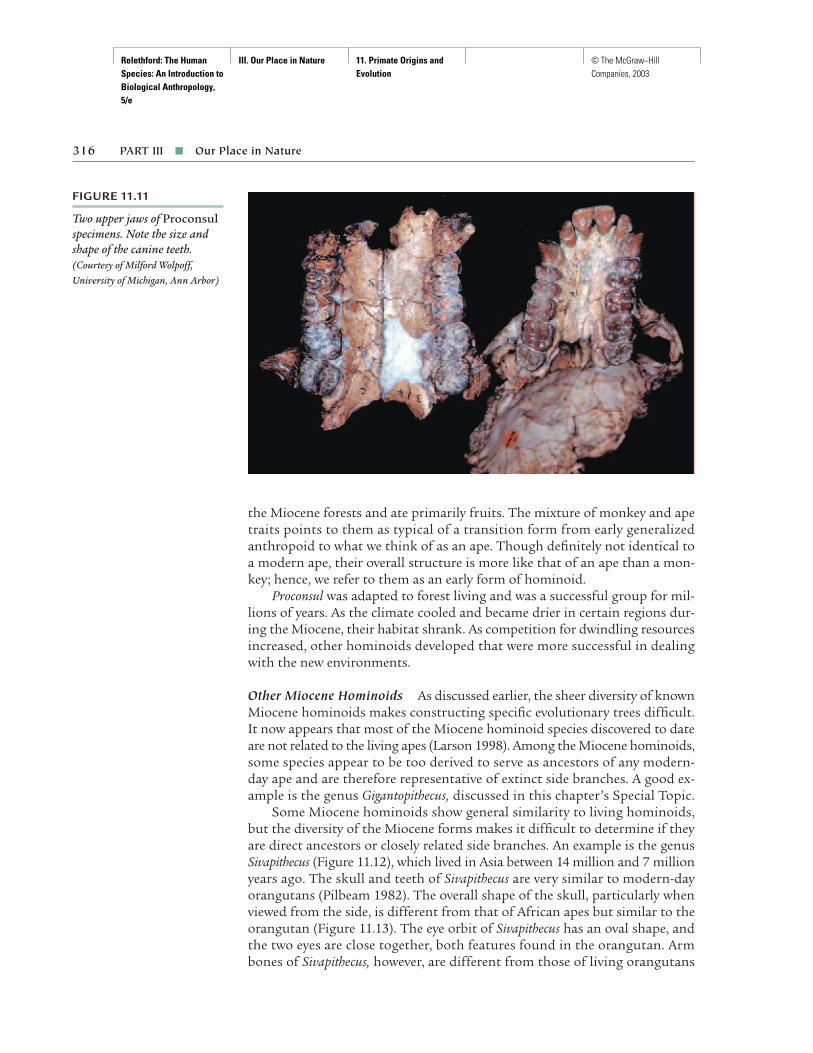
Relethford: The Human Species: An Introduction to Biological Anthropology, 5/e
III. Our Place in Nature 11. Primate Origins and Evolution
© The McGraw−Hill Companies, 2003
the Miocene forests and ate primarily fruits. The mixture of monkey and apetraits points to them as typical of a transition form from early generalizedanthropoid to what we think of as an ape. Though definitely not identical toa modern ape, their overall structure is more like that of an ape than a mon-key; hence, we refer to them as an early form of hominoid.
Proconsul was adapted to forest living and was a successful group for mil-lions of years. As the climate cooled and became drier in certain regions dur-ing the Miocene, their habitat shrank. As competition for dwindling resourcesincreased, other hominoids developed that were more successful in dealingwith the new environments.
Other Miocene Hominoids As discussed earlier, the sheer diversity of knownMiocene hominoids makes constructing specific evolutionary trees difficult.It now appears that most of the Miocene hominoid species discovered to dateare not related to the living apes (Larson 1998). Among the Miocene hominoids,some species appear to be too derived to serve as ancestors of any modern-day ape and are therefore representative of extinct side branches. A good ex-ample is the genus Gigantopithecus, discussed in this chapter’s Special Topic.
Some Miocene hominoids show general similarity to living hominoids,but the diversity of the Miocene forms makes it difficult to determine if theyare direct ancestors or closely related side branches. An example is the genusSivapithecus (Figure 11.12), which lived in Asia between 14 million and 7 millionyears ago. The skull and teeth of Sivapithecus are very similar to modern-dayorangutans (Pilbeam 1982). The overall shape of the skull, particularly whenviewed from the side, is different from that of African apes but similar to theorangutan (Figure 11.13). The eye orbit of Sivapithecus has an oval shape, andthe two eyes are close together, both features found in the orangutan. Armbones of Sivapithecus, however, are different from those of living orangutans
316 PART III ■ Our Place in Nature
FIGURE 11.11
Two upper jaws of Proconsulspecimens. Note the size andshape of the canine teeth.(Courtesy of Milford Wolpoff,University of Michigan, Ann Arbor)

Relethford: The Human Species: An Introduction to Biological Anthropology, 5/e
III. Our Place in Nature 11. Primate Origins and Evolution
© The McGraw−Hill Companies, 2003
317
S P E C I A L T O P I C
The Giant ApeOne of the most interesting Miocene apes found so far isGigantopithecus, which literally means “giant ape.” Theremains of Gigantopithecus have been found in Asia—China,India, and Vietnam—dating back as far as 9 million yearsago (Ciochon et al. 1990). The Chinese specimens may beas recent as 500,000 years ago, meaning that this ape livedat the same time as the species Homo erectus (discussed inChapter 13).
Although it sounds strange, Gigantopithecus was firstfound in a drugstore! Throughout much of Asia, fossilteeth and bones are ground into powder and used invarious potions that are said to have healing properties.The teeth are often called “dragon’s teeth” and are sold in apothecary shops. In 1935, the anthropologist Ralphvon Koenigswald discovered huge teeth in one such storeand later named the fossil remains Gigantopithecus. Sincethen, additional teeth and jaws have been recovered fromfossil sites.
The major characteristic of Gigantopithecus is that ithad huge molar and premolar teeth set in a massive jaw.Another interesting feature is that although the canineteeth are large, they are not that large relative to the restof the teeth. The relatively smaller canines and the thickenamel on the molar teeth suggested to some that Gigan-
topithecus might be related to humans, who have the samecharacteristics. We now realize that Miocene ape evolu-tion is a lot more complicated than we once thought.Gigantopithecus is in some ways similar to Sivapithecus andprobably represents a side branch in Asian ape evolution.
The large teeth and jaws have always captured peo-ple’s imaginations. Based on the size of the teeth, somehave suggested that Gigantopithecus might have stood over 9 feet tall! However, there are wide differences among spe-cies in the relationship between tooth size and body size,and it is more likely that Gigantopithecus was around 6 feettall (which is still pretty big!). Until we find more of thebody, we will not know for sure.
The large molars, thick molar enamel, small canines,and large jaws all suggest an ape that was well adapted fora diet consisting of items that were very hard to chew. Infact, the tips of the canines are worn down in a mannerconsistent with heavy chewing.
Some have suggested that Gigantopithecus is somehowrelated to the mythical “Abominable Snowman,” presum-ably because of its geographic location and possible size.There is no support for this idea (nor for the existence of the Snowman). What Gigantopithecus really shows us isyet another example of the diversity of Miocene apes.
Comparison of the lower jaws of Gigantopithecus (left), a moderngorilla (middle), and a modern human (right). Gigantopithecushas the largest overall size but relatively small canines compared to the gorilla. (Illustrations from Gigantopithecus, by E. L. Simons and
P. C. Ettel. © 1970 by Scientific American, Inc. All rights reserved. Used with
permission of Nelson H. Prentiss)
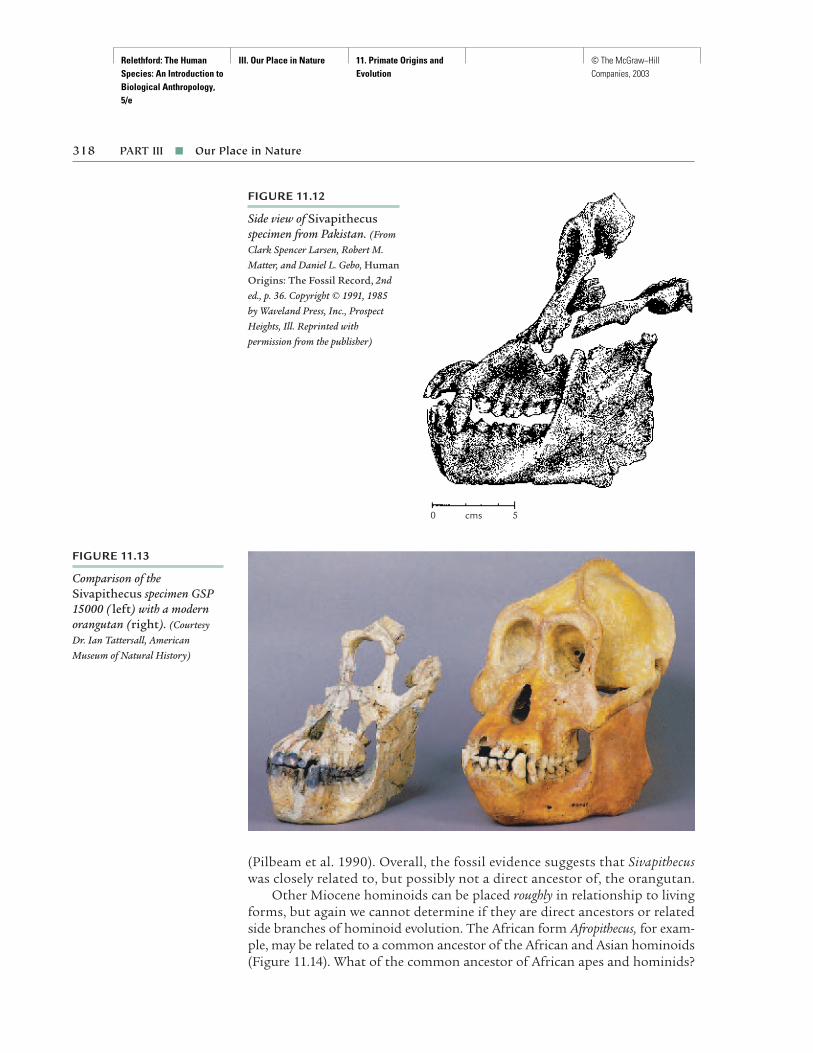
Relethford: The Human Species: An Introduction to Biological Anthropology, 5/e
III. Our Place in Nature 11. Primate Origins and Evolution
© The McGraw−Hill Companies, 2003
(Pilbeam et al. 1990). Overall, the fossil evidence suggests that Sivapithecuswas closely related to, but possibly not a direct ancestor of, the orangutan.
Other Miocene hominoids can be placed roughly in relationship to livingforms, but again we cannot determine if they are direct ancestors or relatedside branches of hominoid evolution. The African form Afropithecus, for exam-ple, may be related to a common ancestor of the African and Asian hominoids(Figure 11.14). What of the common ancestor of African apes and hominids?
318 PART III ■ Our Place in Nature
FIGURE 11.12
Side view of Sivapithecusspecimen from Pakistan. (FromClark Spencer Larsen, Robert M.Matter, and Daniel L. Gebo, HumanOrigins: The Fossil Record, 2nded., p. 36. Copyright © 1991, 1985by Waveland Press, Inc., ProspectHeights, Ill. Reprinted withpermission from the publisher)
0 cms 5
FIGURE 11.13
Comparison of theSivapithecus specimen GSP15000 ( left) with a modernorangutan (right). (CourtesyDr. Ian Tattersall, AmericanMuseum of Natural History)

Relethford: The Human Species: An Introduction to Biological Anthropology, 5/e
III. Our Place in Nature 11. Primate Origins and Evolution
© The McGraw−Hill Companies, 2003
Again, we cannot be definite at present. There are a number of potential can-didates for this common ancestor, including Kenyapithecus, Ouranopithecus,and Dryopithecus, but we lack sufficient information to be more specific otherthan suggesting all of these hominoids belonged to a group that most likelycontained the common ancestor.
Genetic EvidenceIn addition to fossil evidence, our interpretations of Miocene evolution mustalso take genetic evidence from the living hominoids into account. Since the1960s, a comparison of the genetics of living organisms using a set of meth-ods known as molecular dating has shed new light on hominoid evolution.
In Chapter 9 you read about how scientists use molecular informationto judge the relative relationship between living hominoids. These methodsprovide some idea of which primates are most closely related. If certain as-sumptions are made, these methods can be used to provide an estimate of thedate at which two species split from a common ancestor. When two speciesseparate, mutations occur and neutral mutations accumulate in each line
CHAPTER 11 ■ Primate Origins and Evolution 319
FIGURE 11.14
Another example of the diversityof Miocene hominoids—thegenus Afropithecus. Thisspecimen dates to roughly 17 million years ago. In some respects, it is similar to both Proconsul and to later hominoids such asSivapithecus, but in otherdetails (such as facial profile) it is quite different. It mayrepresent a common ancestorof African and Asian hominoidsor may be a side branch inhominoid evolution. (FromClark Spencer Larsen, Robert M.Matter, and Daniel L. Gebo,Human Origins: The FossilRecord, 2nd ed., p. 27. © 1991,1985 by Waveland Press, Inc.,Prospect Heights, Ill. Reprinted withpermission from the publisher)
0 cms 5
molecular dating Theapplication of methods ofgenetic analysis to estimatethe sequence and timing ofdivergent evolutionary lines.
I I I I I I I

Relethford: The Human Species: An Introduction to Biological Anthropology, 5/e
III. Our Place in Nature 11. Primate Origins and Evolution
© The McGraw−Hill Companies, 2003
independently. If the rate of accumulation is constant in both lines, then acomparison of molecular differences in living forms will provide us with a relative idea of how long the two species have been separated.
Imagine three species, A, B, and C, where molecular evidence indicates thatA and B are more closely related to each other than either is to C. We wouldhypothesize that initially species C split off from a common ancestor of allthree, followed by a split of species A and B later on. Suppose we then deter-mine through molecular comparisons that the difference between A and B isone-tenth of the difference between either A or B and species C. This evidencesuggests that the date of divergence of A and B was one-tenth that of the dateof divergence between their common ancestor and species C. Now supposethat we know from fossil evidence that species C split off 40 million years ago.We can then infer that species A and B split from a common ancestor 4 millionyears ago because 4 million years is one-tenth of 40 million years. Here wehave taken the molecular differences between species and used it as a “molec-ular clock,” with our clock calibrated using the fossil record (Figure 11.15).
Molecular dating rests on two major assumptions. First, we assume thatour calibration date is correct. As more fossil evidence accumulates, we mighthave to change our estimate of the date at which species C first split off. Thesecond, more critical assumption is that neutral mutations do accumulate atthe same rate in different lines. There are methods for testing this assump-tion, and it does appear to hold true for some molecular estimates.
Constancy in rates of mutation might seem inconceivable, given thatmutations occur at random. But remember basic probability. If you flip a
320 PART III ■ Our Place in Nature
FIGURE 11.15
Hypothetical example ofmolecular dating.
A B C
The diagram shows the genetic relationship between three hypothetical species (A, B, and C). Let us assume that the genetic distances between these species have been measured and are:
Distance between species A and species B = 2 Distance between species A and species C = 20Distance between species B and species C = 20
Based on these data:
The distance between A and B is one-tenth the distance between A and C (2/20 = 1/10)The distance between A and B is one-tenth the distance between B and C (2/20 = 1/10)
Therefore, the date that species A and B diverged is one-tenth the date that species C diverged from the common ancestor of A and B. If we know from fossil evidence that species C diverged 40 million years ago, then species A and B diverged 4 million years ago (40 × 1/10 = 4).

Relethford: The Human Species: An Introduction to Biological Anthropology, 5/e
III. Our Place in Nature 11. Primate Origins and Evolution
© The McGraw−Hill Companies, 2003
coin 10 times, you will not expect to get five heads and five tails. If you flipthe coin 10 million times, however, you expect to get results closer to the ex-pected 50:50 ratio. Given millions of generations, the random nature of mu-tations also seems constant.
The first use of molecular dating was by Sarich and Wilson (1967), wholooked at differences in albumin protein and found that the difference betweenhumans and the African apes was one-sixth that found between either and theOld World monkeys. Using the then-established estimate of 30 million yearsfor the separation of Old World monkeys, they computed that humans and theAfrican apes had shared a common ancestor 5 million years ago. At that time,most paleoanthropologists thought a date of 15 million to 20 million years agowas more likely and disagreed strongly with Sarich and Wilson’s estimate.
Since that time, a great deal of research has been done on molecular dat-ing and its assumptions. Some researchers disputed the idea of constancy inmutation fixation rates and proposed nonlinear models in their place. Otherproteins have been analyzed. Additional fossil material was found, and newinterpretations of older data were made. Most paleoanthropologists now ac-cept a much more recent split of humans and apes than was the consensusseveral decades ago.
Different data and different methods lead to some variation in estimatesfrom molecular dating. Still, in general the results are consistent. Figure 11.16shows these results superimposed on the picture of evolutionary relation-ships of humans and great apes that was discussed in Chapter 9. The firstsplit was the line leading to orangutans roughly 16 million to 12 million yearsago. The other line consisted of the African hominoids (as shown in the nextchapter, the first hominids arose in Africa). The gorilla line split off next, atroughly 8 million to 6 million years ago, followed by the split between the hom-inid and chimpanzee–bonobo lines at roughly 6 million to 5 million years ago.The chimpanzee and bonobo lines then split at roughly 2.5 million years ago.
ConclusionsBy the early 1960s, anthropologists thought that they had reconstructed theevolutionary tree of the living hominoids and had suitable fossil species iden-tified as the ancestors of modern species. The preliminary dental evidencesuggested a small number of fossil apes dating back 20 million to 15 million
CHAPTER 11 ■ Primate Origins and Evolution 321
FIGURE 11.16
Suggested evolutionaryrelationships between humansand the great apes based ongenetic analysis. The datesrepresent the range in estimatesfrom molecular dating. (Horaiet al. 1995, Gagneux et al. 1999,Chen and Li 2001)
BonoboGorilla Orangutan Chimpanzee Human
3–2.5 Ma
6–5 Ma
8–6 Ma
16–12 Ma

Relethford: The Human Species: An Introduction to Biological Anthropology, 5/e
III. Our Place in Nature 11. Primate Origins and Evolution
© The McGraw−Hill Companies, 2003
years that resembled, in a general sense, presumed ancestors of gorillas, chim-panzees, and humans. We now realize these conclusions were premature. TheMiocene hominoids were much more diverse than once thought. The post-cranial remains of the early forms (e.g., Proconsul) showed us that the earliestMiocene hominoids were quite primitive in some features and had only re-cently branched off from the Old World monkeys. This evidence, combinedwith insights from genetics and molecular dating, led to our current obser-vation of a much later divergence of modern hominoids. Instead of an ape–human split some 20 million to 15 million years ago, we now suggest a morerecent date of 8 million to 5 million years ago, with gorillas branching offearlier than the line leading to chimpanzees and bonobos. There is still somedebate over the exact branching pattern of the African hominoids. Many ac-cept the earlier divergence of the gorilla line, but others argue that gorillas,chimpanzees, and bonobos all shared a common ancestor after the divergenceof hominids (Figure 11.17).
Because there were many more hominoids in the past than live today,the obvious conclusion is that many of the fossils we find belong to speciesthat became extinct side branches. We are able to see, in a general sense, thebroad outline of Miocene evolution, but we are not able to draw a detailedand complete “family tree.” During the early Miocene, the first hominoidswere primitive in many ways, and they represent a link between monkeys andapes. During the rest of the Miocene, several adaptive radiations of Miocenehominoids led to many species in Africa, Europe, and Asia. By 6 million yearsago or so, the line leading to later hominids, our own ancestors, had diverged.
322 PART III ■ Our Place in Nature
FIGURE 11.17
Alternative models of theevolutionary relationshipamong the African hominoids.(a) The gorilla splits off firstand the chimpanzee–bonoboand human lines have a morerecent common ancestor. (b) The gorilla andchimpanzee–bonobo lines have a more recent commonancestor. Genetic and someanatomical evidence favors (a),but some anatomical analysisfavors (b).
a.
b.
BonoboGorilla Chimpanzee Human
BonoboGorilla Chimpanzee Human
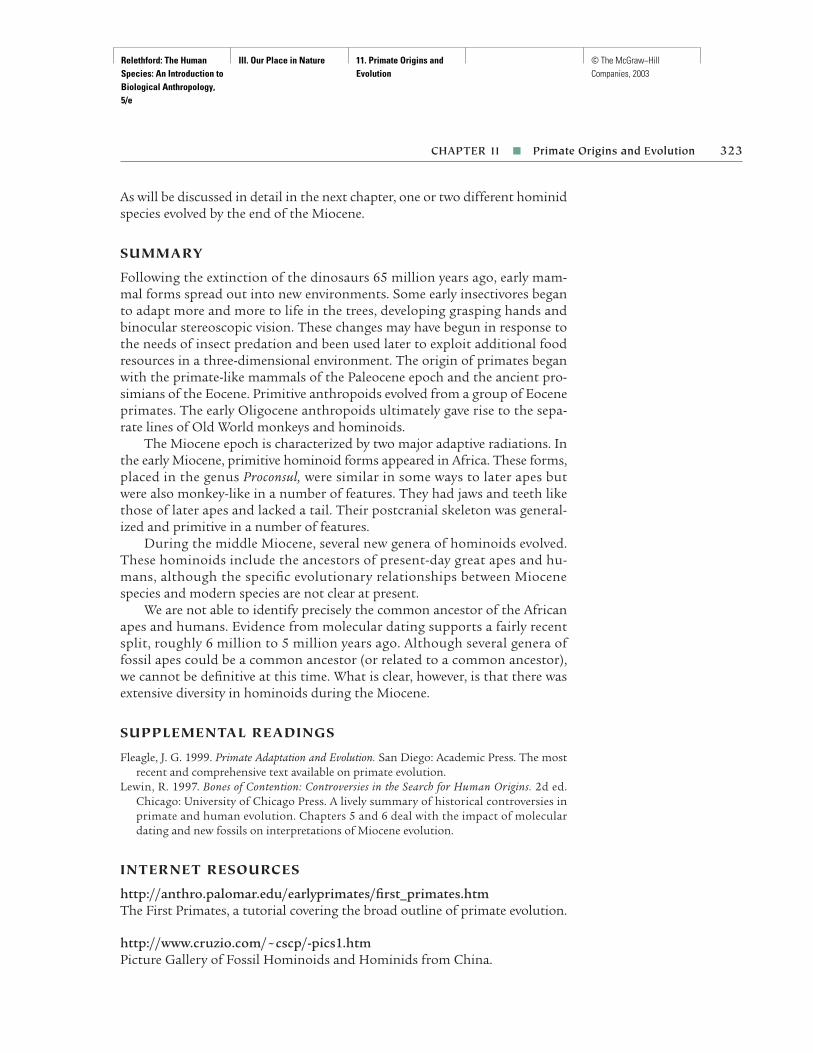
Relethford: The Human Species: An Introduction to Biological Anthropology, 5/e
III. Our Place in Nature 11. Primate Origins and Evolution
© The McGraw−Hill Companies, 2003
As will be discussed in detail in the next chapter, one or two different hominidspecies evolved by the end of the Miocene.
SUMMARY
Following the extinction of the dinosaurs 65 million years ago, early mam-mal forms spread out into new environments. Some early insectivores beganto adapt more and more to life in the trees, developing grasping hands andbinocular stereoscopic vision. These changes may have begun in response tothe needs of insect predation and been used later to exploit additional foodresources in a three-dimensional environment. The origin of primates beganwith the primate-like mammals of the Paleocene epoch and the ancient pro-simians of the Eocene. Primitive anthropoids evolved from a group of Eoceneprimates. The early Oligocene anthropoids ultimately gave rise to the sepa-rate lines of Old World monkeys and hominoids.
The Miocene epoch is characterized by two major adaptive radiations. Inthe early Miocene, primitive hominoid forms appeared in Africa. These forms,placed in the genus Proconsul, were similar in some ways to later apes butwere also monkey-like in a number of features. They had jaws and teeth likethose of later apes and lacked a tail. Their postcranial skeleton was general-ized and primitive in a number of features.
During the middle Miocene, several new genera of hominoids evolved.These hominoids include the ancestors of present-day great apes and hu-mans, although the specific evolutionary relationships between Miocenespecies and modern species are not clear at present.
We are not able to identify precisely the common ancestor of the Africanapes and humans. Evidence from molecular dating supports a fairly recentsplit, roughly 6 million to 5 million years ago. Although several genera offossil apes could be a common ancestor (or related to a common ancestor),we cannot be definitive at this time. What is clear, however, is that there wasextensive diversity in hominoids during the Miocene.
SUPPLEMENTAL READINGS
Fleagle, J. G. 1999. Primate Adaptation and Evolution. San Diego: Academic Press. The mostrecent and comprehensive text available on primate evolution.
Lewin, R. 1997. Bones of Contention: Controversies in the Search for Human Origins. 2d ed.Chicago: University of Chicago Press. A lively summary of historical controversies inprimate and human evolution. Chapters 5 and 6 deal with the impact of moleculardating and new fossils on interpretations of Miocene evolution.
INTERNET RESOURCES
http://anthro.palomar.edu/earlyprimates/first_primates.htmThe First Primates, a tutorial covering the broad outline of primate evolution.
http://www.cruzio.com/~cscp/-pics1.htmPicture Gallery of Fossil Hominoids and Hominids from China.
CHAPTER 11 ■ Primate Origins and Evolution 323

Relethford: The Human Species: An Introduction to Biological Anthropology, 5/e
IV. Human Evolution Introduction © The McGraw−Hill Companies, 2003
PA R T IVHumanEvolution
What is the evidence for human evolution? This ques-tion has several answers because our knowledge ofhuman evolution comes from several sources—thefossil record, the archaeological record, and geneticevidence. In addition to trying to understand the bi-ological evolution of human beings, it is also neces-sary to understand how our cultural adaptationshave changed and how these changes relate to the bi-ological changes and the question of what humansare. It is important to keep in mind that our presentstate did not come about all at once and that differ-ent human characteristics evolved at different times.The most dramatic example is the evidence for bi-pedalism 3.5 million to 4 million years before a sig-nificant increase in brain size or the development ofstone tool technology. Chapter 12 looks at the evi-dence of the first hominids and the origin of bipedal-ism. The origin and evolution of the genus Homo isconsidered in Chapter 13, followed by discussion overthe origin of modern humans in Chapter 14. Chapter15 concludes with an examination of the biologicalimpact of our species’ rapid cultural changes duringthe past 12,000 years since the origin of agriculture.
Relethford: The Human Species: An Introduction to Biological Anthropology, 5/e
IV. Human Evolution 12. Hominid Origins © The McGraw−Hill Companies, 2003
C H A P T E R 12Hominid Origins
327
How old is the human species? Anthropologists are frequently asked thisquestion, and it seems simple enough. But in fact we have no simple an-
swer. The answer depends on how we define human beings. If we limit ourquestion to humans who are more or less anatomically similar to living hu-mans, the answer is roughly 100,000 years. If we include all large-brained hu-mans, even those with a somewhat different skull shape, the answer mightbe close to 500,000 years. If we focus on all members of the genus Homo, withsome significant cranial expansion and a dependence on stone tools, the an-swer is more than 2 million years. If we include all bipedal hominids, the an-swer is close to 6 million years.
Past human evolution was not a one-step process. Humans did notemerge instantaneously from an apelike ancestor. What we are, biologicallyand culturally, is the product of many different evolutionary changes occur-ring at different times. The fossil record of human evolution is now com-plete enough to see that the characteristics of living humans have evolvedover time in a mosaic fashion. New fossil evidence now suggests that bipedal-ism first arose close to 6 million years ago, around the time of the divergenceof hominids and African apes. A number of dental changes took place overthe next few million years. The first major increase in brain size, and the firstuse of stone tool technology, took place between 2.5 million and 2 million
Fossil footprints at the site of Laetoli, Tanzania. These footprints, dating over3.7 million years old, were most likely made by the species Australopithecusafarensis, an early hominid. The inset shows a reconstruction of what thisspecies might have looked like. (Footprints: © John Reader/Science Photo Library/Photo Researchers, Inc.; Inset: Neg. #4744(5). Photo by D. Finnin/C. Chesek. CourtesyDepartment of Library Services, American Museum of Natural History)
▲

Relethford: The Human Species: An Introduction to Biological Anthropology, 5/e
IV. Human Evolution 12. Hominid Origins © The McGraw−Hill Companies, 2003
years ago. Brain size roughly equivalent to living humans appeared within thepast few hundred thousand years, and modern cranial shape within the past100,000 years or so. Many of our current cultural patterns appear even morerecently. It was only 12,000 years ago that humans began relying on agricul-ture and only 6,000 years ago that the first civilizations and complex state-level societies appeared. Many of the things we take for granted in our ownlives today, such as automobiles, nuclear energy, and computer technology,are even more recent, many developing only in the last generation or two.
This chapter examines the beginning of the story of human evolution,focusing on the earliest hominids prior to the appearance of the genus Homo.The fossil species discussed in this chapter all lived in Africa between 6 mil-lion and 1 million years ago.
OVERVIEW OF HUMAN EVOLUTION
The study of human evolution is fascinating but often confusing the firsttime around. To follow the evolutionary history of the first hominids, youmust become familiar with a multitude of different names, places, and events.Just as rereading a book often reveals more insight because you now have aframework within which to integrate the information, it is useful to considerthe general picture of human evolution before absorbing the details.
A succinct discussion of the main events in human evolution goes some-thing like this: “The first hominids appeared in Africa about 6 million yearsago. They had apelike teeth and ape-sized brains but walked on two legs. By2 million years ago, brain size began to increase significantly and stone toolswere being used. Hunting added meat to a diet of fruits and vegetable matterobtained from gathering. Some populations expanded out of Africa intoAsia and Europe. By half a million years ago, brain size was even larger andtechnology continued to develop. Ultimately, some of these large-brainedforms evolved into us.” This summary, while accurate, is of course overly sim-plistic. For one thing, it implies that there was a steady line of change fromthe earliest hominids to us. In actuality, the process is quite a bit more com-plex, and there were several points along the way when more than one homi-nid line existed at the same time.
The most important concept we learn from this overview is that bipedal-ism evolved well before larger brains. The final section of this chapter looks atthe evidence for the origin of bipedalism and examines possible hypothesesfor its origin.
Let us look at the story of human evolution now in somewhat more de-tail (Figure 12.1 provides a graphic representation of this review). As dis-cussed in the previous chapter, our best estimates from molecular datingsuggest that the hominid line split from the African apes about 6 millionyears ago. Our earliest fossil evidence of hominids is at this time, representedby the genus Ardipithecus and possibly by another genus, Orrorin. These earlyhominids had very primitive apelike teeth but were bipedal and lived in andaround the forested woodlands of eastern Africa. One or more species of
328 PART IV ■ Human Evolution

Relethford: The Human Species: An Introduction to Biological Anthropology, 5/e
IV. Human Evolution 12. Hominid Origins © The McGraw−Hill Companies, 2003
primitive hominids lived in Africa over the next few million years, most clas-sified in the genus Australopithecus, and they retained their apelike features insome teeth and had ape-sized brains. These early hominids were bipedal, butthey may have spent time climbing in the trees as well as walking on theground. They foraged for food, primarily fruit, in the woodlands and sa-vanna. By 3 million years ago, a rapid diversification led to at least two dis-tinct lines of hominid evolution. One line led to several species known as the“robusts,” named after their large back teeth and powerful chewing muscles.The robusts were well adapted to a diet that was hard to chew, such as seeds,nuts, and hard-skinned fruits. They became extinct by 1 million years ago.The other line of hominid began to rely more and more on learned behaviorand perhaps began using the first stone tools.
One species of Australopithecus evolved into the first members of the genusHomo sometime between 2.5 million and 2 million years ago. The speciesknown as Homo erectus appears in Africa by 2 million years ago, having an
CHAPTER 12 ■ Hominid Origins 329
FIGURE 12.1
Simplified summary ofhominid evolution emphasizingmajor evolutionary events.
0
1
2
3
4
5
6
Modern humansBone toolsArtFurther geographic expansion
Further increase in brain sizeFurther developments of stone toolsHunting and gatheringUse of fireExpansion out of Africa
Increase in brain sizeStone toolsScavenging and hunting
Ape–hominid split
Onl
y in
Afr
ica
Bec
omin
gw
orld
wid
e
Bipedal Small brainLarge teethNo stone tools
Origin of bipedalism
Variation inskulls and teeth
The genus Homo
First primitivehominids
Millions of years ago
Diversification of hominids
Living humans

Relethford: The Human Species: An Introduction to Biological Anthropology, 5/e
IV. Human Evolution 12. Hominid Origins © The McGraw−Hill Companies, 2003
essentially modern skeleton, full bipedal adaptations, and a brain much largerthan earlier hominids (roughly three-fourths the size of a modern human,on average). Homo erectus was the first hominid to expand out of Africa, mov-ing into parts of Asia and Europe. Homo erectus hunted, used fire, and inventeda new form of general purpose stone tool known as the hand axe.
Brain size increased rapidly by about 700,000 years ago, and by 500,000years ago brain size was roughly the same as ours today. These humans stillhad a rather large face and a less well-rounded skull compared with modernhumans, however. Anthropologists are still debating whether these “archaic”humans are an earlier stage of our own species or represent more than onespecies. The relationship between these archaic humans and the first more“anatomically modern” humans, which appeared in Africa 130,000 years ago,is still quite controversial (and is discussed in detail in Chapter 14).
By 50,000 years ago, a “creative explosion” of culture had taken place, as-sociated with new technologies, such as bone tools, and new behaviors, suchas art. Modern humans dispersed even farther geographically, reaching Aus-tralia by 60,000 years ago and the New World by 13,000 years ago. Starting12,000 years ago, human populations in several different places developedagriculture and the human species began to increase rapidly in number.Cities and state-level societies began about 6,000 years ago. Subsequent cul-tural developments took place at an ever-increasing pace. The Industrial Rev-olution began only 250 years ago. The use of electricity as a power source be-came common only during the twentieth century. Finally, it has been lessthan 50 years since the exploration and colonization of outer space began,another step in the geographic expansion of human beings.
This brief review shows one thing very clearly—what we are today as mod-ern humans did not come about all at the same time but at different timesover millions of years. Thus, we should not speak of a single origin, but ratherof multiple origins.
THE FIRST HOMINIDS
When Darwin wrote his first edition of On the Origin of Species, very little wasknown about the fossil record of human evolution. By the beginning of thetwentieth century we knew a bit more, but only about species now classifiedin the genus Homo. In 1924, anatomist Raymond Dart discovered an earlierform of hominid that had humanlike teeth and walked upright but still hada small ape-sized brain. Dart (1925) named this new species Australopithecusafricanus (which translates as the southern ape of Africa, named so because itwas found in South Africa). Over the next several decades, additional speci-mens were discovered and several new species of the genus Australopithecuswere named.
By the early 1970s, three species of Australopithecus were known, with theoldest dating back about 3 million years. By the late 1980s, another twospecies had been discovered, and the earliest hominid evidence now datedback 4 million years. Since 1990, five new species of early hominid have beendiscovered. Indeed, two of these species have been discovered since the last
330 PART IV ■ Human Evolution

Relethford: The Human Species: An Introduction to Biological Anthropology, 5/e
IV. Human Evolution 12. Hominid Origins © The McGraw−Hill Companies, 2003
edition of this textbook! As you can see, the amount of information we haveon these first hominids has increased dramatically in recent years.
We now have evidence for at least 10 species of early hominid from Africadating between roughly 6 million and 2 million years ago. This increase hasshown us that early hominid evolution was not a simple linear chain withone species evolving into the next; rather, it is a “bush” with many branches.Although there is only one hominid species alive today (us), the situationwas different in the past. At several points in time there was more than onehominid species. The challenge for anthropologists is to figure out how thesedifferent species were related to each other and our own path of ancestry.Which ones were our direct ancestors, and which ones represent extinct sidebranches?
The first hominids were bipedal but had small cranial capacities, a mea-sure of the interior volume of the brain case, measured in cubic centimeters(cc). In many ways, the early hominids can be considered bipedal apes. Theyare classified as hominid because they were bipedal and possessed certain de-rived features of the teeth (although this varies among species). Because theyalso retained a number of primitive ape characteristics, we generally do notequate them directly with “humans.” To do so implies that their biology andbehavior were in many ways similar to our own.
The early hominids described in this chapter have been found dating be-tween 6 million and 1 million years ago. This time period includes portionsof the Miocene epoch, the Pliocene epoch (5–1.7 Ma), and the Pleistoceneepoch (1.7–0.01 Ma).
The first hominids have all been found only in Africa, which supportsDarwin’s early idea that Africa was the birthplace of hominids and is consis-tent with the fact that the closest living relatives of humans are the Africanapes. It also means that hominids were limited to a specific environment—woodlands and tropical grasslands for the most part. Not until later in thefossil record (see Chapters 13 and 14) do we see evidence for hominids mov-ing outside of Africa. Figure 12.2 shows the location of some of the majorsites of the hominids discussed in this chapter, and Table 12.1 lists some ofthese sites. Note that there have been two major areas of discovery, SouthAfrica and East Africa. The geology of South Africa has made chronometricdating difficult, and for many years we were not sure exactly how old the earlySouth African hominids were. Sites in East Africa are better dated; extensivevolcanic activity in East Africa millions of years ago allows us to use potassium-argon and argon-argon dating methods at these sites.
Primitive Hominids (6–3 Ma)This section focuses on the earliest hominids, dating between 6 million and3 million years ago. Four species have been discovered within this time rangeand can be considered as primitive hominids. Remember that “primitive”refers in a biological sense to the possession of traits from earlier ancestors.In this case, the first hominids can be considered primitive in many ways be-cause they retain a number of ape characteristics that are not found in laterhominids. From an evolutionary perspective, this makes perfect sense. After
CHAPTER 12 ■ Hominid Origins 331
cranial capacity Ameasurement of the interiorvolume of the brain case usedas an approximate estimateof brain size.
Pliocene epoch The fifthepoch of the Cenozoic era,dating from 5 million to 1.7 million years ago.
Pleistocene epoch Thesixth epoch of the Cenozoicera, dating from 1.7 millionto 0.01 million years ago.
I I I I I I I

Relethford: The Human Species: An Introduction to Biological Anthropology, 5/e
IV. Human Evolution 12. Hominid Origins © The McGraw−Hill Companies, 2003
the African ape and hominid lines split, each line would have retained primi-tive characteristics of its common ancestor for some time. Among the earli-est hominids, such characteristics include large canine teeth, apelike config-urations of the skull and teeth, and ape-sized brains. The earliest hominidsalso had certain derived characteristics, primarily the development of bipedalanatomy. Even here, however, the earliest hominids are somewhat primitive.
Orrorin and Ardipithecus—The First Hominids? The oldest known spe-cies that have been labeled hominid are Orrorin tugenesis (6 Ma) and Ardi-pithecus ramidus (5.8–4.4 Ma). Both are only recently known; Ardipithecus wasfirst announced in 1995 and Orrorin in 2001. Orrorin is known from the frag-
332 PART IV ■ Human Evolution
FIGURE 12.2
Location of some of the majorsites in Africa where earlyhominid specimens have beenfound.
SOUTH AFRICA
TANZANIA
KENYA
ETHIOPIA
CHAD
Taung
SterkfonteinSwartkrans
Olduvai
Omo
Hadar
Bouri
Bahr el Ghazal
Laetoli
Makapansgat
Kromdraai
0
0
250 500 750 1000 Miles
500 750250 1000 Kilometers
Aramis
Fejej
Tugen Hills
Lake Natron
Allia Bay
Konso
Kanapoi
Lake Victoria
Lake Turkana
Orrorin tugenensis An earlyprimitive hominid speciesfrom Africa dating to thelate Miocene (6 Ma).
Ardipithecus ramidus Anearly primitive hominidspecies from Africa datingbetween 5.8 million and 4.4 million years ago.
I I I I I I I
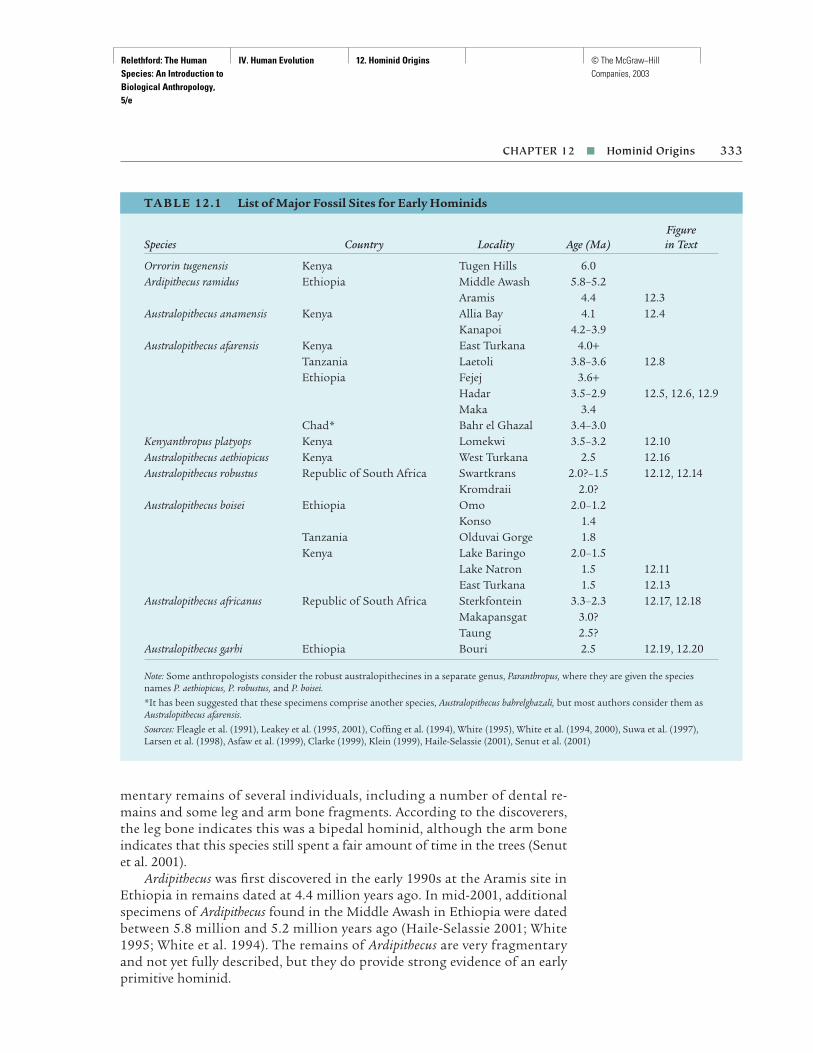
Relethford: The Human Species: An Introduction to Biological Anthropology, 5/e
IV. Human Evolution 12. Hominid Origins © The McGraw−Hill Companies, 2003
mentary remains of several individuals, including a number of dental re-mains and some leg and arm bone fragments. According to the discoverers,the leg bone indicates this was a bipedal hominid, although the arm boneindicates that this species still spent a fair amount of time in the trees (Senutet al. 2001).
Ardipithecus was first discovered in the early 1990s at the Aramis site inEthiopia in remains dated at 4.4 million years ago. In mid-2001, additionalspecimens of Ardipithecus found in the Middle Awash in Ethiopia were datedbetween 5.8 million and 5.2 million years ago (Haile-Selassie 2001; White1995; White et al. 1994). The remains of Ardipithecus are very fragmentaryand not yet fully described, but they do provide strong evidence of an earlyprimitive hominid.
CHAPTER 12 ■ Hominid Origins 333
TA B L E 12 .1 List of Major Fossil Sites for Early Hominids
FigureSpecies Country Locality Age (Ma) in Text
Orrorin tugenensis Kenya Tugen Hills 6.0Ardipithecus ramidus Ethiopia Middle Awash 5.8–5.2
Aramis 4.4 12.3Australopithecus anamensis Kenya Allia Bay 4.1 12.4
Kanapoi 4.2–3.9Australopithecus afarensis Kenya East Turkana 4.0+
Tanzania Laetoli 3.8–3.6 12.8Ethiopia Fejej 3.6+
Hadar 3.5–2.9 12.5, 12.6, 12.9Maka 3.4
Chad* Bahr el Ghazal 3.4–3.0Kenyanthropus platyops Kenya Lomekwi 3.5–3.2 12.10Australopithecus aethiopicus Kenya West Turkana 2.5 12.16Australopithecus robustus Republic of South Africa Swartkrans 2.0?–1.5 12.12, 12.14
Kromdraii 2.0?Australopithecus boisei Ethiopia Omo 2.0–1.2
Konso 1.4Tanzania Olduvai Gorge 1.8Kenya Lake Baringo 2.0–1.5
Lake Natron 1.5 12.11East Turkana 1.5 12.13
Australopithecus africanus Republic of South Africa Sterkfontein 3.3–2.3 12.17, 12.18Makapansgat 3.0?Taung 2.5?
Australopithecus garhi Ethiopia Bouri 2.5 12.19, 12.20
Note: Some anthropologists consider the robust australopithecines in a separate genus, Paranthropus, where they are given the speciesnames P. aethiopicus, P. robustus, and P. boisei.
*It has been suggested that these specimens comprise another species, Australopithecus bahrelghazali, but most authors consider them asAustralopithecus afarensis.
Sources: Fleagle et al. (1991), Leakey et al. (1995, 2001), Coffing et al. (1994), White (1995), White et al. (1994, 2000), Suwa et al. (1997),Larsen et al. (1998), Asfaw et al. (1999), Clarke (1999), Klein (1999), Haile-Selassie (2001), Senut et al. (2001)

Relethford: The Human Species: An Introduction to Biological Anthropology, 5/e
IV. Human Evolution 12. Hominid Origins © The McGraw−Hill Companies, 2003
Most of the remains are dental (Figure 12.3), and they have a number ofapelike features, such as large canines. Certain features, however, are homi-nid, such as the canines being more like incisors in structure (as is the casewith later hominids and living humans). The cranial remains are also apelikeand show many primitive characteristics, although the location of the fora-men magnum (the large hole in the base of the skull where the spinal cordenters) suggests bipedalism. A toe bone also supports the interpretation thatArdipithecus was bipedal.
Both Orrorin and Ardipithecus are primitive in a number of features. Bothspecies existed around the time molecular dating estimates that the hominidline split off from the African apes. As such, we would expect the earliest fos-sils to be very primitive and retain a number of apelike traits. This is exactlywhat the fossils show, although the primitive nature of both species makesevolutionary relationships difficult to interpret. The closer we get to thepoint of ape–hominid divergence, the more difficult it becomes to tell whichline a given species belongs to. This problem is reflected in the ongoing de-bate over the evolutionary status of these species. At present, most research-ers accept Ardipithecus as a hominid (although see Senut et al. 2001), but theevolutionary status of Orrorin is more in doubt (e.g., Aiello and Collard2001). Haile-Selassie (2001) argues that Orrorin might actually represent thelast common ancestor of the hominid and chimpanzee–bonobo lines. Fur-ther analysis and data are needed to resolve these questions (at this writing,both Orrorin and the oldest Ardipithecus specimens had just been announced,and it will take several years for additional comparisons to be made).
Australopithecus Anamensis A somewhat younger species, Australo-pithecus anamensis, is definitely a hominid, although still somewhat primi-tive. A number of the first hominids have been assigned to the genus Austra-lopithecus, which literally translates as “southern ape,” so named because the
334 PART IV ■ Human Evolution
FIGURE 12.3
Fragmentary remains ofArdipithecus ramidus, anearly hominid species (datingback 5.8–4.4 Ma). Althoughfragmentary, the remains of Ardipithecus suggest aspecies with bipedalism butvery apelike teeth. (© 1994 TimD. White/Brill Atlanta)
foramen magnum Thelarge opening at the base ofthe skull where the spinalcord enters, which is locatedmore under the skull inbipeds as compared to four-legged vertebrates.
Australopithecus anamensisA hominid species that lived in East Africa between4.2 million and 3.9 millionyears ago. It was a biped buthad many primitive apelikefeatures of the skull andteeth.
Australopithecus A genus of fossil hominid that livedbetween 4.2 million and 1 million years ago and ischaracterized by bipedallocomotion, small brain size,large face, and large teeth.
I I I I I I I

Relethford: The Human Species: An Introduction to Biological Anthropology, 5/e
IV. Human Evolution 12. Hominid Origins © The McGraw−Hill Companies, 2003
first species discovered in this genus was found in South Africa (Dart 1925).This may sound confusing because Australopithecus anamensis, as well as anumber of other australopithecine species, are known only from East Africa.The reason for this confusion is that scientists have agreed to an interna-tional system of naming genera and species in which the first name giventakes precedence even if the name is no longer the most appropriate. Al-though confusing at times, this system is better than having everyone re-name things all the time.
The species A. anamensis (“A.” is an abbreviation of Australopithecus) isfairly recently known, having been announced in 1995 (Leakey et al. 1995).Fossils of this species come from two sites along the shores of Lake Turkana(see Figure 12.2). The species name is based on the word for lake (anam) inthe Turkana language. A total of 52 specimens have been recovered from twosites (Leakey et al. 1995, 1998). The fossil evidence consists primarily of den-tal remains (Figure 12.4) but also includes skull fragments and pieces of anupper arm bone and lower leg bone. The leg bone is particularly informativebecause it indicates bipedalism. The teeth, jaw, and skull fragments all showprimitive apelike characteristics, such as large canine teeth and a small earhole. Estimates of weight, based on statistical relationships known to existbetween body size and bone measurements, suggest individuals weighedroughly 47 kg to 58 kg (104–128 lb). In summary, A. anamensis shows a mixof features that are primitive and derived (such as bipedalism), further evi-dence that human features did not evolve all at once. It is possible that thisspecies represents a link between the earliest and later hominids (Ward, Leakey,and Walker 1999).
Australopithecus Afarensis The best known of the primitive hominidsis the species Australopithecus afarensis, which lived in East Africa between 4 million and 2.9 million years ago and may include less well-known homi-nids found at one site in Chad in central Africa. Much of our data on this
CHAPTER 12 ■ Hominid Origins 335
FIGURE 12.4
Some fossil specimens ofAustralopithecusanamensis: lower jaw ( left) and facial (right).Australopithecusanamensis was a biped but still had very apelikefeatures in the jaws and teeth.(© Kenneth Garrett/NationalGeographic Society ImageCollection)
Australopithecus afarensis Aprimitive hominid found inEast Africa dating between 4 million and 3 millionyears ago.
I I I I I I I

Relethford: The Human Species: An Introduction to Biological Anthropology, 5/e
IV. Human Evolution 12. Hominid Origins © The McGraw−Hill Companies, 2003
species comes from Donald Johanson’s fieldwork in the 1970s at the site ofHadar, Ethiopia (see Figure 12.2). The fossils collected by Johanson and col-leagues date between 3.5 million and 2.9 million years ago. Additional fossilscollected by Mary Leakey at the site of Laetoli, Tanzania, date to 3.8 millionyears ago. Johanson and colleagues (1978) noted the close similarity betweenthe Hadar and Laetoli finds and placed them together in the species Australo-pithecus afarensis. The species name afarensis derives from the Afar region wherethe Hadar site is located. Additional fossils of A. afarensis have also been dis-covered at a number of other sites, mostly in Ethiopia (see Table 12.1). Theabundance of data available for A. afarensis gives us a more detailed picture oftheir anatomy than is so far available for the earlier primitive hominids al-ready described.
A. afarensis is less primitive than earlier hominids but still more primitivethan later hominids. It is more apelike in certain characteristics, such as cra-nial features (Figure 12.5), than later hominid species, having a small brainand a lower face that juts out. Nonetheless, it is definitely hominid, for itpossessed the human form of bipedalism. The most dramatic find showingbipedalism is the fossil nicknamed “Lucy,” a 40 percent complete skeleton ofan adult female (Figure 12.6). We know Lucy was an adult because her thirdmolar teeth had fully erupted, an event that occurs in young adulthood inhominids. We also know she was a female because most of her pelvis is in-tact. Determining the sex of a fossil is best done by examination of the pelvis(Figure 12.7). Females have a wider and more rounded pelvic opening amongother features. Such comparisons show that Lucy was a female.
Although an adult, Lucy was small. She was little over a meter tall (about3 ft 3 in.) and weighed roughly 27 kg (60 lb) (McHenry 1992). Her pelvicbones and femur show bipedal locomotion. In addition to Lucy, other fossilsshow bipedalism, including a knee joint. In addition, fossil footprints havebeen found at the Laetoli site dating back almost 3.8 million years (Figure12.8). These prints show the bipedal characteristics of a nondivergent bigtoe, heel strike, and a well-developed arch.
All of this evidence indicates that A. afarensis was bipedal. Because bipedallocomotion is unique to humans among living primates, we classify A. afarensis
336 PART IV ■ Human Evolution
FIGURE 12.5
Side view of a cranium ofAustralopithecus afarensis.(© Institute of Human Origins,photograph by W. H. Kimbel)

Relethford: The Human Species: An Introduction to Biological Anthropology, 5/e
IV. Human Evolution 12. Hominid Origins © The McGraw−Hill Companies, 2003
FIGURE 12.6
The skeletal remains of “Lucy,” a 40 percent complete specimen ofAustralopithecus afarensis.(© John Reader/Science PhotoLibrary/Photo Researchers, Inc.)
FIGURE 12.7
Comparison of the pelvicanatomy of modern humanmales and females. (FromHuman Antiquity: AnIntroduction to PhysicalAnthropology andArchaeology, 2d ed., byKenneth Feder and MichaelPark, Fig. 7.17. Copyright ©1993 by Mayfield PublishingCompany. Reprinted withpermission of The McGraw-HillCompanies)
MALE
FEMALE
Ilia more nearly vertical
Ilia splayedoutward
Greater sciaticnotch wide
Greater sciaticnotch narrow
Subpubic anglesmaller
Subpubic angle larger
337

Relethford: The Human Species: An Introduction to Biological Anthropology, 5/e
IV. Human Evolution 12. Hominid Origins © The McGraw−Hill Companies, 2003
as a hominid, although opinion differs on how bipedal it was. Some havenoted certain ape tendencies in the postcranial fossils, such as relatively longarms and curved finger and toe bones. These apelike traits have been inter-preted in two ways. First, they might simply be retentions from a recent ape-like origin. Second, they might indicate that despite its bipedalism A. afarensisdid not walk exactly the same way we do, had considerable climbing ability, andmay have spent a fair amount of time in the trees (Stern and Susman 1983).
Cranial material for A. afarensis consists of a number of fragments and afairly complete skull of an adult male (see Figure 12.5). These remains showa small brain, a large protruding face, and a number of primitive features onthe back and bottom of the cranium (Kimbel et al. 1994). The brain size ofA. afarensis ranges between 400 cc and 500 cc (Aiello and Dunbar 1993). Over-all, the skull of A. afarensis resembles that of a small ape.
The teeth of A. afarensis are less primitive than found in Orrorin, Ardi-pithecus, or A. anamensis, but they are still more primitive than in Homo. Theteeth show a number of characteristics intermediate between apes and hu-mans. The teeth of modern apes and humans can be easily distinguished(Figure 12.9). The canines of apes are generally large and protrude past thesurface of the other teeth, whereas modern humans have small, nonproject-ing canine teeth. The canine teeth of A. afarensis are intermediate; they arelarger and more projecting than those of modern humans but smaller thanin most modern apes. An ape’s upper jaw has a diastema (gap) between the
FIGURE 12.8
Fossil footprints at the Laetolisite. (© John Reader/Science PhotoLibrary/Photo Researchers, Inc.)
338
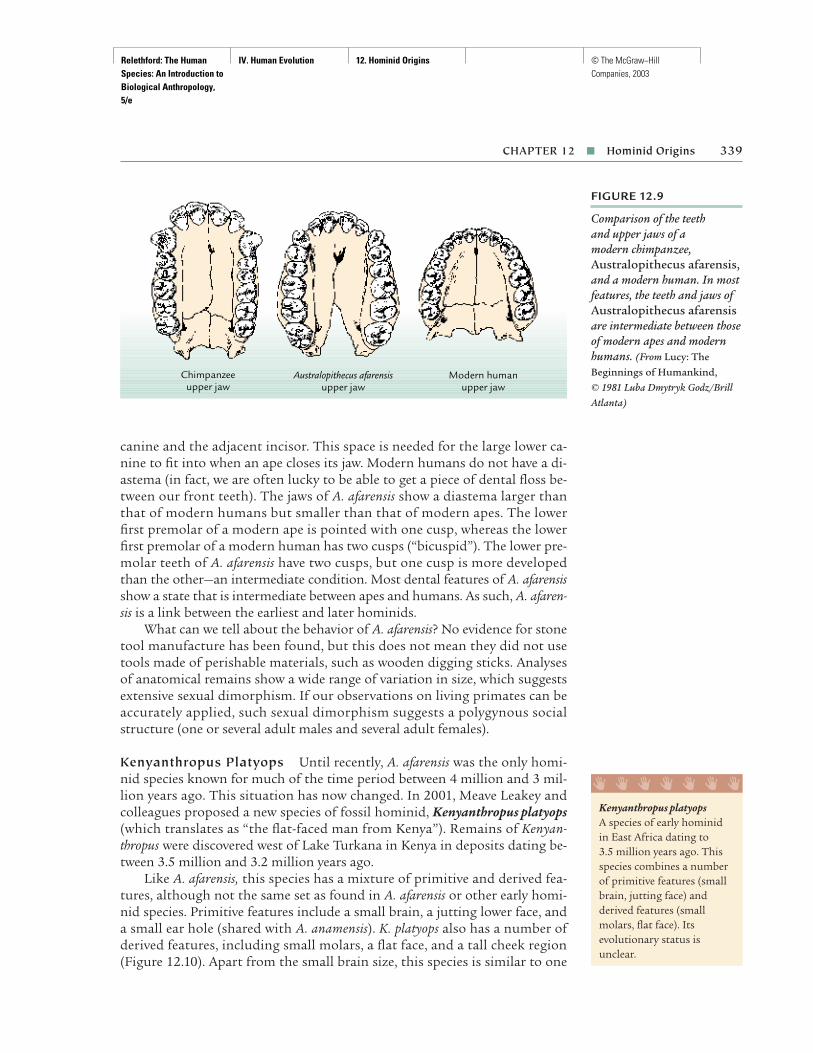
Relethford: The Human Species: An Introduction to Biological Anthropology, 5/e
IV. Human Evolution 12. Hominid Origins © The McGraw−Hill Companies, 2003
canine and the adjacent incisor. This space is needed for the large lower ca-nine to fit into when an ape closes its jaw. Modern humans do not have a di-astema (in fact, we are often lucky to be able to get a piece of dental floss be-tween our front teeth). The jaws of A. afarensis show a diastema larger thanthat of modern humans but smaller than that of modern apes. The lowerfirst premolar of a modern ape is pointed with one cusp, whereas the lowerfirst premolar of a modern human has two cusps (“bicuspid”). The lower pre-molar teeth of A. afarensis have two cusps, but one cusp is more developedthan the other—an intermediate condition. Most dental features of A. afarensisshow a state that is intermediate between apes and humans. As such, A. afaren-sis is a link between the earliest and later hominids.
What can we tell about the behavior of A. afarensis? No evidence for stonetool manufacture has been found, but this does not mean they did not usetools made of perishable materials, such as wooden digging sticks. Analysesof anatomical remains show a wide range of variation in size, which suggestsextensive sexual dimorphism. If our observations on living primates can beaccurately applied, such sexual dimorphism suggests a polygynous socialstructure (one or several adult males and several adult females).
Kenyanthropus Platyops Until recently, A. afarensis was the only homi-nid species known for much of the time period between 4 million and 3 mil-lion years ago. This situation has now changed. In 2001, Meave Leakey andcolleagues proposed a new species of fossil hominid, Kenyanthropus platyops(which translates as “the flat-faced man from Kenya”). Remains of Kenyan-thropus were discovered west of Lake Turkana in Kenya in deposits dating be-tween 3.5 million and 3.2 million years ago.
Like A. afarensis, this species has a mixture of primitive and derived fea-tures, although not the same set as found in A. afarensis or other early homi-nid species. Primitive features include a small brain, a jutting lower face, anda small ear hole (shared with A. anamensis). K. platyops also has a number ofderived features, including small molars, a flat face, and a tall cheek region(Figure 12.10). Apart from the small brain size, this species is similar to one
CHAPTER 12 ■ Hominid Origins 339
FIGURE 12.9
Comparison of the teeth and upper jaws of a modern chimpanzee,Australopithecus afarensis,and a modern human. In mostfeatures, the teeth and jaws ofAustralopithecus afarensisare intermediate between thoseof modern apes and modernhumans. (From Lucy: TheBeginnings of Humankind, © 1981 Luba Dmytryk Godz/BrillAtlanta)
Chimpanzeeupper jaw
Australopithecus afarensisupper jaw
Modern humanupper jaw
Kenyanthropus platyopsA species of early hominidin East Africa dating to 3.5 million years ago. Thisspecies combines a numberof primitive features (smallbrain, jutting face) andderived features (smallmolars, flat face). Itsevolutionary status isunclear.
I I I I I I I

Relethford: The Human Species: An Introduction to Biological Anthropology, 5/e
IV. Human Evolution 12. Hominid Origins © The McGraw−Hill Companies, 2003
of the first species of Homo (Homo rudolfensis, described in the next chapter).The evolutionary status of K. platyops is not yet clear, but it does provide addi-tional evidence of past adaptive radiations of the early hominids (Leakey et al.2001; Lieberman 2001).
Later HominidsStarting around 3 million years ago, adaptive radiations of the early homi-nids were followed by additional diversification within the genus Australopith-ecus. Some of these later species evolved into creatures with immense backteeth, whereas others were less specialized. We suspect that the ancestors ofthe genus Homo belong to this latter group.
Robust Australopithecines Three species of Australopithecus are often re-ferred to collectively as the robust australopithecines. The term robust comesfrom the fact that these forms had very large and robust back teeth, jaws,and faces relative to other hominids. These robust species lived in Africa be-tween 2.5 million and 1.2 million years ago, after which time they became ex-tinct. They are not our ancestors but rather our close relatives. Althoughmany anthropologists consider the robusts as part of the genus Australopithe-cus, some have suggested they be given their own genus, Paranthropus.
One of the key characteristics of the robust australopithecines is theirlarge back teeth and relatively small front teeth. Apart from size, the overallstructure of the teeth is quite human: the canines are nonprojecting, there isno diastema, and the lower premolar has two cusps. In terms of size, how-ever, the robust australopithecines are quite different from modern humans.The front teeth are small, both in absolute size and in relationship to the restof the teeth. The back teeth (premolars and molars) are huge, more than fourtimes the size of modern humans’ in some cases (Figures 12.11 and 12.12).Note how massive the jaws are and how large the back teeth are, especially in
340 PART IV ■ Human Evolution
FIGURE 12.10
Three-quarters view of theskull of Kenyanthropusplatyops, specimen numberKNM-WT 40000. (© NationalMuseums of Kenya)
robust australopithecinesSpecies of Australopithecusthat had very large backteeth, cheekbones, and faces,among other anatomicaladaptations to heavychewing. They lived inAfrica between 2.5 millionand 1.2 million years ago.Three species are generallyrecognized: A. aethiopicus, A. robustus, and A. boisei.Some anthropologistssuggest that they be giventheir own genus name—Paranthropus.
I I I I I I I
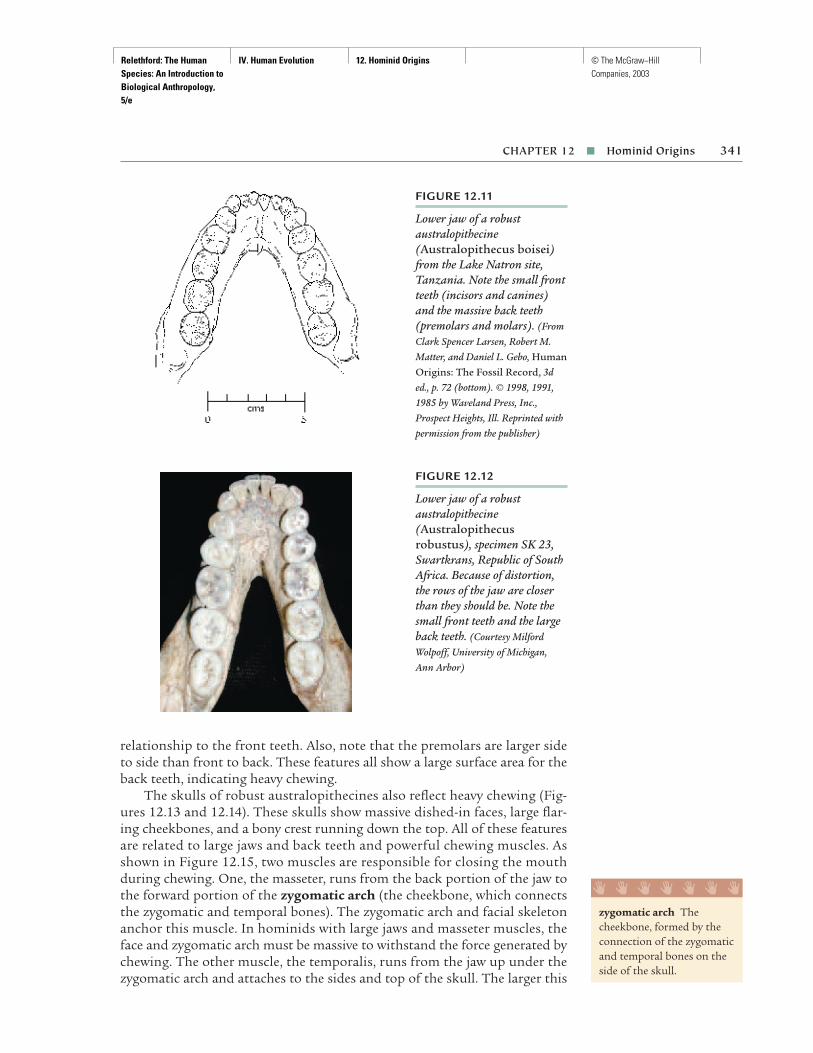
Relethford: The Human Species: An Introduction to Biological Anthropology, 5/e
IV. Human Evolution 12. Hominid Origins © The McGraw−Hill Companies, 2003
relationship to the front teeth. Also, note that the premolars are larger sideto side than front to back. These features all show a large surface area for theback teeth, indicating heavy chewing.
The skulls of robust australopithecines also reflect heavy chewing (Fig-ures 12.13 and 12.14). These skulls show massive dished-in faces, large flar-ing cheekbones, and a bony crest running down the top. All of these featuresare related to large jaws and back teeth and powerful chewing muscles. Asshown in Figure 12.15, two muscles are responsible for closing the mouthduring chewing. One, the masseter, runs from the back portion of the jaw tothe forward portion of the zygomatic arch (the cheekbone, which connectsthe zygomatic and temporal bones). The zygomatic arch and facial skeletonanchor this muscle. In hominids with large jaws and masseter muscles, theface and zygomatic arch must be massive to withstand the force generated bychewing. The other muscle, the temporalis, runs from the jaw up under thezygomatic arch and attaches to the sides and top of the skull. The larger this
CHAPTER 12 ■ Hominid Origins 341
FIGURE 12.11
Lower jaw of a robustaustralopithecine(Australopithecus boisei)from the Lake Natron site,Tanzania. Note the small frontteeth (incisors and canines)and the massive back teeth(premolars and molars). (FromClark Spencer Larsen, Robert M.Matter, and Daniel L. Gebo, HumanOrigins: The Fossil Record, 3ded., p. 72 (bottom). © 1998, 1991,1985 by Waveland Press, Inc.,Prospect Heights, Ill. Reprinted withpermission from the publisher)
FIGURE 12.12
Lower jaw of a robustaustralopithecine(Australopithecusrobustus), specimen SK 23,Swartkrans, Republic of SouthAfrica. Because of distortion,the rows of the jaw are closerthan they should be. Note thesmall front teeth and the largeback teeth. (Courtesy MilfordWolpoff, University of Michigan,Ann Arbor)
zygomatic arch Thecheekbone, formed by theconnection of the zygomaticand temporal bones on theside of the skull.
I I I I I I I

Relethford: The Human Species: An Introduction to Biological Anthropology, 5/e
IV. Human Evolution 12. Hominid Origins © The McGraw−Hill Companies, 2003
muscle is, the more the zygomatic arch must flare out from the side of the skull.To anchor the temporalis muscle on the sides and top of the skull, a ridge ofbone sometimes develops down the center of the skull (called a sagittalcrest). All these cranial and facial features indicate powerful chewing activity.
Despite the name robust, the robust australopithecines were not thatlarge in terms of overall body size, with estimated height ranging from
342 PART IV ■ Human Evolution
FIGURE 12.13
Side, frontal, and top views ofa robust australopithecine(Australopithecus boisei),skull, specimen KNM-ER 406,from Lake Turkana, Kenya. (© The National Museums of Kenya)
FIGURE 12.14
Skull of a robustaustralopithecine(Australopithecusrobustus), specimen SK 48,Swartkrans, Republic of SouthAfrica. (© Transvaal Museum)
sagittal crest A ridge ofbone running down thecenter of the top of the skull that serves to anchorchewing muscles.
I I I I I I I

Relethford: The Human Species: An Introduction to Biological Anthropology, 5/e
IV. Human Evolution 12. Hominid Origins © The McGraw−Hill Companies, 2003
roughly 4 ft to 5 ft. On average, males weighed about 45 kg (roughly 100 lb)and females weighed about 33 kg (73 lb) (McHenry 1992). As with all earlyhominids, brain size was small, averaging slightly less than 500 cc, with a range of 410 cc to 545 cc (Aiello and Dunbar 1993; Falk et al. 2000; Suwa et al. 1997).
Three species of robust australopithecine are generally recognized. Theoldest at 2.5 million years ago is Australopithecus aethiopicus, which is very ro-bust but also shows a number of primitive cranial traits that link it to A. afar-ensis (Figure 12.16). The later two species, Australopithecus robustus and Aus-tralopithecus boisei, lived from roughly 2 million to 1 million years ago anddiffer in terms of geography and size. A. robustus is found in South Africa,and A. boisei is found in East Africa. Of the two, A. boisei is the more robust.
What does the morphology of the robust australopithecines tell us? Themassive jaws and back teeth point to powerful chewing ability. Evidence fromdental anatomy, including microscopic wear patterns on the teeth, show thatall early hominids had a diverse diet that often included food that was hardto chew, such as seeds, nuts, and hard fruits. The robust australopithecinesappear to have relied more regularly on such hard to chew food (Teaford andUngar 2000), which is best exploited with large back teeth and massive chew-ing muscles.
There is no direct association of stone tool technology and the robustaustralopithecines. Although stone tools have been found at sites where ro-bust forms were found, fossils of early Homo were also found, and most re-searchers suggest that Homo was the toolmaker and not the robusts. There issome evidence for tool use, however, among the robust forms in South Africa.Susman (1988) examined the hand bones of A. robustus and concluded thattheir manual dexterity meant they could have made tools. The most direct ev-idence for tool use comes from the Swartkrans robust australopithecine site
CHAPTER 12 ■ Hominid Origins 343
FIGURE 12.15
Skull of a robustaustralopithecine, with arrows indicating the action of chewing muscles: (top)temporalis, (bottom)masseter.
FIGURE 12.16
Specimen KNM-WT 17000from Lake Turkana, Kenya,also known as the “Black Skull”because of the color of mineralstaining. This skull is dated to2.5 million years ago. It is arobust australopithecineclassified as Australopithecusaethiopicus by some and as an early example ofAustralopithecus boisei byothers. It shows a mixture ofspecialized robust features (e.g.,the sagittal crest) and primitivefeatures (e.g., the forwardjutting of the jaw). (© AlanWalker/National Geographic SocietyImage Collection)
Australopithecus aethiopicusThe oldest robustaustralopithecine, dating to2.5 million years ago in EastAfrica. It combines derivedfeatures seen in other robustaustralopithecines withprimitive features seen in A. afarensis.
Australopithecus robustusA species of robustaustralopithecine datingbetween roughly 2 millionand 1.5 million years agoand found in South Africa.
Australopithecus boisei Avery robust species of robustaustralopithecine datingbetween 2 million and 1.2 million years ago andfound in East Africa.
I I I I I I I

Relethford: The Human Species: An Introduction to Biological Anthropology, 5/e
IV. Human Evolution 12. Hominid Origins © The McGraw−Hill Companies, 2003
in South Africa, where animal bones have been found with scratch patternsindicating their use as digging tools. Based on comparisons with experimen-tally scratched animal bones, Backwell and d’Errico (2001) conclude that theseearly hominids were digging for termites.
Australopithecus Africanus Although debate continues regarding theevolutionary relationships of the robust australopithecines to earlier homi-nids, there is general agreement that they represent a side branch in humanevolution that became extinct 1 million years ago. Who then was our ances-tor from the 3-million- to 2-million-year time period separating the earlierprimitive hominids and species in the genus Homo? There are two major can-didates, Australopithecus africanus and Australopithecus garhi.
A number of australopithecine specimens found in South Africa betweenroughly 3 million and 2 million years ago have been placed in the speciesAustralopithecus africanus (named after Africa). A. africanus had reduced ca-nines, large faces, and a small brain, averaging about 460 cc (Aiello and Dun-bar 1993; Conroy et al. 1998). A skull of A. africanus is shown in Figure 12.17.Like other early hominids, it had a small brain and a large face. The face isnot as massive as the robust forms, however, and there is no sagittal crest. Alower jaw of A. africanus is shown in Figure 12.18. Compared to the robustforms, the front teeth are not as small relative to the back teeth. In overallsize, however, the back teeth are still larger than those of modern humans. A. africanus is considered a descendant of A. afarensis and may represent anancestor of the genus Homo, although some anthropologists consider it an-other extinct side branch in hominid evolution.
Australopithecus Garhi For many years, anthropologists have agreed thatthe robust australopithecines are not our ancestors. Many have proposed A. africanus as the ancestor of Homo. Others, however, suggested that A. afri-canus was too specialized to be our ancestor and that the genus Homo evolvedfrom A. afarensis (Johanson and White 1979). The problem with this idea, how-
344 PART IV ■ Human Evolution
FIGURE 12.17
Skull of Australopithecusafricanus, specimen STS 5,Sterkfontein, Republic of SouthAfrica. (© Transvaal Museum)
Australopithecus africanus Aspecies of australopithecinedating between 3.3 millionand 2.3 million years agoand found in South Africa.It is not as massive as therobust forms and may be anancestor of the genus Homo.
Australopithecus garhi Aspecies of australopithecinedating to 2.5 million years ago in East Africa. It differs from otheraustralopithecines in havinglarge front and back teeth,although the back teeth are not specialized to thesame extent as found in therobust australopithecines.
I I I I I I I

Relethford: The Human Species: An Introduction to Biological Anthropology, 5/e
IV. Human Evolution 12. Hominid Origins © The McGraw−Hill Companies, 2003
ever, was that there was a gap between the last known occurrence of A. afaren-sis and the first evidence of Homo. If their idea is correct, a suitable transitionalspecies was needed to fill this gap.
There now appears to be a possible transition. Fossils from Ethiopia dat-ing to 2.5 million years ago have been classified as a new species Australopith-ecus garhi (Asfaw et al. 1999). The species name garhi means “surprise” in thelocal Afar language. The major specimen consists of a partial cranium with anupper jaw. The skull (Figure 12.19) has a small brain size (450 cc) and does nothave a robust anatomy. Overall, many of its features are similar to A. afarensis.
CHAPTER 12 ■ Hominid Origins 345
FIGURE 12.19
Top and side views ofAustralopithecus garhi skull,specimen BOU-VP-12/130. (© David L. Brill)
FIGURE 12.18 (above)
Lower jaw ofAustralopithecus africanus,specimen STS 52b,Sterkfontein, Republic of SouthAfrica. The teeth are largerthan in modern humans, butthe relative proportions offront and back teeth are moresimilar to those of modernhumans than are those of therobust australopithecines. (FromClark Spencer Larsen, Robert M.Matter, and Daniel L. Gebo, HumanOrigins: The Fossil Record, 3ded., p. 64. © 1998, 1991, 1985 byWaveland Press, Inc., ProspectHeights, Ill. Reprinted withpermission from the publisher)

Relethford: The Human Species: An Introduction to Biological Anthropology, 5/e
IV. Human Evolution 12. Hominid Origins © The McGraw−Hill Companies, 2003
Both the front and back teeth of A. garhi (Figure 12.20) are large, but they donot show the anatomical specializations of the robust australopithecines.
It is possible that A. garhi, and not A. africanus, was our ancestor. Becausethe fossil evidence shows the earliest members of Homo appear in East Africaby 2 million years ago, A. garhi is “in the right place, at the right time, to bethe ancestor of early Homo” (Asfaw et al. 1999:634). Its anatomy, comparedwith other early hominids, does not preclude this possibility.
The discovery of A. garhi is even more important when we consider thefact that stone tools were found at the same site (de Heinzelin et al. 1999),suggesting that A. garhi was the toolmaker (at 2.5 million year ago, these areamong the earliest stone tools known). Analysis of animal bones found atthe site show that these hominids used the stone tools to butcher animalsand to break open bones for their marrow (a nutritious food high in fats).This evidence shows that by 2.5 million years ago hominids had added meatand marrow to their diet, a pattern continued in the evolution of the genusHomo. The similarity of behavior in A. garhi with later Homo further supportsthe hypothesis that A. garhi was the ancestor of Homo. This conclusion is ten-tative because we still have much to learn about early hominids. Additionalspecies may be awaiting discovery, including others that practiced some typeof toolmaking and dietary expansion.
EVOLUTIONARY TRENDS
Given the diversity in early hominids, what conclusions can we reach regard-ing evolutionary trends and relationships? How were these species related?What were the major evolutionary trends, and what caused them?
346 PART IV ■ Human Evolution
FIGURE 12.20
Upper jaw ofAustralopithecus garhi,specimen BOU-VP-12/130.The teeth are large but do not resemble those of robustaustralopithecines in structure. (© 1999 Luba Dmytryk Gudz)
Relethford: The Human Species: An Introduction to Biological Anthropology, 5/e
IV. Human Evolution 12. Hominid Origins © The McGraw−Hill Companies, 2003
Evolutionary RelationshipsOne of our goals is to use the available information to reconstruct the gen-eral patterns of early hominid evolution. The hominids described in thischapter thus far provide a history of evolutionary events that took place fromthe initial origins of the hominids and the development of bipedalism up tothe origin of the genus Homo. We are interested, where possible, in trying tolink species over time to produce a “family tree.”
Historical Overview The study of the historical development of any scien-tific discipline is important for a number of reasons. Because science is an on-going, cumulative process, its current state will partially reflect past ideas andhypotheses. Even after hypotheses have been rejected, they may continue toinfluence thinking in a field. Scientists do not work in a vacuum but are partof a larger culture, and current intellectual philosophies and trends can havean impact on the formulation of hypotheses and the interpretation of data.
It is also important to remember that our current knowledge is incom-plete and not necessarily the final answer. It is not uncommon to read news-paper headlines such as “Fossil Discovery Overturns Previous Ideas aboutHuman Origins” or “Fossil Discovery Uproots Human Family Tree.” The im-pression some people get from such headlines is that anthropologists knowlittle about their subject or else they would not have gotten things wrong.This impression ties in with a common belief that science produces ultimatetruth and that mistakes in interpretation are tragic and indicative of serioustrouble within a discipline. However, this is not how science works. Ideas arenot simply accepted on faith but are tested. If shown to be wrong, they arerejected and alternative hypotheses are constructed. Questioning and skepti-cal debate form the essence of scientific research.
Many hypotheses in the study of human evolution have been tested andrejected. Others have stood the test of time, some in modified form. Some ex-amples from the study of human evolution show how ideas have been testedas new evidence accumulated and new analyses were conducted. For example,when the first species of early hominid was announced in 1925 (A. africanus),it went against then-current thinking that the first stage in human evolutionwas the origin of a larger brain, followed by the origin of bipedalism. Aus-tralopithecus africanus, and all the other hominids described in this chapter,shows just the reverse—bipedalism arose millions of years before there was asignificant increase in the size of the brain. Although it took time, ultimatelythe entire scientific community agreed that the “brains first” hypothesis wasincorrect.
By the middle of the twentieth century, little was known about early hom-inid variation. One early debate focused on whether only a single hominidspecies or two or more hominid species were living at the same time. The singlespecies hypothesis postulated that only one hominid species was living at anyone time and that the pattern of human evolution was essentially a straightline, from earliest hominid to the genus Homo. As more species were discov-ered, this view became harder and harder to maintain. There was simply toomuch variation at any time to lump all specimens under a single species.
CHAPTER 12 ■ Hominid Origins 347

Relethford: The Human Species: An Introduction to Biological Anthropology, 5/e
IV. Human Evolution 12. Hominid Origins © The McGraw−Hill Companies, 2003
S P E C I A L T O P I C
The Piltdown HoaxOne of the main points made in this chapter is that charac-teristics of modern humans did not all appear at the sametime. In particular, we know from the fossil record that bi-pedalism started 3.5 million years before we see any signifi-cant increase in brain size or the origin of stone tools. Thisfinding is based on the fossil and archaeological records.
Early ideas about human origins suggested just thereverse—that brain size evolved first. Because there were fewfossils to show otherwise at that time, this hypothesis couldnot then be rejected and was quite popular. The modelpredicted that the fossil record would ultimately showthat, of all modern human characteristics, large brain sizewould be the oldest. Of course, today we have sufficientinformation to reject this hypothesis altogether. At thebeginning of the twentieth century, however, we did not.
In fact, fossil evidence was found to support theantiquity of the large human brain. Between 1911 and1915, hominid fossils were discovered at Piltdown, En-gland, alongside stone tools and the fossils of prehistoricanimals such as mastodons. A primary specimen (“Pilt-down Man”) consisted of a large skull and an apelike jaw.The teeth, however, were worn flat, more closely resem-bling the condition of human teeth. The specimen showeda mixture of ape and human traits and had a modernhuman brain size. It offered clear proof that large brainscame first in human origins.
Because of Piltdown, any fossils that had human char-acteristics but did not have the large brain were rejected, fora time, as possible human ancestors. Indeed, this was partof the reluctance of scientists to accept Australopithecus as a hominid. The first australopithecine specimen was dis-covered by Raymond Dart in 1924. The specimen consistedof the face, teeth, and cranial fragments (including a cast ofthe brain case) of a young child. Dart named the specimenAustralopithecus africanus. Based on cranial evidence relat-ing to the angle at which the spinal cord enters the skull,he claimed it was an upright walker. The brain size wasapelike, as was the protruding face. The teeth, however,were more like those of humans, particularly in havingsmall canines. Here was another specimen that had a mix-ture of ape and human traits but that suggested the largebrain evolved after bipedalism and humanlike teeth. At thetime, more people tended to support Piltdown (in fairness,some of their criticisms of Australopithecus, including thedifficulty in interpreting remains of children, were valid).
Some scientists, however, were more skeptical aboutPiltdown Man. And, eventually, continuing investigationshowed that the find was a fake. In 1953, a fluorine analy-sis (see Chapter 11) confirmed that the jaw bones and skull
bones did not come from the same time period. Closerinspection showed that the skull was that of a modernhuman and the jaw that of an orangutan. The teeth hadbeen filed down, and all of the bones had been chemicallytreated to simulate age.
Who was responsible for the Piltdown hoax? Over theyears many different suspects have been suggested. Oneanalysis suggests that the guilty party may have beenMartin Hinton, then curator of zoology at the LondonNatural History Museum (Gee 1996), although this is notdefinite (Feder 2002). The story of Piltdown Man is oftenoffered up as evidence that anthropologists (and otherscientists) often do not know what they are talking about.After all, look how easily they were fooled. This criticismmisses the point altogether. Science and scientists makemistakes, and sometimes they commit outright fraud. Itis ridiculous to expect otherwise. Science does not repre-sent truth per se but rather a means of arriving at thetruth. When Piltdown was discovered, scientific investiga-tion did not stop. Instead, scientists kept looking at theevidence, questioning it and various assumptions, anddevising new ways of testing. As a result, the hoax wasuncovered. This is how science is supposed to work.
Side view of Piltdown Man. The dark-colored areas and the backpart of the lower jaw were found; the rest was reconstructed. Thisfind, which confirmed the then-popular notion that early humans hadlarge brains and apelike jaws, was a hoax; the remains of a modernhuman and an orangutan were placed together at the Piltdown site.(© The Natural History Museum, London)
348

Relethford: The Human Species: An Introduction to Biological Anthropology, 5/e
IV. Human Evolution 12. Hominid Origins © The McGraw−Hill Companies, 2003
Eventually, the single species hypothesis was rejected. Today, anthropologistsdebate exactly how many species lived at any one time, but they are in com-plete agreement that at certain times there were two or more.
As time went on and new discoveries were made, we realized that the fos-sil record of early hominids was even more diverse. With four new species an-nounced in the past 10 years, it seems likely that additional species will befound in the near future. The discovery of new species, and integration ofthese new data with previous data, mean that the specifics of our understand-ing of early hominid evolution continue to change. However, some generalfindings can be made at this time. First, the earliest evidence of the first hom-inids goes back 6 million years, a date consistent with genetic evidence onthe timing of hominid origins. The earliest hominids were apelike in manyways but were bipedal. Second, there appears to have been considerable di-versity throughout the time frame discussed here, with two or more speciesexisting at many points in time. Many of these species are extinct side branchesin human evolution. Third, diversity increased even more 3 million years ago,with a variety of robust and nonrobust species living in Africa. It is withinthe radiation of the nonrobust forms that we see the first beginning of ana-tomical and behavioral changes that led, in at least one case, to the genus Homo.
Family Trees How might all these early hominids be related? Our first stepin trying to answer this question is to reexamine what we know about thedates for these species. Figure 12.21 provides a picture of the dates for eachof the 10 species discussed in this chapter and for the genus Homo. Keep inmind that these are the dates as we currently know them. It is entirely possiblethat the actual distribution of each species is greater than what we currentlyknow. The diversity of fossil hominids, particularly between 4 million and 2 million years ago, is quite apparent in this figure.
How can these forms be linked? We look for physical similarity and, inparticular, forms that share derived characteristics that are not found inother species. Formal cladistic analysis has been done on many of thesespecies, but the results are not always consistent across different traits (e.g.,McHenry 1996; Strait et al. 1997). Part of the problem is the frequency of homoplasy, similarity due to independent evolution. For some traits, such asdental size, homoplasy seems more common than we once thought. For ex-ample, some argue that the robust australopithecines are all related, but oth-ers suggest that the robust anatomy might have developed independently indifferent species.
Some evolutionary relationships are more definite than others. For ex-ample, the robust species A. aethiopicus is likely a link between A. afarensis andA. boisei. Other relationships are less clear. As noted previously, two species,A. africanus and A. garhi, are possible links of early hominids with the genusHomo. The evolutionary relationships of newly discovered species, such as K. platyops, are even less clear.
Figure 12.22 represents an attempt to portray some of the current ideasregarding evolutionary relationships as well as possible alternatives. Thisfamily tree should be taken as a summary of hypotheses and not the finalanswer. Regardless of which specific connections are ultimately shown to be
CHAPTER 12 ■ Hominid Origins 349
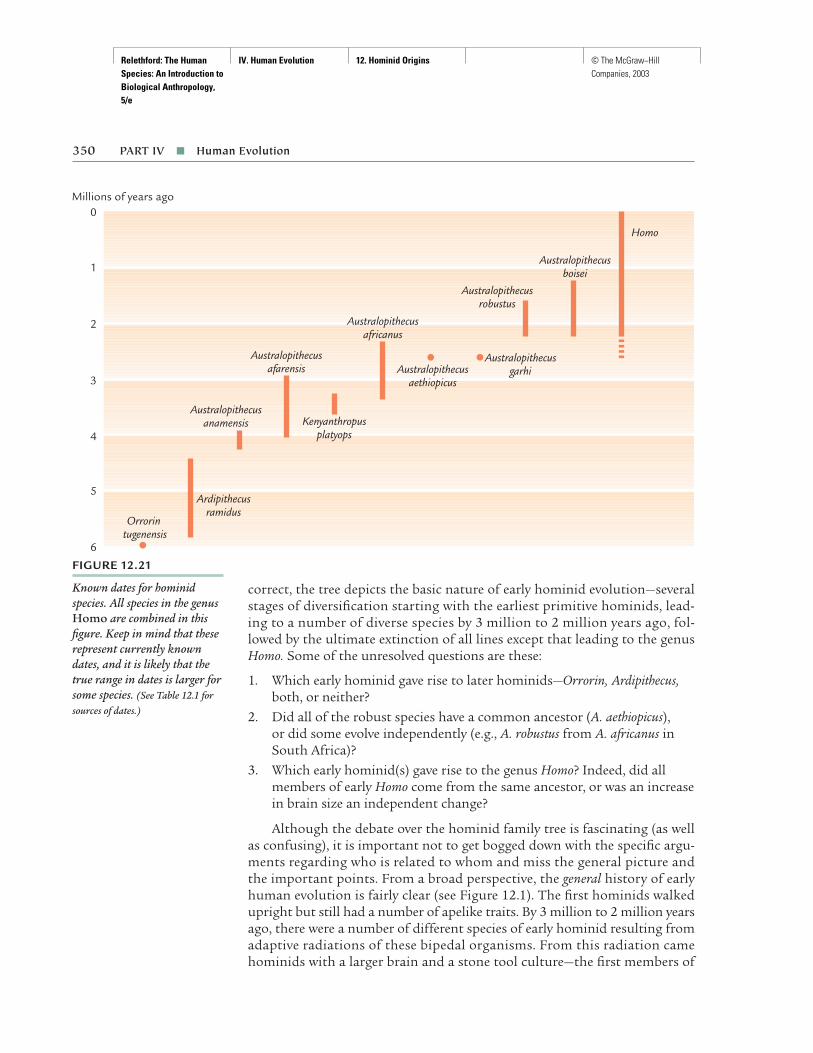
Relethford: The Human Species: An Introduction to Biological Anthropology, 5/e
IV. Human Evolution 12. Hominid Origins © The McGraw−Hill Companies, 2003
correct, the tree depicts the basic nature of early hominid evolution—severalstages of diversification starting with the earliest primitive hominids, lead-ing to a number of diverse species by 3 million to 2 million years ago, fol-lowed by the ultimate extinction of all lines except that leading to the genusHomo. Some of the unresolved questions are these:
1. Which early hominid gave rise to later hominids—Orrorin, Ardipithecus,both, or neither?
2. Did all of the robust species have a common ancestor (A. aethiopicus), or did some evolve independently (e.g., A. robustus from A. africanus inSouth Africa)?
3. Which early hominid(s) gave rise to the genus Homo? Indeed, did allmembers of early Homo come from the same ancestor, or was an increasein brain size an independent change?
Although the debate over the hominid family tree is fascinating (as wellas confusing), it is important not to get bogged down with the specific argu-ments regarding who is related to whom and miss the general picture andthe important points. From a broad perspective, the general history of earlyhuman evolution is fairly clear (see Figure 12.1). The first hominids walkedupright but still had a number of apelike traits. By 3 million to 2 million yearsago, there were a number of different species of early hominid resulting fromadaptive radiations of these bipedal organisms. From this radiation camehominids with a larger brain and a stone tool culture—the first members of
350 PART IV ■ Human Evolution
FIGURE 12.21
Known dates for hominidspecies. All species in the genusHomo are combined in thisfigure. Keep in mind that theserepresent currently knowndates, and it is likely that thetrue range in dates is larger forsome species. (See Table 12.1 forsources of dates.)
5
6
4
3
2
1
0Millions of years ago
Homo
Ardipithecusramidus
Orrorin tugenensis
Australopithecusanamensis
Australopithecusafarensis
Australopithecusafricanus
Australopithecusaethiopicus
Australopithecusrobustus
Australopithecusboisei
Australopithecusgarhi
Kenyanthropusplatyops

Relethford: The Human Species: An Introduction to Biological Anthropology, 5/e
IV. Human Evolution 12. Hominid Origins © The McGraw−Hill Companies, 2003
the genus Homo. Their story will continue in Chapter 13. For the moment,we need to stop and consider the most important question about the firsthominids: Why did they become bipedal?
The Origin of BipedalismOf all the unique traits used to define hominids, bipedalism is the oldest.Therefore, any model of hominid origins must consider the origin of bipe-dalism. We are talking here about the specific anatomical changes, outlinedin Chapter 10, that define human bipedalism. Chimpanzees can walk up-right, and bonobos frequently do so. What makes us different is that we doit all the time, and our anatomy reflects changes that make bipedalism moreefficient.
Locomotion in the Hominid–African Ape Ancestor The origin of bipedal-ism raises an interesting question. How did the common ancestor of Africanapes and hominids move about on the ground? Because we have not yet pre-cisely identified this common ancestor, we must use reconstruction based ontwo basic facts. First, among living primates, the African apes are the mostclosely related to humans. Second, humans are bipedal, and the African apesare all knuckle walkers. (Although the African apes frequently move in otherways, their anatomy shows that knuckle walking is their main means of
CHAPTER 12 ■ Hominid Origins 351
FIGURE 12.22
A possible family tree of earlyhominids. All species in thegenus Homo are combined inthis figure. Dotted lines andquestion marks indicate areasof continuing debate.
5
6
4
3
2
1
0Millions of years ago
?
?
?
?
?
?
?
?
?
Homo
ArdipithecusramidusOrrorin
tugenensis
Australopithecusanamensis
Australopithecusafarensis
Australopithecusrobustus
Australopithecusboisei
Kenyanthropusplatyops
Australopithecusaethiopicus
Australopithecusafricanus
Australopithecusgarhi

Relethford: The Human Species: An Introduction to Biological Anthropology, 5/e
IV. Human Evolution 12. Hominid Origins © The McGraw−Hill Companies, 2003
movement on the ground.) These two observations suggest three possibili-ties for the common ancestor:
1. The common ancestor was bipedal. Hominids retained bipedalism, andknuckle walking evolved in the African ape lineage.
2. The common ancestor had a different pattern of locomotion, perhaps ageneralized form capable of suspensory climbing and hanging, and bothlineages changed, with the African apes evolving knuckle walking andthe hominids evolving bipedalism.
3. The common ancestor was a knuckle walker. The African apes retainedthis ability, and the hominid line changed, evolving bipedalism.
The first suggestion has generally not been accepted. Anatomists argue thata change from bipedalism to knuckle walking is unlikely. Of the remainingtwo suggestions, the second has been favored more often than the third.Here, the common ancestor was a hominoid that was a generalized suspen-sory climber in the trees and evolved in two directions once it moved to theground, knuckle walking in the African ape line and bipedalism in the homi-nid line.
One problem with the idea of a climbing common ancestor is that it con-flicts somewhat with accumulating evidence that chimpanzees and bonobosare genetically more similar to humans than are gorillas and therefore di-verged later than gorillas (recall this discussion from the previous chapter).If the common ancestor of the African apes and hominids was a climber,then knuckle walking would have to evolve twice, once in the line leading tothe gorillas and again in the chimpanzee–bonobo line (Figure 12.23). If, how-ever, the African apes as a group diverged only once, then there would be no parallel evolution. But this is not in agreement with the genetic evidence.There has been much debate over the exact pattern of divergence among theAfrican apes (see Figure 11.17 for review), with genetics supporting one viewand the anatomy of locomotion supporting the other.
The third idea, that the common ancestor was a knuckle walker, hasoften been rejected on the ground that there is no indication of a knuckle-walking ancestry in early hominids or modern humans ( Johanson and Edey1981). Although others had argued that a knuckle-walking ancestry was com-patible with hominid origins, the most convincing evidence to date comesfrom a comparative analysis of the wrist joint by Brian Richmond and DavidStrait (2000). They examined four measurements of the wrist bone associ-ated with knuckle walking in African apes and compared living hominoidswith data from four fossil hominid species. They found that two early homi-nids, A. anamensis and A. afarensis, were very similar to the African apes, whereasthe two later hominids, A. africanus and A. robustus, were more similar to livinghumans. Their results show that the wrist bones of early hominids retainedcharacteristics indicative of a knuckle-walking ancestry, which then were lostin later hominid evolution. Because African apes are knuckle walkers and be-cause the earliest hominids show some knuckle-walking ancestry, it is rea-
352 PART IV ■ Human Evolution
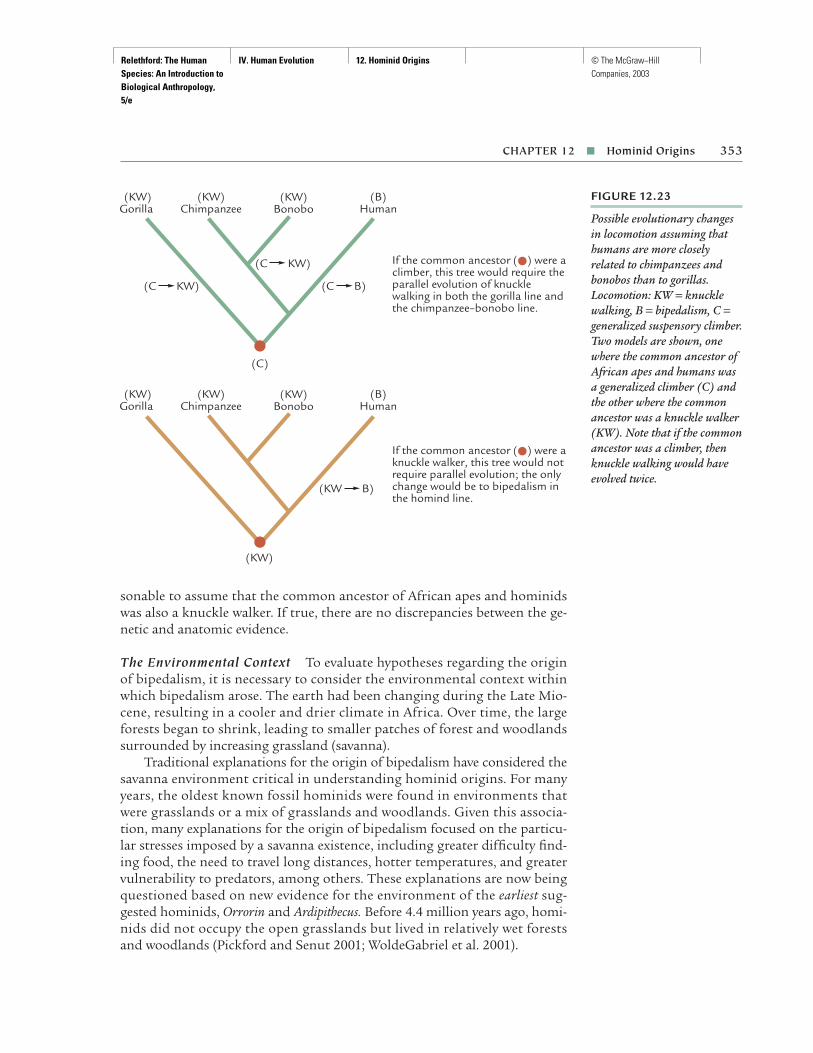
Relethford: The Human Species: An Introduction to Biological Anthropology, 5/e
IV. Human Evolution 12. Hominid Origins © The McGraw−Hill Companies, 2003
sonable to assume that the common ancestor of African apes and hominidswas also a knuckle walker. If true, there are no discrepancies between the ge-netic and anatomic evidence.
The Environmental Context To evaluate hypotheses regarding the originof bipedalism, it is necessary to consider the environmental context withinwhich bipedalism arose. The earth had been changing during the Late Mio-cene, resulting in a cooler and drier climate in Africa. Over time, the largeforests began to shrink, leading to smaller patches of forest and woodlandssurrounded by increasing grassland (savanna).
Traditional explanations for the origin of bipedalism have considered thesavanna environment critical in understanding hominid origins. For manyyears, the oldest known fossil hominids were found in environments thatwere grasslands or a mix of grasslands and woodlands. Given this associa-tion, many explanations for the origin of bipedalism focused on the particu-lar stresses imposed by a savanna existence, including greater difficulty find-ing food, the need to travel long distances, hotter temperatures, and greatervulnerability to predators, among others. These explanations are now beingquestioned based on new evidence for the environment of the earliest sug-gested hominids, Orrorin and Ardipithecus. Before 4.4 million years ago, homi-nids did not occupy the open grasslands but lived in relatively wet forestsand woodlands (Pickford and Senut 2001; WoldeGabriel et al. 2001).
CHAPTER 12 ■ Hominid Origins 353
FIGURE 12.23
Possible evolutionary changesin locomotion assuming thathumans are more closelyrelated to chimpanzees andbonobos than to gorillas.Locomotion: KW = knucklewalking, B = bipedalism, C =generalized suspensory climber.Two models are shown, onewhere the common ancestor ofAfrican apes and humans wasa generalized climber (C) andthe other where the commonancestor was a knuckle walker(KW). Note that if the commonancestor was a climber, thenknuckle walking would haveevolved twice.
(KW)Bonobo
(KW)Gorilla
(KW)Chimpanzee
(B)Human
(KW)Bonobo
(KW)Gorilla
(KW)Chimpanzee
(B)Human
(C)
(KW)
(C KW)
(KW B)
(C KW) (C B)
If the common ancestor (●) were a climber, this tree would require the parallel evolution of knuckle walking in both the gorilla line and the chimpanzee–bonobo line.
If the common ancestor (●) were a knuckle walker, this tree would not require parallel evolution; the only change would be to bipedalism in the homind line.

Relethford: The Human Species: An Introduction to Biological Anthropology, 5/e
IV. Human Evolution 12. Hominid Origins © The McGraw−Hill Companies, 2003
Why Bipedalism? The early hominids were bipedal. Although there is someanatomical evidence suggesting that they were also active climbers, it is clearfrom their anatomy that they walked upright on the ground. The criticalquestion is why they did so. Ever since Darwin’s time, hypotheses have beenproposed to account for the origin of bipedalism.
Darwin offered one of the first hypotheses, focusing on the link betweenbipedalism and tool use. By standing up, early hominids had their hands freeto carry tools. This basic model was later expanded by a number of anthro-pologists such as Washburn (1960) to consider the evolution of a number ofhuman characteristics. The model proposes that as tool use increased andbecame more important, natural selection led to enhanced learning abilities,intelligence, and larger brains. As larger brains evolved along with longer pe-riods of infant and child dependency, tools would become even more impor-tant for survival. Thus, tool use affected brain size increase, which in turn af-fected tool use. Tool use would benefit from walking upright, such that themodel predicts a simultaneous evolution of bipedalism, larger brains, andtool use. Although popular for many years, the tool use model has been re-jected because fossil evidence from the past 30 years has shown that bipedal-ism evolved before significant increases in brain size and a stone tool technol-ogy. The latest evidence shows that bipedalism may be as old as 6 millionyears, a full 3.5 million years before either the first stone tools or significantlylarger brains.
Although the idea of a simultaneous evolution of hominid traits hasbeen rejected, the basic idea that bipedalism offers an evolutionary advantageby freeing the hands to carry things may still have some merit. Wooden tools,such as digging sticks, could be carried. As the early hominids were at leastas smart as chimpanzees, which make and use simple tools, it is possible thatenvironmental changes prompted an increase in simple tool use that led to aselective advantage for bipedalism.
Tools are not the only items that can be carried effectively if the handsare free. A hominid could also have carried food and infants, which, under theright conditions, could promote increased survival and reproduction. OwenLovejoy (1981) has suggested that bipedalism evolved as a strategy to increasethe survival of infants and other dependent offspring by having some groupmembers forage for food and then carry it back to the group. Consequently,more infants could be cared for, allowing an increase in reproduction andpotential population growth. According to Lovejoy, bipedalism is the way inwhich hominids got around the basic problem faced by apes—a long periodof infant dependency leading to slow rates of population growth. Bipedalismmight have altered the situation and allowed more infants to be cared for atthe same time.
The specifics of Lovejoy’s model have been rather controversial, as heproposes that the social structure that evolved along with bipedalism was ofmonogamous family groups where the male foraged for food and the femalestayed with the dependent offspring. The high degree of sexual dimorphismseen in many early hominids does not fit this model because monogamousprimates tend to have reduced sexual dimorphism. It is possible that other
354 PART IV ■ Human Evolution

Relethford: The Human Species: An Introduction to Biological Anthropology, 5/e
IV. Human Evolution 12. Hominid Origins © The McGraw−Hill Companies, 2003
social structures, such as a group of adult females sharing the care and feed-ing of offspring, could have produced the same result—bipedalism as anadaptation for carrying food and infants.
Another suggested advantage of bipedalism is predator avoidance. Onthe savanna, hominids would be in increased danger of being hunted by largecarnivores. By standing on two legs, hominids would be able to see farther,particularly above tall grass, giving them the opportunity to spot potentialdanger. Day (1986) has suggested that this ability, combined with the reten-tion of tree-climbing ability, would be advantageous. Although predator avoid-ance would be facilitated by bipedalism on the savanna, we now know that theearliest hominids were more likely confined to a woodland and forest envi-ronment. Thus, predator avoidance may not explain why bipedalism firstevolved.
The same criticism is true of another hypothesis that links bipedalismwith increased ability to tolerate heat stress (Wheeler 1991). Overheating andwater loss are considerable threats to organisms exposed to sunlight on thesavanna. Based on laboratory experiments, Wheeler found that standing up-right reduces the amount of direct solar radiation that strikes the body (lessexposed surface area). Further, the greater air movement and lower tempera-ture felt by an animal off the ground would increase the rate of heat dissipa-tion and effective evaporation of sweat. Bipedalism would have been veryuseful to have in order to venture out onto the savanna, but the evidence sug-gests that bipedalism had evolved before hominids moved into a savanna en-vironment. Therefore, this hypothesis also fails to explain the initial origin ofbipedalism.
Bipedalism has also been linked to food acquisition and energy efficiency.Energy efficiency refers to the amount of energy expended relative to the taskbeing performed. Bipedalism is more energy-efficient in traveling long dis-tances in search of food. Increased energy efficiency means using less energyto move about looking for and gathering food.
Though human bipedalism is less efficient than ape locomotion whenrunning, the opposite is true at normal walking speeds. Rodman and McHenry(1980) looked at the energy efficiency of bipedal humans and knuckle-walkingchimpanzees at normal walking speeds. The results, shown in Figure 12.24,indicate that bipedalism is more energy-efficient at speeds of both 2.9 kmper hour (the normal walking speed of a chimpanzee) and 4.5 km per hour(the normal walking speed of a human). Leonard and Robertson (1995) con-firmed these observations and compared the expected daily energy costs foran early hominid (A. afarensis) with a knuckle walker of similar size, findingthat bipedalism could save more than 50 percent of the expected daily ex-penditure of calories.
The energy efficiency model is usually discussed in terms of early homi-nid adaptation to the savanna, which would have necessitated long-distancemovement where increased energy efficiency would have been a major advan-tage. The recent evidence that the earliest hominids lived in the woodlandsand forests rather than on the savanna would seem to argue against thismodel. It may not be that simple, however, because climatic data do show
CHAPTER 12 ■ Hominid Origins 355

Relethford: The Human Species: An Introduction to Biological Anthropology, 5/e
IV. Human Evolution 12. Hominid Origins © The McGraw−Hill Companies, 2003
that the forests and woodlands were shrinking. Although the earliest homi-nids may have spent most of their time in the forests and woodlands, theymay have needed to travel between shrinking clusters to find enough food. Asthe forests and woodlands continued to shrink, the advantage of bipedalismmay have continued to increase, ultimately leaving a form very well adaptedfor the savanna.
The hypotheses discussed here (and others) need to be reevaluated interms of the new environmental evidence. It may be the case that there is nosingle cause for the origin of bipedalism but rather a combination of several,including food sharing, infant care, energy efficiency, and others. It alsoseems likely that there were additional advantages of bipedalism once it hadevolved, such as temperature regulation. In any event, bipedalism ultimatelyprovided the opportunity for other changes in hominid evolution, such asincreased brain size, which are discussed in the next chapter.
SUMMARY
The origin of the hominids takes place in Africa. The earliest presumed hom-inids (Orrorin and Ardipithecus) date back 6 million years, coinciding with thesuggested time for hominid divergence based on genetic studies. These earli-est hominids were very primitive, and debate continues as to whether one ofthem is actually an early ape or the common ancestor of hominids and Afri-can apes. Between roughly 4 million and 3 million years ago, two additionalspecies of primitive hominid (Australopithecus anamensis and Australopithecusafarensis) are definite bipeds but still retain some apelike anatomy, particu-larly in certain dental features. The evolutionary significance of a newly dis-
356 PART IV ■ Human Evolution
FIGURE 12.24
The relative energy cost ofmovement for chimpanzeesand humans compared with aquadruped of similar size (setequal to 1.0 in this graph). Theknuckle-walking chimpanzeeuses more energy for movement(values > 1), and the bipedalhuman uses less (< 1). Thesecomparisons have been madeat two speeds: 2.9 km per hour (the normal speed of achimpanzee) and 4.5 km perhour (the normal speed of ahuman). These results showthat bipedalism is more energy-efficient at normal walkingspeeds. (Source of data: Rodmanand McHenry 1980)
Rel
ativ
e en
ergy
cos
t
0.02.9 4.5
Walking speed (km/hr)
0.2
0.4
0.6
0.8
1.0
1.4
1.6
1.2
Quadruped
Chimp
Human
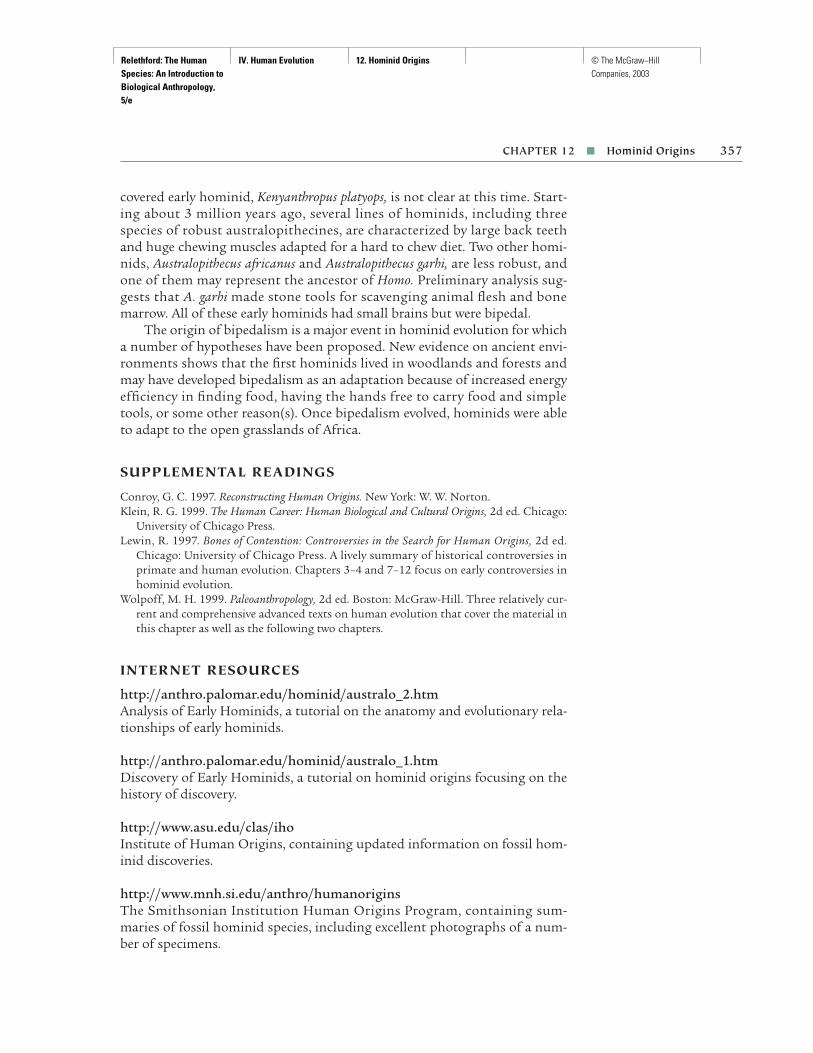
Relethford: The Human Species: An Introduction to Biological Anthropology, 5/e
IV. Human Evolution 12. Hominid Origins © The McGraw−Hill Companies, 2003
covered early hominid, Kenyanthropus platyops, is not clear at this time. Start-ing about 3 million years ago, several lines of hominids, including threespecies of robust australopithecines, are characterized by large back teethand huge chewing muscles adapted for a hard to chew diet. Two other homi-nids, Australopithecus africanus and Australopithecus garhi, are less robust, andone of them may represent the ancestor of Homo. Preliminary analysis sug-gests that A. garhi made stone tools for scavenging animal flesh and bonemarrow. All of these early hominids had small brains but were bipedal.
The origin of bipedalism is a major event in hominid evolution for whicha number of hypotheses have been proposed. New evidence on ancient envi-ronments shows that the first hominids lived in woodlands and forests andmay have developed bipedalism as an adaptation because of increased energyefficiency in finding food, having the hands free to carry food and simpletools, or some other reason(s). Once bipedalism evolved, hominids were ableto adapt to the open grasslands of Africa.
SUPPLEMENTAL READINGS
Conroy, G. C. 1997. Reconstructing Human Origins. New York: W. W. Norton.Klein, R. G. 1999. The Human Career: Human Biological and Cultural Origins, 2d ed. Chicago:
University of Chicago Press.Lewin, R. 1997. Bones of Contention: Controversies in the Search for Human Origins, 2d ed.
Chicago: University of Chicago Press. A lively summary of historical controversies inprimate and human evolution. Chapters 3–4 and 7–12 focus on early controversies inhominid evolution.
Wolpoff, M. H. 1999. Paleoanthropology, 2d ed. Boston: McGraw-Hill. Three relatively cur-rent and comprehensive advanced texts on human evolution that cover the material inthis chapter as well as the following two chapters.
INTERNET RESOURCES
http://anthro.palomar.edu/hominid/australo_2.htmAnalysis of Early Hominids, a tutorial on the anatomy and evolutionary rela-tionships of early hominids.
http://anthro.palomar.edu/hominid/australo_1.htmDiscovery of Early Hominids, a tutorial on hominid origins focusing on thehistory of discovery.
http://www.asu.edu/clas/ihoInstitute of Human Origins, containing updated information on fossil hom-inid discoveries.
http://www.mnh.si.edu/anthro/humanoriginsThe Smithsonian Institution Human Origins Program, containing sum-maries of fossil hominid species, including excellent photographs of a num-ber of specimens.
CHAPTER 12 ■ Hominid Origins 357

Relethford: The Human Species: An Introduction to Biological Anthropology, 5/e
IV. Human Evolution 13. The Evolution of the Genus Homo
© The McGraw−Hill Companies, 2003
C H A P T E R 13The Evolution of the Genus Homo
359
The history of the australopithecines, discussed in the previous chapter,provides us with some insight into the beginning of human evolution and
the origin of one of the unique characteristics of humankind—bipedalism.Bipedalism arose close to 6 million years ago, but it was not until roughly 2.5 million years ago that we begin to see the origin of other human charac-teristics—a substantial increase in brain size and the development of stonetool technology. The genus Homo is usually defined in terms of an increasedbrain size, a reduction in the size of the face and teeth, and increased relianceon cultural adaptations. This chapter reviews the major evidence for the ori-gin and evolution of the genus Homo up to the origin of modern humans(which is covered in Chapter 14).
THE ORIGIN OF THE GENUS HOMO
Hominid fossils are assigned to the genus Homo partly, but not exclusively,on the basis of brain size. The range of brain size overlaps slightly betweenAustralopithecus and Homo (estimates of cranial capacity are not yet availablefor Orrorin, Ardipithecus, or Kenyanthropus). The cranial capacity of Australo-pithecus fossils found to date ranges from 400 cc to 545 cc, whereas the capacity
The site of Olduvai Gorge in Tanzania. This site, worked on for many decades by the famous Leakey family, has proven to be a gold mine forhominid fossil studies. The early excavations at Olduvai uncovered manyspecies, including Homo erectus, the first hominid species to move outside of Africa. (© E. E. Kingsley/Science Source/Photo Researchers, Inc.)
▲
Homo A genus of hominidscharacterized by large brain size and dependenceon culture as a means ofadaptation.
I I I I I I I

Relethford: The Human Species: An Introduction to Biological Anthropology, 5/e
IV. Human Evolution 13. The Evolution of the Genus Homo
© The McGraw−Hill Companies, 2003
of Homo fossils (regardless of species) ranges from 509 cc to 1,880 cc (see Fig-ure 13.1 for bibliographic sources). The point here is that although brainsize is an important defining characteristic, it is not the only one. Other char-acteristics of cranial shape, facial shape, dental size, and postcranial anatomyare also important in identifying fossils.
In addition to having a larger brain size than earlier hominids, the genusHomo shows an increase in brain size over time during the past 2 million years.Figure 13.1 plots the cranial capacity of 19 Australopithecus and 117 Homo craniadating from roughly 10,000 years ago back to slightly more than 3 millionyears ago. This figure clearly shows changes in hominid brain size over time.Whereas the australopithecines show only a slight change over time, the genusHomo shows rapid increase over time, particularly after 700,000 years ago.
Apart from physical appearance, another major characteristic of thegenus Homo is reliance on cultural behaviors, including increasing sophisti-cation in stone tool technology. Sometime during the course of human evo-lution, our ancestors became totally dependent on tool making. Keep in mind,however, that the cultural evolution of the genus Homo was not simply con-fined to technological invention and development. As shown in this and thenext chapter, Homo also used fire, developed hunting-and-gathering strate-gies, expanded into new and diverse environments, and developed various typesof symbolic expression, including intentional burial and art.
The evolution of the genus Homo gets confusing at times, in part becauseof biological and cultural variation over time and space but also because ofthe different views on how to explain this diversity. A major controversy isover the number and nature of species within Homo. How many were there?Who is related to whom? Because we have only one human species today, whathappened to the others (assuming there was more than one to begin with)?
360 PART IV ■ Human Evolution
FIGURE 13.1
Plot of cranial capacity overtime for fossil specimens ofAustralopithecus and Homo from 3 million to10,000 years ago. (Sources ofdata: Australopithecines and earlyHomo from Aiello and Dunbar1993; later Homo from Ruff et al.1997; updates and additions fromSuwa et al. 1997, Abbate et al. 1998,Conroy et al. 1998, Gabunia et al.2000, and Falk et al. 2000)
Date (Ma)
0.00.51.01.52.02.53.03.5
1500
1200
900
600
300
1800
Cra
nial
cap
acity
(cc
)
Australopithecus
Homo
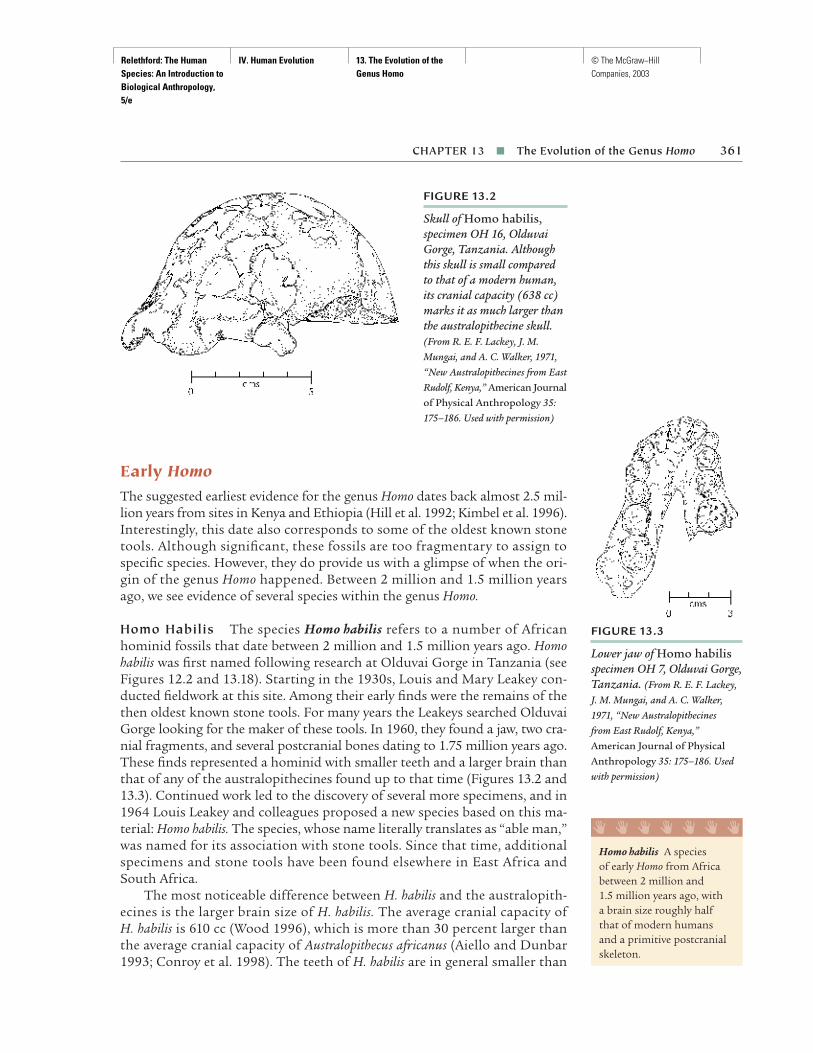
Relethford: The Human Species: An Introduction to Biological Anthropology, 5/e
IV. Human Evolution 13. The Evolution of the Genus Homo
© The McGraw−Hill Companies, 2003
Early HomoThe suggested earliest evidence for the genus Homo dates back almost 2.5 mil-lion years from sites in Kenya and Ethiopia (Hill et al. 1992; Kimbel et al. 1996).Interestingly, this date also corresponds to some of the oldest known stonetools. Although significant, these fossils are too fragmentary to assign tospecific species. However, they do provide us with a glimpse of when the ori-gin of the genus Homo happened. Between 2 million and 1.5 million yearsago, we see evidence of several species within the genus Homo.
Homo Habilis The species Homo habilis refers to a number of Africanhominid fossils that date between 2 million and 1.5 million years ago. Homohabilis was first named following research at Olduvai Gorge in Tanzania (seeFigures 12.2 and 13.18). Starting in the 1930s, Louis and Mary Leakey con-ducted fieldwork at this site. Among their early finds were the remains of thethen oldest known stone tools. For many years the Leakeys searched OlduvaiGorge looking for the maker of these tools. In 1960, they found a jaw, two cra-nial fragments, and several postcranial bones dating to 1.75 million years ago.These finds represented a hominid with smaller teeth and a larger brain thanthat of any of the australopithecines found up to that time (Figures 13.2 and13.3). Continued work led to the discovery of several more specimens, and in1964 Louis Leakey and colleagues proposed a new species based on this ma-terial: Homo habilis. The species, whose name literally translates as “able man,”was named for its association with stone tools. Since that time, additionalspecimens and stone tools have been found elsewhere in East Africa andSouth Africa.
The most noticeable difference between H. habilis and the australopith-ecines is the larger brain size of H. habilis. The average cranial capacity of H. habilis is 610 cc (Wood 1996), which is more than 30 percent larger thanthe average cranial capacity of Australopithecus africanus (Aiello and Dunbar1993; Conroy et al. 1998). The teeth of H. habilis are in general smaller than
CHAPTER 13 ■ The Evolution of the Genus Homo 361
FIGURE 13.3
Lower jaw of Homo habilisspecimen OH 7, Olduvai Gorge,Tanzania. (From R. E. F. Lackey,J. M. Mungai, and A. C. Walker,1971, “New Australopithecines from East Rudolf, Kenya,”American Journal of PhysicalAnthropology 35: 175–186. Usedwith permission)
Homo habilis A species of early Homo from Africabetween 2 million and 1.5 million years ago, with a brain size roughly halfthat of modern humans and a primitive postcranialskeleton.
I I I I I I I
FIGURE 13.2
Skull of Homo habilis,specimen OH 16, OlduvaiGorge, Tanzania. Althoughthis skull is small comparedto that of a modern human,its cranial capacity (638 cc)marks it as much larger thanthe australopithecine skull.(From R. E. F. Lackey, J. M.Mungai, and A. C. Walker, 1971,“New Australopithecines from EastRudolf, Kenya,” American Journalof Physical Anthropology 35:175–186. Used with permission)

Relethford: The Human Species: An Introduction to Biological Anthropology, 5/e
IV. Human Evolution 13. The Evolution of the Genus Homo
© The McGraw−Hill Companies, 2003
those of most australopithecines but larger than those of modern humans.The postcranial skeleton is particularly interesting. For many years little wasknown about the postcranial anatomy of H. habilis other than a few isolatedparts. In 1986, a partial adult skeleton of H. habilis was discovered ( Johansonet al. 1987). The skeleton is similar to that of many early hominids, beingrelatively small and having relatively long arms. H. habilis may have retainedclimbing ability (Wood 1996).
Simple stone tools have been found in association with H. habilis. Thesetools, referred to as the Oldowan tradition, are relatively simple choppingtools made by striking several flakes off a rounded stone to give it a roughcutting edge (Figure 13.4). They were normally made from materials such aslava and quartz. The stone was held steady and was then struck with anotherstone at the correct angle to remove a flake of stone. Several strikes would pro-duce a rough edge capable of cutting through animal flesh. This type of toolmanufacture may sound easy, but it actually involves considerable skill, asanthropologists attempting to duplicate these tools have found (Schick and
FIGURE 13.4
Oldowan tools. (From The OldStone Age by F. Bordes, 1968.Reprinted with permission of the publisher, Weildenfeld andNicolson, Ltd.)
Oldowan tradition Theoldest known stone toolculture.
I I I I I I I
362 PART IV ■ Human Evolution
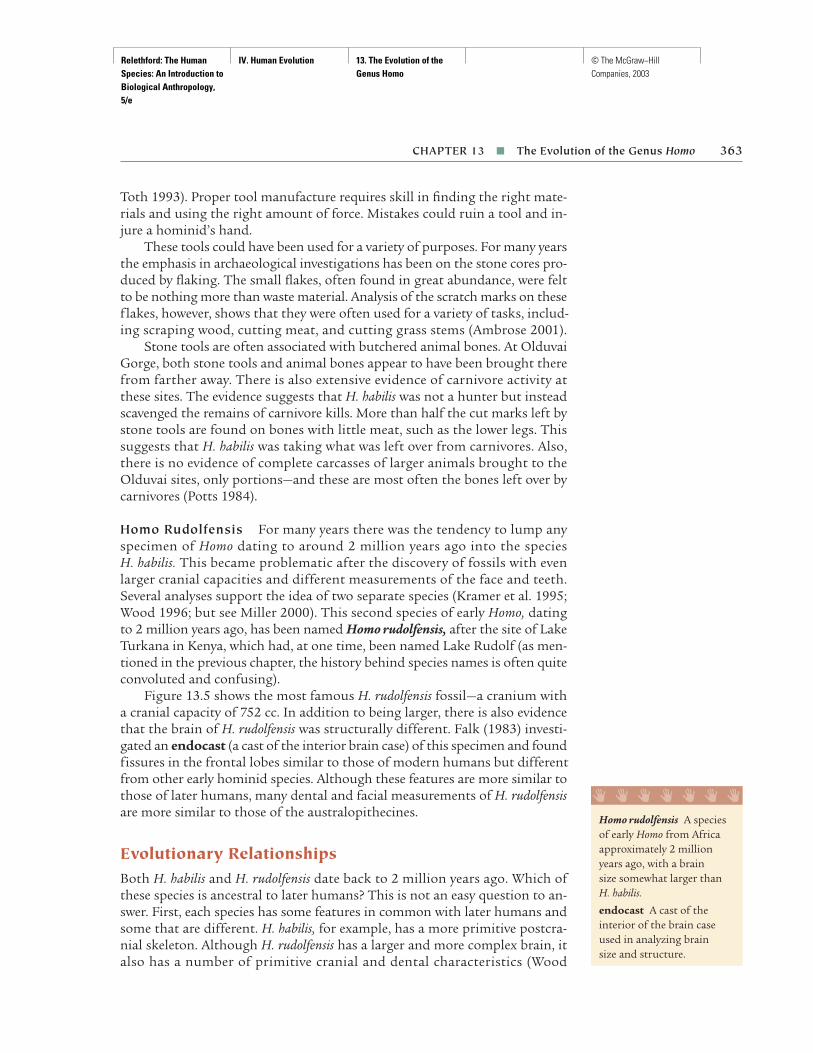
Relethford: The Human Species: An Introduction to Biological Anthropology, 5/e
IV. Human Evolution 13. The Evolution of the Genus Homo
© The McGraw−Hill Companies, 2003
Toth 1993). Proper tool manufacture requires skill in finding the right mate-rials and using the right amount of force. Mistakes could ruin a tool and in-jure a hominid’s hand.
These tools could have been used for a variety of purposes. For many yearsthe emphasis in archaeological investigations has been on the stone cores pro-duced by flaking. The small flakes, often found in great abundance, were feltto be nothing more than waste material. Analysis of the scratch marks on theseflakes, however, shows that they were often used for a variety of tasks, includ-ing scraping wood, cutting meat, and cutting grass stems (Ambrose 2001).
Stone tools are often associated with butchered animal bones. At OlduvaiGorge, both stone tools and animal bones appear to have been brought therefrom farther away. There is also extensive evidence of carnivore activity atthese sites. The evidence suggests that H. habilis was not a hunter but insteadscavenged the remains of carnivore kills. More than half the cut marks left bystone tools are found on bones with little meat, such as the lower legs. Thissuggests that H. habilis was taking what was left over from carnivores. Also,there is no evidence of complete carcasses of larger animals brought to theOlduvai sites, only portions—and these are most often the bones left over bycarnivores (Potts 1984).
Homo Rudolfensis For many years there was the tendency to lump anyspecimen of Homo dating to around 2 million years ago into the species H. habilis. This became problematic after the discovery of fossils with evenlarger cranial capacities and different measurements of the face and teeth.Several analyses support the idea of two separate species (Kramer et al. 1995;Wood 1996; but see Miller 2000). This second species of early Homo, datingto 2 million years ago, has been named Homo rudolfensis, after the site of LakeTurkana in Kenya, which had, at one time, been named Lake Rudolf (as men-tioned in the previous chapter, the history behind species names is often quiteconvoluted and confusing).
Figure 13.5 shows the most famous H. rudolfensis fossil—a cranium witha cranial capacity of 752 cc. In addition to being larger, there is also evidencethat the brain of H. rudolfensis was structurally different. Falk (1983) investi-gated an endocast (a cast of the interior brain case) of this specimen and foundfissures in the frontal lobes similar to those of modern humans but differentfrom other early hominid species. Although these features are more similar tothose of later humans, many dental and facial measurements of H. rudolfensisare more similar to those of the australopithecines.
Evolutionary RelationshipsBoth H. habilis and H. rudolfensis date back to 2 million years ago. Which ofthese species is ancestral to later humans? This is not an easy question to an-swer. First, each species has some features in common with later humans andsome that are different. H. habilis, for example, has a more primitive postcra-nial skeleton. Although H. rudolfensis has a larger and more complex brain, italso has a number of primitive cranial and dental characteristics (Wood
CHAPTER 13 ■ The Evolution of the Genus Homo 363
Homo rudolfensis A speciesof early Homo from Africaapproximately 2 millionyears ago, with a brain size somewhat larger thanH. habilis.
endocast A cast of theinterior of the brain caseused in analyzing brain size and structure.
I I I I I I I
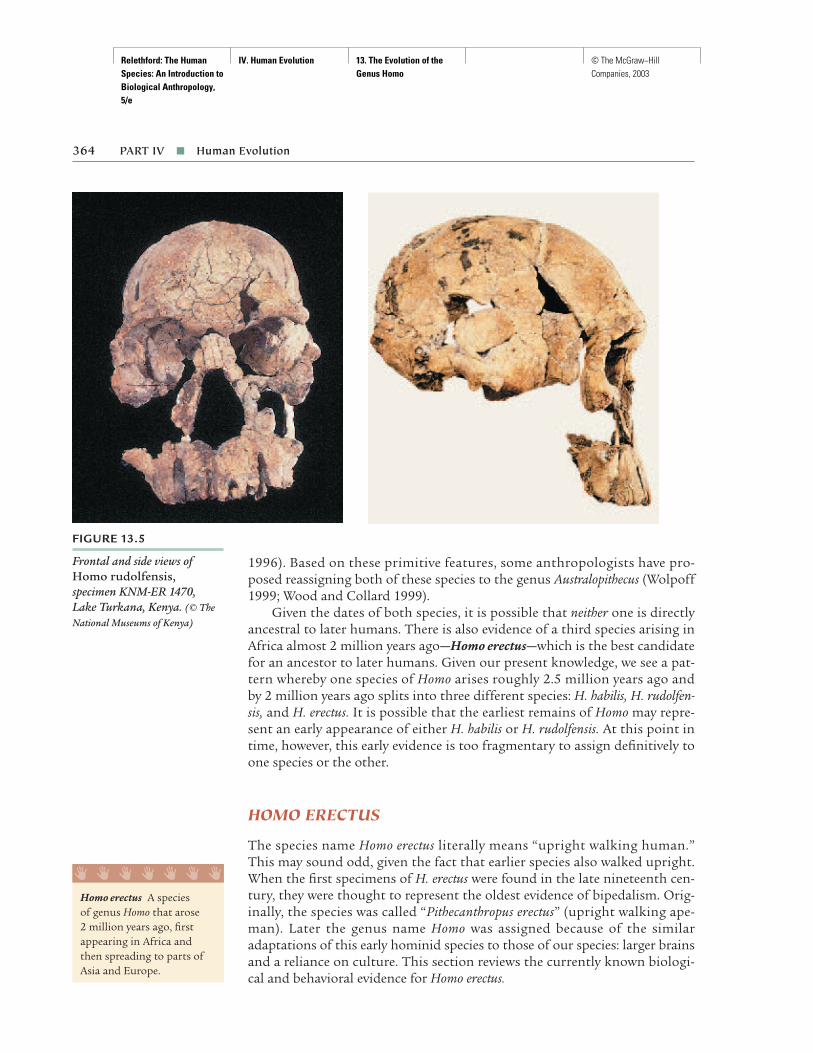
Relethford: The Human Species: An Introduction to Biological Anthropology, 5/e
IV. Human Evolution 13. The Evolution of the Genus Homo
© The McGraw−Hill Companies, 2003
1996). Based on these primitive features, some anthropologists have pro-posed reassigning both of these species to the genus Australopithecus (Wolpoff1999; Wood and Collard 1999).
Given the dates of both species, it is possible that neither one is directlyancestral to later humans. There is also evidence of a third species arising inAfrica almost 2 million years ago—Homo erectus—which is the best candidatefor an ancestor to later humans. Given our present knowledge, we see a pat-tern whereby one species of Homo arises roughly 2.5 million years ago and by 2 million years ago splits into three different species: H. habilis, H. rudolfen-sis, and H. erectus. It is possible that the earliest remains of Homo may repre-sent an early appearance of either H. habilis or H. rudolfensis. At this point intime, however, this early evidence is too fragmentary to assign definitively toone species or the other.
HOMO ERECTUS
The species name Homo erectus literally means “upright walking human.”This may sound odd, given the fact that earlier species also walked upright.When the first specimens of H. erectus were found in the late nineteenth cen-tury, they were thought to represent the oldest evidence of bipedalism. Orig-inally, the species was called “Pithecanthropus erectus” (upright walking ape-man). Later the genus name Homo was assigned because of the similaradaptations of this early hominid species to those of our species: larger brainsand a reliance on culture. This section reviews the currently known biologi-cal and behavioral evidence for Homo erectus.
364 PART IV ■ Human Evolution
FIGURE 13.5
Frontal and side views ofHomo rudolfensis,specimen KNM-ER 1470, Lake Turkana, Kenya. (© TheNational Museums of Kenya)
Homo erectus A species of genus Homo that arose 2 million years ago, firstappearing in Africa andthen spreading to parts ofAsia and Europe.
I I I I I I I
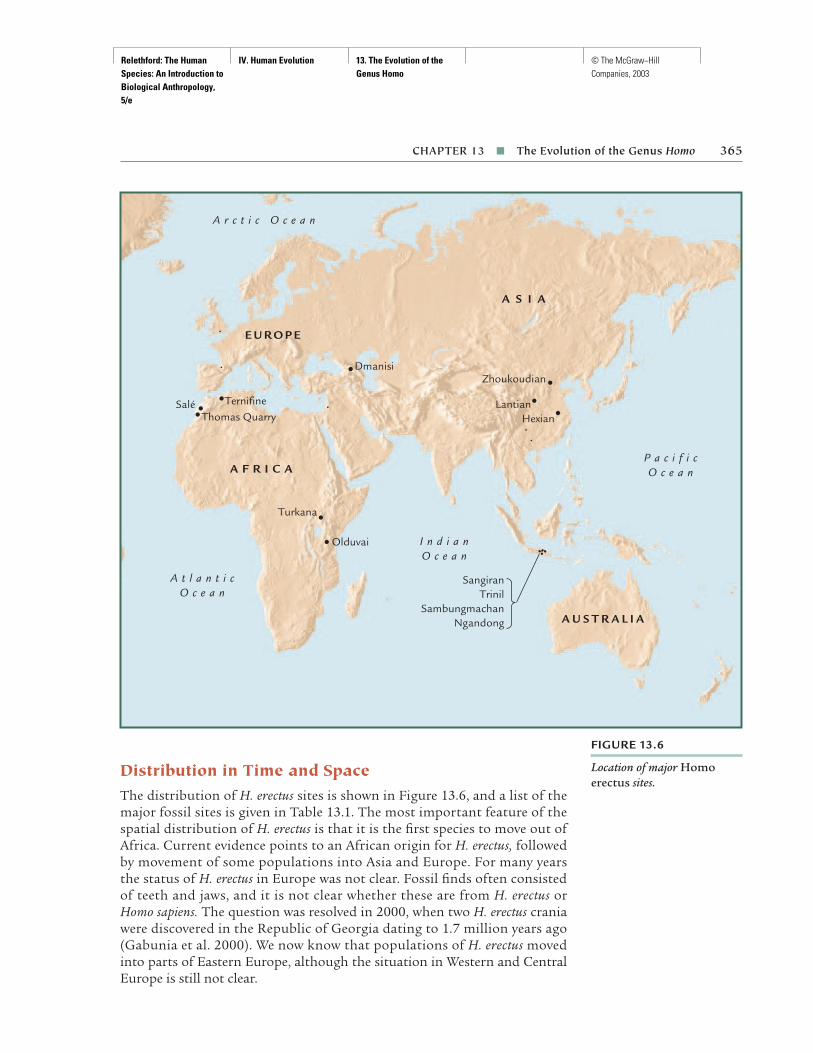
Relethford: The Human Species: An Introduction to Biological Anthropology, 5/e
IV. Human Evolution 13. The Evolution of the Genus Homo
© The McGraw−Hill Companies, 2003
Distribution in Time and SpaceThe distribution of H. erectus sites is shown in Figure 13.6, and a list of themajor fossil sites is given in Table 13.1. The most important feature of thespatial distribution of H. erectus is that it is the first species to move out ofAfrica. Current evidence points to an African origin for H. erectus, followedby movement of some populations into Asia and Europe. For many years the status of H. erectus in Europe was not clear. Fossil finds often consisted of teeth and jaws, and it is not clear whether these are from H. erectus or Homo sapiens. The question was resolved in 2000, when two H. erectus craniawere discovered in the Republic of Georgia dating to 1.7 million years ago(Gabunia et al. 2000). We now know that populations of H. erectus movedinto parts of Eastern Europe, although the situation in Western and CentralEurope is still not clear.
CHAPTER 13 ■ The Evolution of the Genus Homo 365
FIGURE 13.6
Location of major Homoerectus sites.
LantianHexian
Zhoukoudian
Turkana
Dmanisi
TernifineSaléThomas Quarry
Olduvai
SangiranTrinil
SambungmachanNgandong A U S T R A L I A
A F R I C A
A S I A
E U R O P E
P a c i f i cO c e a n
I n d i a nO c e a n
A t l a n t i cO c e a n
A r c t i c O c e a n

Relethford: The Human Species: An Introduction to Biological Anthropology, 5/e
IV. Human Evolution 13. The Evolution of the Genus Homo
© The McGraw−Hill Companies, 2003
The dates for the youngest H. erectus fossils have typically been about200,000 years ago. Recent redating of the Ngandong site in Indonesia sug-gests that this site might actually be as young as 53,000 years old and per-haps even younger (Swisher et al. 1996). If true, then this means that somepopulations of H. erectus were living at the same time as modern humans (seeChapter 14 for dates). If this is the case, then the overlap of the two species(H. erectus and H. sapiens) suggests cladogenesis. There are, however, some cri-tiques of the Ngandong redating (e.g., Grün and Thorne 1997). In addition,some suggest the Ngandong remains are actually archaic humans and not H. erectus at all (the problem is compounded by the fact that none of the Ngan-dong remains have faces—they are all the upper portions of the brain case,and some feel they are difficult to classify).
For many years, researchers believed Asian H. erectus was much youngerthan African H. erectus and suggested the oldest Asian populations (in In-donesia) were roughly 1 million years old. Given these dates, it appeared thatH. erectus had remained in Africa for almost 1 million years before some groupsmoved out to Asia. However, evidence based on argon-argon dating caused areassessment of this scenario. The new evidence dates H. erectus to 1.8 mil-lion to 1.6 million years ago in Indonesia (Swisher et al. 1994). This new datesuggests that some H. erectus populations moved out of Africa into Asia soonafter their initial African origin. The same is now true for Eastern Europe.
The movement of H. erectus into Indonesia might seem puzzling giventhe fact that today the islands of Indonesia are separated from the Asianmainland by water. In the past, however, the sea level was lower and there
366 PART IV ■ Human Evolution
TA B L E 13 .1 Some Major Fossil Sites for Homo erectus
Geographic Region Country Site/Specimen Age (Ma) Figure in Text
East Africa* Kenya East Turkana 2.0–1.3 13.9West Turkana 1.6 13.15
Tanzania Olduvai Gorge 1.2–0.7South Africa Republic of South Swartkrans 1.7–0.9
AfricaNorth Africa Algeria Ternifine 0.7 13.14
Morocco Sale˙ 0.2Eastern Europe Republic of Georgia Dmanisi 1.7Southeast Asia Indonesia Sangiran 1.8–1.6 13.11
Trinil 0.9?Sambungmachan 0.4Ngandong** 0.2/0.05–0.03
East Asia China Lantian 0.8Zhoukoudian 0.55–0.30 13.10Hexian 0.25
*Some anthropologists classify the early East Africa specimens as Homo ergaster.
**The Ngandong site has often been estimated at roughly 200,000 years old. More recent work suggests it might be as young as 53,000 to 27,000 years old. There is also debate over whether the Ngandong hominids should be considered H. erectus or archaic H. sapiens.
Sources: Swisher et al. (1994, 1996), Larsen et al. (1998), Klein (1999), Wolpoff (1999), Gabunia et al. (2000)

Relethford: The Human Species: An Introduction to Biological Anthropology, 5/e
IV. Human Evolution 13. The Evolution of the Genus Homo
© The McGraw−Hill Companies, 2003
was a direct land connection between mainland Asia and Indonesia. Anthro-pologists have long suggested that H. erectus simply walked to Indonesia.Work on the Indonesian island of Flores has challenged this view. Because ofdifferences in ocean depth, this island could have been reached only acrosswater even during times of lowered sea level. Stone tools similar to those usedelsewhere by H. erectus have been found on the island of Flores and dated to840,000 years ago (O’Sullivan et al. 2001). This evidence suggests that H. erec-tus may have been capable of using simple rafts to cross water. Of course, thelack of fossil evidence means that we can only presume that the toolmakerswere H. erectus and not another species. Either way, the evidence does showthat some hominid was crossing water in very ancient times.
General Physical CharacteristicsThe following section focuses on the physical characteristics of Homo erectus,specifically those of the skull, teeth, and postcranial skeleton. Some biologi-cal differences have been found between African and Asian populations of H. erectus. Given the large geographical distance between the two popula-tions, such differences are not surprising. Some anthropologists (e.g., Tatter-sall 1995) have interpreted these differences as indicating two separate species,Homo ergaster in Africa and Homo erectus in Asia, but most evidence to datepoints to a single species (e.g., Kramer 1993; Rightmire 1990).
Brain Size The most obvious characteristic of H. erectus, compared to earlierhominids, is its larger brain size (Figure 13.7). The average cranial capacity of H. erectus is 970 cc, which is approximately 72 percent of the average of modern
CHAPTER 13 ■ The Evolution of the Genus Homo 367
FIGURE 13.7
Comparison of the cranialcapacity of Australopithecus,early Homo (H. habilis andH. rudolfensis), and Homoerectus. The dots indicate the average cranial capacity(in cubic centimeters) for each group. The lines indicatethe range of cranial capacityfrom minimum to maximum.The data for H. erectusincludes the Ngandonghominids; if excluded, theaverage is slightly lower.(Sources of data: Australopithecinesand early Homo from Aiello andDunbar 1993; H. erectus from Ruffet al. 1997; updates and additionsfrom Suwa et al. 1997, Conroy et al.1998, Gabunia et al. 2000, and Falket al. 2000)
Cranial capacity (cc) 400 600 800 1000 1200 1400
Early Homo
Robust australopithecines
Australopithecus africanus
Homo erectus
Australopithecus afarensis

Relethford: The Human Species: An Introduction to Biological Anthropology, 5/e
IV. Human Evolution 13. The Evolution of the Genus Homo
© The McGraw−Hill Companies, 2003
humans. On average, the brain size of H. erectus is more than 50 percent largerthan that of other early Homo species (H. habilis and H. rudolfensis), and thereis an increase in the cranial capacity of H. erectus over time (Figure 13.8).
Cranial and Dental Characteristics One of the earliest H. erectus skulls, fromLake Turkana, Africa, is shown in Figure 13.9. Examples of Asian H. erectus
368 PART IV ■ Human Evolution
FIGURE 13.8
Plot of cranial capacity overtime for fossil specimens ofearly Homo (H. habilisand H. rudolfensis) andHomo erectus. The data for H. erectus includes theNgandong hominids. (Sources ofdata: Early Homo from Aiello andDunbar 1993; H. erectus from Ruffet al. 1997, Gabunia et al. 2000)
Date (Ma)
Early Homo
Homo erectus
0.00.51.01.52.0
1100
1300
900
700
500
300
Cra
nial
cap
acity
(cc
)
FIGURE 13.9
Homo erectus skull,specimen KNM-ER 3733, Lake Turkana, Kenya. Datedat 1.8 million years ago, this is one of the oldest knownspecimens of Homo erectus(some anthropologists considerthis specimen a differentspecies, Homo ergaster). (© The National Museums of Kenya)

Relethford: The Human Species: An Introduction to Biological Anthropology, 5/e
IV. Human Evolution 13. The Evolution of the Genus Homo
© The McGraw−Hill Companies, 2003
are shown in Figure 13.10 (China) and Figure 13.11 (Indonesia). Overall, thebrain case of H. erectus is larger than that of earlier hominids, but it is stillsmaller than that of modern H. sapiens. The skull is lower, and the face stillprotrudes more than in modern humans. Neck muscles are attached to aridge of bone along the back side of the skull. The development of this bonyridge shows that H. erectus had powerful neck muscles.
Figure 13.12 shows a H. erectus skull and a H. sapiens skull from a topview. The frontal region of the H. erectus skull is still rather narrow (post-orbital constriction), suggesting lesser development in the frontal and tem-poral lobes of the brain relative to modern humans. This implies that the in-tellectual abilities of H. erectus were not as great as in modern humans. Thebest evidence for the mental aptitude of H. erectus, however, comes from thearchaeological record, discussed later. Figure 13.13 shows a H. erectus skulland a H. sapiens skull from the rear view. Note that the brain case of H. erectusis much broader toward the bottom of the skull.
CHAPTER 13 ■ The Evolution of the Genus Homo 369
FIGURE 13.11 (left)
Frontal and side views ofHomo erectus skull, specimenSangiran 17, from Sangiran,Indonesia. (Courtesy MilfordWolpoff, University of Michigan,Ann Arbor)
postorbital constrictionThe narrowness of the skull behind the eye orbits, a characteristic of earlyhominids.
I I I I I I I
FIGURE 13.10 (above)
Frontal and side views ofHomo erectus from the site of Zhoukoudian, China. Thespecimens from this site aresometimes referred to as“Peking Man” in olderliterature. (Negs. No. 315446[ left], and 315447 [right].Courtesy Department of LibraryServices, American Museum ofNatural History)

Relethford: The Human Species: An Introduction to Biological Anthropology, 5/e
IV. Human Evolution 13. The Evolution of the Genus Homo
© The McGraw−Hill Companies, 2003
The face of H. erectus protrudes, but not as much as in earlier hominids.One noticeable characteristic of the H. erectus face is the development of largeridges of bone above the eye orbits (brow ridges). The jaws and teeth of H. erectus are still large compared to those of modern humans but smaller thanthose of earlier hominids (Figure 13.14). In particular, the size of the backteeth of H. erectus decreased relative to those of earlier hominids. Electron-scanning-microscopic analysis shows that the wear patterns of H. erectusteeth are characteristic of extensive meat eating.
The Postcranial Skeleton The first specimen of H. erectus was discoveredby Eugene Dubois in Java in 1891. This find consisted of the upper portionof a skull and a femur. Most scientists in the late nineteenth century wouldhave been hesitant to include the skullcap in our genus, for the then-currentview was that all human ancestors had modern-sized brains. Any fossil witha smaller brain was excluded from our ancestry. The femur that Duboisfound, however, was virtually the same as that of a modern human. Becausethe two bones were found together, Dubois reasoned that upright walkinghad developed before the completion of a modern human skull. Though thisstatement now seems perfectly reasonable, it was controversial at the time.
For many years, the postcranial evidence for H. erectus was limited to por-tions of individuals—a femur here or a pelvic bone there. In 1984, this situa-tion changed with the discovery of a nearly complete H. erectus skeleton atLake Turkana dating 1.6 million years ago (Brown et al. 1985). This skeleton(Figure 13.15) is that of a young male. The pattern of dental eruption sug-gests he was about 12 years old when he died. This age estimate depends onthe extent to which his growth patterns were similar to those of modern hu-mans; some have suggested he might have been younger. One of the moststriking features of this extremely complete skeleton is that he was tall; had
370 PART IV ■ Human Evolution
FIGURE 13.12
Top views of the skulls ofHomo erectus ( left) andmodern Homo sapiens(right). Note the greaterconstriction behind the eyes in Homo erectus.
FIGURE 13.13
Rear views of the skulls ofHomo erectus ( left) andmodern Homo sapiens(right). Note the broaderbrain case of Homo sapiens.
FIGURE 13.14
Lower jaw of Homo erectus,specimen, Ternifine 3, Ternifine,Algeria, 700,000 years ago.(From Clark Spencer Larsen, RobertM. Matter, and Daniel L. Gebo,Human Origins: The FossilRecord, 3d ed., p. 101. © 1998,1991, 1985 by Waveland Press, Inc.,Prospect Heights, Ill. Reprinted withpermission from the publisher)
brow ridges The large ridgesof bone above the eye orbits,most noticeable in Homoerectus and archaic humans.
I I I I I I I

Relethford: The Human Species: An Introduction to Biological Anthropology, 5/e
IV. Human Evolution 13. The Evolution of the Genus Homo
© The McGraw−Hill Companies, 2003
he lived to adulthood, he might have been 6 feet tall, well above the averagefor many modern human populations (although this estimate is not acceptedby all—see Bogin and Smith 1996). Also, note that the body proportions arevery similar to those of modern humans and different from those of earlierhominids, which had slightly longer arms.
This H. erectus find also provides us with valuable information about theevolution of brain size in early human evolution. Portions of the pelvis arenarrow relative to those of modern humans. Because little sexual dimorphismis apparent in certain pelvic dimensions, Brown and colleagues (1985) feel
CHAPTER 13 ■ The Evolution of the Genus Homo 371
FIGURE 13.15
Homo erectus skeleton,specimen KNM-WT 15000,Lake Turkana, Kenya. Thisskeleton of a 12-year-old boy,dated to 1.6 million years ago,is the most complete specimenof Homo erectus yet found.(© David L. Brill/Brill Atlanta)

Relethford: The Human Species: An Introduction to Biological Anthropology, 5/e
IV. Human Evolution 13. The Evolution of the Genus Homo
© The McGraw−Hill Companies, 2003
that some measurements taken from this specimen can apply to both malesand females. Their analysis leads to the suggestion that H. erectus females couldnot have given birth to very large-brained babies. To reach the relatively largebrain sizes shown by H. erectus, the rate of brain growth must have continuedto increase after birth. Had H. erectus shown the typical primate pattern ofthe brain size simply doubling after birth, their brains would not have beenas large as they were. It seems that the modern human pattern of extensivepostnatal brain growth had begun.
Cultural BehaviorGiven the increase in brain size in H. erectus, it is no surprise that correspond-ing changes took place in cultural adaptations. The stone tool technology of H. erectus was more sophisticated and specialized than that of H. habilisand H. rudolfensis. Although not all agree, most anthropologists suggest thatH. erectus was a skilled cooperative hunter. Some populations of H. erectus usedcaves for shelter, and others, perhaps, made their own temporary shelters whencaves were not available. H. erectus also used fire for cooking and warmth, al-though it is not clear whether they made fire or relied instead on natural fire.
Stone Tool Technology In general, the stone tool technology of H. erectuswas more diverse and sophisticated than the simple Oldowan tool technology
372 PART IV ■ Human Evolution
FIGURE 13.16
Making an Acheulian tool.Nicholas Toth uses a piece ofantler to remove small flakesfrom both sides of the flint,producing a symmetric handaxe. Shown are flint hand axes and a cleaver. (Courtesy ofNicholas Toth, Indiana University)
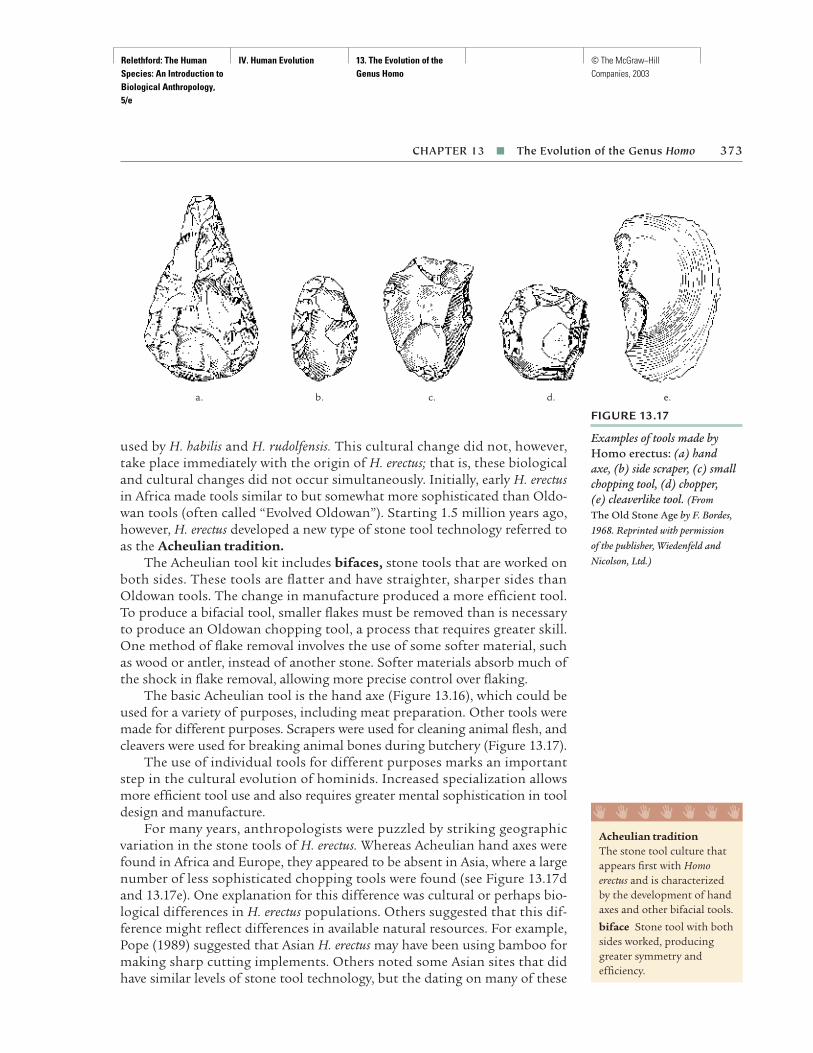
Relethford: The Human Species: An Introduction to Biological Anthropology, 5/e
IV. Human Evolution 13. The Evolution of the Genus Homo
© The McGraw−Hill Companies, 2003
used by H. habilis and H. rudolfensis. This cultural change did not, however,take place immediately with the origin of H. erectus; that is, these biologicaland cultural changes did not occur simultaneously. Initially, early H. erectusin Africa made tools similar to but somewhat more sophisticated than Oldo-wan tools (often called “Evolved Oldowan”). Starting 1.5 million years ago,however, H. erectus developed a new type of stone tool technology referred toas the Acheulian tradition.
The Acheulian tool kit includes bifaces, stone tools that are worked onboth sides. These tools are flatter and have straighter, sharper sides thanOldowan tools. The change in manufacture produced a more efficient tool.To produce a bifacial tool, smaller flakes must be removed than is necessaryto produce an Oldowan chopping tool, a process that requires greater skill.One method of flake removal involves the use of some softer material, suchas wood or antler, instead of another stone. Softer materials absorb much ofthe shock in flake removal, allowing more precise control over flaking.
The basic Acheulian tool is the hand axe (Figure 13.16), which could beused for a variety of purposes, including meat preparation. Other tools weremade for different purposes. Scrapers were used for cleaning animal flesh, andcleavers were used for breaking animal bones during butchery (Figure 13.17).
The use of individual tools for different purposes marks an importantstep in the cultural evolution of hominids. Increased specialization allowsmore efficient tool use and also requires greater mental sophistication in tooldesign and manufacture.
For many years, anthropologists were puzzled by striking geographicvariation in the stone tools of H. erectus. Whereas Acheulian hand axes werefound in Africa and Europe, they appeared to be absent in Asia, where a largenumber of less sophisticated chopping tools were found (see Figure 13.17dand 13.17e). One explanation for this difference was cultural or perhaps bio-logical differences in H. erectus populations. Others suggested that this dif-ference might reflect differences in available natural resources. For example,Pope (1989) suggested that Asian H. erectus may have been using bamboo formaking sharp cutting implements. Others noted some Asian sites that didhave similar levels of stone tool technology, but the dating on many of these
CHAPTER 13 ■ The Evolution of the Genus Homo 373
FIGURE 13.17
Examples of tools made byHomo erectus: (a) hand axe, (b) side scraper, (c) smallchopping tool, (d) chopper, (e) cleaverlike tool. (From The Old Stone Age by F. Bordes,1968. Reprinted with permission of the publisher, Wiedenfeld andNicolson, Ltd.)
a. d.c.b. e.
Acheulian traditionThe stone tool culture thatappears first with Homoerectus and is characterizedby the development of handaxes and other bifacial tools.
biface Stone tool with bothsides worked, producinggreater symmetry andefficiency.
I I I I I I I

Relethford: The Human Species: An Introduction to Biological Anthropology, 5/e
IV. Human Evolution 13. The Evolution of the Genus Homo
© The McGraw−Hill Companies, 2003
sites is unclear. Recently, stone tools made using Acheulianlike technologyhave been found in China dating to the time of H. erectus, 803,000 years ago(Hou et al. 2000).
Hunting and Gathering The fossil and archaeological records show thatH. erectus was definitely a hunter of small and large game. The earliest evi-dence of hunting dates from Olduvai Gorge (Figure 13.18) 1.5 million yearsago. All of the bones from larger animals are found, suggesting a singlebutchering site rather than fragmentary scavenging. The bones are also morefragmented, showing greater use of the animal carcass (Wolpoff 1999). Thecomplete use of animal carcasses matches the pattern found with modernhunting-and-gathering groups and is different from that expected with scav-enging. The increased variety of stone tools for butchering also supports theidea that H. erectus was a hunter, as does dental evidence, which shows a sig-nificant amount of meat in the diet.
One of the best-known H. erectus sites showing evidence of hunting isZhoukoudian, China. Here H. erectus populations lived intermittently in cavesbetween approximately 550,000 and 300,000 years ago (Larsen et al. 1998).The caves were used as living sites and are littered with animal bones, toolsand tool scraps, and fossilized hominid feces. In addition, parts of the remainsof more than 40 H. erectus individuals have been found at the Zhoukoudiancaves. This site has long been known as the place of “Peking Man,” namedafter the nearby city of Beijing (Peking), China.
FIGURE 13.18
Olduvai Gorge, Tanzania.Homo erectus fossils andAcheulian hand axes have beenfound at this site, as well asother hominid fossils and tools.(© Bildarchiv Okapia/ScienceSource/Photo Researchers, Inc.)
374
Relethford: The Human Species: An Introduction to Biological Anthropology, 5/e
IV. Human Evolution 13. The Evolution of the Genus Homo
© The McGraw−Hill Companies, 2003
The bones and stones at different sites show that hunting was an impor-tant source of food. Was it the only source? Gathering vegetables, fruits, nuts,and other foods was surely just as important to the survival of H. erectus. Inmodern hunting-and-gathering societies, up to 75 percent of the total caloricintake of a group comes from gathering. In the past, anthropologists havetended to focus more on hunting than on gathering. This focus was in part aconsequence of the nature of the archaeological record (bones and stones pre-serve more easily than do vegetables or wooden containers).
Another factor behind this emphasis on hunting was male bias, unfortu-nately common in many scientific fields. Modern hunting-and-gathering so-cieties show a clear division of labor by sex—men are generally the huntersand women the gatherers. The early interpretation of (mostly male) anthro-pologists focused on what was considered the more “important” and “diffi-cult” task of male hunting. This interpretation influenced other hypotheseson prehistoric human behavior. Males were assumed to be the hunters be-cause they had the necessary strength. However, although males are generallystronger than females, this slight difference would not have mattered inhunting. Not even the strongest male today can knock down an elephant byhimself ! Hunting requires skill and stealth more than strength. The impor-tant distinction between hunting and gathering is that the former activityrequires greater mobility, and moving around may not be conducive to suc-cessful human pregnancy or nursing. Gathering can be performed in a localarea, whereas hunting requires traveling long distances over many days. Also,the crying of infants would make hunting difficult.
Because gathering accounts for the majority of calories, we could alsoargue for a female-centered view: instead of “man the hunter” we could have“woman the gatherer.” Both of these ideas, however, miss the main feature ofhunting-and-gathering society—food sharing. Hunting and gathering wereequally important activities, and the survival and geographic expansion ofH. erectus depended on both. The division of labor and food sharing ofhunter-gatherers show close and cooperative social structures. We cannotobserve H. erectus society firsthand, of course. Using what we know from thearchaeological record and from modern hunting-and-gathering societies,however, we can safely infer the existence of small social groups banded to-gether for mutual benefit.
Fire The movement of H. erectus into East Asia shows the importance ofcultural adaptations. Hominids are tropical primates, and expansion intocolder climates required an appropriate level of technology. Fire was an im-portant source of warmth and light and made cooking possible so that foodwas easier to chew and digest. In addition, fire can be used for tool manufac-ture. The tip of a wooden spear can be placed in a fire for a short period toharden the point. We can also speculate that fire allowed social interactionsand teaching after dark.
Evidence for controlled fire comes from the cave hearths at Zhoukoudianand other H. erectus sites. The oldest possible use of fire by H. erectus was inAfrica roughly 1.6 million years ago (Wolpoff 1999), although these early
CHAPTER 13 ■ The Evolution of the Genus Homo 375
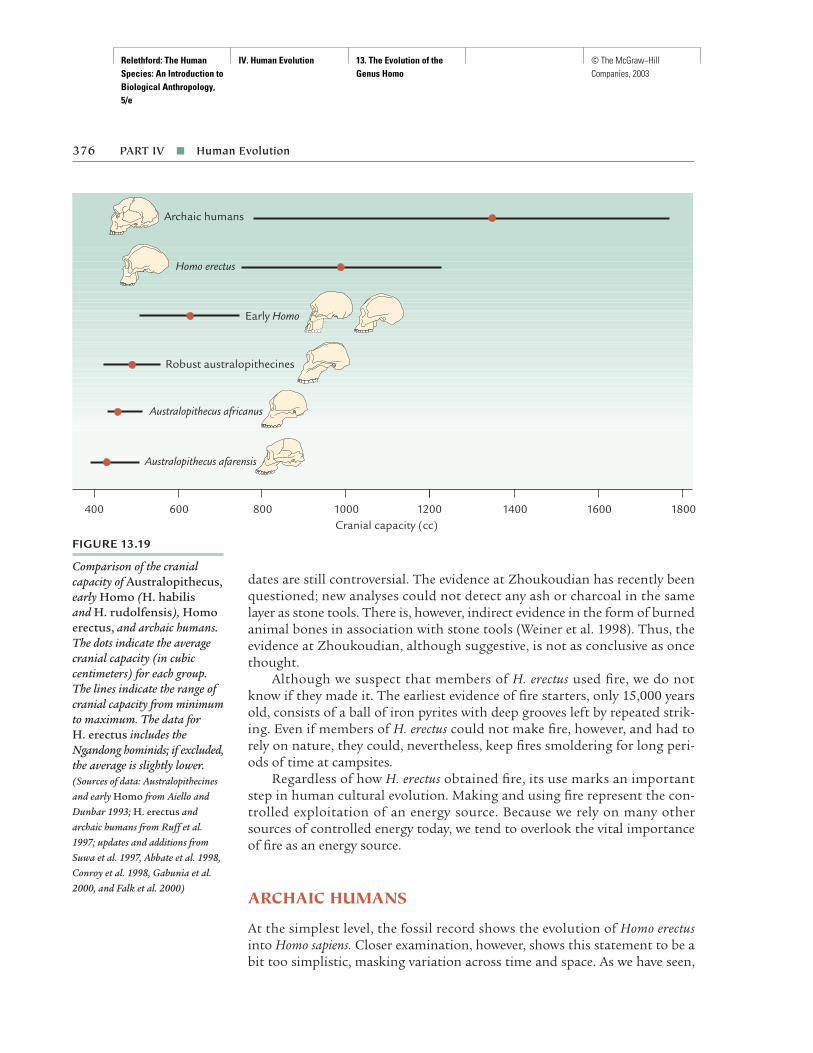
Relethford: The Human Species: An Introduction to Biological Anthropology, 5/e
IV. Human Evolution 13. The Evolution of the Genus Homo
© The McGraw−Hill Companies, 2003
dates are still controversial. The evidence at Zhoukoudian has recently beenquestioned; new analyses could not detect any ash or charcoal in the samelayer as stone tools. There is, however, indirect evidence in the form of burnedanimal bones in association with stone tools (Weiner et al. 1998). Thus, theevidence at Zhoukoudian, although suggestive, is not as conclusive as oncethought.
Although we suspect that members of H. erectus used fire, we do notknow if they made it. The earliest evidence of fire starters, only 15,000 yearsold, consists of a ball of iron pyrites with deep grooves left by repeated strik-ing. Even if members of H. erectus could not make fire, however, and had torely on nature, they could, nevertheless, keep fires smoldering for long peri-ods of time at campsites.
Regardless of how H. erectus obtained fire, its use marks an importantstep in human cultural evolution. Making and using fire represent the con-trolled exploitation of an energy source. Because we rely on many othersources of controlled energy today, we tend to overlook the vital importanceof fire as an energy source.
ARCHAIC HUMANS
At the simplest level, the fossil record shows the evolution of Homo erectusinto Homo sapiens. Closer examination, however, shows this statement to be abit too simplistic, masking variation across time and space. As we have seen,
376 PART IV ■ Human Evolution
FIGURE 13.19
Comparison of the cranialcapacity of Australopithecus,early Homo (H. habilisand H. rudolfensis), Homoerectus, and archaic humans.The dots indicate the averagecranial capacity (in cubiccentimeters) for each group.The lines indicate the range ofcranial capacity from minimumto maximum. The data for H. erectus includes theNgandong hominids; if excluded,the average is slightly lower.(Sources of data: Australopithecinesand early Homo from Aiello andDunbar 1993; H. erectus andarchaic humans from Ruff et al.1997; updates and additions fromSuwa et al. 1997, Abbate et al. 1998,Conroy et al. 1998, Gabunia et al.2000, and Falk et al. 2000)
Cranial capacity (cc) 400 600 800 1000 1200 1400 1600 1800
Early Homo
Robust australopithecines
Australopithecus africanus
Homo erectus
Australopithecus afarensis
Archaic humans

Relethford: The Human Species: An Introduction to Biological Anthropology, 5/e
IV. Human Evolution 13. The Evolution of the Genus Homo
© The McGraw−Hill Companies, 2003
some populations of H. erectus survived until 200,000 years ago and perhapseven longer. Elsewhere in the Old World, however, we see fossils differentfrom H. erectus appear roughly 500,000 years ago (and perhaps earlier). Manyanthropologists classify these non-erectus fossils as early H. sapiens, in largepart because they are clearly not H. erectus and they had larger brains. How-ever, they are not the same as modern H. sapiens, thus creating a problem innaming and classification. What do we call them? Some anthropologists sug-gest lumping all of these fossils together as early examples of Homo sapiens,whereas other anthropologists argue that these fossils represent two or morespecies. For the purpose of discussion here, we will refer to these large-brained(but not modern) specimens as archaic humans.
The most noticeable characteristic of the archaic humans is the furtherincrease in brain size (Figures 13.19 and 13.20). The average brain size of thearchaic specimens plotted in these figures is virtually identical to the averagefor modern humans of 1350 cc. These values mask some important varia-tion. The earliest archaics generally have smaller cranial capacities. Also, therehas been a slight reduction in average brain size over the past 35,000 years orso, probably reflecting a reduction in overall body size (Henneberg 1988; Ruffet al. 1997).
Anagenesis or Cladogenesis?Some paleoanthropologists view the transition from H. erectus to archaic hu-mans to modern humans as evolution within a single evolutionary line; thatis, anagenesis, as described in Chapter 4. Proponents of this model view all ofthese forms as different stages within a single species over time and have sug-gested that they all be considered Homo sapiens. Under this model, H. erectus
CHAPTER 13 ■ The Evolution of the Genus Homo 377
FIGURE 13.20
Plot of cranial capacity overtime for fossil specimens ofearly Homo (H. habilis and H. rudolfensis), Homoerectus, and archaic humans.The data for H. erectusincludes the Ngandonghominids. (Sources of data: Early Homo from Aiello andDunbar 1993; H. erectus andarchaic humans from Ruff et al.1997, Abbate et al. 1998, Gabunia et al. 2000)
Date (Ma)
0.00.51.01.52.0
1500
1800
1200
900
600
300
Cra
nial
cap
acity
(cc
)
Early HomoHomo erectusArchaic humans
archaic humans Specimensof Homo with brain size closeto that of modern humansbut with differently shapedskulls. There is considerablecontroversy over whetherthey are an earlier form ofHomo sapiens or representdifferent species.
I I I I I I I

Relethford: The Human Species: An Introduction to Biological Anthropology, 5/e
IV. Human Evolution 13. The Evolution of the Genus Homo
© The McGraw−Hill Companies, 2003
should be renamed “early Homo sapiens” (Wolpoff 1999). Not everyone agreeswith this view. Others suggest that H. erectus was a separate biological speciesand that the origin of later species was through cladogenesis (e.g., Rightmire1992, 1996). Some go further and suggest that H. erectus fossils actually rep-resent two different species (Tattersall 1995).
Disagreement also exists when considering the archaic humans. Someview them simply as “archaic Homo sapiens,” whereas others see evidence oftwo or more separate species. We will deal with these debates in more detailthroughout the remainder of this chapter and the next. A summary of sev-eral views is shown in Table 13.2.
Distribution in Time and SpaceArchaic humans have been found at a number of sites in Africa, Europe, andAsia (Figure 13.21) dating, for the most part, between approximately 500,000and 28,000 years ago. This time range is conservative—discoveries from theAtapuerca site in Spain suggest that members of the genus Homo might dateback as far as 650,000 years ago (Bermúdez de Castro et al. 1997). Althoughthese remains are not those of H. erectus, it is not clear whether they are anearly group of archaic H. sapiens or a different species altogether (the authorssuggested a new species, “Homo antecessor,” but few anthropologists have yetaccepted this suggestion). Another example is the discovery of a cranium,roughly 1 million years old, from the Ethiopian site of Danakil (Abbate et al.1998). This specimen has a mix of features found in both H. erectus and in H. sapiens. Future debate will focus on whether this specimen can be assignedto a given species, requires a new species name, or simply represents a transi-tion between H. erectus and H. sapiens.
Given the large number of sites and specimens, it is useful to look moreclosely at patterns of regional variation. Some of the better known regionsinclude sub-Saharan Africa, North Asia, South Asia, and Southeast Asia and
378 PART IV ■ Human Evolution
TA B L E 13 . 2 Examples of How Paleoanthropologists Name Fossilsin the Genus Homo
Number of Species
Labels Used Current Maximum in This Text Minimum Number Number
Homo erectus Early Homo sapiens Homo erectusHomo ergaster
Archaic humans Archaic Homo sapiens Homo antecessorHomo heidelbergensisHomo neanderthalensis
Modern humans Recent Homo sapiens Homo sapiens
Sources: Based on information from Tattersall (1995), Bermúdez de Castro et al. (1997), andWolpoff (1999)

Relethford: The Human Species: An Introduction to Biological Anthropology, 5/e
IV. Human Evolution 13. The Evolution of the Genus Homo
© The McGraw−Hill Companies, 2003
Australia (often lumped together as “Australasia”). Table 13.3 lists a numberof the major sites of archaic humans. Note the heavy concentration of sitesin Europe. In the past, scientists tended to focus most of their efforts onthese sites. Now it is generally recognized that human evolution needs to bestudied on a global level.
Because of this interest in European fossils, particular emphasis in thepast was placed on a regional population known as the Neandertals. Theword Neandertal is German for simply “Neander Valley,” the site where one ofthe first specimens was discovered. The Neandertals lived in the regions sur-rounding the Mediterranean, including Western Europe, Central and EasternEurope, and the Middle East. Neandertal remains have been found datingbetween roughly 150,000 and 28,000 years ago.
CHAPTER 13 ■ The Evolution of the Genus Homo 379
FIGURE 13.21
Map of some archaic humansites.
A U S T R A L I A
A F R I C A
A S I A
E U R O P E
P a c i f i cO c e a n
I n d i a nO c e a n
A t l a n t i cO c e a n
A r c t i c O c e a n
Petralona
Bodo
EhringsdorfSteinheim
Vértesszöllös
Arago
Ndutu
Broken Hill/Kabwe
Swanscombe
AmudShanidar
Tabun andKebara
SpyNeandertal
Saccopastore
MonteCirceoGibraltar
Teshik-Tash
Combe GrenalLa FerrassieLa Chapelle-aux-SaintsFontéchevadeLe MoustierLa QuinaKrapina
Jebel Irhoud
FlorisbadSaldanha
Laetoli
Narmada
Dali
Maba
Neandertals A populationof archaic humans that livedin Europe and the MiddleEast, dating between 150,000and 28,000 years ago.
I I I I I I I

Relethford: The Human Species: An Introduction to Biological Anthropology, 5/e
IV. Human Evolution 13. The Evolution of the Genus Homo
© The McGraw−Hill Companies, 2003
Early ArchaicsEarly archaic humans are found throughout much of the Old World betweenabout 500,000 and 150,000 years ago.
Physical Characteristics Both archaic and anatomically modern humanshave large brains, and brain size cannot be used to distinguish between thetwo groups. The cranial shape of these two groups, however, is on averagedifferent. Archaic humans had low skulls with sloping foreheads, whereasmodern humans have high skulls and vertical foreheads. Also, the face andteeth of archaic humans are larger than those in modern humans. Specimensof archaic humans rarely have a chin, something found in modern humans.The postcranial skeleton of many archaic human specimens is very similar tomodern forms. In general, the bones of archaic humans are thicker and showmarkings for greater musculature.
An example of an early archaic human is shown in Figure 13.22. Thisskull, from Petralona, Greece, is roughly 200,000 years old. Its cranial capac-ity (1,230 cc) places it at the upper range of later H. erectus and slightly lower
380
S P E C I A L T O P I C
Neandertals: Names and ImagesThe name Neandertal comes from the site in the NeanderValley in Germany where Neandertals were first found. In German, tal means “valley.” Hence, Neandertal means“Neander Valley.” You may be more familiar with analternative spelling (“Neanderthal”) and an alternativepronunciation (emphasizing the “THAL” sound). How-ever, the h is silent in German so that thal is actually pro-nounced “tal.” Because of this characteristic of Germanpronunciation, many (although not all) anthropologistssimply drop the h in the spelling as well.
The very mention of Neandertals usually invokes anumber of images and preconceptions. You may, for ex-ample, conjure up one of many images of the Neandertalsas crude and simple subhumans with limited intelligencethat walk bent over. These images have become such apart of our popular culture that a typical dictionary defi-nition includes “Neandertal” as an adjective meaning“suggesting primitive man in appearance or behavior(Neandertal ferocity)” and “extremely old-fashioned or out-of-date,” as well as a noun meaning “a rugged or uncouthperson” (Webster’s Third International Dictionary).
Why do Neandertals have such a bad reputation? Asdiscussed in this chapter, Neandertals are viewed by mostanthropologists as a regional population of archaic hu-mans. The distinctive appearance of Neandertals is oftenacknowledged by scientists who refer to them as a differ-ent subspecies of humans—that is, Homo sapiens neander-
thalensis, as opposed to modern humans, who are classifiedin the subspecies Homo sapiens sapiens. Some anthropolo-gists argue that Neandertals are sufficiently different tobe placed in a different species altogether—Homo nean-derthalensis (note that the h remains in the species andsubspecies names, as per international agreement). Re-gardless of classification, however, we know that Nean-dertals had large brains, walked upright, and possessed asophisticated culture including stone tools, hunting, useof fire, and cave burial.
Part of the image problem comes from an inaccuratereconstruction of a Neandertal skeleton in the early 1900s.Because of certain physical features, such as curved thighbones, scientists of the time believed that Neandertals did not walk completely upright, moving about bent overinstead. It was discovered later that the curved bones andother features were simply a reflection of the poor health,including severe arthritis, of that particular Neandertal.Other features once taken to indicate mental inferiority,such as large brow ridges, are now recognized as biome-chanical in nature. Even though the scientific interpreta-tion has changed, the popular images of Neandertalsremain to this day. More information on the history ofNeandertals, including further discussion of their image,can be found in Trinkaus and Shipman (1992) andStringer and Gamble (1993).
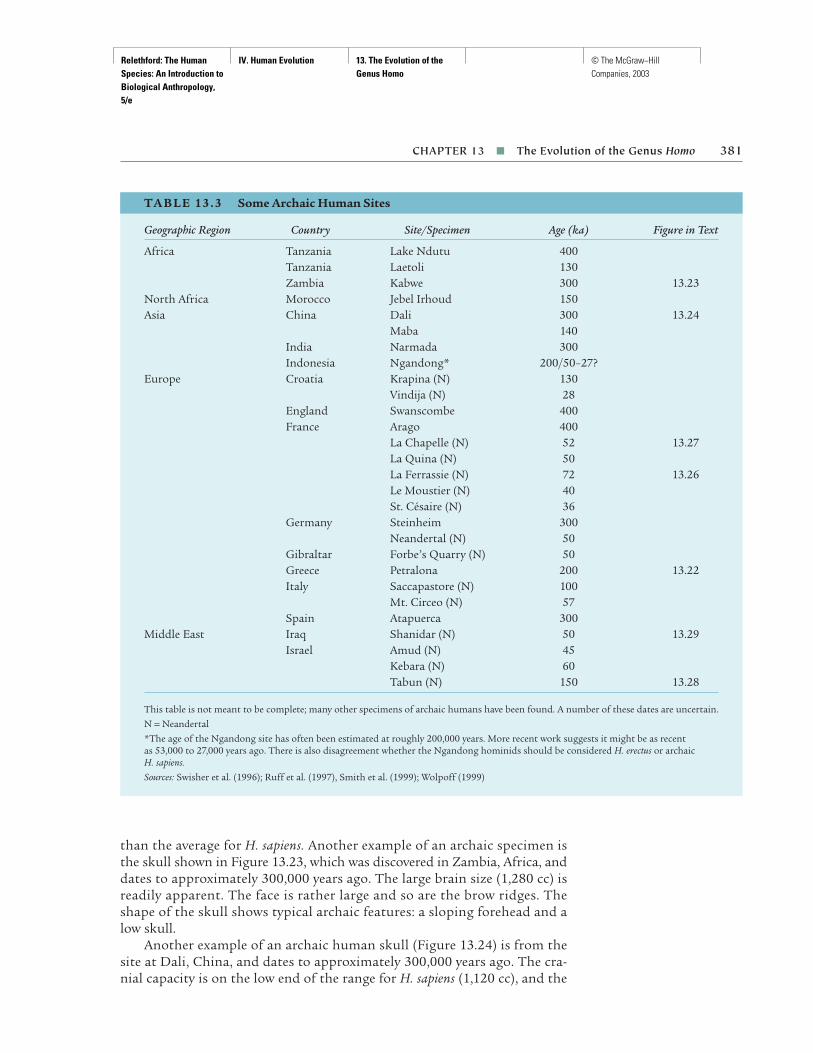
Relethford: The Human Species: An Introduction to Biological Anthropology, 5/e
IV. Human Evolution 13. The Evolution of the Genus Homo
© The McGraw−Hill Companies, 2003
than the average for H. sapiens. Another example of an archaic specimen isthe skull shown in Figure 13.23, which was discovered in Zambia, Africa, anddates to approximately 300,000 years ago. The large brain size (1,280 cc) isreadily apparent. The face is rather large and so are the brow ridges. Theshape of the skull shows typical archaic features: a sloping forehead and alow skull.
Another example of an archaic human skull (Figure 13.24) is from thesite at Dali, China, and dates to approximately 300,000 years ago. The cra-nial capacity is on the low end of the range for H. sapiens (1,120 cc), and the
CHAPTER 13 ■ The Evolution of the Genus Homo 381
TA B L E 13 . 3 Some Archaic Human Sites
Geographic Region Country Site/Specimen Age (ka) Figure in Text
Africa Tanzania Lake Ndutu 400Tanzania Laetoli 130Zambia Kabwe 300 13.23
North Africa Morocco Jebel Irhoud 150Asia China Dali 300 13.24
Maba 140India Narmada 300Indonesia Ngandong* 200/50–27?
Europe Croatia Krapina (N) 130Vindija (N) 28
England Swanscombe 400France Arago 400
La Chapelle (N) 52 13.27La Quina (N) 50La Ferrassie (N) 72 13.26Le Moustier (N) 40St. Césaire (N) 36
Germany Steinheim 300Neandertal (N) 50
Gibraltar Forbe’s Quarry (N) 50Greece Petralona 200 13.22Italy Saccapastore (N) 100
Mt. Circeo (N) 57Spain Atapuerca 300
Middle East Iraq Shanidar (N) 50 13.29Israel Amud (N) 45
Kebara (N) 60Tabun (N) 150 13.28
This table is not meant to be complete; many other specimens of archaic humans have been found. A number of these dates are uncertain.
N = Neandertal
*The age of the Ngandong site has often been estimated at roughly 200,000 years. More recent work suggests it might be as recent as 53,000 to 27,000 years ago. There is also disagreement whether the Ngandong hominids should be considered H. erectus or archaic H. sapiens.
Sources: Swisher et al. (1996); Ruff et al. (1997), Smith et al. (1999); Wolpoff (1999)

Relethford: The Human Species: An Introduction to Biological Anthropology, 5/e
IV. Human Evolution 13. The Evolution of the Genus Homo
© The McGraw−Hill Companies, 2003
382 PART IV ■ Human Evolution
FIGURE 13.22
The Petralona skull, Greece.An example of an early archaichuman from Europe. (FromClark Spencer Larsen, Robert M.Matter, and Daniel L. Gebo,Human Origins: The FossilRecord, 3d ed., p. 117. © 1998,1991, 1985 by Waveland Press, Inc.,Prospect Heights, Ill. Reprinted withpermission from the publisher)
FIGURE 13.23
The Broken Hill skull, Kabwe,Zambia. An example of earlyarchaic Homo sapiens fromAfrica. (© The Natural HistoryMuseum, London)
FIGURE 13.24
The Dali skull, Dali County,People’s Republic of China. An example of archaic Homosapiens from Asia. (From ClarkSpencer Larsen, Robert M. Matter,and Daniel L. Gebo, HumanOrigins: The Fossil Record, 3ded., p. 128. © 1998, 1991, 1985 byWaveland Press, Inc., ProspectHeights, Ill. Reprinted withpermission from the publisher)

Relethford: The Human Species: An Introduction to Biological Anthropology, 5/e
IV. Human Evolution 13. The Evolution of the Genus Homo
© The McGraw−Hill Companies, 2003
brow ridges are large. The skull is low and has a sloping forehead, both typi-cal archaic features. The Dali skull also illustrates regional variation. As inmany archaic North Asian specimens, the face is smaller and flatter than inother regions of the world. These traits, among others, are also found in ear-lier and later North Asian specimens (Thorne and Wolpoff 1992).
Cultural Behavior Like H. erectus, archaic humans were hunters and gath-erers, exploiting a wide variety of natural resources. Remains of animal bonesat their sites show that they hunted both small game and large, includingbears, mammoths, and rhinoceroses. In some areas it appears that archaichumans hunted year round; in others they apparently migrated along withanimal herds.
The early archaic humans continued using Acheulian tools such as hand-axes but often showed improvement in technique. Archaic humans also de-veloped a new method of manufacture, the Levallois, or prepared-core,method (Schick and Toth 1993). As Figure 13.25 shows, a flint nodule is firstchipped around the edges. Small flakes are then removed from the top sur-face of the core. In the final step, the core is struck precisely at one end. Thistype of method allows maximum utilization of stone cores.
CHAPTER 13 ■ The Evolution of the Genus Homo 383
FIGURE 13.25
Manufacture of a stone tool,using the prepared-core method.First, the core is shaped byremoving small flakes from thesides and top (a–d). Then thefinished tool is removed fromthe core (e). (From Archaeology:Discovering Our Past, 2d ed., byRobert Sharer and Wendy Ashmore,Fig. 10.3. © 1993 by MayfieldPublishing Company. Reprinted withpermission from The McGraw-HillCompanies)
Side Views Top Views
a.
c.
b.
d.
e.
Flake
Core
prepared-core method Anefficient method of stonetool manufacture in which a stone core is prepared and then finished tools areremoved from it.
I I I I I I I

Relethford: The Human Species: An Introduction to Biological Anthropology, 5/e
IV. Human Evolution 13. The Evolution of the Genus Homo
© The McGraw−Hill Companies, 2003
The use of the prepared-core technique, which produces sharp and sym-metric tools, tells us two important things about archaic humans. First, theywere capable of precise toolmaking, which implies an excellent knowledge offlaking methods and the structural characteristics of stone. Second, theywere able to visualize the final tool early in production. Not until the laststep does the shape of the finished tool become apparent. Such manufactureis a process quite different from simply chipping away at a stone until a toolis finished.
The NeandertalsOf all the regional populations of archaic humans, the best known (and themost puzzling) are the Neandertals. Many of the Neandertals lived duringglacial times. The Pleistocene epoch witnessed alternating periods of glacia-tion and interglacials as the earth’s climate changed. In the Northern Hemi-sphere, large sections of land were covered with advancing ice sheets duringglaciations, which receded during interglacial periods. The climate changedfrequently, perhaps as many as 17 times, in this period. Even during timestypically characterized as “ice ages,” the temperature and southern advance-ment of ice varied considerably. In any case, the Neandertals lived duringtimes when the climate was cooler in their habitat. They did not live right onthe ice, but the reduction in average temperature surely had an effect on theirenvironments, especially in Western Europe. The ability of the Neandertalsto survive in these conditions is proof of their cultural adaptations, whichincluded hunting, shelter, and use of fire.
Physical Characteristics Neandertals had the typical archaic features ofsloping forehead, low skull, lack of chin, and large brow ridges. They also
384 PART IV ■ Human Evolution
FIGURE 13.26
Frontal and side views of LaFerrassie skull, a Neandertalfrom France. (Courtesy MilfordWolpoff, University of Michigan,Ann Arbor)

Relethford: The Human Species: An Introduction to Biological Anthropology, 5/e
IV. Human Evolution 13. The Evolution of the Genus Homo
© The McGraw−Hill Companies, 2003
possessed several unique characteristics that tend not to be found in otherregions (or to be found at a much lower frequency). The Neandertals hadvery large brains, averaging close to 1,500 cc. Although this was larger in over-all size than those of living humans, the Neandertals also had larger bodymass. Relative to body size, Neandertal cranial capacity is slightly lower thanliving humans (Ruff et al. 1997). According to Holloway (1985), the struc-tural organization of Neandertal brains, as assessed from endocasts, is nodifferent from that of modern humans.
Neandertals differ from other archaic human populations in several fea-tures. Figures 13.26 and 13.27 show two skulls of Western European Ne-andertals, both from sites in France between 75,000 and 50,000 years ago.Neandertal faces are generally long and protrude more than in other ar-chaic populations. The nasal region is large, suggesting large noses, and thesinus cavities to the side of the nose expand outward. The large nasal andmidfacial areas on Neandertal skulls have often been interpreted as sometype of adaptation to a cold climate. However, Rak (1986) interprets the large faces of Neandertals in terms of the biomechanics of the skull. He sug-gests that the Neandertal face acted to withstand stresses brought about bythe use of relatively large front teeth. The front teeth of Neandertals are largein relation to their back teeth and often show considerable wear, suggest-ing that they were used as tools. Spencer and Demes (1993) also suggest thatNeandertal morphology was to a large extent shaped by the use of the front teeth. Many Neandertal specimens have a large crest of bone runningfrom behind the ear toward the back of the skull. The back of the skull israther puffed out (a feature called an occipital bun). Though this feature is most common in Neandertals, it is also found in other archaic and mod-ern human populations. Cranial differences between Neandertals and hu-mans that are more modern appear to be present early in life, a finding that
CHAPTER 13 ■ The Evolution of the Genus Homo 385
FIGURE 13.27
Two side views of La Chapelleskull, a Neandertal fromFrance. (Courtesy Milford Wolpoff,University of Michigan, Ann Arbor)
occipital bun Theprotruding rear region of the skull, a featurecommonly found inNeandertals.
I I I I I I I

Relethford: The Human Species: An Introduction to Biological Anthropology, 5/e
IV. Human Evolution 13. The Evolution of the Genus Homo
© The McGraw−Hill Companies, 2003
suggests to some that they were a separate species (Ponce de León and Zol-likofer 2001).
There is also variation within Neandertals. Figures 13.28 and 13.29 showthe skulls of two Middle Eastern Neandertals. Though they possess the gen-eral characteristics of Neandertals, they are not as morphologically extreme.The skulls are a bit more well rounded than most Western European Nean-dertal skulls.
Neandertal postcranial remains show essentially modern bipedalism butalso a few differences compared with other archaic populations. Neandertalswere relatively short and stocky. The limb bone segments farthest from thebody (lower arm and lower leg) are relatively short, most likely reflecting coldadaptation (Trinkaus 1981). The limb and shoulder bones are more ruggedthan those of modern humans. The areas of muscle attachment show thatthe Neandertals were very strong. It has been suggested that Neandertal handswere not as capable of fine manipulation as modern human hands nor hadat least different patterns of manipulation (Stoner and Trinkaus 1981).
386
FIGURE 13.28
Frontal and side views ofNeandertal skull from Tabun,Israel. (Courtesy Milford Wolpoff,University of Michigan, Ann Arbor)

Relethford: The Human Species: An Introduction to Biological Anthropology, 5/e
IV. Human Evolution 13. The Evolution of the Genus Homo
© The McGraw−Hill Companies, 2003
The pelvic bones are also rather robust compared with those of modernhumans, with the exception of the upper portion of the pubis (at the frontof the pelvis), which is actually thinner and longer than in modern humans.The uniqueness of the Neandertal pelvis seems to reflect a biomechanical func-tion (Rak and Arensburg 1987).
Neandertal DNA In the summer of 1997, an article in the journal Cell an-nounced to the world an amazing technological breakthrough—the extrac-tion of a DNA sequence from a Neandertal fossil at the Feldhofer site in Ger-many (Krings et al. 1997). This marked the first time human DNA had beensuccessfully extracted from such an old specimen (the date is not precise butis usually estimated to lie between 70,000 and 35,000 years ago). The extractedsequence consisted of 378 mitochondrial DNA bases. Mitochondrial DNA(discussed in Chapter 5) preserves better than nuclear DNA and is increas-ingly used in studies of ancient DNA. Since that time, mitochondrial DNAhas been extracted from two additional Neandertal specimens, one from Mez-maiskaya Cave in the northern Caucasus dating to 29,000 years ago (Ovchin-nikov et al. 2000) and one from Vindija Cave in Croatia dating to 42,000 yearsago (Krings et al. 2000).
These DNA sequences are quite different from those of living humans.For example, in the first analysis comparing 378 DNA positions, there were27 differences between Neandertal mitochondrial DNA and living humanDNA, compared to an average of 8 differences between pairs of living hu-mans. The other two Neandertal specimens also show this high genetic dif-ference relative to living humans. Overall, the Neandertal DNA analyses havebeen taken by many as evidence that the Neandertals were not among ourancestors and were likely a separate species that became extinct in Europe28,000 years ago.
CHAPTER 13 ■ The Evolution of the Genus Homo 387
FIGURE 13.29
Shanidar I skull, Iraq. (FromClark Spencer Larsen, Robert M.Matter, and Daniel L. Gebo,Human Origins: The FossilRecord, 3d ed., p. 136. © 1998,1991, 1985 by Waveland Press, Inc.,Prospect Heights, Ill. Reprinted withpermission from the publisher)

Relethford: The Human Species: An Introduction to Biological Anthropology, 5/e
IV. Human Evolution 13. The Evolution of the Genus Homo
© The McGraw−Hill Companies, 2003
The situation is perhaps not that simple. Three observations have beenmade based on Neandertal DNA to argue for a separate species, and each ofthese has alternative explanations that do not require Neandertals to be aseparate species (Relethford 2001c). First, their mitochondrial DNA is differ-ent from that of living humans. The question is how different? Is it differentbecause they were a separate species, or because they lived many thousandsof years ago? There has likely been genetic change in mitochondrial DNA dur-ing that time, and we need to consider the possibility of genetic change withina species over time. Comparative DNA analysis of living primates offers someclues. The difference between Neandertals and living humans is actually lessthan that found in two out of three comparisons of chimpanzee subspecies(Krings et al. 1999). This suggests that Neandertals might be a different sub-species but still be among our ancestors (Relethford 2001c).
A second observation is that we do not find any mitochondrial DNA asdivergent as Neandertal DNA among living humans. One possible reasonthey left no mitochondrial DNA is that they were a separate species that be-came extinct. Another possibility is that their mitochondrial DNA was lostdue to genetic drift (much in the same way that a person’s surname might belost among their descendants, even though they contribute other genetictraits). This possibility has received support by the extraction of another mito-chondrial DNA sequence, this time from a modern human fossil 60,000 yearsold from Australia. This specimen is acknowledged as being anatomicallyhuman and characteristic of some of our known ancestors, but it has a DNAsequence quite different from that of living humans in Australia or elsewhere(Adcock et al. 2001), suggesting that its DNA sequence was lost because ofgenetic drift. If a mitochondrial DNA sequence present in a known modernhuman has become extinct over tens of thousands of years, then the samething might have happened to the Neandertal DNA sequences. Although thisdoes not show that the Neandertals are among our ancestors, it raises doubtthat the observed Neandertal DNA sequences prove they were a separate spe-cies (Relethford 2001b).
The third observation offered to support a view that Neandertals were aseparate species is absence of any particular affinity of Neandertal DNA withliving Europeans. If the European Neandertals were partially ancestral to liv-ing Europeans, some have suggested that the Neandertal DNA should be moresimilar to DNA from living Europeans than to living Africans or living Asians.In fact, Neandertal DNA is roughly equidistant to DNA from living humansacross the world, which is the pattern expected if the Neandertals were an ex-tinct species. However, this pattern is also predicted under models of gene flowwhere Neandertals are part of our ancestry (Relethford 2001c). Given suffi-cient time, all living human DNA would be equidistant from Neandertal DNAdue to gene flow. In sum, although the Neandertal DNA is consistent with amodel where Neandertals were a separate species, it is also consistent with a model where they were part of a widespread single species and form part ofour ancestry. The question of the “fate” of the Neandertals will be revisitedin the next chapter.
388 PART IV ■ Human Evolution

Relethford: The Human Species: An Introduction to Biological Anthropology, 5/e
IV. Human Evolution 13. The Evolution of the Genus Homo
© The McGraw−Hill Companies, 2003
Cultural Behavior The stone tool technology of the Neandertals is knownas the Mousterian tradition. It is not exclusively Neandertal, however, andis often found with other archaic populations. The Mousterian culture con-tinued using the prepared-core method, producing a wide variety of differenttypes of tools, including a preponderance of scrapers (Figure 13.30). There isalso evidence that Neandertals thinned many of the tools so that they couldbe attached to handles or spears (Schick and Toth 1993).
Archaeological evidence suggests that Neandertals may have been capa-ble of symbolic thought, perhaps even holding beliefs in the supernatural.Neandertals were the first hominids to bury their dead deliberately. Evidenceof burial comes from a number of European and Middle Eastern sites, wheredead persons’ bones have been arranged carefully in graves, often in associa-tion with tools, food, and flowers.
The intentional burial of the dead has suggested a ritualistic purpose tosome researchers. At a site in Belgium, fires had been lit above two buried bod-ies. One interpretation of this is that they believed the fires would counteractthe “coldness” of death. At the Shanidar Cave site in Iraq, flowers had beenplaced all over the bodies, an event that was reconstructed based on the pres-ence of fossil pollen in the graves.
Such evidence suggests the evolution of symbolic expressions and the pos-sibility of supernatural beliefs. This standard interpretation, however, is chang-ing. The flexed positions of many of the dead might not reflect intentionalposing but rather be a consequence of digging the smallest possible graves.In addition, although the Shanidar burial is still considered one of the bestexamples of symbolic behavior, it is possible the pollen was introduced by ro-dents burrowing into the grave after burial.
The physical condition of fossil remains offers another window on the be-havior of Neandertals. By looking at bone fractures, condition of teeth, andother features, we can get a good idea of the age and health status of earlyhumans. Many Neandertal remains are of elderly individuals with numerousmedical problems. Some of the elderly had lost all of their teeth, many hadarthritis, and one had lost part of his arm. By looking for signs of healing or
CHAPTER 13 ■ The Evolution of the Genus Homo 389
FIGURE 13.30
Examples of Mousterian tools: (a) scraper, (b) point, (c) scraper, (d) point, (e) handaxe. (From The Old Stone Ageby F. Bordes, 1968. Reprinted withpermission of the publisher,Weidenfeld and Nicolson, Ltd.)
a. e.d.c.b.
Mousterian traditionThe prepared-core stonetool technology of theNeandertals.
I I I I I I I

Relethford: The Human Species: An Introduction to Biological Anthropology, 5/e
IV. Human Evolution 13. The Evolution of the Genus Homo
© The McGraw−Hill Companies, 2003
infection, we can tell that many of these elderly individuals did not die fromthese afflictions. How, then, did they survive, particularly if they had lost allof their teeth? Survival of many of the elderly and impaired Neandertals sug-gests that others cared for them. This implies not only compassion as a social value but also the existence of a social system that allowed for the shar-ing of food and resources.
This perspective may be based more on our interpretive biases, however,than on reality. Dettwyler (1991) questions the traditional view of the elderlyand disabled as nonproductive members of a group who must be cared for.Drawing on cross-cultural studies, she notes that physically disabled individ-uals in many societies still frequently make important contributions.
Language Capability Did the Neandertals have language? Lieberman andCrelin (1971), who reconstructed the vocal anatomy of Neandertals, con-cluded they were incapable of vocalizing certain vowel sounds. The implica-tion was that Neandertals did not possess as wide a range of sounds as mod-ern humans and perhaps had limited language abilities. This hypothesis wascriticized, however, because of differences of opinion on vocal anatomy re-construction. The lack of direct fossil evidence at the heart of the debate wasultimately furnished with the discovery of the first Neandertal hyoid bone, abone lying in the neck that can be used to provide information on the struc-ture of the respiratory tract. That this specimen is almost identical in sizeand shape to the hyoid bone of modern humans indicates that there were nodifferences in vocal ability between archaics and moderns (Arensberg et al.1990). Indeed, no evidence exists from brain anatomy to show that Neander-tals lacked speech centers (Holloway 1985).
SUMMARY
The earliest evidence for the genus Homo dates back 2.5 million years ago.These early fossils are too fragmentary to place into any specific species. By 2 million years ago, there is evidence of at least three species of Homo: Homohabilis, Homo rudolfensis, and Homo erectus, the latter of which is ancestral tolater hominids. Homo erectus appears in Africa 2 million years ago and is thefirst hominid to leave Africa, with some populations appearing in Asia 1.8 mil-lion to 1.6 million years ago and in Europe 1.7 million years ago. H. erectusshows signs of cranial expansion (the average brain size was roughly three-fourths that of modern humans) and human body proportions. The culturaladaptations of H. erectus include development of more sophisticated stonetools (including hand axes), hunting and gathering, and use of fire.
Fossils with close to modern brain size begin to appear in the fossilrecord roughly 400,000 years ago, although their skulls were somewhat dif-ferently shaped than modern humans’. The stone tool technology of archaichumans included tools made by the prepared-core method, a technique thatallows greater sophistication and diversity in tools. Later archaic humans,the Neandertals, are found in Europe and the Middle East between 150,000
390 PART IV ■ Human Evolution

Relethford: The Human Species: An Introduction to Biological Anthropology, 5/e
IV. Human Evolution 13. The Evolution of the Genus Homo
© The McGraw−Hill Companies, 2003
and 28,000 years ago. The Neandertals are somewhat physically differentfrom other archaics, and there is continued debate over whether they representa separate species. The culture of Neandertals includes burial of the dead.
There is considerable controversy over the relationship of all archaic hu-mans to earlier and later hominid populations. Some argue that the evolu-tion from H. erectus to archaic human to modern human took place within asingle, evolving species over time. Others argue that “archaic humans” actu-ally represent several different species, only one of which is ancestral to livinghumans.
SUPPLEMENTAL READINGS
Stringer, C., and C. Gamble. 1993. In Search of the Neanderthals: Solving the Puzzle of HumanOrigins. New York: Thames and Hudson. An excellent review of Neandertal (and otherarchaics) biology and culture, as well as the history of debates over modern humanorigins.
Trinkaus, E., and P. Shipman. 1992. The Neandertals: Changing the Image of Mankind. New York:Knopf. An excellent review of the history of Neandertal discoveries and interpretations.
Walker, A., and P. Shipman. 1996. The Wisdom of the Bones: In Search of Human Origins. NewYork: Alfred A. Knopf. A very readable summary of human evolution focusing on Homoerectus.
INTERNET RESOURCES
In addition to the Web sites listed in Chapter 12, the following are of particu-lar relevance to the current chapter:
http://anthro.palomar.edu/homo/homo_1.htmEarly Transitional Humans, a tutorial focusing on Homo habilis and Homorudolfensis.
http://anthro.palomar.edu/homo/homo_2%20.htmHomo erectus, a tutorial.
http://anthro.palomar.edu/homo/homo_3.htmEarly Human Culture, a tutorial focusing on Oldowan and Acheulian stonetool technology.
http://anthro.palomar.edu/homo2/archaic.htmEarly Archaic Homo sapiens and their Contemporaries, a tutorial on early ar-chaic humans.
http://anthro.palomar.edu/homo2/neandertal.htmNeandertals, a tutorial.
http://thunder.indstate.edu/~ramanank/index.htmlNeandertals: A Cyber Perspective, another Web page devoted to Neandertals.
CHAPTER 13 ■ The Evolution of the Genus Homo 391
Relethford: The Human Species: An Introduction to Biological Anthropology, 5/e
IV. Human Evolution 14. The Origin of Modern Humans
© The McGraw−Hill Companies, 2003
C H A P T E R 14The Origin of Modern Humans
393
Beginning roughly 130,000 years ago, populations of archaic humansstarted evolving into what we refer to as anatomically modern Homo
sapiens. This is the name by which we refer to ourselves today, as well as thename by which we classify our early ancestors, who possessed certain physi-cal characteristics unlike those of archaic humans: a more well-rounded skulland a noticeable chin. The evolution of archaic to modern humans is a sub-ject of considerable debate today among anthropologists.
At the heart of this debate is a series of basic questions. What is the na-ture of this change? When and where did it occur? Did the change occur inonly one place, or was it widespread? Why did it occur? What cultural changestook place, and how are they related to the biological changes? In short, ourquestions concern the recent (130,000+ years) history of the human species.
ANATOMICALLY MODERN HOMO SAPIENS
Human evolution did not end with archaic humans. All fossil humans since28,000 years ago are anatomically modern in form. Though it is clear that ar-chaic humans evolved into anatomically modern humans, the exact natureof this evolution is less certain. This section deals with the biological andcultural characteristics of anatomically modern humans, followed by consid-eration of the nature of their evolution.
A prehistoric cave painting of two bison from the Altamira Caves in Spain.Cave art is one of several behaviors that either originated with or became muchmore common with the advent of modern humans. (© Scala/Art Resource, NY)
▲
anatomically modernHomo sapiens The modernform of the human species,which dates back 130,000years or more.
I I I I I I I

Relethford: The Human Species: An Introduction to Biological Anthropology, 5/e
IV. Human Evolution 14. The Origin of Modern Humans
© The McGraw−Hill Companies, 2003
Distribution in Time and SpaceAnatomically modern H. sapiens are found in many sites across both the OldWorld and the New World (Figure 14.1). Although only modern H. sapienshave been found dating within the past 28,000 years, we now have growingevidence that this form is actually much older than once thought. Cranialremains from the Border Cave site in southeast Africa are fragmentary butshow typical anatomically modern features (Figure 14.2). The dating for thissite is not definite but could range between 115,000 and 90,000 years ago.Modern humans may have occupied the Klasies River Mouth, South Africa,at least as early as 90,000 years ago (Grün et al. 1990). Other African sites alsoprovide evidence of an early appearance of anatomically modern H. sapiens:Omo, Ethiopia (roughly 130,000 years ago), and Laetoli (perhaps 120,000 yearsago). There is also evidence of an early occurrence of anatomically modernH. sapiens in the Middle East, with both the Qafzeh and Skhul sites in Israeldating to 92,000 years ago (Grün et al. 1991). Although some argument aboutthese dates continues, it is certain that modern H. sapiens existed before theyoungest known archaic forms.
Physical CharacteristicsFigure 14.3 shows a skull from one of the more famous anatomically modernsites—Cro-Magnon, France, dating between 27,000 and 23,000 years ago. Thisskull shows many of the characteristics of anatomically modern H. sapiens. It
FIGURE 14.1
Location of some anatomicallymodern H. sapiens sites.
Jebel Irhoud
CioclinovaStarosel’e
SkhulQafzeh
Darra-i-kur
Swan RiverKlasies River Mouth
Border Cave
MumbaKenjeraOmo
Singa
FlorisbadCerroSota
Lagoa Santa
Kansas RiverArlington
Springs
Tepexpan
Devil’s LairLake Mungo
Kow Swamp
Mal’ta
Cro-Magnon,Abri Pataud
StettenHahnöfersand
MladecPodbabaPredmost˘
ˇ
VindijaCasper
Olsen-Chubbuck Meadowcroft
OldCrow
Zhoukoudian
A F R I C A
AUSTRALIA
S O U T HA M E R I C A
N O R T HA M E R I C A
A S I AE U R O P E
P a c i f i c
O c e a n
A t l a n t i c
O c e a nP a c i f i c
O c e a n
I n d i a nO c e a n
A r c t i c O c e a n
394
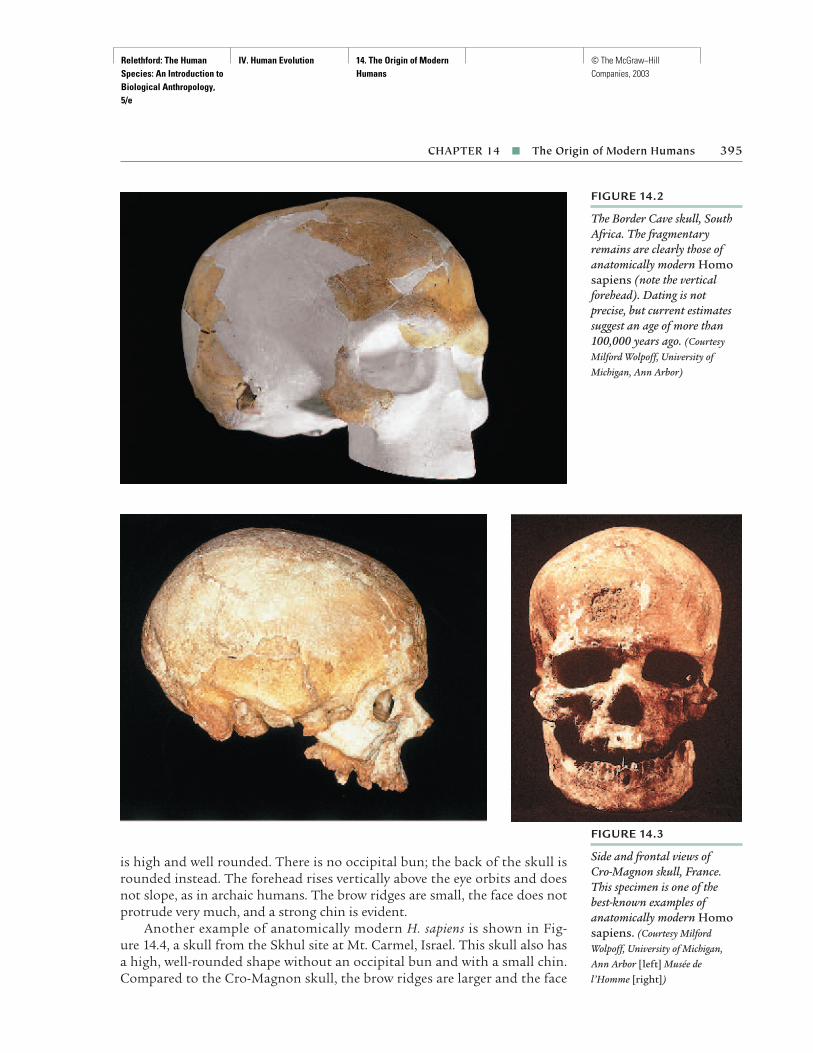
Relethford: The Human Species: An Introduction to Biological Anthropology, 5/e
IV. Human Evolution 14. The Origin of Modern Humans
© The McGraw−Hill Companies, 2003
is high and well rounded. There is no occipital bun; the back of the skull isrounded instead. The forehead rises vertically above the eye orbits and doesnot slope, as in archaic humans. The brow ridges are small, the face does notprotrude very much, and a strong chin is evident.
Another example of anatomically modern H. sapiens is shown in Fig-ure 14.4, a skull from the Skhul site at Mt. Carmel, Israel. This skull also hasa high, well-rounded shape without an occipital bun and with a small chin.Compared to the Cro-Magnon skull, the brow ridges are larger and the face
CHAPTER 14 ■ The Origin of Modern Humans 395
FIGURE 14.2
The Border Cave skull, SouthAfrica. The fragmentaryremains are clearly those ofanatomically modern Homosapiens (note the verticalforehead). Dating is notprecise, but current estimatessuggest an age of more than100,000 years ago. (Courtesy Milford Wolpoff, University ofMichigan, Ann Arbor)
FIGURE 14.3
Side and frontal views of Cro-Magnon skull, France.This specimen is one of the best-known examples ofanatomically modern Homosapiens. (Courtesy MilfordWolpoff, University of Michigan,Ann Arbor [left] Musée del’Homme [right])

Relethford: The Human Species: An Introduction to Biological Anthropology, 5/e
IV. Human Evolution 14. The Origin of Modern Humans
© The McGraw−Hill Companies, 2003
protrudes slightly. The differences between the Skhul and Cro-Magnon skullsare typical of variation within a species, particularly when we consider thatthey existed at different times in separate places. Other specimens also showsimilarities and differences when compared to one another. The skull in Fig-ure 14.5 (Combe Capelle, France, 35,000 to 30,000 years ago) is high and wellrounded, but the face protrudes slightly, and the chin is rather weak. The re-cent skull from Five Knolls, England (3,500 to 1,500 years ago), is high and wellrounded, has small brow ridges and face, and a small chin (Figure 14.6). Thereis clearly variation within both archaic and anatomically modern forms of H. sapiens. This variation makes evolutionary relationships difficult to assess.
Cultural BehaviorDiscussing the cultural adaptations of anatomically modern H. sapiens is dif-ficult because they include prehistoric technologies as well as more recent de-velopments, such as agriculture, generation of electricity, the internal com-bustion engine, and nuclear energy. So that we may provide a comparisonwith the culture of the archaic forms, this section is limited to prehistory be-fore the development of agriculture (roughly 12,000 years ago).
Tool Technologies There is so much variation in the stone tool technolo-gies of anatomically modern H. sapiens that it is impossible to define a singletradition. For the sake of discussion, the types of stone tool industries areoften lumped together under the term Upper Paleolithic (which means“Upper Old Stone Age”). Lower Paleolithic consists of the stone tool tradi-
396 PART IV ■ Human Evolution
FIGURE 14.4
An early anatomically modernHomo sapiens skull fromSkhul, Israel. (© David L. Brill)
Upper Paleolithic TheUpper Old Stone Age, a general term used tocollectively refer to the stone tool technologies ofanatomically modern Homosapiens.
Lower Paleolithic TheLower Old Stone Age, a general term used tocollectively refer to the stonetool technologies of Homohabilis/Homo rudolfensis andHomo erectus.
I I I I I I I

Relethford: The Human Species: An Introduction to Biological Anthropology, 5/e
IV. Human Evolution 14. The Origin of Modern Humans
© The McGraw−Hill Companies, 2003
tions of H. habilis/H. rudolfensis and H. erectus, and Middle Paleolithic in-cludes the stone tool traditions of archaic humans. Even though we use asingle label to describe common features of Upper Paleolithic tool industries,do not be misled into thinking that all traditions were the same. Variation,both within and among sites, is even greater in the Upper Paleolithic than inearlier cultures. This variation demonstrates the increasing sophisticationand specialization of stone tools.
CHAPTER 14 ■ The Origin of Modern Humans 397
FIGURE 14.5
The Combe Capelle skull,anatomically modern Homosapiens, France. (From ClarkSpencer Larsen, Robert M. Matter,and Daniel L. Gebo, HumanOrigins: The Fossil Record, 3ded., p. 169. © 1998, 1991, 1985 byWaveland Press, Inc., ProspectHeights, Ill. Reprinted withpermission from the publisher)
FIGURE 14.6
Skull of anatomically modernHomo sapiens, specimen 18,from the Five Knolls site,England, 3,500–1,500 yearsago. (From Clark Spencer Larsen,Robert M. Matter, and Daniel L.Gebo, Human Origins: The FossilRecord, 3d ed., p. 174. © 1998,1991, 1985 by Waveland Press, Inc.,Prospect Heights, Ill. Reprinted withpermission from the publisher)
Middle Paleolithic TheMiddle Old Stone Age, a general term used tocollectively refer to the stone tool technologies of archaic humans.
I I I I I I I
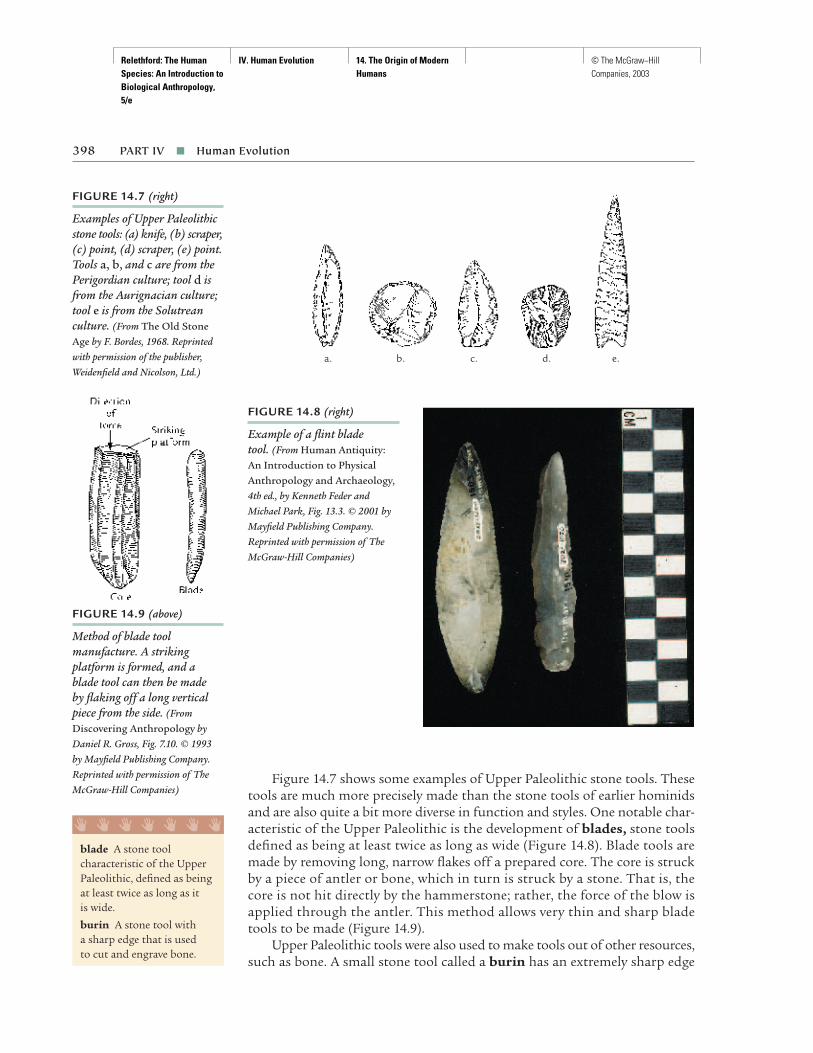
Relethford: The Human Species: An Introduction to Biological Anthropology, 5/e
IV. Human Evolution 14. The Origin of Modern Humans
© The McGraw−Hill Companies, 2003
Figure 14.7 shows some examples of Upper Paleolithic stone tools. Thesetools are much more precisely made than the stone tools of earlier hominidsand are also quite a bit more diverse in function and styles. One notable char-acteristic of the Upper Paleolithic is the development of blades, stone toolsdefined as being at least twice as long as wide (Figure 14.8). Blade tools aremade by removing long, narrow flakes off a prepared core. The core is struckby a piece of antler or bone, which in turn is struck by a stone. That is, thecore is not hit directly by the hammerstone; rather, the force of the blow isapplied through the antler. This method allows very thin and sharp bladetools to be made (Figure 14.9).
Upper Paleolithic tools were also used to make tools out of other resources,such as bone. A small stone tool called a burin has an extremely sharp edge
398 PART IV ■ Human Evolution
FIGURE 14.9 (above)
Method of blade toolmanufacture. A strikingplatform is formed, and a blade tool can then be made by flaking off a long verticalpiece from the side. (FromDiscovering Anthropology byDaniel R. Gross, Fig. 7.10. © 1993 by Mayfield Publishing Company.Reprinted with permission of TheMcGraw-Hill Companies)
blade A stone toolcharacteristic of the UpperPaleolithic, defined as beingat least twice as long as it is wide.
burin A stone tool with a sharp edge that is used to cut and engrave bone.
I I I I I I I
FIGURE 14.7 (right)
Examples of Upper Paleolithicstone tools: (a) knife, (b) scraper,(c) point, (d) scraper, (e) point.Tools a, b, and c are from thePerigordian culture; tool d isfrom the Aurignacian culture;tool e is from the Solutreanculture. (From The Old StoneAge by F. Bordes, 1968. Reprintedwith permission of the publisher,Weidenfield and Nicolson, Ltd.)
a. e.d.c.b.
FIGURE 14.8 (right)
Example of a flint blade tool. (From Human Antiquity:An Introduction to PhysicalAnthropology and Archaeology,4th ed., by Kenneth Feder andMichael Park, Fig. 13.3. © 2001 byMayfield Publishing Company.Reprinted with permission of TheMcGraw-Hill Companies)

Relethford: The Human Species: An Introduction to Biological Anthropology, 5/e
IV. Human Evolution 14. The Origin of Modern Humans
© The McGraw−Hill Companies, 2003
that is used to cut, whittle, and engrave bone. Bone was used to make needles,awls, points, knives, and harpoons, as well as art objects. Bone tools and elab-orate art objects first appear with modern H. sapiens; they are not found inthe culture of earlier hominids (although there are suggestions of art objectsassociated with archaic humans, these finds are controversial). For years, itappeared that bone tools were fairly recent, dating back roughly 40,000 years.Research in Zaire, however, has produced a much earlier age of 90,000 years(Brooks et al. 1995; Yellen et al. 1995).
Shelter As with archaic H. sapiens, modern H. sapiens lived in caves and rockshelters where available. The archaeological evidence also shows definite evi-dence of manufactured shelter—huts made of wood, animal bone, and ani-mal hides. Although much of this material decomposes, we can still find evi-dence of support structures. One example of hut building comes from the18,000-year-old site of Mal’ta in south-central Russia (Figure 14.10). This hutis particularly interesting because people used mammoth ribs and leg bonesfor structural support. Other sites, such as the 15,000-year-old site of Mez-hirich in the Ukraine, contain evidence of shelters built almost entirely frommammoth bones.
Art Another form of symbolic behavior appears with modern H. sapiens—cave art. Cave art dates back more than 30,000 years (although most is notthis old) and has been found in Europe, Africa, and Australia. Some of thebest-known cave art, primarily paintings of large game animals and hunt-ing, comes from sites in Europe (Figures 14.11 and 14.12). These paintingsare anatomically correct and are well executed. Painting is a human activitythat is spiritually rewarding but has no apparent function in day-to-day exis-tence. Why, then, did early humans paint images on the walls of caves? Sev-eral interpretations have been offered, including sympathetic magic (captur-ing the image of an animal may have been felt to improve hunters’ chancesof actually killing it). Other interpretations focus on cultural symbolism
CHAPTER 14 ■ The Origin of Modern Humans 399
FIGURE 14.10
Reconstruction of a hut at the Mal’ta site in Russia. Thissite dates to 18,000 years ago.(From Human Antiquity: AnIntroduction to PhysicalAnthropology and Archaeology,4th ed., by Kenneth Feder andMichael Park, Fig. 13.5. © 2001 byMayfield Publishing Company.Reprinted with permission from TheMcGraw-Hill Companies)
ExteriorCross section /interior
Animal hides
Entrance
Interlaced reindeer antlers
Wood framing
Large animal bonesand boulders holdinghides in place
Large animal bonesfor roof support
Semi-subterraneanfloor
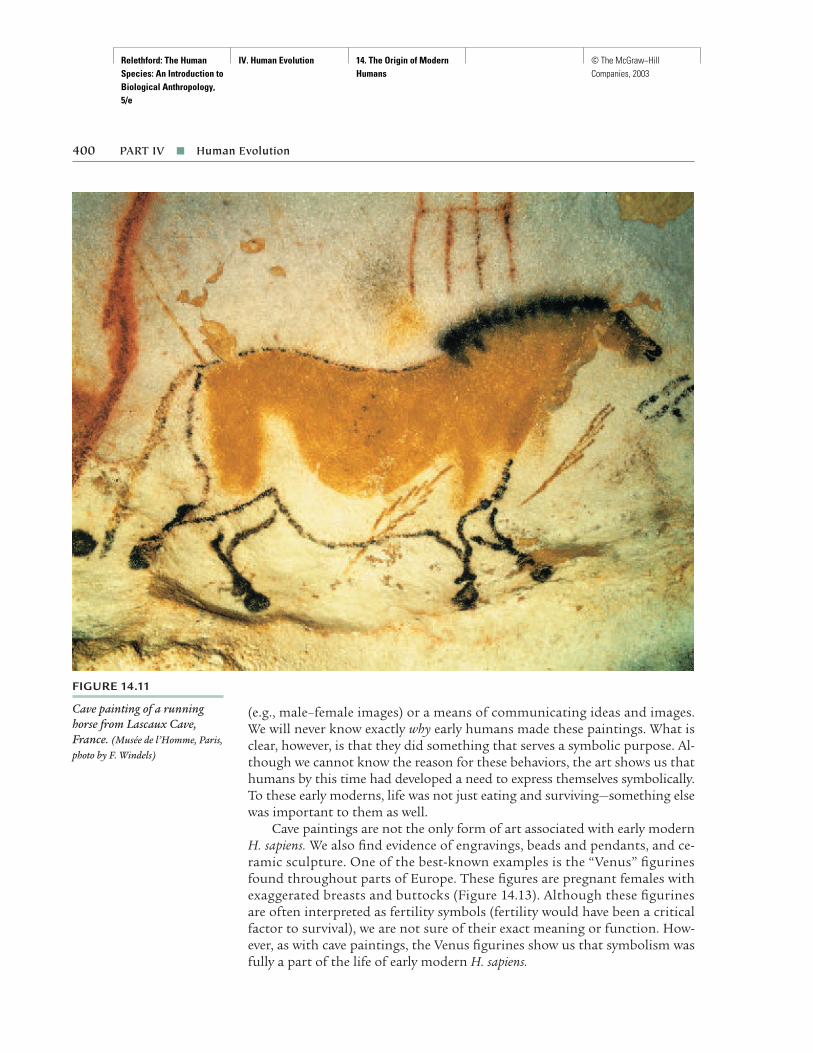
Relethford: The Human Species: An Introduction to Biological Anthropology, 5/e
IV. Human Evolution 14. The Origin of Modern Humans
© The McGraw−Hill Companies, 2003
(e.g., male–female images) or a means of communicating ideas and images.We will never know exactly why early humans made these paintings. What isclear, however, is that they did something that serves a symbolic purpose. Al-though we cannot know the reason for these behaviors, the art shows us thathumans by this time had developed a need to express themselves symbolically.To these early moderns, life was not just eating and surviving—something elsewas important to them as well.
Cave paintings are not the only form of art associated with early modernH. sapiens. We also find evidence of engravings, beads and pendants, and ce-ramic sculpture. One of the best-known examples is the “Venus” figurinesfound throughout parts of Europe. These figures are pregnant females withexaggerated breasts and buttocks (Figure 14.13). Although these figurinesare often interpreted as fertility symbols (fertility would have been a criticalfactor to survival), we are not sure of their exact meaning or function. How-ever, as with cave paintings, the Venus figurines show us that symbolism wasfully a part of the life of early modern H. sapiens.
400 PART IV ■ Human Evolution
FIGURE 14.11
Cave painting of a runninghorse from Lascaux Cave,France. (Musée de l’Homme, Paris,photo by F. Windels)

Relethford: The Human Species: An Introduction to Biological Anthropology, 5/e
IV. Human Evolution 14. The Origin of Modern Humans
© The McGraw−Hill Companies, 2003
Geographic Expansion The archaeological evidence shows that humansbecome more and more successful in adapting to their environments, andconsequently populations grew and expanded.
By 60,000 years ago, populations of anatomically modern H. sapiens hadreached Australia. During times of glaciation, the sea levels drop, extendingthe land mass of the continents. The drop in sea level had allowed earlierpopulations of hominids to reach Southeast Asia, but Australia was not thenconnected to the Asian continent. For humans to reach Australia, they hadto cross many kilometers of sea. The only way they could do this was by somesort of raft or boat.
Anatomically modern H. sapiens also moved into the New World. Thenumber of such movements and their dates are a continuing source of con-troversy. All agree, however, that humans were living in the New World by15,000 years ago. Some argue that these dates are the earliest, whereas otherscite newer evidence and reanalysis of previous finds indicating a much earlierinitial occupation—perhaps 30,000 to 20,000 years ago.
CHAPTER 14 ■ The Origin of Modern Humans 401
FIGURE 14.12
Cave painting of a cow fromLascaux cave, France. (© 2002Artists Rights Society (ARS), NewYork/DACS, London)
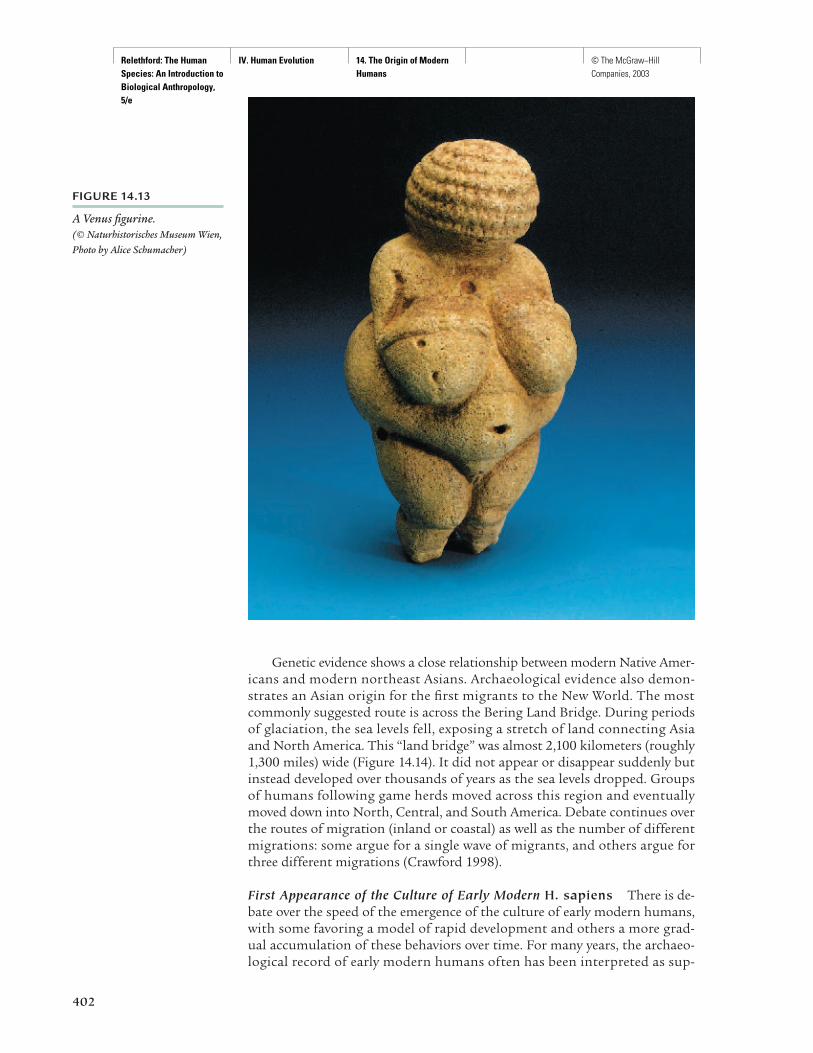
Relethford: The Human Species: An Introduction to Biological Anthropology, 5/e
IV. Human Evolution 14. The Origin of Modern Humans
© The McGraw−Hill Companies, 2003
Genetic evidence shows a close relationship between modern Native Amer-icans and modern northeast Asians. Archaeological evidence also demon-strates an Asian origin for the first migrants to the New World. The mostcommonly suggested route is across the Bering Land Bridge. During periodsof glaciation, the sea levels fell, exposing a stretch of land connecting Asiaand North America. This “land bridge” was almost 2,100 kilometers (roughly1,300 miles) wide (Figure 14.14). It did not appear or disappear suddenly butinstead developed over thousands of years as the sea levels dropped. Groupsof humans following game herds moved across this region and eventuallymoved down into North, Central, and South America. Debate continues overthe routes of migration (inland or coastal) as well as the number of differentmigrations: some argue for a single wave of migrants, and others argue forthree different migrations (Crawford 1998).
First Appearance of the Culture of Early Modern H. sapiens There is de-bate over the speed of the emergence of the culture of early modern humans,with some favoring a model of rapid development and others a more grad-ual accumulation of these behaviors over time. For many years, the archaeo-logical record of early modern humans often has been interpreted as sup-
FIGURE 14.13
A Venus figurine. (© Naturhistorisches Museum Wien,Photo by Alice Schumacher)
402

Relethford: The Human Species: An Introduction to Biological Anthropology, 5/e
IV. Human Evolution 14. The Origin of Modern Humans
© The McGraw−Hill Companies, 2003
porting a rapid “creative explosion” of new technologies and behaviors thatfirst appeared about 40,000 to 50,000 years ago. This interpretation wasbased in part on the first appearance of modern behaviors in the Europeanarchaeological record and did not take into account changes happening elsewhere. In recent decades, archaeological research from Africa suggeststhat many of these behaviors actually appeared tens of thousands of yearsearlier, and the emergence of modern human culture did not take place all atonce but instead cumulatively over time in Africa (McBrearty and Brooks2000).
THE ORIGIN OF ANATOMICALLYMODERN HUMANS
When, where, and how did anatomically modern H. sapiens evolve from ar-chaic humans? The general trend indicated by the fossil record is clear; somearchaic populations evolved into the more modern forms. The specific ques-tions are harder to answer. Did all populations of archaics evolve into mod-ern forms? If so, did this occur at the same time in different places? Or didonly a few archaic populations evolve into modern forms and then expandout to replace, or interbreed with, the remaining archaic forms? If so, whereand when did the transition to anatomically modern H. sapiens first take place?Finally, does our use of such terms as archaic and modern obscure variation overtime and space? We use these categories as a useful sorting device, but wemay be in danger of obscuring reality by pigeonholing all human fossil re-mains into two groups.
CHAPTER 14 ■ The Origin of Modern Humans 403
FIGURE 14.14
The Bering Land Bridge.Today the former Soviet Unionand Alaska are separated bywater. During the “Ice Ages,”water was trapped in glaciers,producing a drop in the sealevel that exposed the land area known as the BeringLand Bridge. This “bridge”connecting North America andAsia was actually 2,100 kmwide!
Russia
Alaska
Bering Land Bridge
Arctic Circle

Relethford: The Human Species: An Introduction to Biological Anthropology, 5/e
IV. Human Evolution 14. The Origin of Modern Humans
© The McGraw−Hill Companies, 2003
Early ModelsMany models have been proposed to answer these questions. Past analyses havebeen complicated by the fact that the best-known samples of archaic humanswere the western European Neandertals, which in many ways are the mostunique of all the archaic populations. The distinctiveness of the Neandertalshad given rise to various interpretations of the origin of anatomically mod-ern H. sapiens. In the early part of this century, it was common to view Nean-dertals as a side branch of human evolution, perhaps even a different species.At that time the fossil record suggested a 5,000-year “gap” between the lastNeandertals and the first modern humans. Such a gap was felt to be too shortin duration for the evolutionary changes needed for a transition from Nean-dertals into modern humans. Another explanation was that the modern formsevolved elsewhere, then invaded and wiped out the Neandertals (see Brace[1964] for a thorough discussion of early views on Neandertal evolution).
This simple model is no longer accepted. For one thing, we now have evi-dence of overlap in dates for archaic and anatomically modern H. sapiens. Themajor problem with the invasion hypothesis is that it was strongly influ-enced by previous interpretations of the extent of differences between ar-chaic and modern forms. This early idea emphasized the differences betweenthese forms and tended to ignore their similarities.
Current Models and DebatesThere are two basic models for the evolution of modern humans—the Africanreplacement model and the multiregional evolution model (which in turnhas several variants). The debate over modern human origins is a “hot” topicin anthropology today, with new data and analyses appearing all the time.Don’t be surprised in class to learn of newer developments.
As pointed out in the previous chapter, debates over the evolution ofHomo center on differences in opinion regarding the number of species andthe mode of evolution—anagenesis or cladogenesis. Some see the fossil recordin terms of a single evolving lineage where what we call Homo erectus changesover time to become what we call archaic, and then modern, humans. Thedifference between these forms is considered arbitrary, and they all representstages along a continuum. Others advocate cladogenesis and see the fossilrecord quite differently. Instead of a single evolving species, they see numer-ous species within the genus Homo, of which only one (Homo sapiens) stillsurvives—the others became extinct. Further, proponents of cladogenesisargue that H. sapiens emerged as a separate species fairly recent in time.
The African Replacement Model According to the African replacementmodel, modern humans emerged as a new species in Africa between 150,000and 200,000 years ago. Some populations left Africa roughly 100,000 yearsago and spread throughout the Old World, replacing preexisting archaichuman populations outside of Africa (Cann et al. 1987; Stringer and Andrews1988). The model proposes that the transition from archaic to modern hu-mans took place only in one region (Africa), that the transition was a specia-
404 PART IV ■ Human Evolution
African replacementmodel The hypothesis thatmodern humans evolved as a new species in Africabetween 150,000 and200,000 years ago and thenspread throughout the OldWorld, replacing preexistingarchaic human populations.
I I I I I I I
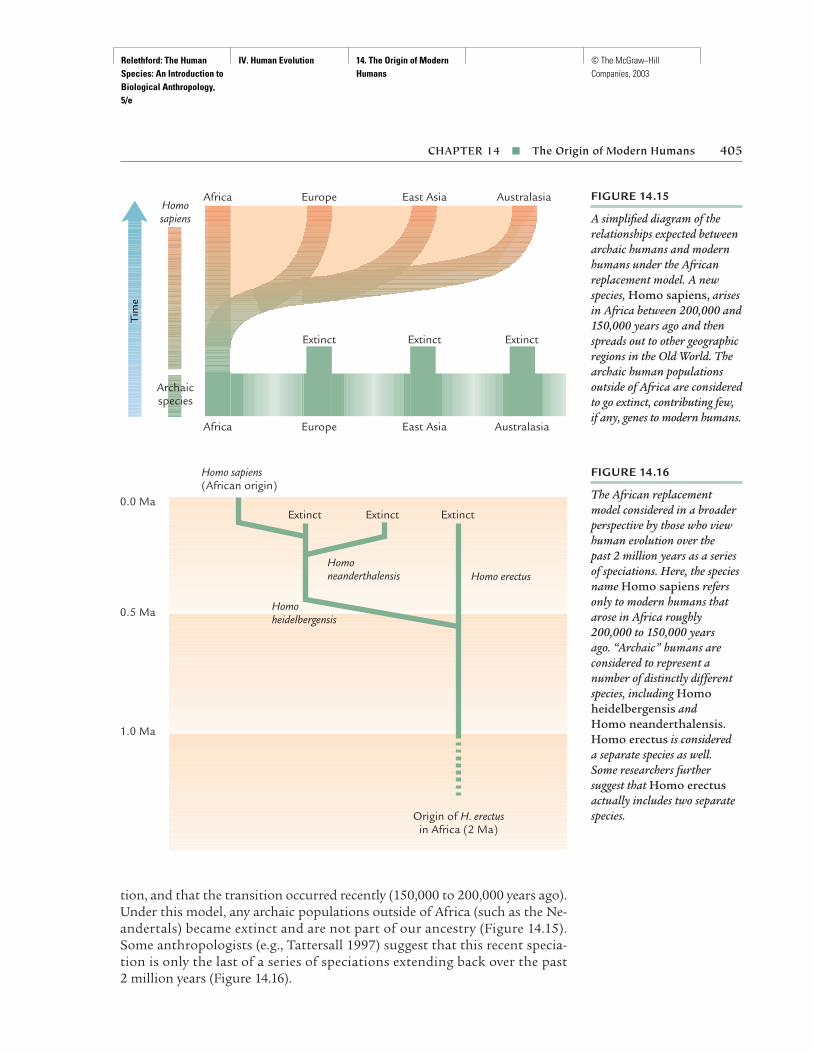
Relethford: The Human Species: An Introduction to Biological Anthropology, 5/e
IV. Human Evolution 14. The Origin of Modern Humans
© The McGraw−Hill Companies, 2003
tion, and that the transition occurred recently (150,000 to 200,000 years ago).Under this model, any archaic populations outside of Africa (such as the Ne-andertals) became extinct and are not part of our ancestry (Figure 14.15).Some anthropologists (e.g., Tattersall 1997) suggest that this recent specia-tion is only the last of a series of speciations extending back over the past 2 million years (Figure 14.16).
CHAPTER 14 ■ The Origin of Modern Humans 405
FIGURE 14.15
A simplified diagram of therelationships expected betweenarchaic humans and modernhumans under the Africanreplacement model. A newspecies, Homo sapiens, arisesin Africa between 200,000 and150,000 years ago and thenspreads out to other geographicregions in the Old World. Thearchaic human populationsoutside of Africa are consideredto go extinct, contributing few,if any, genes to modern humans.
Archaicspecies
Homosapiens
Australasia
Australasia
Extinct
East Asia
East Asia
Extinct
Europe
Europe
Extinct
Africa
Africa
Tim
e
FIGURE 14.16
The African replacementmodel considered in a broaderperspective by those who viewhuman evolution over the past 2 million years as a seriesof speciations. Here, the speciesname Homo sapiens refersonly to modern humans thatarose in Africa roughly200,000 to 150,000 years ago. “Archaic” humans areconsidered to represent anumber of distinctly differentspecies, including Homoheidelbergensis and Homo neanderthalensis.Homo erectus is considered a separate species as well. Some researchers furthersuggest that Homo erectusactually includes two separatespecies.
0.0 Ma
Homo sapiens(African origin)
Extinct Extinct Extinct
Homoheidelbergensis
Homoneanderthalensis Homo erectus
Origin of H. erectusin Africa (2 Ma)
0.5 Ma
1.0 Ma
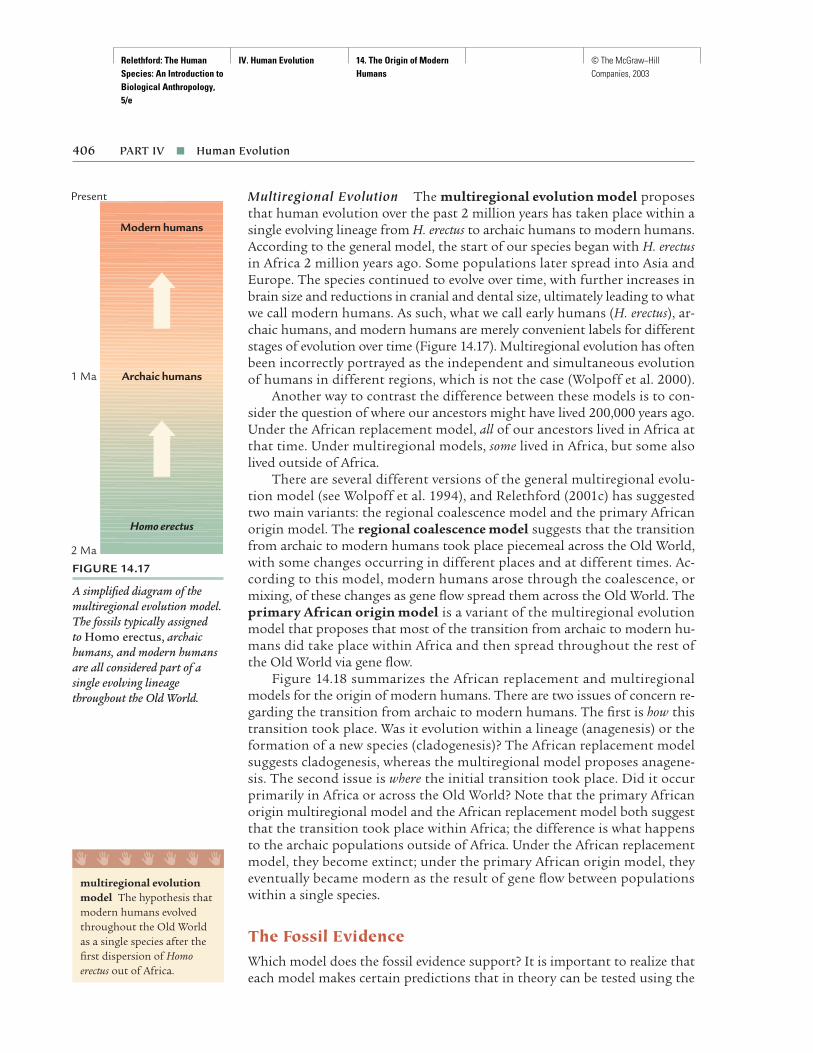
Relethford: The Human Species: An Introduction to Biological Anthropology, 5/e
IV. Human Evolution 14. The Origin of Modern Humans
© The McGraw−Hill Companies, 2003
Multiregional Evolution The multiregional evolution model proposesthat human evolution over the past 2 million years has taken place within asingle evolving lineage from H. erectus to archaic humans to modern humans.According to the general model, the start of our species began with H. erectusin Africa 2 million years ago. Some populations later spread into Asia andEurope. The species continued to evolve over time, with further increases inbrain size and reductions in cranial and dental size, ultimately leading to whatwe call modern humans. As such, what we call early humans (H. erectus), ar-chaic humans, and modern humans are merely convenient labels for differentstages of evolution over time (Figure 14.17). Multiregional evolution has oftenbeen incorrectly portrayed as the independent and simultaneous evolutionof humans in different regions, which is not the case (Wolpoff et al. 2000).
Another way to contrast the difference between these models is to con-sider the question of where our ancestors might have lived 200,000 years ago.Under the African replacement model, all of our ancestors lived in Africa atthat time. Under multiregional models, some lived in Africa, but some alsolived outside of Africa.
There are several different versions of the general multiregional evolu-tion model (see Wolpoff et al. 1994), and Relethford (2001c) has suggestedtwo main variants: the regional coalescence model and the primary Africanorigin model. The regional coalescence model suggests that the transitionfrom archaic to modern humans took place piecemeal across the Old World,with some changes occurring in different places and at different times. Ac-cording to this model, modern humans arose through the coalescence, ormixing, of these changes as gene flow spread them across the Old World. Theprimary African origin model is a variant of the multiregional evolutionmodel that proposes that most of the transition from archaic to modern hu-mans did take place within Africa and then spread throughout the rest ofthe Old World via gene flow.
Figure 14.18 summarizes the African replacement and multiregionalmodels for the origin of modern humans. There are two issues of concern re-garding the transition from archaic to modern humans. The first is how thistransition took place. Was it evolution within a lineage (anagenesis) or theformation of a new species (cladogenesis)? The African replacement modelsuggests cladogenesis, whereas the multiregional model proposes anagene-sis. The second issue is where the initial transition took place. Did it occurprimarily in Africa or across the Old World? Note that the primary Africanorigin multiregional model and the African replacement model both suggestthat the transition took place within Africa; the difference is what happensto the archaic populations outside of Africa. Under the African replacementmodel, they become extinct; under the primary African origin model, theyeventually became modern as the result of gene flow between populationswithin a single species.
The Fossil EvidenceWhich model does the fossil evidence support? It is important to realize thateach model makes certain predictions that in theory can be tested using the
406 PART IV ■ Human Evolution
FIGURE 14.17
A simplified diagram of themultiregional evolution model.The fossils typically assigned to Homo erectus, archaichumans, and modern humansare all considered part of asingle evolving lineagethroughout the Old World.
2 Ma
Modern humans
Archaic humans
Homo erectus
Present
1 Ma
multiregional evolutionmodel The hypothesis thatmodern humans evolvedthroughout the Old Worldas a single species after thefirst dispersion of Homoerectus out of Africa.
I I I I I I I

Relethford: The Human Species: An Introduction to Biological Anthropology, 5/e
IV. Human Evolution 14. The Origin of Modern Humans
© The McGraw−Hill Companies, 2003
fossil evidence of archaic and modern humans. Predictions are made regard-ing the biological relationships between archaic and modern forms withineach region and the relationship between regions.
The First Modern Humans The African replacement model predicts thatanatomically modern humans will appear first in Africa and then later outsideof Africa. A first step is to examine the earliest known dates for modern hu-mans in each region. This is not always as easy as it sounds because there arediffering definitions of what it means to be “modern” (Wolpoff and Caspari1997) and disagreements about which physical features are primitive or de-rived. In addition, we must deal with the incomplete nature of the fossil rec-ord and the possibility that we have not yet found the earliest moderns in anygiven region. In spite of these problems, the evidence to date presents a pat-tern that is compatible with the predictions of the African replacement model.In Africa, modern-looking fossils date to between 130,000 and 100,000 yearsago. Modern anatomy, to some extent, is present among some Middle East-ern fossils by roughly 90,000 years ago. Modern human anatomy is at least60,000 years old in Australia and appears in different parts of Europe be-tween 40,000 and 30,000 years ago. The fossil record for Asia is less clear butsuggests a date of perhaps 60,000 years ago (Stringer and McKie 1996). It isclear that modern humans were present in some parts of the Old World atthe same time as some archaics, such as the Neandertals in Europe.
Does the earlier appearance of modern humans support the African re-placement model? Yes, but it does not necessarily reject all multiregional mod-els. The primary African origin model also suggests that modern anatomyappears first in Africa and then later spread out across the Old World. Quitesimply, it takes time for genes to flow from one part of the world to another,and differences in timing are expected. Thus, the earlier appearance of mod-ern humans in Africa does not distinguish between these models. Instead, weneed to focus on the nature of the contact between moderns and archaicsoutside of Africa—was there an exchange of genes (multiregional evolution)or replacement of the archaics?
CHAPTER 14 ■ The Origin of Modern Humans 407
FIGURE 14.18
Classification of differentmodels of modern humanorigins and the transition fromarchaic to modern humansfocusing on how the transitiontook place (cladogenesis oranagenesis) and where theinitial transition took place(only in Africa or worldwide).(Adapted from Relethford 2001c)
How did the transition take place?
Where did the transition take place?
Cladogenesis
Anagenesis
Recent African origin No single time and place for the origin of modern humans
Mutiregionalevolution: regional coalescence model
Multiregionalevolution: primary
African origin model
Africanreplacement
model
regional coalescencemodel A variant of themultiregional evolutionmodel of the origin ofmodern humans thatsuggests the transition from archaic to modernhumans resulted from the coalescence of geneticand anatomic changes that took place in differentplaces at different times, all mixing together toproduce modern humans.
primary African originmodel A variant of themultiregional evolutionmodel of the origin of modern humans that suggests most of thetransition from archaic to modern humans tookplace first in Africa and thenspread throughout the restof the species across the Old World by gene flow.
I I I I I I I

Relethford: The Human Species: An Introduction to Biological Anthropology, 5/e
IV. Human Evolution 14. The Origin of Modern Humans
© The McGraw−Hill Companies, 2003
Regional Continuity A number of anthropologists have supported a mul-tiregional evolution model based on the observed pattern of regional conti-nuity in the fossil record—the appearance of similar traits within the samegeographic region over time. For example, some humans, past and present,have a particular dental trait known as shovel-shaped incisors, which have aridge on the outer margins of the incisor teeth. Although this trait is foundacross the world today, it is found most frequently in both living and ancientpopulations in East Asia. The fact that this trait is most common throughouttime in the same geographic region suggests genetic continuity over time; thatis, early and archaic humans in Asia contributed some of their genes to liv-ing Asian populations. Another example is the high angle of the nose, foundmost frequently in both European Neandertals and in living Europeans.
Regional traits form as the result of evolutionary forces (namely, geneticdrift and selection) that make a given region somewhat different geneticallyfrom others. At first glance, this seems to pose a problem. If regional popula-tions became different from one another, then how could they remain partof a single species? Gene flow is needed to maintain populations in a singlespecies, but shouldn’t gene flow eradicate regional differences? The answer isactually quite simple: evolution results from the balance of the evolutionaryforces. Under continued gene flow, many regional traits will be lost over time,but some will persist because of genetic drift and selection (Relethford 2001c).This balance means that the transition from archaic to modern humans couldhave taken place across the Old World due to shared gene flow while popula-tions still retained some regional traits (Thorne and Wolpoff 1992; Wolpoffet al. 1994; Wolpoff and Caspari 1997).
For our purposes, the important point is that regional continuity ofmany traits is best explained by the genetic continuity over time predicted bymultiregional evolution. It is more difficult to explain regional traits underthe African replacement model because such traits would be eliminated byreplacement and would then have to reappear independently. Although thereis debate over which traits show continuity and in which regions, many an-thropologists agree that the evidence for continuity is strong for the fossilrecord in Asia and Australasia (e.g., Kramer 1991; Hawks et al. 2000; Thorneand Wolpoff 1992; Wolpoff et al. 2001).
The situation is less clear in Europe, where the coexistence of both Nean-dertal and modern populations, followed by the disappearance of the Neander-tals, is often considered evidence of replacement. It is this pattern, combinedwith the distinct morphology of Neandertals and the findings of divergentancient DNA (discussed in the previous chapter), that has led a number ofanthropologists to support the idea that Neandertals were a separate species—Homo neanderthalensis—that became extinct.
Not everyone agrees, and there is fossil evidence for regional continuity inEurope. One example is the skeleton of a 4-year-old child from 25,000 yearsago that was found in Portugal. The cranium shows a mixture of featuresusually associated with Neandertals and early modern humans, but the post-cranial skeleton shows Neandertal characteristics (Duarte et al. 1999). Thisfind possibly represents an example of admixture between Neandertals and
408 PART IV ■ Human Evolution
regional continuity Theappearance of similar traitswithin a geographic regionthat remain over a longperiod of time.
I I I I I I I

Relethford: The Human Species: An Introduction to Biological Anthropology, 5/e
IV. Human Evolution 14. The Origin of Modern Humans
© The McGraw−Hill Companies, 2003
moderns as the two populations came into contact with each other in west-ern Europe, although others argue that this is simply a stocky early modernhuman child (Tattersall and Schwartz 1999). Several other studies have alsoshown evidence for regional continuity in Europe. Milford Wolpoff and col-leagues (2001) compared features in early modern human skulls to Neander-tals and early moderns from Africa and the Middle East and concluded thatthe evidence is consistent with some genetic continuity in Europe.
Another clue comes from changes in the frequency of Neandertal fea-tures in Europe over time. Wolpoff (1999) lists 18 anatomical traits consid-ered unique to Neandertals and examines their occurrence in the earliestpost-Neandertal European moderns and in living Europeans. Under a replace-ment model, these traits should be absent in the modern populations, butinstead there is a pattern of reduction over time. For example, one unique Ne-andertal dental trait is found in 53 percent of Neandertals, 18 percent of post-Neandertal early moderns, and 1 percent of living Europeans. Instead of thepattern of complete elimination predicted from replacement, this trait showsa decline over time consistent with Neandertals experiencing gene flow from
409
S P E C I A L T O P I C
The IcemanOur understanding of ancient times comes from recon-structions based on the fossil and archaeological records,supplemented by evidence from past environments. Al-though new methods and techniques for analysis haveaided our ability to reconstruct the past, we are neverthe-less dealing with only bits and pieces of what actuallyonce existed.
Occasionally, though, we come across more detailedevidence. On September 19, 1991, hikers in the glacialmountains between Austria and Italy stumbled upon the body of a man. This is not unusual—bodies are oftenfound in this region, the result of accidents while climb-ing or hiking in the mountains. Initial investigation, how-ever, showed that this was a naturally occurring mummy(mummification occurs when a corpse is cut off fromoxygen). How did the corpse remain so well preserved?The man died in a shallow depression in the ground, andthe advancing glacier moved over him, preserving him ina mummified state without carrying his body downhill.In 1991, the ice had receded and the body was exposed.Because of his discovery in the glacier, he is known todayas “The Iceman.”
The body became of greater interest because of sev-eral items found with it, including a flint knife and anaxe. The axe consisted of a wooden shaft attached to whatappeared to be a bronze axe head. The bronze implied
that the axe and the body dated to the European BronzeAge, roughly 4,000 years ago. Closer analysis of the axehead showed, however, that it was not bronze (which is amixture of copper and tin) but almost entirely pure cop-per. Use of copper is known to be even older than 4,000years ago. The greater age was confirmed by carbon-14dating of the body, which placed it at 5,250 years ago.
Research continues on the Iceman, but preliminarystudy has revealed much about his life and death. Markshave been found on the body that might possibly betattoos. In addition to the knife and the axe, he had abow, arrows, and a leather quiver. Remains of his clothesshow that they were made of fur, and boots have alsobeen found. He also had two lumps of fungus connectedby a leather strap. At first, it was thought that the fungusmight have been used as tinder for starting fires. Thefungus has now been identified as a species that is knownto have antibiotic properties, so we might be seeing someevidence of ancient medicine.
How did the Iceman die? Initial analysis suggestedthe possibility of exhaustion and dehydration, althoughthis was based on circumstantial evidence. More recently,a detailed examination of the body revealed that he hadbeen shot in the shoulder with an arrow, most likelyleading to paralysis of the right arm and a painful death(BBC News 2001).

Relethford: The Human Species: An Introduction to Biological Anthropology, 5/e
IV. Human Evolution 14. The Origin of Modern Humans
© The McGraw−Hill Companies, 2003
outside Europe. If verified, this means that Neandertals “disappeared” due tothe cumulative effects of gene flow—they were absorbed into a larger gene pool.
The Genetic EvidenceIn addition to the fossil evidence, many researchers have examined questionsof modern human origins using information on genetic variation in livingpeople. We can observe patterns of genetic variation in the present day andask what evolutionary model could have given rise to these observed patterns.Whereas with fossils we work from the past to the present, genetic studiesstart with the present in an effort to reconstruct the past. We view the pat-terns of contemporary genetic variation as reflections of the past. Althoughmuch of the genetic evidence is compatible with the African replacementmodel, it is also compatible with multiregional evolution (Relethford 2001c).
Gene Trees One way of reconstructing the past is to compare DNA se-quences from pairs of living people and use them to build a “tree” showingthe history of a particular gene. Many of these studies have focused on mito-chondrial DNA because it is inherited maternally and does not recombine,making genealogical reconstruction easier. Studies of mitochondrial DNAshow that the human species today forms two basic clusters. One clusterconsists of people with African ancestry, and the other cluster contains peo-ple of different ancestries, both African and non-African. Further analysisshows that the original female ancestor was African. These findings havebeen interpreted as reflecting population history; an initial origin of modernhumans in Africa followed by a subsequent split of non-African populations.Further, these studies estimate that the common mitochondrial DNA ances-tor of all living humans lived roughly 200,000 years ago, which is felt by manyto be definite proof of the African replacement model (e.g., Cann et al. 1987;Penny et al. 1995; Vigilant et al. 1991). Although these studies are compatiblewith the African replacement model, they do not necessarily disprove a multi-regional evolution hypothesis. Alan Templeton (1998) notes that an Africanorigin for mitochondrial DNA is also possible under a multiregional inter-pretation. The common female ancestor had to live somewhere, and the factthat she lived in Africa does not rule out either a replacement or a multiregionalmodel. Others note that the date for the common ancestor does not directlyinform us about the origin of our species (Relethford 2001c; Rogers and Jorde1995). The history of a particular gene or DNA sequence is not necessarilythe history of our species.
Gene tree analysis has also been applied to a number of different genes,including Y chromosome data and nuclear DNA. Although some show thesame patterns of mitochondrial DNA, others show more ancient “roots” (e.g.,Harris and Hey 1999) and still others show non-African origins (e.g., Hardinget al. 1997). Although the bulk of gene tree analysis suggests a recent Africanorigin of modern humans, it does not unequivocally support a replacementout of Africa. It may be the case, as argued next, that our species’ origin ismostly, but not exclusively, out of Africa.
410 PART IV ■ Human Evolution

Relethford: The Human Species: An Introduction to Biological Anthropology, 5/e
IV. Human Evolution 14. The Origin of Modern Humans
© The McGraw−Hill Companies, 2003
Genetic Diversity Another avenue of research is to compare patterns of ge-netic diversity in living humans. Here we use a variety of data from humanpopulations, including DNA sequences, blood types and other genetic mark-ers, and measures of the face and skull.
One way to look at genetic diversity is to compare the level of geneticvariation within different populations. Studies using a variety of differenttraits have shown that Africa tends to be more genetically diverse than othergeographic regions, such as Europe or Asia (Figure 14.19). The greater diver-sity of African populations has been used to argue for the African replacementmodel under the assumption that the oldest population will accumulate themost mutations over a long period of time and therefore be more geneticallydiverse. If modern humans arose as a new species in Africa and then laterspread to other regions, the African populations would be the oldest andtherefore show the highest amount of variation.
This is not the only possible interpretation because factors other thanage can influence a population’s genetic diversity. One such factor is popula-tion size. Recall from Chapter 3 the relationship between genetic drift andpopulation size. Smaller populations lose more alleles because of genetic driftthan do larger populations and consequently show lower levels of diversity.Larger populations experience less genetic drift and will show higher levelsof diversity. It is possible that the finding of higher African diversity simply re-flects a larger African population in our species’ past.
Using mathematical models relating diversity and population size, Releth-ford and Harpending (1994) and Relethford and Jorde (1999) found that ge-netic diversity in living humans is consistent with a model where most ofour ancestors (50–70 percent) several hundred thousand years ago lived inAfrica. Today, of course, the majority of the human species does not live inAfrica, but in Asia. The distribution of humans today is influenced strongly
CHAPTER 14 ■ The Origin of Modern Humans 411
FIGURE 14.19
Comparison of genetic diversityamong different geographicregions of living humans basedon (a) mitochondrial DNAvariation, (b) microsatelliteDNA variation, and (c) craniometric variation. In each case, different measuresof “diversity” are used so thatthe scales (vertical axes)cannot be compared directly.Instead, simply note that ineach case Africa is the mostdiverse region genetically.(Source of data: Cann et al. 1987;Relethford and Harpending 1994;Jorde et al. 1997)
a. Mitochondrial DNA
Austra
lasia
Euro
peAsia
Africa
0.0
0.1
0.2
0.3
0.4
0.5
Gen
etic
div
ersi
ty
c. Craniometrics
Austra
lasia
Euro
peAsia
Africa
0.7
0.8
0.9
1.0
Gen
etic
div
ersi
ty
b. Microsatellite DNA
Euro
peAsia
Africa
0.65
0.70
0.75
0.80G
enet
ic
dive
rsity
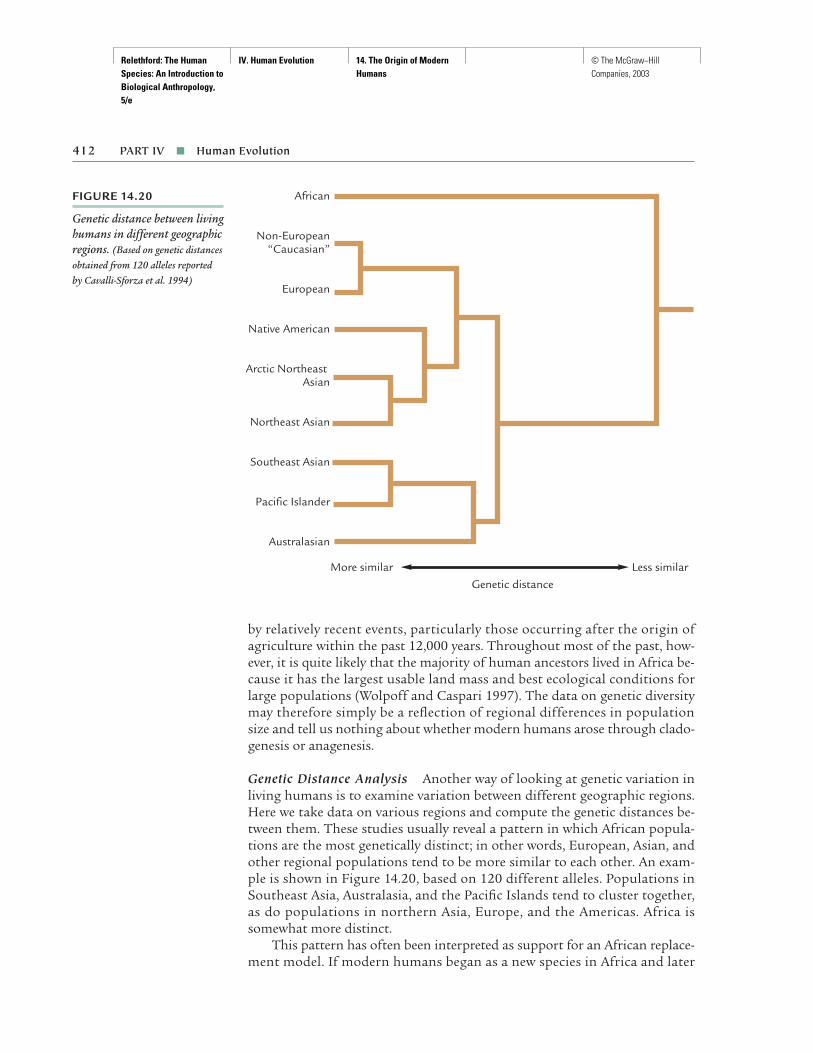
Relethford: The Human Species: An Introduction to Biological Anthropology, 5/e
IV. Human Evolution 14. The Origin of Modern Humans
© The McGraw−Hill Companies, 2003
by relatively recent events, particularly those occurring after the origin ofagriculture within the past 12,000 years. Throughout most of the past, how-ever, it is quite likely that the majority of human ancestors lived in Africa be-cause it has the largest usable land mass and best ecological conditions forlarge populations (Wolpoff and Caspari 1997). The data on genetic diversitymay therefore simply be a reflection of regional differences in populationsize and tell us nothing about whether modern humans arose through clado-genesis or anagenesis.
Genetic Distance Analysis Another way of looking at genetic variation inliving humans is to examine variation between different geographic regions.Here we take data on various regions and compute the genetic distances be-tween them. These studies usually reveal a pattern in which African popula-tions are the most genetically distinct; in other words, European, Asian, andother regional populations tend to be more similar to each other. An exam-ple is shown in Figure 14.20, based on 120 different alleles. Populations inSoutheast Asia, Australasia, and the Pacific Islands tend to cluster together,as do populations in northern Asia, Europe, and the Americas. Africa issomewhat more distinct.
This pattern has often been interpreted as support for an African replace-ment model. If modern humans began as a new species in Africa and later
412 PART IV ■ Human Evolution
FIGURE 14.20
Genetic distance between livinghumans in different geographicregions. (Based on genetic distancesobtained from 120 alleles reportedby Cavalli-Sforza et al. 1994)
African
Non-European“Caucasian”
European
Native American
Arctic Northeast Asian
Northeast Asian
Southeast Asian
Pacific Islander
Australasian
More similar Less similarGenetic distance

Relethford: The Human Species: An Introduction to Biological Anthropology, 5/e
IV. Human Evolution 14. The Origin of Modern Humans
© The McGraw−Hill Companies, 2003
spread out, splitting into groups that colonized different regions, then thesenon-African populations should be more closely related to each other than toAfrican populations. Once again, however, this is not the only alternative. Thesame pattern of genetic distances can be replicated if there were differencesin gene flow between regions, perhaps affected by geographic distance andother factors. The pattern of genetic distances we see in the world today canbe explained by slightly less gene flow into Africa than out of Africa over time(Relethford 2001c). Thus, genetic distance analysis may provide informationon ancient migration, but it does not help us distinguish between replace-ment and multiregional evolution hypotheses.
Population Size and Modern Human Origins One of the most interestingfindings in the past decade is that patterns of genetic variation in living hu-mans contain a signature of past population size. By comparing observedvariation in DNA sequences and other data with different mathematicalmodels, we can tell that the human species increased rapidly in size roughly50,000 years ago (e.g., Sherry et al. 1994). Furthermore, the genetic evidencesuggests that there were only a few thousand ancestors living before this pop-ulation growth (Rogers 1995). Various analyses of genetic data suggest thatour ancestors 200,000 years ago numbered no more than 10,000 adults. Iftrue, this figure argues strongly against a multiregional evolution model, be-cause this is too small a number of people to have been spread out over threecontinents (Harpending et al. 1998). The small size instead suggests that allof our ancestors 200,000 years ago were located in one area—a portion ofAfrica. This pattern is expected under the African replacement model, wherea new species would initially have a small number of people.
As with other genetic analyses, however, the answer is not definite. Themain problem with the population size studies is that these methods pro-vide an estimate of population size under a set of idealized assumptions. Theactual number of ancestors under real-world conditions may be quite a bitlarger than the genetic estimates suggest. Depending on demographic and eco-logical conditions, the genetic estimate of 10,000 adults could be equivalentto as many as several hundred thousand, a number close to that predictedfrom archaeological analysis (Relethford 2001c; Templeton 1997). Thus, al-though the genetic data show us that the human species increased rapidly insize, we have no clear indication of the actual number of ancestors.
Consensus—Mostly Out of Africa?The debate over modern human origins is not over. Both African replacementand multiregional evolution models have some support from the fossil rec-ord and genetic data, but in many cases the results can be interpreted in morethan one way. The question of modern human origins is not likely to besolved by any single study but rather by a consensus based on the accumu-lated evidence using a variety of approaches and methods.
Given the evidence to date, what is the bottom line? Keeping in mind thatnew data and analyses continue to come in all the time, and could conceivably
CHAPTER 14 ■ The Origin of Modern Humans 413

Relethford: The Human Species: An Introduction to Biological Anthropology, 5/e
IV. Human Evolution 14. The Origin of Modern Humans
© The McGraw−Hill Companies, 2003
change any current conclusions, we can still summarize some main points.Based on the fossil evidence to date, there is some consensus that modernhuman anatomy appeared first in Africa, although the issue of genetic in-volvement from other geographic regions is not settled. The genetic evidencehas frequently been taken as supporting the African replacement model be-cause these observations are compatible with that model. Unfortunately, ge-netic observations are also compatible with some versions of the multire-gional evolution model, making it difficult to distinguish between them. Thefossil evidence for regional continuity outside of Africa is also accepted bymany (although not all) anthropologists. This evidence, combined with somegenetic data of non-African ancestry before 200,000 years ago, suggests thatmodern humans arising in Africa did not totally replace archaic humans out-side of Africa.
Elsewhere, I have suggested that a variant of the primary African originmodel best fits the available data (Relethford 2001c). In this view, our recentorigins can be considered mostly, but not exclusively, out of Africa, with most ofour ancestors 200,000 years ago living in Africa (perhaps because there werelikely to be more people there than elsewhere). Many modern human traitsappeared first in Africa but then spread throughout the rest of the Old Worldvia gene flow. The contribution of non-African populations may have variedfrom place to place; for example, it may be the case that there was more con-tinuity in Australasia than in Europe.
This model combines two basic lines of evidence—the central evolution-ary importance of Africa and regional continuity outside of Africa. Further,the genetic evidence for a larger African population size may have had a majorimpact on the recent evolution of our species. Quite simply, if more of ourancestors lived in Africa than elsewhere, then Africa would have a greater evo-lutionary impact than other regions. Although this model does suggest a re-cent African origin for our species, it is multiregional—more than one regionwas involved. If true, then modern humans do not represent a new speciesbut the continuation of a more ancient evolutionary line. Further research isneeded to determine if this hypothesis is correct.
Why Did Modern Humans Evolve?The alternative models for the origin of modern humans are fascinating todebate, but we don’t want to lose track of a basic fact that all agree on: onlymodern human fossils have been found within the past 28,000 years or so. Inaddition to explaining the timing and nature of the transition from archaicsto moderns, we must also ask ourselves why this transition occurred in thefirst place. The available evidence suggests that anatomically modern hu-mans had some evolutionary advantage over archaic humans. But what wasthis advantage?
Modern humans differ from the archaics in several features, including amore well-rounded skull, smaller brow ridges, and a prominent chin. DanielLieberman (1998) suggests that these and other changes are all related to re-duction in the length of the sphenoid, a bone in the cranial base. Because the
414 PART IV ■ Human Evolution

Relethford: The Human Species: An Introduction to Biological Anthropology, 5/e
IV. Human Evolution 14. The Origin of Modern Humans
© The McGraw−Hill Companies, 2003
anatomical development of a skull consists of interrelated components, achange in one part can influence changes throughout. His analysis suggeststhat most of the changes from archaic to modern are related to this relativelysimple change. However, a problem remains—what caused this change?
Language and Modern Human Origins It has often been suggested thatthe development of human language capabilities marks the origin of mod-ern H. sapiens. Cranial changes are seen to relate to changes in language abil-ity, with a claim that modern H. sapiens was linguistically superior to the ar-chaics. This view is tempting when evidence for the increased symbolic andtechnological achievements of modern H. sapiens is also considered. Can cra-nial changes and these cultural achievements be related? It is possible—butthe basic problem remains that these cultural changes took place well afterthe initial biological changes associated with modern H. sapiens. Of course,cave art, bone tools, and other achievements may actually be older than wethink, an idea supported to some extent by the new dating of bone tools inAfrica. However, basing a model on what has not been found is not a goodidea. We must always deal with the known fossil and archaeological recordsand be willing to make appropriate revisions when we make new discoveries.
How can we date the origin of language? This question is central to anydiscussion of differences in language ability between archaics and moderns.One approach is to examine the fossil evidence of vocal anatomy. Strikingdifferences exist between the vocal tract of a modern human and an ape. Thelarynx is part of the respiratory system that contains the vocal chords forspeech. Apes, like other mammals, have their larynx high in the throat. Inhumans, however, the larynx is farther down in the throat, a position that al-lows the throat to serve as a resonating chamber capable of a greater numberof sounds (Figure 14.21). Humans can make a wider number of sounds, anddo it faster, than apes. We pay a price for this adaptation, though—unlike apes,
CHAPTER 14 ■ The Origin of Modern Humans 415
FIGURE 14.21
The vocal anatomy of achimpanzee (left) and amodern human (right). Inapes, the larynx is higher in thethroat. In humans, it is lower,allowing a greater number of sounds but increasing thepossibility of choking on food.(From Roger Lewin, In the Age ofMankind: A Smithsonian Bookof Human Evolution, 1989: 181,Smithsonian Institution Press)
Soft palate
Epiglottis
Pharynx
Larynx
Soft palate
Epiglottis
Pharynx
Larynx
larynx Part of the vocalanatomy in the throat.
I I I I I I I

Relethford: The Human Species: An Introduction to Biological Anthropology, 5/e
IV. Human Evolution 14. The Origin of Modern Humans
© The McGraw−Hill Companies, 2003
we cannot breathe and eat at the same time, and we are in far greater dangerof choking to death. Human infants still have the larynx high in the throatand can breathe and swallow at the same time. By early childhood, however,the larynx has descended into the throat, making this phenomenon no longerfeasible (Lewin 1998).
The position of the larynx represents a clear-cut anatomical difference be-tween humans and apes, and, as such, larynx position can help in assessingthe language abilities of any fossil hominid. Unfortunately, the throat, likeall soft tissue, decomposes and we cannot recover it. We can get clues aboutthe positioning of the larynx, however, by looking at the base of a cranium.Note that in Figure 14.21 the lower profile of the ape skull is fairly straight,whereas in the modern human it is flexed. The degree of this flexion is di-rectly related to the position of the larynx. Given this relationship, what do thefossils tell us? Laitman and colleagues (1979) investigated the crania of a num-ber of fossil hominids and concluded that whereas Australopithecus had theape pattern, the crania of many archaic humans are more similar to modern-day humans. The Neandertals had a pattern that was between those of amodern subadult and modern adult human, suggesting that their languageabilities may have been somewhat different. Other reconstructions and inter-pretations are possible (Houghton 1993; Schepartz 1993); some suggest therewas little difference in language ability between any of the archaics and mod-ern humans. Schepartz (1993) argues instead that complex language beganwith the initial origin of the genus Homo.
Another source of information on language origins is the archaeologicalrecord. Some argue that complex language is of recent origin, coinciding witha rapid spread of new behaviors roughly 50,000 years ago (e.g., Klein 1999).Others argue that modern human behaviors actually developed over a longerperiod of time (e.g., McBrearty and Brooks 2000; Schepartz 1993). This lattergroup feels that by focusing on the more recent cultural innovations, such asbone tools and cave art, we are ignoring significant earlier innovations, suchas complex stone tool manufacture and burial of the dead. Could such thingsbe possible without some language abilities? Although it seems unlikely, thepossibility exists nevertheless that some enhancement of language ability co-incided with the origin of modern H. sapiens. We have too few data at presentto answer these questions.
Technology and Biological Change If changes in language abilities arenot the reason for the origin of modern H. sapiens, what else might have beeninvolved? Technological changes have also been suggested as mechanisms forthe change from archaic to modern forms. This view holds that many of thestructural characteristics of archaic humans were the result of stresses gener-ated by the use of their front teeth as tools. The large size and wear patternsof the incisor teeth of archaics (especially Neandertals) support the notionthat these teeth were used for a variety of purposes. The stresses generated byheavy use of the front teeth can also be used to explain the large face, largeneck muscles, and other features of archaic skulls. Once technological adap-
416 PART IV ■ Human Evolution

Relethford: The Human Species: An Introduction to Biological Anthropology, 5/e
IV. Human Evolution 14. The Origin of Modern Humans
© The McGraw−Hill Companies, 2003
tations had developed sufficiently, these physical adaptations were no longernecessary and would not be selected for. Smaller teeth and faces might thenbe advantageous because smaller structures require correspondingly less en-ergy for growth and maintenance (Smith et al. 1989). Similar arguments canbe made to explain the reduction in body size and musculature (e.g., Frayer1984). Once cultural behaviors took the place of larger teeth, faces, and bones,smaller structures actually became more adaptive.
Calcagno and Gibson (1988) present evidence that larger teeth can be non-adaptive. They cite clinical evidence from contemporary human populationsthat show that large teeth can have many disadvantages. Larger teeth are moresusceptible to dental decay due to crowding of teeth and periodontal disease.In earlier prehistoric times, the advantages of larger teeth as tools may haveoutweighed the disadvantages. When cultural change led to more efficienttools, however, these advantages diminished, and selection would then havebeen against large teeth.
Once again, evolution is best seen in terms of the overall balance betweencosts and benefits. Human evolution is particularly interesting becausehuman behaviors frequently affect this balance. In the past, as new technolo-gies and behaviors arose, they changed the balance between cost and benefit.At some point in the past, for example, the less rugged and less muscular mod-ern morphology may have shifted from being a disadvantage to being an ad-vantage. The origin of modern H. sapiens may itself reflect this type of process.If so, we would expect the kind of “lag” between cultural and biological changethat we see in the fossil record. Biological changes allow further culturalchanges, which in turn allow further biological changes. Each change shiftsthe balance.
RECENT BIOLOGICAL AND CULTURALEVOLUTION IN HOMO SAPIENS
Human evolution did not end with the origin of modern H. sapiens. Biologi-cally, we have continued to change in subtle ways even over the past 10,000to 20,000 years or so. Cranial capacity has declined somewhat (Henneberg1988), probably a reflection of a general decrease in size and ruggedness, asdiscussed in the last section. Teeth have also become somewhat smaller(Brace et al. 1987), most likely reflecting the changing costs and benefits oflarger teeth.
Within the very recent past (10,000–15,000 years), the major changes inhuman evolution have been cultural. One major change in human existence—the invention of agriculture—began roughly 12,000 years ago. Up to thispoint, humans had been exclusively hunters and gatherers. Agriculturechanged the entire ecological equation for human beings. Humans beganmanipulating the environment to increase the availability of food throughthe domestication of plants and animals. Many explanations are offered as towhy agriculture developed, including that it was a solution to the increased
CHAPTER 14 ■ The Origin of Modern Humans 417
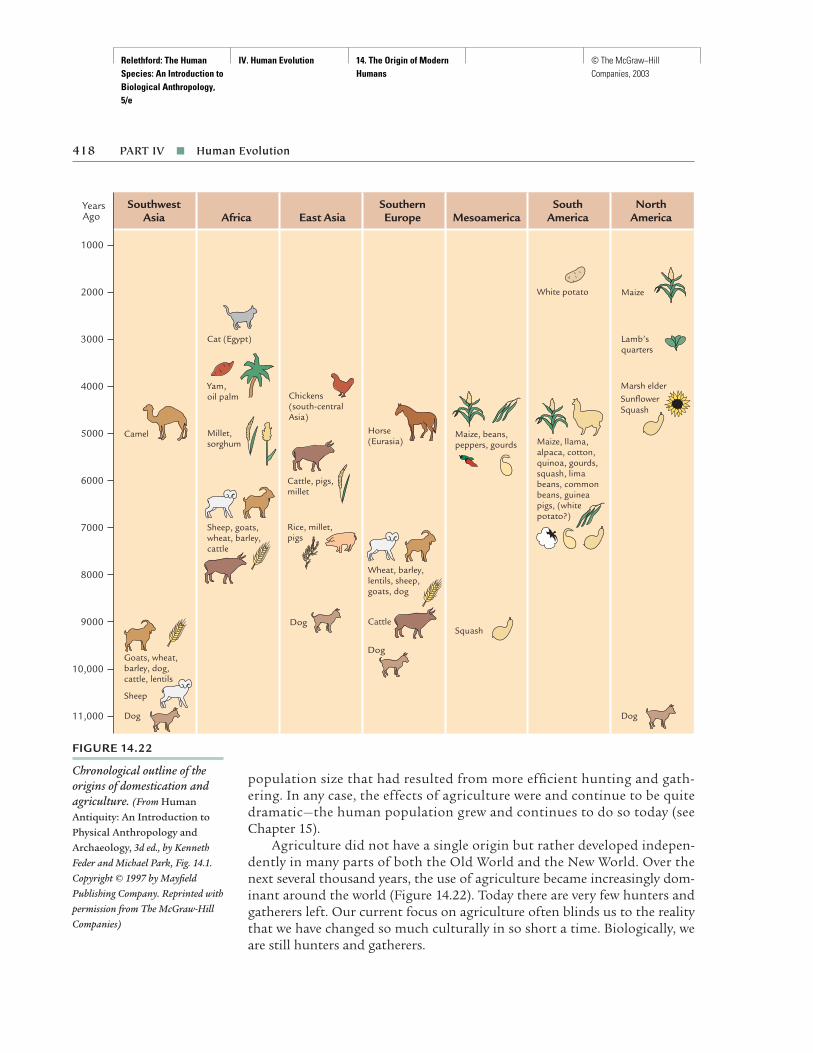
Relethford: The Human Species: An Introduction to Biological Anthropology, 5/e
IV. Human Evolution 14. The Origin of Modern Humans
© The McGraw−Hill Companies, 2003
population size that had resulted from more efficient hunting and gath-ering. In any case, the effects of agriculture were and continue to be quitedramatic—the human population grew and continues to do so today (seeChapter 15).
Agriculture did not have a single origin but rather developed indepen-dently in many parts of both the Old World and the New World. Over thenext several thousand years, the use of agriculture became increasingly dom-inant around the world (Figure 14.22). Today there are very few hunters andgatherers left. Our current focus on agriculture often blinds us to the realitythat we have changed so much culturally in so short a time. Biologically, weare still hunters and gatherers.
418 PART IV ■ Human Evolution
FIGURE 14.22
Chronological outline of theorigins of domestication andagriculture. (From HumanAntiquity: An Introduction toPhysical Anthropology andArchaeology, 3d ed., by KennethFeder and Michael Park, Fig. 14.1.Copyright © 1997 by MayfieldPublishing Company. Reprinted withpermission from The McGraw-HillCompanies)
Dog
Maize, llama,alpaca, cotton, quinoa, gourds, squash, lima beans, common beans, guinea pigs, (white potato?)
White potato
Camel
Goats, wheat,barley, dog,cattle, lentils
Sheep
Dog
Cat (Egypt)
Yam, oil palm
Millet, sorghum
Sheep, goats,wheat, barley,cattle
Lamb’squarters
Dog
Maize
SunflowerMarsh elder
Squash
MesoamericaSouthwest
Asia East AsiaSouthern
EuropeSouth
AmericaNorth
AmericaAfrica
1000
2000
3000
4000
5000
6000
7000
8000
9000
10,000
11,000
YearsAgo
Horse (Eurasia)
Wheat, barley,lentils, sheep,goats, dog
Cattle
Cattle, pigs, millet
Chickens(south-centralAsia)
Rice, millet, pigs
Dog
Maize, beans,peppers, gourds
Squash

Relethford: The Human Species: An Introduction to Biological Anthropology, 5/e
IV. Human Evolution 14. The Origin of Modern Humans
© The McGraw−Hill Companies, 2003
Cultural change continued at an even faster rate following the origin ofagriculture and rapid population growth. Cities and state-level societies de-veloped. Exploration brought the inhabitants of the Old World and the NewWorld back into contact, and industrialization spread rapidly. Today, only12,000 years after the time our ancestors survived by hunting and gathering,we are able to explore and live in every environment on earth and beyond (Fig-ure 14.23). However one feels about the rapid cultural changes of H. sapiens,these changes can be viewed as a continuation of the basic adaptations ofculture and learning that have been apparent for at least the past 2.5 millionyears of human evolution. The final chapter focuses on the biological impactof our species’ rapid cultural change, particularly in the past 12,000 years.
SUMMARY
Among other features, anatomically modern Homo sapiens is characterized bya higher, more well-rounded skull and a smaller face than most archaics and
CHAPTER 14 ■ The Origin of Modern Humans 419
FIGURE 14.23
The space shuttle is one featureof our species’ continuingexploration and utilization ofnew environments. (Courtesy NASA)
Relethford: The Human Species: An Introduction to Biological Anthropology, 5/e
IV. Human Evolution 14. The Origin of Modern Humans
© The McGraw−Hill Companies, 2003
by the presence of a noticeable chin. Modern H. sapiens is best known fromfossil records dating over the past 30,000 years. There is considerable evi-dence, however, that these humans appeared first more than 100,000 yearsago in Africa and by 100,000 to 90,000 years ago in the Middle East. By50,000 years ago, the culture of H. sapiens had begun to change rapidly; theuse of more sophisticated stone tools (especially blade tools) and bone toolsspread, burials of the dead became more elaborate, and art appeared. Mod-ern humans had colonized Australia by 60,000 years ago and the New Worldby at least 15,000 years ago.
There is continuing controversy regarding the origin of anatomicallymodern humans. The multiregional evolution model hypothesizes that thetransition from H. erectus to archaic humans to modern H. sapiens occurredthroughout the Old World. According to this model, the evolution of mod-ern humans took place within a widespread species across several continents.Gene flow is considered here to be sufficient to have maintained a single speciesof human after the initial dispersal of H. erectus from Africa. Conversely, theAfrican replacement model hypothesizes that the evolution of modern hu-mans occurred in one place—Africa, between 200,000 and 100,000 years ago—and that modern humans then spread outward across the world, replacingpreexisting archaic populations. There are variants of each model, includingthe possibility of a primary African origin combined with mixture with ar-chaic populations. Fossil and genetic data have been used to examine thesehypotheses. There is still considerable debate about why modern humansfirst evolved.
Human evolution did not end after the initial appearance of modern hu-mans. Although there have been some biological changes during our recentpast, most of our species’ evolution during the past 10,000 years has beencultural. Perhaps the single most important event was the development ofagriculture, which changed our entire way of life. Predicting the specifics offuture human evolution is problematic, but it does appear clear that our fu-ture will involve more and more cultural change, which occurs at a far greaterrate than biological evolution. This does not mean that biological evolutionhas stopped but rather that our fate is becoming increasingly affected by cul-tural change.
420 PART IV ■ Human Evolution

Relethford: The Human Species: An Introduction to Biological Anthropology, 5/e
IV. Human Evolution 14. The Origin of Modern Humans
© The McGraw−Hill Companies, 2003
SUPPLEMENTAL READINGS
Relethford, J. H. 2001. Genetics and the Search for Modern Human Origins. New York: Wiley-Liss. A review of different models for the origin of modern humans and the genetic evidence that has been used to test them.
Stringer, C., and R. McKie. 1996. African Exodus: The Origins of Modern Humanity. New York:Henry Holt.
Wolpoff, M. H., and R. Caspari. 1997. Race and Human Evolution. New York: Simon andSchuster.
These two books are excellent and interesting summaries of the modern human originsdebate, coauthored by the leading proponents of the African replacement model(Stringer) and multiregional evolution model (Wolpoff ).
INTERNET RESOURCES
http://anthro.palomar.edu/homo2/modern_humans.htmEarly Modern Homo sapiens, a tutorial including discussion of models ofmodern human origins.
http://www.mnh.si.edu/anthro/humanorigins/ha/sap.htmHomo sapiens, a similar Web page.
http://anthro.palomar.edu/homo2/sapiens_culture.htmEarly Modern Human Culture, a tutorial focusing on stone tool technologyand cave art.
CHAPTER 14 ■ The Origin of Modern Humans 421

Relethford: The Human Species: An Introduction to Biological Anthropology, 5/e
IV. Human Evolution 15. Human Biology and Culture Change
© The McGraw−Hill Companies, 2003
C H A P T E R 15Human Biology and Culture Change
423
Human evolution has been increasingly driven by cultural changes in ourspecies’ recent history. Although we continue to evolve biologically, these
changes are much slower than changes in human cultural adaptation. Dur-ing the past 12,000 years, we have changed from being hunters and gatherersto being agriculturalists; an increasing portion of humanity lives in or nearlarge urban centers; and our population has exploded from 5 million to 10million people to more than 6 billion. In many ways, we live in a world veryunlike that of our ancestors.
These cultural changes have happened much faster than biologicalchange. As a result, biologically we are still hunters and gatherers to some ex-tent but live in conditions that are often quite different from those underwhich our ancestors evolved. We live in larger groups, eat different foods,and structure our societies in different ways. The disparity between rates ofcultural change and biological evolution has had serious consequences forour biology. An example of this type of change was described briefly in thesection on nutritional adaptation in Chapter 7, which noted the biomedicalimpact of a changing diet and lifestyle on Samoan populations. This exam-ple is only one of many that show how rapid cultural changes have affectedour biology—not always to our benefit. This chapter considers the impact ofculture change on human biology by focusing on some major cultural changesin human evolution over the past 12,000 years.
Chinese farmers working in rice paddies. The transition to agriculture beganin the human species 12,000 years ago. This major cultural event has led tomany changes in human biology, including shifts in disease, death, and fertility.(© Michael S. Yamashita/Corbis)
▲

Relethford: The Human Species: An Introduction to Biological Anthropology, 5/e
IV. Human Evolution 15. Human Biology and Culture Change
© The McGraw−Hill Companies, 2003
THE BIOLOGICAL IMPACT OF AGRICULTURE
A major shift in human adaptation was the transition from hunting andgathering to agriculture. Human populations began relying increasingly onagriculture starting 12,000 years ago. Although a small proportion of humanpopulations today still rely on hunting and gathering, most are agricultural.The reasons for this change are still widely debated, and there was probablyno single cause responsible for this shift. Feder (2000) notes that there is ageneral pattern in the archaeological record that shows that human popula-tions became more sedentary (settled in one place) before agriculture devel-oped. Human populations might have been able to settle down because ofincreased efficiency at hunting and gathering and/or changes in the environ-ment resulting from the warming climate near the end of the Pleistocene.Some archaeologists suggest that the shift to a sedentary life led to popula-tion growth, which in turn led to the need for more food resources. Undersuch conditions, sedentary populations would shift their methods of acquir-ing food and adopt a variety of agricultural strategies that increased the foodsupply, such as weeding, protecting plant resources, and clearing forests. Overtime, human populations became more reliant on such methods, and thedomestication of plants and animals became their primary means of feedingthemselves.
The study of the biological impact of the transition to agriculture reliesextensively on the field of paleopathology, the study of disease in prehis-toric populations. The primary evidence is from skeletal remains, which canprovide a variety of information on health and disease, including age atdeath, cause of death, nutritional status, growth patterns, and trauma (Cohen1989; Larsen 2000). Diseases such as osteoarthritis may affect bones directly(Figure 15.1). Other diseases, such as syphilis and tuberculosis, may leave in-dications of their effects on the skeletal system (Figure 15.2). Physical traumadue to injury or violence often leaves detectable fractures. Signs of healing orinfection tell us the long-term effects of such trauma (Figure 15.3). X-ray andchemical analysis can provide us with information about nutrition and growthpatterns. Collectively, these methods and others provide us with a view ofthe health of prehistoric populations.
Population GrowthThe shift to agriculture led to many changes in human populations. A majorchange was the increase in population size, which in turn led to a greater re-liance on agriculture, and ultimately to further population growth. The rela-tionship between population size and agriculture is clear when consideringthe maximum size, or carrying capacity, of human populations. Huntingand gathering populations tend to be small, usually no more than a coupleof dozen people, because there would not be enough food for more. Agricul-ture can support much larger populations.
424 PART IV ■ Human Evolution
sedentary Settled in oneplace throughout most orall of the year.
paleopathology The studyof disease in prehistoricpopulations based onanalysis of skeletal remainsand archaeological evidence.
carrying capacity Themaximum population sizecapable of being supportedin a given environment.
I I I I I I I

Relethford: The Human Species: An Introduction to Biological Anthropology, 5/e
IV. Human Evolution 15. Human Biology and Culture Change
© The McGraw−Hill Companies, 2003
CHAPTER 15 ■ Human Biology and Culture Change 425
FIGURE 15.1
Osteoarthritis in a prehistoricPeruvian. The head of thefemur is deformed. (© The FieldMuseum, Chicago: Neg. #74749B)
FIGURE 15.2
The skull of a prehistoric Eskimo who suffered from treponemalinfection. The marks on the top of the skull are typical of along-term syphilitic infection. (© Hrdlicka Paleopathology Collection,Courtesy San Diego Museum of Man)
FIGURE 15.3
Nasal fracture in a prehistoric Peruvian. The affected areashows signs of healing, indicating that this individual survivedthe initial trauma. (© Hrdlicka Paleopathology Collection, CourtesySan Diego Museum of Man)

Relethford: The Human Species: An Introduction to Biological Anthropology, 5/e
IV. Human Evolution 15. Human Biology and Culture Change
© The McGraw−Hill Companies, 2003
Why did agricultural populations become larger? Population growth re-sults from the net effects of fertility, mortality, and migration. Births increasethe population size, and deaths decrease the population size. Migration caneither increase or decrease the population size, depending on whether morepeople move into a population or leave it. Ignoring migration for the mo-ment, the change in population size because of natural increase is the num-ber of births minus the number of deaths. If the number of births exceeds thenumber of deaths, then the population grows. If the number of births is lessthan the number of deaths, then the population declines.
The fact that the human species grew in numbers following the rise ofagriculture suggests that this growth was due to an increase in fertility (morebirths per year), a decrease in mortality (fewer deaths per year), or both. Theredoes not appear to have been a reduction in overall mortality, as assessed byestimates of the life expectancy at birth, a measure of the average length oflife for a newborn child. Life expectancy at birth is derived by looking at apopulation’s life table, which is the age distribution of members of a popu-lation that is used to compute the probability that someone will die by a cer-tain age based on the current distribution of the age at death. Life tables areroutinely used in demographic research, and by the insurance industry, andcan be compiled for prehistoric populations by estimating from skeletal re-mains the age at death.
Hunting and gathering populations typically have a low life expectancyat birth—roughly 20 to 40 years (Cohen 1989). Keep in mind that the life ex-pectancy at birth is an average length of life. The value of 20 to 40 years doesnot mean that everyone only lives 20 to 40 years total. Some live much longer,and others do not live this long. This average provides a crude index of over-all health in a population. Skeletal evidence suggests that, in general, agri-cultural populations did not improve on this figure; in fact, in some casesmortality rates actually increased and life expectancy at birth declined some-what following the transition to agriculture. For example, analysis of skeletalremains from Dickson Mound, a prehistoric Native American site in Illinois,shows that life expectancy at birth was 26 years at a time when they were ex-clusively hunters and gatherers but decreased to 19 years following the tran-sition to agriculture (Cohen 1989).
If lowered mortality rates are not responsible for increase in populationsize following the adoption of agriculture, then it seems logical that the an-swer must lie in increased fertility rates. A traditional explanation is that theshift to a sedentary life and diet resulted in improved ovarian function andshorter intervals of breast-feeding. Studies of living hunters and gatherers haveshown that breast-feeding has a contraceptive effect. When a women nursesher child, hormonal changes take place that reduce the probability of ovula-tion (Wood 1994). Among some contemporary hunting-gathering popula-tions, the women breast-feed for several years, contributing to a long intervalbetween births—44 months on average among the !Kung of the KalahariDesert in Africa (Potts 1988). The shift to agriculture resulted in foods avail-able to infants that allowed earlier weaning, and hence shorter intervals be-tween children, leading to an increase in population size. In addition, there
426 PART IV ■ Human Evolution
natural increase Numberof births minus the numberof deaths.
life expectancy at birthA measure of the averagelength of life for a newbornchild.
life table A compilation of the age distribution of apopulation that provides anestimate of the probabilitythat an individual will die by a certain age, used tocompute life expectancy.
I I I I I I I
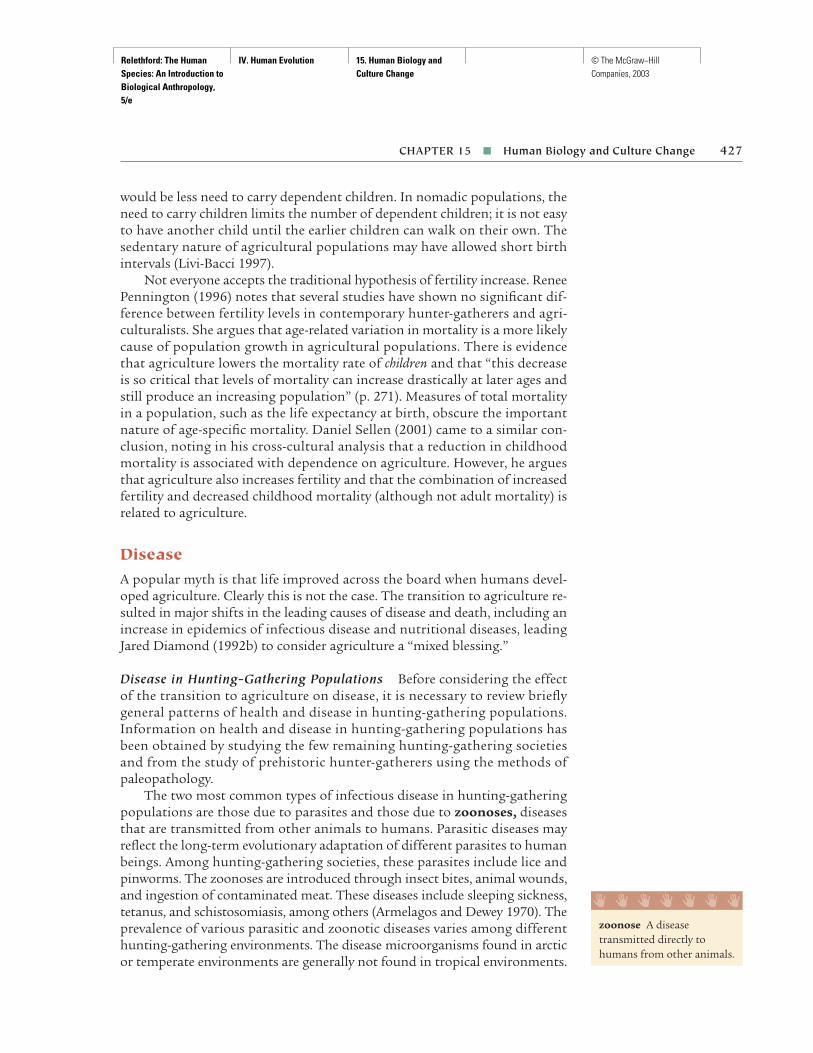
Relethford: The Human Species: An Introduction to Biological Anthropology, 5/e
IV. Human Evolution 15. Human Biology and Culture Change
© The McGraw−Hill Companies, 2003
would be less need to carry dependent children. In nomadic populations, theneed to carry children limits the number of dependent children; it is not easyto have another child until the earlier children can walk on their own. Thesedentary nature of agricultural populations may have allowed short birthintervals (Livi-Bacci 1997).
Not everyone accepts the traditional hypothesis of fertility increase. ReneePennington (1996) notes that several studies have shown no significant dif-ference between fertility levels in contemporary hunter-gatherers and agri-culturalists. She argues that age-related variation in mortality is a more likelycause of population growth in agricultural populations. There is evidencethat agriculture lowers the mortality rate of children and that “this decreaseis so critical that levels of mortality can increase drastically at later ages andstill produce an increasing population” (p. 271). Measures of total mortalityin a population, such as the life expectancy at birth, obscure the importantnature of age-specific mortality. Daniel Sellen (2001) came to a similar con-clusion, noting in his cross-cultural analysis that a reduction in childhoodmortality is associated with dependence on agriculture. However, he arguesthat agriculture also increases fertility and that the combination of increasedfertility and decreased childhood mortality (although not adult mortality) isrelated to agriculture.
DiseaseA popular myth is that life improved across the board when humans devel-oped agriculture. Clearly this is not the case. The transition to agriculture re-sulted in major shifts in the leading causes of disease and death, including anincrease in epidemics of infectious disease and nutritional diseases, leadingJared Diamond (1992b) to consider agriculture a “mixed blessing.”
Disease in Hunting-Gathering Populations Before considering the effectof the transition to agriculture on disease, it is necessary to review brieflygeneral patterns of health and disease in hunting-gathering populations. Information on health and disease in hunting-gathering populations hasbeen obtained by studying the few remaining hunting-gathering societiesand from the study of prehistoric hunter-gatherers using the methods ofpaleopathology.
The two most common types of infectious disease in hunting-gatheringpopulations are those due to parasites and those due to zoonoses, diseasesthat are transmitted from other animals to humans. Parasitic diseases mayreflect the long-term evolutionary adaptation of different parasites to humanbeings. Among hunting-gathering societies, these parasites include lice andpinworms. The zoonoses are introduced through insect bites, animal wounds,and ingestion of contaminated meat. These diseases include sleeping sickness,tetanus, and schistosomiasis, among others (Armelagos and Dewey 1970). Theprevalence of various parasitic and zoonotic diseases varies among differenthunting-gathering environments. The disease microorganisms found in arcticor temperate environments are generally not found in tropical environments.
CHAPTER 15 ■ Human Biology and Culture Change 427
zoonose A diseasetransmitted directly tohumans from other animals.
I I I I I I I
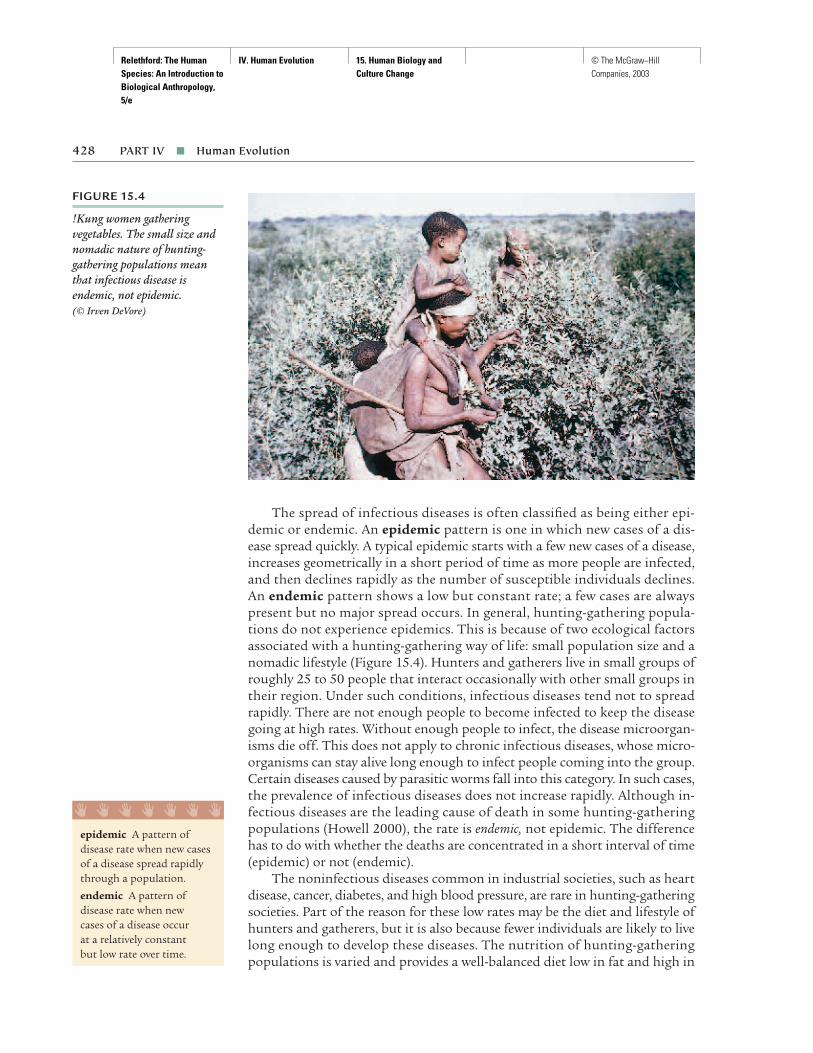
Relethford: The Human Species: An Introduction to Biological Anthropology, 5/e
IV. Human Evolution 15. Human Biology and Culture Change
© The McGraw−Hill Companies, 2003
The spread of infectious diseases is often classified as being either epi-demic or endemic. An epidemic pattern is one in which new cases of a dis-ease spread quickly. A typical epidemic starts with a few new cases of a disease,increases geometrically in a short period of time as more people are infected,and then declines rapidly as the number of susceptible individuals declines.An endemic pattern shows a low but constant rate; a few cases are alwayspresent but no major spread occurs. In general, hunting-gathering popula-tions do not experience epidemics. This is because of two ecological factorsassociated with a hunting-gathering way of life: small population size and anomadic lifestyle (Figure 15.4). Hunters and gatherers live in small groups ofroughly 25 to 50 people that interact occasionally with other small groups intheir region. Under such conditions, infectious diseases tend not to spreadrapidly. There are not enough people to become infected to keep the diseasegoing at high rates. Without enough people to infect, the disease microorgan-isms die off. This does not apply to chronic infectious diseases, whose micro-organisms can stay alive long enough to infect people coming into the group.Certain diseases caused by parasitic worms fall into this category. In such cases,the prevalence of infectious diseases does not increase rapidly. Although in-fectious diseases are the leading cause of death in some hunting-gatheringpopulations (Howell 2000), the rate is endemic, not epidemic. The differencehas to do with whether the deaths are concentrated in a short interval of time(epidemic) or not (endemic).
The noninfectious diseases common in industrial societies, such as heartdisease, cancer, diabetes, and high blood pressure, are rare in hunting-gatheringsocieties. Part of the reason for these low rates may be the diet and lifestyle ofhunters and gatherers, but it is also because fewer individuals are likely to livelong enough to develop these diseases. The nutrition of hunting-gatheringpopulations is varied and provides a well-balanced diet low in fat and high in
428 PART IV ■ Human Evolution
FIGURE 15.4
!Kung women gatheringvegetables. The small size andnomadic nature of hunting-gathering populations meanthat infectious disease isendemic, not epidemic. (© Irven DeVore)
epidemic A pattern ofdisease rate when new casesof a disease spread rapidlythrough a population.
endemic A pattern ofdisease rate when new cases of a disease occur at a relatively constant but low rate over time.
I I I I I I I

Relethford: The Human Species: An Introduction to Biological Anthropology, 5/e
IV. Human Evolution 15. Human Biology and Culture Change
© The McGraw−Hill Companies, 2003
fiber. In fact, some researchers have suggested people in Western society shouldemulate this diet to improve their health (Eaton et al. 1988). A major nutri-tional problem in hunting-gathering societies is the scarcity of food duringhard times, such as droughts. The rate of malnutrition and starvation in mosthunting-gathering groups is usually very low (Dunn 1968).
Apart from endemic infectious disease, what else accounts for the majorcauses of death in hunting-gathering societies? Injury deaths are one factor.In most environments, death could result from hunting injuries and burns.Depending on the specific environment, death can result from drowning, coldexposure, or heat stress. In some hunting-gathering populations, injuries arethe leading cause of death (Dunn 1968). For females, an additional factor isdeath during childbirth.
Infectious Disease in Agricultural Populations The pattern of disease isdifferent in agricultural populations. Agriculture allows larger populationsize and requires a sedentary life. The increased size and lack of mobility hascertain implications for the spread of disease (Figure 15.5). Large popula-tions with many susceptible individuals allow for rapid spread of short-livedmicroorganisms. Such conditions exist in agricultural populations becauseof increased population size and the increased probability of coming into
FIGURE 15.5
Chinese farmers planting rice.The larger size and sedentarynature of agriculturalpopulations contribute toepidemics of infectious disease.(© Michael S. Yamashita/Corbis)
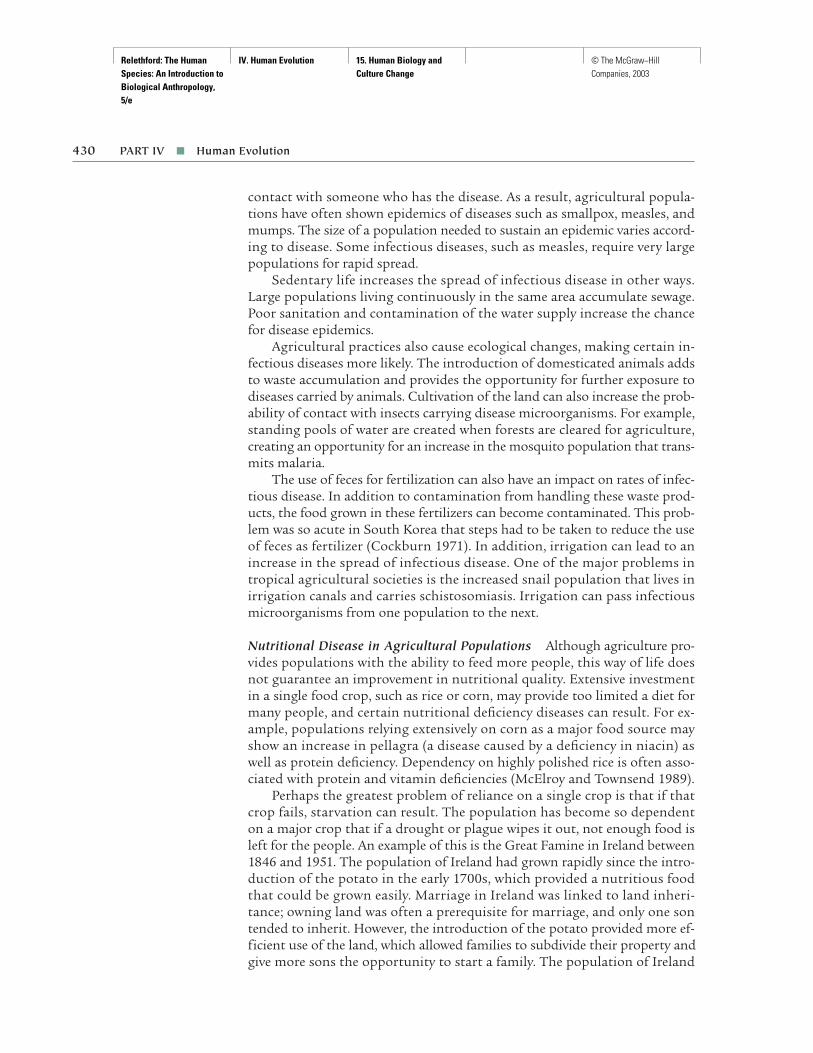
Relethford: The Human Species: An Introduction to Biological Anthropology, 5/e
IV. Human Evolution 15. Human Biology and Culture Change
© The McGraw−Hill Companies, 2003
contact with someone who has the disease. As a result, agricultural popula-tions have often shown epidemics of diseases such as smallpox, measles, andmumps. The size of a population needed to sustain an epidemic varies accord-ing to disease. Some infectious diseases, such as measles, require very largepopulations for rapid spread.
Sedentary life increases the spread of infectious disease in other ways.Large populations living continuously in the same area accumulate sewage.Poor sanitation and contamination of the water supply increase the chancefor disease epidemics.
Agricultural practices also cause ecological changes, making certain in-fectious diseases more likely. The introduction of domesticated animals addsto waste accumulation and provides the opportunity for further exposure todiseases carried by animals. Cultivation of the land can also increase the prob-ability of contact with insects carrying disease microorganisms. For example,standing pools of water are created when forests are cleared for agriculture,creating an opportunity for an increase in the mosquito population that trans-mits malaria.
The use of feces for fertilization can also have an impact on rates of infec-tious disease. In addition to contamination from handling these waste prod-ucts, the food grown in these fertilizers can become contaminated. This prob-lem was so acute in South Korea that steps had to be taken to reduce the useof feces as fertilizer (Cockburn 1971). In addition, irrigation can lead to anincrease in the spread of infectious disease. One of the major problems intropical agricultural societies is the increased snail population that lives inirrigation canals and carries schistosomiasis. Irrigation can pass infectiousmicroorganisms from one population to the next.
Nutritional Disease in Agricultural Populations Although agriculture pro-vides populations with the ability to feed more people, this way of life doesnot guarantee an improvement in nutritional quality. Extensive investmentin a single food crop, such as rice or corn, may provide too limited a diet formany people, and certain nutritional deficiency diseases can result. For ex-ample, populations relying extensively on corn as a major food source mayshow an increase in pellagra (a disease caused by a deficiency in niacin) aswell as protein deficiency. Dependency on highly polished rice is often asso-ciated with protein and vitamin deficiencies (McElroy and Townsend 1989).
Perhaps the greatest problem of reliance on a single crop is that if thatcrop fails, starvation can result. The population has become so dependenton a major crop that if a drought or plague wipes it out, not enough food isleft for the people. An example of this is the Great Famine in Ireland between1846 and 1951. The population of Ireland had grown rapidly since the intro-duction of the potato in the early 1700s, which provided a nutritious foodthat could be grown easily. Marriage in Ireland was linked to land inheri-tance; owning land was often a prerequisite for marriage, and only one sontended to inherit. However, the introduction of the potato provided more ef-ficient use of the land, which allowed families to subdivide their property andgive more sons the opportunity to start a family. The population of Ireland
430 PART IV ■ Human Evolution

Relethford: The Human Species: An Introduction to Biological Anthropology, 5/e
IV. Human Evolution 15. Human Biology and Culture Change
© The McGraw−Hill Companies, 2003
grew rapidly, but this resulted in a precarious ecology. The potato crop wasoften destroyed by blight, and during the Great Famine there were five con-tinuous years of blight with no relief (Connell 1950). Roughly 1.5 millionpeople died and 1 million left the country (Woodham-Smith 1962), startinga pattern of population decline that continued into the twentieth century(Figure 15.6).
An agricultural diet can also lead to dental problems. The increasedamount of starches in an agriculturalist’s diet, combined with an increase indirt and grit in the food, can lead to an increase in dental wear and cavities.Such changes are readily apparent in many studies of paleopathology (Cohen1989; Larsen 2000).
THE BIOLOGICAL IMPACT OF CIVILIZATION
Following the origin and spread of agriculture in different parts of the world,a number of human populations began to develop urban centers and civi-lization as much as 6,000 years ago. As defined by archaeologists, a civiliza-tion is a large state-level society that has a number of specific characteristicsincluding large population size, high population density, cities, social strati-fication, food and labor surpluses, monumental architecture, and a systemof record keeping (Feder 2000).
Urbanization and DiseasePreindustrial cities date back several thousand years. Such cities often de-velop as market or administrative centers for a region, and their increasedpopulation size and density provide many opportunities for epidemics of in-fectious disease. In addition, a number of early cities had inadequate sewage
CHAPTER 15 ■ Human Biology and Culture Change 431
FIGURE 15.6
Population growth in Irelandfrom 1687 to 1971. Data fromthe two currently separatenations, the Republic of Irelandand Northern Ireland, havebeen pooled. (Source of data:Vaughan and Fitzpatrick 1978)
9
Popu
latio
n si
ze (
mill
ions
)
2
Year
1680
8
7
6
3
19601840 1880 19201760 18001720
4
5
Relethford: The Human Species: An Introduction to Biological Anthropology, 5/e
IV. Human Evolution 15. Human Biology and Culture Change
© The McGraw−Hill Companies, 2003
disposal and contaminated water, both major factors increasing the spreadof epidemics. To feed large numbers of people, food had to be brought infrom the surrounding countryside and stored inside the city. In Europe dur-ing the Middle Ages, grain was often stored inside the house. Rats and othervermin had easy access to these foods and their populations increased, fur-thering the spread of disease. In preindustrial cities located in dry parts ofthe world, grain was stored in ceramic containers, which limited the accessof vermin.
Perhaps the best-known example of an epidemic disease in preindustrialcities is the bubonic plague in Europe during the fourteenth century. Bu-bonic plague, also known as the Black Death, is caused by a bacterium spreadby fleas among field rodents. With the development of large urban areas andthe corresponding large indoor rat populations, the disease spread to rats inthe cities. As the rats died, the fleas jumped off them to find a new host, whichwas frequently a human being. The spread of bubonic plague during this timewas pandemic, a widespread epidemic affecting large continental areas. It isestimated that up to 20 million Europeans died from bubonic plague between1346 and 1352 (McEvedy 1988). A major factor in the spread of plague wastrade; rats would board ships sailing across the Mediterranean Sea and dis-embark at distant ports, infecting more rats and ultimately the human pop-ulation. The ecological changes accompanying the development of urbaniza-tion in Europe provided an opportunity for the rapid spread of fleas, rats, andthe disease. Bubonic plague is still around today, including in the AmericanSouthwest, although treatment with antibiotics has kept the incidence ofdeath close to zero.
Industrialization, which began more than 250 years ago, accelerated pop-ulation growth in urban areas. Technological changes provided more efficientmethods of agriculture and the means to support more people than in previ-ous eras. The increased growth of urban areas was accompanied initially byfurther spread of infectious diseases, compounded by problems in waste dis-posal. By the end of the nineteenth century, however, some populations begana transition wherein the rate of infectious disease declined and the rate ofnoninfectious disease increased. This shift in disease patterns was accompa-nied by a reduction in mortality, especially infant mortality, and an increasein life expectancy. In evolutionary terms, all of these changes are very recent.
Culture ContactOne consequence of expanding civilizations is the increase in long-distancecontact with other societies through exploration, colonization, trade, andconquest. With the rise of European exploration in the 1500s, many previ-ously separate human populations met one another. In addition to the vastcultural, economic, and political problems resulting from such contact, in-fectious diseases could now spread into populations that had no prior im-mune experience. The results were generally devastating.
The epidemiologic effects of culture contact have been documented fora number of populations, particularly Native Americans and Pacific Islanders.
432 PART IV ■ Human Evolution
pandemic A widespreadepidemic that affects a largegeographic area, such as acontinent.
I I I I I I I

Relethford: The Human Species: An Introduction to Biological Anthropology, 5/e
IV. Human Evolution 15. Human Biology and Culture Change
© The McGraw−Hill Companies, 2003
Many infectious diseases, such as smallpox, measles, and mumps, were intro-duced into the New World at this time, leading to massive loss of life in manypopulations (Cohen 1989; McNeill 1977). The actual impact of infectiousdisease varied across populations—some were hit much harder than wereothers, and at different times (Larsen 1994). The overall impact was a severereduction in population size across the Americas (Crawford 1998).
The flow of disease seems to have been primarily in one direction, fromthe Old World to the New World. The reason for this might have to do withfewer domesticated animals in the New World. These animals are often theinitial source of diseases that infect humans (Diamond 1992a). One possibleexception to this one-way flow of human disease is treponemal diseases, in-cluding venereal syphilis. Venereal syphilis (spread by sexual contact) increasedrapidly in Europe after 1500, a date that coincides with the contact betweenNew World and Old World populations. Following European settlement inthe Americas, it was also noted that many Native Americans had syphilis.Did the disease evolve in Europe and then spread to the Americas? Or did itfirst appear in the New World and then spread to Europe? Or did it evolve in-dependently in both the New World and the Old World? Evidence from paleo-pathology suggests that cases of treponemal disease occurred in the NewWorld before European contact, suggesting that venereal syphilis evolved inthe New World (Baker and Armelagos 1988). This remains a controversialtopic, and some have suggested that treponemal disease was present in Eu-rope before contact, which would support the idea of the independent evolu-tion of syphilis.
RECENT CHANGES
The last hundred years has seen dramatic shifts in our species. Industrializa-tion and economic development have spread throughout much (but not all)of the world, resulting in major biological impacts on disease, mortality, fer-tility, and population growth. The exact changes experienced by a society arein part a reflection of its economic status. Demographers routinely classifynations into two groups: more developed countries and less developed coun-tries. Over much of the last century, the more developed countries have seena reduction in death rates and birth rates, a shift from infectious disease tononinfectious disease as the leading causes of death, a slowing (and in somecases a reversal) of population growth, and an aging population. Less devel-oped countries have seen some reduction in mortality and fertility, althoughinfectious disease still dominates and birth rates remain high in parts of theworld. Population growth continues at a high rate in many less developedcountries.
The Epidemiologic TransitionIn the more developed countries, life expectancy at birth has increased morethan 50 percent, and the leading causes of death have shifted from infectious
CHAPTER 15 ■ Human Biology and Culture Change 433

Relethford: The Human Species: An Introduction to Biological Anthropology, 5/e
IV. Human Evolution 15. Human Biology and Culture Change
© The McGraw−Hill Companies, 2003
to noninfectious diseases. The increase in life expectancy and the shift frominfectious to noninfectious diseases as the primary cause of death is a fea-ture of the epidemiologic transition that has been observed in the more de-veloped countries and that is under way, to varying degrees, in the less devel-oped countries.
The Nature of the Epidemiologic Transition According to the model de-veloped by Omran (1977), a pretransition population has high death rates,particularly because of epidemics of childhood infectious disease. As publichealth, sanitation, and medical technologies improve, epidemics become lessfrequent and less intense. The overall death rate declines, and life expectancyat birth increases. Following the transition, the leading causes of death areprimarily noninfectious rather than infectious diseases.
A major characteristic of the epidemiologic transition is the increase inlife expectancy at birth. In the United States in 1900, life expectancy was 49years, but by 1999 life expectancy had risen to 77 years (Kochanek et al. 2001).Figure 15.7 shows the life expectancy at birth for males and females in theUnited States from 1900 through 1999. Females tend to live longer, as re-flected in their higher life expectancies; in 1999, the life expectancy of a new-born girl was 79.4 years, compared with 73.9 for newborn boys. Excepting anoticeable dip in 1918 (the year of a major worldwide influenza pandemic),life expectancy at birth rose during the twentieth century.
The increase in life expectancy is not limited to the more developed soci-eties. Other groups undergoing modernization and the epidemiologic tran-sition have also shown an increase, such as the residents of the modernizingpopulation of American Samoa. From 1950 to 1980, life expectancy at birthincreased 10 years for males and 18 years for females (Crews 1989).
A controversial topic today is the extent to which life expectancy can beexpected to increase in developed societies. Based on statistical analysis ofdeath rates, Olshansky and colleagues (1990, 2001) argue that even with majorreductions in chronic disease, life expectancy at birth will not increase past
434 PART IV ■ Human Evolution
FIGURE 15.7
Life expectancy at birth in theUnited States from 1900 to1999. Life expectancy at birthincreased during the twentiethcentury, with the majorexception of 1918, the year of an influenza pandemic.(Source of data: 1900–1996 datafrom Anderson 1998; 1997 datafrom Centers for Disease Controland Prevention Web page: <http://www.cdc.gov/nchs/data/lewk3_97.pdf >; 1998 data from Kochanek et al. 2001)
80
Life
exp
ecta
ncy
at b
irth
Year
1900
70
60
30
20001940 1960 19801920
Males
Females
40
50
epidemiologic transitionThe increase in lifeexpectancy and the shift from infectious to noninfectious disease as the primary cause of death.
I I I I I I I

Relethford: The Human Species: An Introduction to Biological Anthropology, 5/e
IV. Human Evolution 15. Human Biology and Culture Change
© The McGraw−Hill Companies, 2003
85 years of age because the decline in mortality rates will slow down. Others,however, suggest that mortality rates will continue to decline and that lifeexpectancy at birth could reach as high as 90 years of age in some developednations by the year 2050 (Tuljapurkar et al. 2000).
The increase in life expectancy is related to a dramatic decline in deathsdue to infectious diseases. Infants and young children are at greater risk forsuch diseases, and a large number of deaths in this age group lowers the aver-age length of life in a population. As infectious disease death rates decline, theaverage length of life increases. A consequence of people living longer is thatthe death rate from degenerative noninfectious diseases, such as cancer andheart disease, begins to rise. Thus, there was a shift from infectious to non-infectious diseases as the primary causes of death. In the United States in1900, the top three causes of death were all infectious diseases: pneumonia/influenza, tuberculosis, and diarrheal diseases. In 1999, the top three causes ofdeath were all degenerative diseases: heart disease, cancer, and stroke (Kocha-nek et al. 2001).
Figure 15.8 illustrates this dramatic shift by comparing the mortalityrate (deaths per 100,000 people) for selected diseases in the United States in1900 and in 1998–1999. Note the tremendous decline in infectious diseasemortality and the increase in noninfectious diseases. As we continue to livelonger lives, we are more likely to die from a degenerative noninfectious dis-ease. The major health problems today are quite different than they wereonly several generations in the past when infectious diseases were the pri-mary cause of death. Figure 15.9 shows the 10 leading causes of death in theUnited States in 1999. Heart disease and cancer are the two major causes ofdeath, accounting for 53 percent of all deaths. Only two of the top 10 causesof death are due to infectious disease, pneumonia/influenza and septicemia
CHAPTER 15 ■ Human Biology and Culture Change 435
FIGURE 15.8
Death rates (per 100,000people) for selected infectiousand noninfectious diseases inthe United States in 1900 and1998–1999. Note the decrease in infectious disease and theincrease in noninfectiousdisease. (Source of data: 1900 ratesfrom Centers for Disease Controland Prevention Web page: <http://www.cdc.gov/nchs/data/lead0078.pdf >, and Molnar 1998 for measlesand diabetes; 1999 rates fromKochanek et al. 2001 except fortuberculosis rates, taken for 1998from CDC Web page: <http://www.cdc.gov/nchs/data/gm250_98.pdf >,and measles, taken for 1998 fromCDC Web page: <http://www.cdc.gov/nchs/data/98gm3_01.pdf >)
DiabetesCancerHeartdisease
MeaslesTuberculosis
300
250
200202.4
150
100
50
0
Dea
ths
per 1
00,0
00 p
eopl
e
Infectious
Pneumoniaand
influenza
Noninfectious
23.4
194.4
0.412.5
0.0
137.4
64.0
201.6
265.8
9.725.1
1900
1998–99

Relethford: The Human Species: An Introduction to Biological Anthropology, 5/e
IV. Human Evolution 15. Human Biology and Culture Change
© The McGraw−Hill Companies, 2003
(blood poisoning). Heart disease, cancer, and stroke are likely to remain asthe major causes of death in the near future, but the other leading causesoften change rapidly, primarily because of new technologies and aggressivepublic health measures. Since the previous edition of this text, HIV infection(the viral agent responsible for AIDS), suicide, and liver disease have droppedbelow tenth place, and Alzheimer’s disease, nephritis, and septicemia have allmoved into the leading causes of death.
It is important to remember that these figures refer to the United States,and although typical of other nations that have undergone the epidemio-logic transition, they do not represent the entire world. Infectious disease re-mains a leading cause of death in many human populations, particularlyamong the less developed countries. Figure 15.10 shows the leading causesof death worldwide, illustrating that infectious disease is still a leading causeof death in the human species. HIV infection, which has dropped signifi-cantly in the United States, remains high elsewhere in the world and is thefourth leading cause of death in our species. The magnitude of infectiousdisease is even more apparent when considering the leading causes of deathin Africa (Figure 15.11), where HIV infection is the leading cause of deathand malaria is second. Measles, which has disappeared as a cause of death inthe more developed countries, is the sixth leading cause of death in Africa.Populational differences in disease and death are due to differences in thelevel of economic development and public health measures, and differentpopulations are at different points in the epidemiologic transition.
Causes of the Epidemiologic Transition What has caused these rapidchanges in disease rates and life expectancy? Cultural changes in industrial so-
436 PART IV ■ Human Evolution
FIGURE 15.9
Leading causes of death in theUnited States in 1999. Thedeath rate is the number ofdeaths per 100,000 people. The abbreviation COPD =chronic obstructive pulmonarydiseases. (Source of data: Kochanek et al. 2001)
Deaths per 100,000 people
300250200150100500
Heart disease
Cancer
Stroke
COPD
Injuries
Diabetes
Pneumonia/flu
Nephritis
Septicemia
Alzheimer’s
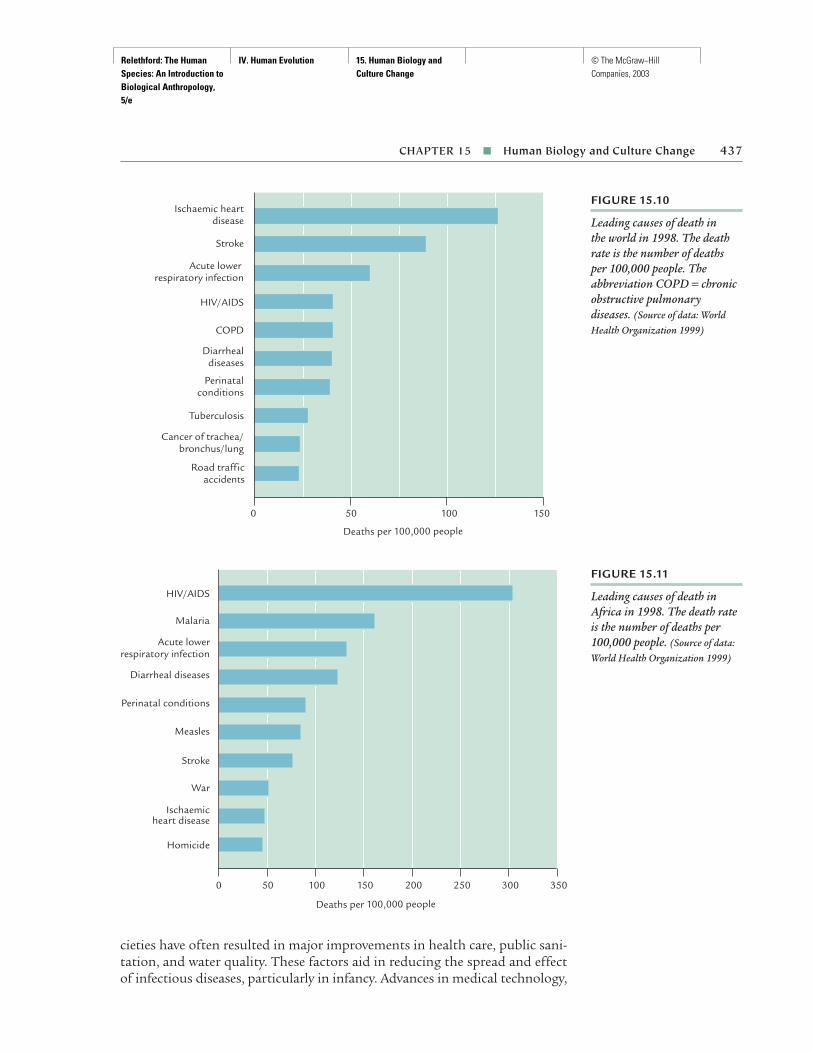
Relethford: The Human Species: An Introduction to Biological Anthropology, 5/e
IV. Human Evolution 15. Human Biology and Culture Change
© The McGraw−Hill Companies, 2003
CHAPTER 15 ■ Human Biology and Culture Change 437
FIGURE 15.10
Leading causes of death in the world in 1998. The deathrate is the number of deaths per 100,000 people. Theabbreviation COPD = chronicobstructive pulmonarydiseases. (Source of data: WorldHealth Organization 1999)
Deaths per 100,000 people
150100500
Ischaemic heartdisease
Stroke
Acute lower respiratory infection
HIV/AIDS
COPD
Diarrheal diseases
Perinatal conditions
Tuberculosis
Cancer of trachea/bronchus/lung
Road traffic accidents
FIGURE 15.11
Leading causes of death inAfrica in 1998. The death rateis the number of deaths per100,000 people. (Source of data:World Health Organization 1999)
Deaths per 100,000 people
300 350250200150100500
HIV/AIDS
Malaria
Acute lowerrespiratory infection
Diarrheal diseases
Perinatal conditions
Measles
Stroke
War
Ischaemicheart disease
Homicide
cieties have often resulted in major improvements in health care, public sani-tation, and water quality. These factors aid in reducing the spread and effectof infectious diseases, particularly in infancy. Advances in medical technology,

Relethford: The Human Species: An Introduction to Biological Anthropology, 5/e
IV. Human Evolution 15. Human Biology and Culture Change
© The McGraw−Hill Companies, 2003
such as antibiotics and vaccination, have continued to help reduce the deathrate due to infectious diseases, but the major reason for the initial declinewas a cleaner environment brought about by civil engineering—particularlysewers and water treatment systems.
Case Study of the Epidemiologic Transition The relationship betweencultural change and disease rates emerges clearly in specific case studies ofthe epidemiologic transition. Omran (1977) looked at overall death rates inhis study of the epidemiologic transition in New York City. Figure 15.12 showsthe changes in total mortality in New York City over time. Before the 1860s,the overall death rate was high and had frequent spikes, primarily because ofepidemics of cholera. Following the mid-1860s, both the overall death rateand the intensity of epidemics declined. This decrease corresponds with theestablishment of the Health Department. After the 1920s, the continued in-corporation of better sanitation and a clean water supply, along with an im-provement in drugs and health care and the introduction of pasteurized milk,caused the death rates to decline even more.
Secular Changes in Human GrowthThe epidemiologic transition affects more than disease and death rates; itseffects have also been observed in studies of child growth. During the pastcentury, many industrialized nations have shown several secular changes in
438 PART IV ■ Human Evolution
FIGURE 15.12
Changes in the death rate in New York City during the nineteenth and twentiethcenturies. (Source: Omran[1977:12]. Courtesy PopulationReference Bureau, Inc., Washington,D.C.)
50
Dea
ths
per 1
,000
pop
ulat
ion
19701800
Old city ofNew York
Former citiesof New York
and Brooklyn
Greater city ofNew York
40
30
20
10
19601950
19401930
19201910
19001890
18801870
18601850
18401830
18201810

Relethford: The Human Species: An Introduction to Biological Anthropology, 5/e
IV. Human Evolution 15. Human Biology and Culture Change
© The McGraw−Hill Companies, 2003
child growth. A secular change is simply a change in the pattern of growthacross generations.
Types of Secular Change Three basic secular changes have been observedover the past century: an increase in height, an increase in weight, and a de-crease in the age of sexual maturation. Children in many industrialized na-tions are taller and heavier today than children the same age a century or soago. Figure 15.13 shows the average distance curve for height of North Amer-ican males of European ancestry in 1880 and 1960. There is no noticeabledifference in body length at birth. Note, however, that at all postnatal agesthe 1960 males are consistently taller than the 1880 males. This difference ismost noticeable during adolescence. Comparison of distance curves for weightshows the same pattern.
Another secular change is a decrease in the age of maturation. This ismost apparent in a specific measure of human development—the age atmenarche, the age at which a female experiences her first menstrual period.Figure 15.14 plots the average age at menarche for the United States and sev-eral European industrial nations over time. The general trend is one of ear-lier biological maturation.
Causes of Secular Change The basic secular changes observed in industri-alized nations during the past century reflect environmental change. Thesechanges came too fast and were too pervasive to be due to genetic change;rather, environmental changes have enabled more people to reach their ge-netic potential for growth. These trends, however, should not be projectedindefinitely into the future. Some data suggest that the secular changes in
CHAPTER 15 ■ Human Biology and Culture Change 439
FIGURE 15.13
Secular change in EuropeanAmerican males in NorthAmerica. At all ages the malesliving in 1960 have greaterheight than those who lived in 1880. (Adapted from Growthand Development by Robert M.Malina, © 1975, publisher BurgessPublishing Company, Minneapolis,Minn. With permission from thepublisher)
180
Hei
ght (
cm)
50
20Age (years)
18161412108642B
160
140
120
100
80
60
19601880
170
150
130
110
90
70
secular change A change in the average pattern ofgrowth or development in a population over severalgenerations.
age at menarche The age atwhich a female experiencesher first menstrual period.
I I I I I I I

Relethford: The Human Species: An Introduction to Biological Anthropology, 5/e
IV. Human Evolution 15. Human Biology and Culture Change
© The McGraw−Hill Companies, 2003
height, weight, and age at menarche have slowed down or stopped in somecountries (Eveleth and Tanner 1990). Future environmental improvementscould enable more and more children to reach their genetic potential forgrowth, but we should not expect average heights of 8 feet or more in an-other hundred years!
Many environmental factors have been suggested as being responsiblefor these secular changes, including improved nutrition, reduction of child-hood infectious disease, improved availability of health care, improved standard of living, and reduction of family size. Many of these factors are in-terrelated, making precise identification of causes difficult. Malina (1979)notes that improved nutrition has often been cited as a primary cause of the observed secular changes. Though availability of nutritional intake has improved for many people, especially during infancy, Malina does notthink it is solely responsible for secular changes and argues that one of the most important factors was an improvement in health conditions re-sulting in the reduction in childhood infectious diseases. Thus, the epidemi-ologic transition appears to be related to secular changes in human growthas well.
Pollution and Human BiologyThe spread of industrialization has led to a dramatic increase in levels of airand water pollution on our planet. Exposure to such toxins was probablyrare for our species before widespread industrialization (Schell 1991). Aglance at any newspaper reveals the number of potential pollution-related
440 PART IV ■ Human Evolution
FIGURE 15.14
Secular change in age atmenarche (the age of a female’sfirst menstrual period) in theUnited States and severalEuropean countries. (Adaptedfrom Growth and Developmentby Robert M. Malina, © 1975,publisher Burgess PublishingCompany, Minneapolis, Minn. Withpermission from the publisher)
17.5
Age
at m
enar
che,
yea
rs
Year of menarche
17.0
16.5
16.0
15.5
15.0
14.5
14.0
13.5
13.0
1830
Norway
Germany
Finland
Denmark
U.K.
U.S.
Sweden
19101900
18901880
18701860
18501840
19601950
19401930
19201970
Relethford: The Human Species: An Introduction to Biological Anthropology, 5/e
IV. Human Evolution 15. Human Biology and Culture Change
© The McGraw−Hill Companies, 2003
problems that now plague humanity, including global warming, acid rain,and others. The biological impact of increased pollution is often discussedin terms of health problems such as cancer and asthma, but these are onlysome of the observed impacts. This section discusses two other effects of in-creased pollution.
Pollution and Human Growth Many potential health problems are de-tected by studying patterns of human growth because the pattern of humangrowth and development is very sensitive to environmental changes. Schell(1991) has reviewed a number of studies showing a link between environmen-tal pollution and human growth. Detrimental effects on human growth havebeen demonstrated or suggested for air pollution, lead poisoning, and expo-sure to toxic chemicals.
One of the most dramatic examples of pollution is the infamous case ofLove Canal, a community in New York State named after a canal that was usedin the 1940s and early 1950s as a dumping site for 19,000 tons of industrialchemicals. Several studies have shown a definite impact of living near LoveCanal on human growth. Some studies have focused on low birth weight (lessthan 2.5 kg), a useful measure of environmental stress and a risk factor for anumber of medical and behavioral problems. Vianna and Polan (1984) foundthat the rate of babies born with low birth weight was much higher in theneighborhood closest to the dumping; 12 percent of all births had low birthweight as compared with 7 percent for the remainder of upstate New York.The growth deficit continued through later years (Paigen et al. 1987). Chil-dren who had lived at least 75 percent of their lives in Love Canal were signif-icantly shorter than a control group. The Love Canal studies are just one ofmany examples showing the negative impact of environmental pollution onhuman growth (Schell 1991).
The Environmental Endocrine Hypothesis Industrialization has intro-duced many chemicals into our environment. Although much of the con-cern focuses on biomedical problems such as cancer and deficits in humangrowth, there is also growing concern about the potential effects of such chem-icals on our endocrine system (the organs and tissues of the body involved inhormone secretion). The environmental endocrine hypothesis proposes thatindustrial and agricultural chemicals act to mimic or obstruct hormone func-tion. According to this view, these chemicals are not simply foreign materialin our bodies but act to provide new instructions to our endocrine system,causing disruption of normal hormone function. There is vigorous debateover this hypothesis, which has suggested links with declining sperm quality,cognitive impairment (including Attention Deficit Disorder), and breast can-cer, among others (Krimsky 2000). As with many other environmental is-sues, such as global warming, there is continued debate over the magnitudeof effects, but it is also clear that the potential harm dictates continued study.The environmental endocrine hypothesis may provide another example ofthe potential biological costs of rapid cultural change.
CHAPTER 15 ■ Human Biology and Culture Change 441

Relethford: The Human Species: An Introduction to Biological Anthropology, 5/e
IV. Human Evolution 15. Human Biology and Culture Change
© The McGraw−Hill Companies, 2003
The Reemergence of Infectious DiseaseThe success in reducing infectious disease in developed nations during thefirst half of the twentieth century gave rise to an overly optimistic view thatall infectious diseases would be eliminated by the year 2000. Smallpox, oncea killer of millions, had been eliminated by 1977, and polio and tuberculosiswere close behind. This view is now known to be incorrect; despite our ef-forts, new infectious diseases are emerging, and old ones are coming back innew forms (Garrett 1994). A dramatic example occurred in May 1995 withthe outbreak of a frequently fatal disease, Ebola, in the Democratic Republicof the Congo (then known as Zaire) in Africa. Although the Ebola virus wasdiscovered only in 1976, previous epidemics had killed hundreds of people inZaire and Uganda (Cowley et al. 1995).
Emergent Infectious Disease This outbreak was not an isolated event. Thereare many other examples of emergent infectious diseases, newly evolveddiseases that have only appeared in the past few decades, including Legion-naire’s Disease, Korean hemorraghic fever, E. coli, Hantavirus, and HIV (Arme-lagos et al. 1996).
The emergence of new diseases shows the evolution of microorganisms,a process often exacerbated by environmental changes brought about byhuman populations. New environments are created by rapid deforestationand conversion of land for agriculture and industrialization. Conversion ofremote and isolated habitats provides the opportunity for previously raremicroorganisms to encounter the human species. Continued pollution canincrease the mutation rate of microorganisms in addition to interfering withecosystems. New forms of quick travel, such as jet planes, and internationalcommerce increase the amount of contact between human groups, enablingdiseases to spread quickly and to new populations, many of which have noprior immune experience. New technologies often lend themselves to theemergence of infectious diseases by creating new microenvironments con-ducive to bacterial spread. Air conditioning, for example, has been implicatedin the origin and spread of Legionnaire’s Disease. Cultural and environmen-tal changes have provided new opportunities for the evolution of microor-ganisms (Garrett 1994; Levins et al. 1994).
Reemergent Infectious Disease An additional problem is reemergent in-fectious diseases, which are infectious diseases that have evolved resistanceto antibiotics. Tuberculosis, for example, is a respiratory disease that hadbeen treated very successfully with antibiotics in the last half of the twenti-eth century, but tuberculosis rates began to increase in the 1980s and 1990s.Figure 15.15 shows tuberculosis rates in New York, a state hard hit by the in-crease in tuberculosis from 1984 through 1997. Tuberculosis rates increasedinto the mid-1990s due to a number of factors, including the outbreak ofantibiotic-resistant strains of the bacterium. Aggressive public health mea-
442 PART IV ■ Human Evolution
emergent infectiousdisease A newly identifiedinfectious disease that hasrecently evolved.
reemergent infectiousdisease Infectious diseasethat had previously beenreduced but that increasesin frequency whenmicroorganisms evolveresistance to antibiotics.
I I I I I I I

Relethford: The Human Species: An Introduction to Biological Anthropology, 5/e
IV. Human Evolution 15. Human Biology and Culture Change
© The McGraw−Hill Companies, 2003
sures have reversed this trend, but it remains a problem for many residentsand illustrates the danger of bacteria evolving resistance to antibiotics.
Antibiotic resistance illustrates the principle of natural selection appliedto disease-causing microorganisms. Sometimes a mutant form of bacteriaexists that has resistance to a specific antibiotic. Although most bacteria arekilled, the mutant form will multiply and become more common in successivegenerations of bacteria. Because bacteria have short life spans, an antibiotic-resistant form of bacteria can spread very quickly. The problem of reemer-gence of infectious diseases is linked to indiscriminate use of antibiotics fortreating illness in humans and the increasing use of antibiotics in animal feed(Armelagos et al. 1996). As these practices have increased, so have antibiotic-resistant forms of bacteria. This problem has required development of newantibiotics, which in turn lead to new forms of antibiotic resistance.
The problems of emergent and reemergent infectious diseases show usthat infectious disease is not gone, and is unlikely ever to be gone. We will al-ways have to deal with infectious disease, but the nature of this threat willchange over time as the microorganisms continue to evolve and as we con-tinue to change our environment. The continued struggle against infectiousdisease will require increased funding, global coordination, and a holistic ap-proach to cultural, environmental, and technological factors affecting thespread of infectious disease (Binder et al. 1999).
Demographic ChangeThe reduction in death rates and the increase in life expectancy throughoutmuch of the world have an obvious implication in terms of population growth.The natural increase of our species reflects the difference between the rate ofbirths and deaths. If death rates drop but birth rates remain the same, then
CHAPTER 15 ■ Human Biology and Culture Change 443
FIGURE 15.15
Tuberculosis rates (number ofcases per 100,000 residents) inNew York State from 1984 to1997. (Source of data: 1984–1993from New York State Department ofHealth Web page: <http://www.health.state.ny.us/nysdoh/epi/93/tb.pdf >;1994 rates from NYSDOH Web page:<http://www.health.state.ny.us/nysdoh/cdc/1994/section2.pdf >;1995 rates from NYSDOH Webpage: <http://www.health.state.ny.us/nysdoh/cdc/1995/rates95.pdf >;1996 rates from NYSDOH Webpage: <http://www.health.state.ny.us/nysdoh/cdc/1996/rates96.pdf >;1997 rates from NYSDOH Webpage: <http://www.health.state.ny.us/nysdoh/cdc/1997/rates1.pdf >)
30
25
Tube
rcul
osis
cas
es p
er 1
00,0
00 re
side
nts
10
Year
1994 19961990 1992198819861984
15
20

Relethford: The Human Species: An Introduction to Biological Anthropology, 5/e
IV. Human Evolution 15. Human Biology and Culture Change
© The McGraw−Hill Companies, 2003
a population will grow in size. This is what happened to our species during thetwentieth century, when the world population tripled in size from roughly 2 billion to 6 billion (Figure 15.16).
The Demographic Transition What led to such high rates of populationgrowth in our species and the variation in growth rates among nations today?As death rates dropped, there was a lag before birth rates also declined, re-sulting in a time of significant population growth. Observations on these de-mographic patterns in a number of European countries led to the develop-ment of demographic transition theory. The utility of this model to explainand predict demographic shifts in all human populations has been questioned(e.g., Cohen 1995), but it does provide a convenient summary of some basicdemographic trends.
Demographic transition theory states that as a population becomes moreeconomically developed, a reduction in death rates will take place first, fol-lowed by a reduction in fertility rates. Three stages are usually identified inthis model (Swedlund and Armelagos 1976). Stage 1 populations are those ofundeveloped areas with high mortality and high fertility rates. Because thehigh number of births is balanced by the high number of deaths, the overallpopulation size remains more or less stable. In Stage 2, the transitional stage,demographic and economic factors are changing rapidly and there is highfertility but lowered mortality. The transition to lowered mortality, especiallyin childhood, is a consequence of improvements in public health and med-ical technology. Because fertility rates remain high, there are more birthsthan deaths and the population grows quickly in size. Stage 3 populationshave completed the transition with a reduction in fertility rates. Because oftechnological, social, economic, and education changes, people in the more
444 PART IV ■ Human Evolution
FIGURE 15.16
World population growth overthe past 2,000 years. Rapidgrowth began after the eighteenth century. If you lookclosely, you will see a slight dipin world population sizeduring the fourteenth centurycorresponding to the BlackDeath pandemic. (Source of data: Livi-Bacci 1997)
7
4
5
6
Wor
ld p
opul
atio
n (b
illio
ns)
0
Year1500 200010005000
1
2
3
demographic transitiontheory A model ofdemographic change thatstates that as a populationbecomes economicallydeveloped, a reduction indeath rates (leading topopulation growth) willtake place, followed by areduction in birth rates.
I I I I I I I

Relethford: The Human Species: An Introduction to Biological Anthropology, 5/e
IV. Human Evolution 15. Human Biology and Culture Change
© The McGraw−Hill Companies, 2003
developed countries have more of a desire and opportunity to control familysize and the birth rate declines. Because the rates of both births and deathsare low, such populations tend to show little growth (ignoring migration).
The demographic transition model does describe the experience seen insome of the more developed countries today, but it has a number of prob-lems. Although it serves as a rough description of the types of changes thattend to take place as populations become more economically developed,there is considerable variation in the timing of these events, with some pop-ulations having less of a lag between falling death rates and falling birth ratesthan others. The model is less accurate in predicting the timing of fertilitydeclines, and the assumption that economic development must occur beforea decline in mortality rate does not fit all cases (Cohen 1995). There are alsocases of the basic trends reversing, such as in the United States in the twenti-eth century, when fertility rates declined at first and then increased rapidlyfor a short time following World War II before falling again.
World Population Growth Today there is a wide range of variation in therate of population growth. In 2001, the world numbered more than 6.1 bil-lion people and had a rate of natural increase of 1.3 percent per year. At thisrate, the world’s population would double in slightly more than 50 years. Themore developed countries make up roughly 19 percent of the world’s popu-lation and have low birth and death rates. Estimates made in mid-2001 showa very low annual rate of natural increase (births minus deaths) of 0.1 per-cent and total growth is expected to be only 4 percent by the year 2050. Theless developed countries, which currently make up 81 percent of the world’spopulation, have a rate of natural increase of 1.6 percent per year and are ex-pected to increase in total by 58 percent by the year 2050. There is variationwithin the less developed countries. For example, sub-Saharan Africa has arate of natural increase of 2.5 percent per year, whereas China has a rate of0.9 percent per year (Population Reference Bureau 2001). Some countries inEurope are actually declining in size (Bouvier and Bertrand 1999).
There are two critical and interrelated questions regarding the growth ofthe human species: (1) What will global population size be in the immediatefuture? and (2) How many people can the planet support? Estimates of fu-ture population size are difficult to make because the factors underlying pop-ulation growth continue to change. If rates were constant, prediction of fu-ture numbers would be a simple mathematical exercise. For example, given aworld population of 6.1 billion and assuming that the rate of growth observedin mid-2001 remains the same (1.3 percent per year), the expected size of thehuman species would be 11.5 billion in the year 2050 and 21.9 billion in theyear 2100. This estimate would be inaccurate, however, because it assumesthat the rate of growth will remain constant and that rates of the underlyingcomponents of growth (mortality and fertility) will remain constant. This isnot the case; analysis of recent global demographic trends shows that theglobal rate of population growth is slowing (Lutz et al. 1997). Indeed, the les-son from studies of the epidemiologic and demographic transitions is thatsuch rates have not stayed the same in recent times.
CHAPTER 15 ■ Human Biology and Culture Change 445

Relethford: The Human Species: An Introduction to Biological Anthropology, 5/e
IV. Human Evolution 15. Human Biology and Culture Change
© The McGraw−Hill Companies, 2003
Most models of demographic projection attempt to model likely changesin mortality and fertility rates, usually under a range of scenarios that assumethe eventual drop of fertility rates to replacement level, but at different rates.The United Nations, for example, projects between 8 billion and 11 billionpeople by the year 2050, with a midrange estimate of 9.4 billion (Bouvier andBertrand 1999). To deal with the rapidity and complexity of demographicchange, demographers refine these estimates as new data accumulate. Sev-eral major changes have occurred just in the past decade, including a notice-able reduction in the fertility rate of China and an increase in mortality dueto AIDS in sub-Saharan Africa (Bouvier and Bertrand 1999; U.S. Bureau ofthe Census 1999).
There seems to be some consensus that world population growth will even-tually stabilize, but there is less agreement about when this will occur. Demog-raphers have shifted from giving exact estimates to developing probability-based estimates. Wolfgang Lutz and colleagues (2001) estimate that there is
446
S P E C I A L T O P I C
The Baby BoomA classic example of how changing social and economicfactors affect population growth is the “Baby Boom” inthe history of the United States. At the beginning of thetwentieth century, fertility rates in the United States hadbegun to decline, as expected under a demographic tran-sition. In 1909, the fertility rate (the number of births per1,000 women of reproductive age, 15–44 years) was 127.By the end of World War II, this number had declined to 85 per 1,000. As shown in the figure, the fertility rateincreased dramatically after World War II, peaking at 123 in 1957, after which there was a subsequent decline.
This temporary increase in fertility is labeled theBaby Boom, a term for the generation of children bornbetween 1946 and 1964, a period of high fertility relativeto prewar years. Several social and economic factors ac-count for the Baby Boom. It was not simply that menreturning from the war made up for lost time with theirwives. Such an effect often accompanies the end of a war,but the Baby Boom lasted much longer. The economicgrowth of the United States continued to increase rapidlyfollowing World War II. As economic growth increases, sodoes the demand for labor. This demand is often met bynew immigrants in a population. In the United States,however, restrictive laws had reduced the number of im-migrants. The pool of available labor was also reduced bythe fact that there had been fewer births during the 1920sand 1930s, perhaps in part due to the Great Depression.
Thus, fewer men were available to meet the increaseddemand. Women tended to be locked out of many occu-pations because of sex bias. Though it is true that womentook the place of men in the workforce during the war,afterward the preference for women to remain at homeraising children prevailed.
The relative lack of available labor meant that youngmen returning from the war often had excellent opportu-nities for employment. A good income meant that mencould afford to marry and raise families earlier than theycould under poorer conditions. The economic conditionsprevailing after World War II meant that a couple couldhave several children without lowering their standard ofliving (Weeks 1981). People married earlier and the spac-ing between births was shorter than in previous times,both of which contributed to an increase in the birth rate.Of course, not everyone married or had larger families or even shared in economic growth. On average, however,these changes were sufficient to affect the birth rate, andtherefore the rate of population growth.
After 1958, the fertility rate in the United States beganto decline. By the mid-1960s, the Baby Boom was over.From this point on, changing economic conditions andgreater educational and economic opportunities contrib-uted to delayed marriage and childbirth, as well as thedesire for smaller families. By the mid-1980s, the fertilityrate had dropped to 65 per 1,000 and the average number

Relethford: The Human Species: An Introduction to Biological Anthropology, 5/e
IV. Human Evolution 15. Human Biology and Culture Change
© The McGraw−Hill Companies, 2003
an 85 percent chance that the population of the world will stop growing be-fore the end of this century.
The question of global carrying capacity, the number of people that theearth can support, is also complex. An answer must include a number of vari-ables that are difficult at best to estimate, including future economic, political,and technological changes. In addition, we also need to consider these fac-tors in relationship to a desired standard of living; the actual number wouldbe higher if we assume a level of bare subsistence, which is not desirable, ascompared with a higher standard of living (Bouvier and Bertrand 1999). JoelCohen (1995) reviewed the history of answers to the question of global carry-ing capacity and found a wide range. Most estimates range from 4 billion to16 billion, although some were as low as 1 billion. Cohen concludes that therange of likely values is dependent primarily on food and water supply. Amore recent paper by J. Kenneth Smail (1997) argues that the earth’s carry-ing capacity at an adequate to comfortable standard of living for all is in the
of children per couple was less than replacement (that is,fewer than 2 children per couple). Of course, the UnitedStates continues to grow in part because so many womenwere born during the Baby Boom (and in part due to im-migration). Even if the average number of children bornper woman is less than 2, the sheer number of womenwill continue to lead to population growth in the short
term. In fact, the total number of births in the UnitedStates rose starting in 1977 and peaked in 1990 (Gabriel1995). This short burst of births is often referred to as the“Baby Boomlet,” brought about by the fact that so manyof the original Baby Boomers were now in their child-bearing years. Thus, the Baby Boom continues to affectfertility levels and population growth a generation later.
Changes in fertility rate in theUnited States from 1909 to 1997.Fertility rate is the number of birthsper 1,000 women of reproductiveage (15–44 years). From the startof the twentieth century, the fertilityrate declined until the end of WorldWar II, at which point it increasedrapidly to give rise to the BabyBoom. (Source of data: 1909–1959 data
from the Centers for Disease Control
and Protection Web page: http://www.
cdc.gov/nchs/data/t1x0197.pdf; 1960–
1997 data from Ventura et al. 1999)
Year
Fert
ility
rat
e
190060
1920 1940 1960 1980 2000
140
120
100
80
447

Relethford: The Human Species: An Introduction to Biological Anthropology, 5/e
IV. Human Evolution 15. Human Biology and Culture Change
© The McGraw−Hill Companies, 2003
range of 2 billion to 3 billion. The lower estimates cited by Cohen and Smailare particularly troublesome because we have already exceeded them withmore than 6 billion humans alive at present. Smail (1997) also notes thatthis is an issue of primary importance: “Population stabilization and subse-quent reduction is the primary issue facing humanity; all other matters aresubordinate” (p. 190). World population is a critical variable for humanity’sfuture, and one that requires a coordinated effort across all societies.
Implications of Changing Age Structure The demographic transition ofdecreasing mortality and fertility rates affects not only the size of human pop-ulations but also their composition. A major effect of a transition is on theage structure of a population. Most demographic studies look at the numberof males and females in different age groups in a population—the age-sexstructure of a population. A device known as a population pyramid is thebest way to describe a population’s age-sex structure at a particular point intime. The population pyramid is a graph showing the actual numbers of bothsexes at different age groups, normally at five-year intervals (e.g., 0–4 years ofage, 5–9 years of age, and so forth).
The population pyramid looks different for the less developed and moredeveloped countries. Figure 15.17 shows the population pyramid of Chad, aless developed country in Africa. The bottom axis represents the number ofmales on the left and the number of females on the right. The vertical axis rep-
448 PART IV ■ Human Evolution
FIGURE 15.17
The age-sex structure of Chad, Africa, in 2000. (Sourceof data: U.S. Census BureauInternational Database Web page:<http://www.census.gov/ipc/www/idbpyr.html>)
Males
Age
FemalesPopulation size (hundred thousands)
0–4
5–9
10–14
15–19
20–24
25–29
30–34
35–39
40–44
45–49
50–54
55–59
60–64
65–69
70–74
75–79
80+
0 2 4 6 8 10246810
age-sex structure Thenumber of males andfemales in different agegroups of a population.
population pyramid Adiagram of the age-sexstructure of a population.
I I I I I I I

Relethford: The Human Species: An Introduction to Biological Anthropology, 5/e
IV. Human Evolution 15. Human Biology and Culture Change
© The McGraw−Hill Companies, 2003
resents different age groups, from 0–4 years of age at the bottom to 80+ yearsof age at the top. The population pyramid has a true pyramid shape, broad onthe bottom and tapering to a small point at the top. This picture shows graph-ically the age structure of the population. The largest segment of the societyis infants and young children. The older the age group, the fewer the num-ber of people, trailing to a relative handful after 80 years of age. This shape ischaracteristic of populations with relatively high birth and death rates. Thebroad base, corresponding to infants and young children, is a product ofhigh fertility. The other age groups are less numerous because of high deathrates, which limits the number of children living to increasingly older ages.
By contrast, Figure 15.18 shows the age-sex structure of the United States,one of the more developed countries. Excepting the oldest age groups, theshape of the graph looks more like a rectangle than a pyramid. This shape isconsistent with low birth and death rates. Fewer births mean a decreasingbase, and fewer deaths mean less of a decline in numbers with age. Note thatthere are more females than males among the elderly, reflecting the greaterlongevity of women. This figure also reflects the demographic history of theUnited States. There is a noticeable bulge in the graph corresponding to peo-ple in their mid-30s to late 40s. This is the Baby Boom generation discussedearlier; children born during the Baby Boom of 1946 to 1964 were between36 and 54 years of age in the year 2000. As this generation continues to age,this bulge will move upward on the population pyramid.
CHAPTER 15 ■ Human Biology and Culture Change 449
FIGURE 15.18
The age-sex structure of theUnited States in 2000. (Sourceof data: U.S. Census BureauInternational Database Web page:<http://www.census.gov/ipc/www/idbpyr.html>)
Males
Age
FemalesPopulation size (millions)
0–4
5–9
10–14
15–19
20–24
25–29
30–34
35–39
40–44
45–49
50–54
55–59
60–64
65–69
70–74
75–79
80+
0 5 10 1551015

Relethford: The Human Species: An Introduction to Biological Anthropology, 5/e
IV. Human Evolution 15. Human Biology and Culture Change
© The McGraw−Hill Companies, 2003
The age structure of a population will change over time depending onbirth and death rates of different age groups. By examining current birthand death rates and estimating likely changes in both over the short term,we can estimate the population pyramid for the near future. Figure 15.19shows the projected population pyramid for the United States in 2025. Theshape has become even more rectangular, and most of the Baby Boom gener-ation will be in their 70s.
By comparing Figures 15.17 and 15.18, we can see the impact of differentrates of mortality and fertility on the age structure of a population. A de-cline in both birth and death rates results in an aging population. As fewerpeople are born and as people live longer, the population pyramid of themore developed nations will continue to resemble a rectangle. The medianage of Chad is 16 years, meaning that half of the population is less than thisage, and only 3 percent of the population is 65 years or older. By compari-son, the median age of the United States is 36 years, and 13 percent of thepopulation is 65 or older. By the year 2025, this figure is expected to increaseto 19 percent.
We can expect many cultural changes to accompany such a shift to anolder population. Many of these shifts are apparent today in the UnitedStates. For example, if we assume current average ages for retirement, it isclear that there will be fewer people of working age in the future. Such a shiftmight be seen as having both advantages and disadvantages. A smaller laborpool might mean better economic opportunities for working-age people. On
450 PART IV ■ Human Evolution
FIGURE 15.19
The projected age-sex structureof the United States for theyear 2025. (Source of data: U.S. Census Bureau InternationalDatabase Web page: <http://www.census.gov/ipc/www/idbpyr.html>)
Males
Age
FemalesPopulation size (millions)
0–4
5–9
10–14
15–19
20–24
25–29
30–34
35–39
40–44
45–49
50–54
55–59
60–64
65–69
70–74
75–79
80+
0 5 10 1551015
Relethford: The Human Species: An Introduction to Biological Anthropology, 5/e
IV. Human Evolution 15. Human Biology and Culture Change
© The McGraw−Hill Companies, 2003
the other hand, we may also expect greater taxation to help provide for thewell-being of the retired portion of the population.
Many questions are being asked by those concerned with social and eco-nomic shifts. For example, how well will our Social Security system functionwhen more people are drawing from it? What changes need to be made in theinsurance industries? How can we provide adequate health and other care toan aging population?
Economic shifts can also be examined. Perhaps one of the best examplesof the effects of changing age structure is in our system of higher education.During the 1960s and early 1970s, as more and more Baby Boom childrenreached college age, the demand for colleges and universities increased. Thisdemand was accompanied by an increased desire for a college education, inpart because of a changing economy and the value of a college degree in earn-ing potential. As college enrollments increased, more schools were built, andmore faculty and staff were hired. By the mid-1970s, the effects of the BabyBoom were over and enrollments began to diminish at many institutions.How, then, can we afford to maintain our colleges? Increases in tuition andtaxes are remedies, but they are generally not very popular. Should schoolsbe closed? If so, what happens to the local economies, which are often highlydependent on these schools? What about the future? If we cut back on pro-grams now, will we need to start them up again in a few years?
These questions have no easy answers. Awareness of the problems andtheir connections to a variety of economic, social, and political factors is astart in the right direction. Today’s world is marked by an unusually highlevel of rapid change. A society’s successful integration of demographicchange requires analysis of current trends and, above all, a basic acknowledg-ment that, for good or ill, these changes are indeed taking place.
SUMMARY
The evolution of the human species continues through the present day. Al-though biological change continues in human populations, the rate of suchchange is most often exceeded by the rapid rate of cultural change. Duringthe past 12,000 years, the human species has changed from hunting andgathering to agriculture to feed itself, and the total size of the human specieshas increased roughly a thousandfold. These rapid cultural changes have af-fected aspects of human biology by affecting our patterns of health, physicalgrowth, nutrition, mortality, and fertility, among other factors. The transi-tion to agriculture was a major change in human adaptation, and the do-mestication of plants and animals provided the opportunity to maintainmuch larger populations, which in turn allowed the development of complexstate-level societies. Larger sedentary populations led to many epidemics ofinfectious disease. Although more food could be produced, many people inearly agricultural societies suffered from nutritional stress. Overall, life ex-pectancy did not increase with the origins of agriculture.
The subsequent rise of state-level societies with large urban populationswas accompanied by further epidemics and nutritional problems. Exploration,
CHAPTER 15 ■ Human Biology and Culture Change 451

Relethford: The Human Species: An Introduction to Biological Anthropology, 5/e
IV. Human Evolution 15. Human Biology and Culture Change
© The McGraw−Hill Companies, 2003
trade, and conquest resulted in contact between cultures that had been iso-lated previously, resulting in catastrophic epidemics and social upheaval. Bythe end of the nineteenth century, modernization had begun the epidemio-logic transition, where improvements in public health and civil engineering,later supplemented by improvements in medical science, led to a reductionin deaths from infectious diseases and a dramatic increase in life expectancyat birth.
As people lived longer on average, the death rate due to noninfectiousdegenerative diseases increased. In the more developed countries, childrenmature faster and grow larger because of changes in disease and diet. In re-cent decades, evidence has shown a resurgence in infectious diseases, in partdue to the evolution of new diseases and in part due to the reemergence ofdiseases as microorganisms evolve resistance to antibiotics. The world’s pop-ulation tripled in size during the twentieth century as death rates declined.Many populations have since seen a reduction in fertility rates, such that therate of population growth has declined somewhat. Even given this trend,most projections suggest a global population of roughly 9 billion by the mid-dle of the twenty-first century. Another consequence of recent demographicchange is the changing age structure of the more developed countries. Asbirth rates decline and people live longer, populations become older on aver-age. All of these demographic changes are interrelated with many contempo-rary social, economic, and political problems.
SUPPLEMENTAL READINGS
Bouvier, L. F., and J. T. Bertrand. 1999. World Population: Challenges for the 21st Century.Santa Ana, Calif.: Seven Locks Press. A thorough discussion of contemporary demo-graphic trends focusing on social, political, and economic responses to world popula-tion growth.
Cohen, J. E. 1995. How Many People Can the Earth Support? New York: W. W. Norton. A com-prehensive and fascinating discussion of the demographic history of the humanspecies, population projection, and the question of global carrying capacity.
Howell, N. 2000. Demography of the Dobe !Kung, 2d ed. New York: Aldine de Gruyter. An ex-tensive description of the demography of a hunting-gathering society focusing onmortality and fertility.
Larsen, C. S. 2000. Skeletons in Our Closet: Revealing our Past through Bioarchaeology. Prince-ton: Princeton University Press. A detailed survey of the field of paleopathology andwhat it can tell us about disease and life in prehistoric times, focusing on the transi-tion to agriculture and culture contact among prehistoric Native Americans.
452 PART IV ■ Human Evolution
Relethford: The Human Species: An Introduction to Biological Anthropology, 5/e
IV. Human Evolution 15. Human Biology and Culture Change
© The McGraw−Hill Companies, 2003
INTERNET RESOURCES
http://www.cdc.govCenters for Disease Control and Prevention (CDC), the main Web page of thisgovernment organization, which includes a wide range of statistical data andother information on health and disease in the United States.
http://www.who.int/disease-outbreak-newsDisease Outbreak News, containing up-to-date news about recent outbreaksof infectious diseases around the world.
http://www.who.int/home-pageWorld Health Organization, the main Web page of this international organi-zation, which includes a wide range of statistical data and other informationon health and disease worldwide.
http://www.census.govU.S. Census Bureau, the official Web page of the United State Bureau of theCensus, containing a wealth of demographic data on the United States. Thissite also includes links to an international database.
http://www.prb.orgPopulation Reference Bureau, containing comparative data from around theworld on health, disease, and demography.
CHAPTER 15 ■ Human Biology and Culture Change 453

Relethford: The Human Species: An Introduction to Biological Anthropology, 5/e
IV. Human Evolution Epilogue: The Future of Our Species
© The McGraw−Hill Companies, 2003
E P I L O G U E
455
This book has focused on human biological variation and evolution, pastand present. What about the future? Can biological anthropology, or indeedany science, make predictions about the future of our species? What possibledirections will our biological and cultural evolution take?
One thing is certain—we continue to evolve both biologically and cultur-ally and will do so in the future. Human evolution is increasingly complexbecause of our biocultural nature. Much of our adaptive nature is culturallybased. We can adapt to a situation more quickly through cultural evolutionthan through biological evolution. Theoretically, we can also direct our cul-tural evolution. We can focus our efforts on solutions to specific problems,such as finding a vaccine for AIDS or developing ways to further reduce den-tal decay. Biological evolution, however, has no inherent direction. Naturalselection works on existing variation, not on what we might desire or need.
Our success with cultural adaptations should not lead us to concludethat we do not continue to evolve biologically. Regardless of our triumphs inthe field of medicine, many incurable diseases still carry on the process ofnatural selection. Biological variation still takes place in potential and real-ized fertility. Perhaps as many as a third to half of all human conceptions failto produce live births. We still live in a world in which up to 50 percent ofthe children have an inadequate diet. Even if all inhabitants of the world wereraised to an adequate standard of living tomorrow, we would still be subjectto natural selection and biological evolution. The fact that we are culturalorganisms does not detract from the fact that we are also biological organ-isms. Scholars in various fields throughout history have argued about whetherhumans and human behavior should be studied biologically, as products ofnature, or culturally, as products of nurture. Both sides were wrong. Humansmust be studied as both biological and cultural organisms.
The Future of Our Species

Relethford: The Human Species: An Introduction to Biological Anthropology, 5/e
IV. Human Evolution Epilogue: The Future of Our Species
© The McGraw−Hill Companies, 2003
Given that we will continue to evolve, how will we evolve? This questioncannot be answered. Evolution has many random elements that cannot bepredicted. Also, the biocultural nature of humans makes prediction evenharder. The incredible rate of cultural and technological change in the pastcentury was not predicted. What kinds of cultural evolution are possible inthe next hundred years? We may be able to forecast some short-term changes,but we know nothing about the cultural capabilities of our species hundredsor thousands of years in the future.
Another problem is that our own viewpoint can influence our predic-tions. An optimistic view might focus on the success of past cultural adapta-tions and the rate of acquisition of knowledge and then develop a scenarioincluding increased standard of living for all, cheap energy sources, and anelevated life expectancy. A pessimistic view might consider all the horrors ofthe past and present and project a grim future. A pessimist might envisagewidespread famine, overcrowding, pollution, disease, and warfare. Most likely,any possible future will be neither pie-in-the-sky nor doom but a combina-tion of positive and negative changes. If the study of evolution tells us onething, it is that every change has potential costs and benefits. We need to tem-per our optimism and pessimism with a sense of balance.
In any consideration of the future, we must acknowledge change as basicto life. Many people find it tempting to suggest we would be better off livinga “simpler” life. Others argue that we should stop trying to deal with ourproblems and let nature take its course or that we should trust in the acts ofGod. This is unacceptable—indeed our understanding of human evolutionargues for the reverse. Our adaptive pattern has been one of learning andproblem solving. More than that, this is our primate heritage. Our biologyhas allowed us to develop the basic mammalian patterns of learned behaviorto a high degree. We have the capability for rational thought, for reason, andfor learning. Even if many of our cultural inventions have led to sufferingand pain, our potential for good is immense. In any case, we must continuealong the path of learning and intelligence; it is our very nature. Good or bad,the capabilities of the human mind and spirit may be infinite.
456 EPILOGUE ■ The Future of Our Species

Relethford: The Human Species: An Introduction to Biological Anthropology, 5/e
Appendixes 1. Mathematical Population Genetics
© The McGraw−Hill Companies, 2003
457
Population genetics was discussed in Chapter 3 with a minimum of mathe-matical formulae. This appendix is intended for those wishing to obtain anelementary understanding of the mathematical basis of population genetics.Additional sources, such as Hartl and Clark (1997), are recommended forfurther information.
The formulae presented here are limited to a simple genetic case—a singlelocus with two possible alleles, A and a. Following convention, the symbol pis used to denote the frequency of the A allele, and the symbol q is used to denote the frequency of the a allele. Because there are only two alleles, p � q � 1. For this simple case, there are three genotypes: AA, Aa, and aa.
HARDY-WEINBERG EQUILIBRIUM
The Hardy-Weinberg equilibrium model, discussed briefly in Chapter 3,states that: (1) under random mating, the expected genotype frequencies areAA � p2, Aa � 2pq, and aa � q2, and (2) under certain conditions, the allelefrequencies p and q will remain constant from one generation to the next.
There are a number of ways to demonstrate the first conclusion of theHardy-Weinberg model. Perhaps the simplest proof rests on the fact that p and q represent probabilities. If the frequency of the A allele is p, then theprobability of drawing an A allele from the entire gene pool is equal to p. Toobtain the AA genotype in the next generation, it is necessary to have an A allele from both parents. Assuming that the allele frequencies are the samein both sexes, the probability of getting an A allele from one parent is p andthe probability of getting an A allele from the other parent is also p. The
A P P E N D I X 1MathematicalPopulation Genetics

Relethford: The Human Species: An Introduction to Biological Anthropology, 5/e
Appendixes 1. Mathematical Population Genetics
© The McGraw−Hill Companies, 2003
probability of both these events happening is the product of these probabili-ties, or p � p � p2. The same method can be used to determine the probabil-ity of getting the aa genotype (q � q � q2).
Getting an Aa genotype in the next generation requires one parent con-tributing the A allele (probability � p) and the other parent contributing thea allele (probability � q). The joint probability is p � q � pq. It is also possi-ble, however, that the order may be reversed. The first parent could con-tribute the a allele, and the second parent could contribute the A allele. Thejoint probability of this happening is also equal to pq. The overall probabilityof having the Aa genotype is therefore pq � pq � 2pq.
The reasoning behind the Hardy-Weinberg model is summarized as follows:
Allele from Parent
Genotype of Child 1 2 Probability
AA A A p � p � p2
Aa A a p � q � pqor � pq � pq � 2pq
a A q � p � pqaa a a q � q � q2
Also note that the sum of genotype frequencies (p2 � 2pq � q2) is equal to 1.The second part of the Hardy-Weinberg model states that in the absence
of evolutionary forces the allele frequencies will remain the same from onegeneration to the next. This may be easily demonstrated by using the geno-type frequencies in a given generation to predict the allele frequencies in thenext generations. Allele frequencies are easily derived from genotype frequen-cies. In the present example, the frequency of allele A is computed as the fre-quency of genotype AA plus half the frequency of genotype Aa (we only wishto count the A alleles that make up half the total number of alleles in het-erozygotes). The frequency of the A allele in the next generation, designatedp′, is therefore equal to
p′ � frequency of AA � (frequency of Aa/2)
which is equal to
p′ � p2 � �2
2
pq�
The 2s cancel out, giving
p′ � p2 � pq
Factoring p from the equation gives
p′ � p(p � q)
Now, because the quantity ( p � q) is equal to 1 by definition, the equationbecomes
p′ � p
458 APPENDIX 1 ■ Mathematical Population Genetics

Relethford: The Human Species: An Introduction to Biological Anthropology, 5/e
Appendixes 1. Mathematical Population Genetics
© The McGraw−Hill Companies, 2003
The fact that the allele frequency in the next generation ( p′) is equal to theinitial allele frequency ( p) shows that given certain assumptions there will beno change in the allele frequency over time. Therefore, when we do see achange in allele frequency over time, we know that one of the assumptions ofthe Hardy-Weinberg model has been violated. Because the model assumes noevolution has taken place, the fact that the model does not fit means this as-sumption is incorrect and, therefore, that a change in allele frequency (evolu-tion) has taken place.
INBREEDING
Inbreeding does not change allele frequencies, but it does change genotypefrequencies. The genotype frequencies predicted by Hardy-Weinberg requirethe assumption that mating is random and that there is no inbreeding. Theinbreeding coefficient, F, is a measure of the probability that a homozygousgenotype is the result of common ancestry of the parents. For example, theinbreeding coefficient for offspring born to first cousins is F � 0.0625. Thisvalue indicates the additional probability of the child having a homozygousgenotype because the parents were first cousins. Inbreeding coefficients aremost often computed from genealogical data, although with certain assump-tions they may also be estimated from frequencies of last names and from al-lele frequencies (in certain cases).
At the populational level, there is also a probability of having a homozy-gous genotype due to random mating ( p2 or q2, depending on the genotype).Inbreeding increases this probability. Under inbreeding, the genotype fre-quencies are
AA: p2 � pqFAa: 2pq (1 � F )aa: q2 � pqF
Thus, inbreeding increases the frequency of homozygotes (AA and aa) anddecreases the frequency of heterozygotes. As an example, consider a popula-tion where p � 0.5 and q � 0.5. Under random mating (F � 0), the genotypefrequencies are AA � 0.25, Aa � 0.50, and aa � 0.25. If the population hadan inbreeding coefficient of F � 0.05, these frequencies would be AA �0.2625, Aa � 0.4750, and aa � 0.2625.
It is easy to see why inbreeding does not change allele frequencies. Giventhe genotype frequencies expected under inbreeding, we can compute thefrequency of the A allele in the next generation as
p′ � frequency of AA � �frequency of �A
2
a��
Substituting the formulae for AA and Aa given earlier, this equation becomes
p′ � p2 � pqF � �2pq(1
2
� F )�
APPENDIX 1 ■ Mathematical Population Genetics 459
Relethford: The Human Species: An Introduction to Biological Anthropology, 5/e
Appendixes 1. Mathematical Population Genetics
© The McGraw−Hill Companies, 2003
The 2s in the equation cancel out. When the remaining terms are multipliedout, the equation becomes
p′ � p2 � pqF � pq � pqF
After subtracting pqF from pqF, the equation then becomes
p′ � p2 � pq
Factoring the p in the equation gives
p′ � p( p � q)
Because p � q � 1, the allele frequency in the next generation is
p′ � p
Thus, the allele frequency does not change from one generation to the nextunder inbreeding.
MUTATION
Mutation involves the change from one allele into another. For the simplecase given here, let us assume that allele a is the mutant form. The mutationrate, usually denoted as u, is the proportion of A alleles that mutates into a alleles in a single generation. The value u therefore represents the probabil-ity of any A allele mutating into the a allele. Models also exist to deal withbackward mutation (a into A), but these are not presented here because therate of back mutations is usually very low.
How can mutation change the allele frequency in a population over time?To answer that, assume that mutation is the only force acting to change al-lele frequencies. The frequency of allele a in the next generation (q′) dependson the current frequency of a alleles (q), the frequency of A alleles that havenot mutated ( p � 1 � q), and the rate of mutation (u). The frequency of thea allele in the next generation, q′, is therefore equal to
q′ � q � u(1 � q)
The first part of this equation represents the initial frequency of a alleles (q),and the second part represents the expected increase in a alleles due to mu-tation of A alleles.
As an example, assume that the initial allele frequencies are p � 1.0 andq � 0.0 and that the mutation rate is u � 0.0001. The allele frequencies inthe next generation are
q′ � 0 � 0.0001(1 � 0)� 0.0001
p′ � 1 � q′ � 0.9999
460 APPENDIX 1 ■ Mathematical Population Genetics

Relethford: The Human Species: An Introduction to Biological Anthropology, 5/e
Appendixes 1. Mathematical Population Genetics
© The McGraw−Hill Companies, 2003
If we carry this to an additional generation, the allele frequencies in the sec-ond generation (q′ and p′) are
q″ � 0.0001 � 0.0001(1 � 0.0001)� 0.0001 � 0.00009999� 0.00019999
p″ � 1 � q″ � 0.9980001
Continued mutation, in the absence of any other evolutionary forces, willlead to an increase in q and a decrease in p. For example, after 50 generationsof mutation the allele frequencies in the example here are p � 0.99501223and q � 0.00498777.
The mutation model presented here is simplified and does not take intoconsideration back mutation, changes in mutation rates over time, or any ofthe other evolutionary forces. It does, however, illustrate how mutation willlead to a cumulative increase in the frequency of the mutant allele. These ex-amples also show that such increases are relatively low, even over many gen-erations. Of course, evolution is not caused only by mutation. Other evolu-tionary forces act to increase, or decrease, the allele frequencies.
NATURAL SELECTION
Natural selection is modeled mathematically by assigning a fitness value toeach genotype. Fitness is defined as the probability that an individual willsurvive to reproductive age. The actual proportion of individuals surviving isknown as absolute fitness. Mathematically, the effects of natural selection areeasier to model if relative fitness is used; here the absolute fitness values areconverted such that the largest relative fitness equals 1.
As an example, consider absolute fitness values of AA � 0.8, Aa � 0.8,and aa � 0.4. These numbers mean that 80 percent of those with the AA geno-type survived, 80 percent of those with the Aa genotype survived, and 40 per-cent of those with the aa genotype survived. Because the largest absolute fit-ness is 0.8, relative fitness values are obtained by dividing each fitness by 0.8.Thus, the relative fitness values are AA � 1.0, Aa � 1.0, and aa � 0.5. Thegenotype aa has a fitness value of 0.5 relative to the most fit genotypes (AAand Aa). As another example, consider the following absolute fitness values:AA � 0.7, Aa � 0.9, and aa � 0.3. The relative fitness values are AA � 0.7/0.9 �0.778, Aa � 0.9/0.9 � 1.0, and aa � 0.3/0.9 � 0.333.
The symbol w is used to designate relative fitness. Here wAA is the relativefitness of genotype AA, wAa is the relative fitness of genotype Aa, and waa isthe relative fitness of genotype aa. The effect of natural selection can now bedetermined by looking at the genotype frequencies before and after selec-tion. The genotype frequencies before selection are obtained from the Hardy-Weinberg model: AA � p2, Aa � 2pq, and aa � q2. The genotype frequenciesafter selection are obtained by multiplying the genotype frequencies before
APPENDIX 1 ■ Mathematical Population Genetics 461

Relethford: The Human Species: An Introduction to Biological Anthropology, 5/e
Appendixes 1. Mathematical Population Genetics
© The McGraw−Hill Companies, 2003
selection by the respective relative fitness values. After selection, the genotypefrequencies are therefore
AA � wAA p2
Aa � 2wAa pqaa � waaq2
The frequency of the A allele after selection is then computed by addingthe frequency of genotype AA to half the frequency of genotype Aa and divid-ing this figure by the sum of all genotype frequencies after selection. That is,
p′ � (wAA p2 � (2wAa pq/2)) / (wAA p2 � 2wAa pq � waaq2)� (wAA p2 � wAa pq) / (wAA p2 � 2wAa pq � waaq2)
As an example, consider a population with initial allele frequencies of p � 0.8 and q � 0.2. Assume relative fitness values for each genotype as AA �1.0, Aa � 1.0, and aa � 0.5. In this example, there is partial selection againstthe homozygous genotype aa. Logically, we expect that such selection willlead to a reduction in the frequency of the a allele and an increase in the fre-quency of the A allele.
Using Hardy-Weinberg, the expected genotype frequencies before selec-tion are
AA: p2 � (0.8)2 � 0.64Aa: 2pq � 2(0.8)(0.2) � 0.32aa: q2 � (0.2)2 � 0.04
Using the relative fitness values, the relative proportion of each genotype afterselection is
AA: wAA p2 � (1)(0.8)2 � 0.64Aa: 2wAa pq � 2(1)(0.8)(0.2) � 0.32aa: waaq2 � (0.5)(0.2)2 � 0.02
The frequency of the A allele after selection is computed as
p′ � (0.64 � (0.32/2)) / (0.64 � 0.32 � 0.02)� (0.64 � 0.16) / (0.64 � 0.32 � 0.02)� 0.8 / 0.98� 0.8163
Also, the frequency of the a allele after selection is
q′ � 1 � p′ � 0.1837
The entire process can be repeated for additional generations. To extend theanalysis another generation, use the new values of p � 0.8163 and q � 0.1837.After an additional generation of selection, the allele frequencies will be p �
462 APPENDIX 1 ■ Mathematical Population Genetics

Relethford: The Human Species: An Introduction to Biological Anthropology, 5/e
Appendixes 1. Mathematical Population Genetics
© The McGraw−Hill Companies, 2003
0.8303 and q � 0.1697. If you continue this process, the frequency of A keepsincreasing and the frequency of a keeps decreasing.
Some forms of natural selection can be represented using simplified for-mulae. For example, complete selection against recessive homozygotes in-volves relative fitness values of AA � 1.0, Aa � 1.0, and aa � 0.0. Given thesevalues, the frequency of the A allele after one generation of selection is
p′ � (wAA p2 � wAa pq) / (wAA p2 � 2wAa pq � waaq2)� ((1)p2 � (1)pq) / ((1)p2 � 2(1)pq � (0)q2)� ( p2 � pq) / ( p2 � 2pq)� ( p( p � q)) / ( p( p � q � q))� ( p � q) / ( p � q � q)� 1 / (1 � q)� 1 / (1 � (1 � p))� 1 / (2 � p)
which is a much easier formula to work with. Other forms of natural selec-tion also have simplified formulae and are listed in the references given atthe beginning of this appendix.
As an example, assume initial frequencies of p � 0.5 and q � 0.5. Thefrequency of the A allele in the next five generations of natural selectionwould be 0.6667, 0.7500, 0.8000, 0.8333, and 0.8571.
GENETIC DRIFT
The process of genetic drift is random. As a result, we cannot predict theexact allele frequencies resulting from a generation of genetic drift. We can,however, describe the probability of obtaining a given allele frequency causedby genetic drift. For example, assume a population of six people (and hence12 alleles at each locus) with initial allele frequencies of p � 0.5 and q � 0.5.A generation of genetic drift could result in the frequency of the A allele rang-ing from 0/12 � 0.0 to 12/12 � 1.0. Other possible allele frequency valuesare 1/12 � 0.083, 2/12 � 0.167, 3/12 � 0.250, 4/12 � 0.333, 5/12 � 0.417,6/12 � 0.500, 7/12 � 0.583, 8/12 � 0.667, 9/12 � 0.750, 10/12 � 0.833,11/12 � 0.917.
The frequency of the A allele depends on how many A alleles are repre-sented in the next generation (which can range from 0 to 12). Because geneticdrift is a random process, we cannot tell how many A alleles will be representedin the next generation. We can, however, compute the probability of each ofthese events occurring. We would expect, for example, that getting 6 A allelesis more likely than getting 12 A alleles (just as we would expect it to be morelikely that we get 6 heads rather than 12 heads or 1 if we flipped a coin 12 times).The exact formula used is a bit complex and is not presented here (see Hartl1988:70). Using this formula, the probability of getting 6 A alleles in the nextgeneration (and an allele frequency of 6/12 � 0.5) is 0.223. Therefore, the
APPENDIX 1 ■ Mathematical Population Genetics 463
Relethford: The Human Species: An Introduction to Biological Anthropology, 5/e
Appendixes 1. Mathematical Population Genetics
© The McGraw−Hill Companies, 2003
probability of getting some change in the allele frequency (some number otherthan 6 A alleles) is 1 � 0.223 � 0.777. Mathematical investigation also showsthat smaller populations are more likely to experience genetic drift thanlarger populations.
GENE FLOW
The process of gene flow is best described mathematically by considering al-lele frequencies in two populations, 1 and 2. The allele frequencies of popu-lation 1 are denoted p1 and q1, and the allele frequencies of population 2 aredenoted p2 and q2. What happens when gene flow takes place between thesetwo populations? Assume that populations 1 and 2 mix together at rate m.The term m is a measure of the proportion of migrants moving from one pop-ulation into the other. For simplicity, further assume that the rate of migra-tion from population 1 into population 2 is the same as the rate of migrationfrom population 2 into population 1.
The frequency of the A allele in population 1 after one generation of geneflow is then expressed as
(1 � m)p1 � mp2
The first part of the right-hand side of the equation shows the contributionto allele frequency from the proportion of individuals who stayed in popula-tion 1 (1 � m). The second part of the right-hand side of the equation showsthe contribution to allele frequency caused by the proportion of individualsmigrating from population 2 (m). Likewise, the frequency of allele A in pop-ulation 2 after one generation of gene flow is
mp1 � (1 � m)p2
As an example, assume initial allele frequencies in population 1 are p1 �0.7 and q1 � 0.3 and that initial allele frequencies in population 2 are p2 �0.2 and q2 � 0.8. Further assume a rate of gene flow of m � 0.3. After onegeneration of gene flow, the frequencies of the A allele are
(1 � 0.3)(0.7) � (0.3)(0.2) � 0.49 � 0.06 � 0.55
for population 1, and
(0.3)(0.7) � (1 � 0.3)(0.2) � 0.21 � 0.14 � 0.35
for population 2. Thus, the frequency of the A allele has made populations 1and 2 more similar as a result of gene flow. An additional generation of geneflow at the same rate would result in allele frequencies of
(1 � 0.3)(0.55) � (0.3)(0.35) � 0.385 � 0.105 � 0.49
for population 1, and
(0.3)(0.55) � (1 � 0.3)(0.35) � 0.165 � 0.245 � 0.41
464 APPENDIX 1 ■ Mathematical Population Genetics

Relethford: The Human Species: An Introduction to Biological Anthropology, 5/e
Appendixes 1. Mathematical Population Genetics
© The McGraw−Hill Companies, 2003
for population 2. The two populations continue to become more similar ge-netically. Another generation of gene flow would result in allele frequenciesof 0.466 for population 1 and 0.434 for population 2. After only a few moregenerations of gene flow, the allele frequencies of the two populations wouldbe essentially equal.
SummaryThe formulae presented here represent a simplified view of mathematical pop-ulation genetics. Each model ignores the effects of other evolutionary forces,although they can easily be extended to consider simultaneous effects. Thesemodels also deal only with a simple situation of one locus with two alleles.More complicated analyses require more sophisticated mathematical meth-ods that are best performed on a computer. Nonetheless, these formulae dodemonstrate the basic nuts and bolts of population genetic theory.
APPENDIX 1 ■ Mathematical Population Genetics 465

Relethford: The Human Species: An Introduction to Biological Anthropology, 5/e
Appendixes 2. Classification of Living Primates
© The McGraw−Hill Companies, 2003
466
A P P E N D I X 2Classification of Living Primates
The chart that begins on the next page lists representatives of all living pri-mate groups. This classification is fairly “traditional” and was taken fromCiochon and Nisbett (1998), with additional examples of common namesfrom Fleagle (1999). As discussed in Chapter 8, there are alternative classifi-cations, most notably the strepsirhine-haplorhine subdivision (rather thanprosimian-anthropoid). There are also alternative classifications of the hom-inoids that reflect the greater genetic and evolutionary similarity of Africanapes with humans rather than with the orangutan.

Relethford: The Human Species: An Introduction to Biological Anthropology, 5/e
Appendixes 2. Classification of Living Primates
© The McGraw−Hill Companies, 2003
APPENDIX 2 ■ Classification of Living Primates 467
Order: Primates Suborder: Anthropoidea
Number Number Common Infraorder Superfamily Family Subfamily of Genera of Species Name(s)
Platyrrhini Ceboidea Atelidae Atelinae 4 13 Howler monkeySpider monkey
Pitheciinae 3 9 SakiUakari
Callitrichidae Callitrichinae 5 22 MarmosetTamarin
Cebidae Aotinae 2 4 Owl monkeyTiti
Cebinae 2 5 Capuchin Squirrel monkey
Order: Primates Suborder: Prosimii
Number Number Common Infraorder Superfamily Family Subfamily of Genera of Species Name(s)
Lemuriformes Lemuroidea Daubentoniidae 1 1 Aye-ayeIndriidae 3 4 Indriid
SifakaLemuridae 3 10 LemurLepilemuridae 1 1 Sportive lemur
Lorisoidea Cheirogaleidae 5 7 Dwarf lemurMouse lemur
Galagidae 4 11 Bush babyLorisidae 4 5 Potto
Slender lorisSlow loris
Tarsiiformes Tarsioidea Tarsiidae 1 4 Tarsier

Relethford: The Human Species: An Introduction to Biological Anthropology, 5/e
Appendixes 2. Classification of Living Primates
© The McGraw−Hill Companies, 2003
468 APPENDIX 2 ■ Classification of Living Primates
Order: Primates Suborder: Anthropoidea
Number Number Common Infraorder Superfamily Family Subfamily of Genera of Species Name(s)
Catarrhini Cercopithecoidea Cercopithecidae Cercopithecinae 9 53 BaboonGelada baboonGuenonMacaqueMandrillMangabeyPatas
Colobinae 9 28 ColobusLangur
Hominoidea Hylobatidae 1 9 GibbonPongidae 3 4 Bonobo
ChimpanzeeGorillaOrangutan
Hominidae 1 1 Human

Relethford: The Human Species: An Introduction to Biological Anthropology, 5/e
Appendixes 3. Conversion Factors © The McGraw−Hill Companies, 2003
469
A P P E N D I X 3Conversion Factors
Conversion Factors for Common Measures Used in the Text
To Convert Into Multiply By
Centimeters Inches 0.3937Cubic centimeters Cubic inches 0.06102Cubic inches Cubic centimeters 16.39Feet Meters 0.3048Grams Ounces 0.03527Inches Centimeters 2.54Inches Millimeters 25.4Kilograms Pounds 2.205Kilometers Miles 0.6214Kilometers Yards 1,094Meters Feet 3.281Meters Yards 1.094Miles Kilometers 1.609Millimeters Inches 0.03937Ounces Grams 28.349527Pounds Kilograms 0.4536Yards Kilometers 9.144 × 10⁻⁴
Yards Meters 0.9144
Temperature conversion:From Celsius to Fahrenheit: (C° × 1.8) + 32From Fahrenheit to Celsius: (F° − 32) / 1.8
Source: Frisancho (1993)

Relethford: The Human Species: An Introduction to Biological Anthropology, 5/e
Appendixes 4. Comparative Primate Skeletal Anatomy
© The McGraw−Hill Companies, 2003
470
A P P E N D I X 4Comparative PrimateSkeletal Anatomy
This appendix provides a general background in comparative primate anatomyby showing the skeletons of three primates—a modern human, an ape (go-rilla), and an Old World monkey (baboon). In addition to noting the differ-ences between these species, you should also note the similarities, particu-larly in terms of the homology of the skeletons (see Chapter 8 for a review ofthe principle of homology).

Relethford: The Human Species: An Introduction to Biological Anthropology, 5/e
Appendixes 4. Comparative Primate Skeletal Anatomy
© The McGraw−Hill Companies, 2003
APPENDIX 4 ■ Comparative Primate Skeletal Anatomy 471
FIGURE 1
The human skeleton is madeup of 206 bones on average(not all of which are shownhere). Of these, 29 bones arefound in the crania, 27 arefound in each hand, and 26 are found in each foot. Note thehomology between the humanskeleton and the skeleton of the gorilla (Figure 2) and the baboon (Figure 3). Alsonote differences in certainanatomical structures, such asthe pelvis, that reflect humanbipedalism (discussed inChapter 10).
Cranial bones
Facial bones
MandibleClavicle
Sternum
Ribs
VertebraeSacrum
Femur
Patella
Tibia
Fibula
Scapula
Humerus
UlnaRadiusCarpals
MetacarpalsPhalanges
Tarsals
Metatarsals
Phalanges
Innominates
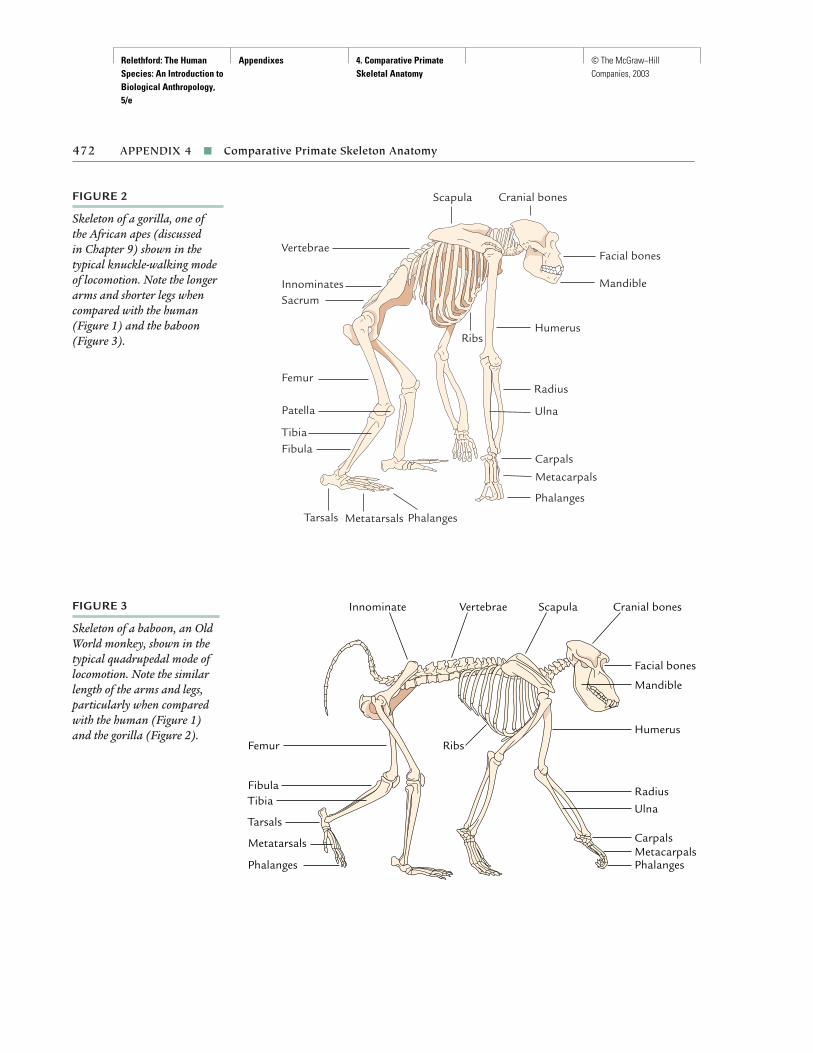
Relethford: The Human Species: An Introduction to Biological Anthropology, 5/e
Appendixes 4. Comparative Primate Skeletal Anatomy
© The McGraw−Hill Companies, 2003
472 APPENDIX 4 ■ Comparative Primate Skeleton Anatomy
FIGURE 2
Skeleton of a gorilla, one of the African apes (discussed in Chapter 9) shown in thetypical knuckle-walking modeof locomotion. Note the longerarms and shorter legs whencompared with the human(Figure 1) and the baboon(Figure 3).
Cranial bones
Facial bones
Mandible
Ribs
Vertebrae
SacrumInnominates
Femur
Patella
TibiaFibula
Scapula
Humerus
Ulna
Radius
Carpals
Metacarpals
Phalanges
Tarsals Metatarsals Phalanges
FIGURE 3
Skeleton of a baboon, an OldWorld monkey, shown in thetypical quadrupedal mode oflocomotion. Note the similarlength of the arms and legs,particularly when comparedwith the human (Figure 1) and the gorilla (Figure 2).
Cranial bonesScapulaVertebraeInnominate
Facial bones
Mandible
HumerusFemur Ribs
RadiusTibiaFibula
Tarsals
Metatarsals
Ulna
CarpalsMetacarpalsPhalangesPhalanges

Relethford: The Human Species: An Introduction to Biological Anthropology, 5/e
Back Matter Glossary © The McGraw−Hill Companies, 2003
G L O S S A R Y
473
acclimation Short-term physiologic responses to astress, usually occurring within minutes or hours.
acclimatization Long-term physiologic responses to astress, usually taking from days to months.
Acheulian tradition A stone tool technology thatappears first with Homo erectus and is characterized bythe development of hand axes and other bifacial tools.
adaptation The process of successful interactionbetween a population and an environment. Cultural orbiological traits that offer an advantage in a given envi-ronment are adaptations.
adaptive radiation The formation of many newspecies following the availability of new environments or the development of a new adaptation.
African replacement model The hypothesis that mod-ern humans evolved as a new species in Africa between150,000 and 200,000 years ago and then spread through-out the Old World, replacing preexisting archaic humanpopulations.
age at menarche The age at which a human femaleexperiences her first menstrual period.
age-sex structure The number of males and femalesin different age groups of a population.
allele The alternative form of a gene or DNA sequencethat occurs at a given locus. Some loci have only oneallele, some have two, and some have many alternativeforms. Alleles occur in pairs, one on each chromosome.
Allen’s rule States that mammals in cold climatestend to have shorter and bulkier limbs, allowing less lossof body heat, whereas mammals in hot climates tend tohave long, slender limbs, allowing greater loss of bodyheat.
allometry The study of the change in proportion ofvarious body parts as a consequence of their growth atdifferent rates.
Alu insertions A sequence of DNA repeated at differ-ent locations on different chromosomes.
anagenesis The transformation of a single speciesover time.
anatomically modern Homo sapiens The modernform of the human species, which dates back 130,000years or more.
Anthropoidea (anthropoids) The suborder of pri-mates consisting of monkeys, apes, and humans.
anthropology The science that investigates humanbiological and cultural variation and evolution.
anthropometrics Measurements of the human body,skull, and face.
antibody A substance that reacts to other substancesinvading the body (antigens).
antigen A substance invading the body that stimu-lates the production of antibodies.
arboreal Living in trees.
arboreal model The view of primate origins thathypothesizes that stereoscopic vision and graspinghands first evolved as adaptations for moving around in the trees.
archaeology The subfield of anthropology that focuses on cultural variation in prehistoric (and some historic) populations by analyzing the culture’sremains.
archaic humans Specimens of Homo with brain sizeclose to that of modern humans but with differentlyshaped skulls. There is considerable controversy overwhether they are an earlier form of Homo sapiens or rep-resent different species.
Ardipithecus ramidus An early primitive hominidspecies from Africa dating between 5.8 million and 4.4 million years ago.
Relethford: The Human Species: An Introduction to Biological Anthropology, 5/e
Back Matter Glossary © The McGraw−Hill Companies, 2003
argon-argon dating A chronometric dating methodbased on the half-life of radioactive argon that can beused with very small samples.
assortative mating Mating between phenotypicallysimilar or dissimilar individuals, for example, betweentwo people with the same hair color.
Australopithecus A genus of fossil hominid that livedbetween 4.2 million and 1 million years ago and is char-acterized by bipedal locomotion, small brain size, largeface, and large teeth.
Australopithecus aethiopicus The oldest robust australo-pithecine, dating to 2.5 million years ago in East Africa.It combines derived features seen in other robust austra-lopithecines with primitive features seen in A. afarensis.
Australopithecus afarensis A primitive hominid foundin East Africa dating between 4 million and 2.9 millionyears ago. The teeth and postcranial skeleton show anumber of primitive and apelike features.
Australopithecus africanus A species of australopithe-cine dating between 3.3 million and 2.3 million years agoand found in South Africa. It is not as massive as therobust forms and may be an ancestor of the genus Homo.
Australopithecus anamensis A hominid species thatlived in East Africa between 4.2 million and 3.9 millionyears ago. It was a biped but had many primitive apelikefeatures of the skull and teeth.
Australopithecus boisei A very robust species of robustaustralopithecine dating between 2 million and 1.2 mil-lion years ago and found in East Africa.
Australopithecus garhi A species of australopithecinedating to 2.5 million years ago in East Africa. It differsfrom other australopithecines in having large front and back teeth, although the back teeth are not specialized to the same extent as found in the robustaustralopithecines.
Australopithecus robustus A species of robust australo-pithecine dating between roughly 2 million and 1.5 mil-lion years ago and found in South Africa.
balancing selection Selection for the heterozygoteand against the homozygotes (the heterozygote is mostfit). Allele frequencies move toward an equilibrium de-fined by the fitness values of the two homozygotes.
base Chemical units (adenine, thymine, guanine,cytosine) that make up part of the DNA molecule andspecify genetic instructions.
behavioral ecology The study of behavior from anecological and evolutionary perspective.
Bergmann’s rule States that (1) among mammals ofsimilar shape, the larger mammal loses heat less rapidly
than the smaller mammal and that (2) among mammalsof similar size, the mammal with a linear shape will loseheat more rapidly than the mammal with a nonlinearshape.
biface Stone tool with both sides worked, producinggreater symmetry and efficiency.
bilateral symmetry Symmetry in which the right andleft sides of the body are approximately mirror images, acharacteristic of vertebrates.
binocular stereoscopic vision Overlapping fields ofvision (binocular), with both sides of the brain receivingimages from both eyes (stereoscopic), thereby providingdepth perception.
biocultural approach A method of studying humansthat looks at the interaction between biology and cul-ture in evolutionary adaptation.
biological anthropology The subfield of anthropol-ogy that focuses on the biological evolution of humansand human ancestors, the relationship of humans toother organisms, and patterns of biological variationwithin and among human populations. Also referred toas physical anthropology.
biological species concept A definition of speciesthat focuses on reproductive capabilities, where organ-isms from different populations are considered to be in the same species if they naturally interbreed andproduce fertile offspring.
biostratigraphy A relative dating method in whichsites can be assigned an approximate age based on thesimilarity of animal remains with other dated sites.
bipedal Moving about on two legs. Unlike the move-ment of other bipedal animals such as kangaroos,human bipedalism is further characterized by a strid-ing motion.
blade A stone tool characteristic of the Upper Paleo-lithic, defined as being at least twice as long as it is wide. Blade tools were made using an efficient and pre-cise method.
B.P. Before Present (1950), the internationally acceptedform of designating past dates.
brachiation A method of movement that uses the armsto swing from branch to branch. Gibbons are brachiators.
breeding population A group of organisms that tendto choose mates from within the group.
brow ridges The large ridges of bone above the eyeorbits, most noticeable in Homo erectus and archaic humans.
burin A stone tool with a sharp edge that is used tocut and engrave bone.
474 GLOSSARY

Relethford: The Human Species: An Introduction to Biological Anthropology, 5/e
Back Matter Glossary © The McGraw−Hill Companies, 2003
canine One of four types of teeth found in mammals.The canine teeth are located in the front of the jaw be-hind the incisors. Mammals normally use these teeth forpuncturing and defense. Unlike most mammals, hu-mans have small canine teeth that function like incisors.
carbon-14 dating A chronometric dating methodbased on the half-life of carbon-14 that can be applied to organic remains such as charcoal dating back over the past 50,000 years or so.
carrying capacity The maximum population sizecapable of being supported in a given environment.
Cenozoic era The third and most recent geologic era of the Phanerozoic eon, dating roughly to the past65 million years. The first primates appeared during the Cenozoic era.
cephalic index A measure of cranial shape defined asthe total length of a skull divided by the maximum widthof the skull.
cerebrum The area of the forebrain that consists ofthe outermost layer of brain cells. The cerebrum is asso-ciated with memory, learning, and intelligence.
Chordata A vertebrate phylum consisting of organ-isms that possess a notochord at some period duringtheir life.
chromosome A long strand of DNA sequences.
chronometric dating Method of dating fossils or sitesthat provides an estimate of the specific date (subject toprobabilistic limits).
cladistics A school of thought that stresses evolution-ary relationships between organisms in forming biologi-cal classifications. Organisms are grouped together onthe basis of the number of derived traits they share.
cladogenesis The formation of one or more newspecies from another over time.
codominant Both alleles affect the phenotype of aheterozygous genotype, and neither is dominant overthe other.
comparative approach Comparing human popula-tions to determine common and unique behaviors orbiological traits.
continental drift The movement of continental landmasses on top of a partially molten layer of the earth’smantle. Because of continental drift, the relative loca-tion of the continents has changed over time.
convergent evolution Independent evolution of atrait in rather distinct evolutionary lines. The develop-ment of flight in birds and certain insects is an exampleof convergent evolution.
cranial capacity A measurement of the interior vol-ume of the brain case measured in cubic centimeters (cc)and used as an approximate estimate of brain size.
crossing over The exchange of DNA between chromo-somes during meiosis.
cultural anthropology The subfield of anthropologythat focuses on variations in cultural behaviors amonghuman populations.
culture Behavior that is shared, learned, and sociallytransmitted.
cusp A raised area on the chewing surface of a tooth.
demographic transition theory A model of demo-graphic change that states that as a population becomeseconomically developed, a reduction in death rates(leading to population growth) will take place, followedby a reduction in birth rates.
dendrochronology A chronometric dating methodbased on the fact that trees in dry climates tend to ac-cumulate one growth ring per year. The width of therings varies according to climate, and a sample can becompared with a master chart of tree rings over the past10,000 years.
dental formula A shorthand method of describingthe number of each type of tooth in half of one jaw of amammal. The dental formula consists of four numbers:I-C-PM-M, where I is the number of incisors, C is thenumber of canines, PM is the number of premolars, andM is the number of molars. When a mammal has adifferent number of teeth in the upper and lower jaws,two dental formulae are used.
derived trait A trait that has changed from an ances-tral state. The large human brain is a derived trait rela-tive to the common ancestor of humans and apes.
dermatoglyphics Measurements of finger and palmprints, including type classification and ridge counts.
developmental acclimatization Changes in organ orbody structure that occur during the physical growth ofany organism.
diastema A gap next to the canine teeth that allowsspace for the canine on the opposing jaw.
directional selection Selection against one extreme ina continuous trait and/or selection for the other extreme.
distance curve A measure of size over time, for exam-ple, a person’s height at different ages.
diurnal Active during the day.
DNA (Deoxyribonucleic acid) The molecule thatprovides the genetic code for biological structures andthe means to translate this code.
GLOSSARY 475
Relethford: The Human Species: An Introduction to Biological Anthropology, 5/e
Back Matter Glossary © The McGraw−Hill Companies, 2003
dominance hierarchy The ranking system within asociety that indicates which individuals are dominant insocial behaviors.
dominant allele An allele that masks the effect of the other allele (which is recessive) in a heterozygousgenotype.
electron spin resonance A chronometric datingmethod that estimates dates from observation of radioactive atoms trapped in the calcite crystals pres-ent in a number of materials, such as bones and shells.This method is useful for dating sites back to roughly 1 million years.
electrophoresis A laboratory method that uses elec-tric current to separate proteins, allowing genotypes tobe determined.
embryo The stage of human prenatal life lasting fromroughly two to eight weeks following conception, char-acterized by structural development.
emergent infectious disease A newly identified infec-tious disease that has recently evolved.
endemic A pattern of disease rate when new cases of a disease occur at a relatively constant but low rate overtime.
endocast A cast of the interior of the brain case usedin the analysis of brain size and structure.
Eocene epoch The second epoch of the Cenozoic era,dating roughly between 54 million and 34 million yearsago. The first true primates, early prosimians, appearedduring this epoch as well as the first anthropoid.
eon The major subdivision of geologic time.
epidemic A pattern of disease rate when new cases ofa disease spread rapidly through a population.
epidemiologic transition The increase in life expec-tancy and the shift from infectious to noninfectiousdisease as the primary cause of death.
epoch Subdivision of a geological period.
era Subdivision of a geological eon.
estrus A time during the month when females are sex-ually receptive (also known as “heat”). Among primates,human and orangutan females lack an estrus period.
Eurasia The combined land masses of Europe and Asia.
evolution The transformation of species of organiclife over long periods of time. Anthropologists studyboth the cultural and biological evolution of the humanspecies.
evolutionary forces Four mechanisms that can causechanges in allele frequencies from one generation to thenext: mutation, natural selection, genetic drift, and gene flow.
exogamy The tendency to choose mates from outsidethe local population.
exon A section of DNA that codes for the amino acidsthat make up proteins. It is contrasted with an intron.
fetus The stage of human prenatal growth from roughlyeight weeks following conception until birth, character-ized by further development and rapid growth.
fission-track dating A chronometric dating methodbased on the number of tracks made across volcanicrock as uranium decays into lead.
fitness An organism’s probability of survival and re-production. Fitness is generally measured in terms ofthe different genotypes for a given locus.
foramen magnum The large opening at the base ofthe skull where the spinal cord enters, which is locatedmore under the skull in bipeds as compared to four-legged vertebrates.
founder effect A type of genetic drift caused by theformation of a new population by a small number ofindividuals. The small size of the sample can causemarked deviations in allele frequencies from the origi-nal population.
gene A DNA sequence that codes for a functionalpolypeptide or RNA product.
gene flow A mechanism for evolutionary change re-sulting from the movement of genes from one popula-tion to another. Gene flow introduces new genes into a population and also acts to make populations moresimilar genetically to one another.
generalized structure A biological structure adaptedto a wide range of conditions and used in very generalways. For example, the grasping hands of humans aregeneralized structures allowing climbing, food gathering,toolmaking, and a variety of other functions.
genetic distance An average measure of relatednessbetween populations based on a number of traits. Ge-netic distances are used for understanding effects ofgenetic drift and gene flow, which should affect all locito the same extent.
genetic distance map A picture that shows the geneticrelationships between populations, based on geneticdistance measures.
genetic drift A mechanism for evolutionary changeresulting from the random fluctuations of gene frequen-cies from one generation to the next, or from any formof random sampling of a larger gene pool.
genome The total DNA sequence of an organism.
genotype The genetic endowment of an individualfrom the two alleles present at a given locus.
476 GLOSSARY

Relethford: The Human Species: An Introduction to Biological Anthropology, 5/e
Back Matter Glossary © The McGraw−Hill Companies, 2003
genus Groups of species with similar adaptations.
gradualism A model of macroevolutionary changewhereby evolutionary changes occur at a slow, steadyrate over time.
grooming The handling and cleaning of another indi-vidual’s fur or hair. In primates, grooming serves as a formof communication that soothes and provides reassurance.
half-life The average length of time it takes for half ofa radioactive substance to decay into another form.
Haplorhini (haplorhines) One of two suborders ofprimates suggested to replace the prosimian/anthropoidsuborders (the other is the strepsirhines). Haplorhinesare primates without a moist nose (tarsiers, monkeys,apes, and humans).
Hardy-Weinberg equilibrium In the absence of non-random mating and evolutionary forces, genotype andallele frequencies will remain the same from one genera-tion to the next.
hemoglobin The molecule in blood cells that trans-ports oxygen.
heritability The proportion of total variance in a traitdue to genetic variation. This measure is not always thesame; the actual value depends on the degree of environ-mental variation in any population.
heterodontic Having different types of teeth. Mam-mals have four different types of teeth: incisors, canines,premolars, and molars.
heterozygous The two alleles at a given locus aredifferent.
holistic Refers to the viewpoint that all aspects ofexistence are interrelated and important in understand-ing human variation and evolution.
homeobox gene A group of regulatory genes thatencode a sequence of 60 amino acids that regulate em-bryonic development. Homeobox genes subdivide fromhead to tail a developing embryo into different regions,which then form limbs and other structures. Thesegenes are similar in many organisms, such as insects,mice, and humans.
homeostasis In a physiologic sense, the maintenanceof normal limits of body functioning.
homeotherm Organism capable of maintaining aconstant body temperature under most circumstances.Mammals are homeotherms.
home range The size of the geographic area that isnormally occupied and used by a social group.
hominid Humans and humanlike ancestors since thetime of divergence from the African apes. Some research-ers advocate a somewhat different definition, including
the African apes, and use the term “hominin” to refer to humans and their bipedal ancestors.
hominin Under some taxonomic classifications, thisterm is used instead of “hominid” to refer to humansand humanlike ancestors.
hominoid A superfamily of anthropoids consisting of apes and humans. Hominoids have a shoulder struc-ture adapted for climbing and hanging, lack a tail, aregenerally larger than monkeys, and have the largest brainto body size ratio among primates.
Homo A genus of hominids characterized by largebrain size and dependence on culture as a means ofadaptation.
homodontic All teeth are the same.
Homo erectus A species of genus Homo that arose 2 million years ago, first appearing in Africa and thenspreading to parts of Asia and Europe.
Homo habilis A species of early Homo from Africa be-tween 2 million and 1.5 million years ago with a brainsize roughly half that of modern humans and a primi-tive postcranial skeleton.
homology Similarity due to descent from a commonancestor.
homoplasy Similarity due to independent evolution.
Homo rudolfensis A species of early Homo from Africaroughly 2 million years ago with a brain size somewhatlarger than H. habilis.
homozygous Both alleles at a given locus are identical.
horticulture A form of farming in which only simplehand tools are used.
hypothesis An explanation of observed facts. To bescientific, a hypothesis must be testable.
hypoxia Oxygen starvation, which occurs frequentlyat high altitudes.
inbreeding Mating between biologically related individuals.
incisor One of four types of teeth found in mammals.The incisors are the chisel-shaped front teeth used forcutting, slicing, and gnawing food.
infanticide The killing of infants.
infectious disease A disease caused by the introduc-tion of an organic foreign substance into the body. Suchsubstances include viruses and parasites.
insectivore An order of mammals adapted to insecteating.
intelligent design creationism The idea that the biological world was created by an intelligent entity and did not arise from natural processes.
GLOSSARY 477

Relethford: The Human Species: An Introduction to Biological Anthropology, 5/e
Back Matter Glossary © The McGraw−Hill Companies, 2003
intron A section of DNA that does not code for theamino acids that make up proteins. It is contrasted withan exon.
Kenyanthropus platyops A species of early hominid inEast Africa dating to 3.5 million years ago. This speciescombines a number of primitive features (small brain,jutting face) and derived features (small molars, flat face).Its evolutionary status is unclear.
kin selection A concept used in sociobiological expla-nations of altruism. Sacrificial behaviors, for example,can be selected for if they increase the probability of sur-vival of close relatives.
knuckle walking A form of movement used by chim-panzees and gorillas that is characterized by all fourlimbs touching the ground, with the weight of the armsresting on the knuckles of the hands.
kwashiorkor An extreme form of protein-calorie mal-nutrition resulting from a severe deficiency in proteinsbut not calories.
lactase persistence The ability to produce the enzymelactase after 5 years of age.
lactose intolerance A condition characterized bydiarrhea, cramps, and other intestinal problems result-ing from the ingestion of milk.
larynx Part of the vocal anatomy in the throat.
lemur A prosimian found today on the island ofMadagascar. Lemurs include both nocturnal and diur-nal species.
life expectancy at birth A measure of the averagelength of life for a newborn child.
life table A compilation of the age distribution of apopulation that provides an estimate of the probabilitythat an individual will die by a certain age, used to com-pute life expectancy.
linguistic anthropology The subfield of anthropol-ogy that focuses on the nature of human language, therelationship of language to culture, and the languages of nonliterate peoples.
linkage Alleles on the same chromosome are inheritedtogether.
locus The specific location of a gene or DNA sequenceon a chromosome.
loris Nocturnal prosimian found today in Asia andAfrica.
Lower Paleolithic The Lower Old Stone Age, a gen-eral term used to refer collectively to the stone tooltechnologies of Homo habilis/Homo rudolfensis and Homoerectus.
macroevolution Long-term evolutionary change. Thestudy of macroevolution focuses on biological evolutionover many generations and on the origin of higher taxo-nomic categories, such as species.
major genes Genes that have the primary effect onthe phenotypic distribution of a complex trait. Addi-tional variation can be due to smaller effects from otherloci and/or environmental influences.
malnutrition Poor nutrition, either from two much or too little food or the improper balance of nutrients.
marasmus An extreme form of protein-calorie mal-nutrition resulting from severe deficiencies in bothproteins and calories.
mass extinction Many species becoming extinct atabout the same time.
meiosis The creation of sex cells by replication ofchromosomes followed by cell division. Each sex cell con-tains 50 percent of an individual’s chromosomes (onefrom each pair).
Mendelian genetics The branch of genetics concernedwith patterns and processes of inheritance. This fieldwas named after Gregor Mendel, the first scientist towork out many of these principles.
Mendel’s Law of Independent Assortment Thesegregation of any pair of chromosomes does not affect the probability of segregation for other pairs of chromosomes.
Mendel’s Law of Segregation Sex cells contain one of each pair of alleles.
menopause The permanent cessation of menstrualcycles.
Mesozoic era The second geologic era of the Phanero-zoic eon, dating roughly between 245 million and 65 million years ago, when the first mammals and birdsappeared.
messenger RNA The form of RNA that transports thegenetic instructions from the DNA molecule to the siteof protein synthesis.
microevolution Short-term evolutionary change. Thestudy of microevolution focuses on changes in allelefrequencies from one generation to the next.
microsatellite DNA Repeated short sequences ofDNA; the number of repeats is highly variable.
Middle Paleolithic The Middle Old Stone Age, ageneral term used to refer collectively to the stone tooltechnologies of archaic humans.
478 GLOSSARY
Relethford: The Human Species: An Introduction to Biological Anthropology, 5/e
Back Matter Glossary © The McGraw−Hill Companies, 2003
Miocene epoch The fourth epoch of the Cenozoic era,dating between 23 million and 5 million years ago. Thefirst apes evolved during the Miocene. The first hominidsare dated to the Late Miocene.
mitochondrial DNA A small amount of DNA that islocated in the mitochondria of cells. Mitochondrial DNAis inherited only through the mother.
mitosis The process of replication of chromosomes inbody cells. Each cell produces two identical copies.
molar One of four types of teeth found in mammals.The molars are back teeth used for crushing and grind-ing food.
molecular dating The application of methods ofgenetic analysis to estimate the sequence and timing ofdivergent evolutionary lines.
monogamous family group Social structure in whichthe primary social group consists of an adult male, anadult female, and their immature offspring.
monogamy An exclusive sexual bond between an adultmale and an adult female for a long period of time.
monosomy A condition in which one chromosomerather than a pair is present in body cells.
morphology The physical structure of organisms.
Mousterian tradition The prepared-core stone tooltechnology of the Neandertals.
multimale/multifemale group A type of social struc-ture in which the primary social group is made up of sev-eral adult males, several adult females, and their offspring.
multiregional evolution model The hypothesis thatmodern humans evolved throughout the Old World as asingle species after the first dispersion of Homo erectusout of Africa. According to this view, the transition fromHomo erectus to archaic humans to modern Homo sapiensoccurred within a single evolutionary line throughoutthe Old World.
multivariate analysis The analysis of human biologi-cal variation that considers the interrelationships ofseveral traits at a time.
mutation A mechanism for evolutionary change re-sulting from a random change in the genetic code; theultimate source of all genetic variation. Mutations mustoccur in sex cells to cause evolutionary change.
nasal index A measure of the shape of the nasal open-ing, defined as the width of the nasal opening divided bythe height.
natural increase Number of births minus the numberof deaths.
natural selection A mechanism for evolutionarychange favoring the survival and reproduction of someorganisms over others because of their biological characteristics.
Neandertals A population of archaic humans thatlived in Europe and the Middle East dating between150,000 and 28,000 years ago.
nocturnal Active during the night.
noninfectious disease A disease caused by factorsother than the introduction of an organic foreign sub-stance into the body.
nonrandom mating Patterns of mate choice thatinfluence the distributions of genotype and phenotypefrequencies. Nonrandom mating does not lead tochanges in allele frequencies.
notochord A flexible internal rod that runs along theback of an animal. Animals possessing a notochord atsome period in their life are known as chordates.
occipital bun The protruding rear region of the skull,a feature commonly found in Neandertals.
odontometrics Measurements of the size of teeth.
Oldowan tradition The oldest known stone toolculture.
Oligocene epoch The third epoch of the Cenozoicera, dating roughly between 34 million and 23 millionyears ago, when there was an adaptive radiation of anthropoids.
Orrorin tugenensis An early primitive, possibly hominid,species from Africa dating to the late Miocene (6 Ma).
orthogenesis A discredited idea that evolution wouldcontinue in a given direction because of some vaguelydefined “force.”
outgroup A group used for comparison in cladisticanalyses to determine whether the ancestral state of atrait is primitive or derived.
Paleocene epoch The first epoch of the Cenozoic era, dating roughly between 65 million and 54 millionyears ago. The primate-like mammals lived during thePaleocene.
paleoecology The study of ancient environments.
paleomagnetic reversal A method of dating sitesbased on the fact that the earth’s magnetic field hasshifted back and forth from the north to the south inthe past at irregular intervals.
paleopathology The study of disease in prehistoricpopulations based on analysis of skeletal remains andarchaeological evidence.
GLOSSARY 479

Relethford: The Human Species: An Introduction to Biological Anthropology, 5/e
Back Matter Glossary © The McGraw−Hill Companies, 2003
paleospecies Species identified from fossil remainsbased on their physical similarities and differences rela-tive to other species.
Paleozoic era The first geologic era of the Phanerozoiceon, dating roughly between 545 million and 245 mil-lion years ago, when the first vertebrates appeared.
palynology The study of fossil pollen. Palynologyallows prehistoric plant species to be identified.
pandemic A widespread epidemic that affects a largegeographic area, such as a continent.
parallel evolution Independent evolution of a trait in closely related species. One example might be theparallel development of large back teeth in several homi-nid species.
parental investment A concept used in sociobiologi-cal models that describes parental behaviors that increasethe probability that offspring will survive.
period Subdivision of a geologic era.
Phanerozoic eon The past 545 million years.
phenetics A school of thought that stresses the over-all physical similarities among organisms in formingbiological classifications.
phenotype The observable appearance of a givengenotype in the organism. The phenotype is determinedby the relationship of the two alleles at a given locus, the number of loci, and often environmental influencesas well.
placenta An organ that develops inside a pregnantplacental mammal that provides the fetus with oxygenand food and helps filter out harmful substances.
plasticity The ability of an organism to respond physi-ologically or developmentally to environmental stress.
pleiotropy A single allele that has multiple effects onan organism.
Pleistocene epoch The sixth epoch of the Cenozoicera, dating from 1.7 million to 0.01 million years ago.
Pliocene epoch The fifth epoch of the Cenozoic era,dating from 5 million to 1.7 million years ago.
polyandrous group A rare type of primate socialstructure, consisting of a small number of adult males,one reproductively active adult female, and their off-spring. Other adult females may belong to the groupbut are not reproductively active.
polyandry In humans, a form of marriage in which awife has several husbands. In more general terms, it refersto an adult female having several mates.
polygamy A sexual bond between an adult male andan adult female in which either individual may havemore than one mate at the same time.
polygenic A complex genetic trait affected by two ormore loci.
polygyny In humans, a form of marriage in which a husband has several wives. In more general terms, itrefers to an adult male having several mates.
polymorphism A discrete genetic trait in which thereare at least two alleles at a locus having frequenciesgreater than 0.01.
population pyramid A diagram of the age-sex struc-ture of a population.
postcranial Referring to that part of the skeletonbelow the skull.
postnatal The period of life from birth until death.
postorbital bar The bony ring that separates the eyeorbit from the back of the skull. The postorbital bar is aprimate characteristic.
postorbital constriction The narrowness of the skullbehind the eye orbits, a characteristic of early hominids.
potassium-argon dating A chronometric datingmethod based on the half-life of radioactive potassium(which decays into argon gas) that can be used to datevolcanic rock older than 100,000 years.
Precambrian eon The eon from the earth’s beginning(4.6 billion years ago) until 545 million years ago. Dur-ing this eon, single-celled and simple multicelled organ-isms first evolved.
prehensile Capable of grasping. Primates have pre-hensile hands and feet, and some primates (certain NewWorld monkeys) have prehensile tails.
premolar One of four types of teeth found in mam-mals. The premolars are back teeth used for crushingand grinding food.
prenatal The period of life from conception until birth.
prepared-core method An efficient method of stonetool manufacture in which a stone core is prepared andthen finished tools are removed from it.
primary African origin model A variant of the multi-regional evolution model of the origin of modern hu-mans that suggests most of the transition from archaicto modern humans took place first in Africa and thenspread by gene flow throughout the rest of the speciesacross the Old World.
primates The order of mammals that has a complexof characteristics related to an initial adaptation to lifein the trees, including binocular stereoscopic vision andgrasping hands. The primates include prosimians, mon-keys, apes, and humans.
primitive trait In biological terms, a trait that has notchanged from an ancestral state. The five digits of the
480 GLOSSARY

Relethford: The Human Species: An Introduction to Biological Anthropology, 5/e
Back Matter Glossary © The McGraw−Hill Companies, 2003
human hand and foot are primitive traits inherited fromearlier vertebrate ancestors.
Proconsul A genus of fossil hominoid that lived in Africabetween 23 million and 17 million years ago. Thoughclassified as apes, this genus also shows a number ofmonkey characteristics. It most probably represents oneof the first forms to evolve following the divergence ofthe monkey and ape lines.
Prosimii (prosimians) The suborder of primates thatare biologically primitive compared to anthropoids.
protein-calorie malnutrition A group of nutritionaldiseases resulting from inadequate amounts of proteinand/or calories. Protein-calorie malnutrition is a severeproblem in less developed countries today.
punctuated equilibrium A model of macroevolution-ary change in which long periods of little evolutionarychange (stasis) are followed by relatively short periods ofrapid evolutionary change.
quadrupedal A form of movement in which all fourlimbs are of equal size and make contact with the ground,and the spine is roughly parallel to the ground. Mon-keys are typical quadrupedal primates.
race A group of populations sharing certain biologicaltraits that make them distinct from other groups ofpopulations. In practice, the concept of race is very dif-ficult to apply to patterns of human variation.
recessive allele An allele whose effect is masked by the other allele (which is dominant) in a heterozygousgenotype.
recombination The production of new combinationsof DNA sequences caused by exchanges of DNA duringmeiosis.
regional coalescence model A variant of the multi-regional evolution model of the origin of modern humans that suggests the transition from archaic tomodern humans resulted from the coalescence of ge-netic and anatomic changes that took place in differentplaces at different times, all mixing together to producemodern humans.
regional continuity The appearance of similar traitswithin a geographic region that remain over a longperiod of time.
regulatory gene Gene that codes for the regulation ofbiological processes such as growth and development.
relative dating Comparative method of dating fossilsand sites that provides an estimate of the older find butnot a specific date.
remergent infectious disease Infectious disease that had previously been reduced but that increases in
frequency when microorganisms evolve resistance toantibiotics.
reproductive isolation The genetic isolation of popu-lations that may render them incapable of producingfertile offspring.
restriction fragment length polymorphism (RFLP)A genetic trait defined in terms of the length of DNAfragments produced when certain enzymes cut the DNAsequence.
Rhesus incompatibility A condition in which a preg-nant woman and her fetus have incompatible Rhesusblood group phenotypes.
RNA (Ribonucleic acid) The molecule that functionsto carry out the instructions for protein synthesis speci-fied by the DNA molecule.
robust australopithecines Species of Australopithecusthat had very large back teeth, cheekbones, and faces,among other anatomical adaptations to heavy chewing.They lived in Africa between 2.5 million and 1.2 mil-lion years ago. Three species are generally recognized: A. aethiopicus, A. robustus, and A. boisei. Some anthropolo-gists suggest that they be given their own genus name—Paranthropus.
sagittal crest A ridge of bone running down the cen-ter of the top of the skull that serves to anchor chewingmuscles.
savanna An environment consisting of open grass-lands in which food resources tend to be spread out overlarge areas.
secular change A change in the average pattern ofgrowth or development in a population over severalgenerations.
sedentary Settled in one place throughout most or allof the year.
sexual dimorphism The average difference in bodysize between adult males and adult females. Primatespecies with sexual dimorphism in body size are charac-terized by adult males being, on average, larger thanadult females.
sickle cell allele An allele of the hemoglobin locus.Individuals homozygous for this allele have sickle cellanemia.
sickle cell anemia A genetic disease that occurs in aperson homozygous for the sickle cell allele, which altersthe structure of red blood cells.
single-nucleotide polymorphisms (SNPs) Specificpositions in a DNA sequence that differ at one base. Forexample, the DNA sequences CCTGAA and CCCGAAdiffer in the third position—one sequence has the base Tand the other the base C.
GLOSSARY 481
Relethford: The Human Species: An Introduction to Biological Anthropology, 5/e
Back Matter Glossary © The McGraw−Hill Companies, 2003
social structure The composition of a social groupand the way it is organized, including size, age structure,and number of each sex in the group.
sociobiology The study of behavior from an evolution-ary perspective, particularly the role of natural selection.
solitary group The smallest primate social group,consisting of the mother and her dependent offspring.
specialized structure A biological structure adaptedto a narrow range of conditions and used in very specificways. For example, the hooves of horses are specializedstructures allowing movement over flat terrain.
speciation The origin of a new species.
species A group of populations whose members caninterbreed naturally and produce fertile offspring.
stabilizing selection Selection against extreme values,large or small, in a continuous trait.
stratigraphy A relative dating method based on thefact that older remains are found deeper in the earth(under the right conditions). This method makes use ofthe fact that a cumulative buildup of the earth’s surfacetakes place over time.
Strepsirhini (strepsirhines) One of two suborders ofprimates suggested to replace the prosimian/anthropoidsuborders (the other is the haplorhines). Strepsirhinesare primates that have a moist nose (lemurs and lorises).
stress Any factor that interferes with the normal lim-its of operation of an organism.
suspensory climbing The ability to raise the armsabove the head and hang on branches and to climb inthis position. Hominoids are suspensory climbers.
taphonomy The study of what happens to plants andanimals after they die. Taphonomy helps in determiningreasons for the distribution and condition of fossils.
tarsier Nocturnal prosimian found today in Indone-sia. Unlike other prosimians, tarsiers lack a moist nose.
taxonomy The science of describing and classifyingorganisms.
terrestrial Living on the ground.
territory A home range that is actively defended.
theistic evolution The belief that God operatesthrough the natural process of evolution.
theory A set of hypotheses that have been tested re-peatedly and that have not been rejected. This term issometimes used in a different sense in social scienceliterature.
therapsid An early group of mammal-like reptiles;therapsids were the ancestors of later mammals.
thermoluminescence A chronometric dating methodthat uses the fact that certain heated objects accumu-late trapped electrons over time, which allows the datewhen the object was initially heated to be determined.
transfer RNA A free-floating molecule that is attractedto a strand of messenger RNA, resulting in the synthesisof a protein chain.
trephination Surgery involving the removal of a sec-tion of bone from the skull.
trisomy A condition in which three chromosomesrather than a pair occur. Down syndrome is caused bytrisomy by the addition of an extra chromosome to the 21st chromosome pair.
uni-male group Social structure in which the primarysocial group consists of a single adult male, several adultfemales, and their offspring.
univariate analysis The analysis of human biologicalvariation focusing on a single trait at a time.
Upper Paleolithic The Upper Old Stone Age, a gen-eral term used to collectively refer to the stone tooltechnologies of anatomically modern Homo sapiens.
variation The differences that exist among individualsor populations. Anthropologists study both culturaland biological variation.
vasoconstriction The narrowing of blood vessels,which reduces blood flow and heat loss.
vasodilation The opening of the blood vessels, whichincreases blood flow and heat loss.
velocity curve A measure of the rates of change ingrowth over time.
Vertebrata A subphylum of the phylum Chordata,defined by the presence of an internal, segmented spinalcolumn and bilateral symmetry.
visual predation model The view of primate originsthat hypothesizes that stereoscopic vision and graspinghands first evolved as adaptations for hunting insectsalong branches.
zoonose A disease transmitted directly to humansfrom other animals.
zygomatic arch The cheekbone, formed by the con-nection of the zygomatic and temporal bones on the sideof the skull.
zygote A fertilized egg.
482 GLOSSARY

Relethford: The Human Species: An Introduction to Biological Anthropology, 5/e
Back Matter References © The McGraw−Hill Companies, 2003
R E F E R E N C E S
483
Abbate, E., A. Albianelli, A. Azzaroli, M. Benvenuti, B. Tesfa-mariam, P. Bruni, N. Cipriani, R. J. Clarke, G. Ficcarelli, R. Macchiarelli, G. Napoleone, M. Papini, L. Rook, M. Sagri,T. M. Tecle, D. Torre, and I. Villa. 1998. A one-million-yearold Homo cranium from the Danakil (Afar) depression ofEritrea. Nature 393:458–60.
Adcock, G. J., E. S. Dennis, S. Easteal, G. A. Huttley, L. S. Jermiin,W. J. Peacock, and A. Thorne. 2001. Mitochondrial DNAsequences in ancient Australians: Implications for modernhuman origins. Proceedings of the National Academy of Sciences,USA 98:537–42.
Aiello, L. C., and M. Collard. 2001. Our newest oldest ancestor?Nature 410:526–27.
Aiello, L. L., and R. Dunbar. 1993. Neocortex size, group size, andthe evolution of language. Current Anthropology 34:184–93.
Allen, J. S., and S. M. Cheer. 1996. The non-thrifty genotype.Current Anthropology 37:831–42.
Ambrose, S. H. 2001. Paleolithic technology and human evolu-tion. Science 291:1748–53.
Anderson, C. M. 1992. Male investment under changing condi-tions among Chacma baboons at Suikerbosrand. AmericanJournal of Physical Anthropology 87:479–96.
Anderson, R. N. 1998. United States abridged life tables, 1996.National Vital Statistics Reports, vol. 47, no. 13. National Cen-ter for Health Statistics, Centers for Disease Control andPrevention.
Arensberg, B., L. A. Schepartz, A. M. Tillier, B. Vandermeersch,and Y. Rak. 1990. A reappraisal of the anatomical basis forspeech in Middle Paleolithic hominids. American Journal ofPhysical Anthropology 83:137–46.
Armelagos, G. J., K. C. Barnes, and J. Lin. 1996. Disease inhuman evolution: The re-emergence of infectious disease inthe third epidemiologic transition. AnthroNotes, NationalMuseum of Natural History Bulletin for Teachers, vol. 18, no. 3(Fall 1996). Washington: Smithsonian Institution.
Armelagos, G. J., and J. R. Dewey. 1970. Evolutionary responseto human infectious diseases. BioScience 157:638–44.
Armstrong, E. 1983. Relative brain size and metabolism inmammals. Science 220:1302–4.
Asfaw, B., T. White, O. Lovejoy, B. Latimer, S. Simpson, and G. Suwa. 1999. Australopithecus garhi: A new species of earlyhominid from Ethiopia. Science 284:629–35.
Backwell, L. R., and F. d’Errico. 2001. Evidence of termiteforaging by Swartkrans early hominids. Proceedings of theNational Academy of Sciences, USA 98:1358–63.
Baker, B. J., and G. J. Armelagos. 1988. The origin and antiquityof syphilis: Paleopathological diagnosis and interpretation.Current Anthropology 29:703–37.
Barbujani, G., A. Magagni, E. Minch, and L. L. Cavalli-Sforza.1997. An apportionment of human DNA diversity. Proceed-ings of the National Academy of Sciences, USA 94:4516–19.
Bartlett, T. Q., R. W. Sussman, and J. M. Cheverud. 1993. Infantkilling in primates: A review of observed cases with specificreference to the sexual selection hypothesis. American An-thropologist 95:958–90.
BBC News. 2001. Scientists solve Iceman mystery. Sci/Tech( July 26). Available on the Internet at: http://news.bbc.co.uk/hi/english/sci/tech/newsid_1458000/1458198.stm.
Beall, C. M., J. Blangero, S. Williams-Blangero, and M. C. Gold-stein. 1994. Major gene for percent of oxygen saturation of arterial hemoglobin in Tibetan highlanders. AmericanJournal of Physical Anthropology 95:271–76.
Beall, C. M., and A. T. Steegmann Jr. 2000. Human adaptationto climate: Temperature, ultraviolet radiation, and altitude.In Human Biology: An Evolutionary and Biocultural Perspective,ed. S. Stinson, B. Bogin, R. Huss-Ashmore, and D. O’Rourke,pp. 163–224. New York: John Wiley.
Beals, K. L. 1972. Head form and climatic stress. AmericanJournal of Physical Anthropology 37:85–92.
Beals, K. L., C. L. Smith, and S. M. Dodd. 1983. Climate andthe evolution of brachycephalization. American Journal ofPhysical Anthropology 62:425–37.
Becker, L., R. J. Poreda, A. G. Hunt, T. E. Bunch, and M. Ram-pino. 2001. Impact event at the Permian-Triassic boundary:Evidence from extraterrestrial noble gases in fullerenes.Science 291:1530–33.
Bermúdez de Castro, J. M., J. L. Arsuaga, E. Carbonell, A. Rosas,I. Martínez, and M. Mosquera. 1997. A hominid from the

Relethford: The Human Species: An Introduction to Biological Anthropology, 5/e
Back Matter References © The McGraw−Hill Companies, 2003
Lower Pleistocene of Atapuerca, Spain: Possible ancestor toNeandertals and modern humans. Science 276:1392–95.
Binder, S., A. M. Levitt, J. J. Sacks, and J. M. Hughes. 1999.Emerging infectious diseases: Public health issues for the21st century. Science 284:1311–13.
Bindon, J. R., and P. T. Baker. 1985. Modernization, migrationand obesity among Samoan adults. Annals of Human Biology12:67–76.
Bittles, A. H., W. M. Mason, J. Greene, and N. A. Rao. 1991.Reproductive behavior and health in consanguineousmarriages. Science 252:789–94.
Blum, H. F. 1961. Does the melanin pigment of human skinhave adaptive value? Quarterly Review of Biology 36:50–63.
Bodmer, W. F., and L. L. Cavalli-Sforza. 1976. Genetics, Evolution,and Man. San Francisco: W. H. Freeman.
Bogin, B. A. 1995a. Growth and development: Recent evolu-tionary and biocultural research. In Biological Anthropology:The State of the Science, ed. N. T. Boaz and L. D. Wolfe, pp. 49–70. Bend, Ore.: International Institute for HumanEvolutionary Research.
———. 1995b. Plasticity in the growth of Mayan refugee childrenliving in the United States. In Human Variability and Plastic-ity, ed. C. G. N. Mascie-Taylor and B. Bogin, pp. 46–74.Cambridge: Cambridge University Press.
———. 1999. Patterns of Human Growth, 2d ed. Cambridge: Cam-bridge University Press.
———. 2001. The Growth of Humanity. New York: John Wiley &Sons.
Bogin, B. A., and B. H. Smith. 1996. The evolution of the humanlife cycle. American Journal of Human Biology 8:703–16.
Bottini, N., G. F. Meloni, A. Finocchi, G. Ruggiu, A. Amante, T. Meloni, and E. Bottini. 2001. Maternal-fetal interactionin the ABO system: A comparative analysis of healthy moth-ers and couples with recurrent spontaneous abortion sug-gests a protective effect of B incompatibility. Human Biology73:167–74.
Bouchard, T. J., D. T. Lykken, M. McGue, N. L. Segal, and A. Tellegen. 1990. Sources of human psychological differ-ences: The Minnesota study of twins reared apart. Science250:223–28.
Bouvier, L. F., and J. T. Bertrand. 1999. World Population: Chal-lenges for the 21st Century. Santa Ana, Calif.: Seven Locks Press.
Brace, C. L. 1964. The fate of the “classic” Neandertals: A con-sideration of hominid catastrophism. Current Anthropology5:3–43.
Brace, C. L., K. R. Rosenberg, and K. D. Hunt. 1987. Gradualchange in human tooth size in the Late Pleistocene andPost-Pleistocene. Evolution 41:705–20.
Brace, C. L., D. P. Tracer, L. A. Yaroch, J. Robb, K. Brandt, andR. Nelson. 1993. Clines and clusters versus “race”: A test inancient Egypt and the case of a death on the Nile. Yearbookof Physical Anthropology 36:1–31.
Bramblett, C. A. 1976. Patterns of Primate Behavior. Palo Alto,Calif.: Mayfield.
———. 1994. Patterns of Primate Behavior, 2d ed. ProspectHeights, Ill.: Waveland.
Brooks, A. S., D. M. Helgren, J. S. Cramer, A. Franklin, W. Hornyak, J. M. Keating, R. G. Klein, W. J. Rink, H. Schwarcz, J. N. L. Smith, K. Stewart, N. E. Todd, J. Ver-niers, and J. E. Yellen. 1995. Dating and context of threeMiddle Stone Age sites with bone points in the UpperSemliki Valley, Zaire. Science 268:548–53.
Brown, F. H. 1992. Methods of dating. In The Cambridge Ency-clopedia of Human Evolution, ed. S. Jones, R. Martin, and D. Pilbeam, pp. 179–86. Cambridge: Cambridge UniversityPress.
Brown, F., J. Harris, R. Leakey, and A. Walker. 1985. Early Homoerectus skeleton from west Lake Turkana, Kenya. Nature316:788–92.
Brown, R. A., and G. J. Armelagos. 2001. Apportionment ofracial diversity: A review. Evolutionary Anthropology 10:34–40.
Brues, A. M. 1977. People and Races. New York: Macmillan.Buss, D. M. 1985. Human mate selection. American Scientist
73:47–51.Cabana, T., P. Jolicoeur, and J. Michaud. 1993. Prenatal and
postnatal growth and allometry of stature, head circumfer-ence, and brain weight in Québec children. American Journalof Human Biology 5:93–99.
Calcagno, J. M., and K. R. Gibson. 1988. Human dental reduc-tion: Natural selection or the probable mutation effect.American Journal of Physical Anthropology 77:505–17.
Campbell, B. G. 1985. Human Evolution, 3d ed. New York: Aldine.Cann, R. L., M. Stoneking, and A. C. Wilson. 1987. Mitochon-
drial DNA and human evolution. Nature 325:31–36.Carpenter, C. R. 1965. The howlers of Barro Colorado Island.
In Primate Behavior: Field Studies of Monkeys and Apes, ed. I. DeVore, pp. 250–91. New York: Holt, Rinehart, and Winston.
Carroll, S. B., S. D. Weatherbee, and J. A. Langeland. 1995.Homeotic genes and the regulation and evolution of insectwing number. Nature 375:58–61.
Cartmill, M. 1974. Rethinking primate origins. Science184:436–43.
———. 1992. New views on primate origins. Evolutionary Anthro-pology 1:105–11.
Cavalli-Sforza, L. L., and W. F. Bodmer. 1971. The Genetics ofHuman Populations. San Francisco: W. H. Freeman.
Cavalli-Sforza, L. L., P. Menozzi, and A. Piazza. 1994. The His-tory and Geography of Human Genes. Princeton: PrincetonUniversity Press.
Cela-Conde, C. J., E. Aguirre, F. J. Ayala, P. V. Tobias, D. Turbón,L. C. Aiello, M. Collard, M. Goodman, C. P. Groves, F. C.Howell, J. H. Schwartz, D. S. Strait, F. Szalay, I. Tattersall,M. H. Wolpoff, and B. Wood. 2000. Systematics of human-kind. Palma 2000: A working group on systematics inhuman paleontology. Ludus Vitalis 12:127–30.
Chapman, C. A., and C. A. Peres. 2001. Primate conservation in the new millennium: The role of scientists. EvolutionaryAnthropology 10:16–33.
484 REFERENCES

Relethford: The Human Species: An Introduction to Biological Anthropology, 5/e
Back Matter References © The McGraw−Hill Companies, 2003
Chen, F-C., and W-H. Li. 2001. Genomic divergences betweenhumans and other hominoids and the effective populationsize of the common ancestor of humans and chimpanzees.American Journal of Human Genetics 68:444–56.
Cheney, D. L., and R. W. Wrangham. 1987. Predation. In Pri-mate Societies, ed. B. B. Smuts, D. L. Cheney, R. M. Seyfarth,R. W. Wrangham, and T. T. Struhsaker, pp. 227–39. Chi-cago: University of Chicago Press.
Ciochon, R. L., and R. A. Nisbett. 1998. The Primate Anthology:Essays on Primate Behavior, Ecology, and Conservation fromNatural History. Upper Saddle River, N.J.: Prentice Hall.
Ciochon, R., J. Olsen, and J. James. 1990. Other Origins: TheSearch for the Giant Ape in Human Prehistory. New York: Ban-tam Books.
Clarke, R. J. 1999. Discovery of complete arm and hand of the3.3-million-year-old Australopithecus skeleton from Sterk-fontein. South African Journal of Science 95:477–80.
Cockburn, T. A. 1971. Infectious diseases in ancient popula-tions. Current Anthropology 12:45–62.
Coffing, K., C. Feibel, M. Leakey, and A. Walker. 1994. Four-million-year-old hominids from East Lake Turkana, Kenya.American Journal of Physical Anthropology 93:55–65.
Cohen, J. E. 1995. How Many People Can the Earth Support? NewYork: W. W. Norton.
Cohen, M. N. 1989. Health and the Rise of Civilization. New Haven:Yale University Press.
Comuzzie, A. G., J. E. Hixson, L. Almasy, B. D. Mitchell, M. C.Mahaney, T. D. Dyer, M. P. Stern, J. W. MacCluer, and J. Blangero. 1997. A major quantitative trait locus determin-ing serum leptin levels and fat mass is located on humanchromosome 2. Nature Genetics 15:273–76.
Connell, K. H. 1950. The Population of Ireland 1750–1845. Oxford:Clarendon Press.
Conroy, G. C., G. W. Weber, H. Seidler, P. V. Tobias, A. Kane,and B. Brunsden. 1998. Endocranial capacity in an earlyhominid cranium from Sterkfontein, South Africa. Science280:1730–31.
Covert, H. H. 1997. The early primate adaptive radiations andnew evidence about anthropoid origins. In Biological Anthro-pology: The State of the Science, 2d ed., ed. N. T. Boaz and L. D. Wolfe, pp. 1–23. Bend, Ore.: International Institute for Human Evolutionary Research.
Cowen, R. 1995. History of Life, 2d ed. Boston: Blackwell.Cowley, G., J. Contreras, A. Rogers, J. Lach, C. Dickey, and S.
Raghavan. 1995. Outbreak of fear. Newsweek, May 22, 1995.Coyne, J. A. 1992. Genetics and speciation. Nature 355:511–15.Crawford, M. H. 1998. The Origins of Native Americans: Evidence
from Anthropological Genetics. Cambridge: Cambridge Univer-sity Press.
Crews, D. E. 1989. Cause-specific mortality, life expectancy, and debilitation in aging Polynesians. American Journal ofHuman Biology 1:347–53.
Crockett, C. M., and J. F. Eisenberg. 1987. Howlers: Variationsin group size and demography. In Primate Societies, ed. B. B.
Smuts, D. L. Cheney, R. M. Seyfarth, R. W. Wrangham, andT. T. Struhsaker, pp. 54–68. Chicago: University of ChicagoPress.
Crook, J. H., and J. S. Gartlan. 1996. Evolution of primatesocieties. Nature 210:1200–3.
Crow, J. F. 1958. Some possibilities for measuring selectionintensities in man. Human Biology 30:1–13.
Damon, A. 1977. Human Biology and Ecology. New York: W. W.Norton.
Dart, R. A. 1925. Australopithecus africanus: The man-ape ofSouth Africa. Nature 115:195–99.
Dawkins, R. 1987. The Blind Watchmaker: Why the Evidence ofEvolution Reveals a Universe without Design. New York: W. W.Norton.
Day, M. H. 1986. Bipedalism: Pressures, origins and modes. InMajor Topics in Primate and Human Evolution, ed. B. Wood, L. Martin, and P. Andrews, pp. 188–202. Cambridge: Cam-bridge University Press.
de Heinzelin, J., D. Clark, T. White, W. Hart, P. Renne, G. Wolde-Gabriel, Y. Beyene, and E. Vrba. 1999. Environment andbehavior of 2.5-million-year-old Bouri hominids. Science284:625–29.
Denham, W. W. 1971. Energy relations and some basic proper-ties of primate social organization. American Anthropologist73:77–95.
De Robertis, E. M., G. Oliver, and C. V. E. Wright. 1990.Homeobox genes and the vertebrate body plan. ScientificAmerican 263(1): 46–52.
Dettwyler, K. A. 1991. Can paleopathology provide evidence for “compassion”? American Journal of Physical Anthropology84:375–84.
———. 1994. Dancing Skeletons: Life and Death in West Africa.Prospect Heights, Ill.: Waveland.
Devlin, B., M. Daniels, and K. Roeder. 1997. The heritability ofIQ. Nature 388:468–71.
DeVore, I. 1963. A comparison of the ecology and behavior ofmonkeys and apes. In Classification and Human Evolution, ed.S. L. Washburn, pp. 301–9. Chicago: Aldine.
de Waal, F. B. M. 1995. Bonobo sex and society. Scientific Ameri-can 272(3):82–88.
———. 1999. Cultural primatology comes of age. Nature399:635–36.
Diamond, J. 1992a. The arrow of disease. Discover 13 (October):64–73.
———. 1992b. The Third Chimpanzee: The Evolution and Future ofthe Human Animal. New York: HarperCollins.
Doran, D. M., and A. McNeilage. 1998. Gorilla ecology andbehavior. Evolutionary Anthropology 6:120–31.
Duarte, C., J. Maurício, P. B. Pettitt, P. Souto, E. Trinkaus, H. van der Plicht, and J. Zilháo. 1999. The early UpperPaleolithic human skeleton from the Abrigo do Lagar Velho (Portugal) and modern human emergence in Iberia.Proceedings of the National Academy of Sciences, USA 96:7604–9.
REFERENCES 485

Relethford: The Human Species: An Introduction to Biological Anthropology, 5/e
Back Matter References © The McGraw−Hill Companies, 2003
Dunn, F. L. 1968. Epidemiological factors: Health and diseaseamong hunter-gatherers. In Man the Hunter, ed. R. B. Leeand I. DeVore, pp. 221–28. Chicago: Aldine.
Eaton, G. G. 1976. The social order of Japanese macaques.Scientific American 235(4): 96–106.
Eaton, S. B., M. Shostak, and M. Konner. 1988. Stone agers inthe fast lane: Chronic degenerative diseases in evolutionaryperspective. American Journal of Medicine 84:739–49.
Eldredge, N., and S. J. Gould. 1972. Punctuated equilibria: Analternative to phyletic gradualism. In Models in Paleobiology,ed. T. J. M. Schopf, pp. 82–115. San Francisco: Freeman,Cooper.
Ereshefsky, M., ed. 1992. The Units of Evolution: Essays on theNature of Species. Cambridge: MIT Press.
Erlich, H. A., D. Gelfand, and J. J. Sninsky. 1991. Recent advancesin the polymerase chain reaction. Science 252:1643–51.
Eveleth, P. B., and J. M. Tanner. 1990. Worldwide Variation in Hu-man Growth, 2d ed. Cambridge: Cambridge University Press.
Falk, D. 1983. Cerebral cortices of East African early hominids.Science 221:1072–74.
———. 1992. Braindance. New York: Henry Holt.———. 2000. Primate Diversity. New York: W. W. Norton.Falk, D., J. C. Redmond Jr., J. Guyer, G. C. Conroy, W. Recheis,
G. W. Weber, and H. Seidler. 2000. Early hominid brainevolution: A new look at old endocases. Journal of HumanEvolution 38:695–717.
Feder, K. L. 2000. The Past in Perspective: An Introduction to HumanPrehistory. Mountain View, Calif.: Mayfield.
———. 2002. Frauds, Myths, and Mysteries: Science and Pseudosciencein Archaeology, 4th ed. New York: McGraw-Hill.
Fedigan, L. M. 1983. Dominance and reproductive success inprimates. Yearbook of Physical Anthropology 26:91–129.
Fedigan, L. M., and S. C. Strum. 1999. A brief history of pri-mate studies: National traditions, disciplinary origins, andstages in North American field research. In The NonhumanPrimates, ed. P. Dolhinow and A. Fuentes, pp. 258–69.Mountain View, Calif.: Mayfield.
Fisher, H. 1992. Anatomy of Love: A Natural History of Mating,Marriage, and Why We Stray. New York: Ballantine.
Fleagle, J. G. 1995. The origin and radiation of anthropoidprimates. In Biological Anthropology: The State of the Science,ed. N. T. Boaz and L. D. Wolfe, pp. 1–21. Bend, Ore.: Inter-national Institute for Human Evolutionary Research.
———. 1999. Primate Adaptation and Evolution, 2d ed. San Diego:Academic Press.
Fleagle, J. G., D. T. Rasmussen, S. Yirga, T. M. Brown, and F. E.Grine. 1991. New hominid fossils from Fejej, SouthernEthiopia. Journal of Human Evolution 21:145–52.
Flynn, J. J., A. R. Wyss, R. Charrier, and C. C. Swisher. 1995. An early Miocene anthropoid skull from the Chilean Andes.Nature 373:603–7.
Fossey, D. 1983. Gorillas in the Mist. Boston: Houghton Mifflin.Fouts, R., and S. T. Mills. 1997. Next of Kin: What Chimpanzees Have
Taught Me About Who We Are. New York: William Morrow.
Franciscus, R. G., and J. C. Long. 1991. Variation in humannasal height and breadth. American Journal of Physical Anthro-pology 85:419–27.
Frayer, D. W. 1984. Biological and cultural change in the Euro-pean Late Pleistocene and Early Holocene. In The Origins ofModern Humans: A World Survey of the Fossil Evidence, ed. F. H.Smith and F. Spencer, pp. 211–50. New York: Alan R. Liss.
Friedlaender, J. S. 1975. Patterns of Human Variation. Cambridge:Harvard University Press.
Frisancho, A. R. 1990. Introduction: Comparative high-altitudeadaptation. American Journal of Human Biology 2:599–601.
———. 1993. Human Adaptation and Accommodation. Ann Arbor:University of Michigan Press.
Frisancho, A. R., and P. T. Baker. 1970. Altitude and growth: Astudy of the patterns of physical growth of a high altitudePeruvian Quechua population. American Journal of PhysicalAnthropology 32:279–92.
Fuentes, A. 2000. Hylobatid communities: Changing views onpair bonding and social organization in hominoids. Year-book of Physical Anthropology 43:33–60.
Futuyma, D. J. 1983. Science on Trial: The Case for Evolution. NewYork: Pantheon Books.
———. 1986. Evolutionary Biology, 2d ed. Sunderland, Mass.:Sinauer.
Gabriel, T. 1995. A generation’s heritage: After the boom, aboomlet. New York Times, February 12, 1995.
Gabunia, L., A. Vekua, D. Lordkipanidze, C. C. Swisher III, R. Ferring, A. Justus, M. Nioradze, M. Tvalchrelidze, S. C.Antón, G. Bosinski, O. Jöris, M. A. de Lumley, G. Majsur-adze, and A. Mouskhelishvili. 2000. Earliest Pleistocenehominid cranial remains from Dmanisi, Republic of Geor-gia: Taxonomy, geological setting, and age. Science 288:1019–25.
Gagneux, P., C. Wills, U. Gerloff, D. Tautz, P. A. Morin, C. Boesch,B. Fruth, G. Hohmann, O. A. Ryder, and D. S. Woodruff.1999. Mitochondrial sequences show diverse evolutionaryhistories of African hominoids. Proceedings of the NationalAcademy of Science, USA 96:5077–82.
Galdikas, B. M. F., and J. W. Wood. 1990. Birth spacing pat-terns in humans and apes. American Journal of Physical An-thropology 83:185–91.
Garn, S. M. 1965. Human Races, 2d ed. Springfield, Ill.: CharlesC. Thomas.
Garrett, L. 1994. The Coming Plague: Newly Emerging Diseases in aWorld Out of Balance. New York: Farrar, Straus, and Giroux.
Gee, H. 1996. Box of bones “clinches” identity of Piltdownpalaeontology hoaxer. Nature 381:261–2.
Gibbs, S., M. Collard, and B. Wood. 2000. Soft-tissue charactersin higher primate phylogenetics. Proceedings of the NationalAcademy of Sciences, USA 97:11130–32.
Gingerich, P. D. 1986. Plesiadapis and the delineation of theorder Primates. In Major Topics in Primate and Human Evolu-tion, ed. B. Wood, L. Martin, and P. Andrews, pp. 32–46.Cambridge: Cambridge University Press.
486 REFERENCES

Relethford: The Human Species: An Introduction to Biological Anthropology, 5/e
Back Matter References © The McGraw−Hill Companies, 2003
Gingerich, P. D., B. H. Smith, and E. L. Simons. 1990. Hindlimbs of Eocene Basilosaurus: Evidence of feet in whales.Science 249:154–57.
Glass, H. B. 1953. The genetics of the Dunkers. Scientific Ameri-can 189(2): 76–81.
Goldsmith, M. 1999. Gorilla socioecology. In The NonhumanPrimates, ed. P. Dolhinow and A. Fuentes, pp. 58–63. Moun-tain View, Calif.: Mayfield.
Goodall, J. 1986. The Chimpanzees of Gombe: Patterns of Behavior.Cambridge: Harvard University Press.
Goodman, A. H., and T. L. Leatherman, eds. 1998. Building aNew Biocultural Synthesis: Political-Economic Perspectives onHuman Biology. Ann Arbor: University of Michigan Press.
Gould, S. J. 1981. The Mismeasure of Man. New York: W. W. Norton.———. 1983. Hen’s Teeth and Horse’s Toes. New York: W. W. Norton.———. 1991. Bully for Brontosaurus. New York: W. W. Norton.———. 1999. Non-overlapping magisterial. Skeptical Inquirer
23(4):55–61.Gould, S. J., and N. Eldredge. 1977. Punctuated equilibria: The
tempo and mode of evolution reconsidered. Paleobiology3:115–51.
Gould, S. J., and R. C. Lewontin. 1979. The spandrels of SanMarco and the Panglossian paradigm: A critique of theadaptationist programme. Proceedings of the Royal Society ofLondon (Series B), 205:581–98.
Grant, P. R. 1991. Natural selection and Darwin’s finches.Scientific American 265(4): 82–87.
Grant, V. 1985. The Evolutionary Process: A Critical Review ofEvolutionary Theory. New York: Columbia University Press.
Greksa, L. P. 1990. Developmental responses to high-altitudehypoxia in Bolivian children of European ancestry: A test ofthe developmental adaptation hypothesis. American Journalof Human Biology 2:603–12.
———. 1996. Evidence for a genetic basis to the enhanced total lung capacity of Andean highlanders. Human Biology68:119–29.
Grün, R. 1993. Electron spin resonance dating in paleoanthro-pology. Evolutionary Anthropology 2:172–81.
Grün, R., N. J. Shackleton, and H. J. Deacon. 1990. Electron-Spin-Resonance dating of tooth enamel from Klasies RiverMouth. Current Anthropology 31:427–32.
Grün, R., C. B. Stringer, and H. P. Schwartz. 1991. ESR datingof teeth from Garrod’s Tabun cave collection. Journal ofHuman Evolution 20:231–48.
Grün, R., and A. Thorne. 1997. Dating the Ngandong humans.Science 276:1575.
Gunnell, G. F., and E. R. Miller. 2001. Origin of anthropoidea:Dental evidence and recognition of early anthropoids in thefossil record, with comments on the Asian anthropoid ra-diation. American Journal of Physical Anthropology 114:177–91.
Hagelberg, E. 1994. Ancient DNA studies. Evolutionary Anthro-pology 2:199–207.
Haile-Selassie, Y. 2001. Late Miocene hominids from the Mid-dle Awash, Ethiopia. Nature 412:178–81.
Hamer, D. H., S. Hu, V. L. Magnuson, N. Hu, and A. M. L. Pattatucci. 1993. A linkage between DNA markers on the X chromosome and male sexual orientation. Science 261:321–27.
Hammer, M. F., and S. L. Zegura. 1996. The role of the Y chro-mosome in human evolutionary studies. Evolutionary Anthro-pology 5:116–34.
Harcourt, A. H., P. H. Harvey, S. G. Larson, and R. V. Short.1981. Testis weight, body weight, and breeding system inprimates. Nature 293:55–57.
Harding, R. M., S. M. Fullerton, R. C. Griffiths, J. Bond, M. J.Cox, J. A. Schneider, D. S. Moulin, and J. B. Clegg. 1997.Archaic African and Asian lineages in the genetic ancestry of modern humans. American Journal of Human Genetics60:772–89.
Hardy, G. H. 1908. Mendelian proportions in a mixed popula-tion. Science 28:49–50.
Harlow, H. F. 1959. Love in infant monkeys. Scientific American200(6): 68–74.
Harlow, H. F., and M. K. Harlow. 1962. Social deprivation inmonkeys. Scientific American 207(5):136–46.
Harpending, H. C., M. A. Batzer, M. Gurven, L. B. Jorde, A. R.Rogers, and S. T. Sherry. 1998. Genetic traces of ancientdemography. Proceedings of the National Academy of Science,USA 95:1961–67.
Harpending, H. C., and T. Jenkins. 1973. Genetic distanceamong southern African populations. In Methods and Theo-ries of Anthropological Genetics, ed. M. H. Crawford and P. L.Workman, pp. 177–99. Albuquerque: University of NewMexico Press.
Harris, E. E., and J. Hey. 1999. X chromosome evidence forancient human histories. Proceedings of the National Academyof Sciences, USA 96:3320–24.
Harris, M. 1987. Cultural Anthropology, 2d ed. New York: Harper& Row.
Harrison, G. A., J. M. Tanner, D. R. Pilbeam, and P. T. Baker.1988. Human Biology: An Introduction to Human Evolution,Variation, Growth, and Adaptability, 3d ed. Oxford: OxfordUniversity Press.
Hartl, D. L. 1988. A Primer of Population Genetics, 2d ed. Sunder-land, Mass.: Sinauer.
Hartl, D. L., and A. G. Clark. 1997. Principles of Population Genet-ics, 3d ed. Sunderland, Mass.: Sinauer.
Harvey, P. H., R. D. Martin, and T. H. Clutton-Brock. 1987. Life histories in comparative perspective. In Primate Societies,ed. B. B. Smuts, D. L. Cheney, R. M. Seyfarth, R. W. Wrang-ham, and T. T. Struhsaker, pp. 181–96. Chicago: Universityof Chicago Press.
Harvey, P. H., and M. D. Pagel. 1991. The Comparative Method inEvolutionary Biology. Oxford: Oxford University Press.
Hawks, J., S. Oh, K. Hunley, S. Dobson, G. Cabana, P. Dayalu,and M. H. Wolpoff. 2000. An Australasian test of the recentAfrican origin model using the WLH-50 calvarium. Journalof Human Evolution 39:1–22.
REFERENCES 487

Relethford: The Human Species: An Introduction to Biological Anthropology, 5/e
Back Matter References © The McGraw−Hill Companies, 2003
Henneberg, M. 1988. Decrease of human skull size in the Holo-cene. Human Biology 60:395–405.
Herrnstein, R. J., and C. Murray. 1994. The Bell Curve: Intelli-gence and Class Structure in American Life. New York: The FreePress.
Hill, A., S. Ward, A. Deino, G. Curtis, and R. Drake. 1992. Ear-liest Homo. Nature 355:719–22.
Hoff, H., I. Thorneycroft, F. Wilson, and M. Williams-Murphy.2001. Protection afforded by sickle-cell trait (Hb AS): Whathappens when malarial selection pressures are alleviated?Human Biology 73:583–86.
Holden, C., and R. Mace. 1997. Phylogenetic analysis of theevolution of lactose digestion in adults. Human Biology69:605–28.
Holick, M. F., J. A. MacLaughlin, and S. H. Doppelt. 1981.Regulation of cutaneous previtamin D3 photosynthesis inman: Skin pigment is not an essential regulator. Science211:590–93.
Holloway, R. L. 1985. The poor brain of Homo sapiens neander-thalensis: See what you please. In Ancestors: The Hard Evidence,ed. E. Delson, pp. 319–24. New York: Alan R. Liss.
Hooton, E. A. 1946. Up from the Ape. New York: Macmillan.Horai, S., K. Hayasaka, R. Kondo, K. Tsugane, and N. Takahata.
1995. Recent African origin of modern humans revealed by complete sequences of hominoid mitochondrial DNAs.Proceedings of the National Academy of Sciences, USA 92:532–36.
Horr, D. A. 1972. The Borneo orangutan. Borneo Research Bul-letin 4(2):46–50.
Hou, Y., R. Potts, B. Yuan, Z. Gou, A. Deino, W. Wang, J. Clark,G. Xie, and W. Huang. 2000. Mid-Pleistocence Acheulian-like stone technology of the Bose Basin, South China. Science287:1622–26.
Houghton, P. 1993. Neandertal supralaryngeal vocal tract.American Journal of Physical Anthropology 90:139–46.
Houle, A. 1999. The origin of the Platyrrhines: An evaluationof the Antarctic scenario and the floating island model.American Journal of Physical Anthropology 109:541–59.
Howell, N. 2000. Demography of the Dobe !Kung, 2d ed. New York:Aldine de Gruyter.
Howells, W. W. 1989. Skull Shapes and the Map: Craniometric Anal-yses in the Dispersion of Modern Homo. Papers of the PeabodyMuseum, vol. 79. Cambridge: Harvard University.
Hrdy, S. B. 1977. The Langurs of Abu. Cambridge: Harvard Uni-versity Press.
Hrdy, S. B., C. Janson, and C. van Schaik. 1995. Infanticide:Let’s not throw the baby out with the bath water. Evolution-ary Anthropology 3:151–54.
Hu, S., A. M. L. Pattatucci, C. Patterson, L. Li, D. W. Fulker, S. S. Cherny, L. Kruglyak, and D. H. Hamer. 1995. Linkagebetween sexual orientation and chromosome Xq28 in malesbut not in females. Nature Genetics 11:248–56.
Hunt, E. 1995. The role of intelligence in modern society.American Scientist 83:356–68.
International Human Genome Sequencing Consortium. 2001.Initial sequencing and analysis of the human genome.Nature 409:860–921.
Jablonski, N. G., and G. Chaplin. 2000. The evolution of hu-man skin coloration. Journal of Human Evolution 39:57–106.
Jaeger, J-J., T. Thein, M. Benammi, Y. Chaimanee, A. N. Soe, T. Lwin, S. Wai, and S. Ducrocq. 1999. A new primate fromthe Middle Eocene of Myanmar and the Asian early originof anthropoids. Science 286:528–30.
Johanson, D. C., and M. A. Edey. 1981. Lucy: The Beginnings ofHumankind. New York: Simon & Schuster.
Johanson, D. C., F. T. Masau, G. G. Eck, T. D. White, R. C.Walter, W. H. Kimbel, B. Asfaw, P. Manega, P. Ndessokia,and G. Suwa. 1987. New partial skeleton of Homo habilisfrom Olduvai Gorge, Tanzania. Nature 327:205–9.
Johanson, D. C., and T. D. White. 1979. A systematic assess-ment of early African hominids. Science 203:321–30.
Johanson, D. C., T. D. White, and Y. Coppens. 1978. A newspecies of the genus Australopithecus (Primates: Hominidae)from the Pliocene of Eastern Africa. Kirtlandia 28:1–14.
Jolly, A. 1972. The Evolution of Primate Behavior. New York:Macmillan.
———. 1985. The Evolution of Primate Behavior, 2d ed. New York:Macmillan.
Jorde, L. B., A. R. Rogers, M. Bamshad, W. S. Watkins, P. Kra-kowiak, S. Sung, J. Kere, and H. C. Harpending. 1997.Microsatellite diversity and the demographic history ofmodern humans. Proceedings of the National Academy of Sci-ences, USA 94:3100–3.
Karn, M. N., and L. S. Penrose. 1951. Birth weight and gesta-tion time in relation to maternal age, parity, and infantsurvival. Annals of Eugenics 15:206–33.
Katzmarzyk, P. T., and W. R. Leonard. 1998. Climatic influenceson human body size and proportions: Ecological adapta-tions and secular trends. American Journal of Physical Anthro-pology 106:483–503.
Kennedy, K. A. R. 1976. Human Variation in Space and Time.Dubuque, Iowa: Wm. C. Brown.
Kimbel, W. H., D. C. Johanson, and Y. Rak. 1994. The first skulland other new discoveries of Australopithecus afarensis atHadar, Ethiopia. Nature 368:449–51.
Kimbel, W. H., R. C. Walter, D. C. Johanson, K. E. Reed, J. L.Aronson, Z. Assefa, C. W. Marean, G. G. Eck, R. Bobe, E. Hovers, Y. Rak, C. Vondra, T. Yemane, D. York, Y. Chen,N. M. Evenson, and P. E. Smith. 1996. Late Pliocene Homoand Oldowan tools from the Hadar formation (Kada Hadar Member), Ethiopia. Journal of Human Evolution 31:549–61.
King, M. C., and A. C. Wilson. 1975. Evolution at two levels:Molecular similarities and biological differences betweenhumans and chimpanzees. Science 188:107–16.
Kitcher, P. 1982. Abusing Science: The Case Against Creationism.Cambridge: MIT Press.
488 REFERENCES

Relethford: The Human Species: An Introduction to Biological Anthropology, 5/e
Back Matter References © The McGraw−Hill Companies, 2003
Klein, R. G. 1999. The Human Career: Human Biological and Cul-tural Origins, 2d. ed. Chicago: University of Chicago Press.
Kochanek, K. D., B. L. Smith, and R. N. Anderson. 2001. Deaths:Preliminary data for 1999. National Vital Statistics Reports,vol. 49, no. 3. National Center for Health Statistics, Centersfor Disease Control and Prevention.
Kollar, E. J., and C. Fisher. 1980. Tooth induction in chick epi-thelium: Expression of quiescent genes for enamel synthesis.Science 207:993–95.
Kramer, A. 1991. Modern human origins in Australasia: Re-placement or evolution? American Journal of Physical Anthro-pology 86:455–73.
———. 1993. Human taxonomic diversity in the Pleistocene:Does Homo erectus represent multiple hominid species?American Journal of Physical Anthropology 91:161–71.
Kramer, A., S. M. Donnelly, J. H. Kidder, S. D. Ousley, and S. M.Olah. 1995. Craniometric variation in large-bodied homi-noids: Testing the single-species hypothesis for Homo habilis.Journal of Human Evolution 29:443–62.
Krimsky, S. 2000. Hormonal Chaos: The Scientific and Social Originsof the Environmental Endocrine Hypothesis. Baltimore: JohnsHopkins University Press.
Krings, M., C. Capelli, F. Tschentscher, H. Geisert, S. Meyer, A. von Haeseler, K. Grossschmidt, G. Possnert, M. Paunovic,and S. Pääbo. 2000. A view of Neandertal genetic diversity.Nature Genetics 26:144–46.
Krings, M., H. Geisert, R. W. Schmitz, H. Krainitzki, and S. Pääbo.1999. DNA sequence of the mitochondrial hypervariableregion II from the Neandertal type specimen. Proceedings ofthe National Academy of Sciences, USA 96:5581–85.
Krings, M., A. Stone, R. W. Schmitz, H. Krainitzki, M. Stone-king, and S. Pääbo. 1997. Neandertal DNA sequences andthe origin of modern humans. Cell 90:19–30.
Laitman, J. T., R. C. Heimbuch, and E. S. Crelin. 1979. The basi-cranium of fossil hominids as an indicator of their upperrespiratory systems. American Journal of Physical Anthropology51:15–34.
Larsen, C. S. 1994. In the wake of Columbus: Native popula-tion biology in the postcontact Americas. Yearbook of Physi-cal Anthropology 37:109–54.
———. 2000. Skeletons in Our Closet: Revealing Our Past throughBioarchaeology. Princeton: Princeton University Press.
Larsen, C. S., R. M. Matter, and D. L. Gebo. 1998. Human Origins: The Fossil Record, 3d ed. Prospect Heights, Ill.: Waveland.
Larson, E. J. 1997. Summer for the Gods: The Scopes Trial andAmerica’s Continuing Debate Over Science and Religion. Cam-bridge, Mass.: Harvard University Press.
Larson, S. G. 1998. Parallel evolution in the hominoid trunkand forelimb. Evolutionary Anthropology 6:87–99.
Leakey, L. S. B., P. V. Tobias, and J. R. Napier. 1964. A newspecies of the genus Homo from Olduvai Gorge. Nature202:7–10.
Leakey, M. G., C. S. Feibel, I. McDougall, and A. Walker. 1995.New four-million-year-old hominid species from Kanapoiand Allia Bay, Kenya. Nature 376:565–71.
Leakey, M. G., C. S. Feibel, I. McDougall, C. Ward, and A. Walker. 1998. New specimens and confirmation of anearly age for Australopithecus anamensis. Nature 393:62–66.
Leakey, M. G., F. Spoor, P. N. Gathogo, C. Kiarie, L. N. Leakey,and I. McDougall. 2001. New hominin genus from easternAfrica shows diverse middle Plioecene lineages. Nature410:433–40.
Lee, R. B. 1968. What hunters do for a living, or, how to makeout on scarce resources. In Man the Hunter, ed. R. B. Lee andI. DeVore, pp. 30–48. Chicago: Aldine.
Leidy, L. E. 1998. Accessory eggs, follicular atresia, and theevolution of human menopause. American Journal of PhysicalAnthropology, Supp. 26:148–49 (abstract).
Leonard, W. H., T. L. Leatherman, J. W. Carey, and R. B. Thomas.1990. Contributions of nutrition versus hypoxia to growthin rural Andean populations. American Journal of HumanBiology 2:613–26.
Leonard, W. R. 2000. Human nutritional evolution. In HumanBiology: An Evolutionary and Biocultural Perspective, ed. S. Stinson, B. Bogin, R. Huss-Ashmore, and D. O’Rourke,pp. 295–343. New York: John Wiley & Sons.
Leonard, W. R., and M. L. Robertson. 1995. Energetic efficiencyof human bipedality. American Journal of Physical Anthropol-ogy 97:335–38.
Lerner, I. M., and W. J. Libby. 1976. Heredity, Evolution, andSociety. San Francisco: W. H. Freeman.
Lerner, L. S. 2000. Good Science, Bad Science: Teaching Evolution in the States. Thomas B. Fordham Foundation. Available onthe Internet at: http://www.edexcellence.net/library/lerner/gsbsteits.html.
Leutenegger, W. 1982. Sexual dimorphism in nonhuman pri-mates. In Sexual Dimorphism in Homo sapiens: A Question ofSize, ed. R. L. Hall, pp. 11–36. New York: Praeger.
Levins, R., T. Awerbuch, U. Brinkman, I. Eckardt, P. Epstein, N. Makhoul, C. A. de Possas, C. Puccia, A. Spielman, and M. E. Wilson. 1994. The emergence of new diseases. Ameri-can Scientist 82:52–60.
Lewin, R. 1998. Principles of Human Evolution: A Core Textbook.Malden, Mass.: Blackwell Science.
Lewis, D. E., Jr. 1990. Stress, migration, and blood pressure inKiribati. American Journal of Human Biology 2:139–51.
Lieberman, D. E. 1998. Sphenoid shortening and the evolutionof modern cranial shape. Nature 393:158–62.
———. 2001. Another face in our family tree. Nature 410:419–20.Lieberman, P., and E. S. Crelin. 1971. On the speech of Nean-
derthal. Linguistic Inquiry 2:203–22.Linden, E. 1981. Apes, Men, and Language, rev. ed. Middlesex,
England: Penguin Books.Little, M. A., and P. T. Baker. 1988. Migration and adapta-
tion. In Biological Aspects of Human Migration, ed. C. G. N.
REFERENCES 489

Relethford: The Human Species: An Introduction to Biological Anthropology, 5/e
Back Matter References © The McGraw−Hill Companies, 2003
Mascie-Taylor and G. W. Lasker, pp. 167–215. Cambridge:Cambridge University Press.
Livi-Bacci, M. 1997. A Concise History of World Population, 2d ed.Oxford: Blackwell.
Livingstone, F. B. 1958. Anthropological implications of sicklecell gene distribution in West Africa. American Anthropologist60:533–62.
———. 1964. On the nonexistence of human races. In The Con-cept of Race, ed. A. Montagu, pp. 46–60. New York: Collier.
———. 1984. The Duffy blood groups, vivax malaria, andmalaria selection in human populations: A review. HumanBiology 56:413–25.
Loehlin, J. C., G. Lindzey, and J. N. Spuhler. 1975. Race Differ-ences in Intelligence. San Francisco: W. H. Freeman.
Loomis, W. F. 1967. Skin-pigment regulation of vitamin-Dbiosynthesis in man. Science 157:501–6.
Lovejoy, C. O. 1981. The origin of man. Science 211:341–50.Lutz, W., W. Sanderson, and S. Scherbov. 1997. Doubling of
world population unlikely. Nature 387:803–5.———. 2001. The end of world population growth. Nature
412:543–45.Mackintosh, N. J. 1998. IQ and Human Intelligence. Oxford:
Oxford University Press.Madrigal, L. 1989. Hemoglobin genotype, fertility, and the
malaria hypothesis. Human Biology 61:311–25.Malina, R. M. 1975. Growth and Development: The First Twenty
Years in Man. Minneapolis, Minn.: Burgess.———. 1979. Secular changes in size and maturity: Causes and
effects. Monograph for the Society of Research in Child Develop-ment 44:59–102.
Markham, R., and C. P. Groves. 1990. Brief communication:Weights of wild orangutans. American Journal of PhysicalAnthropology 81:1–3.
Marks, J. 1995. Human Biodiversity: Genes, Races, and History.New York: Aldine de Gruyter.
Mascia-Lees, F. E., J. H. Relethford, and T. Sorger. 1986. Evolu-tionary perspectives on permanent breast enlargement inhuman females. American Anthropologist 88:423–28.
Mayr, E. 1982. The Growth of Biological Thought. Cambridge:Harvard University Press.
McBrearty, S., and A. S. Brooks. 2000. The revolution thatwasn’t: A new interpretation of the origin of modern humanbehavior. Journal of Human Evolution 39:453–563.
McElroy, A., and P. K. Townsend. 1989. Medical Anthropology in Ecological Perspective, 2d ed. Boulder, Colo.: WestviewPress.
McEvedy, C. 1988. The bubonic plague. Scientific American258(2): 118–23.
McGrew, W. C. 1992. Chimpanzee Material Culture. Cambridge:Cambridge University Press.
———. 1998. Culture in nonhuman primates? Annual Review ofAnthropology 27:301–28.
McHenry, H. M. 1992. How big were the early hominids? Evolu-tionary Anthropology 1:15–20.
———. 1996. Homoplasy, clades, and hominid phylogeny. InContemporary Issues in Human Evolution, ed. W. E. Meikle, F. C. Howell, and N. G. Jablonski, pp. 77–92. San Francisco:California Academy of Sciences.
McKenna, J. J. 1996. Sudden Infant Death Syndrome in cross-cultural perspective: Is infant–parent cosleeping protective?Annual Review of Anthropology 25:201–16.
McKenzie, R. L., and J. M. Elwood. 1990. Intensity of solarultraviolet radiation and its implications for skin cancer.New Zealand Medical Journal 103:152–54.
McNeill, W. H. 1977. Plagues and Peoples. New York: Doubleday.Meindl, R. S., and A. C. Swedlund. 1977. Secular trends in mor-
tality in the Connecticut River Valley, 1700–1850. HumanBiology 49:389–414.
Miller, J. M. A. 2000. Cranifacial variation in Homo habilis:An analysis of the evidence for multiple species. AmericanJournal of Physical Anthropology 112:103–28.
Mittermeier, R. A., and E. J. Sterling. 1992. Conservation ofprimates. In The Cambridge Encyclopedia of Human Evolution,ed. S. Jones, R. Martin, and D. Pilbeam, pp. 33–36. Cam-bridge: Cambridge University Press.
Molnar, S. 1998. Human Variation: Races, Types and Ethnic Groups,4th ed. Englewood Cliffs, N.J.: Prentice-Hall.
Molnar, S., and I. M. Molnar. 2000. Environmental Change andHuman Survival: Some Dimensions of Human Ecology. UpperSaddle River, N.J.: Prentice Hall.
Montagu, A., ed. 1984. Science and Creationism. Oxford: OxfordUniversity Press.
Moran, E. F. 1982. Human Adaptability: An Introduction to Ecologi-cal Anthropology. Boulder, Colo.: Westview Press.
Mosko, S., C. Richard, J. McKenna, S. Drummond, and D. Mu-kai. 1997. Maternal proximity and infant CO2 environmentduring bedsharing and possible implications for SIDS re-search. American Journal of Physical Anthropology 103:315–28.
National Academy of Sciences. 1989. Recommended DietaryAllowances, 10th ed. Washington: National Academy Press.
Noad, M. J., D. H. Cato, M. M. Bryden, M-N. Jenner, and K. C.S. Jenner. 2000. Cultural revolution in whale songs. Nature408:537.
North, K. E., L. J. Martin, and M. H. Crawford. 2000. Theorigins of the Irish travelers and the genetic structure ofIreland. Annals of Human Biology 27:453–65.
Oates, J. F. 1987. Food distribution and foraging behavior. InPrimate Societies, ed. B. B. Smuts, D. L. Cheney, R. M. Seyfarth,R. W. Wrangham, and T. T. Struhsaker, pp. 197–209. Chi-cago: University of Chicago Press.
Olshansky, S. J., B. A. Carnes, and C. Cassel. 1990. In search ofMethuselah: Estimating the upper limit to human longev-ity. Science 250:634–40.
Olshansky, S. J., B. A. Carnes, and A. Désesquelles. 2001. Pros-pects for human longevity. Science 291:1491–92.
Omran, A. R. 1977. Epidemiologic transition in the UnitedStates: The health factor in population change. PopulationBulletin 32:3–42.
490 REFERENCES
Relethford: The Human Species: An Introduction to Biological Anthropology, 5/e
Back Matter References © The McGraw−Hill Companies, 2003
O’Sullivan, P. B., M. Morwood, D. Hobbs, F. A. Suminto, M. Situmorang, A. Raza, and R. Maas. 2001. Archaeologicalimplications of the geology and chronology of the SoaBasin, Flores, Indonesia. Geology 29:607–10.
Ovchinnikov, I., A. Götherstrom, G. P. Romanova, V. M. Khari-tonov, K. Lidén, and W. Goodwin. 2000. Molecular analysisof Neanderthal DNA from the northern Caucasus. Nature404:490–93.
Paigen, B., L. R. Goldman, M. M. Magnant, J. H. Highland, and A. T. Steegmann Jr. 1987. Growth of children livingnear the hazardous waste site, Love Canal. Human Biology59:489–508.
Pasachoff, J. M. 1979. Astronomy: From the Earth to the Universe.Philadelphia: W. B. Saunders.
Passingham, R. 1982. The Human Primate. San Francisco: W. H.Freeman.
Pattatucci, A. M. 1998. Molecular investigations into complexbehavior: Lessons from sexual orientation studies. HumanBiology 70:367–86.
Pavelka, M. S. M., and L. M. Fedigan. 1991. Menopause: Acomparative life history perspective. Yearbook of PhysicalAnthropology 34:13–38.
Pawlowski, B. 1999. Permanent breasts as a side effect of sub-cutaneous fat tissue increase in human evolution. Homo50:149–62.
Peccei, J. S. 2001. Menopause: Adaptation or epiphenomenon?Evolutionary Anthropology 10:43–57.
Pennington, R. L. 1996. Causes of early human popula-tion growth. American Journal of Physical Anthropology99:259–74.
Pennisi, E. 2001. The human genome. Science 291:1177–80.Pennock, R. T. 1999. Tower of Babel: The Evidence against the New
Creationism. Cambridge, Mass.: MIT Press.Penny, D., M. Steel, P. J. Waddell, and M. D. Hendy. 1995.
Improved analyses of human mtDNA sequences support a recent African origin for Homo sapiens. Molecular Biologyand Evolution 12:863–82.
Pianka, E. R. 1983. Evolutionary Ecology, 3d ed. New York:Harper & Row.
Pickford, M., and B. Senut. 2001. The geological and faunalcontext of Late Miocene hominid remains from Lukeino,Ethiopia. Comptes Rendus de l’Académie des Sciences, Paris332:145–52.
Pier, G. B., M. Grout, T. Zaidi, G. Meluleni, S. S. Mueschenborn,G. Banting, R. Ratcliff, M. J. Evans, and W. H. Colledge.1998. Salmonella typhi uses CFTR to enter intestinal epithe-lial cells. Nature 393:79–82.
Pilbeam, D. 1982. New hominoid skull material from theMiocene of Pakistan. Nature 295:232–34.
———. 1984. The descent of hominoids and hominids. ScientificAmerican 250(3): 84–96.
Pilbeam, D., M. D. Rose, J. C. Barry, and S. M. Ibrahim Shah.1990. New Sivapithecus humeri from Pakistan and the rela-tionship of Sivapithecus and Pongo. Nature 348:237–39.
Pillard, R. C., and M. Bailey. 1998. Human sexual orientationhas a heritable component. Human Biology 70:347–65.
Plomin, R., M. J. Owen, and P. McGuffin. 1994. The geneticbasis of complex human behaviors. Science 264:1733–39.
Ponce de León, M., and C. P. E. Zollikofer. 2001. Neanderthalcranial ontogeny and its implications for late hominiddiversity. Nature 412:534–38.
Pope, G. G. 1989. Bamboo and human evolution. NaturalHistory, October:49–56.
Population Reference Bureau. 2001. 2001 World Population DataSheet. Washington, D.C. Available on the Internet at: http://www.prb.org/pubs/wpds2001/.
Post, P. W., F. Daniels Jr., and R. T. Binford Jr. 1975. Cold injuryand the evolution of “white” skin. Human Biology 47:65–80.
Potts, M. 1988. Birth control. In The New Encyclopaedia Britan-nica, vol. 15, pp. 113–20. Chicago: Encyclopaedia Britannica.
Potts, R. 1984. Home bases and early hominids. AmericanScientist 72:338–47.
Pusey, A., J. Williams, and J. Goodall. 1997. The influence ofdominance rank on the reproductive success of femalechimpanzees. Science 277:828–31.
Rak, Y. 1986. The Neanderthal: A new look at an old face.Journal of Human Evolution 15:151–64.
Rak, Y., and B. Arensburg. 1987. Kebara 2 Neanderthal pelvis:First look at a complete inlet. American Journal of PhysicalAnthropology 73:227–31.
Relethford, J. H. 1992. Cross-cultural analysis of migrationrates: Effects of geographic distance and population size.American Journal of Physical Anthropology 89:459–66.
———. 1994. Craniometric variation among human popula-tions. American Journal of Physical Anthropology 95:53–62.
———. 1997. Hemispheric difference in human skin color.American Journal of Physical Anthropology 104:449–57.
———. 2001a. Absence of regional affinities of Neandertal DNA with living humans does not reject multiregional evo-lution. American Journal of Physical Anthropology 115:95–98.
———. 2001b. Ancient DNA and the origin of modern hu-mans. Proceedings of the National Academy of Sciences, USA 98:390–91.
———. 2001c. Genetics and the Search for Modern Human Origins.New York: John Wiley & Sons.
Relethford, J. H., and J. Blangero. 1990. Detection of differen-tial gene flow from patterns of quantitative variation.Human Biology 62:5–25.
Relethford, J. H., and M. H. Crawford. 1995. Anthropometricvariation and the population history of Ireland. AmericanJournal of Physical Anthropology 96:25–38.
Relethford, J. H., and H. C. Harpending. 1994. Craniometricvariation, genetic theory, and modern human origins.American Journal of Physical Anthropology 95:249–70.
Relethford, J. H., and L. B. Jorde. 1999. Genetic evidence forlarger African population size during recent human evolu-tion. American Journal of Physical Anthropology 108:251–60.
Richard, A. F. 1985. Primates in Nature. New York: W. H. Freeman.
REFERENCES 491

Relethford: The Human Species: An Introduction to Biological Anthropology, 5/e
Back Matter References © The McGraw−Hill Companies, 2003
Richmond, B. G., and D. S. Strait. 2000. Evidence that hu-mans evolved from a knuckle-walking ancestor. Nature 404:382–85.
Rightmire, G. P. 1990. The Evolution of Homo erectus: Compara-tive Anatomical Studies of an Extinct Human Species. Cambridge:Cambridge University Press.
———. 1992. Homo erectus: Ancestor or evolutionary side branch?Evolutionary Anthropology 1:43–49.
———. 1996. The human cranium from Bodo, Ethiopia: Evi-dence for speciation in the Middle Pleistocene? Journal ofHuman Evolution 31:21–39.
Roberts, D. F. 1968. Genetic effects of population size reduc-tion. Nature 220:1084–88.
———. 1978. Climate and Human Variability, 2d ed. Menlo Park,Calif.: Benjamin Cummings.
Robins, A. H. 1991. Biological Perspectives on Human Pigmentation.Cambridge: Cambridge University Press.
Rodman, D. M., and S. Zamudio. 1991. The cystic fibrosisheterozygote—advantage in surviving cholera? MedicalHypotheses 36:253–58.
Rodman, P. S., and H. M. McHenry. 1980. Bioenergetics andthe origin of human bipedalism. American Journal of PhysicalAnthropology 52:103–6.
Rogers, A. R. 1995. Genetic evidence for a Pleistocene popula-tion explosion. Evolution 49:608–15.
Rogers, A. R., and L. B. Jorde. 1995. Genetic evidence on mod-ern human orgins. Human Biology 67:1–36.
Rowell, T. E. 1966. Forest-living baboons in Uganda. Journal ofZoology, London 149:344–64.
Roychoudhury, A. K., and M. Nei. 1988. Human PolymorphicGenes: World Distribution. Oxford: Oxford University Press.
Ruff, C. B. 1994. Morphological adaptations to climate inmodern and fossil hominids. Yearbook of Physical Anthropol-ogy 37:65–107.
Ruff, C. B., E. Trinkaus, and T. W. Holliday. 1997. Body massand encephalization in Pleistocene Homo. Nature 387:173–76.
Sagan, C. 1977. The Dragons of Eden: Speculations on the Evolutionof Human Intelligence. New York: Ballantine Books.
Sarich, V. M., and A. C. Wilson. 1967. Immunological timescale for hominoid evolution. Science 158:1200–3.
Savage-Rumbaugh, S., and R. Lewin. 1994. Kanzi: The Ape at theBrink of the Human Mind. New York: John Wiley & Sons.
Scammon, R. E. 1930. The measurement of the body in child-hood. In The Measurement of Man, ed. J. A. Harris, C. M.Jackson, D. G. Paterson, and R. E. Scammon, pp. 171–215.Minneapolis: University of Minnesota Press.
Scarr, S., and A. Weinberg. 1978. Attitudes, interests, and IQ.Human Nature 1(4):29–36.
Schell, L. M. 1991. Effects of pollutants on human prenataland postnatal growth: Noise, lead, polychlorobiphenyl com-pounds, and toxic wastes. Yearbook of Physical Anthropology34:157–88.
Schepartz, L. A. 1993. Language and modern human origins.Yearbook of Physical Anthropology 36:91–126.
Schick, K. D., and N. Toth. 1993. Making Silent Stones Speak:Human Evolution and the Dawn of Technology. New York:Simon and Schuster.
Schoenemann, P. T., T. F. Budinger, V. M. Sarich, and W. S-Y.Wang. 2000. Brain size does not predict general cognitiveability within families. Proceedings of the National Academy ofSciences, USA 97:4932–37.
Schopf, J. W., ed. 1992. Major Events in the History of Life. Boston:Jones and Bartlett.
———. 1999. Cradle of Life: The Discovery of Earth’s Earliest Fossils.Princeton: Princeton University Press.
Schow, D. J., and J. Frentzen. 1986. The Outer Limits: The OfficialCompanion. New York: Ace.
Schwartz, J. H. 1987. The Red Ape: Orangutan-utans and HumanOrigins. Boston: Houghton Mifflin.
Seckler, D. 1980. Malnutrition: An intellectual odyssey. WesternJournal of Agricultural Economics 5:219–27.
Sellen, D. W. 2001. Relationships between fertility, mortality,and subsistence: Results of recent phylogenetic analyses. In Humanity from African Naissance to Coming Millennia, ed. P. V. Tobias, M. A. Raath, J. Moggi-Cecchi, and G. A. Doyle,pp. 51–64. Firenze, Italy: Firenze University Press.
Senut, B., M. Pickford, D. Gommery, P. Mein, K. Cheboi, and Y. Coppens. 2001. First hominid from the Miocene (Lukeinoformation, Kenya). Comptes Rendus de l’Académie des Sciences,Paris 332:137–44.
Shea, B. T., and A. M. Gomez. 1988. Tooth scaling and evolu-tionary dwarfism: An investigation of allometry in hu-man pygmies. American Journal of Physical Anthropology 77:117–32.
Sheehan, P. M., D. E. Fastovsky, R. G. Hoffman, C. B. Berghaus,and D. L. Gabriel. 1991. Sudden extinction of the dino-saurs: Latest Cretaceous, Upper Great Plains, U.S.A. Science254:835–39.
Sherry, S. T., A. R. Rogers, H. Harpending, H. Soodyall, T. Jenkins,and M. Stoneking. 1994. Mismatch distributions of mtDNAreveal recent human populations expansions. Human Biology66:761–75.
Smail, J. K. 1997. Beyond population stabilization: The case fordramatically reducing global human numbers. Politics andthe Life Sciences 16:182–236.
Small, M. 1992. A reasonable sleep. Discover, April 1992.Smith, F. H., A. B. Falsetti, and S. M. Donnelly. 1989. Modern
human origins. Yearbook of Physical Anthropology 32:35–68.Smith, F. H., E. Trinkaus, P. B. Pettitt, I. Karavanic, and
M. Paunovic. 1999. Direct radiocarbon dates for Vindija G1and Velika Pecina Late Pleistocene hominid remains. Pro-ceedings of the National Academy of Sciences, USA 96:12281–86.
Smouse, P. E. 1982. Genetic architecture of swidden agricul-tural tribes from the lowland rain forests of South America.In Current Developments in Anthropological Genetics. vol. 2,
492 REFERENCES

Relethford: The Human Species: An Introduction to Biological Anthropology, 5/e
Back Matter References © The McGraw−Hill Companies, 2003
Ecology and Population Structure, ed. M. H. Crawford and J. H. Mielke, pp. 139–78. New York: Plenum Press.
Snowden, C. T. 1990. Language capacities of nonhuman ani-mals. Yearbook of Physical Anthropology 33:215–43.
Spencer, M. A., and B. Demes. 1993. Biomechanical analysis of masticatory system configuration in Neandertals andInuits. American Journal of Physical Anthropology 91:1–20.
Stern, J. T., Jr., and R. L. Susman. 1983. The locomotor anat-omy of Australopithecus afarensis. American Journal of PhysicalAnthropology 60:279–317.
Stone, A. C., and M. Stoneking. 1993. Ancient DNA from a Pre-Columbian Amerindian population. American Journal ofPhysical Anthropology 92:463–71.
Stoneking, M. 1993. DNA and recent human evolution. Evolu-tionary Anthropology 2:60–73.
Stoneking, M., J. J. Fontius, S. L. Clifford, H. Soodyall, S. S.Arcot, N. Sasha, T. Jenkins, M. A. Tahir, P. L. Deininger, andM. A. Batzer. 1997. Alu insertion polymorphisms and humanevolution: Evidence for a larger population size in Africa.Genome Research 7:1061–71.
Stoner, B. P., and E. Trinkaus. 1981. Getting a grip on theNeandertals: Were they all thumbs? American Journal ofPhysical Anthropology 54:281–82.
Strachan, T., and A. P. Read. 1996. Human Molecular Genetics.New York: John Wiley & Sons.
Strait, D. S., F. E. Grine, and M. A. Moniz. 1997. A reappraisal ofearly hominid phylogeny. Journal of Human Evolution 32:17–82.
Strier, K. B. 2000. Primate Behavioral Ecology. Boston: Allyn andBacon.
Stringer, C., and C. Gamble. 1993. In Search of the Neanderthals:Solving the Puzzle of Human Origins. New York: Thames andHudson.
Stringer, C., and R. McKie. 1996. African Exodus: The Origins ofModern Humanity. New York: Henry Holt.
Stringer, C. B., and P. Andrews. 1988. Genetic and fossil evidencefor the origin of modern humans. Science 239:1263–68.
Strum, S. C., and W. Mitchell. 1987. Baboon models and mud-dles. In The Evolution of Human Behavior: Primate Models, ed.W. G. Kinzey, pp. 87–104. Albany, N.Y.: State University ofNew York Press.
Sturm, R. A., N. F. Box, and M. Ramsay. 1998. Human pigmen-tation genetics: The difference is only skin deep. BioEssays20:712–21.
Susman, R. L. 1988. Hand of Paranthropus robustus from Mem-ber I, Swartkrans: Fossil evidence for tool behavior. Science240:781–84.
Sussman, R. W. 1991. Primate origins and the evolution ofangiosperms. American Journal of Primatology 23:209–23.
Sussman, R. W., J. M. Cheverud, and T. Q. Bartlett. 1995. Infantkilling as an evolutionary strategy: Reality or myth? Evolu-tionary Anthropology 3:149–51.
Sutton, H. E., and R. P. Wagner. 1985. Genetics: A Human Con-cern. New York: Macmillan.
Suwa, G., B. Asfaw, Y. Beyene, T. D. White, S. Katoh, S. Naga-oka, H. Nakaya, K. Uzawa, P. Renne, and G. WoldeGabriel.1997. The first skull of Australopithecus boisei. Nature 389:489–92.
Swedlund, A. C., and G. J. Armelagos. 1976. Demographic Anthro-pology. Dubuque, Iowa: Wm. C. Brown.
Swisher, C. C., G. H. Curtis, T. Jacob, A. G. Getty, A. Suprijo,and Widiasmoro. 1994. Age of the earliest known hominidsin Java, Indonesia. Science 263:1118–21.
Swisher, C. C., W. J. Rink, S. C. Antón, H. P. Schwarcz, G. H.Curtis, A. Suprijo, and Widiasmoro. 1996. Latest Homoerectus of Java: Potential contemporaneity with Homo sapiensin southeast Asia. Science 274:1870–4.
Tattersall, I. 1995. The Fossil Trail: How We Know What We ThinkWe Know About Human Evolution. New York: Oxford Univer-sity Press.
———. 1997. Out of Africa again . . . and again? Scientific Ameri-can 276(4):60–7.
Tattersall, I., and J. H. Schwartz. 1999. Hominids and hybrids:The place of Neanderthals in human evolution. Proceedingsof the National Academy of Sciences, USA 96:7117–19.
Tchernov, E., O. Rieppel, H. Zaher, M. J. Polcyn, and L. L. Jacobs.2000. A fossil snake with limbs. Science 287:2010–12.
Teaford, M. F., and P. S. Ungar. 2000. Diet and the evolution of the earliest human ancestors. Proceedings of the NationalAcademy of Sciences, USA 97:13506–11.
Templeton, A. R. 1997. Testing the Out of Africa replacementhypothesis with mitochondrial DNA data. In ConceptualIssues in Modern Human Origins Research, ed. G. A. Clark andC. M. Willermet, pp. 329–60. New York: Aldine de Gruyter.
———. 1998. Human races: A genetic and evolutionary perspec-tive. American Anthropologist 100:632–50.
Terrace, H. S. 1979. Nim: A Chimpanzee Who Learned Sign Lan-guage. New York: Knopf.
Thorne, A. G., and M. H. Wolpoff. 1992. The multi-regionalevolution of humans. Scientific American 266(4): 76–83.
Tills, D., P. Teesdale, and A. E. Mourant. 1977. Blood groups ofthe Irish. Annals of Human Biology 4:23–34.
Tobias, P. V. 1971. The Brain in Hominid Evolution. New York:Columbia University Press.
Trinkaus, E. 1981. Neanderthal limb proportions and coldadaptation. In Aspects of Human Evolution, ed. C. B. Stringer,pp. 187–224. London: Taylor and Francis.
Trinkaus, E., and P. Shipman. 1992. The Neandertals: Changingthe Image of Mankind. New York: Knopf.
Tuljapurkar, S., N. Li, and C. Boe. 2000. A universal pattern ofmortality decline in the G7 countries. Nature 405:789–92.
Underwood, J. H. 1979. Human Variation and Human Microevolu-tion. Englewood Cliffs, N.J.: Prentice-Hall.
UNICEF. 1998. The State of the World’s Children 1998. Oxford:Oxford University Press.
U.S. Bureau of the Census. 1999. World Population Profile 1998.Washington, D.C.: U.S. Government Printing Office.
REFERENCES 493

Relethford: The Human Species: An Introduction to Biological Anthropology, 5/e
Back Matter References © The McGraw−Hill Companies, 2003
van Schaik, C. P., and C. Knott. 1998. Orangutan culture? Ameri-can Journal of Physical Anthropology, Supp. 26:233 (abstract).
Vaughan, W. E., and A. J. Fitzpatrick. 1978. Irish Historical Sta-tistics: Population, 1821–1971. Dublin: Royal Irish Academy.
Venter, J. C., et al. 2001. The sequence of the human genome.Science 291:1304–51.
Ventura, S. J., J. A. Martin, S. C. Curtin, and T. J. Mathews.1999. Births: Final data for 1997. National Vital Statistics Re-ports, vol. 47, no. 18. National Center for Health Statistics,Centers for Disease Control and Prevention.
Vianna, N. J., and A. K. Polan. 1984. Incidence of low birthweight among Love Canal residents. Science 226:1217–19.
Vigilant, L., M. Stoneking, H. Harpending, K. Hawkes, and A. C. Wilson. 1991. African populations and the evolutionof human mitochondrial DNA. Science 253:1503–7.
Vogel, G. 2001. Objection #2: Why sequence the junk? Science291:1184.
Walker, A., and M. Teaford. 1989. The hunt for Proconsul. Scien-tific American 260(1): 76–82.
Ward, C., M. Leakey, and A. Walker. 1999. The new hominidspecies Australopithecus anamensis. Evolutionary Anthropology7:197–205.
Ward, C. V., A. Walker, and M. F. Teaford. 1991. Proconsul didnot have a tail. Journal of Human Evolution 21:215–20.
Ward, S., B. Brown, A. Hill, J. Kelley, and W. Downs. 1999.Equatorius: A new hominoid genus from the Middle Mioceneof Kenya. Science 285:1382–86.
Washburn, S. L. 1960. Tools and human evolution. ScientificAmerican 203:62–75.
Weeks, J. R. 1981. Population: An Introduction to Concepts and Issues,2d ed. Belmont, Calif.: Wadsworth.
Weiner, J. 1994. The Beak of the Finch. New York: Vintage Books.Weiner, S., Q. Xu, P. Goldberg, J. Liu, and O. Bar-Yosef. 1998.
Evidence for the use of fire at Zhoukoudian, China. Science281:251–53.
Weiss, K. M. 1984. On the number of members of the genusHomo who have ever lived, and some evolutionary implica-tions. Human Biology 56:637–49.
Weitz, C. A., R. M. Garruto, C-T Chin, J-C Liu, R-L Liu, and X. He. 2000. Morphological growth of Han boys and girlsborn and raised near sea level and at high altitude in west-ern China. American Journal of Human Biology 12:665–81.
Wheeler, P. E. 1991. The thermoregulatory advantage of homi-nid bipedalism in open equatorial environments: The con-tribution of increased convective heat loss and cutaneousevaporative cooling. Journal of Human Evolution 21:107–15.
White, F. 1996. Pan paniscus 173 to 1996: Twenty-three years offield research. Evolutionary Anthropology 5:11–17.
White, R., and J. M. Lalouel. 1988. Chromosome mapping withDNA markers. Scientific American 258:40–48.
White, T. D. 1995. Corrigendum: Australopithecus ramidus, a new species of early hominid from Aramis, Ethiopia. Nature375:88.
White, T. D., G. Suwa, and B. Asfaw. 1994. Australopithecusramidus, a new species of early hominid from Aramis,Ethiopia. Nature 371:306–12.
White, T. D., G. Suwa, S. Simpson, and B. Asfaw. 2000. Jawsand teeth of Australopithecus afarensis from Maka, MiddleAwash, Ethiopia. American Journal of Physical Anthropology111:45–68.
Whiten, A., J. Goodall, W. C. McGrew, T. Nishida, V. Reynolds, Y. Sugiyama, C. E. G. Tutin, R. W. Wrangham, and C. Boesch.1999. Culture in chimpanzees. Nature 399:682–85.
Wilford, J. N. 1985. The Riddle of the Dinosaur. New York: Knopf.Willerman, L., R. Schultz, J. N. Rutledge, and E. D. Bigler. 1991.
In vivo brain size and intelligence. Intelligence 15:223–28.Williams-Blangero, S., and J. Blangero. 1992. Quantitative
genetic analysis of skin reflectance: A multivariate approach.Human Biology 64:35–49.
Wilson, E. O. 1980. Sociobiology: The Abridged Edition. Cambridge:Harvard University Press.
WoldeGabriel, G., Y. Haile-Selassie, P. R. Renne, W. K. Hart, S. H. Ambrose, B. Asfaw, G. Heiken, and T. White. 2001.Geology and palaeontology of the Late Miocene MiddleAwash valley, Afar rift, Ethiopia. Nature 412:175–78.
Wolfe, L. D. 1995. Current research in field primatology. InBiological Anthropology: The State of the Science, ed. N. T. Boazand L. D. Wolfe, pp. 149–68. Bend, Ore.: InternationalInstitute for Human Evolutionary Research.
Wolpoff, M. H. 1999. Paleoanthropology, 2d ed. Boston: McGraw-Hill.
Wolpoff, M. H., and R. Caspari. 1997. Race and Human Evolu-tion. New York: Simon and Schuster.
Wolpoff, M. H., J. Hawks, and R. Caspari. 2000. Multiregional,not multiple origins. American Journal of Physical Anthropol-ogy 112:129–36.
Wolpoff, M. H., J. Hawks, D. W. Frayer, and K. Hunley. 2001.Modern human ancestry at the peripheries: A test of thereplacement theory. Science 291:293–97.
Wolpoff, M. H., A. G. Thorne, F. H. Smith, D. W. Frayer, and G. G. Pope. 1994. Multiregional evolution: A world-widesource for modern human populations. In Origins of Ana-tomically Modern Humans, ed. M. H. Nitecki and D. V.Nitecki, pp. 175–200. New York: Plenum Press.
Wood, B. 1996. Origin and evolution of the genus Homo. InContemporary Issues in Human Evolution, ed. W. E. Meikle, F. C. Howell, and N. G. Jablonski, pp. 105–14. San Fran-cisco: California Academy of Sciences.
Wood, B., and M. Collard. 1999. The changing face of the genusHomo. Evolutionary Anthropology 8:195–207.
Wood, B., and B. G. Richmond. 2000. Human evolution: Tax-onomy and paleobiology. Journal of Anatomy 196:19–60.
Wood, J. W. 1994. Dynamics of Human Reproduction: Biology,Biometry, Demography. New York: Aldine de Gruyter.
Woodham-Smith, C. 1962. The Great Hunger: Ireland 1845–1849.New York: Harper & Row.
494 REFERENCES
Relethford: The Human Species: An Introduction to Biological Anthropology, 5/e
Back Matter References © The McGraw−Hill Companies, 2003
Workman, P. L., B. S. Blumberg, and A. J. Cooper. 1963. Selec-tion, gene migration and polymorphic stability in a U.S.White and Negro population. American Journal of HumanGenetics 15:71–84.
World Health Organization. 1997. Weekly Epidemiological Record72:269–76.
———. 1999. The World Health Report 1999: Making a Difference.Geneva: Office of Publications, World Health Organization.
Wrangham, R. W. 1987. Evolution of social structure. In Pri-mate Societies, ed. B. B. Smuts, D. L. Cheney, R. M. Seyfarth,R. W. Wrangham, and T. T. Struhsaker, pp. 282–96. Chi-cago: University of Chicago Press.
Wright, F. A., W. J. Lemon, W. D. Zhao, R. Sears, D. Zhuo, J-P. Wang, H-Y. Yang, T. Baer, D. Stredney, J. Spitzner,
A. Stutz, R. Krahe, and B. Yuan. 2001. A draft annotationand overview of the human genome. Genome Biology 2(7):research0025.1–0025.17. Available on the Internet at:http://genomebiology.com/2001/2/7/research/0025.
Wright, P. C. 1992. Primate ecology, rainforest conservation,and economic development: Building a national park inMadagascar. Evolutionary Anthropology 1:25–33.
———. 1999. Lemur traits and Madagascar ecology: Copingwith an island environment. Yearbook of Physical Anthropology42:31–72.
Yellen, J. E., A. S. Brooks, E. Cornelissen, M. J. Mahlman, and K. Stewart. 1995. A Middle Stone Age worked bone industryfrom Katanda, Upper Semliki Valley, Zaire. Science 268:553–56.
REFERENCES 495

Relethford: The Human Species: An Introduction to Biological Anthropology, 5/e
Back Matter Index © The McGraw−Hill Companies, 2003
I N D E X
497
Italicized page numbers indicate illustrations.Page numbers in bold indicate glossary terms.
ABO blood group, 43antigens and antibodies, 121–122, 121genotypes and phenotypes, 45, 45,
121–122natural selection and, 162–165, 163, 164
acclimation, 176acclimatization, 176Acheulian tradition, 373, 373–374, 374, 383achondroplastic dwarfism, 76–77, 77adaptation, 175–195
biological, defined, 7–8cultural
defined, 7to cold stress, 175, 183, 184to heat stress, 183–185, 184to ultraviolet radiation, 177
defined, 6–8, 175genetic, defined, 7–8misconceptions about, 107–108natural selection and, 17, 18–20, 19nutritional, 189–195, 190, 193, 194, 195,
196overview of, 175physiologic
to high-altitude stresses, 175,185–189, 186, 188
to temperature stress, 175, 177–179,178
to ultraviolet radiation, 169–170,176–177
types of, 176to climate, 177–185, 178, 179, 180, 181,
182, 184to high altitude, 174, 175, 185–189, 186,
188types of, 176–177
adaptive radiation, 102Aegyptopithecus, 311African replacement model, 404–405, 405Afropithecus, 318–319, 319
age at menarche, 439, 440age-sex structure, 448, 448–451, 449, 450agriculture
diseases and, 425, 429–431, 429, 431horticulture, 158–159, 159human diet with, 192invention of, 417–418, 418, 424population growth with, 424–427
allelesin Claxton, Georgia population,
135–136, 135, 136codominant, 45, 45defined, 43dominant, 43–44in gene flow, 86–89, 89–93, 91in genetic drift, 81–86, 89–93, 91, 92in Hardy-Weinberg equilibrium, 69–73,
456–458linked, 48mating choices and, 93–94in microevolution, 69–73, 70in mutations, 73–74, 89–93, 92in natural selection, 74–81, 89–93, 91pleiotropic, 51–52, 52recessive, 43–44, 47See also sickle cell alleles
Allen’s rule, 180, 181, 181, 182allometry, 271–272, 272altruism, 229–230Alu insertions, 123anagenesis, 99, 99–100, 377–378anaphase, 62, 63, 64, 65anatomically modern Homo sapiens,
393–419appearance of culture of, 402–403art, 392, 393, 399–400, 400, 401, 402distribution of, 394, 394geographic expansion, 401–402, 403origin of, 403–417
in Africa, 413–414fossil evidence, 406–410genetic evidence, 410–413, 411, 412
models of, 404–406, 405, 406, 407reasons for, 414–417, 415
physical characteristics, 394–396, 395,396, 397
recent evolution in, 417–419, 418, 419shelter, 399, 399tool technologies, 396–399, 398See also humans
anthropoids (Anthropoidea)classification of, 236, 466, 467defined, 235, 238origins of, 310–312, 311overview of, 238–239See also hominoids; monkeys
anthropologistsbiological, 10–11stereotypes of, 3–4
anthropologyanthropological archaeology, 9applied, 8biocultural approach of, 5–6biological, 3, 9–12, 28cultural, 8defined, 3, 4–8holistic nature of, 5linguistic, 9major concerns of, 6–8subfields of, 8–12
anthropometrics, 124, 124antibodies, 121antigens, 121apes
bonobos, 235, 263–266, 264, 265, 288chimpanzees, 259–263, 261, 262,
286–293, 287, 290, 291, 292classification of, 249, 250, 251, 251, 252,
253differences between monkeys and, 239gibbons, 253–255, 254gorillas, 257–259, 258, 259, 304, 471language use by, 269, 291–294, 292,
415–416, 415living, 253–266

Relethford: The Human Species: An Introduction to Biological Anthropology, 5/e
Back Matter Index © The McGraw−Hill Companies, 2003
apes (continued)Miocene hominoids, 312–323
fossil evidence of, 296, 297, 313–319,315, 316, 317, 318, 319
genetic evidence of, 319–321, 320orangutans, 255–257, 256, 260, 288similarities to humans, 248–252, 249,
250, 251, 252, 253behaviors, 269, 285–294, 287, 290, 291,
292evolutionary relationship based on
genetic evidence, 321–323, 321,322
genetic difference, 21–22, 22genetic structure, 250, 250
skeleton, 276, 277, 471tool use, 286–288, 287
applied anthropology, 8arboreal environment, 216arboreal model, 309archaeology, defined, 9archaic humans, 377–390
cranial capacity, 376, 377, 377distribution of, 378–379, 379, 381early archaics, 380–384, 382, 383Neandertals, 379, 380, 384–390, 384,
385, 386, 387, 389tool use, 383–384, 383, 389, 389
Ardipithecus ramidus, 332, 333–334, 334argon-argon dating, 301Aristotle, 269artifacts, defined, 9Ashkenazi Jews, Tay-Sachs disease among,
93assortative mating, 72–73, 94Australopithecus
Australopithecus aethiopicus, 343, 343Australopithecus afarensis, 326, 327,
335–339, 336, 337, 338, 339Australopithecus africanus, 13, 330, 344,
344, 345Australopithecus anamensis, 334–335, 335Australopithecus boisei, 341, 342, 343, 343Australopithecus garhi, 344–346, 345, 346Australopithecus robustus, 341, 342, 343cranial capacity, 359–360, 360defined, 334overview of, 330–331, 334–335robust australopithecines, 340–344,
341, 342, 343, 344
baboons, 244–246, 245, 471Baby Boom, 446–447, 449, 451Baker, Paul, 187, 194balancing selection, 79–80bases, 32behavior
ecological approach to, 227–228genetic component of, 58–59
infant sleeping, cultural variation in, 282learned, in primates, 219–221, 220similar, in humans and apes, 269,
285–294, 287, 290, 291, 292sociobiological approach to, 228–231,
229, 231behavioral ecology, 227–228Bergmann’s rule, 179, 179–180, 180, 181,
181, 182Bering Land Bridge, 402, 403bifaces, 373bilateral symmetry, 208Bindon, James, 194Binet, Alfred, 141binocular stereoscopic vision, 218, 219biocultural approach, 5–6biological anthropologists, 10–11biological anthropology
defined, 3, 9–12, 28subfields of, 12
biological species concept, 98–99, 99biostratigraphy, 299bipedalism
defined, 274evolution of, 327, 328, 351–356hypotheses on origin of, 354–356Laetoli fossil footprints, 326, 327, 336,
338oldest fossil evidence of, 364skeletal structure for, 274–276, 275, 276,
277birds
absence of teeth, 38earliest known (Confuciusornis sanctus),
96, 97Galapagos finches, variation in, 17, 20
blades, 398, 398blood groups
blood group systems, 121, 160–161determining blood types, 121–122Diego, 130Duffy, 165natural selection and, 160–165, 161, 162,
163, 164race and, 129–130Rhesus, 161–162, 161, 162See also ABO blood group; MN blood
groupblood pressure, modernization and, 195,
196body size
Bergmann and Allen rules on, 179–181,179, 181
bigger as better, 105–106high altitude and, 188, 287–289See also height; weight
Bogin, Barry, 10, 284bonobos
classification of, 250, 251, 251, 252, 253
overview of, 235, 263–266, 264, 265tool use, 288
Bougainville Island, 89B.P. (Before Present), 298brachiation, 253brains
human, 270–274evolution of, 105, 106, 107, 327–328,
330growth pattern, 283, 284, 372IQ and, 272–274Piltdown hoax, 348, 348size of, and body weight, 270–272,
271, 272mammals, 215primates, 219–221, 220, 271theory of orthogenesis on evolution of,
105, 106, 107vertebrates, 214–215See also cranial capacity
breeding population, 68brow ridges, 370Bryan, William Jennings, 23, 24bubonic plague, 164, 432burins, 398–399
canine teeth, 212–213, 277carbon-14 dating, 300care of offspring
bipedalism and, 354–355mammals, 210–211, 229primates, 221–225, 222
carrying capacity, 424, 447–448Cartmill, Matt, 309Caspari, Rachel, 11catastrophism, 16cave art, 392, 393, 399–400, 400, 401cell membrane, 61, 62cells
replication of (mitosis), 39, 39, 61–62, 63structure of, 61, 62
Cenozoic era, 112, 113–114, 305centrioles, 62, 62, 63centromeres, 62, 63cephalic index, 181–182, 182cerebrum, 215childhood dysentery, 139–140chimpanzees
American Sign Language (ASL) learnedby, 291–293, 292
classification of, 250, 251, 251, 252, 253communication by, 289–290, 290, 291cultural behavior, 288–289language behavior, 289–290overview of, 259–263, 261, 262skeleton of, 275, 276, 277social structure, 260, 262–263tool use, 286–288, 287
Chordata, 208
498 INDEX

Relethford: The Human Species: An Introduction to Biological Anthropology, 5/e
Back Matter Index © The McGraw−Hill Companies, 2003
chromatids, 62, 63chromosomes
crossing over in, 49, 49–50defined, 35, 37inheritance and, 47–50linked alleles on, 48locus (loci) and alleles on, 43–45Mendel’s Law of Independent
Assortment, 47–48, 48mutations of, 54–56overview of, 35, 37replication of, in meiosis, 39–40, 40, 62,
64, 64–65replication of, in mitosis, 39, 39, 61–62,
63sex determination, 50as structure in typical cells, 61, 62
chronometric dating, 298, 299–302, 301,302
civilizationbiological impact of, 431–433defined, 431
cladistics, 206, 206cladogenesis, 100, 100, 378classification
of anthropoids (Anthropoidea), 236,466, 467
approaches to, 205–207, 207of hominoids, 248–252, 249, 250, 251,
252, 253of humans, 206–208, 207Linnaeus’s system of, 15, 126, 201,
202–203of living primates, 235–239, 236, 238,
465–467methods of, 203–205, 204, 205of monkeys, 236, 238overview of, 201–202of prosimians (Prosimii), 236, 466taxonomic, 15, 201–208
climateat high altitudes, 175, 185–189, 186, 188Bergmann and Allen rules on mammal
size, 179–180, 179, 180body size and shape, 180–181, 181cranial size and shape, 181–182, 182nasal size and shape, 182–183temperature stress, 177–179, 178,
183–185, 184codominant alleles, 45, 45cold injury, 171cold stress, 175, 177–178, 178, 183, 184comparative approach, 6complex physical traits
genetics of, 50–53, 51, 52height as, 50–51, 51, 52–53heritability of, 52–53major genes, 53measurements of, 52–53, 124–125, 124
natural selection of, 80–81, 81polygenic, 51–52, 52
Confuciusornis sanctus, 96, 97continental drift, 306–307, 307convergent evolution, 204conversion factors, 468“Cosmic Calendar,” 108–109, 110–111cranial capacity, 331
archaic humans, 376, 377, 377Australopithecus, 359–360, 360climate and, 181–182, 182genus Homo, 360, 360, 361Homo erectus, 367–368, 367, 368, 372Homo habilis, 361, 361Homo rudolfensis, 363See also brains
Crawford, Michael, 10, 122creation science, 23–26, 26, 97Crichton, Michael, 57crossing over, 49, 49–50cultural adaptation
defined, 7to cold stress, 183, 184to heat stress, 183–185, 184to ultraviolet radiation, 177
cultural anthropology, 8culture
appearance of, of anatomically modernHomo sapiens, 402–403
biocultural approach, 5–6change in, and sickle cell frequency,
158–160, 159of chimpanzees, 288–289defined, 4gene flow restricted by, 88–89, 89of humans and apes, 285–286infant sleeping patterns and, 282
cusps, 247, 247Cuvier, Georges, 16cystic fibrosis, 47, 80cytoplasm, 61, 62
Darrow, Clarence, 23, 24Dart, Raymond, 330, 348Darwin, Charles, 15
evolutionary theory, 14modern evolutionary thought and, 20natural selection concept, 16, 17, 17–18
dating fossil recordschronometric methods, 298, 299–302,
301, 302relative methods, 298–299
de Waal, Frans, 289demographic transition theory, 444–445demographics
Baby Boom, 446–447, 449, 451measures of
genetic drift and gene flow in humanvariation, 137
natural selection in human variation,139–140
world population growth, 443–444,444, 445–448
See also population growthdendrochronology, 301–302, 302dental formula, 213
See also teethderived traits, 205dermatoglyphics, 125Dettwyler, Katherine, 10, 193developmental acclimatization, 176diabetes, 167Diamond, Jared, 427diastema, 315Diego blood group, 130diet
in agricultural populations, 192change in, with modernization,
194–195, 195, 196in hunting and gathering populations,
191–192malnutrition, 192–193, 193, 194of mammals, teeth and, 213–214See also nutrition
dinosaurs, 112–113, 113directional selection, 80–81diseases
ABO blood type and, 163–164in agricultural populations, 425,
429–431, 429, 431endemics, 428epidemics, 428, 429, 432epidemiologic transition, 434, 434–438,
435, 436, 437, 438in hunting-gathering populations,
427–429, 428inheritance of, 47, 50pandemics, 432urbanization and, 431–432See also infectious diseases;
noninfectious diseases; specificdiseases
distance curve, 281, 281, 283, 284diurnal animals, 236DNA (deoxyribonucleic acid)
analysis of, 122–124, 122ancient, reconstruction of, 57defined, 32Human Genome Project (HGP), 40–41microsatellite, 122–123mitochondrial, 123–124Neandertal, 387–388replication of, 34–35, 35, 36structure of, 32–34, 32
dominance hierarchy, 225–227, 226dominant alleles, 43–44Down syndrome, 55, 55Dubois, Eugene, 370
INDEX 499

Relethford: The Human Species: An Introduction to Biological Anthropology, 5/e
Back Matter Index © The McGraw−Hill Companies, 2003
Duffy blood group, 165Dunker religious sect, 85
Ebola disease, 442Egyptians, 152–153Eldredge, Niles, 103electron spin resonance, 302electrophoresis, 122embryo, 280, 280emergent infectious diseases, 442endemic diseases, 428, 428endocasts, 363endoplasmic reticulum, 61, 62environmental correspondence, 139environmental endocrine hypothesis, 441environmental variation, 52–53Eocene epoch, 305, 308–309eons
defined, 109Phanerozoic eon, 109, 112Precambrian eon, 109
epidemic diseases, 428, 429epidemiologic transition, 434, 434–438,
435, 436, 437, 438epochs
of Cenozoic era, 305defined, 305Eocene, 305, 308–309Miocene, 305, 312–323, 312Oligocene, 305, 310–312Paleocene, 305, 307–308Pleistocene, 305, 331Pliocene, 305, 331
erasCenozoic, 112, 113–114, 305defined, 109Mesozoic, 112, 112–113Paleozoic, 109, 110, 112
estrus, 257, 277Eurasia, 312evolution
of bipedalism, 327, 328, 351–356as both fact and theory, 12–13convergent, 204defined, 6evidence for, 21–23of genus Homo (see Homo, evolution of)of hominids (see hominids, evolution of)human (see Homo, evolution of)misconceptions about, 104–108, 107orthogenesis theory on, 105, 106, 107parallel, 204of primates (see primates, evolution of)principles of, 19–20science vs. religion on, 23–27, 97significance of mutations to, 53–54of size of human brain, 105, 106, 107,
327–328, 330of skin color, 169–171, 172
theistic, 26See also macroevolution; microevolution
evolutionary forces, 73–94as approach to human variation,
134–142defined, 72gene flow as, 86–89genetic drift as, 81–86interaction of, 89–92mutation as, 73–74natural selection as, 74–81in speciation, 100–102See also specific forces
evolutionary theoryDarwin’s concept of natural selection,
14, 16–18, 16, 17, 28modern evolutionary thought, 20–21pre-Darwinian thought, 14–16
exogamy, 146exons, 37, 37extinctions
of dinosaurs, 113mass, 104of primates, 223of species, 104
eye form, 130
facts, in science, 12–13Falk, Dean, 10–11fertility
birth rate as measure of, 139changes in U.S. rate of, 447increased in agricultural populations,
426–427sickle cell allele and, 153–154
fetus, 280–281fire, 375–376Fisher, Helen, 279fission-fusion social structure, 144, 145,
146, 146–147fission-track dating, 302fitness, 74
maximizing, and sociobiology, 228–230,229
foramen magnum, 334Fossey, Dian, 3fossil record
anatomically modern Homo sapiens,406–410
archaic humans, 377–390Australopithecus, 359–360, 360Confuciusornis sanctus, 96, 97as evidence of evolution, 2, 3, 21–23genus Homo, 358, 359–360, 361,
377–378, 378Homo erectus, 364–376Homo habilis, 361, 361–363, 362Homo rudolfensis, 363–364, 364identifying species from, 304–305, 304
influence on evolutionary thought,15–16
Laetoli footprints, 326, 327, 336, 338“Lucy,” 336, 337methods of dating, 298–302, 301, 302Miocene hominoids, 296, 297, 313–319,
315, 316, 317, 318, 319Neandertals, 379, 380, 384–390reconstructing past from, 302–303
founder effect, 85, 146frostbite, 171
G6PD deficiency, 160gametes. See sex cellsGardner, Allen, 291Gardner, Beatrice, 291gene flow
defined, 86determinants of, 87–89, 88, 89as evolutionary force, 86–89genetic effects of, 86–87, 87in human variation, 136–137, 137interaction with other evolutionary
forces, 89–93, 91mathematical model of, 463–464in speciation, 101, 102Vikings in Ireland, 147–150, 148, 149, 150Yanamamo Indians, 144, 145, 146–147,
147gene trees, 410generalized structures, 217–218genes
defined, 37functions of, 37–39homeobox, 38–39major genes, 53regulatory, 38–39similarities of, of humans and apes,
21–22, 22, 250, 250genetic difference between humans and
apes, 21–22, 22genetic distance, 136
between living humans in geographicregions, 412–413, 412
genetic distance maps, 136–137, 137Vikings in Ireland, 149, 150
genetic divergence, 101–102genetic drift
defined, 81as evolutionary force, 81–86examples of, 85–86founder effect, 85in human variation, 136–137interaction with other evolutionary
forces, 89–93, 91, 92mathematical model of, 462–463overview of, 81–84, 82, 83population size and, 84–85, 84in speciation, 101, 102
500 INDEX

Relethford: The Human Species: An Introduction to Biological Anthropology, 5/e
Back Matter Index © The McGraw−Hill Companies, 2003
Vikings in Ireland, 147–150, 148, 149, 150Yanamamo Indians, 144, 145, 146–147,
147genetic variation, 52–53genetics
behavior’s relationship to, 58–59of complex physical traits, 50–53, 51, 52levels of studying, 31–32Mendelian genetics, 31, 41–50molecular genetics, 32–41mutations and, 53–58population genetics, 67–73, 456–464relationship of race, IQ and, 141
genome, 40genotypes
analysis of natural selection of, 137–142defined, 43in Hardy-Weinberg equilibrium, 69–73,
456–458heterozygous, 43–45, 47homozygous, 43, 45, 47in microevolution, 69–73predicting, in offspring, 45–47
genus, as taxonomic category, 15, 203genus Homo. See Homogeologic time
Cenozoic era, 112, 113–114, 305“Cosmic Calendar,” 108–109, 110–111Mesozoic era, 112, 112–113Paleozoic era, 109, 110, 112Phanerozoic eon, 109, 112Precambrian eon, 109subdivisions of, 109
gibbonsclassification of, 249, 250, 252, 253overview of, 253–255, 254social structure, 254–255
Gigantopithecus, 316, 317Goodall, Jane, 3, 286, 288gorillas
classification of, 250, 251, 251, 252, 253overview of, 257–259, 258, 259sexual dimorphism in, 304skeleton, 471social structure, 258–259, 260
Gould, Stephen Jay, 103gradualism, 102–103, 103Grant, P. R., 20grooming, 290, 291
half-life, 300Haplorhini (haplorhines), 238, 239Hardy-Weinberg equilibrium, 69–73, 70,
456–458Harlow, Harry, 222, 224heat stress, 178–179, 183–185, 184, 355height
as complex physical trait, 50–51, 51,52–53
continuous variation and, 127distance curve for, 281, 281heritability of, 52–53measurement of, 124, 124secular change in, 439, 439, 440velocity curve for, 281–283, 283
hemoglobindefined, 37malaria and, 150–151, 151skin color and, 168
hemophilia, 50heritability, 52–53heterodontic teeth, 212heterozygotes
heterozygous genotypes, 43–45, 47selection for, 77–80, 78, 79
high altitude, adaptation to, 174, 175,185–189, 186, 188
Hinton, Martin, 348HIV infection, 436holistic perspective, 5home range, 227homeobox genes, 38–39homeostasis, 175homeotherms, 211hominids
classification of humans as, 207defined, 252evolution of, 327–356
Ardipithecus ramidus, 332, 333–334, 334Australopithecus afarensis, 326, 327,
335–339, 336, 337, 338, 339Australopithecus africanus, 344, 345Australopithecus anamensis, 334–335, 335Australopithecus garhi, 344–346, 345, 346bipedalism, 327, 328, 351–356brain size, 327–328, 330fossil sites, 332, 333Kenyanthropus platyops, 339–340, 341later hominids, 340–346Orrorin tugenesis, 332–333, 334overview of, 328–331, 329primitive hominids, 331–340relationships revealed by, 347–351,
350, 351robust australopithecines, 340–344,
341, 342, 343, 344family tree, 349–351, 351See also Homo
hominins, 252hominoids, 246–252
characteristics of, 246–248, 247, 248classification of, 248–252, 249, 250, 251,
252, 253living apes, 253–266Miocene, 312–323relationships among, based on genetic
evidence, 321–323, 321, 322teeth of, 247, 247, 315
Homoage of, 327defined, 359evolution of
anatomically modern Homo sapiens,393–419
archaic humans, 377–390growth pattern, 283–284Homo erectus, 364–376Homo habilis, 361, 361–363, 362Homo rudolfensis, 363–364, 364misconceptions about, 106–108, 107Neandertals, 379, 380, 384–390origin of, 359–364overview of, 327–330, 329
fossil record of, 358, 359–360, 361,377–378, 378
as genus name, 15, 203See also humans
Homo erectus, 364–376cranial capacity, 367–368, 367, 368, 372cultural behavior, 372–376, 373, 374distribution of, 365–367, 365, 366fire use, 375–376hunting and gathering, 374–375physical characteristics, 367–372, 367,
368, 369, 370, 371tool use, 372–374, 373, 374
Homo habilis, 361, 361–363Homo rudolfensis, 363–364, 364Homo sapiens
genus and species name of, 15, 98See also anatomically modern Homo
sapiens; humanshomodontic teeth, 212homology, 203, 204, 216–217homoplasy, 203–204, 205homozygotes
homozygous genotypes, 43, 45, 47selection against recessive homozygotes,
74–76, 75selection for recessive homozygotes,
76–77, 77horses, 38, 217–218horticulture, 158Howells, W. W., 152howler monkeys, 241–243, 241Hrdy, Sarah, 230–231human adaptation. See adaptationHuman Genome Project (HGP), 40–41human variation. See variationhumans
anthropology’s focus on, 4archaic, 377–390bipedalism, 274–276, 275, 276, 277, 327,
328, 351–356brains, 270–274
evolution of, 105, 106, 107, 327–328,330
INDEX 501

Relethford: The Human Species: An Introduction to Biological Anthropology, 5/e
Back Matter Index © The McGraw−Hill Companies, 2003
humans, brains (continued)growth pattern, 283, 284, 372IQ and, 272–274Piltdown hoax, 348, 348size of, and body weight, 270–272,
271, 272canine teeth, 277defining, 269–270distribution and environment, 270evolution of (see Homo, evolution of)future of, 454–455growth of
in high-altitude populations,187–189, 188
pattern of, 283–284pollution and, 441postnatal growth, 281–284, 281, 283,
284prenatal growth, 280–281, 280secular changes in, 438–440, 439, 440
language capabilities, 293–294,415–416, 415
life cycle, 280–285mammal characteristics, 208–215, 212primate characteristics, 215–227sex and reproduction, 260, 277–279,
283, 284similarities to apes, 248–252, 249, 250,
251, 252, 253behaviors, 269, 285–294, 287, 290, 291,
292evolutionary relationship based on
genetic evidence, 321–323, 321,322
genetic difference between humansand apes, 21–22, 22
genetic structure, 250, 250skeleton, 274–276, 275, 276, 277, 337, 470social structure, 279traditional classification of, 206–208, 207vertebrate characteristics, 204, 208See also anatomically modern Homo
sapienshunting-gathering populations
diet in, 191–192diseases in, 427–429, 428Homo erectus, 374–375life expectancy at birth, 426
hypothesisdefined, 13testability of, 13–14
hypoxia, 185, 186, 187–189
“The Iceman,” 409inbreeding, 72, 72–73, 93–94, 458–459incisors, 212infanticide
by male langurs, 230–231, 231defined, 230
infectious diseasesABO blood types and, 163–164in agricultural populations, 429–430, 429defined, 152emergent, 442epidemic vs. endemic patterns of, 428,
429epidemiologic transition due to decrease
in, 434, 434–438, 435, 436, 437, 438in hunting-gathering populations,
427–428, 428reemergent, 442–443, 443spread through cultural contact, 432–433zoonoses, 427See also specific diseases
Inherit the Wind, 23insectivores, 306, 306intelligence
brain size and, 272–274relationship of genetics, race and, 141
intelligent design creationism, 26–27interphase, 62, 63, 64introns, 37, 37Ireland, Vikings in, 147–150, 148, 149, 150
Johanson, Donald, 336Jones, Indiana, 3, 4Jurassic Park, 57
ka, 298Kenyanthropus platyops, 339–340, 340Kimble, Bill, 2–3, 2kin selection, 230King Kong, 246Klinefelter’s syndrome, 56knuckle walking
by chimpanzees, 261by gorillas, 257–258, 258defined, 257–258as preceding bipedalism, 352–353, 353spine position with, 276, 276
Koko, 269, 269Konigsberg, Lyle, 11kwashiorkor, 192–193, 193
lactase persistence, 130–131, 165–167lactose intolerance, 165–167, 166Laetoli footprints, 326, 327, 336, 338Lamarck, Jean-Baptiste, 16language
American Sign Language (ASL) learnedby apes, 269, 291–293, 292
characteristics of, 290–291chimpanzees’ communication,
289–290, 290, 291differences in, and mating, 89, 89human vs. ape capabilities for, 293–294,
415–416, 415Neandertal, 390
langurs, 230–231, 231larynx, 415, 415–416Leakey, Louis, 3, 361Leakey, Mary, 336, 361Leidy, Lynnette, 285lemurs, 236, 236–238, 237, 238, 239Lewis hunting phenomenon, 178, 178Lieberman, Daniel, 414life expectancy at birth, 279, 426,
434–435, 434life table, 426linguistic anthropology, 9linkage, 48Linnaeus, Carolus, 15, 126, 201, 202–203locus (loci), 43lorises, 201, 236, 236, 237, 238, 239Love Canal, 441Lower Paleolithic, 396–397“Lucy” fossil, 336, 337Lutz, Wolfgang, 446
Ma, 298macaques, 220–221, 234, 242, 243macroevolution, 97–114
defined, 32, 67, 97history of life on earth, 108–114patterns of
adaptive radiation, 102anagenesis, 99, 99–100cladogenesis, 100, 100extinctions, 104genetic divergence, 101–102gradualism, 102–103, 103punctuated equilibrium, 103, 103reproductive isolation, 101speciation, 100–102, 101
tempo and mode of, 102–104See also evolution
Madrigal, Lorena, 11major genes, 53malaria
cultural change contributing to,158–160, 159
Duffy blood group and, 165falciparum, 152, 155genetic loci related to, 160hemoglobin and, 150–151, 151sickle cell allele distribution and,
151–158, 154, 155, 156, 157malnutrition
Great Famine in Ireland, 430–431, 431in hunting-gathering populations, 429obesity, 192, 194, 195overview of, 192–193, 193, 194
Malthus, Thomas, 17–18mammals
behavior, 214–215Bergmann and Allen rules on size and
shape of, 179–180, 179, 180
502 INDEX

Relethford: The Human Species: An Introduction to Biological Anthropology, 5/e
Back Matter Index © The McGraw−Hill Companies, 2003
characteristics of, 208–215origin and evolution of, 112, 113–114primate-like, 306, 306, 307–308, 308reproduction and care of offspring,
209–211, 209, 210, 229skeletal structure, 214, 214teeth, 212–214, 212temperature regulation, 211–212
mandrills, 243marasmus, 192–193, 194marital distance, 87–88, 88mass extinctions, 104mating
assortative, 72–73, 94breeding populations, 68cultural differences, 88–89, 89cultural influences on, 88–89, 89exogamy, 146human marriage patterns, 279inbreeding, 72, 72–73, 93–94, 458–459marital distance, 87–88, 88nonrandom, 72–73, 93–94social groups and, 225
Mead, Margaret, 3measles, 433, 436measurements
of biochemical variation, 121–124, 121,122
of complex physical traits, 52–53,124–125, 124
conversion factors for, 468demographic measures, 137, 139–140of human variation, 119–125
meiosiscrossing over in, 49, 49–50defined, 39–40, 40overview of, 62, 64, 65phases of, 62, 64, 65
melanin, 167–168Mendel, Gregor. See Mendelian geneticsMendelian genetics, 41–50
defined, 31genotypes and phenotypes in, 43–47linkage, 48overview of, 41–43predicting genotype/phenotype
distribution in offspring, 45–47Mendel’s Law of Independent Assortment,
47–48, 48Mendel’s Law of Segregation, 43Mengele, Joseph, 57menopause, 285Mesozoic era, 112, 112–113messenger RNA (ribonucleic acid), 34,
36, 37metaphase, 62, 63, 64, 65microevolution, 67–94
allele frequencies, 69–73, 70breeding populations, 68
case studiesblood groups, 160–165, 161, 162, 163,
164hemoglobin, sickle cell, and malaria,
150–160, 151, 154, 155, 156, 157,159
lactase persistence/intolerance,165–167, 166
skin color, 167–171, 168, 172Vikings in Ireland, 147–150, 148, 149,
150Yanamamo Indians, 144, 145,
146–147, 147defined, 31, 67of Egyptians, 152–153genotype frequencies, 69–73Hardy-Weinberg equilibrium, 69–73,
456–458mating choices, 72–73, 72, 93–94population genetics, 67–73, 456–464relationship between demographic
measures and, 137See also evolution; evolutionary forces
microsatellite DNA, 122–123Middle Paleolithic, 397migration
Bering Land Bridge, 402, 403effect on population growth, 426See also gene flow
Miocene epoch, 305, 312Miocene hominoids, 312–323
Afropithecus, 318–319, 319fossil evidence of, 296, 297, 313–319,
315, 316, 317, 318, 319genetic evidence of, 319–321, 320Gigantopithecus, 316, 317Kenyanthropus platyops, 339–340, 340Orrorin tugenesis, 332–333, 334Proconsul, 296, 297, 313–316, 315, 316Sivapithecus, 316–318, 318
mitochondria, 61, 62mitochondrial DNA, 123–124
Neandertal, 387–388mitosis
defined, 39, 39overview of, 61–62, 63phases of, 62, 63
MN blood group, 43effects of natural selection on, 138–139genetic drift in Dunker population, 85genotype and allele frequencies, 69, 70genotypes and phenotypes, 45, 45, 46,
46modernization
blood pressure and, 195, 196obesity and, 194, 195
molars, 212, 213molecular dating, 319–321, 320monkeys, 239–246
differences between apes and, 239in Miocene epoch, 313See also New World monkeys; Old World
monkeysmonogamous family groups, 225monogamy, 223–224, 229monosomy, 55morphology, 249mortality
death rate as measure of, 139survival of childhood dysentery and,
139–140mother–infant bond, 221–223, 222, 224moths
gypsy, 99peppered, 18–20, 19
Mousterian tradition, 389, 389mules, 98, 99multimale/multifemale groups, 225,
243–244, 244multiregional evolution model, 406, 406,
407multivariate analysis, 134, 135, 135, 136mumps, 433mutations, 53–58
as evolutionary force, 53–54, 73–74evolutionary significance of, 53–54interaction with other evolutionary
forces, 89–93, 92mathematical model of, 459–460rates of, 56, 58in speciation, 101, 102types of, 54–56
nasal index, 182–183natural increase, 426natural selection
balancing selection, 79–80blood groups and, 160–165, 161, 162,
163, 164of complex physical traits, 80–81, 81Darwin’s concept of, 14, 16, 17, 17–18defined, 18, 74directional selection, 80–81as evolutionary force, 74–81examples of, 18–20, 19fitness, 74for heterozygotes, 77–80, 78, 79in human variation, 137–142interaction with other evolutionary
forces, 89–93, 91lactase intolerance/persistence and,
165–167, 166mathematical model of, 460–462misconceptions about, 104–107, 107for/against recessive homozygotes,
74–77, 75, 77sickle cell allele and malaria and,
150–160, 151, 154, 155, 156, 157, 159
INDEX 503

Relethford: The Human Species: An Introduction to Biological Anthropology, 5/e
Back Matter Index © The McGraw−Hill Companies, 2003
natural selection (continued)skin color and, 167–171, 168, 172,
176–177in speciation, 102stabilizing selection, 80, 81
nature vs. nurture, 58–59Neandertals, 384–390
cultural behavior, 389–390, 389defined, 379DNA, 387–388language, 390origin of name, 379, 380physical characteristics, 384–387, 384,
385, 386, 387Neel, James, 146New World monkeys, 240–243
case study (howler monkeys), 241–243,241
characteristics of, 240classification of, 236, 238origin of, 311–312
nocturnal animals, 236noninfectious diseases
ABO blood type and, 164in agricultural populations, 430–431,
431defined, 152epidemiologic transition due to
increase in, 434, 434–438, 435, 436,437, 438
in hunting-gathering populations,428–429
See also specific diseasesnonrandom mating, 72–73, 93–94notochord, 208nucleus, cell, 61, 62nurture, nature vs., 58–59nutrition
in agricultural populations, anddisease, 430–431, 431
basic needs, 189–191, 190blood pressure and modernization, 195,
196malnutrition, 192–193, 193, 194obesity and modernization, 194, 195“small but healthy” hypothesis, 193variation in human diet, 191–192See also diet
obesity, 192, 194, 195occipital bun, 385odontometrics, 125Old World monkeys, 243–246
case study (baboons), 244–246, 245characteristics of, 242, 243–244, 243classification of, 236, 238origin of, 310–311, 311skeleton, 471social structure, 243–244, 244
Oldowan tradition, 362, 362–363Olduvai Gorge (Tanzania), 358, 359, 361,
363, 374Oligocene epoch, 305, 310–312On the Origin of Species by Means of Natural
Selection (Darwin), 18orangutans
classification of, 249, 250, 251, 251, 252,253
overview of, 255–257, 256social structure, 257, 260tool use, 288
Orrorin tugenesis, 332–333, 334orthogenesis, 105, 106, 107outgroups, 206, 207
paleoanthropologists, 2, 3paleoanthropology, 12Paleocene epoch, 305, 307–308paleoecology, 303paleomagnetic reversal, 299paleopathology, 424, 425paleospecies, 100Paleozoic era, 109, 110, 112palynology, 303pandemic diseases, 432parallel evolution, 204parental care
in mammals, 210–211, 229mother–infant bond, 221–223, 222, 224in primates, 221–225, 222
parental investment, 229paternal care, 223–224, 229“Peking Man,” 369, 374Pennington, Renee, 427periods, 109, 112Phanerozoic eon, 109, 112phenetics, 205–206phenotypes, 43–45
defined, 43predicting, in offspring, 45–47
physical anthropology. See biologicalanthropology
physiologic adaptationto high-altitude stresses, 175, 185–189,
186, 188to temperature stress, 175, 177–179, 178to ultraviolet radiation, 169–170,
176–177types of, 176
Piltdown hoax, 348, 348placenta, 209plasticity, 176pleiotropy, 51–52, 52Pleistocene epoch, 305, 331Pliocene epoch, 305, 331pollution, 440–441polyandrous groups, 225polyandry, 279
polygamy, 224polygenic traits, 51–52, 52polygyny, 279polymerase chain reaction (PCR), 57polymorphisms, 73–74population genetics, 67–73
allele frequencies, 69–73, 70genotype frequencies, 69–73Hardy-Weinberg equilibrium, 69–73,
456–458mathematical, 456–464mating choices in, 72–73, 72population defined, 68
population growthage-sex structure, 448, 448–451, 449, 450agriculture’s impact on, 424–427of anatomically modern Homo sapiens,
413–414Baby Boom, 446–447, 449, 451demographic transition theory, 444–445Malthus on, 17–18world population growth, 443–444,
444, 445–448population pyramids, 448, 448–449, 449,
450postcranial skeleton, 313postnatal period, 210postorbital bar, 308postorbital constriction, 369potassium-argon dating, 300–301, 301Precambrian eon, 109prehensile capability
of New World monkey tails, 240–241,240, 241
of primate hands and feet, 217premolars, 212, 213prenatal period, 210prepared-core tool technology, 383,
383–384, 389primary African origin model, 406, 407,
407primate studies, 12primates, 201
arboreal adaptations of, 216–217behavioral ecology approach to, 227–228brain structure and learned behavior,
219–221, 220, 271, 272characteristics of, 215–227classification of, 235–239, 236, 238,
465–467endangered status of, 223evolution of
Afropithecus, 318–319, 319anthropoid origins, 310–312, 311early primates, 305–312Gigantopithecus, 316, 317major events in Cenozoic era epochs,
305Miocene hominoids, 312–323
504 INDEX

Relethford: The Human Species: An Introduction to Biological Anthropology, 5/e
Back Matter Index © The McGraw−Hill Companies, 2003
primate origins, 306–310, 306, 307,308, 309
primate-like mammals, 306, 306,307–308, 308
Proconsul, 296, 297, 313–316, 315, 316Sivapithecus, 316–318, 318
reproduction and care of offspring,221–225, 222
skeleton, 217–218, 470–471social structure, 225–227, 226, 260sociobiological approach to, 228–231,
229, 231suborders of, 235–239vision, 218–219, 219
primitive traits, 204–205Proconsul, 296, 297, 313–316, 315, 316prophase, 62, 63, 64, 65prosimians (Prosimii), 235–238
characteristics of, 236classification of, 236, 466defined, 235evolution of, 305–306, 306types of, 236–238, 237
protein-calorie malnutrition, 192–193,193, 194
protoculture, 220punctuated equilibrium, 103, 103pythons, 22
quadrupedal movement, 239
racesblood groups, 129–130cephalic indexes and, 182continuous variation and, 127–130, 128,
129, 130correspondence of traits, 130–131defined, 125–126eye form, 130lactase persistence and, 130–131number of, 126–127, 152problems with concept of, 126–134relationship of genetics, intelligence
and, 141sickle cell anemia and, 130, 160skin color, 127–129, 128, 129, 130variation between and within groups,
131–132, 133Raiders of the Lost Ark, 3, 4recessive alleles, 43–44, 47recessive homozygotes
selection against, 74–76, 75, 76selection for, 76–77, 77
recombination, 49–50reemergent infectious diseases, 442–443,
443regional coalescence model, 406, 407, 407regional continuity, 408–410regulatory genes, 38–39
relative dating, 298–299religion
creation science, 23–26, 26, 97intelligent design creationism, 26–27science vs., 23–27theistic evolution, 26
reproductionof humans, 277–279, 283, 284of mammals, 209–210, 209, 210of primates, 221testes size in primates, 260
reproductive isolation, 101restriction enzymes, 122restriction fragment length
polymorphisms (RFLPs), 122Retzius, Anders, 181Rhesus incompatibility, 161, 161–162, 162ribosomes, 61, 62RNA (ribonucleic acid)
defined, 34messenger RNA, 34, 36, 37transfer RNA, 34, 36
robust australopithecines, 340–344, 341,342, 343, 344
Sagan, Carl, “Cosmic Calendar,” 108–109,110–111
sagittal crest, 342savanna
baboons living in, 244, 245bipedalism in, 355–356defined, 243
sciencecharacteristics of, 12–14creation science, 23–26, 26, 97education in, 27facts in, 12–13hypotheses in, 13–14religion vs., 23–27theories in, 14
Scopes Monkey Trial, 23, 24Seckler, David, 193secular changes, 439, 439–440, 440sedentary population, 424Sellen, Daniel, 427sex cells
crossing over, 49, 49–50formation of (meiosis), 39–40, 40, 62,
64, 65Mendel’s Law of Independent
Assortment, 47–48, 48mitochondrial DNA in, 123–124mutations in, 54
sex differentiationbrain size and, 273–274chromosomes governing, 40, 40, 50Mendel’s Law of Independent
Assortment, 47–48, 48mutations in, 56
sexual dimorphism, 226, 304sexual orientation, genetic/environmental
origin of, 59sickle cell alleles
defined, 54–55distribution of, and malaria, 151–158,
154, 155, 156, 157as example of selection for
heterozygote, 78–80as pleiotropic, 51race and, 130, 160
sickle cell anemia, 151, 151, 154, 156,157–158, 160
single-nucleotide polymorphisms (SNPs),123
Sivapithecus, 316–318, 318skeleton
apes, 276, 277, 471for bipedalism, 274–276, 275, 276, 277chimpanzees, 275, 276, 277gorillas, 471Homo erectus, 370–372, 371human, 274–276, 275, 276, 277, 337, 470mammals, 214, 214Old World monkeys, 471postcranial, 313primates, 217–218, 470–471Proconsul, 313–314, 315
skin cancer, 169–170, 177skin color
as adaptation, 7–8, 176–177biology of, 167–168continuous variation and, 127–129,
128, 129, 130directional selection of, 81distribution of, 168–169, 168measurement of, 125natural selection and, 167–171, 168, 172,
176–177theories of evolution of, 169–171, 172
Smail, J. Kenneth, 447“small but healthy” hypothesis, 193smallpox, 140, 164, 433, 442Smouse, Peter, 146snakes, 22social groups, primate, 225social structure
chimpanzees, 260, 262–263defined, 225fission-fusion, 144, 145, 146, 146–147gibbons, 254–255gorillas, 258–259, 260humans, 279Old World monkeys, 243–244, 244orangutans, 257, 260primates, 225–227, 226, 260testes size and, 260
sociobiology, 228–231, 229, 231solitary groups, 225
INDEX 505

Relethford: The Human Species: An Introduction to Biological Anthropology, 5/e
Back Matter Index © The McGraw−Hill Companies, 2003
specialized structures, 217–218speciation, 100–102, 101species, 98–104
adaptive radiation of, 102anagenesis of, 99, 99–100biological species concept, 98–99, 99changing over time, 99–100, 99, 100cladogenesis of, 100, 100classification of, 203–206defined, 15, 98–99, 99emergence of new, 100–102extinctions of, 104identifying, of fossils, 304–305, 304paleospecies, 100as taxonomic category, 15, 203
spider monkeys, 240spindle fibers, 62, 63stabilizing selection, 80, 81stratigraphy, 298–299Strepsirhini (strepsirhines), 238, 239stress
cold, 177–178, 178, 183, 184defined, 175heat, 178–179, 183–185, 184, 355high-altitude, 175, 185–189, 186, 188plasticity and, 176
Strier, Karen, 11sudden infant death syndrome (SIDS),
282sunburn, 169–170suspensory climbing, 247syphilis, 163, 425, 433
tanning, 176–177taphonomy, 302–303tarsiers, 236, 236, 237, 238, 239taste, genetic determination of, for PTC,
43–44, 46–47, 46, 47taxonomy, 15
See also classificationTay-Sachs disease, 76, 93teeth
anatomically modern Homo sapiens,416–417
Australopithecus afarensis, 338–339, 339Australopithecus africanus, 344, 345birds’ absence of, 38cusps, 247, 247dental formula, 213diastema, 315diet and, 213–214of hominoids, 247, 247, 315
in mammals, 212–214, 212Neandertal, 385of New World vs. Old World monkeys,
240odontometrics, 125robust australopithecines, 340–342, 341types of, 212–213
telophase, 62, 63, 64, 65Templeton, Alan, 410terrestrial environment, 216territory, 242thalassemia, 160theistic evolution, 26theory, 14therapsids, 110thermoluminescence, 302tool use
Acheulian tradition, 373, 373–374, 374,383
bipedalism and, 354by anatomically modern Homo sapiens,
396–399, 398by apes, 286–288, 287by archaic humans, 383–384, 383by Homo erectus, 372–374, 373, 374by Homo habilis, 362–363, 362by Neandertals, 389, 389Mousterian tradition, 389, 389Oldowan tradition, 362, 362–363prepared-core technology, 383, 383–384,
389Upper Paleolithic technologies, 396,
397–399, 398Toth, Nicholas, 372transfer RNA (ribonucleic acid), 34, 36trisomy, 55Tristan da Cunha, 85–86tuberculosis, 93, 442–443, 443Turner’s syndrome, 56
ultraviolet radiation, skin color and,169–170, 176–177
uni-male groups, 225, 243–244, 244univariate analysis, 134Upper Paleolithic, 396, 397–399, 398urbanization, diseases and, 431–432
variation, 119–142as area of study, 12biochemical, 121–124biological history of Egyptians and,
152–153
Claxton, Georgia allele frequency study,135–136, 135, 136
in complex physical traits, 52, 124–125defined, 6, 7, 119–121, 120effect of gene flow and genetic drift on,
136–137, 137effect of natural selection on, 137–142evolutionary approach to, 134–142heritability and, 52–53in human diet, 191–192measuring, 119–125morphological, climate and, 179–183,
179, 180, 181, 182multivariate analysis of, 134, 135, 135,
136racial approach to, 125–134relationship of genetics, race and IQ,
141in skin color, 125, 127–129, 128, 129,
130univariate analysis of, 134
vasoconstriction, 177–178vasodilation, 177–178velocity curve, 281–283, 283Venus figurines, 400, 402Vertebrata (vertebrates)
characteristics of, 204, 208defined, 208
Vikings in Ireland, 147–150, 148, 149, 150vision, primates, 218–219, 219visual predation model, 309–310Vitamin D, and skin color, 169, 170–171,
172
Wallace, Alfred Russel, 18Washoe, 291–293weight
birth, stabilizing selection of, 80, 81of body, relationship between brain size
and, 270–272, 271, 272measurement of, 124, 124secular change in, 439See also body size
whales, 22–23Whiten, Andrew, 289
Yanamamo Indians, 144, 145, 146–147, 147
zoonoses, 427zygomatic arch, 341zygote, 280
506 INDEX