Investigations of marine aerosols over the tropical Indian Ocean
Upload
independentCategory
view
4download
0
ARTICLE IN PRESS
1352-2310/$ - se
doi:10.1016/j.at
�CorrespondScience, Gradu
University, 1-1
Tel./fax: +81 7
E-mail addr
Distribution characteristics of polycyclic aromatic hydrocarbonswith particle size in urban aerosols at the roadside in
Ho Chi Minh City, Vietnam
To Thi Hiena,b,�, Le Tu Thanhb, Takayuki Kamedaa,Norimichi Takenakaa, Hiroshi Bandowa
aDepartment of Applied Materials Science, Graduate School of Engineering, Osaka Prefecture University, 1-1 Gakuen-cho,
Sakai 599-8531, JapanbDepartment of Environmental Sciences, University of Natural Sciences, Vietnam National University-Ho Chi Minh City,
No. 227 Nguyen Van Cu Street, 5 Dist, Ho Chi Minh City, Vietnam
Received 26 January 2006; received in revised form 1 August 2006; accepted 26 October 2006
Abstract
The purpose of this study was to characterize size distributions of atmospheric polycyclic aromatic hydrocarbons
(PAHs) with 4–6 rings at the roadside in Ho Chi Minh City, Vietnam. Ten PAHs (fluoranthene, pyrene, triphenylene,
benzo[a]anthracene, chrysene, benzo[b]fluoranthene, benzo[k]fluoranthene, benzo[a]pyrene, benzo[ghi]perylene and
indeno[1,2,3-cd]pyrene) in atmospheric particulate matters (PM) at the roadside were measured in the dry and rainy
seasons in 2005 at Ho Chi Minh City, using a low-pressure cascade impactor. The PM were separated into nine fractions
by their aerodynamic diameter, i.e. 49.0, 9.0–5.8, 5.8–4.7, 4.7–3.3, 3.3–2.1, 2.1–1.1, 1.1–0.7, 0.7–0.4 and o0.4 mm (a final
filter). PAHs were analyzed by high-performance liquid chromatography with fluorescence detection. Total PAHs
measured were higher in the rainy season than in the dry season. The mass of coarse particles occupied a higher fraction
than that of fine particles in both seasons. Total PAHs were mainly concentrated in particles with aerodynamic diameter
smaller than 0.4 mm. The particle size distributions of PAHs investigated were bi-modal with a peak in fine particle mode
(o2.1mm) and another peak in coarse particle mode (42.1mm). Generally, 5,6-ring PAHs associated mainly with fine
particles and 4-ring PAHs spread out in both fine and coarse particles.
r 2006 Elsevier Ltd. All rights reserved.
Keywords: PAHs; Size distribution; Particulate matters; Seasonal trend; Roadside; Asia
e front matter r 2006 Elsevier Ltd. All rights reserved
mosenv.2006.10.045
ing author. Department of Applied Materials
ate School of Engineering, Osaka Prefecture
Gakuen-cho, Sakai 599-8531, Japan.
2 254 9325.
ess: [email protected] (T.T. Hien).
1. Introduction
Polycyclic aromatic hydrocarbons (PAHs) con-stitute a large class of organic compounds andconsist of hundreds of individual substances, whichare released into the atmosphere as a complexmixture of compounds during incomplete combus-tion of organic matter. They can be emitted from all
.
ARTICLE IN PRESS
combustion sources (Venkataraman and Friedlan-dar, 1994), such as wood burning heaters, agricul-tural waste burning, forest fires, diesel and gasolineengine exhaust (Zielinska et al., 2004), tobaccosmoke, waste incineration facilities and asphaltroads (Nikolaou et al., 1984). PAHs are of specialconcern because they are widespread contaminantsin the environment and a number of them are eitherknown or suspected as carcinogens. Benzo(a)pyr-ene, a widely reported 5-ring PAH, is known for itscarcinogenic potency. Ambient concentrations ofPAHs vary according to emission patterns (Mascletet al., 1986) and meteorological effects such astemperature, wind direction and the solar radiation.
PAHs can be transported into the atmosphericenvironment in gaseous and particulate phases.Generally, PAHs with 2–4 aromatic rings occur inthe gaseous and particulate phases, whereas PAHsconsisting of more aromatic rings are almost solelyin the particulate phase (Hoff and Chan, 1987).
In recent years, a number of studies on PAHs invarious cities in the world have been conducted.These studies identified and quantified several PAHcompounds in samples collected from wastewater,sediment (Booij et al., 2003; Fernandez-Sanchezet al., 2004), soils (Meyer et al., 1999) and airenvironment (Hayakawa et al., 2002), and fromdirect emission of several sources such as domesticcombustion (Li et al., 2003; Lee et al., 2005), naturalgas combustion in residential appliances (Roggeet al., 1993), tobacco smoke (Ding et al., 2005) andgasoline and diesel vehicle exhaust (Zielinska et al.,2004; Yang et al., 2005). More importantly, particle-associated PAHs were found significantly in fineparticles with a diameter smaller than 2.5 mm(Kawanaka et al., 2004; Yamaguchi et al., 2004),and the mutagenicity of fine particles is much higherthan that of coarse particles (Tokiwa et al., 1980;Takagi et al., 2002). Recently, Kameda et al. (2005)found that some PAHs are major contributors tothe deposition that contributes to the total deposi-tion of PAHs in the human respiratory tract becausethese PAHs had the same size distributions andaccounted for the largest fraction within size range0.43–1.1 mm. These fine particles can penetratedeeply into the respiratory system, where there isno protective mucus layer, and cause a serioushealth risk and especially can be one of the causes oflung cancer. It should be noted that the health effectrelated to the inhalation of ambient aerosols isknown to be size-dependent. Therefore, the study ofparticle size distribution patterns of these mutagenic
compounds is very necessary for assessing the healtheffects of PAHs. Several studies on particle sizedistribution of PAHs in the atmosphere werecarried out in Europe, US (Aceves and Grimalt,1993; Miguel et al., 1998) and Asia (Japan, China)(Kawanaka et al., 2004; Bi et al., 2005).
Ho Chi Minh City is the largest industrial andcommercial center in South Vietnam. In recentyears, with the increase in fossil fuel use resultingfrom industrialization and urbanization processes,traffic and population growth, Ho Chi Minh Cityhas to face many environmental issues, especially airpollution. Since 1992, a system of activities formonitoring air quality in Ho Chi Minh City hasstarted and is mainly concerned about commonparameters such as total suspended particulate(TSP), carbon monoxide, sulfur dioxide, ozone,and nitrogen oxides. Not much attention is paid tomeasurements of toxic and mutagenic compoundsaffecting human health such as PAHs, whichrequire complicated analytical methods and highexpenses. Consequently, environmental profiles ofthese compounds have not been reported yet.
In this study, the first measurement was carriedout to investigate the concentration level and theparticle size distributions of PAHs in the particulatematters (PM) at a roadside in Ho Chi Minh City inthe dry and rainy seasons of 2005. The aim of thiswork was to understand concentration levels,particle size distributions and seasonal variationsof PAHs at the roadside in Ho Chi Minh City. Theresults from this study will help to better understandtheir ambient environmental sources and alsoprovide helpful information about the environmen-tal levels of these harmful substances in big cities inVietnam.
2. Experimental methods
2.1. Site characterization and sampling of PM
Ho Chi Minh City is located in the tropical regionand is close to the sea. Therefore, it is steadily warmto hot all year round in the city. The climate variesseasonally according to the typical monsoon regime,i.e. only two major seasons are identified. Dryseason generally begins in early December and endsin late April. Rainy season begins in May and lastsuntil November or sometimes to December.
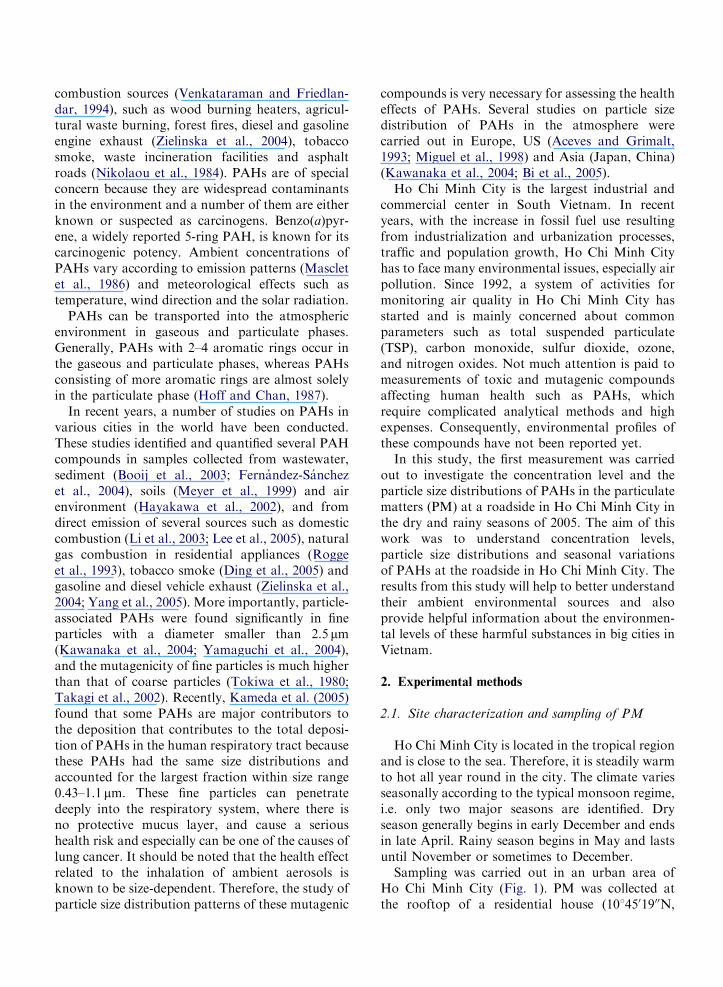
Sampling was carried out in an urban area ofHo Chi Minh City (Fig. 1). PM was collected atthe rooftop of a residential house (1014501900N,
ARTICLE IN PRESS
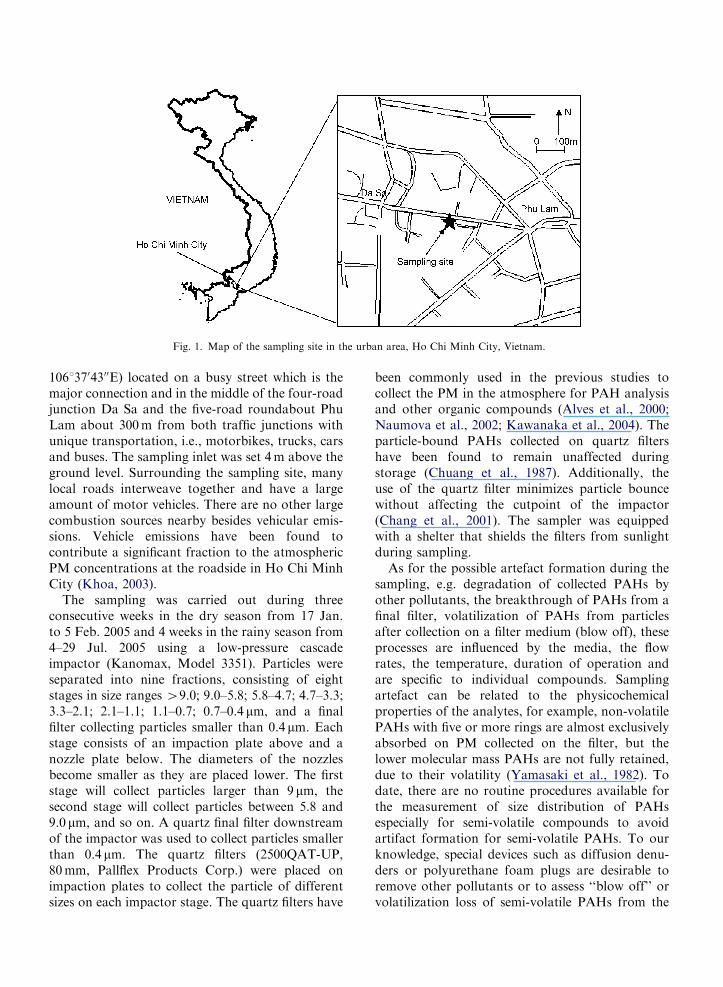
Fig. 1. Map of the sampling site in the urban area, Ho Chi Minh City, Vietnam.
10613704300E) located on a busy street which is themajor connection and in the middle of the four-roadjunction Da Sa and the five-road roundabout PhuLam about 300m from both traffic junctions withunique transportation, i.e., motorbikes, trucks, carsand buses. The sampling inlet was set 4m above theground level. Surrounding the sampling site, manylocal roads interweave together and have a largeamount of motor vehicles. There are no other largecombustion sources nearby besides vehicular emis-sions. Vehicle emissions have been found tocontribute a significant fraction to the atmosphericPM concentrations at the roadside in Ho Chi MinhCity (Khoa, 2003).
The sampling was carried out during threeconsecutive weeks in the dry season from 17 Jan.to 5 Feb. 2005 and 4 weeks in the rainy season from4–29 Jul. 2005 using a low-pressure cascadeimpactor (Kanomax, Model 3351). Particles wereseparated into nine fractions, consisting of eightstages in size ranges 49.0; 9.0–5.8; 5.8–4.7; 4.7–3.3;3.3–2.1; 2.1–1.1; 1.1–0.7; 0.7–0.4 mm, and a finalfilter collecting particles smaller than 0.4 mm. Eachstage consists of an impaction plate above and anozzle plate below. The diameters of the nozzlesbecome smaller as they are placed lower. The firststage will collect particles larger than 9 mm, thesecond stage will collect particles between 5.8 and9.0 mm, and so on. A quartz final filter downstreamof the impactor was used to collect particles smallerthan 0.4 mm. The quartz filters (2500QAT-UP,80mm, Pallflex Products Corp.) were placed onimpaction plates to collect the particle of differentsizes on each impactor stage. The quartz filters have
been commonly used in the previous studies tocollect the PM in the atmosphere for PAH analysisand other organic compounds (Alves et al., 2000;Naumova et al., 2002; Kawanaka et al., 2004). Theparticle-bound PAHs collected on quartz filtershave been found to remain unaffected duringstorage (Chuang et al., 1987). Additionally, theuse of the quartz filter minimizes particle bouncewithout affecting the cutpoint of the impactor(Chang et al., 2001). The sampler was equippedwith a shelter that shields the filters from sunlightduring sampling.
As for the possible artefact formation during thesampling, e.g. degradation of collected PAHs byother pollutants, the breakthrough of PAHs from afinal filter, volatilization of PAHs from particlesafter collection on a filter medium (blow off), theseprocesses are influenced by the media, the flowrates, the temperature, duration of operation andare specific to individual compounds. Samplingartefact can be related to the physicochemicalproperties of the analytes, for example, non-volatilePAHs with five or more rings are almost exclusivelyabsorbed on PM collected on the filter, but thelower molecular mass PAHs are not fully retained,due to their volatility (Yamasaki et al., 1982). Todate, there are no routine procedures available forthe measurement of size distribution of PAHsespecially for semi-volatile compounds to avoidartifact formation for semi-volatile PAHs. To ourknowledge, special devices such as diffusion denu-ders or polyurethane foam plugs are desirable toremove other pollutants or to assess ‘‘blow off’’ orvolatilization loss of semi-volatile PAHs from the
ARTICLE IN PRESS
particles. In this study, we were not equipped withthese special devices, therefore the possibility thatthe PAHs concentrations reported here might beunderestimated in their ambient concentrations,especially for PAHs with four aromatic rings dueto potential sampling artifacts as mentioned(Thrane and Mikalsen, 1981).
The sampling was done over 5 workdays in aweek at the flow rate of 28.3 Lmin�1 and the totalair volume is about 204m3 at the ambient condition.In this study, to reduce the possibility of artifactformation during the sampling period, the filterswere changed every 24 h and the five filter samples(i.e., 5 consecutive days) are combined into onesample for PAH analysis.
For the gravimetric determination of PM massconcentrations, the filters were wrapped withaluminum foil and equilibrated in a desiccator atroom temperature within 48 h and weighed beforeand after sample collection. Filter blanks were donein the same manner as the sampling procedure. Thefilters were wrapped in aluminum foil and stored at�20 1C until chemical analysis.
2.2. Extraction of soluble organic compounds
Particulate samples were treated according to theprevious study (Hayakawa et al., 2002) with somemodifications. The filters from each stage of thecascade impactor were cut into small pieces andwere extracted by ultrasonication in the solventbenzene/ethanol (3/1 v/v), and then the solution wasfiltered with cellulose acetate filter (Advantec MFS,No. 2) to remove solid substances. The filtrate wascleaned with 100mL of 5% NaOH, followed by100mL of 20% H2SO4 and then 100mL ofMillipore water. The extract was concentrated to
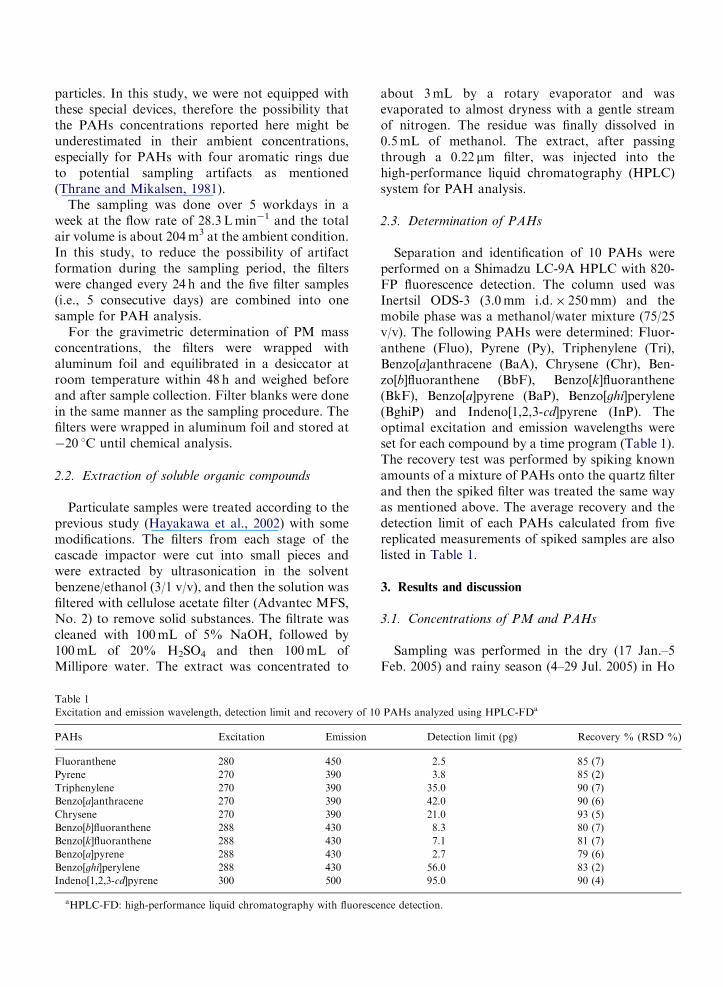
Table 1
Excitation and emission wavelength, detection limit and recovery of 10
PAHs Excitation Emission
Fluoranthene 280 450
Pyrene 270 390
Triphenylene 270 390
Benzo[a]anthracene 270 390
Chrysene 270 390
Benzo[b]fluoranthene 288 430
Benzo[k]fluoranthene 288 430
Benzo[a]pyrene 288 430
Benzo[ghi]perylene 288 430
Indeno[1,2,3-cd]pyrene 300 500
aHPLC-FD: high-performance liquid chromatography with fluoresce
about 3mL by a rotary evaporator and wasevaporated to almost dryness with a gentle streamof nitrogen. The residue was finally dissolved in0.5mL of methanol. The extract, after passingthrough a 0.22 mm filter, was injected into thehigh-performance liquid chromatography (HPLC)system for PAH analysis.
2.3. Determination of PAHs
Separation and identification of 10 PAHs wereperformed on a Shimadzu LC-9A HPLC with 820-FP fluorescence detection. The column used wasInertsil ODS-3 (3.0mm i.d.� 250mm) and themobile phase was a methanol/water mixture (75/25v/v). The following PAHs were determined: Fluor-anthene (Fluo), Pyrene (Py), Triphenylene (Tri),Benzo[a]anthracene (BaA), Chrysene (Chr), Ben-zo[b]fluoranthene (BbF), Benzo[k]fluoranthene(BkF), Benzo[a]pyrene (BaP), Benzo[ghi]perylene(BghiP) and Indeno[1,2,3-cd]pyrene (InP). Theoptimal excitation and emission wavelengths wereset for each compound by a time program (Table 1).The recovery test was performed by spiking knownamounts of a mixture of PAHs onto the quartz filterand then the spiked filter was treated the same wayas mentioned above. The average recovery and thedetection limit of each PAHs calculated from fivereplicated measurements of spiked samples are alsolisted in Table 1.
3. Results and discussion
3.1. Concentrations of PM and PAHs
Sampling was performed in the dry (17 Jan.–5Feb. 2005) and rainy season (4–29 Jul. 2005) in Ho
PAHs analyzed using HPLC-FDa
Detection limit (pg) Recovery % (RSD %)
2.5 85 (7)
3.8 85 (2)
35.0 90 (7)
42.0 90 (6)
21.0 93 (5)
8.3 80 (7)
7.1 81 (7)
2.7 79 (6)
56.0 83 (2)
95.0 90 (4)
nce detection.
ARTICLE IN PRESS
Chi Minh City, Vietnam. The meteorologicalconditions during the sampling periods are shownin Table 2.
The fractions of particles collected on impactorstages 1–5 (particle diameter, DP42.1mm) and onstage 6—the final filter (DPo2.1mm) are referred toas a coarse and a fine particle fraction, respectively,in this study. The total PM calculated from allimpactor stages and the final filter ranged from 341to 540mgm�3 (average: 470mgm�3) and from 395 to442mgm�3 (average: 418mgm�3) in the dry andrainy seasons, respectively. The total PM concentra-tions in this study were considerably higher than ourother studies (unpublished data) on atmospheric PMat a residential area (54–130mgm�3) and anotherroadside with lighter pollution (72–206mgm�3) in theurban area from Jan. to Sep. 2005 that will bedescribed in the next paper. These high concentra-tions of the total PM are in agreement with themonthly average concentrations of samples collectedin roadside air in Ho Chi Minh City from 1995 to2002 (range: 200–800mgm�3) (Khoa, 2003).
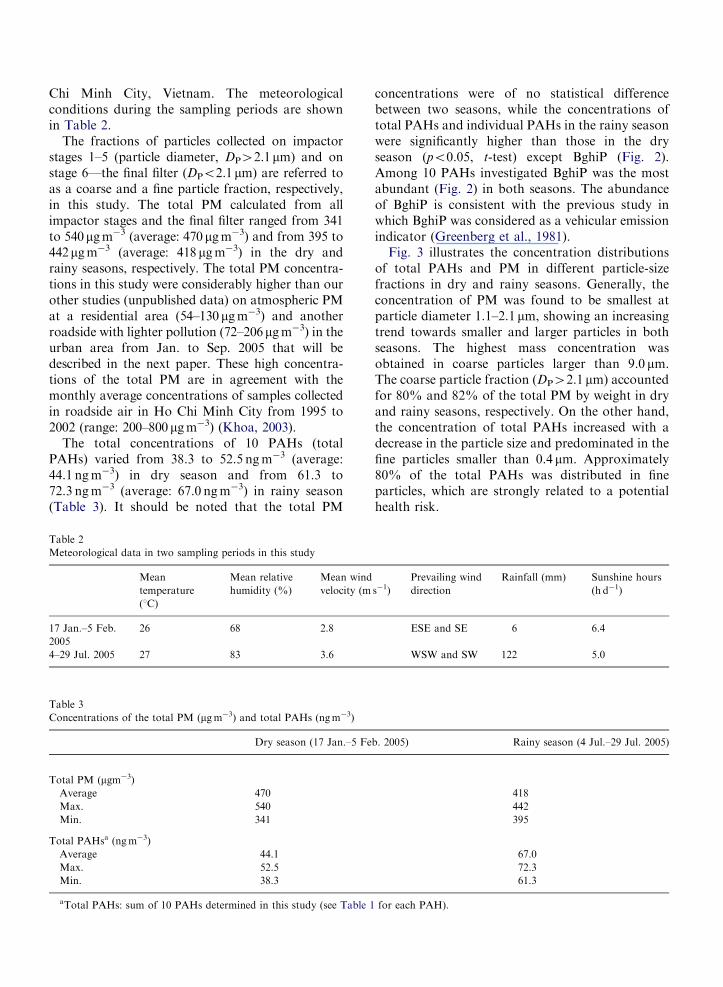
The total concentrations of 10 PAHs (totalPAHs) varied from 38.3 to 52.5 ngm�3 (average:44.1 ngm�3) in dry season and from 61.3 to72.3 ngm�3 (average: 67.0 ngm�3) in rainy season(Table 3). It should be noted that the total PM
Table 2
Meteorological data in two sampling periods in this study
Mean
temperature
(1C)
Mean relative
humidity (%)
Mean wind
velocity (m
17 Jan.–5 Feb.
2005
26 68 2.8
4–29 Jul. 2005 27 83 3.6
Table 3
Concentrations of the total PM (mgm�3) and total PAHs (ngm�3)
Dry season (17 Jan.–5 Fe
Total PM (mgm�3)Average 470
Max. 540
Min. 341
Total PAHsa (ngm�3)
Average 44.1
Max. 52.5
Min. 38.3
aTotal PAHs: sum of 10 PAHs determined in this study (see Table 1
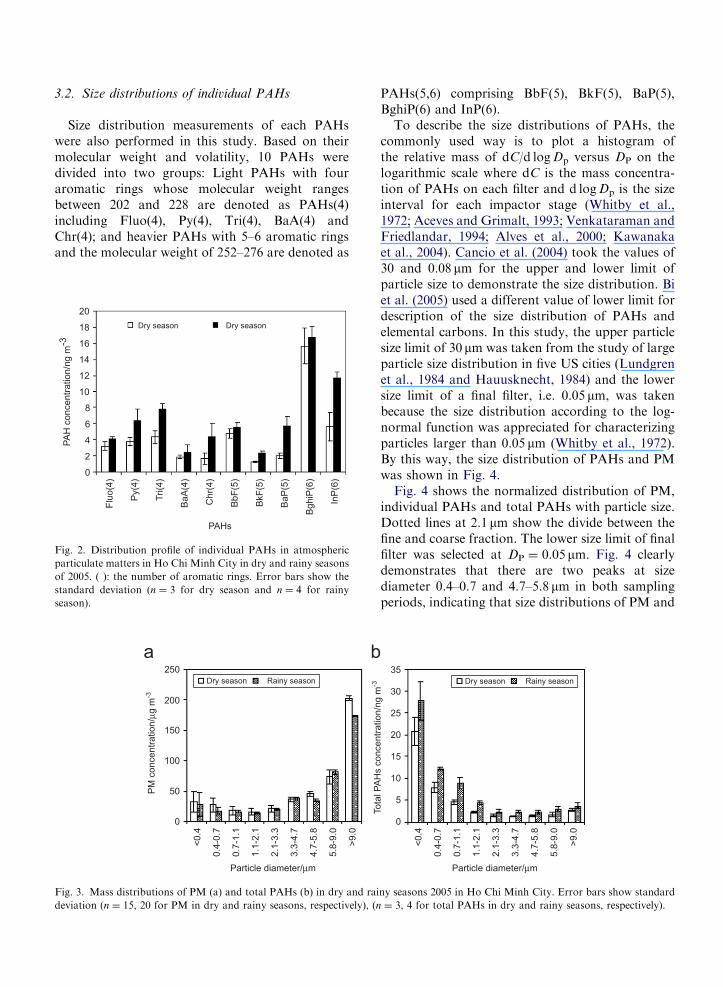
concentrations were of no statistical differencebetween two seasons, while the concentrations oftotal PAHs and individual PAHs in the rainy seasonwere significantly higher than those in the dryseason (po0.05, t-test) except BghiP (Fig. 2).Among 10 PAHs investigated BghiP was the mostabundant (Fig. 2) in both seasons. The abundanceof BghiP is consistent with the previous study inwhich BghiP was considered as a vehicular emissionindicator (Greenberg et al., 1981).
Fig. 3 illustrates the concentration distributionsof total PAHs and PM in different particle-sizefractions in dry and rainy seasons. Generally, theconcentration of PM was found to be smallest atparticle diameter 1.1–2.1 mm, showing an increasingtrend towards smaller and larger particles in bothseasons. The highest mass concentration wasobtained in coarse particles larger than 9.0 mm.The coarse particle fraction (DP42.1 mm) accountedfor 80% and 82% of the total PM by weight in dryand rainy seasons, respectively. On the other hand,the concentration of total PAHs increased with adecrease in the particle size and predominated in thefine particles smaller than 0.4 mm. Approximately80% of the total PAHs was distributed in fineparticles, which are strongly related to a potentialhealth risk.
s�1)
Prevailing wind
direction
Rainfall (mm) Sunshine hours
(h d�1)
ESE and SE 6 6.4
WSW and SW 122 5.0
b. 2005) Rainy season (4 Jul.–29 Jul. 2005)
418
442
395
67.0
72.3
61.3
for each PAH).
ARTICLE IN PRESS
3.2. Size distributions of individual PAHs
Size distribution measurements of each PAHswere also performed in this study. Based on theirmolecular weight and volatility, 10 PAHs weredivided into two groups: Light PAHs with fouraromatic rings whose molecular weight rangesbetween 202 and 228 are denoted as PAHs(4)including Fluo(4), Py(4), Tri(4), BaA(4) andChr(4); and heavier PAHs with 5–6 aromatic ringsand the molecular weight of 252–276 are denoted as
20
18
16
Dry season Dry season
14
12
10
PAHs
8
PA
H c
oncentr
ation/n
g m
-3
6
4
2
0
Flu
o(4
)
Py(4
)
Tri(4
)
BaA
(4)
Chr(
4)
BbF
(5)
BaP
(5)
BkF
(5)
InP
(6)
BghiP
(6)
Fig. 2. Distribution profile of individual PAHs in atmospheric
particulate matters in Ho Chi Minh City in dry and rainy seasons
of 2005. ( ): the number of aromatic rings. Error bars show the
standard deviation (n ¼ 3 for dry season and n ¼ 4 for rainy
season).
250
200
PM
concentr
ation/µ
g m
-3
150
100
50
0
Particle diameter/µm
<0.4
>9.0
0.4
-0.7
0.7
-1.1
1.1
-2.1
2.1
-3.3
3.3
-4.7
4.7
-5.8
5.8
-9.0
Dry season Rainy season
a b
Fig. 3. Mass distributions of PM (a) and total PAHs (b) in dry and rai
deviation (n ¼ 15, 20 for PM in dry and rainy seasons, respectively), (n
PAHs(5,6) comprising BbF(5), BkF(5), BaP(5),BghiP(6) and InP(6).
To describe the size distributions of PAHs, thecommonly used way is to plot a histogram ofthe relative mass of dC/d logDp versus DP on thelogarithmic scale where dC is the mass concentra-tion of PAHs on each filter and d logDp is the sizeinterval for each impactor stage (Whitby et al.,1972; Aceves and Grimalt, 1993; Venkataraman andFriedlandar, 1994; Alves et al., 2000; Kawanakaet al., 2004). Cancio et al. (2004) took the values of30 and 0.08 mm for the upper and lower limit ofparticle size to demonstrate the size distribution. Biet al. (2005) used a different value of lower limit fordescription of the size distribution of PAHs andelemental carbons. In this study, the upper particlesize limit of 30 mm was taken from the study of largeparticle size distribution in five US cities (Lundgrenet al., 1984 and Hauusknecht, 1984) and the lowersize limit of a final filter, i.e. 0.05 mm, was takenbecause the size distribution according to the log-normal function was appreciated for characterizingparticles larger than 0.05 mm (Whitby et al., 1972).By this way, the size distribution of PAHs and PMwas shown in Fig. 4.
Fig. 4 shows the normalized distribution of PM,individual PAHs and total PAHs with particle size.Dotted lines at 2.1 mm show the divide between thefine and coarse fraction. The lower size limit of finalfilter was selected at DP ¼ 0.05 mm. Fig. 4 clearlydemonstrates that there are two peaks at sizediameter 0.4–0.7 and 4.7–5.8 mm in both samplingperiods, indicating that size distributions of PM and
Dry season Rainy season
Tota
l P
AH
s c
oncentr
ation/n
g m
-3
35
30
25
20
15
10
5
0
Particle diameter/µm
<0.4
>9.0
0.4
-0.7
0.7
-1.1
1.1
-2.1
2.1
-3.3
3.3
-4.7
4.7
-5.8
5.8
-9.0
ny seasons 2005 in Ho Chi Minh City. Error bars show standard
¼ 3, 4 for total PAHs in dry and rainy seasons, respectively).
ARTICLE IN PRESS
Particle diameter, Dp/µm
dC
/dlo
gD
p/ n
g m
–3µµm
–1
Fluo (4)
0.0
0.5
1.0
1.5
2.0
2.5
3.0
3.5
4.0
0.01 0.1 1 10 100
Py (4)
0.0
1.0
2.0
3.0
4.0
5.0
6.0
0.01 0.1 1 10 100
Tri (4)
0.0
1.0
2.0
3.0
4.0
5.0
6.0
7.0
8.0
0.01 0.1 1 10 100
BaA (4)
0.0
0.2
0.4
0.6
0.8
1.0
1.2
1.4
1.6
1.8
0.01 0.1 1 10 100
Chr (4)
0.0
0.5
1.0
1.5
2.0
2.5
3.0
3.5
4.0
0.01 0.1 1 10 100
BbF (5)
0.0
1.0
2.0
3.0
4.0
5.0
6.0
0.01 0.1 1 10 100
BkF (5)
0.0
0.5
1.0
1.5
2.0
2.5
0.01 0.1 1 10 100
BaP (5)
0.0
1.0
2.0
3.0
4.0
5.0
6.0
7.0
0.01 0.1 1 10 100
BghiP (6)
0.0
2.0
4.0
6.0
8.0
10.0
12.0
14.0
16.0
0.01 0.1 1 10 100
InP (6)
0.0
2.0
4.0
6.0
8.0
10.0
12.0
0.01 0.1 1 10 100
Total PAHs
0.0
10.0
20.0
30.0
40.0
50.0
60.0
0.01 0.1 1 10 100
PM/ (µg m-3µm-1)
0
100
200
300
400
500
600
0.01 0.1 1 10 100
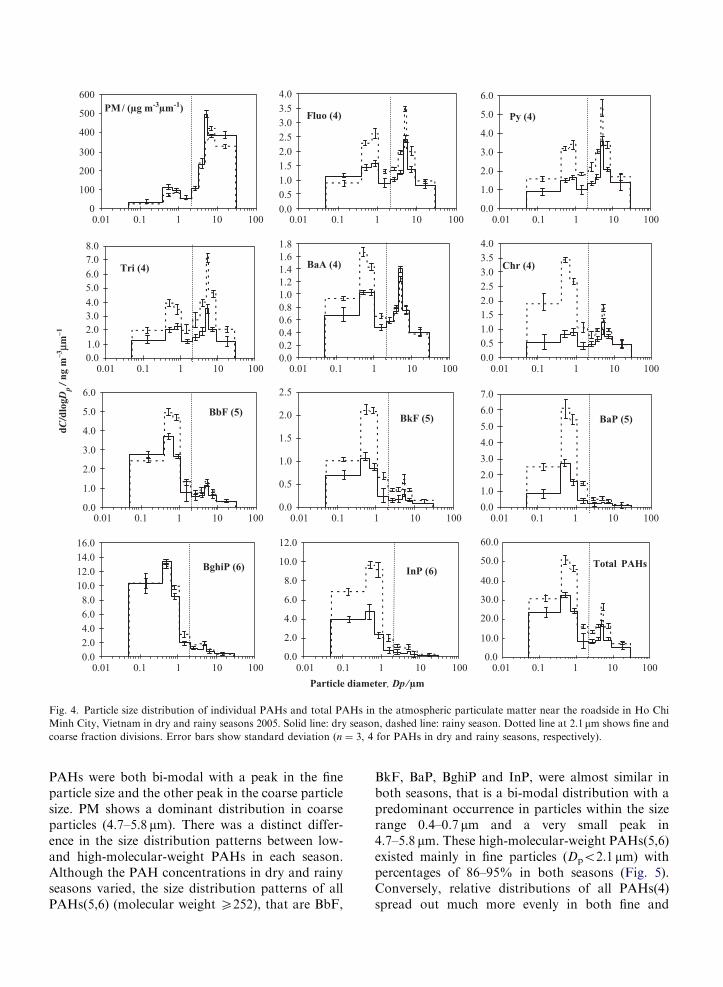
Fig. 4. Particle size distribution of individual PAHs and total PAHs in the atmospheric particulate matter near the roadside in Ho Chi
Minh City, Vietnam in dry and rainy seasons 2005. Solid line: dry season, dashed line: rainy season. Dotted line at 2.1mm shows fine and
coarse fraction divisions. Error bars show standard deviation (n ¼ 3, 4 for PAHs in dry and rainy seasons, respectively).
PAHs were both bi-modal with a peak in the fineparticle size and the other peak in the coarse particlesize. PM shows a dominant distribution in coarseparticles (4.7–5.8 mm). There was a distinct differ-ence in the size distribution patterns between low-and high-molecular-weight PAHs in each season.Although the PAH concentrations in dry and rainyseasons varied, the size distribution patterns of allPAHs(5,6) (molecular weight X252), that are BbF,
BkF, BaP, BghiP and InP, were almost similar inboth seasons, that is a bi-modal distribution with apredominant occurrence in particles within the sizerange 0.4–0.7 mm and a very small peak in4.7–5.8 mm. These high-molecular-weight PAHs(5,6)existed mainly in fine particles (Dpo2.1 mm) withpercentages of 86–95% in both seasons (Fig. 5).Conversely, relative distributions of all PAHs(4)spread out much more evenly in both fine and
ARTICLE IN PRESS
100 %
Dry season
Rainy season
PAHs
PAHs
Fine Coarse
80 %
60 %
40 %
20 %
0 %
Re
lative
co
ntr
ibu
tio
n/%
Flu
o(4
)
Py(4
)
Tri(4
)
Ba
A(4
)
Ch
r(4
)
Bb
F(5
)
Ba
P(5
)
BkF
(5)
InP
(6)
Bg
hiP
(6)
100 %
80 %
60 %
40 %
20 %
0 %
Re
lative
co
ntr
ibu
tio
n/%
Flu
o(4
)
Py(4
)
Tri(4
)
Ba
A(4
)
Ch
r(4
)
Bb
F(5
)
Ba
P(5
)
BkF
(5)
InP
(6)
Bg
hiP
(6)
Fine Coarse
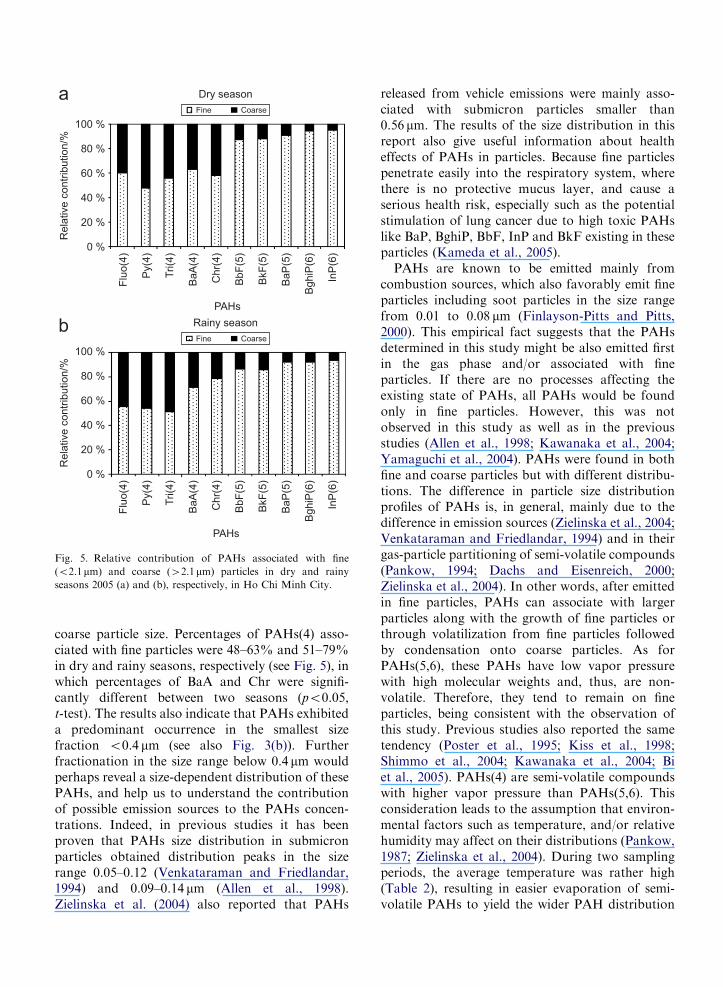
Fig. 5. Relative contribution of PAHs associated with fine
(o2.1mm) and coarse (42.1mm) particles in dry and rainy
seasons 2005 (a) and (b), respectively, in Ho Chi Minh City.
coarse particle size. Percentages of PAHs(4) asso-ciated with fine particles were 48–63% and 51–79%in dry and rainy seasons, respectively (see Fig. 5), inwhich percentages of BaA and Chr were signifi-cantly different between two seasons (po0.05,t-test). The results also indicate that PAHs exhibiteda predominant occurrence in the smallest sizefraction o0.4 mm (see also Fig. 3(b)). Furtherfractionation in the size range below 0.4 mm wouldperhaps reveal a size-dependent distribution of thesePAHs, and help us to understand the contributionof possible emission sources to the PAHs concen-trations. Indeed, in previous studies it has beenproven that PAHs size distribution in submicronparticles obtained distribution peaks in the sizerange 0.05–0.12 (Venkataraman and Friedlandar,1994) and 0.09–0.14 mm (Allen et al., 1998).Zielinska et al. (2004) also reported that PAHs
released from vehicle emissions were mainly asso-ciated with submicron particles smaller than0.56 mm. The results of the size distribution in thisreport also give useful information about healtheffects of PAHs in particles. Because fine particlespenetrate easily into the respiratory system, wherethere is no protective mucus layer, and cause aserious health risk, especially such as the potentialstimulation of lung cancer due to high toxic PAHslike BaP, BghiP, BbF, InP and BkF existing in theseparticles (Kameda et al., 2005).
PAHs are known to be emitted mainly fromcombustion sources, which also favorably emit fineparticles including soot particles in the size rangefrom 0.01 to 0.08 mm (Finlayson-Pitts and Pitts,2000). This empirical fact suggests that the PAHsdetermined in this study might be also emitted firstin the gas phase and/or associated with fineparticles. If there are no processes affecting theexisting state of PAHs, all PAHs would be foundonly in fine particles. However, this was notobserved in this study as well as in the previousstudies (Allen et al., 1998; Kawanaka et al., 2004;Yamaguchi et al., 2004). PAHs were found in bothfine and coarse particles but with different distribu-tions. The difference in particle size distributionprofiles of PAHs is, in general, mainly due to thedifference in emission sources (Zielinska et al., 2004;Venkataraman and Friedlandar, 1994) and in theirgas-particle partitioning of semi-volatile compounds(Pankow, 1994; Dachs and Eisenreich, 2000;Zielinska et al., 2004). In other words, after emittedin fine particles, PAHs can associate with largerparticles along with the growth of fine particles orthrough volatilization from fine particles followedby condensation onto coarse particles. As forPAHs(5,6), these PAHs have low vapor pressurewith high molecular weights and, thus, are non-volatile. Therefore, they tend to remain on fineparticles, being consistent with the observation ofthis study. Previous studies also reported the sametendency (Poster et al., 1995; Kiss et al., 1998;Shimmo et al., 2004; Kawanaka et al., 2004; Biet al., 2005). PAHs(4) are semi-volatile compoundswith higher vapor pressure than PAHs(5,6). Thisconsideration leads to the assumption that environ-mental factors such as temperature, and/or relativehumidity may affect on their distributions (Pankow,1987; Zielinska et al., 2004). During two samplingperiods, the average temperature was rather high(Table 2), resulting in easier evaporation of semi-volatile PAHs to yield the wider PAH distribution
ARTICLE IN PRESS
shifted towards larger size particles. In addition,mass concentration of PM in coarse particle rangewas high at the sampling site and this can enhancethe distribution of the low molecular weight PAHsin the coarse particles.
3.3. Seasonal changes in size distribution of PAHs
As mentioned above, there are some differencesin the concentrations and size distributions of PAHsin dry and rainy seasons. Generally, the concentra-tions of total PAHs increased when particle sizebecame smaller and the concentrations of totalPAHs in each size fraction were higher in rainyseason than those in dry season (po0.05, t-test)(Fig. 3(b)). PM concentrations decreased slightly inrainy season but there was no statistical differencein two sampling periods. For PAH distribution,distinct difference is not obvious in size distributionpatterns of PAHs(5,6) between both seasons, asshown in Fig. 4. These patterns showed bi-modaldistribution and a dominant peak in fine particlessize (0.4–0.7 mm) in both seasons. However, theintensities of dominant peaks in rainy season werehigher than those in dry season (po0.05, t-test),with an exception of BghiP. As for PAHs(4), dryseason samples showed the predominant distribu-tion for coarse particles (4.7–5.8 mm). Interestingly,the enhancement of the peak distribution at particlediameter (0.4–0.7 mm) was prominent in the rainyseason samples for BaA and Chr, similar toPAHs(5,6).
The possible cause of these seasonal variations isthought to be different meteorological conditionsbetween both seasons. The characteristics of me-teorological conditions in Ho Chi Minh City arelisted in Table 2. Average temperature did notchange substantially in two sampling periods, i.e.26 1C (range: 20–35 1C) in dry and 27 1C (range:21–33 1C) in rainy season. Wind direction and windspeed vary with the season that may affect onseasonal variation of PAHs. In Ho Chi Minh City,wind direction reflects the typical monsoon circula-tion. In dry season (Jan.–Feb. 2005), easterly windprevails in general, which means the sampling sitereceives the air-mass passing around Phu Lamroundabout (see Fig. 1), whereas wind in rainyseason (Jul. 2005) is mostly westerly and thus itblows from the side of Da Sa junction to thesampling site. In fact, more detailed observation ofdiurnal wind patterns indicated that wind directionschange from day to day and even within a day with
different wind velocity. Additionally, as describedabove, the sampling site is adjacent to a road andsurrounded by proximal roads with high trafficintensities and the number of vehicles moving on theroad also changes at different times within a day.Therefore, the seasonal effect of wind directioncould not be a main reason to explain the variationof size distribution patterns and concentrations ofPAHs in both seasons.
Another variable related to meteorological con-ditions which might effect seasonal variations ofPAHs is sunshine hours. The average number ofsunshine hours was 6.4 and 5.0 h d�1 duringsampling periods in dry and rainy seasons, respec-tively, and rainfall increased significantly in rainyseason. Thus, a likely factor of the difference inPAHs concentration and distribution between dryand rainy seasons seems most probably related tophotochemical degradation of particle-bound PAHsin the atmospheric environment. In dry season, thenumber of sunshine hours became longer, whichcould increase PAHs decay in daytime and result inthe decrease of PAH concentration. This result isconsistent with the work of Kamens et al. (1988)with respect to PAHs decay under the solarradiation, but is in contrast with the resultsobserved on the seasonal variation of PAHs inTSP in Jakarta, which have shown higher concen-trations of PAHs during the dry season with longersunshine hours and lower concentrations of PAHsin wet season (Panther et al., 1999). It should also benoted that traffic jams often happen on the streetin urban areas of Ho Chi Minh City in rainy days,i.e. the emission from vehicles increases resulting inthe increase of PAHs at the roadside.
Compared to the results reported for the tempe-rate zones such as Barcelona (Aceves and Grimalt,1993), the concentration of PAHs in cold seasonwas higher than that in warm season. However,there was no difference between low- and high-molecular-weight PAHs in their size distributionsbetween two seasons and the size distribution wasuni-modal. Another study reported by Zhou et al.(2005) showed that the size distributions of PAHswith two and three rings were bi-modal, and thoseof PAHs with more than four rings were uni-modalin Autumn in Beijing, China. In addition, the resultfrom the work of Allen et al. (1996) on sizedistribution of PAHs in atmospheric aerosols inMassachusetts indicated that PAHs with 2–3 aro-matic rings were evenly distributed between the fineand coarse particles, while PAHs with higher
ARTICLE IN PRESS
molecular weights were mainly in fine particles inurban areas. On the other hand, the distributions ofthese PAHs were associated with both the fine andcoarse particles in rural areas.
From the previous findings mentioned above andalso from the results of this study, it could bepointed out that size distribution of PAHs havevaried from city to city, from urban to rural areas,and from season to season, depending on manyfactors like meteorological conditions, emissionsources, physicochemical properties of PAHs andso on. The results observed in this study could bethe characteristics of seasonal change in the sizedistribution of PAHs in the urban area in Ho ChiMinh City. However, this is the first study on sizedistribution of PAHs in the tropical area such as HoChi Minh City, and therefore, there is no data onthe size distribution of PAHs to be directlycompared with the present study. To get moreinformation on size distribution of PAHs in theatmosphere in Ho Chi Minh City, further studiesare now in progress.
4. Conclusion
Field study was conducted to collect atmosphericPM with different sizes near the roadside in Ho ChiMinh City, Vietnam in dry and rainy seasons of2005. The results showed the characteristics of sizedistribution of PAHs in the atmospheric PM of thesite in a tropical area. There was no statisticaldifference between the total PM in both samplingperiods. The concentration of total PAHs wassignificantly higher in the rainy season than in thedry season. Coarse particles with aerodynamicdiameters larger than 2.1 mm occupied approxi-mately 80%. On the other hand, the total PAHsdetermined in this study accounted for about 80%in fine particles smaller than 2.1 mm in diameter inboth seasons. The size distributions of PAHs(5,6)were bi-modal with a dominant peak in fine sizerange of 0.4–0.7 mm in both seasons. However, sizedistributions of PAHs(4), being bi-modal asPAHs(5,6), showed a higher peak in coarse sizerange of 4.7–5.8 mm in both seasons except for BaAand Chr, which showed predominance in fine sizeparticles from 0.4 to 0.7 mm only in the rainy season.The differences in concentration of PAHs and sizedistributions of PAHs(4) (Fluo, Py, Tri, BaA, andChr) and PAHs(5,6) (BbF, BkF, BaP, BghiP andInP) are discussed with the possible parameters suchas the differences of the physicochemical properties
of PAHs themselves, meteorological factors espe-cially sunshine hours, and the emission source, butthe cause of the difference remains uncertain atpresent.
This research is the first field investigation oflevels and distributions of PAHs at different aerosolsizes in the atmospheric environment in Vietnam.The further study on size distribution of theparticles smaller than 0.4 mm should provide usefulinformation on the contribution of possible emis-sion sources to the PAH concentrations. Theassessment of loss processes of PAHs need to becarried out in future study.
Acknowledgements
This study was partly supported by the Ministryof Education and Training, Vietnam. We greatlythank Dr. Kiyoshi Imamura, Environmental Pollu-tion Control Center of Osaka Prefecture;Dr. Nguyen Van Dong, University of NaturalSciences of Ho Chi Minh City; and Ms. Dang SiThuy Tam, Meteorological Center of South Viet-nam for their supports. We would like to thank theanonymous reviewers for their valuable comments.
References
Aceves, M., Grimalt, J.O., 1993. Seasonally dependent size
distributions of aliphatic and polycyclic aromatic hydrocar-
bons in urban aerosols from densely populated areas.
Environmental Science and Technology 27, 2896–2908.
Allen, J.O., Dookeran, N.M., Smith, K.A., Sarofim, A.F., 1996.
Measurement of polycyclic aromatic hydrocarbons associated
with size-segregated atmospheric aerosols in Massachusetts.
Environmental Science and Technology 30, 1023–1031.
Allen, J.O., Drant, J.L., Dookeran, N.M., Taghizadeh, K.,
Plumer, E.F., Lafleur, A.L., Sarofim, A/F., Smith, K.A.,
1998. Measurement of C24H14 polycyclic aromatic hydro-
carbons associated with a size-segregated urban aerosol.
Environmental Science and Technology 32, 1928–1932.
Alves, C.A., Pio, C.A., Duarte, A.C., 2000. Particulate size
distributed organic compounds in a forest atmosphere.
Environmental Science and Technology 34, 4287–4293.
Bi, X., Sheng, G., Peng, P., Chen, Y., Fu, J., 2005. Size
distribution of n-alkanes and polycyclic aromatic hydrocar-
bons (PAHs) in urban and rural atmospheres of Guangzhou,
China. Atmospheric Environment 39, 477–487.
Booij, K., Hoedemaker, J.R., Bakker, J.F., 2003. Dissolved
PCBs, PAHs, and HCB in pore waters and overlying waters
of contaminated harbor sediments. Environmental Science
and Technology 37, 4213–4220.
Cancio, J.A.L., Castellano, A.V., Artin, S.S., Rodriguez, J.F.S.,
2004. Size distributions of PAHs in ambient air particles of
two areas of Las Palmas De Gran Canaria. Water, Air and
Soil Pollution 154, 127–138.
ARTICLE IN PRESS
Chang, M., Sioutas, C., Cassee, F.R., Fokkens, P.H.B., 2001.
Field evaluation of a mobile high-capacity particle size
classifier (HCPSC) for separate collection of coarse, fine
and ultrafine particles. Journal of Aerosol Sciences 32,
139–156.
Chuang, J.C., Hanna, S.W., Wilson, N.K., 1987. Field compar-
ison of polyurethane foam and XAD-2 resin for air sampling
for polycyclic aromatic hydrocarbons. Environmental Science
and Technology 21, 798–804.
Dachs, J., Eisenreich, S.J., 2000. Adsorption onto aerosol soot
carbon dominates gas-phase partitioning of polycyclic aro-
matic hydrocarbons. Environmental Science and Technology
34, 3690–3697.
Ding, Y.S., Trommel, J.S., Yan, X.J., Ashley, D., Watson, C.H.,
2005. Determination of 14 polycyclic aromatic hydrocarbons
in mainstream smoke from domestic cigarettes. Environmen-
tal Science and Technology 39, 471–478.
Fernandez-Sanchez, J.F., Carretero, A.S., Cruces-Blanco, C.,
Fernandez-Gutierrez, A., 2004. Highly sensitive and selective
fluorescence optosensor to detect and quantify benzo[a]pyrene
in water samples. Analytica Chimica Acta 17, 1–7.
Finlayson-Pitts, B., Pitts, J.N., 2000. Chemistry of the Upper and
Lower Atmosphere: Theory, Experiments, and Applications.
Academic Press, London, pp. 438–439.
Greenberg, A., Bozzelli, J.W., Cannova, F., Forstner, E.,
Giorgio, P., Stout, D., Yokoyama, R., 1981. Correlations
between lead and coronene concentrations at urban, sub-
urban, and industrial sites in New Jersey. Environmental
Science and Technology 16, 566–570.
Hayakawa, K., Tang, N., Akutsu, K., Murahash, T., Kakimoto,
H., Kizu, R., Toriba, A., 2002. Comparison of polycyclic
aromatic hydrocarbons and nitropolycyclic aromatic hydro-
carbons in airborne particulates collected in downtown and
suburban Kanazawa, Japan. Atmospheric Environment 36,
5535–5541.
Hoff, R.M., Chan, K.W., 1987. Measurement of polycyclic
aromatic hydrocarbons in the air along the Niagara River.
Environmental Science and Technology 21, 556–561.
Kameda, Y., Shirai, J., Komai, T., Nakanishi, J., Masunaga, S.,
2005. Atmospheric polycyclic aromatic hydrocarbons: size
distribution, estimation of their risk and their depositions to
the human respiratory tract. Science of the Total Environ-
ment 340, 71–80.
Kamens, R.M., Guo, Z., Fulcher, J.N., Bell, D.A., 1988. The
influence of humidity, sunlight, and temperature on the
daytime decay of polyaromatic hydrocarbons on atmospheric
soot particles. Environmental Science and Technology 22,
103–108.
Kawanaka, Y., Matsumoto, E., Sakamoto, K., Wang, N., Yun,
S., 2004. Size distributions of mutagenic compounds and
mutagenicity in atmospheric particulate matter collected with
a low-pressure cascade impactor. Atmospheric Environment
38, 2125–2132.
Khoa, V.L., 2003. Air Quality Management in Hochiminh City.
Kitakyushu initiative seminar on urban air quality manage-
ment, 20–21 February 2003. Bangkok, Thailand./http://
unescap.org/esd/environment/kitakyushu/urban_air/city_
report/HoChiMinh2.pdfS.
Kiss, G., Varga-Puchony, Z., Rohrbacher, G., Hlavay, J., 1998.
Distribution of polycyclic aromatic hydrocarbons on atmo-
spheric aerosol particles of different sizes. Atmospheric
Research 46, 253–261.
Lee, R.G.M., Coleman, P., Jones, J.L., Jones, K.C., Lohmann,
R., 2005. Emission factors and importance of PCDD/Fs,
PCBs, PCNs, PAHs and PM10 from the domestic burning of
Coal and wood in the UK. Environmental Science and
Technology 39, 1436–1447.
Li, C.T., Lin, Y.C., Lee, W.J., Tsai, P.J., 2003. Emission of
polycyclic aromatic hydrocarbons and their carcinogenic
potencies from cooking sources to the urban atmosphere.
Environmental Health Perspectives 111, 483–487.
Lundgren, D.A., Hausknecht, B.J., Burton, R.M., 1984. Large
particle size distribution in five US cities and the effect on a
new ambient particulate matter standard (PM10). Aerosol
Science and Technology 0, 467–473.
Masclet, P., Mouvier, G., Nikolaou, K., 1986. Relative decay
index and sources of polycyclic aromatic hydrocarbons.
Atmospheric Environment 20, 439–446.
Meyer, S., Cartellieri, S., Steinhart, H., 1999. Simultaneous
determination of PAHs, hetero-PAHs (N, S, O), and their
degradation products in creosote-contaminated soils. Method
development, validation, and application to hazardous waste
Sites. Analytical Chemistry 71, 4023–4029.
Miguel, A.H., Kirchstetter, T.W., Harley, R.A., Hering, S.V.,
1998. On-road emissions of particulate polycyclic aromatic
hydrocarbons and black carbon from gasoline and diesel
vehicles. Environmental Science and Technology 32, 450–455.
Naumova, Y.Y., Eisenreich, S.J., Turpin, B.J., Weisel, C.P.,
Morandi, M.T., Colome, S.D., 2002. Polycyclic aromatic
hydrocarbons in the indoor and outdoor air of three cities
in the US. Environmental Science and Technology 36,
2552–2559.
Nikolaou, K., Masclet, P., Mouvier, G., 1984. Sources and
chemical reactivity of polynuclear aromatic hydrocarbons in
the atmosphere—a critical review. Science of The Total
Environment 32, 103–132.
Pankow, J.F., 1987. Review and comparative analysis of the
theories on partitioning between the gas and aerosol
particulate phases in the atmosphere. Atmospheric Environ-
ment 21, 2275–2283.
Pankow, J.F., 1994. An absorption model of gas/particle
partitioning of organic compounds in the atmosphere.
Atmospheric Environment 28, 185–188.
Panther, B.C., Hooper, M.A., Tappe, N.J., 1999. A comparison
of air particulate matter and associated polycyclic aromatic
hydrocarbons in some tropical and temperate urban environ-
ments. Atmospheric Environment 33, 4087–4099.
Poster, D.L., Hoff, R.M., Baker, J.E., 1995. Measurement of the
particle-size distributions of semivolatile organic contami-
nants in the atmosphere. Environmental Science and Tech-
nology 29, 1990–1997.
Rogge, W.F., Hildemann, L.M., Mazurek, M.A., Cass, G.R.,
Simoneit, B.R.T., 1993. Sources of fine organic aerosol. 5.
Natural gas home appliances. Environmental Science and
Technology 27, 2736–2744.
Shimmo, M., Saarnio, K., Aalto, P., Hartonen, K., Hyotyllainen,
T., Kulmala, M., Riekkola, M., 2004. Particle size distribu-
tion and gas-particle partition of polycyclic aromatic hydro-
carbon in Helsinki Urban Area. Journal of Atmospheric
Chemistry 47, 223–241.
Takagi, Y., Goto, S., Nakajima, D., Endo, O., Koyano, M.,
Kohzaki, K., Matsushita, H., 2002. Mutagenicity of sus-
pended particulate matter divided in three sizes indoors.
Journal of Health Science 48, 480–484.
ARTICLE IN PRESS
Thrane, K.E., Mikalsen, A., 1981. High-volume sampling of airborne
polycyclic aromatic hydrocarbons using glass fiber filters and
polyurethane foam. Atmospheric Environment 15, 909–918.
Tokiwa, H., Kitamori, S., Takahashi, K., Ohnishi, Y., 1980.
Mutagenic and chemical assay of extracts of airborne
particulates. Mutation Research 77, 99–108.
Venkataraman, C., Friedlandar, S.K., 1994. Size distributions of
polycyclic aromatic hydrocarbons and elemental carbon. 2.
Ambient measurements and effects of atmospheric processes.
Environmental Science and Technology 28, 563–572.
Whitby, K.T., Husar, R.B., Liu, B.Y.H., 1972. The aerosol size
distribution of Los Angeles smog. Journal of Colloid and
Interface Science 39, 177–204.
Yamaguchi, T., Yamasaki, C., Yamazaki, H., 2004. Character-
istic of size-classified airborne particulates in Kobe, Japan.
Journal of Health Science 50, 290–295.
Yamasaki, H., Kuwata, K., Miyamoto, H., 1982. Effects of
ambient temperature on aspects of airborne polycyclic
aromatic hydrocarbons. Environmental Science and Technol-
ogy 16, 189–194.
Yang, H.H., Hsieh, L.T., Liu, H.C., Mi, H.H., 2005. Polycyclic
aromatic hydrocarbon emissions from motorcycles. Atmo-
spheric Environment 39, 1–201.
Zhou, T., Wang, T., Huang, Y., Mao, T., Zhong, N., 2005. Size
distribution of polycyclic aromatic hydrocarbons in urban
and suburban sites of Beijing, China. Chemosphere 61,
792–799.
Zielinska, B., Sagebiel, J., Arnott, W.P., Rogers, C.F., Kelly,
K.E., Wagner, D.A., Lighty, J.S., Sarofim, A.F., Palmer, G.,
2004. Phase and size distribution of polycyclic aromatic
hydrocarbons in diesel and gasoline vehicle emissions.
Environmental Science and Technology 38, 2557–2567.
Copyright © 2022 FDOKUMEN