Dispersion and abundance of Antarctic krill in the vicinity of ...
11
Vol. 99:29-39, 1993 l MARINE ECOLOGY PROGRESS SERIES Mar. Ecol. Prog. Ser. Published September 2 Dispersion and abundance of Antarctic krill in the vicinity of Elephant Island in the 1992 austral summer Roger P. Hewitt l, David A. ern er^^' 'Southwest Fisheries Science Center, La JoIIa, California 92038, USA 'Scripps Institution of Oceanography, La Jolla, California 92093, USA ABSTRACT: Antarctic knll Euphausia superba distribution and abundance were estimated from 4 acoustic surveys conducted in the vicinity of Elephant Island. Antarctica, from mid-January to mid- March 1992. The first and last surveys covered a 105 by 105 n mile study area centered on Elephant Island; the second and third surveys covered a 60 by 35 n mile area immediately north of Elephant Island. During the first survey, krill were distributed in a wide band extending along the north side of Elephant Island and wrapping around the western end; biomass was estimated to be 2.2 million metric tons (t). During the second survey, the highest densities of krill were over the shelf extending to the northwest from Elephant Island and including the Seal Island archipelago; high densities of krill also extended off the shelf from the northeast end of Elephant Island Into deeper water. Biomass in the smaller survey area was estimated to be 0.7 million t. Three weeks later, high krill densities were still apparent in the vicinity of Seal Island, but the area of high density previously mapped off the northeast end of Elephant Island had diminished considerably; biomass was estimated to be 0.4 million t. During the final survey, conducted 6 wk after the first survey, krill were mapped in reduced densities primar- ily to the west of Elephant Island; biomass over the larger survey area had declined to 1.1 million t. INTRODUCTION Antarctic krill Euphausia superba is a key compo- nent in the pelagic marine ecosystem of the Southern Ocean (Laws 1985).As much as 300 million metric tons (t) of krill may be consumed annually by 30 million pinnipeds, 50 million sea birds and 300000 baleen whales (Miller & Hampton 1989). It is also the target of an international fishery (ca 400000 t annually). Although the harvest is less than 1 % of the annual krill production, catches tend to be localized near penguin and fur seal breeding colonies (Agnew in press). The effects of fishing, however, on the reproductive success of land-breeding krill predators has yet to be demon- strated. To do so, it will first be necessary to document the response of predator populations to features of the offshore prey field, and then to determine the effects of fishing on the distribution of prey. ' Supported by the John and Fannie Hertz Foundation O Inter-Research 1993 In response to international concern regarding unregulated development of fisheries in the Southern Ocean, the Convention of the Conservation of Ant- arctic Marine Living Resources (CCAMLR) was estab- lished as part of the Antarctic treaty system in 1982. A principal tenet of the convention is that the harvest of living resources shall be managed with the goal of preserving species diversity and stability of the entire marine ecosystem. Through its Scientific Committee, CCAMLR has encouraged member nations to establish long-term programs to monitor foraging behavior and reproductive success of selected krill predators (SC- CAMLR-IV 1985, SC-CAMLR-V 1986, Croxall et al. 1988, Croxall 1989). More recently the Scientific Committee called for descriptions of the prey hstribu- tion and abundance in the vicinity of predator monitor- ing sites and adopted a series of general principles to be used in the design of krill surveys (SC-CAMLR-X 1991). It was recommended that: (1) acoustic data be collected along a series of regularly spaced parallel transects; (2) these data be used to map the distribution
-
Upload
khangminh22 -
Category
Documents
-
view
4 -
download
0
Transcript of Dispersion and abundance of Antarctic krill in the vicinity of ...

Vol. 99: 29-39, 1993 l MARINE ECOLOGY PROGRESS SERIES Mar. Ecol. Prog. Ser. Published September 2
Dispersion and abundance of Antarctic krill in the vicinity of Elephant Island in the
1992 austral summer
Roger P. Hewitt l , David A. ern er^^'
'Southwest Fisheries Science Center, La JoIIa, California 92038, USA 'Scripps Institution of Oceanography, La Jolla, California 92093, USA
ABSTRACT: Antarctic knll Euphausia superba distribution and abundance were estimated from 4 acoustic surveys conducted in the vicinity of Elephant Island. Antarctica, from mid-January to mid- March 1992. The first and last surveys covered a 105 by 105 n mile study area centered on Elephant Island; the second and third surveys covered a 60 by 35 n mile area immediately north of Elephant Island. During the first survey, krill were distributed in a wide band extending along the north side of Elephant Island and wrapping around the western end; biomass was estimated to be 2.2 million metric tons (t). During the second survey, the highest densities of krill were over the shelf extending to the northwest from Elephant Island and including the Seal Island archipelago; high densities of krill also extended off the shelf from the northeast end of Elephant Island Into deeper water. Biomass in the smaller survey area was estimated to be 0.7 million t. Three weeks later, high krill densities were still apparent in the vicinity of Seal Island, but the area of high density previously mapped off the northeast end of Elephant Island had diminished considerably; biomass was estimated to be 0.4 million t. During the final survey, conducted 6 wk after the first survey, krill were mapped in reduced densities primar- ily to the west of Elephant Island; biomass over the larger survey area had declined to 1.1 million t.
INTRODUCTION
Antarctic krill Euphausia superba is a key compo- nent in the pelagic marine ecosystem of the Southern Ocean (Laws 1985). As much as 300 million metric tons (t) of krill may be consumed annually by 30 million pinnipeds, 50 million sea birds and 300000 baleen whales (Miller & Hampton 1989). It is also the target of an international fishery (ca 400000 t annually). Although the harvest is less than 1 % of the annual krill production, catches tend to be localized near penguin and fur seal breeding colonies (Agnew in press). The effects of fishing, however, on the reproductive success of land-breeding krill predators has yet to be demon- strated. To do so, it will first be necessary to document the response of predator populations to features of the offshore prey field, and then to determine the effects of fishing on the distribution of prey.
' Supported by the John and Fannie Hertz Foundation
O Inter-Research 1993
In response to international concern regarding unregulated development of fisheries in the Southern Ocean, the Convention of the Conservation of Ant- arctic Marine Living Resources (CCAMLR) was estab- lished as part of the Antarctic treaty system in 1982. A principal tenet of the convention is that the harvest of living resources shall be managed with the goal of preserving species diversity and stability of the entire marine ecosystem. Through its Scientific Committee, CCAMLR has encouraged member nations to establish long-term programs to monitor foraging behavior and reproductive success of selected krill predators (SC- CAMLR-IV 1985, SC-CAMLR-V 1986, Croxall et al. 1988, Croxall 1989). More recently the Scientific Committee called for descriptions of the prey hstribu- tion and abundance in the vicinity of predator monitor- ing sites and adopted a series of general principles to be used in the design of krill surveys (SC-CAMLR-X 1991). It was recommended that: (1) acoustic data be collected along a series of regularly spaced parallel transects; (2) these data be used to map the distribution

Mar. Ecol. Prog. Ser. 99: 29-39, 1993
of krill in the vicinity of a predator monitoring site The analyses presented here were conducted to reveal and estimate their abundance; and (3) more focused features of krill distribution that persisted over rela- surveys, consisting of randomly or regularly spaced tively large scales (tens of km, and several days). parallel transects, be conducted in areas of highest krill Analyses of these data on finer scales will be reported density. elsewhere.
A seasonal predator monitoring site has been main- tained at Seal Island, off the northwest coast of Elephant Island, Antarctica, since the austral summer METHODS of 1986/1987 (Bengtson et al. 1991, Boveng et al. 1991, Croll et al. 1991). An annual series of complementary Echo integration methods were used to map the shipboard observations, including acoustic surveys of distribution of krill and estimate its abundance in zooplankton distribution and abundance, has been the vicinity of Elephant Island. Four surveys were conducted in the waters surrounding Elephant Island conducted between 19 January and 11 March 1992 (Anon. 1990, Rosenberg & Hewitt 1991, 1992). The (Fig. l a , b). acoustic surveys presented in this report are the latest in the series.
Results from previous surveys suggest that the distri- bution, abundance and demography of krill in the Elephant Island area varies considerably both within and between years (Mathisen & Macaulay 1983, 60
Kalinowski 1984, Macaulay et al. 1984, Kalinowski et al. 1985, Klindt 1986, Nast 1986, Siegel 1986b, Brinton et al. 1987), and that these changes are due to immi- gration and emigration of krill rather than local popu- lation effects (Priddle 1988, Sahrhage et al. 1988). Spatial separation of adults, sub-adults and juveniles
61 suggests that offshore waters west of the Antarctic Peninsula are krill spawning areas and that the neritic zone may be used as nursery grounds (Fevolden &
George 1984, Quetin & Ross 1984, Siegel 1986a). Siegel (1988) proposed that adult krill migrate from the G southwest (Bellingshausen Sea) into offshore waters g during the summer, that sub-adults and juveniles drift f 62 to the northeast with the prevailing coastal current, m
58 57 56 55 54 53
and that the direction of these movements is reversed g 0 60
the autumn. Makaorov et al. (1988) and Nast et al. g CI
(1988) noted that Elephant Island lies in the path of a major outlet from the Weddell Sea, and that variations
3
in the position of the Weddell-Scotia Confluence (WSC) may account for the variation in the numbers of krill accumulating in the Elephant Island area from the northern Weddell Sea. Stein (1986) described seasonal variations and meanders in the position of the WSC, which is apparent as a persistent hydrographic front north of Elephant Island. The meanders and eddies in
61 the current flow along the front may be a factor favor- ing the accumulation of krill in the Elephant Island area, regardless of their origin (Everson 1984, Witek et al. 1988).
Two objectives of our field research program are to: (1) relate the response of krill predators to changes in 57 56 5s
the availability of their prey; and (2) relate these changes to biotic and abiotic aspects of the pelagic habitat. As such, there is interest in both the spatial patterns of krill distribution as well as their abundance.
Longitude (degrees West)
Fig 1 (a) Station pattern and acoustic transects for Surveys A and D. (b) Acoustlc transects for Surveys B and C

Hewitt & Demer: Krill abundance in the Antarctic 31
Surveys A and D were designed to describe meso- scale (tens to hundreds of km) features of water mass structure, phytoplankton biomass and productivity, and zooplankton constituents (including krill) in the area around Elephant Island. Surveys B and C were designed to map the micro-scale (one to tens of km) features of the distribution, density and abundance of krill immediately north of Elephant Island, within the foraging range of krill predators breeding at Seal Island.
Acoustic data were collected with a Simrad EK5OO echo sounder (Bodholt et al. 1989) configured with a 120 kHz split-beam transducer. The transducer was deployed on a dead-weight towed body positioned 7 m below the water surface, and communicated with the echo sounder via 50 m of armored towing cable, a set of slip rings on the towing winch, and 75 m of shielded deck cable. The entire system (echo sounder, cables and winch) was calibrated before and after the cruise using standard sphere methods (Johannesson &
Mitson 1983) in a 3 m diameter by 10 m deep tank filled with seawater chilled to 0.5 'C; calibration drift was less than 1.2 dB (Demer & Hewitt in press).
Echo power levels for each ping were sampled approximately every 3 cm (25 kHz sampling rate) and adjustments were made for spherical spreading and absorption losses. This data set was averaged every 0.5 m over depths ranging from 10 to 250 m, and the resulting set of mean volume backscattenng strength measurements (sv) was passed to a computer for further processing and archiving.
Echograms were generated from the subsampled data set and interpreted. The threshold volume backscattering strength was set at -81 dB (equivalent to approximately 0.1 krill m-3), and portions of the echogram were attributed to echoes from krill and non-krill (bottom return, system noise, other scatter- ers). For the purpose of generating distribution maps and biomass estimates, volume backscattering strength attributed to krill was integrated over 10 to 250 m depth range (or 1 m above the bottom, if shal- lower than 250 m) and averaged over 1 n mile inter- vals. Ship's position was also recorded every 10 s and time-keyed to the acoustic data set. Version 2.6 of the 'Bergen Integrator' software, CO-developed by the Bergen Institute of Marine Research, the Christian Michelsen Institute, and Simrad (Knudsen 1990, Foote et al. 1991), was used as an aid in interpreting the echograms and archiving the results.
Mean backscattering area per square n mile of sea surface (sA) for every 1 n mile of survey transect [m2(n mile12] was thus calculated by the Bergen Integrator software as:
2 = 250
sA = 4 ~ c r ~ ~ 1 8 5 2 ~ (1) z r l 0
where S , = 0 if 10 log(sv) 2-81 dB; z = depth; and r, =
1 m is the reference range for backscattering strength. By assuming that measurements of sv represent the
linear sum of echoes from individual animals within the sample volume (MacLennan & Sirnmonds 1992), the numerical density of krill (number per unit area of sea surface) can be estimated by dividing S, by the backscattering cross-sectional area (o, m2) of a single krill. Biomass density of krill ( p , g m-2) can be estl- mated by multiplying the numerical density by the weight of a single krill.
Both the backscattering cross-sectional area and the weight of krill are non-linear functions of body length. We used the definition of knll target strength (TS, dB) as a function of standard length (I) as proposed by Greene et al. (1991) and adopted by the CCAMLR Working Group on Krill (SC-CAMLR-X 1991) (see also 'Discussion') :
where l = standard length of krill (mm). The corre- sponding backscattering cross-sectional area of krill (c) is:
The relationship of krill wet wt (W, mg) as a function of standard length was taken from Siegel (1986a) for individuals caught in March:
Thus: p = S," = 0.249 S, 0 (5)
Krill were sampled directly with a 6 ft (ca 1.8 m) Isaacs-Kidd rnidwater trawl (IKMT, Devereux 1953), outfitted with a net made of 505 pm mesh nytex, and fished obliquely from approximately 170 m depth to the surface (Loeb & Siegel in press). Net tows were made at regularly-spaced stations on Surveys A and D (Fig. l a ) without regard to time of day; no net tows were conducted during Surveys B and C. The fre- quency distribution of krill standard length was used to calculate p as follows:
where f, = the relative frequency of krill of standard length l,, such that C:=, f, = 1, where i refers to the ith length class and n is the number of length classes.
A composite frequency distribution of kri!J standard length was calculated from all net tows conducted dur- ing Survey A and used to estimate densities on Surveys A and B; similarly a composite frequency distribution was calculated from all net tows conducted during Survey D and used to estimate densities on Surveys C

Mar. Ecol. Prog. Ser. 99: 29-39, 1993
and D. The resulting data sets, indexed by time and ship's position, were gridded and contoured for each of the 4 surveys.
Following the method proposed by Hampton (1987) and Jolly & Hampton (1990), each transect was consid- ered a single sample of biomass density. The entire survey area was treated as a single stratum. Mean bio- mass density (p) was calculated as a weighted mean:
where (7, = mean density on the ith transect; n, = no, of 1 n mile averaging-intervals on the ith transect; and N = no. of transects. Following Jolly & Hampton (1990) and Simmonds et al. (1991), variance of p was esti- mated as: N
Biomass was estimated as:
where A = total survey area (m2). Variance of the bio- mass estimate was calculated as:
and the coefficient of variation as:
The above expression only reflects the sampling vari- ance (Simmonds et al. 1991). Other potential sources of errors and biases are outlined in the 'Discussion'.
RESULTS
ably (Survey C, Fig. 4). A final survey, similar in area1 coverage and sampling intensity to the first survey, was conducted during the first 10 d of March, 6 wk after Survey A. Both the extent and density of krill were greatly reduced; areas of highest densities were mapped to the west of Elephant Island (Survey D, Fig. 5).
The frequency distribution of krill standard length was bimodal throughout the study period (Fig. 6). Both
Longitude
Fig. 2. Euphausia superba. Survey A, large- area survey, 19 January to 2 February 1992.
KriU biomass density in g m-Z
In late January, krill were distributed in a broad $ band which extended across the north side of Elephant 2 Island and wrapped around its western end (Survey A, 3 Fig. 2). During a higher resolution survey, conducted during the first week in February, highest krill densl- ties were mapped over the shelf extending to the northwest from Elephant Island and including the Seal Island archipelago. High densities of krill also ex- tended off the shelf from the northeast end of Elephant Island into deeper water (Survey B, Fig. 3).
A similar survey was conducted 3 wk later during the last week in February. Although high krill densities were still apparent in the vicinity of Seal Island, the Fig. 3, Euphausia superba, Survey B, Small- area of high density previously mapped off the north- area 5 to 6 ~~b~~~~~ 1992, ill east end of Elephant Island had diminished consider- biornass density in g m-2

Hewitt & Demer: Krill abundance in the Antarctic
Longitude
Standard length (mm)
Fig. 4. Euphausia superba. Survey C, small- area survey, 25 to 28 February 1992. Krill
biomass density in g m-2
18 20 22 r.r co LO ou or 34 36 38 40 42 M 46 48 50 52 54 56 58 60
Standard length (mm) 60
Fig. 6. Euphausia superba. Frequency distributions of krill standard length collected during (a) Survey A and (b) Survey
B From Loeb & Siegel (in press)
and the size frequency of krill obtained during Survey 61 D was used to calculate krill densities on Surveys C
and D. During the first large-area survey (Survey A) krill
abundance was estimated at 2.2 million t, CV = 16 %. Six weeks later (Survey D) krill abundance over the same area was estimated to be 1.1 million t, CV = 9 %. Estimated abundance during the first small-area
62 survey (Survey B) was 0.7 million t, CV = 22 %, and 58 57 56 55 H 53 during the second small-area survey (Survey C) it was
Longitude 0.4 million t, CV = 23 % (Table 1).
Fig. 5. Euphausia superba. Survey D, large- area survey, 29 February to 10 March 1992.
Knll biomass density in g m-'
reproductively mature and immature adult krill con- tributed to the mode at 44 to 45 mm; juvenile krill con- stituted the mode at approximately 28 mm (Loeb & Siegel in press). Relative to Survey A, greater propor- tions of intermediate-sized krill and reduced propor- tions of smaller sizes were caught during Survey D. The size frequency obtained during Survey A was used to calculate krill densities on Surveys A and B,
DISCUSSION
Several sources of error associated with the echo in- tegration method can be identified. These include both random errors and systematic biases associated with the definition of individual krill target strength, esti- mating the size distribution of krill in the surveyed population, species identification, estimating the amount of undetected krill, assumption of a linear addition of echoes from individual krill in the sample volume, estimating system gain and absorption loss, and estimating survey sampling error.
34 Mar. Ecol. Prog. Ser. 99: 29-39. 1993
Table 1. Euphausia superba. Abundance estimates for Surveys A, B , C and D n,: no of 1 n mlle averaging intervals on the ith transect; S,: mean backscattering area per n mile2 of sea surface; (5: mean biomass dens~ty; Var ( P ) : variance of p; CV: coefficient
of variation
Transect 1 Transect 2 Transect 3 Transect 4 Transect 5 Transect 6 Transect 7 Transect 8 Transect 9 Transect 10 Transect 11 Transect 12
Cn, Weighted mean Weighted vanance
0 . 2 4 9 5 fi r = l
D(g m-') Var (P) Survey area (n mile2) Survey area (A, X 106 m') Biomass (B, X 103 t) CV (%)
Survey A n, SA
113 386.3 95 374.5
108 814.9 112 590.6 127 451.1 137 473.4 115 231.5 117 178.9
Survey B n, SA
30 714.9 37 188.6 35 979.5 35 470.7 27 386.9 24 590.0 31 918.2 28 67.8 37 1220.0 35 1990.3 33 353.5 34 529.6
386
721.8 25 723.2
Survey C nr S4
47 725.9 35 512.7 38 160.5 37 1155.2 29 648.0 25 55.2 29 34.9 37 400.5 32 219.9 37 337.5 32 144.6 38 374.1
416
421.3 9056.1
Survey D n, S,:
Foote et al. (1990) noted that abundance estimates of krill using acoustics were often much less than those obtained from estimates of predator demand. They suspected large errors associated with the definition of individual krill target strength, and ensonified live krill aggregations in a cage at 120 kHz. The mean singIe- animal target strength of 30 to 39 mm krill was inferred from the aggregation backscatter to range from -81 to -74 dB. Everson et al. (1990) noted that these values were considerably lower that those calculated from previously used equations relating target strength to the physical size of krill (BIOMASS 1986), and that the use of these equations resulted in gross underesti- mates of krill abundance. Until recently, a fluid sphere model was used to characterize the target strength of krill. Wiebe et al. (1990) ensonified several species of Live, but tethered, zooplankton at 420 kHz and con- cluded that sound scatter from elongated animals is better described by a bent cylinder model (Stanton 1989), and that target strength is proportional to the volume of an animal rather than its cross-sectional area. Using these data, Greene et al. (1991) predicted krill target strength at several frequencies and over a range of body lengths. The Foote et al. (1990) data agreed with the Greene et al. (1991) prediction. Further corroboration was offered by Hewitt & Demer
(1991) who reported a set of in situ target strength measurements using a 120 kHz split-beam transducer. For krill with an estimated mean length of 47.4 mm, the modal target strength was -69 dB, within 1 dB of the prediction by Greene et al. (1991). The CCAMLR Working Group on Krill reviewed these and several unpublished studies on krill target strength and concluded that 'a growing body of evidence suggests that the BIOMASS definition of target strength as a function of body length at 120 kHz consistently over- estimates target strength', and that 'measurements over a range of animal lengths imply a stronger depen- dence of target strength on length than that predicted by the BIOPI4ASS definition' (SC-CAMLR-X 1.991). Although the Greene et al. (1991) equation is a cur- rently accepted estimator of krill target strength, body shape, orientation and physical condition also affect target strength (Stanton 1989). The range of variation of these parameters should be measured under condi- tions when the krill would be surveyed, and used in theoretical models to predict the distribution of indi- vidual target strengths that would be expected from a natural aggregation of knll (SC-CAMLR-X 1991).
Estimates of krill biomass density are insensitive to minor variations in the frequency distribution of length. This is because the number of krill per kg
Hewitt & Demer: Krill abundance in the Antarctic 3 5
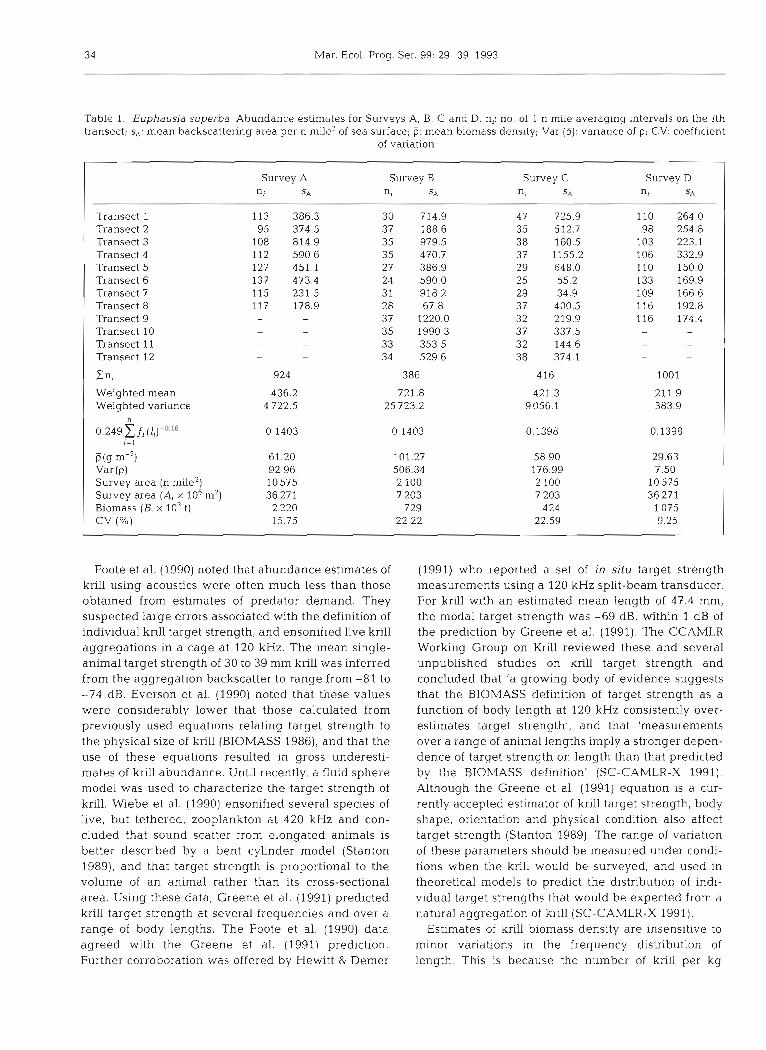
Table 2. Euphausia superba. Knl l weight, numbers per kg, target strength (TS) per individual, TS per kg, backscattenng cross- section per kg, and kg per backscattering cross-section by standard length
A B C D E F G
Length Wet wt No. of TS ind.-' TS kg-' Backscattering kg krill m-2
(mm) (9) krill kg"
(dB) (dB) cross-sectional area backscattering
of 1 kg krill (m2 kg-') area (kg m-')
20 0.0409 24 463 -82.11 -38.22 0.001892 529 25 0.0858 11649 -78.73 -38.07 0.001960 510 30 0.1574 6354 -75.97 -37 94 0.002018 4 95 35 0.2628 3 806 -73.64 -37 84 0.002069 483 4 0 0.4096 2441 -71.62 -37.74 0.002113 473 4 5 0.6060 1650 -69.84 3 7 . 6 6 0.002154 464 50 0.8603 1162 -68.24 -37.59 0.002190 457 55 1.1810 847 -66.80 -37.52 0.002224 450 60 1.5773 634 -65.48 -37.46 0.002255 443
B = (0.00193 325)/1000 D = -127.45 - 34.85log(A) F = 471 10E"O C = 1000/B E = lOlog(C) + D G = 1/E
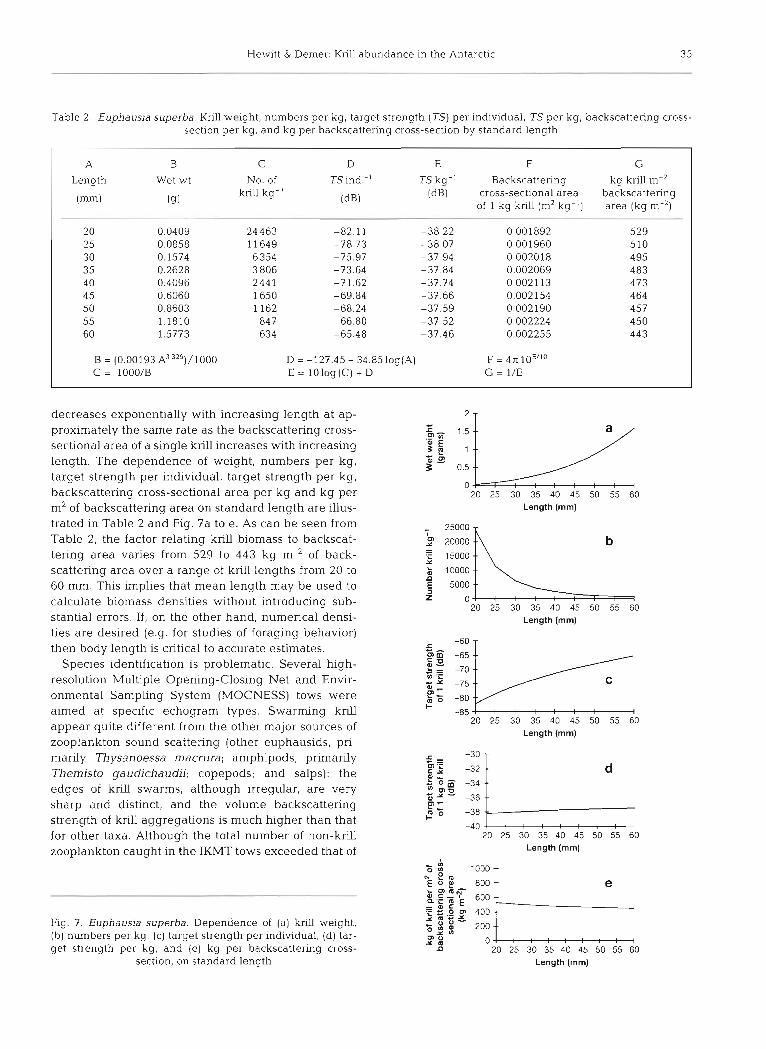
decreases exponentially with increasing length at ap- proximately the same rate as the backscattering cross- sectional area of a single krill increases with increasing length. The dependence of weight, numbers per kg, target strength per individual, target strength per kg, backscattering cross-sectional area per kg and kg per m* of backscattering area on standard length are illus- trated in Table 2 and Fig. 7a to e. As can be seen from Table 2, the factor relating krill biomass to backscat- tering area varies from 529 to 443 kg m-2 of back- scattering area over a range of krill lengths from 20 to 60 mm. This implies that mean length may be used to calculate biomass densities without introducing sub- stantial errors. If, on the other hand, numerical densi- ties are desired (e.g. for studies of foraging behavior) then body length is critical to accurate estimates.
Species identification is problematic. Several high- resolution Multiple Opening-Closing Net and Envir- onmental Sampling System (MOCNESS) tows were aimed at specific echogram types. Swarming krill appear quite different from the other major sources of zooplankton sound scattering (other euphausids, pri- marily Thysanoessa macrura; amphipods, primarily Themisto gaudichaudii; copepods; and salps): the edges of krill swarms, although irregular, are very sharp and distinct, and the volume backscattering strength of krill aggregations is much higher than that for other taxa. Although the total number of non-krill zooplankton caught in the IKMT tows exceeded that of
Fig. 7. Euphausia superba. Dependence of (a) krill weight, (b) numbers per kg, (c) target strength per individual, (d) tar- get strength per kg, and (e) kg per backscattering cross-
section, on standard length
20 25 30 35 40 45 50 55 60 Length (mm)
Length (mm)
Length (mm)
20 25 30 35 40 45 50 55 60 Length (mm)
= O C -c Z 2 m 400 x m - , U v s 0 200 m U x m n 20 25 30 35 A0 45 50 55 60
Length (mm)

Mar Ecol. Prog. Ser. 99: 29-39, 1993
krill (Loeb et al. 1992), their aggregate backscattering strength, estimated by assuming that target strength of elongated zooplankton is proportional to the cube of their length (Wiebe et al. 1990), was less than 10 % of that from krill over the survey area. Backscattering from krill and non-krill zooplankton were lumped to- gether and biomass estimates are thus biased slightly upward. Although Salpa thompsoni were the most abundant non-krill zooplankton, they were not in- cluded in the above calculation because as gelatinous tunicates they are unlike any taxa included in Wiebe et al. (1990) experiments. Because they are mostly water and lack a strong density contrast, salps are probably not efficient sound scatterers. Although the numerical density of salps was higher than that of krill in IKMT samples collected in the southern and eastern portions of the large-area surveys, the integrated backscatter- ing strength in these areas was low.
Krill within 10 m of the surface, below 250 m, and more dispersed than a threshold density of approxi- mately 0.1 krill m-3 were not detected and thus not included in the biomass estimates. Survey effort was not adjusted for the time of day so that the amount of undetected krill could have varied with diel changes in krill behavior. Ship's position was independent of time of day, however, and any diel effects should be random error added to the estimate of systematic bias caused by undetected krill. There were occasions when sur- face swarms were observed during daylight hours; and krill were sometimes entrained in the ship's cooling water intake during the day, although more frequently at night. The amount of krill in the upper 10 m, how- ever, can be a substantial, but unknown, portion of that in the entire water column, and a potentially large source of error. This region could be investigated by using side-looking and up-looking transducers. In their review, Miller & Hampton (1989) note that knll are principally found in the upper 150 m of the water column. The lack of evidence to the contrary, however, does not preclude substantial numbers of krill below 250 m depth. Lower frequency echo sounders, acoustic transducers mounted on remote vehicles, and/or deeper fishing nets could be used to detect krill deeper than 250 m. The maximum density of undetected dis- persed krill, assuming a density of 0.1 krill m-3 throughout the upper 250 m and an average individual weight of 0.5 g, is less than 10 % of the average denslty of the 4 surveys. It is very unlikely that undetected krill would be present throughout the water column at just below the threshold density, and thus errors due to non-detection of dispersed krill are considered negligible.
Foote (1983) demonstrated that i.t was reasonable to assume that volume backscattering strength from fish schools was the result of incoherent addition of echoes
from individual fish within the sample volume. The lin- ear relationship between backscattering strength and density breaks down, however, at very high animal densities due to the effects of shadowing and multiple scattering (MacLennan & Simmonds 1992). Although peak sv values indicated krill densities on the order of 103 ind. m-3, shadowing may have occurred, particu- lary with thick swarms and layers. Evidence of multi- ple scattering was observed occasionally in association with very dense swarms. This ringing, observed as diffuse echoes below the more solid return from the swarm, was included in the integration with the expec- tation that multiple scattering helps offset the effect of shadowing (Stanton 1983).
Calibration inaccuracies can also contribute to the error in integration survey results. Foote & MacLennan (1984) stated that precision calibration to within 0.5 dB is possible by using standard calibration spheres. This translates to a 1 dB error in estimating mean target strength. Robinson (1984) noted that the acoustic absorption coefficient at 120 kHz is not known better than f 0.5 dB km-'. This implies that, at a range of 50 m, calibration accuracy can be no better than k 0.5 dB due to this parameter alone. Our calibration exper- iments using various pulse lengths and sphere materi- als indicated system gain variations of as much as 1.2 and 1.5 dB, respectively (Demer & Hewitt in press).
Application of Jolly & Hampton's (1990) formula for estimating variance is valid only if the parallel survey transects are randomly spaced. Because the intent was to derive distribution maps as well as estimate abun- dance, transects were regularly spaced and Jolly & Hampton's expression for variance was used as an ap- proximation. As such it is an underestimate of the true survey sampling variance.
The range of estimates of krill abundance in the Elephant Island area reported here is within the range of previously reported values. Macaulay et al. (1984) estimated that 2.1 million t of krill were aggregated in a large swarm located over the shelf break north of Elephant Island. Acoustic surveys conducted by Macaulay in the austral summers of 1981, 1984, 1987, 1988 and 1989, when normalized to a survey area of 5055 n mile2 centered on Elephant Island, resulted in biomass estimates of 0.8, 0.3, 0.7, 0.5 and 0.9 million t respectively (Macaulay unpubl.). Macaulay (pers. comm.) assumed the target strength of 40 to 45 mm krill to be -35.93 dB kg-'; incorporating the more re- cent definition of krill target strength (-37.70 dB kg-', Table 2) results in adjusted biomass estimates of 1.2, 0.4, 1.0, 0.7 and 1.4 million t. Klindt (1986) reported biomass estimates from combined acoustic and net surveys conducted in the Elephant Island area during 1983, 1984 and 1985 of 0.05, 0.4 and 0.02 million t re- spectively. Klindt used the BIOMASS (1984) definition

Hewitt & Demer: Knll abundance in the Antarct~c
Table 3. Euphausia superha. Acoustic estimates of krill biornass in the Elephant Island area
Year Month Survey area Biomass Adj. biomass Source (n mile2) (X lo3 t) (X lo3 t)
p- P
1981 March 5 055 790 a 1187 Macaulay (unpubl ) 1983 October/November 10507 5 2 480 Klindt (1986) 1984 march 5 055 260 390 Macaulay (unpubl.) 1984 November/December 10 106 380 2 200 Klindt (1986) 1985 March/April 9 283 16 8 1 Klindt (1986) 1987 January 5 055 660 992 Macaulay (unpubl.) 1988 January 5 055 480 721 Macaulay (unpubl.) 1989 February 5 055 950 a 1428 Macaulay (unpubl.) 1990 Early January 11 925 4 65 699 Arnos et al. (1990)
Late January 10 575 1132 1702 Amos et al. (1990) Early February 11 925 2 133 3 206 Arnos et al. (1990) Late February 11 925 2475 3 720 Amos et al. (1990)
1991 Late January 12 675 689 1036 Macaulay & Mathsen (1991) Late Feb. - early Mar. 12525 822 1236 Macaulay & Mathisen (1991)
1992 Late January 10575 2 220 2 220 This report Early March 10 575 1075 1 075 This report
aExcluding b~omass of observed superswarms
of target strength adjusted to 150 kHz and the length frequency distributions reported by Siege1 (1986a). Klindt's biomass estimates may be adjusted by a factor corresponding to the difference in target strength at 120 kHz using the modal krill lengths for each of the surveys (30, 41 and 45 mm); the corresponding factors (9.2, 5.8 and 4.9) result in adjusted biomass estimates of 0.5, 2.2 and 0.1 n~illion t. Four surveys were con- ducted by Macaulay in the Elephant Island area during January and February 1990 (Amos et al. 1990). Estimated krill biomass increased from the first survey through the fourth survey (0.5, 1.1, 2.1 and 2.4 million t) . Two surveys were conducted by Macaulay between mid-January and mid-February 1991 (Macaulay &
Mathisen 1991). Estimated krill biomass increased from 0.7 to 0.8 million t. For the 1990 and 1991 surveys, Macaulay (pers. comm.) again used -35.93 dB kg-' to scale his biomass estimates; adjusted biomass esti- mates are 0.7, 1.7, 3.2 and 3.7 million t for 1990, and 1.0 and 1.2 million t for 1991. Results from the above surveys are summarized in Table 3.
Knll abundance in the Elephant Island area de- creased over the 2 mo observational period of mid- January to mid-March 1992. Krill abundance de- creased approximately 2-fold between the 2 large-area surveys, Surveys A and D, conducted in the waters surrounding Elephant Island. Krill abundance also decreased approximately 2-fold between the 2 small- area surveys conducted to the north of Elephant Island, Surveys B and C. This was in marked contrast to the results from surveys conducted in 1990 and 1991 when krill abundance increased from mid-January to mid- March.
Over the last 3 yr, several measures of reproductive success of chinstrap penguins Pygoscelis antarctica at Seal Island varied in concert with estimates of knll bio- mass: moderately high in 1990, very low in 1991, and very high in 1992 (D. A. Croll pers. comm.). Seasonal variations in the availabhty of krill to predators may also be important. Although average abundances of krlll during the 1990 and 1992 austral summer were similar, the seasonal timing of peak abundance was quite different - late in 1990, early in 1992. Repro- ductive success of chinstrap penguins was high in 1992 relative to 1990. Good breeding success early in the 1992 season, however, may be countered by the lack of knll late in the season when local demand for prey by newly fledged chicks and adults about to molt may be at its highest (Croll in press).
Acknowledgements. This work was supported by the National Oceanic and Atmosphenc Administration as part of its Antarctic Manne L~ving Resources (AMLR) program. We thank Duncan McGehee, Jane Rosenberg, Stephanie Sexton and Rennie Holt for their assistance in collecting the acoustic data; Valerie Loeb for providing data on the size distribution of krill; and the officers and crew of the NOAA Ship 'Surveyor' for t h e ~ r help and support. Helpful comments were also received from 3 anonymous reviewers.
LITERATURE CITED
Agnew, D. J . (in press). Knll catch distribution in relation to predator colonies, 1987-1991. Selected Scientific Papers of the CCAMLR Scientific Committee 1992, Hobart
Amos, A. F., Bengtson, J. L., Holm-Hansen, O., Loeb, V. J . , Macaulay, M. C . , Wormuth, J . H. (1990). Surface water

38 Mar. Ecol. Prog. Ser. 99. 29-39, 1993
masses, primary production, krill distribution and predator foraging in the vicinity of Elephant Island during the 1989-90 austral summer. CCAMLR-WG-CEMP-90/11, Hobart
Anon. (ed.) (1990). AMLR 1989/90 field season report: objectives, accomplishments, and tentative conclusions. SWFSC Admin. Rep. W-90-11. Southwest Fishenes Science Center, La Jolla. CA, p. 1-104
Bengtson, J . L., Boveng, P., Jansen, J. K. (1991). AMLR Program: foraging areas of knll-consumng penguins and fur seals near Seal Island, Antarctica. Antarct. J . U.S. 26(5): 217-218
BIOMASS (1986). Report on post-FIBEX acoustic workshop. Frankfurt. Germany, September 1984. BIOMASS Report Series No. 40. SCAR. Cambridge, p. 1-128
Bodholt, H., Nes, H., Solli, H. (1989). A new echo-sounder sys- tem. Proc. 10A l l (3) : 123-130
Boveng, P,, Bengtson, J . L., Jansen, J. K. (1991). AMLR Program: Antarctic fur seal foraging patterns at Seal Island, South Shetland Islands, Antarctica, during austral summer 1990-91. Antarct. J. U.S. 26(5): 215-216
Brinton, E. , Loeb, V. J. , Macaulay, M. C. , Shulenberger, E (1987). Variability of Euphausia superba populations near Elephant Island and the South Shetland Islands: 1981 vs 1984. Polar Biol. 7: 345-362
Croll, D. A. (1990). Estimation of the energy and prey requirements of predators breeding on the South Shetland Islands. CCAMLR-WG-CEMP-90/30, Hobart
Croll, D. A., Jansen, J . K. , Bengtson, J. L. (1991). AMLR Program: reproductive performance of chinstrap penguins on Seal Island, South Shetland Islands, Antarctica. Antarct. J . U S. 26(5): 218-220
Croxall, J . P. (1989). Use of indices of predator status and per- formance in CCAMLR fishery management. Selected Scientific Papers of the CCAMLR Scientific Committee 1989, Hobart, p. 353-365
Croxall, J. P,, McCann, T. S., Prince, P. A., Rothery, P. (1988). Reproductive performance of seabirds and seals at South Georgia and Signy Island, South Orkney Islands 1976-1987: implications for Southern Ocean monitoring studies. In: Sahrhage, D. (ed.) Antarctic Ocean and resources variability. Springer-Verlag, Berlin, p. 262-285
Demer, D. A., Hewitt, R. P. (in press). Calibration of an acoustic echo-integration system in a deep tank, with gain comparisons over standard sphere material, water temper- ature and time. Selected Scientific Papers of the CCAMLR Scientific Committee 1992, Hobart
Devereux, R. F. (1953). Isaacs-Kidd midwater trawl. Scripps Institution of Oceanography, La JoIla, Refer. 53-3: 1-21
Everson. I. (1984). Zooplankton. In: Laws, R. M. (ed.) Antarctic ecology, Vol. 2. Academic Press, London, 491 -532
Everson, I . , Watkins, J . L., Rone, D. G , Foote, K. G. (1990). Implications of a new acoustic target strength for abun- dance estimates of Antarctic krill. Nature 345: 338-340
Fevolden, S. E., George, R. Y (1984). Size frequency pattern of Euphausia superba in the Antarctic Peninsula waters in the austral summer of 1983. J . crust. Biol. 4 (Spec. No. 1): 107-122
Foote, K . G. (1983). Linearity of fisheries acoustics, with addi- t ~ o n theorums. J . Acoust. Soc. Am. 73: 1932-1940
Foote, K. G., Everson. I., Watkins, J . L., Bone, D. G. (1990). Target strengths of Antarctic kriU (Euphausia superba) at 38 and 120 kHz. J . Acoust. Soc. Am. 87: 16-24
Foote. K. G., Knudsen, H. P., Korneliussen, R. J. . Norbe. P. E., Rsang, K. (1991). Postprocessing system for echo sounder data. J . Acoust. Soc. Am. 90(1): 37-47
Foote, K. G., MacLennan, D. N. (1984). Comparison of copper
and tungsten carbide spheres. J. Acoust. Soc. Am. 75: 612-616
Greene, C. H., Stanton, T K. , Wiebe, P. H., McClatchie, S. (1991). Acoustic estimates of Antarctic krill. Nature 349: 110
Hampton, I. (1987). Acoustic study on the abundance and dis- tribut~on of anchovy spawners and recruits in South African waters. In: Payne. A. I. L., Gulland, J . A., Brink, K. H. (eds.) The Benguela and comparable ecosystems. S. Air. J . mar. Sci. 5: 901-917
Hewitt, R. P., Demer, D. A. (1991). Krill abundance. Nature 353: 310
Johannesson, K. A., Mitson, R. B. (1983) Fisheries acoustics: a pract~cal manual for aquatic biomass estimation. FAO Tech. Pap. No. 240, Rome, p. 1-249
Jolly, G. M., Hampton, I . (1990). A stratified random transect design for acoustic surveys of fish stocks. Can. J. Fish. Aquat. Sci. 47: 1282-1291
Kalinowski, J. (1984). The biomass of krill in the eastern part of the Bransfield Strait, March, 1981. Pol. polar Res. 5: 99-105
Kalinowski, J., Godlowska, M,, Klusek, Z. (1985). Distribution and stock of krill in the Bransfield Strait and Drake Passage during December 1983 -January 1984. Pol. polar Res. 6: 151-158
Klindt, H. (1986). Acoustic estimates of the distribution and stock size of krill around Elephant Island during SIBEX I and I1 in 1983. 1984, and 1985. Arch. FischWiss. 37: 107-127
Knudsen, P. (1990). The Bergen Echo Integrator: an introduc- tion. J . Cons. int. Explor. Mer 47: 167-174
Laws, R. M. (1985). The ecology of the Southern Ocean. Am. Scient. 7 3: 26-40
Loeb, V., Davis, K., Roddy, F., Siegel, V., Kelly, D. (1992). Direct krill and zooplankton sampling. In: Rosenberg, J., Hewitt, R. (eds.) AMLR 1991/92 field season report. SWFSC Admin. Rep. U-92-17. Southwest Fisheries Science Center, La Jolla, CA, p. 51-66
Loeb, V., Siegel, V. (in press). AMLR Program: krill stock structure in the Elephant Island area, January-March 1992. Antarct. J. U.S.
Macaulay, M. C., English, T. S., Mathisen, 0. A. (1984). Acoustic characterization of Antarctic knll (Euphausia superba) from Elephant Island and Bransfield Strait. J . crust. Biol. 4 (Spec. No. 1): 16-44
Macaulay, M. C. , Math~sen, 0. A. (1991). AMLR Program: hydroacoustic observations of krill distribution and bio- mass near Elephant Island, austral summer 1991. Antarct. J . U.S. 26(5): 203-204
MacLennan, D. N., Slrnmonds, E. J . (1992). Fishenes acoustics. Chapman and Hall, London
Makaorov, R. R.. Maslennikov, V. V., Solyankin, E. V., Spindonov, V. A., Yakolev, V. N. (1988). Variability in pop- ulation density of Antarctic knll in the western Scotia Sea in relation to hydrological conditions. In: Sahrhage. D. (ed.) Antarctic Ocean and resources variability. Springer- Verlag, Berlin, p. 231-236
Mathisen, 0 . E., Macaulay, M. C. (1983). The morphological features of a super-swarm of krill, Euphausia superba. Mem. Nat. Inst. Polar Res. Spec. Issue No. 27: 153-164
Mffler, D. G. M., Hampton, 1. (1989). Biology and ecology of the Antarctic krill (Euphausia superba): a review. BIOMASS Sci. Ser. No. 9: 1-166
Nast. F. (1986). Changes in knll abundance and in other zoo- plankton relative to the Weddell-Scotia Confluence around Elephant Island in November 1983, November 1984 and March 1985. Arch. FischWiss. 37: 73-94

Hewitt & Demer: Krill abundance in the Antarctic 39
Nast, F., Kock, K.-H., Sahrhage, D., Stein, M. , Tiedtke, J E. (1988). Hydrography, krill and flsh and their possible rela- tlonships around Elephant Island. In- Sahrhage, D. (ed.) Antarctic Ocean and resources variability. Springer- Verlag, Berlin, p. 183-198
Priddle, J., Croxall, J. P,, Everson, I., Heywood, R. B., Murphy. E. J., Prince, P. A., Sear, C. B. (1988). Large-scale fluctua- tions in distribution and abundance of krill - a discussion of possible causes. In: Sahrhage. D. (ed.) Antarctic Ocean and resources variability. Springer-Verlag, Berlin, p. 169-182
Quetin, L B . , Ross, R. M. (1984). School composition of the Antarctic krill Euphausja superba in the waters of the Antarct~c Peninsula in the austral summer of 1982. J. crust. Biol. 4 (Spec. No. 1): 96-106
Robinson, B. J . (1984). Calibration of equipment. Rapp. P.-v. Reun. Cons. int. Explor. Mer 184: 62-67
Rosenberg, J., Hewitt, R. (eds.) (1991). AMLR 1990/91 field season report: objectives, accomplishments, and tentative conclusions. SWFSC Admin. Rep. U-91-18. Southwest Fisheries Science Center, La Jolla, CA, p. 1- 97
Rosenberg, J., Hewitt, R. (eds.) (1992). AMLR 1991/92 field season report: objectives, accomplishments, and tentative conclusions. SWFSC Admn. Rep. LJ-92-17. Southwest F~sheries Science Center, La Jolla, CA, p. 1-116
Sahrhage, D. (1988). Some indications for environmental and krill resources variability m the Southern Ocean. In: Sahrhage, D. (ed.) Antarctic Ocean and resources van- abllity. Springer-Verlag, Berlin, p. 33-40
SC-CAMLR-IV. (1985). Report of the fourth meeting of the Scientific Committee for the Conservation of Antarctic Marine Living Resources. CCAMLR, Hobart
SC-CAMLR-V. (1986). Report of the fifth meeting of the Scientific Committee for the Conservation of Antarctic Marine Living Resources. CCAMLR, Hobart
SC-CAMLR-X. (1991). Report of the tenth meeting of the Scientific Committee for the Conservation of Antarctic
Marine Living Resources. CCAMLR, Hobart Sherman, K., Ryan, A. F. (1988). Antarctic marine llving
resources. Oceanus 31 (2): 59-63 Slegel, V. (1986a). Structure and conlposition of the Antarctic
krill stock in the Bransfield Strait (Antarctic Peninsula) during the Second International BIOMASS Experiment (SIBEX). Arch. FischWiss. 37: 51-72
Siegel, V (1986b). Untersuchungen zur Biologie des antark- tischen Krill, Euphausia superba, im Bereich der Bransfield StraRe und angrenzender Gebiete. Mitt. Inst. Seefisch. Hamburg 38. 1-244
S~ege l , V. (1988). A concept of seasonal variation of krill (Euphausia superba) d~str ibut~on and abundance west of the Antarctic Peninsula. In: Sahrhage, D. (ed.) Antarctic Ocean and resources variability. Springer-Verlag, Berlln, p . 219-230
Simmonds, E. J., Williamson, N. J., Gerlotto. F.. Aglen, A. (1991). Survey design and analysis procedures: a compre- hensive review of good practice. Comm. Meet. int. Coun. Explor. Sea 1991/B: 54
Stanton, T. K. (1983). Multiple scattering with applications to fish-echo processing. J . Acoust. Soc. Am. 73: 1164-1169
Stanton, T. K. (1989). Simple approximate forn~ulas for backscattering of sound by spherical and elongated objects. J. Acoust. Soc. Am. 86: 1499-1510
Stein, M. (1986). Vanability of water masses and currents off the Antarctic Peninsula during SIBEX. Arch. FischWiss. 37: 25-50
Wiebe, P. H., Greene. C. H., Stanton, T K., Burczynski, J . (1990). Sound scattering by live zooplankton and micro- nekton: empirical studies with a dual-beam acoustical system. J. Acoust. Soc. Am. 88: 2346-2360
Witek, Z., Kalinowski, J., Grelowslu, A. (1988). Formation of Antarctic krill concentrations in relation to hydrodynamic processes and social behavior. In: Sahrhage, D. (ed.) Antarctic Ocean and resources variability. Springer- Verlag, Berlin, p. 237-244
This article was submitted to the editor Manuscript first received: February 9, 1993 Revised version accepted: May 28, 1993