Growth and behavior of larval krill (Euphausia superba) under the ice in late winter 2001 west of...
16
Deep-Sea Research II 51 (2004) 2169–2184 Growth and behavior of larval krill (Euphausia superba) under the ice in late winter 2001 west of the Antarctic Peninsula Robin M. Ross a, , Langdon B. Quetin a , Timothy Newberger b , Stephanie A. Oakes a a Marine Science Institute, University of California at Santa Barbara, Santa Barbara, CA 93106, USA b Lamont-Doherty Earth Observatory, Columbia University, Palisades, NY 10964, USA Accepted 12 July 2004 Abstract In situ growth rates are one measure of the physiological condition of larval Antarctic krill in winter. During the southern ocean global ecosystem dynamics (SO GLOBEC) research cruise in July/August 2001 aboard the ARSV Laurence M. Gould west of Adelaide Island and Marguerite Bay, larval krill were observed in the under-ice habitat. Ten instantaneous growth rate experiments were conducted with larvae collected from the under-ice habitat on the outer shelf, mid-shelf, and just south of Adelaide Island in the mouth of Marguerite Bay. For all experiments, average growth increments for larval krill were about 1.6% per intermolt period, with a median intermolt period of 30.6 d. Larvae were observed feeding on the ice, even though no color was visible in the ice. Pigment (chlorophyll a equivalents) content of larvae from three of the sites was measured as an indicator of ingestion of sea-ice microalgae. Pigment values were above those found in starved controls, but only about 20% of maximum possible values. Although feeding, the data suggested that the larval krill were unable to ingest enough food to maintain growth. The results from this first SO GLOBEC winter process cruise were compared to growth rates of larval krill during previous winter cruises that covered all months from late May through September, except for the month of August. r 2004 Elsevier Ltd. All rights reserved. 1. Introduction The Southern Ocean Global Ecosystem Dy- namics (SO GLOBEC) program has multiple goals, but focuses on understanding the biologi- cal–physical interactions impacting the population dynamics of a target species, Antarctic krill (Euphausia superba), and its predators. Recruit- ment success in Antarctic krill is highly variable, as has been documented in many regions of the Southern Ocean (Siegel and Loeb, 1995; Siegel et al., 1998, 2002; Watkins, 1999; Siegel, 2000; Quetin and Ross, 2003). These studies include reports on decade-long time series in two regions west of the Antarctic Peninsula, one at the tip of the peninsula (Siegel and Loeb, 1995) and one between Anvers ARTICLE IN PRESS www.elsevier.com/locate/dsr2 0967-0645/$ - see front matter r 2004 Elsevier Ltd. All rights reserved. doi:10.1016/j.dsr2.2004.07.001 Corresponding author.
-
Upload
independent -
Category
Documents
-
view
2 -
download
0
Transcript of Growth and behavior of larval krill (Euphausia superba) under the ice in late winter 2001 west of...

ARTICLE IN PRESS
0967-0645/$ - se
doi:10.1016/j.ds
�Correspondi
Deep-Sea Research II 51 (2004) 2169–2184
www.elsevier.com/locate/dsr2
Growth and behavior of larval krill (Euphausia superba) underthe ice in late winter 2001 west of the Antarctic Peninsula
Robin M. Rossa,�, Langdon B. Quetina, Timothy Newbergerb,Stephanie A. Oakesa
aMarine Science Institute, University of California at Santa Barbara, Santa Barbara, CA 93106, USAbLamont-Doherty Earth Observatory, Columbia University, Palisades, NY 10964, USA
Accepted 12 July 2004
Abstract
In situ growth rates are one measure of the physiological condition of larval Antarctic krill in winter. During the
southern ocean global ecosystem dynamics (SO GLOBEC) research cruise in July/August 2001 aboard the ARSV
Laurence M. Gould west of Adelaide Island and Marguerite Bay, larval krill were observed in the under-ice habitat. Ten
instantaneous growth rate experiments were conducted with larvae collected from the under-ice habitat on the outer
shelf, mid-shelf, and just south of Adelaide Island in the mouth of Marguerite Bay. For all experiments, average growth
increments for larval krill were about �1.6% per intermolt period, with a median intermolt period of 30.6 d. Larvae
were observed feeding on the ice, even though no color was visible in the ice. Pigment (chlorophyll a equivalents)
content of larvae from three of the sites was measured as an indicator of ingestion of sea-ice microalgae. Pigment values
were above those found in starved controls, but only about 20% of maximum possible values. Although feeding, the
data suggested that the larval krill were unable to ingest enough food to maintain growth. The results from this first SO
GLOBEC winter process cruise were compared to growth rates of larval krill during previous winter cruises that
covered all months from late May through September, except for the month of August.
r 2004 Elsevier Ltd. All rights reserved.
1. Introduction
The Southern Ocean Global Ecosystem Dy-namics (SO GLOBEC) program has multiplegoals, but focuses on understanding the biologi-cal–physical interactions impacting the populationdynamics of a target species, Antarctic krill
e front matter r 2004 Elsevier Ltd. All rights reserve
r2.2004.07.001
ng author.
(Euphausia superba), and its predators. Recruit-ment success in Antarctic krill is highly variable, ashas been documented in many regions of theSouthern Ocean (Siegel and Loeb, 1995; Siegel etal., 1998, 2002; Watkins, 1999; Siegel, 2000; Quetinand Ross, 2003). These studies include reports ondecade-long time series in two regions west of theAntarctic Peninsula, one at the tip of the peninsula(Siegel and Loeb, 1995) and one between Anvers
d.

ARTICLE IN PRESS
R.M. Ross et al. / Deep-Sea Research II 51 (2004) 2169–21842170
and Adelaide Islands, the Palmer Long-TermEcological Research study region (Quetin andRoss, 2003). Variation in recruitment leads tosignificant interannual differences in the popula-tion structure, and potentially abundance. Thestrong correlation between recruitment and var-ious aspects of seasonal sea-ice dynamics has beendocumented well (Siegel and Loeb, 1995; Quetinand Ross, 2003). Also, differences have beendocumented in the physiological condition(growth, lipid reserves, condition factor) of larvalkrill in winter from under the ice and in open water(Ross and Quetin, 1991). The previous resultssupport the concept that sea ice and the associatedmicrobial community provide food resourcesduring a period in larval development when foodresources in the water column are low. And as aconsequence, variation in the availability of foodresources in sea ice may lead to variability in larvalsurvival and consequent recruitment. Thus under-standing growth processes in larval krill in winteris a critical aspect of understanding the nature ofrecruitment and population regulation in Antarc-tic krill.
A hypothesis widely accepted in discussionsabout recruitment in larval marine fish is that thesurvival of a cohort or year class is directly relatedto growth rates during the pre-recruit period. Theunderlying concept is that any food limitationsimultaneously affects both growth rates andsurvivorship. The effects of temperature onproduction of prey and developmental rates ofthe larvae also often play a role (Ottersen andLoeng, 2000; Pepin, 1991).
In the case of Antarctic krill, sea ice, and themicrobial community living on and within the seaice, is perceived as the winter grazing ground forlarval krill when food in the water column is low(Smetacek et al., 1990; Quetin et al., 1996). A lackof sea ice and/or the quantity, quality or avail-ability of the microbial community within the icemay lead to food limitation in larval krill. Areasonable assumption is that slower-growingindividuals are more likely to die before recruit-ment into the adult population than the faster-growing individuals (Pepin, 1989). Pepin’s model(1989) predicts that the death of slow-growingindividuals is one mechanism of increasing the
mean growth rate over time. If this holds true, thenvariations in growth rates within a year class mightbe of value in predicting survivorship. Thus,understanding seasonal patterns in growth inAntarctic krill could have significant implicationsfor predicting recruitment patterns.
A recent compilation of fall and winter growthdata for larval Antarctic krill in waters west of theAntarctic Peninsula documented variability in thepattern of seasonal growth that exceeded inter-annual variability (Quetin et al., 2003). Thismultiple-cruise study reported results from threeJune cruises and two September cruises, withresults showing far great variability month tomonth than year to year within the same month.Other cruises were in fall (April/early May, lateMay), and mid-winter (late June/early July, July).The growth data were from instantaneous growthrate experiments (IGRs), and showed that thegrowth increment decreased throughout the fall tolow and sometimes negative values in mid-Junethrough early July. By September, growth incre-ments were positive and at their maximum. Mid-winter growth rates were similar to those of larvaemaintained on low-food concentrations (Elias,1990), whereas late winter rates were comparableto those of larvae fed unlimited food supplies(Ikeda, 1984). For these data, a strong correlationexisted between daylength at the time of collectionand the average growth increment of the larvalkrill in the experiment. However, no growth datain the late July through August time period wereavailable. Whether low growth increments wouldcontinue through the remainder of the winter andincrease as a step function in the late winter andearly spring or if growth increments would slowlyincrease through late July and August wasunknown. There was also the question of whetherthe daylength predictor would hold during this latewinter period, as there are several alternativeexplanations for what the daylength parameterrepresented (Quetin et al., 2003).
In light of the documented winter-seasonvariability in growth rates (Quetin et al., 2003),we need to understand the full scope of theseasonal patterns in growth in addition to theweaker interannual variation if we are to under-stand the role of growth in larval krill survivorship

ARTICLE IN PRESS
R.M. Ross et al. / Deep-Sea Research II 51 (2004) 2169–2184 2171
and ultimately recruitment. In this study, wereport on SCUBA diver observations of larvalkrill in their under-ice habitat, the results of aseries of IGR experiments, and pigment content asan index of ingestion of sea-ice microalgae inlarval krill from the same habitat. Some of theobservations and data were obtained during twoice camps or multi-day observations of the sameice floes, enabling us to compare larval krillcollections on small time and space scales. Thisresearch cruise provided the opportunity to obtaininformation on the length and stage composition,and physiological condition of larval krill during atime period in winter for which no data exist westof the Antarctic Peninsula. With this informationin hand, we can now begin to explore the full rangeof seasonal and interannual variability in growthand behavior of larval krill from the pack-icehabitat in winter.
2. Material and methods
Study site: The first winter process cruise for SOGLOBEC took place on board the ARSVLaurence M. Gould from 21 July to 1 September2001. The study region was on the continentalshelf, west of the Antarctic Peninsula, from themid-point of Adelaide Island to just south ofMarguerite Bay (Fig. 1). The study area wasapproximately 160 km2, with a latitudinal range of1.651. Collection of larval krill for experiments andanalysis took place between 28 July and 22 August(Table 1).
Collections and observations: Larval krill werecollected from under the ice by SCUBA diverswith fine-meshed (�680-mm mesh) aquarium nets.Larvae from ten dives were used in instantaneousgrowth experiments, larvae from six dives wereextracted for pigment content, and larvae from sixdives were processed for carbon and/or dry mass(Table 1). Ice Station Robert (Dives 6–11)comprised six dives on the same ice floe in themouth of Marguerite Bay from 5 to 9 August; IceStation Billy (Dives 13–18) comprised six divesabout 100 km to the northwest of Ice StationRobert from 16 to 18 August. In three cases (Dives12, 13 and 18), larvae were collected during the
same dive for both growth and pigment data(Table 1).
Four divers with pairs alternating dives wereused throughout the cruise. Observations duringeach dive included notes on whether krill werepresent or absent, whether krill were displayingfeeding behavior, and their location, e.g. in thewater column or associated with a particularsurface of ice. Divers distinguished among threeice orientations: floors (upward facing), walls (sidefacing) or ceilings (downward facing). Maximumdepth of over rafting, color of the ice and hardnesswere also noted. Maximum depth of the rafted icewas determined with a diver’s depth gauge. Colorof the ice was noted as white (no color), green,yellow or brown, and recorded as evidence of theoverall presence or absence of ice algae to thediver’s eye. Hardness of the ice was noted as hardor soft. Hard ice could not be penetrated by adiver’s finger and had a polished feel. Soft icecould be penetrated to varying depths.
IGR experiments: Immediately after collection,the contents of the aquarium net were gentlyplaced into large insulated buckets of seawater atin situ temperatures and taken back to the ship.Larvae from each collection were randomlyselected for subsequent growth experiments. TheIGR method was first briefly described as amethod to measure field growth rates for krill inshort-term (4 d) experiments (adults, Quetin andRoss, 1991; larvae, Ross and Quetin, 1991). Nicolet al. (1992) confirmed the underlying premise thatmaintenance conditions do not affect the lengthincrement at ecdysis for up to 7 d after collectionwhen in situ water temperatures are 2 1C or less.Further details of the experimental protocol weredescribed in Ross et al. (2000) for late furcilia andjuvenile krill �10–12-month old, and Quetin et al.(2003) for larval krill. Between 83 and 100randomly selected larvae were individually placedin 1.2-mm filtered seawater in separate 500-mlcontainers and held at ambient seawater tempera-tures. At 12-h intervals over the following fourdays all containers were inspected for molts, andthe temperature of the water measured. Averagetemperature in an experiment ranged from �1.3 to�1.6 1C. Upon molting, the larva was measuredfor total length, and the larva and its molt were

ARTICLE IN PRESS
4
5
6 78
91011
13
1415
16
1718
19
12
10 NM
Adelaide Island
Marguerite Bay
71 70 69
71 70 69
67
68 68
67
3
Fig. 1. Southern Ocean GLOBEC study region for ARSV Laurence M. Gould 01–06, 29 July to 1 September, and dive number near the
symbol for each dive location to show the location of each type of sampling (Table 1). Dives 6–11 were at Ice Station Robert, Dives
13–18 at Ice Station Billy. Cruise track lines between dives at each ice station, e.g. diving from the same floe, are thicker than track lines
between single dives on a floe. Dive 3 is off the map, 82 km north–northeast of Dive 16.
R.M. Ross et al. / Deep-Sea Research II 51 (2004) 2169–21842172
preserved together in 10% buffered formalin.At the end of the experiment, total length andstage of all non-molters were determined prior topreservation.
The total length from the tip of the rostrum tothe end of the uropods of each larva in theexperiment was measured under a dissectingmicroscope (Standard Length 1; Mauchline,1980), and the developmental stage was deter-mined according to Fraser (1936). In addition,telson lengths of both molt and larva weremeasured, and the stage of the molt was deter-mined. The intermolt period (IMP) was estimated
as the inverse of the molting frequency per day inthe experiment. The growth increment was basedon the change in telson length and expressed aspercent growth per IMP (% IMP�1). The numberof growth increments measured ranged from 11 to18 for most of the experiments, with 3 and 7molters each for the other two experiments. Themean, standard deviation, and standard error ofthe growth increment of all molters were calcu-lated for each experiment. Telson lengths weremeasured from the side, from mid-bump at theinsertion point to the abdomen to the tip, to keepthe entire telson length in focus under a dissecting

ARTICLE IN PRESS
Table 1
Location from event log and date of collection of larvae for
growth experiments (IGR, with number), carbon (C) and dry
mass (dwt) determination, and pigment content determination
(Pig)
Ice
station
Dive Date Latitude
(1S)
Longitude
(1W)
IGR
Expt.
no.
C/dwt Pig
— 3 28 Jul 66122.50 70144.70 1 — —
— 4 29 Jul 67113.70 69125.50 2 X —
— 5 2 Aug 67135.70 69124.90 3 X —
Robert 6 5 Aug 6814.60 70121.40 4 X —
Robert 7 6 Aug 6813.80 70110.50 — — X
Robert 8 6 Aug 6813.880 70111.60 — — X
Robert 9 8 Aug 67157.20 70113.70 5 X —
Robert 10 8 Aug 67158.50 70113.20 — — —
Robert 11 9 Aug 6812.00 7016.80 — — —
— 12 11 Aug 6816.60 69141.30 6 X X
Billy 13 16 Aug 6718.200 70114.50 7 — X
Billy 14 16 Aug 6717.500 70115.00 — — X
Billy 15 16 Aug 6717.50 70116.20 — — —
Billy 16 17 Aug 6716.80 70134.30 8 — —
Billy 17 18 Aug 67112.70 70132.10 — — —
Billy 18 18 Aug 67112.50 70131.50 9 — X
— 19 22 Aug 67121.40 7110.00 10 X —
R.M. Ross et al. / Deep-Sea Research II 51 (2004) 2169–2184 2173
microscope at a magnification so that the telsonfilled the field of view. The lengths were recordedto the nearest division on the eyepiece micrometer,a precision of 70.012 mm at the magnificationsused. This yielded a precision of 70.45–0.66%IMP�1 for the growth increments in these experi-ments.
Other investigators have measured the growthincrement in IGR experiments from changes in theaverage uropod length (Nicol et al., 1992; Daly,2004). Although there are advantages to bothmeasurement types, the results of a cross-calibra-tion study (Nicol’s uropod and Quetin and Ross’stelson measurements) showed that growth incre-ments of a group of krill followed over time arenot significantly different with the two measure-ments (Hollander, 2001, pers. comm.). Both therelationships between uropod and total length andtelson and total length are significant (generallywith r2 of40.95) but they are not identical. Thus,to compare directly growth increments in %IMP�1 derived from telson and uropod measure-ments, both should be used to estimate a change in
the same size measure, such as total length or drymass or carbon.
Two indices of development were calculated. Wecalculated the percentage of furcilia stage larvaethat advanced to the next larval stage at ecdysis. Adevelopmental stage index (DSI) also character-ized the stage composition of each experimentalpopulation. Each furcilia stage was assigned anumber ‘i’, 4 for furcilia stage 4, 5 for furcilia stage5, 6 for furcilia stage 6, and 7 for juveniles, and theDSI is calculated as follows:
DSI ¼X
i
number larvae in stage i � i
total number of larvae:
Length and mass relationships: The relationshipsbetween telson length, total length, and wet anddry mass were determined from a group of larvaefrom Dive 19 maintained in 2-l jars at ambienttemperatures for 3.5 d until arrival at PalmerStation. On station, total and telson length of alarva were measured, and then the larva wasweighed on a 5-place Mettler balance. Dry masswas determined after 24 h in a 60 1C oven. Therange in total length was 6.5–15.0 mm, in wet massfrom 2.0 to 21.4 mg, and in dry mass from 0.4 to5.1 mg. On five dives (Dives 4–6, 9 and 12), larvaecollected from under the ice were processed forlater determination of dry mass and organiccarbon. The stage and total length of the larvawere determined, then the individual larva wasplaced in a pre-weighed aluminum sleeve that hadbeen fired at 450 1C for 2 h. The sleeve was thenplaced in a hole in an aluminum plate (previouslyfired at 450 1C for 24 h) in a drying oven. The massof the larvae was determined on a Cahn Electro-balance, and the elemental analysis was conductedwith an elemental analyzer at the Marine ScienceInstitute’s Analytical Laboratory, University ofCalifornia at Santa Barbara.
Pigment content of larvae: The gut fluorescenceor pigment content method is specific for the algalcomponent of the diet. The measurement ofchlorophyll a (chl a) and phaeopigments in cope-pod guts has long been used as an index ofphytoplankton ingestion (Mackas and Bohrer,1976; Dagg, 1993). We used the pigment contentof freshly collected larval krill as an index of their

ARTICLE IN PRESS
R.M. Ross et al. / Deep-Sea Research II 51 (2004) 2169–21842174
recent feeding history on sea-ice microalgae. Lessthan a minute after the diver surfaced with larvaefor pigment content analysis, groups of larvaewere placed in glass vials containing 8 ml of 90%acetone. Five vials of about 15 larvae each wereprepared for each collection. Vials were then takenfrom the ice floe and placed in a freezer for 24 h forextraction of the plant pigment from the larvae.The chl a and phaeopigment (phe) content (mg) inthe extract were determined according to themethod described in Smith et al. (1981) with aTurner Designs digital fluorometer calibrated atthe beginning of the cruise. After extraction, thetelson lengths of all larvae in a vial were measured.The relationship between telson length and wetmass determined with larvae collected on thecruise was used to estimate the wet mass of eachindividual. Individual wet masses were summedfor the total wet mass of larvae in each vial. Thesum of the pigments (chl a and phe) in mg chl a
equivalents (Dagg, 1993) was divided by the totalwet mass of the larvae for pigment content in mggwwt�1.
To determine the pigment content of starvedlarvae, larvae from nine dive collections were heldin 1.2 mm filtered seawater for 2–14 d. Two sets offive vials of five larvae each were prepared asdescribed above, one at the end of the starvationperiod and the second after a further 12 h ofstarvation. The pigment content was determinedas described above.
3. Results
Diving observations: Several observations madeby divers were consistent throughout the cruise oneach dive. The pack ice rafted to maximum depthsof 5–8 m. Over-rafted ice was consistently char-acterized as white and hard. Color was onlyobserved in the ice at one location (Dive 19) andwas recorded as light yellow. No adult krill wereseen. On every dive except one, most larval krillwere found feeding on floors of the over-rafted ice.On Dive 3 the krill were in aggregations drifting inthe water column.
Size and developmental stage: Length frequencydistributions (LFD) of the larvae were similar
across the study area (Fig. 2), with mean totallengths ranging from 8.77 to 10.23 mm (Table 2,Fig. 3A). However, there were inter-collectiondifferences in the relative dominance of small(7–10 mm) and large (12–15 mm) larvae. Thecollections grouped into LFDs characterized byeither (1) a dominance (X70%) of small larvaeand a lack of large larvae (Dives 3–5, 9, and 16), or(2) the presence (42%) of large larvae and a lowerpercentage (62% of small larvae) (Dives 6, 12, 13,18, and 19). The remainder of the larvae were10–12 mm in length. Groups of similar LFDs didnot necessarily come from the same geographicallocation or ice floe. Significant variation in larvalsize existed on the small temporal and spatialscales present in the ten collections (ANOVA,F=14.66, p50.001, n=974). This result held ateven smaller scales. For example, at Ice StationBilly, the size of larval krill collected from the sameice floe on three dives 1-d apart yielded signifi-cantly different size distributions (ANOVA,F=24.4, p|0.001) (Fig. 3A).
Larval stage distribution paralleled that of theLFD, as larger larvae tended to be more advanced.Larvae were predominantly furcilia stage 6 andjuveniles, with a small percent (0–6%) of furciliastages 4 and 5. The DSI ranged from 6.0 to 6.5(Table 2, Fig. 3B). Differences in the DSI were dueto changes in the relative proportions of furciliastage 6 and juvenile. The larval stage frequencyclustered in two groups: collections dominated byfurcilia stage 6 (average 77% furcilia 6, 19%juvenile), and collections with nearly equal pro-portions (52% furcilia 6, 46% juvenile) (Fig. 4). Aswith total length, collections from dives on thesame floe at Ice Station Billy showed stagedevelopment indices at almost the extremes ofthe range of all collections, 6.5 versus 6.1 (Table 2).In summary, significant variation in length andstage of larvae were found on small space (same icefloe) and time (1 d) scales. This result reinforces thefindings of previous researchers that single samplesof krill from one area do not provide reliableestimates of either population characteristics(Watkins et al., 1990) or genetic populationparameters (Jarman et al., 2002) of krill in thatarea. Thus, single samples of larval krill taken atdifferent points in time cannot be used to track a

ARTICLE IN PRESS
Dive 3
5
15
25
5 7 9 11 13 15
Dive 4
5
15
25
5 7 9 11 13 15
Dive 12
5
15
25
5 7 9 11 13 15
25 Dive 13Billy
5
15
5 7 9 11 13 15
Dive 19
5
15
25
5 7 9 11 13 15
Dive 9Robert
5
15
5 7 9 11 13 15
25
5 7 9 11 13 15
Dive 6Robert
25
15
5
Dive 16Billy
5
15
25
5 7 9 11 13 15
25 Dive 18Billy
5 7 9 11 13 15
15
5
Total Length (mm)
Dive 5
5
15
25
5 7 9 11 13 15
Fre
quen
cy
Fig. 2. E. superba larvae. Length frequency distributions in IGR experiments in 0.5 mm increments. Length frequency distributions
labeled with dive number and Ice Station name if appropriate. Column color indicates proportion of furcilia (black) and juvenile
(white) in a length class.
R.M. Ross et al. / Deep-Sea Research II 51 (2004) 2169–2184 2175
population of larvae over time, and cannot be usedto estimate growth rates of larvae in the region.
IGR experiments: In all experiments, averagepercent growth per IMP was negative (Fig. 5A).The highest average growth increment was foundat the farthest north station, and the lowest growthincrement at Ice Station Billy. However, there wasno significant difference in growth incrementsdetermined in the separate experiments (ANOVA,F=0.91, p=0.52, n=111). The mean growth
increment in this region in winter 2001 was�1.64% IMP�1 (SD=1.73). Growth incrementsof the 111 individual molters ranged from +4.3%to �6.1% IMP�1, with the majority (78%)showing negative growth. Zero growth was ob-served in 9% of the individuals, and positivegrowth in 13%. The percentage of individualsshowing positive growth varied among experi-ments, ranging from 0 in several experiments to38.5% in the experiment with larvae from the site

ARTICLE IN PRESS
Table 2
Total length (TL) with standard deviation (SD), developmental
stage index (DSI), percent of furcilia stage larvae advancing to
the next stage and percent of molters showing positive growth
Ice
station
IGR
Expt no.
TL
(mm)
(SD)
DSI % Adv
stage
%
Positive
growth
— 1 9.22 6.01 33.3 38.5
— — (1.42) — — —
— 2 8.82 6.11 0 16.7
— — (1.03) — — —
— 3 8.93 6.17 27.3 7.7
— — (1.11) — — —
Robert 4 9.69 6.38 25 16.7
— — (1.36) — — —
Robert 5 9.26 6.25 14.3 0
— — (1.14) — — —
— 6 9.92 6.48 0 8.3
— — (1.01) — — —
Billy 7 10.23 6.48 50.0 0
— — (1.52) — — —
Billy 8 8.77 6.11 0 9.1
— — (1.37) — — —
Billy 9 9.70 6.36 0 0
— — (1.61) — — —
— 10 9.75 6.44 0 15.4
— — (1.35) — — —
8
9
10
11
66.3 67.3 67.8 68.3
66.3 67.3 67.8 68.3
Latitude (˚S)
Tota
l len
gth
(mm
)
66.8
Dev
elop
men
tal S
tage
Inde
x 6.6
6.4
6.2
6.0
66.8
(A)
(B)
Fig. 3. E. superba larvae from the under-ice habitat. (A) Mean
total length and standard error. (B) Developmental stage index.
Plotted against the latitude of collection: single collections from
floes (open circles), Ice Stations Robert (closed diamonds) and
Billy (closed circles).
R.M. Ross et al. / Deep-Sea Research II 51 (2004) 2169–21842176
farthest north (Dive 3) (Fig. 1, Table 2). IMPswere generally 22–30 d (Fig. 5B), with a medianIMP of 30.6 d.
The relationships derived between telson length(TelL) and different size parameters (total lengthin mm (TL), wet mass in mg (wwt), dry mass in mg(dwt), and carbon in mg (C)) (Fig. 6) allowed us toestimate growth rates in terms of both length andmass. To estimate growth rates as dry mass, pre-and post-molt telson lengths were used to estimatedry mass of the larva pre- and post-molt. Forestimates of growth rates as carbon, pre- and post-molt telson lengths were used to estimate totallength, and total length used to estimate carboncontent of the larva. The pre- and post-moltestimates were subtracted to estimate the absolutedry mass and carbon change during the IMP foreach experiment (Fig. 7A and B). The patternswere similar to those found for the linear growthincrement in % IMP�1, with the highest averagegrowth rate at the ice floe farthest north(�0.041 mg dwt IMP�1 and �19.43 mg C IMP�1),
and the lowest growth rate (�0.155 mg dwt IMP�1
and �76.97 mg C IMP�1) found at Ice StationBilly west of Adelaide Island. The medianaverage growth rate was �0.075 mg dwt IMP�1
and –35.93 mg C IMP�1. Minor differences inpatterns were due to differences in the relation-ships between telson and total length (linear) andlength and dry mass and carbon (power function),and the varying size of the experimental larvae.
The change per IMP was divided by the medianIMP to calculate growth in mg dwt d�1 and mgC d�1 (Table 3). The measured total length, thegrowth increment (% IMP�1) and median IMPwere used to calculate growth rates in mm d�1.Average growth rates for all three measures werecalculated for each experiment (Table 3). Drymass growth rates ranged from �0.0006 to�0.0051 mg dwt d�1, carbon growth rates rangedfrom �0.295 to �2.515mg C d�1, and linear growthrates ranged from �0.0021 to �0.0065 mm d�1
(Table 3).The percent of furcilia stage 4, 5 or 6 advancing
stage upon molting in an experiment also varied

ARTICLE IN PRESS
0
20
40
60
40 50 60 70 80 90
Furcilia 6 (%)
3 4
5
9
16
6
1213
1819
Juve
nile
(%
)
Fig. 4. E. superba larvae from the under-ice habitat. Relation-
ship between percent of furcilia stage 6 and percent of juveniles.
The number is the dive number.
66.3 66.8
0
20
40
60
80
66.3 66.8 67.3 67.8 68.3
68.367.867.3
-2.5
-2.0
-1.5
-1.0
-0.5
0.0
0.5(A)
Gro
wth
Incr
emen
t (%
IMP
-1)
Latitude (˚S)
(B) 120
100
Inte
rmol
t Per
iod
(d)
Fig. 5. E. superba larvae from the under-ice habitat. (A)
Average growth increment (% IMP�1) with standard error.
Speckled bar indicates zero growth increment. Solid line is the
mean growth increment. (B) IMP (d) with the dotted line
indicating the median value. Plotted against the latitude of
collection: single collections from floes (open circles), Ice
Stations Robert (closed diamonds) and Billy (closed circles).
2
6
10
14
18
22
1.25 1.75 2.25 2.75 3.25Telson Length (mm)
1000
1400
6 10 12
Total Length (mm)
(A)
Tota
l Len
gth
(mm
),
Wet
and
Dry
Mas
s (m
g)
(B)
8
Car
bon
Con
tent
(µg
)
200
600
Fig. 6. E. superba larvae. Relationships between larval length
measurements and other parameters. (A) Telson length
(TelL, mm) and total length (TL, mm, +), wet mass (wwt, mg,
closed circle) and dry mass (dwt, mg, open triangle). (B)
Total length and carbon content (C, mg). The equations
derived were: TL=5.09 TelL – 1.4391, r2=0.98 (n=30); Wwt=
0.365 TelL3.412; Dwt=0.074 TelL3.554, r2=0.96 (n=31); and
C=0.136 TL3.60, r2=0.97 (n=106).
R.M. Ross et al. / Deep-Sea Research II 51 (2004) 2169–2184 2177
from 0 (n=5 experiments) to 50% (Table 2). Allfurcilia 4 and 5 larvae advanced (n=4), whereasonly 9% of furcilia 6 advanced to juvenile. Thosefurcilia that advanced a stage were larger thanthose that did not (Table 4) (ANOVA, F=6.05,p=0.016), but the growth increments werenot significantly different (ANOVA, F=0.44,p=0.50).
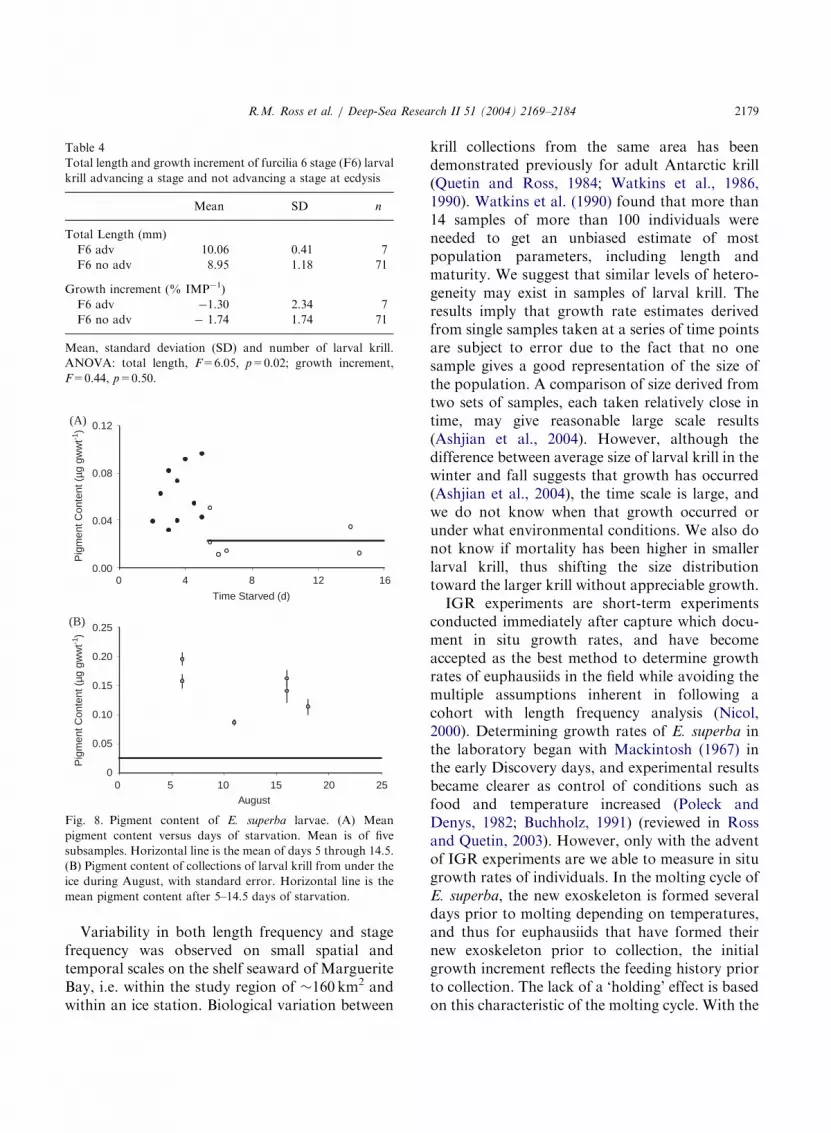
Pigment content: Pigment content in the larvaedecreased with increasing days of starvation,leveling off at day 5.5 at a value of 0.02 mg gwwt�1
for long-term starvation (Fig. 8A). Larvae fromIce Station Robert averaged slightly higher pig-ment contents than those from Ice Station Billy,but pigment contents of larval krill from differentsites were very similar (Fig. 8B). All were 3–8 timesgreater than long-term starvation levels, althoughtwo of the collections showed pigment valuessimilar to 2–3 d starvation levels (Fig. 8A). For the

ARTICLE IN PRESS
Table 3
Daily growth rates in terms of linear dimension (mm of total length
growth rate experiments: Mean, standard deviation (SD) and numbe
Expt. N Linear (mm d�1) Dry mass (mg dwt d�1)
1 11 0.0021 �0.0013
2 18 �0.0062 �0.0017
3 13 �0.0054 �0.0021
4 12 �0.0051 �0.0028
5 12 �0.0065 �0.0033
6 12 �0.0050 �0.0023
7 7 �0.0041 �0.0051
8 11 �0.0061 �0.0029
9 3 �0.0010 �0.0016
10 13 �0.0049 �0.0026
The median IMP of 30.6 d was used as the molt interval.
-0.15
-0.10
-0.05
0.00
66.3 66.8 67.3 67.8 68.3
10
Latitude (˚S)
Gro
wth
Incr
emen
t (m
g dw
t IM
P-1
)
68.367.867.366.866.3
-10
-30
-50
-70
-90
Gro
wth
Incr
emen
t (µg
C IM
P-1
)
(B)
(A)
Fig. 7. E. superba larvae from the under-ice habitat. Growth
increments in dry mass and carbon estimated from IGR
experiments. (A) Average dry mass growth increment (mg
dwt IMP�1) with standard error. (B) Average carbon growth
increment (mg C IMP�1) with standard error. Plotted against
the latitude of collection: single collections from floes (open
circles), Ice Stations Robert (closed diamonds) and Billy (closed
circles).
R.M. Ross et al. / Deep-Sea Research II 51 (2004) 2169–21842178
three collections for which both pigment contentand growth increment exist, the two parameters donot co-vary.
In separate experiments not reported here,larval krill feeding at maximum ingestion rates atphytoplankton concentrations of44 mg chl a l�1 atin situ temperatures reached an average maximumpigment content of approximately 1.0 mg gwwt�1
(S. A. Oakes, unpublished data). This maximumpigment content was 5 times that of the larval krillcollected from under the ice during this cruise.
4. Discussion
The combination of diver observations, theresults of the growth rate experiments and thepigment content determination allowed us to drawsome general conclusions about the physiologicalstatus of larval krill from under the pack ice inAugust 2001. The observations and results de-scribe larval krill from the under-ice surface inareas of moderately over-rafted pack ice, 5–8 mdeep, in the winter of 2001. The dominant stageswere furcilia stage 6 and juveniles, as has beenpreviously found for late winter and early spring inthe Scotia-Weddell Seas (Daly, 1990) and west ofthe Antarctic Peninsula (Frazer et al., 2002a;Quetin et al., 2003).
), dry mass (mg dwt) and carbon (C) for the 10 instantaneous
r of measurements (n)
Dry mass SD Carbon (mg d�1) Carbon (SD)
0.0022 �0.635 1.043
0.0029 �0.777 1.383
0.0022 �0.968 1.043
0.0023 �1.362 1.135
0.0027 �1.542 1.284
0.0019 �1.116 0.913
0.0018 �2.515 0.894
0.0023 �1.314 1.087
0.0027 �0.737 1.277
0.0031 �1.232 1.533
ARTICLE IN PRESS
Table 4
Total length and growth increment of furcilia 6 stage (F6) larval
krill advancing a stage and not advancing a stage at ecdysis
Mean SD n
Total Length (mm)
F6 adv 10.06 0.41 7
F6 no adv 8.95 1.18 71
Growth increment (% IMP�1)
F6 adv �1.30 2.34 7
F6 no adv � 1.74 1.74 71
Mean, standard deviation (SD) and number of larval krill.
ANOVA: total length, F=6.05, p=0.02; growth increment,
F=0.44, p=0.50.
0.00
0.04
0.08
0.12
0 8 12 16
Time Starved (d)
0
0.05
0.10
0.15
0.20
0.25
0 10 15 20 25
Pig
men
t Con
tent
(µg
gw
wt-1
)
4
August
5
Pig
men
t Con
tent
(µg
gw
wt-1
)
(B)
(A)
Fig. 8. Pigment content of E. superba larvae. (A) Mean
pigment content versus days of starvation. Mean is of five
subsamples. Horizontal line is the mean of days 5 through 14.5.
(B) Pigment content of collections of larval krill from under the
ice during August, with standard error. Horizontal line is the
mean pigment content after 5–14.5 days of starvation.
R.M. Ross et al. / Deep-Sea Research II 51 (2004) 2169–2184 2179
Variability in both length frequency and stagefrequency was observed on small spatial andtemporal scales on the shelf seaward of MargueriteBay, i.e. within the study region of �160 km2 andwithin an ice station. Biological variation between
krill collections from the same area has beendemonstrated previously for adult Antarctic krill(Quetin and Ross, 1984; Watkins et al., 1986,1990). Watkins et al. (1990) found that more than14 samples of more than 100 individuals wereneeded to get an unbiased estimate of mostpopulation parameters, including length andmaturity. We suggest that similar levels of hetero-geneity may exist in samples of larval krill. Theresults imply that growth rate estimates derivedfrom single samples taken at a series of time pointsare subject to error due to the fact that no onesample gives a good representation of the size ofthe population. A comparison of size derived fromtwo sets of samples, each taken relatively close intime, may give reasonable large scale results(Ashjian et al., 2004). However, although thedifference between average size of larval krill in thewinter and fall suggests that growth has occurred(Ashjian et al., 2004), the time scale is large, andwe do not know when that growth occurred orunder what environmental conditions. We also donot know if mortality has been higher in smallerlarval krill, thus shifting the size distributiontoward the larger krill without appreciable growth.
IGR experiments are short-term experimentsconducted immediately after capture which docu-ment in situ growth rates, and have becomeaccepted as the best method to determine growthrates of euphausiids in the field while avoiding themultiple assumptions inherent in following acohort with length frequency analysis (Nicol,2000). Determining growth rates of E. superba inthe laboratory began with Mackintosh (1967) inthe early Discovery days, and experimental resultsbecame clearer as control of conditions such asfood and temperature increased (Poleck andDenys, 1982; Buchholz, 1991) (reviewed in Rossand Quetin, 2003). However, only with the adventof IGR experiments are we able to measure in situgrowth rates of individuals. In the molting cycle ofE. superba, the new exoskeleton is formed severaldays prior to molting depending on temperatures,and thus for euphausiids that have formed theirnew exoskeleton prior to collection, the initialgrowth increment reflects the feeding history priorto collection. The lack of a ‘holding’ effect is basedon this characteristic of the molting cycle. With the

ARTICLE IN PRESS
R.M. Ross et al. / Deep-Sea Research II 51 (2004) 2169–21842180
IGR technique, we can document growth rates ofthe target species over the critical periods.
Average growth increments over the time andspace scales surveyed were all negative, i.e. thelarvae were shrinking, whether growth was ex-pressed in linear, dry mass or carbon terms.However, shrinkage was relatively low. In linearterms, the median shrinkage in total length(�0.005 mm d�1) would only result in a larvadecreasing in total length by about 0.1 mm in amonth. The median loss in dry mass was estimatedat 0.002 mg dwt d�1 and in carbon, 1.17 mg C d�1.To place this level of loss in perspective, Daly(2004) found that larvae kept starved, lost0.009 mg dwt d�1 and 6.49 mg C d�1. Thus larvaestarved in the laboratory lost dry mass and carbonat rates of about 5 times faster than the ratesdocumented for larvae from the under-ice habitatin this region in winter 2001, as estimated from theIGR experiments.
Daly (2004) found that growth rates in larvalkrill decreased to near zero in both the winters of2001 and 2002 in the SO GLOBEC study region.Combining the results from both winters, shefound that 87% of the larvae in her experiments(total of five experiments for the 2 years) eithermaintained their size or grew. In this study, basedon data from 10 experiments in the winter of 2001only, the majority of larvae were shrinking,although over one-fifth (22%) were receivingenough food to either maintain their size or grow.What are some of the possible causes of thedifference in the distribution of individual growthincrements between this study and that of Daly(2004)? One possibility is that the experi-ments were conducted with larvae from slightlydifferent geographical locations. In the studyof Quetin et al. (2003), although the seasonalpattern was stronger than the interannual andwithin cruise variability, growth rates did varyfrom site to site within a cruise by 1–3% IMP�1.The results of the present study also showthat there is a large variability in the percentof positive individual growth rates in an experi-ment with location, ranging from 0% to 38.5%,leading to one experiment with an averagegrowth increment that was not significantlydifferent from zero.
Development also appeared to be slow, as only9% of the furcilia stage 6 that molted advanced tojuvenile, a similar result to that of Daly (2004).This result implies that multiple instars within thefurcilia 6 stage were the rule and not the exceptionunder these winter conditions. As might bepredicted, those furcilia that advanced a stagewere larger than those that did not, but the growthincrements were the same. Such developmentaldelays and consequent multiple instars due to slowgrowth were also found for larval Euphausia
pacifica in laboratory experiments (Ross, 1981).Larval krill were coupled to the under-ice
habitat in winter 2001, and generally feeding onthe floors of over-rafted ice floes, as previouslyfound and described in Frazer et al. (1997, 2002a).Visually, however, the ice surface was white andhard, to all appearances devoid of sea-ice algae.Pigment content of the larvae was used as an indexof grazing on sea-ice algae. Two studies indicatethat larval krill from under the ice in winter areprimarily herbivores. The first was based on thestable isotopic composition of the larvae (Frazer,1996), and the second on the metabolic O:N ratio(Frazer et al., 2002b). Larval krill also may begrazing on heterotrophic organisms living on theice surfaces, increasing total food intake by anunknown amount, as protozoans can comprise6–49% of the biomass in the ice (Garrison, 1991;Palmisano and Garrison, 1993). Garrison andClose (1993) also suggested that the hetero-trophic component of the sea-ice microbial com-munity might become increasingly important inthe fall and winter, but there was considerableinterannual variation. Thus pigment content yieldsqualitative data on the feeding of these larval krillon sea-ice microalgae alone, but is likely to followtotal ingestion if the heterotrophic/autotrophicratio does not vary substantially and if larvalkrill are not strongly selective for one group orthe other.
In previous studies, larval or juvenile krill fromunder ice floes in winter or spring have shownhigher pigment content than those in this studythat averaged 0.15 mg gwwt�1. Two other data setsexist on pigment content of larval krill in winterfrom under the ice (Daly, 1990, 2004), and otherstudies have documented pigment content in

ARTICLE IN PRESS
R.M. Ross et al. / Deep-Sea Research II 51 (2004) 2169–2184 2181
subadult krill in spring (November) (Daly, 1998)and summer (Urban-Rich et al., 2001). Larval krillin the Scotia-Weddell Seas contained from 4.0 to21.0 ng pigment per krill, corrected for degrada-tion (Daly, 1990) or about 0.5–2 mg gwwt�1 (ourcalculation). For subadults (27 mm), during springin the west of Antarctic Peninsula, pigmentcontent corrected for degradation was equivalentto 0.06 mg gwwt�1 in krill from the water column,but 1.5 mg gwwt�1 in krill from under ice floes(Daly, 1998). In winter 2001, Daly (2004) foundthat pigment content of larvae was low, and thesame whether larvae were from the water columnor the under-ice habitat. If we use the estimates ofpigment degradation found in Daly (1998) of59–67%, the average pigment values of larval krillfrom under the ice in August 2001 would still be atthe low end of those found in previous studies.However, pigment content of well-fed larvae (S. A.Oakes, unpublished data) was similar to themaximum values of larval and juvenile krill fromunder ice floes (Daly, 1990, 1998).
In addition, Perissinotto et al. (2000) measuredpigment content in adult krill on three summercruises. Pigment content, corrected for degrada-tion and assuming that adult krill were about600 mg wwt, ranged from 0.1 to 7.9 mg gwwt�1,with most values o0.2 mg gwwt�1. They emphasizethat the pigment content tended to correlate wellwith the chl a concentration in the water column,confirming that pigment content can be used as anindex of grazing on phytoplankton.
One other issue is that microalgal pigmentscannot be used as quantitative tracers of ingestionbecause the pigments are degraded to a variableextent during the digestive process (Conover et al.,1986; Perissinotto and Pakhomov, 1996; Dagg,1993; Daly, 1998). This variability may be due, inpart, to variations in ingestion rate and nutritionalhistory (Penry and Frost, 1990). We minimized thefactor of variable levels of pigment degradationdue to temperature and larval condition bycomparing pigment content of larvae from underthe ice to that of starved and well-fed larvae fromthe same region and held at in situ temperatures.Although variability may exist in the extent ofpigment degradation in larval krill from the fieldand well-fed larval krill on board the ship, our
comparison allowed us to qualitatively evaluatethe level of ingestion of sea-ice microalgae.
Pigment content of larval krill associated withthe under-ice surface was only about 20% of thatof larvae fed high concentrations of phytoplank-ton (about 4 mg l�1 chl a). These results suggestedthat larvae in the field were not feeding on sea-icealgae at maximum possible ingestion rates. Addi-tional data on the abundance and composition ofthe sea-ice microbial community, and possibleselection by larval krill on that community willcontribute to our understanding of the interactionof larval krill with the sea-ice community. At thisjuncture, the low pigment content and negativegrowth increments suggested that although larvalkrill were feeding on the sea-ice microbial com-munity, total intake for most larvae was less thanrequired for both maintenance and growth. How-ever, the larvae were losing dry mass and carbon atrates much less than those of starved larvae, andthus, although food limited from the perspective ofbeing able to grow, they may not have been indanger of starvation.
Comparison to historical data: One of theobjectives of this study was to obtain data ongrowth rates of larval krill in August, a time periodfor which there was no historical data (Quetin etal., 2003). The low and negative growth incrementsfound in this study appeared to continue thedecreasing trend of growth found in early winter inthis previous study of growth increments for larvaefrom the under-ice habitat (Quetin et al., 2003).Growth rates in August in this study were slightlyless than those found early in the winter (June/July), and much less than those found in Septem-ber, as winter turns to spring (Quetin et al., 2003)(Fig. 9A). The results suggest that the rate ofincrease in growth from late winter progressinginto spring is more rapid than the decline ingrowth rate from fall progressing to winter.
In Quetin et al. (2003), based on 52 experimentsfrom nine fall and winter cruises with larvae fromboth the water column and the under-ice habitat,daylength appeared to be a good predictor ofgrowth increments. However, growth incrementsin this study were not correlated with daylength,and were well below the regression line describingthe previous relationship between daylength at the

ARTICLE IN PRESS
-3
0
3
6
9
2 6 10
-2
2
6
10
14
Jul Aug SepJun
Gro
wth
Icre
men
t (%
IMP
-1)
Gro
wth
Incr
emen
t (%
IMP
-1)
4 8
Daylength (h)
(B)
(A)
Fig. 9. Comparison to historical growth data on larval krill in
winter west of the Antarctic Peninsula. (A) Growth increment
versus Julian Day. Open circles are historical data for larval
krill from the under-ice habitat only from Quetin et al. (2003),
closed circles are the present study. Horizontal line is zero
growth. (B) Growth increment versus daylength. Closed circles
are data from this study. Line is the linear regression describing
the previously found relationship between daylength and
growth increment for larvae from both the water column and
under the ice in fall and winter (growth increment=0.984
(daylength in h) –0.868, r2=0.74, n=49) (Quetin et al., 2003).
R.M. Ross et al. / Deep-Sea Research II 51 (2004) 2169–21842182
time and place of collection and growth increment(Fig. 9B). Given that this is a single studycompared to nine previous cruises, the resultssuggest that food availability in the late winter of2001 was anomalously low. However, an alternateexplanation involves the differences in the plat-forms used to collect the data. During this SOGLOBEC cruise, due to the assistance of theRVIB Nathaniel B. Palmer, the ARSV Laurence
M. Gould penetrated further into pack ice in thisregion in winter than was previously possible.One possibility is that the relationship previouslyderived is relevant for the fringes and lighterregions of the pack ice, but may not be relevantfor the interior. In the interior, the degree of
overrafting is greater, and the light penetration tothe under-ice habitat is less. Under these condi-tions, daylength would not represent the lightavailable for sea-ice microalgal production, as waspostulated by Quetin et al. (2003). The sequentialcruise in August 2002 may help us resolve thisdiscrepancy.
Acknowledgements
We express our appreciation to the Captain andcrew of the ARSV Laurence M. Gould for theirskill and attention to safety during the cruise.Members of the Raytheon support staff alsocontributed significantly to our ability to conductresearch under winter conditions. We wouldparticularly like to mention the contributions ofC. Boch and J. Watson, SCUBA divers ‘parexcellence’, who in addition to Quetin and New-berger were essential to the under water observa-tions and collection of larval krill. M. Thimgamwas of great assistance in overall cruise sampling.We would also like to thank two anonymousreviewers and an editor for their helpful com-ments. This research was supported by NationalScience Foundation, Office of Polar Programs,Grant No. OPP-9909933 to Ross and Quetin. U.S.GLOBEC Contribution No. 458.
References
Ashjian, C.J., Rosenwaks, G.A., Wiebe, P.H., Davis, C.S.,
Gallager, S.M., Copley, N.J., Lawson, G.L., Alatalo, P.,
2004. Distribution of zooplankton on the continental shelf
off Marguerite Bay, Antarctic Peninsula, during austral fall
and winter, 2001. Deep-Sea Research II, this issue [doi:
10.1016/j.dsr2.2004.07.025].
Buchholz, F., 1991. Moult cycle and growth of Antarctic krill
Euphausia superba in the laboratory. Marine Ecology
Progress Series 69, 217–229.
Conover, R.J., Durvasula, S., Roy, S., Wang, R., 1986.
Probable loss of chlorophyll-derived pigments during
passage through the gut of zooplankton, and some of the
consequences. Limnology and Oceanography 31, 878–887.
Dagg, M.J., 1993. Grazing by the copepod community does not
control phytoplankton production in the subartic Pacific
Ocean. Progress in Oceanography 32, 163–183.
Daly, K.L., 1990. Overwintering development, growth and
feeding of larval Euphausia superba in the Antarctic

ARTICLE IN PRESS
R.M. Ross et al. / Deep-Sea Research II 51 (2004) 2169–2184 2183
marginal ice zone. Limnology and Oceanography 35,
1564–1576.
Daly, K.L., 1998. Physioecology of juvenile Antarctic krill
(Euphausia superba) during spring in ice-covered seas. In:
Lizotte, M.P., Arrigo, K.R. (Eds.), Antarctic Sea Ice
Biological Processes, Interactions, and Variability. Antarc-
tic Research Series. American Geophysical Union, Wa-
shington, DC, pp. 183–198.
Daly, K.L., 2004. Overwintering growth and development of
larval Euphausia superba: an interannual comparison under
varying environmental conditions west of the Antarctic
Peninsula. Deep-Sea Research II, this issue [doi: 10.1016/
j.dsr2.2004.07.010].
Elias, M.C., 1990. Effects of photoperiod, phytoplankton
level and temperature on the growth, development and
survival of larval Euphausia superba (Dana). Master of
Arts in Biology Thesis, University of California, Santa
Barbara.
Fraser, F.C., 1936. On the development and distribution of the
young stages of krill (Euphausia superba). Discovery
Reports 14, 1–192.
Frazer, T.K., 1996. Stable isotope composition (d13C and d15N)
of larval krill, Euphausia superba, and two of its potential
food sources in winter. Journal of Plankton Research 18,
1413–1426.
Frazer, T.K., Quetin, L.B., Ross, R.M., 1997. Abundance and
distribution of larval krill, Euphausia superba, associated
with annual sea ice in winter. In: Battaglia, B., Valencia, J.,
Walton, D.W.H. (Eds.), Sixth Biological Symposium.
Scientific Committee on Antarctic Research (SCAR),
pp. 107–111.
Frazer, T.K., Quetin, L.B., Ross, R.M., 2002a. Abundance,
sizes and developmental stages of larval krill, Euphausia
superba, during winter in ice-covered seas west of the
Antarctic Peninsula. Journal of Plankton Research 24,
1067–1077.
Frazer, T.K., Quetin, L.B., Ross, R.M., 2002b. Energetic
demands of larval krill, Euphausia superba, in winter.
Journal of Experimental Marine Biology and Ecology 277,
157–171.
Garrison, D.L., 1991. The biota of Antarctic sea ice. American
Zoologist 31, 17–33.
Garrison, D.L., Close, A.R., 1993. Winter ecology of the sea ice
biota in Weddell Sea pack ice. Marine Ecology Progress
Series 96, 17–31.
Hollander, E., 2001. Investigation of growth measurements for
Antarctic krill, Euphausia superba. Honors Thesis, Uni-
versity of Tasmania, Australia.
Ikeda, T., 1984. Development of the larvae of the Antarctic krill
(Euphausia superba Dana) observed in the laboratory.
Journal of Experimental Marine Biology and Ecology 75,
107–117.
Jarman, S.N., Elliott, N.G., Nicol, S., McMinn, A., 2002.
Genetic differentiation in the Antarctic coastal krill
Euphausia crystallorophias. Heredity 88, 280–287.
Mackas, D., Bohrer, R., 1976. Fluorescence analysis of
zooplankton gut contents and an investigation of diel
feeding patterns. Journal of Experimental Marine Biology
and Ecology 25, 77–85.
Mackintosh, N.A., 1967. Maintenance of living Euphausia
superba and frequency of moults. Norsk Hvalfangst-
Tidende (The Norwegian Whaling Gazette) 5, 97–102.
Mauchline, J., 1980. Measurement of body length of Euphausia
superba Dana: BIOMASS Handbook, vol. 4, pp. 4–9.
SCAR/SCOR.
Nicol, S., 2000. Understanding krill growth and aging: the
contribution of experimental studies. Canadian Journal of
Fisheries and Aquatic Sciences 57, 168–177.
Nicol, S., Stolp, M., Cochran, T., Geijsel, P., Marshall, J., 1992.
Growth and shrinkage of Antarctic krill (Euphausia superba
Dana) from the Indian sector of the Southern Ocean during
summer. Marine Ecology Progress Series 89, 175–181.
Ottersen, G.B., Loeng, H., 2000. Covariability in early growth
and year-class strength of Barents Sea cod, haddock and
herring: The environmental link. ICES Journal of Marine
Science 57, 339–348.
Palmisano, A.C., Garrison, D.L., 1993. Microorganisms in
Antarctic sea ice. In: Friedmann, E.I. (Ed.), Antarctic
Microbiology. Wiley-Liss, Inc., New York, pp. 167–218.
Penry, D.L., Frost, B.W., 1990. Re-evaluation of the gut-
fullness (gut fluorescence) method for inferring ingestion
rates of suspension-feeding copepods. Limnology and
Oceanography 35, 1207–1214.
Pepin, P., 1989. Using growth histories to estimate larval fish
mortality rates. Rapports et Proces-Verbaux des Reunions,
Conseil International Pour L’Exploration de la Mer 191,
324–329.
Pepin, P., 1991. The effect of temperature and size on
development and mortality rates of pelagic life history
stages of marine fish. Canadian Journal of Fisheries and
Aquatic Sciences 48, 503–518.
Perissinotto, R., Pakhomov, E.A., 1996. Gut evacuation rates
and pigment destruction in the Antarctic krill Euphausia
superba. Marine Biology 125, 47–54.
Perissinotto, R., Gurney, L., Pakhomov, E.A., 2000. Contribu-
tion of heterotrophic material to diet and energy budget of
Antarctic krill, Euphausia superba. Marine Biology 136,
129–135.
Poleck, T.P., Denys, C.J., 1982. Effect of temperature on the
molting, growth and maturation of the Antarctic Euphausia
superba (Crustacea: Euphausiacea) under laboratory condi-
tions. Marine Biology 70, 255–265.
Quetin, L.B., Ross, R.M., 1984. School composition of the
Antarctic krill, Euphausia superba, in the waters west of the
Antarctic Peninsula during the austral summer, 1982.
Journal of Crustacean Biology 4 (Spec. No. 1), 96–106.
Quetin, L.B., Ross, R.M., 1991. Behavioral and physiological
characteristics of the Antarctic krill, Euphausia superba.
American Zoologist 31, 49–63.
Quetin, L.B., Ross, R.M., 2003. Episodic recruitment in
Antarctic krill, Euphausia superba, in the Palmer LTER
study region. Marine Ecology Progress Series 295, 185–200.
Quetin, L.B., Ross, R.M., Frazer, T.K., Haberman, K.L.,
1996. Factors affecting distribution and abundance of

ARTICLE IN PRESS
R.M. Ross et al. / Deep-Sea Research II 51 (2004) 2169–21842184
zooplankton, with an emphasis on Antarctic krill,
Euphausia superba. In: Ross, R.M., Hofmann, E.E.,
Quetin, L.B. (Eds.), Foundations for Ecological Research
West of the Antarctic Peninsula. Antarctic Research
Series. American Geophysical Union, Washington, DC,
pp. 357–371.
Quetin, L.B., Ross, R.M., Frazer, T.K., Amsler, M.O., Wyatt-
Evens, C., Oakes, S.A., 2003. Growth of larval krill,
Euphausia superba, in fall and winter west of the Antarctic
Peninsula. Marine Biology 143, 833–843.
Ross, R.M., 1981. Laboratory culture and development of
Euphausia pacifica. Limnology and Oceanography 26,
235–246.
Ross, R.M., Quetin, L.B., 1991. Ecological physiology of larval
euphausiids, Euphausia superba (Euphausiacea). Memoirs of
the Queensland Museum 31, 321–333.
Ross, R.M., Quetin, L.B., 2003. Working with living krill—the
people and the places. Marine and Freshwater Behavior and
Physiology 36, 207–228.
Ross, R.M., Quetin, L.B., Baker, K.S., Vernet, M., Smith,
R.C., 2000. Growth limitation in young Euphausia superba
under field conditions. Limnology and Oceanography 45,
31–43.
Siegel, V., 2000. Krill (Euphausiacea) life history and aspects of
population dynamics. Canadian Journal of Fisheries and
Aquatic Sciences 57, 130–150.
Siegel, V., Loeb, V., 1995. Recruitment of Antarctic krill
(Euphausia superba) and possible causes for its variability.
Marine Ecology Progress Series 123, 45–56.
Siegel, V., Loeb, V., Groger, J., 1998. Krill (Euphausia superba)
density, proportional and absolute recruitment and biomass
in the Elephant Island region (Antarctic Peninsula) during
the period 1977 to 1997. Polar Biology 19, 393–398.
Siegel, V., Bergstrom, B., Muhlenhardt-Siegel, U., Thomasson,
M., 2002. Demography of krill in the Elephant Island area
during summer 2001 and its significance for stock recruit-
ment. Antarctic Science 14, 162–170.
Smetacek, V., Scharek, R., Nothig, E.-M., 1990. Seasonal and
regional variation in the pelagial and its relationship to the
life history cycle of krill. In: Kerry, K.R., Hempel, G.,
(Eds.), Antarctic Ecosystems, Ecological Change and
Conservation. Symposium on Antarctic Biology (SCAR).
Springer, Berlin, pp. 103–114
Smith, R.C., Baker, K.S., Dustan, P., 1981. Fluorometer
techniques for measurement of oceanic chlorophyll in the
support of remote sensing. La Jolla, California, Scripps
Institution of Oceanography, University of California, Ref.
81-17, 14pp.
Urban-Rich, J., Dagg, M., Peterson, J., 2001. Copepod grazing
on phytoplankton in the Pacific sector of the Antarctic
Polar Front. Deep-Sea Research II 48, 4223–4246.
Watkins, J., 1999. A composite recruitment index to describe
interannual changes in the population structure of Antarctic
krill at South Georgia. CCAMLR Science 6, 71–84.
Watkins, J.L., Morris, D.J., Ricketts, C., Priddle, J., 1986.
Differences between swarms of Antarctic krill and some
implications for sampling krill populations. Marine Biology
93, 137–146.
Watkins, J.L., Morris, D.J., Ricketts, C., Murray, A.W.A.,
1990. Sampling biological characteristics of krill: effects of
heterogeneous nature of swarms. Marine Biology 107,
409–415.