The mitochondrial genome of Euphausia superba (Prydz Bay) (Crustacea: Malacostraca: Euphausiacea)...
14
The mitochondrial genome of Euphausia superba (Prydz Bay) (Crustacea: Malacostraca: Euphausiacea) reveals a novel gene arrangement and potential molecular markers Xin Shen Haiqing Wang Jianfeng Ren Mei Tian Minxiao Wang Received: 3 December 2008 / Accepted: 24 June 2009 / Published online: 4 July 2009 Ó Springer Science+Business Media B.V. 2009 Abstract Euphausiid krill are dominant organisms in the zooplankton population and play a central role in marine ecosystems. In this paper, we described the gene organiza- tion, gene rearrangement and codon usage in the mitochon- drial genome of Euphausia superba Dana 1852 (sampling from Prydz Bay, PB). The mitochondrial genome of E. superba is more than 15,498 bp in length (partial non- coding region was not determined). Translocation of four tRNAs (trnL 1 , trnL 2 , trnW and trnI) and duplication of one tRNA (trnN) were founded in the mitochondrial genome of E. superba when comparing its genome with the pancrusta- cean ground pattern. To investigate the phylogenetic rela- tionship within Malacostraca, phylogenetic trees based on currently available malacostracan mitochondrial genomes were built with the maximum likelihood and the Bayesian models. All analyses based on nucleotide and amino acid data strongly support the monophyly of Stomatopoda, Penaeidae, Caridea, and Brachyura, which is consistent with previous research. However, the taxonomic position of Euphausiacea within Malacostraca is unstable. From com- paring the mitochondrial genome between E. superba (PB) and E. superba (sampling from Weddell Sea, WS), we found that nad2 gene contains maximal variation with 61 segre- gating sites, following by nad5 gene which has 12 segre- gating sites. Thus, nad2 and nad5 genes may be used as potential molecular markers to study the inherit diversity among different E. superba groups, which would be helpful to the exploitation and management of E. superba resources. Keywords Malacostraca Euphausiacea Mitochondrial genome Gene rearrangement Phylogenomics Abbreviations atp6, and 8 ATPase subunits 6 and 8 bp Base pair (s) cox1-3 Cytochrome c oxidase subunits I–III PCGs Protein-coding genes nCR Non coding region cob Cytochrome b mtDNA Mitochondrial DNA nad1–6, and 4L NADH dehydrogenase subunits 1–6 and 4L srRNA, and lrRNA Small and large subunits ribosomal RNA tRNA Transfer RNA L 1 tRNA Leu(CUN) L 2 tRNA Leu(UUR) S 1 RNA Ser(AGN) S 2 tRNA Ser(UCN) BPNn Bootstrap probability of neighbor joining based on nucleotide data BPNa Bootstrap probability of neighbor joining based on amino acid data BPMn Bootstrap probability of maximum likelihood based on nucleotide data Xin Shen and Haiqing Wang contributed equally to this work. X. Shen M. Tian Jiangsu Key Laboratory of Marine Biotechnology/College of Marine Science, Huaihai Institute of Technology, 222005 Lianyungang, China X. Shen (&) H. Wang J. Ren M. Wang (&) Institute of Oceanology, Chinese Academy of Sciences, 266071 Qingdao, China e-mail: [email protected] M. Wang e-mail: [email protected] 123 Mol Biol Rep (2010) 37:771–784 DOI 10.1007/s11033-009-9602-7
Transcript of The mitochondrial genome of Euphausia superba (Prydz Bay) (Crustacea: Malacostraca: Euphausiacea)...

The mitochondrial genome of Euphausia superba (Prydz Bay)(Crustacea: Malacostraca: Euphausiacea) reveals a novel genearrangement and potential molecular markers
Xin Shen Æ Haiqing Wang Æ Jianfeng Ren ÆMei Tian Æ Minxiao Wang
Received: 3 December 2008 / Accepted: 24 June 2009 / Published online: 4 July 2009
� Springer Science+Business Media B.V. 2009
Abstract Euphausiid krill are dominant organisms in the
zooplankton population and play a central role in marine
ecosystems. In this paper, we described the gene organiza-
tion, gene rearrangement and codon usage in the mitochon-
drial genome of Euphausia superba Dana 1852 (sampling
from Prydz Bay, PB). The mitochondrial genome of
E. superba is more than 15,498 bp in length (partial non-
coding region was not determined). Translocation of four
tRNAs (trnL1, trnL2, trnW and trnI) and duplication of one
tRNA (trnN) were founded in the mitochondrial genome of
E. superba when comparing its genome with the pancrusta-
cean ground pattern. To investigate the phylogenetic rela-
tionship within Malacostraca, phylogenetic trees based on
currently available malacostracan mitochondrial genomes
were built with the maximum likelihood and the Bayesian
models. All analyses based on nucleotide and amino acid
data strongly support the monophyly of Stomatopoda,
Penaeidae, Caridea, and Brachyura, which is consistent with
previous research. However, the taxonomic position of
Euphausiacea within Malacostraca is unstable. From com-
paring the mitochondrial genome between E. superba (PB)
and E. superba (sampling from Weddell Sea, WS), we found
that nad2 gene contains maximal variation with 61 segre-
gating sites, following by nad5 gene which has 12 segre-
gating sites. Thus, nad2 and nad5 genes may be used as
potential molecular markers to study the inherit diversity
among different E. superba groups, which would be helpful
to the exploitation and management of E. superba resources.
Keywords Malacostraca � Euphausiacea �Mitochondrial genome � Gene rearrangement �Phylogenomics
Abbreviations
atp6, and 8 ATPase subunits 6 and 8
bp Base pair (s)
cox1-3 Cytochrome c oxidase subunits I–III
PCGs Protein-coding genes
nCR Non coding region
cob Cytochrome b
mtDNA Mitochondrial DNA
nad1–6, and 4L NADH dehydrogenase subunits 1–6
and 4L
srRNA, and lrRNA Small and large subunits ribosomal
RNA
tRNA Transfer RNA
L1 tRNALeu(CUN)
L2 tRNALeu(UUR)
S1 RNASer(AGN)
S2 tRNASer(UCN)
BPNn Bootstrap probability of neighbor
joining based on nucleotide data
BPNa Bootstrap probability of neighbor
joining based on amino acid data
BPMn Bootstrap probability of maximum
likelihood based on nucleotide data
Xin Shen and Haiqing Wang contributed equally to this work.
X. Shen � M. Tian
Jiangsu Key Laboratory of Marine Biotechnology/College
of Marine Science, Huaihai Institute of Technology,
222005 Lianyungang, China
X. Shen (&) � H. Wang � J. Ren � M. Wang (&)
Institute of Oceanology, Chinese Academy of Sciences,
266071 Qingdao, China
e-mail: [email protected]
M. Wang
e-mail: [email protected]
123
Mol Biol Rep (2010) 37:771–784
DOI 10.1007/s11033-009-9602-7

BPMa Bootstrap probability of maximum
likelihood based on amino acid data
BPPn Bayesian posterior probability based
on nucleotide data
BPPa Bayesian posterior probability based
on amino acid data
Introduction
With a few exceptions, metazoan mitochondrial (mt)
DNAs are circular molecules, 13–20 kb in size, containing
37 genes: 13 for proteins of electron transport (cox1–cox3,
cob, nad1-4-4L-nad6, atp6 and atp8), 2 for ribosomal
RNAs (srRNA and lrRNA), and 22 for transfer RNAs. Over
the past decades, inference of phylogenetic relationship and
population diversity of metazoa species based on mito-
chondrial genome sequences has become popular [1–6].
This resulted from many advantages offered by mt gen-
omes over other molecular markers. Compared with
sequences of individual gene, mitochondrial genomes
could provide sets of genome-level characteristics, such as
the relative arrangements of gene orders, which are valu-
able characters for studies on evolutionary relationships [1,
2, 7].
Euphausiid krill are significant and dominant organisms
in the zooplankton population and play a central role in
marine ecosystems, which represent important elements in
the transfer of energy from the lower trophic levels through
the planktonic food web upwards to apex predators [8–10].
Euphausia superba Dana 1852, belonging to the order
Euphausiacea, is a dominant krill species and has a huge
biomass in the Antarctic ecosystem. Machida et al. [11]
determined the partial mitochondrial genome sequence of
E. superba sampling from Weddell Sea (Fig. 1). However,
due to the lack of partial srRNA gene and three tRNAs,
many genomic characters and phylogenetic relationship of
Euphausiacea within Malacostraca have not been further
analyzed.
In this paper, we described the gene organization, gene
rearrangement and codon usage of E. superba (sampling
from Prydz Bay, PB) (Crustacea: Malacostraca: Euphausi-
acea). Furthermore, the phylogenetic relationship of Eup-
hausiacea has been analyzed based on 23 malacostracan
mitochondrial genomes. In addition to a better understanding
of the phylogenetic history of the crustaceans, this work
Fig. 1 The sampling location
of E. superba (PB) and
E. superba (WS)
772 Mol Biol Rep (2010) 37:771–784
123

should be useful to the practice of biodiversity management
and conservation strategies of this ecological and commer-
cial significant species.
Materials and methods
Sample collection and DNA extraction
A single specimen of E. superba was obtained from the
Prydz Bay (64�440S, 73�000E; Fig. 1) and was preserved in
99.5% ethanol immediately after collection. Total genomic
DNA was extracted from the muscle tissues using a
DNeasy tissue DNA extraction kit (Promega) following the
manufacturer’s instructions, and was dissolved in TE
buffer.
Long PCR and sequencing by primer walking
The mitochondrial genome of E. superba (PB) was amplified
using a long PCR protocol [12]. Based on partial mito-
chondrial genome sequence of E. superba, five pairs of
primers (Eus-cox1F: GGT GCA TGA GCT GGA ATA GT,
Eus-cox1R: TTA AGT TGT GCA CCG TGA AG; Eus-
cox3F: GCA CAC GGA TTT CAC ACA TA, Eus-cox3R:
GCT GGC TGA AAA GTG ACA AC; Eus-nad5F: TTA
TGA ATT ACA GCC CCA GC, Eus-nad5R: AGG TTG
AGA TGG GTT AGG GT; Eus-cobF: ATC GCA AAT AGA
GCA CTG GT, Eus-cobR: AAA ATA ATG GTG GAA TGG
GA; Eus-srRNAF: TAA GAA TGA GAG CGA CGG G, Eus-
srRNAR: TTT GGC GGT GTC TTA GTC TAG) were
designed to amplify the entire mitochondrial genomes in five
long PCR reactions (Eus-cox1F/Eus-cox3R, Eus-cox3F/Eus-
nad5R, Eus-nad5F/ Eus-cobR, Eus-cobF/Eus-srRNAR and
Eus-srRNAF/Eus-cox1R). PCR reactions were conducted in
a Mastercycler gradient machine (Eppendorf AG Inc.) in a
total volume of 30.0 ll, containing 20.4 ll sterile distilled
H2O, 3.0 ll 109 LA PCR buffer II (Mg2? plus, Takara),
0.6 ll dNTP (10 mM each), 2.0 ll each primer (5 lM),
1.0 ll LA-Taq polymerase (1 unit, Takara), and 1.0 ll DNA
template. The thermal cycling profile was as follows: initial
denaturation at 94�C for 2 min and followed by denaturation
at 94�C for 20 s, annealing at 52�C for 60 s, and extension at
65�C for 16.0 min, for 33 cycles. PCR products were purified
using the Montage PCR Cleanup Kit (Millipore) and
sequenced by primer walking with ABI 373091 DNA
Analyzer.
Sequence analysis
Base calling was performed with PHRED [13, 14] and
sequence reads were assembled in PHRAP with default
parameters. All assembled sequences were manually
checked by using CONSED to remove misassemblies [15].
The locations of thirty PCGs and two ribosomal RNAs were
determined with DOGMA [16] and subsequently aligned
with malacostracan mitochondrial genomes. The majority
of tRNA genes were identified by using tRNAscan-SE 1.21
under the default mode [17]. Remaining tRNA genes were
identified by inspecting sequences for tRNA-like secondary
Fig. 2 A phylogeny of
Malacostraca derived from [35],
indicating species for which
mitochondrial genome
sequences are available so far.
Note: * means the species
displays mt gene
rearrangements in comparison
to the pancrustacean ground
pattern (shared by Penaeus,
Daphnia, Locusta, Drosophila,
and many others)
Mol Biol Rep (2010) 37:771–784 773
123

structures and anticodons. Gene map of E. superba (PB)
mitochondrial genome was drawn by OGDRAW [18].
Codon usage in the 13 PCGs of the E. superba (PB)
mitochondrial genome was estimated with DnaSP 4.10.7
[19].
Phylogenomic analysis
Along with the mitochondrial genome sequence from
E. superba (PB) all currently available malacostracan
mitochondrial genome data were used in phylogenomic
analysis, which included Penaeus monodon, Fennerope-
naeus chinensis, Litopenaeus vannamei, Marsupenaeus
japonicus, Macrobrachium rosenbergii, Halocaridina
rubra, Ligia oceanica, Callinectes sapidus, Cherax
destructor, Eriocheir sinenesis, Geothelphusa dehaani,
Pagurus longicarpus, Shinkaria crosnieri, Panulirus
japonicus, Portunus trituberculatus, Pseudocarcinus gigas,
Gonodactylus chiragra, Harpiosquilla harpax, Lysiosquil-
lina maculate, Squilla empusa, Squilla mantis and Eup-
hausia superba (WS) [5, 11, 20–34]. Their traditional
classification according to Martin and Davis is illustrated in
Fig. 2 [35].
The nucleic acid and amino acid sequences from all 13
PCGs were aligned using ClustalW 1.83 [36] under the
default settings. The concatenated alignment of amino acid
sequences and nucleotide sequences consisted of 11,396
and 3,753 sites for nucleic acid and amino acid sequences,
respectively. Three phylogenetic reconstruction approaches
were applied including Neighbor Joining (NJ) of pairwise
distances using MEGA 4.1 [37], maximum likelihood
(ML) using PHYML 3.0 [38] and Bayesian inference
analyses using MrBayes 3.1 MPI version [39].
To determine the best fitting model of sequence evolu-
tion for the nucleic acid dataset, a nested likelihood ratio
test was performed using MODELTEST 3.8 [40]. After the
evolutionary model (GTR ? I ? G) was determined, phy-
logenetic relationships were inferred by using PHYML 3.0
and MrBayes 3.1 MPI version. The NJ analyses were built
using the maximum composite likelihood model of evolu-
tionary change. In the NJ and ML methods, the assessment
of node reliability was done using 1,000 bootstrap
Fig. 3 Gene map of
mitochondrial genomes of
E. superba (Malacostraca:
Euphausiacea). Note: Protein-
coding genes are transcribed in
a clockwise direction, except for
nad1, nad4, nad4L, and nad5genes. The two ribosomal RNA
genes are encoded on the lightstrands. Transfer RNA genes are
designated by single-letter
amino acid codes. Genes
encoded on the heavy and lightstrands are shown outside and
inside the circular gene map,
respectively. Inner ring shows
GC content graph. The entire
E. supera (PB) mtDNA
sequence has been deposited in
GenBank under accession
number EU583500
774 Mol Biol Rep (2010) 37:771–784
123
replicates. In the case of the Bayesian analyses, the Markov
Chain Monte Carlo analyses were run for 1,000,000 gen-
erations (sampling every 1,000 generations) to allow ade-
quate time for convergence. After approximate 100,000
generations, the log-likelihood values of each sampled tree
had stabilized. After omitting the first 100 ‘‘burn in’’ trees,
the remaining 900 sampled trees were used to estimate the
50% majority rule consensus tree and the Bayesian pos-
terior probabilities (BPPn).
Model selection for the amino acid dataset was done
with ProtTest 1.4 [41]. Due to the Akaike information
criterion MtArt ? C ? I model performed best with our
dataset [42]. NJ and ML analyses of 13 concatenated
mitochondrial PCGs (amino acid data) were built using the
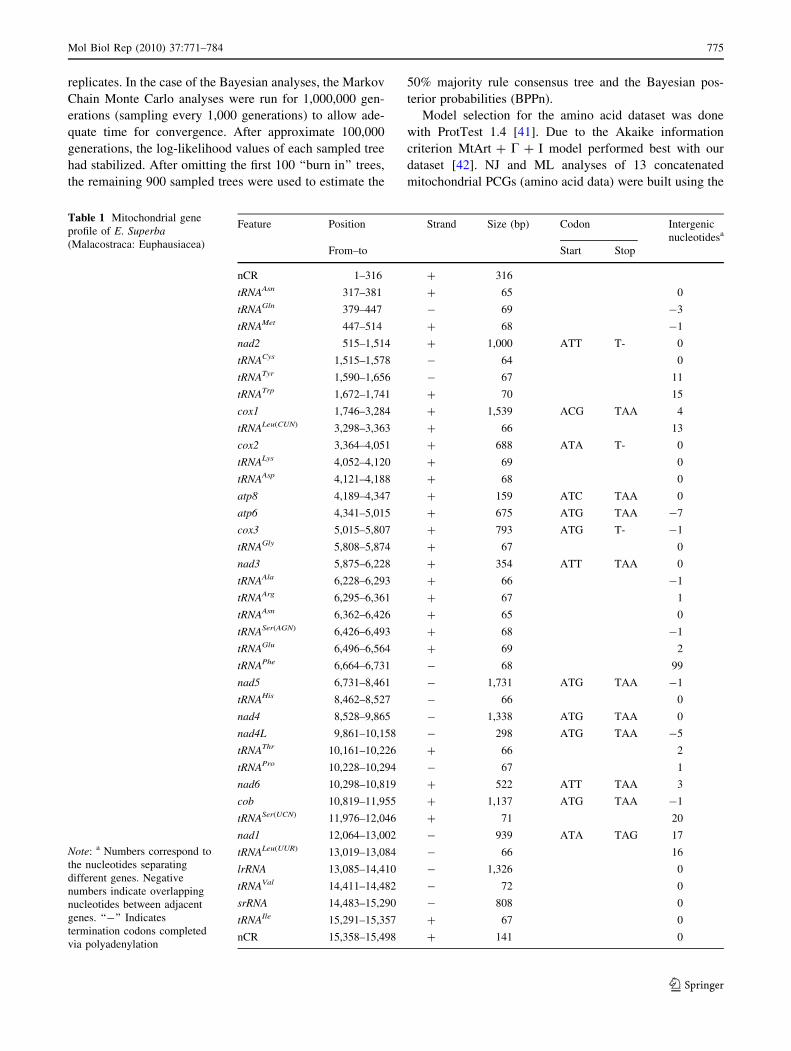
Table 1 Mitochondrial gene
profile of E. Superba(Malacostraca: Euphausiacea)
Note: a Numbers correspond to
the nucleotides separating
different genes. Negative
numbers indicate overlapping
nucleotides between adjacent
genes. ‘‘-’’ Indicates
termination codons completed
via polyadenylation
Feature Position Strand Size (bp) Codon Intergenic
nucleotidesa
From–to Start Stop
nCR 1–316 ? 316
tRNAAsn 317–381 ? 65 0
tRNAGln 379–447 - 69 -3
tRNAMet 447–514 ? 68 -1
nad2 515–1,514 ? 1,000 ATT T- 0
tRNACys 1,515–1,578 - 64 0
tRNATyr 1,590–1,656 - 67 11
tRNATrp 1,672–1,741 ? 70 15
cox1 1,746–3,284 ? 1,539 ACG TAA 4
tRNALeu(CUN) 3,298–3,363 ? 66 13
cox2 3,364–4,051 ? 688 ATA T- 0
tRNALys 4,052–4,120 ? 69 0
tRNAAsp 4,121–4,188 ? 68 0
atp8 4,189–4,347 ? 159 ATC TAA 0
atp6 4,341–5,015 ? 675 ATG TAA -7
cox3 5,015–5,807 ? 793 ATG T- -1
tRNAGly 5,808–5,874 ? 67 0
nad3 5,875–6,228 ? 354 ATT TAA 0
tRNAAla 6,228–6,293 ? 66 -1
tRNAArg 6,295–6,361 ? 67 1
tRNAAsn 6,362–6,426 ? 65 0
tRNASer(AGN) 6,426–6,493 ? 68 -1
tRNAGlu 6,496–6,564 ? 69 2
tRNAPhe 6,664–6,731 - 68 99
nad5 6,731–8,461 - 1,731 ATG TAA -1
tRNAHis 8,462–8,527 - 66 0
nad4 8,528–9,865 - 1,338 ATG TAA 0
nad4L 9,861–10,158 - 298 ATG TAA -5
tRNAThr 10,161–10,226 ? 66 2
tRNAPro 10,228–10,294 - 67 1
nad6 10,298–10,819 ? 522 ATT TAA 3
cob 10,819–11,955 ? 1,137 ATG TAA -1
tRNASer(UCN) 11,976–12,046 ? 71 20
nad1 12,064–13,002 - 939 ATA TAG 17
tRNALeu(UUR) 13,019–13,084 - 66 16
lrRNA 13,085–14,410 - 1,326 0
tRNAVal 14,411–14,482 - 72 0
srRNA 14,483–15,290 - 808 0
tRNAIle 15,291–15,357 ? 67 0
nCR 15,358–15,498 ? 141 0
Mol Biol Rep (2010) 37:771–784 775
123
Poisson correction and MtArt model respectively. The
assessment of node reliability was also done using 1,000
bootstrap replicates (BPNa and BPMa stand for NJ and ML
methods, respectively). Given MtArt model could not be
implemented in Bayesian analysis, where we used the best
scoring alternative, MtRev matrix and the gamma ? invar
model of evolutionary change. For a likelihood analysis,
we implemented the MtArt matrix in PHYML 3.0 [38].
The Markov Chain Monte Carlo analyses were run for
1,000,000 generations (sampling every 1,000 generations)
to allow adequate time for convergence. After approximate
100,000 generations, the log-likelihood values of each
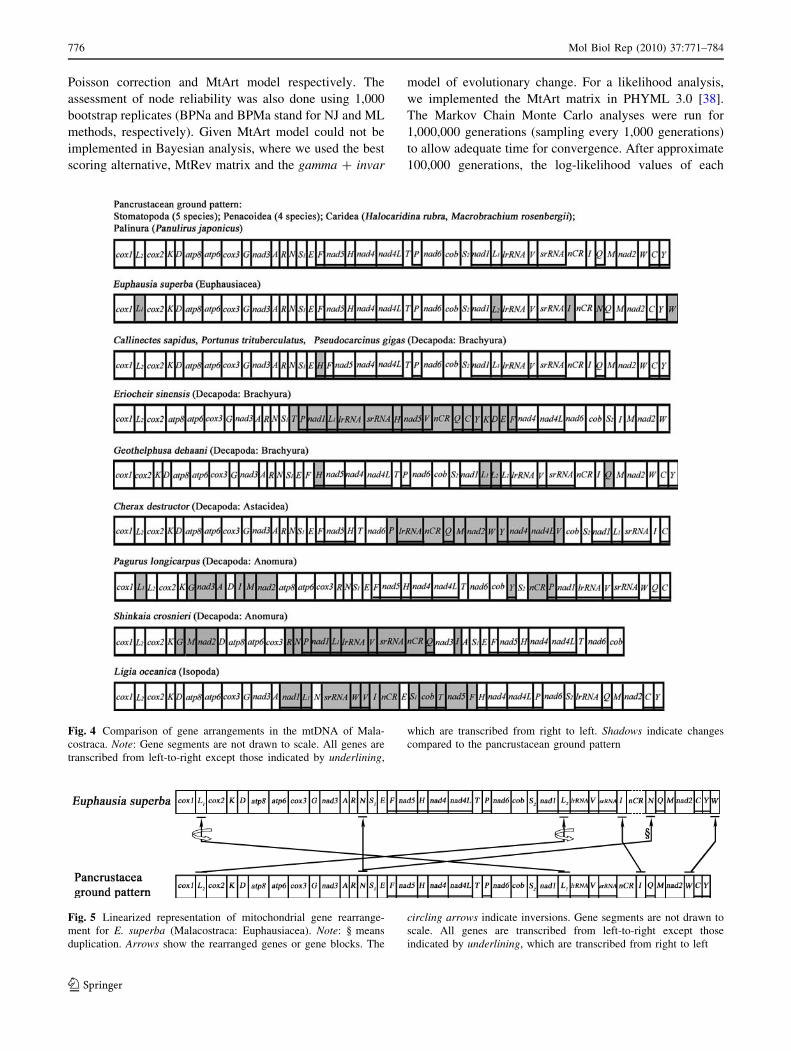
Fig. 4 Comparison of gene arrangements in the mtDNA of Mala-
costraca. Note: Gene segments are not drawn to scale. All genes are
transcribed from left-to-right except those indicated by underlining,
which are transcribed from right to left. Shadows indicate changes
compared to the pancrustacean ground pattern
Fig. 5 Linearized representation of mitochondrial gene rearrange-
ment for E. superba (Malacostraca: Euphausiacea). Note: § means
duplication. Arrows show the rearranged genes or gene blocks. The
circling arrows indicate inversions. Gene segments are not drawn to
scale. All genes are transcribed from left-to-right except those
indicated by underlining, which are transcribed from right to left
776 Mol Biol Rep (2010) 37:771–784
123
sampled tree had stabilized. After omitting the first 100
‘‘burn in’’ trees, the remaining 900 sampled trees were used
to estimate the 50% majority rule consensus tree and the
Bayesian posterior probabilities (BPPa). The root of each
tree was determined by using the data from five stomato-
pods as an outgroup.
Results and discussion
Genomic characters
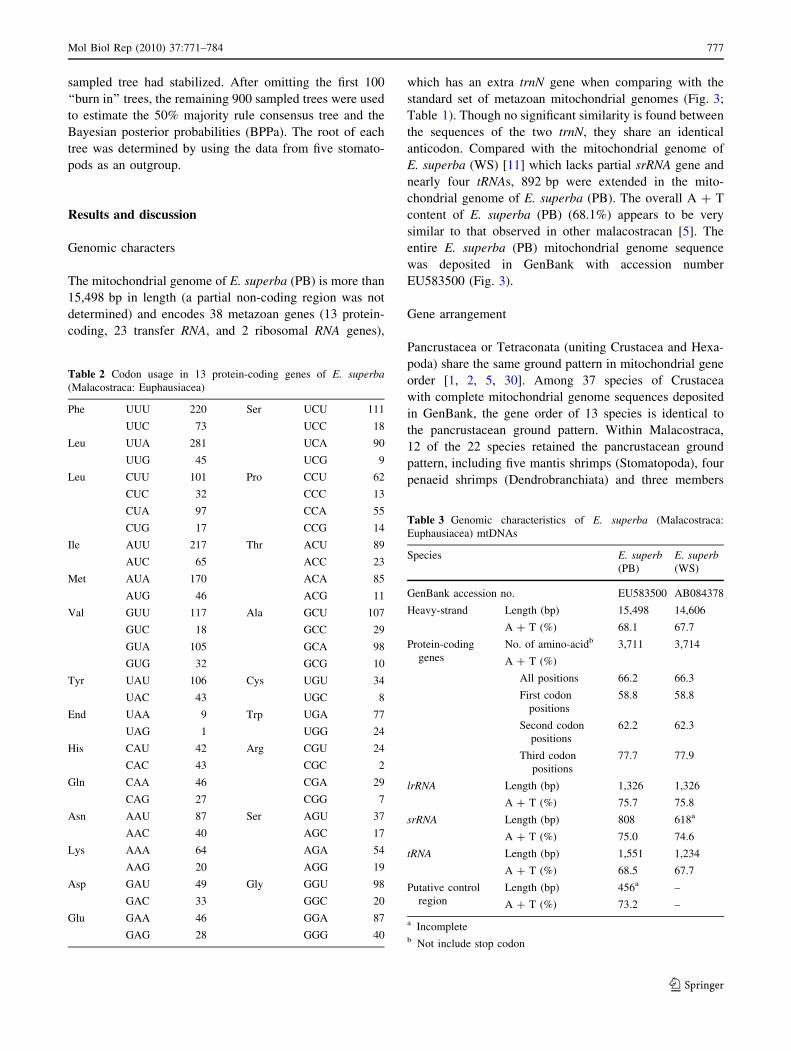
The mitochondrial genome of E. superba (PB) is more than
15,498 bp in length (a partial non-coding region was not
determined) and encodes 38 metazoan genes (13 protein-
coding, 23 transfer RNA, and 2 ribosomal RNA genes),
which has an extra trnN gene when comparing with the
standard set of metazoan mitochondrial genomes (Fig. 3;
Table 1). Though no significant similarity is found between
the sequences of the two trnN, they share an identical
anticodon. Compared with the mitochondrial genome of
E. superba (WS) [11] which lacks partial srRNA gene and
nearly four tRNAs, 892 bp were extended in the mito-
chondrial genome of E. superba (PB). The overall A ? T
content of E. superba (PB) (68.1%) appears to be very
similar to that observed in other malacostracan [5]. The
entire E. superba (PB) mitochondrial genome sequence
was deposited in GenBank with accession number
EU583500 (Fig. 3).
Gene arrangement
Pancrustacea or Tetraconata (uniting Crustacea and Hexa-
poda) share the same ground pattern in mitochondrial gene
order [1, 2, 5, 30]. Among 37 species of Crustacea
with complete mitochondrial genome sequences deposited
in GenBank, the gene order of 13 species is identical to
the pancrustacean ground pattern. Within Malacostraca,
12 of the 22 species retained the pancrustacean ground
pattern, including five mantis shrimps (Stomatopoda), four
penaeid shrimps (Dendrobranchiata) and three members
Table 2 Codon usage in 13 protein-coding genes of E. superba(Malacostraca: Euphausiacea)
Phe UUU 220 Ser UCU 111
UUC 73 UCC 18
Leu UUA 281 UCA 90
UUG 45 UCG 9
Leu CUU 101 Pro CCU 62
CUC 32 CCC 13
CUA 97 CCA 55
CUG 17 CCG 14
Ile AUU 217 Thr ACU 89
AUC 65 ACC 23
Met AUA 170 ACA 85
AUG 46 ACG 11
Val GUU 117 Ala GCU 107
GUC 18 GCC 29
GUA 105 GCA 98
GUG 32 GCG 10
Tyr UAU 106 Cys UGU 34
UAC 43 UGC 8
End UAA 9 Trp UGA 77
UAG 1 UGG 24
His CAU 42 Arg CGU 24
CAC 43 CGC 2
Gln CAA 46 CGA 29
CAG 27 CGG 7
Asn AAU 87 Ser AGU 37
AAC 40 AGC 17
Lys AAA 64 AGA 54
AAG 20 AGG 19
Asp GAU 49 Gly GGU 98
GAC 33 GGC 20
Glu GAA 46 GGA 87
GAG 28 GGG 40
Table 3 Genomic characteristics of E. superba (Malacostraca:
Euphausiacea) mtDNAs
Species E. superb(PB)
E. superb(WS)
GenBank accession no. EU583500 AB084378
Heavy-strand Length (bp) 15,498 14,606
A ? T (%) 68.1 67.7
Protein-coding
genes
No. of amino-acidb 3,711 3,714
A ? T (%)
All positions 66.2 66.3
First codon
positions
58.8 58.8
Second codon
positions
62.2 62.3
Third codon
positions
77.7 77.9
lrRNA Length (bp) 1,326 1,326
A ? T (%) 75.7 75.8
srRNA Length (bp) 808 618a
A ? T (%) 75.0 74.6
tRNA Length (bp) 1,551 1,234
A ? T (%) 68.5 67.7
Putative control
region
Length (bp) 456a –
A ? T (%) 73.2 –
a Incompleteb Not include stop codon
Mol Biol Rep (2010) 37:771–784 777
123
of Pleocyemata (Figs. 2, 4). Among Decapoda, rear-
ranged mitochondrial genomes have been found only in
the suborder Pleocyemata. Five species of the infraorder
Brachyura (Callinectes sapidus, Portunus trituberculatus,
Pseudocarcinus gigas, Eriocheir sinenesis, and Geothel-
phusa dehaani), share a translocation of the trnH gene
compared to the pancrustacean ground pattern [24, 25, 27–
29] (Fig. 4). The trnH translocation shared by these five
taxa is regarded as a synapomorphic character and this
pattern of gene rearrangement supports the monophyly of
Brachyura.
Translocation of four tRNAs (trnL1, trnL2, trnW, and trnI)
and the duplication of trnN were founded in the
mitochondrial genome of E. superba when comparing the
genome with the pancrustacean ground pattern (Figs. 4, 5).
These data indicate that gene order is not conserved in
euphausiids mitochondrial genome. Gene order may be
useful for inferring phylogenetic relationship among eup-
hausiids and other malacostracans when more mitochon-
drial genome data from Euphausiacea are available.
Protein-coding genes
Protein-coding genes were identified with DOGMA [16]
and subsequently aligned with malacostracan mitochon-
drial genomes. There are in total nine genes (atp6, atp8,
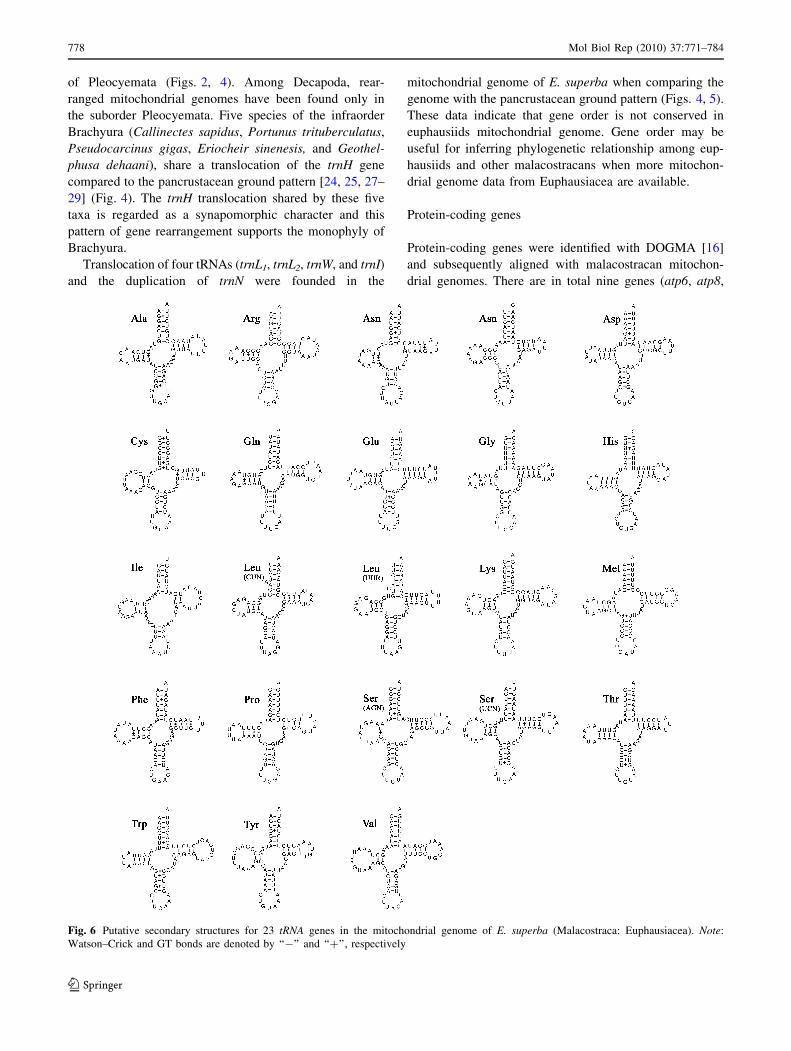
Fig. 6 Putative secondary structures for 23 tRNA genes in the mitochondrial genome of E. superba (Malacostraca: Euphausiacea). Note:
Watson–Crick and GT bonds are denoted by ‘‘-’’ and ‘‘?’’, respectively
778 Mol Biol Rep (2010) 37:771–784
123

cox1, cox2, cox3, cob, nad2, nad3, and nad6) are encoded
on the heavy-strand, while the remaining four (nad1, nad4,
nad4L, and nad5) are encoded on the light-strand (Table 1).
These transcriptional polarities are identical to the pan-
crustacean ground pattern (Figs. 4, 5) [5, 30].
Among the 13 protein-coding genes of E. superba (PB),
there are two reading-frame overlaps on the same strand
(atp6/atp8 and nad4/nad4L, both share seven nucleotides)
(Table 1), and this is common among the crustaceans.
Mitochondrial genes commonly use several alternatives to
ATG as start codons. Six of the thirteen PCGs (atp6, cob,
cox3, nad4, nad4L, and nad5) of E. superba (PB) start with
the ATG start codon, cox2 and nad1 genes start with ATA.
Nad2, nad3, and nad6 genes start with ATT, while atp8
and cox1 genes start with ATC and ACG, respectively
(Table 1).
Ten open reading frames of the E. superba (PB) mtDNA
end with the TAA or TAG stop codon (atp6, atp8, cob,
cox1, nad1, nad3, nad4, nad4L, nad5, and nad6), and the
remaining ones (cox1, cox3, and nad1) have incomplete
stop codons (TA- or T-) (Table 1). Compared with the
mitochondrial genome of E. superba (PB), there are six
alterations in the mitochondrial genome of E. superba
(WS), including atp6, atp8, nad2, nad3, nad4L, nad5, and
nad6. Those variations partially result from the gene
annotation in the mitochondrial genome of E. superba
(WS). Such immature stop codons are common among
animal mitochondrial genomes, and it has been shown that
TAA stop codons are created via posttranscriptional poly-
adenylation [43].
The pattern of codon usage in E. superba (PB) mtDNA
was also studied (Table 2). Excluding incomplete termi-
nation codons, there are a total of 3,711 codons in all
thirteen mitochondrial PCGs of E. superba. In the 13 PCGs
of E. superba (PB) mitochondrial genome, the most fre-
quently used amino acids were Leu (15.44%), followed by
Ser (9.57%), Phe (7.90%), Ile (7.60%) and Val (7.33%).
A common feature in most metazoan genomes is a bias
towards a higher representation of nucleotides A and T
which leads to a subsequent bias in the corresponding
Fig. 7 Topology derived from
NJ analysis of 13 concatenated
mitochondrial PCGs (nucleic
acid data) from 23
mitochondrial genomes, which
was built using the maximum
composite likelihood model of
evolutionary change. Note:
Black branches indicate the taxa
whose mitochondrial gene
arrangements are consistent
with the pancrustacean ground
pattern, and gray ones indicate
the taxa whose mitochondrial
genes encountered
rearrangement. Nodal support
indicated by Bootstrap value(BPNn)
Mol Biol Rep (2010) 37:771–784 779
123
encoded amino acids. The overall AT composition of
protein-coding regions is 69.8 and 66.2%, but at the third
codon positions the AT composition elevates to 77.7% in
E. superba (PB) (Table 3).
Transfer and ribosomal RNA genes
The E. superba (PB) mitochondrial genome encodes 23
tRNA genes, and has an extra trnN gene compared with the
standard set of metazoan mitochondrial genomes. Each
folds into a clover-leaf secondary structure (Fig. 6), rang-
ing from 64 to 72 nucleotides (Table 1), and the total
length is 1,551 bp with 68.5% AT (Table 3). Gene sizes
and anticodon usage are congruent to those described for
other malacostracan species (Fig. 6).
DOGMA and BLAST analyses indicate that the lrRNA
gene lies between the tRNALeu(UUR) and tRNAVal genes,
while the srRNA gene lies between tRNAVal and the puta-
tive control region, and both rRNA genes are encoded on
the light-strand. The location and orientation of rRNA
genes is typical to the pancrustacean ground pattern
(Fig. 5). The lengths of lrRNA/srRNA are 1,326/808 bp,
and the A ? T contents are 75.7/75.0%, which are similar
to other malacostracans (Table 3).
Phylogenomic relationship
Malacostracans have been the subject of a huge number of
taxonomic and phylogenetic studies employing morpho-
logical characters and molecular characters. Though Mal-
acostraca itself is widely regarded as a monophyletic
group, the relationship among various groups of Mala-
costraca is still controversial [35]. Here we explored the
phylogenetic relationship among major groups within
Malacostraca and the taxonomic position of Euphausiacea
based on their mitochondrial genomes.
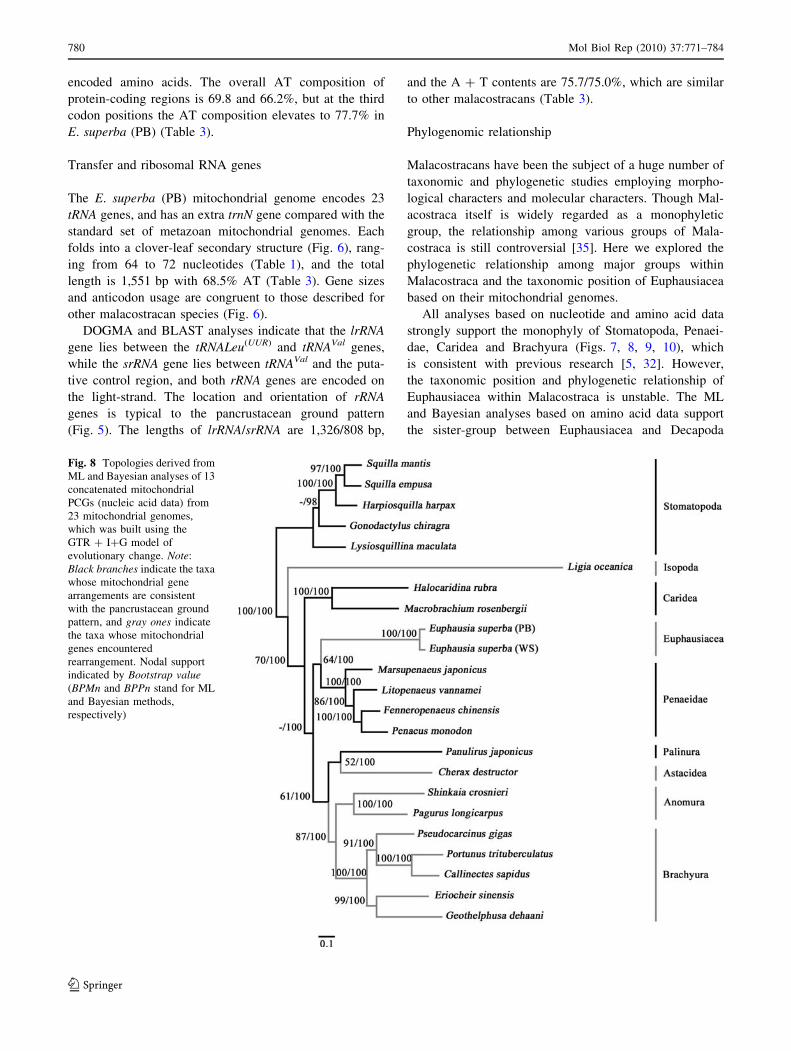
All analyses based on nucleotide and amino acid data
strongly support the monophyly of Stomatopoda, Penaei-
dae, Caridea and Brachyura (Figs. 7, 8, 9, 10), which
is consistent with previous research [5, 32]. However,
the taxonomic position and phylogenetic relationship of
Euphausiacea within Malacostraca is unstable. The ML
and Bayesian analyses based on amino acid data support
the sister-group between Euphausiacea and Decapoda
Fig. 8 Topologies derived from
ML and Bayesian analyses of 13
concatenated mitochondrial
PCGs (nucleic acid data) from
23 mitochondrial genomes,
which was built using the
GTR ? I?G model of
evolutionary change. Note:
Black branches indicate the taxa
whose mitochondrial gene
arrangements are consistent
with the pancrustacean ground
pattern, and gray ones indicate
the taxa whose mitochondrial
genes encountered
rearrangement. Nodal support
indicated by Bootstrap value(BPMn and BPPn stand for ML
and Bayesian methods,
respectively)
780 Mol Biol Rep (2010) 37:771–784
123
(BPMa \ 50, BPPa = 100) (Fig. 10), which is in coinci-
dence with traditional views (Fig. 2) [35] and supports the
monophyly of Eucarida. However, the ML and Bayesian
analyses based on nucleotide acid data and the NJ approach
based on nucleotide and amino acid data strongly support
the close relationship between Euphausiacea and Penaei-
dae, which destroys the monophyly of Decapoda and dis-
agrees with traditional classification (Fig. 2) [35]. In
addition, the bootstrap value is very high (BPNn = 100,
BPNa = 99, BPMn = 64, BPPn = 100), so the further
analyses with more mitochondrial genomes from Eup-
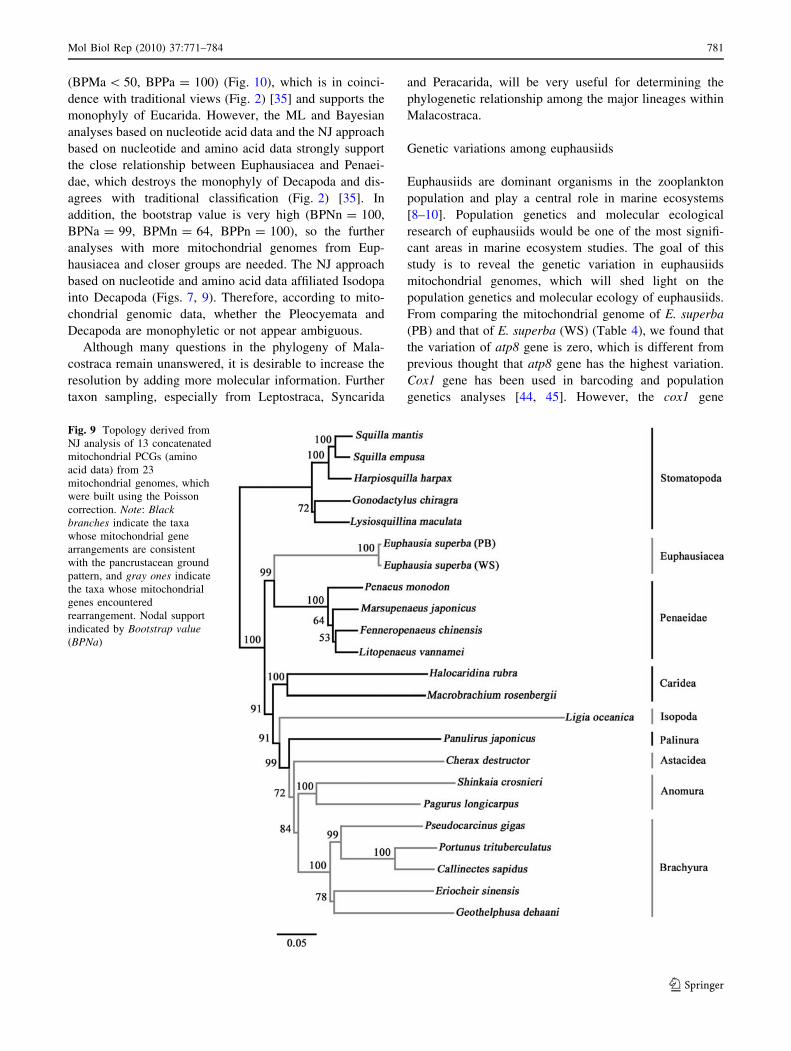
hausiacea and closer groups are needed. The NJ approach
based on nucleotide and amino acid data affiliated Isodopa
into Decapoda (Figs. 7, 9). Therefore, according to mito-
chondrial genomic data, whether the Pleocyemata and
Decapoda are monophyletic or not appear ambiguous.
Although many questions in the phylogeny of Mala-
costraca remain unanswered, it is desirable to increase the
resolution by adding more molecular information. Further
taxon sampling, especially from Leptostraca, Syncarida
and Peracarida, will be very useful for determining the
phylogenetic relationship among the major lineages within
Malacostraca.
Genetic variations among euphausiids
Euphausiids are dominant organisms in the zooplankton
population and play a central role in marine ecosystems
[8–10]. Population genetics and molecular ecological
research of euphausiids would be one of the most signifi-
cant areas in marine ecosystem studies. The goal of this
study is to reveal the genetic variation in euphausiids
mitochondrial genomes, which will shed light on the
population genetics and molecular ecology of euphausiids.
From comparing the mitochondrial genome of E. superba
(PB) and that of E. superba (WS) (Table 4), we found that
the variation of atp8 gene is zero, which is different from
previous thought that atp8 gene has the highest variation.
Cox1 gene has been used in barcoding and population
genetics analyses [44, 45]. However, the cox1 gene
Fig. 9 Topology derived from
NJ analysis of 13 concatenated
mitochondrial PCGs (amino
acid data) from 23
mitochondrial genomes, which
were built using the Poisson
correction. Note: Blackbranches indicate the taxa
whose mitochondrial gene
arrangements are consistent
with the pancrustacean ground
pattern, and gray ones indicate
the taxa whose mitochondrial
genes encountered
rearrangement. Nodal support
indicated by Bootstrap value(BPNa)
Mol Biol Rep (2010) 37:771–784 781
123
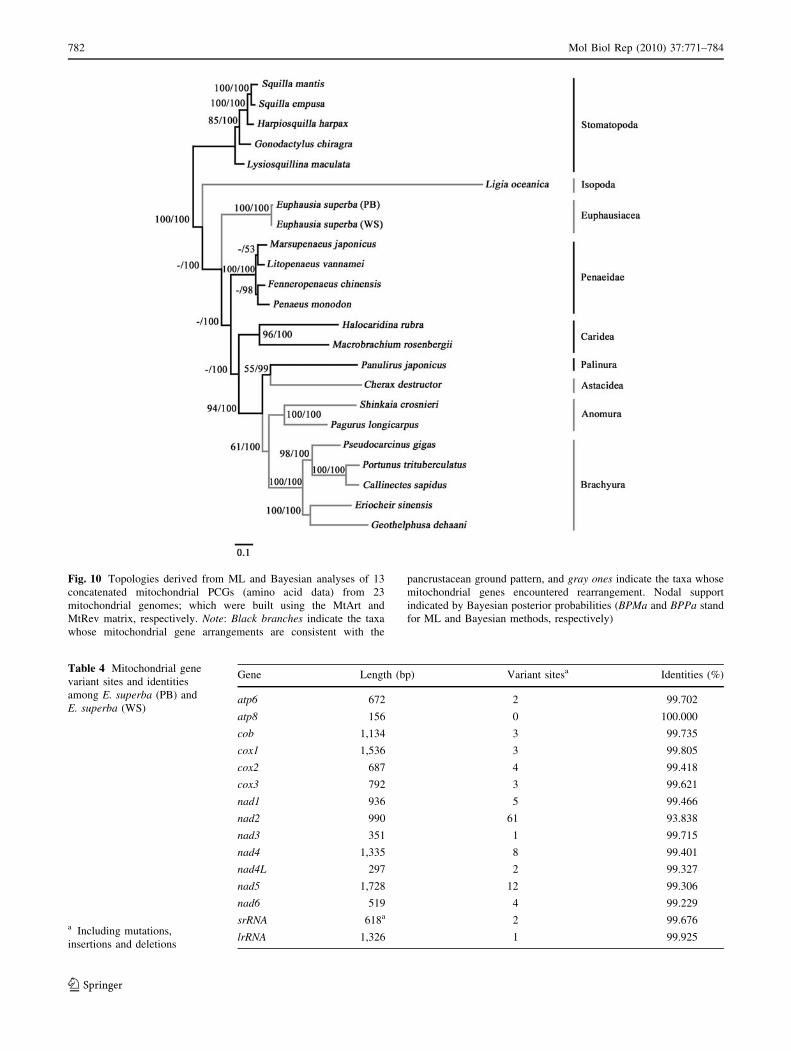
Fig. 10 Topologies derived from ML and Bayesian analyses of 13
concatenated mitochondrial PCGs (amino acid data) from 23
mitochondrial genomes; which were built using the MtArt and
MtRev matrix, respectively. Note: Black branches indicate the taxa
whose mitochondrial gene arrangements are consistent with the
pancrustacean ground pattern, and gray ones indicate the taxa whose
mitochondrial genes encountered rearrangement. Nodal support
indicated by Bayesian posterior probabilities (BPMa and BPPa stand
for ML and Bayesian methods, respectively)
Table 4 Mitochondrial gene
variant sites and identities
among E. superba (PB) and
E. superba (WS)
a Including mutations,
insertions and deletions
Gene Length (bp) Variant sitesa Identities (%)
atp6 672 2 99.702
atp8 156 0 100.000
cob 1,134 3 99.735
cox1 1,536 3 99.805
cox2 687 4 99.418
cox3 792 3 99.621
nad1 936 5 99.466
nad2 990 61 93.838
nad3 351 1 99.715
nad4 1,335 8 99.401
nad4L 297 2 99.327
nad5 1,728 12 99.306
nad6 519 4 99.229
srRNA 618a 2 99.676
lrRNA 1,326 1 99.925
782 Mol Biol Rep (2010) 37:771–784
123
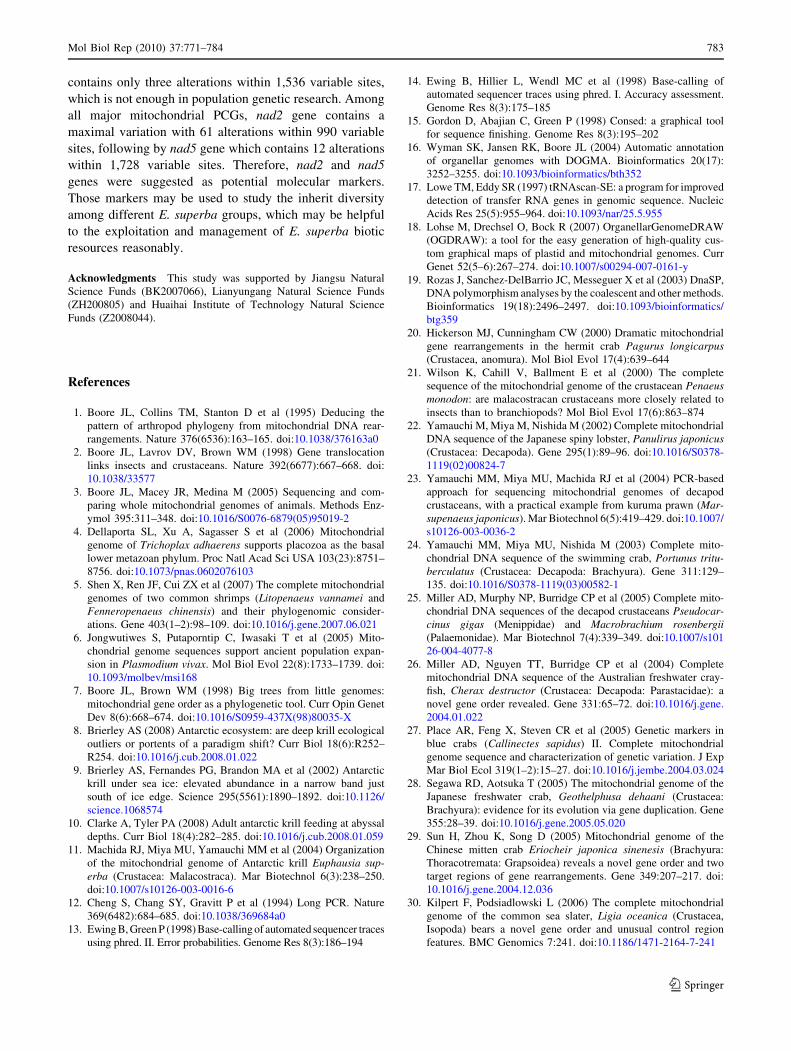
contains only three alterations within 1,536 variable sites,
which is not enough in population genetic research. Among
all major mitochondrial PCGs, nad2 gene contains a
maximal variation with 61 alterations within 990 variable
sites, following by nad5 gene which contains 12 alterations
within 1,728 variable sites. Therefore, nad2 and nad5
genes were suggested as potential molecular markers.
Those markers may be used to study the inherit diversity
among different E. superba groups, which may be helpful
to the exploitation and management of E. superba biotic
resources reasonably.
Acknowledgments This study was supported by Jiangsu Natural
Science Funds (BK2007066), Lianyungang Natural Science Funds
(ZH200805) and Huaihai Institute of Technology Natural Science
Funds (Z2008044).
References
1. Boore JL, Collins TM, Stanton D et al (1995) Deducing the
pattern of arthropod phylogeny from mitochondrial DNA rear-
rangements. Nature 376(6536):163–165. doi:10.1038/376163a0
2. Boore JL, Lavrov DV, Brown WM (1998) Gene translocation
links insects and crustaceans. Nature 392(6677):667–668. doi:
10.1038/33577
3. Boore JL, Macey JR, Medina M (2005) Sequencing and com-
paring whole mitochondrial genomes of animals. Methods Enz-
ymol 395:311–348. doi:10.1016/S0076-6879(05)95019-2
4. Dellaporta SL, Xu A, Sagasser S et al (2006) Mitochondrial
genome of Trichoplax adhaerens supports placozoa as the basal
lower metazoan phylum. Proc Natl Acad Sci USA 103(23):8751–
8756. doi:10.1073/pnas.0602076103
5. Shen X, Ren JF, Cui ZX et al (2007) The complete mitochondrial
genomes of two common shrimps (Litopenaeus vannamei and
Fenneropenaeus chinensis) and their phylogenomic consider-
ations. Gene 403(1–2):98–109. doi:10.1016/j.gene.2007.06.021
6. Jongwutiwes S, Putaporntip C, Iwasaki T et al (2005) Mito-
chondrial genome sequences support ancient population expan-
sion in Plasmodium vivax. Mol Biol Evol 22(8):1733–1739. doi:
10.1093/molbev/msi168
7. Boore JL, Brown WM (1998) Big trees from little genomes:
mitochondrial gene order as a phylogenetic tool. Curr Opin Genet
Dev 8(6):668–674. doi:10.1016/S0959-437X(98)80035-X
8. Brierley AS (2008) Antarctic ecosystem: are deep krill ecological
outliers or portents of a paradigm shift? Curr Biol 18(6):R252–
R254. doi:10.1016/j.cub.2008.01.022
9. Brierley AS, Fernandes PG, Brandon MA et al (2002) Antarctic
krill under sea ice: elevated abundance in a narrow band just
south of ice edge. Science 295(5561):1890–1892. doi:10.1126/
science.1068574
10. Clarke A, Tyler PA (2008) Adult antarctic krill feeding at abyssal
depths. Curr Biol 18(4):282–285. doi:10.1016/j.cub.2008.01.059
11. Machida RJ, Miya MU, Yamauchi MM et al (2004) Organization
of the mitochondrial genome of Antarctic krill Euphausia sup-erba (Crustacea: Malacostraca). Mar Biotechnol 6(3):238–250.
doi:10.1007/s10126-003-0016-6
12. Cheng S, Chang SY, Gravitt P et al (1994) Long PCR. Nature
369(6482):684–685. doi:10.1038/369684a0
13. Ewing B, Green P (1998) Base-calling of automated sequencer traces
using phred. II. Error probabilities. Genome Res 8(3):186–194
14. Ewing B, Hillier L, Wendl MC et al (1998) Base-calling of
automated sequencer traces using phred. I. Accuracy assessment.
Genome Res 8(3):175–185
15. Gordon D, Abajian C, Green P (1998) Consed: a graphical tool
for sequence finishing. Genome Res 8(3):195–202
16. Wyman SK, Jansen RK, Boore JL (2004) Automatic annotation
of organellar genomes with DOGMA. Bioinformatics 20(17):
3252–3255. doi:10.1093/bioinformatics/bth352
17. Lowe TM, Eddy SR (1997) tRNAscan-SE: a program for improved
detection of transfer RNA genes in genomic sequence. Nucleic
Acids Res 25(5):955–964. doi:10.1093/nar/25.5.955
18. Lohse M, Drechsel O, Bock R (2007) OrganellarGenomeDRAW
(OGDRAW): a tool for the easy generation of high-quality cus-
tom graphical maps of plastid and mitochondrial genomes. Curr
Genet 52(5–6):267–274. doi:10.1007/s00294-007-0161-y
19. Rozas J, Sanchez-DelBarrio JC, Messeguer X et al (2003) DnaSP,
DNA polymorphism analyses by the coalescent and other methods.
Bioinformatics 19(18):2496–2497. doi:10.1093/bioinformatics/
btg359
20. Hickerson MJ, Cunningham CW (2000) Dramatic mitochondrial
gene rearrangements in the hermit crab Pagurus longicarpus(Crustacea, anomura). Mol Biol Evol 17(4):639–644
21. Wilson K, Cahill V, Ballment E et al (2000) The complete
sequence of the mitochondrial genome of the crustacean Penaeusmonodon: are malacostracan crustaceans more closely related to
insects than to branchiopods? Mol Biol Evol 17(6):863–874
22. Yamauchi M, Miya M, Nishida M (2002) Complete mitochondrial
DNA sequence of the Japanese spiny lobster, Panulirus japonicus(Crustacea: Decapoda). Gene 295(1):89–96. doi:10.1016/S0378-
1119(02)00824-7
23. Yamauchi MM, Miya MU, Machida RJ et al (2004) PCR-based
approach for sequencing mitochondrial genomes of decapod
crustaceans, with a practical example from kuruma prawn (Mar-supenaeus japonicus). Mar Biotechnol 6(5):419–429. doi:10.1007/
s10126-003-0036-2
24. Yamauchi MM, Miya MU, Nishida M (2003) Complete mito-
chondrial DNA sequence of the swimming crab, Portunus tritu-berculatus (Crustacea: Decapoda: Brachyura). Gene 311:129–
135. doi:10.1016/S0378-1119(03)00582-1
25. Miller AD, Murphy NP, Burridge CP et al (2005) Complete mito-
chondrial DNA sequences of the decapod crustaceans Pseudocar-cinus gigas (Menippidae) and Macrobrachium rosenbergii(Palaemonidae). Mar Biotechnol 7(4):339–349. doi:10.1007/s101
26-004-4077-8
26. Miller AD, Nguyen TT, Burridge CP et al (2004) Complete
mitochondrial DNA sequence of the Australian freshwater cray-
fish, Cherax destructor (Crustacea: Decapoda: Parastacidae): a
novel gene order revealed. Gene 331:65–72. doi:10.1016/j.gene.
2004.01.022
27. Place AR, Feng X, Steven CR et al (2005) Genetic markers in
blue crabs (Callinectes sapidus) II. Complete mitochondrial
genome sequence and characterization of genetic variation. J Exp
Mar Biol Ecol 319(1–2):15–27. doi:10.1016/j.jembe.2004.03.024
28. Segawa RD, Aotsuka T (2005) The mitochondrial genome of the
Japanese freshwater crab, Geothelphusa dehaani (Crustacea:
Brachyura): evidence for its evolution via gene duplication. Gene
355:28–39. doi:10.1016/j.gene.2005.05.020
29. Sun H, Zhou K, Song D (2005) Mitochondrial genome of the
Chinese mitten crab Eriocheir japonica sinenesis (Brachyura:
Thoracotremata: Grapsoidea) reveals a novel gene order and two
target regions of gene rearrangements. Gene 349:207–217. doi:
10.1016/j.gene.2004.12.036
30. Kilpert F, Podsiadlowski L (2006) The complete mitochondrial
genome of the common sea slater, Ligia oceanica (Crustacea,
Isopoda) bears a novel gene order and unusual control region
features. BMC Genomics 7:241. doi:10.1186/1471-2164-7-241
Mol Biol Rep (2010) 37:771–784 783
123
31. Miller AD, Austin CM (2006) The complete mitochondrial genome
of the mantid shrimp Harpiosquilla harpax, and a phylogenetic
investigation of the Decapoda using mitochondrial sequences. Mol
Phylogenet Evol 38(3):565–574. doi:10.1016/j.ympev.2005.10.
001
32. Ivey JL, Santos SR (2007) The complete mitochondrial genome
of the Hawaiian anchialine shrimp Halocaridina rubra Holthuis,
1963 (Crustacea: Decapoda: Atyidae). Gene 394(1–2):35–44.
doi:10.1016/j.gene.2007.01.009
33. Cook CE (2005) The complete mitochondrial genome of the
stomatopod crustacean Squilla mantis. BMC Genomics 6:105.
doi:10.1186/1471-2164-6-105
34. Yang JS, Nagasawa H, Fujiwara Y et al (2008) The complete
mitochondrial genome sequence of the hydrothermal vent galat-
heid crab Shinkaia crosnieri (Crustacea: Decapoda: Anomura): a
novel arrangement and incomplete tRNA suite. BMC Genomics
9:257. doi:10.1186/1471-2164-9-257
35. Martin JW, Davis GE (2001) An updated classification of the recent
crustacea. Natural History Museum of Los Angeles County, Los
Angeles
36. Thompson JD, Gibson TJ, Plewniak F et al (1997) The CLUS-
TAL_X windows interface: flexible strategies for multiple
sequence alignment aided by quality analysis tools. Nucleic Acids
Res 25(24):4876–4882. doi:10.1093/nar/25.24.4876
37. Tamura K, Dudley J, Nei M et al (2007) MEGA4: molecular
evolutionary genetics analysis (MEGA) software version 4.0.
Mol Biol Evol 24(8):1596–1599. doi:10.1093/molbev/msm092
38. Guindon S, Gascuel O (2003) A simple, fast, and accurate
algorithm to estimate large phylogenies by maximum likelihood.
Syst Biol 52(5):696–704. doi:10.1080/10635150390235520
39. Ronquist F, Huelsenbeck JP (2003) MrBayes 3: Bayesian phy-
logenetic inference under mixed models. Bioinformatics 19(12):
1572–1574. doi:10.1093/bioinformatics/btg180
40. Posada D (2006) ModelTest server: a web-based tool for the
statistical selection of models of nucleotide substitution online.
Nucleic Acids Res 34(Web server issue):W700–W703
41. Abascal F, Zardoya R, Posada D (2005) ProtTest: selection of
best-fit models of protein evolution. Bioinformatics 21(9):2104–
2105. doi:10.1093/bioinformatics/bti263
42. Abascal F, Posada D, Zardoya R (2007) MtArt: a new model of
amino acid replacement for Arthropoda. Mol Biol Evol 24(1):1–5.
doi:10.1093/molbev/msl136
43. Ojala D, Montoya J, Attardi G (1981) tRNA punctuation model
of RNA processing in human mitochondria. Nature 290(5806):
470–474. doi:10.1038/290470a0
44. Schindel DE, Miller SE (2005) DNA barcoding a useful tool for
taxonomists. Nature 435(7038):17. doi:10.1038/435017b
45. Seifert KA, Samson RA, Dewaard JR et al (2007) Prospects for
fungus identification using CO1 DNA barcodes, with Penicillium
as a test case. Proc Natl Acad Sci USA 104(10):3901–3906. doi:
10.1073/pnas.0611691104
784 Mol Biol Rep (2010) 37:771–784
123