New insights in the evolution of Antarctic glaciation from depth conversion of well-log calibrated...
17
REVIEW ARTICLE New insights in the evolution of Antarctic glaciation from depth conversion of well-log calibrated seismic section of Prydz Bay V. Volpi M. Rebesco P. Diviacco Received: 31 January 2007 / Accepted: 6 July 2008 / Published online: 26 July 2008 Ó Springer-Verlag 2008 Abstract The understanding of the evolution of the Antarctic Ice Sheet is crucial for the comprehension of the history of past global climate. The debate regarding the age of the transition to modern ‘‘dry- and cold-based’’ ice sheet after the Neogene polythermal conditions has taken place over more than 20 years. An evident change in the geometry of the depositional systems of the Prydz Bay continental margin demarked the initiation of the Prydz Channel Fan and has been inferred to correspond to this transition. The improvement in the age placement of this change contributes to unravel the last stages of the Ant- arctic glacial history. We predicted the spatial distribution of P-wave velocity data along both dip- and strike-oriented seismic profiles that intersect 3 Ocean Drilling Program (ODP) sites on the Prydz Bay continental shelf. We used this information to assist the correlation of the existing litho- and bio-stratigraphic information among the drilling sites and to produce an accurate geometric reconstruction of the Neogene shelf units through depth-migration of the seismic data. The revised stratigraphy that we obtained suggests an early late to late early Pliocene age for the seismic reflector at the base of the Prydz Channel Fan. This age, younger than previously proposed, is consistent with the age inferred for similar geometric changes identified in different Antarctic margins. Keywords Prydz Bay Log property Seismic attributes Neogene stratigraphy Introduction The East Antarctic Ice Sheet is the longest lived and largest ice mass on Earth (Barron et al. 1991). It has played a central role in global climate, sea level change and ocean and atmospheric circulation (Cooper and O’Brien 2004). Its study complements the history of the long-term global cooling recorded in the ocean d 18 O records. On land and offshore data demonstrate that the ice sheet was subjected to major fluctuations during polythermal glacial regime in the Neogene, before the transition to the modern glacial regime, which is usually referred to as ‘‘polar’’. However, recent evidence for possible intercon- nection of modern Antarctic subglacial lakes suggests a relatively developed hydrology beneath the present ice sheet (Bingham and Siegert 2007). Nevertheless, this hydrology is supposedly much less than that existing dur- ing the short deglacial periods (Dowdeswell and Elverhøi 2002; Stokes and Clark 2001) and during the polythermal glacial regime. For simplicity we will refer hereafter to modern, polar regime as relatively cold- and dry-based with respect to previous polythermal conditions. A primary objective of offshore drilling in the Prydz Bay region, which is considered a drainage area for the earliest Cenozoic ice sheets, was to decipher the Late Eocene onset of glaciation (Barron et al. 1991; Cooper and O’Brien 2004). Nevertheless, drilling provided also evi- dence of the Neogene ice sheet fluctuations, which repeatedly eroded the continental shelf removing large parts of the sedimentary record (Barrett 1996; O’Brien et al. 2004). In the Neogene the depositional systems of the conti- nental margin show a dramatic change: shelf and slope progradation increased and focused in the middle of Prydz Bay in contrast with the earlier even distribution along the V. Volpi (&) M. Rebesco P. Diviacco Istituto Nazionale di Oceanografia e di Geofisica Sperimentale, OGS, Borgo Grotta Gigante 42/c, 34010 Sgonico (Trieste), Italy e-mail: [email protected] URL: http://www.ogs.trieste.it 123 Int J Earth Sci (Geol Rundsch) (2009) 98:1991–2007 DOI 10.1007/s00531-008-0356-6
Transcript of New insights in the evolution of Antarctic glaciation from depth conversion of well-log calibrated...

REVIEW ARTICLE
New insights in the evolution of Antarctic glaciation from depthconversion of well-log calibrated seismic section of Prydz Bay
V. Volpi Æ M. Rebesco Æ P. Diviacco
Received: 31 January 2007 / Accepted: 6 July 2008 / Published online: 26 July 2008
� Springer-Verlag 2008
Abstract The understanding of the evolution of the
Antarctic Ice Sheet is crucial for the comprehension of the
history of past global climate. The debate regarding the age
of the transition to modern ‘‘dry- and cold-based’’ ice sheet
after the Neogene polythermal conditions has taken place
over more than 20 years. An evident change in the
geometry of the depositional systems of the Prydz Bay
continental margin demarked the initiation of the Prydz
Channel Fan and has been inferred to correspond to this
transition. The improvement in the age placement of this
change contributes to unravel the last stages of the Ant-
arctic glacial history. We predicted the spatial distribution
of P-wave velocity data along both dip- and strike-oriented
seismic profiles that intersect 3 Ocean Drilling Program
(ODP) sites on the Prydz Bay continental shelf. We used
this information to assist the correlation of the existing
litho- and bio-stratigraphic information among the drilling
sites and to produce an accurate geometric reconstruction
of the Neogene shelf units through depth-migration of the
seismic data. The revised stratigraphy that we obtained
suggests an early late to late early Pliocene age for the
seismic reflector at the base of the Prydz Channel Fan. This
age, younger than previously proposed, is consistent with
the age inferred for similar geometric changes identified in
different Antarctic margins.
Keywords Prydz Bay � Log property �Seismic attributes � Neogene stratigraphy
Introduction
The East Antarctic Ice Sheet is the longest lived and largest
ice mass on Earth (Barron et al. 1991). It has played a
central role in global climate, sea level change and ocean
and atmospheric circulation (Cooper and O’Brien 2004).
Its study complements the history of the long-term
global cooling recorded in the ocean d18O records.
On land and offshore data demonstrate that the ice sheet
was subjected to major fluctuations during polythermal
glacial regime in the Neogene, before the transition to the
modern glacial regime, which is usually referred to as
‘‘polar’’. However, recent evidence for possible intercon-
nection of modern Antarctic subglacial lakes suggests a
relatively developed hydrology beneath the present ice
sheet (Bingham and Siegert 2007). Nevertheless, this
hydrology is supposedly much less than that existing dur-
ing the short deglacial periods (Dowdeswell and Elverhøi
2002; Stokes and Clark 2001) and during the polythermal
glacial regime. For simplicity we will refer hereafter to
modern, polar regime as relatively cold- and dry-based
with respect to previous polythermal conditions.
A primary objective of offshore drilling in the Prydz
Bay region, which is considered a drainage area for the
earliest Cenozoic ice sheets, was to decipher the Late
Eocene onset of glaciation (Barron et al. 1991; Cooper and
O’Brien 2004). Nevertheless, drilling provided also evi-
dence of the Neogene ice sheet fluctuations, which
repeatedly eroded the continental shelf removing large
parts of the sedimentary record (Barrett 1996; O’Brien
et al. 2004).
In the Neogene the depositional systems of the conti-
nental margin show a dramatic change: shelf and slope
progradation increased and focused in the middle of Prydz
Bay in contrast with the earlier even distribution along the
V. Volpi (&) � M. Rebesco � P. Diviacco
Istituto Nazionale di Oceanografia e di Geofisica Sperimentale,
OGS, Borgo Grotta Gigante 42/c, 34010 Sgonico (Trieste), Italy
e-mail: [email protected]
URL: http://www.ogs.trieste.it
123
Int J Earth Sci (Geol Rundsch) (2009) 98:1991–2007
DOI 10.1007/s00531-008-0356-6

shelf edge (Cooper and O’Brien 2001; Cooper and O’Brien
2004). In correspondence with a progressive landward shift
of the depocenters, from the continental rise towards the
continental slope and base of slope (O’Brien et al. 2004),
sedimentation rates progressively declined on the conti-
nental rise. These changes are inferred by Cooper and
O’Brien (2004) to correspond to the transition to the polar
ice sheet. Prior to the change in fact, temperate glaciers
eroded onshore and intermittently on the shelf, resulting in
widespread erosion of a normal water depth shelf during
lowered sea levels. After the change, glacial maxima gla-
ciers in the Lambert graben merged into a major axial ice
stream that extended far onto the continental shelf, pro-
ducing localized erosion in deep trough areas.
However, the age of the final transition to the polar ice
sheet was not entirely resolved by the stratigraphic studies
conducted for the Neogene continental shelf in the frame of
ODP Leg 188 (Erohina et al. 2004; O’Brien et al. 2004;
Handwerger et al. 2004; Whitehead and Bohaty 2003). This
age has been inferred progressively younger: from the
middle-late Miocene (Cooper and O’Brien 2001), to the
middle Miocene–Pleistocene (Cooper and O’Brien 2004), to
the late Miocene or early Pliocene (Whitehead et al. 2006).
On land evidence of Neogene ice sheet fluctuations is
provided by the Sirius Group, whose age has been under
intense debate since over 20 years. The so-called ‘‘Stabi-
lists’’ have argued that the Sirius Group predates the Dry
Valleys landscape, which is inferred to has remained stable
at least since 14 Ma, i.e. since middle Miocene (Marchant
et al. 1993, 1996; Sugden et al. 1993; Sugden 1996; Stro-
even et al. 1998; Stroeven and Kleman 1999). Conversely,
the so-called ‘‘Dynamicists’’ have argued that the ice-sheet
fluctuations, which are indicative of more temperate
(polythermal) glacial regimes than the present one, lasted
until about 2.5 Ma, i.e. the late Pliocene (Webb et al. 1984;
McKelvey et al. 2001; Wilson 1995; Harwood and Webb
1998; Hambrey and McKelvey 2000; Hambrey et al. 2003).
Whitehead et al. 2006 reviewed the Cenozoic stratigraphy
of the whole Lambert Graben and Prydz Bay region pro-
viding a general overview of temporal and spatial history
of ice sheet advance and retreat.
The aim of this work is to further contribute to the
constraining of the transition to the polar ice sheet by
producing an integrated stratigraphy of the glacial
sequences of the continental shelf in the Prydz Bay area.
For this purpose we employ an innovative technique to
predict, along seismic profiles, the distribution of log
properties (i.e. P-wave velocity) measured at three sites
of ODP Leg 188 and 119. The resulting distribution of
P-wave velocity is then used to correlate the existing lith-
ologic and biostratigraphic information. Furthermore, it is
used to produce an accurate depth-converted seismic pro-
file, which illustrates the correct geometric relationship of
the glacial sequences of the continental shelf in the Prydz
Bay area.
Geological setting
Prydz Bay is roughly triangular in outline with an east-west
baseline at the continental shelf edge and a southward
pointing apex. The southwest margin is formed by the
Amery Ice Shelf while the southeast margin of the bay is
formed by the rugged and generally north-east trending
Ingrid Christensen Coast (Stagg 1985). Prydz Bay lies at
the oceanward end of a graben, which is occupied by the
Lambert Glacier and Amery Ice Shelf (Fig. 1).
Most features of the shelf and upper slope were pro-
duced by the advance and retreat of the Lambert Glacier
and Amery Ice Shelf since late Eocene to Oligocene times
(Hambrey et al. 1991; Cooper et al. 1991a).
As the other Antarctic continental shelves, Prydz Bay
shows a number of inner shelf deeps and outer shelf banks;
it is occupied by a broad topographic basin, the Amery
Depression, which deepens landward, and by a relatively
deep trough, the Prydz Channel, that crosses the outer shelf
on the western side of the bay.
The present ice-drainage basin is believed to be long-
lived (Barron et al. 1991; Cooper and O’Brien 2004) and to
have responded to mass balance fluctuations in the interior
of the East Antarctic Ice Sheet. Leitchenkov et al. (1994)
analyzing the shelf edge progradation recognized three
main post-Oligocene events in the advance-retreat history
on the Prydz Bay shelf. They have been interpreted in
terms of till-tongue stratigraphy based on model of King
et al. (1991).
The stages of Antarctic glaciation and the pre-glacial
continental climate are inferred to be recorded in the sed-
iments of Prydz Bay (Cooper and O’Brien 2004).
During the late Neogene, the Lambert Glacier-Amery
Ice Shelf drainage system flowed across Prydz Bay in a
fast-flowing ice stream that cut Prydz Channel and
deposited a large amount of debris on the upper slope
(O’Brien et al. 2004). O’Brien and Harris (1996) inferred
that the Prydz Channel and Fan started to develop in the
early to mid-Pliocene, when the amount of ice accumu-
lating in Princess Elizabeth Land at the southeastern side of
Prydz Bay increased to the point where it deflected the flow
of the main Lambert–Amery system westward. Different
glacially formed features testify the complex glacial history
of the area. O’Brien and Harris (1996) argued that erosion
and deposition by the Lambert Glacier in Prydz Bay fell
into three zones: the inner zone where inner shelf deeps
formed by enhanced erosion in areas of thick ice due to the
maximum basal shear stress; the middle zone, underlain
by transitional marine sediments, deposited during retreat,
1992 Int J Earth Sci (Geol Rundsch) (2009) 98:1991–2007
123

both as blanket-like deposits and as grounding zone mor-
aines; the outer zone with deposition of subglacial till and
prograding continental slope deposits during full glacial
conditions.
Acoustic and physical characteristic of the seismic units
Stagg 1985 defined several acoustic units in the Prydz Bay
area. These seismic units were named from the shallowest
(PS.1) to the deepest (PS.6); units PS.1 to PS.4 are of
sedimentary type, whereas units PS.5 and PS.6 represent
the acoustic basement. Cooper et al. 1991b, based on data
acquired during ODP Leg 119, inferred that the topmost
units PS.1 and PS.2A (late Eocene/Early Oligocene-
Holocene) are constituted by glacial deposits, topset beds
and prograding sequences, respectively, deposited in front
of a grounding ice sheet. The underlying sequences are
composed by preglacial deposits (PS.2B–PS.4), by meta-
morphic rocks (PS.5) and igneous intrusive rocks (PS.6).
Many of the units identified in the area cannot be correlated
between the drilling sites, except for seismic unit PS.1,
since not all these units extend throughout the shelf
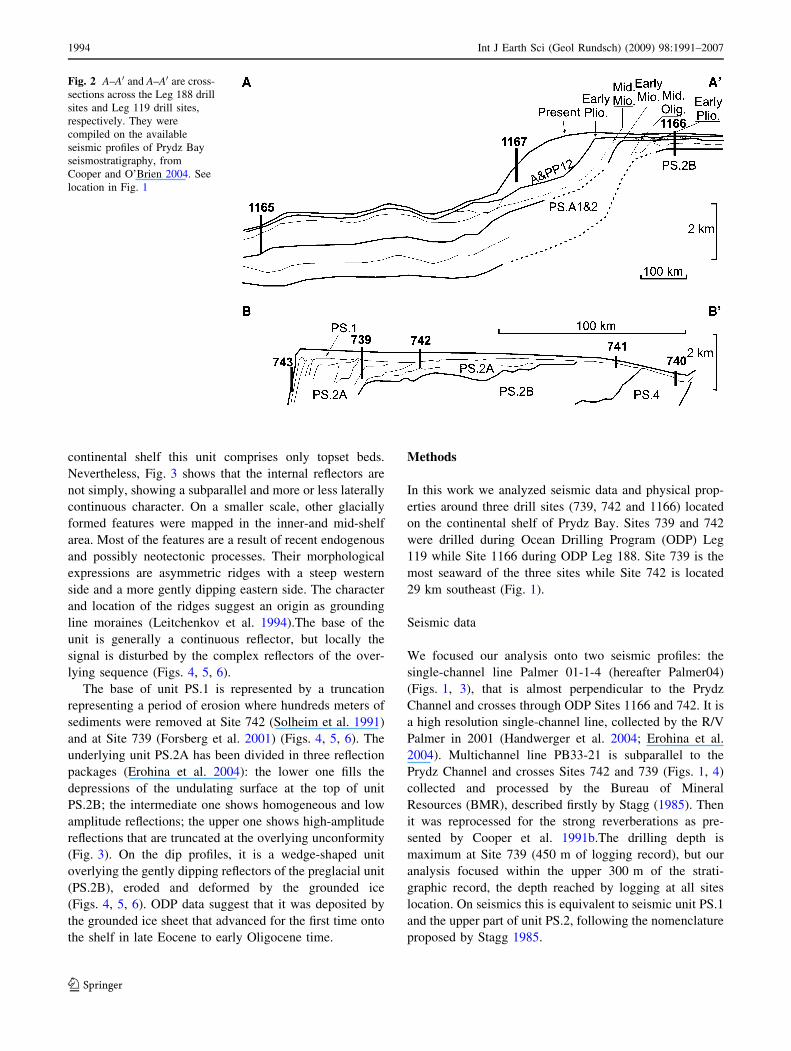
(Fig. 2).
Seismic unit PS.1 has been detected at all drill sites in
the Prydz Bay area and it extends between Neogene/
Paleogene unconformity, represented by the top of unit
PS.2A, and the seafloor (Fig. 2). At all drill sites on the
Fig. 1 Location map of the
Legs 119 and 188 related sites,
seismic profiles used in the
present paper. A–A0 and B–B0
are the two cross-sections along
the Prydz Bay area presented in
Fig. 2
Int J Earth Sci (Geol Rundsch) (2009) 98:1991–2007 1993
123
continental shelf this unit comprises only topset beds.
Nevertheless, Fig. 3 shows that the internal reflectors are
not simply, showing a subparallel and more or less laterally
continuous character. On a smaller scale, other glacially
formed features were mapped in the inner-and mid-shelf
area. Most of the features are a result of recent endogenous
and possibly neotectonic processes. Their morphological
expressions are asymmetric ridges with a steep western
side and a more gently dipping eastern side. The character
and location of the ridges suggest an origin as grounding
line moraines (Leitchenkov et al. 1994).The base of the
unit is generally a continuous reflector, but locally the
signal is disturbed by the complex reflectors of the over-
lying sequence (Figs. 4, 5, 6).
The base of unit PS.1 is represented by a truncation
representing a period of erosion where hundreds meters of
sediments were removed at Site 742 (Solheim et al. 1991)
and at Site 739 (Forsberg et al. 2001) (Figs. 4, 5, 6). The
underlying unit PS.2A has been divided in three reflection
packages (Erohina et al. 2004): the lower one fills the
depressions of the undulating surface at the top of unit
PS.2B; the intermediate one shows homogeneous and low
amplitude reflections; the upper one shows high-amplitude
reflections that are truncated at the overlying unconformity
(Fig. 3). On the dip profiles, it is a wedge-shaped unit
overlying the gently dipping reflectors of the preglacial unit
(PS.2B), eroded and deformed by the grounded ice
(Figs. 4, 5, 6). ODP data suggest that it was deposited by
the grounded ice sheet that advanced for the first time onto
the shelf in late Eocene to early Oligocene time.
Methods
In this work we analyzed seismic data and physical prop-
erties around three drill sites (739, 742 and 1166) located
on the continental shelf of Prydz Bay. Sites 739 and 742
were drilled during Ocean Drilling Program (ODP) Leg
119 while Site 1166 during ODP Leg 188. Site 739 is the
most seaward of the three sites while Site 742 is located
29 km southeast (Fig. 1).
Seismic data
We focused our analysis onto two seismic profiles: the
single-channel line Palmer 01-1-4 (hereafter Palmer04)
(Figs. 1, 3), that is almost perpendicular to the Prydz
Channel and crosses through ODP Sites 1166 and 742. It is
a high resolution single-channel line, collected by the R/V
Palmer in 2001 (Handwerger et al. 2004; Erohina et al.
2004). Multichannel line PB33-21 is subparallel to the
Prydz Channel and crosses Sites 742 and 739 (Figs. 1, 4)
collected and processed by the Bureau of Mineral
Resources (BMR), described firstly by Stagg (1985). Then
it was reprocessed for the strong reverberations as pre-
sented by Cooper et al. 1991b.The drilling depth is
maximum at Site 739 (450 m of logging record), but our
analysis focused within the upper 300 m of the strati-
graphic record, the depth reached by logging at all sites
location. On seismics this is equivalent to seismic unit PS.1
and the upper part of unit PS.2, following the nomenclature
proposed by Stagg 1985.
Fig. 2 A–A0 and A–A0 are cross-
sections across the Leg 188 drill
sites and Leg 119 drill sites,
respectively. They were
compiled on the available
seismic profiles of Prydz Bay
seismostratigraphy, from
Cooper and O’Brien 2004. See
location in Fig. 1
1994 Int J Earth Sci (Geol Rundsch) (2009) 98:1991–2007
123

Other seismic lines were interpreted in this work: Line
PB33-23 (subparallel to and further west of the PB33-21,
crossing only Site 739, Figs. 1 and 5), and Line 32002,
acquired within the 32nd and 33rd Soviet Antarctic
Research Expedition, from 1986 to 1988 (Kuvaas and
Leitchenkov 1992). As part of this work, the field data of
this seismic profile, courtesy by German Leitchenkov, were
stacked (24-fold stack of common depth-point gathers
spaced 25 m apart) (Fig. 6).
The data processing includes the application of the
‘‘amplitude recovery technique’’ which is crucial for the
following phases of the analysis. Seismic and log correla-
tion is very sensitive to the amplitude of the signal so
whenever possible the data should be processed taking into
account this peculiarity. In this work raw seismic data were
available only for the Line 32002. The method applied
consists firstly in determining an arbitrary exponential gain
function, with the only objective of having signals that can
Fig. 3 Single trace seismic profile Palmer04 (shot 2400–5300)
perpendicular to the Prydz Channel (from Erohina et al. 2004)
crossing Sites 742 and 1166, with the interpreted version. In the close
up it is visible the very continuous reflector close to the base of PS.1
that actually lies above the PS.1 base sampled in Site 742
Fig. 4 BMR PB33-21
multichannel seismic profile,
sub-parallel to the Prydz
Channel crossing Sites 739 and
742. See the text for further
details on the seismic data. The
seismic stratigraphy is from
Cooper et al. 1991
Int J Earth Sci (Geol Rundsch) (2009) 98:1991–2007 1995
123

be used in the following velocity analysis. An initial
velocity model is calculated and the amplitude loss due to
spherical divergence is corrected. The data are then sub-
jected to the processing steps till a final model of velocity
is obtained. This velocity model is used to calculate the
exact amplitude correction. At this point the data are pro-
cessed obtaining the final stack section.
Traces have been deconvolved before stack. Accurate
velocity analyses were conducted and the resulting velocity
functions were applied in the F–k filtering (multiple
attenuation) before the final stacking.
Well information
The physical property analyzed in this work is the P-wave
velocity. It was chosen because it is the only property that
was measured at all drill sites. The most reliable data are
provided by downhole logging. They provide continuous
and rather uniform velocity profiles from the top to the
bottom of the three holes. After a carefully editing phase,
we verified that, except for some occasional spikes, the log
is not particularly affected by noise or other effects due to
the conditions of the hole as also reported in the Shipboard
Scientific Party (1989d, 2001a, b) site related chapters.
In particular, P-wave velocity log measured at Site 1166
spans from 30 to 367 mbsf (meters below seafloor). The
data were acquired using a DSI (Dipole Shear Imagery)
sonic tool (Shipboard Scientific Party 2001a, b).
Sonic log velocity measured at Sites 739 and 742 were
obtained using the LLS (Long Spaced Sonic) tool (Ship-
board Scientific Party 1989a).
The first 30 mbsf were not measured by the logging
instruments so we integrated the velocity curve with core
data. To do this, we employed an iterative process in which
we initially assumed the correspondence between coring
and logging depths. Subsequently, a synthetic seismic trace
has been generated using P-wave log data and a constant
density of 1 g/cm3. The assumption of a constant density
Fig. 5 BMR PB33-23 multichannel seismic profile, sub-parallel to the Prydz Channel, oriented NE–SW. The location of Site 739 lies with
3.75 km offset from the line and it was projected on the seismic profile
Fig. 6 Multichannel line
32002, collected during a Soviet
Antarctic Expedition. The line
is oriented NW–SE, 50 m away
from Site 739. The data was
processed as part of this work.
Details are provided in the text
1996 Int J Earth Sci (Geol Rundsch) (2009) 98:1991–2007
123

value has been necessary since core density measurements
are unreliable at Sites 742 and 1166 due to bad hole con-
ditions or not recorded at all as at Site 739 (Shipboard
Scientific Party 2001a, b, 1989a, b). The synthetic seismic
trace was then compared with a trace resulting from the
average of three seismic traces extracted around the well
locations. A time-depth function has hence been calculated
to maximize the correlation between the two traces.
Finally, such function has been used to re-locate and
re-calibrate the logs in time.
Multi-attribute analysis
The prediction of petrophysical parameters (P-wave
velocity in the case of this work) along seismic profiles
(BMR 33-21 and Palmer04) has been performed using a
commercial software (Hampson–Russell EMERGETM
software package, Calgary, Canada). The program was
designed principally for use in hydrocarbon basins with
good acoustic continuity, unlike the examined Antarctic
shelf sections. For this reason we considered the resulting
prediction in a qualitative and not in a quantitative way.
Besides well-logs, that we employed in this work, core logs
or laboratory measurements on core samples may normally
be used to extract the petrophysical parameters that serve
as input for the prediction. To tie the seismic data to well-
logs we manually calibrated the logs to the seismic traces.
The technique used for this point is of wavelet extraction
and correlation. We extracted the wavelet from the seismic
data using e-Log program (Hampson–Russel). The internal
algorithm operates by finding the operator which, when
convolved with the reflectivity from the wells, closely
approximates the nearby seismic traces. The result was a
150 ms mixed phase wavelet with a taper length of 20 ms.
A stretch was then applied to the logs in order to maximize
the correlation between the seismic trace and the velocity
curve. The result of this fine stretching procedure yielded
to the generation of the adopted time–depth relationship. A
statistical correlation was then calculated among time
series of the petrophysical parameter (P-wave velocity) and
a number of time series of seismic attributes, extracted
from the seismic profiles crossing the boreholes. By
applying the best-fit correlation, a 2D section of the pre-
dicted distribution of the petrophysical parameter along the
seismic profile was obtained (Fig. 7a, b). The outline of the
procedure is the following: (1) a representative seismic
Fig. 7 Predicted spatial distributions of P-wave velocity obtained
extrapolating the velocity log measured at Sites 739 and 742 along the
tie seismic profile PB33-21 (a) and at Sites 742 and 1166 along the
Palmer04 profile (b). The two profiles are perpendicular one each
other allowing a 2D image of the lateral velocity variation along the
investigated area of the Prydz Bay shelf
Int J Earth Sci (Geol Rundsch) (2009) 98:1991–2007 1997
123

trace at each well location is obtained averaging a few
traces near the well; (2) starting from the trace, a set of
seismic attributes is derived, according to Taner et al.
(1979), considering the conventional seismic trace as the
real component of a complex trace. The basic attributes are
instantaneous amplitude, instantaneous phase, and instan-
taneous frequency. However, many additional attributes
can be derived from these (Barnes 1998). (3) A linear
regression is performed between pairs of seismic attributes
and petrophysical parameters in order to find a linear
relationship:
y ¼ aþ bx
where x is the independent variable (target petrophysical
parameters), y is the dependent variable (seismic attribute);
a and b are two constants determined by the regression. In
multiple-attribute analysis the target petrophysical param-
eter is modeled as a linear combination of several seismic
attributes. In the equation above, all terms are replaced by
matrixes. Because the linear relationships are often not
satisfactory, polynomial relationships with progressively
higher order can be used. (4) Different polynomials are
computed for an increasing number of seismic attributes.
(5) For each computed polynomials, the prediction error is
calculated as the root-mean square difference between the
actual value (that is the target log property) and the pre-
dicted value. (6) A ranking of polynomials is produced
according to decreasing errors, and a choice is made of
which number of attributes most significantly predicts a
given petrophysical parameter. (7) The chosen relationship
is then used to invert the seismic signal and predict the
spatial distribution of the petrophysical parameter along the
entire seismic section.
Seismic attributes analysis characterizes the internal
structure of the sediments in terms of physical properties,
with more details than what can be obtained by conven-
tional interpretation of seismic profiles (amplitude plot).
With multiple-attribute analysis, at each time sample of the
seismic profile the target log is modeled as a linear com-
bination of several attributes (available within the Emerge
software). The aim of this method is to use the seismic data
to predict the theoretical log at every CDP location in the
seismic profile. To do this we summed three traces around
the well locations and found a relationship between the
seismics at those locations and the measured logs. The
derived relationship is assumed to be valid for every trace
of the section and is consequently applied to the entire
dataset. We used two wells for the two seismic profiles:
wells 739–742 for line PB33-21, wells 742 and 1166 for
line Palmer04. We specified a time window for each log in
order to focus the prediction only where the data are con-
strained by the log measurements that is from the seafloor
to 1,000 ms (TWT). The average prediction error and the
number of attributes used for the prediction are shown in
Table 1.
Results
P-wave velocity distribution
From Site 742 to Site 739:
The overall distribution of P-wave velocity along line
PB33-21 shows that values are generally higher around Site
742 than around Site 739, in other words there is a ten-
dency of decreasing velocity moving seaward (Fig. 7a).
The upper part of the section (to about 680 ms depth)
shows an alternation of interfingering low velocity layers,
with values ranging from *1.9 to *2.2 km/s around Site
739 and from *2 to *2.3 km/s around Site 742. A sig-
nificant variation in velocity occurs deepward and has a
correspondence in the logs of both drill-sites. This anomaly
is a thin low velocity layer with values of *1.9 km/s at
*690 ms around Site 739 and of *2.0 km/s at *700 ms
around Site 742. Just below, a laterally continuous high
velocity unit characterized by values of *2.5 km/s extends
down to *735 ms. Further below, the seaward dipping
character of the reflectors results in different sections
drilled at the two sites, without direct correlation. The
velocity ranges from about *1.9 to *2.5 km/s and over,
broadly downward increasing, but with some minor
inversions in the trend.
From Site 742 to Site 1166:
The overall distribution of P-wave velocity along line
Palmer04 shows that values are generally similar at both
Site 742 and 1166, or slightly higher in the latter, which is
closer to the Prydz Channel (Fig. 7b). The upper part of the
section (to about 680 ms in Site 742 and 740 ms in Site
1166) shows a generally downward increasing trend of the
velocity values, from *2.0 to *2.4 km/s. At about
110 ms below the seafloor in both drill-sites, a significant
decrease corresponds to a continuous low velocity layer
with values of *2.0 km/s. Below this, the velocity values
increase to *2.5 km/s. However, this high velocity layer is
much thicker in Site 742 (from about 700 to about 735 ms
Table 1 Number of seismic attributes considered in the multi-attri-
bute analysis (see text for details) and the average error calculated at
each well location between the predicted and the original logs
Dataset Seismic attributes Prediction error (km/s)
PB 33-21 4 0.3
Palmer04 5 1.4
1998 Int J Earth Sci (Geol Rundsch) (2009) 98:1991–2007
123

depth) with respect to Site 1166 (from about 780 to about
795 ms depth). The upper part of this layer is missing in
the site closer to the Prydz Channel and apparently eroded
by the overlying unconformity. Below this layer, a low
velocity unit characterized by values between *1.9 and
*2.3 km/s is also thicker at Site 742 (between about 735
and 815 ms) with respect to Site 1166 (between about 780
and 820 ms). Velocity values in excess of *2.5 km/s are
found below 820 ms in both sites.
Depth conversion
The P-wave velocity field calculated from the seismic
attribute analysis for seismic profile PB33-21 has been used
to perform the depth migration (Fig. 8). We used the
velocity field obtained from the seismic attribute analysis
because it is very accurate providing detailed information
on the lateral velocity variation between wells along the
seismic line. Moreover, the logging measurements of
P-wave velocity represent a realistic velocity model for
depth migration Generally, migration is a process that
locates reflectors in their sub-surface correct position
allowing a true reconstruction of the seismic stratigraphy
along the considered profile.
Depth migration was performed on seismic line BMR
PB33-21 availing of the Paradigm GEODEPTH software
using the velocity model of Fig. 7a.
The velocity model produced by the EMERGE Hampson–
Russel software needed some pre-processing adjustments in
order to make it amenable to the migration process. The
problem encountered comes from the fact that EMERGE
does not provide velocity values along the water column
where obviously no log measurements exist. Therefore,
a constant value of 1,500 m/s was assigned to the water
layer.
On seismic line PB 33-21 the seafloor morphology
presents a ridge with a relief of about 30 m around Shot
2150. It is a structure that has its top at about 420 m with a
NNW steep side. The same structure was recognized along
other seismic profiles crossing the area (Figs. 4, 5, 6). In
correspondence of this ridge, there are three velocity
changes which have a correspondence in the time section:
(1) the presence of the ridge itself results in higher velocity
(with respect to the area just NNW of it, where only water
is present); (2) the interfingering of low velocity layers
occurs in the uppermost strata (Fig. 7a); (3) a change in
thickness of the high velocity unit at about 700 ms depth,
which is thicker NNW of the ridge. Migration took into
account these changes in reconstructing the geometric
relationships of the seismostratigraphic boundaries.
The migrated profile (Fig. 8) provides an image that is
clearer than the time section. In particular, this image
precisely illustrates the ‘‘three reflections’’ set at the base of
Unit PS.1. This set includes, from the base of PS.1
upwards: (1) a gently SSE-dipping negative-phase (white)
reflection at about 160 mbsf at Site 739 (purple reflector in
Fig. 8), which is terminated by erosional truncation in
correspondence of the ridge, without reaching Site 739; (2)
a negative-phase (white), concave reflection (red reflector
in Fig. 8), continuous between Sites 739 (about 130 mbsf)
and 742, but with varying amplitude as a consequence of
the tuning effect (Widess 1973; Sheriff 1977) produced
by the interaction with the adjacent reflections; 3) a
continuous, concave negative-phase (white) reflector
Fig. 8 Depth migrated version
of seismic profile PB33-21
across Sites 742 and 739. The
velocity field used for the depth
migration is the one obtained by
the multi-attribute analysis,
shown in Fig. 7a
Int J Earth Sci (Geol Rundsch) (2009) 98:1991–2007 1999
123

(green reflector in Fig. 8) at about 115 mbsf (clearly above
the base of unit PS.1 sampled in Site 742 (Fig. 3), which
tops the underlying very continuous positive (black) phase.
Integrated stratigraphy
The scientific results of ODP Leg 119 contributed sig-
nificantly to the definition of Prydz Bay stratigraphy,
analyzing seismic stratigraphy (Cooper et al. 1991a),
lithofacies (Hambrey et al. 1991), geotechnical properties
(Solheim et al. 1991), geophysical logs (Ollier and Mathis
1991), bio- and magnetic-stratigraphy (Baldauf and Barron
1991). Most of these works were aimed at deciphering the
onset of glacial continental climate and the initial devel-
opment of the ice sheet up to the early Neogene (Shipboard
Scientific Party 1989d).
ODP Site 1166 drilled during Leg 188 provided an
additional record on the shelf, illustrating in particular the
transition from East Antarctic preglacial to glacial condi-
tions (Shipboard Scientific Party 2001a,b). As for the
Cenozoic history of the shelf, a stratigraphic correlation
between Sites 742 and 1166 was proposed by Erohina et al.
(2004), supported by synthetic seismograms (Handwerger
et al. 2004). A comparison between Quaternary and Plio-
cene diatom biostratigraphy of Site 742 and 1166 was also
provided (Whitehead and Bohaty 2003). However, none of
these works considered in detail the information provided
by Site 739. Seismo-stratigraphic correlation of Sites 739,
1166 and 742 was considered only in a few general works
aimed at reconstructing the Plio-Quaternary history of the
Prydz Channel Fan (O’Brien et al. 2004) or depicting the
transition in the glacial history of the Prydz Bay (Cooper
and O’Brien 2004).
Recently, a review of the Cenozoic stratigraphy and
glacial history of the Lambert Graben and Prydz Bay
region has been synthesized from previous works (White-
head et al. 2006).
In this work we propose a detailed stratigraphic frame-
work resulting from data integration of Sites 739, 1166 and
742 (Fig. 9). It complements and refines the broad review
provided by Whitehead et al. (2006).
This framework recognizes 5 units within the topset
beds of seismic units PS.1 and the first units within PS.2. In
spite of the lateral variability shown in detail by the three
sites, the four upper units may be correlated along the
seismic profiles with the aid of log (P-wave velocity),
lithologic and age information.
UNIT A
The uppermost unit (upper few meters) consists of soft
Quaternary sediments (diatomaceous sand silt and dia-
micton) on top of the underlying firmer diamictites
(Fig. 9). This unit corresponds to lithologic unit IA in Site
1166 and I in Sites 742 and 739 (Shipboard Scientific Party
1989b, c, 2001a, b), and lies within seismic unit PS.1 of
Stagg (1985). It is not logged and not resolved in the
seismic profiles (Figs. 3, 4), though may be considered to
be represented by the low velocity layer within the seafloor
reflection (Figs. 7a, b).
UNIT B
The underlying unit, 60–110 m thick, consists of a homo-
geneous poorly sorted diamictite (Shipboard Scientific
Party 1989b, c, 2001a, b). It lies within seismic unit PS.1
and corresponds to lithologic unit IB in Site 1166 (Cores
1R to 12R, 3–106 mbsf), to unit II in Site 742 (Cores 2R to
14R, 5–115 mbsf), and to the upper part of the upper half
of unit II in Site 739 (Cores 4R to 10R, 24–80 mbsf). In
Site 739 this unit was not subdivided from the underlying
sediments because the poor core recovery in the upper
100 m (about 15%) prevented sample of the boundary. We
set the base of this unit at 80 mbsf, where logging data
recorded a change in lithology (Shipboard Scientific Party
1989b). This unit is characterized by relatively low P-wave
velocities around 2.2 km/s (Fig. 9) showing a certain
amount of variability within a downward trend that overall
is constant or slightly increasing. A fair degree of lateral
variability within this unit is suggested by the seismic data
showing discontinuous reflectors and channel-like features
(Figs. 3, 4). These features and the erosional truncations
are even more evident in the ‘‘depth-geometry’’ of the
migrated seismic profile (Fig. 8). Such lateral variability is
represented by the interfingering of low velocity layers
within the spatial distribution of P-wave velocity (Figs. 7a,
b). The age of this unit is late Pliocene to Quaternary in
both Sites 1166 and 742. It may well be the same in Site
739, where the stratigraphic placement is ‘‘tentative at
best’’ (Shipboard Scientific Party 1989b). The only three
valid samples there suggest a maximum age of late Plio-
cene (2R-CC), no older than early Pliocene (8R-CC) and
late Miocene or younger (10R-CC).
UNIT C
The underlying unit, 16(?)–30 m thick, is a stratified,
lithologically variable unit (Fig. 9). This internal variabil-
ity, combined with the moderate recovery (less than 50%
on average) resulted in appreciable differences in the three
sites. It lies within seismic unit PS.1 and corresponds to
lithologic unit IC in Site 1166, to unit III in Site 742, and to
the lower part of the upper half of unit II in Site 739
(Shipboard Scientific Party 1989b, c, 2001a, b). In partic-
ular: in Site 1166 the recovered part of unit IC is only 4 m
thick (Core 13R, 113–117 mbsf), but its top and base were
2000 Int J Earth Sci (Geol Rundsch) (2009) 98:1991–2007
123

not recovered. This unit may actually be up to 16 m thick
if the whole interval between the recovered parts of the
adjacent units is considered. It consists of two diatoma-
ceous clayey silt beds (about 15 and 60 cm thick) and
interbedded diamictites, dated to the upper Pliocene on the
basis of diatom biostratigraphy. In Site 742 four subunits
were ascribed to unit III, for a total thickness of 19 m
(within Cores 14R to 16R, 115–134 mbsf) (Shipboard
Scientific Party 1989c). Subunit IIIA is 12.5 m thick and
consists of weakly to moderately stratified diamictite.
Subunit IIIB is a 60 cm thick diatomaceous clayey silt bed
of late early Pliocene to early late Pliocene age. Subunit
IIIC is a 5.4 m thick weakly stratified diamictite similar to
subunit IIIA. Subunit IIID is a 70 cm thick boulder. In Site
739 this unit did not achieve recognition as a separate
subunit within unit II due to the poor recovery (about 5%).
It is 30 m thick (Cores 11R to 13R, 80–110 mbsf). As far
as it is known from the scarce samples and logging data,
this lithology consists of stratified diamictite with inter-
bedded sandy sediments with up to 25% diatoms of an
imprecisely determined Pliocene age. In all three sites this
unit is characterized on the logging data by a low velocity
layer with P-wave values lower than *1.9 km/s (Fig. 9).
This unit corresponds to the apparently continuous low
velocity layer at about 110 ms below the seafloor shown by
the spatial distribution of P-wave velocity (Figs. 7a, b).
The fair lateral continuity of this unit, locally interrupted
likely by erosion soon after deposition, would be also
suggested by the nearly continuous reflection that is clearly
seen in the seismic profiles (Figs. 3, 4). However, rather
than corresponding to a single layer, this strong complex
reflection may be caused by the composite effects of thin
and variable thickness interlayered soft and hard layers
(Erohina et al. 2004). It is also clear from the high reso-
lution profile Palmer 04 that the very continuous reflector
close to the base of PS.1 actually lies above the PS.1 base
sampled in Site 742 (Fig. 3). The reflector representing
this unit is marked as ‘‘C’’ in the depth profile of Fig. 8.
Evaluating the biostratigraphic evidence in the three sites,
we assign a generic late Pliocene age to this unit. In par-
ticular, the upper of the two diatomaceous beds in Site
1166 is dated to 1.8–2.0 to 2.1–2.5 Ma and correlates to
subunit IIIB of Site 742 (Whitehead and Bohaty 2003). The
lower diatomaceous bed in Site 1166, possibly separated
Fig. 9 The proposed reviewed Neogene stratigraphy along the continental shelf of the Prydz Bay region, obtained integrating P-wave velocity
logs, lithologic and biostratigraphic information from the ODP Sites 1166, 742 and 739
Int J Earth Sci (Geol Rundsch) (2009) 98:1991–2007 2001
123

from the upper one by a disconformity, is dated to 2.5–2.7
to 2.7–3.2 Ma, whereas older Pliocene strata appear to be
disconformably absent from Site 742. In Site 739 no
sample was available from Core 11R, whereas Core 12 R
contained a Quaternary diatom assemblage considered
downhole contamination (Shipboard Scientific Party
1989b). An early Pliocene diatom assemblage age was
initially suggested for Core 13R, which recovered 1.75 m
within the 106–115 mbsf interval. However, the early
Pliocene interval belonging to Neogene Southern Ocean
diatom (NSOD) zone 14–15 was clearly stated to occur
beneath the recovered part of Core 13R, and precisely at
111 mbsf (Shipboard Scientific Party 1989b; Baldauf and
Barron 1991). The age of this unit in Site 739 is hence
reasonably regarded as late Pliocene, in agreement with the
other sites.
UNIT D
The underlying unit, 12–38 m thick (Fig. 9), consists of
highly compacted diamictite (Shipboard Scientific Party
1989b, c, 2001a, b) that recorded preconsolitation stresses
of about 7,000 kPa (Solheim et al. 1991). It lies within
seismic unit PS.1 and corresponds to lithologic unit ID
(Cores 14R to 15R, 123–135 mbsf) in Site 1166, to unit IV
(Cores 16R to 20R, 134–172 mbsf) in Site 742 and to the
upper part of the lower half of unit II (Cores 14R to 17R,
110–140 mbsf) in Site 739. At Sites 1166 and 742 this is
the lowermost unit within PS.1, but not in Site 739. In Site
739 we set the base of this unit at 140 mbsf, in corre-
spondence of the erosional unconformity (load event 2)
determined on the base of consolidation tests (Solheim
et al. 1991). A small but distinct peak in the water content
was inferred to indicate a lithologic change in this interval,
an observation which was further supported by a change in
clast content and in undrained shear strength. In particular,
load event 2 was placed at the top of a thin layer of
apparently more fine-grained sediments that could repre-
sent the erosional remnants of a more distal (interstadial)
sediment (Solheim et al. 1991).This unit is characterized by
a high P-wave velocities, around 2.5 km/s (Fig. 9). This
high velocity unit is rather continuous along both dip and
strike profiles (Fig. 7a, b). However at Site 1166 it is much
thinner and eroded by the overlying unconformity
(Fig. 7b). The geometry of this unit in the depth profile is
represented by the concave reflection (red reflector) with
variable amplitude (Fig. 8). No biostratigraphic control
was provided by either Sites 1166 and 742. The age of this
unit is early Pliocene on the basis of Site 739 evidence. In
this site in fact, this unit lies within the early Pliocene
NSOD zones 14 to 15 (111–127 mbsf) and above early
Pliocene NSOD zone 12 from Core 18R downward
(Baldauf and Barron 1991).
UNIT E
The lowest unit, 34 m thick (Fig. 9), is present only in Site
739, where it lies just above the base of seismic unit PS.1,
in the lower half of lithologic unit II (Cores 18R to 24R,
140–174 mbsf).). It consists of very highly compacted
diamictite (Shipboard Scientific Party 1989b) that recorded
preconsolitation stresses of about 8,000 kPa and was
deposited in a more distal position with respect to the
overlying diamictite (Solheim et al. 1991). This unit is
characterized by a high P-wave velocities, around 2.5 km/s
(Fig. 9). It is gently SSE-dipping and terminates (by ero-
sional truncation) against the ridge around Shot 2150 on
line PB33–21, without reaching Site 742 (Figs. 7a, 8). Two
sub-units non resolvable on the seismic record may tenta-
tively be distinguished on the basis of the diatom contents:
the early Pliocene E1 with up to 25% diatoms in Cores 18R
to 19R belonging to NSOD zone 12 (Shipboard Scientific
Party 1989b; Baldauf and Barron 1991); the late Miocene
E2 with no or few diatoms in Cores 20R to 24R (Shipboard
Scientific Party 1989b; Baldauf and Barron 1991).
Older units
The underlying units lie within the prograding seismic unit
PS.2 and are essentially different from site to site. In
general these units are progressively older from Site 739, to
742, to 1166. Lower Oligocene glacial diamictite units III
to V were sampled at Site 739 (Barron et al. 1991). Glacial
diamictite units V and VI of Site 742 lie below the sedi-
ments sampled in Site 739, and are hence inferred to be
Eocene or earliest Oligocene in age (Barron et al. 1991).
Site 1166 drilled an older section than Site 742, and most
units sampled either do not extend between the two sites
(Erohina et al. 2004). In particular, Site 1166 sampled
glacial sediments within late Eocene to early Oligocene
glaciomarine proglacial unit II and late Eocene glacioflu-
vial deltaic unit III, whereas pre-glacial sediments were
sampled in late Cretaceous lagoonal unit IV and in Creta-
ceous low-relief alluvial plain unit V (Cooper and O’Brien
2004; Erohina et al. 2004).
Comparison with Lambert Graben and Prydz Bay
region–Cenozoic stratigraphy
The reviewed Neogene stratigraphy that we obtained by
integration of seismic, logging, lithologic and biostati-
graphic data of three shelf sites, essentially differs from
previous stratigraphies in the treatment of unit II of Site
739 and its correlation to Site 742 and hence Site 1166.
However, previous stratigraphic reconstructions never
attempted a direct correlation of these 3 crucial sites,
and were not assisted by an estimation of the spatial
2002 Int J Earth Sci (Geol Rundsch) (2009) 98:1991–2007
123

distribution of the logging properties and by a careful
geometric reconstruction of the lithologic units along
depth-migrated seismic profiles. Among the factors that
prevented a correct stratigraphy of Site 739 we recognize:
(1) the poor recovery in the upper 100 mbsf that precluded
the sampling and hence the definition of different facies.
These different facies were correctly identified within unit
II by logging information, but were unfortunately not
recognized by the seismic interpretation (Ollier and Mathis
1991); (2) initial errors in the age placement, even after
they were already corrected in the scientific results volume
(e.g. the age placement of loading event II of Solheim et al.
1991; see below); (3) some lack of update in the scientific
literature with regards to the evolution of the biostrati-
graphic zonations (e.g. the NSOD zone 12 was ascribed to
the late Miocene at the time of the scientific results volume,
but later assigned to the early Pliocene. However, sedi-
ments within that zone and originally place in the late
Miocene have been referred to that age until recently).
The detailed Neogene stratigraphy that we propose for
the Prydz Bay shelf essentially fits within more general
review of the Cenozoic stratigraphy of the Lambert Graben
and Prydz Bay region synthesized by Whitehead et al.
(2006). A comparison between the two stratigraphies sup-
ports, complements and refines the latter.
In our stratigraphy (Fig. 9) the units are named A to E
downsection. In that of Whitehead et al. (2006) 4 main
types of events are independently numbered in chrono-
logical order from the oldest. These main types of events
include: terrestrial deposits (T), marine deposits (M), ero-
sional unconformities (E), ice loading events (L).
The general consistency between the two stratigraphies
(Table 2) is suggested by the almost one-to-one match of
the units (and their relative boundaries) of our stratigraphy
to those of Whitehead et al. (2006).
The general Neogene glacial history for the Prydz Bay
shelf that is supported by both stratigraphies is the
following:
• Post-late Eocene—early Oligocene multiple glacial
advance;
• Miocene (to Early Pliocene) deposition of glaciomarine
sediments;
• Erosion of Prydz Bay Channel and initiation of the
Prydz Channel Fan;
• Late Pliocene to early Pleistocene multiple glacial
advances and deposition of glaciomarine sediments.
• The discrepancies, inherent in the incomplete and often
poorly dated records, lead to interesting considerations
and refinements.
• Post-Oligocene deposition occurred in Late Miocene
time (our unit E2). No evidence exists on the shelf for
Middle Miocene deposits. Miocene was sampled only
in Site 739. There, samples from Core 25R to 38R
downward were assigned an earliest Oligocene age, and
Cores 23R–24R were placed in the late Miocene,
though no samples were unfortunately available from
Core 24R (Shipboard Scientific Party 1989b; Baldauf
and Barron 1991; Barron et al. 1991). The first post-
Oligocene deposits on the shelf are hence the late
Miocene glaciomarine sediments (our unit E2), which
correspond to unit M6 of Whitehead et al. 2006
(Table 2). This fact does not necessarily discount a
possible Mid Miocene age for the widespread post-
Oligocene erosion surface (Base of seismic unit PS.1 in
Figs. 8, 9; surface E2 of Whitehead et al. 2006).
Table 2 Comparison between Neogene stratigraphy presented in this work and the one proposed by Whitehead et al. 2006
Neogene Prydz Bay shelf stratigraphy (this work) Cenozoic stratigraphy of the Lambert Graben and Prydz
Bay region (Whitehead et al. 2006)
Unit Proposed age Event Proposed age
A Quaternary M16–17 Holocene–late Pleistocene
Glacial erosion Late? Pleistocene E8 Late? Pleistocene
B Late Pliocene to Pleistocene L8 Early Pleistocene
Sharp, irregular, deformed contact in 742 Late Pliocene to early Pleistocene E7 Late Pliocene–early Pleistocene
C Late Pliocene (M9) M10–M11 Late Pliocene–early Pleistocene
Loading event III of Solheim et al. (1991), p. 12 Early late Pliocene L5 Early to late Pliocene
D Early Pliocene M8 Early Pliocene (NSOD 14-15)
Loading event II of Solheim et al. (1991) Early Pliocene E4, L4 (Late Miocene to) early Pliocene
E1 Early Pliocene (NSOD 12) M7 Early Pliocene (NSOD 12)
E1/E2 boundary Late Miocene E3 Late Miocene
E2 Late Miocene M6 Late Miocene
Base of PS.1 Post-early Oligocene E2 Post-late Eocene–Early Oligocene
Int J Earth Sci (Geol Rundsch) (2009) 98:1991–2007 2003
123

• The late Miocene glaciomarine sediments unit E2 (M6
of Whitehead et al. 2006) unconformably overlie the
post-Oligocene erosion surface (E2 of Whitehead
et al. 2006) and may be overlain by an erosion
surface. This erosion should correspond to that
produced by the late Miocene regional glacial
advances and identified as E3 by Whitehead et al.
(2006), which in this case would post-date the late
Miocene glaciomarine sediments in Prydz Bay
(Table 2) and likely also those in the Pagodroma
Group (Whitehead et al. 2003, 2004). This is possible
since the age ranges of the sediments (M6) and of the
erosion surface (E3) have been estimated to be very
similar, between 10.7–8.5 Ma and 10.7–9 Ma, respec-
tively (Whitehead et al. 2006).
• The late Miocene erosion (our E1/E2 boundary; E3
surface of Whitehead et al. 2006) is overlain by a
glaciomarine unit (our E1) dated to the early Pliocene
(NSOD zone 12), which in turn is overlain by an
evident erosion surface (our D/E1 boundary, Figs. 8,
9). This surface in Sites 742 and 1166 coincides with
the base of seismic sequence PS.1 (Stagg 1985),
since it eroded the early Pliocene-Miocene record of
glacial advances and deposition on the shelf. D/E1
boundary was produced by the glacial advance
accompanied by sediment compaction identified as
load event II by Solheim et al. (1991). It should
hence correspond to surface E4 of Whitehead et al.
(2006), which in this case would post-date the early
Pliocene sediments placed within NSOD zone 12
(Table 2). Load event II, placed by Solheim et al.
(1991) at 140 mbsf in Core 17R of Site 739, was
attributed to the late Miocene because the samples of
Core 17R were initially assigned (only tentatively) to
this age on the base of the occurrence of D. Hustedii
(Shipboard Scientific Party 1989b). The assignment
of load event II to the late Miocene survived to the
present day notwithstanding the underlying Cores 18
to 19R have been undoubtedly placed to the (early
Pliocene) NSOD zone 12 since 15 years (Baldauf and
Barron 1991). Our placement of load event II within
the early Pliocene does not contrast with the other
constrains reviewed by Whitehead et al. (2006) and
makes some events younger, limiting, for example,
the age of E4 (previously ascribed to span between
4.1 and 6.3 Ma) to span between 4.1 Ma (the
minimum revised age of the overlying Sørsal For-
mation; Whitehead et al. 2004) and 4.9 Ma (the
maximum age of the underlying sediments in Site
734).
• Erosion surface D/E1 is overlain by early Pliocene
sediments belonging to NSOD zones 14 to 15, which
in turn are overlain by erosion surface C/D (Figs. 8,
9), in turn overlain by the late Pliocene unit C.
Surface C/D, at 110 mbsf in Site 739, is dated to late
early/early late Pliocene, and corresponds to loading
event III of Solheim et al. (1991) and hence to
loading event L5 (Table 1) of Whitehead et al.
(2006). It also corresponds to surface PP-12 of
O’Brien et al. (2004) and to reflector A of Mizukoshi
et al. (1986), which was tied to Site 739 between 106
and 130 mbsf by O’Brien et al. (1995). This event is
one of the most significant in the Neogene glacial
history of the region. It corresponds to the cutting of
Prydz Bay Channel and initiation of the Prydz
Channel Fan (Cooper et al. 1991b; Cooper and
O’Brien 2004). The initiation of the Prydz Channel
Fan is marked in the seismic units of the continental
shelf and slope by a significant change in the
geometry, towards rapid progradation of the shelf
edge along the channel axis and downlap at the base
of the slope (O’Brien et al. 2004). This geometry
changes are observed also in other Antarctic margins
at presumably similar ages (Rebesco et al. 2006).
These authors have analyzed six different areas along
the Antarctic margin: Antarctic Peninsula, Prydz Bay,
Weddell Sea, Wilkes Land and Eastern and Western
Ross Sea. These sectors of the continental margin
share the same characters: (1) enhanced progradation
in the form of steep sedimentary wedges building
above pronounced truncation surfaces; (2) prominent
downlapping of these wedges at the base of the
continental slope; and (3) significant decrease in
sedimentation rates on the continental rise. The
common driving force has been inferred to be the
Late Neogene transition of ice sheet regime to
modern polar conditions. Previous placement of this
event (reflector A, PP-12, initiation of Prydz Channel
Fan and Paleo shelf-break 4) to the late Miocene (e.g.
Cooper et al. 2001) was based on an erroneous
stratigraphy of Site 739. However, the reviewed
stratigraphy of Site 739 that we obtained by integra-
tion of seismic, logging, lithologic and biostatigraphic
data of three shelf sites, fits very well within the
broad Cenozoic stratigraphy of Whitehead et al.
(2006). Conversely, the coincidence that we identify
between PP-12 and Load event III (Solheim et al.
1991), and our revised age of these events provide an
answer to the uncertainty for the age of the initiation
of the Prydz Channel and Prydz Channel Fan. This
event in fact was attributed to late Miocene or to
early Pliocene in the review of Whitehead et al.
(2006). We constrain surface PP-12 (our C/D bound-
ary) to the Pliocene, between 4.1 and 2.5 Ma, as
suggested for loading event L5 of Whitehead et al.
(2006).
2004 Int J Earth Sci (Geol Rundsch) (2009) 98:1991–2007
123

Conclusions
To revise the Neogene stratigraphy of the Prydz Bay
continental shelf we:
• reprocessed and analyzed a dataset constituted by 3 low
resolution multichannel seismic reflection profiles and
1 single-channel profile;
• reviewed the existing logging, lithologic, physical
properties and biostratigraphic data of three sites
(ODP Leg 188 Site 1166 and ODP Leg 119 Sites 739
and 742);
• estimated (using the Emerge software) the spatial
distribution (along the crossing seismic profiles) of
the P-wave velocity measured in the three sites;
• used the resulting velocity distribution in the depth-
migration of the dip-oriented seismic profile (PB33-21)
to obtain a reliable geometry reconstruction;
• integrated the information derived from the above steps
(seismic profiles, well data, velocity distribution, geo-
metric reconstruction) to assist the correlation among
the three sites of the stratigraphic information;
• compared the resulting detailed Neogene stratigraphy
of Prydz Bay continental shelf with the recently
reviewed broad Cenozoic stratigraphy of the Lambert
Graben and Prydz Bay region by Whitehead et al.
(2006).
As a general result, the Neogene stratigraphy proposed
by Whitehead et al. (2006) is confirmed (with minor
internal re-adjustments), but we find some events are
younger by up to a few Myrs, assigning a more precisely
age to the following events:
• the first shelf deposits above the post-early Oligocene–
late Eocene glacial advance are dated to late Miocene
instead of mid Miocene;
• the glacial advance that produced the load event II
(Solheim et al. 1991) and that eroded the post-early
Oligocene–late Eocene sediments in Sites 742 and 1166
is placed in early Pliocene time (between NSOD zones
14 to 15 and 12) rather than at the transition between
late Miocene and early Pliocene;
• the erosion of Prydz Bay Channel and the initiation of
Prydz Channel Fan (marked by reflector A of
Mizukoshi et al. (1986) and PP-12 of O’Brien et al.
2004) is dated to early late to late early Pliocene,
instead of at the transition between late Miocene and
early Pliocene. The age of this event in Prydz Bay is
consistent with the age suggested by Rebesco et al.
(2006) for similar events recognized in different
Antarctic margins, and inferred to result from the
transition to modern, ‘‘dry and cold-based’’, polar ice
sheets.
Acknowledgments Research was conducted within the project
‘‘Analysis of the physical properties relevant to the seismic stratig-
raphy, ODP Leg 188–Leg 119, Prydz Bay funded by the Italian
Programma Nazionale di Ricerche in Antartide (PNRA). The logging
data used in this work are furnished by the Ocean Drilling Program
(ODP). We thank German Leitchenkov for his contribution in pro-
viding Russian seismic data collected by within the 32nd and 33rd
Soviet Antarctic Research Expedition.
References
Baldauf JG, Barron JA (1991) Diatom biostratigraphy: Kerguelen
Plateau and Prydz Bay regions of the Southern Ocean. In: Barron
J, Larsen B (eds) Shipboard Scientific Party. Kerguelen Plateau–
Prydz Bay. Proc Ocean Drill Program Sci Results 119:547–598
Barnes AE (1998) The complex seismic trace made simple. Lead
Edge (Tulsa Okla) 17(4):473–478. doi:10.1190/1.1437993
Barrett PJ (1996) Antarctic Palaeoenvironment through Cenozoic
Times—a review. Terra Antarct 3(2):103–119
Barron J, Larsen B, Baldauf JG (1991) Evidence for late Eocene to
early Oligocene Antarctic glaciation and observations on late
Neogene glacial history of Antarctica: results from Leg 119. In:
Barron J, Larsen B et al (eds) Proc ODP Sci Results, vol 119
(Ocean Drilling Program). College Station, pp 869–891
Bingham RG, Siegert MJ (2007) Radio echo-sounding over polar ice
masses. J Environ Eng Geophys 12(1):47–62
Cooper A, Stagg H, Geist E (1991a) Seismic stratigraphy and
structure of Prydz Bay, Antarctica: implications from Leg 119
drilling. In: Barron J, Larsen B et al (eds) Proc ODP Sci Results,
vol 119, pp 5–25
Cooper AK, Barrett PJ, Hinz K, Traube V, Leitchenkov G, Stagg
HMJ (1991b) Cenozoic prograding sequences of the Antarctic
continental margin: a record of glacio-eustatic and tectonic
events. Mar Geol 102:175–213. doi:10.1016/0025-3227(91)
90008-R
Cooper AK, O’Brien PE (2001) Early stages of East Antarctic
glaciation – Insights from drilling and seismic reflection data in
the Prydz Bay region. Ext. Abst. For the International ANTO-
STRAT symposium on ‘‘The geologic record of the Antartcic Ice
sheet from drilling, coring and seismic studies’’. Erice, Italy, 8–
14 September 2001
Cooper AK, O’Brien PE (2004) Leg 188 synthesis: transitions in the
glacial history of the Prydz Bay region, East Antarctica, from
ODP drilling. In: Cooper AK, O’Brien PE, Richter C (eds) Proc
ODP Sci Results, vol 188, pp 1–42 (Online)
Dowdeswell JA, Elverhøi (2002) The timing of initiation of fast-
flowing ice streams during a glacial cycle inferred from
glacimarine sedimentation. Mar Geol 188(1–2):3–14
Erohina T, Cooper A, Handwerger D, Dunbar R (2004) Seismic
stratigraphy correlations between ODP Sites 742 and 1166:
implications for depositional paleoenvironments in Prydz Bay,
Antarctica. In: Cooper AK, O’Brien PE, Richter C (eds) Proc
ODP, Sci. Results, vol 188, pp 1–21
Forsberg CF, Solheim A, Gruetzner J, Taylor B, Strand K (2001)
Glacial development in the Prydz Bay region as witnessed by
geotechnical and mineralogical properties of Leg 188 Sites 1166
and 1167. In: Florindo F, Cooper AK (eds) The Geologic Record
of the Antarctic Ice Sheet from Drilling, Coring and Seismic
Studies. Quad Geofis Inst Naz Geofis Vulcanol 16:71–71
(Abstracts)
Hambrey MJ, McKelvey B (2000) Major Neogene fluctuations of the
East Antarctic ice sheet: stratigraphic evidence from the Lambert
Glacier region. Geology 28(10):887–890. doi:10.1130/0091-
7613(2000)28\887:MNFOTE[2.0.CO;2
Int J Earth Sci (Geol Rundsch) (2009) 98:1991–2007 2005
123
Hambrey MJ, Ehrmann WU, Larsen B (1991) The Cenozoic glacial
record of the Prydz Bay continental shelf, East Antarctica. Proc
ODP Sci Results 119:77–132
Hambrey MJ, Webb P-N, Harwood DM, Krissek LA (2003) Neogene
glacial record from the Sirius group of the Shackleton Glacier
region, central Transantarctic Mountains, Antarctica. Bull Geol
Soc Am 115(8):994–1015. doi:10.1130/B25183.1
Handwerger DA, Cooper AK, O’Brien PE, Willimas T, Barr SR,
Dunbar RB et al (2004) Synthetic seismograms linking ODP
Sites to seismic profiles, continental rise and shelf of Prydz Bay.
In: Cooper AK, O’Brien PE, Richter C (eds) Proc ODP Sci
Results 188:1–28 (Online)
Harwood DM, Webb P-N (1998) Glacial transport of diatoms in the
Antarctic Sirius Group: Pliocene refrigerator. GSA Today
8(4):1–8
King LH, Rokoengen K, Fader GBJ, Gunleiksurd T (1991)
Till-tongue stratigraphy. Geol Soc Am Bull 103:637–659.
doi:10.1130/0016-7606(1991)103\0637:TTS[2.3.CO;2
Kuvaas B, Leitchenkov G (1992) Glaciomarine turbidite and current
controlled deposits on Prydz Bay, Anatrctica. Mar Geol
108:365–381. doi:10.1016/0025-3227(92)90205-V
Leitchenkov G, Stagg H, Gandjukhin AK, Cooper AK, Tanahashi M,
O’Brien P (1994) Cenozoic Seismic Stratigraphy of Prydz Bay
(Antarctica). Terra Antarct 1(2):395–397
Marchant DR, Denton GH, Swisher CCIII, Potter N Jr (1996) Late
Cenozoic Antarctic paleoclimate reconstructed from volcanic
ashes in the Dry Valleys region of southern Victoria Land. Geol
Soc Am Bull 108:181–194. doi:10.1130/0016-7606(1996)
108\0181:LCAPRF[2.3.CO;2
Marchant DR, Swisher CCIII, Lux DR, West DP Jr, Denton GH
(1993) Pliocene paleoclimate and east antarctic ice-sheet history
from surficial ash deposits. Science 260(5108):667–670. doi:
10.1126/science.260.5108.667
McKelvey BC, Hambrey MJ, Harwood DM, Mabin MCG, Webb P-
N, Whitehead JM (2001) The Pagodroma Group-A Cenozoic
record of the East Antarctic ice sheet in the northern Prince
Charles Mountains, Antarctic Science 13 (4):455–468 Nota:
questo e’ del 2001 e non 1991!
Mizukoshi I, Sunouchi H, Saki T, Sato S, Tanahashi M (1986)
Preliminary report of geological geophysical surveys off Amery
Ice Shelf, East Antartica. Memoirs Natl Inst Polar Res Spec Issue
Jpn 43:48–61
O’Brien PE, Harris PT, Quilty PG, Taylor F, Wells P (1995) Postcruise
report, Antarctic CRC marine geoscience: Prydz Bay, Mac
Robertson Shelf and Kerguelen Plateau. AGSO Rec, 1995/29
O’Brien PE, Harris PT (1996) Patterns of glacial erosion and
deposition in Prydz Bay and the past behaviour of the Lambert
Glacier. Pap Proc R Soc Tasmania 130:79–85
O’Brien PE, Cooper AK, Florindo F, Handwereger DA, Lavelle M,
Passchier S et al (2004) Prydz Channel Fan and the history of
extreme ice advances in Prydz Bay. In: Cooper AK, O’Brien PE,
Richter C (eds) Proc ODP Sci Results 188 (Online).
http://www-odp.tamu.edu/publications/188_SR/016/016.htm
Ollier G, Mathis B (1991) Lithologic interpretation from geophysical
logs in Holes 737B, 738C and 742A. In: Barron J, Larsen B et al
(1991) Proceedings of the Ocean Drilling Program, Scientific
Results, vol 119, pp 263–289
Rebesco M, Camerlenghi A, Geletti R, Canals M (2006) Margin
architecture reveals the transition to the modern Antarctic ice
sheet ca. 3 Ma. Geology 34(4):301–304. doi:10.1130/G22000.1
Sheriff RE (1977) Limitations of resolution of seismic reflections and
geologic detail deliverable from them. In: Payton CE (ed)
Memoir 26, Seismic Stratigraphy—application to hydrocarbon
exploration. Am Ass Of Petrol. Geologists, Tulsa, Oklahoma
USA, 1985 pp 3–14
Shipboard Scientific Party (1989a) Explanatory notes. In: Barron J,
Larsen B et al (1989) Proc ODP Init Repts (Ocean Drilling
Program), vol 119. College Station
Shipboard Scientific Party (1989b) Site 739. In: Barron J, Larsen B
et al (eds) Proc ODP Init Repts (Ocean Drilling Program), vol
119. College Station
Shipboard Scientific Party (1989c) Site 742. In: Barron J, Larsen B
et al (1989) Proc ODP Init Repts (Ocean Drilling Program), vol
119. College Station
Shipboard Scientific Party (1989d) Introduction. In: Barron J, Larsen
B et al (eds) Proc ODP Init Repts (Ocean Drilling Program), vol
119. College Station
Shipboard Scientific Party (2001a) Leg 188 summary: Prydz Bay—
Cooperation Sea, Antarctica. In: O’Brien PE, Cooper AK,
Richter C et al (eds) Proc ODP Init Repts (Ocean Drilling
Program), vol 188. College Station, pp 1–65
Shipboard Scientific Party (2001b) Site 1166. In: O’Brien PE, Cooper
AK, Richter C et al (eds) Proc ODP Init Repts, vol 188, pp 1–191
(Online)
Solheim A, Forsberg CF, Pittenger A (1991) Stepwise consolidation
of glacigenic sediments related to the glacial history of Prydz
Bay, East Antarctica. In: Barron J, Larsen B et al (eds)
Proceedings of the Ocean Drilling Program, Scientific Results,
vol 119, pp 169–182
Stagg HMJ (1985) The structure and origin of Prydz Bay and
MacRobertson Shelf, East Antarctica. Tectonophysics 114:315–
340. doi:10.1016/0040-1951(85)90019-8
Stokes CR, Clark CD (2001) Paleo-ice streams. Quat Sc Rev
20(12):1437–1457
Stroeven AP, Kleman J (1999) Age of Sirius group on Mount Feather,
McMurdo Dry Valleys, Antarctica, based on glaciological
inferences from the overridden mountain range of Scandinavia.
Glob Planet Change 23(1–4):231–247. doi:10.1016/S0921-8181
(99)00059-4
Stroeven AP, Burckle LH, Kleman J, Prentice ML (1998) Atmo-
spheric transport of diatoms in the Antarctic Sirius Group:
Pliocene deep freeze. GSA Today 8(4):1–8
Sugden DE, Marchant DR, Denton GH (1993) The case for a stable
East Antarctic ice sheet; the background. In: Sugden DE,
Marchant DR, Denton G (eds) The case for a stable East
Antarctica ice sheet; proceedings. Geografiska Annaler. Series
A: Physical Geography. Generalstabens Litografiska Anstlalt,
Stockholm, Sweden, pp 151–154
Sugden DE (1996) The east Antarctic ice sheet: unstable ice or
unstable ideas? Trans Inst Br Geogr 21(3):443–454. doi:
10.2307/622590
Taner MT, Koehler F, Sheriff RE (1979) Complex seismic trace
analysis. Geophysics 44(6):1041–1063. doi:10.1190/1.1440994
Webb PN, Harwood DM, McKelvey BC, Mercer JH, Stott LD (1984)
Cenozoic marine sedimentation and ice–volume variation on the
East Antarctic Craton. Geology 12:287–291. doi:10.1130/0091-
7613(1984)12\287:CMSAIV[2.0.CO;2
Whitehead JM, Bohaty SM (2003) Data report: Quaternary–Pliocene
diatom biostratigraphy of ODP Sites 1165 and 1166, Coopera-
tion Sea and Prydz Bay. In: Cooper AK, O’Brien PE, Richter C
(eds) Proc ODP Sci Results 188:1–25 (Online).
http://www-odp.tamu.edu/publications/188_SR/VOLUME/
CHAPTERS/008.PDF
Whitehead JM, Harwood DM, McMinn A (2003) Ice-distal Upper
Miocene marine strata from inland Antarctica. Sedimentology
50:531–552
Whitehead JM, Harwood DM, McKelvey BC, Hambrey MJ, McMinn
A (2004) Diatom biostratigraphy of the Cenozoic fjordal
Pagodroma Group, Northern Prince Charles Mountains, East
Antarctica. Aust J Earth Sci 51:521–547
2006 Int J Earth Sci (Geol Rundsch) (2009) 98:1991–2007
123

Whitehead JM, Quilty PG, Mckelvey BC, O’Brien PE (2006) A
review of the Cenozoic stratigraphy and glacial history of the
Lambert Graben-Prydz Bay region, East Antarctica. Antarct Sci
18(1):83–99. doi:10.1017/S0954102006000083
Widess MB (1973) How thin is a thin bed? Geophysics 38:1176–
1180. doi:10.1190/1.1440403
Wilson GS (1995) The Neogene East Antarctic ice sheet; a dynamic
or stable feature? Quat Sci Rev 14(2):101–123. doi:10.1016/
0277-3791(95)00002-7
Int J Earth Sci (Geol Rundsch) (2009) 98:1991–2007 2007
123