Effects of tissue factor, thrombomodulin and elevated clotting factor levels on thrombin generation...
19
Effects of tissue factor, thrombomodulin and elevated clotting factor levels on thrombin generation in the calibrated automated thrombogram Kellie R. Machlus 1 , Emily A. Colby 2 , Jogin R. Wu 3 , Gary G. Koch 2 , Nigel S. Key 4 , and Alisa S. Wolberg 1 1 Department of Pathology and Laboratory Medicine, University of North Carolina at Chapel Hill, Chapel Hill, North Carolina, USA 2 Department of Biostatistics, University of North Carolina at Chapel Hill, Chapel Hill, North Carolina, USA 3 Department of Pathology, Duke University Medical Center, Durham, North Carolina, USA 4 Department of Medicine, University of North Carolina at Chapel Hill, Chapel Hill, North Carolina, USA Summary Elevated procoagulant levels have been correlated with increased thrombin generation in vitro and with increased venous thromboembolism (VTE) risk in epidemiological studies. Thrombin generation tests are increasingly being employed as a high throughput method to provide a global measure of procoagulant activity in plasma samples. The objective of this study was to distinguish the effects of assay conditions [tissue factor (TF), thrombomodulin, platelets/lipids] and factor levels on thrombin generation parameters, and determine the conditions and parameters with the highest sensitivity and specificity for detecting elevated factor levels. Thrombin generation was measured using calibrated automated thrombography (CAT) in corn trypsin inhibitor (CTI)-treated platelet- free plasma (PFP) and platelet-rich plasma (PRP). Statistical analysis was performed using logarithms of observed values with analysis of variance that accounted for experiment and treatment. The relative sensitivity of lag time (LT), time to peak (TTP), peak height and endogenous thrombin potential (ETP) to elevated factors XI, IX, VIII, X, and prothrombin was as follows: PFP initiated with 1 pM TF > PFP initiated with 5 pM TF > PRP initiated with 1 pM TF. For all conditions, inclusion of thrombomodulin prolonged the LT and decreased the peak and ETP; however, addition of thrombomodulin did not increase the ability of CAT to detect elevated levels of individual procoagulant factors. In conclusion, CAT conditions differentially affected the sensitivity of thrombin generation to elevated factor levels. Monitoring the peak height and/or ETP following initiation of clotting in PFP with 1 pM TF was most likely to detect hypercoagulability due to increased procoagulant factor levels. Keywords Thrombin; tissue factor; thrombomodulin; platelets; hypercoagulability; thrombosis Correspondence to: Alisa S. Wolberg, PhD, Department of Pathology and Laboratory Medicine, University of North Carolina at Chapel Hill, 815 Brinkhous-Bullitt Building, CB #7525, Chapel Hill, NC 27599–7525, USA, Tel.: +1 919 966 8430, Fax: +1 919 966 6718, [email protected]. NIH Public Access Author Manuscript Thromb Haemost. Author manuscript; available in PMC 2010 November 1. Published in final edited form as: Thromb Haemost. 2009 November ; 102(5): 936–944. doi:10.1160/TH09-03-0180. NIH-PA Author Manuscript NIH-PA Author Manuscript NIH-PA Author Manuscript
Transcript of Effects of tissue factor, thrombomodulin and elevated clotting factor levels on thrombin generation...

Effects of tissue factor, thrombomodulin and elevated clottingfactor levels on thrombin generation in the calibrated automatedthrombogram
Kellie R. Machlus1, Emily A. Colby2, Jogin R. Wu3, Gary G. Koch2, Nigel S. Key4, and AlisaS. Wolberg11Department of Pathology and Laboratory Medicine, University of North Carolina at Chapel Hill,Chapel Hill, North Carolina, USA2Department of Biostatistics, University of North Carolina at Chapel Hill, Chapel Hill, North Carolina,USA3Department of Pathology, Duke University Medical Center, Durham, North Carolina, USA4Department of Medicine, University of North Carolina at Chapel Hill, Chapel Hill, North Carolina,USA
SummaryElevated procoagulant levels have been correlated with increased thrombin generation in vitro andwith increased venous thromboembolism (VTE) risk in epidemiological studies. Thrombingeneration tests are increasingly being employed as a high throughput method to provide a globalmeasure of procoagulant activity in plasma samples. The objective of this study was to distinguishthe effects of assay conditions [tissue factor (TF), thrombomodulin, platelets/lipids] and factor levelson thrombin generation parameters, and determine the conditions and parameters with the highestsensitivity and specificity for detecting elevated factor levels. Thrombin generation was measuredusing calibrated automated thrombography (CAT) in corn trypsin inhibitor (CTI)-treated platelet-free plasma (PFP) and platelet-rich plasma (PRP). Statistical analysis was performed usinglogarithms of observed values with analysis of variance that accounted for experiment and treatment.The relative sensitivity of lag time (LT), time to peak (TTP), peak height and endogenous thrombinpotential (ETP) to elevated factors XI, IX, VIII, X, and prothrombin was as follows: PFP initiatedwith 1 pM TF > PFP initiated with 5 pM TF > PRP initiated with 1 pM TF. For all conditions,inclusion of thrombomodulin prolonged the LT and decreased the peak and ETP; however, additionof thrombomodulin did not increase the ability of CAT to detect elevated levels of individualprocoagulant factors. In conclusion, CAT conditions differentially affected the sensitivity ofthrombin generation to elevated factor levels. Monitoring the peak height and/or ETP followinginitiation of clotting in PFP with 1 pM TF was most likely to detect hypercoagulability due toincreased procoagulant factor levels.
KeywordsThrombin; tissue factor; thrombomodulin; platelets; hypercoagulability; thrombosis
Correspondence to: Alisa S. Wolberg, PhD, Department of Pathology and Laboratory Medicine, University of North Carolina at ChapelHill, 815 Brinkhous-Bullitt Building, CB #7525, Chapel Hill, NC 27599–7525, USA, Tel.: +1 919 966 8430, Fax: +1 919 966 6718,[email protected].
NIH Public AccessAuthor ManuscriptThromb Haemost. Author manuscript; available in PMC 2010 November 1.
Published in final edited form as:Thromb Haemost. 2009 November ; 102(5): 936–944. doi:10.1160/TH09-03-0180.
NIH
-PA Author Manuscript
NIH
-PA Author Manuscript
NIH
-PA Author Manuscript

IntroductionThrombin activates platelets, converts fibrinogen to fibrin, and initiates wound healing.Elevated procoagulant levels are correlated with abnormal thrombin generation in vitro (1–5)and increased risk of VTE (6–12). For example, prothrombin concentrations >115% of normalare associated with a 2.1-fold increased VTE risk, and factor VIII concentrations >200% areassociated with markedly elevated VTE risk (OR = 10.8) (6,7). Tests that assess the ability ofplasma to generate thrombin are thought to provide a more global measure of hemostasis andthrombosis than standard clotting assays. Such tests may be useful for determining risk ofprimary and recurrent VTE, and therefore, duration of antithrombotic therapy.
The most commonly used assay for continuous thrombin measurement is calibrated automatedthrombography (CAT) (13). CAT is based on monitoring cleavage of a slow-reactingfluorogenic substrate and comparing it to a known thrombin concentration added to non-clotting samples (13). Studies have demonstrated CAT's ability to detect reduced thrombingeneration in clotting factor deficiency (14–17). CAT appears most sensitive tohypocoagulability when initiated by low (1 pM) TF (16).
Given these findings, it is logical to hypothesise that CAT can be used to detecthypercoagulability due to elevated factor levels. Using high (184–429 pM) TF and no addedphospholipids, Siegemund et al. observed increased ETP in platelet-poor plasma with highconcentrations of factors XI and IX, but not VIII (4). In contrast, in PRP assays in which clottingwas initiated with low (0.5 pM) TF, Regnault et al. observed increased ETP with elevatedfactor VIII (3). Several studies have correlated recurrent VTE risk with elevated peak heightand/or ETP (18–24). However, another study correlated abnormal thrombin generation withfirst, but not recurrent VTE (25). It has been proposed that differences in findings from thesestudies stem, in part, from variations in assay conditions (25–27). Notably, these studiesdiffered in the source and concentration of TF and phospholipids, and use (or not) of contactpathway inhibitors (CTI) and protein C pathway sensitising agents [activated protein C (APC),thrombomodulin] because the experimental conditions providing the highest sensitivity andspecificity for detecting hypercoagulability have not been defined. The goals of this study wereto:
1. distinguish the effects of assay conditions (added TF, thrombomodulin, platelets/phospholipids) and elevated factor levels on thrombin generation parameters, and
2. determine the conditions and parameters with the highest sensitivity and specificityfor detecting elevated factor levels.
We simulated “hypercoagulability” by spiking plasma with factors XI, IX, VIII, X, V,prothrombin, or fibrinogen to 200% and 400% of normal, and measured the effect of thesefactors on thrombin generation parameters in different experimental conditions. We report thatthe conditions under which CAT was performed differentially affected its sensitivity. Changesin the peak height and/or ETP following initiation of clotting in PFP with 1 pM TF was mostlikely to detect hypercoagulability due to increased factor levels.
Materials and methodsMaterials and proteins
All proteins used in this study were of the highest quality and specific activity available. CTIand factors XI, V, and prothrombin were purchased from Haematologic Technologies, Inc(Essex Junction, VT). Factor X and plasminogen-, von Willebrand factor- and fibronectin-depleted fibrinogen were purchased from Enzyme Research Laboratories (South Bend, IN);factor X was further purified as described (5). Factor VIII (Hemofil M, Baxter, Deerfield, IL)
Machlus et al. Page 2
Thromb Haemost. Author manuscript; available in PMC 2010 November 1.
NIH
-PA Author Manuscript
NIH
-PA Author Manuscript
NIH
-PA Author Manuscript

and factor IX were the generous gifts of Dr. Dougald M. Monroe (UNC at Chapel Hill). Briefly,factor IX was prepared from prothrombin complex concentrations by Q Sepharosechromatography, heparin affinity, metal chelate chromatography using copper, and pseudo-affinity calcium elution from HiTrap Q. Factor IX could be activated completely by factor XIaand gave the expected molar concentration when the activated material was titrated withantithrombin in the presence of heparin. Protein purity was verified by both non-reducing andreducing 12% SDS-PAGE prior to use. Analysis of factors XI, IX, X, V, prothrombin, andfibrinogen:
1. revealed only bands of the expected molecular weight for each zymogen and cofactor,and
2. indicated no activated protein species (data not shown).
The factor VIII preparation (Hemophil M) also contained albumin, however, controlexperiments showed no effect of this albumin concentration on thrombin generation (data notshown). The specific activity of the factor V preparation was 51.3 U/mg, consistent with thatexpected for factor V (50–60 U/mg), and ∼40× lower than that expected for factor Va (2000U/mg), indicating no factor Va contamination in the preparation. Rabbit lung thrombomodulinwas from American Diagnostica, Inc (Stamford, CT). Fluorogenic thrombin substrate (Z-Gly-Gly-Arg-AMC), TF/Lipid Reagents (PFP-Low, PFP-High), and thrombin calibrator (α2-macroglobulin/thrombin) were generously provided by Diagnostica Stago (Parsippany, NJ).Lipids were composed of phosphatidylserine, phosphatidylcholine, andphosphatidylethanolamine at a ratio of 20:60:20, respectively. Blood was collected accordingto protocols approved by the UNC Institutional Review Board.
Plasma preparationsFor PFP, blood was collected from 18 healthy individuals [20–45 years old, 50% female, 50%non-Caucasian, with normal partial thromboplastin times (PTT)] through a 21-gauge needleinto a syringe and immediately transferred to sodium citrate/CTI [0.105 M (3.2%, pH 6.5) and18.3 μg/mL, respectively] to minimise contact activation (28,29). PFP was prepared bysequential centrifugation (150 × g, 15 minutes, 13,000 × g, 15 minutes), aliquoted, and snap-frozen in liquid nitrogen within two hours of phlebotomy. PFPs were then thawed, pooled, andrefrozen for subsequent assays. Pooled PFP was analyzed for levels of factors XI, IX, VIII, X,V, VII, protein C, free protein S, prothrombin, and fibrinogen at UNC Hospitals McLendonClinical Laboratory; all were in the normal reference range.
For PRP, blood was collected from six healthy individuals (21–50 years old, 67% female,normal PTTs) who had not taken aspirin for two weeks or ibuprofen for three days prior tophlebotomy. Blood was drawn as for PFP. PRP was prepared by centrifugation (150 × g, 15minutes) within one hour. The platelet count was measured on a Z1 Series Coulter Counter(Beckman Coulter, Fullerton, CA), and normalised by dilution with autologous PFP to 225,000/μl, and used at 150,000/μl (final).
Thrombin generation assayFactors XI, IX, VIII, X, V, prothrombin or fibrinogen were added to normal, pooled PFP andindividual PRPs to 200% or 400% of normal (final). Thrombin generation was measured byCAT (13). For PFP experiments, 20 μl of TF/phospholipids were mixed with 80 μl PFP in 96-well round-bottom microtiter plates (Becton Dickinson, Falcon™). The plate was inserted intoa Fluoroskan Ascent® fluorometer (ThermoLabsystem, Helsinki, Finland) and warmed to 37°C for 5 minutes. Reactions were initiated by automatically dispensing 20 μl of 2.5 mMfluorogenic substrate in 0.1 M CaCl2 to each well. Reactions were performed in duplicate ortriplicate in each experiment. The final TF, phospholipid, fluorogenic substrate, and CaCl2
Machlus et al. Page 3
Thromb Haemost. Author manuscript; available in PMC 2010 November 1.
NIH
-PA Author Manuscript
NIH
-PA Author Manuscript
NIH
-PA Author Manuscript

concentrations were 1 or 5 pM, 4 μM, 416 μM and 16 mM, respectively. Experiments withPRP were performed under identical conditions, but without added phospholipids. Reactionswere calibrated against wells containing 20 μL of α2-macroglobulin/thrombin complex and 80μL PFP or PRP (13). Thrombin generation was monitored at 37 °C with excitation and emissionfilters at 390 nm and 460 nm, respectively, every 20 seconds for 120 minutes. Experimentswith PFP and 1 pM TF, PFP and 5 pM TF, and PRP and 1 pM TF were performed 10, 5, and6 times, respectively.
Thrombin parameters were calculated using Thrombinoscope software version 3.0.0.29(Thrombinoscope BV, Maastricht, Netherlands), which defines the LT as the first time pointafter the thrombin concentration exceeds one-sixth peak height, the TTP as the time to the peakheight, the peak height as the maximum thrombin concentration produced, and the ETP as thetime integral of thrombin formation (the area under the thrombin generation curve).
Statistical methodsStatistical analysis was performed for logarithms of parameters using analysis of variance(ANOVA) that accounted for experiment date (PFP experiments), or donor (PRP experiments)and elevated factors. Each condition (factor level) was handled separately; factor concentrationwas not considered a covariate. An ANOVA model was first fit to each log-transformedparameter with covariates of date or donor, factor level, an indicator variable for platelets, andthe interaction between factor level and platelet indicator. We compared PFP initiated with 1pM TF to:
1. PFP initiated with 5 pM TF, and
2. PRP initiated with 1 pM TF.
Hypothesis testing was performed using a contrast matrix corresponding to a 1 degree offreedom F-test for each parameter. In a separate analysis, for each log-transformed parameter,a separate ANOVA model was fit with covariates of date or donor and factor level. Todetermine the effect of thrombomodulin in the presence of elevated factors, ANOVA modelswere applied to the log of the ratio of the parameter value with and without thrombomodulin.Differences in least square means between conditions and the control were evaluated by t-tests.Multiple comparisons were handled with Bonferroni corrections; significance was p<0.0033(0.05/15) unless otherwise indicated. The percent coefficient of variation (%CV) wascalculated as the ratio of the standard deviation to the mean multiplied by one hundred forinter-assay variability (PFP) and inter-individual variability (PRP).
ResultsThrombin generation in normal PFP and PRP
We first characterised the effects of TF on thrombin generation in normal PFP and PRP.Thrombin generation in PFP required addition of both TF and phospholipids; omission of eitherprevented thrombin generation for >120 minutes (data not shown), indicating that the PFP wasnot contaminated with detectable endogenous TF activity, procoagulant lipids, or contactactivation. Similarly, thrombin generation in PRP required addition of TF (data not shown),indicating that PRP from these healthy subjects did not contain detectable TF activity or contactactivation.
Table 1 shows baseline thrombin generation characteristics for PFP and PRP. Reactionsinitiated by 1 and 5 pM TF are indicated: PFP(1 pM TF), PFP(5 pM TF), and PRP(1 pM TF),respectively. Compared to PFP(1 pM TF), PFP(5 pM TF) demonstrated shortened LT and TTP andincreased peak height and ETP. The inter-assay variability (%CV) of PFP (Table 2) and inter-individual variability (%CV) in PRP (Table 3) were consistent with prior studies (13,26,30).
Machlus et al. Page 4
Thromb Haemost. Author manuscript; available in PMC 2010 November 1.
NIH
-PA Author Manuscript
NIH
-PA Author Manuscript
NIH
-PA Author Manuscript

Thrombin generation in PFP(1 pM TF) demonstrated a significantly shorter LT and TTP,increased peak height and decreased ETP than PRP(1 pM TF), consistent with previous studies(13,26,30).
Effect of thrombomodulin on thrombin generation in normal PFP and PRPThrombin generation in normal PFP is decreased in the presence of thrombomodulin or APC(3,13,22,24,31,32); however, patients with a protein C pathway deficiency (factor V Leiden,protein C/S deficiency) have decreased thrombomodulin/APC sensitivity (22,24). Previousstudies have recommended that CAT assays include APC or thrombomodulin to increaseability to discriminate between healthy subjects and VTE patients, as well as predict VTErecurrence (19,23,24,31). We first compared thrombin generation in the presence and absenceof thrombomodulin in PFP(1 pM TF) and PFP(5 pM TF) (Fig. 1a, 1b, Table 1). Thrombomodulinslightly prolonged the LT and reduced the peak height and ETP in both PFP(1 pM TF) andPFP(5 pM TF). Thrombomodulin slightly shortened the TTP in PFP(1 pM TF), but notPFP(5 pM TF). Increased TF decreased thrombomodulin sensitivity; that is, 5 nMthrombomodulin reduced the ETP ∼87±1.9% and ∼28±3.1% for PFP(1 pM TF) andPFP(5 pM TF), respectively. Thrombomodulin significantly increased the inter-assay %CV ofthe peak height and ETP in PFP(1 pM TF), but had less effect in PFP(5 pM TF) (Table 2).
We then examined the impact of thrombomodulin on thrombin generation in PRP(1 pM TF). Asin PFP(1 pM TF), thrombomodulin prolonged the LT and reduced the peak height and ETP inPRP(1 pM TF) (Fig. 1c, Table 1). In contrast to PFP(1 pM TF), thrombomodulin slightly prolongedthe TTP in PRP(1 pM TF), likely because the TTP in PRP is limited by the time to plateletactivation. These findings are somewhat different, although not altogether inconsistent withprevious findings that thrombomodulin decreased ETP, but did not change LT or TTP in PRP(13). The subtle differences in response to thrombomodulin in these studies may relate to thethrombomodulin source (human vs. rabbit lung), although another study found similar effectsof thrombomodulin from different sources on ETP (24). The inter-individual variabilityincreased for LT and TTP, decreased for ETP, and did not change for peak height in thepresence of thrombomodulin (Table 3). Platelets decreased CAT sensitivity tothrombomodulin; that is, 5 nM thrombomodulin reduced the ETP ∼66±4.8% inPRP(1 pM TF), compared to ∼87±1.9% in PFP(1 pM TF) (Fig. 1c,Table 1). The reducedthrombomodulin sensitivity of PRP versus PFP likely reflects contributions of platelet-derivedfactor V(a) to thrombin generation (33,34), and is consistent with previous studies (13).
Effect of procoagulant factors on thrombin generation in PFP and PRPFinally, we compared the ability to detect hypercoagulability under each of these conditions(1 and 5 pM TF, in the presence and absence of thrombomodulin, in PFP and PRP). Wemeasured thrombin generation in PFP and PRP spiked with factors XI, X, IX, VIII, V,prothrombin, or fibrinogen. We initiated clotting in PFP with 1 or 5 pM TF and 4 μMphospholipids, and in PRP with 1 pM TF (no phospholipids), in the presence and absence ofthrombomodulin.
LTThe LT in PFP(1 pM TF) and PFP(5 pM TF) were qualitatively similar, although changes inPFP(5 pM TF) were smaller than changes in PFP(1 pM TF) (Fig. 2a, 2b). In both the absence andpresence of thrombomodulin, intrinsic factors XI, IX, and VIII did not significantly alter theLT, although effects were slightly greater in the presence of thrombomodulin. Factor Xsignificantly shortened the LT in both conditions. Interestingly, factor V significantly shortenedthe LT in PFP(1 pM TF) but not PFP(5 pM TF). Both prothrombin and fibrinogen significantlyincreased the LT, irrespective of the TF concentration or presence of TM. The opposing effectsof factor X and prothrombin on LT in PFP may relate to differences in their plasma
Machlus et al. Page 5
Thromb Haemost. Author manuscript; available in PMC 2010 November 1.
NIH
-PA Author Manuscript
NIH
-PA Author Manuscript
NIH
-PA Author Manuscript

concentrations. Whereas 200% factor X increases the plasma level from 8 to 16 μg/mL, 200%prothrombin increases the plasma level from 100 to 200 μg/mL. This high concentration ofprothrombin or the prothrombin activation product fragment 1.2 may competitively inhibitbinding of other Gla proteins to the lipid surface, thereby prolonging the time to complexassembly and enzyme generation. Indeed, elevated prothrombin did not prolong the LT inassays performed in the presence of increased (300 μM) lipid concentrations (data not shown).
Procoagulant factors produced unique effects on the LT in PRP(1 pM TF) (Fig. 2c). In both thepresence and absence of thrombomodulin, factors XI, IX, VIII, X, prothrombin, and fibrinogennon-significantly shortened the LT in PRP(1 pM TF); only 400% factor XI significantlyshortened the LT. These findings suggest that in contrast to PFP, the LT in PRP is predominatedby the time required for platelet activation and supercedes the time necessary to formprocoagulant complexes on exposed lipid. Factor V exhibited a biphasic effect on LT inPRP(1 pM TF), significantly increasing the LT at 200%, with no effect at 400%. These interestingobservations were unique to experiments with platelets and may reflect differences in theprocoagulant activity of plasma and platelet-derived factor V(a) (34).
TTPFactors XI, IX, and VIII generally shortened the TTP in PFP(1 pM TF), but did not affect theTTP in PFP(5 pM TF) (Fig. 3a, 3b). Factor X shortened the TTP in both PFP(1 pM TF) andPFP(5 pM TF). Factor V and fibrinogen produced little to no effect on TTP in either condition.With the exception of prothrombin, the factors produced qualitatively similar effects inPRP(1 pM TF) as in PFP(1 pM TF), with a slight decrease in the TTP with factors XI, IX, VIII, X,and fibrinogen (Fig. 3c). Effects were similar in the presence and absence of thrombomodulin.
Interestingly, as seen in the LT, whereas prothrombin prolonged the TTP in PFP, it shortenedthe TTP in PRP. Again, prothrombin's effect may arise in PFP because of prothrombin bindingto the constitutively exposed lipid surface of the synthetic lipids, whereas the lipid surface isprotected from prothrombin binding on unactivated platelets until the time of activation.Platelet activation permits simultaneous formation of both tenase and prothrombinase,preventing inhibition by high prothrombin concentrations.
Peak heightIn contrast to effects on LT and TTP, factors exhibited similar effects on peak height in PFPand PRP; however the magnitude of the effects differed substantially (Fig. 4a-4c). For allconditions, factors XI, IX, VIII, X, prothrombin, and fibrinogen increased the peak height,whereas factor V had little effect on peak height. Changes were largest in PFP(1 pM TF), followedby PFP(5 pM TF) and PRP(1 pM TF), respectively, but similar in the presence and absence ofthrombomodulin for all three conditions.
ETPAs with peak height, factors similarly affected ETP in PFP and PRP; however, the magnitudeof the effects differed substantially with the different conditions (Fig. 5a-5c). Factors IX, VIII,X, prothrombin, and fibrinogen increased the ETP in PFP(1 pM TF), PFP(5 pM TF), andPRP(1 pM TF). Factor XI increased ETP only in reactions initiated with 1 pM TF, in the presenceof thrombomodulin. Factor V had little effect on ETP in any condition.
DiscussionUsing a range of TF and phospholipid concentrations in the presence and absence of proteinC pathway inhibitors, previous studies have correlated VTE risk with elevated peak height(18), ETP (20,22–25) or both (19,21). Other studies have focused on the LT, rate, and peak as
Machlus et al. Page 6
Thromb Haemost. Author manuscript; available in PMC 2010 November 1.
NIH
-PA Author Manuscript
NIH
-PA Author Manuscript
NIH
-PA Author Manuscript

an indicator of circulating TF and prothrombotic disease (19,35,36). Although differences infindings between studies have been attributed to differences in assay conditions, few studieshave contrasted different assay conditions within a single design, and even fewer underhypercoagulable conditions. It has not been explicitly shown that all conditions provide equalsensitivity and specificity to detect hypercoagulability. Given limited plasma sample sizes andlimited availability of samples from large-scale epidemiologic studies of hypercoagulability,empirical evidence for the use of specific conditions and parameters is essential for designingprospective studies of plasma hypercoagulability. Our study design permitted the directcomparison of conditions and parameters to identify those most sensitive and specific to factor-induced hypercoagulability. To our knowledge, this work is the first comprehensive, systematiccomparison of these conditions in a single study.
Our analysis shows that in PFP, factors XI, IX, VIII, X, prothrombin, and fibrinogensignificantly increased peak height and ETP, though increases were proportionally larger forpeak height than ETP. Whereas the baseline peak height of PFP(5 pM TF) was 74% higher thanthat of PFP(1 pM TF) (344 nM vs. 197 nM, respectively, Table 1), the apparent “maximum peakheight” in PFP(5 pM TF) plus elevated factors XI, IX, VIII, X, or V up to 400% was only 23%higher than that in PFP(1 pM TF) plus elevated factors (396 nM vs. 322 nM, respectively). Thesefindings suggest that the maximum observable difference between peak height in normal and“hypercoagulable” PFP was reduced in assays initiated with higher TF (15% forPFP(5 pM TF) vs. 63% for PFP(1 pM TF). Similarly, the maximum ETP in PFP(5 pM TF) withelevated factors XI, IX, VIII, X, or V (1925 nM*min) was only 3.8% higher than that inPFP(1 pM TF) (1854 nM*min). Thus, the maximum observable difference in ETP between PFPand “hypercoagulable” PFP was reduced in PFP(5 pM TF) (9.7%) versus PFP(1 pM TF) (18%).This difference is even smaller than that seen for peak height. The exception to these resultsis in PFP containing elevated prothrombin. Prothrombin (200%) significantly increased peakheight and ETP in both in both low (1 pM) (1.3-fold and 1.6-fold, respectively) and high (5pM) (1.4-fold and 1.7-fold, respectively) TF. These findings suggest that the mechanismlimiting thrombin generation in this system results, at least in part, from the prothrombinconcentration and indicates that peak height and ETP are exquisitely sensitive tohyperprothrombinemia.
It is widely accepted that PRP may provide greater physiologic relevance in assays of thisnature, however studies of PFP persist, in part because of logistical limitations associated withthe use of fresh PRP. Our study demonstrates that CAT assays of PFP and PRP show differenttrends in LT and TTP, but provide qualitatively similar data on peak height and ETP. Thus,studies comparing the presence and absence of platelets are likely to provide consistentinformation on peak height and ETP, but inconsistent findings on LT and TTP. Differences inresponse of LT or TTP in PFP and PRP may, however, provide important mechanisticinformation on the role of platelets and platelet abnormalities in thrombosis.
Epidemiologic studies have correlated elevated levels of factors XI, IX, VIII, X, prothrombin,or fibrinogen, but not factor V, with increased VTE risk (6–12). In this regard, CAT appearsspecific to hypercoagulability due to these factors. It is important to note, however, that themagnitude of change in thrombin generation did not correlate with the degree of thromboticrisk associated with each factor. For example, elevated prothrombin produced a large linearincrease in peak height. However, thrombotic risk associated with elevated prothrombin isrelatively small (OR ∼2.1) (7). Discrepancies between the thrombin generation measurementsand clinical risk in the case of elevated prothrombin may result from difficulties in measuring(pro)thrombin concentrations in excess of the antithrombin level present in the plasma.Additionally, although 200% fibrinogen increased the peak height and ETP, its role in VTErisk is controversial. It is unclear whether the effects of fibrinogen on thrombin generationparameters resulted from changes in thrombin generation, itself, or in the ability of fibrinogen
Machlus et al. Page 7
Thromb Haemost. Author manuscript; available in PMC 2010 November 1.
NIH
-PA Author Manuscript
NIH
-PA Author Manuscript
NIH
-PA Author Manuscript

(“antithrombin I”) to bind thrombin and preserve its proteolytic activity towards smallmolecular substrates. Thus, CAT may demonstrate disproportionately high peak height andETP for patients with lower overall risk, reducing the specificity and predictive value of thistechnique in certain patients.
As a means of distinguishing effects of procoagulant factors on CAT, we note that whereasseveral clotting factors significantly increased peak height and ETP, these factors had differentand sometimes unique effects on other parameters. For example, in PFP(1 pM TF), elevatedlevels of factors IX, X, and prothrombin significantly increased peak height and ETP. However,factor IX did not affect the LT, factor X significantly decreased the LT, and prothrombinprolonged the LT in low but not high lipid concentrations (data not shown). Thus, analysis ofmultiple experimental conditions (e.g., varied lipid concentrations) and/or parameters may behelpful in discerning factors contributing to abnormal thrombin generation in certain PFPs.Indeed, Tripodi et al. recently suggested that use of three abnormal thrombin generationparameters (LT, peak height, and ETP) improves the identification of patients at risk ofrecurrent VTE versus analysis based on a single parameter (37).
Comparisons of findings between centers have been difficult, as inter-center variability is highpartly due to the use of “in house” reagents and protocols. Using a particularly elegant studydesign, Dargaud et al. (2007) showed that the use of different TF and phospholipid sourcesproduces large variability in CAT, but standardising conditions significantly reduces center-to-center variability (27). We used commercially-available reagents from the CATmanufacturer, which may offer consistency in results and enable the continued evaluation ofthese conditions in future studies.
This study has several limitations. First, although thrombomodulin may be helpful incharacterising plasmas with proteins C or S deficiency or factor V Leiden, the physiologicalthrombomodulin concentration has not been established because it is primarily a cell-associatedprotein. Thus, the concentration of soluble thrombomodulin that provides the most clinically-useful information has not been determined. Our data suggested that thrombomodulinincreased the inter-assay %CV and dampened the effects of 200% fibrinogen at low TF, butdid not significantly impact the ability to detect hypercoagulability from the other factors tested.Thus, its general use for detecting protein C pathway abnormalities is compatible with assaysused to detect elevated levels of clotting factors. Second, although epidemiological studieshave suggested elevated levels of certain clotting factors independently increase VTE risk(6–12), the factor levels we tested were generally higher than those reported in these studies.Of note, however, prothrombin levels as high as 500% of normal have been reported in patientswith type 2 diabetes (38). CAT's ability to detect elevated prothrombin suggests abnormalthrombin generation in these patients would be readily detected by this technique. Third, ourstudy design compared frozen/thawed, pooled PFP with individual PRP, which may emphasisedifferences in %CV between PFP and PRP. Fourth, as opposed to tests of individual factorlevels, CAT offers the advantage of testing global haemostatic potential. Effects of multipleabnormal coagulation factor levels on thrombin generation may be additive, synergistic, orreflect only the effects of the most limiting factor. Additional studies are warranted to fullyappreciate the effects of multiple factor abnormalities on thrombin generation measured withthis technique. Finally, it is not clear whether CAT recapitulates the in vivo pathologic effectsof procoagulant factors; other mechanisms besides thrombin generation may contribute tothrombotic risk.
In sum, we have shown that CAT's ability to detect elevated factors varies between factors anddepends on the assay conditions. The largest changes in thrombin generation in response toelevated factors XI, IX, VIII, X, or prothrombin were seen in peak height and ETP inPFP(1 pM TF). Smaller changes were observed in PFP(5 pM TF) and PRP(1 pM TF). Therefore,
Machlus et al. Page 8
Thromb Haemost. Author manuscript; available in PMC 2010 November 1.
NIH
-PA Author Manuscript
NIH
-PA Author Manuscript
NIH
-PA Author Manuscript

monitoring the peak height and/or ETP following initiation of clotting in PFP with 1 pM TFis most likely to detect hypercoagulability due to increased procoagulant factor levels.
What is known about this topic?
Thrombin generation tests can detect hypocoagulability. Significant interest lies indetermining their ability to detect hypercoagulability.
Previous studies have correlated primary or recurrent VTE risk with abnormal thrombingeneration; however, the experimental conditions differ significantly in these studies.
Standardisation of thrombin generation tests reduces the variability of results and isnecessary for its continued clinical development.
The experimental conditions providing the highest sensitivity and specificity fordetecting hypercoagulability have not been identified.
What does this paper add?
The ability to detect elevated factors varies between factors and depends on the assayconditions.
The relative sensitivity of lag time (LT), time to peak (TTP), peak height andendogenous thrombin potential (ETP) to elevated factors XI, IX, VIII, X, andprothrombin was as follows: PFP initiated with 1 pM TF > PFP initiated with 5 pM TF> PRP initiated with 1 pM TF.
Monitoring the peak height and/or ETP following initiation of clotting in PFP with 1pM TF is most likely to detect hypercoagulability due to increased procoagulant factorlevels.
Our findings support efforts to standardise reagents (TF and lipid concentrations) (27) toreliably achieve the assay conditions necessary for maximal sensitivity. Our data also confirmeffects previously seen in normal plasma, but importantly, extend these findings tohypercoagulable situations. Identification of conditions that best identify hypercoagulabilityand predict VTE warrants further investigation. In vivo, VTE risk likely depends on acombination of increased procoagulant and decreased anticoagulant activities, and/or otherpathologic mechanisms. In a clinical setting, the concerted use of several different assayconditions may be necessary to identify patients with distinct clinical phenotypes, not unlikethe use of both aPTT and PT to diagnose factor deficiencies.
AcknowledgmentsThe authors thank Dr. Robert A. Campbell for his thoughtful contributions.
Financial support: Supported by grants from the NIH (K01AR051021), NSF (0705977), UNC Institute on Aging,Novo Nordisk, Gustavus and Louise Pfeiffer Research Foundation, and National Hemophilia Foundation.
References1. Al Dieri R, Peyvandi F, Santagostino E, et al. The thrombogram in rare inherited coagulation disorders:
its relation to clinical bleeding. Thromb Haemost 2002;88:576–582. [PubMed: 12362226]2. Butenas S, van't Veer C, Mann KG. “Normal” thrombin generation. Blood 1999;94:2169–2178.
[PubMed: 10498586]3. Regnault V, Beguin S, Lecompte T. Calibrated automated thrombin generation in frozen-thawed
platelet-rich plasma to detect hypercoagulability. Pathophysiol Haemost Thromb 2003;33:23–29.[PubMed: 12853709]
Machlus et al. Page 9
Thromb Haemost. Author manuscript; available in PMC 2010 November 1.
NIH
-PA Author Manuscript
NIH
-PA Author Manuscript
NIH
-PA Author Manuscript

4. Siegemund A, Petros S, Siegemund T, et al. The endogenous thrombin potential and high levels ofcoagulation factor VIII, factor IX and factor XI. Blood Coagul Fibrinolysis 2004;15:241–244.[PubMed: 15060420]
5. Allen GA, Wolberg AS, Oliver JA, et al. Impact of procoagulant concentration on rate, peak and totalthrombin generation in a model system. J Thromb Haemost 2004;2:402–413. [PubMed: 15009455]
6. Kraaijenhagen RA, in't Anker PS, Koopman MM, et al. High plasma concentration of factor VIIIc isa major risk factor for venous thromboembolism. Thromb Haemost 2000;83:5–9. [PubMed:10669145]
7. Poort SR, Rosendaal FR, Reitsma PH, et al. A common genetic variation in the 3′-untranslated regionof the prothrombin gene is associated with elevated plasma prothrombin levels and an increase invenous thrombosis. Blood 1996;88:3698–3703. [PubMed: 8916933]
8. Meijers JC, Tekelenburg WL, Bouma BN, et al. High levels of coagulation factor XI as a risk factorfor venous thrombosis. N Engl J Med 2000;342:696–701. [PubMed: 10706899]
9. Kamphuisen PW, Rosendaal FR, Eikenboom JC, et al. Factor V antigen levels and venous thrombosis:risk profile, interaction with factor V leiden, and relation with factor VIII antigen levels. ArteriosclerThromb Vasc Biol 2000;20:1382–1386. [PubMed: 10807757]
10. van Hylckama Vlieg A, van der Linden IK, Bertina RM, et al. High levels of factor IX increase therisk of venous thrombosis. Blood 2000;95:3678–3682. [PubMed: 10845896]
11. Kyrle PA, Minar E, Hirschl M, et al. High plasma levels of factor VIII and the risk of recurrent venousthromboembolism. N Engl J Med 2000;343:457–462. [PubMed: 10950667]
12. de Visser MC, Poort SR, Vos HL, et al. Factor X levels, polymorphisms in the promoter region offactor X, and the risk of venous thrombosis. Thromb Haemost 2001;85:1011–1017. [PubMed:11434677]
13. Hemker HC, Giesen P, Al Dieri R, et al. Calibrated automated thrombin generation measurement inclotting plasma. Pathophysiol Haemost Thromb 2003;33:4–15. [PubMed: 12853707]
14. Chantarangkul V, Clerici M, Bressi C, et al. Thrombin generation assessed as endogenous thrombinpotential in patients with hyper- or hypo-coagulability. Haematologica 2003;88:547–554. [PubMed:12745274]
15. Dargaud Y, Beguin S, Lienhart A, et al. Evaluation of thrombin generating capacity in plasma frompatients with haemophilia A and B. Thromb Haemost 2005;93:475–480. [PubMed: 15735797]
16. Duchemin J, Pan-Petesch B, Arnaud B, et al. Influence of coagulation factors and tissue factorconcentration on the thrombin generation test in plasma. Thromb Haemost 2008;99:767–773.[PubMed: 18392335]
17. Keularts IM, Zivelin A, Seligsohn U, et al. The role of factor XI in thrombin generation induced bylow concentrations of tissue factor. Thromb Haemost 2001;85:1060–1065. [PubMed: 11434685]
18. Hron G, Kollars M, Binder BR, et al. Identification of patients at low risk for recurrent venousthromboembolism by measuring thrombin generation. JAMA 2006;296:397–402. [PubMed:16868297]
19. Tripodi A, Legnani C, Chantarangkul V, et al. High thrombin generation measured in the presenceof thrombomodulin is associated with an increased risk of recurrent venous thromboembolism. JThromb Haemost 2008;6:1327–1333. [PubMed: 18485081]
20. Besser M, Baglin C, Luddington R, et al. High rate of unprovoked recurrent venous thrombosis isassociated with high thrombin-generating potential in a prospective cohort study. J Thromb Haemost2008;6:1720–1725. [PubMed: 18680535]
21. Ten Cate-Hoek AJ, Dielis AW, Spronk HM, et al. Thrombin generation in patients after acute deep-vein thrombosis. Thromb Haemost 2008;100:240–245. [PubMed: 18690343]
22. Brandts A, van Hylckama Vlieg A, Rosing J, et al. The risk of venous thrombosis associated with ahigh endogenous thrombin potential in the absence and presence of activated protein C. J ThrombHaemost 2007;5:416–418. [PubMed: 17116237]
23. Tripodi A, Martinelli I, Chantarangkul V, et al. The endogenous thrombin potential and the risk ofvenous thromboembolism. Thromb Res 2007;121:353–359. [PubMed: 17560633]
24. Dargaud Y, Trzeciak MC, Bordet JC, et al. Use of calibrated automated thrombinography +/-thrombomodulin to recognise the prothrombotic phenotype. Thromb Haemost 2006;96:562–567.[PubMed: 17080211]
Machlus et al. Page 10
Thromb Haemost. Author manuscript; available in PMC 2010 November 1.
NIH
-PA Author Manuscript
NIH
-PA Author Manuscript
NIH
-PA Author Manuscript

25. van Hylckama Vlieg A, Christiansen SC, Luddington R, et al. Elevated endogenous thrombin potentialis associated with an increased risk of a first deep venous thrombosis but not with the risk ofrecurrence. Br J Haematol 2007;138:769–774. [PubMed: 17760809]
26. Gerotziafas GT, Depasse F, Busson J, et al. Towards a standardization of thrombin generationassessment: the influence of tissue factor, platelets and phospholipids concentration on the normalvalues of Thrombogram-Thrombinoscope assay. Thromb J 2005;3:16. [PubMed: 16250908]
27. Dargaud Y, Luddington R, Gray E, et al. Effect of standardization and normalization on imprecisionof calibrated automated thrombography: an international multicentre study. Br J Haematol2007;139:303–309. [PubMed: 17897307]
28. Luddington R, Baglin T. Clinical measurement of thrombin generation by calibrated automatedthrombography requires contact factor inhibition. J Thromb Haemost 2004;2:1954–1959. [PubMed:15550027]
29. Dargaud Y, Luddington R, Baglin TP. Elimination of contact factor activation improves measurementof platelet-dependent thrombin generation by calibrated automated thrombography at low-concentration tissue factor. J Thromb Haemost 2006;4:1160–1161. [PubMed: 16689781]
30. Vanschoonbeek K, Feijge MA, Van Kampen RJ, et al. Initiating and potentiating role of platelets intissue factor-induced thrombin generation in the presence of plasma: subject-dependent variation inthrombogram characteristics. J Thromb Haemost 2004;2:476–484. [PubMed: 15009466]
31. Regnault V, Hemker HC, Wahl D, et al. Phenotyping the haemostatic system by thrombography--potential for the estimation of thrombotic risk. Thromb Res 2004;114:539–545. [PubMed: 15507289]
32. Dielis AW, Castoldi E, Spronk HM, et al. Coagulation factors and the protein C system as determinantsof thrombin generation in a normal population. J Thromb Haemost 2008;6:125–131. [PubMed:17988231]
33. Taube J, McWilliam N, Luddington R, et al. Activated protein C resistance: effect of plateletactivation, platelet-derived microparticles, and atherogenic lipoproteins. Blood 1999;93:3792–3797.[PubMed: 10339485]
34. Monkovic DD, Tracy PB. Functional characterization of human platelet-released factor V and itsactivation by factor Xa and thrombin. J Biol Chem 1990;265:17132–17140. [PubMed: 2211616]
35. Bidot L, Jy W, Bidot C Jr, et al. Microparticle-mediated thrombin generation assay: increased activityin patients with recurrent thrombosis. J Thromb Haemost 2008;6:913–919. [PubMed: 18363818]
36. Ollivier V, Wang J, Manly D, et al. Detection of endogenous tissue factor levels in plasma using thecalibrated automated thrombogram assay. Thromb Res. 2009 prepublished online April 3, 2009.
37. Tripodi A, Legnani C, Palareti G, et al. More on: high thrombin generation and the risk of recurrentvenous thromboembolism. J Thromb Haemost 2009;7:906–907. [PubMed: 19320819]
38. Sauls DL, Banini AE, Boyd LC, et al. Elevated prothrombin level and shortened clotting times insubjects with type 2 diabetes. J Thromb Haemost 2007;5:638–639. [PubMed: 17166250]
Machlus et al. Page 11
Thromb Haemost. Author manuscript; available in PMC 2010 November 1.
NIH
-PA Author Manuscript
NIH
-PA Author Manuscript
NIH
-PA Author Manuscript
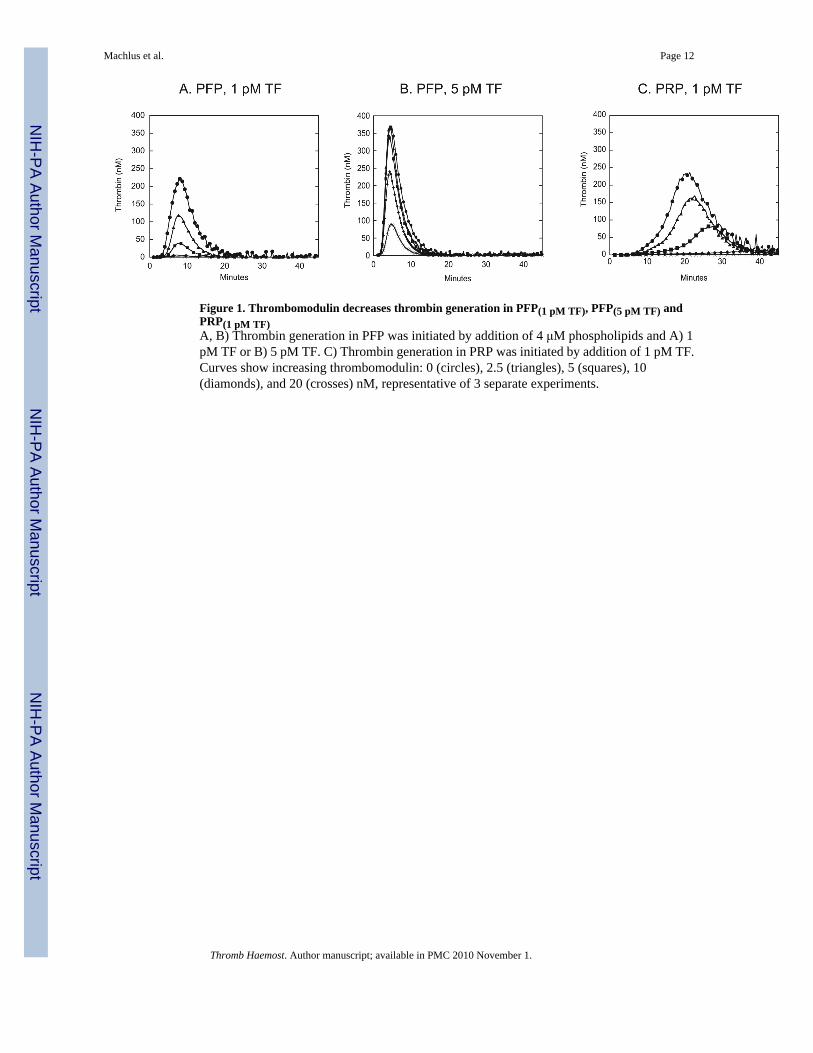
Figure 1. Thrombomodulin decreases thrombin generation in PFP(1 pM TF), PFP(5 pM TF) andPRP(1 pM TF)A, B) Thrombin generation in PFP was initiated by addition of 4 μM phospholipids and A) 1pM TF or B) 5 pM TF. C) Thrombin generation in PRP was initiated by addition of 1 pM TF.Curves show increasing thrombomodulin: 0 (circles), 2.5 (triangles), 5 (squares), 10(diamonds), and 20 (crosses) nM, representative of 3 separate experiments.
Machlus et al. Page 12
Thromb Haemost. Author manuscript; available in PMC 2010 November 1.
NIH
-PA Author Manuscript
NIH
-PA Author Manuscript
NIH
-PA Author Manuscript

Figure 2. Procoagulant factors and thrombomodulin differently influence LT in PFP and PRPPFP or PRP was spiked with factors XI, IX, VIII, X, V, prothrombin, or fibrinogen to 200%or 400% of normal. Clotting was initiated by addition of 1 pM TF and 4 μM phospholipids(circles), 5 pM TF and 4 μM phospholipids (diamonds), or 1 pM TF (no lipids, squares) forA) PFP(1 pM TF), B) PFP(5 pM TF), and C) PRP(1 pM TF), respectively, in the absence (opensymbols) and presence (closed symbols) of thrombomodulin, as described in methods. Notey-axis scaling in panel C. The shaded gray box encompasses the 100% value and its standarderror of the mean (SEM). Data show means ±SEM. *p<0.0033 versus 100%.
Machlus et al. Page 13
Thromb Haemost. Author manuscript; available in PMC 2010 November 1.
NIH
-PA Author Manuscript
NIH
-PA Author Manuscript
NIH
-PA Author Manuscript

Figure 3. Procoagulant factors and thrombomodulin differently influence TTP in PFP and PRPReactions were performed as in Fig 2. A) PFP(1 pM TF), B) PFP(5 pM TF), C) PRP(1 pM TF). Theshaded gray box encompasses the 100% value ±SEM. Data show means ±SEM for the absence(open symbols) and presence (closed symbols) of thrombomodulin. Note y-axis scaling inpanel C. *p<0.0033 versus 100%
Machlus et al. Page 14
Thromb Haemost. Author manuscript; available in PMC 2010 November 1.
NIH
-PA Author Manuscript
NIH
-PA Author Manuscript
NIH
-PA Author Manuscript

Figure 4. Procoagulant factors and thrombomodulin differently influence peak height in PFP andPRPReactions were performed as in Fig 2. A) PFP(1 pM TF), B) PFP(5 pM TF), C) PRP(1 pM TF). Theshaded gray box encompasses the 100% value ±SEM. Data show means ±SEM for the absence(open symbols) and presence (closed symbols) of thrombomodulin. Note the y-axis scaling.*p<0.0033 versus 100%
Machlus et al. Page 15
Thromb Haemost. Author manuscript; available in PMC 2010 November 1.
NIH
-PA Author Manuscript
NIH
-PA Author Manuscript
NIH
-PA Author Manuscript

Figure 5. Procoagulant factors and thrombomodulin differently influence ETP in PFP and PRPReactions were performed as in Fig 2. A) PFP(1 pM TF), B) PFP(5 pM TF), C) PRP(1 pM TF). Theshaded gray box encompasses the 100% value ±SEM. Data show means ±SEM for the absence(open symbols) and presence (closed symbols) of thrombomodulin. Note the y-axis scaling.*p<0.0033 versus 100%
Machlus et al. Page 16
Thromb Haemost. Author manuscript; available in PMC 2010 November 1.
NIH
-PA Author Manuscript
NIH
-PA Author Manuscript
NIH
-PA Author Manuscript

NIH
-PA Author Manuscript
NIH
-PA Author Manuscript
NIH
-PA Author Manuscript
Machlus et al. Page 17
Tabl
e 1
Bas
elin
e ch
arac
teri
stic
s (±S
D) o
f thr
ombi
n ge
nera
tion
in P
FP a
nd P
RP,
in th
e ab
senc
e an
d pr
esen
ce o
f 5 p
M th
rom
bom
odul
in (T
M)
PFP (
1 pM
TF)
PFP (
5 pM
TF)
PRP (
1 pM
TF)
-TM
+TM
-TM
+TM
-TM
+TM
LT
(min
)4.
5±
0.4
5.3
± 0.
5*2.
0±
0.2ˆ
2.4
± 0.
2*9.
7±
2.9ˆ
13.1
± 4.
4*
TT
P (m
in)
9.1
± 0.
68.
6±
0.6*
4.4
± 0.
3ˆ4.
5±
0.2
20.4
± 2.
9ˆ22
.0±
4.8
Peak
hei
ght (
nM)
197.
0±
30.2
35.9
± 16
.834
4.4
± 10
.4ˆ
296.
4±
22.2
*13
2.2
± 37
.6ˆ
52.6
± 15
.6*
ET
P (n
M.m
in)
1569
.1±
168.
819
7.9
± 90
.2*
1754
.7±
176.
2ˆ13
03.9
± 12
8.7*
1893
.6±
455.
3ˆ60
2.1
± 94
.9*
* p<0.
0001
vs.“
-TM
”.
ˆ p<0.
0001
vs.
“PFP
(I p
M T
F)-T
M”.
Thromb Haemost. Author manuscript; available in PMC 2010 November 1.

NIH
-PA Author Manuscript
NIH
-PA Author Manuscript
NIH
-PA Author Manuscript
Machlus et al. Page 18
Table 2Inter-assay variability (%CV) of thrombin generation in PFP
PFP(1 pM TF) PFP(5 pM TF)
-TM +TM -TM +TM
LT 8.4 9.2 10.8 9.8
TTP 6.4 7.0 5.8 5.3
Peak height 15.4 46.8 3.0 7.5
ETP 10.8 45.6 10.0 9.9
Thromb Haemost. Author manuscript; available in PMC 2010 November 1.

NIH
-PA Author Manuscript
NIH
-PA Author Manuscript
NIH
-PA Author Manuscript
Machlus et al. Page 19
Table 3Inter-individual variability (%CV) of thrombin generation in PRP
PRP(1 pM TF)
-TM +TM
LT 29.7 33.9
TTP 14.4 21.9
Peak height 28.4 29.7
ETP 24.0 15.8
Thromb Haemost. Author manuscript; available in PMC 2010 November 1.