Dispersal in stream-living brown trout (salmo trutta) Truls Næsje
31
Dispersal in stream-living brown trout (salmo trutta) Truls Næsje Master of Science thesis 2008 Department of Biology Centre for Ecological and University of Oslo Evolutionary Syntheses 1
-
Upload
khangminh22 -
Category
Documents
-
view
0 -
download
0
Transcript of Dispersal in stream-living brown trout (salmo trutta) Truls Næsje

Dispersal in stream-living
brown trout (salmo trutta)
Truls Næsje
Master of Science thesis
2008
Department of Biology Centre for Ecological and University of Oslo Evolutionary Syntheses
1
Preface
Preface
This project is part of a long-term mark-recapture project at CEES: Spatial and temporal
population structure and breeding system in stream-living brown trout: an integrated
ecological and genetic approach, which started in 1997.
Jeg er veldig glad for å ha vært en del av dette prosjektet med de gleder og utfordringer det
har ført med seg. Først av alle må Asbjørn Vøllestad takkes. Faglig kompetanse, tilgjengelig,
godt humør og ikke minst tålmodig er alle egenskaper som beskriver han bra. Takk for god
oppfølging både i tider hvor jeg visste jeg trengte det og de gangene jeg ikke selv var klar
over det. Takk til Dimitar Zerbezov, Esben Molland Olsen og Annette Taugbøl for noen, om
enn få, veldig fine og lærerike dager i felt. Dere fikk meg for en kveld til å føle meg ung igjen.
Alle som tidligere ha vært med å samle inn data slik at jeg kunne gjennomføre mine studier,
fortjener også en takk. Meget takknemlig for arbeidet som er lagt ned.
Rom 4419 har blitt et andre hjem til tider, men hva gjør vel det med en slik gjeng som holder
til der. Både faglige og langt mindre faglige diskusjoner og samtaler har aldri vært langt unna.
Takk til alle der som er eller har vært en del av skolehverdagen i to gode år.
Takk til dere blant familie og venner som med genuin interesse stiller spørsmål om oppgaven
og studielivet. Gløden for faget bygges raskt opp med slike mennesker rundt seg.
Etter en hektisk innspurt skjønner jeg etter hvert hvorfor man holder av siste avsnitt til sin
aller nærmeste. Takk til deg Silje for at du, med et smil, holder ut med meg mens stresset
bobler eller fortvilelsen render over. Du får meg raskt tilbake på banen igjen. Engasjement og
positivitet er alltid rett rundt hjørnet med deg i nærheten.
2
Table of contents
Table of contents
PREFACE ................................................................................................................................. 2
TABLE OF CONTENTS......................................................................................................... 3
ABSTRACT .............................................................................................................................. 4
INTRODUCTION.................................................................................................................... 5
The Restricted Movement Paradigm.............................................................................. 5
The brown trout .............................................................................................................. 6
Why dispersal ................................................................................................................. 6
METHODS ............................................................................................................................... 8
Study area ....................................................................................................................... 8
Sampling and analysis .................................................................................................... 9
RESULTS................................................................................................................................ 13
The brown trout population .......................................................................................... 13
Density and density of spawning fish........................................................................... 14
Dispersal ....................................................................................................................... 17
Summer dispersal.............................................................................................. 17
Winter dispersal................................................................................................ 20
Movement and growth.................................................................................................. 22
DISCUSSION ......................................................................................................................... 23
Restricted movement .................................................................................................... 23
Brown trout length........................................................................................................ 24
Maturity stage, sex and spawning movement............................................................... 24
Brown trout density, growth rate and dispersal direction............................................. 26
REFERENCES:...................................................................................................................... 28
3
Abstract
Abstract
Stream-living salmonids are known to show restricted movement behaviour, and to be
composed of both movers and stayers within the population. The small steam Bellbekken
holds a landlocked population of brown trout (Salmo trutta), and was used in this study to
qualitatively and quantitatively patterns of dispersal and home range movement.
Electrofishing was carried out in 25 sampling sites (mean length 60±16 meters) throughout
the stream, in a total of nine sampling sessions (four spring and five autumn sessions). The
brown trout were individually marked with Passive Integrated Transponder tags (PIT tag) and
visible implant elastomer (VIE) for later recognition. In total 3348 of the caught fish was
tagged and 1757 of these were later recaptured. Brown trout length, maturation stage and sex
as well as population density within each site was used to explain the patterns of movement.
In general, the brown trout showed a restricted movement pattern in all the four summer and
four winter periods, with only a few individuals performing long distance dispersal
movements out of the home range. Only the larger, mature brown trout seemed to stick out as
more mobile than other individuals in the stream, but only within the home range, indicating
that large fish have larger home ranges than smaller fish.
The overall brown trout densities in the stream were low and did lead to an increase in home
range activity during the summer periods. Amongst the brown trout that did move out of site
of first capture, the fish that moved upstream grew faster downstream movers. This may be
because fish with a poor initial condition do not have the energy to undertake upstream
movement.
4
Introduction
Introduction
“…dispersal is probably the most important life history trait involved in both species
persistence and evolution…” Clobert et al.(2001)
Dispersal can, in many populations and species, be an important life history trait. The reasons
for dispersal may also be many, both on a population scale and on a scale of fitness
maximization for an individual. Kin interaction, inbreeding avoidance (Clobert et al. 2001,
Gandon and Michalakis 2001), mate localisation and avoidance of extinction by change in
environmental factors (Hendry and Stearns 2004) are all recognised as population regulated
dispersal dynamics. Movement of organisms may also determine the spatial scale over which
population regulation occurs (Hastings 1993, Ray and Hastings 1996). In small populations,
dispersal out of the population may increase the risk of local extinction, while immigration
into the population may reduce the risk (Hanski 2001). There are also a variety of factors in
the environment close by the organism which can lead to condition-dependant dispersal (Ims
and Hjermann 2001).
The Restricted Movement Paradigm
The concept of restricted movement in stream-living fish was introduced in 1959 (Gerking),
and stated that adult stream-living fish has a restricted movement and spend most of their
lives in short stream reaches (20 – 50m). Until challenged by a review published in 1994
(Gowan et al.), the notion, later called the restricted-movement paradigm, was generally
accepted by stream ecologists. The critics used radiotelemetric studies to point out what they
meant was a higher mobility in stream-living fish. They also criticised the fashion earlier
studies treated the problem with fish never recaptured. These fish may be fish which have
carried out movement, but never recaptured. A response towards this argument came from
Rodriguez (2002). Lack of recapture may be due to movement, but the movement may be
low. So the number of fish not recaptured may be highly correlated with the length of the
home section (place of capture). An alternative to the traditional one-sided movement pattern
came at the same time. The two-sided movement model claim populations of stream-living
fish are composed of both stationary and highly mobile individuals (Skalski and Gilliam
2000, Rodriguez 2002) and both within and between populations the dispersal length may
wary among the movers. In general the proportion of movers in a population is low
5
Introduction
(Rodriguez 2002, Steingrimsson and Grant 2003, Wilson et al. 2004, Coombs and Rodriguez
2007, Heggenes et al. 2007)
The brown trout
The brown trout (Salmo trutta) originates from Europe with a wide spread on the continent
and has later been successfully introduced into at least 24 countries (Elliott 1994).
Great variations in general life cycle strategies are found and it may occupy different habitats
such as steams, rivers, lakes and costal waters. In the Northern Hemisphere the most usual
spawning time for stream-dwelling brown trout is November and December although
breeding has been recorded from October to March. The female makes a nest in clean gravel
of a certain size (normally 2-3 cm in diameter), then laying her eggs when the dominant male
is at her side to shed his sperm. Both males and females may spawn over several years (Elliott
1994). The development of the eggs depends mainly on water temperature with the alevins
staying in the nest after hatching, later emerging as fry from the gravel (Elliott 1994). Fry
dispersal abilities are low, but during the parr stage density dependent dispersal may bee high
(example on Atlantic salmon Einum and Nislow 2005, Einum et al. 2006).
Variation in life-history traits such as growth rate (Greenberg and Giller 2001, Vøllestad et al.
2002), age at maturation (Olsen and Vøllestad 2005) and investment and size in offspring may
occur both within and between populations.
Since site occupation explain a majority of the variation in consumption of prey (Utz and
Hartman 2006, Gowan 2007), the importance of defending ones site is easy to understand, and
the brown trout is highly territorial (Elliott 1994). The fish also follow a clear hierarchy model
and the dominance is settled by aggressive behaviour (Sundström et al. 2004b, Höjesjö et al.
2007). Throughout the life-history of a stream-living salmonid the habitat preferences may
vary. The preferences in cover, water depth and velocity and substrate on the water bed may
lead to niche shifts as the fish grow larger (reviewed in Heggenes et al. 1999). Larger and
more dominant fish also tend to have lager home ranges (area of displacement) than smaller
and subordinate fish (Elliott 1994, Höjesjö et al. 2007).
Why dispersal
We may find several advantages for showing site fidelity. There will be reduced energetic
costs during the movement, in establishing new territories and adaptation to new
environments. During movement there may be a lack of feeding opportunities, which can lead
to starvation. The period exposed to predators may also be reduced by being sedentary
6
Introduction
7
(Gandon and Michalakis 2001). So the advantages of dispersal must be large to compensate
for advantages of being sedentary. The reasons for dispersal may be plenty and complex, and
may be evolutionary (Hendry and Stearns 2004) or it can be onset by conditions in and around
the stream (condition-dependent dispersal) (Ims and Hjermann 2001). The characteristics
leading to condition-dependant dispersal for stream-living fish may be numerous, ranging
amongst physical and chemical characteristics of the water, characteristics of adjacent
substratum and structure, positioning to the structural characteristics of the stream and
presence or absence of own or other species (Kramer et al. 1997). During the early life-stages
salmonids often show a tendency for density-dependant dispersal (Einum and Nislow 2005,
Einum et al. 2006). During the parr stage the fish avoids dispersal until a situation of high
density occurs and a displacement to get to a less habituated patch is inevitable. Later in life
we may find differences in movement amongst dominant and subordinate (Höjesjö et al.
2007), among the different size classes in the population (Skalski and Gilliam 2000) and
between males and females (Atlantic salmon Pirhonen et al. 1998, brook trout Hutchings and
Gerber 2002). Stream-living brown trout often undertake both short and long ranged
movement to get to suitable spawning areas. This movement takes place right before
spawning, and is carried out by mature fish (both males and females) of a certain size (Elliott
1994, Hendry and Stearns 2004). This spawning-time movement often lead to a larger overlap
of the home ranges of the fish and higher fish densities (Höjesjö et al. 2007).
Flooding is a major source to amongst-year variations in the different habitats in the stream
making variations in gravel composition (Giberson and Caissie 1998). Stream dwelling fish
may undertake movement and dispersal as a response to these variations (Gowan and Fausch
2002, Hendry and Stearns 2004).
The objective of this study is to look at the pattern behind dispersal for stream-dwelling
brown trout in a small stream in Norway. Trough different summer and winter movement
periods, the dynamics behind the dispersal for the fish will be elucidated by looking at
differences in displacement patterns for brown trout of different lengths, ages, maturity stages
and sexes. The aspect of brown trout density on movement will also be visited, as well as the
growth rate advantages associated with dispersal. I would expect an increased in home range
activity rate throughout the year and a higher rate of dispersal in the summer period, before
spawning, carried out by the larger and mature part of the brown trout population.
Methods
Methods
Study area
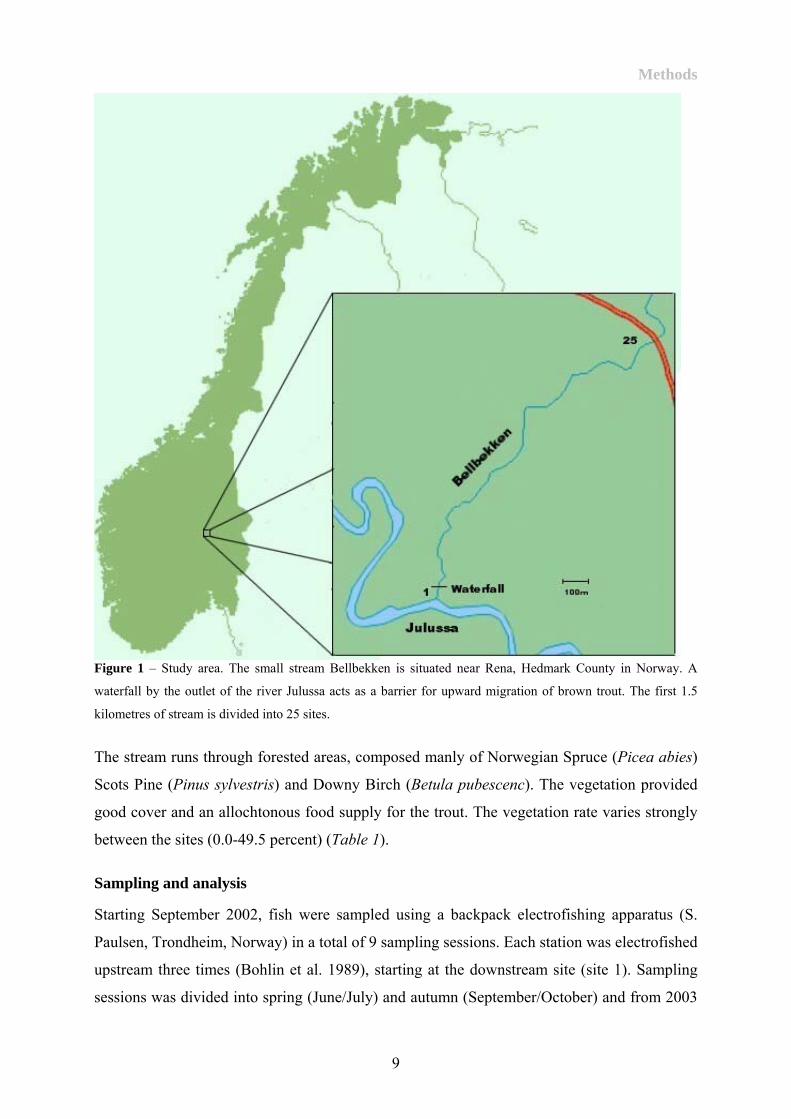
The small stream Bellbekken is situated near Rena, Hedmark County in Norway (Figure 1). A
waterfall by the outlet of the river Julussa acts as a barrier for upward migration and has led to
an extrinsic isolation of a landlocked population of brown trout (Salmo trutta) (Taugbøl
2008). The stream also holds a small population of alpine bullheads (Cottus poecilopus)
(Olsen and Vøllestad 2005), and is believed to experience natural predation from dipper
(Cinclus cinclus), ducks (Mergus spp.), herons (Ardea cinerea) and mink (Mustela vison), but
little angling stress.
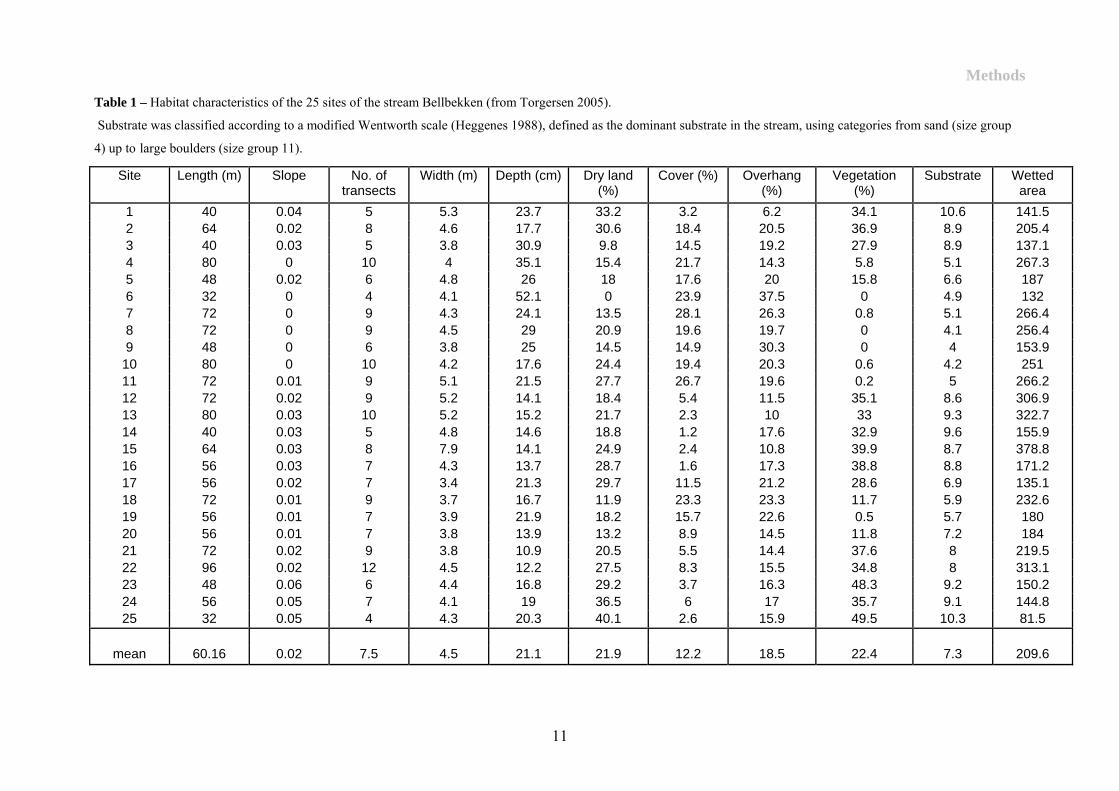
The stream has been partitioned into 25 sites, spanning 1.5 km from the outlet to Julussa
(mean site length 60.16±6.67(SE)m ranging from 32 to 96m) (Table 1). The habitat in
Bellbekken was characterised in August 2004 at low summer flow (Torgersen 2005). The first
1.5 km of the stream was divided into 25 stations with a mean length of. Transects was made
with an interval of 8 m in each site. These transects was then divided into 50*50cm areas. The
values was given as the average of the transects within the site (Table 1). The stream is
narrow (4.46±0.35m) and shallow (21.1±3.56cm). The characteristics show great variations in
the stream. The slope divides the stream into 5 different areas, 3 fast running, high sloped
areas (stations 1-5, 12-17 and 21-25) and 2 slower running, flatter areas (stations 6-11 and
18-20). 2 areas with relatively little vegetations are found between stations 6-11 and at station
19. This correlates somewhat with the substrate categories throughout the stream. There is
generally more cover and overhang and less vegetation in the areas with shallower slope.
8
Methods
Figure 1 – Study area. The small stream Bellbekken is situated near Rena, Hedmark County in Norway. A
waterfall by the outlet of the river Julussa acts as a barrier for upward migration of brown trout. The first 1.5
kilometres of stream is divided into 25 sites.
The stream runs through forested areas, composed manly of Norwegian Spruce (Picea abies)
Scots Pine (Pinus sylvestris) and Downy Birch (Betula pubescenc). The vegetation provided
good cover and an allochtonous food supply for the trout. The vegetation rate varies strongly
between the sites (0.0-49.5 percent) (Table 1).
Sampling and analysis
Starting September 2002, fish were sampled using a backpack electrofishing apparatus (S.
Paulsen, Trondheim, Norway) in a total of 9 sampling sessions. Each station was electrofished
upstream three times (Bohlin et al. 1989), starting at the downstream site (site 1). Sampling
sessions was divided into spring (June/July) and autumn (September/October) and from 2003
9
Methods
10
until 2006 sampling was carried out in both periods. Normally the sites were sampled within
4-5 days, but during some sampling sessions, sampling had to be interrupted due to heavy rain
and increasing water flow. Sampling was then resumed when the water level had receded.
After capture the fish was sedated using Bensocaine. Fish captured for the first time was
marked using Passive Integrated Transponder tags (PIT tag) injected in the ventral part of the
peritoneal cavity, giving each fish a personal code (Prentice 1990, Olsen and Vøllestad
2001a). Brown trout too small for tagging (ca 60 mm) and mature females with a high
probability of losing the tag during spawning was marked with visible implant elastomer
(VIE)(Skalski and Gilliam 2000, Olsen and Vøllestad 2001b) giving each fish an individual
colour code. Scale samples were taken from new fish at the caudal peduncle for later age
determination (Jonsson 1976, Jonsson and Stenseth 1976), sex was determined in the autumn
session when possible and fork length was measured to the nearest mm. The adipose fin was
cut off enabling recognition of previously captured fish. Tagging, sex determination and fork
length measurement was made by the same two people during all 9 sampling sessions. After
full recovery the brown trout was released close to the middle of its designated station.
A total of 8320 brown trout was captured, of which 3113 were recaptures (Table 2).
Methods
Table 1 – Habitat characteristics of the 25 sites of the stream Bellbekken (from Torgersen 2005). Substrate was classified according to a modified Wentworth scale (Heggenes 1988), defined as the dominant substrate in the stream, using categories from sand (size group
4) up to large boulders (size group 11).
Site Length (m) Slope No. of transects
Width (m) Depth (cm) Dry land (%)
Cover (%) Overhang (%)
Vegetation (%)
Substrate Wetted area
1 40 0.04 5 5.3 23.7 33.2 3.2 6.2 34.1 10.6 141.5 2 64 0.02 8 4.6 17.7 30.6 18.4 20.5 36.9 8.9 205.4 3 40 0.03 5 3.8 30.9 9.8 14.5 19.2 27.9 8.9 137.1 4 80 0 10 4 35.1 15.4 21.7 14.3 5.8 5.1 267.3 5 48 0.02 6 4.8 26 18 17.6 20 15.8 6.6 187 6 32 0 4 4.1 52.1 0 23.9 37.5 0 4.9 132 7 72 0 9 4.3 24.1 13.5 28.1 26.3 0.8 5.1 266.4 8 72 0 9 4.5 29 20.9 19.6 19.7 0 4.1 256.4 9 48 0 6 3.8 25 14.5 14.9 30.3 0 4 153.9
10 80 0 10 4.2 17.6 24.4 19.4 20.3 0.6 4.2 251 11 72 0.01 9 5.1 21.5 27.7 26.7 19.6 0.2 5 266.2 12 72 0.02 9 5.2 14.1 18.4 5.4 11.5 35.1 8.6 306.9 13 80 0.03 10 5.2 15.2 21.7 2.3 10 33 9.3 322.7 14 40 0.03 5 4.8 14.6 18.8 1.2 17.6 32.9 9.6 155.9 15 64 0.03 8 7.9 14.1 24.9 2.4 10.8 39.9 8.7 378.8 16 56 0.03 7 4.3 13.7 28.7 1.6 17.3 38.8 8.8 171.2 17 56 0.02 7 3.4 21.3 29.7 11.5 21.2 28.6 6.9 135.1 18 72 0.01 9 3.7 16.7 11.9 23.3 23.3 11.7 5.9 232.6 19 56 0.01 7 3.9 21.9 18.2 15.7 22.6 0.5 5.7 180 20 56 0.01 7 3.8 13.9 13.2 8.9 14.5 11.8 7.2 184 21 72 0.02 9 3.8 10.9 20.5 5.5 14.4 37.6 8 219.5 22 96 0.02 12 4.5 12.2 27.5 8.3 15.5 34.8 8 313.1 23 48 0.06 6 4.4 16.8 29.2 3.7 16.3 48.3 9.2 150.2 24 56 0.05 7 4.1 19 36.5 6 17 35.7 9.1 144.8 25 32 0.05 4 4.3 20.3 40.1 2.6 15.9 49.5 10.3 81.5
mean 60.16 0.02 7.5 4.5 21.1 21.9 12.2 18.5 22.4 7.3 209.6
11

Methods
Table 2 – Summary of captured and recaptured brown trout sampled in Bellbekken during 9 sampling sessions,
with variations in start and end dates in both the autumn and spring sessions.
Sampling periode Timeframe # fish captured, N Recaptures 2002 Autumn 23/9 - 22/10 870 2003 Spring 30/6 - 3/7 637 169 2003 Autumn 22/9 - 2/10 652 220 2004 Spring 15/6 - 18/6 1052 327 2004 Autumn 13/9 - 1/10 1091 483 2005 Spring 27/6 - 30/6 1061 472 2005 Autumn 12/9 - 16/9 1150 547 2006 Spring 19/6 - 21/6 856 465 2006 Autumn 18/9 - 21/9 951 430 Total 8320 3113
Brown trout movement was analysed in several different was. First, data was divided into
summer (from spring to autumn) and winter periods (from autumn to spring) and analysed
separately. During the summer period activity amongst the fish may be high and growth
higher than in the winter period. Summer displacement for the mature trout may be an effect
of movement towards habitats suitable for spawning (Burrell et al. 2000, Höjesjö et al. 2007).
I also wanted to analyse two different types of movement. Because brown trout home ranges
may be large (131 meters river length in Young et al. 1997, less than 270 meters river length
in Burrell et al. 2000, 281 meters river length in Höjesjö et al. 2007), and activity and
movement within the range high (Ovidio et al. 2002), I wanted to eliminate home range
movement from the dispersal. The home range was defined as the site of first capture and the
closest site both down- and upstream (giving a mean home range length of 180.48 meters).
General movement for the fish will be defined as all movement away from the site of first
recapture (movement ≥1 site), while dispersal will be defined as movement away from the
home range (movement >1 site).
Probability to move may be influenced by a few parameters. These may be parameters such as
length, maturation stage, sex and site density. A lot of questions which need answering may
arise from this. Does brown trout of a higher length move/disperse more often, or maybe
longer distances, than shorter fish (assigned as the length before movement (summer
period/spring length, winter period/autumn length))(Diana et al. 2004)? Do mature individuals
have a higher rate of movement than immature ones? Can I find differences betweens males
12
Results
and females in probability of movement (Hutchings and Gerber 2002)? Has high brown trout
densities at site of first capture made fish move away from their site or home range?
In terms of looking for any possible advantages or disadvantages, I wanted to see if growth
was affected by movement. Do movers have a higher growth rate than fish staying within
theire home range (Steingrimsson and Grant 2003)? Time between each sampling period
varied between years (Table 2). This made calculations necessary for growth. Specific growth
rate (G) was estimated as;
*100 ln L2 - ln L1 t
were L1 and L2 is the spring and autumn length respectively and t is the total number of days
between sampling sessions, giving G in percent growth per day (%day-1). Because growth is
limited during the winter period (Klemetsen et al. 2003), G, and further analyses with G, was
only estimated for the summer period (from spring to autumn).
Density was estimated as abundance pr m² wetted area (Table 1). To avoid overestimation of
catchability, due to differences in both water level and ice cover (2002), population
abundance was estimated for each station and sampling period using the Zippin removal
model described by Bohlin, Hamrin et al. (1989).
All analyses were done in JMP, Statistical Discovery Software, SAS Institute. Because of
skewed and non-normal data in this study, non-parametric statistical models were used.
Results
The brown trout population
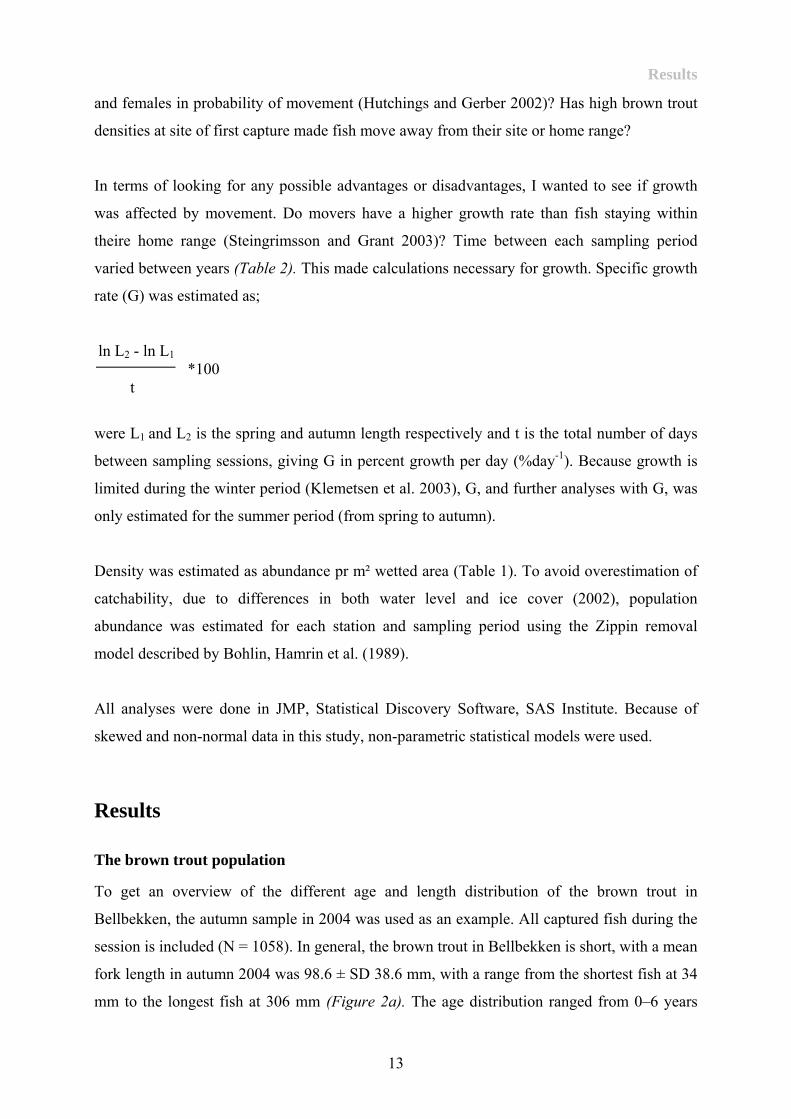
To get an overview of the different age and length distribution of the brown trout in
Bellbekken, the autumn sample in 2004 was used as an example. All captured fish during the
session is included (N = 1058). In general, the brown trout in Bellbekken is short, with a mean
fork length in autumn 2004 was 98.6 ± SD 38.6 mm, with a range from the shortest fish at 34
mm to the longest fish at 306 mm (Figure 2a). The age distribution ranged from 0–6 years
13
Results
14
with the highest number of trout in the age class of 2 years (325 fish) and only 15 trout in the
age of 6 years (Figure 2b). During the same sampling session the number of immature fish
was 251 and the number of mature fish 123 giving almost a ratio of 2:1. The first brown trout
became mature at lengths of 120 mm and at the age of 2 years. At lengths of 170 mm, almost
all the fish was mature. The same can be sad at the age of 5 years. Amongst the mature fish,
73 was female and 50 male. a)
No
fish
b)
Brown trout length in mm
No
fish
Brown trout age in years
Figure 2 – Length in mm (a) and age in years (b) distribution of brown trout in Bellbekken sampled during
autumn 2004. Red bars indicate mature brown trout.
Density and density of spawning fish
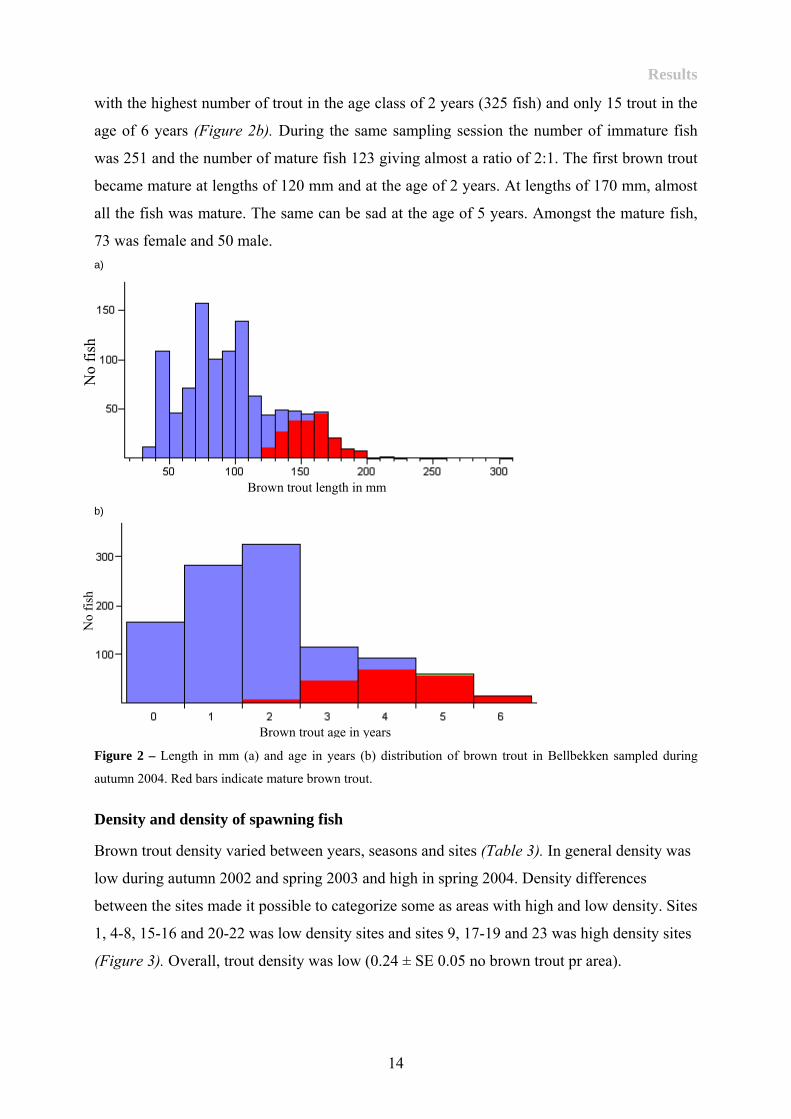
Brown trout density varied between years, seasons and sites (Table 3). In general density was
low during autumn 2002 and spring 2003 and high in spring 2004. Density differences
between the sites made it possible to categorize some as areas with high and low density. Sites
1, 4-8, 15-16 and 20-22 was low density sites and sites 9, 17-19 and 23 was high density sites
(Figure 3). Overall, trout density was low (0.24 ± SE 0.05 no brown trout pr area).
Results
Table 3 – Brown trout density at each site during the 9 samplings sessions, from autumn 2002 – autumn 2006 (A = autumn, S = spring). All values estimated as brown trout
abundance pr wetted area (m²).
*) Density could not be estimated with precision.
2002 A 2003 S 2003 A 2004 S 2004 A 2005 S 2005 A 2006 S 2006 A 1 0.22 ± 0.01 0.13 ± 0.23 0.13 ± 0.23 0.04 ± 0.00 0.16 ± 0.10 0.07 ± 0.02 0.08 ± 0.01 0.07 ± 0.02 0.19 ± 0.02 2 0.23 ± 0.03 0.24 ± 0.12 0.20 ± 0.07 0.22 ± 0.03 0.23 ± 0.01 0.25 ± 0.02 0.33 ± 0.13 0.35 ± 0.03 0.20 ± 0.02 3 0.17 ± 0.01 0.08 ± 0.01 0.10 ± 0.01 0.22 ± 0.08 0.16 ± 0.01 0.22 ± 0.06 0.41 ± 0.41 0.23 ± 0.06 0.22 ± 0.17 4 0.13 ± 0.01 * 0.14 ± 0.01 0.30 ± 0.08 0.19 ± 0.05 0.17 ± 0.03 0.21 ± 0.04 0.16 ± 0.08 0.19 ± 0.02 5 0.13 ± 0.01 0.12 ± 0.03 0.11 ± 0.02 0.22 ± 0.01 0.23 ± 0.03 0.17 ± 0.02 0.19 ± 0.01 0.23 ± 0.04 * 6 0.21 ± 0.11 0.19 ± 0.07 0.09 ± 0.03 * 0.21 ± 0.11 0.17 ± 0.11 * * * 7 0.12 ± 0.01 * 0.11 ± 0.03 0.25 ± 0.04 0.21 ± 0.06 0.18 ± 0.01 0.14 ± 0.00 0.12 ± 0.02 0.23 ± 0.02 8 0.20 ± 0.01 0.10 ± 0.03 0.08 ± 0.07 * 0.13 ± 0.01 0.25 ± 0.10 0.17 ± 0.03 * 0.18 ± 0.02 9 0.35 ± 0.02 0.20 ± 0.02 0.13 ± 0.01 0.41 ± 0.13 0.27 ± 0.04 0.25 ± 0.02 0.35 ± 0.05 0.21 ± 0.09 0.51 ± 0.45 10 0.22 ± 0.03 0.16 ± 0.03 * 0.27 ± 0.01 0.17 ± 0.03 0.40 ± 0.10 0.33 ± 0.06 0.22 ± 0.04 0.11 ± 0.01 11 0.27 ± 0.04 0.17 ± 0.01 0.12 ± 0.01 0.34 ± 0.04 0.22 ± 0.02 0.26 ± 0.05 0.32 ± 0.03 0.32 ± 0.17 0.36 ± 0.10 12 0.16 ± 0.01 0.16 ± 0.08 0.13 ± 0.03 0.32 ± 0.02 0.21 ± 0.01 0.34 ± 0.01 0.30 ± 0.04 0.28 ± 0.01 0.19 ± 0.01 13 0.10 ± 0.01 0.21 ± 0.02 * 0.23 ± 0.02 0.20 ± 0.01 0.64 ± 0.52 0.21 ± 0.01 0.17 ± 0.01 0.19 ± 0.01 14 0.18 ± 0.03 0.17 ± 0.03 0.05 ± 0.01 * 0.24 ± 0.04 0.32 ± 0.02 0.24 ± 0.03 0.21 ± 0.08 * 15 * 0.14 ± 0.07 * 0.14 ± 0.01 0.09 ± 0.02 0.11 ± 0.01 0.08 ± 0.01 0.10 ± 0.00 0.10 ± 0.02 16 0.13 ± 0.03 0.16 ± 0.01 0.12 ± 0.03 0.24 ± 0.03 0.20 ± 0.05 0.24 ± 0.02 0.19 ± 0.00 0.14 ± 0.02 0.13 ± 0.01 17 0.26 ± 0.02 0.31 ± 0.13 * 0.50 ± 0.12 0.39 ± 0.03 0.34 ± 0.03 0.50 ± 0.16 0.26 ± 0.02 0.28 ± 0.04 18 0.19 ± 0.01 * 0.27 ± 0.09 0.35 ± 0.02 0.33 ± 0.04 0.29 ± 0.02 0.26 ± 0.03 0.26 ± 0.02 0.24 ± 0.04 19 * 0.28 ± 0.11 * 0.33 ± 0.03 0.34 ± 0.01 * 0.20 ± 0.01 0.25 ± 0.01 0.30 ± 0.02 20 0.08 ± 0.01 0.21 ± 0.13 0.21 ± 0.03 0.19 ± 0.06 0.23 ± 0.01 0.20 ± 0.02 0.23 ± 0.02 * 0.19 ± 0.02 21 0.13 ± 0.03 0.12 ± 0.01 0.09 ± 0.01 0.20 ± 0.01 0.14 ± 0.01 0.20 ± 0.03 0.19 ± 0.01 0.22 ± 0.03 0.16 ± 0.01 22 0.13 ± 0.02 0.18 ± 0.18 0.06 ± 0.00 0.15 ± 0.02 0.13 ± 0.01 0.33 ± 0.14 0.18 ± 0.06 0.13 ± 0.01 0.16 ± 0.03 23 0.15 ± 0.02 * 0.19 ± 0.05 1.53 ± 0.00 0.27 ± 0.23 0.27 ± 0.01 0.29 ± 0.05 0.17 ± 0.02 0.34 ± 0.05 24 * 0.19 ± 0.07 0.12 ± 0.02 0.24 ± 0.04 0.22 ± 0.03 0.37 ± 0.13 0.31 ± 0.03 0.29 ± 0.02 0.28 ± 0.05 25 * 0.08 ± 0.02 * 0.29 ± 0.03 0.33 ± 0.02 0.22 ± 0.02 0.26 ± 0.05 0.25 ± 0.01 0.35 ± 0.11
Total 0.19 ± 0.02 0.17 ± 0.07 0.22 ± 0.10 0.32 ± 0.04 0.22 ± 0.04 0.26 ± 0.06 0.25 ± 0.05 0.26 ± 0.04 0.26 ± 0.06
15
Results
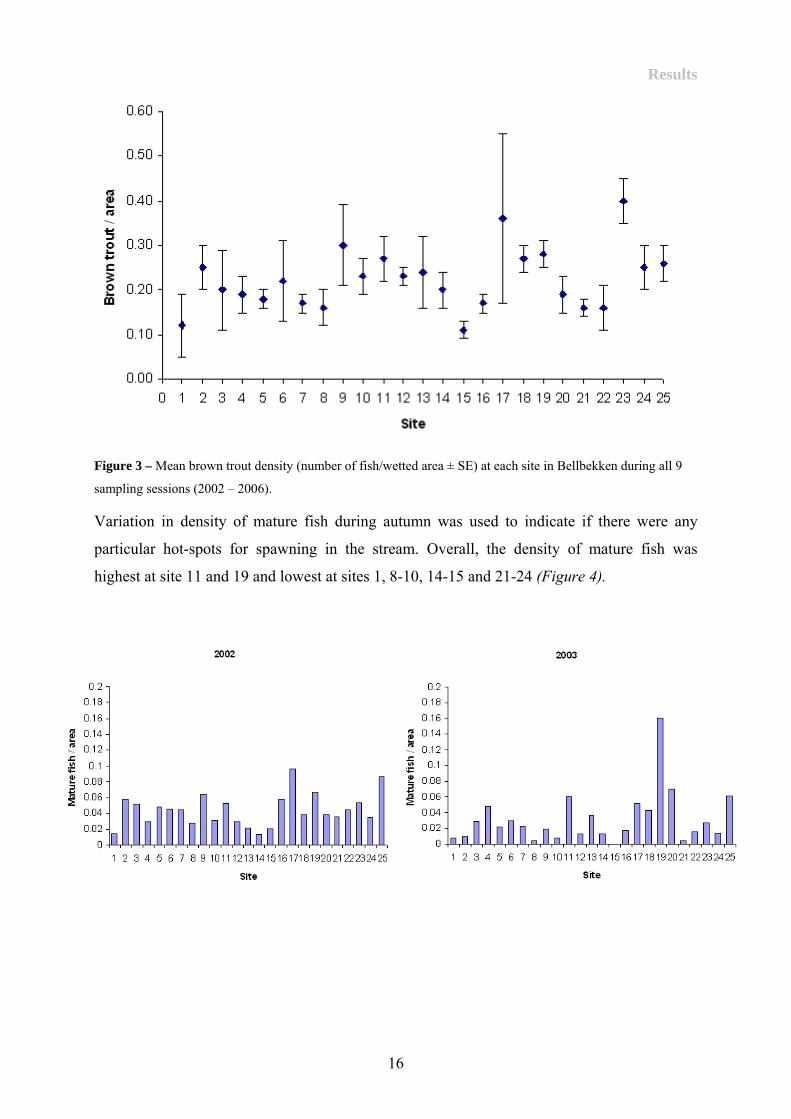
Figure 3 – Mean brown trout density (number of fish/wetted area ± SE) at each site in Bellbekken during all 9
sampling sessions (2002 – 2006).
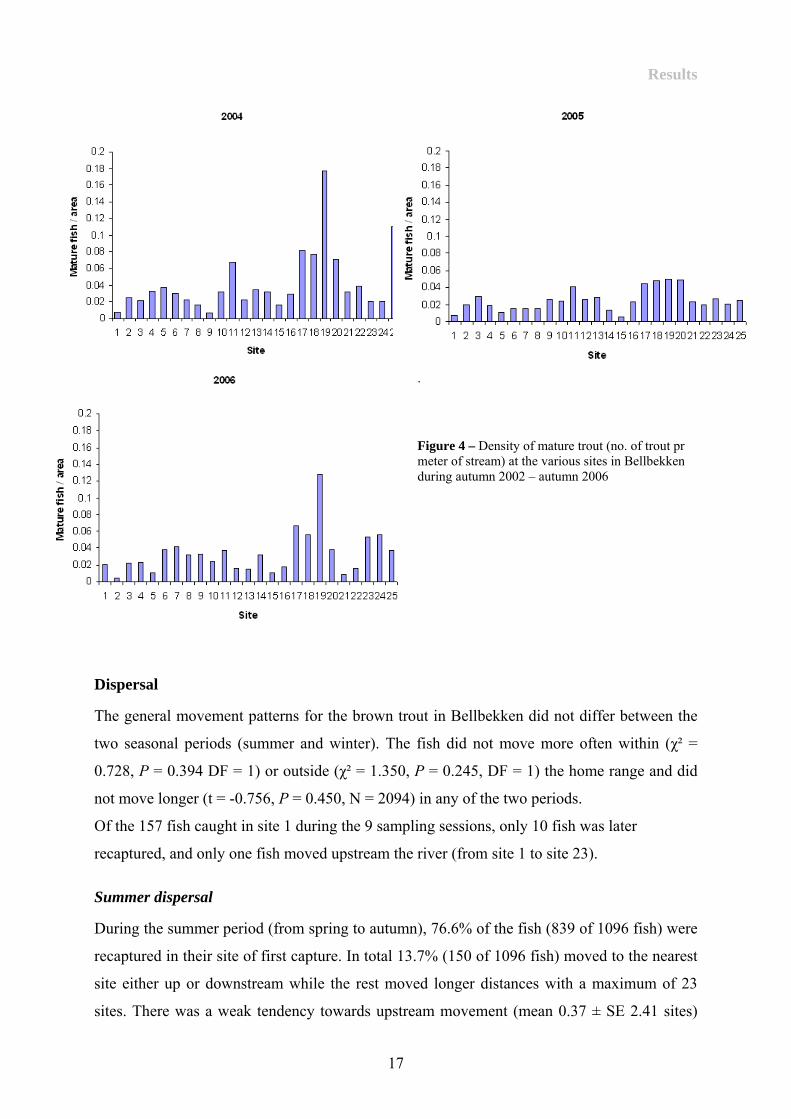
Variation in density of mature fish during autumn was used to indicate if there were any
particular hot-spots for spawning in the stream. Overall, the density of mature fish was
highest at site 11 and 19 and lowest at sites 1, 8-10, 14-15 and 21-24 (Figure 4).
16
Results
.
Figure 4 – Density of mature trout (no. of trout pr meter of stream) at the various sites in Bellbekken during autumn 2002 – autumn 2006
Dispersal
The general movement patterns for the brown trout in Bellbekken did not differ between the
two seasonal periods (summer and winter). The fish did not move more often within (χ² =
0.728, P = 0.394 DF = 1) or outside (χ² = 1.350, P = 0.245, DF = 1) the home range and did
not move longer (t = -0.756, P = 0.450, N = 2094) in any of the two periods.
Of the 157 fish caught in site 1 during the 9 sampling sessions, only 10 fish was later
recaptured, and only one fish moved upstream the river (from site 1 to site 23).
Summer dispersal
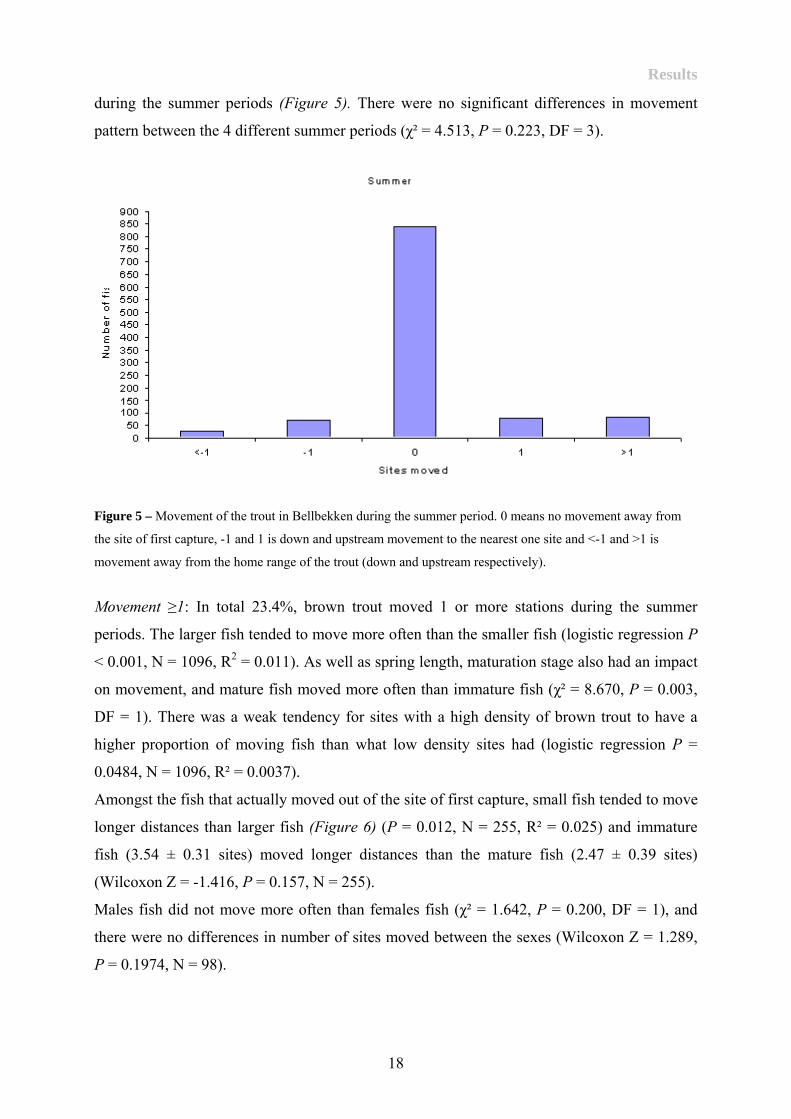
During the summer period (from spring to autumn), 76.6% of the fish (839 of 1096 fish) were
recaptured in their site of first capture. In total 13.7% (150 of 1096 fish) moved to the nearest
site either up or downstream while the rest moved longer distances with a maximum of 23
sites. There was a weak tendency towards upstream movement (mean 0.37 ± SE 2.41 sites)
17
Results
during the summer periods (Figure 5). There were no significant differences in movement
pattern between the 4 different summer periods (χ² = 4.513, P = 0.223, DF = 3).
Figure 5 – Movement of the trout in Bellbekken during the summer period. 0 means no movement away from
the site of first capture, -1 and 1 is down and upstream movement to the nearest one site and <-1 and >1 is
movement away from the home range of the trout (down and upstream respectively).
Movement ≥1: In total 23.4%, brown trout moved 1 or more stations during the summer
periods. The larger fish tended to move more often than the smaller fish (logistic regression P
< 0.001, N = 1096, R2 = 0.011). As well as spring length, maturation stage also had an impact
on movement, and mature fish moved more often than immature fish (χ² = 8.670, P = 0.003,
DF = 1). There was a weak tendency for sites with a high density of brown trout to have a
higher proportion of moving fish than what low density sites had (logistic regression P =
0.0484, N = 1096, R² = 0.0037).
Amongst the fish that actually moved out of the site of first capture, small fish tended to move
longer distances than larger fish (Figure 6) (P = 0.012, N = 255, R² = 0.025) and immature
fish (3.54 ± 0.31 sites) moved longer distances than the mature fish (2.47 ± 0.39 sites)
(Wilcoxon Z = -1.416, P = 0.157, N = 255).
Males fish did not move more often than females fish (χ² = 1.642, P = 0.200, DF = 1), and
there were no differences in number of sites moved between the sexes (Wilcoxon Z = 1.289,
P = 0.1974, N = 98).
18

Results
Dispersal >1: In total, 9.7% of the trout dispersed longer than to their nearest neighbouring
site during the summer period. There was no indications that the brown trout length during
spring (logistic regression P = 0.694, N = 1096, R² = 0.000), maturation stage (χ² = 0.932, P =
0.3301, DF = 1) or density at the spring site (logistic regression P = 0.194, N = 1095, R² =
0.002) made any difference on dispersal.
Amongst the individuals that dispersed out of their home range during the summer period,
there were no indication that length influenced fish distances moved (P = 0.136, N = 105, R²
= 0.021). The immature dispersing fish (6.67 ± 0.57 sites) moved longer distances than the
mature fish (4.87 ± 0.77 sites) (Wilcoxon Z = -1.765, P = 0.0776, N = 105).
A weak tendency was found that male fish dispersed more often than female fish (χ² = 3.755,
P = 0.526, DF = 1). Neither males nor females dispersed longer distances than the other sex
during the summer period (Wilcoxon Z = 0.373, P = 0.7093, N = 36).
Figure 6 – Relation between brown trout length during spring and absolute distance moved (sites). Only fish
moving ≥ 1 site included, all years (2002 – 2006) pooled. (R² = 0.025, P = 0.017, N = 255).
19
Results
Winter dispersal
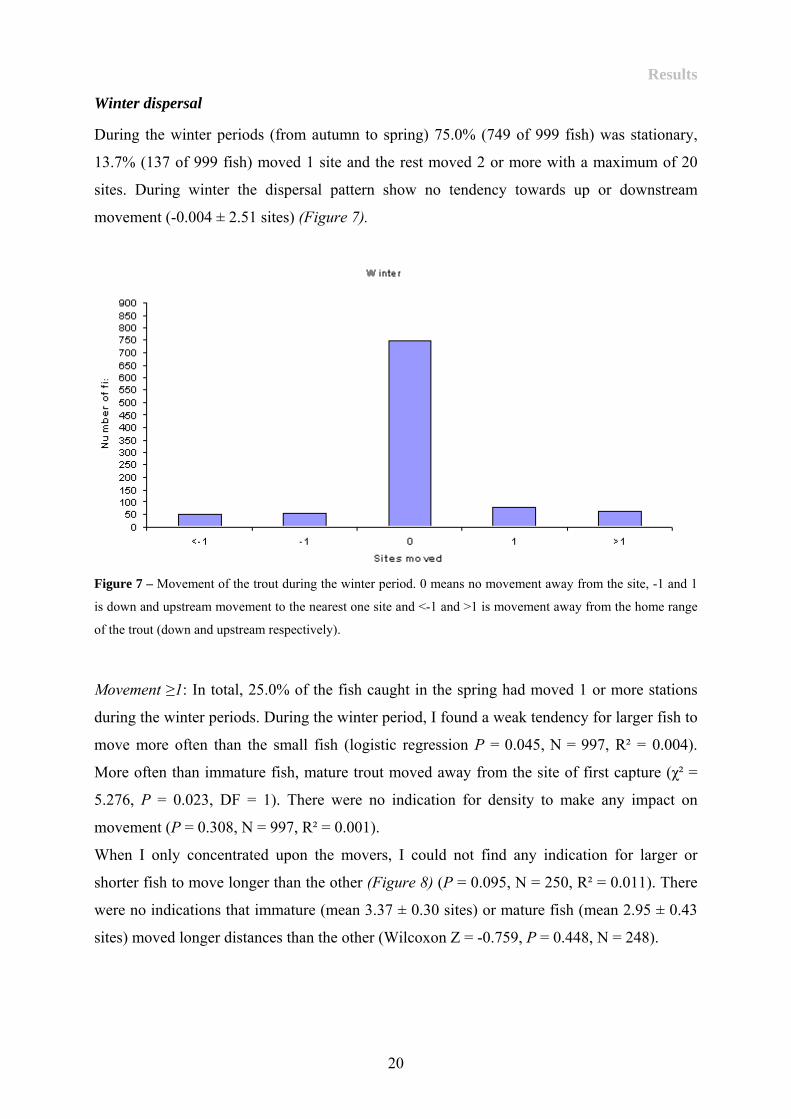
During the winter periods (from autumn to spring) 75.0% (749 of 999 fish) was stationary,
13.7% (137 of 999 fish) moved 1 site and the rest moved 2 or more with a maximum of 20
sites. During winter the dispersal pattern show no tendency towards up or downstream
movement (-0.004 ± 2.51 sites) (Figure 7).
Figure 7 – Movement of the trout during the winter period. 0 means no movement away from the site, -1 and 1
is down and upstream movement to the nearest one site and <-1 and >1 is movement away from the home range
of the trout (down and upstream respectively).
Movement ≥1: In total, 25.0% of the fish caught in the spring had moved 1 or more stations
during the winter periods. During the winter period, I found a weak tendency for larger fish to
move more often than the small fish (logistic regression P = 0.045, N = 997, R² = 0.004).
More often than immature fish, mature trout moved away from the site of first capture (χ² =
5.276, P = 0.023, DF = 1). There were no indication for density to make any impact on
movement (P = 0.308, N = 997, R² = 0.001).
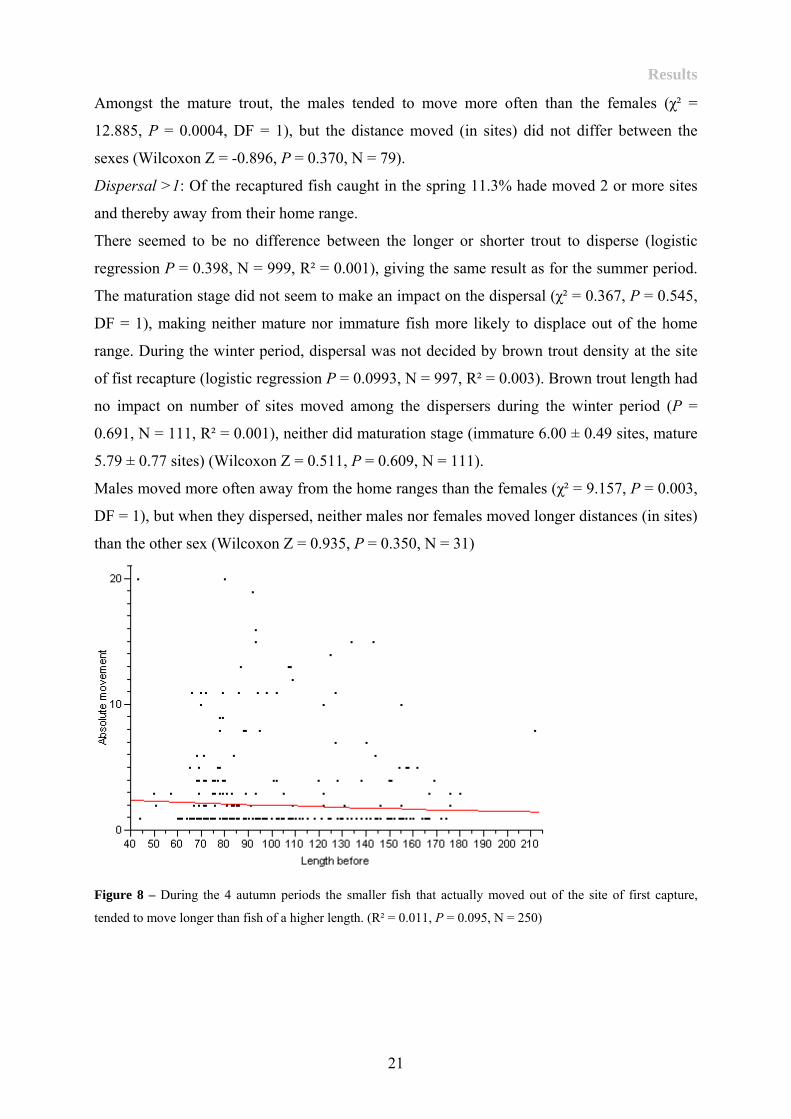
When I only concentrated upon the movers, I could not find any indication for larger or
shorter fish to move longer than the other (Figure 8) (P = 0.095, N = 250, R² = 0.011). There
were no indications that immature (mean 3.37 ± 0.30 sites) or mature fish (mean 2.95 ± 0.43
sites) moved longer distances than the other (Wilcoxon Z = -0.759, P = 0.448, N = 248).
20
Results
Amongst the mature trout, the males tended to move more often than the females (χ² =
12.885, P = 0.0004, DF = 1), but the distance moved (in sites) did not differ between the
sexes (Wilcoxon Z = -0.896, P = 0.370, N = 79).
Dispersal >1: Of the recaptured fish caught in the spring 11.3% hade moved 2 or more sites
and thereby away from their home range.
There seemed to be no difference between the longer or shorter trout to disperse (logistic
regression P = 0.398, N = 999, R² = 0.001), giving the same result as for the summer period.
The maturation stage did not seem to make an impact on the dispersal (χ² = 0.367, P = 0.545,
DF = 1), making neither mature nor immature fish more likely to displace out of the home
range. During the winter period, dispersal was not decided by brown trout density at the site
of fist recapture (logistic regression P = 0.0993, N = 997, R² = 0.003). Brown trout length had
no impact on number of sites moved among the dispersers during the winter period (P =
0.691, N = 111, R² = 0.001), neither did maturation stage (immature 6.00 ± 0.49 sites, mature
5.79 ± 0.77 sites) (Wilcoxon Z = 0.511, P = 0.609, N = 111).
Males moved more often away from the home ranges than the females (χ² = 9.157, P = 0.003,
DF = 1), but when they dispersed, neither males nor females moved longer distances (in sites)
than the other sex (Wilcoxon Z = 0.935, P = 0.350, N = 31)
Figure 8 – During the 4 autumn periods the smaller fish that actually moved out of the site of first capture,
tended to move longer than fish of a higher length. (R² = 0.011, P = 0.095, N = 250)
21
Results
22
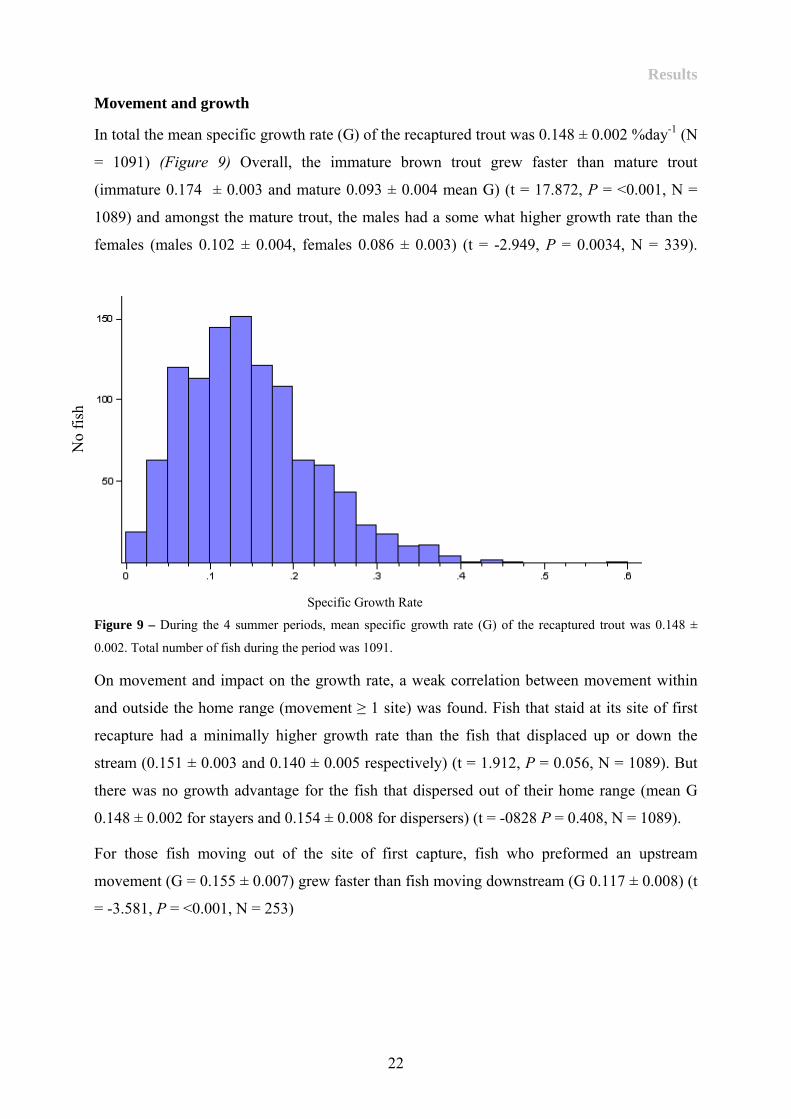
Movement and growth
In total the mean specific growth rate (G) of the recaptured trout was 0.148 ± 0.002 %day-1 (N
= 1091) (Figure 9) Overall, the immature brown trout grew faster than mature trout
(immature 0.174 ± 0.003 and mature 0.093 ± 0.004 mean G) (t = 17.872, P = <0.001, N =
1089) and amongst the mature trout, the males had a some what higher growth rate than the
females (males 0.102 ± 0.004, females 0.086 ± 0.003) (t = -2.949, P = 0.0034, N = 339).
No
fish
Figure 9 – During the 4 summer periods, mean specific growth rate (G) of the recaptured trout was 0.148 ±
0.002. Total number of fish during the period was 1091.
Specific Growth Rate
On movement and impact on the growth rate, a weak correlation between movement within
and outside the home range (movement ≥ 1 site) was found. Fish that staid at its site of first
recapture had a minimally higher growth rate than the fish that displaced up or down the
stream (0.151 ± 0.003 and 0.140 ± 0.005 respectively) (t = 1.912, P = 0.056, N = 1089). But
there was no growth advantage for the fish that dispersed out of their home range (mean G
0.148 ± 0.002 for stayers and 0.154 ± 0.008 for dispersers) (t = -0828 P = 0.408, N = 1089).
For those fish moving out of the site of first capture, fish who preformed an upstream
movement (G = 0.155 ± 0.007) grew faster than fish moving downstream (G 0.117 ± 0.008) (t
= -3.581, P = <0.001, N = 253)
Discussion
Discussion
The study in Bellbekken was conducted in 9 sampling sessions giving 8 individual dispersal
periods, 4 during the winter and 4 during the summer. The individual movement or dispersal
pattern of a specific brown trout was only follow during one of these rather short periods,
separate from other periods. Therefore, the whole movement history of a specific fish was not
looked upon. In total 3348 of the caught fish was tagged and 1757 of these fish was later
recaptured at one or numerous occasions, which gives the study a recapture-rate of 52.5 %.
Throughout these 4 years of monitoring the brown trout movement in the stream, the fish
showed modest dispersal behaviour, with very little movement between the sites. Only the
larger, mature brown trout seemed to stand out as more mobile than other individuals in the
stream, but only in the home range scale. The brown trout densities in the stream were rather
low on average, and did only seem to affect movement within the home range in the summer
periods. Amongst the moving individuals in this study, a higher growth rate was found for the
upstream moving fish than for the downstream movers.
The high turnover rate and lack of upstream movement in site 1, indicate that the waterfall
between site 1 and 2 work as a partial barrier for upstream movement from stream Julussa, as
indicated by Taugbøl (2008).
Restricted movement
The studies in Bellbekken from 2002 until 2006 showed that very few brown trout preformed
long range movement. Both for the summer and the winter periods only about 1 in 4 of the
fish showed any kind of movement, and only about 1 in 10 of the fish actually dispersed out
of its home range. These results are in accordance with movement associated with restricted
movement (Rodriguez 2002). Previous studies of both brown trout (Knouft and Spotila 2002)
and other salmonids have given similar results as this study (Rodriguez 2002, Wilson et al.
2004, Coombs and Rodriguez 2007). Since the brown trout in the stream manly stayed in its
site of first capture, and given the mean site length in Bellbekken of 60.16m, the mean
movement of the brown trout in the stream is near the region of restricted movement (between
20 and 50 meters) presented by Rodriguez (2002). The same author found similar movement
patterns for brown trout, with mean displacement distances around 50 meters and never
exceed 80 meters. Other studies show a brown trout movement distance which rarely exceed
100 meters (Brown et al. 2001, Ovidio et al. 2002).
23
Discussion
Brown trout length
Within the home range the larger of the brown trout tended to move more during both the
summer and the winter periods. With exception of the one movement pattern in the
summertime where smaller brown trout tended to move longer distances, length of the fish did
not affect the distance of the movement. Sundström et al (2004b) showed boldness and
exploratory behaviour is correlated with dominance in brown trout, making dominant
individual more likely to move within the home range. Since length of the fish had no effect
on the movement out of the home range, we may assume this study is in agreement with
earlier research where large brown trout move at a higher rate than does smaller trout within
the home range (Elliott 1994, Young 1994, Bunnell et al. 1998, Höjesjö et al. 2007). The
change in niche preferences as the brown trout grows larger may also be important in size-
dependent movement. One size class of fish may have a higher probability for niche shifts
then other sizes as a habitat becomes unsuitable, making it more likely to undertake
movement (reviewed in Heggenes et al. 1999). Smaller and subordinate individuals may also
be subjected to movement as they may have a problem with establishing good territories.
Being driven out of the area means the fish have dispers.
Maturity stage, sex and spawning movement
The mature brown trout in Bellbekken had a higher rate of movement within the home range,
compared with the immature fish, which would be expected since the bigger fish moved more
often, and the majority of the bigger fish was mature. Pirhonen and Forsman (1999) and
Pirhonen et al. (1998) studied the activity level of mature and immature brown trout, and
came to the conclusion of higher movement rate for the immature fish than for the mature
during a movement period in springtime (May), but a higher activity level for mature in the
autumn period (October).
In Bellbekken, 2 hot-spots for spawning for the brown trout were found during this study. As
well as having the highest number of mature fish, site number 11 and 19 had the habitat
characteristics suitable for spawning. Both sites had a somewhat slow slope surrounded by
high sloped areas, had a low percentage of vegetation and, maybe most importantly, correct
sized substrate. Estimations of movement towards the sites showed for both site 11 and 19
35% (12 out of 32 trout and 7 out of 20 trout respectively) of the mature trout in that site
during the autumn sampling had moved during the summer period to get to the site.
24

Discussion
Although there was some movement in the steam towards these hot-spots during the summer
periods, I found no general differences between the summer and winter movement periods on
the population scale. There was no indication of more or longer movement in total during the
summer than during the winter. This is a result in contrast to numerous studies conducted on
brown trout (Young 1994, Ovidio et al. 2002, Bettinger and Bettoli 2004, Höjesjö et al. 2007,
James et al. 2007), all showing a higher rate of movement and dispersal during the autumn in
connection with spawning. Höjesjö et al.(2007) found that the brown trout visited the
spawning ground more often during the same period. In Pirhonen et al.(1998), Pirhonen and
Forsman (1999), Ovidio et al (1998) and Ovidio et al (2002) the peak of spawning movement
was in October, and the study in Bellbekken had autumn sampling sessions from September
to early October. Although this was an intentional choice done to not interfere with the brown
trout spawning, one could argue that the study design, unfortunately, lose the spawning
movement done by the fish.
Since I did not find ant spawning movement in this study, I would have expected to find an
equal proportion of both male and female dispersers (in connection with spawning movement,
the dispersal may be male-biased (Hutchings and Gerber 2002)). The movement differences
between the sexes were only apparent on the measurement for how often the different sexes
moved, not on the distance moved. Males moved more often within the home range during the
winter period and as dispersers trough the whole year. The research on sex-biased dispersal
for salmonids has been contradicting. The movement of the different sexes has been found to
differ between years (one year of positively female-biased movement in brown trout, Piecuch
et al. 2007), to differ between the seasons within one year (brown trout, Pirhonen and
Forsman 1999), to be positively male-biased in distance moved (brook trout, Hutchings and
Gerber 2002), to be positively female-biased in distance moved (atlantic salmon, Pirhonen et
al. 1998) and to be equal giving the same dispersal patterns for both males and females
(Consuegra and de Leaniz 2007). A theoretical approach to the contradicting results of this
and previous studies on the male-biased dispersal pattern, can be found in Perrin & Mazalov
(2000). Here the authors argue that male-biased dispersal will be most likely in a population
with a promiscuous mating system (as found in salmonids) where the mating success for the
males is limited by mating competition, and female reproduction is not limited by resource
competition. The study in Bellbekken does not include the competition neither for males nor
females, but the theory may give an explanation for the male-biased movement pattern found
in the stream.
25
Discussion
Brown trout density, growth rate and dispersal direction
The brown trout density did not affect the movement of the fish in this study, except for the
home range movement in the summer period. Although density-dependant dispersal has been
proven for salmonid parr (Einum et al. 2006), the same lack of density-dependant dispersal
for older fish was shown by Sundström et al. (2004a), where brown trout from areas with high
densities had a similar displacement rate as did fish from low density areas. Crisp (1993), on
the other hand, found density-dependent dispersal in brown trout populations, but the brown
trout density in Bellbekken (highest mean density at a given site through all the sampling
sessions was 0.32 ± 0.04 fish/m²) did not experience the densities proposed as limiting for
density-dependent dispersal (brown trout density of 1.4 fish/m²).
The density-dependant movement in Bellbekken was only on the home-range scale. The
increase in movement can be caused ether by a growth in home range size for the fish or an
increased activity level at the high density sites. I have no reason to believe the home range
size should be higher with higher densities, but an increase in activity is possible. In
Bellbekken there was a small indication that the stayers in the population had a higher growth
rate than fish that moved, indicating a net amount of energy cost for the movers. An increase
in home range activity caused by density could then lead to a lower growth rate. A previous
study in Bellbekken has shown that brown trout growth rate decreases with increasing fish
density (Vøllestad et al. 2002). The spatial scale on which a study is conducted can be critical
for the detection of density-dependence (Ray and Hastings 1996). The study of 79 insect
populations made it clear studies on density-dependant dispersal is often conducted on a wider
on bigger spatial scale than necessary to pick up the density-dependence.
The question connected with the difference in growth rates and condition between moving
and stationary salmonids, has been raised may times. The energetic cost of movement has
made many authors come to the conclusion that moving individuals are in poorer condition
than resident fish (Naslund et al. 1993, Gowan and Fausch 1996). Nakano (1995), on the other
hand, suggested movement as a response to poor feeding conditions for smaller, subordinate
fish. Other studies have shown both equal and higher growth for fish that has moved trough
the season (Steingrimsson and Grant 2003, Hilderbrand and Kershner 2004).
In Bellbekken, the upstream moving fish had a higher growth rate than downstream movers.
Elliott (1994) argue that brown trout fry of a poor condition do not the strength to carry out
upstream movement, but only downstream. The fry of good condition has the energy to move
upstream. Höjesjö et al argue that when dominant brown trout move upstream, lower ranked
26

Discussion
27
individuals present in the dominant fish’s new home range, have a high probability of moving
downstream.
One may have in mind size, boundary and habitat differences between the sites in Bellbekken.
Before assigning the different sites in the stream, the length of each site was determined to be
approximately 50 meters following the movement pattern of the “restricted movement
paradigm”(Rodriguez 2002). Presence or absence of natural boundaries sometimes made sites
shorter or longer than the 50 meters (range 32 – 92 meters of length). Some of the sites had
natural endings, like a small waterfall or riffles, wile others had smooth connections with
neighbouring sites, giving the brown trout easy access to the sites nearby. The habitat
characteristics varied greatly trough the run of the stream, both in water velocity and depth
and vegetation and substrate. All these differences may have influenced brown trout
movement without being caught up by the data in this study.
References
References:
Bettinger, J. M., and P. W. Bettoli. 2004. Seasonal movement of brown trout in the
Clinch River, Tennessee. North American Journal of Fisheries Management 24:1480-1485.
Bohlin, T., S. Hamrin, T. G. Heggberget, G. Rasmussen, and S. J. Saltveit. 1989. Electrofishing - Theory and Practice with Special Emphasis on Salmonids. Hydrobiologia 173:9-43.
Brown, R. S., G. Power, and S. Beltaos. 2001. Winter movements and habitat use of riverine brown trout, white sucker and common carp in relation to flooding and ice break-up. Journal of Fish Biology 59:1126-1141.
Bunnell, D. B., J. J. Isely, K. H. Burrell, and D. H. Van Lear. 1998. Diel movement of brown trout in a southern Appalachian River. Transactions of the American Fisheries Society 127:630-636.
Burrell, K. H., J. J. Isely, D. B. Bunnell, D. H. Van Lear, and C. A. Dolloff. 2000. Seasonal movement of brown trout in a southern Appalachian river. Transactions of the American Fisheries Society 129:1373-1379.
Clobert, J., E. Danchin, A. A. Dhondt, and J. D. Nichols, editors. 2001. Dispersal. Oxford University Press, Oxford.
Consuegra, S., and C. G. de Leaniz. 2007. Fluctuating sex ratios, but no sex-biased dispersal, in a promiscuous fish. Evolutionary Ecology 21:229-245.
Coombs, M. F., and M. A. Rodriguez. 2007. A field test of simple dispersal models as predictors of movement in a cohort of lake-dwelling brook charr. Journal of Animal Ecology 76:45-57.
Crisp, D. T. 1993. Population-Densities of Juvenile Trout (Salmo-Trutta) in 5 Upland Streams and Their Effects Upon Growth, Survival and Dispersal. Journal of Applied Ecology 30:759-771.
Diana, J. S., J. P. Hudson, and R. D. Clark. 2004. Movement patterns of large brown trout in the mainstream an Sable River, Michigan. Transactions of the American Fisheries Society 133:34-44.
Einum, S., and K. H. Nislow. 2005. Local-scale density-dependent survival of mobile organisms in continuous habitats: an experimental test using Atlantic salmon. Oecologia 143:203-210.
Einum, S., L. Sundt-Hansen, and K. H. Nislow. 2006. The partitioning of density-dependent dispersal, growth and survival throughout ontogeny in a highly fecund organism. Oikos 113:489-496.
Elliott, J. M. 1994. Quantitative Ecology and the Brown Trout. Oxford University Press, Oxford.
Gandon, S., and Y. Michalakis. 2001. Multiple causes of the evolution of dispersal. in J. Clobert, E. Danchin, A. A. Dhondt, and J. D. Nichols, editors. Dispersal. Oxford University Press, New york.
Gerking, S. D. 1959. The Restricted Movement of Fish Populations. Biological Reviews of the Cambridge Philosophical Society 34:221-242.
Giberson, D. J., and D. Caissie. 1998. Stream habitat hydraulics: interannual variability in three reaches of Catamaran Brook, New Brunswick. Canadian Journal of Fisheries and Aquatic Sciences 55:485-494.
28

References
Gowan, C. 2007. Short-term cues used by foraging trout in a California stream. Environmental Biology of Fishes 78:317-331.
Gowan, C., and K. D. Fausch. 1996. Mobile brook trout in two high-elevation Colorado streams: Re-evaluating the concept of restricted movement. Canadian Journal of Fisheries and Aquatic Sciences 53:1370-1381.
Gowan, C., and K. D. Fausch. 2002. Why do foraging stream salmonids move during summer? Environmental Biology of Fishes 64:139-153.
Gowan, C., M. K. Young, K. D. Fausch, and S. C. Riley. 1994. Restricted Movement in Resident Stream Salmonids - a Paradigm Lost. Canadian Journal of Fisheries and Aquatic Sciences 51:2626-2637.
Greenberg, L. A., and P. S. Giller. 2001. Individual variation in habitat use and growth of male and female brown trout. Ecography 24:212-224.
Hanski, I. 2001. Population dynamic consequences of dispersal in local populations and in metapopulations. in J. Clobert, E. Danchin, A. A. Dhondt, and J. D. Nichols, editors. Dispersal. Oxford University Press, New York.
Hastings, A. 1993. Complex Interactions between Dispersal and Dynamics - Lessons from Coupled Logistic Equations. Ecology 74:1362-1372.
Heggenes, J. 1988. Effect of Experimentally Increased Intraspecific Competition on Sedentary Adult Brown Trout (Salmo-Trutta) Movement and Stream Habitat Choice. Canadian Journal of Fisheries and Aquatic Sciences 45:1163-1172.
Heggenes, J., J. L. Bagliniere, and R. A. Cunjak. 1999. Spatial niche variability for young Atlantic salmon (Salmo salar) and brown trout (S-trutta) in heterogeneous streams. Ecology of Freshwater Fish 8:1-21.
Heggenes, J., P. K. Omholt, J. R. Kristiansen, J. Sageie, F. Okland, J. G. Dokk, and M. C. Beere. 2007. Movements by wild brown trout in a boreal river: response to habitat and flow contrasts. Fisheries Management and Ecology 14:333-342.
Hendry, A. P., and S. C. Stearns. 2004. EVOLUTION ILLUMINATED Salmon and Their Relatives. Oxford University Press, New York.
Hilderbrand, R. H., and J. L. Kershner. 2004. Are there differences in growth and condition between mobile and resident cutthroat trout? Transactions of the American Fisheries Society 133:1042-1046.
Höjesjö, J., F. Økland, L. F. Sundstrom, J. Pettersson, and J. I. Johnsson. 2007. Movement and home range in relation to dominance; a telemetry study on brown trout Salmo trutta. Journal of Fish Biology 70:257-268.
Hutchings, J. A., and L. Gerber. 2002. Sex-biased dispersal in a salmonid fish. Proceedings of the Royal Society of London Series B-Biological Sciences 269:2487-2493.
Ims, R. A., and D. Ø. Hjermann. 2001. Condition-dependent dispersal. Pages 201-216 in J. Clobert, E. Danchin, A. A. Dhondt, and J. D. Nichols, editors. Dispersal. Oxford University Press, Oxford.
James, D. A., J. W. Erickson, and B. A. Barton. 2007. Brown trout seasonal movement patterns and habitat use in an urbanized South Dakota stream. North American Journal of Fisheries Management 27:978-985.
Jonsson, B. 1976. Comparison of scales and otoliths for age determination in brown trout, Salmo trutta L. Norwegian Journal of Zoology 24:295-301.
Jonsson, B., and N. C. Stenseth. 1976. Regression of Body Length on Scale Size of Brown Trout, Salmo-Trutta-L. Norwegian Journal of Zoology 24:331-340.
Klemetsen, A., P. A. Amundsen, J. B. Dempson, B. Jonsson, N. Jonsson, M. F. O'Connell, and E. Mortensen. 2003. Atlantic salmon Salmo salar L., brown trout
29
References
Salmo trutta L. and Arctic charr Salvelinus alpinus (L.): a review of aspects of their life histories. Ecology of Freshwater Fish 12:1-59.
Knouft, J. H., and J. R. Spotila. 2002. Assessment of movements of resident stream brown trout, Salmo trutta L., among contiguous sections of stream. Ecology of Freshwater Fish 11:85-92.
Kramer, D. L., R. W. Rangeley, and L. J. Chapman. 1997. Habitat selection: patterns of spatial distribution from behavioural decisions. in J.-D. J. Godin, editor. Behavioural Ecology of Teleost Fishes. Oxford University Press, Oxford.
Nakano, S. 1995. Individual-Differences in Resource Use, Growth and Emigration under the Influence of a Dominance Hierarchy in Fluvial Red-Spotted Masu Salmon in a Natural Habitat. Journal of Animal Ecology 64:75-84.
Naslund, I., G. Milbrink, L. O. Eriksson, and S. Holmgren. 1993. Importance of Habitat Productivity Differences, Competition and Predation for the Migratory Behavior of Arctic Charr. Oikos 66:538-546.
Olsen, E. M., and L. A. Vøllestad. 2001a. Estimates of survival of stream-dwelling brown trout using mark-recaptures. Journal of Fish Biology 59:1622-1637.
Olsen, E. M., and L. A. Vøllestad. 2001b. An evaluation of visible implant elastomer for marking age-0 brown trout. North American Journal of Fisheries Management 21:967-970.
Olsen, E. M., and L. A. Vøllestad. 2005. Small-scale spatial variation in age and size at maturity of stream-dwelling brown trout, Salmo trutta. Ecology of Freshwater Fish 14:202-208.
Ovidio, M., E. Baras, D. Goffaux, C. Birtles, and J. C. Philippart. 1998. Environmental unpredictability rules the autumn migration of brown trout (Salmo trutta L.) in the Belgian Ardennes. Hydrobiologia 372:263-274.
Ovidio, M., E. Baras, D. Goffaux, F. Giroux, and J. C. Philippart. 2002. Seasonal variations of activity pattern of brown trout (Salmo trutta) in a small stream, as determined by radio-telemetry. Hydrobiologia 470:195-202.
Perrin, N., and V. Mazalov. 2000. Local competition, inbreeding, and the evolution of sex-biased dispersal. American Naturalist 155:116-127.
Piecuch, J., B. Lojkasek, S. Lusk, and T. Marek. 2007. Spawning migration of brown trout, Salmo trutta in the Moravka reservoir. Folia Zoologica 56:201-212.
Pirhonen, J., and L. Forsman. 1999. Can smolting and maturation of hatchery-reared brown trout Salmo trutta L. be affected by food deprivation during the first and second years of rearing? Aquaculture Research 30:611-620.
Pirhonen, J., L. Forsman, A. Soivio, and J. Thorpe. 1998. Movements of hatchery reared Salmo trutta during the smolting period, under experimental conditions. Aquaculture 168:27-40.
Prentice, E. F. F. T. A. M. C. S. 1990. - Feasibility of using implantable passive integrated transponder (PIT) tags in salmonids. in.
Ray, C., and A. Hastings. 1996. Density dependence: Are we searching at the wrong spatial scale? Journal of Animal Ecology 65:556-566.
Rodriguez, M. A. 2002. Restricted movement in stream fish: The paradigm is incomplete, not lost. Ecology 83:1-13.
Skalski, G. T., and J. F. Gilliam. 2000. Modeling diffusive spread in a heterogeneous population: A movement study with stream fish. Ecology 81:1685-1700.
Steingrimsson, S. O., and J. W. A. Grant. 2003. Patterns and correlates of movement and site fidelity in individually tagged young-of-the-year Atlantic salmon (Salmo salar). Canadian Journal of Fisheries and Aquatic Sciences 60:193-202.
30
References
31
Sundström, L. F., T. Bohlin, and J. I. Johnsson. 2004a. Density-dependent growth in hatchery-reared brown trout released into a natural stream. Journal of Fish Biology 65:1385-1391.
Sundström, L. F., E. Petersson, J. Höjesjö, J. I. Johnsson, and T. Jarvi. 2004b. Hatchery selection promotes boldness in newly hatched brown trout (Salmo trutta): implications for dominance. Behavioral Ecology 15:192-198.
Taugbøl, A. 2008. Fine-scale genetic structure of brown trout (Salmo trutta). University of Oslo, Oslo.
Torgersen, P. 2005. Growth variation in brown trout Salmo trutta across small spatial scales: effects of density-dependence and habitat quality? University of Oslo, Oslo.
Utz, R. M., and K. J. Hartman. 2006. Temporal and spatial variation in the energy intake of a brook trout (Salvelinus fontinalis) population in an Appalachian watershed. Canadian Journal of Fisheries and Aquatic Sciences 63:2675-2686.
Vøllestad, L. A., E. M. Olsen, and T. Forseth. 2002. Growth-rate variation in brown trout in small neighbouring streams: evidence for density-dependence? Journal of Fish Biology 61:1513-1527.
Wilson, A. J., J. A. Hutchings, and M. M. Ferguson. 2004. Dispersal in a stream dwelling salmonid: Inferences from tagging and microsatellite studies. Conservation Genetics 5:25-37.
Young, M. K. 1994. Mobility of Brown Trout in South-Central Wyoming Streams. Canadian Journal of Zoology-Revue Canadienne De Zoologie 72:2078-2083.
Young, M. K., R. A. Wilkison, J. M. Phelps, and J. S. Griffith. 1997. Contrasting movement and activity of large brown trout and rainbow trout in Silver Creek, Idaho. Great Basin Naturalist 57:238-244.