Do trout swim better than eels? Challenges for estimating ...
Upload
khangminh22Category
view
4download
0
Lerceteau-Köhler et al. BMC Evolutionary Biology 2013, 13:176http://www.biomedcentral.com/1471-2148/13/176
RESEARCH ARTICLE Open Access
Genetic variation in brown trout Salmo truttaacross the Danube, Rhine, and Elbe headwaters:a failure of the phylogeographic paradigm?Estelle Lerceteau-Köhler1,3, Ulrich Schliewen2, Theodora Kopun1,4 and Steven Weiss1*
Abstract
Background: Brown trout Salmo trutta have been described in terms of five major mtDNA lineages, four of whichcorrespond to major ocean basins, and one, according to some authors, to a distinct taxon, marbled trout Salmomarmoratus. The Atlantic and Danubian lineages of brown trout meet in a poorly documented contact zone inCentral Europe. The natural versus human mediated origin of the Atlantic lineage in the upper Danube is aquestion of both theoretical and practical importance with respect to conservation management. We provide acomprehensive population genetic analysis of brown trout in the region with the aim of evaluating the geographicdistribution and genetic integrity of these two lineages in and around their contact zone.
Results: Genetic screening of 114 populations of brown trout across the Danube/Rhine/Elbe catchments revealeda counter-intuitive phylogeographic structure with near fixation of the Atlantic lineage in the sampled portions ofthe Bavarian Danube. Along the Austrian Danube, phylogeographic informative markers revealed increasingpercentages of Danube-specific alleles with downstream distance. Pure Danube lineage populations wererestricted to peri-alpine isolates within previously glaciated regions. Both empirical data and simulated hybridcomparisons support that trout in non-glaciated regions north and northeast of the Alps have an admixed originlargely based on natural colonization. In contrast, the presence of Atlantic basin alleles south and southeast of theAlps stems from hatchery introductions and subsequent introgression. Despite extensive stocking of the Atlanticlineage, little evidence of first generation stocked fish or F1 hybrids were found implying that admixture has beenestablished over time.
Conclusions: A purely phylogeographic paradigm fails to describe the distribution of genetic lineages of Salmo inCentral Europe. The distribution pattern of the Atlantic and Danube lineages is extremely difficult to explainwithout invoking very strong biological mechanisms.The peri-alpine distribution of relict populations of pure Danubian lineage brown trout implies that they colonizedheadwater river courses post-glacially ahead of the expansion of the Atlantic lineage. The recognition of natural asopposed to anthropogenic introgression of the Atlantic lineage into Danubian gene pools is of fundamentalimportance to management strategies.
Keywords: Paleo-hydrology, Phylogeography, Alpine, Austria, Bavaria, mtDNA, Microsatellites, LDH-C1, Stocking,Conservation
* Correspondence: [email protected] of Zoology, Karl-Franzens University Graz, Universitätsplatz 2,A-8010 Graz AustriaFull list of author information is available at the end of the article
© 2013 Lerceteau-Köhler et al.; licensee BioMed Central Ltd. This is an Open Access article distributed under the terms of theCreative Commons Attribution License (http://creativecommons.org/licenses/by/2.0), which permits unrestricted use,distribution, and reproduction in any medium, provided the original work is properly cited.
Lerceteau-Köhler et al. BMC Evolutionary Biology 2013, 13:176 Page 2 of 18http://www.biomedcentral.com/1471-2148/13/176
BackgroundAn overwhelming majority of species in nature exhibitsome level of phylogeographic structure and this structureis very often shown to correspond to major landscape fea-tures born out of paleo-environmental processes. Thephylogeographic revolution [1] has promoted a paradigm,especially in Europe, whereby mountain ranges, penin-sulas, and for freshwater organisms, river catchments area priori landscape units expected to correspond to somelevel of genetic subdivision within a species. To the extentthat studies support these expectations, the evolutionarysignificance of this non-biological source of genetic struc-ture remains controversial [2]. Moreover, broad-scale phy-logeographic studies of European fishes almost invariableinvoke complex within-drainage or between drainagelineage structure, which is presumed to be the result ofpaleo-hydrological re-arrangements of river networks orfor some managed species, the result of human-mediatedtransport and release. Several studies support a clear dis-tinction between genetic lineages of cold-tolerant fishesacross adjacent headwater regions of the Rhine andDanube catchments such as for Telestes souffia [3] andEuropean grayling Thymallus thymallus [4], but a compar-ably low level of distinction for Cottus gobio [5]. In contrast,lineage sharing between the Danube and Rhine catchmentspresumably based on natural colonization patterns hasbeen demonstrated in European perch Perca fluviatilis [6]and European chub Leuciscus cephalus [7] and between theDanube and Vistula drainages for Barbus carpathicus [8].The pre-molecular view of the Ponto-Caspian (includingthe Danube) basin in aquatic zoogeography was thatit served as the major refuge for the post-glacial re-colonization of Central and Northern Europe [9]. Whilemolecular studies highlight the evolutionary importance ofthe Ponto-Caspian basin in terms of genetic diversity, thereis often little evidence or a lack of clarity concerning its roleas a source of post-glacial expansion for specific species.None of the above studies were explicitly aimed at investi-gating the Danube/Rhine/Elbe headwater region withrespect to these considerations. Moreover, the population-level knowledge base of the investigated species does notapproach that of the brown trout.The brown trout was one of the first non-model verte-
brates to attract the attention of population geneticists inEurope [10-12] and subsequently one of the first orga-nisms to be analyzed with molecular markers for a pan-European phylogeographic structure [13]. Five majormtDNA lineages of the species were identified correspon-ding to four major catchment areas (Danube, Atlantic,Mediterranean & Adriatic) with the fifth lineage associatedwith the marbled phenotype found in the Adriatic basin.This structure has proliferated in the literature as the “fivemajor evolutionary lineages” of the species [14]. Subse-quent studies based on intensive sampling deliver a more
complicated perspective than that of major mtDNA line-ages associated with major river basins (e.g. [15-17]). Anancient split within the Atlantic lineage was reported [18]and described as a sixth (Duero) major mtDNA lineage[19]. The allopatric origin of the Mediterranean lineagewas questioned [15], and the “Adriatic” lineage was con-sidered a misnomer [16] as it is extensively distributedfrom Iberia to Turkey, with no evidence that its origin isin the Adriatic. Although the marbled trout phenotype islimited to portions of Adriatic drainage (Po drainage inItaly, Slovenia, Bosnia-Herzegovina & Montenegro), theso-called marble trout mtDNA lineage has been found inAlbania [20], central Italy [21], Greece [22] and Corsica(Snoj A. personal communication, unpublished data).Thus, the mtDNA lineage appears to have an independentorigin with respect to the taxon’s phenotypic divergence.In Central Europe, the notion of a Danube lineage of
brown trout has been well-established and unquestionedwithin management and conservation circles. The lineage,however, exhibits extensive life-history diversity andstretches across the entire Ponto-Caspian basin, exhibitingits deepest split across the Tigris-Euphrates catchment[23], leaving some uncertainty about where the lineage ac-tually arose as well as its meaning related to evolutionaryor taxonomic debate. Recently, populations of the upperDanube basin have been assigned a new name Salmolabrax [24], although it is unclear what the distribution ofthis taxon should be, or on what basis if any it should begenetically delineated. Weiss et al. [25] reported on the ex-tensive sympatric occurrence of Atlantic and Danubelineage mtDNA in Austrian and Bavarian streams of theupper Danube, and argued that although introduced hatch-ery strains may account for much of this pattern, the statis-tical distribution of Atlantic lineage mtDNA suggests adegree of natural occurrence on the north slopes of theAlps. Watershed patterns of alleles at the LDH-C1 locusreflected some known river capture events across adjoiningheadwater tributaries of the Rhine and Danube in Baden-Württemberg [26]. A review of molecular genetic data in-cluding extensive allozyme studies [27] concluded thatthere is no modern genetic signal of brown trout gene flowfrom the Ponto-Caspian Basin into north draining riversystems of Central Europe (e.g. Rhine & Elbe), despite thegenerally accepted zoogeographic model of this basin ser-ving northern post-glacial expansion and the fact that theDanube basin has repeatedly lost (through river capture)area to the north-flowing Rhine and Elbe systems over thelast few ice ages [28]. Nonetheless, no study to date hassystematically evaluated the genetic structure of browntrout across the Danube/Rhine/Elbe interface.In this paper we characterize the population genetic
structure in the upper Danube in the Alpine and sub-Alpine regions of Austria and Bavaria including com-parison to samples from adjacent areas of the Rhine and

Lerceteau-Köhler et al. BMC Evolutionary Biology 2013, 13:176 Page 3 of 18http://www.biomedcentral.com/1471-2148/13/176
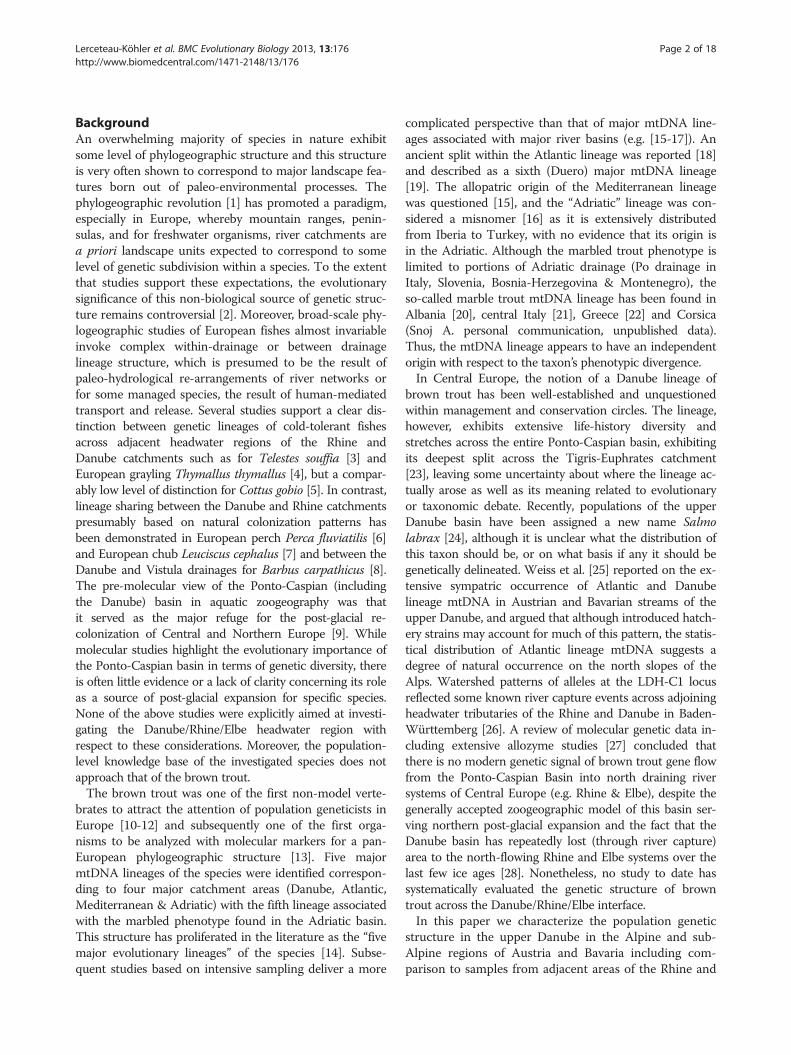
Elbe drainages (Figure 1). This study was broadly designedto: 1) evaluate the hypothesis of [25] and [29] suggestingthat the upper Danube in Austria and Germany may havebeen naturally colonized by the Atlantic lineage; 2) identifypure Danubian lineage populations for conservation pur-poses, and 3) to question the utility of river basin-basedphylogeographic expectations versus biological hypothesesfor explaining the extant distribution of genetic variationacross large-scale aquatic landscapes. More specific hy-potheses concerning the potential hybrid origins of groupsof populations are presented below.
ResultsMtDNA and LDH-C1 analysisAtlantic lineage mtDNA was fixed in the Rhine and Elbedrainages and there was a general decreasing trend in itsmean occurrence from west to east (i.e. downstream)within the Danube basin ranging from a high of 93.5% inthe Bavarian Danube to a low of 32.1% in the AustrianDrau, south of the Alps (Table 1; Figure 2). Although thepercentage of Atlantic mtDNA varied widely among sam-ple sites within the Danube catchment, in our data onlypreviously glaciated regions within the Austrian Mur andDrau drainages revealed some populations (N = 11) fixedfor Danubian mtDNA (Table 1). An analogous west–easttrend in decreasing mean frequency was seen for the
Figure 1 Map of sample sites. Map of all 97 sites sampled in this study asdrainages. The purple dotted lines correspond to the maximum extension ofborders are shown with a light gray line; part of the border between Austria a
Atlantic basin LDH-C1 90* allele (Table 1; Figure 1), withnear fixation in the Elbe (97.8%) and Rhine (95.5%) basinsand the lowest occurrence in the Austrian Drau (37.3%).The alternate LDH-100* allele was fixed in five (ETR,MOO, BIS, SAG, WOL) of the 11 populations (ETR,KOT, MOO, TIE, ANR, BIS, SAG, SCH, WOL, ANL andWIS) that were fixed for the Danubian mtDNA lineage,but nowhere else (Table 1). Fixation of the LDH-C1 90* al-lele was found in only two populations in the Danubecatchment (in Bavaria), and both were fixed for AtlanticmtDNA (Ilz & Lech, Table 1). There was a highly signifi-cant correlation (Kendall’s tau 0.609; P < 0.001) betweenthe frequencies of Atlantic mtDNA and the LDH-C1 90*allele across all populations. Correcting for multiple test-ing, there was no deviation from HWE at the populationlevel for the LDH-C1 locus. For some comparisons in thetext we will refer to populations fixed for Danube mtDNAas “pure Danubian”.
MicrosatellitesThe mean allelic richness across all loci at the populationlevel ranged from 2.5 (BIS, Drau drainage) to 7.9 (SUL,Mur drainage, Additional file 1). This richness was signifi-cantly different (Kruskal-Wallis test; P = 0.018) amongdrainages with the highest values found in the AustrianDanube (6.4) and the lowest in the Austrian Drau (5.1).
well as the 17 populations sampled in [30] and their correspondingglacial ice at the height of the Würm glaciation [31]. Current nationalnd the German State of Bavaria is defined by the Salzach and Inn rivers.

Table 1 Complete list of all 114 populations mentioned in this paper; 97 of these were newly analyzed for this study and 17 stem from [30]
(WGS84) (%)
Population Pop-Code Drainage Region Lat. Long. N mtDNA At LDH-90* Mgt. MASL Glac.
Grumpelbach GRU Rhine/Main/Rodach/Kremnitz Bav 50° 18′ 11° 22′ 19 100.00 100.00 3 393 No
Langenaubach LAN Rhine/Main/Rodach Bav 50° 20′ 11° 35′ 21 100.00 100.00 1 630 No
Mathelbach MAT Rhine/Main/Wiesent/Leinleiter Bav 49° 50′ 11° 12′ 32 100.00 93.94 2 456 No
Schulmühlbach SHU Rhine/Main/Wiesent/Leinleiter Bav 49° 50′ 11° 11′ 27 100.00 83.33 1 333 No
Thiemitz THI Rhine/Main/Rodach/Wilde Rodach/Thiemitz Bav 50° 17′ 11° 35′ 22 100.00 100.00 1 612 No
Weisser WEM Rhine/Main Bav 50° 03′ 11° 39′ 24 100.00 95.65 3 485 No
Sub-total Rhine Bav 145 100.00 95.49
Bibersbach BIB Elbe/Eger Bav 50° 03′ 12° 00′ 22 100.00 100.00 3 640 No
Goldbach GOL Elbe/Saale/Sächsische Saale/Pulschnitz Bav 50° 11′ 11° 44′ 23 100.00 95.83 1 584 No
Harlandtbach HAL Elbe/Moldau/Kalte Moldau Bav 48° 51′ 13° 44′ 19 100.00 100.00 2 957 No
Lamitz LAM Elbe/Saale/Sächsische Saale Bav 50° 14′ 11° 56′ 23 100.00 93.18 3 493 No
Steinselb STB Elbe/Eger Bav 50° 10′ 12° 03′ 21 100.00 97.73 1 1040 No
Schwarzbach SWA Elbe/Moldau/Kalte Moldau Bav 48° 51′ 13° 42′ 23 100.00 100.00 2 588 No
Sub-total Elbe Bav 131 100.00 97.79
Forellenbach FOR Danube/Ilz/Große Ohe Bav 48° 55′ 13° 21′ 21 100.00 100.00 1 754 No
Geiselmoosbach GEI Danube/Lech/Rottbach Bav 47° 53′ 10°58′ 24 100.00 65.22 2 699 Yes
Haarauer Saige HAA Danube/Ilz/Kleine Ohe/Sagwasser Bav 48° 54′ 13° 28′ 26 76.92 100.00 1 783 No
Haidenaab HAD Danube/Naab Bav 49° 55′ 11° 49′ 26 85.00 90.74 2 507 No
Kirnbach KIR Danube/Inn Bav 48° 17′ 13° 9′ 20 100.00 87.50 2 330 No
Kohlgraben KOH Danube/Isar/Amper/Ammersee/Rott Bav 47° 54′ 11° 02′ 22 73.91 86.84 3 580 Yes
Milchelbach MIC Danube/Isar/Amper/Ammersee/Rott Bav 47° 54′ 11° 05′ 22 86.36 85.00 3 568 Yes
Muhlbach MUH Danube/Isar/Amper/Ammersee/Rott Bav 47° 52′ 11° 03′ 24 100.00 77.27 2 617 Yes
Schlittbach SLI Danube/Isar/Amper/Ammersee/Rott Bav 47° 51′ 11° 01′ 23 100.00 65.91 2 676 Yes
Steingraben STG Danube/Isar/Amper/Ammersee/Rott Bav 47° 53′ 11° 03′ 23 100.00 88.10 2 616 Yes
Tauritzbach TAU Danube/Naab Bav 49° 54′ 11° 46′ 27 100.00 85.19 2 541 No
Wielenbach WIE Danube/Lech Bav 47° 50′ 10° 59′ 22 100.00 100.00 2 755 No
Sub-total Bavarian Danube Bav 280 93.52 85.98
Aschbach ASC Danube/Enns Styr 47° 43′ 15° 19′ 34 76.92 83.33 2 900 No
Eidechselbach EID Danube/Fischa/Piesting L_Aus 47° 54′ 15° 49′ 29 36.67 91.67 1 612 No
Erlauf ERL Danube L_Aus 47° 50′ 15° 17′ 23 75.00 70.83 3 777 No
Fugnitz FUG Danube/March/Thaya L_Aus 48° 51 15° 50′ 28 100.00 98.21 3 446 No
Lerceteau-Köhleret
al.BMCEvolutionary
Biology2013,13:176
Page4of
18http://w
ww.biom
edcentral.com/1471-2148/13/176

Table 1 Complete list of all 114 populations mentioned in this paper; 97 of these were newly analyzed for this study and 17 stem from [30] (Continued)
Galgenbach GAL Danube/Große Mühle U_Aus 48° 38′ 13° 58′ 19 13.33 97.37 3 538 No
Grosse Krems GKR Danube/Krems L_Aus 48° 28′ 15° 21′ 39 79.49 93.59 3 654 No
Höllbach HB Danube/Weiten L_Aus 48° 22′ 15° 9′ 27 33.33 62.96 2 900 No
Hollerbach HOL Danube/Raab Styr 47° 20′ 15° 42′ 34 77.42 82.81 2 560 No
Hummelmühlbach HM Danube/Große Mühle/Steinerne Mühl U_Aus 48° 31′ 14° 7′ 16 6.25 84.38 2 700 No
Johnsbach JOH Danube/Enns Styr 47° 31′ 14° 36′ 33 72.00 74.00 2 1100 Yes
KaYesbach KAJ Danube/March/Thaya L_Aus 48° 49′ 15° 53′ 25 96.43 91.07 2 443 No
Kaltergang KAG Danube/Fischa/Piesting L_Aus 47° 49′ 15° 48′ 30 86.67 83.33 1 734 No
Kleine Mühl KM Danube U_Aus 48° 28′ 13° 55′ 15 46.67 76.67 2 530 No
Kleine Ysper KY Danube/Ysper L_Aus 48° 16′ 14° 59′ 20 40.00 87.50 3 475 No
Kleiner Kamp KK Danube/Kamp/Großer Kamp L_Aus 48° 27′ 15° 1′ 96 48.45 77.84 2 750 No
Lohnbach LOH Danube/Kamp/Großer Kamp/Kleiner Kamp L_Aus 48° 28′ 15° 1′ 33 16.67 68.18 1 776 No
Luckenbach LUC Danube/Ybbs L_Aus 47° 51′ 14° 49′ 10 80.00 40.00 2 849 No
Natters (2004) NAT Danube/Pielach L_Aus 47° 58′ 15° 19′ 40 52.50 81.25 3 594 No
Niklbach NIK Danube/Enns/Steyr/Paltenbach U_Aus 47° 47′ 14° 17′ 29 3.45 44.64 2 929 No
Ois (2004) OIS Danube L_Aus 47° 52′ 15° 3′ 59 52.54 62.50 3 621 No
Pielach PIL Danube L_Aus 47° 57′ 15° 22′ 33 51.52 75.76 3 508 No
Piesting at Wöll. PIW Danube/Fischa L_Aus 47° 49′ 15° 48′ 24 83.33 87.50 3 762 No
Preinerbach PB Danube/Leitha/Schwarza L_Aus 47° 42′ 15° 49′ 29 51.72 84.48 3 499 No
Raab RAA Danube Styr 47° 10′ 15° 36′ 28 76.67 79.31 3 419 No
Schwarza GRA Danube/Leitha L_Aus 47° 48′ 15° 42′ 25 100.00 75.00 3 600 No
Thannergraben THA Danube/Ybbs L_Aus 47° 52′ 14° 47′ 30 100.00 46.67 2 522 No
Triebenbach TRI Danube/Enns Styr 47° 30′ 14° 27′ 34 47.22 45.71 2 700 No
Viehbach VIE Danube/Kleine Mühl/Daylesbach U_Aus 48° 29′ 13° 51′ 20 73.68 67.50 2 700 No
Weißenbach WEB Danube/Fischa/Piesting L_Aus 47° 51′ 15° 50′ 26 52.17 73.21 1 546 No
Weiten WIE Danube L_Aus 48°′18′ 15°′15′ 40 52.50 78.75 2 372 No
Sub-total Austrian Danube 928 76.01 73.94
Etrachbach ETR Danube/Drau/Mur Styr 47°′14′ 13°′57′ 30 0.00 0.00 1 1400 Yes
Kainach KAI Danube/Drau/Mur Styr 47′2′ 15°′10′ 27 73.08 66.67 3 362 No
Kotalmbach KOT Danube/Drau/Mur/Turrach Styr 46°′56′ 13°′49′ 27 0.00 11.29 1 1580 Yes
Lassnitz LAS Danube/Drau/Mur Styr 46°′52′ 15′2′ 32 34.38 39.39 3 320 No
Modriachwinkelbach MOD Danube/Drau/Mur Styr 46°′56′ 15′5′ 34 11.43 48.61 2 1000 No
Lerceteau-Köhleret
al.BMCEvolutionary
Biology2013,13:176
Page5of
18http://w
ww.biom
edcentral.com/1471-2148/13/176

Table 1 Complete list of all 114 populations mentioned in this paper; 97 of these were newly analyzed for this study and 17 stem from [30] (Continued)
Moosbach MOO Danube/Drau/Mur Styr 47°′17′ 14°′23′ 35 0.00 0.00 1 1400 Yes
Mürz (Feistritz) MÜR Danube/Drau/Mur Styr 47°′33′ 15°′35′ 30 80.00 80.00 3 615 No
Mürz MRZ Danube/Drau/Mur Styr 47°′34′ 15°′36′ 29 82.76 86.67 3 637 No
Rosenbach ROS Danube/Drau/Mur Styr 47′7′ 14°′13′ 30 100.00 98.15 2 781 Yes
Schwarze Sulm SUL Danube/Drau/Mur Styr 46°′46′ 15′8′ 37 62.16 77.03 3 870 No
Steinbach STE Danube/Drau/Mur/Turrach Styr 46°′57′ 13°′51′ 26 23.33 53.33 2 651 Yes
Teigitsch TEI Danube/Drau/Mur Styr 47′0′ 15′8′ 39 65.00 93.42 3 566 No
Tiefbach TIE Danube/Drau/Mur Styr 47′1′ 14′2′ 25 0.00 17.24 1 1400 Yes
Wiesenriegelbach WRB Danube/Drau/Mur Styr 46°′46′ 15′6′ 20 81.25 81.25 2 969 No
Sub-total Austrian Mur 421 43.81 53.79
Anrasersee ANR Danube/Drau/Mühlbach Tyrol 46°′48′ 12°′31′ 19 0.00 23.68 1 2523 Yes
Bach in der Schütt BIS Danube/Drau/Gail Car 46°′34′ 13°′45′ 18 0.00 0.00 1 520 Yes
Elbach ELB Danube/Drau/Lavant Car 46°′40′ 14°′57′ 23 100.00 95.45 2 780 No
Gesgerbach GES Danube/Drau/Tiebel Car 46°′44′ 14′4′ 20 45.00 32.50 2 660 Yes
Gößbach GÖß Danube/Drau/Lieser/Malta Car 46°′58′ 13°′26′ 20 20.00 70.00 2 980 Yes
Lichtengrabenbach LIC Danube/Drau/Lavant Car 46°′59′ 14°′46′ 24 28.00 24.00 2 900 No
Maisbach MAK Danube/Drau/Radlbach/Lieser Car 46° 55′ 13° 27′ 26 0.00 NA 1 1200 Yes
Oberallacher Bach OBE Danube/Drau Car 46° 45′ 13° 20′ 16 100.00 84.21 3 786 Yes
Radlbach RAD Danube/Drau/Lieser Car 46° 54′ 13° 29′ 20 20.00 25.00 2 1080 Yes
Rakoutzabach RAK Danube/Drau/Gurk/Glan Car 46° 35′ 14° 7′ 9 90.00 90.00 3 550 Yes
Saggrabenbach SAG Danube/Drau/Gurk/Görtschitz Car 46° 55′ 14° 37′ 10 0.00 0.00 1 1080 Yes
Schafgrabenbach SCH Danube/Drau/Gurk/Görtschitz Car 46° 58′ 14° 35′ 20 0.00 5.00 1 1066 No
Stieger Wiesenbach SWB Danube/Drau/Gail Car 46° 34′ 13° 46′ 16 5.56 11.11 2 520 Yes
Stutterner Bach STU Danube/Drau/Gurk Car 46° 40′ 14° 23′ 13 7.69 58.33 1 480 Yes
Trojer Almbach TAT Danube/Drau Tyrol 46° 57′ 12° 17′ 15 100.00 NA 1* 1989 Yes
Wellenbach WEL Danube/Drau Car 46° 50′ 13° 24′ 15 20.00 40.00 2 554 Yes
Woisgenbach WOK Danube/Drau Car 47° 00′ 13° 08′ 30 43.00 NA 2 1300 Yes
Wolfsgrabenbach WOL Danube/Drau/Gurk/Görtschitz Car 46° 55′ 14° 38′ 17 0.00 0.00 1 1140 No
Sub-total Austrian Drau 331 32.10 37.28
Kapellenbach KPT Danube/Inn Tyrol 47° 39′ 12° 23′ 20 85.00 NA 2 594 Yes
Katzbach KAT Danube/Inn Tyrol 47° 33′ 12° 25′ 20 15.00 NA 1 706 Yes
Kreuzbach KRT Danube/Inn Tyrol 47° 28′ 11° 51′ 16 0.00 NA 1 561 Yes
Lerceteau-Köhleret
al.BMCEvolutionary
Biology2013,13:176
Page6of
18http://w
ww.biom
edcentral.com/1471-2148/13/176

Table 1 Complete list of all 114 populations mentioned in this paper; 97 of these were newly analyzed for this study and 17 stem from [30] (Continued)
Mühlauer Bach MUT Danube/Inn Tyrol 47° 17′ 11° 25′ 12 100.00 NA 2 707 Yes
Rappenbach RAT Danube/Inn Tyrol 47° 23′ 10° 56′ 20 0.00 NA 1 1169 Yes
Rossbach ROT Danube/Inn Tyrol 47° 18′ 10° 52′ 30 77.0 NA 2 967 Yes
Sandtalbraben SAT Danube/Inn Tyrol 47° 32′ 12° 18′ 20 25.00 NA 2 950 Yes
Sendersbach SET Danube/Inn Tyrol 47° 10′ 11° 15′ 31 0.00 NA 1 1726 Yes
Trins-Padast TPT Danube/Inn Tyrol 47° 04′ 11° 24′ 20 0.00 NA 1 1248 Yes
Zeischbach ZET Danube/Inn Tyrol 47° 02′ 11° 34′ 17 12.00 NA 2 1339 Yes
Anlaufbach ANL Danube/Inn/Salzach Szbg 47° 10′ 13° 54′ 65 0.00 19.00 2 1384 Yes
Grubingerbach GRS Danube/Inn/Salzach Szbg 47° 17′ 12° 24′ 17 53.00 NA 1 925 Yes
Krimmler Ache KRS Danube/Inn/Salzach Szbg 47° 05′ 12° 13′ 18 5.00 NA 2 1580 Yes
Rettenbach_1 RMS Danube/Inn/Salzach Szbg 47° 07′ 12° 26′ 20 50.00 NA 1 1158 Yes
Rettenbach_2 RUS Danube/Inn/Salzach Szbg 47° 18′ 12° 25′ 18 100.00 NA 1 1300 Yes
Winbach WIS Danube/Inn/Salzach Szbg 47° 07′ 12° 11′ 31 0.00 34.00 2 1882 Yes
Blühnbach BLU Danube/Inn/Salzach Szbg 47° 28′ 13° 5′ 40 10.00 26.25 2 911 Yes
Fuscher Ache FUS Danube/Inn/Salzach Szbg 47° 09′ 12° 48′ 37 3.00 14.00 1 222 Yes
Sub-total Austrian Inn 452 29.7 23.31
A Hatchery 29 85.19 82.76
B Hatchery 30 74.07 51.67
C Hatchery 24 100.00 100.00
D Hatchery 30 100.00 100.00
E Hatchery 31 100.00 77.42
F Hatchery 40 100.00 98.75
G Hatchery 30 96.00 90.00
H Hatchery 26 95.83 74.00
I Hatchery 27 100.00 100.00
J Hatchery 29 89.29 60.34
Sub-total Hatcheries 296 94.04 83.49
Grand total All sample groups 2984 67.74 71.79
Populations from [30] are shown in bold italics. Listed is the drainage hierarchy, geo-political region (Bav Bavaria, Styr Styria, L_Aus Lower Austria, U_Aus Upper Austria, Car Carinthia, Szbg Salzburg), geographiccoordinates (Lat. Latitude, Long. Longitude), N = number of individuals, (%) mtDNA percentage of Atlantic mtDNA,% LDH-90* percentage of the LDH-90* allele, Mgt management level (1 unstocked, 2 possibleintroductions or immigration from managed reaches, 3 definitely stocked), MASL meters above sea level, Glac previously glaciated (yes, no). Pure Danubian populations in Carinthia with low samples sizes (BIS, SAG,SCH, & WOL) have all been recently validated with increased sample sizes (Weiss, unpublished data).
Lerceteau-Köhleret
al.BMCEvolutionary
Biology2013,13:176
Page7of
18http://w
ww.biom
edcentral.com/1471-2148/13/176

Figure 2 Percentage of Atlantic basin specific markers (mtDNA& LDH-C1 90*) in the 97 populations sampled in this study. Themean (plus S.D) percentage of Atlantic mtDNA and the LDH-C1 90*allele across the major drainages included all hatcheries as a group.N is the number of populations within each drainage.
Lerceteau-Köhler et al. BMC Evolutionary Biology 2013, 13:176 Page 8 of 18http://www.biomedcentral.com/1471-2148/13/176
There was a highly significant difference (Mann–WhitneyU, P < 0.001) in mean allelic richness between populationsfixed for Danubian mtDNA (3.8) and the remainingDanubian populations of the Mur and Drau drainages(6.2). HE likewise ranged widely across populations (0.374to 0.836) and showed wholly analogous patterns of statis-tical significance within and among major basins (data notshown). There was a significant positive correlation be-tween HE and the percent occurrence of Atlantic basinmtDNA across populations in the Austrian Mur (R2 =0.488, P < 0.01) and the Austrian Drau (R2 = 0.391, P <0.05) drainages supporting the influence of recent admix-ture; in contrast, no such correlation was found acrosspopulations in the Bavarian or the Austrian Danube.Most populations (N = 74, 80%) showed no deviation
from HWE, not considering table-wide corrections formultiple testing. The remaining samples that showed sig-nificantly negative FIS-values stem either from hatcheries orsmall headwater streams. Samples that showed significantlypositive FIS-values are known to be either moderately orheavily managed. After correcting for multiple testing onlya single heavily managed population (Schwarza, lowerAustria) deviated significantly from HWE, with a positiveFIS-value, presumably reflecting the presence of both wildand hatchery-origin fish.The global FST across all 97 populations was 0.116 indi-
cating a moderate level of differentiation among popula-tions. Among drainage (Elbe, Rhine, Bavarian Danube,Austrian Danube, Mur and Drau) differentiation was con-siderably lower (FST = 0.031) while within drainage differ-entiation varied widely with the lowest values revealedamong populations within the Bavarian Rhine (FST =0.044) and Elbe (FST = 0.068), and the highest values found
among populations within the Mur (FST =0.1465) andDrau (FST =0.188) where pure Danubian populations werefound. A maximum FST value of 0.228 was observedamong pure Danubian populations, presumably reflectinglong periods of isolation relative to other among popula-tion comparisons within the global data set.Using analog F-statistics (Φ), the AMOVA drainage
model (Rhine, Elbe, Bavarian Danube, Austrian Danube,Mur and Drau) revealed 2.6% of the genetic variance dis-tributed among drainages (ΦCT), 10% among populationswithin drainages (ΦSC), and 87.4% within populations(ΦST), all of which were highly significant (P < 0.0001). Theportion of among drainage variance (ΦCT) rose to 4.8%when using R-statistics reflecting the influence of mutationon the among drainage variance. A higher (ΦCT) value(13.8%) was seen based on a reduced model for differenti-ation between native Danube and remaining Danubianpopulations reflecting the relatively high divergence of pureDanubian populations within the global data set.The allele size permutation test further supported the
influence of mutation on phylogeographic structure (andthus longer periods of isolation) for global comparisons(e.g. among all populations, or among all drainages) aswell as those involving among population differentiationof the native Danube populations (Figure 3). In contrast,non-mutational mechanisms (drift and gene flow) werepresumably dominant in comparisons involving Bavarianpopulations, supporting a surprising lack of geographicstructure across the sampled sites of the three majordrainages (Rhine, Elbe, Danube) in this region.The principal component analysis of populations based
on microsatellites revealed one axis (PC-1, 28.2%) generallyreflecting population differentiation corresponding to thetwo mtDNA (Atlantic and Danubian) lineages (Figure 4).Populations fixed for, or revealing high percentages ofDanubian mtDNA occur to the right along the x axis,whereas those with very low frequencies are to the left.The second axis (PC-2, 7.2%) tends to distinguish amongpopulations within the Atlantic mtDNA lineage; hatcherypopulations are at the low end of the axis, whereby Bava-rian populations (red text) are at the high end and AustrianDanube populations (black text) are generally intermediate(Figure 4). The location of the OBE (Oberallacher Bach)population from the Drau drainage at the low end ofthis axis is concordant with fixation of Atlantic lineagemtDNA despite its south Alpine location. Subsequent toour genetic screening of this population, local authoritiestold us that this river stretch was fishless (above a water-fall) and was stocked by an unknown source. Our dataimply that the source of stocking was a pure Atlantichatchery strain. All additional PCA factors reflected onlyminor portions of variance in the data set, and were nei-ther biologically or geographically interpretable at theglobal scale (Additional file 2).

0
0,05
0,1
0,15
0,2
0,25
0,3
FST
RST
pRST
* P<0.05; ** P<0.01;*** P<0.001;* *** P<0.0001
****
**
**
*
****
FR ro
veula
ST
ST
Population Group Tested
FST
RST
pRST
Figure 3 Global comparisons of FST and RST. Global comparisons of FST and RST using the allele size permutation test carried out it SPAGeDi 1.2.Comparisons include among all populations, among Danube, Mur, and Drau drainages, among the three Bavarian drainages (Danube, Elbe, Rhine),among all Mur populations, among all Drau populations, among all pure Danubian lineage populations, and pure-Danubian versus all otherDanubian populations.
Lerceteau-Köhler et al. BMC Evolutionary Biology 2013, 13:176 Page 9 of 18http://www.biomedcentral.com/1471-2148/13/176
Two of the ten hatcheries (B &C) have an intermediateposition. The first is known to be supplemented with locallycaught fish, while the second is of Czech origin and pre-sumed to be founded with fish from the Elbe drainage. Afew Austrian Danube populations, all north of the Danube(e.g. KK, THA, GAL, VIE), are located intermediate alongthe X-axis, suggesting some admixture with pure Danube-lineage fish. A large number of Austrian Danube popula-tions are found around the center of both axes potentiallyreflecting admixture between one or more lineages.Structure analysis revealed three main clusters primarily
corresponding to: (1) Bavarian populations irrespective ofdrainage; (2) the so-called pure Danubian populations fromthe Mur and Drau; and (3) remaining populations primarilyfrom the Danube catchment (data not shown). However,only the pure Danubian populations showed a high meanproportion of self-assignment (based on mean q-values)(Table 2) (Additional file 3). Within other geographicgroups, the population-level q-values (data not shown) var-ied widely, and some individual populations were assignedto groups outside of their region. For example, severalAustrian populations north of the Danube could beassigned to the Bavarian group (e.g. the mean Q value forVIE = 0.707, HM= 0.699, KK = 0.779, and HOL= 0.702).Likewise, a number of Bavarian populations, including onefrom the Elbe (LAM) could be assigned to the third clusterrepresenting hatcheries. While K = 3 showed the highestdelta K, K = 4 also revealed a biologically meaningful group
consisting of five Austrian populations (KK, HM, KM, GAL& VIE) all from the granitic regions (Waldviertal &Muhlviertal) north of the Danube, thus providing somelevel of distinction from Bavarian populations.Statistically significant but weak isolation-by-distance
signals were seen for Bavaria (R2 = 0.029, P = 0.004),the Austrian Danube (R2 = 0.075, P = 0.026) and pureDanubian populations (R2 = 0.438, P = 0.003) as wellas the Drau drainage alone (Drau R2 = 0.172, P = 0.026),suggesting that natural as opposed to anthropogenicmechanisms are still operative, if not dominant, in deter-mining among population differentiation. The populationtree highly supported both the distinction of Bavaria rela-tive to Danube populations (including hatcheries), and thetwo members of a south alpine group in the Danubedrainages (Mur and Drau). In addition, it provided mode-rate support for a group containing the Rhine and Elbecatchments (Figure 5). A weak but statistically significantsignal for demographic expansion was seen for the Rhinebasin (P = 0.04), as well as the Rhine and Elbe basins com-bined (P = 0.04) using the within-locus k test. This test isnoted for being more sensitive to recent as opposed to an-cient expansion events compared to the inter-locus g test,which did not reveal any statistically significant signal.
Global patterns of admixtureTo generate hypothetical sources of admixture, wesimulated six different crosses between four population

HAA
FOR
GOL
SLI
BIB TAU
GALSTG
THI
HAD
LANHAL
WIE
RAK
ELB
Göß
GES STU
OBE
WEL ANR
RAD
LIC
SWB
SCH
SAG
WOLWEM
KK
HOL
LOH
THA
LUC
TRI
WIS
PIL
JOHERL
KAG PBSUL
RAAWEI
ASC
PIW NAT
GRA
NIK
FUSBLU
ANLOISWEB
HB
HM
EID
BIS
ETR
KOT
TIE
STELAS
MODKAI
TEI
CH
A
B
I
FE
G
K
D
J
MUR
MRZ ROS
WRB
MOO
FUG
GKR
KAJ KM
KY
VIEMAT
LAM
MUH
BIB
MIC
KOHKIR
GEISWAGRU
STBSHU
AXIS 1 - 28%DanubianAtlantic
AXIS
2 -
7%Na
tural
Hatche
ry
XXX = Drau Drainage
XXX = Mur Drainage
XXX = Austrian Danube
XXX = Bavaria (Rhine, Elbe & Danube)
XXX = Hatcheries
> 95% Danubian mtDNA
> 70% Danubian mtDNA
Figure 4 PCA of microsatellite frequency data. Principal components analysis based on microsatellite allele frequency data from 97populations. Populations are colour-coded by major drainage, including hatcheries as a group. Populations carrying > 95% (blue bar) or between70% and 95% (red bar) Danubian lineage mtDNA are additionally marked.
Lerceteau-Köhler et al. BMC Evolutionary Biology 2013, 13:176 Page 10 of 18http://www.biomedcentral.com/1471-2148/13/176
groups (identified with Structure): 1) Hatcheries, 2) pureDanubian, 3) Bavarian, 4) Northeast Austrian graniticgroup (KK, HM, KM, GAL & VIE). There were three pre-sumably admixed population groups of interest: 1) theAustrian Danube, 2) the Mur, and 3) the Drau. For each ofthese three groups, we applied Bayesian clustering tests toeach of the simulated hybrid crosses, resulting in 18 tests.Across all 18 tests, the posterior probably of individual as-signment to an F1 hybrid was negligible (<1%) (Figures 6 &7). However, meaningful levels of individual assignment tosubsequent classes (i.e. F2 and backcrosses) were seen forthe Austrian Danube group (Figure 6) as well as the Murand Drau (Figure 7). The percentage assignment to a post-F1 class for Austrian Danube individuals reached 28 and29% for the two simulated crosses involving hatcheries andother Austrian population groups (i.e. native Danube &granitic North). For the Mur and Drau individuals, assign-ment to a post-F1 class reached a high of 53% for the simu-lated cross between hatcheries and the pure Danubianpopulations (Figure 7).
DiscussionMultiple marker systems (mtDNA, microsatellites, LDH-C1) strongly support the natural occurrence of the
Atlantic lineage of brown trout throughout large areas ofthe upper Danube catchment, whereas there is no evi-dence of the Danube lineage in the sampled populationsof the Bavarian Rhine and Elbe catchments and very littletrace (< 7% mtDNA) of the Danube-lineage in the sam-pled portion of the Bavarian Danube. The cause of thislarge-scale pattern is natural, reflecting the admixed faunalcharacter of the upper Danube established over both geo-logical and glacial time scales [9]. These results are largelyconcordant with the distribution of the Atlantic lineage ofbrown trout in Czech and Slovakian tributaries of theupper Danube [32], but these authors did not argue fornatural colonization. While the timing and colonizationcorridors of especially north-to-south colonizing fish taxa(i.e. from Atlantic to the Danube basin) are poorly under-stood, it is clear that the genera Salvelinus and Coregonus[33] have arrived in the upper Danube relatively recentlyduring the last (Würm) or penultimate (Riss) ice age. Asdivergence for brown trout across the Rhine/Danube/Elbecontact zones are minimal to non-existent, we presumethe species arrived in the upper Danube from the northduring these ice age transitions. However, we emphasizethat described river capture events are primarily in the op-posite direction (i.e. from the Danube into the Atlantic

Table 2 Average proportion of membership (q-values) of wild populations within major drainages to the differentclusters defined by STRUCTURE using K = 3
Drainage Cluster 1 Cluster 2 Cluster 3Bavarian group Pure-Danubian group Hatchery group
Elbe 0.63 (0.22) 0.04 (0.03) 0.33 (0.22)
Rhine 0.73 (0.16) 0.04 (0.01) 0.24 (0.15)
Bavarian Danube 0.62 (0.23) 0.05 (0.02) 0.33 (0.24)
Austrian Danube 0.37 (0.18) 0.18 (0.14) 0.45 (0.16)
Mur 0.23 (0.14) 0.24 (0.18) 0.53 (0.15)
Drau 0.21 (0.13) 0.39 (0.28) 0.40 (0.23)
Pure-Danubian 0.06 (0.04) 0.88 (0.11) 0.06 (0.07)
Standard deviations are shown in parentheses and the highest value for each drainage is shown in bold.
Rhine
Bavarian Danube
Austrian Danube
DrauMur
Hatcheries
Elbe
83
99
100
Figure 5 NJ – tree of populations grouped by drainage.Neighbour-Joining tree of populations (grouped by drainage) basedon Dc chord distances of microsatellite allele frequency data. Supportvalues were based on bootstrapping over loci (500 replicates).
Lerceteau-Köhler et al. BMC Evolutionary Biology 2013, 13:176 Page 11 of 18http://www.biomedcentral.com/1471-2148/13/176
basin), and this corresponds well with the paleo-hydrological perspective that the Danube basin has beencontinuously loosing area to the Rhine and Elbe basinsacross the ice ages [34].While a relatively clear gradient of increasing Danube-
specific alleles is found with increasing distance down-stream (west-to-east) in the Danube catchment, the sourceof admixture displays a geographic as well as glacial pat-tern. Hatchery Atlantic strains appear to be the source ofadmixture in glaciated regions, especially south and south-east of the Alps, whereas natural sources of Atlanticlineage colonization from the upper Bavarian Danube ap-pear to be the primary source of admixture north andnortheast of the Alps, especially in unglaciated regions.Nonetheless, the influence of stocking in the region can beevaluated at a population level, as hatchery and wild Atlanticgenotypes can be distinguished, but the overall presenceand dominance of Atlantic genotypes is based on naturalcolonization.Regardless of the orientation of the Alps, pure Danube
lineage populations are exceedingly rare and appear lim-ited to isolated high elevation populations in previouslyglaciated areas. This inference is further supported by anearlier study reporting 72% Danube lineage mtDNA andnine populations (three reported herein) fixed forDanube-lineage mtDNA in the upper Inn, Lech, Salzachand Drau drainages in Austria [30]. Curiously, all occurwithin previously glaciated areas and all over 1000 me-ters above sea level (MASL) (Table 1; Figure 1). The dis-tribution of populations with 100% Danube-linagemtDNA form a peri-alpine ring that is difficult to ex-plain based on either purely anthropogenic influence orany simple natural mechanism of colonization. Since theanalysis of this data set, three additional pure Danubian-lineage populations have been identified, all on the southslopes of the Alps in Carinthia, and all over 1000 MASL(Weiss, unpublished data).Brown trout undoubtedly occupied large areas of
Austria even during the height of the Würm glaciation,as glaciers did not reach the Danube from the south. No
real glaciation occurred either north of the Danube oracross large areas east and southeast of the Alps. In themountainous region of Salzburg, for example, glaciersreached a maximum extension of about 5–600 MASL ap-proximately 24–22,000 years ago [35]. Based on accessibi-lity, it is assumed that cold-tolerant fish re-colonized theSalzach River catchment post-glacially from the Danubeand its tributaries to a maximum extent ca.11,000 yearago [35] during the early Holocene warm period. Between11 and 4,000 years ago depositional and erosional pro-cesses created numerous impassible barriers isolatingcold-tolerant fishes, namely brown trout and sculpin(Cottus gobio) in some river reaches found between 1 and2,000 MASL today. We assume that this scenario was

0.02
0.70
0
0.14
0 0.14
Simulated CrossPure Danubian x Hatchery
Simulated CrossBavaria x Hatchery
Simulated CrossBavaria x Kamp_Region
Simulated Cross Hatchery x Kamp_Region
Simulated CrossPure Danubian x Kamp_Region
Simulated CrossBavaria x Pure Danubian
0.02
0.80
00.12
0
0.06
0.73
0.02
0
0.17
0.08 0
0.51
0.26
0
0.23
0 0
0.55
0.45
0
0 0
0
0.04
0.67
0.01
0.27
0 0.01
= First parent; = Second parent; = F1; = F2; = BC_0; = BC_1;Figure 6 Assignment of Austrian Danube individuals based on simulated crosses. Mean posterior probability that individual samples fromthe Austrian Danube belong to the parental or hybrid genotype categories listed, for each of six simulated crosses. BC_0 is a first generationbackcross to the first parent of the simulated cross, and BC_1 is a first generation backcross to the second parent of the simulated cross. TheKamp_Region represents populations in crystalline river sites in Northeast Austria (i.e. KK, HM, KM, GAL and VIE).
Lerceteau-Köhler et al. BMC Evolutionary Biology 2013, 13:176 Page 12 of 18http://www.biomedcentral.com/1471-2148/13/176
similar for many other glaciated river valleys of theAustrian Alps. Thus, pure Danubian lineage brown troutare primarily, if not exclusively found in headwater tribu-taries that were accessible in the early Holocene, but arenow physically isolated from downstream colonization.For regions south and southeast of the Alps, Atlantic
lineage trout apparently exist exclusively through human-mediated mechanisms. That the admixture in theseregions is more recent than to the north is stronglysupported by the elevated levels of allelic diversity in the
presence of both mtDNA strains in the Mur and Draucompared to the lack of such a correlation in the north.However, elsewhere the existence of pure Danubianlineage brown trout in isolated headwater systems meansthat they colonized these systems in the early stages of thecurrent interglacial in the absence of the Atlantic lineage.This is difficult to explain as the Atlantic lineage not onlydominates brown trout stocks in the upper Danube inBavaria, but also reveals no signal of recent (i.e. post-glacial) expansion and thus must have been available for

= First parent; = Second parent; = F1; = F2; = BC_0; = BC_1;
Simulated CrossBavaria x Kamp_Region
Simulated CrossHatchery x Kamp_Region
Simulated CrossPure Danubian x Kamp_Region
Simulated Cross Pure Danubian x Hatchery
Simulated CrossBavaria x Pure-Danubian
Simulated Cross Bavaria x Hatchery
0.39
0.61
0%
00
0
0.50
0.120
0.38
0 0
0.14
0.59
0.01
0.26
00
0.11
0.59
0
0.29
00.01
0.14
0.33
0
0.36
0.02
0.15
0.24
0.74
0
0.01
0%
0.01
Figure 7 Assignment of Mur and Drau individuals based on simulated crosses. Mean posterior probability that individual samples from theMur and Drau drainages belong to the parental or hybrid genotype categories listed, for each of six simulated crosses. BC_0 is a first generationbackcross to the first parent of the simulated cross, and BC_1 is a first generation backcross to the second parent of the simulated cross. TheKamp_Region represents populations in crystalline river sites in Northeast Austria (i.e. KK, HM, KM, GAL and VIE).
Lerceteau-Köhler et al. BMC Evolutionary Biology 2013, 13:176 Page 13 of 18http://www.biomedcentral.com/1471-2148/13/176
post-glacial colonization of the Alps. There is also noindication of a breeding barrier between Danubian andAtlantic lineages. Thus, the post-glacial expansion intoalpine rivers of only one of these two co-existing line-ages strongly implies some level of pre-glacial physicalseparation within the upper Danube. Interestingly, someauthors have considered the Atlantic lineage browntrout stocks in the region as Salmo trutta, but theDanubian linage brown trout stocks in the upperDanube as Salmo labrax admitting a hybrid zone in the
upper Danube [24]. Regardless of one’s taxonomic view-point, we postulate that the Danube lineage of browntrout must have existed in numerous small-scale peri-Alpine refugia and were the initial colonizers of at leastsome Alpine streams following glacier retreat. Such ascenario begs the question of whether the Danubelineage is more adapted to steeper gradient or glaciallyinfluenced habitats. Increasing attention is being paid tofiner than basin-scale local adaption of brown trout[36]. Keller et al. [37] investigated the possibility of an

Lerceteau-Köhler et al. BMC Evolutionary Biology 2013, 13:176 Page 14 of 18http://www.biomedcentral.com/1471-2148/13/176
elevation gradient being associated with outlier loci show-ing some signs of divergent selection within drainages butthe association with elevation were weak, and the Danubelineage was essentially not involved in their work. Theexisting isolated populations of the pure Danubian lineagein high elevation habitats of Austria provide an intriguingsource of material for future experiments on their poten-tial for adaptive advantage compared to the Atlanticlineage. In contrast, one could pose the hypothesis ofwhether or not the Atlantic lineage has an adaptive advan-tage over the Danube lineage in the lower elevation rivercourses.Regardless of such experimental avenues, it is apparent
that a phylogeographic paradigm for European browntrout is failing to provide both researchers and managerswith the proper framework for providing biological in-sights. From a purely management standpoint, the identi-fication of a “Danubian” or an “Atlantic” genetic lineage isuseless if not misleading in many (but not all) areas of theDanube basin, because the so-called Atlantic lineage is thedominant native trout lineage in much if not all of theBavarian Danube and overlaps extensively in many drain-ages of Austria as well. Moreover, a homogeneous view ofthe Danubian lineage for management purposes mightvery well be counter-productive if strong selective mecha-nisms are operative in higher elevation populations. In-deed, elevation as a proxy for specific environmentalconditions may turn out to be an important functionalcharacteristic at the population or meta-population levelfor conservation purposes. Discarding or lumping ad-mixed populations might also be counter-productive ifsome regions have arrived at this admixture throughhuman-mediated events, while others have been admixedfor thousands of years, representing unique and well-adapted gene pools. Our results and baseline data allow usto distinguish not only between native and anthropogenicintrogression within the Atlantic lineage, but also the relictstatus of peri-alpine Danubian populations providing avaluable resource for future conservation planning.The initial naming and description of five major
mtDNA lineages in brown trout [13] was a break-through for European phylogeographic studies. Numer-ous subsequent studies have added detail and somecontroversy as to the origin of these lineages, but todate no study has provided a single biologically relevantcharacter that is fixed or even predominant in one ormore of these so-called lineages. Considering the high-level of physical fragmentation of all brown trout popu-lations, it may be time to question the usefulness ofthe mtDNA phylogeographic lineages in managementschemes, but also in the logical construction of basicscience research programs. The universality of this con-cern related to other phylogeographically circumscribedlineages of plants and animals can be debated, but for
highly fragmented species with large ranges it might in-deed be broadly applicable, as recently suggested forEuropean grayling [38], another pan-European salmonidspecies.
ConclusionsThe Atlantic lineage of brown trout is native to large areasof the upper Danube in Bavaria where it predominates,but also in numerous drainages of the Austrian Danube.The lineage has been a very successful post-glacial invaderof river courses of the Austrian Danube, but to date thereis no evidence of natural occurrence south and southeastof the Alps in the provinces of Styria and Carinthia. PureDanubian lineage populations are found primarily in pre-viously glaciated regions at higher elevations, in a peri-alpine distribution implying that the lineage colonizedheadwater river courses post-glacially ahead of the expan-sion of the Atlantic lineage. The distribution pattern ofthese two lineages is difficult if not impossible to describewithout invoking strong biological mechanisms, meaningthat a purely phylogeographic paradigm for these lineagesfails to explain their distribution in the upper Danubebasin. More recently, anthropogenic activities have aidedthe spread of the Atlantic lineage and there is no clear evi-dence of niche segregation or a breeding barrier where thetwo lineages are found in sympatry today.
MethodsSamplesA total of 2568 brown trout were sampled from 97 popu-lations (including 10 hatcheries) across Austrian andBavarian reaches of the upper Danube basin, as well asBavarian reaches of the upper Elbe and Rhine catchments(Table 1; Figure 1). Fish were sampled with certified back-pack electric fishing generators, licensed operators, andwith written permission from the local (district) level au-thorities as required by law. Small (1.2 mm) samples werecut from regenerative caudal fin tissue and stored in 96%ethanol. All fish were released unharmed back into theirrespective habitats. A wide variety of natural and relativelyintact habitats were sampled including small headwaterswith little or no known history of stocking as well as mod-erate to heavily managed fisheries. For post-hoc descrip-tive purposes, each population was given a three scalerating in relation to known management history: 1) noknown history of stocking and unlikely affected by disper-sal from managed waters; 2) at least one known event ofstocking and/or lack of isolation from managed waters: 3)known history of stocking and management. GenomicDNA was extracted from fin clips using a high-salt extrac-tion technique [39]. For some analyses and inferencesconcerning mtDNA only, published data [30] from anadditional 17 populations primarily from the upper Inn drain-age in western Austria were also used (Table 1; Figure 1).

Lerceteau-Köhler et al. BMC Evolutionary Biology 2013, 13:176 Page 15 of 18http://www.biomedcentral.com/1471-2148/13/176
Thus the total number of populations integrated into the in-ferences of this study is 114, whereas results of 97 of these arereported for the first time.
Genetic analysisMicrosatellite analysis was based on a two reaction, 12locus multi-plex assay specifically developed and optimizedfor the region as previously reported [40]. SSR profiles wererecorded using the GeneMapper Software v3.7 (AppliedBiosystems). Following evaluation with the program Micro-Checker 2.2 [41], one locus (Ssa85) was removed from theanalysis due to the unambiguous presence of null alleles.Variation at two additional markers (mtDNA and LDH-C)was evaluated due to their broad-scale phylogeographic in-formation content. Raw allelic data for all loci and popula-tions is provided [Additional file 4].
mtDNAAs both the Atlantic and Danubian mtDNA lineages ofbrowns trout exist in the region [13,14,25], we developedan allele-specific PCR assay to assign an individual’smtDNA to one of these two lineages. A multi-plex allele-specific assay was developed to screen two diagnostic posi-tions in the control region (positions 26 & 389 in [27]).One primer (Da26 –GACTTTTCAGCTATGTACAATAACAAA) was combined with three published primers(LN19 and HN20 [13]; and 28ribaF [40]) to produce diag-nostic bands for the Atlantic (452 bp) and Danubian(1035 bp) lineages. The PCR was performed in a total vol-ume of 10 μl with 1X reaction buffer (PeqLab), 0.2 mM ofeach dNTP, 0.06 μM of primer At389Rd, 0.4 μM of primerDa26 + 2Fb, 0.15 μM of primer CytR, 0.03 μM of primer28ribaF, 1.1 mM of MgCl2, 0.4 U Taq polymerase (PeqLab)and 20–50 ng genomic DNA. The reaction consisted of3 min denaturation at 94°C, 32 cycles of 45 s at 94°C, 15 sat 61°C, 30 s at 72°C, and a final extension step of 7 min at72°C. The reactions were loaded on a 2% agarose gel.
LDH-C1We developed an allele-specific duplex assay to replacethe PCR-RFLP assay from [42] in order to efficientlyscreen the bi-allelic phylogeographically informative LDH-C1 locus [43]. We selected two primers (Ldhxon4F-100and Ldhxon4R-At) with the 3′end located on the allele-defining substitution, which in combination withLdhxon3F and Ldhxon4R [42] allowed detection of allthree relevant genotypes in one PCR. PCR was performedin a total volume of 10 μl with 1X reaction buffer(PeqLab), 0.2 mM of each dNTP, 0.8 μM of primerLdxon4F-100 (ATTGTTCTCCCACGGTCAGA), 0.1 μMof primer Ldxon4R-At (GTTCGCCGTCACAGAGTAGC), 0.03 μM of primer Ldhxon3F, 0.03 μM of primerLdhxon4R, 1.8 mM of MgCl2, 0.8 U Taq polymerase(PeqLab) and 20–50 ng genomic DNA. The reaction
consisted of 3 min denaturation at 94°C, 32 cycles of 45 sat 94°C, 10 s at 70°C, 30 s at 72°C, and a final extensionstep of 7 min at 72°C. The reactions were loaded on a3.8% NuSieve GTG agarose gel (Cambrex Bio Science).Amplified fragments of 340 bp and 100 bp characterizethe *90 and *100 alleles, respectively, while an additional440 bp fragment spanning regions of exons 3 and 4, asdescribed in [42] is also observed.
Data analysisThe number of alleles per locus, allelic richness, observed(HO) and expected (HE) heterozygosity and tests for devia-tions from Hardy-Weinberg expectations (HWE) wereperformed with FSTAT 2.9.3.2 [44]. The distribution ofgenetic variation across major drainage basins was evalu-ated with an hierarchical analysis of genetic variation(AMOVA) [45] using Arlequin v 3.11 [46] whereby anumber of geographic partitions were evaluated usingboth FST- and RST-statistics. The contribution of microsa-tellite allele sizes (i.e. a measure reflecting mutation) tothe distribution of this variation was examined using theallele size permutation test [47] implemented in SPAGeDi1.2 [48]. The distribution of RST values from 10 000 permu-tations (pRST) was compared to the observed RST, which isanalogous to FST when mutations are not contributing togenetic differentiation, and significantly greater than FSTwhen they do. Such an evaluation should allow more tem-poral insight into the comparison of pairwise divergence es-timates among groups of populations and whole basins. Togain perspective on the overall genetic relationships amongthe large number of populations screened we also carriedout a Principal Component Analysis (PCA) on gene fre-quency data using the software PCAGEN 1.2 [49]. Popula-tions were also grouped into drainages and unrootedNeighbor-Joining trees were constructed using the programPopulations 1.2.30 [50]. Population trees were constructedbased on the Dc chord distance [51]. Node confidence wasevaluated by bootstrapping over loci (500 replicates).An a priori evaluation of genetic structure across the
global data set was carried out with the program Structurev2.1 [52] assuming admixture and independent allele fre-quencies. For each simulated K, the first 20,000 steps werediscarded as burn-in, followed by 100,000 iterations to col-lect the data. We derived the most likely value of K usingthe second-order rate of change L”(K) following [53] usingthe on-line tool Structure Harvester (http://taylor0.biol-ogy.ucla.edu/struct_harvest). Structure analysis was re-peated separately for a number of population groupsdefined by major drainages or sub-drainages (i.e. Rhine,Elbe, Bavarian Danube, Austrian Danube, Mur & Drau).Correlations between pairwise geographic (GGD) and
genetic (FST) distances were examined using the Manteltest implemented in the GeneAlEx 6 software [54]. Toassess whether significant drainage-wide demographic

Lerceteau-Köhler et al. BMC Evolutionary Biology 2013, 13:176 Page 16 of 18http://www.biomedcentral.com/1471-2148/13/176
events may affect our global inferences we tested forboth expansion and bottlenecks across groups of popula-tions. Demographic expansion within drainages wasassessed using the within-locus k test and the inter-locusg test [55] using the Excel (Microsoft) Macro developedby [56]. The significance of k was evaluated with a one-tailed binomial distribution, whereas the significance ofg was based on cut-off values as described in [57].Finally, to evaluate the potential that genotypic profiles
within the Austrian Danube have a hybrid origin, we com-bined a series of simulated hybrid data sets based onhypothetical hybrid scenarios with Bayesian assessment ofmembership of individual multi-locus genotypes using thesoftware NewHybrids Version 1.1 [58]. Genotypes fromthe Austrian Danube basin were tested for membership tovarious hybrid classes using six different hybrid scenarios,whereby at least one parental source of Atlantic origin wasused in five of six scenarios and Atlantic lineage genotypesof both natural and hatchery origin were consideredseparately. Considering the historical complexity of thesesystems as well as the size of the data set, our goal withthis analysis was to gain global insight on the plausibilityof various hybrid scenarios without elaborating on thestatistical confidence of individual genotype assignment orhybrid architecture of individual populations. As the pre-cise procedure was based to some extent on other majorresults of our study, more detailed description of theseanalyses is integrated into the Results section.
Availability of supporting dataThe data sets supporting the results of this article are in-cluded within the article and its additional files.
Additional files
Additional file 1: Population Genetic Statistics of all Populations.Population genetic statistics for all sampled populations. Shown is thefull name of the population, a three letter code, AR = Allelic Richness,HE = Expected Heterozygosity, HO = Observed Heterozygosity, FIS =Inbreeding Coefficient, Sig. = P-value for the inbreeding coefficient,whereby NS is not significant.
Additional file 2: Additional PCA factors. Scatterplots of PCA factor 1(X Axis) against factors 3 through 6 (Y Axis), based on a PCA ofmicrosatellite allele frequencies in all 97 newly typed populations. Theadditional factors further support several outlier populations as well asthe uniqueness of several Pure Danubian populations (e.g. ANR and BIS)and the differentiation between these and Bavarian populations. Severalof these populations defining the Y – axis are labeled with thepopulation code for reference. There is however no general pattern orinference that can be drawn from these additional vectors of variation.
Additional file 3: Q-Values of Pure Danubian Populations.Percentage Self Assignment (Q-values from STRUCTURE analysis) of allpure Danubian populations found in this study. One known stocktransport from Anrasersee to the Anlaufbach/Winbach drainage wasmade and is clearly evidenced here. Additionally, fish from these streamswere released into Fuscher Ache by local authorities.
Additional file 4: Complete set of microsatellite data. Individual allelicdata of all microsatellite loci across all populations analyzed in this study.
Competing interestsThe authors declare that they have no competing interests.
Authors’ contributionsEL-K carried out the majority of the laboratory work as well as nearly allstatistical analyses and contributed to the first draft of the manuscript as apost-doc employed in the research group of SW. US contributed to thedesign and development of this research study as well as to the collectionand maintenance of all Bavarian sample material. TK contributed substantiallyto the laboratory work and analysis. SW conceived the design of the projectand supervised the research study at all stages, contributed some statisticalanalyses and designed and wrote the first draft of the manuscript.All authors read, contributed revisions and approved the final manuscript.
AcknowledgementsThe work was primarily funded by the provincial governments of lowerAustria and Styria as well as the lower Austrian fishery association under theso-called “TROUCTCHECK” project, done in close cooperation with GünterUnfer of the Institute of Hydrobiology and Aquatic Ecosystem Managementof the University of Natural Resources and Life Sciences, Vienna. Additionalfunding was obtained through Klaus Kugi of the Nature Protection Agencyof the Carinthia. Numerous people have assisted in the sample collectionand several students including Ana Sprajc and Stephan Kurat contributed tothe laboratory work. A special thanks goes to Dr. Otto Schwomma of thelower Austrian fishery association for his promotion and sincere interest ofthis project throughout all phases.
Author details1Institute of Zoology, Karl-Franzens University Graz, Universitätsplatz 2,A-8010 Graz Austria. 2Department of Ichthyology, Bavarian State Collection ofZoology (ZSM), Münchhausenstr. 21, D-81247, München Germany.3Department of Plant Biology and Forest Genetics,Uppsala BioCenter,Swedish University of Agricultural Sciences (SLU), Box 7080, S-750 07 UppsalaSweden. 4Institute of Plant Sciences, Karl-Franzens University Graz,Schubertstraße 51, A-8010 Graz Austria.
Received: 6 March 2013 Accepted: 15 August 2013Published: 26 August 2013
References1. Avise JC: Twenty-five key evolutionary insights from the
phylogeographic revolution in population genetics. In Phylogeographyof southern european refugia. Edited by Weiss S, Ferrand N. Dordrecht,The Netherlands: Springer; 2006:7–21.
2. Moritz C, McGuigan K, Bernatchez L: Conservation of freshwater fishes:integrating evolution and genetics with ecology. In Freshwater FishConservation: options for the future. Edited by Collares-Pereira MJ, CoelhoMM, Cowx IG. Oxford: Blackwell Science; 2002:293–310.
3. Salzburger W, Brandstatter A, Gilles A, Parson W, Hempel M, Sturmbauer C,Meyer A: Phylogeography of the vairone (Leuciscus souffia, Risso 1826) inCentral Europe. Mol Ecol 2003, 12(9):2371–2386.
4. Gross R, Kühn R, Baars M, Schröder W, Stein H, Rottmann O: Geneticdifferentiation of European grayling populations across the Main,Danube and Elbe drainages in Bavaria. J Fish Biol 2001, 58(1):264–280.
5. Englbrecht CC, Freyhof J, Nolte A, Rassmann K, Schliewen U, Tautz D:Phylogeography of the bullhead Cottus gobio (Pisces: Teleostei: Cottidae)suggests a pre-pleistocene origin of the major central Europeanpopulations. Mol Ecol 2000, 9(6):709–722.
6. Nesbo CL, Fossheim T, Vollestad LA, Jakobsen KS: Genetic divergence andphylogeographic relationships among European perch (Perca fluviatilis)populations reflect glacial refugia and postglacial colonization. Mol Ecol1999, 8(9):1387–1404.
7. Durand JD, Persat H, Bouvet Y: Phylogeography and postglacial dispersionof the chub (Leuciscus cephalus) in Europe. Mol Ecol 1999, 8(6):989–997.
8. Konopinski MK, Amirowicz A, Kukula K: Probable direction of thepostglacial colonization of rivers on northern slopes of the CarpathianRidge by Barbus carpathicus (Teleostei: Cyprinidae) evidenced by cline ofgenetic variation. J Fish Biol 2007, 70:406–415.
9. Bânârescu P: Zoogeography of fresh waters, Volume 2: distribution anddispersal of freshwater animals in North America and Eurasia. Wiesbaden:AULA-Verlag; 1991.

Lerceteau-Köhler et al. BMC Evolutionary Biology 2013, 13:176 Page 17 of 18http://www.biomedcentral.com/1471-2148/13/176
10. Allendorf F, Ryman N, Stennek A, Stahl G: Genetic-variation inScandinavian brown trout (Salmo trutta L) - evidence of distinctsympatric populations. Hereditas 1976, 83(1):73–82.
11. Ryman N, Allendorf FW, Stahl G: Reproductive isolation with little geneticdivergence in sympatric populations of brown trout (Salmo trutta).Genetics 1979, 92(1):247–262.
12. Ferguson A, Mason FM: Allozyme evidence for reproductively isolatedsympatric populations of brown trout Salmo trutta L in Lough Melvin,Ireland. J Fish Biol 1981, 18(6):629–642.
13. Bernatchez L, Guyomard R, Bonhomme F: DNA sequence variation of themitochondrial control region among geographically andmorphologically remote European brown trout Salmo trutta populations.Mol Ecol 1992, 1(3):161–173.
14. Bernatchez L: The evolutionary history of brown trout (Salmo trutta L.)inferred from phylogeographic, nested clade, and mismatch analyses ofmitochondrial DNA variation. Evolution 2001, 55(2):351–379.
15. Cortey M, Pla C, Garcia-Marin JL: Historical biogeography ofMediterranean trout. Mol Phylogenet Evol 2004, 33(3):831–844.
16. Sušnik S, Snoj A, Wilson IF, Mrdak D, Weiss S: Historical demography ofbrown trout (Salmo trutta) in the Adriatic drainage including theputative. Mol Phylogenet Evol 2007, 44(1):63–76.
17. Apostolidis AP, Madeira MJ, Hansen MM, Machordom A: Genetic structureand demographic history of brown trout (Salmo trutta) populations fromthe southern Balkans. Freshwater Biol 2008, 53(8):1555–1566.
18. Suárez J, Bautista JM, Almodóvar A, Machordom A: Evolution of themitochondrial control region in Palaearctic brown trout (Salmo trutta)populations: the biogeographical role of the Iberian Peninsula.Heredity 2001, 87:198–206.
19. Martinez P, Bouza C, Castro J, Hermida M, Pardo BG, Sanchez L: Analysis ofa secondary contact between divergent lineages of brown trout Salmotrutta L. from Duero basin using microsatellites and mtDNA RFLPs.J Fish Bio 2007, 71B:195–213.
20. Snoj A, Maric S, Bajec SS, Berrebi P, Janjani S, Schoffmann J:Phylogeographic structure and demographic patterns of brown trout inNorth-West Africa. Mol Phylogenet Evol 2011, 61(1):203–211.
21. Splendiani A, Giovannotti M, Cerioni PN, Caniglia ML, Caputo V:Phylogeographic inferences on the native brown trout mtDNA variationin central Italy. Ital J Zool 2006, 73(2):179–189.
22. Apostolidis AP, Triantaphyllidis C, Kouvatsi A, Economidis PS: MitochondrialDNA sequence variation and phylogeography among Salmo trutta L(Greek brown trout) populations. Mol Ecol 1997, 6(6):531–542.
23. Sušnik S, Schoffmann J, Weiss S: Genetic verification of native brown troutfrom the Persian Gulf (Catak Cay River, Tigris basin). J Fish Biol 2005,67(3):879–884.
24. Kottelat M, Freyhof J: Handbook of European Freshwater Fishes. Cornol:Kottelat, Berlin: Freyhof; 2007.
25. Weiss S, Schlotterer C, Waidbacher H, Jungwirth M: Haplotype (mtDNA)diversity of brown trout Salmo trutta in tributaries of the AustrianDanube: massive introgression of Atlantic basin fish - by man or nature?Mol Ecol 2001, 10(5):1241–1246.
26. Riffel M, Storch V, Schreiber A: Allozyme variability of brown trout(Salmo trutta L.) populations across the Rhenanian-Danubian watershedin southwest Germany. Heredity 1995, 74(3):241–249.
27. Weiss S, Antunes A, Schlotterer C, Alexandrino P: Mitochondrial haplotypediversity among Portuguese brown trout Salmo trutta L. populations:relevance to the post-Pleistocene recolonization of northern Europe.Mol Ecol 2000, 9(6):691–698.
28. Hantke R: Flußgeschichte Mitteleuropas – Skizzen zu einer, Vegetations-und Klimageschichte der letzten 40 Millionen Jahre. Stuttgart: FerdinandEnke Verlag; 1993.
29. Schliewen U, Englbrecht C, Rassmann K, Miller M, Klein L, Tautz D:Veränderungen der genetischen Vielfalt: Molekulare und populations-ökologische Charkterisierung autochoner und durch Besatz beeinflussterSalmoniden-Populationen (Bachforelle, Alpen-Seesaibling) in Bayern. Berlin:Umweltbundesamt; 2001:206. Available through http://www.umweltdaten.de/publikationen/fpdf-l/2014.pdf.
30. Baric S, Riedl A, Meraner A, Medgyesy N, Lackner R, Pelster B, Via JD:Alpine headwater streams as reservoirs of remnant populations of theDanubian clade of brown trout. Freshwater Biol 2010, 55(4):866–880.
31. van Husen D: Die Ostalpen in den Eiszeiten: palägeographischen Karte derletzen Eiszeit 1:5000.000. Wien: Geologische Bundesanstallt; 1987.
32. Kohout J, Jaškova I, Papoušek I, Šedivá A, Šlechta V: Effects of stocking onthe genetic structure of brown trout, Salmo trutta, in Central Europeinferred from mitochondrial and nuclear DNA markers. Fisheries ManagEcol 2012, 19:252–263.
33. Winkler KA, Pamminger-Lahnsteiner B, Wanzenbock J, Weiss S:Hybridization and restricted gene flow between native and introducedstocks of Alpine whitefish (Coregonus sp.) across multiple environments.Mol Ecol 2011, 20(3):456–472.
34. Fink J: Die Paläogeographie der Donau. In Limnologie der Donau. vol. Teil III.Stuttgart: Schweizerbar’scher Verlagsbuchhandlung; 1966:1–50.
35. Ibetsberger H, Jäger P, Häupl M: Der Zerfall des Salzachgletschers unddie nacheiszeitliche Entwicklung des Salzburger Gewässersystems ausder Sicht der Wiederbesiedlung der Salzburger Gewässer mit Fischen.In Nacheiszeitliche Entwicklung des Salzburger Gewässernetzes. Land Salzburg:Österreich; 2010:7–54.
36. Meier K, Hansen MM, Bekkevold D, Skaala O, Mensberg KLD: An assessment ofthe spatial scale of local adaptation in brown trout (Salmo trutta L.): footprintsof selection at microsatellite DNA loci. Heredity 2011, 106(3):488–499.
37. Keller I, Taverna A, Seehausen O: Evidence of neutral and adaptive geneticdivergence between European trout populations sampled alongaltitudinal gradients. Mol Ecol 2011, 20(9):1888–1904.
38. Weiss S, Kopun T, Sušnik Bajec S: Assessing natural and disturbedpopulation structure in European grayling, Thymallus thymallus(Salmonidae): melding phylogeographic, population genetic, andjurisdictional perspectives for conservation planning. J Fish Biol 2013,82(2):505–521.
39. Miller SA, Dykes DD, Polesky HF: A simple salting out procedure forextracting DNA from human nucleated cells. Nucleic Acids Res 1988,16(3):1215–1215.
40. Lerceteau-Köhler E, Weiss S: Development of a multiplex PCRmicrosatellite assay in brown trout Salmo trutta, and its potentialapplication for the genus. Aquaculture 2006, 258(1–4):641–645.
41. Van Oosterhout C, Hutchinson WF, Wills DPM, Shipley P: Micro-checker:software for identifying and correcting genotyping errors inmicrosatellite data. Mol Ecol Notes 2004, 4(3):535–538.
42. McMeel OM, Hoey EM, Ferguson A: Partial nucleotide sequences, androutine typing by polymerase chain reaction-restriction fragment lengthpolymorphism, of the brown trout (Salmo trutta) lactate dehydrogenase,LDH-C1*90 and*100 alleles. Mol Ecol 2001, 10(1):29–34.
43. Hamilton KE, Ferguson A, Taggart JB, Tomasson T, Walker A, Fahy E:Post-glacial colonization of brown trout, Salmo trutta L - LDH-5 as aphylogeographic marker locus. J Fish Biol 1989, 35(5):651–664.
44. Goudet J: FSTAT, version 2.9.3: a program to estimate and test gene diversities andfixation indices. [Available via http://www2.unil.ch/popgen/softwares/fstat.htm]
45. Excoffier L, Smouse PE, Quattro JM: Analysis of molecular variance inferredfrom metric distances among DNA haplotypes: application to humanmitochondrial DNA restriction data. Genetics 1992, 131(2):479–491.
46. Excoffier L, Laval G, Schneider S: Arlequin ver. 3.0: an integrated software packagefor population genetics data analysis. Evol Bioinform Online 2005, 1:47–50.
47. Hardy OJ, Charbonnel N, Freville H, Heuertz M: Microsatellite allele sizes:a simple test to assess their significance on genetic differentiation.Genetics 2003, 163(4):1467–1482.
48. Hardy OJ, Vekemans X: SPAGeDi: a versatile computer program to analysespatial genetic structure at the individual or population levels. Mol EcolNotes 2002, 2(4):618–620.
49. Goudet J: PCAGEN 1.2. [Available via http://www2.unil.ch/popgen/softwares/pcagen.htm]
50. Langella O: Populations 1.2.30. [Available http://bioinformatics.org/~tryphon/populations]
51. Cavalli-Sforza LL, Edwards AWF: Phylogenetic analysis: models andestimation procedures. Am J Hum Genet 1967, 19:233–257.
52. Pritchard JK, Stephens M, Donnelly P: Inference of population structureusing multilocus genotype data. Genetics 2000, 155(2):945–959.
53. Evanno G, Regnaut S, Goudet J: Detecting the number of clusters ofindividuals using the software STRUCTURE: a simulation study. Mol Ecol2005, 14(8):2611–2620.
54. Peakall R, Smouse PE: GenAlEX 6: genetic analysis in excel. Population geneticsoftware for teaching and research. Mol Ecol Notes 2006, 6(1):288–295.
55. Reich DE, Goldstein DB: Genetic evidence for a paleolithic humanpopulation expansion in Africa (vol 95, pg 8119, 1998). Proc Natl Acad SciU S A 1998, 95(18):11026–11026.

Lerceteau-Köhler et al. BMC Evolutionary Biology 2013, 13:176 Page 18 of 18http://www.biomedcentral.com/1471-2148/13/176
56. Bilgin R: Kgtests: a simple excel macro program to detect signatures ofpopulation expansion using microsatellites. Mol Ecol Notes 2007,7(3):416–417.
57. Reich DE, Feldman MW, Goldstein DB: Statistical properties of two teststhat use multilocus data sets to detect population expansions. Mol BiolEvol 1999, 16(4):453–466.
58. Anderson EC, Thompson EA: A model-based method for identifyingspecies hybrids using multilocus genetic data. Genetics 2002,160(3):1217–1229.
doi:10.1186/1471-2148-13-176Cite this article as: Lerceteau-Köhler et al.: Genetic variation in browntrout Salmo trutta across the Danube, Rhine, and Elbe headwaters:a failure of the phylogeographic paradigm?. BMC Evolutionary Biology2013 13:176.
Submit your next manuscript to BioMed Centraland take full advantage of:
• Convenient online submission
• Thorough peer review
• No space constraints or color figure charges
• Immediate publication on acceptance
• Inclusion in PubMed, CAS, Scopus and Google Scholar
• Research which is freely available for redistribution
Submit your manuscript at www.biomedcentral.com/submit
Copyright © 2022 FDOKUMEN