the “PROSPER” method, with application on brown trout (Salmo
Upload
independentCategory
view
3download
0
Short-and long term niche segregation and individualspecialization of brown trout (Salmo trutta)in species poor Faroese lakes
Jakob Brodersen & Hilmar J. Malmquist & Frank Landkildehus &
Torben L. Lauridsen & Susanne L. Amsinck & Rikke Bjerring &
Martin Søndergaard & Liselotte S. Johansson & Kirsten S. Christoffersen &
Erik Jeppesen
Received: 24 January 2011 /Accepted: 14 August 2011# Springer Science+Business Media B.V. 2011
Abstract Trophic niche divergence is considered tobe a major process by which species coexistence isfacilitated. When studying niche segregation in lakeecosystems, we tend to view the niche on a one-dimensional pelagic-littoral axis. In reality, however,the niche use may be more complex and individualfidelity to a niche may be variable both between andwithin populations. In order to study this complexity,
relative simple systems with few species are needed.In this paper, we study how competitor presenceaffects the resource use of brown trout (Salmo trutta)in 11 species-poor Faroese lakes by comparingrelative abundance, stable isotope ratios and diet inmultiple habitats. In the presence of three-spinedsticklebacks (Gasterosteus aculeatus), a higher pro-portion of the trout population was found in the
Environ Biol FishDOI 10.1007/s10641-011-9914-z
J. Brodersen : F. Landkildehus : T. L. Lauridsen :S. L. Amsinck : R. Bjerring :M. Søndergaard :L. S. Johansson : E. JeppesenDepartment of Bioscience, Aarhus University,Vejlsøvej 25,DK-8600 Silkeborg, Denmark
J. BrodersenDepartment of Biology/Aquatic Ecology, Lund University,223 62 Lund, Sweden
H. J. MalmquistNatural History Museum of Kópavogur,Hamraborg 6a,IS-200 Kópavogur, Iceland
K. S. ChristoffersenFreshwater Biological Laboratory,University of Copenhagen,Helsingørsgade 51,DK-3400 Hillerød, Denmark
E. JeppesenGreenland Climate Research Centre (GCRC),Greenland Institute of Natural Resources,Nuuk, Greenland
E. JeppesenThe Sino-Danish Center for Educationand Research (SDC),Beijing, China
Present Address:J. Brodersen (*)Department of Fish Ecology and Evolution, EAWAG SwissFederal Institute of Aquatic Science and Technology,Center of Ecology, Evolution and Biochemistry,Seestrasse 79,CH-6047 Kastanienbaum, Switzerlande-mail: [email protected]

pelagic habitat, and trout in general relied on a morepelagic diet base as compared to trout living in allopatryor in sympatry with Arctic charr (Salvelinus alpinus).Diet analyses revealed, however, that niche-segregationmay be more complex than described on a one-dimensional pelagic-littoral axis. Trout from bothlittoral and offshore benthic habitats had in thepresence of sticklebacks a less benthic diet ascompared to trout living in allopatry or in sympatrywith charr. Furthermore, we found individual habitatspecialization between littoral/benthic and pelagic troutin deep lakes. Hence, our findings indicate that fortrout populations interspecific competition can driveshifts in both habitat and niche use, but at the sametime they illustrate the complexity of the ecologicalniche in freshwater ecosystems.
Keywords Niche complexity. Stable isotopes . Trout .
Stickleback . Aquatic ecology. Faroe Islands
Introduction
A central, but much debated (e.g. Hubbell 2001;Chase and Leibold 2003) concept in ecological theoryis the ‘ecological niche’. Hutchinson (1957; 1959)originally defined the ecological niche as a hyper-volume in an n-dimensional space with environmentalvariables as axes. However, empirical measurementsof all potential dimensions will probably never beaccomplished for any species occurring in a naturalecosystem (Chase and Leibold 2003). Ecologists aretherefore challenged as they have to reduce thenumber of potential axes of resource specializationto a single or a few measurable axes. In lakeecosystems, the niche is often measured on a two-dimensional scale with limnetic/pelagic and benthic/littoral organisms as end points (e.g. Schluter andMcPhail 1992; Svanbäck and Persson 2009), whichconveniently can be determined by two end-memberstable isotope analyses (Post 2002). However, whentreating the niche as a one-dimensional variable, wemay trade-off the ability to measure the complexity ofreality for convenience. Also we might end upmeasuring habitat use rather than niche. Theseconcepts of habitat and niche are highly entangled,which is likely due to the confusion of whether nicherefers to aspects of environment or species (Chase andLeibold 2003). There are in that regard a large
biological difference between how a species exploitsa habitat and in which habitat a species forage.
However, it is not only important to recognize thateach species has a certain niche, but also toacknowledge that each individual in a populationmay vary in its niche use, both compared to otherindividuals, but also temporally. The importance ofindividual phenotypic variation is generally recog-nized as the raw material on which evolution acts.Individual flexibility may enable adaptation to currentconditions in the changing environment, and the sumof individual adaptations will shape the response ofpopulations to variations in the environment, forinstance changed competition or predation pressure.Competition may particularly affect niche use. Insympatry, ecologically similar species are expected todiverge in habitat use and/or diet, whereas inallopatry, species are expected to converge in theiruse of the same primary resources (MacArthur andLevins 1967; Schoener 1982; Tilman 1987).
In fishes, partitioning of resources by ecologicallysimilar species has been well documented, in partic-ular among Arctic charr (Salvelinus alpinus (L.)) andbrown trout (Salmo trutta L.) in temperate lakes(Langeland et al. 1991; Jansen et al. 2002, Klemetsenet al. 2003; Jonsson et al. 2008). In sympatry, charrand trout populations usually utilize distinct habitatand prey resources. Generally, charr feed on zoo-plankton in offshore habitats, while trout utilize thelittoral zone and feed on benthic invertebrates andsurface arthropods (Langeland et al. 1991; Klemetsenet al. 2003; Jonsson et al. 2008). In allopatry, charr,but not trout, usually alter their use of resources andexploit the littoral zone to a greater extent. Therefore,trout are usually regarded the competitively superior,and shifts in charr habitat use are ascribed to troutforcing charr to use alternative resources (e.g.Klemetsen et al. 2003). While this pattern is welldescribed in the literature, less is known aboutresource use by brown trout living in sympatry withfish species other than Arctic charr. An emergingquestion is whether more specialized littoral speciesmay drive trout into a more pelagic resource use.
Undertaking field studies on competition andbehavioral adaptations is difficult because the ob-served behavior is the sum of complex interactions,where each consumer displays dietary overlap withseveral other species (Tilman 1987; Hansson 1995).Therefore, species-poor ecosystems serve as valuable
Environ Biol Fish

sites for the study of behavioral interactions and nichesegregation. On the Faroe Islands, situated in the Mid-Atlantic, a total of seven freshwater fish species occur,but a maximum of four coexist in a single lake(Jeppesen et al. 2002a; unpubl. data). Most Faroeselakes host brown trout only, but in some lakes otherfish species co-occur, usually only three-spinedstickleback (Gasterosteus aculeatus L.).
A previous study of four Faroese lakes revealed thatin the one lake with Arctic charr, Lake Leynavatn,brown trout reliedmore on benthic food than in the lakeswithout charr (Malmquist et al. 2002). Moreover, thedensity, somatic growth and condition factor of troutwere lowest in Leynavatn (Malmquist et al. 2002).Stable isotope investigations supported the suggestionthat interspecific competition between trout and charrwas important in Leynavatn, with trout diet appearingto be of a more littoral origin (Jeppesen et al. 2002b).This study also indicated that the presence of three-spined sticklebacks in other lakes may drive trout intoa more pelagic feeding mode (Jeppesen et al. 2002b).However, in order to verify this theory, more compre-hensive studies with more lakes are needed.
In this study we investigated the differences inhabitat use and diet of brown trout in elevenspecies-poor Faroese lakes with notably differentfish communities. Our aim was to determine if thehabitat use and diet of trout were affected by fishcommunity structure and other environmental vari-ables such as lake depth, area, and nutrient status.We also examined the role of body size of trout inrelation to diet and habitat as another metric ofcompetitive interactions. We expected that thefundamental niche as described by diet and habitatof brown trout in lakes with only trout would differfrom the realized niche described by diet andhabitat use in lakes with presence of potential fishcompetitors, i.e. Arctic charr and three-spinedsticklebacks.
Materials and methods
Study area
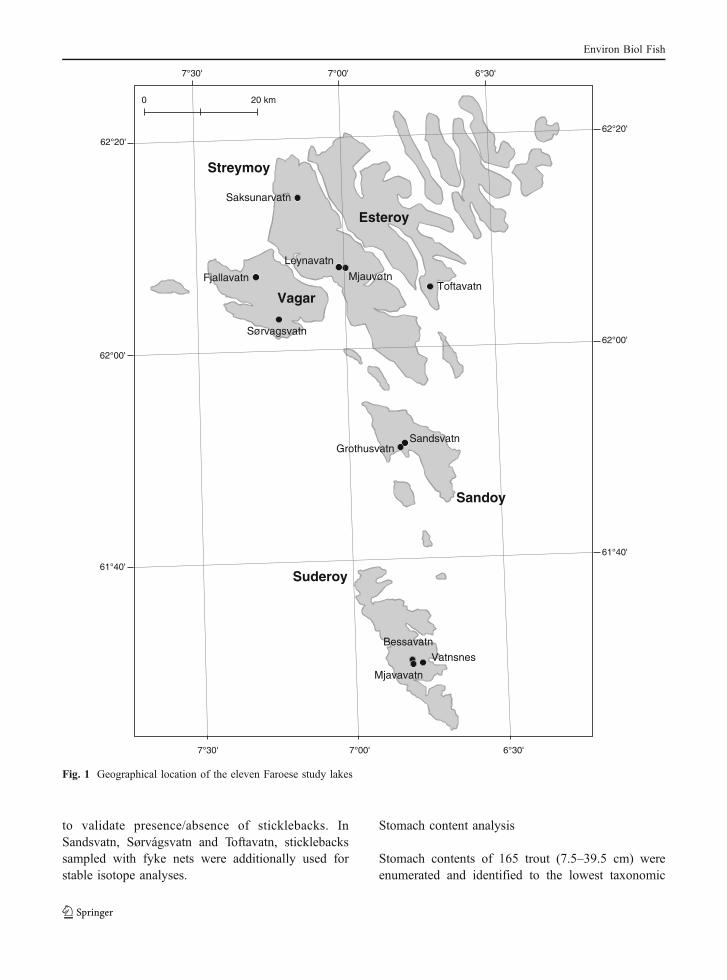
All sampling was carried out during July–August2000 in 11 lakes located on the five largest Faroeseislands (Fig. 1). The lakes included a wide range ofareas (0.6–356 ha) and depths (max depth: 0.7–52 m)
(Table 1). Total phosphorous concentrations varied,with the highest nutrient levels occurring in LakeVatnsnes which is used for rearing Atlantic salmon(Salmo salar L.) in cages. Brown trout is the mostwidespread freshwater fish species on the FaroeIslands and occurred in all the study lakes. Three-spined stickleback (hereafter sticklebacks) werefound in five and European eel (Anguilla anguillaL.) in four of the study lakes. Arctic charr, Europeanflounder (Platichthys flesus (L.)) and Atlantic salm-on occurred only in one study lake (salmon due tofish farming). As shown in Table 1, the lakes variedsubstantially in a number of physical, chemical andbiological parameters, all of which can be hypothe-sized to influence trout ecology. Compared to analysis ofvery similar lake types, this will further enable us toevaluate the relative importance of competitor presence/absence compared to other environmental factors. Forfurther information on the characteristics of Faroeselakes, see Landkildehus et al. (2002).
Fish sampling
Fish were caught in multi-mesh sized gill nets (typeNORDIC: 14 different mesh sizes ranging from 6.25-75 mm (Appelberg et al. 1995)), placed overnight.“Littoral nets” were set parallel to the shore at a depthof 1.5 m, offshore nets in the middle of the lake alongthe major length axis of the lake- either at the bottom,“offshore benthic net” and in lakes with a maximumdepths >8 m also in the mid pelagic (in half the depthof the epilimnion), “pelagic nets” (Jeppesen et al.2001). The number of nets ranged between 4 and 9per lake depending on area and depth, except inMjavavatn, a small lake where only one mid-lakeoffshore benthic net was used. Catch per unit effort oftrout (CPUE: #trout net−1 h−1) was used as a measurefor relative fish density, both for each habitat within alake and as an average for all nets per lake. Each fishwas measured (fork length) to the nearest mm andweighed to the nearest 0.1 g. Based on individual fishweights, we further calculated trout biomass per unitof effort (BPUE).
Brown trout stomachs were removed after captureand stored individually in 96% ethanol. Brown trout,Arctic charr and sticklebacks were frozen individuallyfor stable isotope analysis. Although sticklebackswere often caught in gill nets, we additionallysampled the lakes with fyke nets and shoreline netting
Environ Biol Fish
to validate presence/absence of sticklebacks. InSandsvatn, Sørvágsvatn and Toftavatn, sticklebackssampled with fyke nets were additionally used forstable isotope analyses.
Stomach content analysis
Stomach contents of 165 trout (7.5–39.5 cm) wereenumerated and identified to the lowest taxonomic
'03°6'00°7'03°7
61°40'
62°00'
62°20'
'03°6'00°7'03°7
61°40'
62°00'
62°20'
Saksunarvatn
SandsvatnGrothusvatn
Bessavatn
Vatnsnes
Mjavavatn
Leynavatn
MjauvøtnFjallavatn
Sørvagsvatn
Toftavatn
Esteroy
Streymoy
Vagar
Sandoy
Suderoy
mk020
Fig. 1 Geographical location of the eleven Faroese study lakes
Environ Biol Fish

level possible. For each lake a maximum of eight fish,representing all sizes if possible, was selectedrandomly from the fish caught in each of the threehabitats sampled: the littoral, the pelagic and the mid-lake offshore benthic nets defined above.
Stomach contents were identified and countedusing a dissection microscope. Food items wereidentified to group (Hirudinea, Hydracarina, Turbel-laria and Diptera other than mentioned below),order (Coleoptera, Heteroptera, Trichoptera andOstracoda, Copepoda), family (Tipulidae), subfam-ily (Chironominae, Orthocladinae, Tanypodinae),genus (Gammarus, Lymnaea, Pisidium, Daphnia,Alona, Eurycercus, Acroperus, Bosmina, Holope-dium and Chydorus) or species level (Gasterosterusaculeatus). Insects were furthermore categorized aslarvae, pupae or adults.
Stable isotope analysis
To compare the relative contribution of pelagic andlittoral components to the diet, and to determine thetrophic level of the diet of trout and stickleback, weperformed analyses of the stable carbon and nitrogenisotope content. Approximately 5–8 mg (wet weight)of white dorsal muscle was extracted from each fish.During sorting, all samples were kept at roomtemperature for as short a time as possible, afterwhich they were frozen again before being lyophi-
lized. Lyophilized samples were homogenized andpacked into tin capsules (4×6 mm). The samples wereanalyzed for δ13C and δ15N isotopes using a PDZEuropa ANCA-GSL elemental analyzer interfaced toa PDZ Europa 20–20 isotope ratio mass spectrometerat the UC Davis Stable Isotope Facility, USA. Sincelipid corrected values showed little deviation fromoriginal values (Δδ13C; average=0.10; SD=0.31) dueto relatively low C:N-ratios (average=3.46; SD=0.31), indicating a relatively low lipid content (Postet al. 2007), we used original δ13C-values rather thanlipid corrected ones.
Average δ13C-values for littoral invertebrates (chiro-nomidae, Lymnaea sp., Eurycercus sp., Gammarus sp.,Haliplus spp., Helopdella spp., Hydracarina spp.,Limnephilidae, Phryganeidae sp., Polycentropus,Tipulidae) and periphyton scraped of stones collectedin the littoral zone were used as littoral δ13C-baseline.Since large mussels were not found, and collectedPisidium sp. turned out to yield unrealistic baselines,we used zooplankton as the pelagic baseline. The relativecontribution of pelagic resources in diet was calculatedfrom the 2-end-member-mixing model (Post 2002):
where ά is the proportion of carbon obtained from thebase of food web 1 and δ13Csc is the stable isotope ratioof the secondary consumer. Our two-end-members were
Table 1 Characteristics of the 11 Faroese study lakes.Chlorophyll data are from Amsinck et al. (2006). A=lake area(ha); Ptot=total phosphorus (μg l−1), Zm=maximum depth (m);S=Secchi depth (m), Chl a=chlorophyll a (μg l−1); Zoo=crustacean zooplankton (# l−1). CPUE data refer to average
number caught per net per hour. Fish fauna: T: Brown trout; TS:Three-spined stickleback; C: Arctic Charr; E: Eel; S: AtlanticSalmon and F: Flounder. *In Sørvágsvatn, no sticklebacks werecaught in gill nets, some individuals being caught in fyke nets
Lake A Zm Ptot S Chl a Zoo CPUET CPUETS CPUEC CPUES CPUEF Fish fauna
Mjávavatn 0.6 0.8 19 0.8 1.81 0.0 0.50 0 0 0 0 T
Bessavatn 5.4 2.0 30 2.0 1.98 54.0 0.22 0 0 0 0 T
Saksunarvatn 8.1 16.0 6 8.8 1.13 53.2 0.35 0 0 0 0 T & E
Mjáuvøtn 3.1 5.7 15.2 4.3 1.76 175.5 1.83 0 0 0 0 T
Leynavatn 18.0 32.5 3.4 10.0 1.23 21.7 0.51 0 1.06 0 0 T & C
Vatnsnes 14.7 9.5 76 1.7 25.17 42.5 0.22 0 0 0.04 0 T & S
Sandsvatn 79.7 2.4 43 2.4 1.05 85.6 0.38 0.02 0 0 1.02 T, TS, F & E
Gróthúsvatn 13.4 0.7 35 0.7 1.03 22.8 0.69 0.01 0 0 0 T, TS & E
Sørvágsvatn 356.0 52.0 5.2 12.5 0.72 5.2 0.36 0* 0 0 0 T & TS
Toftavatn 52.2 17.5 10.8 5.8 0.98 25.6 0.21 0.03 0 0 0 T, TS & E
Fjallavatn 101.9 46.6 3 14.0 0.46 4.8 0.56 0.02 0 0 0 T & TS
Environ Biol Fish

the bases of the pelagic and littoral food webs (base1and base2, respectively) ά was constrained to bebetween 0 and 1. Since δ15N values were solely usedfor within-lake comparisons, baseline values were notneeded for δ15N.
Environmental variables
Depth integrated samples of zooplankton were taken at amid-lake station with a modified Patalas sampler (3.3 L).Zooplankton was identified under a stereo microscopeand counted in the lab (for more details, see Amsinck etal. 2006). Total phosphorous was measured as describedby Jensen et al. (2002) and chlorophyll a wasdetermined according to Christoffersen et al. (2002).These samples were taken simultaneously with the fishsamples.
Data treatment and statistical analysis
To test for possible effects of environmental variables(lake area, Zmax, Chl a, Ptot zooplankton density andpresence of charr and stickleback) on the density(CPUE) and biomass (BPUE) of trout, we usedmultiple analysis of variance (MANCOVA, WilksLambda).
For statistical analysis, food items were dividedinto the following groups: zooplankton (Daphnia,Bosmina, Holopedium, Chydorus and Copepoda),benthic cladocerans (Eurycercus, Alona and Acrope-rus), chironomid larvae (larvae of Chironomidae),insect pupae (pupae of Chironomidae, Trichoptera,and other flies), emerged insects (emerged insects ofChironomidae, Trichoptera, Tipulidae, other flies andterrestrial insects), and benthic macroinvertebrates(Hirudinea, Pisidium, Lymnaea, Hydracarina, Gam-marus, Trichoptera larvae, Coleoptera larvae andadults, Turbellaria and Heteroptera). This resulted insix different diet groups. For each group we calculatedthe proportion of the total diet as the number of fooditems in the given group divided by the total number offood items in the stomach. The effect of sticklebackpresence on trout diet was tested with a nestedMANCOVA (Wilk’s lambda; lake nested under thepresence/absence of sticklebacks) on arcsine trans-formed data with the individual fish length as acovariate. Differences in ά-values between lake typeswere tested with a nested ANOVA. Lakes were in bothcases treated as fixed rather than random factors, since
stickleback presence was not randomly assigned tothe different lakes, but is expected to be fixed foreach lake, i.e. a lake with sticklebacks is assumedto host sticklebacks at every revisit (see discussionin Bennington and Thayne 1994 and Domenici etal. 2008). This complies with common practice whenanalyzing effects of predator presence in differentlakes (e.g. Reznick and Endler 1982; Reznick 1989;Leips and Travis 1999; Kelly et al. 2000; Jennionsand Telford 2002; Langerhans et al. 2004; Domeniciet al. 2008).
To test for the relative importance of environmentalvariables, including presence/absence of sticklebackcompetitors, on the stomach composition of trout, weused ordination analysis. Canonical CorrespondenceAnalysis (CCA) was performed due to a high gradientlength of axis 1 in Detrended Canonical Analysis(3.029 standard units). Seven environmental variables(lake area, maximum depth, total phosphorous,chlorophyll a content, zooplankton density, densityof trout (catch per unit effort) and presence-absencedata on sticklebacks) were included in the CCA. Toexplore the relative importance of the 7 environmentalvariables these were run as sole environmental variablesin CCA analyses. The larger the ratio between theeigenvalue of CCA axis 1 (λ1) and CCA axis 2 (λ2) themore variation explained by the single environmentalvariable. ‘Species’ data were arcsine-transformed stom-ach content data, i.e. the proportion of each diet group(based on the average values of stomach content foreach lake), whereas environmental variables were logtransformed with the exception of presence-absence ofsticklebacks. ‘Species’ occurring only in one lake wereexcluded from the analysis. For the CCA, the benthicmacroinvertebrate group was split into individual taxa(see above).
Sticklebacks may act both as competitors and asprey for trout. Since piscivorous trout are known toprey more heavily on sticklebacks than on trout, fishwill likely be a more frequent diet item in thepresence of sticklebacks as a consequence of preyavailability rather than competition. Thus, when fishoccurred in the diet of trout they were excluded fromthe analysis to avoid a false positive result ofcompetition. Furthermore, we excluded the largesttrout caught (> 40 cm; N=5) from the diet andisotopic analyses, since they were likely to be obligatepiscivores. These trout had little or nothing in theirstomachs.
Environ Biol Fish

Results
Fish abundance, habitat distribution and populationdemography
Catch per unit effort of trout (CPUE; Fig. 2) rangedbetween 0.02 trout hour−1 net−1 (Vatnsnes, pelagialnets) and 2.00 trout hour−1 net−1 (Mjauvötn, littoralnets). In all lakes but Leynavatn and Sandsvatn,brown trout was the most abundant fish species in thecatches of all three habitats sampled. Arctic charroccurred only in Leynavatn where it dominated thecatch in the offshore benthic and pelagic habitats.European flounder was found only in Sandsvatn,where it dominated the catch in both habitatssampled (littoral and offshore benthic). Three-spined sticklebacks were caught in five of the 11lakes sampled (Table 1). In the six deepest lakes,where pelagic nets were used, the number of troutcaught in pelagic nets relative to the total number oftrout caught was significantly higher in lakes withsticklebacks (10.7–45.6%) than in lakes without
sticklebacks (2.9–3.8%) (Mann–Whitney U-test,Z=−1.96; p=0.05). Neither the density (CPUE) northe biomass (BPUE) of trout in the lakes was relatedto any of the environmental variables, includingpresence of competitors (MANCOVA; Wilks Lambda;p>0.05 for all). The size of trout varied highlysignificantly between the lakes (Kruskal-Wallis test;χ2=154.6; p<0.001; Fig. 3); the difference was,however, not related to any of the environmentalvariables, including presence of other species.
Long term resource use: Stable isotope analyses
Trout in lakes with sticklebacks were found to havesignificantly higher ά-values, indicating a relativelyhigher dependence on pelagic resources than troutfrom lakes without sticklebacks (nested ANOVA; F=50.4; p<0.001; Fig. 4). The ά-values were generallyhabitat-dependent (Two-way ANOVA, lake randomfactor; F=7.40; p<0.001), with pelagic trout having a
TS absent TS present
Ch FlSa
CP
UE
(no
. net
–1 h
our–1
)
0
1.0
0.5
1.5
2.0
2.5LittoralBenthicPelagic
Fja
llava
tn
Tof
tava
tn
Sø
rvág
svat
n
San
dsva
tn
Leyn
avat
n
Gró
thús
vatn
Vat
nsne
s
Sak
suna
rvat
n
Mjá
uvø
tn
Bes
sava
tn
Mjá
vava
tn
Fig. 2 Catch per unit effort (CPUE: # trout net−1 h−1) of browntrout in three different habitats, i.e. littoral, pelagic and offshorebenthic, in eleven Faroese lakes with contrasting fish assemb-lages (TS: three-spined stickleback present; Sa: Atlantic salmonpresent; Ch: Arctic charr present; Fl: flounder present)
***
TS absent TS present
Ch FlSa
Leng
th (
cm)
Mjá
vava
tn
Bes
sava
tn
Mjá
uvø
tn
Sak
suna
rvat
n
Vat
nsne
s
Leyn
avat
n
San
dsva
tn
Gró
thús
vatn
Sø
rvág
svat
n
Tof
tava
tn
Fja
llava
tn
0
10
20
30
40
50e e b,c,d d,e a a,b,c e c,d,e a,b b,c,d b,c,d
ns * *** ns ** ns ns *** ** ns
Fig. 3 Length distribution of brown trout from 11 Faroeselakes with contrasting fish assemblages (TS: three-spinedstickleback present; Sa: Atlantic salmon present; Ch: Arcticcharr present; Fl: flounder present). Grey bars denote fishcaught in the littoral zone, open bars denote fish caughtoffshore in pelagic or benthic nets (see text). Boxes representthe interquartile range (containing 50% of values), lines acrossboxes indicate medians, and whiskers extend to the highest andlowest values, excluding statistical outliers (circles) andextreme values (vertical asterisks). Letters above bars showresults of a non-habitat specific post hoc test for between-lakedifferences and asterisks indicate significant size differencebetween habitats
Environ Biol Fish

more pelagic isotopic signature (higher ά-values)compared to both littoral and off-shore benthic caughttrout (Tukey post hoc test; p<0.001 for pelagicagainst both littoral and off-shore benthic trout).Littoral and off-shore benthic trout were not foundto have different isotopic signatures (Tukey post hoctest; p=0.146). This pattern was consistent to all deeplakes, i.e. lakes where pelagic nets were used, withpelagic caught trout on average having a more pelagicsignal than both littoral and off-shore benthic caughttrout.
In all three lakes with a sufficient number ofsticklebacks caught to allow statistical analyses,trout had significantly more pelagic isotopic sig-nals, i.e. higher ά-values, than sticklebacks(ANOVA; F>6.1 for all; p<0.027 for all; Fig. 4).In the one lake containing charr, trout had asignificantly more littoral isotopic signal, i.e. lower
ά-values, than charr (ANOVA; F=68.7; p<0.001),whereas there was no difference between trout andsalmon in the one lake containing salmon (ANOVA;F=0.151; p=0.70).
The level of δ15N-value in Sandsvatn differedsignificantly between sticklebacks (average±SD; 4.4±0.42) and trout (4.0±0.54) relative to length(ANCOVA; F=15.59; p=0.001), sticklebacks havinga higher δ15N-value compared to small trout. InSørvágsvatn, there was no effect of length and nosignificant difference between δ15N-value of trout(5.1±1.2) and sticklebacks (5.0±0.88) (ANCOVA;F=0.142; p=0.709), and in Toftavatn, sticklebacks(5.4±0.34) had a significantly higher δ15N-value thantrout (3.7±3.6) (ANCOVA; F=22.54; p<0.001).Hence, the δ15N-values of sticklebacks were in noneof the lakes lower than the δ15N-values recorded forsimilar sized trout.
TS absent TS present
Ch FlSa
Fja
llava
tn
Tof
tava
tn
Sø
rvág
svat
n
San
dsva
tn
Leyn
avat
n
Gró
thús
vatn
Vat
nsne
s
Sak
suna
rvat
n
Mjá
uvø
tn
Bes
sava
tn
Mjá
vava
tn
Pro
port
ion
pela
gic
diet
1.0
0.8
0.6
0.4
0.2
0
SticklebackCharrSalmonTrout
Fig. 4 Relative contribu-tion of pelagic resources(ά) calculated from relativecontent of δ13C (see text) introut, sticklebacks, charr andsalmon from eleven Faroeselakes with contrasting fishcommunity composition
Environ Biol Fish

Short term resource use: direct diet observations
We found substantial variation in the stomach contentsof trout between lakes and within lakes (Fig. 5). Thepresence of sticklebacks significantly affected the dietof trout caught in the littoral zone (MANCOVA (lakenested under the presence or absence of sticklebacks);Wilks’ lambda=7.982; p<0.001). In particular, therewere significant differences in the proportion ofemerged insects and benthic macroinvertebrates in thetrout diet, the former being higher and the latter lowerin the presence of sticklebacks. Although only margin-ally significant, also the share of benthic cladoceransand insect pupae in the stomach of trout tended todiffer depending on stickleback presence (Table 2).However, individual fish length, used as a co-variate inthe analysis, was not found to have any effect on troutdiet (Wilks’ lambda=0.626; p=0.709).
The diet of trout in the offshore benthic habitat wassignificantly affected by the presence of sticklebacks(MANCOVA (lake nested under the presence or absenceof sticklebacks); Wilks’ lambda=4.248; p=0.002), butnot by individual fish length (MANCOVA; Wilks’lambda=0.807; p=0.132). Tests of between subjecteffects (Table 2) show that benthic trout fromstickleback-containing lakes fed significantly more onemerged insects and benthic cladocerans and less onchironomid larvae and benthic macroinvertebrates.
In both the littoral and the offshore benthichabitats, there were significant lake effects on troutdiet (MANCOVA; littoral: Wilks’ lambda=3.259; p<0.001; benthic: Wilks lambda=6.259; p<0.001). Thisdifference was evident for all diet groups (p<0.05 forall; Table 2). An effect of stickleback presence on thediet of pelagic trout could not be traced, since fewpelagic trout were caught in lakes without sticklebacks.
Excluding the effect of habitats, the multivariateCCA showed that lake area and the presence of
sticklebacks explained most of the between-lakevariation in the stomach contents of trout (Table 3).These variables were, however, significantly correlat-ed (Mann–Whitney U-test; p=0.018), which is alsoseen from the ordination including all 7 environmen-tal variables (Fig. 6). The ordination (Fig. 6) showed
�Fig. 5 Relative proportion by number of food items in thestomach of brown trout from three different habitats of elevenFaroese lakes. Taxa were grouped into zooplankton (Daphnia,Bosmina, Holopedium, Chydorus and Copepoda), benthic clado-cerans (Eurycercus, Alona and Acroperus), chironomid larvae(larvae of Chironomidae), insect pupae (pupae of Chironomidae,Trichoptera, and other flies) and emerged insects (emerged insectsof Chironomidae, Trichoptera, Tipulidea, other flies and terrestrialinsects), and other benthic macroinvertebrates (Hirudinea, Pisidium,Lymnaea, Hydracarina, Gammarus, Trichoptera larvae, Coleopteralarvae and adult Turbellaria, and Heteroptera)
a
b
c
Macro zoobenthosBenthic cladoceransChironomid larvae
Insect pupaeEmerged insectsZooplankton
TS absent TS present
Ch FlSa
)%( laro ttiL
)%( cihtne
BP
elag
ic (
%)
Mjá
vava
tn
Bes
sava
tn
Mjá
uvø
tn
Sak
suna
rvat
n
Vat
nsne
s
Leyn
avat
n
San
dsva
tn
Gró
thús
vatn
Sø
rvág
svat
n
Tof
tava
tn
Fja
llava
tn
0
20
40
60
80
100
0
20
40
60
80
100
0
20
40
60
80
100
Environ Biol Fish

that stickleback presence was related to relativelyhigh proportions of zooplankton and insects (pupaeand emerged) as well as Pisidium and Hydracarina inthe trout diet, whereas food items such as Heteroptera,
Hirudinea, Gammarus and Trichoptera were mainlyfound in trout stomachs from stickleback-free lakes.In the charr-containing lake, zooplankton did notoccur in the trout stomach contents.
Table 2 Presence/absence of stickleback (TS presence) andlake effects on diet numerical composition of brown trout in thelittoral and the offshore benthic zones. Both TS presence andlake effects were tested with nested MANCOVA (lake nested
under stickleback presence/absence with fish length as a co-variate, see text). Values in the table refer to subsequent‘between-subjects effects’ tests. Length is not included in thetables as it was not significant in any of the habitats
Diet group Type III ssq d.f. mean square F p
Littoral
TS presence Zooplankton .305 1 .305 2.420 .124
Chironomid larvae .160 1 .160 2.077 .154
Benthic cladocerans .373 1 .373 3.941 .051
Insect pupae .157 1 .157 3.085 .084
Emerged insects 1.344 1 1.344 20.120 < .001
Benth. macroinvert. 2.244 1 2.244 21.027 < .001
Lake effects (TS presence) Zooplankton 3.659 9 .407 3.223 .003
Chironomid larvae 1.439 9 .160 2.070 .044
Benthic cladocerans 3.509 9 .390 4.115 < .001
Insect pupae 1.063 9 .118 2.314 .025
Emerged insects 1.245 9 .138 2.071 .044
Benth. macroinvert. 8.796 9 .977 9.157 < .001
Benthic
TS presence Zooplankton .130 1 .130 1.094 .301
Chironomid larvae .417 1 .417 5.976 .018
Benthic cladocerans .647 1 .647 7.616 .008
Insect pupae .003 1 .003 .050 .824
Emerged insects .052 1 .052 6.955 .011
Benth. macroinvert. .707 1 .707 6.543 .014
Lake effects (TS presence) Zooplankton 11.519 6 1.920 16.121 < .001
Chironomid larvae 2.128 6 .355 5.081 < .001
Benthic cladocerans 3.346 6 .558 6.568 < .001
Insect pupae 1.283 6 .214 3.085 .012
Emerged insects .195 6 .033 4.384 .001
Benth. macroinvert. 5.405 6 .901 8.333 < .001
Environmental variable CCA 11/CCA 12 11 % explained F-ratio P-value
Lake area 0.629 0.302 21.0 2.391 0.039
Stickleback presence 0.533 0.276 19.2 2.136 0.047
Zmax 0.444 0.198 13.8 1.436 0.198
Ptot 0.433 0.228 15.9 1.696 0.143
Trout CPUE 0.370 0.199 13.8 1.450 0.233
Zooplankton biomass 0.326 0.181 12.6 1.292 0.246
Chlorophyll a 0.283 0.147 10.2 1.022 0.382
Table 3 Resultsfrom CCA’s including onlyone variable at the time.Variables sorted bydecreasing importancefor the between-lake varia-tion. ‘% explained’ denotesthe total percentageexplained of thebetween-lake variation (nocovariation included)
Environ Biol Fish

Discussion
The interactions between species drive individuals tochange their use of resources, leading to an apparentaltered niche use of populations (Bolnick et al. 2007).Jeppesen and co-workers (2002b) suggested thatcompetition from three-spined sticklebacks couldmodify the relative use of pelagic and littoralresources in trout. In this study, we confirm thissuggestion with results both from relative distribution,stable isotope analyses and direct diet observations.We also found evidence that trout in some lakes,besides the general effect of competitors on thepopulations relative pelagic/littoral resource use,individually specialized in habitat usage. While thecompetitors appeared to affect trout at populationlevel, the individual specialization in habitat useseems to be dependent on habitat availability, i.e. theavailability of the pelagic habitat.
However, our results also suggest that by treatingthe niche as a one-dimensional pelagic-littoral vari-able, we might miss the larger picture. The observeddiet differences show that both littoral and off-shorebenthic trout in the presence of sticklebacks would
feed more on emerged insects and less on benthicmacroinvertebrates, and in off-shore habitats alsoless on chironomid larvae. Such a difference in diet,being short or long term, would require differenthunting modes and microhabitat use, with emergedinsects caught on the surface and benthic macro-invertebrates and chironomid larvae caught on thebottom substrate, even though the different preytypes, at least in the littoral habitat, may berelatively close to each other. Such a specializationwould be difficult to trace in the isotopic signature,since most of the emerged insects in the diet wereof aquatic origin and hence belonged to either thechironomid larvae or benthic macroinvertebrate dietgroup at an earlier life stage.
Although foraging in the littoral habitat may,particularly in shallow lakes, be more profitable thanin offshore habitats, for example due to greaterabundance of large, energetically rewarding fooditems, this may not apply to all lake types. Especiallyin deep lakes, the relative importance of the pelagiczone in terms of food availability may be greater thanin the littoral zone (e.g. Gasith 1991; Jeppesen et al.1997; Horppila et al. 2000; Vadeboncoeur et al. 2002).
Fig. 6 Canonical correspon-dence analysis (CCA) plot ofbrown trout stomach content(arcsine transformed relativeproportions) and 7 environ-mental variables (abbrevia-tions see Table 1). CCAaxis 1 and 2 explain 41%and 23% of the variation,respectively. Speciesvariables: triangles, environ-mental variables: arrows,lakes: circles: lakes withoutstickleback, squares: lakeswith stickleback
Environ Biol Fish

Interestingly, however, it appears that the relativedependency of the pelagic habitat is more related tothe presence of competitors than to physical lakecharacteristics. Specifically, our multivariate analysis(Fig. 6) suggests that trout in lakes with sticklebacksutilize more open-water food items, such as zooplank-ton, emerged insects and insect pupae as comparedto lakes without sticklebacks, where they feedmore on bottom-associated food items, such asbenthic cladocerans and benthic macroinverte-brates. Since sticklebacks were generally found inthe larger, albeit not deeper, lakes, it was inprinciple not possible from the CCA analysis todetermine whether the difference in diet betweenlakes was due to competitor presence or lake area.Whereas lake depth and/or volume are known tohave a number of effects on lake ecosystems, suchas periphyton vs. phytoplankton contribution toprimary production (Vadeboncoeur et al. 2003;Vadeboncoeur et al. 2008), zooplankton communitystructure (Amsinck et al. 2006), fish populationstructure (Riget et al. 2000), fish assemblages(Mehner et al. 2007), top-down control (Jeppesenet al. 2003), ecological effects of lake area appear tobe rather weak (e.g. Søndergaard et al. 2005). Sinceneither lake depth nor lake volume were related tostickleback presence or trout diet, we see it as morelikely that the observed diet differences betweenlakes are related to competitor presence rather thanto lake area. Assuming that charr is a more effectivezooplanktivore than trout, due to its evolved behav-ioral and morphological traits (e.g. Malmquist 1992;Forseth et al. 2003; Klemetsen et al. 2003), charrmay be a strong competitor in large, deep lakeswhere the pelagic niche is prominent, as in deepLeynavatn. Indirect evidence for this is also providedby large, deep Lake Takvatn, Norway, where anincrease in the density of brown trout was attributedto competitive release followed by a decrease in thedensity of Arctic charr (Klemetsen et al. 2002;Amundsen et al. 2007).
As with many other species, two individual troutwill never exploit their resources in an exactly similarfashion. This may be due to stochastic differences inencounter rate with different prey types or it may bedue to individual specialization. By analyzing directdiet observations, it is rarely possible to distinguishbetween random differences in diet and actualindividual specialization, even when comparing fish
from different habitats, as the stomach content of anyindividual will be dependent on the habitat in which itmost recently foraged, which will often be the sameas the habitat in which the fish was caught. However,stable isotope analysis provides a longer time averageof littoral/pelagic dependency, which reduces theinfluence of stochastic prey encounter, and cantherefore be used to describe individual specializationmore accurately. It is noteworthy that pelagic-caughttrout, in the deepest Faroese lakes, where we alsoconducted sampling with pelagic gill nets, differed inisotopic signal from trout caught both in the littoraland the off-shore benthic area, especially since off-shore benthic invertebrates often have a more pelagicsignal than littoral benthic invertebrates (e.g. Hersheyet al. 2006), as has been observed in the Faroese lakes(E. Jeppesen and J. Brodersen unpubl. data). Ifindividual fish showed fidelity to all habitats, wewould have expected to see pelagic and off-shorebenthic trout to differ in isotopic signature fromlittoral trout. However, it appears that intra-population specialization occurs along a pelagic-benthic gradient, where the latter includes both thelittoral and the off-shore benthic habitats.
In six out of the seven deepest Faroese lakes browntrout tended to be smaller in the littoral habitat than inthe off-shore benthic and pelagic habitats. Such apattern has been observed for trout in other relativelydeep lakes (e.g. Klemetsen et al. 2003; Saksgård andHesthagen 2004) and may be explained by the greaterstructural complexity of the littoral zone, offeringbetter refuge to small fish (Werner and Gilliam 1984).In general, brown trout often display ontogenetic dietshifts, switching from relatively small invertebratefood items to large items such as sticklebacks andother fish species (L’Abée-Lund et al. 1992, 2002;Kahilainen and Lehtonen 2002; Klemetsen et al.2003). However, the habitat specific diet of theFaroese trout was not related to size, suggesting thatontogenetic changes occur in habitat choice, but notin habitat specific diet.
In conclusion, brown trout in Faroese lakes shouldbe regarded as a generalist species (MacArthur andLevins 1967), potentially facing competition frommore specialized pelagic Arctic charr and benthicfeeding three-spined sticklebacks. Whereas generalistspecies are often found to struggle under competitionfrom multiple directions (e.g. Werner 1977), this isnot the case for Faroese trout, since in no lakes does it
Environ Biol Fish

face competition from both sides. Besides the popu-lation effects of competition on population niche usecharacteristics, we have shown that individual troutspecialize in pelagic/benthic habitat use whenever thelake characteristics allow this. Lastly, our studyillustrates the complexity of niche use in freshwaterlakes and the potential shortcomings of applying aone-dimensional axis for describing niche use.
Acknowledgements Weare grateful to Jane Stougaard Pedersen,Karina Jensen and Lissa Skov Hansen for identification ofzooplankton samples. Special thanks go to Kirsten LandkildehusThomsen for chemical analysis and Anne Mette Poulsen formanuscript editing. We also wish to thank Juana Jacobsen andKathe Møgelvang for graphical layout. The project was partlyfunded by the Carlsberg Foundation, The Nordic Arctic ResearchProgramme 1999–2003 and The Danish North AtlanticResearch Programme. The study was also supported bythe EU projects EUROLIMPACS (www.eurolimpacs.ucl.ac.uk) and WISER (www.wiser.eu), REFRESH, CRES, Green-land Research Centre and by Galathea 3. Furthermore, wethank Andy Jones, Geraldine Thiere and Karin Olsson forvaluable comments on the manuscript.
References
Amsinck SL, Strzelczak A, Bjerring R, Landkildehus F,Lauridsen TL, Christoffersen K, Jeppesen E (2006) Lakedepth rather than fish planktivory determines cladocerancommunity structure in Faroese lakes—evidence fromcontemporary data and sediments. Freshw Biol 51:2124–2142
Amundsen P-A, Knudsen R, Andersen K (2007) Intraspecificcompetition and density dependence of food consumptionand growth in Arctic charr. J Anim Ecol 76:149–158
Appelberg M, Berger H-M, Hesthagen T, Kleiven E, KurkilahtiM, Raitaniemi J, Rask M (1995) Development andintercalibration of methods in Nordic freshwater fishmonitoring. Water, Air, & Soil Pollution 85:401–406
Bennington CC, Thayne WV (1994) Use and misuse of mixed-model analysis of variance in ecological studies. Ecology75:717–722
Bolnick DI, Svanbäck R, Araújo MS, Persson L (2007)Comparative support for the niche variation hypothesisthat generalized populations also are more heterogeneous.Proc Natl Acad Sci USA 104:10075–10079
Chase JM, Leibold MA (2003) Ecological niches: linkingclassical and contemporary approaches. University ofChicago Press, Chicago, USA
Christoffersen K, Pålsson C, Kritzberg E, Granéli W (2002)Abundance and biomass of microbial communities inrelation to phyto- and bacterioplankton production in fiveFaroese lakes. Ann Soc Sci Færoensis Suppl 36:59–69
Domenici P, Turesson H, Brodersen J, Brönmark C (2008)Predator-induced morphology enhances escape locomo-tion in crucian carp. P Roy Soc Lond Ser B 275:195–201
Forseth T, Ugedal O, Jonsson B, Fleming IA (2003) Selectionon Arctic charr generated by competition from Browntrout. Oikos 101:467–478
Gasith A (1991) Can littoral resources influence ecosystemprocesses in large, deep lakes? Verh Int Ver Limnol24:1073–1076
Hansson S (1995) Effects of exploitative food competition onfood niche dynamics—a simulation analysis. Ecol Modell77:167–187
Hershey AE, Beaty S, Fortino K, Kelly S, Keyse M, Luecke C,O'Brien WJ, Whalen SC (2006) Stable Isotope Signaturesof Benthic Invertebrates in Arctic Lakes Indicate LimitedCoupling to Pelagic Production. Limnol Oceanogr51:177–188
Horppila J, Ruuhijärvi J, Rask M, Karppinen C, Nyberg K,Olin M (2000) Seasonal changes in the diets and relativeabundances of perch and roach in the littoral and pelagiczones of a large lake. J Fish Biol 56:51–72
Hubbell SP (2001) The Unified Neutral Theory of SpeciesAbundance and Diversity. Princeton University Press,Princeton, NJ
Hutchinson GE (1957) Concluding remarks. Cold SpringsHarbor Symp Quant Biol 22:415–427
Hutchinson GE (1959) Homage to Santa Rosalia or why arethere so many kinds of animals. Am Nat 93:145–159
Jansen PA, Slettvold H, Finstad AG, Langeland AL (2002)Niche segregation between Arctic char (Salvelinus alpi-nus) and Brown trout (Salmo trutta): an experimentalstudy of mechanisms. Can J Fish Aquat Sci 59:6–11
Jennions MD, Telford SR (2002) Life-history phenotypes inpopulations of Brachyrhaphis episcopi (Poeciliidae) withdifferent predator communities. Oecologia 132:44–50
Jensen JP, Landkildehus F, Søndergaard M, Jeppesen E,Christoffersen K (2002) Water chemistry of five lakes atthe Faroe Islands. Ann Soc Sci Færoensis Suppl 36:34–38
Jeppesen E, Jensen JP, Søndergaard M, Lauridsen TL, PedersenLJ, Jensen L (1997) Top-down control in freshwater lakes:the role of nutrient state, submerged macrophytes andwater depth. Hydrobiologia 342(343):151–164
Jeppesen E, Christoffersen K, Landkildehus F, Lauridsen T,Amsinck S (2001) Fish and crustaceans in northeast Green-land lakes with special emphasis on interactions betweenArctic charr (Salvelinus alpinus), Lepidurus arcticus andbenthic chydorids. Hydrobiologia 442:329–337
Jeppesen E, Christoffersen K, Malmquist HJ, Faafeng B,Hansson L-A (2002a) Ecology of five Faroese lakes:summary and synthesis. Ann Soc Sci Færoensis Suppl36:126–139
Jeppesen E, Landkildehus F, Lauridsen TL, Jensen JP, BjerringR, Søndergaard M, Amsinck SL (2002b) Food webinteractions in five Faroese lakes tracked by stableisotopes. Ann Soc Sci Færoensis Suppl 36:114–125
Jeppesen E, Jensen JP, Jensen C, Faafeng B, Hessen DO,Søndergaard M, Lauridsen T, Brettum P, Christoffersen K(2003) The impact of nutrient state and lake depth on top-down control in the pelagic zone of lakes: a study of 466lakes from the temperate zone to the arctic. Ecosystems:313–325
Jonsson B, Jonsson N, Hindar K, Northcote TG, Engen S(2008) Asymmetric competition drives lake use of coex-isting salmonids. Oecologia 157:553–560
Environ Biol Fish

Kahilainen K, Lehtonen H (2002) Brown trout (Salmo truttaL.) and Arctic charr (Salvelinus alpinus (L.)) as predatorson three sympatric whitefish (Coregonus lavaretus (L.))forms in the subarctic Lake Muddusjarvi. Ecol FreshwatFish 11:158–167
Kelly CD, Godin JGJ, Abdallah G (2000) Geographicalvariation in the male intromittent organ of the Trinidadianguppy (Poecilia reticulata). Can J Zool 78:1674–1680
Klemetsen A, Amundsen P-A, Grotnes PE, Knudsen R,Kristoffersen R, Svenning M-A (2002) Takvatn through20 years: long-term effects of an experimental massremoval of Arctic charr, Salvelinus alpinus, from asubarctic lake. Environ Biol Fish 64:39–47
Klemetsen A, Amundsen P-A, Dempson JB, Jonsson B,Jonsson N, O’Connel MF, Mortensen E (2003) Atlanticsalmon Salmo salar L., Brown trout Salmo trutta L. andArctic charr Salvelinus alpinus (L.): a review of aspects oftheir life histories. Ecol Freshwat Fish 12:1–59
L’Abée-Lund JH, Langeland A, Sægrov H (1992) (1992)Piscivory by Brown trout Salmo trutta L. and Arctic charrSalvelinus alpinus (L.) in Norwegian lakes. J Fish Biol41:91–101
L’Abée-Lund JH, Aass P, Sægrov H (2002) Long-term variationin piscivory in a Brown trout population: effect of changesin available prey organisms. Ecol Freshwat Fish 11:260–269
Landkildehus F, Jeppesen E, Jensen JP, Dali S (2002) Lakedescriptions. Ann Soc Sci Færoensis Suppl. 36 28–33.
Langeland A, L’Abée-Lund JH, Jonsson B, Jonsson N (1991)Resource partitioning and niche shift in Arctic charr,Salvelinus alpinus and Brown trout, Salmo trutta. J AnimEcol 60:895–912
Langerhans RB, Layman CA, Shokrollahi M, DeWitt T (2004)Predator-driven phenotypic diversification in Gambusiaaffinis. Evolution 58:2305–2318
Leips J, Travis J (1999) The comparative expression of lifehistory traits and its relationship to the numericaldynamics of four populations of the least killifish. J AnimEcol 68:595–616
MacArthur RH, Levins R (1967) The limiting similarity,convergence and divergence of coexisting species. AmNat 101:377–385
Malmquist HJ (1992) Phenotype-specific feeding behaviour oftwo Arctic charr Salvelinus alpinus morphs. Oecologia3:354–361
Malmquist HJ, Ingimarsson F, Jóhannsdóttir EE, Gíslason D,Snorrason SS (2002) Biology of Arctic charr (Salvelinusalpinus) and Brown trout (Salmo trutta) in four Faroeselakes. Ann Soc Sci Færoensis Suppl 36:94–103
Mehner T, Holmgren K, Lauridsen TL, Jeppesen E, DiekmannM (2007) Lake depth and geographical position modify
lake fish assemblages of the European ‘Central Plain’ecoregion. Freshwat Biol 52:2285–2297
Post DM (2002) Using stable isotopes to estimate trophicposition: models, methods, and assumptions. Ecology83:703–718
Post DM, Layman CA, Arrington DA, Takimoto G, QuattrochiJ, Montaña CG (2007) Getting to the fat of the matter:models, methods and assumptions for dealing with lipidsin stable isotope analyses. Oecologia 152:179–189
Reznick DN (1989) Life-history evolution in guppies: 2.Repeatability of field observations and the effects ofseason on life histories. Evolution 43:1285–1297
Reznick DN, Endler JA (1982) The impact of predation on lifehistory evolution in Trinidadian guppies (Poecilia retic-ulata). Evolution 36:160–177
Riget F, Jeppesen E, Landkildehus F, Lauridsen TL, Geertz-Hansen P, Christoffersen K, Sparholt H (2000) LandlockedArctic charr (Salvelinus alpinus) population structure andlake morphometry in Greenland – is there a connection?Polar Biol 23:550–558
Saksgård R, Hesthagen T (2004) A 14-year study of habitat useand diet of Brown trout (Salmo trutta) and Arctic charr(Salvelinus alpinus) in Lake Atnsjoen, a subalpineNorwegian lake. Hydrobiologia 521:187–199
Schluter D, McPhail JD (1992) Ecological character displace-ment and speciation in stickleback. Am Nat 140:85–108
Schoener TW (1982) The controversy over interspecificcompetition. Am Sci 70:586–595
SøndergaardM, Jeppesen E, Jensen JP (2005) Pond or lake: does itmake any difference? Arch Hydrobiol 162:143–165
Svanbäck R, Persson L (2009) Population density fluctuationschange the selection gradient in Eurasian perch. Am Nat173:507–516
Tilman D (1987) The importance of the mechanisms ofinterspecific competition. Am Nat 129:769–774
Vadeboncoeur Y, Vander Zanden MJ, Lodge DM (2002) Puttingthe lake back together: Reintegrating benthic pathwaysinto lake food web models. Bioscience 52:44–54
Vadeboncoeur Y, Jeppesen E, Vander Zanden MJ, Schierup H-H, Christoffersen K, Lodge DM (2003) From Greenland togreen lakes: Cultural eutrophication and the loss of benthicpathways in lakes. Limnol Oceanogr 48:1408–1418
Vadeboncoeur Y, Peterson G, Vander Zanden MJ, Kalff J (2008)Benthic algal production across lake size gradients:interactions among morphometry, nutrients, and light.Ecology 89:2542–2552
Werner EE (1977) Species packing and niche complementarityin three sunfishes. Am Nat 111:553–578
Werner EE, Gilliam JF (1984) The ontogenetic niche andspecies interactions in size-structured populations. AnnuRev Ecol Syst 15:393–425
Environ Biol Fish
Copyright © 2022 FDOKUMEN