
Electrofishing eel, salmon and trout: impact of waveform and ...
Journal of Fish Biology (2013) 82, 1789–1804
doi:10.1111/jfb.12095, available online at wileyonlinelibrary.com
Beaufort trout MicroPlex: a high-throughput multiplexplatform comprising 38 informative microsatellite loci foruse in resident and anadromous (sea trout) brown trout
Salmo trutta genetic studies
K. Keenan*, C. R. Bradley*, J. J. Magee*, R. A. Hynes*,R. J. Kennedy†, W. W. Crozier†, R. Poole‡, T. F. Cross§,
P. McGinnity§ and P. A. Prodohl*‖*Institute for Global Food Security, School of Biological Sciences, Queen’s University,
Belfast BT9 7BL, U.K., †Agri-Food and Biosciences Institute, Newforge Lane, Belfast BT95PX, U.K., ‡Marine Institute Catchment Research Facility, Furnace, Newport, Co. Mayo,
Ireland and §School of Biological, Earth and Environmental Sciences/Aquaculture &Fisheries Development Centre, University College, Cork, Ireland
(Received 12 October 2012, Accepted 4 February 2013)
A flexible panel consisting of 38 informative microsatellite markers for Salmo trutta is described.These markers were selected from a pool of over 150 candidate loci that can be readily amplifiedin four multiplex PCR groups but other permutations are also possible. The basic properties ofeach markers were assessed in six population samples from both the Burrishoole catchment, in thewest of Ireland, and Lough Neagh, in Northern Ireland. A method to assess the relative utility ofindividual markers for the detection of population genetic structuring is also described. Given itsflexibility, technical reliability and high degree of informativeness, the use of this panel of markersis advocated as a standard for S. trutta genetic studies. © 2013 The Authors
Journal of Fish Biology © 2013 The Fisheries Society of the British Isles
Key words: conservation; DNA profiling; management; marker panel; population genetics.
INTRODUCTION
The brown trout Salmo trutta L. 1758 is one of the most polytypic vertebrate speciesdescribed, with extensive variation observed in morphological, behavioural, ecolog-ical and genetic traits (Ferguson, 1989; McKeown et al ., 2010). This high levelof variation has made S. trutta a model species for population and evolutionarygenetic studies (Hendry & Stearns, 2004). These studies include investigations oflife-history variation (Hansen et al ., 2000; Olsen & Vøllestad, 2001; Klemetsen& Amundsen, 2003; Jonsson & Jonsson, 2006; Robertsen et al ., 2011), micro-evolutionary processes (Hansen & Mensberg, 1996; Hynes et al ., 1996; Prodohl
‖Author to whom correspondence should be addressed. Tel.: +44 2890972267; email: [email protected]
1789© 2013 The AuthorsJournal of Fish Biology © 2013 The Fisheries Society of the British Isles
1790 K . K E E NA N E T A L .
et al ., 1997), natural selection (Coughlan et al ., 2006; Jensen et al ., 2008; Hansenet al ., 2010), kin selection (Carlsson et al ., 2004; O’Farrell et al ., 2011), interspecifichybridization (Matthews et al ., 2000) and mating systems (Tiira et al ., 2005; Jacobet al ., 2007).
Given its biological and evolutionary complexity, in addition to its socioeconomicimportance throughout its distribution range (Youngson et al ., 2003), the identifi-cation and description of S. trutta population genetic structure are of the utmostimportance for the conservation and management of the species. To ensure that thistask is achieved successfully, the availability of effective and reliable moleculargenetic tools is essential.
To date, microsatellite marker loci have been the tool of choice for most of thegenetic applications in S. trutta . Despite their utility, the use of these markers has notbeen without complications. These include problems associated with the reproducibil-ity of genotypes derived from different research laboratories, and also difficulties indetermining mutation models for specific loci (Buschiazzo & Gemmell, 2006). Theformer issue, in particular, has notably hampered efforts in the application of meta-analyses of generated data (e.g . scoring inconsistencies). In recent years, however,this problem has been minimized as the result of a better understanding of technicalissues associated with microsatellite screening and parallel developments in scoringsoftware, along with a higher degree of collaboration between research groups thathas promoted exchange of control samples and protocols. Thus, allele bin calls canbe predefined, readily allowing the standardization of allele size calls across researchprojects (Ellis et al ., 2011).
There are a large number of salmonid microsatellites available in the publishedliterature, many of which have been found to cross-amplify in S. trutta (Scribneret al ., 1996; Paterson et al ., 2004; King et al ., 2005; Vasemagi et al ., 2005a).While such a large pool of markers is potentially advantageous, it is not withoutproblems. For instance, for logistic and economic reasons, it is often impractical toscreen >20–30 markers in any study. Thus, researchers are often forced to use asub-set of markers that are typically chosen ad hoc. This variation in markers usedby different research groups has prevented meaningful comparisons of populationsand locus trends across the range of the species (Carlsson et al ., 1999; Swatdiponget al ., 2010; Meier et al ., 2011).
To alleviate some of these logistic trade-offs, a panel of 38 informativemicrosatellite loci is presented. This panel avails of new technological and analyticaladvances and is intended to foster a more collaborative approach to S. truttagenetic research. It is anticipated that this marker panel will be useful in a range ofresearch areas, including genetic mapping, parentage analysis, quantitative trait loci(QTL) analysis, ancestry assignment and population structure detection. The markerpanel, referred to as the Beaufort trout MicroPlex (BTMP), has been designedto allow the efficient and reliable amplification of many loci in relatively fewPCRs, through multiplexing. Although the main aim of this study was to maximizethroughput, hence the particular configuration of multiplex groups presented, thenature of the multiplexing system employed provides other users of the panel withsufficient flexibility to rearrange loci to suit specific demands of any given study(notably, in the event of locus range overlap as a result of diversity not observed inthis study).
© 2013 The AuthorsJournal of Fish Biology © 2013 The Fisheries Society of the British Isles, Journal of Fish Biology 2013, 82, 1789–1804
B E AU F O RT T RO U T M I C RO P L E X F O R S A L M O T RU T TA G E N E T I C S 1791
MATERIALS AND METHODS
I N I T I A L M A R K E R L O C I S E L E C T I O N
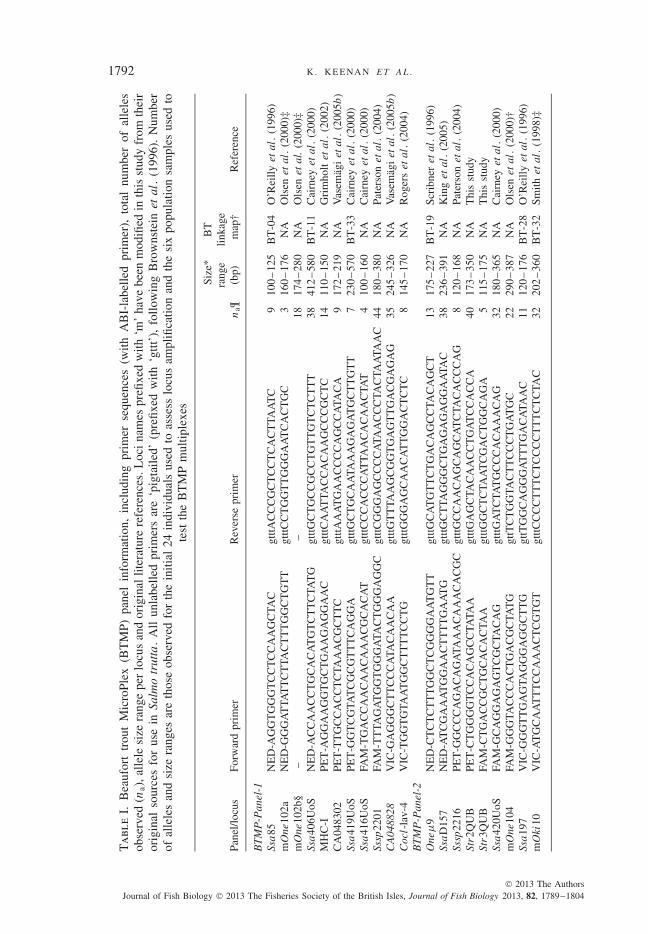
All initial steps in the development of the BTMP (e.g . reliability of PCR amplificationand allele resolution) were carried out on a random sub-set of S. trutta specimens collectedthroughout Britain and Ireland (n = 24). Following the identification of reliably amplifyingloci, 150 candidate salmonid microsatellite primer sets were further evaluated with respectto a number of criteria relevant to their suitability for S. trutta population genetic studies.All candidate loci were either obtained from the literature, developed using in-house cloning,or designed de novo from sequences sourced from GenBank. Loci obtained using the lattermethod are prefixed with ‘m’, indicating that the sequences presented in Table I differ fromthe original sequences presented in the references provided. The evaluation criteria used were(1) reliability of amplification, (2) consistency of automated allelic calls, (3) equal or greaterthan two alleles and (4) allele size range. Loci with very large size ranges (i.e. spanning c.100–600 bp) were excluded due to their unsuitability for size-based multiplexing.
M U LT I P L E X D E V E L O P M E N T
Following extensive evaluation of marker compatibility, loci fulfilling the set criteriawere subsequently grouped into four separate multiplex panels that were optimizedfor screening on a 96 capillary ABI-3730XL DNA analyser (Applied Biosystems;www.appliedbiosystems.com). The main criteria for the inclusion of markers in each ofthe four panels were co-amplification reliability and non-overlapping size compatibility,while also making use of the distinct ABI fluorescent labels. The cycling conditions of allfour multiplex PCRs were as follows: (95◦ C for 15 min) ×1 cycle (95◦ C for 45 s, 55◦C for 1 min 30 s and 72◦ C for 1 min) ×5 cycles, (95◦ C for 45 s, 57◦ C for 1 min 30 sand 72◦ C for 1 min) ×22 cycles, (60◦ C for 30 min) ×1 cycle. Each multiplex reactionconsisted of 1 μl of template DNA (concentration ranging from c. 0·5 to 5 ng), 0·15 μMof each primer, 1·75 μl of PCR mastermix (Qiagen Multiplex PCR Kit; www.qiagen.com)and double-distilled H2O as required to make a final volume of 3·5 μl. PCRs were carriedout in 96 well microtitre plates and were overlain with 10 μl of mineral oil to preventevaporation. Following PCR, amplified fragments were subsequently diluted one-tenthwith double-distilled H2O and 1 μl of this dilution was added to 9 μl of HiDi formamide(Life Technologies; www.lifetechnologies.com) mixed with Gene Scan 600-LIZ (LifeTechnologies), as per standard ABI 3730xl genotyping protocol.
A S S E S S M E N T O F B T M P F O R P O P U L AT I O N S T U D I E S
Although the BTMP is expected to be useful for a range of S. trutta genetic researchquestions as outlined earlier, given its commercial and conservation relevance, it is likely thatits widest application will be in population genetic research, specifically population structuredetection. To provide an initial evaluation of the utility of the BTMP when applied to thisspecific research area, an assessment of marker performance, in the form of basic populationgenetic statistical description and statistical power analyses, was carried out.
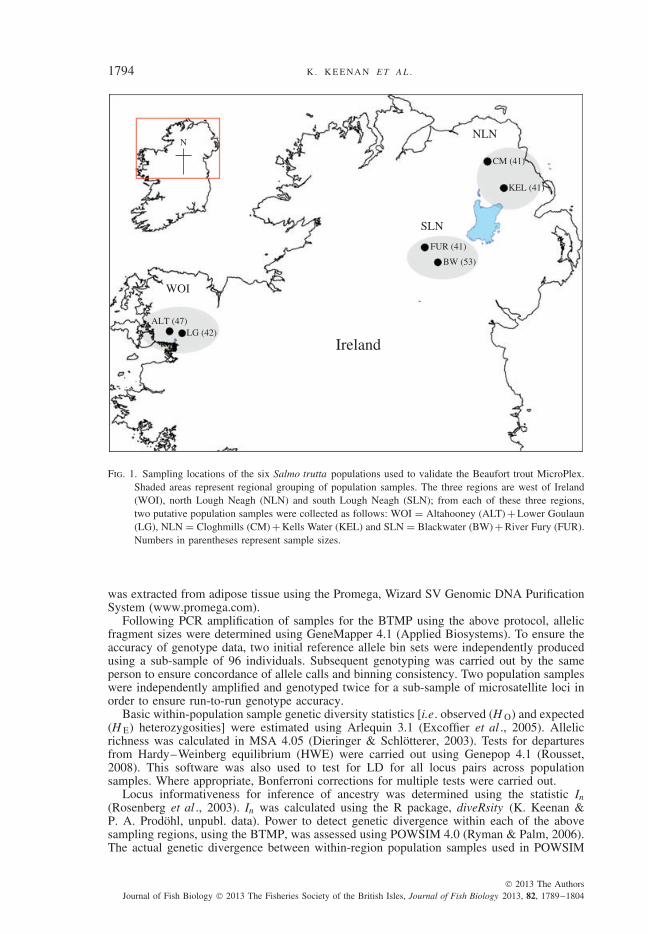
To investigate the properties of individual microsatellites [e.g . amplification reliabilityunder multiplex conditions, polymorphism level, informativeness for the inference of ances-try, statistical power to detect genetic differentiation and linkage disequilibrium (LD)], sixfreshwater S. trutta population samples (n = 265) were screened for all loci in the BTMP.These population samples were collected from three geographical regions within the islandof Ireland. For the purposes of this study, these regions are referred to as: west of Ireland(WOI), north Lough Neagh (NLN) and south Lough Neagh (SLN). Two putative popu-lation samples were collected from each of these three geographical regions to accountfor within-region pair-wise population comparisons also. These samples were as follows:WOI = Altahooney (ALT) + Lower Goulaun (LG), NLN = Cloghmills (CM) + Kells Water(KEL) and SLN = Blackwater (BW) + River Fury (FUR) (see Fig. 1 for details of samplinglocations). All fish (0+ and 1+ year juveniles) were caught via electrofishing. Genomic DNA
© 2013 The AuthorsJournal of Fish Biology © 2013 The Fisheries Society of the British Isles, Journal of Fish Biology 2013, 82, 1789–1804
1792 K . K E E NA N E T A L .
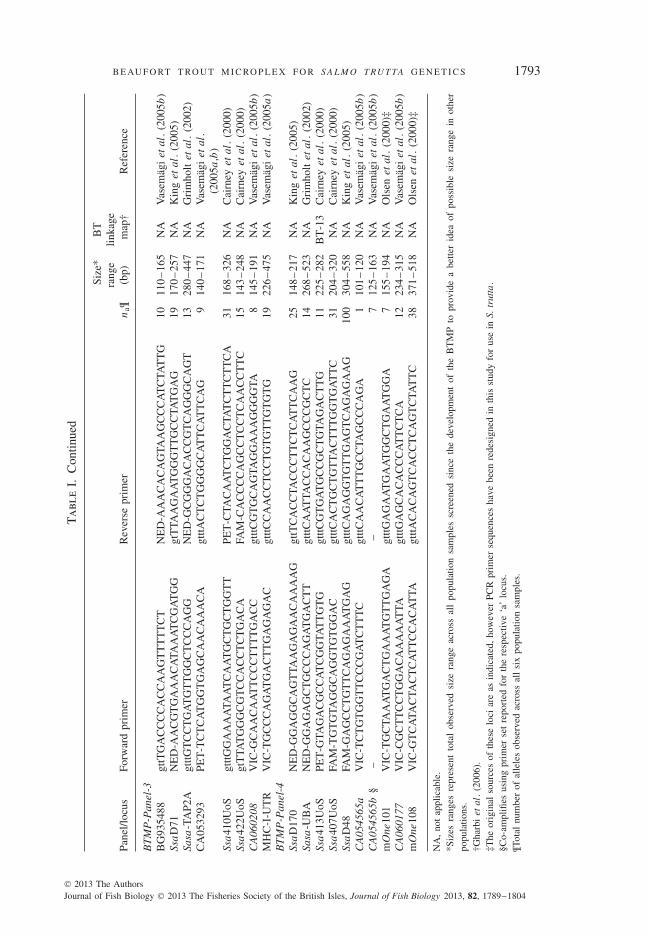
Tab
leI.
Bea
ufor
ttr
out
Mic
roPl
ex(B
TM
P)pa
nel
info
rmat
ion,
incl
udin
gpr
imer
sequ
ence
s(w
ithA
BI-
labe
lled
prim
er),
tota
lnu
mbe
rof
alle
les
obse
rved
(na)
,alle
lesi
zera
nge
per
locu
san
dor
igin
allit
erat
ure
refe
renc
es.L
oci
nam
espr
efixe
dw
ith‘m
’ha
vebe
enm
odifi
edin
this
stud
yfr
omth
eir
orig
inal
sour
ces
for
use
inSa
lmo
trut
ta.
All
unla
belle
dpr
imer
sar
e‘p
igta
iled’
(pre
fixed
with
‘gttt
’),
follo
win
gB
row
nste
inet
al.
(199
6).
Num
ber
ofal
lele
san
dsi
zera
nges
are
thos
eob
serv
edfo
rth
ein
itial
24in
divi
dual
sus
edto
asse
sslo
cus
ampl
ifica
tion
and
the
six
popu
latio
nsa
mpl
esus
edto
test
the
BT
MP
mul
tiple
xes
Pane
l/loc
usFo
rwar
dpr
imer
Rev
erse
prim
ern
a¶
Size
*ra
nge
(bp)
BT
linka
gem
ap†
Ref
eren
ce
BT
MP
-Pan
el-1
Ssa
85N
ED
-AG
GT
GG
GT
CC
TC
CA
AG
CTA
Cgt
ttAC
CC
GC
TC
CT
CA
CT
TAA
TC
910
0–
125
BT
-04
O’R
eilly
etal
.(1
996)
mO
ne10
2aN
ED
-GG
GA
TTA
TT
CT
TAC
TT
TG
GC
TG
TT
gtttC
CT
GG
TT
GG
GA
AT
CA
CT
GC
316
0–
176
NA
Ols
enet
al.
(200
0)‡
mO
ne10
2b§
––
1817
4–
280
NA
Ols
enet
al.
(200
0)‡
Ssa
406U
oSN
ED
-AC
CA
AC
CT
GC
AC
AT
GT
CT
TC
TAT
Ggt
ttGC
TG
CC
GC
CT
GT
TG
TC
TC
TT
T38
412
–58
0B
T-1
1C
airn
eyet
al.
(200
0)M
HC
-IPE
T-A
GG
AA
GG
TG
CT
GA
AG
AG
GA
AC
gtttC
AA
TTA
CC
AC
AA
GC
CC
GC
TC
1411
0–
150
NA
Gri
mho
ltet
al.
(200
2)C
A04
8302
PET
-TT
GC
CA
CC
TC
TAA
AC
GC
TT
Cgt
ttAA
AT
GA
AC
CC
CA
GC
CA
TAC
A9
172
–21
9N
AV
asem
agi
etal
.(2
005b
)Ss
a41
9UoS
PET
-GG
TC
GTA
TC
GC
GT
TT
CA
GG
Agt
ttGC
TG
CA
ATA
AA
GA
GA
TG
CT
TG
TT
723
0–
570
BT
-33
Cai
rney
etal
.(2
000)
Ssa
416U
oSFA
M-T
GA
CC
AA
CA
AC
AA
AC
GC
AC
AT
gtttC
CC
AC
CC
AT
TAA
CA
CA
AC
TAT
410
0–
160
NA
Cai
rney
etal
.(2
000)
Sssp
2201
FAM
-TT
TAG
AT
GG
TG
GG
ATA
CT
GG
GA
GG
Cgt
ttCG
GG
AG
CC
CC
ATA
AC
CC
TAC
TAA
TAA
C44
180
–38
0N
APa
ters
onet
al.
(200
4)C
A04
8828
VIC
-GA
GG
GC
TT
CC
CA
TAC
AA
CA
Agt
ttGT
TTA
AG
CG
GT
GA
GT
TG
AC
GA
GA
G35
245
–32
6N
AV
asem
agi
etal
.(2
005b
)C
ocl-
lav-
4V
IC-T
GG
TG
TAA
TG
GC
TT
TT
CC
TG
gtttG
GG
AG
CA
AC
AT
TG
GA
CT
CT
C8
145
–17
0N
AR
oger
set
al.
(200
4)B
TM
P-P
anel
-2O
neμ
9N
ED
-CT
CT
CT
TT
GG
CT
CG
GG
GA
AT
GT
Tgt
ttGC
AT
GT
TC
TG
AC
AG
CC
TAC
AG
CT
1317
5–
227
BT
-19
Scri
bner
etal
.(1
996)
Ssa
D15
7N
ED
-AT
CG
AA
AT
GG
AA
CT
TT
TG
AA
TG
gtttG
CT
TAG
GG
CT
GA
GA
GA
GG
AA
TAC
3823
6–
391
NA
Kin
get
al.
(200
5)Ss
sp22
16PE
T-G
GC
CC
AG
AC
AG
ATA
AA
CA
AA
CA
CG
Cgt
ttGC
CA
AC
AG
CA
GC
AT
CTA
CA
CC
CA
G8
120
–16
8N
APa
ters
onet
al.
(200
4)St
r2Q
UB
PET
-CT
GG
GG
TC
CA
CA
GC
CTA
TAA
gtttG
AG
CTA
CA
AC
CT
GA
TC
CA
CC
A40
173
–35
0N
AT
his
stud
ySt
r3Q
UB
FAM
-CT
GA
CC
GC
TG
CA
CA
CTA
Agt
ttGG
CT
CTA
AT
CG
AC
TG
GC
AG
A5
115
–17
5N
AT
his
stud
ySs
a42
0UoS
FAM
-GC
AG
GA
GA
GT
CG
CTA
CA
Ggt
ttGA
TC
TAT
GC
CC
AC
AA
AC
AG
3218
0–
365
NA
Cai
rney
etal
.(2
000)
mO
ne10
4FA
M-G
GG
TAC
CC
AC
TG
AC
GC
TAT
Ggt
tTC
TG
GTA
CT
TC
CC
TG
AT
GC
2229
0–
387
NA
Ols
enet
al.
(200
0)†
Ssa
197
VIC
-GG
GT
TG
AG
TAG
GG
AG
GC
TT
Ggt
tTG
GC
AG
GG
AT
TT
GA
CA
TAA
C11
120
–17
6B
T-2
8O
’Rei
llyet
al.
(199
6)m
Oki
10V
IC-A
TG
CA
AT
TT
CC
AA
AC
TC
GT
GT
gtttC
CC
CT
TT
CT
CC
CC
TT
TC
TC
TAC
3220
2–
360
BT
-32
Smith
etal
.(1
998)
‡
© 2013 The AuthorsJournal of Fish Biology © 2013 The Fisheries Society of the British Isles, Journal of Fish Biology 2013, 82, 1789–1804
B E AU F O RT T RO U T M I C RO P L E X F O R S A L M O T RU T TA G E N E T I C S 1793T
able
I.C
ontin
ued
Pane
l/loc
usFo
rwar
dpr
imer
Rev
erse
prim
ern
a¶
Size
*ra
nge
(bp)
BT
linka
gem
ap†
Ref
eren
ce
BT
MP
-Pan
el-3
BG
9354
88gt
tTG
AC
CC
CA
CC
AA
GT
TT
TT
CT
NE
D-A
AA
CA
CA
GTA
AG
CC
CA
TC
TAT
TG
1011
0–
165
NA
Vas
emag
iet
al.
(200
5b)
Ssa
D71
NE
D-A
AC
GT
GA
AA
CA
TAA
AT
CG
AT
GG
gtT
TAA
GA
AT
GG
GT
TG
CC
TAT
GA
G19
170
–25
7N
AK
ing
etal
.(2
005)
Sasa
-TA
P2A
gtttG
TC
CT
GA
TG
TT
GG
CT
CC
CA
GG
NE
D-G
CG
GG
AC
AC
CG
TC
AG
GG
CA
GT
1328
0–
447
NA
Gri
mho
ltet
al.
(200
2)C
A05
3293
PET
-TC
TC
AT
GG
TG
AG
CA
AC
AA
AC
Agt
ttAC
TC
TG
GG
GC
AT
TC
AT
TC
AG
914
0–
171
NA
Vas
emag
iet
al.
(200
5a,b
)Ss
a41
0UoS
gtttG
GA
AA
ATA
AT
CA
AT
GC
TG
CT
GG
TT
PET
-CTA
CA
AT
CT
GG
AC
TAT
CT
TC
TT
CA
3116
8–
326
NA
Cai
rney
etal
.(2
000)
Ssa
422U
oSgt
TTA
TG
GG
CG
TC
CA
CC
TC
TG
AC
AFA
M-C
AC
CC
CA
GC
CT
CC
TC
AA
CC
TT
C15
143
–24
8N
AC
airn
eyet
al.
(200
0)C
A06
0208
VIC
-GC
AA
CA
AT
TC
CC
TT
TT
GA
CC
gtttC
GT
GC
AG
TAG
GA
AA
GG
GG
TA8
145
–19
1N
AV
asem
agi
etal
.(2
005b
)M
HC
-I-U
TR
VIC
-TG
CC
CA
GA
TG
AC
TT
GA
GA
GA
Cgt
ttCC
AA
CC
TC
CT
GT
GT
TG
TG
TG
1922
6–
475
NA
Vas
emag
iet
al.
(200
5a)
BT
MP
-Pan
el-4
Ssa
D17
0N
ED
-GG
AG
GC
AG
TTA
AG
AG
AA
CA
AA
AG
gttT
CA
CC
TAC
CC
TT
CT
CA
TT
CA
AG
2514
8–
217
NA
Kin
get
al.
(200
5)Sa
sa-U
BA
NE
D-G
GA
GA
GC
TG
CC
CA
GA
TG
AC
TT
gtttC
AA
TTA
CC
AC
AA
GC
CC
GC
TC
1426
8–
523
NA
Gri
mho
ltet
al.
(200
2)Ss
a41
3UoS
PET
-GTA
GA
CG
CC
AT
CG
GTA
TT
GT
Ggt
ttCG
TG
AT
GC
CG
CT
GTA
GA
CT
TG
1122
5–
282
BT
-13
Cai
rney
etal
.(2
000)
Ssa
407U
oSFA
M-T
GT
GTA
GG
CA
GG
TG
TG
GA
Cgt
ttCA
CT
GC
TG
TTA
CT
TT
GG
TG
AT
TC
3120
4–
320
NA
Cai
rney
etal
.(2
000)
Ssa
D48
FAM
-GA
GC
CT
GT
TC
AG
AG
AA
AT
GA
Ggt
ttCA
GA
GG
TG
TT
GA
GT
CA
GA
GA
AG
100
304
–55
8N
AK
ing
etal
.(2
005)
CA
0545
65a
VIC
-TC
TG
TG
GT
TC
CC
GA
TC
TT
TC
gtttC
AA
CA
TT
TG
CC
TAG
CC
CA
GA
110
1–
120
NA
Vas
emag
iet
al.
(200
5b)
CA
0545
65b
§–
–7
125
–16
3N
AV
asem
agi
etal
.(2
005b
)m
One
101
VIC
-TG
CTA
AA
TG
AC
TG
AA
AT
GT
TG
AG
Agt
ttGA
GA
AT
GA
AT
GG
CT
GA
AT
GG
A7
155
–19
4N
AO
lsen
etal
.(2
000)
‡C
A06
0177
VIC
-CG
CT
TC
CT
GG
AC
AA
AA
AT
TAgt
ttGA
GC
AC
AC
CC
AT
TC
TC
A12
234
–31
5N
AV
asem
agi
etal
.(2
005b
)m
One
108
VIC
-GT
CA
TAC
TAC
TC
AT
TC
CA
CA
TTA
gtttA
CA
CA
GT
CA
CC
TC
AG
TC
TAT
TC
3837
1–
518
NA
Ols
enet
al.
(200
0)‡
NA
,no
tap
plic
able
.*S
izes
rang
esre
pres
ent
tota
lob
serv
edsi
zera
nge
acro
ssal
lpo
pula
tion
sam
ples
scre
ened
sinc
eth
ede
velo
pmen
tof
the
BT
MP
topr
ovid
ea
bette
rid
eaof
poss
ible
size
rang
ein
othe
rpo
pula
tions
.†G
harb
iet
al.
(200
6).
‡The
orig
inal
sour
ces
ofth
ese
loci
are
asin
dica
ted,
how
ever
PCR
prim
erse
quen
ces
have
been
rede
sign
edin
this
stud
yfo
rus
ein
S.tr
utta
.§C
o-am
plifi
esus
ing
prim
erse
tre
port
edfo
rth
ere
spec
tive
‘a’
locu
s.¶T
otal
num
ber
ofal
lele
sob
serv
edac
ross
all
six
popu
latio
nsa
mpl
es.
© 2013 The AuthorsJournal of Fish Biology © 2013 The Fisheries Society of the British Isles, Journal of Fish Biology 2013, 82, 1789–1804
1794 K . K E E NA N E T A L .
N
WOI
ALT (47)LG (42)
BW (53)
FUR (41)
CM (41)
KEL (41)
SLN
Ireland
NLN
Fig. 1. Sampling locations of the six Salmo trutta populations used to validate the Beaufort trout MicroPlex.Shaded areas represent regional grouping of population samples. The three regions are west of Ireland(WOI), north Lough Neagh (NLN) and south Lough Neagh (SLN); from each of these three regions,two putative population samples were collected as follows: WOI = Altahooney (ALT) + Lower Goulaun(LG), NLN = Cloghmills (CM) + Kells Water (KEL) and SLN = Blackwater (BW) + River Fury (FUR).Numbers in parentheses represent sample sizes.
was extracted from adipose tissue using the Promega, Wizard SV Genomic DNA PurificationSystem (www.promega.com).
Following PCR amplification of samples for the BTMP using the above protocol, allelicfragment sizes were determined using GeneMapper 4.1 (Applied Biosystems). To ensure theaccuracy of genotype data, two initial reference allele bin sets were independently producedusing a sub-sample of 96 individuals. Subsequent genotyping was carried out by the sameperson to ensure concordance of allele calls and binning consistency. Two population sampleswere independently amplified and genotyped twice for a sub-sample of microsatellite loci inorder to ensure run-to-run genotype accuracy.
Basic within-population sample genetic diversity statistics [i.e. observed (H O) and expected(H E) heterozygosities] were estimated using Arlequin 3.1 (Excoffier et al ., 2005). Allelicrichness was calculated in MSA 4.05 (Dieringer & Schlotterer, 2003). Tests for departuresfrom Hardy–Weinberg equilibrium (HWE) were carried out using Genepop 4.1 (Rousset,2008). This software was also used to test for LD for all locus pairs across populationsamples. Where appropriate, Bonferroni corrections for multiple tests were carried out.
Locus informativeness for inference of ancestry was determined using the statistic In(Rosenberg et al ., 2003). In was calculated using the R package, diveRsity (K. Keenan &P. A. Prodohl, unpubl. data). Power to detect genetic divergence within each of the abovesampling regions, using the BTMP, was assessed using POWSIM 4.0 (Ryman & Palm, 2006).The actual genetic divergence between within-region population samples used in POWSIM
© 2013 The AuthorsJournal of Fish Biology © 2013 The Fisheries Society of the British Isles, Journal of Fish Biology 2013, 82, 1789–1804
B E AU F O RT T RO U T M I C RO P L E X F O R S A L M O T RU T TA G E N E T I C S 1795
simulations was calculated using G st (Nei & Chesser, 1983), again in the R package, diveR-sity. All sample sizes were set to n = 50 in order to represent a typical population geneticexperimental design, and also due to its close approximation to the actual size of samplescollected from each of the populations studied here (Fig. 1).
In an effort to establish a robust locus selection method for researchers wishing to recon-figuring the BTMP into multiplex groups that better address their particular questions, poweranalysis was carried out in a sequential manner. Contributions from each locus to overallpower were assessed by iteratively adding a single locus to the power-analysis simulation inan order defined by loci ranked from high to low for: (1) number of alleles (na), (2) infor-mativeness for the inference of ancestry (In) and (3) randomly ranked loci (i.e. alphabeticalorder of locus names). With the addition of individual loci in sequential order for each of thethree rank criteria, statistical power was independently assessed in POWSIM. This processwas repeated until all available loci were included in the final power analysis simulation.The rationale of this method is based on the observation by Kalinowski (2002) that highna leads to higher statistical power or accuracy. In can also be interpreted as an assessmentof the decrease in uncertainty resulting from information contributed by a particular locus(Rosenberg et al ., 2003), suggesting that both measures may be useful in the selection of themost informative loci for population genetic studies. For the purposes of the power analy-ses, the loci Sasa-UBA, CA054565a and SsaD48 were excluded because of deviations fromHWE, monomorphism and having more than the permissible 50 alleles by POWSIM 4.0,respectively.
As an additional test of the generality (i.e. applicability to populations beyond thosesurveyed here) of na and In as predictors of statistical power, correlations between locusranks were carried out across within-region comparisons using Spearman’s rank correla-tion, calculated in the statistical programming environment R (R Development Core Team;www.r-project.org).
RESULTS
M A R K E R L O C I S E L E C T I O N A N D M U LT I P L E XD E V E L O P M E N T
From the original 150 candidate loci assessed, 38 met the specified selectioncriteria. Following extensive testing involving multiple permutations of marker com-binations, the minimum number of multiplex groups required to reliably amplify the38 loci was found to be four. This particular configuration of the BTMP can befound in Table I. Microsatellites within the BTMP were found to reliably amplify inall six population samples with a mean ± s.d. amplification success of 96·6 ± 1·9%(individual locus amplification success per population sample is presented in TableSI, Supporting Information). All primer sequence information, including those formarkers derived from the literature, are presented in Table I. Trace file figures (chro-matograms) for each microsatellite locus, in addition to notes pertinent to successfulallele scoring, are provided in Appendix SI (Supporting Information).
B T M P F L E X I B I L I T Y
The flexibility of the panel of markers comprising the BTMP was tested as part ofa parallel on-going project investigating the population genetics of sea trout (anadro-mous S. trutta). During these tests, it was noted that the allelic size range of many ofthe microsatellite markers comprising the BTMP panel varied considerably betweenfreshwater resident and anadromous S. trutta , leading to extensive marker overlap(unpubl. data). To address this issue, an alternative marker configuration was tested.
© 2013 The AuthorsJournal of Fish Biology © 2013 The Fisheries Society of the British Isles, Journal of Fish Biology 2013, 82, 1789–1804
1796 K . K E E NA N E T A L .
This alternative panel comprised 22 of the original 38 BTMP loci organized intotwo unique multiplex groups. An initial screening of anadromous S. trutta , as part ofthis parallel study, has shown that this new configuration of loci does indeed over-come the overlap issue, while more than adequately meeting the statistical powerrequirement. Details of anadromous S. trutta configuration of the BTMP markers arepresented in Table SII (Supporting Information).
S TAT I S T I C A L A S S E S S M E N T O F T H E B T M P
Within the BTMP, the mean observed single locus heterozygosity ranged from0·20 to 0·92 (Ssa416UoS and SSsp2201). The mean ± s.d. number of alleles perlocus was 20·4 ± 17·9 and any single population sample possessed between 23 and100% of the total alleles observed at a particular locus across all population samplesscreened (Table SI, Supporting Information).
As expected from presumed neutral markers, with one exception (Sasa-UBA),all loci conform to HWE expectations within all six population samples (Table SI,Supporting Information). The small number of deviations, observed after Bonferronicorrection, had no consistent pattern related to samples or loci. Accordingly, they arelikely to be due to sampling error rather than true population deviations from HWEexpectations. For the Sasa-UBA locus, however, five of the six samples were foundto deviate from HWE expectations. While the occurrence of null alleles cannot bedismissed, it is interesting to note that Sasa-UBA is embedded in the 3′-untranslatedregion of the major histocompatibility complex (MHC) class I locus in Salmo salar .Protein modelling of several Sasa-UBA alleles has demonstrated differences in theirpeptide-binding domains (Grimholt et al ., 2002). Thus, selective constraints cannotbe excluded as a possible explanation for the observed deviations from HWE. It waselected to leave this particular marker locus in the BTMP panel as it may be usefulfor investigations examining adaptive differences among S. trutta populations. It isimportant to emphasize, however, that care should be taken when using this particularlocus to estimate population parameters which assume neutrality.
An additional feature was identified during marker assessment with regard to locimOne102 and CA054565 . Both loci primer sets appeared to amplify two indepen-dently segregating loci. The two presumed paralogues for each primer set were sub-sequently renamed as mOne102a and mOne102b and CA054565a and CA054565b,respectively. In both cases, the locus with the smaller allele size distribution wasdenoted with the suffix ‘a’ and the larger with ‘b’. The two mOne102 loci are easilydistinguished as they do not overlap with any other loci within their fluorophore group(Table I). This, however, is not the case for the CA054565 loci (i.e. CA054565b).Thus, alleles at the CA054565b locus tend to fall within the range of the mOne108locus within the same fluorophore group (VIC; see Table I). Despite this overlap,alleles from each locus can be easily identified based on their distinct stutter patternsand peak shape profiles.
In this study, CA054565a was excluded from analyses as it was found to bemonomorphic for the same allele in all six population samples examined. Variationat this locus, however, was observed in the samples previously used to carry outthe initial locus selection and in other S. trutta populations examined, including theanadromous S. trutta samples mentioned above.
© 2013 The AuthorsJournal of Fish Biology © 2013 The Fisheries Society of the British Isles, Journal of Fish Biology 2013, 82, 1789–1804
B E AU F O RT T RO U T M I C RO P L E X F O R S A L M O T RU T TA G E N E T I C S 1797
0·0
0·2
0·4
0·6
0·8
1·0(a)
0·0
0·2
0·4
0·6
0·8
1·0(b)
0·00 5 10 15 20
Number of loci
25 30 35
0·2
0·4
0·6
0·8
1·0(c)
Pow
er to
det
ect d
iver
genc
e
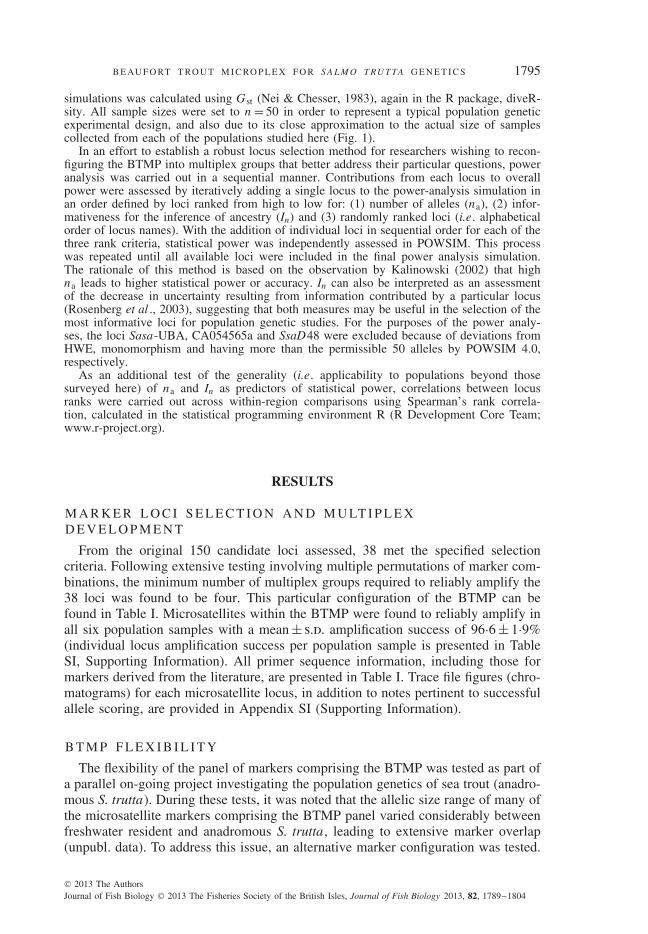
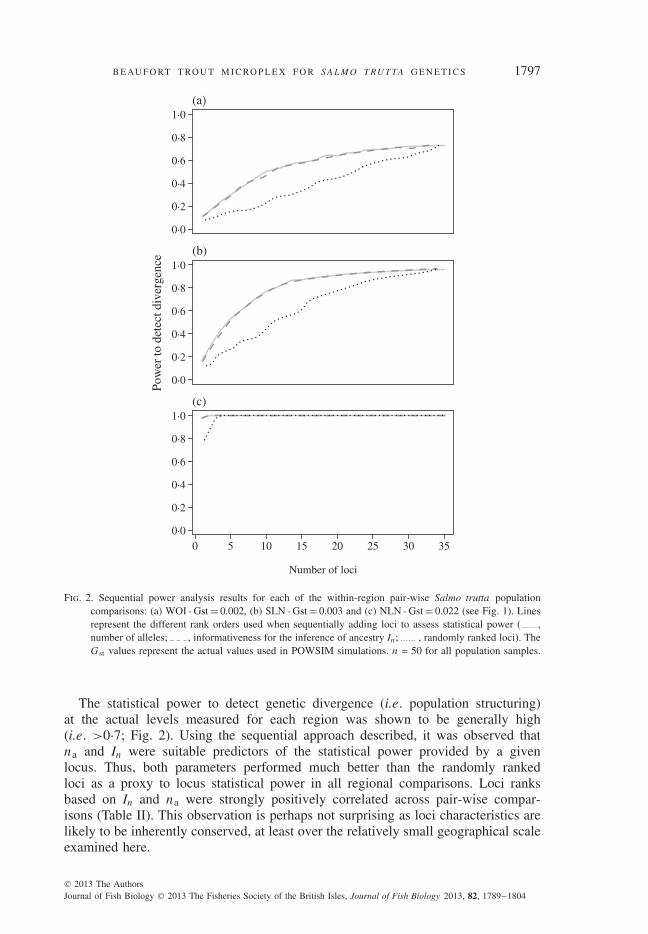
Fig. 2. Sequential power analysis results for each of the within-region pair-wise Salmo trutta populationcomparisons: (a) WOI - Gst = 0.002, (b) SLN - Gst = 0.003 and (c) NLN - Gst = 0.022 (see Fig. 1). Linesrepresent the different rank orders used when sequentially adding loci to assess statistical power ( ,number of alleles; , informativeness for the inference of ancestry In; , randomly ranked loci). TheG st values represent the actual values used in POWSIM simulations. n = 50 for all population samples.
The statistical power to detect genetic divergence (i.e. population structuring)at the actual levels measured for each region was shown to be generally high(i.e. >0·7; Fig. 2). Using the sequential approach described, it was observed thatna and In were suitable predictors of the statistical power provided by a givenlocus. Thus, both parameters performed much better than the randomly rankedloci as a proxy to locus statistical power in all regional comparisons. Loci ranksbased on In and na were strongly positively correlated across pair-wise compar-isons (Table II). This observation is perhaps not surprising as loci characteristics arelikely to be inherently conserved, at least over the relatively small geographical scaleexamined here.
© 2013 The AuthorsJournal of Fish Biology © 2013 The Fisheries Society of the British Isles, Journal of Fish Biology 2013, 82, 1789–1804

1798 K . K E E NA N E T A L .
Table II. Spearman’s rank correlation ρ-scores with significance levels for loci ranked forIn (informativeness for the inference of ancestry) and na (total number of observed alleles).
See Fig. 1 for population sample code
In
Populationsample WOI SLN NLN
WOI – *** ***SLN 0·781 – ***NLN 0·780 0·756 –
na Population sample WOI SLN NLNWOI – *** ***SLN 0·940 – ***NLN 0·936 0·964 –
***P -value < 0·001.
DISCUSSION
In this study, a high-throughput set of informative microsatellite marker loci ispresented for general use in both freshwater and anadromous S. trutta genetic inves-tigations. While many microsatellite markers have been previously described forS. trutta , this is the first attempt to compile a highly flexible, high-throughput andcost-effective group of markers suitable for addressing a range of research questions.
T E C H N I C A L B E N E F I T S O F T H E B T M P
The BTMP ensures maximum throughput in conjunction with high data qualityand consistency for microsatellite genotyping. In this study, for example, screeningthroughput was extremely high, with up to 922 genotypes (assuming 96% ampli-fication success) being produced from a single 96 well plate PCR. This level ofthroughput for microsatellite multiplexing is much higher than that observed else-where. For example, the multiplex panels presented in Renshaw et al . (2006) andused in Hansen et al . (2010), assuming the same amplification success achievedhere, generate only 645 and 368 genotypes, respectively. Such high throughput alsoreduces the time for reaction preparation, thus resulting in tangible reductions ofboth financial costs associated with personnel and also PCR reagents. Optimizationof each of the four multiplex reactions in a total volume of only 3·5 μl providesadditional savings on PCR reagent usage. Given that as little as 0·5 ng of genomicDNA is required per PCR, tissue requirements are also minimal.
One of the major benefits of the BTMP is high quality data, as demonstrated bythe levels of genotyping accuracy and amplification success observed. For example,following the establishment of the initial reference allele bin sets, no genotypeinconsistencies were observed for replicated individuals (i.e. same individualsscreened more than once for the same loci). This high degree of reproducibilityis a particularly useful feature of the BTMP, especially for parentage studieswhere allelic mismatches can be particularly troublesome (Wang, 2010). Thegenotyping platform used to develop the BTMP also allows for standardization ofmicrosatellite scoring through the development of a universal reference allele binset. This consensus bin set overcomes one of the major disadvantages commonly
© 2013 The AuthorsJournal of Fish Biology © 2013 The Fisheries Society of the British Isles, Journal of Fish Biology 2013, 82, 1789–1804

B E AU F O RT T RO U T M I C RO P L E X F O R S A L M O T RU T TA G E N E T I C S 1799
associated with microsatellites. Thus, it is now possible to share a reference allelebin set among research groups to ensure that independently derived genotypesare both accurate and comparable (Ellis et al ., 2011). This advantage also lendsitself to meta-analyses and should be seen as beneficial for the establishment of anunderstanding of S. trutta population structure and evolution throughout its range.
B T M P A P P L I C AT I O N S
Different genetic approaches have distinct experimental requirements; thus, locusselection for inclusion in the BTMP panels was carefully planned to ensure thegeneral applicability of the markers. For instance, levels of polymorphism of locifor population genetic structure studies and population assignment have constraintsin the sense that there is no discriminative value in using monomorphic markers.Where markers are too polymorphic, however, practical constraints relating to alleletyping and sample size requirements will be encountered. Loci used for parentageassignment analyses, on the other hand, should be sufficiently polymorphic to allowunambiguous individual assignment to family and family group. Therefore, thereare no explicit constraints on how high or low the levels of polymorphism can be.Taking these factors into consideration, the BTMP was developed to be flexiblefor researchers who wish to reorganize the loci to meet the requirements of theirparticular research project. This feature of the BTMP is shown in Table SII (Sup-porting Information), where two unique multiplex groups (derived from the originalpool of 38 markers) were developed for specific application to anadromous S. truttapopulations, with allelic distribution ranges distinct from those of the surveyed fresh-water S. trutta populations. The inclusion of loci which have the potential to deviatefrom neutrality as a result of their association to regions of the genome involved inadaptive changes (e.g. Sasa-UBA and the other MHC-linked loci) also provides theopportunity for investigations of adaptive evolution in S. trutta populations.
The occurrence of putatively duplicated loci, in most instances, has no direct con-sequences for any of the analyses used in this study. Where putatively duplicatedloci were identified, there was no evidence, in the study populations, of LD. Assuch, they could confidently be used as independently segregating marker loci. Theoccurrence of these putative ohnologues is likely to be the result of locus duplica-tion as the ancestor of the salmonids underwent whole genome duplication around50 million years ago and many contemporary salmonid species still exhibit resid-ual tetraploidy (Bailey et al ., 1978). Interestingly, while the locus CA054565a wasmonomorphic and hence uninformative in the context of the present investigation,more than one allele was observed among the individuals used in the developmentof the anadromous S. trutta panels and also in on-going investigations of freshwaterpopulations of S. trutta .
S TAT I S T I C A L P OW E R A N D L O C U S I N F O R M AT I V E N E S S
The POWSIM analysis demonstrated high statistical power for all within-regionpopulation comparisons when all loci of the BTMP were included (Fig. 2). Thishigh statistical power was observed for divergence levels as low as G st = 0·002(ALT v . LG), demonstrating one of the major benefits of the BTMP. When inves-tigating population genetic structuring among populations where F st values are
© 2013 The AuthorsJournal of Fish Biology © 2013 The Fisheries Society of the British Isles, Journal of Fish Biology 2013, 82, 1789–1804
1800 K . K E E NA N E T A L .
c. >0·005 and n = at least 50, the 38 loci of the BTMP are likely to provide morethan enough statistical power. This conclusion is derived from the observation that,in the SLN population comparison (G st = 0·003), with all 35 eligible loci included,power was found to be 96%. Considering this in view of the fact that three lociwere excluded from the analysis (including the most informative locus SsaD48), itappears reasonable to assume that close to 100% statistical power would be achievedunder the aforementioned conditions. Such superfluous levels of statistical power atrelatively low levels of genetic divergence will undoubtedly provide users of theBTMP with extra flexibility when reconfiguring loci for the specific needs of theirgiven study.
R E C O N F I G U R AT I O N O F T H E B T M P
The BTMP is presented here as a baseline group of microsatellite loci that canbe readily used by researchers for purposes other than population genetics, includ-ing QTL and parentage analyses, inheritance and gene-mapping studies, as well asgenetic stock identification. Thus, it is not presented as a fixed configuration of mark-ers. Certain studies may have a lower requirement for the number of loci (e.g . NLNpopulation comparison) than others. In such cases, it is important to select the mostefficient set of loci to attempt to reduce the overall labour and financial expendi-ture. The main aim of the marker assessment carried out was to evaluate how wellboth qualitative (polymorphism as determined by the number of alleles) and quan-titative (In) features of loci could predict the potential statistical power provided byindividual loci.
Despite the evidence that both In and na can be used to select the most power-ful loci, results should be interpreted cautiously, especially where sample sizes aresmall (i.e. n < 50). This caution is based on the observation that POWSIM assessesstatistical power as a function of the ability to detect true genetic divergence witha particular data set and experimental design. It does not assess the accuracy ofa particular data set in the estimation of a given population parameter (Ryman &Jorde, 2001; Ryman et al ., 2006). This is an important distinction that needs to beemphasized between these two particular tasks.
An alternative way to consider this issue is in terms of sampling error. Wherea locus has many alleles (thus high informativeness as determined by POWSIMand In), most of these occur, necessarily, at low frequencies and are likely to bemisrepresented in samples of insufficient size. Where this occurs, it is often the casethat frequency differences between these alleles are of little biological relevance, yetthey contribute significantly to the overall χ2 test for sample independence (unpubl.data), which is employed in POWSIM. Thus, it is likely that where sample sizesare insufficient to accurately detect alleles, POWSIM will provide reports of highstatistical power, even for data sets with very low biological accuracy (i.e. the abilityto calculate a true parameter which describes a population from a sample of thatpopulation). Despite this issue, it should still be possible to use either polymorphismlevel (i.e. na) or In as a proxy to general relative locus power, providing that samplesizes are adequately large.
The utility of these two features as proxies to power in studies of populations, otherthan those considered here, is supported by the high degree of similarity in locusranks across the three sampling regions. Furthermore, by considering the fact that the
© 2013 The AuthorsJournal of Fish Biology © 2013 The Fisheries Society of the British Isles, Journal of Fish Biology 2013, 82, 1789–1804

B E AU F O RT T RO U T M I C RO P L E X F O R S A L M O T RU T TA G E N E T I C S 1801
relative polymorphism level at neutral loci is determined almost entirely by mutationrate and genomic range constraints, and that these inherent features are likely to beconserved, at least to the intraspecific scale, it is not unreasonable to assume that theyare generally applicable features of these loci for S. trutta populations throughout thedistribution range. It is possible, however, that the observed high positive correlationsin ranks observed here are restricted to S. trutta from the island of Ireland as a resultof recent common ancestry, relative to S. trutta from elsewhere. In this instance,locus informativeness would have to be assessed on a study-by-study basis. To testthis hypothesis, the methods used here should be replicated in S. trutta populationsfrom other areas.
In summary, the panel of microsatellite markers described is submitted as a valu-able molecular resource facilitating a more rational and collaborative approach tothe study of S. trutta population and evolutionary genetics throughout the speciesdistribution range. Given advances in genotyping technology and software, it is nowpossible to share allele classifications between research groups, thus allowing forstandardized allele nomenclature based on a single reference sample of individuals.For the future, it is envisaged that additional informative markers will be added to theBTMP. Work is on-going to provide an online resource to store information regard-ing allele bins for locus typing and marker information for efficient customizationof the BTMP. Finally, it is argued that while there is a trend to move towards newtechnologies, which potentially allow for the screening of a very large number ofmarkers (e.g . single nucleotide polymorphisms), their application may not always beappropriate to address specific questions in S. trutta population genetic research. It istherefore anticipated that the microsatellite panel described here will have utility (e.g .low cost, well-developed statistical framework, accessibility and high throughput),in such applications, at least in the medium term (e.g . 5–10 years).
K.K. was supported by a PhD studentship from the Beaufort Marine Research Award inFish Population Genetics funded by the Irish Government under the Sea Change programme.P.A.P, T.F.C, W.W.C., P.McG. and C.R.B were also supported by this award. J.J.M wassupported by a PhD studentship funded by the Environmental Protection Agency Ireland.The authors are grateful to the staff of the Marine Institute, Ireland, and the Agri-Foodand Biosciences Institute for help with sample collection. The authors would also like toexpress their gratitude to the Associate Editor and two anonymous reviewers for constructivecomments that helped to substantially improve this manuscript.
Supporting Information
Supporting Information may be found in the online version of this paper:Table SI Details of locus diversity statistics estimated per population sample, includ-ing number of individuals typed per locus per population sample (N ), number ofobserved alleles (N a), population sample proportion of the number of total alle-les observed across all samples for a particular locus (P/T), allelic richness (AR),observed (H O) and expected (H E) heterozygosities; significance (P -value) of testsfor departures from Hardy–Weinberg equilibrium (ns, non-significant).Table SII Marker information for the two anadromous Salmo trutta MicroPlexpanels assembled in this study, including primer sequences (with ABI-labelledprimer). Loci names prefixed with ‘m’ have been modified in this study from
© 2013 The AuthorsJournal of Fish Biology © 2013 The Fisheries Society of the British Isles, Journal of Fish Biology 2013, 82, 1789–1804
1802 K . K E E NA N E T A L .
their original sources for use in S. trutta (see main text for additional details). Allunlabelled primers are pigtailed (i.e. prefixed with ‘gttt’)APPENDIX SI. Brown trout MicroPlex marker loci scoring notes
References
Bailey, G. S., Poulter, R. & Stockwell, P. A. (1978). Gene duplication in tetraploid fish: modelfor gene silencing at unlinked duplicated loci. Proceedings of the National Academy ofSciences 75, 5575.
Brownstein, M. J., Carpten, J. D. & Smith, J. R. (1996). Modulation of non-templatednucleotide addition by Taq DNA polymerase: primer modifications that facilitate geno-typing. BioTechniques 20, 1004–1010.
Buschiazzo, E. & Gemmell, N. J. (2006). The rise, fall and renaissance of microsatellites ineukaryotic genomes. BioEssays 28, 1040–1050.
Cairney, M., Taggart, J. B. & Høyheim, B. (2000). Characterization of microsatellite andminisatellite loci in Atlantic salmon (Salmo salar L.) and cross-species amplificationin other salmonids. Molecular Ecology 9, 2175–2178.
Carlsson, J., Olsen, K. H. H., Nilsson, J., Øverli, Ø. & Stabell, O. B. O. (1999). Microsatellitesreveal fine-scale genetic structure in stream-living brown trout. Journal of Fish Biology55, 1290–1303.
Carlsson, J., Carlsson, J. E. L., Olsen, K. H., Hansen, M. M., Eriksson, T. & Nilsson, J. (2004).Kin-biased distribution in brown trout: an effect of redd location or kin recognition?Heredity 92, 53–60.
Coughlan, J., McGinnity, P., O’Farrell, B., Dillane, E., Diserud, O., de Eyto, E., Farrell, K.,Whelan, K., Stet, R. J. M. & Cross, T. F. (2006). Temporal variation in an immuneresponse gene (MHC I) in anadromous Salmo trutta in an Irish river before and duringaquaculture activities. ICES Journal of Marine Science 63, 1248–1255.
Dieringer, D. & Schlotterer, C. (2003). Microsatellite analyser (MSA): a platform independentanalysis tool for large microsatellite data sets. Molecular Ecology Notes 3, 167–169.
Ellis, J. S., Gilbey, J., Armstrong, A., Balstad, T., Cauwelier, E., Cherbonnel, C., Consuegra,S., Coughlan, J., Cross, T. F., Crozier, W., Dillane, E., Ensing, D., García de Leaniz,C., García-Vazquez, E., Griffiths, A. M., Hindar, K., Hjorleifsdottir, S., Knox, D.,Machado-Schiaffino, G., McGinnity, P., Meldrup, D., Nielsen, E. E., Olafsson, K.,Primmer, C. R., Prodohl, P. A., Stradmeyer, L., Vaha, J.-P., Verspoor, E., Wennevik,V. & Stevens, J. R. (2011). Microsatellite standardization and evaluation of genotypingerror in a large multi-partner research programme for conservation of Atlantic salmon(Salmo salar L.). Genetica 139, 1–15.
Excoffier, L., Laval, G. & Schneider, S. (2005). Arlequin (version 3.0): an integrated softwarepackage for population genetics data analysis. Evolutionary Bioinformatics 1, 47–50.
Ferguson, A. (1989). Genetic differences among brown trout, Salmo trutta , stocks and theirimportance for the conservation and management of the species. Freshwater Biology21, 35–46.
Gharbi, K., Gautier, A., Danzmann, R. G., Gharbi, S., Sakamoto, T., Høyheim, B., Taggart,J. B, Cairney, M., Powell, R., Krieg, F., Okamoto, N., Ferguson, M. M., Holm, L.-E.& Guyomard, R. (2006). A linkage map for brown trout (Salmo trutta): chromosomehomeologies and comparative genome organization with other salmonid fish. Genetics172, 2405.
Grimholt, U., Drabløs, F., Jørgensen, S., Høyheim, B. & Stet, R. J. M. (2002). The majorhistocompatibility class I locus in Atlantic salmon (Salmo salar L.): polymorphism,linkage analysis and protein modelling. Immunogenetics 54, 570–581.
Hansen, M. M. & Mensberg, K.-L. D. (1996). Founder effects and genetic population structureof brown trout (Salmo trutta) in a Danish river system. Canadian Journal of Fisheriesand Aquatic Sciences 53, 2229–2237.
Hansen, M. M., Ruzzante, D. E., Nielsen, E. E. & Mensberg, K.-L. D. (2000). Microsatelliteand mitochondrial DNA polymorphism reveals life-history dependent interbreedingbetween hatchery and wild brown trout (Salmo trutta L.). Molecular Ecology 9,583–594.
© 2013 The AuthorsJournal of Fish Biology © 2013 The Fisheries Society of the British Isles, Journal of Fish Biology 2013, 82, 1789–1804
B E AU F O RT T RO U T M I C RO P L E X F O R S A L M O T RU T TA G E N E T I C S 1803
Hansen, M. M., Meier, K. & Mensberg, K.-L. D. (2010). Identifying footprints of selection instocked brown trout populations: a spatio-temporal approach. Molecular Ecology 19,1787–1800.
Hendry, A. P. & Stearns, S. C. (2004). Evolution Illuminated: Salmon and their Relatives .Oxford: Oxford University Press.
Hynes, R. A., Ferguson, A. & McCann, M. A. (1996). Variation in mitochondrial DNA andpost-glacial colonization of North Western Europe by brown trout. Journal of FishBiology 48, 54–67.
Jacob, A., Nussle, S., Britschgi, A., Evanno, G., Muller, R. & Wedekind, C. (2007). Maledominance linked to size and age, but not to “good genes” in brown trout (Salmotrutta). BMC Evolutionary Biology 7, 207–216.
Jensen, L. F., Hansen, M. M., Pertoldi, C., Holdensgaard, G., Mensberg, K. L. D. &Loeschcke, V. (2008). Local adaptation in brown trout early life-history traits:implications for climate change adaptability. Proceedings of the Royal Society B 275,2859–2868.
Jonsson, B. & Jonsson, N. (2006). Life-history effects of migratory costs in anadromousbrown trout. Journal of Fish Biology 69, 860–869.
Kalinowski, S. T. (2002). How many alleles per locus should be used to estimate geneticdistances? Heredity 88, 62–65.
King, T. L., Eackles, M. S. & Letcher, B. H. (2005). Microsatellite DNA markers for thestudy of Atlantic salmon (Salmo salar) kinship, population structure, and mixed-fisheryanalyses. Molecular Ecology Notes 5, 130–132.
Klemetsen, A. & Amundsen, P. A. (2003). Atlantic salmon Salmo salar L., brown troutSalmo trutta L. and Arctic charr Salvelinus alpinus (L.): a review of aspects of theirlife histories. Ecology of Freshwater Fish 12, 1–59.
Matthews, M. A., Poole, R., Thompson, C. E., McKillen, J., Ferguson, A., Hindar, K. &Wheelan, K. F. (2000). Incidence of hybridization between Atlantic salmon, Salmosalar L., and brown trout, Salmo trutta L., in Ireland. Fisheries Management andEcology 7, 337–347.
McKeown, N. J., Hynes, R. A., Duguid, R. A., Ferguson, A. & Prodohl, P. A. (2010).Phylogeographic structure of brown trout Salmo trutta in Britain and Ireland: glacialrefugia, postglacial colonization and origins of sympatric populations. Journal of FishBiology 76, 319–347.
Meier, K., Hansen, M. M., Bekkevold, D., Skaala, O. & Mensberg, K.-L. D. (2011). Anassessment of the spatial scale of local adaptation in brown trout (Salmo trutta L.):footprints of selection at microsatellite DNA loci. Heredity 106, 488–499.
Nei, M. & Chesser, R. K. (1983). Estimation of fixation indices and gene diversities. Annalsof Human Genetics 47, 253–259.
Olsen, E. M. & Vøllestad, L. A. (2001). Within-stream variation in early life-history traits inbrown trout. Journal of Fish Biology 59, 1579–1588.
O’Farrell, B., Benzie, J. A. H., McGinnity, P., Carlsson, J., Eyto, E. d., Dillane, E., Coughlan,J. & Cross, T. (2011). MHC-mediated spatial distribution in brown trout (Salmo trutta)fry. Heredity 108, 403–409.
Olsen, J. B., Wilson, S. L., Kretschmer, E. J., Jones, K. C. & Seeb, J. E. (2000). Characteriza-tion of 14 tetranucleotide microsatellite loci derived from sockeye salmon. MolecularEcology 9, 2155–2234.
O’Reilly, P. T., Hamilton, L. C., McConnell, S. K. & Wright, J. M. (1996). Rapid analysis ofgenetic variation in Atlantic salmon (Salmo salar) by PCR multiplexing of dinucleotideand tetranucleotide microsatellites. Canadian Journal of Fisheries and Aquatic Sciences53, 2292–2298.
Paterson, S., Piertney, S. B., Knox, D., Gilbey, J. & Verspoor, E. (2004). Characterizationand PCR multiplexing of novel highly variable tetranucleotide Atlantic salmon (Salmosalar L.) microsatellites. Molecular Ecology Notes 4, 160–162.
Prodohl, P. A., Walker, A. F., Hynes, R. A., Taggart, J. B. & Ferguson, A. (1997). Geneticallymonomorphic brown trout (Salmo trutta L.) populations as revealed by mitochon-drial DNA, multilocus and single-locus minisatellite (VNTR) analyses. Heredity 79,208–213.
© 2013 The AuthorsJournal of Fish Biology © 2013 The Fisheries Society of the British Isles, Journal of Fish Biology 2013, 82, 1789–1804
1804 K . K E E NA N E T A L .
Renshaw, M., Saillant, E., Bradfield, S. & Gold, J. (2006). Microsatellite multiplex panelsfor genetic studies of three species of marine fishes: red drum (Sciaenops ocellatus),red snapper (Lutjanus campechanus), and cobia (Rachycentron canadum). Aquaculture253, 731–735.
Robertsen, G., Kvingedal, E. & Einum, S. (2011). Is there genetic variation in the responseto competition intensity in juvenile brown trout Salmo trutta? Journal of Fish Biology78, 635–646.
Rogers, S. M., Marchand, M. H. & Bernatchez, L. (2004). Isolation, characterization andcross-salmonid amplification of 31 microsatellite loci in the lake whitefish (Coregonusclupeaformis , Mitchill). Molecular Ecology Notes 4, 89–92.
Rosenberg, N. A., Li, L. M., Ward, R. & Pritchard, J. K. (2003). Informativeness ofgenetic markers for inference of ancestry. American Journal of Human Genetics 73,1402–1422.
Rousset, F. (2008). GENEPOP’007: a complete re-implementation of the genepop softwarefor Windows and Linux. Molecular Ecology Resources 8, 103–106.
Ryman, N. & Jorde, P. E. (2001). Statistical power when testing for genetic differentiation.Molecular Ecology 10, 2361–2373.
Ryman, N. & Palm, S. (2006). POWSIM: a computer program for assessing statistical powerwhen testing for genetic differentiation. Molecular Ecology Notes 6, 600–602.
Ryman, N., Palm, S., Andre, C., Carvalho, G. R., Dahlgren, T. G., Jorde, P. E., Laikre,L., Larsoon, J. C., Palme, A. & Ruzzante, D. E. (2006). Power for detecting geneticdivergence: differences between statistical methods and marker loci. Molecular Ecology15, 2031–2045.
Scribner, K. T., Gust, J. R. & Fields, R. L. (1996). Isolation and characterization of novelsalmon microsatellite loci: cross-species amplification and population genetic applica-tions. Canadian Journal of Fisheries and Aquatic Sciences 53, 833–841.
Smith, C. T., Koop, B. F. & Nelson, R. J. (1998). Isolation and characterization of coho salmon(Oncorhynchus kisutch) microsatellites and their use in other salmonids. MolecularEcology 7, 1614.
Swatdipong, A., Vasemagi, A., Niva, T., Koljonen, M. L. & Primmer, C. R. (2010). Highlevel of population genetic structuring in lake-run brown trout, Salmo trutta , of theInari Basin, northern Finland. Journal of Fish Biology 77, 2048–2071.
Tiira, K., Laurila, A., Enberg, K., Piironen, J., Aikio, S., Ranta, E. & Primmer, C. R. (2005).Do dominants have higher heterozygosity? Social status and genetic variation in browntrout, Salmo trutta . Behavioral Ecology and Sociobiology 59, 657–665.
Vasemagi, A., Gross, R., Paaver, T., Koljonen, M. L., Saisa, M. & Nilsson, J. (2005a). Anal-ysis of gene associated tandem repeat markers in Atlantic salmon (Salmo salar L.)populations: implications for restoration and conservation in the Baltic Sea. Conserva-tion Genetics 6, 385–397.
Vasemagi, A., Nilsson, J. & Primmer, C. R. (2005b). Seventy-five EST-linked Atlantic salmon(Salmo salar L.) microsatellite markers and their cross-amplification in five salmonidspecies. Molecular Ecology Notes 5, 282–288.
Wang, J. (2010). Effects of genotyping errors on parentage exclusion analysis. MolecularEcology 19, 5061–5078.
Youngson, A. F., Jordan, W. C., Verspoor, E., McGinnity, P., Cross, T. F. & Ferguson,A. (2003). Management of salmonid fisheries in the British Isles: towards a practicalapproach based on population genetics. Fisheries Research 62, 193–209.
© 2013 The AuthorsJournal of Fish Biology © 2013 The Fisheries Society of the British Isles, Journal of Fish Biology 2013, 82, 1789–1804
Copyright © 2022 FDOKUMEN