Classification of northern Finnish lakes and the suitability for the stocking for brown trout (...
13
ELSEVIER Fisheries Research 27 (I 996) 37-49 Classification of northern Finnish lakes and the suitability for the stocking for brown trout 1 Salmo trutta f L.) m. Zacustris) Teppo Vehanen a,*, Jouni Aspi b a Finnish Gume and Fisheries Institute, Kainuu Fisheries Research and Aquaculture, Manamansalontie 90. FIN-88300. Paltamo, Finland ’ University qf Oulu. Oulanka Biological St&ion. Liikasenvaarantie 134, FIN-93999, Kuusamo. Finland Accepted 8 December 1995 Abstract Because there are some 15 000 Finnish lakes exceeding 10 ha in area, there is a pressing need in Finland for the development of effective stocking strategies for various types of Finnish lakes. The most common predatory fish employed in stocking in Finland for the past few decades has been brown trout (Sulmo trutta CL.) m. lacustris), and the brown trout yield in lakes relies almost solely on stocking. Since the recourses of the fisheries managers are limited, it would be useful if an empirically derived lake classification scheme were made available for them, to enable them to plan and implement monitoring programmes to suit each individual lake. A cluster analysis (Ward’s minimum-variance method) was used to classify 33 lakes in northern Finland on the basis of the yields of seven most common species: brown trout, vendace, whitefish, perch, pike, burbot and roach. The success achieved in the stocking of brown trout was compared between the various lake clusters. A discriminant analysis was used to develop a discriminant criterion to classify each lake into one of the clusters on the basis of species composition and ten environmental variables. The results suggested that, when based on catch statistics, cluster analysis can produce an objective classification scheme. Relative brown trout yield (kilograms per thousand fish released) seemed to be higher in the cluster with a higher proportion of vendace. The importance of the use of proper stocking rate for different kind of lakes was also revealed. Discriminant criterion based on both species composition and environmental variables rather reliably classified the lakes to correct clusters (76% and 70%, respectively). ’ Corresponding address: Finnish Game and Fisheries Institute, Kainuu Fisheries Research and Aquaculture, Manamansatontie 90, PIN-88300 Paltamo, Finland. Tel.: + 358-86-874451. Fax: + 358-86-874410. Email: [email protected]. 01657836/96/$15.00 0 1996 Elsevier Science B.V. All rights reserved PII SO165-7836(96)00472-9
-
Upload
independent -
Category
Documents
-
view
1 -
download
0
Transcript of Classification of northern Finnish lakes and the suitability for the stocking for brown trout (...

ELSEVIER Fisheries Research 27 (I 996) 37-49
Classification of northern Finnish lakes and the suitability for the stocking for brown trout 1 Salmo
trutta f L.) m. Zacustris)
Teppo Vehanen a,*, Jouni Aspi b a Finnish Gume and Fisheries Institute, Kainuu Fisheries Research and Aquaculture, Manamansalontie 90.
FIN-88300. Paltamo, Finland ’ University qf Oulu. Oulanka Biological St&ion. Liikasenvaarantie 134, FIN-93999, Kuusamo. Finland
Accepted 8 December 1995
Abstract
Because there are some 15 000 Finnish lakes exceeding 10 ha in area, there is a pressing need in Finland for the development of effective stocking strategies for various types of Finnish lakes. The most common predatory fish employed in stocking in Finland for the past few decades has been brown trout (Sulmo trutta CL.) m. lacustris), and the brown trout yield in lakes relies almost solely on stocking. Since the recourses of the fisheries managers are limited, it would be useful if an empirically derived lake classification scheme were made available for them, to enable them to plan and implement monitoring programmes to suit each individual lake.
A cluster analysis (Ward’s minimum-variance method) was used to classify 33 lakes in northern Finland on the basis of the yields of seven most common species: brown trout, vendace, whitefish, perch, pike, burbot and roach. The success achieved in the stocking of brown trout was compared between the various lake clusters. A discriminant analysis was used to develop a discriminant criterion to classify each lake into one of the clusters on the basis of species composition and ten environmental variables.
The results suggested that, when based on catch statistics, cluster analysis can produce an objective classification scheme. Relative brown trout yield (kilograms per thousand fish released) seemed to be higher in the cluster with a higher proportion of vendace. The importance of the use of proper stocking rate for different kind of lakes was also revealed. Discriminant criterion based on both species composition and environmental variables rather reliably classified the lakes to correct clusters (76% and 70%, respectively).
’ Corresponding address: Finnish Game and Fisheries Institute, Kainuu Fisheries Research and Aquaculture, Manamansatontie 90, PIN-88300 Paltamo, Finland. Tel.: + 358-86-874451. Fax: + 358-86-874410. Email: [email protected].
01657836/96/$15.00 0 1996 Elsevier Science B.V. All rights reserved PII SO165-7836(96)00472-9

38 T. Vehanen, J. Aspi / Fisheries Research 27 (1996) 37-49
A scheme employing lake clusters could, thus, be used as a basis for management decisions on suitable stocking rate and which of the lakes are to be included into the stocking programmes of brown trout. The study produced some useful guide-lines to management programmes reducing the need to study all individual lakes in detail.
Keywords: Brown trout; Community analysis; Fish yield; Species composition
1. Introduction
Since Finland has some 15 000 lakes with a surface area exceeding 10 ha, the fisheries involved with the management of stocking carried out in the Finnish lakes need to create effective stocking strategies for different types of lakes or in different succession state of lakes fish stocks. The most common predatory fish used in stocking is brown trout (S&no trutfu (L.) m. &u&s). As a result flow from regulation demanded by hydroelectrical power production, from loss of nursery areas and from overfishing natural reproduction of brown trout has diminished and the yield is currently almost solely based on stocking. More than one million 2-3 year-old brown trout are put annually into Finnish inland waters, most of the stocking being carried out as a means of compensation for the flow regulation resulting from the hydroelectrical power produc- tion.
Despite of large number of fish stocked annually in lakes in Finland, a common strategy for the stocking of brown trout still remains to be developed. The importance of a prevailing fish community for the stocking of salmonid fish to be successful has been noted by several researchers (Gunn et al., 1987; Gipson and Hubert, 1991; Hubert and Guenther, 1992). The growth rate of a fish on a fish diet is high (Garman and Nielsen, 1982), therefore the availability of prey fish of suitable size is important (O’Gorman et al., 1987). The importance of stocking rate, fishing efficiency and the fish community for the stocking success of brown trout in the lakes in northern Finland has also been established (Vehanen, 1995).
The decisions concerning stocking sites and rates for brown trout are usually made on a site-by-site basis. There is probably little sense in stocking a water which cannot support a sustainable population (Cowx, 1994). However, if type of the lake and stocking rate can be matched the results can be beneficial both for the fish community in the lake in question and for the fisheries involved. The limited resources available for fisheries management do not permit the analysis of every lake in detail. If the identification of the factors limiting the success of stocking is possible, an empirical approach can be employed. An empirically derived lake classification scheme would therefore allow managers to stratify the monitoring programme according to lake types (Dolman, 1990). The sites would not have to be dealt with as unique entities, on a site-by-site basis, for they could be clustered or classified on the basis of their fish assemblages or habitat characteristics (Platts, 1980).
Classification methods have not been widely applied in the studies concerned with fisheries research. Johnson et al. (1977) classified Ontario lakes on the basis of combinations of four important game fish species. Tonn et al. (1983) distinguished two

T. Vehanen, J. Aspi/ Fisheries Research 27 (1996137-49 35,
discrete assemblage types of 18 lakes and used them to predict assemblage types of 1 I additional lakes from five habitat characteristics. Dolman (1990) used cluster analysis to examine compositions among 20 fish species to develop a classification scheme for 132 reservoirs. SalojPrvi and Ekholm (1990) employed cluster analysis in predicting the efficiency of whitefish stocking in Finnish lakes.
In this paper data is analysed from 33 northern Finnish lakes, for which information was collected in routine management surveys. The objectives of this study were (I) to create a classification scheme for the lakes in northern Finland on the basis of fish species composition; (2) to relate these clusters to the stocking success of brown trout; and (3) to relate these clusters to environmental variables.
2. Materials and methods
2. I. Classification of the lakes
The purpose of the classification was to create lake cluster classifications according to the principle that each cluster was to have a fish species composition of its own particular type, so that each composition was to differ from all the others. The identification of the lake clusters relied on the compositions of the yields of seven fish species. An hierarchical classification method was used because it can give information about the relative importance of the divisions and the relationships of the resulting clusters, unlike nonhierarchical classification methods that merely group similar samples together (Gauch, 1982).
The cluster analysis was carried out with the CLUSTER procedure of SAS statistical package @AS Institute Inc., 1988) by employing Ward’s minimum-variance method. This clustering procedure was preferred because it produces tight clusters (Gauch, 1982). Minimum-variance clustering agglomerates clusters, provided that the increase in within-group dispersion is less than it would be if either of the two clusters were joined with any other cluster (Gauch, 1982). Initially, each case is its own cluster with a zero sum of squared differences. These initial clusters are then joined together on the basis of a minimum variance within clusters (Aldenderfer and Blashfield, 1985).
Data included in the cluster analysis consisted of catch statistics from 33 lakes in northern Finland lakes containing yields of seven most common species: brown trout, vendace, Coregonus albula L., whitefish, Coregonus lavaretus (L.) s.l., perch, Perca
jZuviatilis CL.), pike, Esox lucius L., burbot, Lota lota (L.) and roach, Rutilus rutilus (L.) (Table I). The brown trout yield is based on stocking, except in Lake Inarijlrvi where, according to fin-clipping, 34% of the recruitment was from natural reproduction (Mutenia and Salonen, 1991). The number of brown trout stocked (two-summer old fish and older) was collected for 6 years prior to the catch data inquiry and trout yield was considered to be a result of these stocking according to fish taggings (for details see Vehanen, 1995).
Because the species composition of the lakes was the issue under the study, the yields of the seven species in different lakes were standardized to zero mean and unit standard deviation before the cluster analysis (see Gauch, 1982) to minimize the effect of fishing

40 T. Vehanen. J. Aspi / Fisheries Research 27 (19%) 37-49
Table 1 Variations in the yields of the seven most common fish species used in cluster analysis to classify the 33 northern Finnish lakes
Variable Mean Minimum Maximum SD
Brown trout yield (kg ha- ’ ) 0.2 0.0 0.9 0.2 Whitefish yield (kg ha- ’ ) 1.5 0.1 1.3 1.6 Vendace yield (kg ha- ’ ) 4.3 0.0 26.3 5.5 Perch yield (kg ha- ’ ) 1.2 0.0 5.4 1.0 Pike yield (kg ha- ’ ) 0.9 0.0 6.0 1.1 Roach yield (kg ha- ’ ) 0.7 0.0 3.4 0.9 Burbot yield (kg ha- ’ ) 0.4 0.0 1.4 0.3
effort to the magnitude of the yields between the lakes. The Squared Euclidian distance, which emphasizes dominant species (see Gauch, 1982), was used as a dissimilarity measure between lakes for cluster analysis. Cubic clustering criterion (CCC) and the pseudo F-statistic (SAS Institute Inc., 1988) was used to estimate the number of lake clusters in the cluster analysis.
2.2. The success of brown trout stocking in different lake clusters
Analysis of covariance was employed to test the possible differences in the relative trout yield (kilograms per thousand fish released) between the lake clusters. The stocking rate (fish ha-’ ) of brown trout was included in the model as a covariate for increased accuracy in determining the effect of lake type (cluster) on the relative trout yield of brown trout. Both variables (relative brown trout yield and stocking rate) were log-transformed before the analysis. One of the lakes (Lake Kynsij’tivi) was excluded from the analysis because no brown trout were stocked in the lake.
2.3. Use of species composition to predict the type of a lake
The next step was to develop classification criterion for future observations. We employed discriminant analysis to produce a classification model for different clusters based on species compositions. When a discriminant model is used to classify the same observations it is based on, the classification error rate obtained is likely to underesti- mate the true error rate (Efron and Gong, 1983). That is why we used cross-validation with the discriminant function model to calculate unbiased error rates for predicting lake types based on species compositions. Cross-validation classifies each observation using a discriminant function calculated from the other observations, excluding the observation being classified.
2.4. Use of environmental variables to predict the type of a lake
Since data about the fish species composition in a lake are not always available, we evaluated the usability of several environmental variables to predict the type of a lake.

T. Vehanen, J. Aspi / Fisheries Reseurch 27 (I 9961 37-49 41
The environmental variables evaluated included water quality variables together with the geomorphology of the lakes, and the amplitude of water level fluctuation.
Water quality samples of the classified lakes were taken from the records of the Finnish National Board of Waters and the Environment, and they had been collected during the summer season (May-August), the depth of the sample sites being O-l m. Calculations were then carried out to produce a 3-year mean average.
The geomorphological variables were the surface area A, maximum depth (m> and shoreline development (D,), calculated after Wetzel (1983):
L/2 x /(; X-A)
where L is shoreline length. The regulation demanded by hydroelectric power production is present in 15 of the
lakes, and the amplitude of water level fluctuation (m> was used to measure the effects of the regulation.
To test the value of the environmental variables in predicting the type of a lake the possible difference between clusters was tested using analysis of variance and Tukey’s- test as a post priori test for pairwise comparisons. We also employed a multivariate discriminant analysis to classify each lake into one of the clusters on the basis of environmental variables.
3. Results
3. I. Luke classification
Both CCC and pseudo F test statistics had a local peaks at three clusters in Ward’s minimum variance clustering analysis indicating existence of three lake clusters. The resulting tree of the analysis for three clusters is shown in Fig. 1
The proportions of the seven species demonstrated clear differences in the yield composition between the clusters (Fig. 2). The following fish species composition characterized the clusters.
3.1.1. Cluster one (roach-perch-pike-type lakes) Seven regulated and four unregulated lakes with larger proportions of roach, perch
and pike in the yield when compared with the other clusters (Fig. 2).
3.1.2. Cluster two (vena’ace-type lakes) Nine unregulated and six regulated lakes with higher proportion of pelagic vendace in
the yield when compared to the other two clusters (Fig. 2). An interesting feature of the cluster is that it seems to be divided into two subgroups in Fig. 2. The other subgroup consisted of tight cluster of eight unregulated lakes (from Lake Muoj5rvi to Lake OrajZrvi), and the other consisting of mainly regulated lakes (from Lake Kerojkvi to

42 T. Vehanen, J. Aspi/ Fisheries Research 27 (19%) 37-49
0.33 SEMI-PARTIAL R-SQUARED 0
ENDARVI
WJKAMOJARV,
PORONTIMA
MARll.&RVl
SUOLIJARVJ
KURTTNJARVI
KYLMALUOMA
KEROIAIM
KUUSAMOJ.&RVT
IRNU‘iRVI
KOSTONJAIWI
OULUJARVI
YLlOUDONJ&Vl
Fig. 1. Dendrograrn of 33 lakes in northern Finland formed by cluster analysis (Ward’s minimum-variance method) and by using the standardized yields of the seven most common species.
Lake NuasjZrvi), the mesotrophic Lake Kuusamo (Huusko, 1990) being the only exception. The division to two subgroups in this cluster is obviously caused by a significantly (r-test, t = 6.5885, d.f. = 7.8, P = 0.0002) larger proportion of roach in the yield of the latter group of lakes when compared with unregulated lakes.
3.1.3. Cluster three (whitefish-type lakes) Five unregulated lakes and two regulated ones, characterized by higher proportion of
whitefish compared to the two other clusters (Fig. 2). The proportion of vendace yield in this cluster was lower than in Cluster 2 but higher than in Cluster 1.
3.2. The success of brown trout stocking in different lake clusters
Significantly different stocking rates (brown trout ha-’ year-‘) appeared to been used in different clusters (Kruskal-Wallis test, X2 = 10.3, P < 0.01). Highest stocking

T. Vehanen, J. Aspi /Fisheries Research 27 (I 996) 37-49 33
60
Cluster 1
40+ %
20
L r-7 ( --
il -...- ” Brawn trout Whitefish Vendace Perch Pike Roach Burbot
“”
Cluster 2
40-
60 I Cluster 3
40 %
20
0 Brown trout Whitefish Vendoce Perch Pike Roach Burbol
Brown trout Whitefish Vendace Perch Pike Roach Turbot
1
Fig. 2. The percentage proportions of the seven most common fish species in northern Finnish lakes in the three different lake groups formed by cluster analysis based on standardized species-specific yields.
rates were used in the lakes of Cluster 3 (mean = 2.3 fish ha-‘, SD = 1.6, range = 0.2- 5.31, lowest in the ones of Cluster 1 (mean = 0.5 fish ha-‘, SD = 0.5, range = 0.1-l 5) and moderate stocking rates were used in lakes of the Cluster 2 (mean = 0.9 fish ha-‘, SD = 0.9, range = 0.02-3.7). There were also significant differences between the clusters in the relative brown trout yield from stocking when stocking rate was used as a covariate (F = 3.97, P < 0.05). The highest relative yields were obtained from the lakes
44 T. Vehunen, J. Aspi/ Fisheries Research 27 (1996) 37-49
450
350
250
150
50 )! Cluster 1 Cluster 2 Cluster 3
Fig. 3. Relative yields of brown trout (kilograms per thousand fish released) in lake groups formed by cluster analysis based on standardized species-specific yields. The mean relative yield (bars) and standard deviation (lines) in different clusters are presented.
of Cluster 2 (vendace-type lakes with moderate stocking rates) and lowest in the ones of Cluster 3 (whitefish-type lakes with highest stocking rates) (Fig. 3).
3.3. Use of species composition to predict the type of a Lake
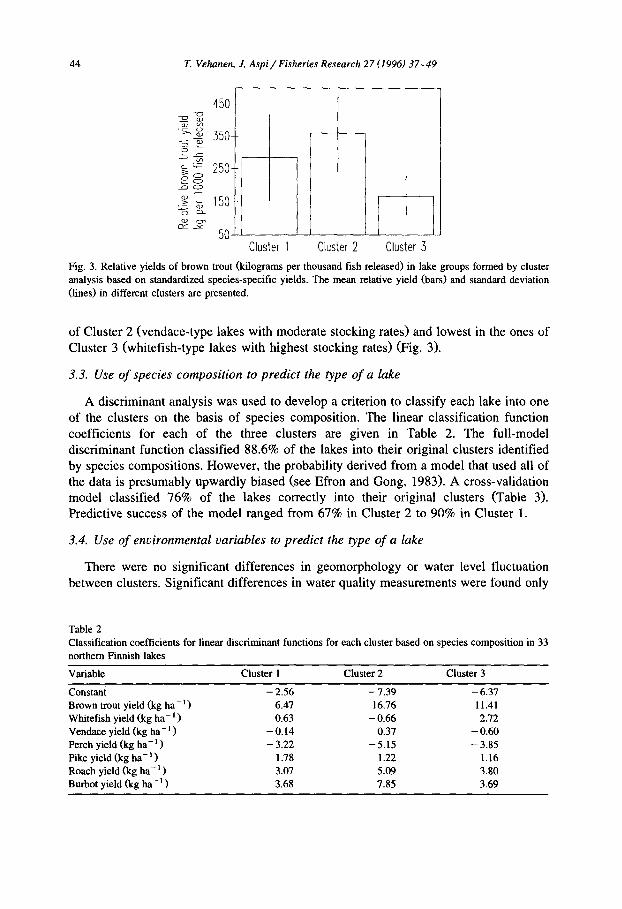
A discriminant analysis was used to develop a criterion to classify each lake into one of the clusters on the basis of species composition. The linear classification function coefficients for each of the three clusters are given in Table 2. The full-model discriminant function classified 88.6% of the lakes into their original clusters identified by species compositions. However, the probability derived from a model that used all of the data is presumably upwardly biased (see Efron and Gong, 1983). A cross-validation model classified 76% of the lakes correctly into their original clusters (Table 3). Predictive success of the model ranged from 67% in Cluster 2 to 90% in Cluster 1.
3.4. Use of environmental variables to predict the type of a lake
There were no significant differences in geomorphology or water level fluctuation between clusters. Significant differences in water quality measurements were found only
Table 2 Clar,sification coefficients for linear discriminant functions for each cluster based on species composition in 33 northern Finnish lakes
Variable Cluster 1 Cluster 2 Cluster 3
Constant - 2.56 -1.39 - 6.37 Brown trout yield (kg ha- ’ ) 6.47 16.76 11.41 Whitefish yield (kg ha- ’ ) 0.63 -0.66 2.12 Vendace yield (kg ha- ’ ) -0.14 0.37 -0.60 Perch yield (kg ha- ’ ) - 3.22 -5.15 - 3.85 Pike yield (kg ha-’ > 1.78 1.22 1.16 Roach yield (kg ha-’ ) 3.07 5.09 3.80 Burbot yield (kg ha-’ 1 3.68 7.85 3.69

7. Vehanen. J. Aspi/ Fisheries Reseurch 27 (I 996) 37-49 45
Table 3 Classification summary from cross-validation of the discriminant functions mode1 used to predict lake cluster based on species composition in 33 northern Finnish lakes
Original cluster Cross-validation cluster Number correct (%I
1 2 3 Total
1 2 3 Total
10 1 0 II 4 10 1 15 1 1 5 7
15 12 6 33
10 (91) 10 (67) 5 (71)
25 (76)
Original clusters were produced by cluster analysis based on standardized yields of seven most common fish species.
Table 4 Characterization of the environmental variables of the three lake clusters formed by cluster analysis on the basis of fish yields of seven most common fish species in 33 northern Finnish lakes
Variable Cluster 1 Cluster 2 Cluster 3 Pseudo-F P
Mean SD Mean SD Mean SD statistic
Surface area (ha) Shoreline development Maximum dept (ml Water level fluctuation (ml Oxygen depletion (%I Conductivity (mS m-’ 1
PH Colour (Pt Mg 1-l ) Total phosphorus ( Kg 1~ ’ ) Total nitrogen ( fig 1 - ’ )
7222 9231 10818 23355 17667 40918 0.38 0.687 0.40 0.15 0.41 0.23 0.44 0.41 0.07 0.932
27.5 13.3 24.2 9.5 34.7 28.3 1.01 0.377 2.50 1.97 1.50 1.35 0.93 0.66 2.64 0.088
92.0 3.8 93.1 2.6 91.6 4.1 0.64 0.535 2.8 0.8 3.6 0.9 3.1 0.6 3.20 0.055 6.8 0.3 7.1 0.3 7.1 0.1 4.48 0.020
60 18 38 20 27 13 8.24 0.014 15 4 14 5 10 3 3.25 0.053
352 109 397 188 328 80 0.61 0.550
Analysis of variance was used to test the hypothesis that all cluster means are equal. For Cluster I, N = I I, Cluster 2, N = 15 and Cluster 3, N = 7.
Table 5 Classification coefficients for linear discriminant functions for each cluster based on ten environmental variables in 33 northern Finnish lakes
Variable Cluster 1 Cluster 2 Cluster 3
Constant Surface area (ha) Shoreline development index Maximum depth (ml Water level fluctuation (ml Oxygen depletion (%I Conductivity (mS m - ’ ) PH Colour (Pt Mg I_ ’ ) Total phosphorus (mg I-‘) Total nitrogencmg I - ’ )
1425 1434 - 1387 -0.0010 -0.cOo9 - 0.0009 38.83 39.39 39.57
1.77 1.72 1.74 - 5.43 -5.89 - 5.77
8.45 8.52 8.19 - 15.16 - 14.46 - 15.54 266 267 266
3.18 3.14 3.06 1.06 1.12 0.99 0.12 0.13 0.12

46 T. Vehanen. J. Aspi/ Fisheries Research 27 (19%) 37-49
Table 6 Classification summary from the discriminant functions model used to predict lake cluster based on ten environmental variables in 33 northern Finnish lakes
Original cluster Classification cluster Number correct (So)
1 2 3 Total
1 8 2 1 11 8 (73) 2 4 10 1 15 10 (67) 3 0 2 5 7 5 (71) Total 12 14 7 33 23 (70)
Original clusters were produced by cluster analysis based on standardized yields of seven most common fish species.
in pH and colour (Table 4). In a priori pairwise comparisons (Tukey’s-test, P < 0.05) the mean colour value was significantly higher in the lakes of Cluster 1 than those in the two other clusters; the mean pH in Cluster 1 was also significantly lower than in Cluster 2. Water quality in the lakes of Cluster 3 indicated oligotrophy with lowest nutrient and colour values of all the three clusters.
A criterion to classify each lake into one of the clusters was developed also for environmental variables by using discriminant analysis. The linear classification function coefficients for each of the three clusters are given in Table 5. The full environmental variable model discriminant analysis classified 70% of the lakes into the original clusters based on species composition (Table 6). This classification success is slightly less than that of the model based on species composition. However, this difference was not statistically significant (Fisher’s Exact Test, P = 0.852). Predictive success of the model ranged from 67% in Cluster 2 to 73% in Cluster 1.
4. Discussion
The cluster analysis based on the yields of the seven most common species generated three clusters, which were classified quite reliably by the disriminant functions. The results suggest that an objective classification scheme can be derived from catch statistics data. Three different lake types were identified: (1) lakes with roach, perch and pike dominating the yield, (2) vendace-lakes with vendace the main fish species in the yield and (3) lakes with whitefish dominating the yield.
All fishing gear employed (here mainly gillnets) are selective, and the yields do not represent accurately the fish community of the lakes. However, it seems that the catch data can be used for the comparisons between the lakes, obviously because fishing gear used are fairly similar in all of them. More effective fishing gear (e.g. fyke nets, seine nets) are used in some of the lakes mainly in catching vendace and whitefish. However, the variation in fish stocks of lakes can also be seen in catch statistics even when effective fishing gears are used, because these fishing gears are useful only where and when the fish stocks are adequately high.

T. Vehanen, J. Aspi/Fisheries Research 27 (1996) 37-49 47
We used only the seven most common species in the present classification, whereas in other studies larger variety of species have been used (Dolman, 1990, SalojPvi and Ekholm, 1990). For example Dolman (1990) used cove-rotenone samples of 20 species to classify Texas reservoirs on the basis of species composition. However, the total yield of the lakes in northern Finland mostly consists of the seven species used in this study. Vendace and whitefish are the main coregonus species, and roach and perch are the main cyprinid and percid fish species in northern Finland. The main predators are burbot, large brown trout and, in particular, pike. Including more species in the analysis would not necessarily increase the amount of information relevant to the classification, and it could, on the other hand, increase random noise due to the small size of the yields.
The lake clusters differed in the success of the brown trout stocking, the relative yield (kilograms per thousand fish stocked) being highest in the cluster where vendace was the dominant catch. Pelagic vendace is an important prey fish in the lakes in northern Finland and the results support the hypothesis that the availability of pelagic prey fish is important for the stocking success of brown trout.
In addition to an indication of the importance of prey fish stocks suggested by the data, the stocking rate of brown trout is probably an important factor affecting variation between the lakes (Vehanen, 19951. Lowest relative yields of brown trout were obtained when high stocking rates were used in a lake group with only an average or low proportion of prey fish (vendace). On the other hand when low stocking rates were used in lake group with a very low vendace proportion, average or even good relative brown trout yields were obtained. The results indicate, that using high stocking rates when prey fish stocks are low, is wasteful management. In order to receive acceptable stocking results, when prey fish densities are low stocking rates should also be kept low.
Our results suggested also that the type of a lake could be predicted both on the basis of biotic (species composition) and abiotic (geomorphology and water quality) factors (Dunson and Travis, 1991). Environmental variables and species compositions were associated with the suggested lake clusters, which is in accordance with the fact that different species present different requirements for their environment. In roach-perch- pike-type lakes (Cluster 1) the water colour was higher, the pH lower than in vendace- and whitefish-lakes. The results are in accordance with the findings of Lind (1983) showing that predators, mainly pike, increase with increasing water colour. Shifts in fish communities from Salmoniformes replaced by percids and cyprinids along the produc- tivity gradient are evident (Persson et al., 1991), and in the present results whitefish-lakes were showing an indication of oligotrophy in water quality.
Lake classification based on catch statistics and environmental variables may be used as a tool giving assistance to management decisions. For example, lake groups lacking or having a small proportion of suitable prey fish (i.e. Clusters 1 and 3) for stocked brown trout could be either stocked with other predatory species or with fewer and larger sized brown trout, which obviously have better possibilities using larger sized prey items. Large stocking rates of brown trout should be used only in lake groups with sustainable stocks of pelagic prey fish (Cluster 2), whereas stocking large amounts of brown trout in lakes where conditions for successful foraging are poor could be considered as wasteful management.
In practice classification of a lake in a cluster could be done on the basis of catch

48 T. Vehanen, J. Aspi/ Fisheries Research 27 (1996) 37-49
inquiry and the discriminant functions presented in Tables 2 and 5. Catch statistics and water quality measurements need to be updated regularly for the detection of the changes. If catch inquiry is done annually variations in the stocks of prey fishes could also be followed. However, changes in the stocks of prey fish (e.g. vendace) can occur rapidly, and forecasting these changes in order to measure the proper stocking rate for brown trout requires extra information about the densities of prey fish stocks, which could be obtained by sampling the annual abundance of prey fish juveniles.
The result offers the management of fisheries some useful guide-lines for the stocking programmes and reduces the need to study every lake in detail. Despite the fact that catch statistics present only a rather coarse picture of the fish community present in a given lake at a given moment, this type of classification on the basis of clustering does fulfil some of the goals expected of a community analysis by Tonn et al. (1983), and it can offer useful assistance so that (1) inappropriate or wasteful management decisions may be avoided and (2) important environmental factors structuring the fish assemblage of a lake may be identified and conveyed to the public to explain why some lakes are suitable for certain management procedures (such as stocking) whereas others are not.
Acknowledgements
This study was supported by the Finnish Power Stations Composition, the Ministry of Agriculture and Forestry, the National Board of Waters and the Environment, the Finnish Forest and Park Service and the Finnish Game and Fisheries Institute.
References
Aldenderfer, M.S. and Blashfield, R.K., 1985. Cluster analysis. Quantitative Applications in the social sciences. Sage University Papers, Sage Publications, London, 87 pp.
Cowx, LG., 1994. Stocking strategies. Fish. Manage. Ecol., I: 15-30. Dolman W.B., 1990. Classification of Texas reservoirs in relation to Iimnology and fish community
compositions. Trans. Am. Fish. Sot., 119: 511-520. Dunson, W.A. and Travis, J., 1991. The role of abiotic factors in community organization. Am. Nat., 138:
1067-1091. Efron, B. and Gong, G., 1983. A leisure look at the bootstrap, the jacknife, and cross-validation. Am. Stat., 37:
36-48. Garman, G.C. and Nielsen, L.A., 1982. Piscivority by stocked brown trout (Saltno rrurta) and its impact on the
nongame fish community on Bottom Creek, Virginia. Can. J. Fish. Aquat. Sci., 39: 862-869. Gauch H.G., 1982. Multivariate analysis in community ecology. Cambridge studies in ecology; I. Cambridge
University Press, Cambridge, 298 pp. Gipson, R.D. and Hubert, W.A., 1991. Factors influencing the body condition of rainbow trout in small
Wyoming reservoirs. J. Fxeshw. Ecol., 6: 327-334. Gunn, J.M., McMurtry, M.J. Bowlby, J.N., Casselman, J.M. and Liimatainen, V.A., 1987. Survival and
growth of stocked lake trout in relation to body size, stocking season, lake acidity, and biomass of competitors. Trans. Am. Fish. Sot. 116: 618-627.
Hubert, W.A. and Guenther, P.M., 1992. Non-salmonid fishes and morphoedaphic features affect abundance of trouts in Wyoming reservoirs. Northwest Sci., 66: 224-228.

T. Vehanen. J. Aspi / Fisheries Research 27 II 996) 37-49 49
Huusko, A., 1990. Kuusinkijoen vesistiiahreen kalatalousselvitys. Finnish Game and Fisheries Research Institute. Kalatutkimuksia-Fiskundersokningar, 14, 238 pp. (In Finnish)
Johnson, M.G., Leach, J.H., Minns, C.K. and Olver, C.H., 1977. Limnological characteristics of Ontario lakes in relation to compositions of walley (Sfizosredion cirreum uirreum), northern pike (Esox Lucius), lake trout (Saluelinus namaycush), and smallmouth bass (Micropferus dolomieui). J. Fish. Res. Board Can., 34: 1592-1601.
Lind, E.A., 1983. Fish yield parameters for fresh- and brackish-water areas of Finland. Rocz. Nauk. Roln.. Seria H, 100: 96-105.
Mutenia, A. and Salonen, E., 1991. Jarvitaimenen ja j’arvilohen velvoiteistutukset, kalastus ja saahit sekP istutustulokset Inarinjarvessl vuosina 1976- 1988. Finnish Game and Fisheries Institute. Kalatutkimuksia -FiskundersGkningar, 22: I-70. (In Finnish)
O’Gorman, R., Bergstedt, R.A. and Eckert, T.H. 1987. Prey fish dynamics and salmonine predator growth in Lake Ontario. Can. J. Fish. Aquat. Sci., 44 (Suppl. 2): 390-403.
Persson, L., Diehl, S., Johansson, L. Andersson, G. and Hamrin, S., 1991. Shifts in fish communities along the productivity gradient-lakes patterns and the importance of size- structured interactions. J. Fish Biol., 38: 281-293.
Plans, W.S., 1980. A plea for fishery habitat classification. Fisheries (Bethesda), 5: 2-6. SaJojarvi. K. and Ekholm, P., 1990. Predicting the efficiency of whitefish (Coregonus lauaretus L. s.1.)
stocking from pre-stocking catch statistics. In: W.L.T van Densen, B. Steinmetz and R.H. Hughes (Editors), Management of Freshwater Fisheries. Pudoc, Wageningen, pp. 112-126.
SAS Institute Inc., 1988. SAS/STAT@ User’s guide, Release 6.03 Edition. Gary, NC, pp. 1028. Tonn, W.M., Magnuson, J.J. and Forbes, A.M., 1983. Community analysis in fishery management; A
application with northern Wisconsin lakes. Trans. Am. Fish. Sot., 112: 368-377. Vehanen, T.,1995. Factors influencing the yield of brown trout, Salmo trutru m. lacustris L. in northern
Finnish lakes. Fish. Manage. Ecol., 2: 121-134. Wetzel, R.G.,1983. Limnology. Saunders College Publishing, New York, 765 pp.