High variability in spawning migration of sea trout, Salmo trutta, in two northern Swedish rivers
Upload
quetimportaCategory
view
8download
0
Population and family structure of brown trout,Salmo trutta, in a Mediterranean stream
Manuel VeraA,B, Nuria SanzA,E, Michael M. HansenC, Ana AlmodovarD
and Jose-Luis Garcıa-MarınA
ALaboratori d’Ictiologia Genetica, Universitat de Girona, Campus Montilivi,
E-17071 Girona, Spain.BCurrent address: Departamento de Xenetica, Facultad Veterinaria, Campus Lugo USC,
E-27002-Lugo, Spain.CDTU Aqua, National Institute of Aquatic Resources, Technical University of Denmark,
Vejlsøvej 39, 8600 Silkeborg, Denmark.DDepartamento de Zoologıa, Facultad de Biologıa, Universidad Complutense de Madrid,
E-28040 Madrid, Jose Antonio Novais 2, Ciudad Universitaria, Spain.ECorresponding author. Email: [email protected]
Abstract. The physical arrangement of closely related individuals is expected to significantly influence the pattern ofpopulation genetic structure. For example, if related individuals are non-randomly distributed and included in samples,this may lead to exaggerated conclusions about genetic differentiation. In the present study, we compared population
structure v. family relationships of brown trout (Salmo trutta L.) along a Mediterranean stream (Pyrenees) by using eightmicrosatellite loci. Results showed low levels of genetic (FST) differentiation between collections in a 6.5-km transectalong the stream, and a significant correlation between genetic and geographical distance matrices, indicating a weakpopulation structure associated with spatial distribution. Our data also indicated that geographical proximity of related
individuals in the youngest (0þ, 1þ) cohorts probably was associated with limited dispersal of younger brown trout fromspawning redds. Family relationships provided evidence, however, for movement of adult trout over distances of a fewkilometres that probably contributed to the low observed differentiation. Dispersal of adult Mediterranean trout contrasts
with the clustering of related older trout observed for some north European rivers and could be related to the reducedproductivity in southern stream basins.
Additional keywords: family reconstruction, fish movement, isolation by distance.
Introduction
Advances in molecular genetics and statistical techniqueshave improved tools for analysis of populations beyond merelydetecting genetic differentiation. Highly polymorphic micro-satellite loci can provide the fine-scale discrimination required
to address questions at the within-population level, includingdescribing family relationships and relatedness among indivi-duals (Ritland 2000; Carlsson et al. 2004; Buston et al. 2007).
In salmonids (Bentzen et al. 2001; Garcıa-Vazquez et al. 2001;Seamons et al. 2004) and other species (Hain and Neff 2007;Neff et al. 2008), mating strategies and relative individual
reproductive success have been examined via parentageassignment. Studies on family relationships have been also usedto evaluate stocking impact on native salmonid populations(Ruzzante et al. 2001) and to examine kinship histories of
individuals to avoid deleterious effects of inbreeding in breedingprograms (Hansen and Jensen 2005; McLean et al. 2008). Fewstudies have, however, used family relationships to investigate
the spatial distribution of individuals at a microgeographical
scale and to understand individual dispersal behaviour (Hansen
et al. 1997; Carlsson and Carlsson 2002; Carlsson et al. 2004).Since Gerking’s (1959) theory on ‘the restricted movement
of resident fish populations’, several studies have supportedthe notion that resident individuals of stream salmonids show
limited movement, whereas others have detected substantialmovement of individuals (review in Gowan et al. 1994; Knouftand Spotila 2002; Hojesjo et al. 2007). These studies also
assessed the mechanisms that cause stream salmonids to moveand showed that, apart from passive dispersal of fry with flow,movements are often associated with individual behaviour. A
complete understanding of individual behaviour within anyanimal group requires understanding the kin structure of agroup. Many species, including some fishes, form groupscomposed of kin (Moller et al. 2006; Hain and Neff 2007).
Several studies of artificially bred sibling groups of juvenilesalmonids, including brown trout (Salmo trutta L.), have shownevidence for kin-biased aggressive behaviour and preference
for sibling groups of juveniles (Brown and Brown 1996; Olsen
CSIRO PUBLISHING
Marine and Freshwater Research, 2010, 61, 676–685 www.publish.csiro.au/journals/mfr
� CSIRO 2010 10.1071/MF09098 1323-1650/10/060676
1999). Nevertheless, studies undertaken in natural settingshave revealed variable patterns of kin-biased behaviour in both
stream- and lake-dwelling salmonids (Carlsson and Carlsson2002; Carlsson et al. 2004; Fraser et al. 2005).
In addition, kin-biased distribution may have consequences
when sampling freshwater fish populations to analyse popula-tion differentiation. In species exhibiting a non-random distri-bution of closely related individuals, sampling of a few families
may lead to overestimation of the observed pattern of structure(Hansen et al. 1997). The age composition of samples may alsoinfluence this pattern of genetic population structure if youngand adult individuals show different dispersal patterns.
In the present study, we investigated family relationships ofbrown trout populations to determine whether they consist ofaggregates of close relatives or alternatively display random
distributions of related individuals. Comparisons of populationstructure v. family relationships were used to infer the extent ofbrown trout dispersal patterns. Such comparisons were made for
each cohort to evaluate whether distribution and movementpatterns of related individuals depend on age.
Material and methods
Samples
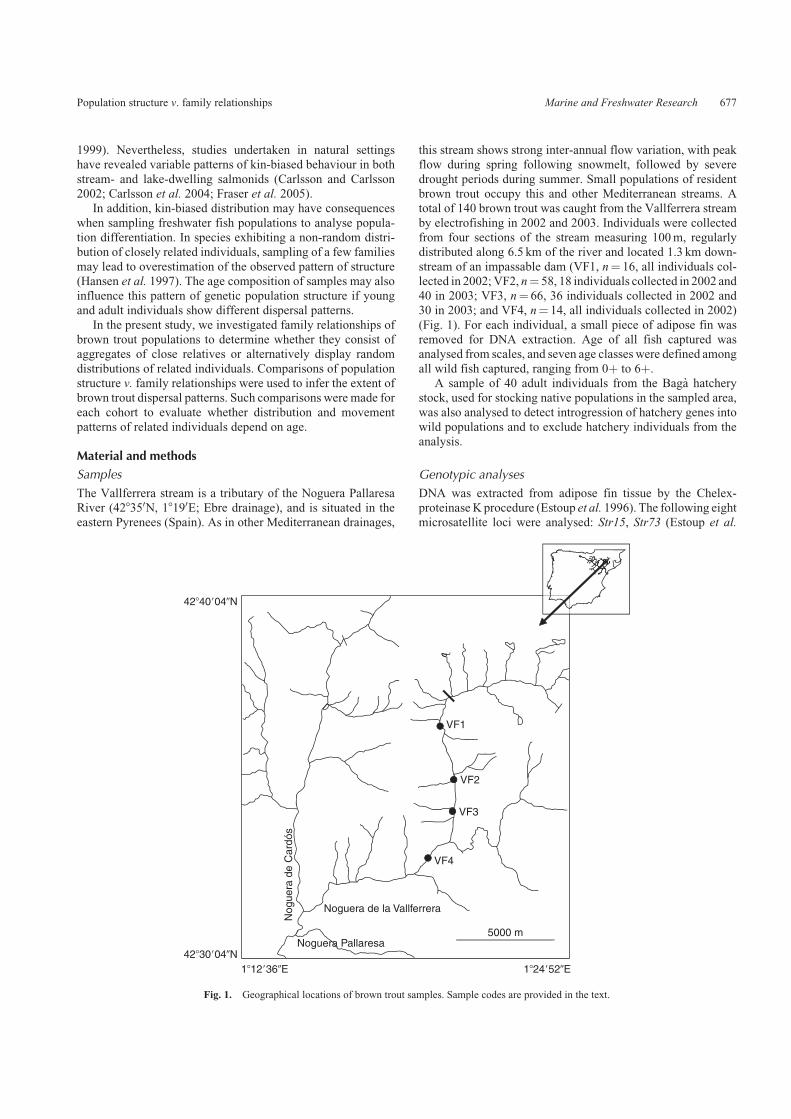
The Vallferrera stream is a tributary of the Noguera PallaresaRiver (428350N, 18190E; Ebre drainage), and is situated in theeastern Pyrenees (Spain). As in other Mediterranean drainages,
this stream shows strong inter-annual flow variation, with peakflow during spring following snowmelt, followed by severe
drought periods during summer. Small populations of residentbrown trout occupy this and other Mediterranean streams. Atotal of 140 brown trout was caught from the Vallferrera stream
by electrofishing in 2002 and 2003. Individuals were collectedfrom four sections of the stream measuring 100m, regularlydistributed along 6.5 km of the river and located 1.3 km down-
stream of an impassable dam (VF1, n¼ 16, all individuals col-lected in 2002;VF2, n¼ 58, 18 individuals collected in 2002 and40 in 2003; VF3, n¼ 66, 36 individuals collected in 2002 and30 in 2003; and VF4, n¼ 14, all individuals collected in 2002)
(Fig. 1). For each individual, a small piece of adipose fin wasremoved for DNA extraction. Age of all fish captured wasanalysed from scales, and seven age classes were defined among
all wild fish captured, ranging from 0þ to 6þ.A sample of 40 adult individuals from the Baga hatchery
stock, used for stocking native populations in the sampled area,
was also analysed to detect introgression of hatchery genes intowild populations and to exclude hatchery individuals from theanalysis.
Genotypic analyses
DNA was extracted from adipose fin tissue by the Chelex-proteinaseK procedure (Estoup et al. 1996). The following eightmicrosatellite loci were analysed: Str15, Str73 (Estoup et al.
Noguera Pallaresa
VF1
VF2
VF3
VF4
Noguera de la Vallferrera
Nog
uera
de
Car
dós
5000 m
1�12�36�E 1�24�52�E
42�40�04�N
42�30�04�N
Fig. 1. Geographical locations of brown trout samples. Sample codes are provided in the text.
Population structure v. family relationships Marine and Freshwater Research 677
1993), T3–13 (Estoup et al. 1998), Ssa85, Ssa197 (O’Reillyet al. 1996), SsHaeIII14.20 (J. L. Goodier, unpubl. data, Gen-
Bank Accession number U10050), SsoSL417 (Slettan et al.
1995) and SsoSL438 (Slettan et al. 1996). Details on the PCRconditions used are provided in Hansen (2002). For each locus,
allele size was determined using Allele Locator software(Amersham Pharmacia Biotech, Piscataway NJ, USA).
Gene diversity within and among locations
For eachcollection, aBayesianMarkovChainMonteCarlo-based
approach method was implemented using STRUCTURE v2.1 soft-ware (Pritchard et al. 2000) to assess the extent of hatchery geneintrogression by estimating individual admixture coefficients.
This estimates the proportion of an individual’s genome derivedfrom native v. hatchery trout, respectively. Estimates were cal-culated incorporating data from the Baga sample as the hatchery
baseline and assuming an admixture model with two populations(hatchery and native), where hatchery individuals were forcedto be non-admixed, and where allelic frequencies in wild and
hatchery trout were independent. Individuals with a proportion ofhatchery genomegreater than90%were considered pure hatcheryfish and excluded from the subsequent analyses.
Analysis of genetic variation and population structure were
investigated from the 2002 collections. Estimates of geneticvariation in samples included mean unbiased expected hetero-zygosity (HS) and allelic richness (A) using pop100 gene (http://
www.ensam.inra.fr/URLB/pop100gene/pop100gene.html, ver-ified May 2010) and FSTAT (Goudet 1995) software. For eachcollection, genotypic distributions were tested for conformance
to Hardy–Weinberg expectations by using GENEPOP v3.3(Raymond andRousset 1995). Significance levels were adjustedby applying the sequential Bonferroni technique (Rice 1989).
Fisher exact tests for genetic differentiation per locus and
between all sample pairs were computed using GENEPOP v3.3.In all cases of multiple tests, significance levels were adjusted byusing the sequential Bonferroni technique. Population structure
was inferred by estimating the number of populations (K) over allpresent genotypes by using a Bayesian approach implemented inthe STRUCTURE v2.1 software. STRUCTURE was tested withK¼ 1–4
populations by using an admixture model with correlated allelefrequencies (FST¼ 0.01). The number of populations representedby the four wild collections was estimated according to Garnier
et al. (2004).Nei’s estimators of gene diversity and differentiationwere used to assess genetic differentiation among samples. Inaddition,Weir andCockerhamestimatorswith1000permutationsevaluated FST values and their significance for all population
pairs. All estimates were computed by using FSTAT. The geneticrelationships among pairs of samples were further assessed withCavalli–Sforza chord distance (Cavalli-Sforza and Edwards
1967). A Mantel’s test with 1000 random permutations fromthe NTSYSpc 2.11 software (Rohlf 1993) was used to test forisolation by distance. For that, we compared geographical dis-
tance among pairs of samples, with genetic differences estimatedby pairwise FST values and Cavalli–Sforza chord distance.
Family structure
To study family relationships, all samples collected in 2002 and
2003 were pooled and individuals grouped into cohorts (from
cohort 1998 to cohort 2002). Additional older cohorts wereexcluded from analyses because of the reduced number of
individuals. A hierarchical analysis of molecular variance(AMOVA) was used to quantify the degree of differentiationamong cohorts related to geographical differences among
locations, usingArlequin 2.000 software (Schneider et al. 2000).Family relationships among individuals within cohorts were
estimated by calculating a ‘two-genes’ relatedness coefficient
(r) and a ‘four-genes’ relatedness coefficient (h, fraternitycoefficient, Wang 2002) with SPAGeDi v1.2 software (Hardyand Vekemans 2002). All individuals were pooled to determinethe baseline. Following Hansen and Jensen (2005), we com-
pared the distribution of observed pairwise relationship coeffi-cients to that expected in a sample of simulated unrelatedindividuals from a population with the same allele frequencies.
For each cohort, this was achieved by simulating 250 unrelatedindividuals from all genotypes with HYBRIDLAB v1.0 software(Nielsen et al. 2006). Comparisons between real and simulated
pairwise coefficients were undertaken using a Mann–WhitneyU-test implemented in the SPSS 15.0 package.
The randomness of relative distributions among locationswas assessed for each cohort. Thus, relationship coefficients for
individual pairs from the same location (intra) were comparedwith coefficients estimated between individuals from differentlocations (inter) by using aMann–WhitneyU-test. Additionally,
we used the permutation program PERM 1.0 (Duchesne et al.
2006) to test for a correlation between population structure andfamily distribution. This program is designed to detect grouping
factors or correlates statistically by randomly permuting speci-mens across groups within a collection of groups while preser-ving all original data as well as group sizes. We ran the program
with 100 permutations and 10 iterations to estimate the P-value.COLONY 1.2 software (Wang 2004) was used to infer family
relationships among individuals. All sampled individuals werepartitioned into full-sib families nested within half-sib families,
without information on parental genotypes. We assumed anerror rate of 2% for all loci, caused by allelic drop-outs anderroneous sizing of alleles. In this case, the random distribution
of full-sib and half-sib families among locations was testedusing the Fisher’s exact test in SPSS 15.0.
Results
Hatchery exclusion, gene diversity and population structure
Estimates of introgression based on the admixture coefficient in
STRUCTURE were not significant (qo 0.01) for most collections,except for VF3 (q¼ 0.026). A single individual from this VF3showed a genome proportion from the hatchery higher than 0.90
(q¼ 0.995) and was considered to be of first-generation hatch-ery origin and therefore excluded from further analyses. Esti-mates of gene diversity ranged from HS¼ 0.634 in VF2 to
HS¼ 0.664 in VF3. Estimates of allelic richness were similarin all samples, with values ranging from 5.252 in VF1 to 5.605in VF3. Comparable estimates of genetic diversity have been
reported in other Mediterranean brown trout populations(Poteaux et al. 1999; Sanz et al. 2009). Significant deviationsfrom Hardy–Weinberg equilibrium at the 5% significance levelwere observed in five of 32 tests. Only three tests were sig-
nificant after Bonferroni correction, two at the Str73 locus
678 Marine and Freshwater Research M. Vera et al.

(in VF1 and VF3, Po 0.001 for both) and the third at theSsoSL417 locus (in VF3, Po 0.001). Of 28 gametic dis-
equilibrium tests conducted, only one in VF1 (P¼ 0.001) and asecond in VF2 (Po 0.001) remained significant after Bonfer-roni correction, involving different pairs of loci.
Nei’s estimators of gene diversity and population differen-tiation indicated that only 1.8% (GST¼ 0.018) of total genediversity (HT¼ 0.659) was due to differences among locations.
Low FST values were observed between most pairs of samples(range: 0.009–0.033), with only very small significant(P¼ 0.049) differentiation evident between VF2 and VF4.Isolation by distance was not detected when geographical
distance was compared with pairwise FST values in a Mantel’stest. Similarly, STRUCTURE suggested a single geneticallyhomogeneous group (K¼ 1, mean lnP¼�1872; K¼ 2, mean
lnP¼ –1912; K¼ 3, mean lnP¼�2175) when all 2002 collec-tions were pooled. Fisher’s exact tests of genetic differentiation,however, detected significant (P¼ 0.004) differences between
VF1 and VF4 as well as between VF1 and VF3 (P¼ 0.007)that persisted after Bonferroni correction. These minor geneticdifferences resulted in a matrix of Cavalli–Sforza geneticdistance that reflected significant, albeit low, spatial differentia-
tion among sampled populations (Table 1). In this case, isolationby distance was confirmed by significant correlation betweengenetic and geographical distance (r¼ 0.932, P¼ 0.021) in a
Mantel’s test.
Family relationships
Hierarchical analysis of molecular variance (AMOVA)
assigned most genetic differentiation to differences amonglocations within cohorts (FLC¼ 3.48%, P¼ 0.013), with nosignificant differences detected among cohorts (FCT¼ 0%,
P¼ 0.435).Relatedness coefficients (r, Wang 2002) among individuals
within cohorts were significantly (Po 0.001, in all cases) lowerthan those expected among simulated unrelated individuals
in all cohorts, except the oldest cohort (P¼ 0.053) (1998). Incontrast, fraternity coefficients (h) were significantly (in allcases Po 0.001) higher between real than between simulated
individuals in all cohorts, except for the oldest cohort(P¼ 0.088) (Fig. 2).
Results of a Mann–Whitney U-test and the permutation
program PERM to test correlations between family and popula-tion structure were similar and showed few significant differ-ences between intra- and inter-location pairwise relatedness (r)
and fraternity (h) coefficients. In all significant cases, except for
VF3, differences reflected higher average relatedness coeffi-cients between individuals within locations compared with
between individuals from different locations (Table 2).Family reconstruction with COLONY 1.2 was consistent
among replicates. The oldest cohorts (1998 and 1999) showed
a similar family structure, with 14–15 full-sib families nestedwithin nine half-sib families, whereas younger cohorts (2000,2001 and 2002) showed a family structure composed of 27 or 28
full-sib families nested within 12–14 half-sib families. Familysizes were small, ranging from one to three individuals, withlarger families observed in the youngest cohorts (Fig. 3). Ana-lysis of variance failed to detect significant differences among
cohorts, however, when the average number of full-sibs (KFS)and half-sibs (KHS) were compared (P¼ 0.344, P¼ 0.127,respectively). Given that sample sizes of the oldest cohorts were
lower, this may imply that some family groups were lost ratherthan a reduction in all family sizes over time. A Fisher’s exacttest indicated that families of older age classes were distributed
randomly among the sampled locations (in all cases P4 0.05).Nevertheless, this test also supported a non-random geographi-cal distribution of full- and half-sib families in the 2001 cohort(P¼ 0.047,P¼ 0.042, respectively) and for the half-sib families
in the 2002 cohort (P¼ 0.001).
Discussion
Limited dispersal of brown trout
Analyses of population structure indicated a low degree of
spatial genetic differentiation. Nevertheless, weak isolation bydistance was evident among populations. This suggests thatindividual dispersal distances of brown trout in the Vallferrera
streams are limited. In salmonids, patterns of isolation by dis-tance are common at large geographical scales (Sanz et al. 2000)and have been also observed at micro-geographical scales(Carlsson et al. 1999). Thus, genetically differentiated popula-
tions can coexist even without any apparent physical barriersto dispersal. For example, sympatric populations of brown trouthave been found in Lough Melvin, Ireland (Ferguson and
Taggart 1991). Several studies have indicated that in these cases,specific fish behaviours, including preferences for distinctivespawning habitats or different life-history forms, can produce
the reproductive isolation necessary to maintain discretebreeding units (Ferguson and Taggart 1991; Olsen et al. 1996;Theriault et al. 2007). Thus, some correlations between differentbehavioural traits and genetic structure can be expected
(Carlsson et al. 1999). In our study area, lack of waterfalls orother physical barriers to dispersal by brown trout in the targetstream suggests that other mechanisms are likely to be respon-
sible for the limited structure observed. Although the distribu-tions of related individuals along the Vallferrera stream wererandom in the oldest cohorts, our data also showed that related
individuals in the youngest cohorts were found in closerproximity than expected by chance. A wide range of fishes hasbeen reported to show kin-biased behaviours, including reduced
aggressiveness and increased food-sharing among relatives. Inbrown trout, kin-biased behaviour has been reported in experi-mental stocks of young brown trout (Olsen et al. 1996), and inAtlantic populations under natural conditions at any age class
(Carlsson et al. 2004).
Table 1. Genetic distance and multilocus FST estimates between pairs
of samples
Above diagonal: Cavalli–Sforza chord distance. Below diagonal: FST
estimates with significant values over 1000 permutations, *Po 0.05
VF1 VF2 VF3 VF4
VF1 – 0.0290 0.0332 0.0393
VF2 0.0225 – 0.0258 0.0355
VF3 0.0094 0.0224 – 0.0299
VF4 0.0141 0.0333* 0.0110 –
Population structure v. family relationships Marine and Freshwater Research 679

0
0.025
0.05
0.075
0.1
0.125
�1 �0.75�0.5�0.250 0.25 0.5 0.75 1Relatedness
�1 �0.75�0.5�0.250 0.25 0.5 0.75 1Relatedness
�1 �0.75�0.5�0.250 0.25 0.5 0.75 1Relatedness
�1 �0.75�0.5�0.25 0 0.25 0.5 0.75 1Relatedness
�1 �0.75�0.5�0.25 0 0.25 0.5 0.75 1Relatedness
Fre
quen
cyF
requ
ency
Fre
quen
cyF
requ
ency
Fre
quen
cy
�1�0.75�0.5�0.25 0.25 0.5 0.750
0.05
0.1
0.15
0.2
0 1Fraternity
�1 �0.75�0.5�0.25 0.25 0.5 0.750 1Fraternity
�1�0.75�0.5�0.25 0.25 0.5 0.750 1Fraternity
�1 �0.75 �0.5 �0.25 0.25 0.5 0.750 1Fraternity
�1 �0.75�0.5�0.25 0.25 0.5 0.750 1Fraternity
Fre
quen
cyF
requ
ency
Fre
quen
cyF
requ
ency
Fre
quen
cy
0
0.025
0.05
0.075
0.1
0.125
0
0.1
0.2
0.3
0.4
0.5
0
0.025
0.05
0.075
0.1
0.125
0
0.05
0.1
0.15
0.2
0
0.025
0.05
0.075
0.1
0.125
0
0.05
0.1
0.15
0.2
0
0.025
0.05
0.075
0.1
0.125
0
0.05
0.1
0.15
0.2
1998
1999
2000
2001
2002
Fig. 2. Frequency distributions of pairwise relatedness and fraternity coefficients between individuals (Wang 2002). The curves denote frequency
distributions of pairwise values between 250 simulated unrelated individuals, whereas bars denote the frequencies of observed relationship values.
680 Marine and Freshwater Research M. Vera et al.

The association observed here is probably too weak to be aconsequence of kin-biased behaviour; otherwise, we would
expect kin-biased association also in adult individuals. Therewill obviously be a very high association of kin among eggs andfry in spawning redds. After emergence from redds, this asso-
ciation is expected to decay over time as juveniles disperse. Thisis the null hypothesis against which kin-biased behaviouralassociation (i.e. hypotheses invoking kin selection) should be
tested (Carlsson et al. 2004). Limited dispersal from spawningredds, leading to a high relatedness among neighbouring juve-nile brown trout, has been observed in Atlantic brown troutpopulations (Hansen et al. 1997; Carlsson et al. 2004). Our data
confirm a similar phenomenon in Mediterranean brown trout,where the observation of kin association in younger, but notolder, trout conformswith the patterns expected under a scenario
of continuous dispersal from spawning redds.
Environmental conditions shaping brown troutdispersal patterns
The spatial distribution of individual salmonids in wild streams,with respect to relatedness, is likely to be influenced by indivi-dual age. On hatching and until 1 year ormore of age, little up- or
downstreammovement of fry is expected in brown trout (Elliott1994). Older fish, however, show strong density-dependentmortality and these result in high individual competition and a
reduction in the numbers of surviving individuals from each
family. Furthermore, fish tend to move to new and perhapsdeeper parts of the river (Elliott 1994; Gowan et al. 1994). The
relatively low numbers of individuals detected in the oldestcohorts (1998–1999) and the random distribution of relatedindividuals in these cohorts reflect this demographic process.
Studies using mark–recapture and telemetry methods havedemonstrated that most stream-dwelling salmonids, includingbrown trout, are relatively sedentary, with the limitedmovement
within locations associated with competition for profitableforaging sites (Knouft and Spotila 2002; Hojesjo et al. 2007;Lobon-Cervia 2009). For instance, Knouft and Spotila (2002)concluded that a high percentage of resident stream brown trout
remained in the same 800m of the stream throughout the year.Within-location movement of less than 100m was reported byHojesjo et al. (2007) for adult resident brown trout in a Swedish
river. No published studies are available for movement patternsof brown trout in the Mediterranean region. Data from mark–recapture methods in the study region (A. Almodovar, unpubl.
results), however, show that 79% of recaptured fish were caughtwithin 600m of sites where they were originally stocked andshowed a maximum displacement of 600m upstream and6200m downstream from this point. Mean rate of trout move-
ment coincides with sedentary behaviour observed in otherrivers (Cresswell 1981; Hesthagen and Johnsen 1989), wherethe movement direction was predominantly downstream
(Helfrich and Kendall 1982).
Table 2. Average pairwise relatedness and fraternity coefficients (Wang 2002) between individual pairs from the same location (intra) and between
individual pairs from different locations (inter) estimated for each cohort and location
n, sample size. Correlation between population and family distribution was estimated with theMann–WhitneyU-test/permutation program PERM (Duchesne
et al. 2006); n.s., not significant; *Po 0.05; ***Po 0.001
Cohort locality (n) Relatedness coefficient Fraternity coefficient
Intra Inter Correlation Intra Inter Correlation
1998 0.0391 �0.0182 n.s./n.s. 0.0187 0.0341 n.s./n.s.
VF1 (5) 0.054 �0.025 n.s./n.s. 0.130 0.052 n.s./n.s.
VF2 (4) �0.061 �0.049 n.s./n.s. 0.058 0.002 n.s./n.s.
VF3 (8) 0.059 0.004 n.s./n.s. �0.033 0.038 n.s./n.s.
VF4 (2) �0.068 �0.007 n.s./n.s. 0.109 0.042 n.s./n.s.
1999 �0.0034 �0.0968 n.s./n.s. 0.0546 0.0802 n.s./n.s.
VF1 (6) �0.056 �0.070 n.s./n.s. 0.062 0.086 n.s./n.s.
VF2 (5) 0.101 �0.127 n.s./* 0.030 0.077 n.s./n.s.
VF3 (3) �0.089 �0.077 n.s./n.s. 0.099 0.093 n.s./n.s.
VF4 (1) – – – – – –
2000 �0.0848 �0.0919 n.s./n.s. 0.0886 0.0813 n.s./n.s.
VF1 (3) �0.100 �0.110 n.s./n.s. 0.262 0.109 */*
VF2 (15) 0.021 �0.087 ***/* 0.074 0.088 n.s./n.s.
VF3 (15) �0.197 �0.109 ***/n.s. 0.105 0.090 n.s./n.s.
VF4 (6) �0.035 �0.059 n.s./n.s. 0.038 0.039 n.s./n.s.
2001 �0.1075 �0.0841 n.s./n.s. 0.0993 0.0672 n.s./*
VF1 (2) �0.150 �0.086 n.s./n.s. 0.043 0.032 n.s./n.s.
VF2 (12) 0.065 �0.081 ***/*** 0.194 0.082 ***/***
VF3 (19) �0.179 �0.094 ***/n.s. 0.066 0.073 n.s./n.s.
VF4 (4) 0.025 �0.063 n.s./n.s. 0.005 0.035 n.s./n.s.
2002 �0.0306 �0.0506 n.s./n.s. 0.0351 0.0322 n.s./n.s.
VF1 (0) – – – – – –
VF2 (18) �0.012 �0.051 n.s./n.s. 0.006 0.032 n.s./n.s.
VF3 (19) �0.047 �0.051 n.s./n.s. 0.061 0.032 n.s./n.s.
VF4 (0) – – – – – –
Population structure v. family relationships Marine and Freshwater Research 681

In the current study, the extensive and largely randomdistribution of sibling individuals in different locations of thestream suggests that adult brown trout often move several
kilometres from their natal site. These results contrast with thosefound in a river in Sweden, where associations were detectedamong related older trout (Carlsson and Carlsson 2002). Greater
movement by Mediterranean brown trout than some Atlanticstocks may be due to extreme habitat conditions that promote
high competition among adult individuals, forcing them todisperse to find profitable feeding areas. Ecological studies ofthe Vallferrera stream detected a very low primary productivity
in this river, and indicated that food was a limiting resource forbrown trout (Rocaspana et al. 2006). Such environmental factorsmay also be responsible for small family sizes and the relatively
low number of individuals detected in our Mediterraneanpopulations, compared with equivalent populations in Denmark
KFS � 1.27 (0.21)KHS � 2.11 (1.36)
1999
KFS � 1.07 (0.07)KHS � 1.67 (0.50)
2000
KFS � 1.41 (0.40)KHS � 3.17 (2.88)
HS1
FS1 FS2
HS6
FS11FS3
HS2
FS8FS7
HS4HS3
FS5 FS6FS4
HS5
FS10FS9
HS7
FS12
HS8
FS13
HS9
FS14 FS15
HS1
FS1
HS2
FS3 FS4FS2
HS3
FS6FS5
HS4
FS7
HS5
FS8
HS6
FS10FS9
HS7
FS12FS11
HS8
FS13
HS9
FS14
HS3
FS7FS6 FS9 FS10FS8
HS1
FS2 FS3FS1
HS2
FS4 FS5
HS4 HS5
FS12 FS13FS11
HS6
FS14
HS8
FS18 FS19
HS7
FS15 FS17FS16
HS9
FS20 FS23FS22FS21
HS10
FS24
HS11
FS26FS25
HS12
FS27
Fig. 3. Distribution of individuals into full-sib families (FS) nestedwith half-sib families (HS), by using the softwareCOLONY 1.2 (Wang 2004).&,’,J and� symbols indicate individuals fromVF1,VF2,VF3 andVF4 locations, respectively. For each cohort,KFS,KHS, the number of full-sibs and the number of half-
sibs, with its variance in the parentheses, are indicated.
682 Marine and Freshwater Research M. Vera et al.

(Hansen and Jensen 2005). Extensive movement by individuals
throughout the river may therefore produce low levels of geneticdifferentiation among sites. At the same time, more sedentarybehaviour by younger individuals may explain the limitedpattern of isolation by distance observed here.
These observations also imply that if a population is sampledby catching fish only from a short river stretch and if this samplecontains a large proportion of fry, then this involves a consider-
able risk of sampling individuals representing only one or afew families. Consequently, estimates of allele frequencies ofthe population may be biased, leading to exaggerated or even
erroneous conclusions regarding genetic differentiation. Thus,the recommendation is to sample adult individuals or, alterna-tively, to sample juveniles over longer river stretches (Hansenet al. 1997).
Mating system inferred from individual relationships
Pairwise relatedness (r) and fraternity (h) coefficients providevaluable information on populations’ mating systems. In an
outbreeding population, r and h are expected to be 0.5 and 0,
respectively, for parents and offspring, 0.5 and 0.25, respec-
tively, for full-sibs and 0.125 and 0, respectively, for half-sibs.In our study, pairwise relationship coefficients estimated withSPAGeDi software indicated an excess of low relatedness values(r) among real individuals compared with values from unrelated
simulated genotypes. Relatedness of offspring strongly dependson the inbreeding relationship of their parents. Low values ofrelationship are expected when parents are not related and
higher values are expected under a high inbreeding scenario.Thus, low relatedness values in cohorts from the Vallferrerastream indicate that parents are unrelated and may reflect the
presence in the samples of adult immigrants from differentpopulations from non-studied areas.
Alternatively, results of pairwise fraternity coefficients (h)were significantly higher between real rather than simulated
genotypes in all but the oldest cohort, suggesting the presenceof some full-sib individuals, and this was supported by resultsobtainedusingCOLONY.Additionally, the presenceof several half-
sib families detected within cohorts by using COLONY may haveresulted from multiple paternities, as described in other brown
2001
KFS � 1.37 (0.32)KHS � 3.08 (2.27)
2002
KFS � 1.28 (0.21)KHS � 2.64 (3.17)
HS1
FS3FS1 FS2
HS2
FS5FS4
HS3
FS6 FS8FS7
HS4
FS10FS9
HS5
FS12FS11
HS6
FS13 FS15 FS14
HS7
FS17 FS18 FS16
HS8
FS19
HS10
FS23
HS9
FS22FS20 FS21
HS1
FS1 FS4FS3FS2 FS5 FS6
HS2
FS7 FS9 FS8
HS3
FS10 FS12 FS11
HS4
FS13
HS5
FS15FS14 FS16
HS6
FS17
HS7
FS19 FS20FS18
HS8
FS22FS21
HS9
FS23
HS10
FS24
HS11
FS25
HS12
FS27FS26
HS13
FS28
HS14
FS29
Fig. 3. (Continued )
Population structure v. family relationships Marine and Freshwater Research 683

trout populations where more than a singlemale had fertilised theeggs of individual females (Garcıa-Vazquez et al. 2001).
Conclusions
In the Vallferrera stream, kin-biased aggregation of juvenilebrown trout was observed. This result implies that analysis ofgenetic population structure inferred from highly polymorphic
markers (microsatellites), at least in part, can be influenced byfamily relationships. Family relationships also provided evi-dence for greater movement by adult trout that occurs over
distances of at least a few kilometres. This is likely to contributeto the observed low spatial genetic differentiation. Dispersal ofadult Mediterranean trout contrasts with observations in some
rivers from northern Europe for the same species and could berelated to lower primary productivity in southern basins. Finally,our results show that combining genetic structure and family
relationship data can be a useful approach for assessing move-ment patterns of brown trout and other species in streams andcould complement information obtained using mark–recaptureand radio-telemetry methods.
Acknowledgements
This research meets the objectives of the REN-2003-05931/GLO project of
the Spanish MCYT. The authors thank K. L. D. Mensberg and D. Meldrup
for their technical support. Microsatellite loci were genotyped at DTUAqua
duringM.Vera’s visit.M.Verawas supported by a fellowship of the Spanish
MCYT. We thank Professor Boulton, Dr Mather and an anonymous referee
for many useful comments and suggestions on the paper. This work is in
accordance with all ethical guidelines and legal requirements of Spain. We
thank DGMN of the Autonomous Government of Catalonia for sampling
permission.
References
Bentzen, P., Olsen, J. B., McLean, J. E., Seamons, T. R., and Quinn, T. P.
(2001). Kinship analysis of Pacific salmon: insights into mating, hom-
ing, and timing of reproduction. The Journal of Heredity 92, 127–136.
doi:10.1093/JHERED/92.2.127
Brown, G. E., and Brown, J. A. (1996). Kin discrimination in salmonids.
Reviews in Fish Biology and Fisheries 6, 201–219. doi:10.1007/
BF00182343
Buston, P. M., Bogdanowicz, S. M., Wong, A., and Harrison, R. G. (2007).
Are clownfish groups composed of close relatives? An analysis of
microsatellite DNA variation in Amphiprion percula. Molecular Ecol-
ogy 16, 3671–3678. doi:10.1111/J.1365-294X.2007.03421.X
Carlsson, J., and Carlsson, J. E. L. (2002). Micro-scale distribution of brown
trout: an opportunity for kin selection? Ecology of Freshwater Fish 11,
234–239. doi:10.1034/J.1600-0633.2002.00017.X
Carlsson, J., Carlsson, J. E. L., Olsen, K. H., Hansen, M. M., Eriksson, T.,
and Nilsson, J. (2004). Kin-biased distribution in brown trout: an effect
of redd location or kin recognition? Heredity 92, 53–60. doi:10.1038/
SJ.HDY.6800376
Carlsson, J., Olsen, K. H., Nilsson, J., Øverli, Ø., and Stabell, O. B. (1999).
Microsatellites reveal fine-scale genetic structure in stream-living brown
trout. Journal of Fish Biology 55, 1290–1303. doi:10.1111/J.1095-8649.
1999.TB02076.X
Cavalli-Sforza, L. L., and Edwards, A. W. F. (1967). Phylogenetic analysis:
models and estimation procedures. Evolution 21, 550–570. doi:10.2307/
2406616
Cresswell, R. C. (1981). Post-stockingmovements and recapture of hatchery
trout released into flowing water – a review. Journal of Fish Biology 18,
429–442. doi:10.1111/J.1095-8649.1981.TB03784.X
Duchesne, P., Etienne, C., and Bernatchez, L. (2006). PERM: a computer
program to detect structuring factors in social units.Molecular Ecology
Notes 6, 965–967. doi:10.1111/J.1471-8286.2006.01414.X
Elliott, J. M. (1994). ‘Quantitative Ecology and the Brown Trout.’ (Oxford
University Press: Oxford, UK.)
Estoup, A., Presa, P., Krieg, F., Vaiman,D., andGuyomard, R. (1993). (CT)nand (GT)n microsatellites: a new class of genetic markers for Salmo
trutta L. (brown trout). Heredity 71, 488–496. doi:10.1038/HDY.
1993.167
Estoup, A., Largiader, C. R., Perrot, E., and Chourrout, D. (1996). Rapid
one-tube DNA extraction for reliable PCR detection of fish polymorphic
markers and transgenes. Molecular Marine Biology and Biotechnology
5, 295–298.
Estoup, A., Rousset, F.,Michalakis, Y., Cornuet, J.M., Adriamanga,M., and
Guyomard,R. (1998).Comparative analysis ofmicrosatellite and allozyme
markers: a case study investigating microgeographic differentiation in
brown trout (Salmo trutta). Molecular Ecology 7, 339–353. doi:10.1046/
J.1365-294X.1998.00362.X
Ferguson, A., and Taggart, J. B. (1991). Genetic differentiation among the
sympatric brown trout (Salmo trutta) populations of Lough Melvin,
Ireland. Biological Journal of the Linnean Society. Linnean Society of
London 43, 221–237. doi:10.1111/J.1095-8312.1991.TB00595.X
Fraser, D. J., Duchesne, P., and Bernatchez, L. (2005). Migratory charr
schools exhibit population and kin associations beyond juvenile stages.
Molecular Ecology 14, 3133–3146. doi:10.1111/J.1365-294X.2005.
02657.X
Garcıa-Vazquez, E., Moran, P., Martınez, J. L., Perez, J., de Gaudemar, B.,
and Beall, E. (2001). Alternative mating strategies in Atlantic salmon
and brown trout. The Journal of Heredity 92, 146–149. doi:10.1093/
JHERED/92.2.146
Garnier, S., Alibert, P., Audiot, P., Prieur, B., and Rasplus, J. Y. (2004).
Isolation by distance and sharp discontinuities in gene frequencies:
implications for the phylogeography of an alpine insect species,Carabus
solieri. Molecular Ecology 13, 1883–1897. doi:10.1111/J.1365-294X.
2004.02212.X
Gerking, S. D. (1959). The restricted movement of fish populations.
Biological Reviews of the Cambridge Philosophical Society 34,
221–242. doi:10.1111/J.1469-185X.1959.TB01289.X
Goudet, J. (1995). Fstat version 1.2: a computer program to calculate
F-statistics. The Journal of Heredity 86, 485–486.
Gowan, C., Young, M. K., Fausch, K. D., and Riley, S. C. (1994). Restricted
movement in resident stream salmonids: a paradigm lost? Canadian
Journal of Fisheries Management 51, 2626–2637. doi:10.1139/F94-262
Hain, T. J. A., and Neff, B. D. (2007). Multiple paternity and kin recognition
mechanisms in a guppy population.Molecular Ecology 16, 3938–3946.
doi:10.1111/J.1365-294X.2007.03443.X
Hansen, M. M. (2002). Estimating the long-term effects of stocking
domesticated trout into wild brown trout (Salmo trutta) populations:
an approach using microsatellite DNA analysis of historical and con-
temporary samples. Molecular Ecology 11, 1003–1015. doi:10.1046/
J.1365-294X.2002.01495.X
Hansen, M. M., and Jensen, L. F. (2005). Sibship within samples of brown
trout (Salmo trutta) and implications for supportive breeding.Conserva-
tion Genetics 6, 297–305. doi:10.1007/S10592-004-7827-5
Hansen, M. M., Nielsen, E. E., and Mensberg, K. L. D. (1997). The problem
of sampling families rather than populations: relatedness among indivi-
duals in samples of juvenile brown trout Salmo trutta L. Molecular
Ecology 6, 469–474. doi:10.1046/J.1365-294X.1997.T01-1-00202.X
Hardy, O. P., and Vekemans, X. (2002). SPAGeDI: a versatile computer
program to analyse spatial genetic structure at the individual or popula-
tion levels. Molecular Ecology Notes 2, 618–620. doi:10.1046/J.1471-
8286.2002.00305.X
Helfrich, L. A., and Kendall, W. T. (1982). Movements of hatchery-reared
rainbow, brook and brown trout stocked in a Virginia Mountain stream.
684 Marine and Freshwater Research M. Vera et al.

Progressive Fish-Culturist 44, 3–7. doi:10.1577/1548-8659(1982)44
[3:MOHRBA]2.0.CO;2
Hesthagen, T. B., and Johnsen, B. O. (1989). Survival and growth of summer
and autumn stocked 0þ brown trout, Salmo truttaL., in a mountain lake.
Aquaculture and Fisheries Management 20, 329–332.
Hojesjo, J., Økland, F., Sundstrom, L. F., Pettersson, J., and Johnsson, J. I.
(2007).Movement and home range in relation to dominance; a telemetry
study on brown trout Salmo trutta. Journal of Fish Biology 70, 257–268.
doi:10.1111/J.1095-8649.2006.01299.X
Knouft, J. H., and Spotila, J. R. (2002).Assessment ofmovements of resident
stream brown trout, Salmo trutta L., among contiguous sections of
stream. Ecology of Freshwater Fish 11, 85–92. doi:10.1034/J.1600-
0633.2002.110203.X
Lobon-Cervia, J. (2009). Why, when and how do fish populations decline,
collapse and recover? The example of brown trout (Salmo trutta) in Rio
Chaballos (northwestern Spain). Freshwater Biology 54, 1149–1162.
doi:10.1111/J.1365-2427.2008.02159.X
McLean, J. E., Seamons, T. R., Dauer, M. B., Bentzen, P., and Quinn, T. P.
(2008). Variation in reproductive success and effective number of
breeders in a hatchery population of steelhead trout (Oncorhynchus
mykiss): examination by microsatellite-based parentage analysis. Con-
servation Genetics 9, 295–304. doi:10.1007/S10592-007-9340-0
Moller, L. M., Beheregaray, L. B., Allen, S. J., and Harcourt, R. G. (2006).
Association patterns and kinship in female Indo-Pacific bottlenose
dolphins (Tursiops aduncus) of southeastern Australia. Behavioral Ecol-
ogy and Sociobiology 61, 109–117. doi:10.1007/S00265-006-0241-X
Neff, B. D., Pitcher, T. E., and Ramnarine, I. W. (2008). Inter-population
variation in multiple paternity and reproductive skew in the guppy.
Molecular Ecology 17, 2975–2984. doi:10.1111/J.1365-294X.2008.
03816.X
Nielsen, E. E., Bach, L. A., and Kotlicki, P. (2006). HYBRIDLAB (version 1.0):
a program for generating simulated hybrids from population samples.
Molecular Ecology Notes 6, 971–973. doi:10.1111/J.1471-8286.2006.
01433.X
Olsen, K. H. (1999). Present knowledge of kin discrimination in salmonids.
Genetica 104, 295–299. doi:10.1023/A:1026413404363
Olsen, K. H., Jarvi, T., and Lof, A. C. (1996). Agressiveness and kinship
in brown trout (Salmo trutta) parr. Behavioral Ecology 7, 445–450.
doi:10.1093/BEHECO/7.4.445
O’Reilly, P. T., Hamilton, L. C.,McConnell, S. K., andWright, J.M. (1996).
Rapid analysis of genetic variation in Atlantic salmon (Salmo salar) by
PCR multiplexing of dinucleotide and tetranucleotide microsatellites.
Canadian Journal of Fisheries and Aquatic Sciences 53, 2292–2298.
doi:10.1139/CJFAS-53-10-2292
Poteaux, C., Bonhomme, F., and Berrebi, P. (1999). Microsatellite poly-
morphism and genetic impact of restocking in Mediterranean brown
trout (Salmo trutta L.).Heredity 82, 645–653. doi:10.1046/J.1365-2540.
1999.00519.X
Pritchard, J. K., Stephens, M., and Donnelly, P. (2000). Inference of
population structure using multilocus genotype data. Genetics 155,
945–959.
Raymond, M., and Rousset, F. (1995). GENEPOP (version 3.3): population
genetics software for exact test and ecumenicism. The Journal of
Heredity 86, 248–249.
Rice, W. R. (1989). Analyzing tables of statistical tests. Evolution 43,
223–225. doi:10.2307/2409177
Ritland, K. (2000). Marker-inferred relatedness as a tool for detecting
heritability in nature. Molecular Ecology 9, 1195–1204. doi:10.1046/
J.1365-294X.2000.00971.X
Rocaspana, R., Cia, I., Arevalo, J. A., Escue, A., Pou, J., and Pou, C. (2006).
‘Estudi de laMida de la Truita en Zones d’AltaMuntanya de Catalunya.’
(Direccio General del Medi Natural, Departament de Medi Ambient i
Habitatge, Generalitat de Catalunya: Spain.)
Rohlf, F. J. (1993). ‘NTSYSpc 2.1. Numerical Taxonomy and Multivariate
Analysis System.’ (Setauket: New York.)
Ruzzante, D. E., Hansen, M. M., and Meldrup, D. (2001). Distribution of
individual inbreeding coefficients, relatedness and influence of stocking
on native anadromous brown trout (Salmo trutta) population structure.
Molecular Ecology 10, 2107–2128. doi:10.1046/J.1365-294X.2001.
01352.X
Sanz, N., Garcıa-Marın, J. L., and Pla, C. (2000). Divergence of brown trout
(Salmo trutta): evolution within glacial refugia. Canadian Journal of
Fisheries and Aquatic Sciences 57, 2201–2210. doi:10.1139/CJFAS-57-
11-2201
Sanz, N., Araguas, R. M., Fernandez, R., Vera, M., and Garcıa-Marın,
J. L. (2009). Efficiency of markers and methods for detecting hybrids
and introgression in stocked populations. Conservation Genetics 10,
225–236. doi:10.1007/S10592-008-9550-0
Schneider, S., Roessli, D., and Excoffier, L. (2000). ‘Arlequin, Version
2.000: A Software for Populations Genetics Data Analysis.’ (Genetics
and Biometry Laboratory, University of Geneva: Geneva, Switzerland.)
Seamons, T. R., Bentzen, P., and Quinn, T. P. (2004). The mating system
of steelhead, Oncorhynchus mykiss, inferred by molecular analysis of
parents and progeny. Environmental Biology of Fishes 69, 333–344.
doi:10.1023/B:EBFI.0000022893.88086.8F
Slettan, A., Olsaker, I., and Lie, Ø. (1995). Atlantic salmon, Salmo salar,
microsatellites at the SSOSL25, SSOSL85, SSOSL311, SSOSL417 loci.
Animal Genetics 26, 281–282.
Slettan, A., Olsaker, I., and Lie, Ø. (1996). Polymorphic Atlantic salmon
(Salmo salar L.) microsatellites at the SSOSL438, SSOSL439 and
SSOSL444 loci. Animal Genetics 27, 57–58.
Theriault, V., Bernatchez, L., and Dodson, J. J. (2007). Mating system and
individual reproductive success of sympatric anadromous and resident
brook charr, Salvelinus fontinalis, under natural conditions. Behavioral
Ecology and Sociobiology 62, 51–65. doi:10.1007/S00265-007-0437-8
Wang, J. L. (2002). An estimator for pairwise relatedness using molecular
markers. Genetics 160, 1203–1215.
Wang, J. L. (2004). Sibship reconstruction from genetic data with typing
errors. Genetics 166, 1963–1979. doi:10.1534/GENETICS.166.4.1963
Manuscript received 28 August 2009, accepted 11 December 2009
http://www.publish.csiro.au/journals/mfr
Population structure v. family relationships Marine and Freshwater Research 685
Copyright © 2022 FDOKUMEN