Investigation of Genius Loci Theory on Historic Commercial ...
Upload
independentCategory
view
1download
0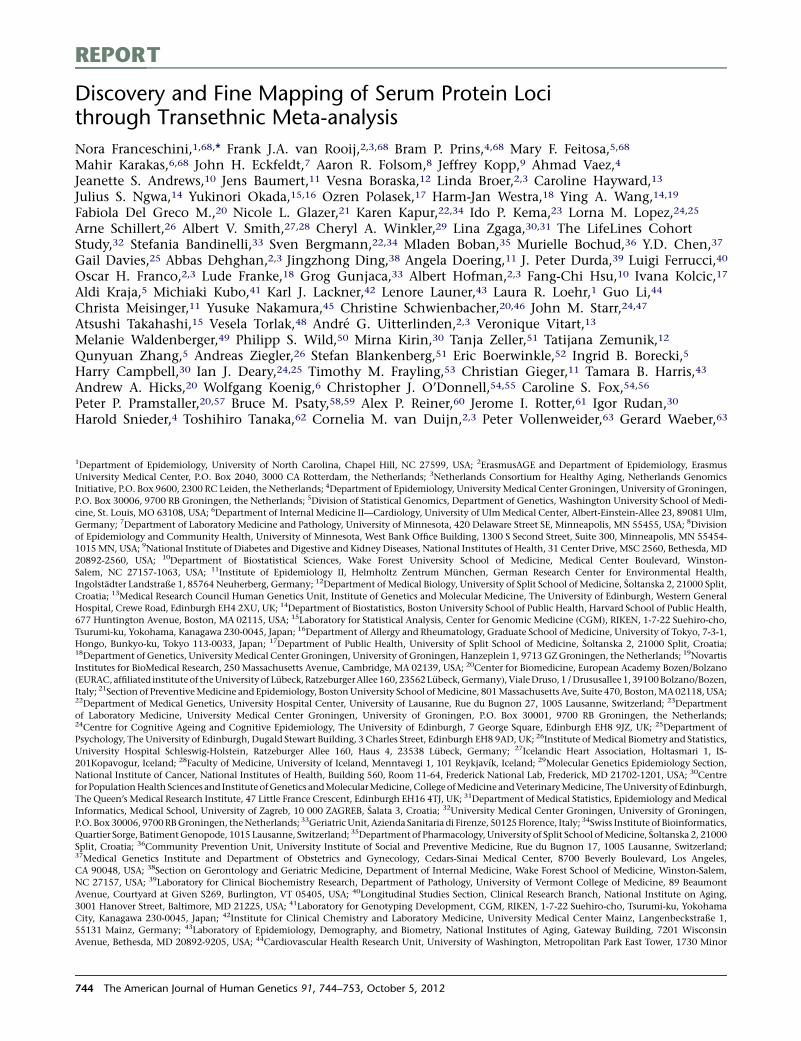
REPORT
Discovery and Fine Mapping of Serum Protein Locithrough Transethnic Meta-analysis
Nora Franceschini,1,68,* Frank J.A. van Rooij,2,3,68 Bram P. Prins,4,68 Mary F. Feitosa,5,68
Mahir Karakas,6,68 John H. Eckfeldt,7 Aaron R. Folsom,8 Jeffrey Kopp,9 Ahmad Vaez,4
Jeanette S. Andrews,10 Jens Baumert,11 Vesna Boraska,12 Linda Broer,2,3 Caroline Hayward,13
Julius S. Ngwa,14 Yukinori Okada,15,16 Ozren Polasek,17 Harm-Jan Westra,18 Ying A. Wang,14,19
Fabiola Del Greco M.,20 Nicole L. Glazer,21 Karen Kapur,22,34 Ido P. Kema,23 Lorna M. Lopez,24,25
Arne Schillert,26 Albert V. Smith,27,28 Cheryl A. Winkler,29 Lina Zgaga,30,31 The LifeLines CohortStudy,32 Stefania Bandinelli,33 Sven Bergmann,22,34 Mladen Boban,35 Murielle Bochud,36 Y.D. Chen,37
Gail Davies,25 Abbas Dehghan,2,3 Jingzhong Ding,38 Angela Doering,11 J. Peter Durda,39 Luigi Ferrucci,40
Oscar H. Franco,2,3 Lude Franke,18 Grog Gunjaca,33 Albert Hofman,2,3 Fang-Chi Hsu,10 Ivana Kolcic,17
Aldi Kraja,5 Michiaki Kubo,41 Karl J. Lackner,42 Lenore Launer,43 Laura R. Loehr,1 Guo Li,44
Christa Meisinger,11 Yusuke Nakamura,45 Christine Schwienbacher,20,46 John M. Starr,24,47
Atsushi Takahashi,15 Vesela Torlak,48 Andre G. Uitterlinden,2,3 Veronique Vitart,13
Melanie Waldenberger,49 Philipp S. Wild,50 Mirna Kirin,30 Tanja Zeller,51 Tatijana Zemunik,12
Qunyuan Zhang,5 Andreas Ziegler,26 Stefan Blankenberg,51 Eric Boerwinkle,52 Ingrid B. Borecki,5
Harry Campbell,30 Ian J. Deary,24,25 Timothy M. Frayling,53 Christian Gieger,11 Tamara B. Harris,43
Andrew A. Hicks,20 Wolfgang Koenig,6 Christopher J. O’Donnell,54,55 Caroline S. Fox,54,56
Peter P. Pramstaller,20,57 Bruce M. Psaty,58,59 Alex P. Reiner,60 Jerome I. Rotter,61 Igor Rudan,30
Harold Snieder,4 Toshihiro Tanaka,62 Cornelia M. van Duijn,2,3 Peter Vollenweider,63 Gerard Waeber,63
1Department of Epidemiology, University of North Carolina, Chapel Hill, NC 27599, USA; 2ErasmusAGE and Department of Epidemiology, Erasmus
University Medical Center, P.O. Box 2040, 3000 CA Rotterdam, the Netherlands; 3Netherlands Consortium for Healthy Aging, Netherlands Genomics
Initiative, P.O. Box 9600, 2300 RC Leiden, the Netherlands; 4Department of Epidemiology, University Medical Center Groningen, University of Groningen,
P.O. Box 30006, 9700 RB Groningen, the Netherlands; 5Division of Statistical Genomics, Department of Genetics, Washington University School of Medi-
cine, St. Louis, MO 63108, USA; 6Department of Internal Medicine II—Cardiology, University of UlmMedical Center, Albert-Einstein-Allee 23, 89081 Ulm,
Germany; 7Department of Laboratory Medicine and Pathology, University of Minnesota, 420 Delaware Street SE, Minneapolis, MN 55455, USA; 8Division
of Epidemiology and Community Health, University of Minnesota, West Bank Office Building, 1300 S Second Street, Suite 300, Minneapolis, MN 55454-
1015 MN, USA; 9National Institute of Diabetes and Digestive and Kidney Diseases, National Institutes of Health, 31 Center Drive, MSC 2560, Bethesda, MD
20892-2560, USA; 10Department of Biostatistical Sciences, Wake Forest University School of Medicine, Medical Center Boulevard, Winston-
Salem, NC 27157-1063, USA; 11Institute of Epidemiology II, Helmholtz Zentrum Munchen, German Research Center for Environmental Health,
Ingolstadter Landstraße 1, 85764 Neuherberg, Germany; 12Department of Medical Biology, University of Split School of Medicine, �Soltanska 2, 21000 Split,
Croatia; 13Medical Research Council Human Genetics Unit, Institute of Genetics and Molecular Medicine, The University of Edinburgh, Western General
Hospital, Crewe Road, Edinburgh EH4 2XU, UK; 14Department of Biostatistics, Boston University School of Public Health, Harvard School of Public Health,
677 Huntington Avenue, Boston, MA 02115, USA; 15Laboratory for Statistical Analysis, Center for Genomic Medicine (CGM), RIKEN, 1-7-22 Suehiro-cho,
Tsurumi-ku, Yokohama, Kanagawa 230-0045, Japan; 16Department of Allergy and Rheumatology, Graduate School of Medicine, University of Tokyo, 7-3-1,
Hongo, Bunkyo-ku, Tokyo 113-0033, Japan; 17Department of Public Health, University of Split School of Medicine, �Soltanska 2, 21000 Split, Croatia;18Department of Genetics, UniversityMedical Center Groningen, University of Groningen, Hanzeplein 1, 9713 GZGroningen, the Netherlands; 19Novartis
Institutes for BioMedical Research, 250 Massachusetts Avenue, Cambridge, MA 02139, USA; 20Center for Biomedicine, European Academy Bozen/Bolzano
(EURAC, affiliated instituteof theUniversityof Lubeck, RatzeburgerAllee 160, 23562Lubeck,Germany),VialeDruso, 1 /Drususallee1, 39100Bolzano/Bozen,
Italy; 21Section of PreventiveMedicine and Epidemiology, BostonUniversity School ofMedicine, 801Massachusetts Ave, Suite 470, Boston,MA02118,USA;22Department of Medical Genetics, University Hospital Center, University of Lausanne, Rue du Bugnon 27, 1005 Lausanne, Switzerland; 23Department
of Laboratory Medicine, University Medical Center Groningen, University of Groningen, P.O. Box 30001, 9700 RB Groningen, the Netherlands;24Centre for Cognitive Ageing and Cognitive Epidemiology, The University of Edinburgh, 7 George Square, Edinburgh EH8 9JZ, UK; 25Department of
Psychology, The University of Edinburgh, Dugald Stewart Building, 3 Charles Street, Edinburgh EH8 9AD, UK; 26Institute ofMedical Biometry and Statistics,
University Hospital Schleswig-Holstein, Ratzeburger Allee 160, Haus 4, 23538 Lubeck, Germany; 27Icelandic Heart Association, Holtasmari 1, IS-
201Kopavogur, Iceland; 28Faculty of Medicine, University of Iceland, Menntavegi 1, 101 Reykjavık, Iceland; 29Molecular Genetics Epidemiology Section,
National Institute of Cancer, National Institutes of Health, Building 560, Room 11-64, Frederick National Lab, Frederick, MD 21702-1201, USA; 30Centre
for PopulationHealth Sciences and Institute ofGenetics andMolecularMedicine,CollegeofMedicine andVeterinaryMedicine, TheUniversityof Edinburgh,
The Queen’s Medical Research Institute, 47 Little France Crescent, Edinburgh EH16 4TJ, UK; 31Department of Medical Statistics, Epidemiology andMedical
Informatics, Medical School, University of Zagreb, 10 000 ZAGREB, �Salata 3, Croatia; 32University Medical Center Groningen, University of Groningen,
P.O. Box 30006, 9700RBGroningen, theNetherlands; 33GeriatricUnit, Azienda Sanitaria di Firenze, 50125 Florence, Italy; 34Swiss Institute of Bioinformatics,
Quartier Sorge, BatimentGenopode, 1015 Lausanne, Switzerland; 35Department of Pharmacology,University of Split School ofMedicine, �Soltanska 2, 21000
Split, Croatia; 36Community Prevention Unit, University Institute of Social and Preventive Medicine, Rue du Bugnon 17, 1005 Lausanne, Switzerland;37Medical Genetics Institute and Department of Obstetrics and Gynecology, Cedars-Sinai Medical Center, 8700 Beverly Boulevard, Los Angeles,
CA 90048, USA; 38Section on Gerontology and Geriatric Medicine, Department of Internal Medicine, Wake Forest School of Medicine, Winston-Salem,
NC 27157, USA; 39Laboratory for Clinical Biochemistry Research, Department of Pathology, University of Vermont College of Medicine, 89 Beaumont
Avenue, Courtyard at Given S269, Burlington, VT 05405, USA; 40Longitudinal Studies Section, Clinical Research Branch, National Institute on Aging,
3001 Hanover Street, Baltimore, MD 21225, USA; 41Laboratory for Genotyping Development, CGM, RIKEN, 1-7-22 Suehiro-cho, Tsurumi-ku, Yokohama
City, Kanagawa 230-0045, Japan; 42Institute for Clinical Chemistry and Laboratory Medicine, University Medical Center Mainz, Langenbeckstraße 1,
55131 Mainz, Germany; 43Laboratory of Epidemiology, Demography, and Biometry, National Institutes of Aging, Gateway Building, 7201 Wisconsin
Avenue, Bethesda, MD 20892-9205, USA; 44Cardiovascular Health Research Unit, University of Washington, Metropolitan Park East Tower, 1730 Minor
744 The American Journal of Human Genetics 91, 744–753, October 5, 2012

James F. Wilson,30 Jacqueline C.M. Witteman,2,3 Bruce H.R. Wolffenbuttel,64 Alan F. Wright,13
Qingyu Wu,65 Yongmei Liu,66 Nancy S. Jenny,39 Kari E. North,1 Janine F. Felix,2,3,68
Behrooz Z. Alizadeh,4,68 L. Adrienne Cupples,14,54,68 John R.B. Perry,53,68 and Andrew P. Morris67,68,*
Many disorders are associated with altered serum protein concentrations, including malnutrition, cancer, and cardiovascular, kidney,
and inflammatory diseases. Although these protein concentrations are highly heritable, relatively little is known about their underlying
genetic determinants. Through transethnicmeta-analysis of European-ancestry and Japanese genome-wide association studies, we iden-
tified six loci at genome-wide significance (p < 5 3 10�8) for serum albumin (HPN-SCN1B, GCKR-FNDC4, SERPINF2-WDR81,
TNFRSF11A-ZCCHC2, FRMD5-WDR76, and RPS11-FCGRT, in up to 53,190 European-ancestry and 9,380 Japanese individuals) and three
loci for total protein (TNFRS13B, 6q21.3, and ELL2, in up to 25,539 European-ancestry and 10,168 Japanese individuals). We observed
little evidence of heterogeneity in allelic effects at these loci between groups of European and Japanese ancestry but obtained substantial
improvements in the resolution of fine mapping of potential causal variants by leveraging transethnic differences in the distribution of
linkage disequilibrium. We demonstrated a functional role for the most strongly associated serum albumin locus, HPN, for which Hpn
knockout mice manifest low plasma albumin concentrations. Other loci associated with serum albumin harbor genes related to ribo-
some function, protein translation, and proteasomal degradation, whereas those associated with serum total protein include genes
related to immune function. Our results highlight the advantages of transethnic meta-analysis for the discovery and fine mapping of
complex trait loci and have provided initial insights into the underlying genetic architecture of serum protein concentrations and their
association with human disease.
Albumin, the major plasma protein, transports endoge-
nous and exogenous compounds such as nutrients,
hormones, metabolic catabolites, and drugs andmaintains
intravascular volume by generating oncotic pressure.
Diverse conditions, including cancer, liver and kidney
diseases, and acute and chronic inflammatory states,
manifest reduced plasma albumin concentrations. Low
plasma albumin is associated with increased risk of cardio-
vascular disease1 and mortality.2 Gamma globulins, the
second most abundant type of plasma protein, are
composed primarily of immunoglobulins (Ig), the effector
arm of humoral immunity. Dysregulation of Ig may result
from altered production in infectious and autoimmune
diseases and in immunodeficiency syndromes and from
increased loss in kidney disease.3 To date, little is known
about the genetic regulation of plasma proteins, and the
pathophysiologic mechanisms leading to low albumin
concentrations in many acute and chronic disease condi-
tions remain obscure. Genetic tools may allow for the
Ave, Suite 1360, Seattle, WA 98101, USA; 45Laboratory of Molecular Medicine,
4-6-1 Shirokanedai, Minato-ku, Tokyo 108-8639, Japan; 46Department of Exp
Italy; 47Alzheimer Scotland Dementia Research Centre, Department of Psycho
EH89JZ,UK; 48UniversityHospital Split,�Soltanska2, 21000 Split,Croatia; 49Rese
Center for Environmental Health, Ingolstadter Landstraße 1, 85764 Neuherber
Langenbeckstraße 1, 55131 Mainz, Germany; 51University Heart Center Ham
20246 Hamburg, Germany; 52Center for Human Genetics and Division of Ep
Pressler, Houston, TX 77030, USA; 53Genetics of Complex Traits, Peninsul
UK; 54National Heart, Lung, and Blood Institute (NHLBI) FraminghamHeart Stu
ham, MA 01702-5827, USA; 55Cardiology Division, Department of Medicine
Boston, MA 02114, USA; 56Center for Populations Studies, NHLBI, 73 Mt. W
Neurology, General Central Hospital, 39100 Bolzano, Italy; 58Cardiovascular H
Services, University ofWashington, Metropolitan Park East Tower, 1730Minor
Group Health Cooperative, 1730 Minor Ave, Suite 1600, Seattle, WA 98101-144
of Washington, Box 357236, Seattle, WA 98195, USA; 61Medical Genetics Inst
Angeles, CA 90048, USA; 62Laboratory for Cardiovascular Diseases, CGM, RIK
Japan; 63Internal Medicine Department, Lausanne University Hospital, Rue du
University Medical Center Groningen, University of Groningen, Hanzeplein 1,
& Hypertension Lerner Research Institute, Cleveland Clinic, 9500 Euclid Aven
tion, Wake Forest University School of Medicine, Medical Center Boulevard, W
Genetics, University of Oxford, Roosevelt Drive, Oxford OX3 7BN, UK68These authors contributed equally to this work
*Correspondence: [email protected] (N.F.), [email protected] (A.P.M.)
http://dx.doi.org/10.1016/j.ajhg.2012.08.021. �2012 by The American Societ
The Americ
discovery of pathways in the metabolism, regulation,
and/or disease processes associated with changes in these
proteins and may provide insights into the immune
system, cancer, inflammatory diseases, and malnutrition.
Serum albumin heritability estimates range from 0.36 to
0.77 in family and twin studies.4–7 Recent genome-wide
association studies (GWASs) of populations of eastern
Asian ancestry have revealed genetic loci contributing to
variation in blood protein concentrations: GCKR (MIM
600842)-FNDC4 (MIM 611905) to serum albumin,8
TNFRSF13B (MIM 604907) to total protein,8 and RPS11
(MIM 180471)-FCGRT (MIM 601437) to both traits.8,9
These associations have not been previously examined in
other ancestry groups, and much of the heritability of
blood protein concentrations remains unexplained. To
bridge this gap in our understanding of the genetic archi-
tecture of serum protein concentrations, we began by per-
forming a meta-analysis of European-ancestry GWASs for
albumin and total protein. Subsequently, we combined
Human Genome Center, Institute of Medical Science, University of Tokyo,
erimental and Diagnostic Medicine, University of Ferrara, 44121 Ferrara,
logy, The University of Edinburgh, Room G24, 7 George Square, Edinburgh
archUnit of Epidemiology,Helmholtz ZentrumMunchen,GermanResearch
g, Germany; 50Department of Medicine II, University Medical Center Mainz,
burg, Clinic for General and Interventional Cardiology, Martinistraße 52,
idemiology, School of Public Health, University of Houston, 1200 Herman
a Medical School, University of Exeter, Barrack Road, Exeter EX2 5DW,
dy, Division of Intramural Research, 73Mt.Wayte Avenue, Suite 2, Framing-
, Massachusetts General Hospital, Harvard Medical School, 55 Fruit Street,
ayte Ave, Suite 2, Framingham, MA 01702-5827, USA; 57Department of
ealth Research Unit, Departments of Medicine, Epidemiology, and Health
Ave, Suite 1360, Seattle, WA 98101, USA; 59Group Health Research Institute,
8, USA; 60Department of Epidemiology, School of Public Health, University
itute, Cedars-Sinai Medical Center, 8700 Beverly Boulevard, Suite 400, Los
EN, 1-7-22 Suehiro-cho, Tsurumi-ku, Yokohama City, Kanagawa 230-0045,
Bugnon 46, 1011 Lausanne, Switzerland; 64Department of Endocrinology,
9713 GZ Groningen, the Netherlands; 65Molecular Cardiology/Nephrology
ue, Cleveland, OH 44195, USA; 66Department of Epidemiology and Preven-
inston-Salem, NC 27157-1063, USA; 67Wellcome Trust Centre for Human
y of Human Genetics. All rights reserved.
an Journal of Human Genetics 91, 744–753, October 5, 2012 745
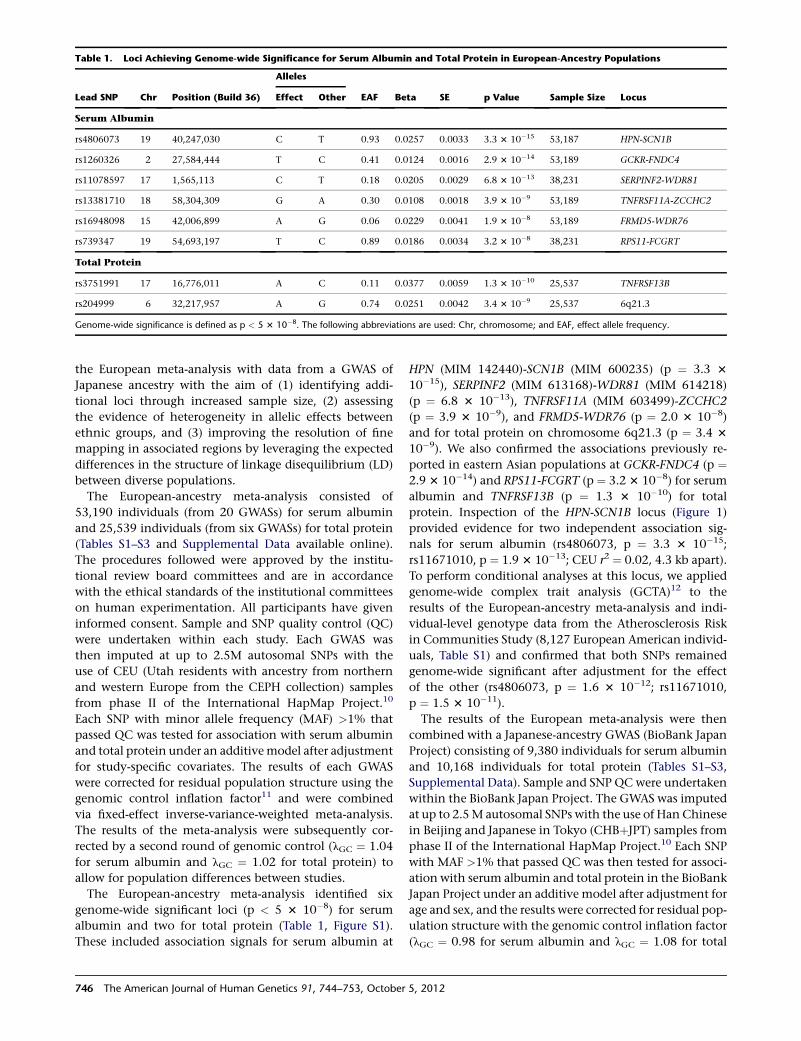
Table 1. Loci Achieving Genome-wide Significance for Serum Albumin and Total Protein in European-Ancestry Populations
Lead SNP Chr Position (Build 36)
Alleles
EAF Beta SE p Value Sample Size LocusEffect Other
Serum Albumin
rs4806073 19 40,247,030 C T 0.93 0.0257 0.0033 3.3 3 10�15 53,187 HPN-SCN1B
rs1260326 2 27,584,444 T C 0.41 0.0124 0.0016 2.9 3 10�14 53,189 GCKR-FNDC4
rs11078597 17 1,565,113 C T 0.18 0.0205 0.0029 6.8 3 10�13 38,231 SERPINF2-WDR81
rs13381710 18 58,304,309 G A 0.30 0.0108 0.0018 3.9 3 10�9 53,189 TNFRSF11A-ZCCHC2
rs16948098 15 42,006,899 A G 0.06 0.0229 0.0041 1.9 3 10�8 53,189 FRMD5-WDR76
rs739347 19 54,693,197 T C 0.89 0.0186 0.0034 3.2 3 10�8 38,231 RPS11-FCGRT
Total Protein
rs3751991 17 16,776,011 A C 0.11 0.0377 0.0059 1.3 3 10�10 25,537 TNFRSF13B
rs204999 6 32,217,957 A G 0.74 0.0251 0.0042 3.4 3 10�9 25,537 6q21.3
Genome-wide significance is defined as p < 5 3 10�8. The following abbreviations are used: Chr, chromosome; and EAF, effect allele frequency.
the European meta-analysis with data from a GWAS of
Japanese ancestry with the aim of (1) identifying addi-
tional loci through increased sample size, (2) assessing
the evidence of heterogeneity in allelic effects between
ethnic groups, and (3) improving the resolution of fine
mapping in associated regions by leveraging the expected
differences in the structure of linkage disequilibrium (LD)
between diverse populations.
The European-ancestry meta-analysis consisted of
53,190 individuals (from 20 GWASs) for serum albumin
and 25,539 individuals (from six GWASs) for total protein
(Tables S1–S3 and Supplemental Data available online).
The procedures followed were approved by the institu-
tional review board committees and are in accordance
with the ethical standards of the institutional committees
on human experimentation. All participants have given
informed consent. Sample and SNP quality control (QC)
were undertaken within each study. Each GWAS was
then imputed at up to 2.5M autosomal SNPs with the
use of CEU (Utah residents with ancestry from northern
and western Europe from the CEPH collection) samples
from phase II of the International HapMap Project.10
Each SNP with minor allele frequency (MAF) >1% that
passed QC was tested for association with serum albumin
and total protein under an additivemodel after adjustment
for study-specific covariates. The results of each GWAS
were corrected for residual population structure using the
genomic control inflation factor11 and were combined
via fixed-effect inverse-variance-weighted meta-analysis.
The results of the meta-analysis were subsequently cor-
rected by a second round of genomic control (lGC ¼ 1.04
for serum albumin and lGC ¼ 1.02 for total protein) to
allow for population differences between studies.
The European-ancestry meta-analysis identified six
genome-wide significant loci (p < 5 3 10�8) for serum
albumin and two for total protein (Table 1, Figure S1).
These included association signals for serum albumin at
746 The American Journal of Human Genetics 91, 744–753, October
HPN (MIM 142440)-SCN1B (MIM 600235) (p ¼ 3.3 3
10�15), SERPINF2 (MIM 613168)-WDR81 (MIM 614218)
(p ¼ 6.8 3 10�13), TNFRSF11A (MIM 603499)-ZCCHC2
(p ¼ 3.9 3 10�9), and FRMD5-WDR76 (p ¼ 2.0 3 10�8)
and for total protein on chromosome 6q21.3 (p ¼ 3.4 3
10�9). We also confirmed the associations previously re-
ported in eastern Asian populations at GCKR-FNDC4 (p ¼2.9 3 10�14) and RPS11-FCGRT (p ¼ 3.2 3 10�8) for serum
albumin and TNFRSF13B (p ¼ 1.3 3 10�10) for total
protein. Inspection of the HPN-SCN1B locus (Figure 1)
provided evidence for two independent association sig-
nals for serum albumin (rs4806073, p ¼ 3.3 3 10�15;
rs11671010, p ¼ 1.9 3 10�13; CEU r2 ¼ 0.02, 4.3 kb apart).
To perform conditional analyses at this locus, we applied
genome-wide complex trait analysis (GCTA)12 to the
results of the European-ancestry meta-analysis and indi-
vidual-level genotype data from the Atherosclerosis Risk
in Communities Study (8,127 European American individ-
uals, Table S1) and confirmed that both SNPs remained
genome-wide significant after adjustment for the effect
of the other (rs4806073, p ¼ 1.6 3 10�12; rs11671010,
p ¼ 1.5 3 10�11).
The results of the European meta-analysis were then
combined with a Japanese-ancestry GWAS (BioBank Japan
Project) consisting of 9,380 individuals for serum albumin
and 10,168 individuals for total protein (Tables S1–S3,
Supplemental Data). Sample and SNP QC were undertaken
within the BioBank Japan Project. The GWAS was imputed
at up to 2.5M autosomal SNPs with the use of Han Chinese
in Beijing and Japanese in Tokyo (CHBþJPT) samples from
phase II of the International HapMap Project.10 Each SNP
with MAF >1% that passed QC was then tested for associ-
ation with serum albumin and total protein in the BioBank
Japan Project under an additive model after adjustment for
age and sex, and the results were corrected for residual pop-
ulation structure with the genomic control inflation factor
(lGC ¼ 0.98 for serum albumin and lGC ¼ 1.08 for total
5, 2012
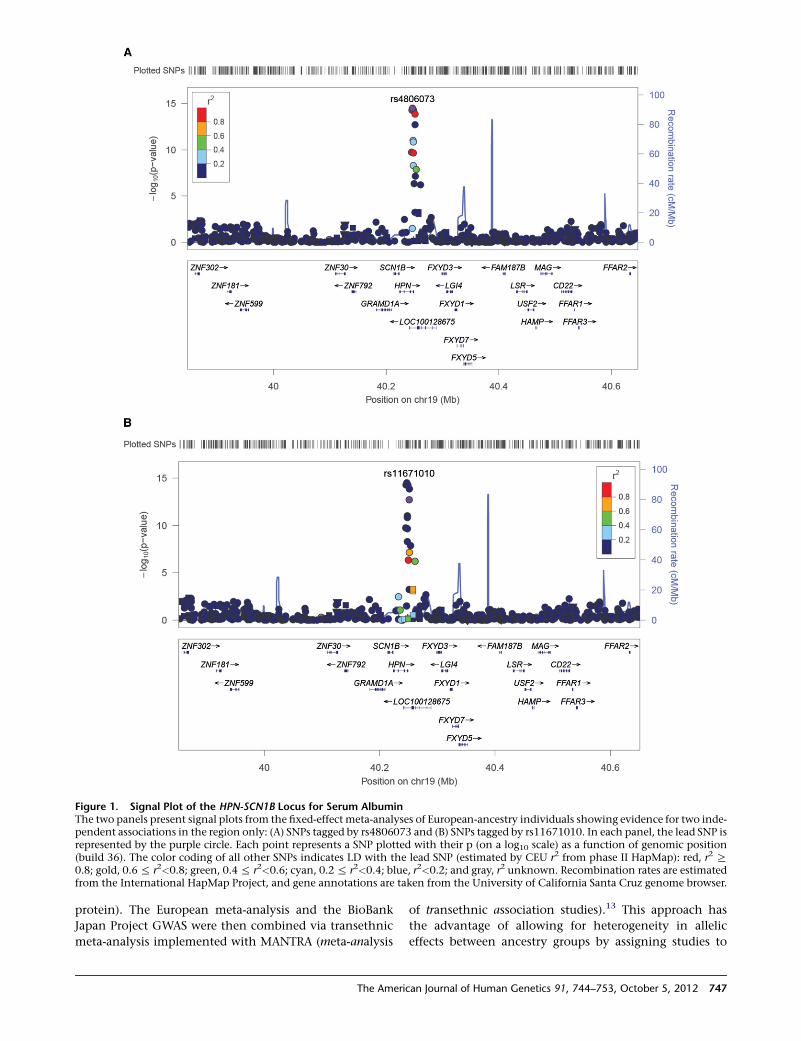
Figure 1. Signal Plot of the HPN-SCN1B Locus for Serum AlbuminThe two panels present signal plots from the fixed-effect meta-analyses of European-ancestry individuals showing evidence for two inde-pendent associations in the region only: (A) SNPs tagged by rs4806073 and (B) SNPs tagged by rs11671010. In each panel, the lead SNP isrepresented by the purple circle. Each point represents a SNP plotted with their p (on a log10 scale) as a function of genomic position(build 36). The color coding of all other SNPs indicates LD with the lead SNP (estimated by CEU r2 from phase II HapMap): red, r2 R0.8; gold, 0.6% r2<0.8; green, 0.4% r2<0.6; cyan, 0.2% r2<0.4; blue, r2<0.2; and gray, r2 unknown. Recombination rates are estimatedfrom the International HapMap Project, and gene annotations are taken from the University of California Santa Cruz genome browser.
protein). The European meta-analysis and the BioBank
Japan Project GWAS were then combined via transethnic
meta-analysis implemented with MANTRA (meta-analysis
The Americ
of transethnic association studies).13 This approach has
the advantage of allowing for heterogeneity in allelic
effects between ancestry groups by assigning studies to
an Journal of Human Genetics 91, 744–753, October 5, 2012 747
clusters according to a Bayesian partition model of simi-
larity in terms of their allele frequency profile. Studies as-
signed to the same cluster have the same allelic effect.
However, each cluster can have different allelic effects.
Fixed-effect meta-analysis is thus equivalent to a Bayesian
partition model with a single cluster of studies.
We observed strong evidence of association, as defined
by a log10 Bayes factor (BF) of 5 (equivalent to prior odds
of association of any SNP with either trait of 1:100,000),14
at all identified loci for both traits (Table 2, Figure S2).
These loci included RPS11-FCGRT for total protein, which
was previously observed in eastern Asian populations but
not at genome-wide significance in our European-ancestry
meta-analysis. The only exception was at the FRMD5-
WDR76 locus (log10BF ¼ 4.79), where the lead SNP from
the Europeanmeta-analysis (rs16948098) was not observed
in the Japanese GWAS and is monomorphic in eastern
Asian (CHB and JPT) HapMap populations.10 Using the
threshold of log10BF> 5 for strong evidence of association,
we identified two additional ‘‘potential’’ loci for serum
albumin and four for total protein (Table 2).
MANTRA revealed little evidence of heterogeneity in
allelic effects between European-ancestry and Japanese
studies at the majority of the serum albumin and total
protein loci (Table 2). The extent of heterogeneity was
assessed through comparison of association BF under a
Bayesian partition model wherein the number of clusters
of studies is unrestricted to that wherein there is a single
cluster, the latter corresponding to homogeneous allelic
effects across all ancestry groups. Subsequent fixed-effect
inverse-variance-weighted meta-analysis across groups of
European and Japanese ancestry (Table S4) revealed one
additional signal for total-protein mapping to ELL2 (MIM
601874, p ¼ 1.1 3 10�8), although none of the other
potential MANTRA loci showed genome-wide significance
(p < 53 10�8). Among these potential loci, however, there
was strong evidence of heterogeneity at ARID5B (MIM
608538) for total protein (MANTRA log10BF in favor of
heterogeneity of 6.79). The lead SNP at this locus
(rs2675609) was strongly associated with total protein
only in the Japanese GWAS (p ¼ 1.7 3 10�6, compared
with p ¼ 0.014 in the European meta-analysis), and the
allelic effects were in opposite directions in the two
ancestry groups (Table 2). Interestingly, the effect-allele
frequency is similar in European-ancestry and Japanese
GWASs, and there is little evidence of variation in LD
structure between CEU and CHBþJPT reference haplotypes
from the 1000 Genomes Project15 (Figure S3). Although
intrastudy phenotypic variation in total protein concen-
trations (such as Ig, which is not available for analyses
here) might contribute to these apparent transethnic dif-
ferences in allelic effects, further investigation is required
to fully elucidate the source of heterogeneity between
ancestry groups.
To assess the improvement in fine-mapping resolution
due to transethnic meta-analysis in serum albumin and
total protein loci, we defined ‘‘credible sets’’ of SNPs
748 The American Journal of Human Genetics 91, 744–753, October
(J.B. Maller, personal communication) with the strongest
signals of association and, hence, most likely to be causal
(or tagging an unobserved causal variant), on the basis of
European-ancestry GWASs only and then after inclusion
of the Japanese study. At each locus, defined by the
genomic region 500 kb up and downstream of the lead
SNP, we calculated the posterior probability that the jth
SNP is ‘‘causal’’ (or tags an unobserved causal variant) by
fj ¼BFjP
k
BFk
:
In this expression, BFj denotes the BF in favor of associa-
tion of the jth SNP from the transethnic MANTRA analysis,
and the summation in the denominator is over all SNPs
passingQCacross the locus (J.B.Maller, personal communi-
cation). A 100u% credible set at the locus was then con-
structed through (1) ranking all SNPs according to their
BF and (2) combining ranked SNPs until their cumulative
posterior probability exceeded u. Using this definition,
we observed improved resolution, in terms of the number
of SNPs and the genomic interval covered by the credible
set, at HPN-SCN1B, TNFRSF11A-ZCCHC2, and RPS11-
FCGRT for serum albumin and at TNFRSF13B and the
6q21.3 locus for total protein (Figure 2, Table S5). The
most striking improvements in resolution were observed
at the 6q21.3 locus for total protein, wherein the 99% cred-
ible set was reduced from 14 SNPs (covering 346 kb), to just
three (covering 37 kb). Furthermore, after transethnic
meta-analysis, the posterior probability that the lead SNP
was causal (or tagged an unobserved causal variant) was
more than 95% at GCKR-FNDC4 and SERPINF2-WDR81
for serum albumin and at TNFRSF13B and the 6q21.3 locus
for total protein.
Two of the serum albumin loci, HPN-SCN1B and RPS11-
FCGRT, can be validated by existing mouse models. The
lead SNP at the HPN-SCN1B locus maps to an intron of
HPN, a gene encoding hepsin, a membrane-bound serine
protease that has substrate specificity for basic amino acids
similar to that of proalbumin processing, suggesting a
physiologic role of hepsin in the cleavage of proalbumin
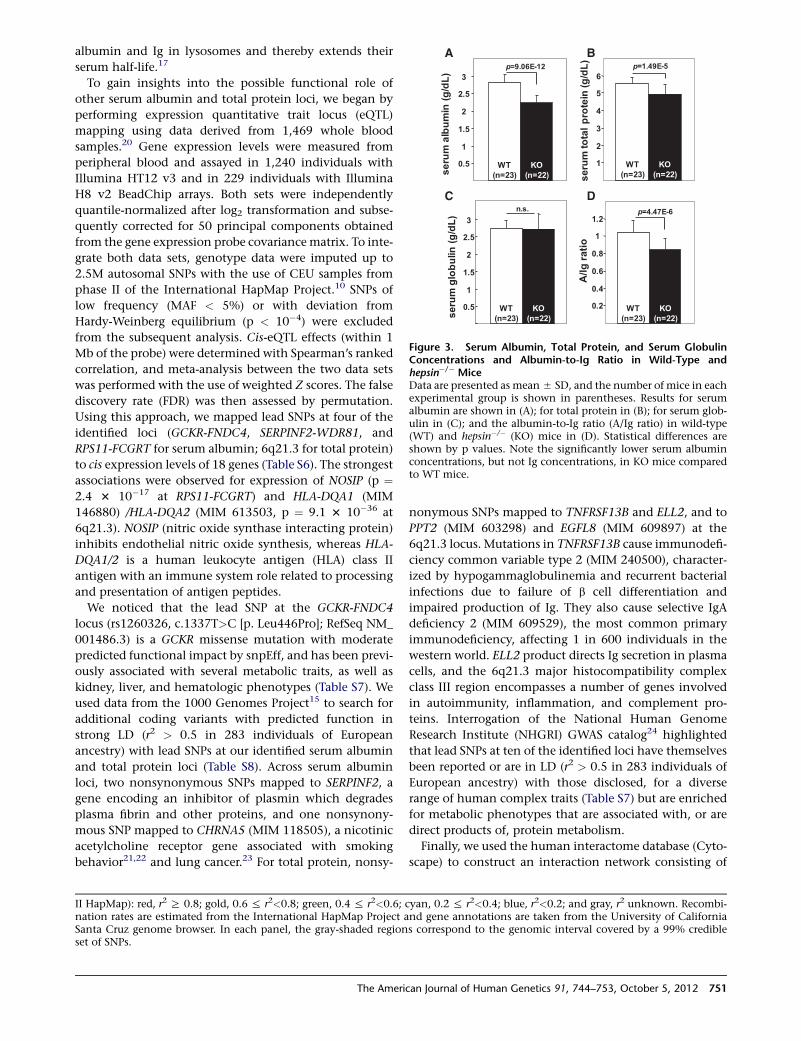
to albumin. We compared serum protein concentrations
between hepsin knockout (KO) mice and wild-type litter
mates16 (Figure 3) using blood samples collected from
the inferior vena cava and analyzed by Consolidated
Veterinary Diagnostics (West Sacramento, CA, USA). In
hepsin�/� mice, we observed overwhelming evidence of
reduced serum albumin (p ¼ 9.1 3 10�12) and, to a lesser
extent, reduced total protein (p ¼ 1.5 3 10�5), but not
Ig. At the RPS11-FCGRT locus, KO Fcgrt mice have been
previously demonstrated to manifest low serum albumin
and low serum gamma Ig concentrations.17,18 Further-
more, in humans, two siblings with genetic deficiency of
FcRn due to lack of the b2 microglobumin component
have manifested reduced serum albumin and gamma Ig
concentrations.19 FCGRT encodes the heavy alpha chain
of the FcRn, which prevents lysosomal degradation of
5, 2012
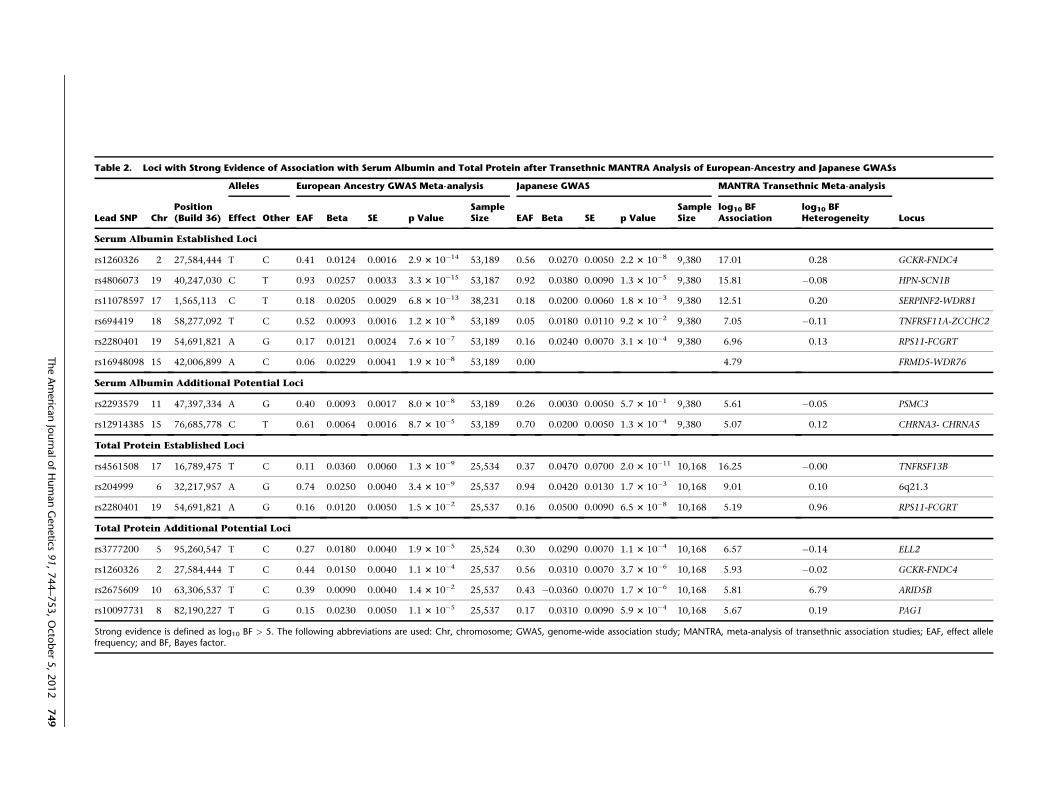
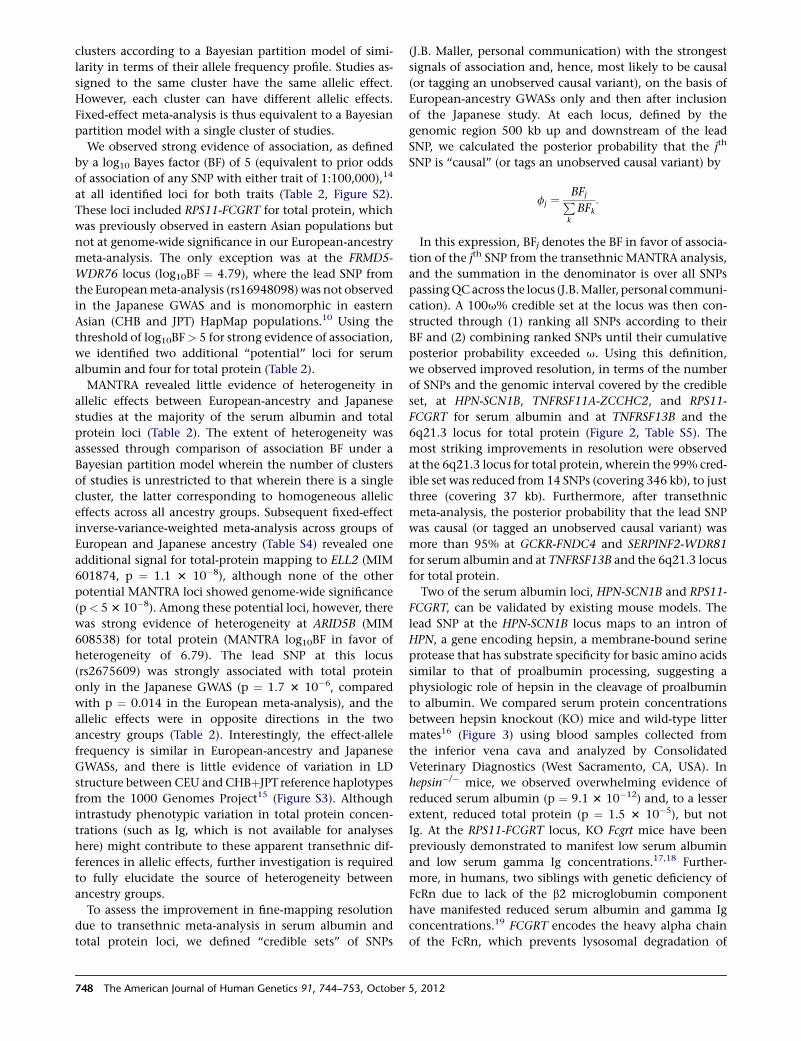
Table 2. Loci with Strong Evidence of Association with Serum Albumin and Total Protein after Transethnic MANTRA Analysis of European-Ancestry and Japanese GWASs
Lead SNP ChrPosition(Build 36)
Alleles European Ancestry GWAS Meta-analysis Japanese GWAS MANTRA Transethnic Meta-analysis
LocusEffect Other EAF Beta SE p ValueSampleSize EAF Beta SE p Value
SampleSize
log10 BFAssociation
log10 BFHeterogeneity
Serum Albumin Established Loci
rs1260326 2 27,584,444 T C 0.41 0.0124 0.0016 2.9 3 10�14 53,189 0.56 0.0270 0.0050 2.2 3 10�8 9,380 17.01 0.28 GCKR-FNDC4
rs4806073 19 40,247,030 C T 0.93 0.0257 0.0033 3.3 3 10�15 53,187 0.92 0.0380 0.0090 1.3 3 10�5 9,380 15.81 �0.08 HPN-SCN1B
rs11078597 17 1,565,113 C T 0.18 0.0205 0.0029 6.8 3 10�13 38,231 0.18 0.0200 0.0060 1.8 3 10�3 9,380 12.51 0.20 SERPINF2-WDR81
rs694419 18 58,277,092 T C 0.52 0.0093 0.0016 1.2 3 10�8 53,189 0.05 0.0180 0.0110 9.2 3 10�2 9,380 7.05 �0.11 TNFRSF11A-ZCCHC2
rs2280401 19 54,691,821 A G 0.17 0.0121 0.0024 7.6 3 10�7 53,189 0.16 0.0240 0.0070 3.1 3 10�4 9,380 6.96 0.13 RPS11-FCGRT
rs16948098 15 42,006,899 A C 0.06 0.0229 0.0041 1.9 3 10�8 53,189 0.00 4.79 FRMD5-WDR76
Serum Albumin Additional Potential Loci
rs2293579 11 47,397,334 A G 0.40 0.0093 0.0017 8.0 3 10�8 53,189 0.26 0.0030 0.0050 5.7 3 10�1 9,380 5.61 �0.05 PSMC3
rs12914385 15 76,685,778 C T 0.61 0.0064 0.0016 8.7 3 10�5 53,189 0.70 0.0200 0.0050 1.3 3 10�4 9,380 5.07 0.12 CHRNA3- CHRNA5
Total Protein Established Loci
rs4561508 17 16,789,475 T C 0.11 0.0360 0.0060 1.3 3 10�9 25,534 0.37 0.0470 0.0700 2.0 3 10�11 10,168 16.25 �0.00 TNFRSF13B
rs204999 6 32,217,957 A G 0.74 0.0250 0.0040 3.4 3 10�9 25,537 0.94 0.0420 0.0130 1.7 3 10�3 10,168 9.01 0.10 6q21.3
rs2280401 19 54,691,821 A G 0.16 0.0120 0.0050 1.5 3 10�2 25,537 0.16 0.0500 0.0090 6.5 3 10�8 10,168 5.19 0.96 RPS11-FCGRT
Total Protein Additional Potential Loci
rs3777200 5 95,260,547 T C 0.27 0.0180 0.0040 1.9 3 10�5 25,524 0.30 0.0290 0.0070 1.1 3 10�4 10,168 6.57 �0.14 ELL2
rs1260326 2 27,584,444 T C 0.44 0.0150 0.0040 1.1 3 10�4 25,537 0.56 0.0310 0.0070 3.7 3 10�6 10,168 5.93 �0.02 GCKR-FNDC4
rs2675609 10 63,306,537 T C 0.39 0.0090 0.0040 1.4 3 10�2 25,537 0.43 �0.0360 0.0070 1.7 3 10�6 10,168 5.81 6.79 ARID5B
rs10097731 8 82,190,227 T G 0.15 0.0230 0.0050 1.1 3 10�5 25,537 0.17 0.0310 0.0090 5.9 3 10�4 10,168 5.67 0.19 PAG1
Strong evidence is defined as log10 BF > 5. The following abbreviations are used: Chr, chromosome; GWAS, genome-wide association study; MANTRA, meta-analysis of transethnic association studies; EAF, effect allelefrequency; and BF, Bayes factor.
TheAmerica
nJournalofHumanGenetics
91,744–753,Octo
ber5,2012
749
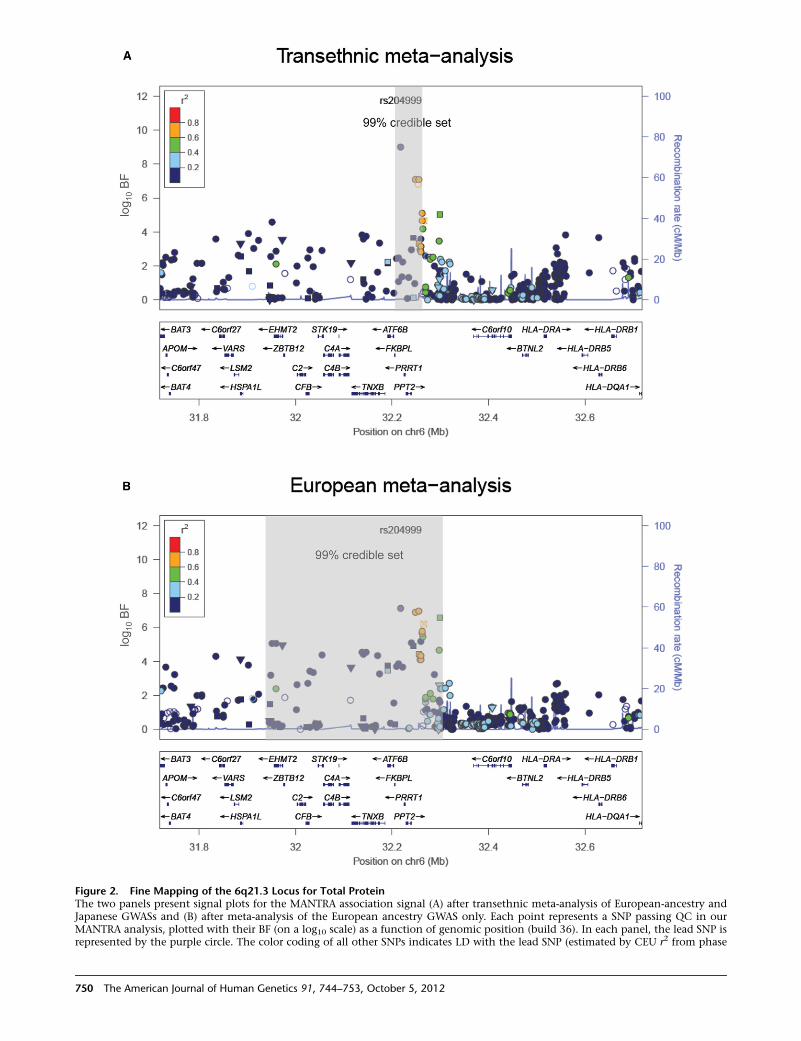
Figure 2. Fine Mapping of the 6q21.3 Locus for Total ProteinThe two panels present signal plots for the MANTRA association signal (A) after transethnic meta-analysis of European-ancestry andJapanese GWASs and (B) after meta-analysis of the European ancestry GWAS only. Each point represents a SNP passing QC in ourMANTRA analysis, plotted with their BF (on a log10 scale) as a function of genomic position (build 36). In each panel, the lead SNP isrepresented by the purple circle. The color coding of all other SNPs indicates LD with the lead SNP (estimated by CEU r2 from phase
750 The American Journal of Human Genetics 91, 744–753, October 5, 2012
A B
C D
A/lg
ratio
Figure 3. Serum Albumin, Total Protein, and Serum GlobulinConcentrations and Albumin-to-Ig Ratio in Wild-Type andhepsin�/� MiceData are presented as mean5 SD, and the number of mice in eachexperimental group is shown in parentheses. Results for serumalbumin are shown in (A); for total protein in (B); for serum glob-ulin in (C); and the albumin-to-Ig ratio (A/Ig ratio) in wild-type(WT) and hepsin�/� (KO) mice in (D). Statistical differences areshown by p values. Note the significantly lower serum albuminconcentrations, but not Ig concentrations, in KO mice comparedto WT mice.
albumin and Ig in lysosomes and thereby extends their
serum half-life.17
To gain insights into the possible functional role of
other serum albumin and total protein loci, we began by
performing expression quantitative trait locus (eQTL)
mapping using data derived from 1,469 whole blood
samples.20 Gene expression levels were measured from
peripheral blood and assayed in 1,240 individuals with
Illumina HT12 v3 and in 229 individuals with Illumina
H8 v2 BeadChip arrays. Both sets were independently
quantile-normalized after log2 transformation and subse-
quently corrected for 50 principal components obtained
from the gene expression probe covariance matrix. To inte-
grate both data sets, genotype data were imputed up to
2.5M autosomal SNPs with the use of CEU samples from
phase II of the International HapMap Project.10 SNPs of
low frequency (MAF < 5%) or with deviation from
Hardy-Weinberg equilibrium (p < 10�4) were excluded
from the subsequent analysis. Cis-eQTL effects (within 1
Mb of the probe) were determined with Spearman’s ranked
correlation, and meta-analysis between the two data sets
was performed with the use of weighted Z scores. The false
discovery rate (FDR) was then assessed by permutation.
Using this approach, we mapped lead SNPs at four of the
identified loci (GCKR-FNDC4, SERPINF2-WDR81, and
RPS11-FCGRT for serum albumin; 6q21.3 for total protein)
to cis expression levels of 18 genes (Table S6). The strongest
associations were observed for expression of NOSIP (p ¼2.4 3 10�17 at RPS11-FCGRT) and HLA-DQA1 (MIM
146880) /HLA-DQA2 (MIM 613503, p ¼ 9.1 3 10�36 at
6q21.3). NOSIP (nitric oxide synthase interacting protein)
inhibits endothelial nitric oxide synthesis, whereas HLA-
DQA1/2 is a human leukocyte antigen (HLA) class II
antigen with an immune system role related to processing
and presentation of antigen peptides.
We noticed that the lead SNP at the GCKR-FNDC4
locus (rs1260326, c.1337T>C [p. Leu446Pro]; RefSeq NM_
001486.3) is a GCKR missense mutation with moderate
predicted functional impact by snpEff, and has been previ-
ously associated with several metabolic traits, as well as
kidney, liver, and hematologic phenotypes (Table S7). We
used data from the 1000 Genomes Project15 to search for
additional coding variants with predicted function in
strong LD (r2 > 0.5 in 283 individuals of European
ancestry) with lead SNPs at our identified serum albumin
and total protein loci (Table S8). Across serum albumin
loci, two nonsynonymous SNPs mapped to SERPINF2, a
gene encoding an inhibitor of plasmin which degrades
plasma fibrin and other proteins, and one nonsynony-
mous SNP mapped to CHRNA5 (MIM 118505), a nicotinic
acetylcholine receptor gene associated with smoking
behavior21,22 and lung cancer.23 For total protein, nonsy-
II HapMap): red, r2 R 0.8; gold, 0.6 % r2<0.8; green, 0.4 % r2<0.6; cnation rates are estimated from the International HapMap Project aSanta Cruz genome browser. In each panel, the gray-shaded regionset of SNPs.
The Americ
nonymous SNPs mapped to TNFRSF13B and ELL2, and to
PPT2 (MIM 603298) and EGFL8 (MIM 609897) at the
6q21.3 locus. Mutations in TNFRSF13B cause immunodefi-
ciency common variable type 2 (MIM 240500), character-
ized by hypogammaglobulinemia and recurrent bacterial
infections due to failure of b cell differentiation and
impaired production of Ig. They also cause selective IgA
deficiency 2 (MIM 609529), the most common primary
immunodeficiency, affecting 1 in 600 individuals in the
western world. ELL2 product directs Ig secretion in plasma
cells, and the 6q21.3 major histocompatibility complex
class III region encompasses a number of genes involved
in autoimmunity, inflammation, and complement pro-
teins. Interrogation of the National Human Genome
Research Institute (NHGRI) GWAS catalog24 highlighted
that lead SNPs at ten of the identified loci have themselves
been reported or are in LD (r2 > 0.5 in 283 individuals of
European ancestry) with those disclosed, for a diverse
range of human complex traits (Table S7) but are enriched
for metabolic phenotypes that are associated with, or are
direct products of, protein metabolism.
Finally, we used the human interactome database (Cyto-
scape) to construct an interaction network consisting of
yan, 0.2 % r2<0.4; blue, r2<0.2; and gray, r2 unknown. Recombi-nd gene annotations are taken from the University of Californias correspond to the genomic interval covered by a 99% credible
an Journal of Human Genetics 91, 744–753, October 5, 2012 751
250 proteins that directly interact with genes in the identi-
fied serum albumin and total protein loci reported in Table
2. For identifying molecular complexes within this first-
degree interaction network, cluster analyses were
performed with the FAG-EC algorithm, implemented in
the ClusterViz plug-in, with standard settings applied. In
total, 16 distinct clusters were identified, including three
large complexes (Figure S4) that were carried forward for
further analysis. Functional enrichment analyses within
these clusters were performed following defined pathways
from BioCarta, KEGG, PANTHER, and Reactome via the
Database for Annotation, Visualization, and Integrated
Discovery (DAVID). The most significantly enriched clus-
ters from protein interaction network analyses incorpo-
rated ribosomal functioning and protein translation,
proteasomal protein degradation, and immune-response
signaling (Table S9). As a complementary approach, we
applied an implementation of gene-set enrichment anal-
ysis (MAGENTA25) to identify whether defined biological
pathways from BioCarta, Gene Ontology, Ingenuity,
KEGG, PANTHER, and Reactome were enriched in the
leading-edge fraction of the meta-analysis. In brief, gene
association p values were calculated on the basis of meta-
analysis summary statistics for SNPs within a 110-kb-
upstream and 40-kb-downstream window. These gene
scores were then corrected for gene size, number of SNPs,
and the LD between them, and subsequently ranked by
p value. Enrichment in the 75th and 95th percentiles was
assessed for significance by comparison with 10,000
randomly generated pathways. Using an FDR threshold
of 5%, we observed significant overrepresentation of genes
assigned to three pathways: RNA- (FDR ¼ 0.044), sensory-
perception- (FDR ¼ 0.027), and protein-trafficking-related
pathways (FDR ¼ 0.043-0.044) (Table S10).
In conclusion, we have identified six loci for serum
albumin concentration and three for total protein at
genome-wide significance. These loci harbor genes that
fall across a diverse range of biological pathways, including
those involved in biomarkers, immune regulation, and dis-
ease, but are enriched for those relevant to the synthesis
and degradation of serum protein. By combining GWAS
data fromEuropean and Japanese populations,we observed
some evidence of heterogeneity in allelic effects between
ancestry groups and have demonstrated substantial im-
provements in the localization of potential causal variants.
Taken together, our results highlight the advantages of
transethnic meta-analysis for the discovery and fine
mapping of complex trait loci and provide initial insights
into the underlying genetic architecture of serum protein
concentrations and their association with human disease.
Supplemental Data
Supplemental Data include four figures, ten tables, Supplemental
Acknowledgments, study characteristics, samples, and assays and
can be found with this article online at http://www.cell.com/
AJHG/.
752 The American Journal of Human Genetics 91, 744–753, October
Acknowledgments
A.P.M acknowledges financial support from the Wellcome
Trust, grant numbers WT081682, WT064890, WT098017, and
WT090532. N.F. acknowledges financial support from AHA
0675001N, R01HL089651, and U01HG004803.
Received: May 11, 2012
Revised: June 18, 2012
Accepted: August 23, 2012
Published online: September 27, 2012
Web Resources
The URLs for data presented herein are as follows:
1000 Genomes Project, http://www.1000genomes.org/
ClusterViz plug-in, http://code.google.com/p/clusterviz-cytoscape
DAVID, http://david.abcc.ncifcrf.gov
GCTA, http://www.complextraitgenomics.com/software/gcta/
NHGRI Catalog of Published Genome-wide Association Studies,
http://www.genome.gov/gwastudies/
Online Mendelian Inheritance in Man (OMIM), http://www.
omim.org
SNIPPER, http://csg.sph.umich.edu/boehnke/snipper/
snpEff, http://snpeff.sourceforge.net
References
1. Nelson, J.J., Liao, D., Sharrett, A.R., Folsom, A.R., Chambless,
L.E., Shahar, E., Szklo, M., Eckfeldt, J., and Heiss, G. (2000).
Serum albumin level as a predictor of incident coronary heart
disease: the Atherosclerosis Risk in Communities (ARIC)
study. Am. J. Epidemiol. 151, 468–477.
2. Goldwasser, P., and Feldman, J. (1997). Association of serum
albumin and mortality risk. J. Clin. Epidemiol. 50, 693–703.
3. Johnson, A., Rohlfs, E., and Silverman, L. (1999). Tietz
Textbook of Clinical Chemistry (Philadelphia, PA: WB Saun-
ders Co.).
4. Dal Colletto, G.M., Krieger, H., and Magalhaes, J.R. (1983).
Genetic and environmental determinants of 17 serum
biochemical traits in Brazilian twins. Acta Genet. Med. Gemel-
lol. (Roma) 32, 23–29.
5. Whitfield, J.B., and Martin, N.G. (1984). The effects of inheri-
tance on constituents of plasma: a twin study on some
biochemical variables. Ann. Clin. Biochem. 21, 176–183.
6. Kalousdian, S., Fabsitz, R., Havlik, R., Christian, J., and
Rosenman, R. (1987). Heritability of clinical chemistries in
an older twin cohort: the NHLBI Twin Study. Genet. Epide-
miol. 4, 1–11.
7. Pankow, J.S., Folsom, A.R., Cushman, M., Borecki, I.B.,
Hopkins, P.N., Eckfeldt, J.H., and Tracy, R.P. (2001). Familial
and genetic determinants of systemic markers of inflamma-
tion: the NHLBI family heart study. Atherosclerosis 154,
681–689.
8. Kamatani, Y., Matsuda, K., Okada, Y., Kubo, M., Hosono, N.,
Daigo, Y., Nakamura, Y., and Kamatani, N. (2010). Genome-
wide association study of hematological and biochemical
traits in a Japanese population. Nat. Genet. 42, 210–215.
9. Kim, Y.J., Go, M.J., Hu, C., Hong, C.B., Kim, Y.K., Lee, J.Y.,
Hwang, J.Y., Oh, J.H., Kim, D.J., Kim, N.H., et al; MAGIC
consortium. (2011). Large-scale genome-wide association
5, 2012
studies in East Asians identify new genetic loci influencing
metabolic traits. Nat. Genet. 43, 990–995.
10. Frazer, K.A., Ballinger, D.G., Cox, D.R., Hinds, D.A., Stuve,
L.L., Gibbs, R.A., Belmont, J.W., Boudreau, A., Hardenbol, P.,
Leal, S.M., et al; International HapMap Consortium. (2007).
A second generation human haplotype map of over 3.1
million SNPs. Nature 449, 851–861.
11. Devlin, B., and Roeder, K. (1999). Genomic control for associ-
ation studies. Biometrics 55, 997–1004.
12. Yang, J., Lee, S.H., Goddard, M.E., and Visscher, P.M. (2011).
GCTA: a tool for genome-wide complex trait analysis. Am. J.
Hum. Genet. 88, 76–82.
13. Morris, A.P. (2011). Transethnic meta-analysis of genomewide
association studies. Genet. Epidemiol. 35, 809–822.
14. Stephens, M., and Balding, D.J. (2009). Bayesian statistical
methods for genetic association studies. Nat. Rev. Genet. 10,
681–690.
15. 1000 Genomes Project Consortium. (2010). A map of human
genome variation from population-scale sequencing. Nature
467, 1061–1073.
16. Wu, Q., Yu, D., Post, J., Halks-Miller, M., Sadler, J.E., and
Morser, J. (1998). Generation and characterization of mice
deficient in hepsin, a hepatic transmembrane serine protease.
J. Clin. Invest. 101, 321–326.
17. Chaudhury, C., Mehnaz, S., Robinson, J.M., Hayton, W.L.,
Pearl, D.K., Roopenian, D.C., and Anderson, C.L. (2003).
The major histocompatibility complex-related Fc receptor
for IgG (FcRn) binds albumin and prolongs its lifespan. J.
Exp. Med. 197, 315–322.
18. Roopenian, D.C., Christianson, G.J., Sproule, T.J., Brown,
A.C., Akilesh, S., Jung, N., Petkova, S., Avanessian, L., Choi,
E.Y., Shaffer, D.J., et al. (2003). The MHC class I-like IgG
receptor controls perinatal IgG transport, IgG homeostasis,
and fate of IgG-Fc-coupled drugs. J. Immunol. 170, 3528–
3533.
The Americ
19. Wani, M.A., Haynes, L.D., Kim, J., Bronson, C.L., Chaudhury,
C., Mohanty, S., Waldmann, T.A., Robinson, J.M., and Ander-
son, C.L. (2006). Familial hypercatabolic hypoproteinemia
caused by deficiency of the neonatal Fc receptor, FcRn, due
to a mutant beta2-microglobulin gene. Proc. Natl. Acad. Sci.
USA 103, 5084–5089.
20. Fehrmann, R.S., Jansen, R.C., Veldink, J.H., Westra, H.J.,
Arends, D., Bonder, M.J., Fu, J., Deelen, P., Groen, H.J., Smo-
lonska, A., et al. (2011). Trans-eQTLs reveal that independent
genetic variants associated with a complex phenotype con-
verge on intermediate genes, with a major role for the HLA.
PLoS Genet. 7, e1002197.
21. Thorgeirsson, T.E., Gudbjartsson, D.F., Surakka, I., Vink, J.M.,
Amin, N., Geller, F., Sulem, P., Rafnar, T., Esko, T., Walter, S.,
et al; ENGAGE Consortium. (2010). Sequence variants at
CHRNB3-CHRNA6 and CYP2A6 affect smoking behavior.
Nat. Genet. 42, 448–453.
22. Tobacco and Genetics Consortium. (2010). Genome-wide
meta-analyses identify multiple loci associated with smoking
behavior. Nat. Genet. 42, 441–447.
23. Amos, C.I., Wu, X., Broderick, P., Gorlov, I.P., Gu, J., Eisen, T.,
Dong, Q., Zhang, Q., Gu, X., Vijayakrishnan, J., et al. (2008).
Genome-wide association scan of tag SNPs identifies a sus-
ceptibility locus for lung cancer at 15q25.1. Nat. Genet. 40,
616–622.
24. Hindorff, L.A., Sethupathy, P., Junkins, H.A., Ramos, E.M.,
Mehta, J.P., Collins, F.S., and Manolio, T.A. (2009). Potential
etiologic and functional implications of genome-wide associ-
ation loci for human diseases and traits. Proc. Natl. Acad.
Sci. USA 106, 9362–9367.
25. Segre, A.V., Groop, L., Mootha, V.K., Daly, M.J., and Altshuler,
D.; DIAGRAM Consortium; MAGIC investigators. (2010).
Common inherited variation in mitochondrial genes is not
enriched for associations with type 2 diabetes or related glyce-
mic traits. PLoS Genet. 6, e1001058.
an Journal of Human Genetics 91, 744–753, October 5, 2012 753
Copyright © 2022 FDOKUMEN