Novel Pheochromocytoma Susceptibility Loci Identified by Integrative Genomics
9
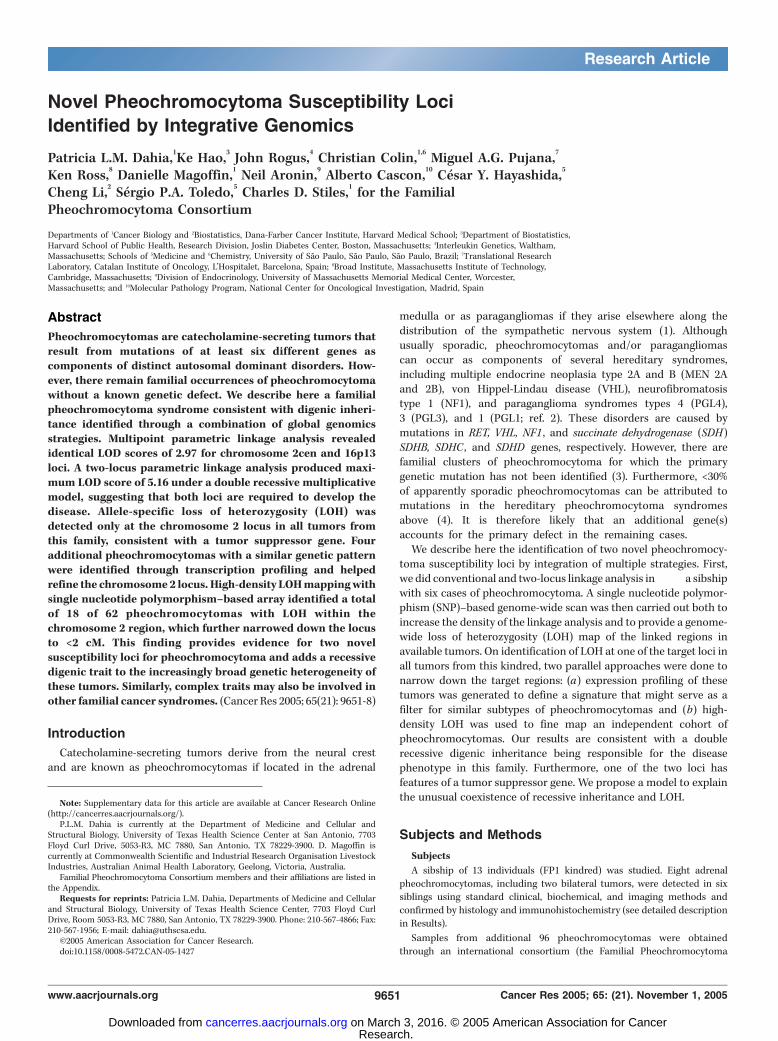
Novel Pheochromocytoma Susceptibility Loci Identified by Integrative Genomics Patricia L.M. Dahia, 1 Ke Hao, 3 John Rogus, 4 Christian Colin, 1,6 Miguel A.G. Pujana, 7 Ken Ross, 8 Danielle Magoffin, 1 Neil Aronin, 9 Alberto Cascon, 10 Ce ´sar Y. Hayashida, 5 Cheng Li, 2 Se ´rgio P.A. Toledo, 5 Charles D. Stiles, 1 for the Familial Pheochromocytoma Consortium Departments of 1 Cancer Biology and 2 Biostatistics, Dana-Farber Cancer Institute, Harvard Medical School; 3 Department of Biostatistics, Harvard School of Public Health, Research Division, Joslin Diabetes Center, Boston, Massachusetts; 4 Interleukin Genetics, Waltham, Massachusetts; Schools of 5 Medicine and 6 Chemistry, University of Sa ˜o Paulo, Sa ˜o Paulo, Sa ˜o Paulo, Brazil; 7 Translational Research Laboratory, Catalan Institute of Oncology, L’Hospitalet, Barcelona, Spain; 8 Broad Institute, Massachusetts Institute of Technology, Cambridge, Massachusetts; 9 Division of Endocrinology, University of Massachusetts Memorial Medical Center, Worcester, Massachusetts; and 10 Molecular Pathology Program, National Center for Oncological Investigation, Madrid, Spain Abstract Pheochromocytomas are catecholamine-secreting tumors that result from mutations of at least six different genes as components of distinct autosomal dominant disorders. How- ever, there remain familial occurrences of pheochromocytoma without a known genetic defect. We describe here a familial pheochromocytoma syndrome consistent with digenic inheri- tance identified through a combination of global genomics strategies. Multipoint parametric linkage analysis revealed identical LOD scores of 2.97 for chromosome 2cen and 16p13 loci. A two-locus parametric linkage analysis produced maxi- mum LOD score of 5.16 under a double recessive multiplicative model, suggesting that both loci are required to develop the disease. Allele-specific loss of heterozygosity (LOH) was detected only at the chromosome 2 locus in all tumors from this family, consistent with a tumor suppressor gene. Four additional pheochromocytomas with a similar genetic pattern were identified through transcription profiling and helped refine the chromosome 2 locus. High-density LOH mapping with single nucleotide polymorphism–based array identified a total of 18 of 62 pheochromocytomas with LOH within the chromosome 2 region, which further narrowed down the locus to <2 cM. This finding provides evidence for two novel susceptibility loci for pheochromocytoma and adds a recessive digenic trait to the increasingly broad genetic heterogeneity of these tumors. Similarly, complex traits may also be involved in other familial cancer syndromes. (Cancer Res 2005; 65(21): 9651-8) Introduction Catecholamine-secreting tumors derive from the neural crest and are known as pheochromocytomas if located in the adrenal medulla or as paragangliomas if they arise elsewhere along the distribution of the sympathetic nervous system (1). Although usually sporadic, pheochromocytomas and/or paragangliomas can occur as components of several hereditary syndromes, including multiple endocrine neoplasia type 2A and B (MEN 2A and 2B), von Hippel-Lindau disease (VHL), neurofibromatosis type 1 (NF1), and paraganglioma syndromes types 4 (PGL4), 3 (PGL3), and 1 (PGL1; ref. 2). These disorders are caused by mutations in RET, VHL, NF1 , and succinate dehydrogenase (SDH ) SDHB, SDHC , and SDHD genes, respectively. However, there are familial clusters of pheochromocytoma for which the primary genetic mutation has not been identified (3). Furthermore, <30% of apparently sporadic pheochromocytomas can be attributed to mutations in the hereditary pheochromocytoma syndromes above (4). It is therefore likely that an additional gene(s) accounts for the primary defect in the remaining cases. We describe here the identification of two novel pheochromocy- toma susceptibility loci by integration of multiple strategies. First, we did conventional and two-locus linkage analysis in a sibship with six cases of pheochromocytoma. A single nucleotide polymor- phism (SNP)–based genome-wide scan was then carried out both to increase the density of the linkage analysis and to provide a genome- wide loss of heterozygosity (LOH) map of the linked regions in available tumors. On identification of LOH at one of the target loci in all tumors from this kindred, two parallel approaches were done to narrow down the target regions: ( a ) expression profiling of these tumors was generated to define a signature that might serve as a filter for similar subtypes of pheochromocytomas and (b) high- density LOH was used to fine map an independent cohort of pheochromocytomas. Our results are consistent with a double recessive digenic inheritance being responsible for the disease phenotype in this family. Furthermore, one of the two loci has features of a tumor suppressor gene. We propose a model to explain the unusual coexistence of recessive inheritance and LOH. Subjects and Methods Subjects A sibship of 13 individuals (FP1 kindred) was studied. Eight adrenal pheochromocytomas, including two bilateral tumors, were detected in six siblings using standard clinical, biochemical, and imaging methods and confirmed by histology and immunohistochemistry (see detailed description in Results). Samples from additional 96 pheochromocytomas were obtained through an international consortium (the Familial Pheochromocytoma Note: Supplementary data for this article are available at Cancer Research Online (http://cancerres.aacrjournals.org/). P.L.M. Dahia is currently at the Department of Medicine and Cellular and Structural Biology, University of Texas Health Science Center at San Antonio, 7703 Floyd Curl Drive, 5053-R3, MC 7880, San Antonio, TX 78229-3900. D. Magoffin is currently at Commonwealth Scientific and Industrial Research Organisation Livestock Industries, Australian Animal Health Laboratory, Geelong, Victoria, Australia. Familial Pheochromocytoma Consortium members and their affiliations are listed in the Appendix. Requests for reprints: Patricia L.M. Dahia, Departments of Medicine and Cellular and Structural Biology, University of Texas Health Science Center, 7703 Floyd Curl Drive, Room 5053-R3, MC 7880, San Antonio, TX 78229-3900. Phone: 210-567-4866; Fax: 210-567-1956; E-mail: [email protected]. I2005 American Association for Cancer Research. doi:10.1158/0008-5472.CAN-05-1427 www.aacrjournals.org 9651 Cancer Res 2005; 65: (21). November 1, 2005 Research Article Research. on March 3, 2016. © 2005 American Association for Cancer cancerres.aacrjournals.org Downloaded from
-
Upload
independent -
Category
Documents
-
view
0 -
download
0
Transcript of Novel Pheochromocytoma Susceptibility Loci Identified by Integrative Genomics
Novel Pheochromocytoma Susceptibility Loci
Identified by Integrative Genomics
Patricia L.M. Dahia,1Ke Hao,
3John Rogus,
4Christian Colin,
1,6Miguel A.G. Pujana,
7
Ken Ross,8Danielle Magoffin,
1Neil Aronin,
9Alberto Cascon,
10Cesar Y. Hayashida,
5
Cheng Li,2Sergio P.A. Toledo,
5Charles D. Stiles,
1for the Familial
Pheochromocytoma Consortium
Departments of 1Cancer Biology and 2Biostatistics, Dana-Farber Cancer Institute, Harvard Medical School; 3Department of Biostatistics,Harvard School of Public Health, Research Division, Joslin Diabetes Center, Boston, Massachusetts; 4Interleukin Genetics, Waltham,Massachusetts; Schools of 5Medicine and 6Chemistry, University of Sao Paulo, Sao Paulo, Sao Paulo, Brazil; 7Translational ResearchLaboratory, Catalan Institute of Oncology, L’Hospitalet, Barcelona, Spain; 8Broad Institute, Massachusetts Institute of Technology,Cambridge, Massachusetts; 9Division of Endocrinology, University of Massachusetts Memorial Medical Center, Worcester,Massachusetts; and 10Molecular Pathology Program, National Center for Oncological Investigation, Madrid, Spain
Abstract
Pheochromocytomas are catecholamine-secreting tumors thatresult from mutations of at least six different genes ascomponents of distinct autosomal dominant disorders. How-ever, there remain familial occurrences of pheochromocytomawithout a known genetic defect. We describe here a familialpheochromocytoma syndrome consistent with digenic inheri-tance identified through a combination of global genomicsstrategies. Multipoint parametric linkage analysis revealedidentical LOD scores of 2.97 for chromosome 2cen and 16p13loci. A two-locus parametric linkage analysis produced maxi-mum LOD score of 5.16 under a double recessive multiplicativemodel, suggesting that both loci are required to develop thedisease. Allele-specific loss of heterozygosity (LOH) wasdetected only at the chromosome 2 locus in all tumors fromthis family, consistent with a tumor suppressor gene. Fouradditional pheochromocytomas with a similar genetic patternwere identified through transcription profiling and helpedrefine the chromosome 2 locus. High-density LOHmappingwithsingle nucleotide polymorphism–based array identified a totalof 18 of 62 pheochromocytomas with LOH within thechromosome 2 region, which further narrowed down the locusto <2 cM. This finding provides evidence for two novelsusceptibility loci for pheochromocytoma and adds a recessivedigenic trait to the increasingly broad genetic heterogeneity ofthese tumors. Similarly, complex traits may also be involved inother familial cancer syndromes. (Cancer Res 2005; 65(21): 9651-8)
Introduction
Catecholamine-secreting tumors derive from the neural crestand are known as pheochromocytomas if located in the adrenal
medulla or as paragangliomas if they arise elsewhere along thedistribution of the sympathetic nervous system (1). Althoughusually sporadic, pheochromocytomas and/or paragangliomascan occur as components of several hereditary syndromes,including multiple endocrine neoplasia type 2A and B (MEN 2Aand 2B), von Hippel-Lindau disease (VHL), neurofibromatosistype 1 (NF1), and paraganglioma syndromes types 4 (PGL4),3 (PGL3), and 1 (PGL1; ref. 2). These disorders are caused bymutations in RET, VHL, NF1 , and succinate dehydrogenase (SDH)SDHB, SDHC , and SDHD genes, respectively. However, there arefamilial clusters of pheochromocytoma for which the primarygenetic mutation has not been identified (3). Furthermore, <30%of apparently sporadic pheochromocytomas can be attributed tomutations in the hereditary pheochromocytoma syndromesabove (4). It is therefore likely that an additional gene(s)accounts for the primary defect in the remaining cases.We describe here the identification of two novel pheochromocy-
toma susceptibility loci by integration of multiple strategies. First,we did conventional and two-locus linkage analysis in a sibshipwith six cases of pheochromocytoma. A single nucleotide polymor-phism (SNP)–based genome-wide scan was then carried out both toincrease the density of the linkage analysis and to provide a genome-wide loss of heterozygosity (LOH) map of the linked regions inavailable tumors. On identification of LOH at one of the target loci inall tumors from this kindred, two parallel approaches were done tonarrow down the target regions: (a) expression profiling of thesetumors was generated to define a signature that might serve as afilter for similar subtypes of pheochromocytomas and (b) high-density LOH was used to fine map an independent cohort ofpheochromocytomas. Our results are consistent with a doublerecessive digenic inheritance being responsible for the diseasephenotype in this family. Furthermore, one of the two loci hasfeatures of a tumor suppressor gene. We propose a model to explainthe unusual coexistence of recessive inheritance and LOH.
Subjects and Methods
Subjects
A sibship of 13 individuals (FP1 kindred) was studied. Eight adrenal
pheochromocytomas, including two bilateral tumors, were detected in sixsiblings using standard clinical, biochemical, and imaging methods and
confirmed by histology and immunohistochemistry (see detailed description
in Results).
Samples from additional 96 pheochromocytomas were obtained
through an international consortium (the Familial Pheochromocytoma
Note: Supplementary data for this article are available at Cancer Research Online(http://cancerres.aacrjournals.org/).
P.L.M. Dahia is currently at the Department of Medicine and Cellular andStructural Biology, University of Texas Health Science Center at San Antonio, 7703Floyd Curl Drive, 5053-R3, MC 7880, San Antonio, TX 78229-3900. D. Magoffin iscurrently at Commonwealth Scientific and Industrial Research Organisation LivestockIndustries, Australian Animal Health Laboratory, Geelong, Victoria, Australia.
Familial Pheochromocytoma Consortium members and their affiliations are listed inthe Appendix.
Requests for reprints: Patricia L.M. Dahia, Departments of Medicine and Cellularand Structural Biology, University of Texas Health Science Center, 7703 Floyd CurlDrive, Room 5053-R3, MC 7880, San Antonio, TX 78229-3900. Phone: 210-567-4866; Fax:210-567-1956; E-mail: [email protected].
I2005 American Association for Cancer Research.doi:10.1158/0008-5472.CAN-05-1427
www.aacrjournals.org 9651 Cancer Res 2005; 65: (21). November 1, 2005
Research Article
Research. on March 3, 2016. © 2005 American Association for Cancercancerres.aacrjournals.org Downloaded from

Consortium). In total, 49 sporadic and 47 familial tumors were includedin this analysis (Supplementary Table S1). Written informed consent was
obtained according to institutional ethical committee requirements
(Dana-Farber Cancer Institute/Harvard Cancer Center; Hospital das
Clınicas, University of Sao Paulo Medical School, Sao Paulo, Brazil; andcollaborating institutions).
Methods
DNA and RNA isolation. Blood samples were collected from all 13
consenting FP1 siblings, and genomic DNA was prepared from lymphocytepellets. DNA was also isolated from snap-frozen or paraffin-embedded
material of eight tumors from the six affected cases using the Qiagen kit
(Valencia, CA) according to the manufacturer’s instructions. RNA for
expression profiling studies was obtained from four of these tumors(individuals 03, 05, 09, and 11, numbered as in Fig. 1 using Trizol;
Invitrogen, Carlsbad, CA) following the manufacturer’s recommendations.
The 96 additional pheochromocytomas included in this study were
available for expression profiling (n = 34), LOH analysis (n = 38), or both
(n = 24). DNA and/or RNA was obtained as described above.
Genome-wide linkage analysis using a 10-cM microsatellite panel.DNA samples from all 13 siblings (6 affected cases and 7 ‘‘clinicallyunaffected’’ individuals) were used for a genome-wide scan using the 378-marker ABI panel with 10-cM interval spacing. In this study, we adopted astringent approach by using an affected-only strategy wherein the siblingswithout a pheochromocytoma diagnosis are considered ‘‘unknown’’ (ratherthan ‘‘unaffected’’). The LOD scores thus obtained reflect only the genotypeof the affected siblings. Additional markers were subsequently used toprovide a 2- to 3-cM spacing coverage in selected regions that yieldedresults consistent with linkage.
Parametric analysis was initially carried out assuming autosomaldominant (AD) inheritance with risk allele frequency of 0.01%. Afterobserving that all six affected individuals coinherited both maternal andpaternal haplotypes at two locations in the genome, parametric analysiswas done considering an autosomal recessive (AR) inheritance with thesame variables. The analysis was also processed considering other allelefrequencies: 1%, 0.5%, and 0.05%. Both parametric and nonparametriclinkage analyses were done using GeneHunter versions 1.3 and 2.1 (5), andthe nonparametric studies were also confirmed by Multipoint Engine forRapid Likelihood Inference (MERLIN) software package (6). All geneticdistances (based on a sex-averaged map) and marker locations used herecorrespond to the Marshfield map (http://research.marshfieldclinic.org/genetics/Default.htm).
Genome-wide linkage using a high-density single nucleotidepolymorphism panel. The Mapping 10K array (Affymetrix, Santa Clara,CA) was used for LOH analysis (see below) as well as to replicate and refinethe genome-wide linkage analysis based on microsatellite markers. Sampleswere processed according to the manufacturer’s instructions using 250 ng ofhigh molecular weight genomic DNA. The oligonucleotide array used forDNA analysis contains 11,500 SNPs distributed throughout the genome atan average density of 0.2-Mb interval.
10K SNP genotypes were generated from all six affected individuals andtwo siblings without clinical disease (individuals 13 and 15 in Fig. 1) forlinkage analysis. Genotype calls and pedigree file were converted into aformat suitable for linkage software MERLIN version 0.10.2 and Gene-Hunter version 2.1 (7). All noninformative markers were removed andgenotype inconsistencies were set to ‘‘no call.’’ Similar to the conventionallinkage analysis, two inheritance models, AD and AR, were considered forthis strategy.
Two-trait Locus Analysis
In the single-locus analysis above, the inheritance trait in the FP1family seemed to be recessive at both chromosomes 2 and 16 loci. Toexamine the potential interaction between these two loci, we employed amodified version of the GeneHunter Two-Locus software (kindly providedby Dr. J. Dietter, Institute for Medical Biometry, Informatics, andEpidemiology, University of Bonn, Bonn, Germany) as described (8, 9).SNP array genotype data of all affected and two clinically unaffected
siblings (individuals 13 and 15 from Fig. 1), as described above, were usedfor this analysis. In brief, the program was used to investigate whether thetwo loci identified by the single-locus analysis interacted. Three modelswere tested to examine the nature of the interaction between the two loci:a multiplicative or synergistic model, an additive or modulating model, ora heterogeneity model (8, 9). Both parametric (recessive model, allelefrequency of 0.01%) and nonparametric (NPL) results were obtained inthese three models.
Loss of heterozygosity analysis. LOH analysis was used on all
8 tumors from the FP1 family and an additional 62 pheochromocytomas
of various genetic backgrounds. Both chromosomes 2 and 16 micro-satellite markers and/or genome-wide SNP-based array (Mapping 10K
array) were done as reported previously (10, 11). Twenty-four tumors
were analyzed by both methods. Tumor samples from four FP1individuals, FP03, FP05, FP11, and FP21, were included in the SNP array
procedures.
Clustering analysis was done to determine tumors with similar patternof LOH throughout the genome using the dChipSNP program as described
(12). In addition, signal intensity analysis was used to distinguish LOH
events caused by hemizygous deletion from those resulting from copyneutral events as reported previously (13).
Expression profiling and pathway enrichment analysis. We havegenerated gene expression profiles of 76 primary pheochromocytomas
representative of all known genetic backgrounds (14). Four tumors from
the FP1 family (03, 05, 09, and 11 as labeled in Fig. 1) were included in
the transcription analysis. In the present study, we did two strategies.First, we used the transcription clustering distribution as a filter to
screen for additional ‘‘FP1-like’’ pheochromocytomas. This approach
involved a genome-wide LOH analysis of tumors that clustered with
samples from the FP1 family. Next, we extended the supervised analysisby comparing FP1 tumors with well-known genetic defects (i.e., MEN 2,
VHL, or samples with SDH mutations) in a pairwise manner. This was
done using k-nearest neighbor and weighed voting supervised machine
learning algorithms as described (14–16). Models were evaluated usingleave-one-out cross-validation (15, 16). Probes to be used in the models
were selected by ranking the genes according to the signal-to-noise
metric (15).
Gene set enrichment analysis (GSEA) was used to gather insights into
the functional classes and mapping position of genes associated with theFP tumors by comparison with the other genetic classes with known
mutations (17, 18). GSEA considers predefined gene sets representing
pathways or chromosomal areas of interest and determines whether the
members of these sets are positively or inversely correlated with a specificphenotype or class distinction.
Results
A familial cluster of pheochromocytoma. A large kindred ofBrazilian-Portuguese extract with 13 siblings and their offspringwere evaluated and followed clinically (Fig. 1). No consanguineousmarriage was reported. The index case, a female patient with typicaladrenergic symptoms, was diagnosed with bilateral adrenalpheochromocytoma at age 34 years. Five of 13 screened siblings,ages 36 to 55 years, who were hypertensive, were found to haveadrenal pheochromocytoma, including 1 bilateral case. Only minornoradrenaline elevation, and in one case adrenaline elevation, wasdetected in plasma or urine after multiple samplings of all theseindividuals. Histologic and immunohistochemical confirmation wasobtained in all cases, and areas of hyperplasia were noted adjacent tothe limits of pheochromocytoma in each case. No additionalpheochromocytomas have been detected in other family membersin 8 years since the last diagnosis. Both clinical and genetic screensexcluded MEN 2A or B, VHL, NF1, or PGL syndromes as being theprimary genetic defect in this family, suggesting that this is a novelhereditary pheochromocytoma variant (19).
Cancer Research
Cancer Res 2005; 65: (21). November 1, 2005 9652 www.aacrjournals.org
Research. on March 3, 2016. © 2005 American Association for Cancercancerres.aacrjournals.org Downloaded from

Genome-wide scan identifies two loci consistent withlinkage. Parental haplotypes were not available and phase wasinferred based on the haplotypes of the entire offspring. The resultsof the genome scan are provided as Supplementary Data. With theAD model, 33% of the genome were excluded with LOD scoreslower than �2.0. Another 51% of the genome had scores between�2 and 0. Only 7% of the markers produced LOD scores higherthan 1 and those regions were reanalyzed at a higher density.Maximum (and identical) LOD scores were found with markerslocated on chromosomes 2 and 16 (Fig. 2; Supplementary Data).Haplotype analysis revealed that affected individuals shared bothmaternal and paternal haplotypes in these two regions. Thus, theanalysis was also done under the assumption of an AR model.On chromosome 2, the peak LOD score of the AR analysis was
2.97 (Fig. 2). Recombination events in individual 09 defined thelinked area to 31.5 cM delimited by markers D2S337 and D2S2209.For the AD model, maximum LOD score was 1.50 delimited byrecombination in individuals 09 and 19 between markers D2S337
and D2S368 (Fig. 1). Analysis of chromosome 16 resulted in similarscores: peak LOD of 2.97 was obtained with the AR model andrecombination events delimited the region between markersD16S407 and D16S499 (Figs. 1 and 2). Maximum LOD score of1.50 was found between markers D16S423 and D16S499 using theAD model. Corresponding nonparametric Z-mean in both regionswas 7.57 (P < 0.0001).The linkage results of eight siblings, six affected and two
clinically unaffected cases, using SNP genotypes were in completeagreement with the microsatellite-based analysis on both chro-mosomes 2 and 16 loci and yielded highly similar LOD and Z-meanscores (Supplementary Data). The limits of the linked area definedby recombination events were largely concordant with theconventional linkage data and were delimited in the AR modelby a 28.5-cM region on chromosome 2 and a 23.4-cM area onchromosome 16 (Supplementary Data).Of note, although the frequency of one parental haplotype in
the sibship seemed overrepresented at the chromosome 2 region,
Figure 1. Digenic inheritance of familial pheochromocytoma. Sibship with six individuals with pheochromocytoma (four unilateral, top left, filled symbols ; twobilateral, top right, filled symbols ) with haplotypes at chromosomes 2 and 16 loci are displayed. The age at diagnosis and/or screening is indicated for each individual.The boxed area represents the regions shared by all six affected individuals at both parental alleles (one parental allele is dotted and the other is gray). Thegray-colored allele was deleted in all tumors from this family. Individuals in the sibship are identified by numbers on top row (same as in Fig. 3).
Novel Familial Pheochromocytoma Loci
www.aacrjournals.org 9653 Cancer Res 2005; 65: (21). November 1, 2005
Research. on March 3, 2016. © 2005 American Association for Cancercancerres.aacrjournals.org Downloaded from

this difference was not significant when the binomial distributionof the parental haplotypes was estimated (P = 0.092 and 0.267 foreach parental allele, respectively). Likewise, the frequency ofparental haplotype distribution at the chromosome 16 locus wasunremarkable (P = 0.581 for both parental alleles).Two-locus analysis suggests an interactive effect of
chromosomes 2 and 16 loci in the familial pheochromocytomainheritance. Maximum LOD scores obtained with the two-locusanalysis using a multiplicative model were 5.16, higher than thoseobtained with the heterogeneity and additive models (Table 1).This suggests that the two loci interact in a synergistic manner todetermine the pheochromocytoma phenotype. Conversely, theLOD scores obtained with the additive and heterogeneity modelwere similar to those calculated for each chromosome in thesingle-locus analysis (Fig. 2). Thus, taken together, the results ofthe two-locus analysis are consistent with a multiplicative, doublerecessive model of inheritance whereby chromosomes 2 and 16genes are equally necessary for tumor development.Nonrandom loss of heterozygosity is detected in the novel
familial pheochromocytoma tumors at the chromosome2 locus. LOH at the chromosome 2 locus was detected in alleight tumors from affected individuals by microsatellite analysis(data not shown) and, in four tumors, by SNP array methods(Fig. 3A). In all cases, the same parental allele was retained,indicating the nonrandom nature of the deletion (Fig. 1).Furthermore, copy number analysis of SNP data based on signal
intensity indicates that the observed LOH at 2q is the result ofchromosomal loss rather than copy-neutral events, such as mitoticnondisjunction followed by duplication of one parental chromo-some (Fig. 3B). The limits of LOH were highly concordant amongall tumors from this sibship and the resulting overlap with thelinked region by the AR model refined the target locus to aninterval delimited by markers D2S2216 and D2S2209. A moreconservative view using the larger limits of the linked regionpredicted by the AD model defines the minimal area of overlapbetween markers D2S2216 and D2S368.In contrast to the finding on chromosome 2, despite high-
density, detailed analysis, no LOH or copy number changessuggestive of deletion or amplification were detected in the FPtumors at the chromosome 16 locus (data not shown). Only 1 of 36additional pheochromocytomas tested showed LOH at this locus:this was a metastatic pheochromocytoma with a deletion thatspanned all tested markers on 16 as well as on other chromosomes.Due to the high degree of genetic instability of this tumor, thespecificity of the 16p finding is unclear. Thus, although the two-locus analysis indicates a requirement for both loci for the diseasephenotype, the lack of LOH suggests that the candidatechromosome 16 gene functions through a different mechanism.Additional FP-like pheochromocytomas are identified
through transcription profiling and loss of heterozygosityscreen. We generated global profiles of four FP tumors to define atranscription signature that might offer insights into the mechanism
Figure 2. Results of linkage analysis. Graph display of parametric AD and AR (top ) and nonparametric linkage (bottom ) results of chromosome 2 (left ) andchromosome 16 (right ). Microsatellite-derived data are shown on the X axis with markers distributed along each chromosome according to the Marshfield genetic map.LOD (top ) or Z -mean (bottom ) scores for parametric and nonparametric analysis, respectively, are displayed on the Y axis. Similar results were obtained withSNP-based linkage analysis (Supplementary Data).
Cancer Research
Cancer Res 2005; 65: (21). November 1, 2005 9654 www.aacrjournals.org
Research. on March 3, 2016. © 2005 American Association for Cancercancerres.aacrjournals.org Downloaded from

of disruption underlying these tumors aswell as to function as a filterfor similar subtypes of pheochromocytomas. Pheochromocytomasand paragangliomas of a variety of genetic backgrounds wereincluded in this analysis. FP tumors formed a cluster, whichsegregated closely with MEN 2– and NF1-derived pheochromocy-tomas (Fig. 4A), whereas tumors with VHL and SDHB or SDHD(SDH) mutations constituted a separate branch (14). To identifydistinguishing features of the FP tumors that might offer clues tothe identity of the susceptibility gene, we applied supervisedlearning methods to the expression data. Independent gene setswere generated from two-class comparisons between FP tumorsand either VHL-, SDH-, or MEN 2-related pheochromocytomas(Supplementary Data). These two-class comparisons are efficientmethods to highlight genes that underlie the differences betweenpredetermined groups of samples. Cross-validation analysis derivedfrom the comparisons between FP � VHL and FP � SDH tumorsindicate that FP is a separable, distinct tumor class based on itsgene expression profile (Supplementary Data). A less cleardistinction was noted between FP and MEN 2 tumors, indicatingthat these two tumor classes share similar transcription patterns(Supplementary Data). These analyses were further enhanced bythe inclusion of additional FP-like tumors identified by LOH screen(see below; Supplementary Data).GSEA of the FP tumors identified genes involved in GTPase
activity, lysosomal and vacuolar functions, and protein synthesisand translation to be statistically overrepresented in FP tumorsin relation to VHL and SDH pheochromocytomas (Table 2).Importantly, chromosome 2q genes present in the array weresignificantly underexpressed in FP pheochromocytomas (GSEA,P < 0.01), in agreement with the genomic loss observed in alltumors from this family.Because chromosome 2 LOH was the hallmark of FP tumors, we
decided to search for new FP-like pheochromocytomas byperforming LOH analysis at the target chromosome 2 locus insamples that clustered in the vicinity of the FP samples by expressionprofiling (Fig. 4A). Thirteen tumors for which DNA was availablewere used for this screen. Three of these pheochromocytomas werefamilial cases with no identifiable mutation, one tumor was from aNF1 patient, another from a MEN 2 case, and the remaining eightwere apparently sporadic samples. With this approach, we detectedfour tumors (three unknown familial and one sporadic) with LOHwithin the target region, one of which displayed a markedly smallerregion of deletion that overlapped with the FP locus (Fig. 4B). Wenext decided to extend the LOH analysis to an independent group of
49 sporadic and familial pheochromocytomas using microsatellite-and/or SNP-based approaches. Fourteen of these tumors revealedLOH of at least two consecutive markers within this area. In total,18 of 62 (29%) pheochromocytomas had detectable LOH atchromosome 2q (Fig. 4C).The consensus region of overlap between the LOH area and the
linked region is delimited by markers D2S2222 and D2S2209 (Fig.4C). The length of deletion at the chromosome 2 locus was variableamong the 18 tumors with LOH and in some cases did not overlapwith the putative linked region. However, six adrenal pheochromo-cytomas (three bilateral cases) had a pattern virtually identical to theoriginal FP1 tumors (Fig. 4C). Likewise, these bilateral tumors withchromosome 2q LOH were negative for mutations in the knownpheochromocytoma susceptibility genes. Although no additionalcases were available for linkage analysis, the combination of clinicalfeatures (tumor bilaterality), allele-specific LOH, and similartranscription profiling suggest that these three families are likely
Table 1. Results of two-locus versus single-locusparametric and nonparametric linkage analysis donewith SNP-based genotype data of the FP1 kindred
Analysis model LOD* NPL P
Two locusMultiplicative 5.16 7.91 0.000024
Additive 2.76 7.91 0.000024
Heterogeneity 2.76 7.91 0.000024Single locus
Chromosome 2 2.97 7.5 0.000977
Chromosome 16 2.97 7.5 0.000977
*Parametric analysis assumed a recessive trait.
Figure 3. LOH of the chromosome 2 FP locus. A, chromosome 2 LOH analysisof four of eight pheochromocytomas from the family described in this study isdisplayed using the dChip program. Paired normal and tumor (T ) samples arenumbered as in Fig. 1. Inferred LOH areas are colored in blue and retention ofheterozygosity is in yellow. The blue line within the shaded area on the rightindicates the LOH score. B, copy number analysis of the same samples indicatesloss of one copy of the 2q arm (arrow, proximal limit of deletion). Color scale(bottom ) indicates copy number and SDs from the mean. Red, high copynumber; white, zero copy. The blue line within the gray area on the rightindicates average copy number along chromosome 2. The short arm ofchromosome 2 contains two copies (red vertical line indicates average copynumber = 2 on the right).
Novel Familial Pheochromocytoma Loci
www.aacrjournals.org 9655 Cancer Res 2005; 65: (21). November 1, 2005
Research. on March 3, 2016. © 2005 American Association for Cancercancerres.aacrjournals.org Downloaded from

linked to the same locus on chromosome 2. In the absence of asimilar marker for the chromosome 16, it is not possible to infer ifthis second locus contributes to the phenotype of the additional FP1-like families.
Discussion
Pheochromocytomas represent a unique paradigm of geneticdiversity and have therefore served as engines of gene discovery: atleast six independent genes have been described in the context ofhereditary pheochromocytoma syndromes (2, 20). We report here ona novel familial variant of these tumors. The linkage studies revealedtwo loci, at chromosomes 2 and 16, with identical scores on bothparametric and nonparametric analyses. Although the large numberof affected cases in this sibship (6 of 13) approaches the expectedfrequency for dominantly inherited traits, haplotype analysisrevealed that all affected cases share both parental alleles onchromosomes 2 and 16 loci consistent with recessive inheritancefrom both regions. This differs from other known FP syndromes thatare inherited through an AD pattern as well as from other hereditarycancers that only rarely result from recessive traits (21–23).Interestingly, a recessive pheochromocytoma syndrome wasreported in rats, and the susceptibility locus was mapped to aregion that is syntenic to human chromosome 10 (24, 25).The hereditary pheochromocytoma syndrome described in our
study presents consistent, nonrandom LOH at the chromosome 2but not chromosome 16 locus. This is in agreement with a classictwo-hit model of tumor suppressor genes at the 2q locus (26). Toreconcile the unusual combination of a recessive disorder withcoexistent LOH at the somatic level, we propose a model wherebyone of the two mutant alleles confers a null phenotype, whereas thesecond allele is hypomorphic at the chromosome 2 locus. Thiscompound ‘‘null/hypomorphic’’ heterozygous state would predis-pose to cell growth at the somatic tissue and consequently cause ahyperplastic state at the target cells (i.e., chromaffin cells). Deletionof the hypomorphic allele would be required as a second ‘‘hit,’’
Figure 4. Integration of expression profile and LOH analysis ofpheochromocytomas. A, unsupervised hierarchical clustering distribution ofpheochromocytomas based on transcription pattern; one of two major clusters isshown. Individual tumor samples are shown by numbers (top row ), geneticclass (middle row ), and anatomic location (bottom row ). The cluster shown iscomposed of pheochromocytomas from MEN 2 (M ), NF1 (N ), or sporadic (S) aswell as uncharacterized FP (indicated by 1, 2, or 4). Four tumors from theFP1 kindred (FP03, FP05, FP09, and FP11 in blue) are labeled 1 on middle row.Tumor location is adrenal (A) or extra-adrenal (E ). B, DNA samples from 4 FP1and 13 other closely clustered tumors shown in (A) were analyzed for LOHusing a genome-wide SNP-based platform (Mapping 10K array). Results ofchromosome 2 are shown. Tumor samples are shown in columns and individualSNPs are displayed in rows according to the mapping location along chromosome2. Yellow, retention of heterozygosity; blue, LOH; white, regions with no markers oruncertain LOH status. LOH prevalence score (0-1, shown as a blue line on theshaded area) indicates overlapping areas of LOH. SNPs within the region with thehighest scores are shown in blue (left). The sample number and color code are thesame as shown on top. C, a total of 18 pheochromocytomas, including tumorsshown in (A) (asterisks) and those resulting from standard microsatellite or SNParray methods, have LOH at the chromosome 2 locus. Six of these tumors(horizontal bracket) were bilateral pheochromocytomas from three individuals. TheLOH score is shown on the shaded area on the right. Markers are orderedaccording to the Marshfield genetic map.
Table 2. Significantly enriched pathways in FPpheochromocytomas in comparison with other hereditarypheochromocytoma classes
Pathways/functional classes DM_GSEA*
Response to stress 0.002
Peroxisome 0.004DNA repair 0.006
Lysosome 0.01
Vacuole 0.01
Endocytosis 0.02Complement activation 0.02
RNA polymerase subunit 0.02
GTPase activity 0.03Regulation of translational initiation 0.04
Protein synthesis factor 0.04
Translation factor activity 0.05
Calcium channels 0.05Glutamate metabolism 0.05
RNA associated 0.05
*DM_GSEA: significance of enrichment as described in Methods.
Cancer Research
Cancer Res 2005; 65: (21). November 1, 2005 9656 www.aacrjournals.org
Research. on March 3, 2016. © 2005 American Association for Cancercancerres.aacrjournals.org Downloaded from

which could progressively evolve to pheochromocytoma. Testing ofthis hypothesis will be possible with characterization of the FPmutation at 2q.The identification of a second linked locus at chromosome 16p13
in this family is consistent with a digenic inheritance. The two-locustrait analysis supports a multiplicative or synergistic model toexplain the relationship between the two loci (9). Of note, the 16p13region overlaps that of a recently described familial neuroblastomalocus (27). Pheochromocytoma and neuroblastoma share a commonsympathoadrenal origin and could conceivably share a genetic link.However, although LOH at the 16p13 region was detected inneuroblastomas (24), we have not identified chromosomal gainsand/or losses at the 16p locus in the FP pheochromocytomas. Therobust and concordant findings of the two independent linkageanalyses are consistent with a role for this locus in the diseasephenotype. Hence, it is possible that a distinct mechanism oftumorigenesis may operate at the putative chromosome 16 locusthat does not require gross structural defects.Expression profiling suggests that FP tumors resemble pheochro-
mocytomas derived from MEN 2 and NF1. It is plausible thereforethat the FP susceptibility gene(s) may encode functions associatedwith those of mutated RET and NF1 genes. Most genes in the targetregion have no ascribed function, but those believed to be involved inthe signals highlighted by the GSEA are potential candidates to befurther explored. Pairing of expression-based clustering with LOHanalysis of pheochromocytomas allowed the identification ofadditional FP pheochromocytomas. The distinction between theeffects of genotype from those of loss of chromosome 2 is not trivialin these tumors, especially because our hypothesis is that these arenot independent events. It is possible that low expression of 2q genesin tumors without LOH reflects other mechanisms of down-regulation, such as methylation or microRNA-based repression(28). Our data suggest that integration of global genomic approachescan be successfully used to help in the identification of the primarygenetic defect in familial disorders. This concept has been recentlyvalidated not only for studies of monogenic diseases (29) but also forquantitative trait loci by deriving genetic transmission patterns ofcotranscribed genes (30–32).In conclusion, we identified two novel susceptibility loci
consistent with a recessive form of pheochromocytoma onchromosomes 2 and 16. These findings broaden the spectrum ofgenetic defects and mode of inheritance of pheochromocytomasand might signal the existence of other familial forms of the tumorthat could result from defects in more than one gene. Although therole of these genes in more common forms of disease still remainsto be determined, the initial chromosome 2 LOH data fromsporadic tumors suggest that the FP locus may be relevant for abroader group of pheochromocytomas.
Appendix
Familial Pheochromocytoma Consortium members and theiraffiliations: Gail Adler (Brigham and Women’s Hospital, Boston,
MA); Seth M. Arum (Boston Medical Center, Boston, MA); MartaBarontini (Center of Endocrinology Investigations, Buenos Aires,Argentina); Diana E. Benn (Royal North Shore Hospital andKolling Institute of Medical Research, University of Sydney,Sydney, New South Wales, Australia); Ana Valeria B. de Castro(Universidade Estadual Paulista, Botucatu, Sao Paulo, Brazil);Robert Dluhy (Brigham and Women’s Hospital, Boston, MA);Judy Garber (Department of Population Sciences, Dana-FarberCancer Institute, Harvard Medical School, Boston, MA); JohnGodine (Massachusetts General Hospital, Diabetes Center,Boston, MA); Ashley Grossman (St. Bartholomew’s Hospital,London, United Kingdom); Shirin Haddady (Division of Endocri-nology, University of Massachusetts Memorial Medical Center,Worcester, MA); Shannon Heitritter (Brigham and Women’sHospital, Boston, MA); Richard Hodin (Department of Surgery,Massachusetts General Hospital, Boston, MA); Marta Korbonits(St. Bartholomew’s Hospital, London, United Kingdom); FrancisMoore, Jr. (Brigham and Women’s Hospital, Boston, MA); CeliaNogueira (Universidade Estadual Paulista, Botucatu, Sao Paulo,Brazil); Vania Nose (Department of Pathology, Brigham andWomen’s Hospital, Boston, MA); I. Tolgay Ocal (Yale University,New Haven, CT); Pascal Pigny (Regional University Hospital,Center Hospitalier Regional Universitaire, Lille, France); James A.Powers (Tufts New England Medical Center, Boston, MA); BruceG. Robinson (Royal North Shore Hospital and Kolling Institute ofMedical Research, University of Sydney, Sydney, New SouthWales, Australia); Marie Rosales (Division of Endocrinology,University of Massachusetts Memorial Medical Center, Worcester,MA); Gabriela Sanso (Center of Endocrinology Investigations,Buenos Aires, Argentina); Sandro Santagata (Department ofPathology, Brigham and Women’s Hospital, Boston, MA); KathySchneider (Department of Population Sciences, Dana-FarberCancer Institute, Harvard Medical School, Boston, MA); JulieAnn Sosa (Yale University, New Haven, CT); and Arthur S.Tischler (Tufts New England Medical Center, Boston, MA).
Acknowledgments
Received 4/26/2005; revised 7/5/2005; accepted 8/17/2005.Grant support: Charles A. Dana Foundation Project in Neuro-Oncology
(C.D. Stiles), NIH grants NS047572-01A1 (C.D. Stiles) and R01HG02341 (K. Hao),and Claudia Adams Barr Investigator Award and Pan-Mass Agencourt SequencingGrant (P.L.M. Dahia).
The costs of publication of this article were defrayed in part by the payment of pagecharges. This article must therefore be hereby marked advertisement in accordancewith 18 U.S.C. Section 1734 solely to indicate this fact.
We thank the patients and families that participated in this study for theircooperation, Dr. Aravinda Chakravarti (John Hopkins University School of Medicine,Baltimore, MD) for critical review of the manuscript, Dr. Kathy Lunnetta (GenomicsCollaborative, Inc., Cambridge, MA) for statistical advice, Dr. David Hill (Dana-FarberCancer Institute, Boston, MA) and Dr. Scott Pomeroy (The Children’s Hospital,Boston, MA) for their support, Maria das Gracas Cavalcanti and Mathew Wright fortechnical assistance, Drs. Marcos Baena and Claudio Campi de Castro (DiagnosticImaging Center at the Heart Institute, Instituto do Coracao do Hospital das Clınicas,University of Sao Paulo), and General Hospital Tumor Bank, Brain and Tissue Bankfor Developmental Disorders at the University of Maryland and the Microarray CoreFacility at the Dana-Farber Cancer Institute.
References
1. Eisenhofer G, Bornstein SR, Brouwers FM, et al.Malignant pheochromocytoma: current status and ini-tiatives for future progress. Endocr Relat Cancer 2004;11:423–36.
2. Bryant J, Farmer J, Kessler LJ, Townsend RR,Nathanson KL. Pheochromocytoma: the expandinggenetic differential diagnosis. J Natl Cancer Inst 2003;95:1196–204.
3. Astuti D, Hart-Holden N, Latif F, et al. Geneticanalysis of mitochondrial complex II subunits SDHD,
SDHB and SDHC in paraganglioma and phaeochromo-cytoma susceptibility. Clin Endocrinol (Oxf) 2003;59:728–33.
4. Neumann HP, Bausch B, McWhinney SR, et al.Germ-line mutations in nonsyndromic pheochromo-cytoma. N Engl J Med 2002;346:1459–66.
Novel Familial Pheochromocytoma Loci
www.aacrjournals.org 9657 Cancer Res 2005; 65: (21). November 1, 2005
Research. on March 3, 2016. © 2005 American Association for Cancercancerres.aacrjournals.org Downloaded from

5. Kruglyak L, Daly MJ, Reeve-Daly MP, Lander ES.Parametric and nonparametric linkage analysis: a unifiedmultipoint approach. Am J Hum Genet 1996;58:1347–63.
6. Abecasis GR, Cherny SS, Cookson WO, Cardon LR.Merlin-rapid analysis of dense genetic maps usingsparse gene flow trees. Nat Genet 2002;30:97–101.
7. Leykin I, Hao K, Cheng J, et al. Comparative linkageanalysis and visualization of high-density oligonucleo-tide SNP array data. BMC Genet 2005;6:7.
8. Dietter J, Spiegel A, an Mey D, et al. Efficient two-trait-locus linkage analysis through program optimi-zation and parallelization: application to hypercholes-terolemia. Eur J Hum Genet 2004;12:542–50.
9. Al-Kateb H, Bahring S, Hoffmann K, et al. Mutation inthe ARH gene and a chromosome 13q locus influencecholesterol levels in a new form of digenic-recessivefamilial hypercholesterolemia. Circ Res 2002;90:951–8.
10. Dahia PL, Marsh DJ, Zheng Z, et al. Somaticdeletions and mutations in the Cowden disease gene,PTEN, in sporadic thyroid tumors. Cancer Res 1997;57:4710–3.
11. Lin M, Wei L-J, Sellers WR, et al. dChipSNP:significance curve and clustering of SNP-array-basedloss-of-heterozygosity data. Bioinformatics 2004;20:1233–40.
12. Janne PA, Li C, Zhao X, et al. High-resolution single-nucleotide polymorphism array and clustering analysisof loss of heterozygosity in human lung cancer cell lines.Oncogene 2004;23:2716–26.
13. Zhao X, Li C, Paez JG, et al. An integrated view ofcopy number and allelic alterations in the cancergenome using single nucleotide polymorphism arrays.Cancer Res 2004;64:3060–71.
14. Dahia PLM, Ross K, Wright ME, et al. A HIF1aregulatory loop links hypoxia and mitochondrial signalsin pheochromocytomas. PLoS Genet 2005;1:e8.
15. Golub TR, Slonim DK, Tamayo P, et al. Molecularclassification of cancer: class discovery and class pre-diction by gene expression monitoring. Science 1999;286:531–7.
16. Armstrong SA, Staunton JE, Silverman LB, et al. MLLtranslocations specify a distinct gene expression profilethat distinguishes a unique leukemia. Nat Genet 2002;30:41–7.
17. Mootha VK, Lindgren CM, Eriksson KF, et al. PGC-1a-responsive genes involved in oxidative phosphoryla-tion are coordinately downregulated in human diabetes.Nat Genet 2003;34:267–73.
18. Sweet-Cordero A, Mukherjee S, Subramanian A, et al.An oncogenic KRAS2 expression signature identified bycross-species gene-expression analysis. Nat Genet 2005;37:48–55.
19. Aguiar RC, Cox G, Pomeroy SL, Dahia PL.Analysis of the SDHD gene, the susceptibility genefor familial paraganglioma syndrome (PGL1), in pheo-chromocytomas. J Clin Endocrinol Metab 2001;86:2890–4.
20. Maher ER, Eng C. The pressure rises: update on thegenetics of phaeochromocytoma. Hum Mol Genet 2002;11:2347–54.
21. Sieber OM, Lipton L, Crabtree M, et al. Multiplecolorectal adenomas, classic adenomatous polyposis,and germ-line mutations in MYH. N Engl J Med 2003;348:791–9.
22. Bagby GC, Jr. Genetic basis of Fanconi anemia. CurrOpin Hematol 2003;10:68–76.
23. Hemminki K, Li X. Age-specific familial risks for renalcell carcinoma with evidence on recessive heritableeffects. Kidney Int 2004;65:2298–302.
24. Fritz A, Walch A, Piotrowska K, et al. Recessivetransmission of a multiple endocrine neoplasia syn-drome in the rat. Cancer Res 2002;62:3048–51.
25. Piotrowska K, Pellegata NS, Rosemann M, et al.Mapping of a novel MEN-like syndrome locus to ratchromosome 4. Mamm Genome 2004;15:135–41.
26. Knudson AG. Mutation and cancer: statistical study ofretinoblastoma. Proc Natl Acad Sci U S A 1971;68:820–3.
27. Maris JM, Weiss MJ, Mosse Y, et al. Evidence for ahereditary neuroblastoma predisposition locus at chro-mosome 16p12-13. Cancer Res 2002;62:6651–8.
28. Lim LP, Lau NC, Garrett-Engele P, et al. Microarrayanalysis shows that some microRNAs downregulatelarge numbers of target mRNAs. Nature 2005;433:769–73.
29. Mootha VK, Lepage P, Miller K, et al. Identification ofa gene causing human cytochrome c oxidase deficiencyby integrative genomics. Proc Natl Acad Sci U S A 2003;100:605–10.
30. Bystrykh L, Weersing E, Dontje B, et al. Uncoveringregulatory pathways that affect hematopoietic stem cellfunction using ‘‘genetical genomics.’’ Nat Genet 2005;37:225–32.
31. Chesler EJ, Lu L, Shou S, et al. Complex trait analysisof gene expression uncovers polygenic and pleiotropicnetworks that modulate nervous system function. NatGenet 2005;37:233–42.
32. Hubner N, Wallace CA, Zimdahl H, et al. Integratedtranscriptional profiling and linkage analysis for iden-tification of genes underlying disease. Nat Genet 2005;37:243–53.
Cancer Research
Cancer Res 2005; 65: (21). November 1, 2005 9658 www.aacrjournals.org
Research. on March 3, 2016. © 2005 American Association for Cancercancerres.aacrjournals.org Downloaded from

2005;65:9651-9658. Cancer Res Patricia L.M. Dahia, Ke Hao, John Rogus, et al. Integrative GenomicsNovel Pheochromocytoma Susceptibility Loci Identified by
Updated version
http://cancerres.aacrjournals.org/content/65/21/9651
Access the most recent version of this article at:
Material
Supplementary
http://cancerres.aacrjournals.org/content/suppl/2005/10/31/65.21.9651.DC1.html
Access the most recent supplemental material at:
Cited articles
http://cancerres.aacrjournals.org/content/65/21/9651.full.html#ref-list-1
This article cites 32 articles, 12 of which you can access for free at:
Citing articles
http://cancerres.aacrjournals.org/content/65/21/9651.full.html#related-urls
This article has been cited by 13 HighWire-hosted articles. Access the articles at:
E-mail alerts related to this article or journal.Sign up to receive free email-alerts
Subscriptions
Reprints and
To order reprints of this article or to subscribe to the journal, contact the AACR Publications
Permissions
To request permission to re-use all or part of this article, contact the AACR Publications
Research. on March 3, 2016. © 2005 American Association for Cancercancerres.aacrjournals.org Downloaded from