Novel Breast Cancer Biomarkers Identified by Integrative Proteomic and Gene Expression Mapping
11
Novel Breast Cancer Biomarkers Identified by Integrative Proteomic and Gene Expression Mapping Keli Ou, †,| Kun Yu, ‡ Djohan Kesuma, †,| Michelle Hooi, † Ning Huang, † Wei Chen, † Suet Ying Lee, † Xin Pei Goh, † Lay keng Tan, † Jia Liu, † Sou Yen Soon, † Suhaimi Bin Abdul Rashid, # Thomas C. Putti, # Hiroyuki Jikuya, †,| Tetsuo Ichikawa, †,| Osamu Nishimura, § Manuel Salto-Tellez, # and Patrick Tan* ,†,|,⊥,¶ Agenica Research Pte Ltd., National Cancer Centre of Singarope, and Genome Institute of Singapore, 11 Hospital Drive, Singapore 169610, Shimadzu (Asia Pacific), 16 Science Park Drive, Singapore 118227, Shimadzu Corporation, Kyoto, Japan 604-8511, National University of Singapore, 10 Kent Ridge Crescent, Singapore 119260, and Duke-NUS Graduate Medical School, 2 Jalan Bukit Merah, Singapore 169547 Received December 6, 2007 Proteomic and transcriptomic platforms both play important roles in cancer research, with differing strengths and limitations. Here, we describe a proteo-transcriptomic integrative strategy for discovering novel cancer biomarkers, combining the direct visualization of differentially expressed proteins with the high-throughput scale of gene expression profiling. Using breast cancer as a case example, we generated comprehensive two-dimensional electrophoresis (2DE)/mass spectrometry (MS) proteomic maps of cancer (MCF-7 and HCC-38) and control (CCD-1059Sk) cell lines, identifying 1724 expressed protein spots representing 484 different protein species. The differentially expressed cell-line proteins were then mapped to mRNA transcript databases of cancer cell lines and primary breast tumors to identify candidate biomarkers that were concordantly expressed at the gene expression level. Of the top nine selected biomarker candidates, we reidentified ANX1, a protein previously reported to be differentially expressed in breast cancers and normal tissues, and validated three other novel candidates, CRAB, 6PGL, and CAZ2, as differentially expressed proteins by immunohistochemistry on breast tissue microarrays. In total, close to half (4/9) of our protein biomarker candidates were successfully validated. Our study thus illustrates how the systematic integration of proteomic and transcriptomic data from both cell line and primary tissue samples can prove advantageous for accelerating cancer biomarker discovery. Keywords: breast cancer • proteomics • transcriptomics • bioinformatics • integrative genomics Introduction Breast cancer is a major worldwide cause of morbidity and mortality in females. 1,2 Patients diagnosed with early stage breast cancer have been shown to experience significantly improved survival compared to late stage patients, 3 making the identification of molecular biomarkers to facilitate early detec- tion and screening an important goal. 3–6 Currently, the majority of biomarkers in clinical use are either protein or antibody based, due to their high sensitivity and specificity, reproduc- ibility, and robustness to different sample types including paraffin-embedded archival samples, frozen samples, and body fluids. The need for novel cancer biomarkers has contributed significantly to the increasing number of proteomic studies analyzing cancer cells and tumors of various types. 7–9 A significant limitation, however, is that the proteomic analysis of primary tumor samples is widely recognized in the field as highly technically challenging. First, primary tumors are often small in quantity and often contain several distinct cellular populations including tumor cells, stroma, immune cells, and blood vessels, which can often lead to significant variability in protein profiles between different individuals. 10 Second, protein contributions from different compartments, particularly blood, can often overwhelm tumor-intrinsic signals due to the pres- ence of highly abundant plasma proteins such as IgG and serum albumin. Third, it is still prohibitive at most centers to proteomically profile a statistically meaningful number of primary tissue samples in terms of cost, labor, and time. While tumor cell lines are a convenient alternative where large amounts of genetically homogeneous material can be gener- ated, the extension of proteomic cell line studies to the primary tumor setting is often confounded by differences associated with in vitro and in vivo growth. 10 * To whom correspondence should be addressed. Dr. Patrick Tan, Duke- NUS Graduate Medical School, 2 Jalan Bukit Merah, Singapore 169547. Tel: (+65) 64368345. Fax: (+65) 62265694. E-mail: [email protected]. † Agenica Research Pte Ltd. | Shimadzu (Asia Pacific) Pte Ltd. ‡ National Cancer Centre of Singapore. # National University of Singapore. § Shimadzu Corp. ⊥ Genome Institute of Singapore, 60 Biopolis Street, Singapore 138672. ¶ Duke-NUS Graduate Medical School. 1518 Journal of Proteome Research 2008, 7, 1518–1528 10.1021/pr700820g CCC: $40.75 2008 American Chemical Society Published on Web 03/05/2008
-
Upload
independent -
Category
Documents
-
view
0 -
download
0
Transcript of Novel Breast Cancer Biomarkers Identified by Integrative Proteomic and Gene Expression Mapping

Novel Breast Cancer Biomarkers Identified by Integrative Proteomic
and Gene Expression Mapping
Keli Ou,†,| Kun Yu,‡ Djohan Kesuma,†,| Michelle Hooi,† Ning Huang,† Wei Chen,†
Suet Ying Lee,† Xin Pei Goh,† Lay keng Tan,† Jia Liu,† Sou Yen Soon,†
Suhaimi Bin Abdul Rashid,# Thomas C. Putti,# Hiroyuki Jikuya,†,| Tetsuo Ichikawa,†,|
Osamu Nishimura,§ Manuel Salto-Tellez,# and Patrick Tan*,†,|,⊥,¶
Agenica Research Pte Ltd., National Cancer Centre of Singarope, and Genome Institute of Singapore,11 Hospital Drive, Singapore 169610, Shimadzu (Asia Pacific), 16 Science Park Drive, Singapore 118227,
Shimadzu Corporation, Kyoto, Japan 604-8511, National University of Singapore,10 Kent Ridge Crescent, Singapore 119260, and Duke-NUS Graduate Medical School,
2 Jalan Bukit Merah, Singapore 169547
Received December 6, 2007
Proteomic and transcriptomic platforms both play important roles in cancer research, with differingstrengths and limitations. Here, we describe a proteo-transcriptomic integrative strategy for discoveringnovel cancer biomarkers, combining the direct visualization of differentially expressed proteins withthe high-throughput scale of gene expression profiling. Using breast cancer as a case example, wegenerated comprehensive two-dimensional electrophoresis (2DE)/mass spectrometry (MS) proteomicmaps of cancer (MCF-7 and HCC-38) and control (CCD-1059Sk) cell lines, identifying 1724 expressedprotein spots representing 484 different protein species. The differentially expressed cell-line proteinswere then mapped to mRNA transcript databases of cancer cell lines and primary breast tumors toidentify candidate biomarkers that were concordantly expressed at the gene expression level. Of thetop nine selected biomarker candidates, we reidentified ANX1, a protein previously reported to bedifferentially expressed in breast cancers and normal tissues, and validated three other novel candidates,CRAB, 6PGL, and CAZ2, as differentially expressed proteins by immunohistochemistry on breast tissuemicroarrays. In total, close to half (4/9) of our protein biomarker candidates were successfully validated.Our study thus illustrates how the systematic integration of proteomic and transcriptomic data from bothcell line and primary tissue samples can prove advantageous for accelerating cancer biomarker discovery.
Keywords: breast cancer • proteomics • transcriptomics • bioinformatics • integrative genomics
Introduction
Breast cancer is a major worldwide cause of morbidity andmortality in females.1,2 Patients diagnosed with early stagebreast cancer have been shown to experience significantlyimproved survival compared to late stage patients,3 making theidentification of molecular biomarkers to facilitate early detec-tion and screening an important goal.3–6 Currently, the majorityof biomarkers in clinical use are either protein or antibodybased, due to their high sensitivity and specificity, reproduc-ibility, and robustness to different sample types includingparaffin-embedded archival samples, frozen samples, and bodyfluids. The need for novel cancer biomarkers has contributed
significantly to the increasing number of proteomic studiesanalyzing cancer cells and tumors of various types.7–9 Asignificant limitation, however, is that the proteomic analysisof primary tumor samples is widely recognized in the field ashighly technically challenging. First, primary tumors are oftensmall in quantity and often contain several distinct cellularpopulations including tumor cells, stroma, immune cells, andblood vessels, which can often lead to significant variability inprotein profiles between different individuals.10 Second, proteincontributions from different compartments, particularly blood,can often overwhelm tumor-intrinsic signals due to the pres-ence of highly abundant plasma proteins such as IgG andserum albumin. Third, it is still prohibitive at most centers toproteomically profile a statistically meaningful number ofprimary tissue samples in terms of cost, labor, and time. Whiletumor cell lines are a convenient alternative where largeamounts of genetically homogeneous material can be gener-ated, the extension of proteomic cell line studies to the primarytumor setting is often confounded by differences associatedwith in vitro and in vivo growth.10
* To whom correspondence should be addressed. Dr. Patrick Tan, Duke-NUS Graduate Medical School, 2 Jalan Bukit Merah, Singapore 169547. Tel:(+65) 64368345. Fax: (+65) 62265694. E-mail: [email protected].
† Agenica Research Pte Ltd.| Shimadzu (Asia Pacific) Pte Ltd.‡ National Cancer Centre of Singapore.# National University of Singapore.§ Shimadzu Corp.⊥ Genome Institute of Singapore, 60 Biopolis Street, Singapore 138672.¶ Duke-NUS Graduate Medical School.
1518 Journal of Proteome Research 2008, 7, 1518–1528 10.1021/pr700820g CCC: $40.75 2008 American Chemical SocietyPublished on Web 03/05/2008
In parallel to proteomics, gene expression profiling has alsoplayed an important role in the identification of biomarkersignatures for patient prognosis and treatment response pre-diction. Compared to proteomics, expression profiling plat-forms offer relatively higher sensitivity and much higherthroughput, as hundreds of samples can be profiled in arelatively short amount of time.11,12 The major limitation ofgene expression profiling, in the context of protein biomarkerdiscovery, is that there is often a less than perfect correlationbetween gene and protein expression,13,14 and it has beenshown that variations between a gene’s mRNA level and itsprotein abundance can be as high as 30-fold.15 Furthermore,important post-translational modification events, such asprotein phosphorylation or cleaveage events, are obviously notcaptured in gene expression data.16 To improve the efficiencyof biomarker discovery, it would thus be useful to employstrategies combining the advantages of both expression profil-ing and proteomics, while minimizing the limitations of bothplatforms.
To address these problems, we present in this study aintegrated proteo-transcriptomic strategy for biomarker dis-covery combining both the direct protein visualization capacityof proteomics with the high-throughput advantages of geneexpression profiling. Using a two-dimensional electrophoresis(2DE)/mass spectrometry (MS) proteomics platform, total celllysates of breast cancer (e.g., MCF-7 and HCC-38) and controlcell lines (e.g., CCD-1059Sk) were analyzed to identify >1500protein spots. We then used mRNA transcript databases ofbreast cell lines and primary tumors to prioritize these differ-entially expressed proteins by their consistency of gene expres-sion differences between tumors and normal tissues. Using thisstrategy, we identified nine potential breast cancer biomarkercandidates, and independently validated four of them (ANX1,CRAB, 6PGL, CAZ2) by immunohistochemistry on breast cancertissue microarrays. In summary, our results demonstrate howthe integration of proteomic and gene expression data mayprove useful in accelerating biomarker discovery.
Materials and Methods
Cell Lines and Primary Tumors. The ER positive humanbreast carcinoma cell line MCF-7 (ATCC: HTB-22) and thenonmalignant control cell line CCD-1059Sk (ATCC: CRL-2072)were cultured in minimum essential medium (Eagle) andDulbecco’s modified eagle medium, respectively, supplementedwith 2 mM L-glutamine and Earle’s BSS adjusted to contain1.5 g/L sodium bicarbonate, 0.1 mM nonessential amino acids,1 mM sodium pyruvate, and 10% fetal bovine serum. The ERnegative human breast carcinoma cell line HCC-38 (ATCC:CRL-2314) was cultured in RPMI 1640 medium with 2 mML-glutamine adjusted to contain 1.5 g/L sodium bicarbonate,4.5 g/L glucose, 10 mM HEPES, 1 mM sodium pyruvate, and10% fetal bovine serum. The cell lines were cultured in ahumidified incubator with 5% CO2 at 37 °C. Cells were grownto confluence and then incubated with three changes of serum-free medium over 48 h. Cell line samples were prepared bywashing cells with ice-cold PBS and trypsinized for 5 min todetach cells. The suspension was transferred to a 15 mL tubeand the cells were centrifuged at 1000g for 5 min. Thesupernatant was discarded and 1–2 mL of PBS was added toresuspend the cells prior to cell counting. About 5 × 10⁶ cellswere aliquoted into each 1.5 mL Eppendorf tube and centri-fuged at 380g for 10 min. The cell pellets were snap-frozen inliquid nitrogen and stored at -80 °C.
Primary human breast tissues used for protein and mRNAanalyses were obtained from the Singapore National CancerCentre Tissue Repository. Detailed descriptions of samplecollection, archiving, and histological assessment of tumorsincluding techniques and scoring parameters have been previ-ously reported.12
Preparation of Protein Extracts and 2DE Separation. Thesame batch of cell line lysates was split for both protein andmRNA profiling analyses. For each cell line, we profiled 3independently grown batches. For proteomic analysis, each cellline batch was also repeated across 3 to 4 technical replicates.For the first two batches, each of the three cell lines had 3replicate gels at two pH levels (pH 4–7 and pH 6–9), while forthe third batch, each cell line had 3 replicate gels at pH 4–7and 4 replicate gels at pH 6–9. In total, 57 gels were run. Proteinextraction and 2DE separation was carried out as previouslydescribed.17 Briefly, harvested cells were disrupted with acocktail of 7 M urea (Bio-Rad), 2 M thiourea (Fluka Chemie),4% (w/v) CHAPS (GE HealthCare), 1 mM PMSF (Sigma), 50 µg/mL DNAse (Boehringer Mannheim), 50 µg/mL RNAse (Boe-hringer Mannheim), and protein inhibitor cocktail (Sigma, 1mL/108 cells). The resulting cell lysate was sonicated with aprobe sonicator (Misonix, Inc., NY) and centrifuged at 40 000rpm for 20 min to remove cellular debris. The extracted proteinswere cleaned up using a 2D-sample clean up kit (Bio-Rad).Protein quantification was determined using the Bradfordmethod.
The first dimensional protein separation was performed onthe IPGphor IEF system (GE HealthCare) using IPG strips (24cm, pH 4–7 and pH 6–9, respectively, GE HealthCare) that hadbeen rehydrated with 450 µL of rehydration buffer (7 M urea,2 M thiourea, 4% CHAPS, 0.5% IPG buffer, and 20 mM DTT)for 8 h. For the IPG 6–9 strips, the destreak rehydration buffer(GE HealthCare) was used as rehydration solution. Proteinlysates of 200 µg in 80 µL of lysis buffer containing 60 mM DTTand 0.5% IPG buffer were applied through cup loading anodi-cally. The strips were then focused using the following electricalconditions at 20 °C: 300 V for 2 h; 300-1000 V for 3 h; from1000 to 8000 V for 4 h; and 8000 V until a total of 72 000 Vhwas reached. After IEF focusing, the IPG strips were equilibratedin 5 mL of equilibration buffer (pH 6.8) containing 1% DTTand rocked for 15 min. The strips were then soaked in 5 mL ofequilibration buffer (pH 8.8) containing 2.5% IAA and rockedfor 15 min. After equilibration, the strips were transferred onto10% isocratic polyacrylamide slab gels (24 cm × 20 cm × 0.75mm). The IPG gels were sealed with 0.5% (w/v) agarose inrunning buffer (25 mM Tris-HCl, 192 mM glycine, and 0.1%SDS, pH 8.3) on top. The second dimensional separation wasperformed with the Dodeca Cell system (Bio-Rad). The SDS-PAGE was carried out at 17 °C at a constant voltage of 200 Vuntil the dye front reached the bottom of the gels. The gelswere fixed and labeled with Deep Purple fluorescent dye (GEHealthCare) according to the manufacturer’s instructions. Thestained gels were digitized using a Molecular Imager FX system(Bio-Rad) and image analysis was carried out with the PDQuest7.3 image analysis software (Bio-Rad). All data points of gel spotstain intensity were means of 3 or 4 analytical replicates.
MS Identification of Proteins. For protein identification,fluorescence stained gel spots were semiautomatically excised,washed, tryptic-digested, cleaned, and spotted onto the MSsample plate using the Shimadzu Xcise robotic system (Shi-madzu, Kyoto, Japan). The excised gel spots were 1.6 mm indiameter and were washed with 50 mM NH4HCO3, pH 8.8,
Biomarker Discovery by Integrative Proteo-Transcriptomic Mapping research articles
Journal of Proteome Research • Vol. 7, No. 4, 2008 1519

containing 50% acetonitrile (ACN) for 10 min. After dehydrationwith 100% ACN, the gel pieces were rehydrated with 30 µL of50 mM NH4HCO3, pH 8.5, containing 3.3 µg/mL trypsin(Promega, Madison, WI) and incubated at 30 °C overnight. Thesamples were then cleaned and concentrated using µC18ZipTips (Millipore). Finally, the peptide mixtures were elutedwith 1.5 µL of 50% ACN/0.5% TFA onto a MALDI sample plateand mixed with 1 µL of matrices containing 5 mg/mL R-cyano-4-hydroxycinnamic acid (CHCA) plus 5 mg/mL 2,5-dihydroxy-benzoic acid (DHB) in 50% ACN/0.5% TFA prior to MS analysis.MALDI-TOF MS analysis was performed using the AXIMA-CFRplus mass spectrometer (Shimadzu Biotech, Manchester, U.K.).The operating conditions were as follow: nitrogen laser (337nm); reflectron mode; detection of positive ions. The accelera-tion potential was set to 35 kV using a gridless-type electrode.MALDI-TOF MS spectra were acquired in the auto experimentmode, from m/z 800 to 3000, and internally calibrated with twotrypsin autolysis peaks (m/z 842.51 and 2211.10). Peak lists fromPMF spectra were used to automatically search against theUniProt or NCBInr human protein databases using the Ko-mpact program (Shimadzu Biotech, Manchester, U.K.) throughan in-house Mascot server V2.1.04 (Matrix Science, U.K.). Tominimize the chance of false-positive protein identification, thedatabase search results were manually validated based on thefollowing criteria: (1) 0.1 Da or better mass accuracy; (2) mostof the major peaks in the spectrum were matched to the trypticpeptide list of the protein; (3) MW and pI of the identifiedprotein should match the estimated values from 2DE imageanalysis. In our hands, about 67% of the excised protein spotswere positively identified (Table 1). Unidentified protein spotswere excluded from subsequent analysis.
Gene Expression Profiling. Total RNAs were extracted fromhuman tissue or cell line samples with Trizol reagent (Invit-rogen, CA) and hybridized onto Affymetrix U133_plus Gene-Chips following the manufacturer’s standard protocols. Rawscanned files were stored in a central database and qualitycontrolled using GeneData Refiner software (GeneData, Basel,Switzerland). The refined profiles were mean-normalized to anintensity value of 500. Detailed description of the profiles havebeen previously reported.12 The primary tumor gene expressiondata is available from the GEO database under accessionnumber GSE2294.
Statistical Integration of Proteomics and Gene Expres-sion. For enrichment analysis, protein IDs identified by MSanalysis were matched to their corresponding U133_plusprobes using Swiss-Prot IDs (www.affymetrix.com). To checkthe concordance between mRNA and protein levels for a set
of genes, we applied Gene Set Enrichment Analysis (GSEA), acomputational method that determines whether an a prioridefined set of genes shows statistically significant and concor-dant differences between two biological states.18 Briefly, thegene expression profiles of the 3 cell lines were filtered to retaingenes exhibiting >60% of valid values across the data set. A“valid” measurement was defined by a present/absent callgenerated by the MAS5 statistical algorithm provided byAffymetrix. Three replicate hybridizations were performed percell line. The gene list was ranked by the level of geneexpression differences (signal-to-noise ratio) between MCF-7versus CCD-1059Sk and between HCC-38 versus CCD-1059Sk,respectively. The significantly differentially expressed proteinspots selected from the 2DE gel image comparisons were thenmapped to their corresponding mRNAs and used as a testgroup against the ranked gene lists for GSEA analysis. Thesignificance of the GSEA was determined by a sample-basedpermutation test where the sample labels were randomlyshuffled. Concordance of gene and protein expression wasdefined as entities having the same fold change direction (i.e.,>1 or <1), that is, the mRNAs were selected if they had thesame fold change direction as the protein result. No p-valuecutoffs were implemented.
Gene Rank Analysis. Candidate biomarkers were selectedby first excluding candidates showing discordant trends be-tween protein and mRNA levels. The concordantly expressedbiomarkers were further stratified using a Support VectorMachine (SVM) algorithm.19 Briefly, a cohort of 39 breast tissuesamples (7 normal and 32 tumors) was used as the trainingdata set. An SVM algorithm with a linear kernel and a penaltyvalue of 10 was used for cross-validation. After 100 cross-validation runs, the biomarkers were ranked based on theirindividual contributions to the normal versus tumor classifica-tion accuracy. The final set of 9 biomarkers was then furthervalidated against an independent cohort of 5 normal and 31tumor samples.
Tissue Microarray and Immunohistochemical Analysis.Potential biomarker candidates were validated using a breastcancer tissue microarray (TMA) composed of tumor (98) ornormal (98) breast tissues.20 The TMA was constructed usinga tissue arraying instrument (ATA100, Advanced Tissue Arrayer,Chemicon, CA) and 1 mm-diameter tissue cylinders. All tumorsamples were arrayed in duplicate, and histologically verifiedfor sampling accuracy and adequacy. Consecutive sections wereprepared on charged polylysine-coated slides for immunohis-tochemical (IHC) analysis. This approach ensures maximumreliability in the analysis of biomarkers in breast cancer21 andhas been used successfully applied in the validation of biom-arker in previous breast cancer related studies.22 This work wasperformed in the context of a TMA program supported by theInstitutional Review Board of the National University of Sin-gapore (NUS-IRB 05–017).
For TMA immunohistochemistry, individual TMAs weredeparaffinized for 20 min at 60 °C, xylene-rinsed, and rehy-drated in a series of alcohol/water rinses. The primary antibod-ies against the potential biomarkers were obtained either fromcommercial sources or custom-made by BioGene (Berlin,Germany). To ensure accurate optimization for each antibody,we analyzed several concentrations and 4 antigen retrievalmethods per concentration. Antigen retrieval was performedby boiling in one of four different buffers (citrate buffer, Tris-EDTA, DAKP, pH 6.0, or DAKO, pH 9.0) in a pressure cookeror microwave. The custom-made primary antibodies were
Table 1. Comprehensive Proteome Analysis on Three BreastCell Lines (CCD-1059Sk, MCF-7, and HCC-38) Using pH 4–7and pH 6–9 IEF, Respectivelya
cell linesno. of
spots cut
no. ofspots
identified
no. of uniqueproteins
identified %
pH 6–9 CCD-1059Sk 329 196 60MCF-7 323 217 67HCC-38 188 135 72
pH 4–7 CCD-1059Sk 440 315 72MCF-7 624 428 69HCC-38 644 433 67Total 2548 1724 67
a The proteins were identified by peptide mass fingerprinting usingMALDI-TOF MS.
research articles Ou et al.
1520 Journal of Proteome Research • Vol. 7, No. 4, 2008
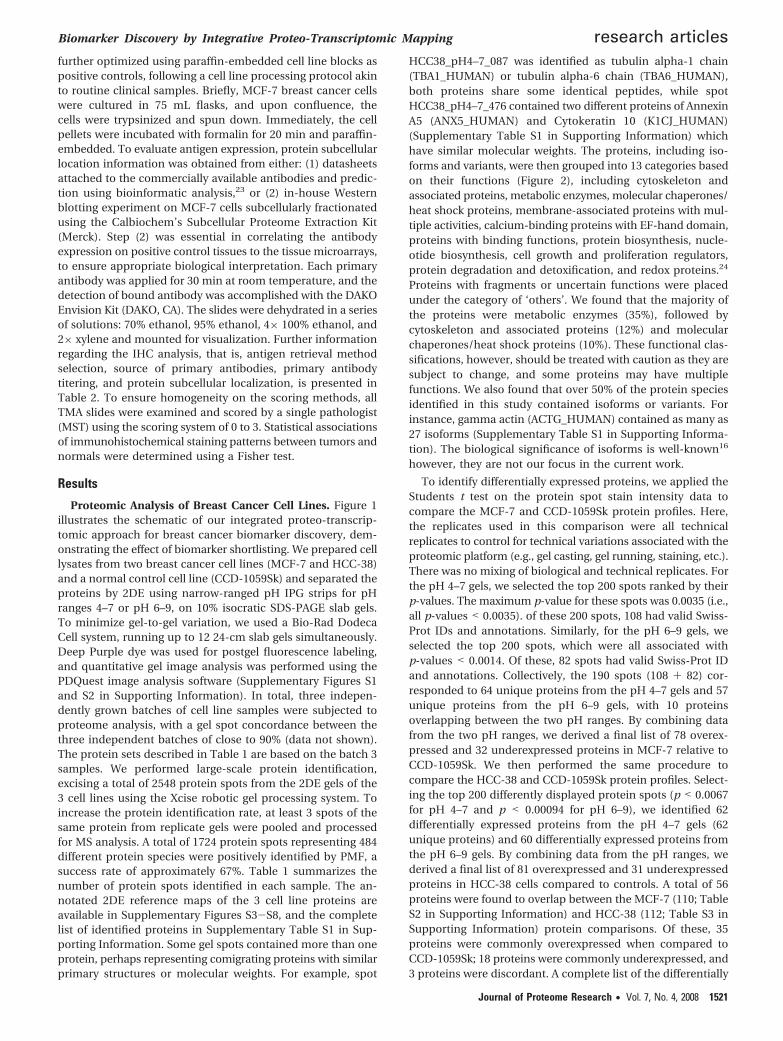
further optimized using paraffin-embedded cell line blocks aspositive controls, following a cell line processing protocol akinto routine clinical samples. Briefly, MCF-7 breast cancer cellswere cultured in 75 mL flasks, and upon confluence, thecells were trypsinized and spun down. Immediately, the cellpellets were incubated with formalin for 20 min and paraffin-embedded. To evaluate antigen expression, protein subcellularlocation information was obtained from either: (1) datasheetsattached to the commercially available antibodies and predic-tion using bioinformatic analysis,23 or (2) in-house Westernblotting experiment on MCF-7 cells subcellularly fractionatedusing the Calbiochem’s Subcellular Proteome Extraction Kit(Merck). Step (2) was essential in correlating the antibodyexpression on positive control tissues to the tissue microarrays,to ensure appropriate biological interpretation. Each primaryantibody was applied for 30 min at room temperature, and thedetection of bound antibody was accomplished with the DAKOEnvision Kit (DAKO, CA). The slides were dehydrated in a seriesof solutions: 70% ethanol, 95% ethanol, 4× 100% ethanol, and2× xylene and mounted for visualization. Further informationregarding the IHC analysis, that is, antigen retrieval methodselection, source of primary antibodies, primary antibodytitering, and protein subcellular localization, is presented inTable 2. To ensure homogeneity on the scoring methods, allTMA slides were examined and scored by a single pathologist(MST) using the scoring system of 0 to 3. Statistical associationsof immunohistochemical staining patterns between tumors andnormals were determined using a Fisher test.
Results
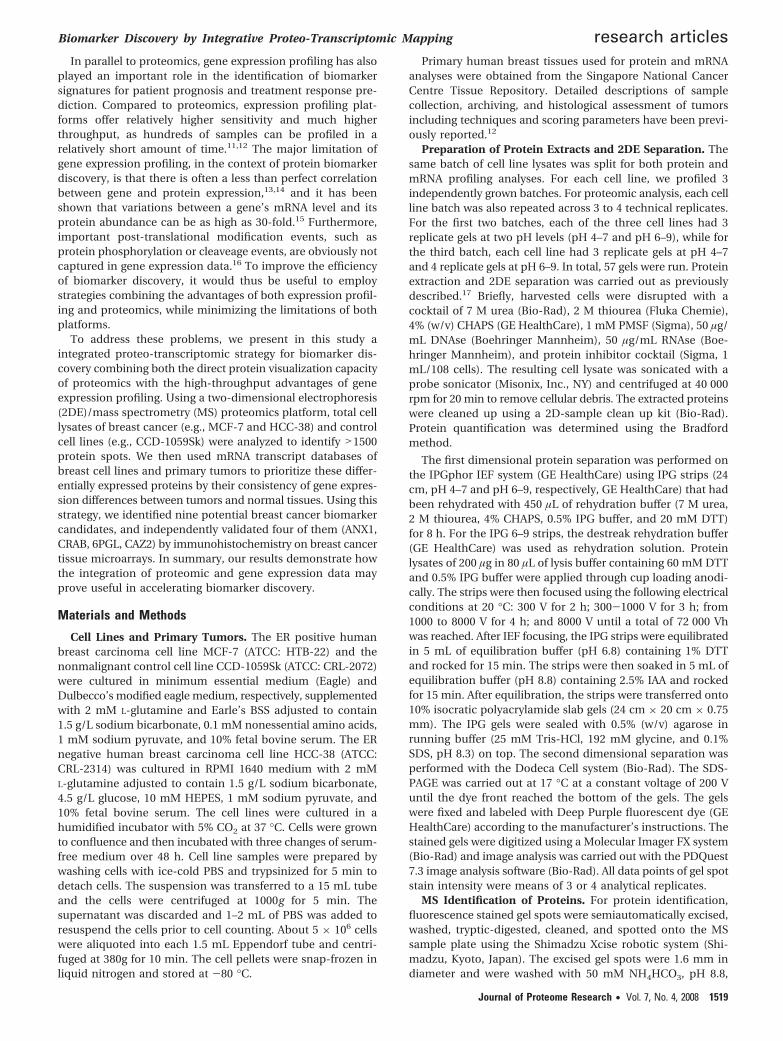
Proteomic Analysis of Breast Cancer Cell Lines. Figure 1illustrates the schematic of our integrated proteo-transcrip-tomic approach for breast cancer biomarker discovery, dem-onstrating the effect of biomarker shortlisting. We prepared celllysates from two breast cancer cell lines (MCF-7 and HCC-38)and a normal control cell line (CCD-1059Sk) and separated theproteins by 2DE using narrow-ranged pH IPG strips for pHranges 4–7 or pH 6–9, on 10% isocratic SDS-PAGE slab gels.To minimize gel-to-gel variation, we used a Bio-Rad DodecaCell system, running up to 12 24-cm slab gels simultaneously.Deep Purple dye was used for postgel fluorescence labeling,and quantitative gel image analysis was performed using thePDQuest image analysis software (Supplementary Figures S1and S2 in Supporting Information). In total, three indepen-dently grown batches of cell line samples were subjected toproteome analysis, with a gel spot concordance between thethree independent batches of close to 90% (data not shown).The protein sets described in Table 1 are based on the batch 3samples. We performed large-scale protein identification,excising a total of 2548 protein spots from the 2DE gels of the3 cell lines using the Xcise robotic gel processing system. Toincrease the protein identification rate, at least 3 spots of thesame protein from replicate gels were pooled and processedfor MS analysis. A total of 1724 protein spots representing 484different protein species were positively identified by PMF, asuccess rate of approximately 67%. Table 1 summarizes thenumber of protein spots identified in each sample. The an-notated 2DE reference maps of the 3 cell line proteins areavailable in Supplementary Figures S3-S8, and the completelist of identified proteins in Supplementary Table S1 in Sup-porting Information. Some gel spots contained more than oneprotein, perhaps representing comigrating proteins with similarprimary structures or molecular weights. For example, spot
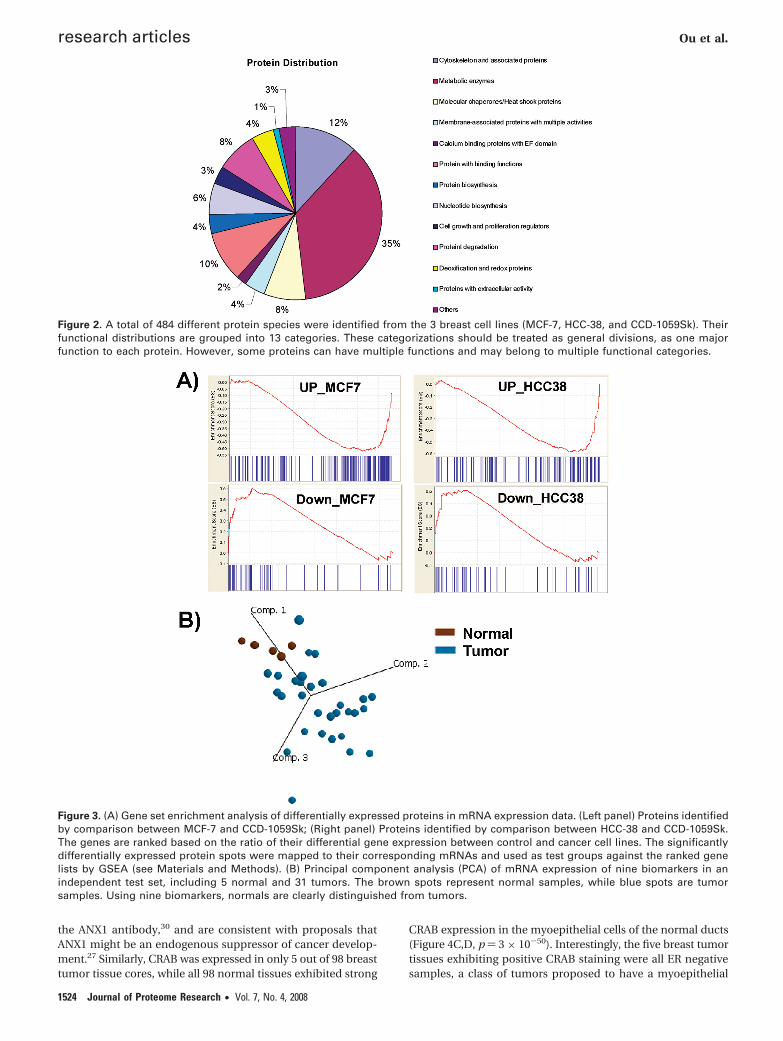
HCC38_pH4–7_087 was identified as tubulin alpha-1 chain(TBA1_HUMAN) or tubulin alpha-6 chain (TBA6_HUMAN),both proteins share some identical peptides, while spotHCC38_pH4–7_476 contained two different proteins of AnnexinA5 (ANX5_HUMAN) and Cytokeratin 10 (K1CJ_HUMAN)(Supplementary Table S1 in Supporting Information) whichhave similar molecular weights. The proteins, including iso-forms and variants, were then grouped into 13 categories basedon their functions (Figure 2), including cytoskeleton andassociated proteins, metabolic enzymes, molecular chaperones/heat shock proteins, membrane-associated proteins with mul-tiple activities, calcium-binding proteins with EF-hand domain,proteins with binding functions, protein biosynthesis, nucle-otide biosynthesis, cell growth and proliferation regulators,protein degradation and detoxification, and redox proteins.24
Proteins with fragments or uncertain functions were placedunder the category of ‘others’. We found that the majority ofthe proteins were metabolic enzymes (35%), followed bycytoskeleton and associated proteins (12%) and molecularchaperones/heat shock proteins (10%). These functional clas-sifications, however, should be treated with caution as they aresubject to change, and some proteins may have multiplefunctions. We also found that over 50% of the protein speciesidentified in this study contained isoforms or variants. Forinstance, gamma actin (ACTG_HUMAN) contained as many as27 isoforms (Supplementary Table S1 in Supporting Informa-tion). The biological significance of isoforms is well-known16
however, they are not our focus in the current work.
To identify differentially expressed proteins, we applied theStudents t test on the protein spot stain intensity data tocompare the MCF-7 and CCD-1059Sk protein profiles. Here,the replicates used in this comparison were all technicalreplicates to control for technical variations associated with theproteomic platform (e.g., gel casting, gel running, staining, etc.).There was no mixing of biological and technical replicates. Forthe pH 4–7 gels, we selected the top 200 spots ranked by theirp-values. The maximum p-value for these spots was 0.0035 (i.e.,all p-values < 0.0035). of these 200 spots, 108 had valid Swiss-Prot IDs and annotations. Similarly, for the pH 6–9 gels, weselected the top 200 spots, which were all associated withp-values < 0.0014. Of these, 82 spots had valid Swiss-Prot IDand annotations. Collectively, the 190 spots (108 + 82) cor-responded to 64 unique proteins from the pH 4–7 gels and 57unique proteins from the pH 6–9 gels, with 10 proteinsoverlapping between the two pH ranges. By combining datafrom the two pH ranges, we derived a final list of 78 overex-pressed and 32 underexpressed proteins in MCF-7 relative toCCD-1059Sk. We then performed the same procedure tocompare the HCC-38 and CCD-1059Sk protein profiles. Select-ing the top 200 differently displayed protein spots (p < 0.0067for pH 4–7 and p < 0.00094 for pH 6–9), we identified 62differentially expressed proteins from the pH 4–7 gels (62unique proteins) and 60 differentially expressed proteins fromthe pH 6–9 gels. By combining data from the pH ranges, wederived a final list of 81 overexpressed and 31 underexpressedproteins in HCC-38 cells compared to controls. A total of 56proteins were found to overlap between the MCF-7 (110; TableS2 in Supporting Information) and HCC-38 (112; Table S3 inSupporting Information) protein comparisons. Of these, 35proteins were commonly overexpressed when compared toCCD-1059Sk; 18 proteins were commonly underexpressed, and3 proteins were discordant. A complete list of the differentially
Biomarker Discovery by Integrative Proteo-Transcriptomic Mapping research articles
Journal of Proteome Research • Vol. 7, No. 4, 2008 1521
Tab
le2.
Bre
ast
Can
cer
Bio
mar
ker
Can
did
ates
Wer
eC
ross
-Val
idat
edb
y2-
DE
/MS
and
TM
AA
nal
yses
Usi
ng
Hu
man
Bre
ast
Tis
sue
Sam
ple
sa
2-D
Eo
nC
ell
Lin
esSu
bce
llula
rLo
cati
on
can
did
ates
tum
or
no
rmal
TM
Are
sult
so
pti
mal
con
dit
ion
sbp
rim
ary
anti
bo
dy
sup
plie
rsp
red
icte
dex
p.
and
lit.
AN
X1
V (MC
F7,
HC
C38
)v
88%
of
tum
or
tiss
ues
sho
wn
egat
ive
stai
nin
g
Pre
ssu
reco
ok
1:50
0B
DT
ran
sdu
ctio
nLa
bo
rato
ries
6100
66C
yto
52%
Nu
cl22
%P
lasm
am
eman
dcy
to
CR
AB
V (MC
F7)
v96
%o
ftu
mo
rti
ssu
essh
ow
neg
ativ
est
ain
ing
Dk9
1:40
0St
ress
gen
#SP
A-2
22C
yto
35%
Nu
cl30
%C
yto
and
nu
cl
6PG
Lv (M
CF
7)V
98%
of
tum
or
tiss
ues
sho
wst
ron
ger
po
siti
vest
ain
ing
Tri
s-E
DT
A1:
50C
ust
om
ized
(Bio
Gen
es)
Cyt
o35
%M
ito
22%
Cyt
o
CA
Z2
v (HC
C38
)V
69%
of
tum
or
tiss
ues
sho
wst
ron
ger
po
siti
vest
ain
ing
Dk6
1:40
0C
ust
om
ized
(Bio
Gen
es)
Cyt
o48
%N
ucl
26%
Cyt
o
K2C
7v (H
CC
38)
ND
Bo
thtu
mo
ran
dn
orm
alti
ssu
essh
ow
po
siti
vest
ain
ing
In-h
ou
sep
roto
col
1:80
Dak
oC
yto
mat
ion
M70
18M
ito
61%
Nu
cl26
%In
term
edia
tefi
lam
ent
LAM
1v (M
CF
7,H
CC
38)
ND
Bo
thtu
mo
ran
dn
orm
alti
ssu
essh
ow
po
siti
vest
ain
ing
DK
61:
50Sa
nta
Cru
zsc
-206
82N
ucl
52%
Pla
sma
mem
17%
Inn
ern
ucl
mem
bra
ne
TK
Tv (M
CF
7)V
Bo
thtu
mo
ran
dn
orm
alti
ssu
essh
ow
po
siti
vest
ain
ing
Dk9
1:50
Cu
sto
miz
ed(B
ioG
enes
)C
yto
70%
22%
Cyt
o>
nu
cl
PSD
2v (H
CC
38)
ND
Bo
thtu
mo
ran
dn
orm
alti
ssu
essh
ow
po
siti
vest
ain
ing
Dk9
1:20
0C
ust
om
ized
(Bio
Gen
es)
Nu
cl74
%C
yto
13%
Cyt
oan
dn
ucl
PA
K2
v (MC
F7)
ND
Bo
thtu
mo
ran
dn
orm
alti
ssu
essh
ow
neg
ativ
est
ain
ing
Dk9
1:10
0Z
ymed
Lab
ora
tori
es51
–300
0E
nd
op
la33
%M
ito
22%
Cyt
oan
dn
ucl
aO
pti
mal
con
dit
ion
sin
clu
de
the
met
ho
dfo
rd
epar
affi
niz
atio
n,
pri
mar
yan
tib
od
yti
ters
,an
dan
tige
nsu
bce
llula
rlo
caliz
atio
n.
Cu
sto
miz
edp
oly
clo
nal
anti
bo
die
sw
ere
rais
edag
ain
stth
ese
lect
edp
oly
pep
tid
esfr
om
the
corr
esp
on
din
gp
rote
ins
(Bio
Gen
esG
mb
H,
Ber
lin,
Ger
man
y).
bO
pti
mal
con
dit
ion
sin
clu
de
met
ho
ds
for
dep
araf
fin
izat
ion
and
con
cen
trat
ion
so
fp
rim
ary
anti
bo
dy.
ND
:n
od
etec
tio
n/i
den
tifi
cati
on
.
research articles Ou et al.
1522 Journal of Proteome Research • Vol. 7, No. 4, 2008

expressed spots and their protein identities is presented in theSupporting Information.
Biomarker Prioritization by Proteo-TranscriptomicMapping. We then integrated the proteomic information withgene expression data. First, we focused on the 78 overexpressedand 32 underexpressed proteins in MCF-7 relative to CCD-1059Sk (Supplementary Table S2 in Supporting Information).Using Affymetrix U133_plus chip annotations and matchingSwiss-Prot IDs, we mapped these differentially expressedproteins to their corresponding mRNA counterparts and identi-fied two sets of microarray probes: one set (‘MCF-7 upregu-lated’) corresponding to MCF-7 up-regulated proteins (198probes), and a second set (‘MCF-7 downregulated’) corre-sponding to MCF-7 down-regulated proteins (84 probes). Wethen ranked all ∼50K probes on the microarray according totheir strength of differential gene expression between MCF-7and CCD-1059Sk, and used Gene Set Enrichment Analysis(GSEA) to examine the distribution of the two ‘MCF-7 upregu-lated’ and ‘MCF-7-downregulated’ probe sets against theranked list. GSEA is a recently described powerful method fortesting the coordinated over or underexpression of sets of genesusing the Kolmogorov–Smirnov test over a weighted summa-tion.25 We found that the “MCF-7 upregulated” probes weresignificantly enriched in genes exhibiting elevated gene expres-sion levels in MCF-7 compared to CCD-1059Sk cells (p < 0.001),indicating a good concordance between the proteomic andtranscriptomic data. Likewise, the “MCF-7 downregulated”probe set was significantly enriched in genes exhibiting de-creased gene expression in MCF-7 compared to CCD-1059Skcells (p < 0.001) (Figure 3A). We then performed a similaranalysis for the “HCC-38 upregulated” and “HCC-38 down-regulated” probe sets, corresponding to the 81 overexpressedand 31 underexpressed proteins in HCC-38 cells compared tocontrols (Supplementary Table S3 in Supporting Information).The “HCC-38 upregulated” probe set (195 probes) was signifi-cantly enriched in genes highly expressed in HCC-38 cells (p< 0.001), while the “HCC-downregulated” probe set (71 probes)was significantly enriched in genes exhibiting decreased ex-pression in HCC-38 cells (p < 0.001) (Figure 3A). These resultsindicate that a significant proportion of differentially expressedproteins (79–82%) identified in the 2DE/MS analysis are alsoassociated with concomitant alterations in mRNA expression.By focusing on these concordantly expressed proteins, we wereable to further shortlist the list of putative biomarker candidatesto 87 proteins for MCF-7 versus CCD-1059Sk and 92 proteins
for HCC-38 versus CCD-1059Sk, respectively. These proteinswere then combined into a single list, representing 30 under-expressed and 105 overexpressed proteins differentially ex-pressed between cancer and control cells.
To move beyond the in vitro cell line setting, we thenprioritized the biomarker candidates by identifying proteinswhose cognate genes were differentially expressed at the geneexpression level between primary human breast tumors andnormal breast samples. We constructed a training mRNA dataset of 39 primary tissue samples (7 normal and 32 tumors),and used a combination of a Support Vector Machine (SVM)machine learning algorithm, coupled with 100 cross-valiationruns, to identify biomakers that could robustly discriminatebetween breast tumors and normal tissues. The SVM identifiednine biomarkers for further evaluation, including Annexin I(ANX1_HUMAN), Alpha basic-Crystallin (CRAB_HUMAN),6-phosphogluconolactonase (6PGL_HUMAN), F-actin cappingprotein alpha-2 subunit (CAZ2_HUMAN), type II cytoskeletal7 (K2C7_HUMAN), Lamin B1 (LAM1_HUMAN), Transketolase(TKT_HUMAN), Serine/threonine-protein kinase PAK 2 (PAK2_HUMAN), and 26S proteasome non-ATPase regulatory subunit2 (PSD2_HUMAN). Of these nine candidates, ANX1 and CRABwere down-regulated, while the rest were up-regulated in breastcancer cells (Table 2). Importantly, the gene expression patternsof the top nine biomarkers were concordant between the celllines and human tumors. To further validate these ninebiomarkers, we then assessed their ability to further classifyan independent test set of 36 tissue samples (31 tumors and 5normals) (Figure 3B). As shown in Figure 3B, the nine biom-arkers could unambiguously differentiate all the tumor andnormal samples in the test data set, indicating that they arerelatively robust.
Validation of Potential Biomarkers by Tissue MicroarrayAnalysis. Our decision to select the top nine biomarkers outof 179 was motivated by the empirical need to select a smallset of candidate biomarkers for subsequent immunohistochem-ical validation. To validate the potential biomarkers at theprotein level, we performed an immunohistochemical (IHC)analysis of the biomarkers on an independent breast cancertissue microarray (TMA) of approximately 100 breast tumorsand 100 normal breast tissues. Of the nine biomarker candi-dates, we purchased commercial antibodies for five (ANX1,CRAB, K2C7, LAM1, PAK2) and generated custom antibodiesfor the remaining four (6PGL, CAZ2, TKT, PSD2). Prior to IHC,the antibodies were optimized against paraffin-embedded cellline blocks, inferring the likely subcellular localization of thebiomarker from either vendor-provided data (for commercialantibodies), prediction using bioinformatic analysis,23 or West-ern blotting experiments using subcellularly fractionated cellline lysates (see Materials and Methods). Of the nine biomarkercandidates, four (ANX1, CRAB, 6PGL, and CAZ2) were success-fully validated on the TMA as bona fide differentially expressedproteins between normal breasts and breast tumors (Table 2).With the exception of ANX1 where a previous association withbreast cancer has been demonstrated,26–29 the other threeproteins (CRAB, 6PGL, and CAZ2) represent novel breast cancerbiomarkers.
The TMA analysis for ANX1 revealed that it was stronglyexpressed in normal breast tissues (10%), while 88% of thebreast tumors exhibited positive staining only in fibroblast cellsbut not in tumor cells (Figure 4A,B, p ) 4 × 10-30, Fisher test).These findings confirm previous reports that only the stromalcells in tumors, but not the epithelial cells, are reactive against
Figure 1. Schematic of an integrated proteo-transcriptomic ap-proach for breast cancer biomarker discovery. Numbers inparentheses represent the number of proteins or mRNAs aftereach filtering step.
Biomarker Discovery by Integrative Proteo-Transcriptomic Mapping research articles
Journal of Proteome Research • Vol. 7, No. 4, 2008 1523
the ANX1 antibody,30 and are consistent with proposals thatANX1 might be an endogenous suppressor of cancer develop-ment.27 Similarly, CRAB was expressed in only 5 out of 98 breasttumor tissue cores, while all 98 normal tissues exhibited strong
CRAB expression in the myoepithelial cells of the normal ducts(Figure 4C,D, p ) 3 × 10-50). Interestingly, the five breast tumortissues exhibiting positive CRAB staining were all ER negativesamples, a class of tumors proposed to have a myoepithelial
Figure 2. A total of 484 different protein species were identified from the 3 breast cell lines (MCF-7, HCC-38, and CCD-1059Sk). Theirfunctional distributions are grouped into 13 categories. These categorizations should be treated as general divisions, as one majorfunction to each protein. However, some proteins can have multiple functions and may belong to multiple functional categories.
Figure 3. (A) Gene set enrichment analysis of differentially expressed proteins in mRNA expression data. (Left panel) Proteins identifiedby comparison between MCF-7 and CCD-1059Sk; (Right panel) Proteins identified by comparison between HCC-38 and CCD-1059Sk.The genes are ranked based on the ratio of their differential gene expression between control and cancer cell lines. The significantlydifferentially expressed protein spots were mapped to their corresponding mRNAs and used as test groups against the ranked genelists by GSEA (see Materials and Methods). (B) Principal component analysis (PCA) of mRNA expression of nine biomarkers in anindependent test set, including 5 normal and 31 tumors. The brown spots represent normal samples, while blue spots are tumorsamples. Using nine biomarkers, normals are clearly distinguished from tumors.
research articles Ou et al.
1524 Journal of Proteome Research • Vol. 7, No. 4, 2008
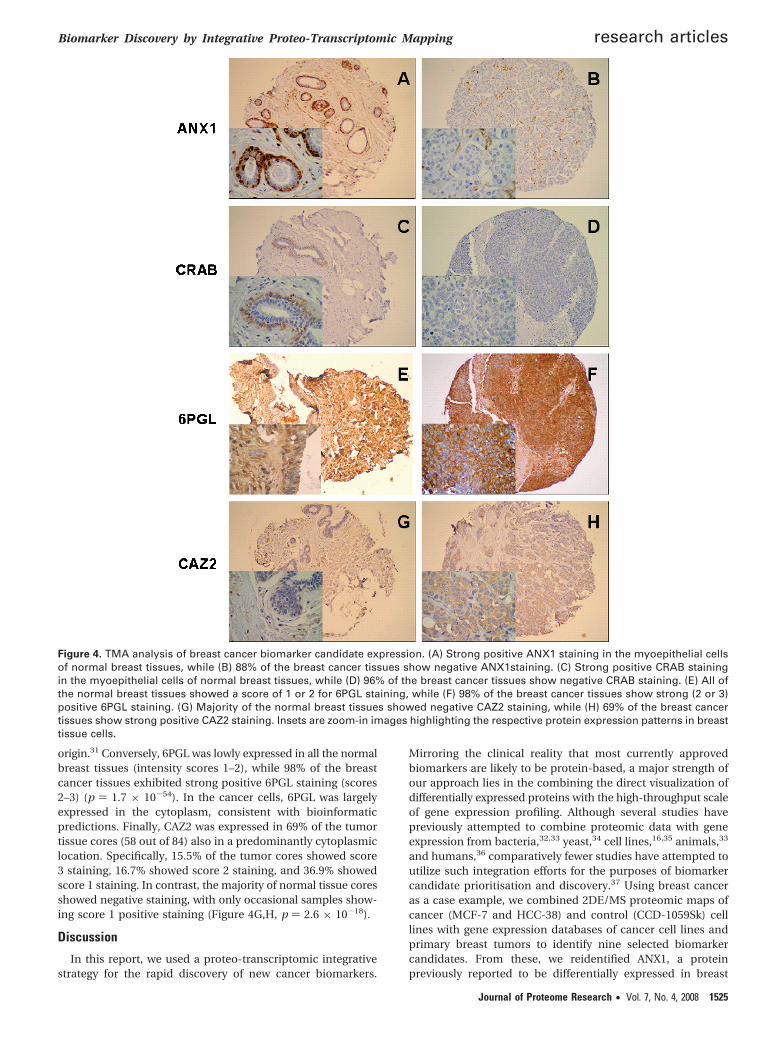
origin.31 Conversely, 6PGL was lowly expressed in all the normalbreast tissues (intensity scores 1–2), while 98% of the breastcancer tissues exhibited strong positive 6PGL staining (scores2–3) (p ) 1.7 × 10-54). In the cancer cells, 6PGL was largelyexpressed in the cytoplasm, consistent with bioinformaticpredictions. Finally, CAZ2 was expressed in 69% of the tumortissue cores (58 out of 84) also in a predominantly cytoplasmiclocation. Specifically, 15.5% of the tumor cores showed score3 staining, 16.7% showed score 2 staining, and 36.9% showedscore 1 staining. In contrast, the majority of normal tissue coresshowed negative staining, with only occasional samples show-ing score 1 positive staining (Figure 4G,H, p ) 2.6 × 10⁻¹⁸).
Discussion
In this report, we used a proteo-transcriptomic integrativestrategy for the rapid discovery of new cancer biomarkers.
Mirroring the clinical reality that most currently approvedbiomarkers are likely to be protein-based, a major strength ofour approach lies in the combining the direct visualization ofdifferentially expressed proteins with the high-throughput scaleof gene expression profiling. Although several studies havepreviously attempted to combine proteomic data with geneexpression from bacteria,32,33 yeast,34 cell lines,16,35 animals,33
and humans,36 comparatively fewer studies have attempted toutilize such integration efforts for the purposes of biomarkercandidate prioritisation and discovery.37 Using breast canceras a case example, we combined 2DE/MS proteomic maps ofcancer (MCF-7 and HCC-38) and control (CCD-1059Sk) celllines with gene expression databases of cancer cell lines andprimary breast tumors to identify nine selected biomarkercandidates. From these, we reidentified ANX1, a proteinpreviously reported to be differentially expressed in breast
Figure 4. TMA analysis of breast cancer biomarker candidate expression. (A) Strong positive ANX1 staining in the myoepithelial cellsof normal breast tissues, while (B) 88% of the breast cancer tissues show negative ANX1staining. (C) Strong positive CRAB stainingin the myoepithelial cells of normal breast tissues, while (D) 96% of the breast cancer tissues show negative CRAB staining. (E) All ofthe normal breast tissues showed a score of 1 or 2 for 6PGL staining, while (F) 98% of the breast cancer tissues show strong (2 or 3)positive 6PGL staining. (G) Majority of the normal breast tissues showed negative CAZ2 staining, while (H) 69% of the breast cancertissues show strong positive CAZ2 staining. Insets are zoom-in images highlighting the respective protein expression patterns in breasttissue cells.
Biomarker Discovery by Integrative Proteo-Transcriptomic Mapping research articles
Journal of Proteome Research • Vol. 7, No. 4, 2008 1525

cancers and normal tissues, and validated three other novelcandidates, CRAB, 6PGL, and CAZ2, as bona fide differentiallyexpressed proteins by immunohistochemistry on breast tissuemicroarrays. In total, close to half (4/9) of our protein bio-marker candidates were successfully validated. It is worthnoting that the bulk of the analytical pipeline prior to the finalvalidation step did not require focusing on individual proteins.We thus believe that our approach is likely to be highlycompetitive compared to other biomarker identification strate-gies in terms of cost, throughput, and efficiency.
The initial step in our approach involved the delineation ofa large set of differentially expressed proteins that weresubsequently prioritized and refined. We elected to use cancercell lines for this purpose, so as to minimize contributions fromnontumor cellular compartments, and to maximize the abilityof our candidate list to represent tumor-centric proteins.Indeed, the 2DE/MS analysis reported in this study representsthe most comprehensive proteomic investigation of breastcancer cell lines ever reported using a 2DE/MS platform,dramatically exceeding the closest previous study where 162proteins (including isoforms and variants) were identified.24
Notably, when the differentially expressed cell line proteinswere treated as a collective set, they did not exhibit a significantconcordance with primary tumor gene expression data whenanalyzed by GSEA. This lack of global concordance, whichpersisted even after the cell lines proteins were filtered by cellline mRNA data, is likely due to the many differences betweenin vitro cultured cell lines and primary tumors. In our strategy,we thus deliberately introduced an extra filtering step wherecandidate biomarkers were further stratified by their concor-dance to primary tumor gene expression (see Figure 1). Thisresulted in nine biomarkers being finally chosen for finalvalidation on the basis of their concordant gene expressionpatterns between cell lines and primary tumors. One potentialcriticism of our study might be its reliance of 2DE/MS, whichhas acknowledged limitations in detecting proteins that arelowly expressed (sensitivity) or associated with extreme pI andMW.38 However, there is no conceptual reason why ourapproach should not be transportable to other newer genera-tion proteomic technologies, such as shotgun-based proteom-ics39 and stable isotope labeling proteomics,17,40 so long as thecandidate proteins are identified before the mRNA integrationstep. It is also important to note that, while we elected to usea particular set of analytical algorithms in our strategy, othermethodologies can also be applied. For example, the generanking step in our study was performed using a Support VectorMachine, as this algorithm has been used in many other geneexpression studies.41 However, this does not rule out the useof simpler methods such as a Venn diagram analysis to performthe ranking. Future work should be focused on defining themost accurate and efficient set of analytical methods for thisapproach.
Of the nine biomarker candidates, four proteins includingANX1, CRAB, 6PGL, and CAZ2 successfully passed the TMAvalidation. ANX1 is a member of the annexin family of calciumand phospholipid-binding proteins, which are involved indiverse biological processes including signal transduction,mediation of apoptosis, and immunosuppression.27 Interest-ingly, the exact expression status of ANX1 in breast cancer iscontroversial. While some groups have reported that ANX1expression is undetectable in breast cancer cells, Ahn et al.recently reported that ANX1 was generally expressed in varioustypes of breast cancers, including noninvasive ductal carcinoma
in situ (DCIS), invasive and metastatic breast tumors.29 Theproteomic and gene expression results of our current studystrongly suggests that ANX1 is down-regulated in breast cancercells and only detected in the stromal cells of tumors, consistentwith proposed models where ANX1 may play a critical role inmaintaining normal breast biology.42 Similar to ANX1, we alsoidentified CRAB as a down-regulated protein in tumors. CRABbelongs to the small heat shock protein HSP20 family and is awell-known structural component of the eye lens.43 A potentialrole for CRAB in cancer development has been suggested as itwas previously found to be down-regulated in anaplasticthyroid carcinomas.44 We found that CRAB was stronglyexpressed in normal breast tissues line as compared to themajority of breast tumors. Interestingly, we detected CRABexpression in five breast tumors that were ER negative.Recently, CRAB expression was reported to associate with thebasal-like subtype of human breast tumor31,45 which aretypically ER negative. The potential role of CRAB in thedevelopment of ER negative breast cancer deserves to befurther studied.
We identified 6PGL and CAZ2 as two proteins up-regulatedin tumors. 6PGL is a well-known enzyme involved in glucosemetabolism. Although there is no current evidence directlyrelating 6PGL to cancer, its high expression in tumors maycontribute to the ‘Warburg effect’ where tumors undergo ametabolic shift from fermenting glucose to lactate even in thepresence of oxygen (aerobic glycolysis).46 6PGL expression hasbeen associated with pentose phosphate pathway (PPP) activityin several species,47,48 and the PPP regulates glucose conversionto ribose for nucleic acid synthesis and glucose degradation tolactate. Interestingly, besides being simply a metabolic end-product, lactate has been proposed to directly mediate tumorinvasion through the promotion of angiogenesis, the proteolyticcleavage of matrix proteins, and inhibition of the immuneresponses.49 Finally, CAZ2 binds to the fast growing ends ofactin filaments (barbed end) in the presence of Ca2+, therebyblocking the exchange of subunits at these ends. CAZ2 has beenreported to be amplified in glioblastomas,50 and F-actincapping protein has been identified as one of the potentialtumor associated antigens (TAA) in human renal cell carcinoma(RCC).51 It is possible that CAZ2 may play a role in regulatingtumor-specific aspects of cell motility.
It is also worth revisiting the five biomarker candidates thatfailed to pass the TMA validation. Four of these, including K2C7,LAM1, TKT, and PSD2, were initially identified as differentiallyexpressed proteins in the proteo-transcriptomic pipeline butultimately showed equally positive IHC staining on both tumorand normal tissues. There could be several reasons for thisdiscrepancy. For example, although TKT was selected byproteo-transcriptomic analysis as an up-regulated caner bio-marker, the TMA analysis revealed that its expression wasequally strong in both tumor and normal cells. This could bedue to differences between in vitro and in vivo growth.Alternatively, since breast tumors typically contain higherrelative proportions of epithelial cells than normal controls thatcomprise predominantly of stromal tissue,52 this difference inrelative proportions might have resulted in relatively greateramounts of TKT protein/mRNA being extracted from tumorcells. Finally, while PAK2 protein was detected in cell lines, wedid not identify PAK2 in a preliminary 2DE analysis of breastcancer tissues (data not shown), which is consistent with thenegative staining results in the breast TMA. Thus, PAK2
research articles Ou et al.
1526 Journal of Proteome Research • Vol. 7, No. 4, 2008

expression may be induced during in vitro growth and mayonly be present in certain breast cell lines.
In conclusion, we have in this report used a novel integratedproteo-transcriptomic analytical pipeline to successfully re-confirm one biomarker and to identify three novel potentialbiomarkers for breast cancer. We acknowledge there are somelimitations in the current work. First, although our 67% proteinidentification rate is generally acceptable, several highly rankedprotein spots were excluded from the analysis because theywere not identified. Thus, improving the protein identificationrate by, for example, implementing MS/MS peptide sequencing,would definitely enhance the process of biomarker selection.Second, only three cell lines were used in this proof-of-conceptstudy, and a larger number of cell lines will undoubtedly berequired to accurately capture the molecular heterogeneity ofbreast cancer. We believe that all are readily solvable deficien-cies. Thus, with fine-tuning, this versatile strategy may alsoprove valuable for biomarker identification in other cancertypes for either molecular diagnostics or therapeutic applications.
Abbreviations: ER, estrogen receptor; GSEA, Gene Set En-richment Analysis; SVM, Support Vector Machine; TMA, tissuemicroarrays; IHC, immunohistochemical analysis.
Acknowledgment. The authors thank Dr. Yonghui Wufor advice on biostatistical analysis. This work was fundedby a grant to P.T. from Agenica Research, and grants fromthe Singapore Cancer Syndicate to M.S-.T. (MN005 andMN-077).
Supporting Information Available: Supporting Infor-mation Figure 1, 2DE gel mage analysis of MCF-7, HCC-38 andCCD-1059Sk cells (pH 4–7) using the PDQuest 7.3 software.Three replicates were made. Supporting Information Figure 2,2DE gel mage analysis of MCF-7, HCC-38 and CCD-1059Sk cells(pH 6–9) using the PDQuest 7.3 software. Four replicates weremade. Supporting Information Figure 3, annotated 2DE mapof MCF-7 pH4–7. Supporting Information Figure 4, annotated2DE map of MCF-7 pH6–9. Supporting Information Figure 5,annotated 2DE map of HCC-38 pH4–7. Supporting InformationFigure 6, annotated 2DE map of HCC-38 pH6–9. SupportingInformation Figure 7, annotated 2DE map of CCD-1059SkpH4–7. Supporting Information Figure 8, annotated 2DE mapof CCD-1059Sk pH6–9. Supporting Information Table 1, acomplete list of proteins identified from 3 breast cell lines(MCF-7, HCC-38 and CCD-1059Sk), which are grouped into 13catalogues based on their functions. Supporting InformationTable 2, the list of 110 unique proteins short-listed from CCD-1059Sk vs MCF-7 comparison. Supporting Information Table3, the list of 112 unique proteins short-listed from CCD-1059Skvs HCC-38 comparison. This material is available free of chargevia the Internet at http://pubs.acs.org.
References(1) Chia, K. S.; Du, W. B.; Sankaranarayanan, R.; Sankila, R.; Wang,
H.; Lee, J.; Seow, A.; Lee, H. P. Int. J. Cancer 2004, 108, 761–765.(2) Parkin, D. M. Lancet Oncol. 2001, 2, 533–543.(3) Gerrero, M. R.; Weber, B. L. Curr. Opin. Oncol. 2001, 13, 415–419.(4) Pole, J. C.; Gold, L. I.; Orton, T.; Huby, R.; Carmichael, P. L.
Toxicology 2005, 206, 91–109.(5) Wulfkuhle, J. D.; Liotta, L. A.; Petricoin, E. F. Nat. Rev. Cancer 2003,
3, 267–275.(6) Rai, A. J.; Zhang, Z.; Rosenzweig, J.; Shih, I.; Pham, T.; Fung, E. T.;
Sokoll, L. J.; Chan, D. W. Arch. Pathol. Lab. Med. 2002, 126, 1518–1526.
(7) Wilkins, M. R.; Pasquali, C.; Appel, R. D.; Ou, K.; Golaz, O.; Sanchez,J. C.; Yan, J. X.; Gooley, A. A.; Hughes, G.; Humphery-Smith, I.;Williams, K. L.; Hochstrasser, D. F. Biotechnology (N.Y.) 1996, 14,61–65.
(8) Aebersold, R.; Mann, M. Nature 2003, 422, 198–207.(9) Verma, M.; Wright, G. L., Jr.; Hanash, S. M.; Gopal-Srivastava, R.;
Srivastava, S. Ann. N.Y. Acad. Sci. 2001, 945, 103–115.(10) Hondermarck, H. Mol. Cell. Proteomics 2003, 2, 281–291.(11) Yu, K.; Lee, C. H.; Tan, P. H.; Hong, G. S.; Wee, S. B.; Wong, C. Y.;
Tan, P. Cancer Res. 2004, 64, 2962–2968.(12) Yu, K.; Lee, C. H.; Tan, P. H.; Tan, P. Clin. Cancer Res. 2004, 10,
5508–5517.(13) Gygi, S. P.; Rochon, Y.; Franza, B. R.; Aebersold, R. Mol. Cell. Biol.
1999, 19, 1720–1730.(14) Chen, G.; Gharib, T. G.; Huang, C. C.; Taylor, J. M.; Misek, D. E.;
Kardia, S. L.; Giordano, T. J.; Iannettoni, M. D.; Orringer, M. B.;Hanash, S. M.; Beer, D. G. Mol. Cell. Proteomics 2002, 1, 304–313.
(15) Pradet-Balade, B.; Boulme, F.; Beug, H.; Mullner, E. W.; Garcia-Sanz, J. A. Trends Biochem. Sci. 2001, 26, 225–229.
(16) Tian, Q.; Stepaniants, S. B.; Mao, M.; Weng, L.; Feetham, M. C.;Doyle, M. J.; Yi, E. C.; Dai, H.; Thorsson, V.; Eng, J.; Goodlett, D.;Berger, J. P.; Gunter, B.; Linseley, P. S.; Stoughton, R. B.; Aebersold,R.; Collins, S. J.; Hanlon, W. A.; Hood, L. E. Mol.Cell. Proteomics2004, 3, 960–969.
(17) Ou, K.; Kesuma, D.; Ganesan, K.; Yu, K.; Soon, S. Y.; Lee, S. Y.;Goh, X. P.; Hooi, M.; Chen, W.; Jikuya, H.; Ichikawa, T.; Kuyama,H.; Matsuo, E.; Nishimura, O.; Tan, P. J. Proteome Res. 2006, 5,2194–2206.
(18) Jiang, Z.; Gentleman, R. Bioinformatics 2007, 23, 306–313.(19) Agranoff, D.; Fernandez-Reyes, D.; Papadopoulos, M. C.; Rojas,
S. A.; Herbster, M.; Loosemore, A.; Tarelli, E.; Sheldon, J.; Schwenk,A.; Pollok, R.; Rayner, C. F.; Krishna, S. Lancet 2006, 368, 1012–1021.
(20) Salto-Tellez, M.; Lee, S. C.; Chiu, L. L.; Lee, C. K.; Yong, M. C.;Koay, E. S. Clin. Chem. 2004, 50, 1082–1086.
(21) Zhang, D.; Salto-Tellez, M.; Putti, T. C.; Do, E.; Koay, E. S. Mod.Pathol. 2003, 16, 79–84.
(22) Chen, W.; Salto-Tellez, M.; Palanisamy, N.; Ganesan, K.; Hou, Q.;Tan, L. K.; Sii, L. H.; Ito, K.; Tan, B.; Wu, J.; Tay, A.; Tan, K. C.;Ang, E.; Tan, B. K.; Tan, P. H.; Ito, Y.; Tan, P. Genes, ChromosomesCancer 2007, 46, 288–301.
(23) Nakai, K.; Horton, P. Trends Biochem. Sci. 1999, 24, 34–36.(24) Pucci-Minafra, I.; Cancemi, P.; Fontana, S.; Minafra, L.; Feo, S.;
Becchi, M.; Freyria, A. M.; Minafra, S. Proteomics 2006, 6, 2609–2625.
(25) Subramanian, A.; Tamayo, P.; Mootha, V. K.; Mukherjee, S.; Ebert,B. L.; Gillette, M. A.; Paulovich, A.; Pomeroy, S. L.; Golub, T. R.;Lander, E. S.; Mesirov, J. P. Proc. Natl. Acad. Sci. U.S.A. 2005, 102,15545–15550.
(26) Shen, D.; Chang, H. R.; Chen, Z.; He, J.; Lonsberry, V.; Elshimali,Y.; Chia, D.; Seligson, D.; Goodglick, L.; Nelson, S. F.; Gornbein,J. A. Biochem. Biophys. Res. Commun. 2005, 326, 218–227.
(27) Vishwanatha, J. K.; Salazar, E.; Gopalakrishnan, V. K. BMC Cancer2004, 4, 8.
(28) Pencil, S. D.; Toth, M. Clin. Exp. Metastasis 1998, 16, 113–121.(29) Ahn, S. H.; Sawada, H.; Ro, J. Y.; Nicolson, G. L. Clin. Exp.
Metastasis 1997, 15, 151–156.(30) Schwartz-Albiez, R.; Koretz, K.; Moller, P.; Wirl, G. Differentiation
1993, 52, 229–237.(31) Moyano, J. V.; Evans, J. R.; Chen, F.; Lu, M.; Werner, M. E.; Yehiely,
F.; Diaz, L. K.; Turbin, D.; Karaca, G.; Wiley, E.; Nielsen, T. O.;Perou, C. M.; Cryns, V. L. J. Clin. Invest. 2006, 116, 261–270.
(32) Ou, K.; Ong, C.; Koh, S. Y.; Rodrigues, F.; Sim, S. H.; Wong, D.;Ooi, C. H.; Ng, K. C.; Jikuya, H.; Yau, C. C.; Soon, S. Y.; Kesuma,D.; Lee, M. A.; Tan, P. J. Bacteriol. 2005, 187, 4276–4285.
(33) Naranjo, V.; Villar, M.; Martin-Hernando, M. P.; Vidal, D.; Hofle,U.; Gortazar, C.; Kocan, K. M.; Vazquez, J.; de la, F. J. Proteomics2007, 7, 220–231.
(34) Washburn, M. P.; Koller, A.; Oshiro, G.; Ulaszek, R. R.; Plouffe, D.;Deciu, C.; Winzeler, E.; Yates, J. R., III Proc. Natl. Acad. Sci. U.S.A.2003, 100, 3107–3112.
(35) Chen, Y. R.; Juan, H. F.; Huang, H. C.; Huang, H. H.; Lee, Y. J.;Liao, M. Y.; Tseng, C. W.; Lin, L. L.; Chen, J. Y.; Wang, M. J.; Chen,J. H.; Chen, Y. J. J. Proteome Res. 2006, 5, 2727–2742.
(36) Seshi, B. Proteomics 2006, 6, 5169–5182.(37) Varambally, S.; Yu, J.; Laxman, B.; Rhodes, D. R.; Mehra, R.;
Tomlins, S. A.; Shah, R. B.; Chandran, U.; Monzon, F. A.; Becich,M. J.; Wei, J. T.; Pienta, K. J.; Ghosh, D.; Rubin, M. A.; Chinnaiyan,A. M. Cancer Cell 2005, 8, 393–406.
(38) Young, R. A. Cell 2000, 102, 9–15.
Biomarker Discovery by Integrative Proteo-Transcriptomic Mapping research articles
Journal of Proteome Research • Vol. 7, No. 4, 2008 1527
(39) Malmstrom, J.; Lee, H.; Aebersold, R. Curr. Opin. Biotechnol. 2007,18, 378–384.
(40) Smolka, M.; Zhou, H.; Aebersold, R. Mol. Cell. Proteomics 2002, 1,19–29.
(41) Ramaswamy, S.; Tamayo, P.; Rifkin, R.; Mukherjee, S.; Yeang, C. H.;Angelo, M.; Ladd, C.; Reich, M.; Latulippe, E.; Mesirov, J. P.; Poggio,T.; Gerald, W.; Loda, M.; Lander, E. S.; Golub, T. R. Proc. Natl. Acad.Sci. U.S.A. 2001, 98, 15149–54.
(42) Shen, D.; Chang, H. R.; Chen, Z.; He, J.; Lonsberry, V.; Elshimali,Y.; Chia, D.; Seligson, D.; Goodglick, L.; Nelson, S. F.; Gornbein,J. A. Biochem. Biophys. Res. Commun. 2005, 326, 218–227.
(43) Horwitz, J. Exp. Eye Res. 2003, 76, 145–153.(44) Mineva, I.; Gartner, W.; Hauser, P.; Kainz, A.; Loffler, M.; Wolf, G.;
Oberbauer, R.; Weissel, M.; Wagner, L. Cell Stress Chaperones 2005,10, 171–184.
(45) Gruvberger-Saal, S. K.; Parsons, R. J. Clin. Invest. 2006, 116, 30–32.
(46) Stern, R.; Shuster, S.; Neudecker, B. A.; Formby, B. Exp. Cell Res.2002, 276, 24–31.
(47) Zimenkov, D.; Gulevich, A.; Skorokhodova, A.; Biriukova, I.; Kozlov,Y.; Mashko, S. FEMS Microbiol. Lett. 2005, 244, 275–280.
(48) Clarke, J. L.; Scopes, D. A.; Sodeinde, O.; Mason, P. J. Eur.J. Biochem. 2001, 268, 2013–2019.
(49) Gatenby, R. A.; Gawlinski, E. T. Cancer Res. 2003, 63, 3847–3854.(50) Mueller, H. W.; Michel, A.; Heckel, D.; Fischer, U.; Tonnes, M.;
Tsui, L. C.; Scherer, S.; Zang, K. D.; Meese, E. Hum. Genet. 1997,101, 190–197.
(51) Kellner, R.; Lichtenfels, R.; Atkins, D.; Bukur, J.; Ackermann, A.;Beck, J.; Brenner, W.; Melchior, S.; Seliger, B. Proteomics 2002, 2,1743–1751.
(52) Hawes, D.; Downey, S.; Pearce, C. L.; Bartow, S.; Wan, P.; Pike,M. C.; Wu, A. H. Breast Cancer Res. 2006, 8, R24.
PR700820G
research articles Ou et al.
1528 Journal of Proteome Research • Vol. 7, No. 4, 2008