A transcriptomic approach to ribbon worm systematics (nemertea): resolving the pilidiophora problem
Upload
independentCategory
view
1download
0
Integrative Genomic and Transcriptomic AnalysisIdentified Candidate Genes Implicated in thePathogenesis of Hepatosplenic T-Cell LymphomaJulio Finalet Ferreiro1, Leila Rouhigharabaei1, Helena Urbankova1, Jo-Anne van der Krogt1,
Lucienne Michaux1, Shashirekha Shetty2, Laszlo Krenacs3, Thomas Tousseyn4, Pascale De Paepe5,
Anne Uyttebroeck6, Gregor Verhoef7, Tom Taghon8, Peter Vandenberghe1, Jan Cools1,9,
Iwona Wlodarska1*
1 Center for Human Genetics, KU Leuven, Leuven, Belgium, 2 Molecular Pathology, Cleveland Clinic, Cleveland, Ohio, United States of America, 3 Laboratory of Tumor
Pathology and Molecular Diagnostics, University of Szeged, Szeged, Hungary, 4 Translational Cell and Tissue Research KU Leuven, Department of Pathology UZ Leuven,
Leuven, Belgium, 5 Department of Pathology, AZ St Jan AV, Brugge, Belgium, 6 Department of Pediatrics, UZ Leuven, Leuven, Belgium, 7 Department of Hematology, UZ
Leuven, Leuven, Belgium, 8 Department of Clinical Chemistry, Microbiology and Immunology, Ghent University Hospital, Ghent University, Ghent, Belgium, 9 Center for
the Biology of Disease, VIB, Leuven, Belgium
Abstract
Hepatosplenic T-cell lymphoma (HSTL) is an aggressive lymphoma cytogenetically characterized by isochromosome 7q[i(7)(q10)], of which the molecular consequences remain unknown. We report here results of an integrative genomic andtranscriptomic (expression microarray and RNA-sequencing) study of six i(7)(q10)-positive HSTL cases, including HSTL-derived cell line (DERL-2), and three cases with ring 7 [r(7)], the recently identified rare variant aberration. Using highresolution array CGH, we profiled all cases and mapped the common deleted region (CDR) at 7p22.1p14.1 (34.88 Mb;3506316-38406226 bp) and the common gained region (CGR) at 7q22.11q31.1 (38.77 Mb; 86259620–124892276 bp).Interestingly, CDR spans a smaller region of 13 Mb (86259620–99271246 bp) constantly amplified in cases with r(7). Inaddition, we found that TCRG (7p14.1) and TCRB (7q32) are involved in formation of r(7), which seems to be a byproduct ofillegitimate somatic rearrangement of both loci. Further transcriptomic analysis has not identified any CDR-relatedcandidate tumor suppressor gene. Instead, loss of 7p22.1p14.1 correlated with an enhanced expression of CHN2 (7p14.1)and the encoded b2-chimerin. Gain and amplification of 7q22.11q31.1 are associated with an increased expression ofseveral genes postulated to be implicated in cancer, including RUNDC3B, PPP1R9A and ABCB1, a known multidrug resistancegene. RNA-sequencing did not identify any disease-defining mutation or gene fusion. Thus, chromosome 7 imbalancesremain the only driver events detected in this tumor. We hypothesize that the D7p22.1p14.1-associated enhancedexpression of CHN2/b2-chimerin leads to downmodulation of the NFAT pathway and a proliferative response, whileupregulation of the CGR-related genes provides growth advantage for neoplastic dcT-cells and underlies their intrinsicchemoresistance. Finally, our study confirms the previously described gene expression profile of HSTL and identifies a set of24 genes, including three located on chromosome 7 (CHN2, ABCB1 and PPP1R9A), distinguishing HSTL from othermalignancies.
Citation: Finalet Ferreiro J, Rouhigharabaei L, Urbankova H, van der Krogt J-A, Michaux L, et al. (2014) Integrative Genomic and Transcriptomic Analysis IdentifiedCandidate Genes Implicated in the Pathogenesis of Hepatosplenic T-Cell Lymphoma. PLoS ONE 9(7): e102977. doi:10.1371/journal.pone.0102977
Editor: Jorg D. Hoheisel, Deutsches Krebsforschungszentrum, Germany
Received April 8, 2014; Accepted June 23, 2014; Published July 24, 2014
Copyright: � 2014 Finalet Ferreiro, et al. This is an open-access article distributed under the terms of the Creative Commons Attribution License, which permitsunrestricted use, distribution, and reproduction in any medium, provided the original author and source are credited.
Data Availability: The authors confirm that all data underlying the findings are fully available without restriction. All relevant data are within the paper and itsSupporting Information files.
Funding: This study was supported by the concerted action grant from the K. U. Leuven no. 3M040406 (J-AvdK, TT, PV, JC and IW) (http://www.kuleuven.be/english), and a research grant from ‘‘Stichting tegen Kanker’’ (PV) (http://www.kanker.be/. PV is a senior clinical investigator of the FWO-Vlaanderen (http://www.fwo.be/en/). The funders had no role in study design, data collection and analysis, decision to publish, or preparation of the manuscript.
Competing Interests: The authors have declared that no competing interests exist.
* Email: [email protected]
Introduction
Hepatosplenic T-cell lymphoma (HSTL) is a rare and clinically
aggressive subtype of peripheral T-cell lymphoma (PTCL) [1],
recognized as a distinct clinico-pathological entity in the 2008
WHO classification [2]. Patients, predominantly young men,
usually present with isolated hepatosplenomegaly and thrombo-
cytopenia. Histologically, they show sinusoidal involvement of
bone marrow, liver and spleen. HSTL is derived from the cd
(occasionally ab [3–5]) cytotoxic memory T-cells responsible for
innate immunity. The disease shows a fulminant clinical course,
therapy resistance and poor prognosis. The median survival of
patients with HSTL is usually shorter than two years [6].
Cytogenetically, isochromosome 7q [i(7)(q10)] is a hallmark of
HSTL [7–10], although sporadic cases with a ring chromosome 7
[r(7)] [11–13] or translocation involving chromosome 7 [14] have
been published. The most common accompanying karyotype
alteration is trisomy 8 [9]. Thus far, the functional and molecular
PLOS ONE | www.plosone.org 1 July 2014 | Volume 9 | Issue 7 | e102977

Ta
ble
1.
Re
leva
nt
clin
ical
and
ge
ne
tic
dat
a.
Ca
seS
ex
/Ag
e
Pre
vio
us
me
dic
al
his
tory
His
tolo
gic
all
yp
rov
en
site
so
fin
vo
lve
-me
nt
Tre
atm
en
tO
utc
om
e(m
on
ths)
Cy
tog
en
eti
csa
CG
Hp
latf
orm
PH
F1
4se
qG
EP
Aff
y2
.0R
NA
seq
WB
Sa
mp
le/
sta
tus
Ka
ryo
typ
eb
1M
/26
Ssp
len
ect
om
y,al
loB
MT
xC
R,
aliv
e(8
0)
S/D
46
–4
8,X
Y,r
(7),i
nc[
2]
Ag
ilen
t2
44
kd
on
ed
on
e
2a
M/7
po
ssib
leIg
An
ep
hro
pat
hy
S,L,
BM
sple
ne
cto
my,
com
bin
ed
CT
(PO
G9
40
4in
du
ctio
np
roto
col)
CR
(12
),lo
stto
FUB
M/D
47
,XY
,r(7
)(p
22
q3
6),
+8[1
5]
Ag
ilen
t2
44
k
3a
F/6
2IT
PS,
L,B
Msp
len
ect
om
y,co
mb
ine
dC
TD
OD
(2)
BM
/D4
7,X
X,r
(7),
+8,d
er(
19
)t(?
;19
)(?;
p1
3)[
10
]A
gile
nt
24
4k
4a
M/3
3B
ud
d-C
hia
risy
nd
rom
e,
live
rT
x
S,L,
BM
sple
ne
cto
my
DO
D(2
)S/
D4
5–
46
,X,-
Y,-
4,d
er(
7)a
dd
(7)(
p2
2)a
dd
(7)
(q3
2),
i(7
)(q
10
),+i(
7)(
q1
0)[
2],d
er(
8)t
(1;8
)(q
21
;p
23
),-2
2,+
mar
1,+
mar
2[c
p1
1].a
CG
H+8
Aff
yme
trix
Cyt
oSc
anH
Dd
on
ed
on
ed
on
e
5M
/52
Cro
hn
’sd
ise
ase
Ssp
len
ect
om
y,co
mb
ine
dC
T,
MA
B
DO
D(1
1.5
)S/
D4
6–
47
,XY
,ad
d(4
)(p
16
),i(7
)(q
10
),+8
[4],-
[20
],+m
ar[2
][cp
6]
Ag
ilen
t2
44
kd
on
ed
on
ed
on
ed
on
e
6M
/50
S,B
Msp
len
ect
om
y,co
mb
ine
dC
TD
OD
(25
)S/
D4
3–
45
,X,-
Y,i(
7)(
q1
0)[
cp7
].aC
GH
+8A
ffym
etr
ixC
yto
Scan
HD
do
ne
7M
/18
kid
ne
yT
xfo
rd
ysp
lasi
aS,
Pe
,B
Msp
len
ect
om
y,co
mb
ine
dC
TD
OD
(8.5
)S/
D4
0–
48
,XY
,+X
[3],-
5[4
],i(7
)(q
10
),+8
[5],+
10
[2],a
dd
(11
)(q
22
)[1
0],i
nc[
cp1
2].a
CG
H+8
Aff
yme
trix
Cyt
oSc
anH
Dd
on
ed
on
ed
on
e
8F/
55
S,B
Msp
len
ect
om
y,co
mb
ine
dC
TD
OD
(21
)B
M/P
46
–4
7,X
X,i(
7)(
q1
0),
+i(7
)(q
10
)[4
],+8
,-1
0,
add
(15
)(q
26
),ad
d(2
2)(
q1
3)[
cp1
2]
Aff
yme
trix
Cyt
oSc
anH
D
9 DE
RL
-24
6,X
Y,a
dd
(5)(
q?)
,i(7
)(q
10
),-1
0[5
][cp
15
]c.
aCG
H+8
Ag
ilen
t2
44
kd
on
ed
on
ed
on
e
a,
pre
vio
usl
yp
ub
lish
ed
case
s[1
0],[
11
,13
].b
,ka
ryo
typ
es
we
red
esc
rib
ed
acco
rdin
gto
reco
mm
en
dat
ion
so
fIS
CN
(20
13
)[8
4]
c,
kary
oty
pe
acco
rdin
gto
Di
No
toet
al.(
20
01
)[2
2].
abb
revi
atio
ns:
ITP
,id
iop
ath
icth
rom
bo
cyto
pe
nic
pu
rpu
ra;P
OG
,Pe
dia
tric
On
colo
gy
Gro
up
;MA
B,M
on
ocl
on
alA
nti
bo
die
s;T
x,tr
ansp
lan
tati
on
;S,s
ple
en
;L,l
ive
r;B
M,b
on
em
arro
w;P
e,p
eri
ton
eu
m;a
llo,a
llog
en
eic
;CT
,ch
em
oth
era
py;
FU,
follo
w-u
p;
D,
dia
gn
osi
s;P
,p
rog
ress
ion
;W
B,
We
ste
rnb
lott
ing
.d
oi:1
0.1
37
1/j
ou
rnal
.po
ne
.01
02
97
7.t
00
1
Molecular Pathogenesis of Hepatosplenic T-Cell Lymphoma
PLOS ONE | www.plosone.org 2 July 2014 | Volume 9 | Issue 7 | e102977

Figure 1. Examples of aCGH and FISH analysis. A) upper panel: genomic profile of chromosome 7 of four index cases with the indicatedcommon deleted region (CDR) on 7p and common gained region (CGR) on 7q; lower left panel: gene content (Hg19) of the biallelically deleted 7p21interval in case 4; lower right panel: zoomed CDR with the indicated selectively amplified region (SAR). B) Examples of interphase FISH validation ofaCGH results performed in cases 1 (left panel) and 2 (right panel) with r(7). Applied probes: (a) RP11-99J06-SG/RP11-735O20-SO, (b) RP13-11C11-SG/RP11-807G04-SO, (c) RP11-513N08-SG/RP11-514N09-SO, (d) RP11-379L24-SO/RP11-16K22-SG,(e) RP11-269N18-SG/RP5-894A10-SO, (f) RP4-548K24-SG/RP11-135F23-SO.doi:10.1371/journal.pone.0102977.g001
Molecular Pathogenesis of Hepatosplenic T-Cell Lymphoma
PLOS ONE | www.plosone.org 3 July 2014 | Volume 9 | Issue 7 | e102977

genetic consequences of i(7)(q10) in HSTL remain largely
unknown. As development of i(7)(q10) results in loss of one copy
of the short arm of chromosome 7 (7p) and gain of the long arm of
chromosome 7 (7q), neoplastic cells presumably suffer from an
aberrant gene dosage effect. Some or all of these imbalances may
represent the key event driving the development of HSTL. As
HSTL tends to gain extra copies of i(7)(q10) [10,15] or selectively
amplify 7q sequences [11–13], overrepresentation of 7q seems to
have an important impact on the pathogenesis of this lymphoma.
Combined gene expression profiling (GEP) and array-based
comparative genomic hybridization (aCGH) of several HSTL
cases recently reported by Travert et al. [5] showed downregu-
lation of 7p genes, particularly CYCS, IKZF1, HUS1 and CBX3,
and upregulation of 7q genes, including the putative oncogene
PTPN12. To gain further insight into the molecular pathogenesis
of HSTL, we determined genomic profiles of six i(7)(q10)-positive
HSTL cases, including DER-L2 cell line, and three cases with r(7),
and significantly narrowed down the common deleted region on
7p and the common gained region on 7q. Subsequent transcrip-
tomic studies using global microarray expression profiling and
RNA-sequencing led to identification of candidate genes impli-
cated in the pathogenesis of HSTL.
Materials and Methods
PatientsSix HSTL cases were collected from files of the Center for
Human Genetics, KU Leuven, Leuven, Belgium. Two cases were
provided by L. Krenacs (Laboratory of Tumor Pathology and
Molecular Diagnostics, Szeged, Hungary) and S. Shetty (Depart-
ment of Medical Genetics, Alberta Children’s Hospital, Calgary,
Canada). Diagnosis of HSTL was based on histopathology and
immunophenotype, according to the WHO criteria [2]. The
clinical, pathological and immunophenotypic features of the
patients were reviewed. The study was approved by the
institutional review board ‘‘Commissie Medische Ethiek’’ of the
University Hospital. For this retrospective study the ‘‘Commissie
Medische Ethiek’’ waived the need for written informed consent
from the participants.
Cytogenetics and fluorescence in situ hybridizationR- and G-banding chromosomal analysis and fluorescence in
situ hybridization (FISH) analysis followed standard procedures.
Probes used for FISH analysis are listed in Table S1. Non-
commercial probes were labeled with SpectrumOrange- and
SpectrumGreen-d-UTP (Abbott Molecular, Ottigne, Belgium)
using random priming. FISH experiments were evaluated using
an Axioplan 2 fluorescence microscope equipped with a charge-
coupled device Axiophot 2 camera (Carl Zeiss Microscopy, Jena,
Germany) and a MetaSystems Isis imaging system (MetaSystems,
Altlussheim, Germany). Two to 10 abnormal metaphases and/or
200 interphase cells were evaluated in each FISH experiment.
High resolution array CGHTotal genomic DNA was isolated from fresh frozen lymphoma
samples or cytogenetic pellet (Table 1; case 2) using standard
procedures. Genomic profiling, following the manufacturer’s
protocols, was performed using the Agilent 244k (www.agilent.
com) (5 cases) and the Affymetrix CytoScan HD arrays (www.
affymetrix.com) (4 cases). Array CGH data are available at GEO
(Accession number: GSE57944).
Data analysis and visualization softwareDownstream data analysis of the genomic profiling results was
performed using the software ArrayStudio, version 6.2 (www.
omicsoft.com). Unless otherwise specified, this software was also
used for various analysis performed on the expression data
retrieved from microarray and RNAseq technologies described
below.
PHF14 sequencingMutation analysis of PHF14 was performed on total genomic
DNA from five index cases (Table 1) and four control PTCL cases
without chromosome 7 abnormalities. PCR amplification and
sequence analysis of genomic sequences spanning full exons of
PHF14 were performed using Sanger sequencing primers (Table
S2) and conventional sequencing method.
Figure 2. Mechanism underlying formation of r(7) in HSTL. A) Partial karyotype showing r(7). B) Proposed model of the r(7) formation.Illegitimate somatic rearrangement of TCRB and TCRG in dcT-cells leads to the aberrant TCRB-TCRG lesion and consequently to the formation of r(7)and loss of the terminal 7p and 7q regions, respectively. This process is followed by a subsequent gain/amplification of 7q sequences (shown in red).doi:10.1371/journal.pone.0102977.g002
Molecular Pathogenesis of Hepatosplenic T-Cell Lymphoma
PLOS ONE | www.plosone.org 4 July 2014 | Volume 9 | Issue 7 | e102977

454 sequencingCustom designed Nimblegen sequence capture 385k Version
2.0 Arrays (Roche Applied Science, Mannheim, Germany)
targeting sequences at 7p21.3/10106629-11176525 (hg18) were
produced. Preparation of shot-gun DNA sequencing libraries and
capturing of the target region was performed according to the
manufacturer’s instructions. Captured DNA was pyrosequenced
on a GS FLX instrument (Roche Applied Science, Mannheim,
Germany) according to the manufacturer’s instructions.
Microarray gene expression analysisTotal RNA extraction from four frozen lymphoma samples
(Table 1) and three nonmalignant spleens was performed using
TRIzol LS Reagent (Life Technologies Europe B.V., Ghent,
Belgium). For gene expression profiling, the Affymetrix platform
HG-U133 Plus 2.0 was used. To increase the statistical
significance of the study, data from 13 previously published
HSTL cases, various T-cell malignancies [25 cases of PTCL
(peripheral T-cell lymphoma), 10 cases of NK/TCL (Natural
Figure 3. Expression of CHN2/b2-chimerin. A) Normalized values of all CHN2 probes in the used U133 array for the analyzed malignancies andnormal controls. The observed expression differences were statistically significant, with FDR_BH ,0.05 (Table S6). B) Expression values of CHN2 usingthe RNAseq data. FPKM (Fragments Per Kilobase of exon Model) is a measurement of transcript abundance in RNAseq experiments. C) Westernblotting and densitometry of b2-chimerin. The bars represent the fold change of the normalized intensity of b2-chimerin (compared to b-actin) versusspleen. The number between parenthesis represent the number of samples.doi:10.1371/journal.pone.0102977.g003
Molecular Pathogenesis of Hepatosplenic T-Cell Lymphoma
PLOS ONE | www.plosone.org 5 July 2014 | Volume 9 | Issue 7 | e102977

Killer/T-cell lymphoma), 21 cases of AITCL (angioimmunoblastic
T-cell lymphoma) and nonmalignant samples (6 spleens, 26
samples of T-cells, including activated cdT-cells] were retrieved
from public sources (GEO and ArrayExpressed)) (Table S3). The
raw data of all cases (CEL files) were normalized together using the
GeneChip-Robust Multiarray Averaging (GC-RMA) algorithm.
Principal component analysis (PCA), hierarchical clustering and a
special application of Lewi’s spectral mapping [16] to microarrays
(Spectral Map Analysis, SMA) (www.vetstat.ugent.be/workshop/
Nairobi2004/Bijnens/Bijnens2004.pdf) were used to detect rela-
tionship in the data and to identify outliers. To find differentially
expressed genes, the General Linear Model (GLM) was used for
inference analysis. The resulting Fold Change (FC) and False
Discovery Rate (FDR) (using the Benjamini–Hochberg procedure,
FDR_BH) were used to set differential expression cut-offs. The cut
offs values for FC ranged from an absolute value (Abs(FC)) of 2.0
(Abs(FC) $2.0) to 3.5 (Abs(FC)$3.5). The maximum FDR used as
a cut off was 0.1 (FDR #0.1) and the minimum was 0.05 (FDR #
0.05). The microarray data of four index cases and three
nonmalignant spleens were deposited in GEO (Accession number:
GSE57944).
Library preparation for paired-end RNA-sequencing andprocessing of RNAseq reads
Four samples of HSTL (Table 1) and one nonmalignant spleen
sample were subjected to RNA-sequencing. The Illumina standard
kit (Illumina TruSeq RNA Sample Preparation Kit, San Diego,
CA, USA) was used for the mRNAseq sample preparation
according to the manufacturer’s protocol. Briefly, 1 mg of total
Table 2. Ingenuity Pathway Analysis: Most significant networks, functions and pathways associated to the top 401 genesdifferentially expressed in HSTL.
Top Networks
Associated Network Functions Score
Cellular Assembly and Organization, Hematological System Development and Function, Inflammatory Response 40
Digestive System Development and Function, Embryonic Development, Organismal Development 40
Cell Morphology, Cellular Assembly and Organization, Carbohydrate Metabolism 38
Connective Tissue Disorders, Developmental Disorder, Skeletal and Muscular Disorders 37
Cancer, Cell Morphology, Organ Morphology 33
Top Diseases and Bio Functions
Name p-value No of molecules
Cancer 3.08E-20 -3.87E-05 265
Reproductive System Disease 2.90E-16 -3.95E-05 104
Connective Tissue Disorders 3.43E-15 -1.54E-05 73
Inflammatory Disease 3.43E-15 -2.37E-05 95
Skeletal and Muscular Disorders 3.43E-15 -3.35E-05 83
Molecular and Cellular Functions
Name p-value No of molecules
Cellular Development 1.98E-23 -2.92E-05 186
Cellular Growth and Proliferation 1.98E-23 -3.32E-05 180
Cellular Movement 6.53E-21 -3.62E-05 126
Cell Morphology 5.60E-19 -2.92E-05 129
Cell-To-Cell Signaling and Interaction 1.12E-15 -2.69E-05 148
Physiological System Development and Function
Name p-value No of molecules
Tissue Morphology 2.19E-20 -2.00E-05 141
Hematological System Development and Function 5.86E-20 -3.62E-05 144
Immune Cell Trafficking 7.14E-16 -3.62E-05 95
Embryonic Development 6.66E-14 -2.35E-05 96
Lymphoid Tissue Structure and Development 6.66E-14 -2.84E-05 73
Top Canonical Pathways
Name p-value Ratio
Natural Killer Cell Signaling 4.36E-07 13/118 (0.11)
Crosstalk between Dendritic Cells and Natural Killer Cells 1.73E-06 11/106 (0.104)
Granulocyte Adhesion and Diapedesis 4.54E-05 13/181 (0.072)
Agranulocyte Adhesion and Diapedesis 8.03E-05 13/191 (0.068)
Hepatic Fibrosis/Hepatic Stellate Cell Activation 4.38E-04 10/155 (0.065)
doi:10.1371/journal.pone.0102977.t002
Molecular Pathogenesis of Hepatosplenic T-Cell Lymphoma
PLOS ONE | www.plosone.org 6 July 2014 | Volume 9 | Issue 7 | e102977

RNA was used for polyA mRNA selection using poly-T oligo-
attached magnetic beads, followed by thermal mRNA fragmen-
tation. Using reverse transcriptase (Superscript II, Life Technol-
ogies Europe B.V.e, Ghent, Belgium) and random primers, cDNA
was synthesized and subsequently double stranded, end-repaired
(End Repair Mix) and ligated to the Illumina RNA Indexes
Adaptor. The libraries were purified after enrichment using 15
cycles of PCR. The insert sizes of the libraries were checked by
Agilent Technologies 2100 Bioanalyzer.
Processing of Illumina RNA-sequencing readsPrepared libraries were sequenced using HiSeq 2000 (Illumina,
San Diego, CA, USA) operated in paired-end 26100 bp mode.
Reads were quality-filtered using a standard Illumina process.
RNAseq bioinformatics analysisFor further analysis, we used additional RNAseq data of three
cases of PTCL, five cases of T-ALL, the Jurkat T-cell line and one
nonmalignant thymus available in our institution. The fastq files of
all samples were mapped to the reference human genome
(assembly GRCh37.68). The mapping was performed using
OSA [17] with the default parameters allowing detection of
insertions and deletions (indels). The mapped reads were used to
calculate read counts and FPKM (Fragment Per Kilobase of exon
model per Million of mapped read) per gene. The DESeq
algorithm [18] was applied to identify differentially expressed
genes. Prediction of SNV followed the previously described
approach [19] filtering out the variants found in normal spleen.
The detection of indels was done independently using ArrayStu-
dio. Fusion transcript discovery was performed using deFuse
v.0.5.0 [20] with default parameters and a fusion detection
algorithm provided by ArrayStudio [17,21]. Fusions with less than
8 spanning reads and less than 5 split reads were filtered out as
well as those observed in adjacent genes.
Gene signature analysisTo find a gene signature of HSTL, at first we ran 10 different
inference analyses (using both microarray and RNAseq data)
comparing HSTL with PTCL-NOS, NK/TCL, AITCL, T-ALL,
nonsorted normal T-cells, sorted activated cdT-cells, nonmalig-
nant spleen and thymus. After selecting the differentially expressed
genes in every comparison, the results (FC of the gene per
comparison) were merged in a table. Then, we selected genes with
a consistent expression pattern (either up- or downregulated)
across the different comparisons and used these genes for
unsupervised hierarchical clustering analyses. The resulting
dendograms and heatmaps were visually inspected and the genes
which were not essential to keep the integrity of the HSTL samples
cluster were removed. This process was repeated until a minimal
Table 3. List of genes comprising the HSTL signature.
Gene Symbol Chromosome Position Name Location* Type molecules
Upregulated
ABCB1 7 87133175 ATP-binding cassette, sub-family B (MDR/TAP), member 1 PM transporter
CD200R1 3 112640056 CD200 receptor 1 PM other
CD5L 1 157800704 CD5 molecule-like PM transmembrane receptor
ITGAD 16 31404633 integrin, alpha D PM other
PPP1R9A 7 94536948 protein phosphatase 1, regulatory subunit 9A PM other
S1PR5 19 10623623 sphingosine-1-phosphate receptor 5 PM G-protein coupled receptor
TMEM178A 2 39892122 transmembrane protein 178A PM other
CHN2 7 29234120 chimerin (chimaerin) 2 C other
CHSY3 5 129240165 chondroitin sulfate synthase 3 C enzyme
FCRLB 1 161691353 Fc receptor-like B C other
PRDM16 1 2985732 PR domain containing 16 N transcription regulator
Downregulated
CCR7 17 38 710021 chemokine (C-C motif) receptor 7 PM G-protein coupled receptor
CD200 3 112051915 CD200 molecule PM other
CD28 2 204571198 CD28 molecule PM transmembrane receptor
CD5 11 60869867 CD5 molecule PM transmembrane receptor
CD83 6 14117872 CD83 molecule PM other
CXCR3 X 70835766 chemokine (C-X-C motif) receptor 3 PM G-protein coupled receptor
GPR183 13 99946784 G protein-coupled receptor 183 PM G-protein coupled receptor
SLAMF1 1 160577890 signaling lymphocytic activation molecule family member 1 PM transmembrane receptor
FAM134B 5 16473147 family with sequence similarity 134, member B C other
GZMK 5 54320081 granzyme K (granzyme 3; tryptase II) C peptidase
CAMK4 5 110559351 calcium/calmodulin-dependent protein kinase IV Nucleus kinase
PRRX1 1 170631869 paired related homeobox 1 Nucleus transcription regulator
CCL19 9 34689564 chemokine (C-C motif) ligand 19 ES cytokine
*PM, plasma membrane; C, cytoplasm; N, nucleus; ES, extracellular space.doi:10.1371/journal.pone.0102977.t003
Molecular Pathogenesis of Hepatosplenic T-Cell Lymphoma
PLOS ONE | www.plosone.org 7 July 2014 | Volume 9 | Issue 7 | e102977

Figure 4. Hierarchical clustering using the 24 gene signature for HSTL. The MA data (A–E) and RNAseq data (F–H) show an accurateseparation of the HSTL cluster from PTCL, AITCL, NK/TCL, nonmalignant spleen, normal T-cells, nonmalignant thymus and T-ALL.doi:10.1371/journal.pone.0102977.g004
Molecular Pathogenesis of Hepatosplenic T-Cell Lymphoma
PLOS ONE | www.plosone.org 8 July 2014 | Volume 9 | Issue 7 | e102977

number of genes was found, which keep the cluster formed by the
HSTL samples intact.
Biological pathways analysisTo find significant enriched pathways and biological functions
in HSTL, we uploaded the result of the inference analyses into the
‘‘Ingenuity Pathway Analysis’’ application (IPA, www.ingenuity.
com). From the three confidence levels provided by the system, we
used ‘‘Experimentally observed’’ and ‘‘Highly predicted’’ data.
For details see: http://ingenuity.force.com/ipa/articles/Feature_
Description/Canonical-Pathways-for-a-Dataset
QRT-PCR analysisQuantitative RT-PCR was performed with the LightCycler 480
SYBR Green I master mix (Roche Diagnostics Belgium,
Vilvoorde, Belgium) and the results were analyzed using the
comparative dCt method. The analysis was done using 3 replicates
and the two most similar values were used to calculate the mean.
Primer sequences are shown in Table S2.
Western blot analysisSections from lymphoma frozen tissues and pellets of cultured
DERL-2 cells were lysed and processed for Western blotting
according to standard procedure using antibodies against b2-
chimerin (2E3; Rat mAb nr. 4728, Cell Signaling Technology,
Danvers, Massachusetts, USA) and b-actin (Sigma Aldrich, St.
Louis, MO, USA). Protein detection was performed with Image
Quant Las4000. Densitometric analysis of protein blots was
performed using the ImageJ (1.45) software from the National
Institutes of Health (http://rsb.info.nih.gov/ij/).
ImmunohistochemistryExpression of ABCB1 (MDR1) was analyzed by IHC with
monoclonal MDR1 antibody (MAB4120, clone JSB-1, Millipore,
Overijse, Belgium) used at dilution 1:200 with a high pretreat-
ment. Results were visualized using the OptiView DAB IHC
Detection Kit (Ventana, Oro Valley, Tucson, Arizona). Image
acquisition was done through a Leica microscope at 2006 and
1006magnification. Images were assembled using Adobe Photo-
shop CS5.
Results
Clinical characteristics of HSTL patientsThe relevant clinical features of eight reported HSTL cases are
shown in Table 1. There were six male and two female patients in
age ranging from seven to 62 years (average 38.7). The cases
displayed the common clinical, morphological and immunophe-
notypic features of HSTL, including cdT-cell origin [2]. Histo-
logically, all patients showed spleen involvement. Liver and/or
bone marrow (BM) involvement were histologically proven in
three and six patients, respectively. Four patients (50%) had either
a previous autoimmune disorder (i.e. idiopathic thrombocytopenic
purpura, Crohn’s disease) or underwent immunosuppressive
treatment after solid organ transplantation. All patients underwent
splenectomy, which was followed by allogenic BM transplantation
(alloBMTX) (one case) or combined chemotherapy (CT) (six
cases). One patient died two months after diagnosis, six patients
treated with combined CT survived 2-25 months (average 11.7
months) and one patient was lost for follow-up after 12 months of
Figure 5. Morphology and ABCB1 expression in HSTL cases detected by IHC. Immunohistochemical stainings (A–C, anti-CD3; D-F, anti-MDR1/ABCB1) of the typical intrasinusoidal spread (red arrows) by HSTL cells in the bone marrow (A/D, case 4) and spleen (B/E, case 6), respectively,compared to staining pattern in normal spleen (C/F). Pictures captured by Leica DFC290HD camera at 400X. Scale bar = 50 mm.doi:10.1371/journal.pone.0102977.g005
Molecular Pathogenesis of Hepatosplenic T-Cell Lymphoma
PLOS ONE | www.plosone.org 9 July 2014 | Volume 9 | Issue 7 | e102977

Figure 6. Postulated model for the pathogenesis of HSTL. (A) In resting T-cells, NFAT proteins are located in the cytoplasm and are associatedwith a large RNA-protein scaffold complex composed of the lincRNA NRON, a repressor of NFAT [30], and several additional proteins [31]. NFATproteins are heavily phosphorylated through synergistic action of three different family of kinases, casein kinase 1 (CK1), glycogen synthase kinase 3(GSK3), and dual specificity tyrosine phosphorylation regulated kinase (DYRK) [29]. When T-cells are stimulated, TCR engagement triggers a rapidincrease in intracellular calcium (Ca2+) and activation of RAC1, a GTPase which belongs to the RAS superfamily of small GTP-binding proteins [79]. Theactive, GTP-bound RAC1 binds to IQGAP (IQ-domain GTPase-activating protein) negatively regulating its binding affinity for other proteins andconsequently, stimulating the disassembly of the NRON complex [31,82,83]. In parallel, the calcium increase leads to activation of calmodulin, a
Molecular Pathogenesis of Hepatosplenic T-Cell Lymphoma
PLOS ONE | www.plosone.org 10 July 2014 | Volume 9 | Issue 7 | e102977

complete remission (CR). Notably, patient 1 who received
alloBMTX is alive and remaining in CR (80 months).
Molecular cytogenetic analysisAll eight patients and the included HSTL-derived DERL-2 cell
line [22] displayed abnormal karyotypes with either i(7)(q10) (six
cases) or r(7) (three cases) (Table 1). Of note, case 4 revealed
additional aberrations of the other chromosome 7 and a subclonal
duplication of i(7)(q10), which was also detected in case 8. Trisomy
8 was identified in five patients. The cases were further subjected
to a high resolution aCGH analysis which detected genomic
imbalances in all of them (Table S4).
Chromosome 7 profiles of cases 1 and 3 with r(7) were very
similar. They were characterized by terminal losses of 7p/
7q regions, with respective breakpoints at 7p14.1/TCRG(38406226 bp) and 7q32/TCRB (142502221 bp), and gain of
7q, which encompasses 7q21.12q33 (86259620–137506193 bp) in
case 1 and 7q21.11q31.33 (79158260–124892276 bp) in case 3
(Figure 1A, upper panel). The profile of case 2 was less
pronounced (,20% of abnormal cells), although loss of
7p22.3p22.1 and gain of 7q21.1q32.1 were evident. Five cases
with i(7)(q10) revealed loss of the entire 7p and gain of 7q, as
expected. Case 4 displayed complex imbalances, including
duplication of the terminal 7p22.2p22.2 (2347596–3506315 bp)
region, monoallelic loss of 7p22.1p11 (3506316–57883626 bp)
and a biallelic microdeletion at 7p21.3 (10165499–11213632 bp)
(Figure 1A, left lower panel). The long arm of chromosome 7
showed three copies of the 7q11q31.1 (61.831.840–110403720 bp)
region and two copies of 7q31.1q36 (110413108–159118566 bp).
Based on the aCGH data, we defined the common deleted region
(CDR) at 7p22.1p14.1 (3506316–38406226 bp) (34.89 Mb) and
the common gained region (CGR) at 7q21.22q31.1/(86259620–
124892276 Mb) (38.78 Mb) (Figure 1A, upper panel). Cases 1 and
3 displayed a smaller amplified region (SAR)of 13 Mb (86259620–
99271246 bp) at 7q21.22q22.1 (Figure 1A, right lower panel). To
validate aCGH data, we analyzed two available cases with r(7)
(cases 1 and 2) by interphase FISH with the selected 7p/7q BAC
clones (Table S1). As illustrated in Figure 1B, FISH confirmed the
localization of terminal 7p/7q breakpoints within TCRG and
TCRB, respectively, and the associated loss of terminal sequences
flanking both loci, suggesting their involvement in formation of r(7)
(Figure 2). FISH also evidenced a different size of the gained 7q
region and the level of 7q gain. For example, three SAR-related
probes showed 4–5 signals in case 1 and 6–9 signals in case 2
(Figure 1B).
Other recurrent aCGH imbalances detected in at least two
cases include a trisomy 8 (7 cases), duplication of 1q (3 cases;
common gain of 1q31q34), loss of 4p (3 cases; common loss of
4p16.3p16.3), loss of 10p (2 cases; common loss of 10p14p13/
10p12.2p11.22) and duplication of 17q (2 cases; common gain of
17q21.33q25.3) (Table S4). Of note, trisomy 8 was not detected in
case 2 (low proportion of tumor cells) but it was identified in three
additional cases (no. 4, 6 and 9). Altogether, cytogenetics and
aCGH detected trisomy 8 in eight out of nine (88.8%) studied
cases.
Sequencing of the biallelically deleted 7p21 regionThe 7p21.3 region biallelically deleted in case 4 harbors two
protein-coding genes, NDUFA4 and PHF14, a candidate tumor
suppressor gene (TSG) [23–25]. To examine the mutational status
of PHF14 on the nondeleted 7p allele in other index cases, we
sequenced the gene in cases 1, 5, 6, and 9 (DERL-2). No mutation,
however, was identified. In the next step, the entire 10165499–
11213632 bp region was sequenced using the 454 technology
combined with region capturing. This analysis detected neither
recurrent intergenic nor intragenic mutations in the four samples
analyzed.
Quality of the RNAseq dataThe average number of reads obtained was 98.7 million and the
average percentage of uniquely mapped reads was 86.3%. No 39
bias was detected. The full alignment report is in Table S5. The
raw RNAseq data (fastq files) of all HSTL and PTCL-NOS cases
analyzed plus the normal spleen are available at GEO (Accession
number: GSE57944).
Gene expression and pathway analysisTranscriptome of HSTL was studied using expression micro-
array (MA) [cases 1, 4, 5, 7 plus 100 publicly available samples,
including HSTL (n = 13), various T/NK-cell malignancies (n = 54)
and normal T-cell controls (n = 33); Table S3] and RNAseq
approach [cases 4, 5, 7, DERL-2 plus 10 control samples
including, PTCL-NOS (n = 3), T-ALL (n = 5), nonmalignant
spleen (n = 1) and thymus (n = 1)] (see details in Materials and
Methods). Given that the MA dataset included samples from five
different laboratories, at first we performed data structure analysis
including Spectral Map Analysis (SMA), hierarchical clustering
and Principal Component Analysis (PCA). SMA showed that the
MA samples selected for further bioinformatic analysis cluster
according to their classification and there was no bias by their
laboratory origin (Figure S1 A–B). PCA on the RNAseq
expression data discriminated HSTL from other analyzed samples
except for the nonmalignant thymus (Figure S2).
To identify critical genes targeted by chromosome 7 imbalances
(presumably TSG located within CDR and/or oncogene(s)
harbored by CGR) in HSTL, we ran 10 different inference
analyses (using the MA and RNAseq data) comparing HSTL vsPTCL-NOS, NK/TCL, AITCL, T-ALL, nonsorted normal T-
cells, sorted activated cdT-cells, nonmalignant spleen and thymus.
Then, we focused on the CDR- and CGR-associated genes.
Among the roughly 550 genes located within the CDR, only 17
genes were found dysregulated (Table S6). Of note, PHF14, our
initial candidate TSG, was not dysregulated in any of
the comparisons performed. Surprisingly, the comparison vs
calcium-binding messenger protein, which activates of the phosphatase calcineurin. This enzyme dephosphorylates NFAT and promotes nucleartransport of activated NFAT by importins (KPNB1, CSE1L). In the nucleus, NFAT, in synergy with a numbers of other transcriptional regulators (e.g. FOSand JUN), participates in a transcriptional regulation of a wide range of genes involved in immune system responses and organs development [29,66].(B) We postulate that formation of i(7)(q10) or r(7) in cdT-cell triggers an aberrant expression of b2-chimerin which subsequently inactivates RAC1 bykeeping it in a GDP-bound state. This prevents RAC1 binding with IQGAP resulting in a strengthening of the NRON complex and arrests thephosphorylated NFAT in the cytoplasm. Cytoplasmic retention of NFAT may be also attributed to the kinase LRRK2 (overexpressed in HSTL), whichblocks the transport of NFAT to the nucleus [32,33]. The significantly reduced nuclear level of NFAT leads to dysregulated transcription of responsivegenes controlling cell-cycle, cell death and proliferation, and eventually, to malignant transformation and clonal proliferation of i(7)(q10)/r(7)-positivecdT-cells. The candidate causative genes include the MYC oncogene (q in HSTL), known to be repressed by NFAT [62] and the IKZF1 tumorsuppressor gene (Q in HSTL) which is activated by NFAT [66]. (C) Hierarchical clustering using NFAT-related genes, including components of theNRON complex. Note that all HSTL samples, except for DERL-2, form a distinct cluster apart from the activated cdT-cells.doi:10.1371/journal.pone.0102977.g006
Molecular Pathogenesis of Hepatosplenic T-Cell Lymphoma
PLOS ONE | www.plosone.org 11 July 2014 | Volume 9 | Issue 7 | e102977

cdT-cells did not identify any downregulated gene in the CDR.
Five genes (TSPAN13, HDAC9, CHN2, EPDR1 and TARP),
however, were frequently upregulated. Interestingly, CHN2 was
upregulated in all 10 comparisons (Figure 3A and 3B) with a 15
FC in the comparison vs cdT-cells (Table S6). The CGR
comprises approximately 650 genes. Twenty nine of these genes
were dysregulated, including 13 (44.8%) which were exclusively
upregulated, four (13.8%) which were downregulated and 12
(41.3%) showing a heterogeneous pattern of expression. The 13
upregulated genes included ABCB1, RUNDC3B, KRIT1,SAMD9, SGCE, PEG10, PPP1R9A, ZNF655, PILRB, NA-PEPLD, PUS7, PIK3CG and NRCAM. Except for NRCAM, all
these genes were upregulated in HSTL vs cdT-cells. Notably,
ABCB1, RUNDC3B and PPP1R9A were upregulated in all 10
comparisons.
To unravel gene expression profile and gene signature of
HSTL, we searched for dysregulated genes genomewide and
focused on 401 genes which were up- or downregulated in at least
four comparisons (Table S7). This 401 geneset, as well as genes
found to be dysregulated in individual comparisons, were further
explored using Ingenuity Pathway Analysis (IPA). As shown in
Table 2, the 401 genes dysregulated in HSTL are implicated in
important biological processes, pathways and diseases, including
cancer (262 molecules) and inflammatory diseases (94 molecules).
‘‘Natural Killer Cell signaling’’ surfaced as the top canonical
pathway dysregulated in HSTL. This pathway was also signifi-
cantly dysregulated when HSTL was compared with activated
cdT-cells, NK/TCL, AITCL, PTCL-NOS and spleen. Notably,
the canonical pathway ‘‘Role of NFAT in regulation of the
immune response’’ was the second and third top dysregulated
pathway in HSTL vs activated cdT-cells (Figure S3) and vsnonmalignant spleen, respectively. Details of individual IPAs can
be found in Figure S4.
Considering the important role of Nuclear factor of activated T
cells (NFAT) transcription factors in T-cell biology and cancer
[26–29], we additionally analyzed expression pattern of genes
encoding proteins belonging to the large lincRNA-protein
complex [also known as the Non-coding RNA Repressor Of
NFAT (NRON) complex], recently found to be associated with
NFAT [30,31], and the kinase LRRK2 which is linked to this
complex as a negative regulator of NFATC2 [32,33]. Several of
these genes were found dysregulated in HSTL vs cdT-cells (Table
S7). Particularly interesting was the finding of LRRK2 upregula-
tion in 4 of 10 comparisons performed (FC = 31.25 in HSTL vsnormal T-cells, FC = 22.77 in HSTL vs dcT-cells, FC = 9.22 in
HSTL vs non-malignant thymus, and FC = 9.03, in HSTL vs T-
ALL). In contrast, CAMK4 was significantly downregulated in
HSTL in 7 of the 10 inference analyses performed (Table S7,
Figure S5). Calcium/calmodulin dependent kinase 4 (encoded by
CAMK4) binds Ca2+/calmodulin in the cytoplasm [34]. In the
nucleus, CAMK4 regulates, mainly by phosphorylation, the
activity of several transcriptional activators, including NFATC2
[34,35]. Other interesting gene emerging in our study is ITGAD,
found to be upregulated in HSTL. It encodes the integrin AlphaD,
a member of a family of molecules implicated in immunological
synapse formation, cell-matrix adhesion, integrin-mediated signal-
ing pathway and proliferation of activated T-cells [36].
In addition, we analyzed expression pattern of chromosome 8-
associated genes. Seven genes, ANGPT1, CA1, CA2, SLC25A37,TOX, and MYBL1, were found upregulated in at least four
comparisons. The MYC oncogene was upregulated only in the
comparison of HSTCL vs cdT-cells (FC = 7.01; FDR_BH
= 0.0011).
To build the gene signature for HSTL several unsupervised
hierarchical cluster analyses were performed to find the minimal
number of genes that keep the integrity of the HSTL samples
cluster in all the comparisons (see Materials and Methods). This
yielded a list of 24 genes, including 11 upregulated and 13
downregulated (Table 3). IPA showed that the vast majority of
these genes is involved in ‘Cancer’, ‘Cellular growth and
proliferation’, ‘Cell death and survival’ and ‘Cell-to cell signaling
’ (Table S8). Using this geneset, HSTL was distinct from AITCL,
NK/TCL, PTCL, nonmalignant spleen and T-cells in the MA
data, and from PTCL, T-ALL, nonmalignant spleen and thymus
in the RNAseq data (Figure 4, Figure S6).
Validation studiesExpression value of six genes, CHN2, ITGAD, CAMK4,
PEG10, PPP1R9A and NFATC2, were validated by QRT-PCR
performed on cases 4, 5, 7 and sorted cdT-cells (Figure S5). The
analysis confirmed downregulation of CAMK4 and NFATC2 in
all cases and showed upregulation of the remaining genes in at
least two out of three cases analyzed, when compared with cdT-
cells. Western blotting was applied to demonstrate expression of
the CHN2-encoded b2-chimerin in four index cases (Table 1). As
cdT-cells were not available, nonmalignant spleen was used as
control. In addition, we analyzed Jurkat T-cells (positive control)
[37] and i(7)(q10)-positive T-cell lymphoblastic lymphoma (Fig-
ure 3C). B2-chimerin was detected in all samples analyzed and its
expression level in HSTL was higher than in spleen and $ than in
Jurkat T-cells known to overexpress CHN2. The expression of the
ABCB1 protein was demonstrated by IHC (Figure 5).
Mutation and fusion genes analysisThe obtained RNAseq data were subjected to mutation and
gene fusion analysis. Three genes were found mutated in all 4
HSTL cases analyzed: SEPT7 (7p14.2), MAP4K5 (14q22.1) and
CYTH2 (19q13.33) (Table S9). However, all these mutations were
predicted as benign or tolerated by VEP. Deleterious mutations
were random (e.g. mutation of ATM in case 4). We did not detect
any nonrandom indel except for Del-39UTR (-/TCTC,
chr7:29,550,568-29,550,571) in the CHN2 gene. This deletion,
however, was reported as SNP (rs71800296).
DeFuse revealed only four fusions, which were absent in
nonmalignant spleen and thymus, and occurred in at least two
cases (Table S10). Two of these fusions, LSP1-.AC027612.6 and
LL22NC03-80A10.6-.RP11-236F9.4, involve either a gene with
its pseudogene or two pseudogenes, respectively. The third fusion
involves a sequence near an uncharacterized noncoding RNA
(LOC402483) on chromosome 7q and a sequence (FLJ45340) on
the telomere of chromosome 5q without gene annotation by
UCSC or RefSeq. The fourth fusion, SEMA4D-.RP11-156P1.3,
was found in cases 4, 7 and DERL-2. An alternative fusion analysis
performed with ArrayStudio did not reproduce the above
mentioned fusions but identified four recurrent fusions ($ two
samples). Further analysis using the UCSC Blat tool suggested,
however, that these fusions could be false positive predictions since
at least one of the involved sequences align to the genome multiple
times with 100 percent identity.
Discussion
Isochromosome 7q is a primary chromosomal aberration in
HSTL detected in almost all affected individuals. The contribution
of this aberration to the pathogenesis of disease is still unknown.
Recent identification of r(7), a rare variant aberration in HSTL
[11,13], provides an unique opportunity to narrow down the
Molecular Pathogenesis of Hepatosplenic T-Cell Lymphoma
PLOS ONE | www.plosone.org 12 July 2014 | Volume 9 | Issue 7 | e102977

critical 7p/7q regions and identify the targeted genes. We set up a
collaborative in-depth genomic study of six HSTL cases with
i(7)(q10), including the DERL-2 cell line, and three cases with r(7).
Using high resolution aCGH, we profiled all samples and defined
a CDR (34.88 Mb) at 7p22.1p14.1 (3.48–38.36 Mb) and a CGR
(38.77 Mb) at 7q22.11q31.1 (86.12–124.89 Mb) (Figure 1A).
Interestingly, CGR encompasses a region of 13 Mb (86.25–
99.27 Mb) selectively amplified in all three cases with r(7). In
addition, aCGH mapped the r(7)-associated breakpoints within the
TCRG (7p14.1) and TCRB (7q32) gene clusters, what suggests that
r(7) is a byproduct of illegitimate somatic rearrangements of both
loci. This defect results in an aberrant TCRG-TCRB lesion,
formation of r(7) and a consequent loss of the distal 7p/7q regions
(Figure 1B and Figure 2). Of note, similar inter-TCR rearrange-
ments feature patients with chromosome instability syndromes
[38]. We presume that formation of r(7) in cdT-cells was a primary
event which was latter followed by a gradual gain of 7q sequences
(Figure 2).
The compilation of all gained genomic data led us to
hypothesize that loss of 7p22.1p14.1 is the critical pathogenetic
event contributing to development of HSTL, while gain of
7q22.11q31.1 provides growth advantages and contributes to
chemoresistance of the tumor. Significance of the former
imbalance is supported by the cytogenetic finding of
der(7)t(7;15)(p22;q21) associated with loss of 7p22pter (breakpoint
not validated by FISH/aCGH) but not affecting 7q, in one case of
i(7)(q10)-negative HSTL [14]. Chromosomal deletions, especially
homozygous deletions, are considered as hallmarks of TSG
localization in cancer cells [39]. Therefore, identification of a
biallelic 7p21.3 microdeletion encompassing PHF14, a postulated
TSG, in case 4 seemed to be the groundbreaking finding of the
study. Particularly, that PHF6, other member of the PHF gene
family, plays a role of tumor suppressor in T-ALL [40].
Subsequent investigations, including sequencing and MA/RNA-
seq analysis, however, did not provide any evidence of inactivated
mutation(s) or downregulated expression of PHF14 in other
HSTL cases.
To further attempt identification of genes targeted by i(7)(q10)/
r(7), we performed an integrative genomic and transcriptomic
analysis initially focusing on genes located within the common
deleted (3.48–38.36 Mb) and gained (86.12–110.19 Mb) regions.
Surprisingly, none of the CDR-associated genes was significantly
and recurrently downregulated, however, one gene, CHN2,
appeared to be commonly upregulated in HSTL. CHN2 encodes
b2-chimerin which displays GTPase-activating protein activity
and is involved in small GTPase mediated signal transduction
[41,42]. B2-chimerin is ubiquitously expressed in T-lymphocytes
and engaged in the regulation of chemokine-modulated responses
[41]. Recent studies implicate b2-chimerin in the downmodulation
of RAC1 (ras-related C3 botulinum toxin substrate 1) activity
during T-cell synapse formation and suggest its contribution to
diacylglycerol-mediated regulation of cytoskeletal remodeling
during T-cell activation [37,41,42]. Given the important role of
b2-chimerin in T-cell biology, CHN2 emerged as a candidate 7p
gene targeted by i(7)(q10)/r(7) in HSTL. The molecular mecha-
nism(s) underlying an enhanced expression of the nondeleted
CHN2 locus in HSTL is unclear, but either loss of 7p-associated
negative regulators or gain/activation of 7q-associated positive
regulators or deregulation of epigenetic effectors may contribute to
this process. Interestingly, regulation data from the Encyclopedia
of DNA Elements (ENCODE) (https://genome.ucsc.edu/
ENCODE/) revealed several transcription factors regulating
expression of CHN2, including EZH2, which targets the promotor
region of CHN2 (http://genome-euro.ucsc.edu/cgi-bin/
hgTracks?hgS_doOtherUser = submit&hgS_otherUserName =
JulioFinalet&hgS_otherUserSessionName = regulation%20at%20
CHN2%20promotor_simple). EZH2, a catalytic subunit of the
Polycomb Repressor Complex 2 [43], is involved in epigenetic
transcriptional repression of genes through histone methylation
and consequent chromatin condensation. As expression of EZH2is significantly downregulated in HSTL vs dcT-cells (FC = -3.012;
FDR_BH = 0.0284), it may affect expression of CHN2. The
EZH2 gene (7q36.1) is not mutated in HSTL, but monoallelically
deleted in all r(7)-positive cases.
Integrative analysis of chromosome 7q identified a set of 13
constantly upregulated genes, including ABCB1, RUNDC3B and
PPPAR9A, found to be selectively amplified in cases with r(7).
The top candidate is ABCB1 (alias MDR1), already known to be
overexpressed in HSTL [5,44]. ABCB1 codes a multidrug
transporter P-glycoprotein which belongs to the superfamily of
ATP-binding cassette (ABC) transporters [45]. These molecules,
which function in normal biology to protect cells from harmful
toxins and xenobiotics, contribute to drug resistance of cancers by
extruding a variety of chemotherapeutic agents from the tumor
cells [46]. Amplification, rearrangement and/or overexpression of
ABCB1 have been associated with chemotherapy failure in many
cancers [47–51]. RUNDC3B is likely involved in multiple Ras-like
GTPase signaling pathways [52,53] and is implicated in transfor-
mation and progression of breast cancer [54]. PPP1R9A encodes
neurabin 1 which constitutes a regulatory subunit of protein
phosphatase I [55]. Neurabin 1 is a multi-functional F-actin-
binding protein, and like other phosphatases, is potentially
implicated in tumorigenesis [56]. Although upregulation of
PEG10 was not constantly observed in HSTCL, it is worth note
that this transcription factor is implicated in tumorigenesis [57–
59]. PEG10 is a postulated target of 7q21 amplification in
hepatocellular carcinoma [59] and its overexpression in cancer
correlates with disease progression, invasiveness and aggressiveness
[57,60]. Altogether, these data support our hypothesis that the
i(7)(q10)/r(7)-related duplication or amplification of 7q mainly
activates genes which provide growth advantage of lymphoma
cells and are responsible for an intrinsic drug resistance and
aggressiveness of HSTL.
Gene expression profile of HSTL has been previously investi-
gated by Miyazaki et al. (2009) [44] and Travert et al. [5]. The first
group showed that the TCR-associated gene signature accurately
classifies cdHSTL and distinguishes it from PTCL. The latter
group demonstrated that HSTL is characterized by a distinct
molecular signature, irrespective of the TCR-cell lineage. GEP
revealed overexpression of multiple NK-cell-associated molecules
and several cancer genes, including FOS, VAV3, S1PR5 and
SYK. Among the most downregulated genes was a tumor
suppressor gene AIM1, found to be methylated in HSTL. Results
of our transcriptomic analysis performed on altogether 17 HSTL
cases (four index cases and 13 previously published cases [5,61])
are in line with the previous findings. Except for a few transcripts,
we found the same differential expression of the vast majority of
genes described by Travert et al. [5]. In addition, we significantly
diminished a number of biomarkers discriminating HSTL from
other malignancies to 24. Remarkably, the geneset comprises three
chromosome 7 genes located either in CDR or CGR: CHN2,
ABCB1 and PPP1R9A.
Interestingly, IPA showed that the canonical pathway ‘‘Role of
NFAT in regulation of the immune response’’ is one of the top
dysregulated pathways in HSTL. NFAT is a family of transcrip-
tion factors playing a crucial role in the development and function
the immune system [29]. There are five NFAT family members
and three of them, NFATC1, -C2 and -C3 are expressed by
Molecular Pathogenesis of Hepatosplenic T-Cell Lymphoma
PLOS ONE | www.plosone.org 13 July 2014 | Volume 9 | Issue 7 | e102977
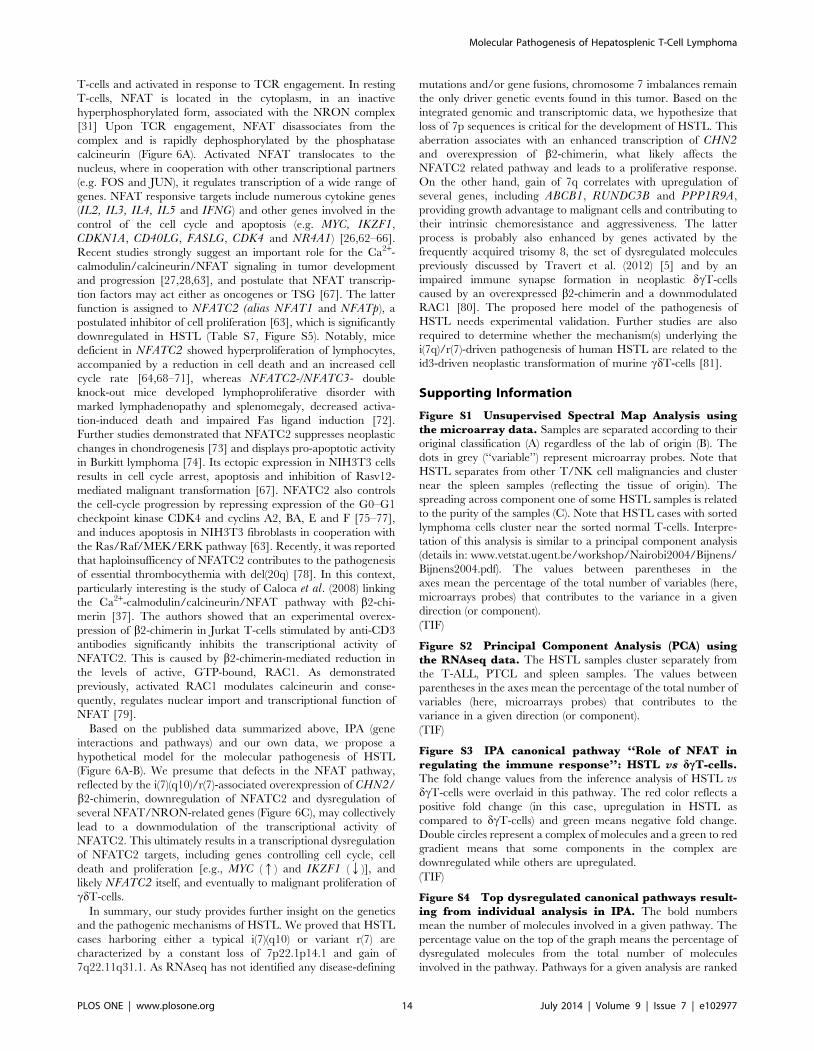
T-cells and activated in response to TCR engagement. In resting
T-cells, NFAT is located in the cytoplasm, in an inactive
hyperphosphorylated form, associated with the NRON complex
[31] Upon TCR engagement, NFAT disassociates from the
complex and is rapidly dephosphorylated by the phosphatase
calcineurin (Figure 6A). Activated NFAT translocates to the
nucleus, where in cooperation with other transcriptional partners
(e.g. FOS and JUN), it regulates transcription of a wide range of
genes. NFAT responsive targets include numerous cytokine genes
(IL2, IL3, IL4, IL5 and IFNG) and other genes involved in the
control of the cell cycle and apoptosis (e.g. MYC, IKZF1,
CDKN1A, CD40LG, FASLG, CDK4 and NR4A1) [26,62–66].
Recent studies strongly suggest an important role for the Ca2+-
calmodulin/calcineurin/NFAT signaling in tumor development
and progression [27,28,63], and postulate that NFAT transcrip-
tion factors may act either as oncogenes or TSG [67]. The latter
function is assigned to NFATC2 (alias NFAT1 and NFATp), a
postulated inhibitor of cell proliferation [63], which is significantly
downregulated in HSTL (Table S7, Figure S5). Notably, mice
deficient in NFATC2 showed hyperproliferation of lymphocytes,
accompanied by a reduction in cell death and an increased cell
cycle rate [64,68–71], whereas NFATC2-/NFATC3- double
knock-out mice developed lymphoproliferative disorder with
marked lymphadenopathy and splenomegaly, decreased activa-
tion-induced death and impaired Fas ligand induction [72].
Further studies demonstrated that NFATC2 suppresses neoplastic
changes in chondrogenesis [73] and displays pro-apoptotic activity
in Burkitt lymphoma [74]. Its ectopic expression in NIH3T3 cells
results in cell cycle arrest, apoptosis and inhibition of Rasv12-
mediated malignant transformation [67]. NFATC2 also controls
the cell-cycle progression by repressing expression of the G0–G1
checkpoint kinase CDK4 and cyclins A2, BA, E and F [75–77],
and induces apoptosis in NIH3T3 fibroblasts in cooperation with
the Ras/Raf/MEK/ERK pathway [63]. Recently, it was reported
that haploinsufficency of NFATC2 contributes to the pathogenesis
of essential thrombocythemia with del(20q) [78]. In this context,
particularly interesting is the study of Caloca et al. (2008) linking
the Ca2+-calmodulin/calcineurin/NFAT pathway with b2-chi-
merin [37]. The authors showed that an experimental overex-
pression of b2-chimerin in Jurkat T-cells stimulated by anti-CD3
antibodies significantly inhibits the transcriptional activity of
NFATC2. This is caused by b2-chimerin-mediated reduction in
the levels of active, GTP-bound, RAC1. As demonstrated
previously, activated RAC1 modulates calcineurin and conse-
quently, regulates nuclear import and transcriptional function of
NFAT [79].
Based on the published data summarized above, IPA (gene
interactions and pathways) and our own data, we propose a
hypothetical model for the molecular pathogenesis of HSTL
(Figure 6A-B). We presume that defects in the NFAT pathway,
reflected by the i(7)(q10)/r(7)-associated overexpression of CHN2/
b2-chimerin, downregulation of NFATC2 and dysregulation of
several NFAT/NRON-related genes (Figure 6C), may collectively
lead to a downmodulation of the transcriptional activity of
NFATC2. This ultimately results in a transcriptional dysregulation
of NFATC2 targets, including genes controlling cell cycle, cell
death and proliferation [e.g., MYC (q) and IKZF1 (Q)], and
likely NFATC2 itself, and eventually to malignant proliferation of
cdT-cells.
In summary, our study provides further insight on the genetics
and the pathogenic mechanisms of HSTL. We proved that HSTL
cases harboring either a typical i(7)(q10) or variant r(7) are
characterized by a constant loss of 7p22.1p14.1 and gain of
7q22.11q31.1. As RNAseq has not identified any disease-defining
mutations and/or gene fusions, chromosome 7 imbalances remain
the only driver genetic events found in this tumor. Based on the
integrated genomic and transcriptomic data, we hypothesize that
loss of 7p sequences is critical for the development of HSTL. This
aberration associates with an enhanced transcription of CHN2and overexpression of b2-chimerin, what likely affects the
NFATC2 related pathway and leads to a proliferative response.
On the other hand, gain of 7q correlates with upregulation of
several genes, including ABCB1, RUNDC3B and PPP1R9A,
providing growth advantage to malignant cells and contributing to
their intrinsic chemoresistance and aggressiveness. The latter
process is probably also enhanced by genes activated by the
frequently acquired trisomy 8, the set of dysregulated molecules
previously discussed by Travert et al. (2012) [5] and by an
impaired immune synapse formation in neoplastic dcT-cells
caused by an overexpressed b2-chimerin and a downmodulated
RAC1 [80]. The proposed here model of the pathogenesis of
HSTL needs experimental validation. Further studies are also
required to determine whether the mechanism(s) underlying the
i(7q)/r(7)-driven pathogenesis of human HSTL are related to the
id3-driven neoplastic transformation of murine cdT-cells [81].
Supporting Information
Figure S1 Unsupervised Spectral Map Analysis usingthe microarray data. Samples are separated according to their
original classification (A) regardless of the lab of origin (B). The
dots in grey (‘‘variable’’) represent microarray probes. Note that
HSTL separates from other T/NK cell malignancies and cluster
near the spleen samples (reflecting the tissue of origin). The
spreading across component one of some HSTL samples is related
to the purity of the samples (C). Note that HSTL cases with sorted
lymphoma cells cluster near the sorted normal T-cells. Interpre-
tation of this analysis is similar to a principal component analysis
(details in: www.vetstat.ugent.be/workshop/Nairobi2004/Bijnens/
Bijnens2004.pdf). The values between parentheses in the
axes mean the percentage of the total number of variables (here,
microarrays probes) that contributes to the variance in a given
direction (or component).
(TIF)
Figure S2 Principal Component Analysis (PCA) usingthe RNAseq data. The HSTL samples cluster separately from
the T-ALL, PTCL and spleen samples. The values between
parentheses in the axes mean the percentage of the total number of
variables (here, microarrays probes) that contributes to the
variance in a given direction (or component).
(TIF)
Figure S3 IPA canonical pathway ‘‘Role of NFAT inregulating the immune response’’: HSTL vs dcT-cells.The fold change values from the inference analysis of HSTL vsdcT-cells were overlaid in this pathway. The red color reflects a
positive fold change (in this case, upregulation in HSTL as
compared to dcT-cells) and green means negative fold change.
Double circles represent a complex of molecules and a green to red
gradient means that some components in the complex are
downregulated while others are upregulated.
(TIF)
Figure S4 Top dysregulated canonical pathways result-ing from individual analysis in IPA. The bold numbers
mean the number of molecules involved in a given pathway. The
percentage value on the top of the graph means the percentage of
dysregulated molecules from the total number of molecules
involved in the pathway. Pathways for a given analysis are ranked
Molecular Pathogenesis of Hepatosplenic T-Cell Lymphoma
PLOS ONE | www.plosone.org 14 July 2014 | Volume 9 | Issue 7 | e102977
from higher to lower statistical significance. The statistical
significance (p-value) of a given pathway is calculated considering
the percentage of dysregulated molecules in the pathways, as well
as the fold change of dysregulation.
(PDF)
Figure S5 Expression of selected genes analyzed byQRT-PCR. The Y-axis represents the fold change of normalized
mRNA expression compared to dcT-cells.
(TIF)
Figure S6 High resolution images of hierarchical clus-tering using the 24 gene signature for HSTL. The
dendograms were generated using the Pearson correlation to
calculate the distance and a complete link. The associated
heatmap was normalized using a robust center scale.
(PDF)
Table S1 List of FISH probes.(XLSX)
Table S2 List of primers used for sequencing and QRT-PCR.(XLSX)
Table S3 List of cases included in the expressionmicroarray analysis.(XLSX)
Table S4 Segment report from the aCGH data.(XLSX)
Table S5 Aligment report of RNAseq analysis of HSTL,PTCL, spleen and thymus.(XLSX)
Table S6 Dysregulated genes in CDR (7p) and CGR(7q).
(XLSX)
Table S7 Genomewide dysregulated genes in 10 com-parisons (XLSX).
(XLSX)
Table S8 IPA functional annotation of genes included inthe HSTL signature.
(XLSX)
Table S9 Annotated mutations found in the index casesanalyzed by RNAseq.
(XLSX)
Table S10 Results of the gene fusion analysis.
(XLSX)
Acknowledgments
The authors would like to thank Stein Aerts, Rekin’s Janky and Luc
Dehaspe for a bioinformatic support, Ursula Pluys and Emilie Bittoun for
their excellent technical assistance, Dominik Selleslag, Vincent Maertens
and Clement Huysentruyt for providing clinical data, Philippe Gaulard for
providing the DERL-2 cell line, and Rita Logist for her editorial assistance.
Author Contributions
Conceived and designed the experiments: JFF JC IW. Performed the
experiments: JFF LR HU J-AvdK T. Tousseyn. Analyzed the data: JFF LR
LM T. Tousseyn JC IW. Contributed reagents/materials/analysis tools: SS
LK T. Tousseyn PDP AU GV PV T. Tabhon. Contributed to the writing
of the manuscript: JFF PV IW.
References
1. Tripodo C, Iannitto E, Florena AM, Pucillo CE, Piccaluga PP, et al. (2009)
Gamma-delta T-cell lymphomas. Nat Rev Clin Oncol 6: 707–717.
2. Swerdlow SH, Campo E, Harris NL, Jaffe ES, Pileri SA, et al. (2008) WHO
Classification of Tumours of Haematopoietic and Lymphoid Tissues. Lyon,
France: IARC.
3. Macon WR, Levy NB, Kurtin PJ, Salhany KE, Elkhalifa MY, et al. (2001)
Hepatosplenic alphabeta T-cell lymphomas: a report of 14 cases and comparison
with hepatosplenic gammadelta T-cell lymphomas. Am J Surg Pathol 25: 285–
296.
4. Suarez F, Wlodarska I, Rigal-Huguet F, Mempel M, Martin-Garcia N, et al.
(2000) Hepatosplenic alphabeta T-cell lymphoma: an unusual case with clinical,
histologic, and cytogenetic features of gammadelta hepatosplenic T-cell
lymphoma. Am J Surg Pathol 24: 1027–1032.
5. Travert M, Huang Y, de Leval L, Martin-Garcia N, Delfau-Larue MH, et al.
(2012) Molecular features of hepatosplenic T-cell lymphoma unravels potential
novel therapeutic targets. Blood 119: 5795–5806.
6. Gaulard P, Jaffe E, Krenacs L, Macon WR (2008) Hepatosplenic T-cell
lymphoma. In: Swerdlow SH, Campo E, Harris NL, Jaffe ES, Pileri SA, et al.,
editors. WHO Classification of Tumours of Haematopoietic and Lymphoid
Tissues. Lyon, France: IARC. pp. 292–293.
7. Wang CC, Tien HF, Lin MT, Su IJ, Wang CH, et al. (1995) Consistent presence
of isochromosome 7q in hepatosplenic T gamma/delta lymphoma: a new
cytogenetic-clinicopathologic entity. Genes Chromosomes Cancer 12: 161–164.
8. Alonsozana EL, Stamberg J, Kumar D, Jaffe ES, Medeiros LJ, et al.(1997)
Isochromosome 7q: the primary cytogenetic abnormality in hepatosplenic
gammadelta T cell lymphoma. Leukemia 11: 1367–1372.
9. Jonveaux P, Daniel MT, Martel V, Maarek O, Berger R (1996) Isochromosome
7q and trisomy 8 are consistent primary, non-random chromosomal abnormal-
ities associated with hepatosplenic T gamma/delta lymphoma. Leukemia 10:
1453–1455.
10. Wlodarska I, Martin-Garcia N, Achten R, De Wolf-Peeters C, Pauwels P, et al.
(2002) Fluorescence in situ hybridization study of chromosome 7 aberrations in
hepatosplenic T-cell lymphoma: isochromosome 7q as a common abnormality
accumulating in forms with features of cytologic progression. Genes Chromo-
somes Cancer 33: 243–251.
11. Shetty S, Mansoor A, Roland B (2006) Ring chromosome 7 with amplification of
7q sequences in a pediatric case of hepatosplenic T-cell lymphoma. Cancer
Genet Cytogenet 167: 161–163.
12. Patkar N, Nair S, Alex AA, Parihar M, Manipadam MT, et al. (2012)
Clinicopathological features of hepatosplenic T cell lymphoma: a single centre
experience from India. Leuk Lymphoma 53: 609–615.
13. Tamaska J, Adam E, Kozma A, Gopcsa L, Andrikovics H, et al. (2006)
Hepatosplenic gammadelta T-cell lymphoma with ring chromosome 7, an
isochromosome 7q equivalent clonal chromosomal aberration. Virchows Arch
449: 479–483.
14. Mandava S, Sonar R, Ahmad F, Yadav AK, Chheda P, et al. (2011) Cytogenetic
and molecular characterization of a hepatosplenic T-cell lymphoma: report of a
novel chromosomal aberration. Cancer Genet 204: 103–107.
15. Rossbach HC, Chamizo W, Dumont DP, Barbosa JL, Sutcliffe MJ (2002)
Hepatosplenic gamma/delta T-cell lymphoma with isochromosome 7q,
translocation t(7;21), and tetrasomy 8 in a 9-year-old girl. J Pediatr Hematol
Oncol 24: 154–157.
16. Lewi PJ (1976) Spectral mapping, a technique for classifying biological activity
profiles of chemical compounds. Arzneimittelforschung 26: 1295–1300.
17. Hu J, Ge H, Newman M, Liu K (2012) OSA: a fast and accurate alignment tool
for RNA-Seq. Bioinformatics 28: 1933–1934.
18. Anders S, Huber W (2010) Differential expression analysis for sequence count
data. Genome Biol 11: R106. gb-2010-11-10-r106 [pii];10.1186/gb-2010-11-
10-r106 [doi].
19. Kalender AZ, Gianfelici V, Hulselmans G, De KK, Devasia AG, et al. (2013)
Comprehensive analysis of transcriptome variation uncovers known and novel
driver events in T-cell acute lymphoblastic leukemia. PLoS Genet 9: e1003997.
10.1371/journal.pgen.1003997 [doi];PGENETICS-D-13-01641 [pii].
20. McPherson A, Hormozdiari F, Zayed A, Giuliany R, Ha G, et al. (2011) deFuse:
an algorithm for gene fusion discovery in tumor RNA-Seq data. PLoS Comput
Biol 7: e1001138. 10.1371/journal.pcbi.1001138 [doi];10-PLCB-RA-2589R4
[pii].
21. Ge H, Liu K, Juan T, Fang F, Newman M, et al.(2011) FusionMap: detecting
fusion genes from next-generation sequencing data at base-pair resolution.
Bioinformatics 27: 1922–1928.
22. Di Noto R, Pane F, Camera A, Luciano L, Barone M, et al.(2001)
Characterization of two novel cell lines, DERL-2 (CD56+/CD3+/Tcry5+)
and DERL-7 (CD56+/CD3-/TCRgammadelta-), derived from a single patient
with CD56+ non-Hodgkin’s lymphoma. Leukemia 15: 1641–1649.
23. Ivanov I, Lo KC, Hawthorn L, Cowell JK, Ionov Y (2007) Identifying candidate
colon cancer tumor suppressor genes using inhibition of nonsense-mediated
mRNA decay in colon cancer cells. Oncogene 26: 2873–2884.
Molecular Pathogenesis of Hepatosplenic T-Cell Lymphoma
PLOS ONE | www.plosone.org 15 July 2014 | Volume 9 | Issue 7 | e102977

24. Akazawa T, Yasui K, Gen Y, Yamada N, Tomie A, et al. (2013) Aberrant
expression of the gene in biliary tract cancer cells. Oncol Lett 5: 1849–1853.
25. Kitagawa M, Takebe A, Ono Y, Imai T, Nakao K, et al. (2012) Phf14, a novel
regulator of mesenchyme growth via platelet-derived growth factor (PDGF)
receptor-alpha1. J Biol Chem 287: 27983–27996.
26. Viola JP, Carvalho LD, Fonseca BP, Teixeira LK (2005) NFAT transcription
factors: from cell cycle to tumor development. Braz J Med Biol Res 38: 335–
344.
27. Muller MR, Rao A (2010) NFAT, immunity and cancer: a transcription factor
comes of age. Nat Rev Immunol 10: 645–656.
28. Mancini M, Toker A (2009) NFAT proteins: emerging roles in cancer
progression. Nat Rev Cancer 9: 810–820.
29. Macian F (2005) NFAT proteins: key regulators of T-cell development and
function. Nat Rev Immunol 5: 472–484.
30. Willingham AT, Orth AP, Batalov S, Peters EC, Wen BG, et al. (2005) A
strategy for probing the function of noncoding RNAs finds a repressor of NFAT.
Science 309: 1570–1573.
31. Sharma S, Findlay GM, Bandukwala HS, Oberdoerffer S, Baust B, et al. (2011)
Dephosphorylation of the nuclear factor of activated T cells (NFAT)
transcription factor is regulated by an RNA-protein scaffold complex. Proc
Natl Acad Sci U S A 108: 11381–11386.
32. Jabri B, Barreiro LB (2011) Don’t move: LRRK2 arrests NFAT in the
cytoplasm. Nat Immunol 12: 1029–1030.
33. Liu Z, Lee J, Krummey S, Lu W, Cai H, et al. (2011) The kinase LRRK2 is a
regulator of the transcription factor NFAT that modulates the severity of
inflammatory bowel disease. Nat Immunol 12: 1063–1070.
34. Racioppi L, Means AR (2008) Calcium/calmodulin-dependent kinase IV in
immune and inflammatory responses: novel routes for an ancient traveller.
Trends Immunol 29: 600–607.
35. Hanissian SH, Frangakis M, Bland MM, Jawahar S, Chatila TA (1993)
Expression of a Ca2+/calmodulin-dependent protein kinase, CaM kinase-Gr, in
human T lymphocytes. Regulation of kinase activity by T cell receptor signaling.
J Biol Chem 268: 20055–20063.
36. Sims TN, Dustin ML (2002) The immunological synapse: integrins take the
stage. Immunol Rev 186: 100–117.
37. Caloca MJ, Delgado P, Alarcon B, Bustelo XR (2008) Role of chimaerins, a
group of Rac-specific GTPase activating proteins, in T-cell receptor signaling.
Cell Signal 20: 758–770.
38. Taylor AM (2001) Chromosome instability syndromes. Best Pract Res Clin
Haematol 14: 631–644.
39. Mestre-Escorihuela C, Rubio-Moscardo F, Richter JA, Siebert R, Climent J,
et al. (2007) Homozygous deletions localize novel tumor suppressor genes in B-
cell lymphomas. Blood 109: 271–280.
40. Van Vlierberghe P, Palomero T, Khiabanian H, Van der Meulen J, Castillo M,
et al. (2010) PHF6 mutations in T-cell acute lymphoblastic leukemia. Nat Genet
42: 338–342.
41. Siliceo M, Garcia-Bernal D, Carrasco S, Diaz-Flores E, Coluccio LF, et al.
(2006) Beta2-chimaerin provides a diacylglycerol-dependent mechanism for
regulation of adhesion and chemotaxis of T cells. J Cell Sci 119: 141–152.
42. Siliceo M, Merida I (2009) T cell receptor-dependent tyrosine phosphorylation
of beta2-chimaerin modulates its Rac-GAP function in T cells. J Biol Chem 284:
11354–11363.
43. Deb G, Singh AK, Gupta S (2014) EZH2: Not EZHY (Easy) to Deal. Mol
Cancer Res e-pub ahead of print. 1541–7786.MCR-13–0546 [pii];10.1158/
1541-7786.MCR-13-0546 [doi].
44. Miyazaki K, Yamaguchi M, Imai H, Kobayashi T, Tamaru S, et al.(2009) Gene
expression profiling of peripheral T-cell lymphoma including gammadelta T-cell
lymphoma. Blood 113: 1071–1074.
45. Gottesman MM, Pastan I, Ambudkar SV (1996) P-glycoprotein and multidrug
resistance. Curr Opin Genet Dev 6: 610–617.
46. Szakacs G, Paterson JK, Ludwig JA, Booth-Genthe C, Gottesman MM (2006)
Targeting multidrug resistance in cancer. Nat Rev Drug Discov 5: 219-234.
47. Holohan C, Van SS, Longley DB, Johnston PG (2013) Cancer drug resistance:
an evolving paradigm. Nat Rev Cancer 13: 714–726.
48. Huff LM, Lee JS, Robey RW, Fojo T (2006) Characterization of gene
rearrangements leading to activation of MDR-1. J Biol Chem 281: 36501–
36509.
49. Knutsen T, Mickley LA, Ried T, Green ED, du MS, et al. (1998) Cytogenetic
and molecular characterization of random chromosomal rearrangements
activating the drug resistance gene, MDR1/P-glycoprotein, in drug-selected
cell lines and patients with drug refractory ALL. Genes Chromosomes Cancer
23: 44–54.
50. Wang YC, Juric D, Francisco B, Yu RX, Duran GE, et al. (2006) Regional
activation of chromosomal arm 7q with and without gene amplification in
taxane-selected human ovarian cancer cell lines. Genes Chromosomes Cancer
45: 365–374.
51. Wang J, Tai LS, Tzang CH, Fong WF, Guan XY, et al. (2008) 1p31, 7q21 and
18q21 chromosomal aberrations and candidate genes in acquired vinblastine
resistance of human cervical carcinoma KB cells. Oncol Rep 19: 1155–1164.
52. Balaguer TM, Gomez-Martinez A, Garcia-Morales P, Lacueva J, Calpena R,
et al. (2012) Dual regulation of P-glycoprotein expression by trichostatin A in
cancer cell lines. BMC Mol Biol 13: 25. 1471-2199-13-25 [pii];10.1186/1471-
2199-13-25 [doi].
53. Wang S, Zhang Z, Ying K, Chen JZ, Meng XF, et al. (2003) Cloning,
expression, and genomic structure of a novel human Rap2 interacting gene
(RPIP9). Biochem Genet 41: 13–25.
54. Raguz S, De Bella MT, Slade MJ, Higgins CF, Coombes RC, et al. (2005)
Expression of RPIP9 (Rap2 interacting protein 9) is activated in breast
carcinoma and correlates with a poor prognosis. Int J Cancer 117: 934–941.
55. Nakabayashi K, Makino S, Minagawa S, Smith AC, Bamforth JS, et al. (2004)
Genomic imprinting of PPP1R9A encoding neurabin I in skeletal muscle and
extra-embryonic tissues. J Med Genet 41: 601–608.
56. McCluskey A, Ackland SP, Gardiner E, Walkom CC, Sakoff JA (2001) The
inhibition of protein phosphatases 1 and 2A: a new target for rational anti-
cancer drug design? Anticancer Drug Des 16: 291–303.
57. Ip WK, Lai PB, Wong NL, Sy SM, Beheshti B, et al. (2007) Identification of
PEG10 as a progression related biomarker for hepatocellular carcinoma. Cancer
Lett 250: 284–291.
58. Tsou AP, Chuang YC, Su JY, Yang CW, Liao YL, et al. (2003) Overexpression
of a novel imprinted gene, PEG10, in human hepatocellular carcinoma and in
regenerating mouse livers. J Biomed Sci 10: 625-635.
59. Tsuji K, Yasui K, Gen Y, Endo M, Dohi O, et al. (2010) PEG10 is a probable
target for the amplification at 7q21 detected in hepatocellular carcinoma.
Cancer Genet Cytogenet 198: 118–125.
60. Kainz B, Shehata M, Bilban M, Kienle D, Heintel D, et al. (2007)
Overexpression of the paternally expressed gene 10 (PEG10) from the imprinted
locus on chromosome 7q21 in high-risk B-cell chronic lymphocytic leukemia.
Int J Cancer 121: 1984–1993.
61. Iqbal J, Weisenburger DD, Chowdhury A, Tsai MY, Srivastava G, et al.(2011)
Natural killer cell lymphoma shares strikingly similar molecular features with a
group of non-hepatosplenic gammadelta T-cell lymphoma and is highly sensitive
to a novel aurora kinase A inhibitor in vitro. Leukemia 25: 348–358.
62. Zheng J, Fang F, Zeng X, Medler TR, Fiorillo AA, et al. (2011) Negative cross
talk between NFAT1 and Stat5 signaling in breast cancer. Mol Endocrinol 25:
2054–2064.
63. Robbs BK, Lucena PI, Viola JP (2013) The transcription factor NFAT1 induces
apoptosis through cooperation with Ras/Raf/MEK/ERK pathway and
upregulation of TNF-alpha expression. Biochim Biophys Acta 1833: 2016–2028.
64. Daniel C, Gerlach K, Vath M, Neurath MF, Weigmann B (2013) Nuclear factor
of activated T cells-A transcription factor family as critical regulator in lung and
colon cancer. Int J Cancer. 10.1002/ijc.28329 [doi].
65. Mognol GP, de Araujo-Souza PS, Robbs BK, Teixeira LK, Viola JP (2012)
Transcriptional regulation of the c-Myc promoter by NFAT1 involves negative
and positive NFAT-responsive elements. Cell Cycle 11: 1014–1028.
66. Macian F, Garcia-Cozar F, Im SH, Horton HF, Byrne MC, et al. (2002)
Transcriptional mechanisms underlying lymphocyte tolerance. Cell 109: 719–
731.
67. Robbs BK, Cruz AL, Werneck MB, Mognol GP, Viola JP (2008) Dual roles for
NFAT transcription factor genes as oncogenes and tumor suppressors. Mol Cell
Biol 28: 7168–7181.
68. Hodge MR, Ranger AM, Charles dlB, Hoey T, Grusby MJ, Glimcher LH
(1996) Hyperproliferation and dysregulation of IL-4 expression in NF-ATp-
deficient mice. Immunity 4: 397–405.
69. Caetano MS, Vieira-de-Abreu A, Teixeira LK, Werneck MB, Barcinski MA, et
al. (2002) NFATC2 transcription factor regulates cell cycle progression during
lymphocyte activation: evidence of its involvement in the control of cyclin gene
expression. FASEB J 16: 1940–1942.
70. Schuh K, Kneitz B, Heyer J, Bommhardt U, Jankevics E, et al.(1998) Retarded
thymic involution and massive germinal center formation in NF-ATp-deficient
mice. Eur J Immunol 28: 2456–2466.
71. Xanthoudakis S, Viola JP, Shaw KT, Luo C, Wallace JD, et al.(1996) An
enhanced immune response in mice lacking the transcription factor NFAT1.
Science 272: 892–895.
72. Ranger AM, Oukka M, Rengarajan J, Glimcher LH (1998) Inhibitory function
of two NFAT family members in lymphoid homeostasis and Th2 development.
Immunity 9: 627–635.
73. Ranger AM, Gerstenfeld LC, Wang J, Kon T, Bae H, et al.(2000) The nuclear
factor of activated T cells (NFAT) transcription factor NFATp (NFATc2) is a
repressor of chondrogenesis. J Exp Med 191: 9–22.
74. Kondo E, Harashima A, Takabatake T, Takahashi H, Matsuo Y, et al. (2003)
NF-ATc2 induces apoptosis in Burkitt’s lymphoma cells through signaling via
the B cell antigen receptor. Eur J Immunol 33: 1–11.
75. Baksh S, Widlund HR, Frazer-Abel AA, Du J, Fosmire S, et al. (2002) NFATc2-
mediated repression of cyclin-dependent kinase 4 expression. Mol Cell 10: 1071–
1081.
76. Carvalho LD, Teixeira LK, Carrossini N, Caldeira AT, Ansel KM, et al. (2007)
The NFAT1 transcription factor is a repressor of cyclin A2 gene expression. Cell
Cycle 6: 1789–1795.
77. Caetano MS, Vieira-de-Abreu A, Teixeira LK, Werneck MB, Barcinski MA,
et al. (2002) NFATC2 transcription factor regulates cell cycle progression during
lymphocyte activation: evidence of its involvement in the control of cyclin gene
expression. FASEB J 16: 1940–1942.
78. Vieira L, Vaz A, Matos P, Ambrosio AP, Nogueira M, et al. (2012) Three-way
translocation (X;20;16)(p11;q13;q23) in essential thrombocythemia implicates
NFATC2 in dysregulation of CSF2 expression and megakaryocyte proliferation.
Genes Chromosomes Cancer 51: 1093–1108.
Molecular Pathogenesis of Hepatosplenic T-Cell Lymphoma
PLOS ONE | www.plosone.org 16 July 2014 | Volume 9 | Issue 7 | e102977

79. Turner H, Gomez M, McKenzie E, Kirchem A, Lennard A, et al. (1998) Rac-1
regulates nuclear factor of activated T cells (NFAT) C1 nuclear translocation inresponse to Fcepsilon receptor type 1 stimulation of mast cells. J Exp Med 188:
527–537.
80. Ritter AT, Angus KL, Griffiths GM (2013) The role of the cytoskeleton at theimmunological synapse. Immunol Rev 256: 107–117.
81. Li J, Maruyama T, Zhang P, Konkel JE, Hoffman V, et al.(2010) Mutation ofinhibitory helix-loop-helix protein Id3 causes gammadelta T-cell lymphoma in
mice. Blood 116: 5615–5621.
82. Jacquemet G, Morgan MR, Byron A, Humphries JD, Choi CK, et al. (2013)
Rac1 is deactivated at integrin activation sites through an IQGAP1-filamin-A-
RacGAP1 pathway. J Cell Sci 126: 4121–4135.
83. Fukata M, Kuroda S, Nakagawa M, Kawajiri A, Itoh N, et al. (1999) Cdc42 and
Rac1 regulate the interaction of IQGAP1 with beta-catenin. J Biol Chem 274:
26044–26050.
84. Shaffer LG, MwGowan-Jordan J, Schmid M (2013) ISCN An International
System for Human Cytogenetic Nomenclature (2013). Basel: S. Karger.
Molecular Pathogenesis of Hepatosplenic T-Cell Lymphoma
PLOS ONE | www.plosone.org 17 July 2014 | Volume 9 | Issue 7 | e102977
Copyright © 2022 FDOKUMEN