Day and night heat stress trigger different transcriptomic ...
Upload
independentCategory
view
2download
0
Article Submission: Discoveries section
A transcriptomic approach to ribbon worm systematics (Nemertea):
resolving the Pilidiophora problem
Sónia C. S. Andrade1,‡, Horácio Montenegro2, Malin Strand3, Megan Schwartz4, Hiroshi
Kajihara5, Jon L. Norenburg6, James M. Turbeville7, Per Sundberg8 and Gonzalo Giribet1
1Museum of Comparative Zoology, Department of Organismic and Evolutionary Biology,
Harvard University, Cambridge, Massachusetts, USA
2Departamento de Entomologia, ESALQ-USP, Piracicaba, São Paulo, Brazil
3Swedish Species Information Centre, Swedish University of Agricultural Sciences,
Uppsala, Sweden
4Division of Science and Mathematicians, University of Washington, Tacoma,
Washington, USA
5Faculty of Science, Hokkaido University, Sapporo, Japan
6Department of Invertebrate Zoology, Smithsonian National Museum of Natural History,
Washington, DC, USA
7Department of Biology, Virginia Commonwealth University, Richmond, Virginia
8University of Gothenburg, Department of Biological and Environmental Sciences,
Gothenburg, Sweden
‡Present address: Departamento de Zootecnia, ESALQ-USP, Piracicaba, São Paulo,
Brazil.
1
© The Author 2014. Published by Oxford University Press on behalf of the Society for Molecular Biology andEvolution. All rights reserved. For permissions, please e-mail: [email protected]
MBE Advance Access published August 27, 2014 at H
arvard Library on A
ugust 28, 2014http://m
be.oxfordjournals.org/D
ownloaded from

Corresponding author: Sónia C. S. Andrade
e-mail: [email protected]
2
at Harvard L
ibrary on August 28, 2014
http://mbe.oxfordjournals.org/
Dow
nloaded from

Abstract
Resolving the deep relationships of ancient animal lineages has proven difficult using
standard Sanger-sequencing approaches with a handful of markers. We thus re-assess the
relatively well-studied phylogeny of the phylum Nemertea (ribbon worms)—for which
the targeted gene approaches had resolved many clades but had left key phylogenetic
gaps—by using a phylogenomic approach using Illumina-based de novo assembled
transcriptomes and automatic orthology prediction methods. The analysis of a
concatenated data set of 2,779 genes (411,138 amino acids) with about 78% gene
occupancy and a reduced version with 95% gene occupancy, under evolutionary models
accounting or not for site-specific amino acid replacement patterns results in a
well-supported phylogeny that recovers all major accepted nemertean clades with the
monophyly of Heteronemertea, Hoplonemertea, Monostilifera, being well supported.
Significantly, all the ambiguous patterns inferred from Sanger-based approaches were
resolved, namely the monophyly of Palaeonemertea and Pilidiophora. By testing for
possible conflict in the analyzed supermatrix, we observed that concatenation was the
best solution, and the results of the analyses should settle prior debates on nemertean
phylogeny. The study highlights the importance, feasibility and completeness of
Illumina-based phylogenomic data matrices.
Key words: phylogeny, Palaeonemertea, Neonemertea, Pilidiophora, supermatrix,
concatenation, Illumina
Introduction
From all the animal phyla, nemerteans are unique in presenting the excretory system of
an acoelomate/pseudocoelomate while possessing a true coelom (Turbeville 1986)—the
rhynchocoel—, and a closed circulatory system. This taxon includes about ca. 1280
species (Gibson 1995; Kajihara et al. 2008), which is more than many other well-known
animal phyla, but it is still considered a “minor” phylum by some, despite inhabiting
3
at Harvard L
ibrary on August 28, 2014
http://mbe.oxfordjournals.org/
Dow
nloaded from

marine, freshwater and some terrestrial environments. The phylum includes what it is
considered to be the longest metazoan ever recorded, Lineus longissimus, which can
reach more than 30 m in length (McIntosh 1873-1874), but many species are small, and
some even microscopic. Most nemertean species are carnivorous or scavengers, using
their unique proboscis apparatus for capturing prey.
The classification of nemerteans has been in flux for decades but a consensus has
arisen with the relatively recent use of molecular systematics (e.g., Sundberg et al. 2001;
Thollesson and Norenburg 2003; Sundberg and Strand 2007; Andrade et al. 2012; Kvist
et al. 2014). The traditional classification system of nemerteans for most of the last 100
years followed largely Stiasny-Wijnhoff (1936), which accepted as Classes Schultze’s
(1851) division of nemerteans into Anopla and Enopla. Stiasny-Wijnhoff (1936) divided
Anopla into Palaeonemertea and Heteronemertea, and Enopla in Hoplonemertea and
Bdellonemertea. Hoplonemertea was further subdivided into Monostilifera and
Polystilifera. Recent accounts of the systematics of Nemertea were provided by Andrade
et al. (2012) and Kvist et al. (2014). In those studies, the authors produced a
comprehensive analysis of ribbon worm relationships based on six molecular markers
obtained by Sanger sequencing for a large taxon sample, including all major lineages.
While many relationships were conclusive, and the major groupings (e.g.,
Heteronemertea and Hoplonemertea) were well supported, their relationship to
Palaeonemertea and Hubrechtidae, and the monophyly of Palaeonemertea were not
satisfactorily resolved. Andrade et al. (2012) therefore concluded their study with a plea
for Next Generation Sequence (NGS) data to resolve the deepest nodes in the tree, as
phylogenomic matrices assembled this way have proven informative at resolving basal
metazoan and protostome relationships (e.g., Dunn et al. 2008; Hejnol et al. 2009; Pick et
al. 2010; Kocot et al. 2011; Smith et al. 2011; Struck et al. 2011; von Reumont et al.
2012; Fernández et al. 2014b).
Nemertean transcriptomic data are scarce and based on Sanger data for the species
Cerebratulus lacteus (Heteronemertea) and Carinoma mutabile (Palaeonemertea) (Dunn
et al. 2008). More recently, two additional species have been sequenced using Illumina,
Cephalothrix hongkongiensis (Palaeonemertea) and Cerebratulus marginatus
4
at Harvard L
ibrary on August 28, 2014
http://mbe.oxfordjournals.org/
Dow
nloaded from

(Heteronemertea) (Riesgo et al. 2012a), both included in this study. Here we use an
RNA-seq approach to generate new transcriptomes for 11 nemertean species with
Illumina (including the ones from Riesgo et al. 2012a) and Roche-454 to address four
outstanding questions in nemertean phylogeny. We selected species from all the major
ribbon-worm lineages, spanning their entire diversity, and obtained fresh RNA from live
or RNAlater® preserved specimens. Our aims were to (1) test the monophyly of
Palaeonemertea by including a member of each of the three lineages obtained by Andrade
et al. (2012); (2) test the monophyly of Anopla, which has been falsified by most
phylogenetic analyses; (3) test the position of Heteronemertea, which has remained in
flux in most studies; and (4) address the position of Hubrechtidae, a family of uncertain
affinities, originally classified in Palaeonemertea, but more recently found to be the
possible sister group of Heteronemertea, thus forming a clade named Pilidiophora for the
presence of a pilidium larva which occurs in both taxa (Thollesson and Norenburg 2003).
Materials and Methods
Species Selection
After identifying all the major nemertean lineages, we obtained live specimens for ca. 30
nemertean species and selected 12 of these for sequencing after examination of RNA
quality and cDNA library quality. RNA was extracted from specimens frozen in liquid
nitrogen or from RNAlater®-preserved specimens. Tissues preserved in RNAlater®
were processed as soon as possible, to avoid RNA degradation.
Outgroup selection was based on recent phylogenomic studies (Dunn et al. 2008;
Hejnol et al. 2009; Struck et al. 2014) which placed Nemertea in a clade with
Brachiopoda, Annelida and Mollusca in the larger Trochozoa (Hejnol et al. 2009). Based
on this evidence and data availability, the following eight representatives were selected as
outgroups: four molluscs (Chiton olivaceus, Octopus vulgaris, Gadila tolmiei and
Ennucula tenuis) and four annelids, including a sipunculan (Sipunculus nudus,
Hormogaster samnitica, Helobdella robusta and Capitella teleta).
5
at Harvard L
ibrary on August 28, 2014
http://mbe.oxfordjournals.org/
Dow
nloaded from

Specimen vouchers, leftover tissues, as well as RNA and DNA are deposited in
the Museum of Comparative Zoology, either in the collections of the Department of
Invertebrate Zoology or in the Cryogenic collection. Specimen details are available
online at MCZbase (http://mczbase.mcz.harvard.edu). Accession numbers for the
sequence data specimens are provided on the Supplementary Table.
Molecular Techniques
RNA extraction
Tissues were preserved in at least 10 volumes of RNAlater® soon after the animals were
collected; if sent to the laboratory alive, animals were flash-frozen in liquid nitrogen. All
samples were stored at 80 ºC until RNA was extracted. Tissues were cut into pieces
ranging from from 0.25 to 0.5 cm in thickness, except for tissues of Cephalothrix
hongkongiensis, Protopelagonemertes beebei, and Hubrechtella ijimai, which were not
subsampled due to small size. Total RNA was extracted using Tri-Reagent® (Ambion),
following the manufacturer’s protocol. Subsequent mRNA purification was performed
with the Dynabeads® mRNA Purification Kit for mRNA (Invitrogen). Purification from
Total RNA preps followed the manufacturer’s instructions. Further details of the RNA
extraction and purification protocols can be found in Riesgo et al. (2012a). For
Tubulanus punctatus, total RNA was extracted from tissue fragments of one specimen
following the same procedure above, processed by Roche (454 Life Sciences, a Roche
company, Connecticut, USA), and sequenced on the 454 Genome Sequencer FLX
Titanium.
Quantity and quality control of mRNA
Quantity and quality (purity and integrity) of mRNA were assessed by two different
methods. Quantity of mRNA was measured with the fluorometric quantitation performed
by the QubiT® Fluorometer (Invitrogen, California, USA). Also, capillary
electrophoresis in an RNA Pico 6000 chip was done using an Agilent Bioanalyzer 2100
System with the “mRNA pico Series II” assay (Agilent Technologies, California, USA).
6
at Harvard L
ibrary on August 28, 2014
http://mbe.oxfordjournals.org/
Dow
nloaded from

Integrity of mRNA was estimated by the electropherogram profile and lack of rRNA
contamination (based on rRNA peaks for 18S and 28S rRNA given by the Bioanalyzer
software).
Illumina sequencing
Next-generation sequencing was performed using the Illumina platform Genome
Analyzer GAII (Illumina, Inc., San Diego, California, USA). Each library was run in a
full lane at the FAS Center for Systems Biology at Harvard University. mRNA
concentrations between 20.1 and 53.4 ng/µL were used for cDNA synthesis, which was
performed following methods published elsewhere (Riesgo et al. 2012b). The Illumina
samples were prepared with the NEBNext mRNA Sample Prep kit (New England
BioLabs, Ipswich, MA). cDNA was ligated to Illumina adapters, as described earlier
(Riesgo et al. 2012a). Size-selected cDNA fragments of around 300 bp excised from a 2%
agarose gel were amplified using Illumina PCR primers for Paired-End reads (Illumina,
Inc.) and 18 cycles of the PCR program consisting of 98 ºC-30 s, 98 ºC-10 s, 65 ºC-30 s,
72 ºC-30 s, followed by an extension step of 5 min at 72 ºC. The concentration of the
cDNA libraries was measured with the QubiT® dsDNA High Sensitivity (HS) Assay Kit
using the QubiT® Fluorometer (Invitrogen, Carlsbad, California, USA). The quality of
the library and size selection were checked using the "HS DNA assay" in a DNA chip for
an Agilent Bioanalyzer 2100 (Agilent Technologies, California, USA). All samples
sequenced on Illumina GAII had 150 bp read length. Details on the sequencing method
(if paired or single-end) and number of raw and processed reads are presented in Table 1.
Sequence Processing, Orthology Prediction, and Alignment
All filtered reads generated for this study are deposited in the National Center for
Biotechnology Information Sequence Read Archive (suppl. Table).
Roche 454 data for Tubulanus were assembled with the NewblerGS de novo assembler
(version 2.3, Roche) with the flags ‘-cdna -nrm -nosplit’. In cases in which multiple
7
at Harvard L
ibrary on August 28, 2014
http://mbe.oxfordjournals.org/
Dow
nloaded from

splice variants (isotigs in Newbler terminology) were produced for a gene (an isogroup in
Newbler terminology), a single exemplar splice variant was selected.
Reads were trimmed at the 5’ end when needed and the ones that did not have an average
quality score of at least 32 based on a Phred scale were removed using the python scripts
from Dunn et al. (2008). Illumina data were assembled with Velvet v.1.1.06 (Zerbino and
Birney 2008) and Oases v. 0.2.06 (Schulz et al. 2012). Insert lengths for Oases were
estimated based on the observed graph from the 2100 Agilent Bioanalyzer. We examined
the assemblies over a range of k values (41–71, in increments of 10), which were merged
by Oases on the final step. In order to select a minimum of splice variants (or transcripts
in Oases terminology) for each gene (locus in Oases terminology), Smith et al.’s (2011)
procedure was adopted: only transcripts that contained at least 150 nucleotides, had a
length of at least 85% of the longest transcript for the gene, and had the highest read
coverage were chosen. Loci with more than 50 transcripts were filtered out, as these often
appeared to be the result of misassembly. Capitella teleta and Helobdella robusta
translated assemblies were obtained from a publicly available database (JGI).
Assembled data were compared to NCBI’s nr protein database with the BLASTX
tool, with an e cutoff of 1e-5. The Blastx comparison was performed reducing the search
field to the NCBI Taxon ID 33154 database (Fungi/Metazoa group). Only sequences with
a hit to the database were retained for subsequent analyses; sequences with hits to rRNA
sequences were excluded. Nucleotide sequences were translated with the prot4EST v.
3.1b pipeline (Wasmuth and Blaxter 2004).
Orthology assignment for the data set assemblies was performed with OrthoMCL
v2.0.9 (Li et al. 2003). All-by-all comparisons were conducted with BLASTP following
OrthoMCL guideline and using the 10-20 e-value threshold. The MCL inflation parameter
was varied in increments of 0.2 ranging from 1.4 to 2.6. The final cluster composition
was not particularly sensitive to different inflation values in this range; therefore, an
inflation value of 2.0 was selected, which is within the range of inflation parameters used
in similar studies. Clusters with at least 15 taxa (>75% gene occupancy) were aligned by
using MAFFT L-INS-i v.7.149b (Katoh et al. 2005; Katoh and Toh 2008), followed by
trimming with TrimAl v1.2 to account for alignment uncertainty, with gap threshold of
8
at Harvard L
ibrary on August 28, 2014
http://mbe.oxfordjournals.org/
Dow
nloaded from
80% and conserving a minimum of 20% of the original alignment (Capella-Gutiérrez et
al. 2009). After trimming, we obtained, for each partition, one ML phylogenetic tree with
with RAxML v.7.7.5 (Stamatakis 2006; Stamatakis et al. 2008). In this analysis, we
applied 50 rapid bootstraps and PROTGAMMALG as evolution model.
Monophyly masking was conducted to reduce the number of monophyletic
sequences from the same taxon to one sequence. The resultant 2,779 phylogenies from
the previous step were then analyzed by an iterative paralogy pruning procedure using
PhyloTreePruner (http://sourceforge.net/projects/phylotreepruner/), by which maximally
inclusive subtrees with no more than one sequence per taxon were pruned and retained.
FASTA-formatted files were generated from subtrees that were produced by the paralogy
pruning procedure. These files were then aligned with MAFFTL-INS-i v.7.149b, trimmed
with trimAl, and concatenated into the final matrices.
Phylogenetic Analyses
We conducted the phylogenetic analyses with two matrices: (1) a large matrix with 2,779
orthogroups (“genes”) including 411,138 aligned amino acid positions and with a 78%
gene occupancy; and (2) a reduced matrix with 464 genes, 82,012 amino acid positions
and 95% gene occupancy. Both matrices (summarized in Fig. 1) were analyzed using the
same methods.
A maximum likelihood analysis was conducted using RAxML v.7.7.5
(Stamatakis 2006; Stamatakis et al. 2008). The best-fit model of amino acid evolution per
partition was estimated by ProtTest 3.4 (Darriba et al. 2011), using the corrected Akaike
Information Criterion. The most frequent model of evolution, LG (2,255 out of 2,779
partitions in the large matrix and 401 out of 464 in the reduced matrix) was used as base
model as long with the “partition.txt” input for the maximum likelihood analysis. Due to
the outperformance of the flexible LG4X model, which can provide gains of up to
hundreds of log-likelihood units and seems better adjusted for the complexity of amino
acid replacements and more efficient than models which use single replacement matrices
(Le et al. 2012), we ran two preliminary tests with the large matrix, using LG and LG4X
9
at Harvard L
ibrary on August 28, 2014
http://mbe.oxfordjournals.org/
Dow
nloaded from

as main models. Best-scoring ML trees were inferred for each gene under the selected
model (with the gamma model of rate variation, but no invariant term) from 100
replicates of parsimony starting trees. One hundred-sixty traditional (non-rapid) bootstrap
replicates for the large matrix, and 200 for the reduced matrix were also inferred. To draw
the bipartition information on the best tree given by RAxML, we used its function “-f b”
along with "-t" based on multiple trees (provided by the bootstrap output file).
Bayesian inference was conducted with ExaBayes version 1.3 (The Exelixis Lab,
http://sco.h-its.org/exelixis/web/software/exabayes/). ExaBayes is a Bayesian
phylogenetic tool that implements Markov chain Monte Carlo (MCMC) sampling
approach similar to the one implemented in MrBayes (Ronquist et al. 2012). It is however
better adapted for large datasets by its ability to parallelize each independent run, each
chain and the data (i.e., unique site patterns of the alignment). We used the revMat model
prior, which integrates over amino acid GTR matrices (189 free parameters). Two and
five independent MCMC chains, for 1,000,000 generations each, were run for the
reduced and large matrices, respectively. The first 100,000 trees (10%) were discarded as
burn-in for each MCMC run prior to convergence (i.e., when maximum discrepancies
across chains < 0.1).
Gene Tree Analyses
To investigate potential incongruence between individual gene trees, we followed three
different approaches for both matrices. First, Salichos and Rokas (2013) stressed the need
of choosing genes with strong phylogenetic signals for accurately reconstructing ancient
divergences. These can be derived from the bootstrap support from the inferred trees, a
measurement called “internode certainty”, which estimates the level of conflict among
internodes. To calculate the “internode certainty” the function -L from RAxML was
implemented and the “tree certainty” (TC) was calculated. TC is the sum of all IC scores
for all trees, which is computed by taking all conflicting bipartitions that have ≥ 5%
support into account, where a TC =1 means no conflict among internodes. Second, we
employed SuperQ v.1.1 (Grünewald et al. 2013) to visualize predominant intergenic
10
at Harvard L
ibrary on August 28, 2014
http://mbe.oxfordjournals.org/
Dow
nloaded from

conflict. Here the gene trees were decomposed into quartets, and a supernetwork
assigning edge lengths based on the quartet frequencies was inferred from these quartets
selecting the “balanced” edge-weight optimization function, with no filter (see
Fernández, et al. 2014b). Finally, we employed Conclustador v.0.4a (Leigh et al. 2011),
using the default settings as an automated incongruence-detection algorithm using the
bootstrap tree files from ML. In order to visualize the networks from the latter two
approaches results, we used SplitsTree v.4.13.1 (Huson and Bryant 2006).
Results
The number of sequence reads, used reads, contigs, and other values to assess the quality
of the assembled transcriptomes can be found in Table 1. Our smallest Illumina library
used ca. 12 million reads (assembled into 29,292 contigs for Protopelagonemertes
beebei) while our largest one used almost 80 million reads (assembled into 70,286
contigs for Carinoma hamanako). Interestingly, smaller libraries yielded more assembled
contigs (see Table 1), although some with a smaller n50 such as Nipponnemertes sp.,
which had 62 million used reads assembled into 34,065 contigs >199 bp, n50 = 816,
vswhile Cerebratulus marginatus had 28 million used reads assembled into 117,335
contigs >150 bp, n50 = 1103. In fact, the relatively small library of C. marginatus had
some of the longest contigs, the largest number of contigs > 999 bp, and the longest total
number of assembled bp. This indicates that transcriptome quality may not be directly
correlated to the number of raw reads or the number of used reads, but instead with the
library quality and diversity.
We obtained a total of 42,730 clusters from the ortholog clustering analyses, from
which 7,581 had five taxa or more. Although previous studies have compared alternative
matrices (e.g., Hejnol et al. 2009; Smith et al. 2011), this was done to compare results
between large numbers of genes (which came with low matrix completeness) and more
complete matrices. The most densely populated matrix from Hejnol et al. (2009), with
only 53 genes, was only 50% complete. Likewise, the ‘small’ matrix of Smith et al.
(2011), consisting of 301 genes, has 50% gene occupancy and 27% character occupancy,
11
at Harvard L
ibrary on August 28, 2014
http://mbe.oxfordjournals.org/
Dow
nloaded from

while the ‘big’ matrix consists of 1,185 genes with 40% gene occupancy and 21%
character occupancy. Our original gene occupancy threshold is much higher than any of
these matrices, and we obtained 89 and 80% of character occupancy for the reduced and
large matrices, respectively. Since support is optimal for almost all nodes, we did not find
it necessary to evaluate more than two alternative matrices with more or less occupancy
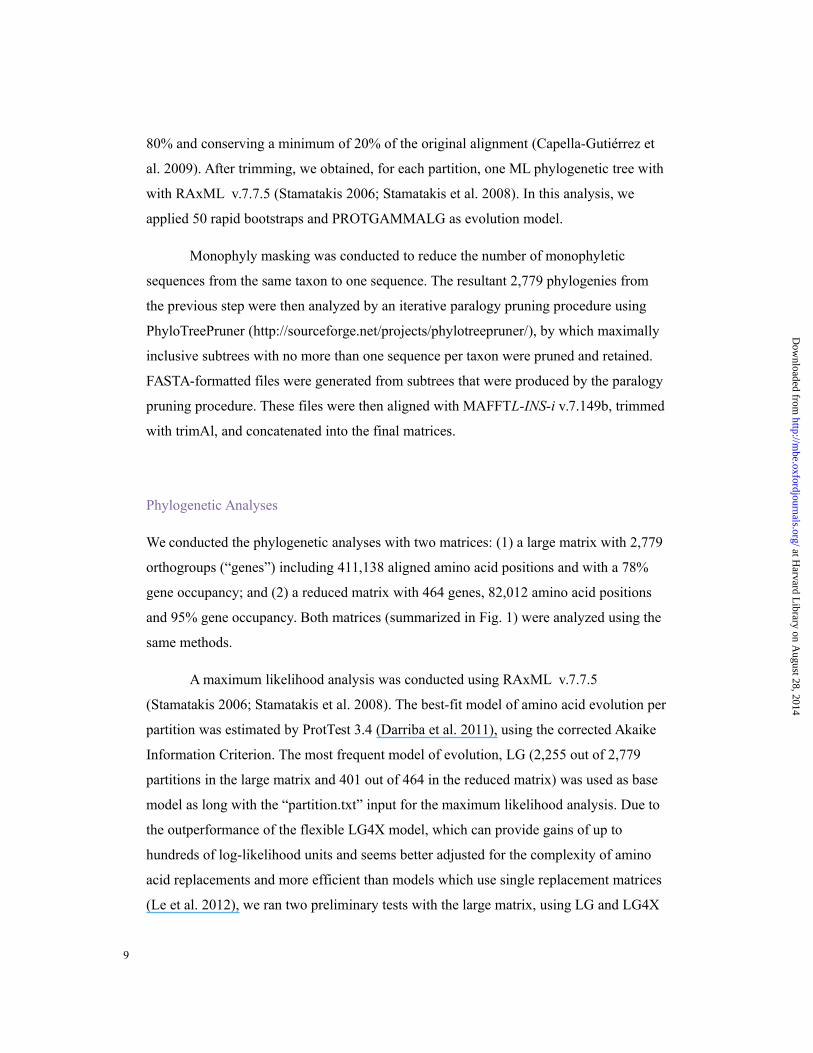
(Fig. 1). The number of ortholog groups represented per taxon ranged from 704 to 2,613
for the large matrix and from 247 to 458 for the reduced matrix (Table 2)
The ML tests using the two alternative models, LG and LG4X, produced an
identical topology on the best-scoring trees. The log likelihood score for them was and
-6,056,455.0098 and -5,973,224.5499, respectively. For the reduced matrix, only the
LG4X model was used, and the best scoring tree had a log likelihood value of
-1,236,158.9849. The phylogenetic analyses of our two data matrices yielded identical
topologies for the maximum likelihood analysis using a partitioned model approach and
for the Bayesian analyses (Fig. 2), the only differences being in the internal resolution of
Palaeonemertea and in one of the outgroup taxa. Each node in the nemertean tree
received 100% bootstrap support or a posterior probability of 1.00, with the exception of
the sister group relationship of Carinoma and Cephalothrix, not supported in the small
data matrix. Monophyly of Nemertea, Palaeonemertea, Neonemertea, Hoplonemertea,
Monostilifera, Pilidiophora, and Heteronemertea are thus found in all analyses with
maximum support. One result evident in our analyses, as well as in previous published
work, is the rejection of the order Bdellonemertea (with its only representative genus
Malacobdella), as it nests deep within the Monostilifera. Monostilifera also shows the
deep split between the clades Cratenemertea (Nipponemertes) and Distronematonemertea
(Argonemertes, Paranemertes and Malacobdella). Within Heteronemertea our data also
support a deep split between Baseodiscus and the other represented genera.
Outgroup relationships are outside the scope of this paper, but our analyses
support the monophyly of all the represented molluscs and annelids (including the
represented sipunculan). Other well-established nodes in molluscan and annelid
phylogeny, including a relationship of the three conchiferan molluscs or the two clitellate
12
at Harvard L
ibrary on August 28, 2014
http://mbe.oxfordjournals.org/
Dow
nloaded from

annelids, are also well supported in our data set, serving as a test for interpreting the
nemertean support values.
The different incongruence inferences presented some different results, probably
due to limitations of “internode certainty” when dealing with missing data (Salichos et al.
2014). The relative tree certainty (Salichos and Rokas 2013) for the large matrix (2,779
partitions) including all conflicting bipartitions (TCA) was 0.996, while for the reduced
matrix (464 partitions), retrieved a value of 0.924, clearly indicating no conflict. The split
network from SuperQ v1.1 identifies some inter-gene conflict with respect to the specific
positions of Hubrechtella ijimai and the hoplonemerteans (Fig. 3) for both matrices.
Conclustador resulted in just one cluster for each matrix, and the small matrix
supernetwork also showed conflict between Cephalothix hongkongiensis and Carinoma
hamanako, as evidenced on the tree presented on Figure 2.
Discussion
Resolving the Tree of Life has been seen as one of the most important 125 unresolved
scientific questions in 2005 by Science Magazine [1 July 2005; vol. 309, p. 96], and the
advent of phylogenomics has aided in resolving many contentious aspects in animal
phylogeny (Delsuc et al. 2005; Dunn et al. 2008; Bleidorn et al. 2009; Hejnol et al. 2009;
Meusemann et al. 2010; Kocot et al. 2011; Rehm et al. 2011; Smith et al. 2011; Struck et
al. 2011; Hartmann et al. 2012; von Reumont et al. 2012; Fernández et al. 2014a, 2014b).
This is not without controversy, and several aspects have been identified that negatively
impact phylogenomic reconstructions, perhaps foremost, gene occupancy (missing data)
(Roure et al. 2013), taxon sampling (Pick et al. 2010), and quality of data (both for
paralogy, orthologue prediction, and exogenous contamination) (Philippe et al. 2011;
Salichos and Rokas 2011). In addition, issues of concatenation (Salichos and Rokas
2013) and model selection (Lartillot and Philippe 2008) have also been identified as
possible pitfalls for phylogeny reconstruction in a phylogenomics framework. Finally, it
has been shown that conflict may exist between classes of genes and some have proposed
the use of slow-evolving genes to resolve deep metazoan splits (Nosenko et al. 2013).
13
at Harvard L
ibrary on August 28, 2014
http://mbe.oxfordjournals.org/
Dow
nloaded from

These issues have been recently analyzed in detail in two studies on arachnid phylogeny
(Fernández et al. 2014a; Sharma et al. 2014), and we follow the same basic strategy
explored there. First, we have minimized the amount of missing data and worked with
one of the most complete phylogenomic matrices for non-model organisms, with gene
completeness between 78 and 95%. Given our levels of missing data and matrix
completeness, it is unlikely that our well-supported results are a consequence of a
problem with gene occupancy or missing data. Likewise, taxon sampling has been
optimized to represent all major nemertean lineages, including a representative of each of
the three main groups of Palaeonemertea, Hubrechtidae, the two main clades of
Heteronemertea, and within Hoplonemertea, both Polystilifera and Monostillifera. No
major hypothesis on nemertean phylogenetics thus remains untested with our sampling,
although it would be desirable to add a second hubrechtid species to further test the
Pilidiophora hypothesis (Thollesson and Norenburg 2003), a clade supported by the
pilidium larva and the striking way the juvenile worm develops inside the larva from a
series of isolated rudiments, called the imaginal discs (Maslakova 2010a; Maslakova
2010b), and other synapomorphies, such as proboscis musculature (Chernyshev et al.
2013) and caudal cirrus and dermal musculature (Chernyshev et al. 2013). Orthology
prediction is another important issue in phylogenomic analysis, and we have followed an
automated methodology (see methods). Given the strong similarity of our results to
Sanger-based phylogenies, we have no reason to suspect that the support obtained for our
relationships is artifactual.
An issue remains untested with our data set, the effects of concatenation and gene
incongruence among data partitions (Jeffroy et al. 2006; Nosenko et al. 2013; Salichos
and Rokas 2013). These authors question the exclusive reliance on concatenation, and
argue that selecting genes with strong phylogenetic signals and demonstrating the
absence of significant incongruence are essential for accurately reconstructing ancient
divergences. This idea contrasts with the basic premises of phylogenetic inference and the
additive nature of signal versus the non-additive signal of noise (Wenzel and Siddall
1999), and it has been suggested that the conclusions reached by Salichos and Rokas
(2013) about the higher levels of incongruence and lower phylogenetic signal reported for
14
at Harvard L
ibrary on August 28, 2014
http://mbe.oxfordjournals.org/
Dow
nloaded from

conserved genes is due to sampling error and not necessarily due to conflict (Betancur-R.
et al. 2014).
Detecting incongruence between large numbers of genes is empirically difficult,
and gene tree approaches (Edwards et al. 2007; Liu et al. 2008; Liu et al. 2009) can
account for the discordance between gene trees and species trees (Degnan and Rosenberg
2006). These methods are now routinely applied to multilocus data sets as an alternative
to concatenation: however, in both empirical and theoretical applications of this
paradigm, data sets analyzed are almost always for closely related species or multiple
individuals per species (Degnan and Rosenberg 2006; Heled and Drummond 2010;
McCormack et al. 2011; Satler et al. 2011). This is not our case, where hundreds or
thousands of species could be placed between any two terminals included in our
phylogeny, and thus the expectation that genes would coalesce prior to the bifurcating
event tends to zero. In addition, our protein-encoding, transcriptomic-based phylogeny is
highly similar to previous hypotheses on nemertean phylogenetics using a much smaller
set of genes (Thollesson and Norenburg 2003; Andrade et al. 2012; Kvist et al. 2014)—
none of which were included in this study—thus supporting the idea that our results are
not artifactual. Our hypothesis is also 100% compatible with a mitogenomics hypothesis,
although with much more limited sampling (Chen et al. 2012), again, stressing the
congruence between such three disparate data sets.
In summary, our analytical approach using the presented tools seems appropriate
for resolving the phylogenetic relationships among nemerteans. We found strong support
for the monophyly of the phylum, as well as for its constituent clades Palaeonemertea,
Neonemertea, Pilidiophora, Heteronemertea, Hoplonemertea, Monostilifera,
Cratenemertea and Distromatonemertea, all with maximal support, stability to model and
method selection, and with high gene support frequency. Hubrechtidae and Polystilifera
are represented by a single species and therefore their monophyly is untested in this
study, but unlikely to be disrupted according to prior morphological and molecular work.
With a phylogenomic approach we are able to infer a stable tree for nemerteans in
contrast to Sanger-sequencing approaches, which failed to resolve some relationships,
15
at Harvard L
ibrary on August 28, 2014
http://mbe.oxfordjournals.org/
Dow
nloaded from

demonstrating the feasibility and utility of phylogenomics for neglected, but nonetheless
unique, phyla.
Supplementary Material
Supplementary material is available at Molecular Biology and Evolution online
(http://www.mbe.oxfordjournals.org/).
Acknowledgements
Many colleagues have assisted with fieldwork, specimens, and laboratory protocols.
FedEx is acknowledged for the constant delivery of life nemerteans for RNA work.
Robert Mesibov for Tasmanian specimens. Alicia Rodríguez Pérez Porro and Ana Riesgo
were instrumental in the development of the RNA and Illumina sequencing protocols.
SCSA is indebted to Casey Dunn for guidance during the first steps on bioinformatics and
cDNA libraries sample preparation. The Bauer Core from the Faculty of Arts and
Sciences at Harvard and the Research Computing Group, also from Harvard, are deeply
acknowledged for their assistance at many stages of the data acquisition and analyses.
This work was funded by the NSF projects Collaborative Research: Resolving old
questions in Mollusc phylogenetics with new EST data and developing general
phylogenomic tools (# DEB-0844881) and Collaborative Research: AToL: Phylogeny on
the half-shell--Assembling the Bivalve Tree of Life (#DEB-0732903) to G.G. H.M. is
funded by a Fapesp scholarship (2012/02906-4).
16
at Harvard L
ibrary on August 28, 2014
http://mbe.oxfordjournals.org/
Dow
nloaded from

References
Andrade SCS, Strand M, Schwartz M, Chen H-X, Kajihara H, von Döhren J, Sun S-C,
Junoy J, Thiel M, Norenburg JL, et al. 2012. Disentangling ribbon worm
relationships: multi-locus analysis supports traditional classification of the
phylum Nemertea. Cladistics 28:141–159. doi:10.1111/j.1096-0031.2011.00376.x
Betancur-R. R, Naylor G, Ortí G. 2014. Conserved genes, sampling error, and
phylogenomic inference. Syst Biol. 63:257–262. doi:10.1093/sysbio/syt073
Bleidorn C, Podsiadlowski L, Zhong M, Eeckhaut I, Hartmann S, Halanych KM,
Tiedemann R. 2009. On the phylogenetic position of Myzostomida: can 77 genes
get it wrong? BMC Evol Biol. 9:150. doi:10.1186/1471-2148-9-150
Capella-Gutiérrez S, Silla-Martínez JM, Gabaldón T. 2009. trimAl: a tool for automated
alignment trimming in large-scale phylogenetic analyses. Bioinformatics
25:1972–1973. doi:10.1093/bioinformatics/btp348
Chen H-X, Sun S-C, Sundberg P, Ren W-C, Norenburg JL. 2012. A comparative study of
nemertean complete mitochondrial genomes, including two new ones for
Nectonemertes cf. mirabilis and Zygeupolia rubens, may elucidate the
fundamental pattern for the phylum Nemertea. BMC Genomics 13:139.
doi:10.1186/1471-2164-13-139
Chernyshev AV, Magarlamov TY, Turbeville JM. 2013. Morphology of the proboscis of
Hubrechtella juliae (Nemertea, Pilidiophora): Implications for pilidiophoran
monophyly. J Morphol. 274:1397-1414.
Darriba D, Taboada GL, Doallo R, Posada D. 2011. ProtTest 3: fast selection of best-fit
models of protein evolution. Bioinformatics 27:1164–1165.
doi:10.1093/bioinformatics/btr088
Degnan JH, Rosenberg NA. 2006. Discordance of species trees with their most likely
gene trees. PLoS Genetics 2:e68. doi:10.1371/journal.pgen.0020068
Delsuc F, Brinkmann H, Philippe H. 2005. Phylogenomics and the reconstruction of the
tree of life. Nat Rev Genet. 6:361–375. doi:10.1038/nrg1603
Dunn CW, Hejnol A, Matus DQ, Pang K, Browne WE, Smith SA, Seaver E, Rouse GW
Obst M, Edgecombe GD, et al. 2008. Broad phylogenomic sampling improves
17
at Harvard L
ibrary on August 28, 2014
http://mbe.oxfordjournals.org/
Dow
nloaded from

resolution of the animal tree of life. Nature 452:745–749.
doi:10.1038/nature06614
Edwards SV, Liu L, Pearl DK. 2007. High-resolution species trees without concatenation.
Proc Natl Acad Sci USA. 104:5936–5941. doi:10.1073/pnas.0607004104
Fernández R, Hormiga G, Giribet G. 2014a. Phylogenomic analysis of spiders reveals
nonmonophyly of orb-weavers Curr Biol. 24:1772–1777.
doi:10.1016/j.cub.2014.06.035
Fernández R, Laumer CE, Vahtera V, Libro S, Kaluziak S, Sharma PP, Pérez-Porro AR,
Edgecombe GD, Giribet G. 2014b. Evaluating topological conflict in centipede
phylogeny using transcriptomic data sets. Mol Biol Evol. 31:1500–1513.
doi:10.1093/molbev/msu108
Gibson R. 1995. Nemertean genera and species of the world: an annotated checklist of
original names and description citations, synonyms, current taxonomic status,
habitats and recorded zoogeographic distribution. J Nat Hist. 29:271–562.
Grünewald S, Spillner A, Bastkowski S, Bogershausen A, Moulton V. 2013. SuperQ:
computing supernetworks from quartets. IEEE/ACM Trans Comput Biol Bioinf.
10:151–160. doi:10.1109/TCBB.2013.8
Hartmann S, Helm C, Nickel B, Meyer M, Struck TH, Tiedemann R, Selbig J, Bleidorn
C. 2012. Exploiting gene families for phylogenomic analysis of myzostomid
transcriptome data. PLoS ONE 7:e29843. doi:10.1371/journal.pone.0029843
Hejnol A, Obst M, Stamatakis A, Ott M, Rouse GW, Edgecombe GD, Martinez P, Baguñà
J, Bailly X, Jondelius U, et al. 2009. Assessing the root of bilaterian animals with
scalable phylogenomic methods. Proc R Soc B 276:4261–4270.
doi:10.1098/rspb.2009.0896
Heled J, Drummond AJ. 2010. Bayesian inference of species trees from multilocus data.
Mol Biol Evol. 27:570–580. doi:10.1093/Molbev/Msp274
Huson DH, Bryant D. 2006. Application of phylogenetic networks in evolutionary
studies. Mol Biol Evol. 23:254–267. doi:10.1093/molbev/msj030
Jeffroy O, Brinkmann H, Delsuc F, Philippe H. 2006. Phylogenomics: the beginning of
incongruence? Trends Genet. 22:225–231. doi:10.1016/j.tig.2006.02.003
18
at Harvard L
ibrary on August 28, 2014
http://mbe.oxfordjournals.org/
Dow
nloaded from

Kajihara H, Chernyshev AV, Sun S-C, Sundberg P, Crandall FB. 2008. Checklist of
nemertean genera and species published between 1995–2007. Spec Div.
13:245–274.
Katoh K, Kuma K, Toh H, Miyata T. 2005. MAFFT version 5: improvement in accuracy
of multiple sequence alignment. Nucleic Acids Res. 33:511–518.
doi:10.1093/nar/gki198
Katoh K, Toh H. 2008. Recent developments in the MAFFT multiple sequence alignment
program. Brief Bioinformat. 9:286–298. doi:10.1093/bib/bbn013
Kocot KM, Cannon JT, Todt C, Citarella MR, Kohn AB, Meyer A, Santos SR, Schander
C, Moroz LM, Lieb B, et al. 2011. Phylogenomics reveals deep molluscan
relationships. Nature 477:452–456. doi:10.1038/nature10382
Kvist S, Laumer CE, Junoy J, Giribet G. 2014. New insights into the phylogeny,
systematics and DNA barcoding of Nemertea. Inv Systemat. 28:287–308.
doi:10.1071/IS13061
Lartillot N, Philippe H. 2008. Improvement of molecular phylogenetic inference and the
phylogeny of Bilateria. Philos Trans R Soc Lond B. 363:1463–1472.
doi:10.1098/rstb.2007.2236
Le SQ, Dang CC, Gascuel O. 2012. Modeling protein evolution with several amino acid
replacement matrices depending on site rates. Mol Biol Evol. 29:2921–2936.
doi:10.1093/Molbev/Mss112
Leigh JW, Schliep K, Lopez P, Bapteste E. 2011. Let them fall where they may:
Congruence analysis in massive phylogenetically messy data sets. Mol Biol Evol.
28:2773–2785. doi:10.1093/Molbev/Msr110
Li L, Stoeckert CJ, Roos DS. 2003. OrthoMCL: Identification of ortholog groups for
eukaryotic genomes. Genome Res. 13:2178–2189. doi:10.1101/Gr.1224503
Liu L, Pearl DK, Brumfield RT, Edwards SV. 2008. Estimating species trees using
multiple-allele DNA sequence data. Evolution 62:2080–2091.
doi:10.1111/J.1558-5646.2008.00414.X
Liu L, Yu LL, Pearl DK, Edwards SV. 2009. Estimating species phylogenies using
coalescence times among sequences. Syst Biol. 58:468–477.
doi:10.1093/Sysbio/Syp031
19
at Harvard L
ibrary on August 28, 2014
http://mbe.oxfordjournals.org/
Dow
nloaded from

Maslakova SA. 2010a. Development to metamorphosis of the nemertean pilidium larva.
Front Zool. 7:30. doi:10.1186/1742-9994-7-30
Maslakova SA. 2010b. The invention of the pilidium larva in an otherwise perfectly good
spiralian phylum Nemertea. Int Comp Biol. 50:734–743. doi:10.1093/icb/icq096
McCormack JE, Heled J, Delaney KS, Peterson AT, Knowles LL. 2011. Calibrating
divergence times on species trees versus gene trees: implications for speciation
history of Aphelocoma jays. Evolution 65:184–202.
doi:10.1111/j.1558-5646.2010.01097.x
McIntosh WC. 1873–1874. A monograph of the British annelids. Part 1. The nemerteans.
London: Ray Society.
Meusemann K, von Reumont BM, Simon S, Roeding F, Strauss S, Kück P, Ebersberger I,
Walzl M, Pass G, Breuers S, et al. 2010. A phylogenomic approach to resolve the
arthropod tree of life. Mol Biol Evol. 27:2451–2464. doi:10.1093/molbev/msq130
Nosenko T, Schreiber F, Adamska M, Adamski M, Eitel M, Hammel J, Maldonado M,
Müller WEG, Nickel M, Schierwater B, et al. 2013. Deep metazoan phylogeny:
When different genes tell different stories. Mol Phylogenet Evol. 67:223–233.
doi:10.1016/j.ympev.2013.01.010
Philippe H, Brinkmann H, Lavrov DV, Littlewood DTJ, Manuel M, Wörheide G, Baurain
D. 2011. Resolving difficult phylogenetic questions: Why more sequences are not
enough. PLoS Biol. 9:e1000602. doi:10.1371/ journal.pbio.1000602
Pick KS, Philippe H, Schreiber F, Erpenbeck D, Jackson DJ, Wrede P, Wiens M, Alié A,
Morgenstern B, Manuel M, et al. 2010. Improved phylogenomic taxon sampling
noticeably affects nonbilaterian relationships. Mol Biol Evol. 27:1983–1987.
doi:10.1093/molbev/msq089
Rehm P, Borner J, Meusemann K, von Reumont BM, Simon S, Hadrys H, Misof B,
Burmester T. 2011. Dating the arthropod tree based on large-scale transcriptome
data. Mol Phylogenet Evol. 61:880–887. doi:10.1016/j.ympev.2011.09.003
Riesgo A, Andrade SC, Sharma PP, Novo M, Pérez-Porro AR, Vahtera V, González VL,
Kawauchi GY, Giribet G. 2012a. Comparative description of ten transcriptomes of
newly sequenced invertebrates and efficiency estimation of genomic sampling in
non-model taxa. Front Zool. 9:33. doi:10.1186/1742-9994-9-33
20
at Harvard L
ibrary on August 28, 2014
http://mbe.oxfordjournals.org/
Dow
nloaded from

Riesgo A, Pérez-Porro AR, Carmona S, Leys SP, Giribet G. 2012b. Optimization of
preservation and storage time of sponge tissues to obtain quality mRNA for
next-generation sequencing. Mol Ecol Resour. 12:312–322.
doi:10.1111/j.1755-0998.2011.03097.x
Ronquist F, Teslenko M, van der Mark P, Ayres DL, Darling A, Höhna S, Larget B, Liu L,
Suchard MA, Huelsenbeck JP. 2012. MrBayes 3.2: efficient Bayesian
phylogenetic inference and model choice across a large model space. Syst Biol.
61:539–542. doi:10.1093/sysbio/sys029
Roure B, Baurain D, Philippe H. 2013. Impact of missing data on phylogenies inferred
from empirical phylogenomic data sets. Mol Biol Evol. 30:197–214.
doi:10.1093/Molbev/Mss208
Salichos L, Rokas A. 2011. Evaluating ortholog prediction algorithms in a yeast model
clade. PLoS ONE 6:e18755. doi:10.1371/journal.pone.0018755.g001
Salichos L, Rokas A. 2013. Inferring ancient divergences requires genes with strong
phylogenetic signals. Nature 497:327–331. doi:10.1038/nature12130
Salichos L, Stamatakis A, Rokas A. 2014. Novel information theory-based measures for
quantifying incongruence among phylogenetic trees. Mol Biol Evol.
31:1261–1271. doi:10.1093/molbev/msu061
Satler JD, Starrett J, Hayashi CY, Hedin M. 2011. Inferring species trees from gene trees
in a radiation of California trapdoor spiders (Araneae, Antrodiaetidae, Aliatypus).
PLoS ONE 6:e25355. doi:10.1371/journal.pone.0025355
Schultze MS. 1851. Beiträge zur Naturgeschichte den Turbellarien.
C.A. Koch, Greifswald.
Schulz MH, Zerbino DR, Vingron M, Birney E. 2012. Oases: robust de novo RNA-seq
assembly across the dynamic range of expression levels. Bioinformatics
28:1086–1092. doi:10.1093/Bioinformatics/Bts094
Sharma PP, Kaluziak S, Pérez-Porro AR, González VL, Hormiga G, Wheeler WC, Giribet
G. 2014. Phylogenomic interrogation of Chelicerata reveals systemic conflicts in
phylogenetic signal. Mol Biol Evol. doi: 10.1093/molbev/msu235
21
at Harvard L
ibrary on August 28, 2014
http://mbe.oxfordjournals.org/
Dow
nloaded from

Smith S, Wilson NG, Goetz F, Feehery C, Andrade SCS, Rouse GW, Giribet G, Dunn
CW. 2011. Resolving the evolutionary relationships of molluscs with
phylogenomic tools. Nature 480:364–367. doi:10.1038/nature10526
Stamatakis A. 2006. RAxML-VI-HPC: maximum likelihood-based phylogenetic analyses
with thousands of taxa and mixed models. Bioinformatics 22:2688–2690.
doi:10.1093/bioinformatics/btl446
Stamatakis AP, Meier H, Ludwig T. 2008. RAxML: A parallel program for phylogenetic
tree inference.
Stiasny-Wijnhoff G. 1936. Die Polystilifera der Siboga-Expedition. Siboga Exped.
22:1–214.
Struck TH, Paul C, Hill N, Hartmann S, Hösel C, Kube M, Lieb B, Meyer A, Tiedemann
R, Purschke G, et al. 2011. Phylogenomic analyses unravel annelid evolution.
Nature 471:95–98. doi:10.1038/nature09864
Struck TH, Wey-Fabrizius AR, Golombek A, Hering L, Weigert A, Bleidorn C, Klebow
S, Iakovenko N, Hausdorf B, Petersen M, et al. 2014. Platyzoan paraphyly based
on phylogenomic data supports a non-coelomate ancestry of Spiralia. Mol Biol
Evol. 31:1833–1849. doi:10.1093/molbev/msu143
Sundberg P, Strand M. 2007. Annulonemertes (phylum Nemertea): when segments do not
count. Biol Lett. 3:570–573.
Sundberg P, Turbeville JM, Lindh S. 2001. Phylogenetic relationships among higher
nemertean (Nemertea) taxa inferred from 18S rDNA sequences. Mol Phylogenet
Evol. 20:327–334.
Thollesson M, Norenburg JL. 2003. Ribbon worm relationships: a phylogeny of the
phylum Nemertea. Proc R Soc B. 270:407–415.
Turbeville JM. 1986. An ultrastructural analysis of coelomogenesis in the hoplonemertine
Prosorhochmus americanus and the polychaete Magelona sp. J Morphol.
187:51–56.
von Reumont BM, Jenner RA, Wills MA, Dell'Ampio E, Pass G, Ebersberger I, Meyer B,
Koenemann S, Iliffe TM, Stamatakis A, et al. 2012. Pancrustacean phylogeny in
the light of new phylogenomic data: support for Remipedia as the possible sister
group of Hexapoda. Mol Biol Evol. 29:1031–1045. doi:10.1093/molbev/msr270
22
at Harvard L
ibrary on August 28, 2014
http://mbe.oxfordjournals.org/
Dow
nloaded from

Wasmuth JD, Blaxter ML. 2004. prot4EST: translating expressed sequence tags from
neglected genomes. BMC Bioinformatics 5:187.
Wenzel JW, Siddall ME. 1999. Noise. Cladistics 15:51-64.
Zapata F, Wilson NG, Howison M, Andrade SCS, Jörger KM, Goetz FE, Giribet G, Dunn
CW. 2014. Phylogenomic analyses of deep gastropod relationships reject
Orthogastropoda. bioRxiv. doi:10.1101/007039
Zerbino DR, Birney E. 2008. Velvet: Algorithms for de novo short read assembly using
de Bruijn graphs. Genome Res. 18:821–829. doi:10.1101/Gr.074492.107
23
at Harvard L
ibrary on August 28, 2014
http://mbe.oxfordjournals.org/
Dow
nloaded from

Fig. 1. Gene occupancy representation per species, with maximum occupancy towards
the top left. Capitella teleta is the best represented species, while the 454 library of
Tubulanus punctatus is the worst represented one. Large matrix (2,779 orthogroups)
represented in blue, and the reduced subset (95% occupancy, 464 orthogroups) is
represented in purple.
Fig. 2. Phylogenetic hypothesis based on the large data matrix analyzed in RAxML (-lnL
= - 5,973,224.55 ) with support values (bootstrap values or posterior probabilities) plotted
as follows: large matrix RAxML/large matrix ExaBayes/small matrix RAxML/small
matrix ExaBayes. Squares indicate maximum support in all four analyses. Nemertean
lineages shown in color/shades. Photos are of representatives of the different lineages of
nemerteans: (a) Palaeonemertea (Tubulanus rhabdotus), (b) Hubrechtidae (Hubrechtella
ijimai), (c) Heteronemertea (Cerebratulus leucopsis), (d) Hoplonemertea, Polystilifera
(Drepanophorus spectabilis), and (e) Hoplonemertea, Monostilifera (Tetrastemmatidae
sp.).
Fig. 3. Unrooted SuperQ ML splits network for the large data matrix. Colors/shades are
as in Fig. 2.
24
at Harvard L
ibrary on August 28, 2014
http://mbe.oxfordjournals.org/
Dow
nloaded from

Table 1. Species included in the analysis, including new and publicly available data. The sequencing method for new data or the source of the data is indicated in the third
column. The public archive used was JGI- http://www.jgi.doe.gov/. MCZ voucher accession numbers beginning with IZ and DNA are at the Harvard Museum of Comparative
Zoology. See methods for details on sample preparation protocols. * assemblies were obtained directly from Casey W. Dunn referring to Smith et al. (2011). **Material deposited
in the Department of Zoology and Physical Anthropology, Universidad Complutense de Madrid. *** used the translated assemblies from the JGI database. N – number.
Species MCZ voucher Sampling
location
Sequence
method/ source
N raw reads N reads
after
filtering
assembler N contigs
(>150bp)
n50 longest
contig
N
contigs
>999bp
Average
contig
length
total length
(bp)
Tubulanus punctatus IZ-134221 Akkeshi,
Hokkaido,
Japan
454 69,472 63,219 Newbler 4,217 501 2374 223 488.9 2,061,617
Carinoma hamanako IZ-135326 Ikarise
Island,
Honshu,
Japan
Illumina-PE 103,234,742 80,199,393 Velvet/
Oases
70,286 1,674 13,084 22,664 825.4 72,037,381
Cephalothrix
hongkongiensis
IZ-135329 Akkeshi,
Hokkaido,
Japan
Illumina-PE 51,634,374 41,432,780 Velvet/
Oases
73,445 1,047 9,337 14,514 539.6 52,901,581
Hubrechtella ijimai IZ-135342 Hamanako,
Honshu,
Japan
Illumina-PE 72,768,612 50,847,602 Velvet/
Oases
110,394 391 5,458 4,110 343.2 49,058,203
Baseodiscus unicolor IZ-135322 Bocas del
Toro,
Panama
Illumina-PE 175,593,324 78,906,444 Velvet/
Oases
89,321 1,443 24,550 17,032 745.3 72,397,184
Cerebratulus marginatus IZ-134484 San Juan
Island,
Washington,
USA
Illumina-PE 52,515,657 28,486,396 Velvet/
Oases
117,305 1,103 16,854 24,435 503 90,860,260
Riseriellus occultus IZ-135375 Liverpool,
UK
Illumina-PE 115,328,860 71,403,264 Velvet/
Oases
91,728 800 14,082 3,359 368.5 53,276,504
Argonemertes australiensis IZ-135314 Tasmania,
Australia
Illumina-PE 128,371,852 39,211,148 Velvet/
Oases
43,999 581 6,810 4,515 471.3 24,144,649
Malacobdella grossa IZ-133743 Tjärnö,
Skagerak,
Sweden
Illumina-PE 47,277,586 35,241,626 Velvet/
Oases
49,596 1,508 9,108 17,380 688.9 52,064,433
Nipponnemertes sp. IZ-135354 Biobío, Chile Illumina-PE 178,923,604 62,354,396 Velvet/ 28,772 816 12,963 5178 584.4 20,995,957
at Harvard L
ibrary on August 28, 2014
http://mbe.oxfordjournals.org/
Dow
nloaded from

Oases
Paranemertes peregrina IZ-134480 San Juan
Island,
Washington,
USA
Illumina-SE 24,392,996 16,521,215 Velvet/
Oases
30,456 1,721 21,949 16,859 913.1 52,515,685
Protopelagonemertes
beebei
IZ-135370 Sagami Bay,
Japan
Illumina-SE 22,321,639 12,011,532 Velvet/
Oases
29,295 1,225 19,285 6,275 709.4 23,997,464
Outgroups
Octopus vulgaris DNA106283 Blanes,
Girona, Spain
Illumina-PE 94,283,86 16,501,336 Velvet/
Oases
56,949 1,158 19,747 10,435 689.4 39,263,022
Chiton olivaceus MAL-378064 Tossa de
Mar, Girona,
Spain
Illumina-PE 82,814,428 55,901,966 Velvet/
Oases
109,413 784 7,118 15,108 557.2 60,964,316
Gadila tolmiei* Smith et al.
2011
Velvet/
Oases
78,360 764 17,170 9,932 542.2 42,641,982
Ennucula tenuis* Greenland Smith et al.
2011
Velvet/
Oases
64,402 1,258 18,317 13,928 747.5 48,144,794
Sipunculus nudus IZ-130438 Fort Pierce,
Florida, USA
Illumina-PE 195,601,190 34,173,928 Velvet/
Oases
121,416 733 7,399 13,337 455.6 55,305,482
Hormogaster samnitica GEL6** Gello,
Toscana,
Italy
Illumina-PE 53,956,780 31,623,984 Velvet/
Oases
59,853 1,156 9,307 11,613 677.1 40,526,740
Capitella teleta JGI
database***
Helobdella robusta JGI
database***
at Harvard L
ibrary on August 28, 2014
http://mbe.oxfordjournals.org/
Dow
nloaded from

Table 2. Number of sequences used in the ortholog clustering analysis and on the final matrices per taxon.
Species N peptide
sequences
analyzed in
OrthoMCL
N orthologs
included in large
matrix
Missing data in
large matrix (%)
N orthologs
included in
reduced matrix
Missing data in
reduced matrix
(%)
Tubulanus punctatus 4,084 704 74.7 247 46.8
Carinoma hamanako 43,936 2,613 6.0 456 1.7
Cephalothrix hongkongiensis 67,577 2,400 13.6 444 4.3
Hubrechtella ijimai 109,839 2,157 22.4 442 4.7
Baseodiscus unicolor 70,859 2,280 18.0 450 3.0
Cerebratulus marginatus 105,512 2,360 15.1 446 3.9
Riseriellus occultus 91,160 2,565 7.7 449 3.2
Argonemertes australiensis 41,675 2,539 8.6 447 3.7
Malacobdella grossa 32,219 2,453 11.7 451 2.8
Nipponnemertes sp. 28,538 2,067 25.6 434 6.5
Paranemertes peregrina 29,918 2,583 7.1 458 1.3
Protopelagonemertes beebei 22,618 2,061 25.8 441 5.0
Outgroups
Octopus vulgaris 55,002 2,371 14.7 457 1.5
Chiton olivaceus 105,806 2,039 26.6 427 8.0
Gadila tolmiei 77,870 2,463 11.4 454 2.2
Ennucula tenuis 63,517 2,422 12.8 443 4.5
Sipunculus nudus 119,303 1,333 52.0 398 14.2
Hormogaster samnitica 59,134 2,235 19.6 444 4.3
Capitella teleta 32,415 2,727 1.9 464 0.0
Helobdella robusta 23,432 2,552 8.2 462 0.4
at Harvard L
ibrary on August 28, 2014
http://mbe.oxfordjournals.org/
Dow
nloaded from

Andrade et al. Fig. 1
at Harvard L
ibrary on August 28, 2014
http://mbe.oxfordjournals.org/
Dow
nloaded from

at Harvard L
ibrary on August 28, 2014
http://mbe.oxfordjournals.org/
Dow
nloaded from

Andrade et al. Fig. 3
at Harvard L
ibrary on August 28, 2014
http://mbe.oxfordjournals.org/
Dow
nloaded from
Copyright © 2022 FDOKUMEN