A genomic and transcriptomic study of lineage-specific ...
290
A genomic and transcriptomic study of lineage-specific variation in Mycobacterium tuberculosis Graham David Rose Thesis submitted for the degree of Doctor of Philosophy 2013 MRC National Institute for Medical Research
-
Upload
khangminh22 -
Category
Documents
-
view
0 -
download
0
Transcript of A genomic and transcriptomic study of lineage-specific ...

A genomic and transcriptomic study
of lineage-specific variation in Mycobacterium
tuberculosis
Graham David Rose
Thesis submitted for the degree of
Doctor of Philosophy
2013
MRC National Institute for Medical Research
ii
Declaration
I, Graham David Rose, confirm that the work presented in this thesis is my own. Where
information has been derived from other sources, I confirm that this has been indicated in the
thesis.
Signed………………………………………….Date……………………………………..
The thesis work was conducted from September 2009 to March 2013 at the MRC National
Institute of Medical Research (NIMR), London, UK, under the supervision of Douglas Young
(NIMR, London), and Sebastien Gagneux (Swiss Tropical and Public Health Institute,
Switzerland).

iii
Abstract
Human tuberculosis (TB) is caused by several closely related species of bacteria collectively
known as the Mycobacterium tuberculosis complex (MTBC). In this thesis the identification
and effect of lineage-specific genetic variation within the phylogenetic lineages of the MTBC
was investigated using a combination of computational methods and high-throughput
sequencing technology.
Genome sequencing has now identified an extensive repertoire of single nucleotide
polymorphisms (SNPs) amongst clinical isolates of the MTBC. Comparative analysis focused
on the detection of all lineage-specific SNPs, providing the first glimpse of the total SNP
diversity that separates the main phylogenetic lineages from each other. Bioinformatic
analysis focused on SNPs more likely to contribute to functional diversity, which predicted
nearly half of all SNPs in the MTBC to have functional consequences, while SNPs within
regulatory proteins were over-represented. To determine whether these and other lineage-
specific SNPs lead to phenotypic diversity, genome datasets were integrated with RNA-
sequencing to assess their impact on the comparative transcriptome profiles of strains
belonging to two MTBC lineages. Analysing the transcriptomes in the light of the underlying
genetic variation found clear correlations between genotype and transcriptional phenotype.
These arose by three mechanisms. First, lineage-specific changes in amino acid sequence of
transcriptional regulators were associated with alterations in their ability to control gene
expression. Second, changes in nucleotide sequence were associated with alteration of
promoter activity and generation of novel transcriptional start sites in intergenic regions and
within coding sequences. Finally, genes showing lineage-specific patterns of differential
expression not linked directly to primary mutations were characterised by a striking over-
representation of toxin-antitoxin pairs.

iv
Acknowledgements
This thesis would not have been possible without the efforts of my colleagues and friends.
Firstly I would like to thank my PhD supervisors Sebastien Gagneux and Douglas Young for
their support and guidance throughout my project, providing me with their invaluable depth
of knowledge and resources. Of special note were the annual Gagneux group retreats in
Charmey and Les Diablerets, which always provided a healthy mix of stimulating scientific
discussions about my projects and great food, including of course the meringue et la crème
double. I am grateful to my three thesis supervisor’s, Delmiro Fernandez-Reyes, Roger
Buxton and Seb, who were a great help in contextualising my ideas and providing a focus.
My thesis relied heavily on sequence data, and as such I thank Abdul Sesay and the rest of the
High Throughput Sequencing group at NIMR for performing the Illumina sequencing. Next I
would like to thank Iñaki Comas, who was always happy to answer my questions on
evolutionary theory and phylogenomics, and provide more general daily support on all things
computational. I also thank the other original member of the Gagneux group at NIMR, Sonia
Borrell, particularly so for her help in getting me up and running in the lab at the start, and
then the current members of Douglas Young’s group, including Kristine Arnvig, for her
guidance on the RNA side of my project, and Steve Coade, who was my Biosafety
Containment Level 3 trainer for the first six months of my PhD. My time at NIMR would not
have been as enjoyable without my colleagues and friends Christina Kahramanoglou and
Teresa Cortés Méndez, and to Teresa, I am indebted to you for your support in keeping me
focused and all things in perspective during the final few months. I apologise that despite
your and the past efforts from the Spanish contingent of the group that my vocabulary is still
quite limited in your language. One day! Of course I am grateful to my parents, who provided
me with their untiring support to undertake my studies throughout the years, and to my
brother Phil for his advice and the countless Sunday lunches in Balham. Finally I am grateful
to the Medical Research Council (MRC) for their funding, who supported not only my
university costs and living expenses for the last three and a half years, but the research of
many of my colleagues as well. Thank you.

CONTENTS
v
Contents
Declaration...……………………………………………………………………………..ii
Abstract.…………………………………………………………………………………iii
Acknowledgements...……………………………………………………………………iv
List of Figures...………………………………………………………………………….x
List of Tables...………………………………………………………………………….xii
Glossary...………………………………………………………………………………xiii
Chapter 1 Introduction ............................................................................................... 1
1.1 The genus Mycobacterium ................................................................................ 2
1.1.1 Taxonomy ..................................................................................................... 2
1.1.2 The Mycobacterium tuberculosis complex (MTBC) .................................... 4
1.1.3 TB disease in humans ................................................................................... 5
1.1.4 Disease diversity ........................................................................................... 6
1.2 Genetic diversity in the MTBC ........................................................................ 7
1.2.1 General features of the M. tuberculosis genome .......................................... 7
1.2.2 Typing the MTBC ......................................................................................... 7
1.2.3 The phylogenetic lineages of the MTBC ...................................................... 9
1.2.4 Origin of the MTBC ................................................................................... 13
1.2.5 Selective pressures acting within the MTBC .............................................. 13
1.3 Phenotypic diversity ........................................................................................ 15
1.3.1 Laboratory strains ....................................................................................... 15
1.3.2 Clinical strain phenotype ............................................................................ 16
1.4 Linking genotype to phenotype ...................................................................... 17
1.4.1 In silico prediction of functional SNPs ....................................................... 19
1.4.2 Gene expression diversity ........................................................................... 20
1.4.3 High throughput DNA sequencing technology ........................................... 22
1.5 Thesis Outline .................................................................................................. 25
CONTENTS
vi
Chapter 2 Materials and Methods ........................................................................... 26
2.1 General microbiological methods .................................................................. 26
2.1.1 Containment 3 laboratory ........................................................................... 26
2.1.2 General chemicals and reagents .................................................................. 26
2.1.3 Bacterial culture and storage ....................................................................... 27
2.1.4 Growth curves ............................................................................................. 27
2.2 Molecular biology techniques ......................................................................... 28
2.2.1 Genomic DNA extraction ........................................................................... 28
2.2.2 RNA Isolation and handling ....................................................................... 28
2.2.3 Quantification of DNA and RNA by Nanodrop ......................................... 29
2.2.4 Determination of DNA and RNA integrity by micro fluidics .................... 30
2.2.5 Removal of DNA contamination from RNA samples ................................ 30
2.2.6 Polymerase chain reaction (PCR) ............................................................... 30
2.3 Materials ........................................................................................................... 31
2.3.1 Mycobacterium tuberculosis strains ........................................................... 31
2.4 DNA-seq ............................................................................................................ 31
2.5 RNA-seq ............................................................................................................ 32
2.5.1 Strand specific RNA-seq libraries .............................................................. 32
2.5.2 TSS 5’ enriched RNA-seq libraries ............................................................ 34
2.6 Illumina sequencing DNA (genome) and cDNA (RNA-seq) libraries ......... 34
2.7 Quantitative RT-PCR ...................................................................................... 34
2.7.1 Primer sequences ........................................................................................ 35
2.8 MTBC annotation datasets ............................................................................. 36
2.8.1 Coding sequence annotations ...................................................................... 36
2.8.2 Functional Categories ................................................................................. 36
2.8.3 Essential M. tuberculosis genes .................................................................. 36
2.9 Bioinformatics software .................................................................................. 37
2.9.1 Artemis ........................................................................................................ 37
2.9.2 Quality control of raw RNA-sequencing data ............................................ 37
2.9.3 Transcriptome mapping software ............................................................... 38
2.9.4 Calculation of mapped read frequencies per feature region ....................... 39
2.9.5 R .................................................................................................................. 40
2.9.6 Perl scripts ................................................................................................... 40
2.9.7 Graph pad prism 5.0 .................................................................................... 40
Chapter 3 Lineage-specific SNPs ............................................................................. 41
3.1 Introduction ..................................................................................................... 41

CONTENTS
vii
3.1.1 Aims ............................................................................................................ 42
3.2 Materials and Methods ................................................................................... 43
3.2.1 Genome collection used in study ................................................................ 43
3.2.2 Genome sequencing. ................................................................................... 43
3.2.3 Mapping genome sequences ....................................................................... 43
3.2.4 Phylogenetic analysis. ................................................................................. 44
3.2.5 Categorising SNPs ...................................................................................... 44
3.2.6 dN/dS calculation ........................................................................................ 45
3.3 Results ............................................................................................................... 47
3.3.1 A globally representative 28-genome human-adapted MTBC phylogeny . 47
3.3.2 Identification of all lineage-specific SNPs ................................................. 53
3.3.3 Distribution of SNPs ................................................................................... 56
3.3.4 Monomorphic population structure and homoplasic SNPs ........................ 59
3.3.5 Creation of pseudogenes ............................................................................. 62
3.3.6 SNPs within genes associated with antibiotic resistance ............................ 69
3.3.7 Conservation and removal of lineage-specific nonsynonymous SNPs ....... 72
3.4 Discussion ......................................................................................................... 77
3.4.1 Strengths and limitations of this study ........................................................ 77
3.4.2 General characteristics of lineage-specific diversity .................................. 78
3.4.3 Insights into the evolution of M. tuberculosis lineages .............................. 80
Chapter 4 In silico prediction of functional Single Nucleotide Polymorphisms .. 84
4.1 Introduction ..................................................................................................... 84
4.1.1 Aims ............................................................................................................ 86
4.2 Materials and Methods ................................................................................... 87
4.2.1 SIFT ............................................................................................................ 87
4.2.2 Indels ........................................................................................................... 89
4.2.3 Homology modelling .................................................................................. 89
4.2.4 Change in protein stability .......................................................................... 90
4.3 Results ............................................................................................................... 91
4.3.1 Predicting functional SNPs within control set ............................................ 91
4.3.2 Predicted functional nonsynonymous SNPs ............................................... 92
4.3.3 Impact of nonsynonymous SNPs outside of the human adapted MTBC .... 95
4.3.4 Clustering of functional SNPs .................................................................... 95
4.3.5 Functional category analysis of functional SNPs ........................................ 99
4.3.6 Functional impairment of Lineage 1 and 2 regulatory proteins ................ 101
4.4 Discussion ....................................................................................................... 106

CONTENTS
viii
4.4.1 Strengths and limitations of the study ....................................................... 106
4.4.2 Validation of the SIFT method ................................................................. 108
4.4.3 Half of lineage-specific SNPs are predicted to have functional
consequences ......................................................................................................... 109
Chapter 5 Screening the effect of lineage-specific variation by sequence-based
transcriptional profiling .............................................................................................. 112
5.1 Introduction ................................................................................................... 112
5.1.1 Aims .......................................................................................................... 113
5.2 Methods .......................................................................................................... 114
5.2.1 Clinical isolates in study ........................................................................... 114
5.2.2 Cluster analysis ......................................................................................... 118
5.2.3 Differential expression analysis ................................................................ 118
5.2.4 Transcriptional Start Site (TSS) calling .................................................... 119
5.3 Results ............................................................................................................. 120
5.3.1 Growth rate in vitro ................................................................................... 120
5.3.2 RNA isolation and Illumina ready libraries .............................................. 124
5.3.3 Transcriptome sequencing ........................................................................ 125
5.3.4 Mapping reads to the H37Rv genome ...................................................... 128
5.3.5 Identifying strain specific gene deletions ................................................. 129
5.3.6 Clustering of strains at the total sample level ........................................... 133
5.3.7 Clustering of strains by antisense expression ........................................... 138
5.3.8 Testing for differential expression in RNA-seq data ................................ 140
5.3.9 Lineage-specific gene expression ............................................................. 141
5.3.10 Enrichment of toxin-antitoxins ............................................................... 155
5.4 Discussion ....................................................................................................... 159
5.4.1 Strengths and limitations of the study ....................................................... 159
5.4.2 Lineage-specific expression ...................................................................... 161
5.4.3 Linking genotype to phenotypic at the transcriptional level ..................... 162
Chapter 6 Final discussion ..................................................................................... 167
References ................................................................................................................ 174
Appendices A-G
Appendix A. genomeDeletions.pl…………………………………………………209
Appendix B. Lineage-specific SNPs………………………………………………211
Appendix C. Lineage-specific SNPs within drug resistance associated genes……265
Appendix D. Nonsynonymous/synonymous SNP ratio………………………...…267
Appendix E. RNA-seq differential expression……………………………………269

CONTENTS
ix
Appendix F. Functional categories…………………………………………..…274
Appendix G. Publications…………………………………………...…..……...275

LIST OF FIGURES
x
List of Figures
Figure 1.1. Phylogenetic structure of the genus Mycobacterium.. .................................. 3!Figure 1.2. The most complete phylogeny of the human adapted MTBC .................... 11!Figure 1.3. Distribution of the MTBC lineages globally .............................................. 12!Figure 1.4. The number of MTBC genome sequences in the Short Read Archive…....18!Figure 3.1. Neighbour-joining phylogeny for 28 human-adapted MTBC genomes ..... 49!Figure 3.2. Within-lineage SNP diversity. .................................................................... 52!Figure 3.3. Isolating lineage-specific SNPs from the phylogeny. ................................. 54!Figure 3.4. Distribution of the lineage-specific SNPs across the genome. ................... 55!Figure 3.5. The average number of non-coding and coding lineage-specific SNPs ..... 57!Figure 3.6 Distribution of lineage SNPs per gene. ....................................................... 58!Figure 3.7. Homoplasic lineage SNPs. .......................................................................... 60!Figure 3.8. Change in protein length due to nonsense SNPs. ....................................... 67!Figure 3.9. Gene creation by nonsense SNPs ................................................................ 68!Figure 3.10 Lineage-specific SNPs within genes associated with drug resistance ........ 69!Figure 3.11. The rate of nonsynonymous SNP accumulation by functional category .... 75!Figure 4.1. SIFT database phylogeny. ........................................................................... 88!Figure 4.2. SIFT predictions. ......................................................................................... 94!Figure 4.3. Distribution of predicted functional SNPs per gene. .................................. 97!Figure 4.4. Frequency distribution of predicted functional SNPs across genome. ....... 98!Figure 4.5. Functional category representation.. ........................................................... 99!Figure 4.6. Predicted loss of function of virS transcriptional regulator in Lineage 1.. 105!Figure 4.7. Spectrum of functional SNPs. ................................................................... 111!Figure 5.1. Strains sequenced in RNA-seq study. ....................................................... 117!Figure 5.2. In vitro growth curves. .............................................................................. 121!Figure 5.3. Quality control of RNA-seq samples by Bioanalyser. .............................. 124!Figure 5.4. Distribution of quality scores for strain N0145. ....................................... 125!Figure 5.5. Circular plot of mapped RNA-seq data.. .................................................. 128!

LIST OF FIGURES
xi
Figure 5.6. Representation of transcriptome plot based on Artemis. .......................... 129!Figure 5.7. Distribution of gene deletions in the six RNA-seq study strains. ............. 130!Figure 5.8. Distribution of gene deletions grouped by gene function category. ......... 132!Figure 5.9. Unsupervised hierarchical clustering of total gene expression. ................ 135!Figure 5.10. Relationship of genotypic to transcriptomic diversity. ............................. 136!Figure 5.11. Correlation of SNP distance to gene expression. ...................................... 137!Figure 5.12. Unsupervised hierarchical clustering of total antisense expression. ......... 139!Figure 5.13. Venn diagram comparing differential expression methods ...................... 141!Figure 5.14. Heatmap of 112 differentially expressed genes. ....................................... 142!Figure 5.15. Differential expression of divergently regulated genes.. .......................... 144!Figure 5.16. Heat map of dosR regulon. ....................................................................... 146!Figure 5.17. Duplication of dosR region. ...................................................................... 147!Figure 5.18. DosR regulon and SNP-associated TSS.. .................................................. 149!Figure 5.19. SNP-associated TSS leading to differential gene expression. .................. 152!Figure 5.20. SNP-associated TSS leading to differential antisense expression. ........... 154!Figure 5.21. Over-representation of differentially expressed toxin-antitoxins.. ........... 156!Figure 5.22. Validation of select RNA-seq differentially expressed toxin- antitoxins.. 156!Figure 5.23. Rates of the types of nucleotide mutations across. ................................... 165!

LIST OF TABLES
xii
List of Tables
Table 2.1. Primer sequences used in the qRT-PCR study........................................... 35
Table 3.1. Twenty eight strains used in this study....................................................... 46
Table 3.2. Estimates of evolutionary divergence between strains. ............................. 50
Table 3.3. Summary of lineage-specific SNPs. .......................................................... 57
Table 3.4. Homoplasic nucleotide positions within the lineage branches. ................. 60
Table 3.5. Variable genomic positions within the lineages. ....................................... 61
Table 3.6. Nonsense SNPs .......................................................................................... 63
Table 3.7. Nonsense SNPs by lineage..........................................................................64
Table 3.8. Nonsense SNPs grouped by functional category........................................64
Table 3.9. Mutations found in drug resistance studies associated with drug resistance
Table 3.10. The rate of nonsynonymous SNP accumulation across the lineages.......... 73
Table 3.11. The rate of nonsynonymous SNP accumulation by functional category….76
Table 4.1. SIFT database of non-MTBC species. ........................................................89
Table 4.2. Predicted tolerated and functional SNPs using SIFT. ................................94
Table 4.3. Functional category representation............................................................100
Table 4.4. Transcriptional regulators with predicted functional mutations................102
Table 4.5. Regulatory proteins with predicted functional mutations in Lineage 1
and 2...............................................................................................................................104
Table 5.1. Lineage 1 and 2 strain used in the RNA-seq study. ...........................115
Table 5.2. Additional strains used in growth curve experiment. ........................ 115
Table 5.3. Additional strains used in qRT-PCR confirmation. .........................116
Table 5.4. In vitro growth rates. ....................................................................... 123
Table 5.5. Details of exponential phase transcriptomes used in differential expression
analysis.......................................................................................................................... 126
Table 5.6. Transcriptomes used in TSS mapping….................................................. 127
Table 5.7. Differential expression associated with lineage-specific amino acid
mutations SNPs............................................................................................................. 143
LIST OF TABLES
xiii
Table 5.8. Ten differentially expressed genes associated with a change in promoter
sequences……................................................................................................................150
Table 5.9. Nine differentially expressed antisense associated with introduction of
SNP- associated TSS……………................................................................................. 153
Table 5.10. Ten differentially expressed toxin-antitoxins (TA).................................. 157

xiv
Glossary
∆∆G change in Gibbs free
energy
-10 Pribnow box
CCAL creative commons
attribution license
cDNA complementary DNA
dt doubling time
DNA deoxyribonucleic acid
DNA-seq DNA-sequencing
g gram
GA Genome Analyser
Gb gigabase
HS HiSeq2000
HTH helix-turn-helix
indel insertion/deletion
LSP large sequence
polymorphism
Mb megabase
mg milligram
ml millilitre
MLSA multilocus sequence
analysis
mRNA messenger RNA
MTBC Mycobacterium
tuberculosis complex
nt nucleotide
OD optical density
PCR polymerase chain reaction
PDB protein data bank
PE proline-glutamic acid
PPE proline-proline-glutamic
acid
PGRS polymorphic glycine rich
sequence
qRT-PCR quantitative realtime-PCR
RD region of difference
RNA ribonucleic acid
RNA-seq RNA-sequencing
RPKM reads per kilobase per
million mapped reads
rRNA ribosomal RNA
sd standard deviation
SNP single nucleotide
polymorphism
SEM standard error of the mean
sRNA small RNA
TA toxin-antitoxin
TSS transcriptional start site
µg microgram
µl microlitre
UTR untranslated region
VST variance stabilising
transformation
HGT horizontal gene transfer
TbD1 M.tuberculosis specific
deletion 1
HMM Hidden Markov model
VCF variant call format
GTF gene transfer format
X2 chi-square test

1.1 The genus Mycobacterium
1
Chapter 1 Introduction
Tuberculosis (TB) is caused by several closely related species of bacteria collectively
known as the Mycobacterium tuberculosis complex (MTBC) (Cole et al., 1998). The
infamous member of the MTBC is the human-adapted pathogen Mycobacterium
tuberculosis, the etiologic agent of human TB along with Mycobacterium africanum, a
phylogenetic variant limited to West Africa (de Jong et al., 2010). Together these
species are regarded as human-adapted MTBC members. Today, TB causes more adult
deaths than any other single infectious disease, and is second only to HIV/AIDS, of
which TB is the greatest cause of mortality in those infected with HIV (WHO, 2012). It
is estimated that nine million new TB cases and over one million deaths from TB
currently occur each year (WHO, 2012). In addition to active cases of TB, two billion
people have a latent infection, effectively acting as a reservoir of active TB cases for
several decades to come (Barry et al., 2009).
Historically TB is an ancient disease (Donoghue et al., 2004). Early cultural references
date back to classical Greek times (Daniel, 1997), when Hippocrates used the term
“phthisis” to describe active TB in individuals (Coar, 1982). Ancient M. tuberculosis
DNA has been isolated from mummies found in Egypt (Nerlich et al., 1997) and South
America (Salo et al., 1994). More recently, molecular genetics and the advent of
sequencing technologies have facilitated more rigorous dating of M. tuberculosis and
other MTBC members; low estimates range from 15,000-20,000 (Sreevatsan et al.,
1997a), but more recently 70,000 years or more has been suggested (Hershberg et al.,
2008). TB has therefore been a burden on humans for a long time, possibly since the
migration of modern humans out of Africa (Hershberg et al., 2008). Recent analyses of
MTBC evolution, largely driven by the advances in sequencing technology (Loman et
al., 2012), have revealed a global picture of human MTBC strain variation, consisting of

1.1 The genus Mycobacterium
2
six major phylogenetic lineages that display strong geographic structure (Gagneux &
Small, 2007; Hershberg et al., 2008) and a rare seventh lineage recently discovered in
the Horn of Africa (Firdessa et al., 2013). This has questioned the accuracy of prior
assumptions that variation in the MTBC was negligible and of no clinical significance
(Musser et al., 2000; Sreevatsan et al., 1997a), whilst bringing to the forefront the
identification, potential effects of genetic variation, and future trajectory of the disease
(Comas & Gagneux, 2009; Hershberg et al., 2008; Homolka et al., 2010). New
opportunities now exist to study how the evolution of the MTBC has resulted in
functional consequences in the lineages of MTBC at the definitive resolution - the level
of DNA and RNA. It is these opportunities that shall be explored in this thesis.
1.1 The genus Mycobacterium
A genus of Actinobacteria, Mycobacteria are distinctive rod-shaped bacteria that are
characterised by high GC content, and complex lipid-rich cell walls (Madigan et al.,
2003). This physical property of the cell wall was exploited in 1882 by Koch, who
stained M. tuberculosis with alkaline methylene blue and a Bismarck brown stain for
surrounding tissue (Ellis & Zabrowarny, 1993). In the same year the Ziehl-Neelsen stain
was developed, which used a similar process to identify acid-fast bacteria, and is still
used today to identify mycobacteria (Parish & Stoker, 2001).
1.1.1 Taxonomy
A working taxonomy for Mycobacteria was established 50 years ago, with original
classifications based on growth rate, pigmentation and clinical significance (Stahl &
Urbance, 1990). A fundamental division can be made based on growth rate, splitting
Mycobacteria into two major groups, fast and slow growers. The fast growers include
mainly opportunistic or non-pathogenic mycobacteria, such as Mycobacterium
smegmatis, which can be cultured from dilute inocula within a week. In contrast, the
slow growing species can take several weeks for visible growth from dilute inocula. This
group includes M. tuberculosis, Mycobacterium bovis and Mycobacterium leprae, the
causative agents of human TB, bovine TB and leprosy, respectively. Modern molecular
biology techniques based on 16S rRNA have revealed the macro population structure of
mycobacteria (Gutierrez et al., 2005; Stahl & Urbance, 1990). The phylogenetic
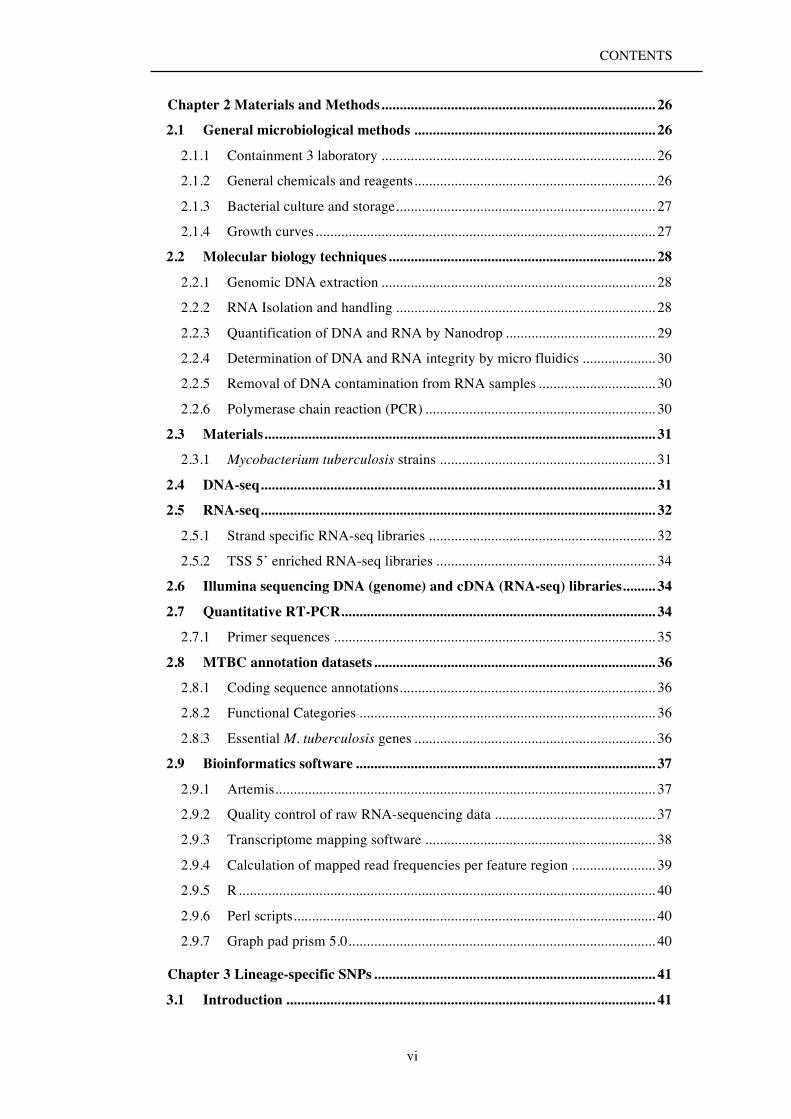
structure of mycobacteria based on this method is shown in Figure 1.1, and of note is the

1.1 The genus Mycobacterium
3
position of the MTBC together with the smooth tubercle bacilli, which includes
Mycobacterium canetti; it is hypothesised that it was an ancestral pool of smooth
tubercle-like bacilli from which the MTBC originated (Gutierrez et al., 2005; Supply et
al., 2013).
Figure 1.1. Phylogenetic structure of the genus Mycobacterium. The neighbor-
joining tree is based on 16S sequences from seventeen smooth mycobacterial and
MTBC strains. The blue triangle indicates the MTBC. Bootstrap support higher than
90% shown on nodes. Scale bar is pairwise distances after Jukes-Cantor correction.
Adapted from Gutierrez et al. (2005). Image reproduced under the Creative Commons
Attribution License (CCAL).

1.1 The genus Mycobacterium
4
1.1.2 The Mycobacterium tuberculosis complex (MTBC)
The MTBC is used as an umbrella term to group the closely related mycobacteria that
cause TB (Cole et al., 1998). Early sequencing of mycobacteria from the MTBC showed
that they share more than 99.9% sequence identity (Sreevatsan et al., 1997a), as
demonstrated by the collapsed branches in Figure 1.1 for the MTBC members.
However, despite this close relatedness, members of the MTBC display different
phenotypic characteristics and mammalian host ranges; as described above, MTBC
members M. tuberculosis and M. africanum are the primary cause of TB in humans.
The MTBC includes several other species and sub-species that are adapted to various
hosts, including both wild and domestic animal species; these bacterial variants have
been referred to as “ecotypes” (Smith et al., 2006b). Here an ecotype is used as the
definition of a set of strains using the same or similar ecological resources (Cohan,
2002). The host of M. bovis is largely cattle, which is of significant agricultural
significance due to the associated cost of bovine TB, estimated globally at $3 billion per
year (Garnier et al., 2003). M. bovis can also cause TB in humans through the
consumption of unpasteurised milk (de la Rua-Domenech, 2006; Grange, 2001).
Fortunately, modern food practices have effectively stopped this transmission route, and
person-to-person transmission of M. bovis is rare (Evans et al., 2007; Grange, 2001).
Other animal adapted pathogens include Mycobacterium microti (infects voles),
Mycobacterium caprae (infects sheep and goats) and Mycobacterium pinnipedii (infects
seals and sea lions). An MTBC pathogen of Dassies, or Rock Hyrax, has been isolated in
South Africa and named the Dassie bacillus (Parsons et al., 2008), whilst more recently
an MTBC pathogen of banded mongooses has been identified in Botswana named
Mycobacterium mungi (Alexander et al., 2010). It is anticipated that MTBC members of
other ecotypes will likely be identified in future studies.
A special member of the MTBC is M. canetti, a rare tubercle bacillus with an unusual
smooth colony phenotype, unlike the classical rough appearance of other MTBC
members (van Soolingen et al., 1997). M. canetti and the other smooth TB bacilli harbor
greater genetic diversity compared with the rest of the MTBC, and are more distantly
related to the remaining MTBC than any two other MTBC strains are to each other
(Gutierrez et al., 2005). M. canetti is subsequently a common choice as an outgroup in
phylogenetic analysis (Bentley et al., 2012; Comas et al., 2010). Horizontal
recombination events are another feature of the M. canetti genome (Supply et al., 2013),

1.1 The genus Mycobacterium
5
which is in stark contrast to the rest of the MTBC where no significant signs of
recombination are seen (Hirsh et al., 2004; Supply et al., 2003).
1.1.3 TB disease in humans
M. tuberculosis and M. africanum, which together make up the human adapted members
of the MTBC, are the etiological agents of TB in humans. TB infection in humans
broadly follows an established pattern of events. Briefly, infectious bacilli are spread
through droplet nuclei that can remain aerosolised for several hours. Following
inhalation of the droplets the bacteria are phagocytosed by the host’s alveolar
macrophages, which are then thought to invade the subtending epithelial layer of the
lung (Russell et al., 2010); the infectious dose is estimated to be as low as a single
bacterium. A primary site of infection is established, known as the Ghon focus, whereby
a localised inflammatory response leads to recruitment of mononuclear cells from the
neighboring blood vessels, which acts to provide fresh cells for the bacterial infection.
The subsequent lesion or granuloma, is a defining pathogenic feature of TB disease.
Initially consisting as a mass of macrophages, neutrophils and monocytes, the
granulomas eventually become stratified with recruitment of lymphocytes and develop a
centre that is rich in lipids. At this stage an equilibrium with the host immune system is
established in most individuals, which can persist from weeks to decades and is known
as latent TB infection. In this latent state the host is asymptomatic and noninfectious. It
is estimated that 95% of human-adapted MTBC infection follows this route into latency,
which is based on evidence of immunological sensitisation by mycobacterial proteins in
the absence of clinical signs and symptoms of active TB (Barry et al., 2009). In
individuals with active TB, either from disease progression, which occurs in about 5%
of cases, or from the reactivation of a latent infection estimated to occur in 10% over a
lifetime in HIV-negative individuals, the granuloma centre fills with caseous debris
including necrotic macrophages. This ultimately ruptures and releases thousands of
infectious bacilli into the lungs and respiratory airways (Kaplan et al., 2003). A
persistent productive cough develops, effectively aerosolising and spreading the bacilli
to new hosts, and it is this late stage of active TB that contributes to tissue damage and
pathogenesis. Bacilli can also escape into other tissues via the lymphatic blood system,
and this is known as miliary or extrapulmonary TB. Rapid progression to active TB
from an initial infection is higher in infants or immunocompromised persons, whilst
latent TB can be triggered by immunosuppression, of which the greatest identified cause
is HIV infection (Ho et al., 1995).
1.1 The genus Mycobacterium
6
1.1.4 Disease diversity
Although TB is clinically defined into active and latent TB forms, it is likely that this is
a gross oversimplification, with TB infection following a continuous spectrum, ranging
from sterilising immunity, subclinical active disease, and active disease (Barry et al.,
2009). Development of active disease is likely determined by multiple factors, including
the host genotype, environmental factors, and bacterial genetics. On the human genetics
side, SNPs have been identified that determine susceptibility of an individual to TB
using genome-wide linkage analysis (Bellamy et al., 2000). In addition to environmental
influences, strain variation in the MTBC is now also thought to play a role in the
outcome of TB infection and disease (Coscolla & Gagneux, 2010). The ability of the
MTBC strain to elicit an immune response was explored by Portevin et al. recently
using a monocyte-derived macrophage model to study the innate immune response to
twenty-eight diverse clinical MTBC strains (Portevin et al., 2011). It was shown that
macrophages infected with different strains differed in the levels of cytokines and
chemokines produced; infections by a group of strains that belong to the modern
phylogenetic lineages produced less pro-inflammatory cytokines compared with strains
from the ancient lineages (classification of modern and ancient lineages is discussed in
detail below in section 1.2.3). Moving into a clinical setting, it has been shown that over
the course of two years household contacts exposed to strains from the modern lineages
were more likely to develop active disease compared to strains from the ancient lineages
(de Jong et al., 2008). Taken together, Gagneux hypothesised that modern strains have
developed an evolutionary strategy of increased virulence and shorter latency, possibly
through adaptation to expanding human population sizes over the past few hundred
years which have provided more hosts for the MTBC pathogen (Gagneux, 2012). In
summary, it is likely that multiple factors play an important role in disease, with a
complex interaction between the host, pathogen and environment (Comas & Gagneux,
2009). This study focuses on the pathogen side, and the following section introduces the
genetic diversity and lineages of the MTBC.

1.2 Genetic diveristy in the MTBC
7
1.2 Genetic diversity in the MTBC
1.2.1 General features of the M. tuberculosis genome
A seminal moment in mycobacterial research was the genome sequencing of the first
strain of M. tuberculosis in 1998 (Cole et al., 1998). A canonical strain of TB research,
M. tuberculosis H37Rv was chosen in 1993 to be the first MTBC strain sequenced, and
the genome was closed and finished over the next five years. It was shown that the
single circular chromosome was 4,411,532 bp in length and consists of just over 4,000
protein coding genes. The annotated genome opened new insights into the biology and
metabolism of the pathogen, with identification of large protein families related to fatty
acid and polyketide biosynthesis, regulation, drug efflux pumps and transporters, and
PE_PGRS proteins. PE_PGRS are a large duplicated family unique to the MTBC.
The genome is rich in repetitive DNA, such as IS6110 insertion sequences, and in
multigene families and duplicated housekeeping genes (Cole et al., 1998). Sixteen
copies of the IS6110 sequence and six copies of the more stable element IS1081 were
found to reside within the genome of H37Rv. Due to the variable number of IS6110
elements in strains these were utilised in a DNA fingerprinting protocol which quickly
evolved into the first international gold standard for genotyping of MTBC (van Embden
et al., 1993). Typing of the MTBC in the context of strain diversity is discussed in the
following section.
1.2.2 Typing the MTBC
Members of the MTBC are considered genetically monomorphic with a high level of
genomic sequence similarity and negligible horizontal gene transfer (Hirsh et al., 2004;
Liu et al., 2006). As such, the MTBC displays a classic clonal population structure and
evolves by descent (Achtman, 2008), which leads to the situation whereby mutations in
the parental strain become defining markers for the rest of the progeny. Together, this
creates a situation where many genotyping tools useful in other species do not transfer to
the MTBC effectively (Achtman, 2008; Comas et al., 2009). Development of tools to
measure genetic variation in the MTBC was the start of generating a robust framework
needed firstly to measure the amount of genetic variation in strains, before secondary
questions, such as the effect of strain variation in TB disease could be asked. Before

1.2 Genetic diveristy in the MTBC
8
discussing the lineages of the MTBC it is first necessary to introduce a brief history of
typing the MTBC and the evolution of such tools to measure genetic diversity in a
robust and definitive manner.
As introduced above, the early 1990s saw the establishment of IS6110 restriction
fragment length polymorphism (RFLP) typing as the gold standard of the MTBC typing
(van Embden et al., 1993). The method is based on strain differences in the IS6110 copy
numbers, ranging from 0 to about 25, as well as the variability in the chromosomal
positions of the insertion sequences. Large collections were subsequently typed and the
first families of strains with a common genotype were uncovered in the MTBC (Van
Soolingen, 2001). It was found that some strains were at a higher frequency and across a
wider geographic area, suggesting differential success rates in terms of infection and
geographical spread (Van Soolingen, 2001). Although non-sequence based tools
including the above RFLP technique, and other methods such as Pulsed-Field Gel
Electrophoresis (PFGE) are useful for typing of monomorphic bacteria at the fine scale,
they have many drawbacks, including problems of reproducibility between laboratories
(Achtman, 2008).
Development of sequence based tools such as spoligotyping and MIRU-VNTR have
largely replaced RFLP typing, and are currently the official gold standards for
epidemiological typing of the MTBC (Supply et al., 2001). Spoligotyping is the
mycobacterial name given to the clustered regularly interspaced short palindromic
repeats (CRISPR) typing method, which is based on counting unique spacer regions
between a series of direct repeats in the M. tuberculosis genome (Grissa et al., 2008).
The second method, MIRU-VNTR or mycobacterial interspersed repetitive units
variable number tandem repeats, classifies strains by comparison of strain-specific
numbers of repeats of short DNA sequences at various genomic positions (Lindstedt,
2005). Databases have been built around the results of typing tens of thousands of
patient isolates with these methods, such as SpolDB4 (Brudey et al., 2006) and MIRU-
VNTR plus (Weniger et al., 2010). Although spoligotyping and MIRU-VNTR have
been invaluable from an epidemiological view, the application of such tools to study
evolutionary questions is not ideal as they are susceptible to convergent evolution.
Convergent evolution describes the identification of the same genotype in two strains
that is not due to descent, and this impacts the robustness of derived phylogenies
(Comas et al., 2009). This scenario arises due to the limited number of loci that the
methods are based on. In a study by Comas et al. it was found that phylogenies built

1.2 Genetic diveristy in the MTBC
9
using either method had low discriminatory power and were incongruent compared to
those based on a recent SNP based typing method (Comas et al., 2009). It was therefore
argued that for evolutionary studies the MTBC should be typed using robust SNP or
large sequence polymorphisms (LSPs) markers (Comas et al., 2009).
Typing the MTBC by LSP or gene deletions exploits the absence of horizontal gene
transfer in the MTBC, making each deletion event unique and so robust informative
phylogenetic markers. Whilst LSPs have been used to resolve the main lineages of the
MTBC (Gagneux et al., 2006a; Reed et al., 2009), deletions are less abundant that SNPs
and were also largely based on deletions found in the reference strain H37Rv, making
SNPs the best choice for sampling MTBC diversity. To date numerous studies have
utilised SNP markers to classify strains and explore the evolutionary history of the
MTBC (Baker et al., 2004; Comas et al., 2010; Gagneux & Small, 2007; Hershberg et
al., 2008). However, SNP analyses can also suffer from the same problems as previous
studies based on LSPs, such as using SNPs based on prior information, which can
introduce a discovery bias, or through simply using a non-representative set of strains. In
2008, Hershberg et al. used de novo sequencing of multiple genes from 108 global
MTBC strains to identify novel SNPs and constructed the most complete phylogenetic
tree of the MTBC (Hershberg et al., 2008). Subsequent whole genome sequencing of a
smaller set of strains in 2010 has defined the MTBC lineages at the highest possible
resolution, the single nucleotide level (Comas et al., 2010).
1.2.3 The phylogenetic lineages of the MTBC
The global populations structure of the MTBC is defined by six main phylogenetic
lineages, named Lineage 1 to 6 (Comas et al., 2010), although these have also been
described by their geographic distribution and other naming schemes in previous studies
(Filliol et al., 2003; Gagneux et al., 2006a; Hershberg et al., 2008). The largest
phylogeny of global MTBC diversity is shown in Figure 1.2. Lineages are coloured
based on previous deletion analysis in a global set of strains (Gagneux et al., 2006a), and
the same colouring scheme is continued throughout this thesis. The phylogeny is based
on a multi locus sequencing analysis (MLSA) of SNPs identified from the sequencing of
89 genes in 108 MTBC strains (Hershberg et al., 2008). The MLSA also included seven
animal-adapted strains, which were shown to all cluster within one of the M. africanum
lineages (Lineage 6). Of special note is the Beijing sub-lineage of Lineage 2, which is of
interest in the context of association with multidrug resistance and recent expansion

1.2 Genetic diveristy in the MTBC
10
(Borrell & Gagneux, 2009); this is discussed further in section 1.3.2. In addition to
strains clustering into six main lineages, two major groupings were observed, the
“ancient” and “modern” lineages (Figure 1.2). Lineage 1 and the two M. africanum
lineages are referred to as ancient as they branched off from a common ancestor at an
early stage of evolution, whilst the remaining three modern lineages diverged at a later
time point (Lineage 2, 3, and 4). Previously, studies have classified MTBC strains into
two groups based on the presence of a single genomic deletion known as TbD1 (Brosch
et al., 2002), but here it was demonstrated this separation is more than a single deletion
(Hershberg et al., 2008). TbD1 is in the relatively long branch prior to the separation of
Lineages 2, 3 and 4 shown in Figure 1.2, thus representing more genetic variation
between the ancient and modern lineages than had been suggested by TbD1. As
mentioned previously, recently a rare seventh MTBC lineage was identified, and this has
a phylogenetic location that is between the ancient and modern lineages in Figure 1.2,
although the Lineage 7 branch point is before TbD1 (Firdessa et al., 2013); Lineage 7
was published in March 2013 and therefore is not discussed further in this thesis.
Strains used in the MLSA study were derived from a global collection of 875 strains
from 80 countries that were previously characterised by genome wide deletion analysis
(Gagneux et al., 2006a), and represent the broadest sample of genetic and geographic
MTBC diversity to date. In the study by Gagneux et al. and following analyses, it was
found that the MTBC diversity is highly geographically structured (Gagneux et al.,
2006a; Hershberg et al., 2008). This is shown in Figure 1.3, where for example Lineage
4 is the dominant lineage in terms of geographical spread across the continents of
Europe, America and Africa, whilst Lineage 2 is predominantly found in East Asia.

1.2 Genetic diveristy in the MTBC
11
Figure 1.2. The most complete phylogeny of the human adapted MTBC. Maximum
Parsimony phylogeny of MTBC built using 89 concatenated gene sequences in 108
strains. The branches are colored according to the main lineages defined previously
based on LSP deletion analysis (Gagneux et al., 2006a). Although not part of this study,
the animal strains were part of the previous MLSA study and shown here for reference.
Adapted from Hershberg et al. (2008). Image reproduced under the Creative Commons
Attribution License (CCAL).
Lineage 1
Lineage 5
Lineage 3
Lineage 2
Lineage 4
Lineage 6
The Philippines
Rim of Indian Ocean
M. africanum (West Africa 1)
M. africanum (West Africa 2)
India, East Africa
Beijing
East Asia
Europe, America, Africa
Ancient lineages
Modern lineages

1.2 Genetic diveristy in the MTBC
12
Figure 1.3. Distribution of the MTBC lineages globally. The six lineages display a
strong geographic structure, with each dot representing the dominant lineage in each of
the 80 countries represented in the strain collection. Adapted from Gagneux et al.
(2006a) and Hershberg et al. (2008). Image reproduced under the CCAL.
sequenced for each strain [26], has been used very successfully todefine the genetic population structure of many bacterial species[27]. Because of the low degree of sequence polymorphisms inMTBC, however, standard MLST is uninformative [28]. A recentstudy of MTBC extended the traditional MLST scheme bysequencing 89 complete genes in 108 strains, covering 1.5% of thegenome of each strain [29]. Phylogenetic analysis of this extendedmultilocus sequence dataset resulted in a tree that was highlycongruent with that generated previously using LSPs (Figure 3).The new sequence-based data also revealed that the MTBCstrains that are adapted to various animal species represent just asubset of the global genetic diversity of MTBC that affects differenthuman populations [29]. Furthermore, by comparing thegeographical distribution of various human MTBC strains withtheir position on the phylogenetic tree, it became evident thatMTBC most likely originated in Africa and that human MTBCoriginally spread out of Africa together with ancient humanmigrations along land routes. This view is further supported by thefact that the so-called ‘‘smooth tubercle bacilli,’’ which are theclosest relatives of the human MTBC, are highly restricted to EastAfrica [30]. The multilocus sequence data reported by Hershberget al. [29] further suggested a scenario in which the three‘‘modern’’ lineages of MTBC (purple, blue, and red in Figure 3)seeded Eurasia, which experienced dramatic human populationexpansion in more recent times. These three lineages then spreadglobally out of Europe, India, and China, respectively, accompa-nying waves of colonization, trade and conquest. In contrast to theancient human migrations, however, this more recent dispersal ofhuman MTBC occurred primarily along water routes [29].The availability of comprehensive DNA sequence data has also
allowed researchers to address questions about the molecular
evolution of MTBC. In-depth population genetic analyses byHershberg et al. highlight the fact that purifying selection againstslightly deleterious mutations in this organism is strongly reducedcompared to other bacteria [29]. As a consequence, nonsynon-ymous SNPs tend to accumulate in MTBC, leading to a high ratioof nonsynonymous to synonymous mutations (also known as dN/dS). The authors hypothesized that the high dN/dS in MTBCcompared to most other bacteria might indicate increased randomgenetic drift associated with serial population bottlenecks duringpast human migrations and patient-to-patient transmission. Ifconfirmed, this would indicate that ‘‘chance,’’ not just naturalselection, has been driving the evolution of MTBC. Although thesekinds of fundamental evolutionary questions are often underap-preciated by clinicians and biomedical researchers, studying theevolution of a pathogen ultimately allows for better epidemiolog-ical predictions by contributing to our understanding of basicbiology, particularly with respect to antibiotic resistance.
A Vision for the FutureThanks to recent increases in research funding for TB [4],
substantial progress has been made in our understanding of the basicbiology and epidemiology of the disease. Unfortunately, this increasedknowledge has not yet had any noticeable impact on the currentglobal trends of TB (Figure 1). While TB incidence appears to havestabilized in many countries, the total number of cases is still increasingas a function of global human population growth [1]. Of particularconcern are the ongoing epidemics of multidrug-resistant TB [31], aswell as the synergies between TB and the ongoing epidemics of HIV/AIDS and other comorbidities such as diabetes (Box 1).As our understanding of TB improves, we would like to be able
to make better predictions about the future trajectory of the
Figure 2. Global distribution of the six main lineages of human MTBC. Each dot represents the most frequent lineage(s) circulating in acountry. Colours correspond to the lineages defined in Figure 3 (adapted from [20]).doi:10.1371/journal.ppat.1000600.g002
PLoS Pathogens | www.plospathogens.org 3 October 2009 | Volume 5 | Issue 10 | e1000600

1.2 Genetic diveristy in the MTBC
13
1.2.4 Origin of the MTBC
Early dating of the MTBC ranged from 15,000-20,000 years ago, where it was
hypothesised that animal domestication was the cause of TB in humans during the
Neolithic transition (Sreevatsan et al., 1997a). But more recent estimates place the
MTBC at 70,000 or more years old, linked with early human migrations out of Africa
(Hershberg et al., 2008). It is interesting that the continent that harbours the greatest
MTBC genetic diversity is Africa, with all six lineages represented (Figure 1.3). Based
on the MLSA data by Hershberg et al., it was postulated that the MTBC originated in
Africa and accompanied the Out-of-Africa migrations of modern humans approximately
70,000 years ago (Hershberg et al., 2008). In this evolutionary model it is suggested that
the two ancient M. africanum lineages (Lineage 5 and 6) remained in Africa, whilst the
other lineages spread with human migrations into Eurasia, with the three modern MTBC
lineages seeding Europe, India and China. Recent expansions in human population over
the last few centuries led to the rapid expansion of these modern lineages (Gagneux,
2012). In 2010, Comas et al. generated the first whole-genome global phylogeny of
human adapted MTBC (Comas et al., 2010). This phylogeny resolved the lineages at
much greater resolution than previous analyses, and demonstrated that the two M.
africanum lineages are the most basal. These two lineages are exclusively found in West
Africa (de Jong et al., 2010), and whilst the reason for this is unknown, this evidence
further supports the model that the MTBC originated in Africa (Gagneux, 2012;
Hershberg et al., 2008)
1.2.5 Selective pressures acting within the MTBC
Genetic diversity is introduced and fixed into populations by the four primary
evolutionary forces – mutation, natural selection, genetic drift and gene flow (Robinson
et al., 2010a). Mutation is a stochastic process affecting DNA regardless of function, but
only those mutations that ‘survive’ the processes of genetic drift and selection will be
detected in the genome. Genetic drift is a change in allele frequency over time due to
random sampling over the course of multiple generations. Importantly, it is dependent
on effective population size; smaller sizes are more strongly affected by genetic drift
than larger populations. In contrast, natural selection is a non random process and
determined by the differential survival of genetic variant within a population (Robinson
et al., 2010a). Finally, gene flow in the form of horizontal gene transfer (HGT) or
recombination can shuffle mutations and introduce new genetic information into
1.2 Genetic diveristy in the MTBC
14
populations. Importantly, while mycobacterial species display gene flow, it has not been
detectable in the MTBC (Hirsh et al., 2004; Supply et al., 2003), thus leaving the three
former evolutionary forces acting within the MTBC. Mutation, selection and drift are
intrinsically interdependent, and Hershberg et al. used the MLSA dataset to explore the
evolutionary forces that might have shaped the MTBC genetic diversity (Hershberg et
al., 2008). Comparison of nonsynonymous SNPs (which cause an amino acid change) to
synonymous SNPs (no amino acid change) can provide a measure of the selective
pressures acting within a sequence. This is expressed as the dN/dS ratio, whereby the
ratio of nonsynonymous SNPs to potential nonsynonymous SNPs (dN) is divided by the
respective synonymous ratio (dS); a ratio of near unity indicates the absence of
selection, whilst the ratio increases under positive selection, and decreases under
purifying selection (Rocha et al., 2006). Positive selection describes the process of
certain alleles increasing in frequency due to a greater fitness than others, whilst
purifying selection purges deleterious alleles, likely generated by nonsynonymous SNPs,
from the population. Applied to the MLSA it was found that 62% of the SNPs were
nonsynonymous and 38% synonymous, corresponding to a dN/dS ratio of 0.57. To put
this in context, the dN/dS ratio for M. canetti, the outlying member of the MTBC was
0.18, and in two sequenced Mycobacterium avium strains the dN/dS was 0.17 (see
phylogeny in Figure 1.1). Similar ratios were observed across all other Actinobacteria,
hence the dN/dS seen in the MTBC is markedly high compared to other mycobacteria. It
was concluded that in the MTBC purifying selection is strongly reduced.
The consequence of reduced purifying selection in the MTBC was examined at the level
of conservation of amino acid positions in the 89 genes sequenced across the MTBC
strains. Orthologs were found for 62 genes in mycobacteria distantly related to the
MTBC strains, and using a multiple sequence alignment of these genes the amino acids
were divided into either conserved or variable positions. This categorised 64% of the
amino acids positions in mycobacteria into conserved positions, and 36% into variable.
Mutations within conserved positions are more likely to have a functional effect than at
variable positions. Nonsynonymous changes in M. canetti predominantly fell into
variable positions (72%), but the majority (58%) of amino acid mutations in MTBC fell
into the conserved positions. This percentage was not dissimilar from that expected if
purifying selection in MTBC was no longer making a distinction among mutations in
these two classes of sites (Hershberg et al., 2008).

1.3 Phenotypic diveristy
15
1.3 Phenotypic diversity
Whilst the outcome of human tuberculosis infection and resulting disease is highly
variable and has been attributed to many factors including host and environmental
variables, the impact of bacterial strain variation on the clinical outcome of human
infection by MTBC remains an open question. At the level of phenotypic diversity, a
number of studies have explored the phenotypic differences between specific strains.
Many of the earlier studies were based on a small set of canonical laboratory reference
strains, whilst later studies moved into the use of clinical strains, increasingly informed
by the phylogenetic structure of the MTBC. The former studies shall be discussed first
in the next subsection, and then moving onto a discussion of clinical strain phenotypes.
1.3.1 Laboratory strains
As introduced above, many early studies were based on a few characterised reference
strains, namely the laboratory strains H37Rv, H37Ra, Erdman and the vaccine strain M.
bovis BCG reviewed in Coscolla & Gagneux (2010). In addition to these strains, two
additional reference clinical strains CDC1551 and HN878, isolated from TB outbreaks
in Tennessee and Texas respectively, have also been used (Jones et al., 1999; Valway et
al., 1998). From a phylogenetic context these stains are not representative of MTBC
diversity, with H37Rv, H37Ra, Erdman and CDC1551 all from Lineage 4, whilst
HN878 is part of the Beijing subgroup of Lineage 2 (Figure 1.2).
One of the clear differences in strain phenotype compared to the above laboratory and
clinical reference strains is from strain HN878 in infections. HN878 is consistently
associated with low inflammatory response and increased virulence in both in vitro
macrophage studies and in vivo animal models compared to the other laboratory stains
(Manca et al., 1999; Manca et al., 2001; Manca et al., 2005). In a mouse challenge study
using several clinical strains, it was found that HN878 was hypervirulent, causing
unusually early death of infected immune-competent mice (Manca et al., 2001).
Hypervirulence of HN878 was suggested to be due the failure of this strain to stimulate
Th1 type immunity for control of M. tuberculosis infection (Manca et al., 2001).
All studies that utilise laboratory strains suffer from the same issue of strain adaptation
to laboratory conditions. This mechanism was exploited to create the laboratory strain

1.3 Phenotypic diveristy
16
H37Ra, an avirulent M. tuberculosis strain that was generated by culturing H37, the
parental strain of H37Rv, on solid egg medium and selecting for resistance to lysis
(Steenken, 1935). This phenomenon can also affect clinical strains but can be managed
through minimal handling and passaging of cells, thereby limiting the number of
generations and potential for mutation. Adaptation can lead to changes in the virulence
of the strain, such as the loss of phthiocerol dimycocerosate (PDIM) from strain H37Rv
grown in vitro. PDIM is a wax-like compound and an important cell wall lipid
associated with mycobacterial virulence (Domenech & Reed, 2009). The other
laboratory strain, H37Ra, does not synthesise a number of cell surface antigens,
including sulfolipid-1, trehalose mycolates, as well as PDIM (Chesne-Seck et al., 2008).
As H37Rv and other laboratory strains have been passaged for many decades outside of
the human host (Ioerger et al., 2010), their relevance in studies of infection and
virulence is debatable. This is further underscored by the genomic diversity seen in
strains of H37Rv, which has been grown in numerous laboratories throughout the world
effectively in an unintentional in vitro evolution experiment, resulting in their separation
by multiple SNPs and frameshift insertion and deletions (indels) (Ioerger et al., 2010).
1.3.2 Clinical strain phenotype
Whilst there is currently little evidence of common phenotypic differences at the lineage
level, multiple phenotypes have been identified in nearly forty studies investigating the
virulence and immunological characteristics of clinical strains (Coscolla & Gagneux,
2010). One consistent phenotype is the lower induction of proinflammatory cytokines by
the Beijing sub-lineage of Lineage 2 (Figure 1.2) compared to H37Rv and other strains.
This group of strains is so described as they are endemic in many parts of East Asia, and
account for the majority of cases of TB in these regions (Qian et al., 1999); they have
also been described as the W-Beijing family of strains (Glynn et al., 2002). The Beijing
group has subsequently become the focus of numerous studies owing to its recent spread
in human populations (Cowley et al., 2008), and association with multidrug resistance
(Borrell & Gagneux, 2009). Whilst the characteristics that predispose this family of
strains to such clinical outcomes have not been fully resolved, Reed et al. (2007) showed
that Beijing strains accumulate large quantities of triglycerides in in vitro aerobic
culture, and that this was linked to the constitutive over expression of genes that are
members of the DosR-controlled regulon. DosR is induced during conditions that are
likely to occur during latent infection, such as by nitric oxide and low oxygen tension
and is thought to contribute to bacterial persistence (Kumar et al., 2007). One

1.4 Linking genotype to phenotype
17
consequence of this constitutive expression is the observed accumulation of large
quantities of triglycerides during in vitro aerobic culture conditions in contrast to non-
Beijing strains. The authors hypothesise that the triglycerides provide an adaptive
advantage to the Beijing strain family by acting as an energy source during infection
(Reed et al., 2007), which would represent the first example of an in vitro phenotypic
characteristic shared at the MTBC strain sub-lineage level (Nicol & Wilkinson, 2008).
From a clinical perspective, early studies of MTBC strain variation found that strains
from South India were less virulent and had increased susceptibility to oxidative stress
compared to strains from Great Britain (Mitchison et al., 1960; Mitchison et al., 1963).
Although these strains were not genotyped at the time, it can be speculated using the
current knowledge MTBC phylogeography that this represents a divide between Lineage
1 (Indo-Oceanic) and Lineage 4 strains (Coscolla & Gagneux, 2010). Another example
of differences between MTBC strains detected at the clinical level is Lineage 2, which
has been associated with extra pulmonary (Kong et al., 2007) and menigeal TB (Caws et
al., 2008) compared to strains from other lineages. Several studies have also associated
Lineage 2 with HIV coinfection (Caws et al., 2006), but the experimental phenotype is
not clear and has been contested in other studies which found no significant associations
(de Jong et al., 2009). In summary, the extent to which clinical MTBC phenotypes are
shared by strains belonging to broader phylogenetic lineages is largely unknown, but
this may reflect the previous paucity of research in this area (Nicol & Wilkinson, 2008).
In the context of increasing evidence that the amount of sequence variation in MTBC
has been underestimated, genetic diversity may have important phenotypic
consequences, including an impact on areas such as drug and vaccine design (Gagneux
& Small, 2007).
1.4 Linking genotype to phenotype
The first step towards understanding the influence of genetic diversity in the MTBC on
TB infection is to understand the molecular mechanisms that link strain diversity to
phenotype. This is a challenging area of research and there are few examples of such
studies for the MTBC. The previously described study by Reed et al. linked the
accumulation of triacylglycerides to the constitutive over-expression of the DosR
regulon (Reed et al., 2007). This has recently been partially associated with a 350 kb
genomic duplication that is present in some strains from the Lineage 2 (Domenech et al.,
2010). A second example is a link between the hypervirulence of some Lineage 2 strains

1.4 Linking genotype to phenotype
18
to the production of the immune modulatory phenolic glycolipid (PGL). It was found
that the laboratory strain H37Rv and other members of Lineage 4 do not produce PGL
due to a seven base pair frameshift deletion in the pks1/15 gene cluster; this encodes a
polyketide synthase involved in the production of PGL (Constant et al., 2002). If
pks1/15 is disrupted in the Lineage 2 laboratory strain HN878, then the
hypoinflammatory and hypervirulent phenotype is lost (Reed et al., 2004). However,
this phenotype is more complex than simply the presence of an intact pks1/15. Insertion
of an intact pks1/15 into the lineage 4 H37Rv laboratory strain did not result in increased
virulence (Sinsimer et al., 2008), thus demonstrating the importance of taking into
account the lineage genetic background of the strain in question.
With the advent of advances in sequencing technology, the number of MTBC strains
sequenced and associated number of SNPs identified is rapidly increasing (Stucki &
Gagneux, 2012). Shown in Figure 1.4 is the number of MTBC genome sequences within
the NCBI Short Read Archive (SRA), which is a repository for all next-generation
genome sequencing data, and currently stands at 4,913 MTBC genome sequences. SNPs
are the most common form of genetic variation in MTBC, followed by insertions and
deletions (indels), and a total of 9,037 SNPs were discovered by sequencing twenty-one
clinical strains of MTBC (Comas et al., 2010). Whilst this presents an opportunity to
understand the impact of such SNPs, there are also considerable challenges due to the
shear number of SNPs identified, which will only grow in size with the associated
increase in comparative genome sequencing studies.
Figure 1.4. The number of MTBC genome sequences in the NCBI Short Read
Archive (SRA). The database was queried on 21-02-2013 using the search term
Mycobacterium tuberculosis complex. The year 2013 is not complete and only
representative of nearly the first two months of the year.
2008 2009 2010 2011 2012 20130
1000
2000
3000
4000
5000
Year
Num
ber o
f gen
omes
in
NC
BI S
RA
1355
1799
46754913
0

1.4 Linking genotype to phenotype
19
1.4.1 In silico prediction of functional SNPs
Whilst identifying SNPs in bacterial genomics studies is becoming relatively simple
through whole genome sequencing using one of the second-generation technologies
(Loman et al., 2012), understanding the effects of sequence variations has become a
major effort in mutation research (Thusberg & Vihinen, 2009). Experimental study of
the molecular effects of all MTBC SNPs identified in recent studies, such as those found
in the above twenty-one genome study, is unfeasible. The development of computational
methods to screen for SNPs likely to have a functional effect from those that are neutral
has therefore been a highly active field within bioinformatics, and a number of
computational tools have been created for this purpose (Bao & Cui, 2005; Cingolani et
al., 2012; Ng & Henikoff, 2006). From here on, the term functional SNP is used to refer
to those SNPs that are expected to alter gene expression or function, and therefore
associated with a phenotype. Use of such methods to predict functional SNPs can help
prioritise additional research on those SNPs more likely to affect protein function.
Methods that predict whether a SNP has a functional effect use either sequence or
structural information, or a combination of both to form the prediction. Such methods
rely on the evidence that mutations which effect protein function tend to occur at
evolutionary conserved positions, or are buried in the interior of the protein structure
(Ng & Henikoff, 2006). Predictions based on sequence information typically follow a
common procedure, as implemented by Ng & Henikoff in their SIFT prediction
algorithm (Ng & Henikoff, 2003). Firstly an input sequence is used in a database search
for homologous sequences. These are used to create a multiple sequence alignment,
which identifies the evolutionary conserved positions, and these are inferred to be
important for function. A scoring method based on the frequency of each amino acid at
each position, and the severity of an amino acid change is then used for each position in
the input sequence. The introduction of an amino acid that does not appear in the
specific amino acid position can still be classified neutral and not functional as
predictions also use the physiochemical properties of the amino acids already present in
the alignment. For example, if a position in an alignment contains the hydrophobic
amino acids isoleucine, leucine and valine, then this position can likely only contain
hydrophobic amino acids, and changes to other hydrophobic amino acids, such as
methionine, will likely not have a functional effect (Ng & Henikoff, 2003; Ng &
Henikoff, 2006).

1.4 Linking genotype to phenotype
20
1.4.2 Gene expression diversity
After the genome sequence of the first M. tuberculosis strain was published in 1998
(Cole et al., 1998), and the extent of genetic diversity was beginning to be uncovered
(Comas et al., 2010; Hershberg et al., 2008), the next logical step in understanding the
consequences of such genetic diversity is to build upwards from the genomic
information layer. Uncovering the complexity of phenotypic differences in the MTBC
likely requires the integration of multiple layers of biological information (Comas &
Gagneux, 2009), and moving from the DNA to RNA level to explore MTBC
transcriptional diversity is discussed in the following section.
In the first systematic survey of variation in mRNA expression, Gao et al. compared the
gene expression of ten clinical isolates of M. tuberculosis in additional to the reference
strains H37Rv and H37Ra (Gao et al., 2005). All isolates were grown in vitro and under
exponential growth conditions. The authors found that 527 (15%) of the genes tested
were variable amongst the isolates, highlighting for the first time strain-to-strain
variability in expression under identical growth conditions. Combined with gene
function information, it was found that variable genes were statistically over-represented
by genes involved in lipid metabolism; it was speculated that this could have
implications in virulence, as lipid and lipid metabolism is thought to have an important
role in host pathogen interactions (Barry, 2001; Forrellad et al., 2012; Reed et al., 2004).
A further 16% of genes represented those consistently expressed, and as might be
expected it was found that this class was over-represented by those found in the
information pathways class; this class consists of genes associated with replication,
transcription and translation (Lew et al., 2011), and are consequently highly expressed
in actively growing bacteria. Approximately two-thirds of the remaining genes in the
study were equally split between low or undetectable and unexpressed classes. Many of
these genes included those that were classed as unknown hypotheticals, and so could
represent incorrect annotation of coding regions, or alternatively discovery bias through
the use of only one culture condition (Gao et al., 2005). Overall the study identified
transcriptional variation amongst a set of clinical isolates, with implications in the
choice of drug targets for vaccine development and diagnostic markers. The study
predates the robust classification of the phylogenetic lineages of the MTBC (Gagneux et
al., 2006a), and so limits the use of the results in a phylogenetic context.
1.4 Linking genotype to phenotype
21
More recently, a study of transcriptional variation amongst clinical isolates of the
MTBC has been undertaken within a phylogenetic framework using microarray
technology (Homolka et al., 2010). The authors included fifteen clinical strains from
four MTBC lineages (Lineages 1, 2, 4 and 6), plus the reference strains H37Rv and
CDC1551, which are part of Lineage 4. Under in vitro exponential growth conditions
the authors identified 364 genes (9.1% of all annotated genes) differentially expressed
between strains of different lineages in at least one pairwise comparison. Several
genotypic signals were identified, such as the dysregulation of virS-mymA operon in
Lineage 1, thought to be involved in maintenance of the cell wall structure (Singh et al.,
2003), and over-expression of the dosR two component regulator in the Beijing strains,
which controls the DosR regulon and described in section 1.3.2. Analyses were extended
to the transcriptional response of intracellular bacilli before and after infection of resting
and activated murine macrophages. Apart from identifying the core universal induction
or repression of 280 genes (7.0%) in all strains regardless of state compared to in vitro
expression, a proportion of genes (293 genes; 7.3%) displayed significant genotypic
patterns in response to the intracellular conditions in the macrophage (Homolka et al.,
2010). This study currently represents the most comprehensive survey of human-
adapted MTBC transcriptional diversity in gene expression. The presence of genotypic
signals implicates the effect of the underlying genotypic diversity, driven by large
deletions, indels, and coding and noncoding SNPs, although this was not explored in the
study.
In 2007, the global transcriptional differences between a strain of M. bovis and the
reference strain H37Rv was investigated by microarray (Golby et al., 2007). This study
provides a useful comparison from the perspective of a human-adapted strain and M.
bovis, which whilst it can be sustained in humans, is regarded as primary pathogen of
wild and domesticated animals (as discussed in section 1.1.2). Under nutrient limited
conditions and in steady state growth, it was found that 92 genes (2.3%) had 3-fold
differential expression. Genes showing higher expression were equally split between the
two strains. Focusing again on the major gene functional categories, a large proportion
of differentially expressed genes encoded proteins involved in the cell wall, lipid
metabolism, gene regulators, the PE/PPE protein family, and toxin–antitoxin (TA) gene
pairs.
The growing understanding that regulatory processes are often mediated by RNA
molecules beyond the classical view of protein based regulation was combined with
1.4 Linking genotype to phenotype
22
advances in sequencing technology to uncover the total transcriptome of M. tuberculosis
by RNA-sequencing (RNA-seq) (Arnvig et al., 2011). The RNA-seq method is
discussed in the following section (1.4.3). All RNA molecules from in vitro exponential
and stationary phase cultures of M. tuberculosis strain H37Rv were sequenced, and it
was found that more than a quarter of all sequence reads mapped to intergenic regions;
this excluded the highly expressed ribosomal RNAs involved in protein synthesis.
Accounting for the size of the intergenic regions based on the H37Rv genome size, this
represented a 2-fold higher density of noncoding RNA expression compared to gene
expression (mRNA transcription). The non-coding RNA ranged from 5’ and 3’
untranslated regions (UTRs), antisense transcripts, and intergenic small RNA (sRNA)
molecules. Although based on the reference strain H37Rv, the work provides an
important benchmark for future studies of transcriptional diversity in MTBC strains,
demonstrating the significant quantity of RNA expression that had not been detectable in
previous microarray based studies.
1.4.3 High-throughput DNA sequencing technology
Our awareness of greater levels of genetic diversity in the MTBC has been largely
driven by technology changes in sequencing, and next-generation high-throughput DNA
sequencing is likely to play an important role in improving our understanding of TB
(Loman et al., 2012); whilst this technology is often described as next-generation
sequencing, this term is likely to become less useful as the technology advances by
further generations. As introduced earlier, in 2010 Comas et al. sequenced twenty-one
representative clinical MTBC strains, and this was performed using Illumina sequencing
by synthesis technology (Comas et al., 2010; Loman et al., 2012). This genome set has
since become an ideal basis on which to perform later phylogenetic studies employing
ever increasing numbers of MTBC strains (Bentley et al., 2012). This section briefly
introduces the technology, focusing specifically on the methods used in this thesis,
namely genome and RNA-sequencing using the Illumina sequencing platform.
Recent advances in DNA sequencing technologies have enabled the determination of
nucleotide sequence at a greater data throughput, a shorter amount of time and at lower
cost than was previously possible using capillary-based Sanger sequencing (Shendure &
Ji, 2008). Several novel approaches have been developed including 454
(pyrosequencing) and Illumina sequencing, previously known as Solexa sequencing.
The Illumina system was established at NIMR in 2010, initially by an Illumina Genome

1.4 Linking genotype to phenotype
23
Analyser IIx sequencer (GA), and later on by the Illumina HiSeq2000 (HS); the HS
sequencer was the result of technical developments and has five times greater data
output than older GA sequencer (Loman et al., 2012). The Illumina method involves
sequencing millions of short reads, initially 36bp but more recently ~100bp, using a
flowcell based system for capturing DNA. It is the flowcell in which the sequencing
reactions take place, which is divided into eight lanes, and therefore up to eight different
samples can be added. This limitation of sample number has been removed by recent
multiplexing technology, which utilises sequence tags to track each sample and therefore
increases the number of individual samples added to each flowcell lane (Meyer &
Kircher, 2010).
Briefly, there are three broad stages in the generation of sequence data: library
preparation, amplification and sequencing. Libraries are initially constructed by one of
several methods that generate a mixture of DNA fragments with ligated adaptor
sequences up to several hundred bp in length. These are amplified using PCR primers
attached to a flowcell, resulting in the physical clustering of the DNA templates across
the flowcell, creating a lawn of sequence fragments (Shendure & Ji, 2008). This is
followed by sequencing, consisting of multiple cycles of single base extensions using
fluorescently labeled reversible terminator nucleotides and imaging to detect which base
has been incorporated, thereby determining the base in the sequence (Bentley et al.,
2008). At the end of each cycle the labeled nucleotide is cleaved and another round of
terminators is added; the number of cycles therefore determines the length of the reads
generated.
The Illumina sequencing platform generates considerable quantities of data per run, with
each flowcell producing up to 6 billion reads which translates into 600 Gigabase (Gb) of
sequence data. Apart from creating demands on storage capacity, with image data from
each flowcell requiring 32 terabytes of temporary storage, a robust informatics pipeline
is required to handle the downstream analysis (Bentley, 2010). There are two main
analytical approaches to using the sequence data, one involves aligning to a reference
sequence, also known as a mapped assembly, and the other is reference free and
therefore a de novo assembly. The short read data generated by the Illumina sequencers
is most applicable to the former method, and is very useful in the discovery of SNPs and
phylogenetics.

1.4 Linking genotype to phenotype
24
High-throughput sequencing has translated into numerous publications that provide new
insight into the evolution and genomic diversity of bacteria (Comas et al., 2010; Holt et
al., 2008; Qi et al., 2009). This technology is being applied to other disciplines, such as
transcriptomics, where whole genome sequencing of RNA transcripts (RNA-seq) is
creating a powerful new approach to characterisation of the bacterial transcriptome
(Perkins et al., 2009). For over ten years, microarray technology has allowed the
simultaneous monitoring of expression levels of all annotated genes in cell populations
(Schena et al., 1998). Whilst microarrays have been instrumental in our understanding
of transcription, generating a wealth of publications and data based on this technology,
limitations in its applicability have begun to be reached (Mortazavi et al., 2008).
Inherent issues such as the limited dynamic range for the detection of transcript levels,
cross hybridisation and the need for normalisation provide some explanation for the
explosion in use of second generation technologies in the analysis of transcriptomes
(Marguerat & Bähler, 2010). As well as surveying the total transcriptional landscape,
adaptation of the library making process can facilitate Transcriptional Start Site (TSS)
mapping, whereby the precise position of transcription initiation can be determined in a
genome-wide manner (Filiatrault et al., 2011; Sharma et al., 2010b). This can provide
greater understanding of the transcriptional output, and in the human pathogen
Helicobacter pylori revealed a complex structure of TSS within operons and opposite to
annotated genes (Sharma et al., 2010b).

1.5 Thesis outline
25
1.5 Thesis Outline
In this thesis, the identification and effect of lineage-specific genetic variation within the
phylogenetic lineages is investigated using computational methods and high-throughput
sequencing technology. This is driven by the overarching hypothesis that fixation of
mutations at evolutionary conserved positions in the lineages of M. tuberculosis, either
due to a relaxed selective constraint or positive selection, has resulted in functional
consequences that separate the MTBC lineages. Chapter 3 begins with the construction
of a representative 28-genome phylogeny using Illumina sequencing data. Comparative
analysis focuses on the detection of all lineage-specific single nucleotide polymorphisms
(SNPs), providing the first glimpse of the total SNP diversity that separates the main
phylogenetic lineages from each other. The lineage-specific coding SNPs are used to
investigate the evolutionary pressures acting within the lineages using population
genetics measures and gene function categories. Chapter 4 applies in silico tools to the
lineage-specific SNPs to predict those likely to have a functional effect. Focus is made
on the largest group of genetic variation, the nonsynonymous SNPs, and a significant
overrepresentation of transcriptional regulators with predicted functional SNPs was
detected. Chapter 5 moves from the DNA to RNA level using a transcriptomic approach.
RNA-sequencing of multiple strains from two lineages was performed, and differential
expression analysis used to define lineage-specific transcriptomes. Along with the
differential expression of genes between the lineages, the experimental method used
allowed novel expression of noncoding and antisense to be detected. In the context of
previously identified lineage-specific SNPs, significant associations were found between
the genomic and transcriptomic data, which were found to arise by three main
mechanisms. These have the potential to alter the response of isolates to differing
microenvironments and to modulate expression of ligands involved in innate immune
recognition.
2 Materials and Methods
26
Chapter 2 Materials and Methods
The following chapter details all protocols used in this thesis. From basic laboratory
methods used in the culture of Mycobacterium tuberculosis and the strains used.
Genome and RNA sequencing are next outlined, alongside the bioinformatics analysis
tools used to interpret this data. Details of MTBC strains and specific bioinformatics
analyses are detailed in results Chapters 3 to 5.
2.1 General microbiological methods
2.1.1 Containment 3 laboratory
All culturing of M. tuberculosis strains was performed in a Biosafety Level 3 laboratory,
and work undertaken within a Class II flow cabinet at a negative pressure of at least
160kPA.
2.1.2 General chemicals and reagents
Unless otherwise stated all laboratory chemicals were purchased from Sigma-Aldrich.
Buffers were prepared as aqueous solutions using distilled water, and solutions were
sterilised either by autoclaving or filtration (Millipore, 0.22μm) depending on the
volume.

2 Materials and Methods
27
2.1.3 Bacterial culture and storage
Growth of M. tuberculosis strains used in this study was performed in liquid
Middlebrook 7H9 growth media (Difco, Becton Dickinson). The 7H9 media was
supplemented with 0.5% glycerol (Fisher Scientific), 10% Middlebrook ADC (Albumin,
Dextrose, Catalase), and to help prevent clumping of the cells during growth, 0.05%
Tween-80. This is standard rich nutrient medium to culture M. tuberculosis (Atlas &
Snyder, 2006). Cultures were grown in one litre roller bottles (Nalgene) in a rolling
incubator at 37oC. For long-term storage all isolates were stored at -20°C in 2ml cryo
tubes (Sigma-Aldrich), and supplemented with 10% glycerol to increase viable cell
number during storage.
2.1.4 Growth curves
Growth curves of the bacterial strains used in this study were performed to determine the
previously unknown growth rates of the clinical isolates, which is critical for the
extraction of RNA from the correct growth phase for subsequent experiments. This
would also provide important phenotypic data on potential differences in in vitro growth
rates between the lineages.
Inoculation of 50ml conical screw cap falcon tubes (Fisher Scientific) with 10mls 7H9
medium was performed two days prior to the start of the growth curve experiment. On
starting the experiment a roller bottle with 100ml 7H9 was inoculated with the pre
culture so that the starting OD was 0.01 (the lower limit of detection by the
spectrophotometer). Samples of 1ml were taken every 24 hrs and the OD measured in
1ml cuvette.
2.1.4.1 Optical density (OD) measurements
The optical density (OD) method was used to measure the growth of mycobacterial
cultures in the above protocol. This is a rapid method that employs a spectrophotometer
to measure the difference in light transmission at a certain wavelength before and when
passing through a path length of a culture sample in a cuvette. Here an Amersham
Bioscience spectrophotometer was used for all OD measurements. All readings were
taken at a wavelength of 600nm (OD600), and sterile 7H9 used as a reference. Saturation

2 Materials and Methods
28
of absorbance occurs > 1 OD, therefore any readings above this were taken from a
diluted sample and multiplied by the dilution factor afterwards (typically 1:10).
2.2 Molecular biology techniques
2.2.1 Genomic DNA extraction
Genomic DNA was extracted using the CTAB method described previously (van
Soolingen et al., 1991). 20mls of culture with an OD of ~0.5 was transferred into a
sterile 50ml conical tube and centrifuged at 3000xg for 10mins to precipitate the
bacteria. The supernatant was decanted and the pellet resuspended in 1ml lysis buffer.
The suspension was transferred into a 2ml screw cap tube, and placed into a water bath
at 90oC for 1hr. Following this step the crude cells and lysate were transferred to a
containment 2 laboratory. The cells were pelleted at 13000xg, the supernatant discarded,
resuspended in 400µl lysis buffer and 100µl of 10mg/ml lysozyme, gently mixed, and
incubated at 37oC for 2 hrs.
The cell lysis step consisted of the addition of 50µl 20% SDS and 25µl Proteinase K to
the cell mix. The sample was incubated at 55oC for 40mins and 250µl of 4M NaCl
added and gently mixed. 160µl of preheated CTAB was added and incubated for 10
minutes. To separate the DNA from protein contamination, 900µl chloroform-isoamyl
alcohol (24:1) was added and the biphasic suspension vortexed, then centrifuged for
10mins at 13000xg at 4oC to separate the phases. The upper phase containing the DNA
mix was transferred to a clean 2ml eppendorf. DNA was purified with 700µl cold
isopropanol and mixed by gently inverting the tube. Following a 2hr or overnight
precipitation, the sample was centrifuged at 13,000xg for 10mins at 4oC. The
supernatant was decanted and the pellet air dried. 1xTE buffer was added to dissolve the
DNA that was then stored at 4oC.
2.2.2 RNA Isolation and handling
Inoculation of 10mls 7H9 media in falcon tubes from previously frozen bacterial stock
was performed per experiment to enable the rapid growth of pre-cultures before scaling
up to larger growth volumes. Following approximately two days and before OD reached

2 Materials and Methods
29
0.8, this culture was used to inoculate a roller bottle containing up to 180mls 7H9 liquid
media.
As determined by growth curve experiments (section 5.3.1), exponential phase cultures
were harvested at an OD of between 0.4 and 0.8, whilst stationary phase cultures were
harvested one week after the OD had reached 1.0. When ready, cultures were cooled
rapidly by addition of ice directly into the culture, and centrifuged at 12,000xg for 15
mins at 4oC. RNA was isolated using the FastRNA Pro blue kit from QBiogene/MP Bio
following the manufacturer’s instructions. The supernatant was subsequently decanted.
Following this procedure, the standard FastRNA Pro blue kit instructions were followed.
Briefly, 1ml of RNApro solution was added to the pellet and the cells resuspended by
pipetting, and 1ml transferred to a blue-cap tube containing Lysing Matrix B. The cell
mix in the tube was homogenised in a FastPrep Ribolyser (QBiogene/MP Bio) for
40secs at a setting of 6.0, and centrifuged at 12000xg for 5mins at 4oC. The upper phase
was transferred to a fresh microcentrifuge tube, incubate for 5mins, 300µl chloroform
added, vortexed for 10secs and further centrifuged at 12,000xg for 5mins. Following
transfer of the upper phase to a fresh microcentrifuge tube, 500µl of cold ethanol was
added and inverted for 5 times.
Following this step the RNA suspension was transferred to containment level 2
laboratory and precipitated for at least 2hrs or alternatively overnight. After
precipitation, the sample was centrifuged at 12,000xg for 15mins at 4oC, the supernatant
removed and pellet washed in 500μl of cold 75% ethanol (made with DEPC-H2O). The
ethanol was aspirated and the pellet air-dried at room temperature for 5mins, then the
RNA resuspended in 100 μl of DEPC-H2O.
2.2.3 Quantification of DNA and RNA by Nanodrop
A Nanodrop spectrophotometer (version ND-1000) was used to detect the quantity of
DNA and RNA following the above protocols. This requires 1μl of sample to be placed
on to the Nanodrop pedestal. Then the Nanodrop measures the absorption of the sample
at a range of wavelengths (230-350nm). This correlates with the concentration of DNA
present, given in ng/μl. The Nanodrop also provides a measure of the quality of DNA or
RNA extraction. Nucleic acids and proteins have absorbance maxima at 260 and 280nm,
respectively. A ratio of ~1.8 is generally accepted as high quality for DNA, a ratio of
~2.0 is generally accepted as high quality for RNA. If DNA or RNA extractions were

2 Materials and Methods
30
appreciably lower than these ratios a repeated round of purification was performed to
remove potential protein or other contamination that may be present in the sample.
2.2.4 Determination of DNA and RNA integrity by micro fluidics
Both RNA and DNA concentration was first measured using Nanodrop, and then
followed by quality control using the Agilent 2100 Bioanalyser. The Bioanalyser is a
chip-based capillary electrophoresis machine for sizing, quantification and quality
control of DNA, RNA, as well as proteins and cells. Depending on the sample type, the
nucleic acid was measured using the Agilent DNA 1000 chip or Agilent RNA 6000 nano
chip following the manufacture’s instructions.
2.2.5 Removal of DNA contamination from RNA samples
Rigorous DNase treatment of all RNA samples was performed using the TURBO DNase
free kit (Applied Biosystems). This procedure can remove > 200µg DNA per ml. Up to
5µg total RNA was treated in volumes of 50µl according to the manufacture’s
instruction. Briefly, 0.1 volume of 10X TURBO buffer and 1µl (2U) TURBO DNase
was added to the 50µl total RNA aliquot and mixed well. This was incubated at 37oC for
20mins, followed by an additional 1µl (2U) TURBO DNase, and 20min incubation. To
terminate the reaction 0.2 volumes DNase Inactivation Reagent was added and
incubated for 5mins at room temperature. The sample was then centrifuged at 13,000xg
for 2mins and the supernatant, containing the DNase free RNA, transferred to a fresh
microcentrifuge tube and stored at -20oC.
2.2.6 Polymerase chain reaction (PCR)
PCR was used to amplify specific regions of DNA. For general PCR amplification of
template DNA Supermix (Invitrogen) was used. Specific protocols including DNA-seq,
RNA-seq and qRT-PCR, used the manufacturers recommended reagents and are
described in the following sections. All PCR reactions were done in 0.2ml RNase- and
DNase-free thin wall PCR tubes (Ambion) using an Applied Biosystems Veriti Thermal
Cycler. As a negative control the same reaction was conducted in the absence of a DNA
template.

2 Materials and Methods
31
2.3 Materials
2.3.1 Mycobacterium tuberculosis strains
At the start of this project, strain stocks were generated for the entire duration of the
project. Stocks were taken from a strain collection at NIMR derived from a global
collection isolated in San Francisco (Gagneux et al., 2006a). Handling of stocks was
kept to a minimum to minimise the effect of laboratory adaptation; strains were cultured
for one week at NIMR to obtain sufficient stocks for this thesis. Stocks were frozen at
OD 0.4-0.8 to prepare stocks for subsequent exponential phase transcriptome sequencing
experiments.
Specific description of the MTBC used in this thesis is described in the respective results
chapters (Chapters 3 and 4).
2.4 DNA-seq
Following extraction and quality control of DNA described in the above method, the
Epicentre Nextera DNA kit was used to generate Illumina sequencing ready DNA
libraries. Briefly, the Nextera method employs in vitro transposition to simultaneously
fragment and tag DNA in a single-tube reaction, thereby facilitating the rapid generation
of DNA libraries; accounting for all quality control procedures, libraries can take less
than two days. The manufacturer’s instructions were followed, and the High-Molecular-
Weight Buffer (HMW) used, which generates fragments of 175-700bp and is
recommended for paired-end sequencing. A limited PCR step was performed, consisting
of a 72°C 3min extension step to denature the templates, followed by nine cycles of
95°C for 10secs, 62°C for 30secs and 72°C for 3mins. The amplified DNA fragments
were subsequently purified using the Zymo column DNA Clean & Concentrator-5 kit.
Additional MTBC strains that were not part of this study were also generated using the
above method at the same time, and therefore the Nextera barcoded adapters were used
in the above PCR step. This can be used to add up to twelve unique barcodes to the
Nextera library, enabling multiplexing of the libraries to reduce the sequencing cost.
2 Materials and Methods
32
2.5 RNA-seq
Following trialling of several methods to generate cDNA libraries ready for sequencing
from the RNA extractions, two methods were chosen for the generation of
transcriptomes in this thesis. The two methods are described below; one generates
transcriptomes for differential expression analysis (2.5.1), whilst the other was used for
transcriptional start site (TSS) mapping analysis (2.5.2).
2.5.1 Strand-specific RNA-seq libraries
The strand-specific protocol for transcriptome sequencing is largely based on the small
RNA sample preparation protocol from Illumina (part # 1001375), but with exclusion of
polyA-tail and size selection methods in order to capture all RNA species. Total RNA
from the above DNase treated RNA extraction was randomly fragmented, specific 5’
and 3’ adapters attached to both ends of the RNA; the adapters are complementary to
oligonucleotides immobilised on the glass surface of the Illumina flowcell. The protocol
consists of six main steps: fragmentation, phosphatase treatment, PNK treatment,
ligation of the adapters, reverse transcription and PCR amplification. These are followed
by purification steps using Solid Phase Reversible Immobilisation (SPRI) beads.
Fragmentation: Initially between 3-5µg of DNase treated RNA was fragmented
following the described Illumina protocol with the 10X fragmentation reagent. This was
stopped with the stop solution and put ice, the volume increased to 100µl with RNase
free water and precipitated by adding 3 volumes of 100% ethanol, 0.1 volumes of
sodium acetate (3M) (Ambion Cat # AM9740) and 0.05 volumes of glycogen. This was
precipitated for at least 30 minutes at -20°C. The pellet was washed with 500µl of 70%
ethanol, air dry the pellet on ice and resuspended in 16µl of RNase free water in a 200µl
PCR tube.
Phosphatase treatment: The sample was treated with 2µl Antartic phosphatase with 10X
Phosphatase buffer (NEB Cat # M0289S) and incubated for 30mins at 37°C, 5mins at
65°C and held at 4°C. PNK treatment: To the previous PCR tube 2µl T4 Polynucleotide
Kinase (PNK) (NEB Cat # M0201S), 17µl water, 5µl 10X PNK buffer, 5µl ATP
(10mM) (Epicentre Cat # R109AT) and 1µl RNAse OUT (Invitrogen, part # 10777-019)
was added and incubated for 60mins at 37°C and held at 4°C.
2 Materials and Methods
33
Phenol purification: In a new 1.5ml microcentrifuge tube the sample was transferred
and volume increased to 200µl by addition of RNase free water (Ambion, Cat #
AM9920). After 200µl acid phenol (Ambion Cat # AM9720) was added, vortexed, and
after centrifuging for 15mins at room temperature the upper phase was transferred to a
new microcentrifuge tube. 3 volumes of cold 100% ethanol, 0.1 volumes of sodium
acetate and 0.05 volumes of glycogen was added and precipitated for 30mins or
overnight. Following precipitation the sample was centrifuged for 25mins at 4°C, the
pellet washed in 70% ethanol and air dried on ice. Once dry 5µl RNase free water was
added to the pellet.
Ligation of the adapters: Adapters were from the Illumina small RNA kit preparation kit
with the v1.5 sRNA 3’ Adaptor (Illumina cat # FC-102-1009). Following the
manufacturers instructions the 3’ sRNA adaptor v1.5 and then SRA 5’ Adapter was
ligated to 5µl RNA from previous step.
Reverse Transcribe and Amplify: 4µl of the 5’ and 3’ ligated RNA was mixed with 1µl
diluted (1:5) SRA RT primer from the Illumina small RNA kit and heated at 70°C for
2mins. The standard SuperScript II Reverse transcriptase kit with 100mM DTT and 5X
first strand buffer (Invitrogen, part # 18064-014) was used to reverse transcribe the
ligated RNA following the manufacturer’s instructions.
PCR Amplification: Using the Phusion DNA Polymerase kit (NEB part # M0530S)
following the manufacturer’s instructions, 10µl of the product from the reverse
transcription reaction was amplified in a thermal cycler using the following conditions:
30secs at 98°C, 17 cycles of: 10secs at 98°C, 30secs at 60°C, 30secs at 72°C, followed
by 10mins at 72°C and then holding at 4°C.
Purification of libraries: The SPRI bead purification system (Agencourt AMPure from
Beckman Coulter Genomics) was used to remove residue reagents from the previous
steps to leave a purified DNA sample. The standard manufacturer’s instructions were
used for two rounds of SPRI bead purification. The final supernatant was transferred to a
fresh labelled RNase free tube, along with another 4µl aliquot for assessing library
concentration and purity (using a Bioanalyser), and stored at -20°C.

2 Materials and Methods
34
2.5.2 TSS 5’ enriched RNA-seq libraries
Terminator-5’-phosphate-dependent exonuclease (Epicentre Biotechnologies) was used
to deplete processed RNAs in cDNA samples used in TSS mapping analysis. Total RNA
was sent to Vertis Biotechnologie AG (Freising, Germany) and Illumina ready libraries
were constructed using the same protocol as above, but with the addition of the
Terminator-5’-phosphate-dependent exonuclease step to remove all RNA transcripts
without a 5’ triphosphate cap. This step removes degraded mRNAs and rRNAs, thereby
biasing the sequencing of only the 5’ end of mRNA transcripts and facilitating the
mapping of transcriptional start sites (TSS).
2.6 Illumina sequencing DNA (genome) and cDNA (RNA-seq) libraries
The library sequencing stage was performed by the high-throughput sequencing (HTS)
group at NIMR under the supervision of Abdul Sesay. Generated libraries were quality
checked by Agilent DNA 1000 chip and quantified by Qubit (Invitrogen).
Briefly, sequencing libraries were denatured with sodium hydroxide and a dilution of
2nM of the library loaded onto a single lane of an Illumina Genome Analyser 2x (GA)
or HiSeq2000 (HS) flowcell. Cluster formation, primer hybridisation and single or
paired-end sequencing were performed using proprietary reagents according to
manufacturer’s recommended protocol (Illumina).
2.7 Quantitative RT-PCR
To confirm differential expression identified by RNA-seq, qRT-PCR was carried out on
a 7500 Fast Real-Time PCR System (Applied Biosystems) using Fast SYBR Green
Master Mix (Applied Biosystems). To minimise across plate normalisation problems
arising, each 96-well plate consisted of a closed experimental plate design, with all
clinical strain samples included. RNA without RT (RT-) was analysed alongside cDNA
(RT+). Standard curves were performed for each gene analysed, and the quantities of
cDNA within the samples were calculated from cycle threshold values. Three biological
replicates were tested, consisting of three qRT-PCR plates per gene tested. Data was
averaged, adjusted for chromosomal DNA contamination (RT+ minus RT-) and
normalised to corresponding 16S RNA values.

2 Materials and Methods
35
cDNA for quantitative RT-PCR was made with random primers and Superscript III
according to manufacturer's instructions (Invitrogen). 2µg of DNase treated total RNA
from each respective strain was used as the starting material. Three biological replicates
per strain were used in this study.
2.7.1 Primer sequences
Primers were designed using the Primer 3 software (Rozen & Skaletsky, 2000), and
ordered from Sigma at 100≤µM concentration in 100µl aliquots, and stored at -20oC.
Primers used in the RNA-seq study in Chapter 5 are shown in Table 2.1.
Table 2.1. Primer sequences used in the qRT-PCR study. Seven toxin-antitoxin
genes were measured by qRT-PCR, and the 16S rRNA sequence was used in
normalisation. In the sequence column the suffix denotes the forward (F) and reverse (R)
primers.
Gene qRT-PCR primer Sequence (5’ - 3’)
Rv2063 mazE7_F TCCACGACGATTAGGGTTTC
Rv2063 mazE7_R ACATCGAGATTCCCCGTTC
Rv2274A mazE8_F CGAACCAGAAACCCTTCCT
Rv2274A mazE8_R GACGACTCTGCTCCCAACTC
Rv2830c vapB22_F GATCGAGATCACCAAACACG
Rv2830c vapB22_R GGTGGTGAAGAGTTCGTCGT
Rv2758c vapB21_F GTATGCTCTCCGGGTGTGAC
Rv2758c vapB21_R TGTCGTGGTACCCAGTTCCT
Rv1398c vapB10_F GGACCTGCAGGCTATAAACG
Rv1398c vapB10_R GCAAGGTGCTGTTCACGAC
Rv1397c vapC10_F TGGACTTGGCGACTATCTGA
Rv1397c vapC10_R GGAAATGCCACACGTTGAG
Rv2527 vapC17_F CGATATCGGCGAACTTGAAT
Rv2527 vapC17_R CAGTGACGTTTGTTGGCTGT
16S 16S_F AAGAAGCACCGGCCAACTAC
16S 16S_R TCGCTCCTCAGCGTCAGTTA

2 Materials and Methods
36
2.8 MTBC annotation datasets
2.8.1 Coding sequence annotations
All gene annotations were based on the reference H37Rv genome sequence (Cole et al.,
1998) and using the most recent annotations from the Tuberculist database, release 24
(December 2011) (Lew et al., 2011). In total there are 4,015 protein coding gene
sequences, 13 pseudogenes, 45 tRNAs and 3 rRNAs.
2.8.2 Functional Categories
The genes can be classified based on the function of the encoded proteins. Using the
Tuberculist database annotations there are ten functional categories, listed below (Lew et
al., 2011):
1. virulence detoxification and adaptation
2. lipid metabolism
3. information pathways
4. cell wall and cell processes
5. intermediary metabolism and respiration
6. unknown
7. regulatory proteins
8. conserved hypotheticals
9. insertion sequences and phages
10. PE/PPE
2.8.3 Essential M. tuberculosis genes
Definition of gene essentiality was based on experiments using transposon mutagenesis
to generate single gene knockouts, followed by transposon site hybridization after
growth on 7H11 agar or in mice (Sassetti et al., 2003; Sassetti & Rubin, 2003). On the
basis of these studies a total of 760 genes fell into the category of essential genes and the
remaining genes were classed as nonessential. This follows the same convention as
Comas et al. (Comas et al., 2010).

2 Materials and Methods
37
2.9 Bioinformatics software
2.9.1 Artemis
The genome browsing and annotation tool, Artemis (Carver et al., 2008), from the
Wellcome Trust Sanger Institute was used extensively throughout this work.
Importantly, this tool enables new features to be overlaid onto published annotations,
and the user plot function allows transcription data to be plotted against the genome.
2.9.2 Quality control of raw RNA-sequencing data
2.9.2.1 FastQC
Raw reads were first filtered to discard low quality reads, which improves the mapping
through a decrease in time and higher number of mapped reads. Raw fastq files
deposited from the Illumina machine were inspected using FastQC version version 0.9.3
(downloaded 20-6-11, Babraham Bioinformatics). FastQC provides a modular set of
analyses in a GUI environment written in the JAVA language. The Phred quality of
scores across the read length displayed in a box whisker plot, per base N content and
over-represented Illumina primer sequences were used to determine if a run has passed
QC.
2.9.2.2 SolexaQA
Fastq files passing the initial QC were filtered using SolexaQA version 1.7 (Cox et al.,
2010) (downloaded April 2011). SolexaQA is a Perl-based software package for quality
analysis of Illumina data. The DynamicTrim.pl script within this package was used to
remove poor quality bases from reads. Specifically, bases with Phred scores < 13 (which
corresponds to a p>0.05) were trimmed from the 5’ and 3’ ends of reads until all bases
were above this parameter. The Perl scripts were run on a linux server.
Trimming of reads was performed with the command:
$ DynamicTrim.pl [in.fastq] –h 13

2 Materials and Methods
38
The resulting output trimmed fastq file was used with the LengthSort.pl script. This
removes reads that were poor for a high percentage of the read length and are not
sufficiently long enough for mapping. The default parameter was used, removing reads
< 25 bases:
$ perl LengthSort.pl [in.fastq] > [out.fastq]
2.9.3 Transcriptome mapping software
An analysis pipeline was created to manage the high throughput sequencing datasets
generated by this study. Each file can contain about 150 million reads consisting of 10
Gigabases of sequence data. A reference based assembly was used for this study, and
mapping was performed against the reference genome H37Rv using BWA (version
0.5.9) (Li & Durbin, 2009). The raw sequence data file in the fastq format (Cock et al.,
2009) was mapped to the reference genome in fasta format using the following
commands:
Index the reference sequence using bwa index.
$ bwa-0.5.9 index [in.fasta]
The reads in the fastq file were mapped to the indexed fasta using the following
commands:
$ bwa-0.5.9 aln -I [in.reference.fasta] [in.fastq] > [out.fastq.sai]
$ baw-0.5.9 samse [in.reference.fasta] [in.fastq.sai] [in.fastq] > [align.sam]
For later processing and storage the mapped file in sam format is converted to the binary
format, BAM, using SAMtools (Li et al., 2009).
$ samtools view -bS [in.align.sam] > [out.align.bam]
The bam file is sorted to further reduce storage size and indexed for viewing the BAM
file in Artemis.

2 Materials and Methods
39
$ samtools sort [in.align.bam] [out.align.sorted.bam]
$ samtools index [in.align.bam]
Basic mapping statistics after this stage were viewed using the SAMtools idxstats
command.
$ samtools idxstats [in.align.bam]
Artemis plots were produced using the unix command.
$ paste [genomeCoverageBed reverse strand.out] [genomeCoverageBed forward
strand.out] > artemis.plot.out
2.9.4 Calculation of mapped read frequencies per feature region
Genome coverage of reads mapping to sense and antisense gene annotations and sRNAs
were calculated using the BEDtools package (Quinlan & Hall, 2010). Specifically, the
coverageBed and genomeCoverageBed utilities were used for extraction of gene regions
and whole genome coverage plots respectively. BEDtools is based on four widely used
file formats used in HTS data: BED, GFF, VCF and SAM/BAM. Gene and intergenic
annotations based on H37Rv were parsed into the BED (Browser Extensible Data)
format using standard linux command line tools. The Bed format consists of one line per
feature, each line containing a minimum of three fields of tabbed delimited information:
chr (chromosome name), chr start (start position), chr end (end position). Two of the
optional fields were used in this study: name (feature e.g. gene name), strand (either
forward or reverse strand). These optional fields enable the calculation of the reads
number that map to either the coding (sense) or non-coding (antisense) strand of the
gene in question.
As described above, the coverageBed script was used to identify the number of reads
mapping to each annotated feature, such a gene. The following was used to identify
reads mapping to each specific strand in the fastq file, in this case the forward strand.
$bamToBed -i [in.align.bam] | grep -w + | coverageBed -a stdin -b [annotations.bed] >
[plus.strand.out]

2 Materials and Methods
40
The genomeCoverageBed provides a useful base-per-base output of read depth that can
be imported into the Artemis, and was also used in deletion analysis. The following was
used to identify all read depths on the forward strand:
$genomeCoverageBed -strand + -d -ibam i [in.align.bam] -g [genome_length.bed] >
[plus.strand.out]
2.9.5 R
R is an open source statistical programming analysis environment (Team_RDC, 2008).
The Bioconductor package programmed in R was used as it provides tools for the
analysis and comprehension of high-throughput genomic data. Specific packages used
are described in the Methods of Chapter 5 in relation to RNA-seq analysis.
2.9.6 Perl scripts
Adhoc Perl scripts were written to aid in the parsing of flat file formats for use in such as
Artemis and R. In addition to these, the Perl script genomicDeletions.pl was written to
identify genomic deletions in genome sequencing data (Appendix A).
2.9.7 Graph pad prism 5.0
For the plotting and analysis of data used the program Graph Pad Prism 5.0c for OSX
was used. The software contains comprehensive statistical analysis and presentation
tools.

3.1 Introduction
41
Chapter 3 Lineage-specific SNPs
3.1 Introduction
Genetic variation within the M. tuberculosis complex (MTBC) is higher than previously
recognised. From studies of Large Sequence Polymorphisms (LSPs), to targeted multi
locus sequence analysis (MLSA), and finally whole genome sequencing (WGS), each
method has provided a greater resolution of the genetic variation that exists between
clinical isolates (Comas et al., 2010; Gagneux & Small, 2007; Hershberg et al., 2008).
The most comprehensive set of phylogenetically representative strains sequenced using
new high throughput sequencing (HTS) technology was published recently (Comas et
al., 2010). For the first time all branches within the MTBC phylogenetic tree could be
resolved, encompassing the six major MTBC phylogenetic lineages. Genome sequences
of the twenty-one clinical strains sequenced in the previous study are publicly available,
making this an ideal reference phylogeny on which to base further analyses. The
genomes were sequenced at high depth (40 to 90-fold coverage) using the Illumina
sequencing platform, making it possible to capture the most complete picture yet of
MTBC nucleotide diversity.
Single Nucleotide Polymorphisms (SNPs) are the most common form of genetic
variation in the MTBC, and driven by advances in sequencing technology an extensive
and ever growing catalogue of SNPs amongst clinical isolates of M. tuberculosis have
been identified (Comas et al., 2010; Stucki & Gagneux, 2012). As described in Chapter
1, analysis of SNPs in 89 genes from 99 human MTBC isolates provided strong
evidence that human MTBC originated in Africa and accompanied the Out-of-Africa
migrations of modern humans approximately 70,000 years ago (Hershberg et al., 2008).
The six human MTBC lineages exhibit a strong global population structure (Gagneux et
3.1 Introduction
42
al., 2006a) and phenotypic diversity has been associated with the different MTBC
lineages. This includes the ability to elicit an immune response in vivo (Portevin et al.,
2011), and clinical associations with extra pulmonary tuberculosis (Kong et al., 2005;
Kong et al., 2007). However, the effect that MTBC genomic diversity plays in TB
disease remains an open question, but one that can now be explored using a rational data
driven approach (Coscolla & Gagneux, 2010).
Using available MTBC genome datasets, it is now possible to identify all SNPs that
contribute to the background genetic variation of the six lineages. Due to the clonal
population structure of MTBC (Supply et al., 2003), the majority of this variation is
expected to be exclusive to the lineage in question, and therefore private from all other
lineage strains. This presents an opportunity to understand the nature of this lineage-
specific variation, and is expected to provide insight into how the hypothesised reduced
purifying selection in the MTBC has shaped the lineages (Hershberg et al., 2008).
3.1.1 Aims
The aim of the work presented in this chapter was to characterise whole genome
variation within the MTBC at the lineage-specific level using M. tuberculosis and M.
africanum clinical isolates. As the identification of the lineage-specific SNPs is reliant
on a representative phylogeny, the initial aim was to generate a robust phylogeny
comprising of strains sequenced using second-generation sequencing technology.
Following generation of a robust phylogeny, specific aims of the analysis were to:
• identify lineage-specific SNPs from the main six lineages. These SNPs make up
the basal branch of each lineage
• gain insights into the evolution of the MTBC, focusing on the type and
frequency of genetic changes within and across the phylogenetic lineages.
• measure the selective pressures on different gene function categories across the
lineages.
3.2 Materials and Methods
43
3.2 Materials and Methods
3.2.1 Genome collection used in study
In total twenty-eight phylogentically representative strains were used in this study.
Twenty-seven were collected from previously published resources, either through
deposited data in public databases or published studies (Comas et al., 2010). Accession
numbers are as follows: SRP001137, SRA009341, SRA009367, SRA008875,
SRA009637. An additional strain was sequenced as part of this study (Lineage 2 strain
N0031). Data has been deposited in the EBI SRA under the accession number:
ERX192819. Details of the strains, country of isolation, and metrics from the mapping
performed for this study is shown in Table 3.1.
3.2.2 Genome sequencing.
Genomic DNA for N0031 was extracted using the CTAB method described [previously
in Methods], and 2µg DNA used for sequencing on the Illumina HiSeq platform.
Sequencing libraries were constructed using the Epicentre Nextera DNA kit according to
manufacturer’s instructions. Paired-end 75 base read sequencing was performed in a
single Illumina flowcell lane as part of a multiplexed run. In total 10.6 million reads
were generated, corresponding to an average sequence depth of 180 reads.
3.2.3 Mapping genome sequences
MAQ (Li et al., 2008) was used to map the reads produced by the Illumina sequencer to
the reference genome. The most recent common ancestor of MTBC was used as the
reference sequence as described previously (Comas et al., 2010). This sequence is based
on the H37Rv genome (NC_000962) but substituting H37Rv alleles with those of the

3.2 Materials and Methods
44
reconstructed common ancestor of the strains. Standard MAQ parameters were used,
removing SNPs with a Phred score <30, read depth of <5, and non-unique matches. A
non-redundant list of variable positions called with high confidence in at least one strain
was constructed and used to recover the base call in all other strains. SNPs and indels
called within repetitive regions (genes annotated as PE/PPE/insertions/phages) were
removed.
3.2.4 Phylogenetic analysis
Phylogenetic analysis was based on filtered SNPs detected when each strain was
compared against the most common recent ancestor of the sequences, as explained in the
above (section 3.3.3). Concatenated SNPs from 13,086 variable genomic positions were
used to infer the phylogenetic relationships between strains using the neighbour-joining
method. Both coding and noncoding were included. The resulting tree was generated
with MEGA (Tamura et al., 2011), using 1000 bootstrap replications for clade support,
and the observed number of substitutions as the measure of genetic distance. In cases
where SNP calls were missing from individual strains, pairwise-deletion was performed
and missing data in the specific comparison ignored. As an outgroup, the distantly
related M. canetti (strain K116) was used to root the tree. For presentation purposes the
branch length of the M. canetti outgroup was reduced by only including SNP positions
shared by the MTBC and M. canetti. Trees in Newick tree format were imported into
FigTree v1.3.1, a graphical viewer of phylogenetic trees and as a program for producing
publication-ready figures. FigTree was downloaded from: http://
tree.bio.ed.ac.uk/software/figtree/.
3.2.5 Categorising SNPs
SNPs were categorised as nonsynonymous (an amino acid change) or synonymous (no
change) using snpEff (Cingolani et al., 2012). Source code was downloaded from:
https://snpeff.svn.sourceforge.net/svnroot/snpeff/SnpEffect/trunk, and run as a local
installation. As an input snpEff takes two files: a database for the reference genome, and
a SNP file in the Variant Call Format (VCF). It was necessary to generate a custom
reference database based on the ancestral genome sequence of the MTBC. The database
was built within snpEFF using the packages command line modules, and the ancestral
sequence in fasta format was parsed into the Genome Transfer Format version 2.2 (GTF

3.2 Materials and Methods
45
2.2), and using the Tuberculist database gene annotations, version 22 (May 2011) to
define regions encoding genes. Annotation of SNPs by functional category was based on
the Tuberculist database. Genes are grouped into ten functional categories as described
previously (section 2.8.2).
3.2.6 dN/dS calculation
dN/dS was calculated by division of the two rate ratios dN and dS. dN is calculated by
dividing the sum of nonsynonymous SNPs by the total number of potential
nonsynonymous sites in coding sequences, and dS is the sum of synonymous SNPs
divided by the total number of synonymous sites in coding sequences. Due to the low
number of SNPs in the MTBC, instead of calculating the dN/dS per gene, gene
concatenates were generated based on different classification. Firstly, genes defined as
essential and nonessential on the basis of Transposon screens (Sassetti et al., 2003;
Sassetti & Rubin, 2003), and secondly using the Tuberculist gene functional categories.
For each concatenate, the Nei-Gojobori method was implemented in SNAP to define
synonymous and nonsynonymous substitutions by pairwise comparison using the
inferred ancestral genome (Korber, 2000).

3.2 Materials and Methods
46
Tabl
e 3.
1. T
wen
ty e
ight
str
ains
use
d in
this
stu
dy. P
atie
nt p
lace
of
birth
and
stra
in is
olat
ion
give
n. D
epth
of
cove
rage
and
nu
mbe
r of
filte
red
SNPs
rela
tive
to th
e re
fere
nce
H37
Rv
is s
how
n. 1
Alte
rnat
ive
stra
in n
ame
as u
sed
in p
revi
ous
MLS
A a
nd
geno
me
stud
y is
incl
uded
to p
rese
rve
the
link
to a
new
sys
tem
atic
nam
ing
conv
entio
n us
ed in
the
stra
in c
olle
ctio
n (C
omas
et a
l.,
2010
; Her
shbe
rg e
t al.,
200
8).
2 Bas
ed o
n H
37R
v re
fere
nce
geno
me.!
Tab
le X
. B
ase
d o
n m
ap
pin
g t
o H
37
Rv
Stra
in n
ame
Alte
rnat
ive
nam
e 1
Lin
eage
Patie
nt p
lace
of
birt
hC
ount
ry o
f is
olat
ion
Ave
rage
m
appe
d de
pth
Num
ber
of
read
sPe
rcen
t gen
ome
cove
rage
2Fi
ltere
d SN
PsSt
udy
sour
ce o
f gen
ome
MTB
_95_
0545
N00
32Li
neag
e 1
Laos
San
Fran
cisc
o77
.37
7,62
1,94
699
.75
1,83
4C
omas
et a
l., (2
010)
MTB
_T17
N01
21Li
neag
e 1
The
Phili
ppin
esSa
n Fr
anci
sco
72.5
97,
130,
412
99.3
61,
867
Com
as e
t al.,
(201
0)N
0157
MTB
_T92
Line
age
1Th
e Ph
ilipp
ines
San
Fran
cisc
o46
.01
5,06
8,05
398
.85
1,88
3C
omas
et a
l., (2
010)
MTB
_K21
-Li
neag
e 1
Zim
babw
eSa
n Fr
anci
sco
77.9
97,
112,
888
99.2
91,
937
Com
as e
t al.,
(201
0)M
TB_K
67-
Line
age
1C
omor
o Is
land
sSa
n Fr
anci
sco
78.2
97,
097,
284
98.9
51,
910
Com
as e
t al.,
(201
0)M
TB_K
93-
Line
age
1Ta
nzan
iaSa
n Fr
anci
sco
65.5
26,
017,
391
99.2
21,
883
Com
as e
t al.,
(201
0)N
0070
EAS0
50Li
neag
e 1
Indo
nesi
aSa
n Fr
anci
sco
55.0
73,
421,
436
99.0
41,
290
Unp
ublis
hed
(Com
as e
t al.,
201
3)N
0072
EAS0
53Li
neag
e 1
Indi
aSa
n Fr
anci
sco
59.4
93,
696,
378
98.8
919
34U
npub
lishe
d (C
omas
et a
l., 2
013)
N01
53M
TB_T
83Li
neag
e 1
Vie
tnam
San
Fran
cisc
o61
.56
3,57
3,05
897
.18
1854
Bro
ad In
stitu
te (S
RA
0093
41)
MTB
_00_
1695
N00
01Li
neag
e 2
Japa
nSa
n Fr
anci
sco
77.9
27,
394,
236
99.0
21,
280
Com
as e
t al.,
(201
0)N
0031
MTB
_94_
M42
41A
Line
age
2C
hina
San
Fran
cisc
o17
9.69
21,1
38,7
2899
.23
1229
This
stud
y (S
RA
TB
C)
N00
52M
TB_9
8_18
33Li
neag
e 2
Chi
naSa
n Fr
anci
sco
64.4
96,
395,
114
99.1
01,
279
Com
as e
t al.,
(201
0)M
TB_M
4100
AN
0110
Line
age
2So
uth
Kor
eaSa
n Fr
anci
sco
40.4
74,
022,
290
98.9
41,
276
Com
as e
t al.,
(201
0)N
0145
MTB
_T67
Line
age
2C
hina
San
Fran
cisc
o78
.77
7,61
6,60
398
.73
1,29
3C
omas
et a
l., (2
010)
MTB
_T85
N01
55Li
neag
e 2
Chi
naSa
n Fr
anci
sco
61.6
56,
159,
284
99.0
41,
305
Com
as e
t al.,
(201
0)M
TB_9
1_00
79N
0022
Line
age
3Et
hiop
iaSa
n Fr
anci
sco
74.0
37,
228,
038
99.1
41,
271
Com
as e
t al.,
(201
0)M
TB_S
G1
N01
14Li
neag
e 3
Indi
aSa
n Fr
anci
sco
66.3
43,
850,
822
99.2
513
30B
road
Inst
itute
(SR
A00
9637
)M
TB_K
49-
Line
age
3Ta
nzan
iaSa
n Fr
anci
sco
75.5
26,
845,
266
99.2
51,
263
Com
as e
t al.,
(201
0)H
37R
v-
Line
age
4U
SA-
Ref
eren
ce-
--
-M
TB_4
783_
04-
Line
age
4Si
erra
-Leo
neSa
n Fr
anci
sco
78.1
27,
466,
814
98.7
873
3C
omas
et a
l., (2
010)
MTB
_GM
_150
3-
Line
age
4Th
e G
ambi
aSa
n Fr
anci
sco
82.2
67,
891,
933
99.0
879
1C
omas
et a
l., (2
010)
MTB
_K37
-Li
neag
e 4
Uga
nda
San
Fran
cisc
o59
.86
5,48
0,45
198
.85
661
Com
as e
t al.,
(201
0)M
TB_E
rdm
an-
Line
age
4-
-32
.69
4,33
3,18
498
.22
862
Bro
ad In
stitu
te (S
RA
0088
75)
MTB
_KZN
_K60
5-
Line
age
4So
uth
Afr
ica
Sout
h A
fric
a93
.51
11,4
58,6
4399
.52
771
Bro
ad In
stitu
te (S
RA
0096
37)
MA
F_11
821_
03-
Line
age
5Si
erra
-Leo
neSa
n Fr
anci
sco
78.2
27,
491,
737
99.0
21,
959
Com
as e
t al.,
(201
0)M
AF_
5444
_04
-Li
neag
e 5
Gha
naSa
n Fr
anci
sco
79.7
57,
578,
690
98.9
21,
959
Com
as e
t al.,
(201
0)M
AF_
4141
_04
-Li
neag
e 6
Sier
ra-L
eone
San
Fran
cisc
o72
.62
7,02
7,14
398
.61
2,04
5C
omas
et a
l., (2
010)
MA
F_G
M_0
981
-Li
neag
e 6
The
Gam
bia
San
Fran
cisc
o76
.39
7,35
0,87
399
.00
2,06
5C
omas
et a
l., (2
010)
MTB
_K11
6-
M. c
anet
tiD
jibou
tiD
jibou
ti93
.01
6,54
4,25
496
.32
1,01
8C
omas
et a
l., (2
010)
1 A
ltern
ativ
e na
me
as u
sed
in H
ersh
berg
et a
l (20
08) a
nd C
omas
et a
l (20
10).
Pres
erve
s lin
k fr
om p
revi
ousl
y pu
blis
hed
and
trans
ition
to sy
stem
atic
nam
ing
conv
entio
n2 B
ased
on
H37
Rv
refe
renc
e ge
nom
e

3.3 Results
47
3.3 Results
3.3.1 A globally representative 28-genome human-adapted MTBC phylogeny
To identify and extract all lineage-specific SNPs, a representative genome collection
was built from previously published and newly sequenced M. tuberculosis strains (Table
3.1). This set of genomes formed the dataset to identify the lineage-specific SNPs
analysed in this study; a subset of these strains will also be followed in Chapter 5 using a
transcriptomic approach (RNA-sequencing). The majority of the strains used in this
phylogeny were published by Comas et al., (2010), consisting of twenty-one genomes
sequenced on the Illumina platform. As previously reported, these genomes have mean
72-fold sequence depth, with 98.9% coverage of the reference genome (Comas et al.,
2010). A further six genomes sequences were downloaded from the European
Nucleotide Achieve (ENA), and the last strain, N0031, was sequenced as part of this
study. Strain N0031 was included in the previous MLSA study and therefore known to
be a rare Lineage 2 strain that is ancestral to the Beijing sub group (Hershberg et al.,
2008). For this reason the strain was selected for sequencing to capture the greatest
possible within-lineage diversity. All strains were sequenced using the Illumina platform
and with a minimum 32-fold average sequence depth, seen in Table 3.1.
Using the H37Rv genome as reference, a mapping assembly was built for the twenty-
eight strains using MAQ (Heng, 2008). SNPs were filtered if they had low associated
Phred quality scores, read numbers, or if they fell within annotated repeat regions such
as PE/PPE regions (see 3.2.3). Such regions are families of genes encoding proteins
carrying Proline-Glutamic acid (PE) or Proline-Proline-Glutamic acid (PPE) motifs
found near the N-terminus (Cole et al., 1998), and are inherently difficult to map using
short read technology such as Illumina. In total 39,764 SNPs were identified in the
strains relative to the reference, and the frequency of filtered SNPs per strain is shown in
Table 3.1. Many of these SNPs are present in more than one strain, leaving a high level
3.3 Results
48
of redundancy in the SNP lists. A non-redundant list of SNPs was constructed,
highlighting 13,088 nucleotide positions that were variable across the 4.4Mb genome.
These positions will therefore harbour a SNP in one or more of the 28 strains, and were
subsequently used to derive a genome wide phylogeny. A Neighbour-Joining phylogeny,
constructed using MEGA5 (Tamura et al., 2011), is shown in Figure 3.1.
Strains group into six main phylogenetic lineages, with bootstrap values indicating
strong statistical support (Figure 3.1). The phylogenetic structure and strain groupings
are completely congruent to the most recent whole genome based phylogeny (Comas et
al., 2010), and previous MLSA and gene deletion based phylogenies (Comas et al.,
2010; Gagneux et al., 2006a; Hershberg et al., 2008). The same lineage colouring
scheme used in previous studies is continued here, and this will be continued where
applicable throughout the thesis (Comas et al., 2010; Hershberg et al., 2008). Naming of
lineages from 1 to 6 follows the convention of Comas et al. (2010). Mycobacterium
canetti (strain K116) was used to root the phylogenetic tree, as it is the closest known
relative to the MTBC (Gutierrez et al., 2005). The number of SNPs has been artificially
reduced for M. canetti in the phylogeny (Figure 3.1). This reduction was performed for
aesthetic reasons due to the large number of singletons between M. canetti and any of
the other MTBC strains used in this study. For example, between the reconstructed most
recent common ancestor of the MTBC sequence used in this study (see section 3.2.3)
and the M. canetti genome sequence used there are 12,319 SNPs, compared to the
~1,500 SNPs between any other MTBC strain and the ancestral sequence.

3.3 Results
49
Figure 3.1. Neighbour-joining phylogeny based on 13,088 variable common
nucleotide positions across 28 human-adapted MTBC genome sequences. Scale bar
shows the number of SNPs. The six lineages are coloured as defined previously
(Hershberg et al., 2008). The root has been truncated due to the large numbers of
changes that separate M. canetti from the rest of the phylogeny. Node support after
1,000 bootstrap replications with all nodes > 75. M. canetti strain K116 was used as the
phylogenetic outgroup.
200 SNPs
MAF_11821_03
MTB_N0153
MTB_KZN_605
MTB_N0052
MTB_GM_1503
MTB_M4100A
MAF_5444_04
MTB_T17
MTB_K21
MTB_91_0079
MTB_K93
MTB_T85
MTB_95_0545
MTB_K49
MAF_4141_04
MTB_N0072
MCAN_K116
MAF_GM_0981
MTB_N0157
MTB_erdman
MTB_K67
MTB_00_1695
MTB_H37Rv
MTB_K37
MTB_N0070
MTB_N0145
MTB_4783_04
MTB_N0031
MTB_SG1
100
100
100
81
100
100
100
100
100
100
100
98
100
100
100
100
100
100
100
100
77
100
100
100
100
100
Lineage 4
Lineage 2
Lineage 3
Lineage 1
Lineage 5
Lineage 6
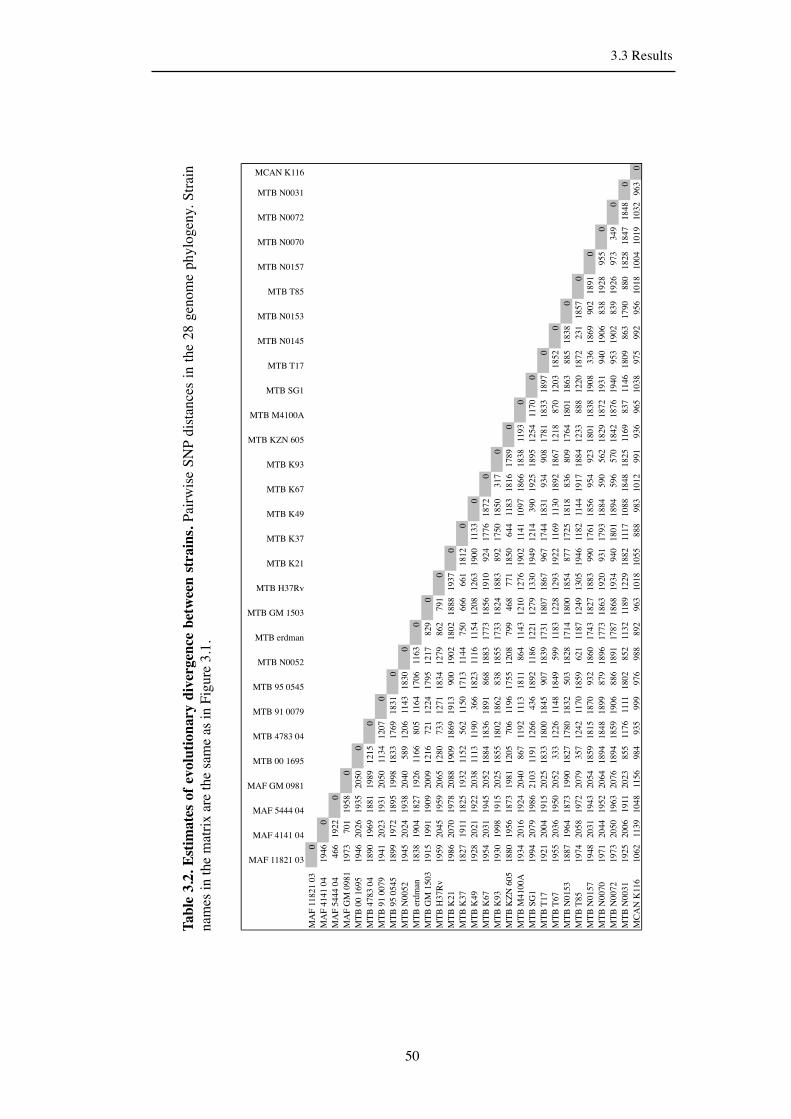
3.3 Results
50
Tabl
e 3.
2. E
stim
ates
of e
volu
tiona
ry d
iver
genc
e be
twee
n st
rain
s. Pa
irwis
e SN
P di
stan
ces
in th
e 28
gen
ome
phyl
ogen
y. S
train
na
mes
in th
e m
atrix
are
the
sam
e as
in F
igur
e 3.
1. !
MAF 11821 03
MAF 4141 04
MAF 5444 04
MAF GM 0981
MTB 00 1695
MTB 4783 04
MTB 91 0079
MTB 95 0545
MTB N0052
MTB erdman
MTB GM 1503
MTB H37Rv
MTB K21
MTB K37
MTB K49
MTB K67
MTB K93
MTB KZN 605
MTB M4100A
MTB SG1
MTB T17
MTB N0145
MTB N0153
MTB T85
MTB N0157
MTB N0070
MTB N0072
MTB N0031
MCAN K116
MA
F 11
821
030
MA
F 41
41 0
419
460
MA
F 54
44 0
446
619
220
MA
F G
M 0
981
1973
701
1958
0M
TB 0
0 16
9519
4620
2619
3520
500
MTB
478
3 04
1890
1969
1881
1989
1215
0M
TB 9
1 00
7919
4120
2319
3120
5011
3412
070
MTB
95
0545
1899
1972
1895
1998
1833
1769
1831
0M
TB N
0052
1945
2024
1938
2040
589
1206
1143
1830
0M
TB e
rdm
an18
3819
0418
2719
2611
6680
511
6417
0611
630
MTB
GM
150
319
1519
9119
0920
0912
1672
112
2417
9512
1782
90
MTB
H37
Rv
1959
2045
1959
2065
1280
733
1271
1834
1279
862
791
0M
TB K
2119
8620
7019
7820
8819
0918
6919
1390
019
0218
0218
8819
370
MTB
K37
1827
1911
1825
1932
1152
562
1150
1713
1144
750
666
661
1812
0M
TB K
4919
2820
2119
2220
3811
1311
9036
618
2311
1611
5412
0812
6319
0011
330
MTB
K67
1954
2031
1945
2052
1884
1836
1891
868
1883
1773
1856
1910
924
1776
1872
0M
TB K
9319
3019
9819
1520
2518
5518
0218
6283
818
5517
3318
2418
8389
217
5018
5031
70
MTB
KZN
605
1880
1956
1873
1981
1205
706
1196
1755
1208
799
468
771
1850
644
1183
1816
1789
0M
TB M
4100
A19
3420
1619
2420
4086
711
9211
1318
1186
411
4312
1012
7619
0211
4110
9718
6618
3811
930
MTB
SG
119
9420
7919
8621
0311
9112
6643
618
9211
8612
2112
7913
3019
4912
1439
019
2518
9512
5411
700
MTB
T17
1921
2004
1915
2025
1833
1800
1845
907
1839
1731
1807
1867
967
1744
1831
934
908
1781
1833
1897
0M
TB T
6719
5520
3619
5020
5233
312
2611
4818
4959
911
8312
2812
9319
2211
6911
3018
9218
6712
1887
012
0318
520
MTB
N01
5318
8719
6418
7319
9018
2717
8018
3250
318
2817
1418
0018
5487
717
2518
1883
680
917
6418
0118
6388
518
380
MTB
T85
1974
2058
1972
2079
357
1242
1170
1859
621
1187
1249
1305
1946
1182
1144
1917
1884
1233
888
1220
1872
231
1857
0M
TB N
0157
1948
2031
1943
2054
1859
1815
1870
932
1860
1743
1827
1883
990
1761
1856
954
923
1801
1838
1908
336
1869
902
1891
0M
TB N
0070
1971
2044
1952
2064
1894
1848
1899
879
1896
1773
1863
1920
931
1793
1884
590
562
1829
1872
1931
940
1906
838
1928
955
0M
TB N
0072
1973
2050
1963
2076
1894
1859
1906
886
1891
1787
1868
1934
940
1801
1894
596
570
1842
1876
1940
953
1902
839
1926
973
349
0M
TB N
0031
1925
2006
1911
2023
855
1176
1111
1802
852
1132
1189
1229
1882
1117
1088
1848
1825
1169
837
1146
1809
863
1790
880
1828
1847
1848
0M
CA
N K
116
1062
1139
1048
1156
984
935
999
976
988
892
963
1018
1055
888
983
1012
991
936
965
1038
975
992
956
1018
1004
1019
1032
963
0

3.3 Results
51
Across and within-lineage genetic diversity was next investigated using the phylogeny.
A SNP distance matrix was constructed based on the number of base differences per
pairwise strain comparison, shown in Table 3.2. Across the phylogeny the average
number of SNPs per pairwise comparison is 1544, which translates to an average of one
SNP per 2.857 kb sequence length, as based on the H37Rv reference sequence genome
(4.411532 Mb). Contrasting to the phylogenetic outgroup M. canetti, there was on
average one SNP per 0.358 kb sequence, which is nearly 8 times higher SNP density
than the MTBC.
Within-lineage variation was next measured by taking the average of all pairwise
comparisons for each lineage strain, shown in Figure 3.2. Average within-lineage
diversity ranged from 397 SNPs (sd=36) between any Lineage 3 strain, to 811 SNPs
(sd=193) between any Lineage 1 strain. Lineages 2 and 1 have the greatest within-
lineage variation, with a standard deviation of 222 and 193 SNPs respectively. This is
nearly twice that of Lineage 4 (sd=104) and over five times the variation seen in Lineage
3 (sd=36). Lineage 1 also has the greatest number of genome sequences in the
phylogeny (9 strain genomes). This might indicate a discovery bias, where the
increasing number of genome sequences is uncovering more within-lineage variation.
Whilst this cannot be ruled out, there was not a significant correlation between the
number of strains per lineage and average within-lineage variation (Pearson r = 0.73, p =
0.10). Furthermore, the M. africanum lineages, (Lineage 5 and 6) had the least
representative strains per lineage sequenced at the time of this study owing to the
restricted number of strains avaliable, but diversity is still greater than Lineage 3, with
Lineage 6 diversity comparable to all but Lineage 1. Overall it would appear that
Lineages 1 and 2 have the greatest within-lineage SNP diversity.

3.3 Results
52
Figure 3.2. Within-lineage SNP diversity. The number of SNPs per pairwise
comparison of all strains per lineage. Lineages are ordered by Ancient and Modern
groups. Error bars indicate mean and standard deviation (sd). There was not a significant
correlation between the number of strains per lineage and average within-lineage
variation (Pearson r = 0.73, p = 0.10).
Linea
ge 1
Linea
ge 5
Linea
ge 6
Linea
ge 2
Linea
ge 3
Linea
ge 4
0
400
800
1200
Num
ber o
f SN
Ps
Ancient Modern

3.3 Results
53
3.3.2 Identification of all lineage-specific SNPs
Using the underlying connections from the derived whole genome phylogeny, it was
possible for the first time to identify and extract all SNPs that are common to all strains
from each of the six lineages. Due to the clonal nature of the MTBC (Supply et al.,
2003), SNPs within these branches are largely exclusive to the respective lineage. All
alleles on the derived phylogeny were traced throughout the tree and the nodes for each
lineage branch were used to isolate all SNPs that contribute to this branch (Figure 3.3A).
For example, the 163 SNPs between node 5 and 7 define Lineage 4 strains (red lineage),
and in all but a few rare cases are exclusive to the lineage. The SNPs were subsequently
defined as lineage-specific, and form the main dataset for the following analysis; SNPs
found in more than one lineage branch represent homoplasic nucleotide positions and
are described later in section 3.3.4.
In total 2,794 lineage-specific SNPs were identified (Figure 3.3B), and these are
distributed throughout the genome, shown in Figure 3.4 (the full list in shown in
Appendix B). Lineage-specific SNPs frequencies range from 124 (Lineage 2) to 698
(Lineage 5). The highest number of lineage-specific SNPs is in the two M. africanum
lineages (Lineages 5 and 6). In addition to the six lineages, SNPs from the relatively
long phylogenetic branch that is basal to the three modern lineages (Lineages 2, 3 and 4)
have also been included in this study (Figure 3.3B). This branch defines the three
modern lineages and consists of 319 SNPs. From here on this branch is called the
modern lineage branch.
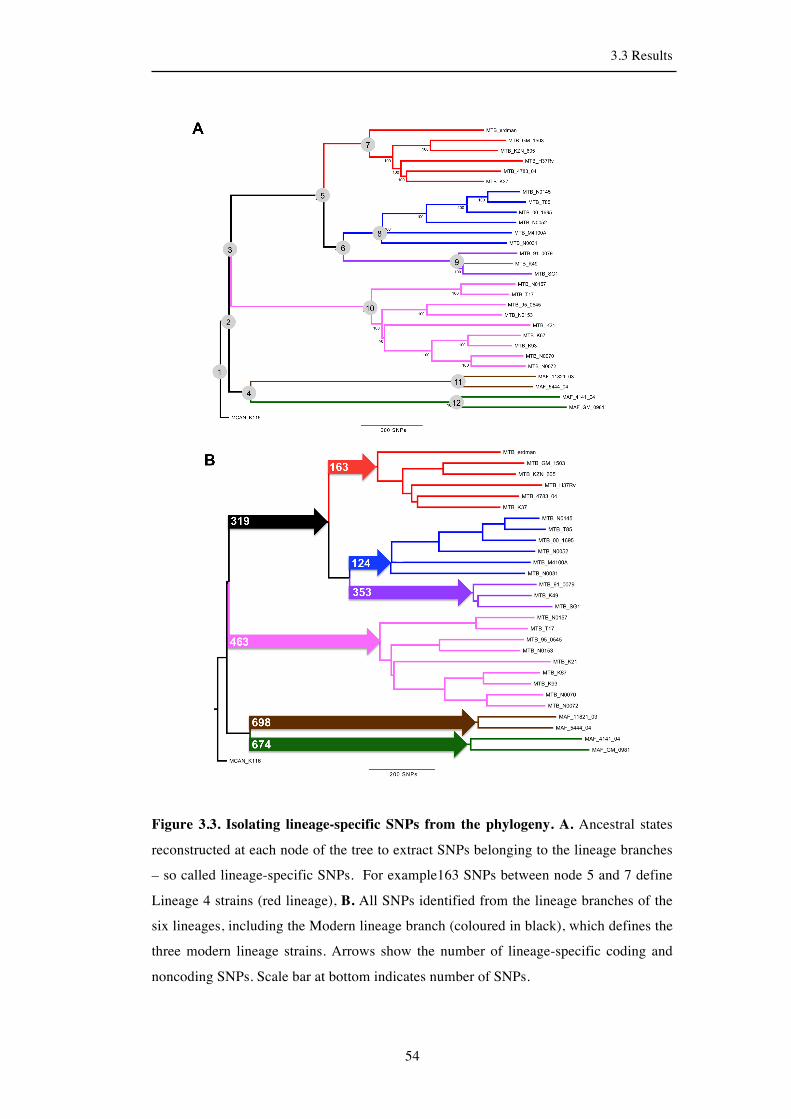
3.3 Results
54
Figure 3.3. Isolating lineage-specific SNPs from the phylogeny. A. Ancestral states
reconstructed at each node of the tree to extract SNPs belonging to the lineage branches
– so called lineage-specific SNPs. For example163 SNPs between node 5 and 7 define
Lineage 4 strains (red lineage), B. All SNPs identified from the lineage branches of the
six lineages, including the Modern lineage branch (coloured in black), which defines the
three modern lineage strains. Arrows show the number of lineage-specific coding and
noncoding SNPs. Scale bar at bottom indicates number of SNPs.

3.3 Results
55
Figure 3.4. Distribution of the lineage-specific SNPs across the genome. Genes on
forward and reverse strands shown in outer rings as blue and red respectively. Mapped
lineage-specific SNPs depicted in six inner rings, with the SNP colouring based on
lineage phylogeny colours. From the innermost ring: Lineage 4, 3, 2, 1, 6, and 5.
Genome structure and size based on H37Rv.
3.3 Results
56
3.3.3 Distribution of SNPs
The most recent M. tuberculosis annotations at the time of this study were used to
classify the lineage-specific SNPs as non-coding (intergenic SNPs) and coding
(Tuberculist database release 24). The average percentage of SNPs falling into these two
regions across all the lineages is shown in Figure 3.5. It can be seen that vast majority of
SNPs (86.4%) fall within annotated coding regions. This is not unexpected, as the
percentage of the M. tuberculosis genome annotated as coding is 91.3% (based on the
H37Rv reference). However, adjusting for the differences in sequence length between
coding and noncoding regions, the number of SNPs falling across coding and non-
coding is not equal, with a nearly 2-fold higher SNP density in intergenic regions (1.0
SNPs per kb of intergenic sequence compared to 0.6 SNPs per kb coding sequence) (X2,
p <0.0001). This may not be surprising as SNPs in coding regions are more likely to be
removed through purifying selection; the selective pressures acting on the coding
regions is investigated later in the chapter (section 3.3.7). Coding SNPs can be further
divided into those that cause a change in the amino acid encoded by the codon (a
nonsynonymous SNP), or cause no change in the amino acid (a synonymous SNP). On
average 55% of all SNPs are nonsynonymous, shown in Figure 3.5. Table 3.3 shows the
frequency of SNP types for each lineage. Although rare, nonsynonymous SNPs were
also found to cause the introduction of a stop codon (1.3% of all SNPs), and these were
found across all lineages (Table 3.3). Conversely, three nonsynonymous SNPs removed
an existing stop codon, contributing to < 0.1% of all lineage-specific SNPs.
The direction of amino acid change was determined using the reconstructed ancestral
sequence of the MTBC. This sequence is similar to the H37Rv genome structure and has
the same nucleotide length, but with H37Rv alleles substituted by those inferred from a
reconstruction of the ancestral states using the derived phylogeny (section 3.2.4).
Inference of the ancestral alleles is possible because the chromosome is effectively a
single linkage group and all descendants share characteristics of the single ancestral cell
(Comas et al., 2010). Therefore, using the ancestral sequence is advantageous as it
enables the evolutionary direction of nucleotide change to be determined, instead of
basing the change from the reference strain H37Rv, which can be problematic as it is a
Lineage 4 strain.

3.3 Results
57
Figure 3.5. The average number of lineage-specific SNPs broken down into non-
coding and coding types. Coding SNPs are further subdivided into synonymous,
nonsynonymous, and nonsynonymous SNPs that affect stop codons, either through an
introduction of a stop codon in a coding sequence, (stop gain) or removal of existing
stop codons (stop loss).
Table 3.3. Summary of lineage-specific SNPs. This total includes the nonsynonymous
SNPs indicated in the table that affect stop codons, either through an introduction of a
stop codon in a coding sequence, (stop gain) or removal of existing stop codons (stop
loss).
SNP type
Lin
eage
1
Lin
eage
5
Lin
eage
6
Lin
eage
2
Lin
eage
3
Lin
eage
4
Mod
ern
linea
ge
Intergenic 59 90 86 16 53 18 57
Nonsynonymous 248 395 381 75 183 99 184
Stop gain 8 10 6 1 3 3 5
Stop loss 0 0 0 0 2 0 1
Synonymous 156 213 207 33 117 46 78
Total SNPs 463 698 674 124 353 163 319
!"#$
%%#$
!#$<1%
&'#$
Intergenic
Non-synonymous
Stop gain
Stop loss
Synonymous

3.3 Results
58
There were 1,556 genes (38.7% of all annotated genes) with one or more lineage SNP.
Three quarters (75.1%) of the genes with a lineage SNP harboured a single SNP (Figure
3.6A). The distribution of SNPs per gene followed a Poisson distribution, suggesting
that there is no clustering of SNPs at the gene specific level, ranging from 0 to a
maximum of 8 SNPs per gene (Figure 3.6B). The single gene with the highest frequency
of SNPs (Rv2424c, fas), encodes a probable fatty acid synthase and has multiple SNPs
present in Lineages 4, 5 and 6. Typical of lipid associated genes in M. tuberculosis, fas
is quite long at 9.21kb, compared to the average M. tuberculosis gene length at 1.0kb.
This is likely the cause of the high number of SNPs, and plotting the nucleotide length
of all genes with a lineage-specific SNP against SNP frequency found a positive
correlation (Pearson r = 0.43, p<0.0001), which is shown in (Figure 3.6C).
Figure 3.6 Distribution of lineage SNPs per gene. A. Frequency of SNPs per gene,
with actual SNP numbers recorded at top of bars. B. Poisson model (shown in red) fitted
to the data. The y-axis is plotted as a log10 scale to better show the SNP distribution. C.
Correlation between the number of SNPs per gene and gene length.
0 1 2 3 4 5 6 7 80
500
1000
1500
2000
2500
Number of SNPs per gene
Num
ber o
f gen
es
2464
1000
377
109 51 11 5 2 1
0 1 2 3 4 5 6 7 80.1
1
10
100
1000
10000
Number of SNPs per gene
Num
ber o
f gen
es (l
og10
)
0 2 4 6 80
5000
10000
15000
Number of SNPs per gene
Gen
e le
ngth
(nuc
leot
ides
)
A.! B.!
C.!

3.3 Results
59
3.3.4 Monomorphic population structure and homoplasic SNPs
The MTBC displays a highly clonal population structure (Supply et al., 2003); (Hirsh et
al., 2004). Consistent with this structure a negligible degree of homoplasy was observed
in the lineages. Of the 2,794 lineage-specific SNPs identified, four homoplastic SNPs
were found, corresponding to 0.14% of the lineage SNPs being homoplastic (Table 3.4).
The SNPs have the same nucleotide change across two or more of lineages, and three of
the four cause synonymous changes.
As shown in Table 3.4, the first homoplasy (SNP 1) at genomic position 1480945,
introduces a synonymous C to G mutation into codon 519 in Rv1319, which encodes a
possible adenylate cyclase (Cole et al., 1998). This mutation occurs in all Lineages 3
and 5 strains (Figure 3.7A), indicating convergent evolution of this nucleotide position
between an ancient and modern lineage. Interestingly, the homoplasy 2 also occurs in
Rv1319, at position 1480948, and is three nucleotides from the first homoplasy.
Furthermore, this also occurs in the same lineages (Lineage 3 and 5), causing a
synonymous C to T mutation in the preceding codon (codon 518). It was confirmed that
this was not an artefact from poor sequencing over this region by inspection of the MAQ
alignment files, and it was found that the surrounding 100bp region in strains from
Lineage 3 and 5 were mapped with high confidence, shown by MAQ quality scores of
1.0 (Heng, 2008). If an insertion or deletion was present this could cause erroneous
SNPs to be called in close proximity, but again this would cause a loss in the associated
MAQ quality scores for the region, and this was not found to be the true. Together this
would suggest that these two SNPs have been called with a high confidence, and the two
homoplasies are likely true.
The third and fourth homoplasic SNPs occur in Rv2082, which encodes a conserved
hypothetical protein. The two homoplasies are present in Lineages 1, 2 and 6,
introducing synonymous (A94A) and nonsynonymous (T96A) SNPs (Figure 3.7B).
Again these are in modern and ancient lineages, and located closely together, this time
within four nucleotides of each other. The gene is a conserved hypothetical with no
known function, but independent mutation of the same allele across three lineages might
suggest biological relevance. Although not within the lineage branch, some strains from
Lineage 4, including H37Rv, also have these two homoplasies as a sub-lineage
homoplasy.

3.3 Results
60
Table 3.4. Homoplasic nucleotide positions within the lineage branches. Independent
mutation of the same nucleotide position occurring across the phylogenetic tree. SNP
position based on the reference strain H37Rv genome coordinates. H
omop
lasy
Gen
e
SNP
posit
ion
Anc
ient
alle
le
SNP
alle
le
Mutation Lineages Gene
product
1 Rv1319c 1480945 C G T519T 3, 5 adenylate
cyclase
2 Rv1319c 1480948 C T E518E 3, 5 adenylate
cyclase
3 Rv2082 2338990 C G A94A 1, 2, 6 hypothetical
protein
4 Rv2082 2338994 A G T96A 1, 2, 6 hypothetical
protein
Figure 3.7. Homoplasic lineage SNPs. A. Homoplasy 1 and 2 occur in Rv1319c in
Lineages 3 and 5. B. Homoplasy 3 and 4 occur in Rv2082 in Lineages 1, 2 and 6.
A.! B.!

3.3 Results
61
In addition to the four homoplasic positions at the nucleotide level shown in Table 3.4,
there was one intergenic SNP at nucleotide position at 2566768 that was mutated to an
Adenosine in Lineage 4, but a Cytosine in Lineage 1 (Table 3.5). Finally, at the amino
acid level, the residue at position 733 within Rv0339c, harbours different
nonsynonymous SNP in Lineages 3 and 5. Rv0339c encodes a transcriptional regulatory
protein, and the two SNPs result in change to different amino acids in the lineages
(Table 3.5).
Table 3.5. Variable genomic positions within the lineages. Two nucleotide positions
harbour different SNPs across the lineages.
SNP
Gen
e
SNP
posit
ion
Anc
ient
alle
le
SNP
alle
le
Mutation Lineage Gene product
1 Rv2294-
Rv2295 2566768 G A intergenic 4
hypothetical
protein
Rv2294-
Rv2295 2566768 G C intergenic 1
hypothetical
protein
2 Rv0339c 406251 A G D733G 3
transcriptional
regulatory
protein
Rv0339c 406251 A C D733A 5
transcriptional
regulatory
protein

3.3 Results
62
3.3.5 Creation of pseudogenes
In total, thirty-nine SNPs were found to affect stop codons. SNPs can either cause the
premature introduction of a new stop codon at any point in the annotated coding
sequence (a nonsense SNP), or more rarely remove an existing stop codon. Thirty-six of
the SNPs cause the former type of nonsense mutation. As shown previously (section
3.3.3), the majority of SNPs occur in isolation within genes, and nonsense SNPs follow
this distribution, thus leading to the potential generation of thirty-five pseudogenes in
the respective lineages (Table 3.6A). The remaining three nonsynonymous SNPs have
the reverse effect, causing the loss or removal of an existing stop codon (Table 3.6B).
Whilst all lineages have accumulated nonsense SNPs, the three ancient lineages have the
greatest frequency, with nearly two-thirds of nonsense SNPs (24 out of 39 nonsense
SNPs). To test if this is due to the longer branch lengths of these lineages compared to
the modern lineages, and so a reflection of the greater time that these lineages have had
to accumulate nonsense mutations, the number of nonsense SNPs was compared to the
total number of SNPs found in each respective lineage branch, shown in Table 3.7.
Lineage 4 has the shortest branch length and one nonsense SNP, whilst Lineage 5 has
the longest branch and the most nonsense SNPs. A significant correlation was found
between branch length and the number of pseudogenes (Pearson r= 0.8477, p= 0.0160).
It can be seen from Table 6 that a large proportion of the nonsense SNPs are within
genes annotated as encoding hypothetical proteins (21 out of 39 SNPs). Using the formal
functional gene categories defined by Tuberculist, it was tested if the nonsense SNPs
were distributed across all gene function categories. Whilst all categories were affected
by one or more nonsense SNP, as expected the hypothetical category contained the
largest proportion (15 SNPs, 38.7%). Due to the low number of nonsense SNPs, it was
not possible to stratify into functional groups by each lineage, but the distribution of
nonsense SNPs was not significantly different for any of the functional categories using
the ancient and modern lineage groupings (Table 3.8) (Mann-Whitney U test, p= 0.24).

3.3 Results
63
Table 3.6 Nonsense SNPs. In total thirty-nine SNPs cause a change in the encoded stop
codon. A. Introduction of a stop codon within the coding sequence. B. Removal of an
existing stop codon. The stop codon is indicated by an asterisk (*) in column 3. Rows
are ordered by gene.
A. Stop introduction Gene Mutation Lineage Gene product
Rv0064 Q862* 5 hypothetical protein Rv0134 ephF W152* 1 epoxide hydrolase Rv0146 Y94* 3 hypothetical protein Rv0325 Q75* 4 hypothetical protein Rv0329c R141* 6 hypothetical protein Rv0368c S277* 5 hypothetical protein Rv0402c mmpL1 R376* 5 transmembrane transport protein Rv0457c W119* 1 peptidase Rv0490 senX3 R410* 6 two component sensor histidine kinase Rv0574c Q149* 5 hypothetical protein Rv0610c Q305* 1 hypothetical protein Rv0621 W355* Modern hypothetical protein Rv0836c W218* 4 hypothetical protein Rv0906 Q183* 1 hypothetical protein Rv1251c E875* 3 hypothetical protein Rv1504c E200* Modern hypothetical protein Rv1870c L212* Modern hypothetical protein Rv1912c fadB5 G63* 3 oxidoreductase Rv1965 yrbE3B W11* 5 integral membrane protein Rv2079 Q609* 2 hypothetical protein Rv2132 Y60* 5 hypothetical protein Rv2187 fadD15 Y81* 6 long-chain-fatty-acid-CoA ligase Rv2187 fadD15 W43* 1 long-chain-fatty-acid-CoA ligase Rv2299c htpG Q109* 6 heat shock protein 90 Rv2339 mmpL9 S917* 5 transmembrane transport protein Rv2690c R658* Modern hypothetical protein Rv2788 sirR Q131* 1 transcriptional repressor Rv2797c Q273* 5 hypothetical protein Rv2818c Q304* 6 hypothetical protein Rv2850c R515* 5 magnesium chelatase Rv2994 W68* 1 integral membrane protein Rv3079c E120* 1 hypothetical protein Rv3373 echA18 G214* Modern enoyl-CoA hydratase Rv3416 whiB3 E71* 5 transcriptional regulatory protein Rv3729 W369* 6 transferase Rv3898c Q111* 4 hypothetical protein B. Stop removal
Gene Lineage Gene product Rv0257 *23R Modern hypothetical protein Rv1641 infC *202S 3 translation initiation factor IF-3 Rv1921c lppF *424G 3 lipoprotein

3.3 Results
64
Table 3.7. Nonsense SNPs by lineage. Thirty-six lineage-specific nonsynonymous
SNPs result in the introduction of a stop codon within the coding sequence (nonsense
SNP). The number of nonsense SNPs is correlated to branch length.
Lineage Nonsense Branch length
(SNPs)
1 8 463
5 10 698
6 6 674
2 1 124
3 3 353
4 3 163
Modern 5 319
Table 3.8 Nonsense SNPs grouped by functional category. Nonsense SNPs separated
by functional category of the affected gene, and into modern (Lineages 2, 3 and 4) and
ancient groups (Lineages 1, 5 and 6). Rows are ordered by descending total number of
SNPs per functional category.
Lineage
Functional category Total Modern Ancient
conserved hypotheticals 15 7 8
cell wall and cell processes 7 3 4
lipid metabolism 5 3 2
intermediary metabolism and
respiration 3 0 3
regulatory proteins 3 0 3
virulence, detoxification, adaptation 3 0 3
unknown 2 1 1
information pathways 1 1 0

3.3 Results
65
3.3.5.1 Nonsense and stop codon removal SNPs in essential genes
The thirty-eight genes harbouring the thirty-nine nonsense and stop codon removal
SNPs were next grouped by gene essentiality. These groups are based on the genome-
wide analyses of mutants that were unable to grow in vitro on Middlebrook 7H11 agar
or in the spleens of intravenously infected mice (Sassetti et al., 2003; Sassetti & Rubin,
2003).
Strikingly, all but two of the genes harbouring a SNP involved in creation or removal of
a stop codon were nonessential. There were 36 SNPs in nonessential genes compared to
2 in essential, out of a genome-wide number of 2,986 nonessential and 760 essential
genes (X2 test; p = 0.0362). Given that nonsense SNPs within essential genes would
highly likely cause a loss of function for the encoded protein that leads to cell death, this
result is perhaps unsurprising. One of the two exceptions is in Lineage 6, an M.
africanum lineage. Here an amino acid change at position 410 in senX3 (Rv0490), leads
to the change of an Arginine residue for a stop codon. SenX3 encodes a predicted
secreted two component sensor histidine kinase (Malen et al., 2007). Whilst this has the
potential to severely affect the function of the encoded protein, the precise position of
the SNP within the gene will determine the length of protein truncation, and so the likely
severity. The amino acid length of SenX3 is 410, which places the new stop codon
directly adjacent to the existing ancestral stop codon, and an ensuing loss of only one
amino acid residue from the protein C-terminus; such a short truncation is likely to have
little or no effect on gene function which may explain why the SNP is allowed to persist
in the lineage.
A similar scenario exists in the second essential gene harbouring a stop codon affecting
SNP. infC (Rv1641) encodes the translation initiation factor-IF3, one of the three
initiation factors in bacteria (Malys & McCarthy, 2011). IF3 binds to the 30S ribosomal
subunit, and shifts the equilibrium between 70S ribosomes and their 50S and 30S
subunits by promoting dissociation of 30S from 50S, and thereby subsequent binding of
mRNA (Liveris et al., 1993); it is therefore required for the initiation of protein
biosynthesis in bacteria. Lineage 3 strains carry a nonsynonymous SNP that removes the
existing stop codon at codon position 202, and introduces a Serine residue (Table 3.6B).
This could lead to transcription of infC into the following intergenic region and potential
fusion to the next encoded gene, rpmI. However, 27 nucleotides downstream from the
removed stop codon is another in frame stop codon at position 1852903. Therefore infC

3.3 Results
66
in Lineage 3 is 27 nucleotides longer, and the protein 9 amino acids longer, than in the
rest of the MTBC. Again, this is unlikely to be harmful to the cell.
3.3.5.2 Length of protein truncation
The majority of SNPs that affect a stop codon cause the introduction of termination
codon within the coding sequence (36 nonsense SNPs). Whilst this has the potential to
severely affect the function of the encoded protein, it has been demonstrated previously
(section 3.3.5.1) that the position of the SNP within the gene should also be taken into
account. Comparing the full-length ancestral protein sequence to the truncated protein
revealed that truncations were distributed throughout the protein length (Figure 3.8A).
There was only one example of more than one nonsense SNP within a gene. Lineage 6
strains have two SNPs within fadD15, both of which would cause >85% loss of the
protein length. The most extreme truncation, in yrbE3B (Rv1965), will lead to a protein
96.3% shorter in length than the ancestral protein. Although yrbE3B encodes a protein
of unknown function, it is highly similar to other membrane proteins, and forms one of
the mammalian cell entry operons in M. tuberculosis (Mce3) (Cole et al., 1998). Overall,
14 SNPs (38.9% of all nonsense SNPs) cause the deletion of >50% of the ancestral
amino acid sequence; such a deletion might be expected to have severe effects on the
function of the gene product.
It can been seen in Figure 3.8A that nine of the nonsense SNPs cause <1% of the
protein being truncated. Apart from senX3, which has one amino acid truncated and
described in the above section (3.3.5.1), the remaining eight genes affected by nonsense
SNPs have 0% deletions. This is an artefact of basing the length of truncations on
H37Rv strain annotations, a Lineage 4 strain. Therefore the analysis is identifying
proteins with a premature stop codons introduced either from Lineage 4 or more basal
Modern lineage branch, which have then been integrated into the H37Rv annotations.
Interestingly, in four cases the nonsense SNPs have created two open reading frames
that have been annotated as separate genes in H37Rv: these genes are Rv0325-Rv0326,
Rv1504c-Rv1503c, Rv3373-Rv3374 and Rv3898c-Rv3897c. Whilst these are
effectively new genes in the respective lineages, all but one are annotated as encoding
hypothetical proteins. The single exception is echA18 (Rv3373) and echA18.1 (Rv3374)
which encode probable Enoyl-CoA hydratases, but was previously a single open reading
frame (Figure 3.9).

3.3 Results
67
The three SNPs that remove existing stop codons lead to proteins that are 104.3-563.6%
greater in amino acid length compared to existing annotations (Figure 3.8B). This is
based on the next in frame stop codon from the 3’ end of the annotated gene. infC has
the smallest increase in length, and was described previously (section 3.3.5.1). The
remaining two genes, lppF and Rv0257, increase by 110 (110.2% increase) and 104
(563.6%) amino acids.
Figure 3.8. Change in protein length due to nonsense SNPs. A. Distribution of
protein truncations due to thirty-six nonsense SNPs causing premature stop codon
introductions. Truncations expressed as percentage change based on H37Rv annotations.
Note fadD15 shown twice due to two SNPs that introduce stop codons. Black bars
indicate the deletion; grey bars are remaining protein. B. Percentage increase in protein
length from three SNPs that remove existing stop codons. Striped bars indicate new
protein sequence.
A.!
B.!
0 20 40 60 80 100 120 300 600Rv0257
lppFinfC
Percentage increase in protein length
0 20 40 60 80 100yrbE3BfadD15fadD15Rv2994
htpGRv0457c
fadB5Rv0146
Rv0574cmmpL1
Rv3079cRv3729
Rv2797cRv0906
ephFsirR
Rv0329cRv0368c
whiB3Rv1251cRv2132
Rv0610cRv2818cRv2850cRv0064Rv2079mmpL9senX3
Rv0325Rv0621
Rv0836cRv1504cRv1870cRv2690c
echA18Rv3898c
Percentage of protein truncated

3.3 Results
68
Figure 3.9. Gene creation by nonsense SNPs. echA18 (Rv3373) and echA18.1
(Rv3374) is a contiguous open reading frame in the ancient sequence, but introduction
of a nonsense SNP in the modern branch led to the annotation of two genes in the
reference H37Rv, and all other modern lineage strains.

3.3 Results
69
3.3.6 SNPs within genes associated with antibiotic resistance
Many drug resistance-conferring mutations have been identified in the MTBC and are
held in the publicly available TBDReaMDB database (Sandgren et al., 2009).
Identification of such mutations has been important in the development of molecular
genotypic based assays for drug resistance (Boehme et al., 2011; Hillemann et al.,
2007). However, as shown in this study, many SNPs in the MTBC are phylogenetic
markers for the lineage, and so it is important to understand the underlying phylogeny to
distinguish SNPs within drug resistant genes that are unlikely to be the cause of drug
resistance but instead phylogenetic markers.
Using the above database, the lineage-specific SNPs were screened to identify SNPs
within genes associated with drug resistance. In total, forty-six coding SNPs were
identified, thirty-two were nonsynonymous and fourteen synonymous. Lineage-specific
SNPs were found in genes associated with resistance to six of the nine antibiotics used
in the treatment of tuberculosis, these were: Ethambutol (SNPs in 9 out of 13 associated
genes), ethionamide (2 of 3), flurorquinolones (2 of 2), isoniazid (11 of 23), rifampicin
(1 of 2) and streptomycin (1 of 3) (Figure 3.10). A further two intergenic SNPs were in
potential regulatory regions (<100bp from the translational start site) of the genes ahpC
and rpoB, which are associated with isoniazid and rifampicin resistance respectively
(Ramaswamy & Musser, 1998; Sherman et al., 1996). Whilst more SNPs in drug
resistance associated genes were found in the two M. africanum lineages (11 SNPs
each), all lineages harboured at least one example (see Appendix C for details).
Figure 3.10 Lineage-specific SNPs within genes associated with drug resistance. In
total 46 SNPs were identified.
Ethambu
tol
Ethion
amide
Flurorq
uinolo
nes
Isonia
zid
Rifampic
in
Strepto
mycin
0
5
10
15
20
Num
ber o
f SN
Ps
3.3 Results
70
Whilst one of the genome sequences used to construct the whole genome phylogeny is
extensively drug resistant (XDR) (Lineage 4 strain KZN 605), the inherent nature of this
study excludes SNPs only present in one strain (singleton SNPs), and so all of the
lineage-specific SNPs are not directly involved in causing drug resistance. Interestingly,
nine of the forty-six lineage-specific SNPs identified above were found within the
TBDream database (19.6%), shown in Table 3.9. It is therefore likely that these lineage-
specific SNPs have been incorrectly associated with drug resistance.
It can be seen at the top of Table 3.9 that a cysteine to tyrosine mutation (C110Y) within
embR (Rv1267c) was found in a study by (Srivastava et al., 2009). This SNP is present
within all strains from Lineage 1. In the former study, three genes implicated in
ethambutol resistance (embB, embC and embR) were sequenced in 44 ethambutol
resistant clinical strains isolated in India (Srivastava et al., 2009). The C110Y mutation
was found within one of the study strains, which also had two mutations in embC
(G288W and V303G). The C110Y mutation therefore identifies this strain as likely
belonging to Lineage 1. Lineage 1 is not prevalent in the country from which the strains
were isolated (Gagneux et al., 2006a; Gagneux & Small, 2007), which might account for
there only being one instance of the SNP out of the 44 strains in the study. Interestingly,
Lineage 1 strains also harbour two more lineage-specific SNPs within genes involved in
ethambutol resistance, one in embA (Rv3794), a P913S mutation, and another within
embC (Rv3793), a N394D mutation but these were not found in the study. However,
embA was not sequenced and the primers used to sequence embC did not extend beyond
the 5’ 308bp region of embC that has sequence homology to the resistance-determining
region (ERDR), and so missed the Lineage 1 SNP that is in the middle of the gene
(Sreevatsan et al., 1997b; Srivastava et al., 2009). It is therefore not possible for C110Y
SNP to be involved directly in drug resistance to ethambutol.
The above study and others have identified the most common mutation reported in
embC at codon 270 (I270T) (Srivastava et al., 2006; Srivastava et al., 2009). However,
in this study the mutation was found to be a modern lineage SNP, and so is present
within Lineages 2, 3 and 4. This would make the mutation highly prevalent in the study
areas where the strains were isolated (Srivastava et al., 2006; Srivastava et al., 2009).
The mutation is typically reported as the conversion of an existing Tyrosine residue, but
most studies use the reference strain H37Rv as the ancient allele, and therefore the
direction of change is reported incorrectly; this agrees with the findings of (Koser et al.,
2011).

3.3 Results
71
Table 3.9. Putative mutations found in drug resistance studies incorrectly
associated with drug resistance. All SNPs are lineage-specific, and therefore
phylogenetic markers of the respective lineages.
Lineage Gene Mutation Drug
resistance Primary reference
1 Rv1267c embR C110Y ethambutol Srivastava et al., 2009
3 Rv3264c manB D152N ethambutol Ramaswamy et al., 2000
Modern Rv3793 embC I270T ethambutol Sreevatsan et al., 1997b;
Srivastava et al., 2009
1 Rv3793 embC N394D ethambutol Ramaswamy et al., 2000
3 Rv3793 embC R738Q ethambutol Ramaswamy et al., 2000
1 Rv3794 embA P913S ethambutol Ramaswamy et al., 2000
Modern Rv3795 embB A378E ethambutol Srivastava et al., 2006
4 Rv1908c katG L463R isoniazid Heym et al., 1995
3 Rv2242 M323T isoniazid Ramaswamy et al., 2003

3.3 Results
72
3.3.7 Conservation and removal of lineage-specific nonsynonymous SNPs
In the following section the extent to which nonsynonymous SNPs are removed from the
lineages was analysed. The commonly used method to detect selection by measuring the
proportion of nonsynonymous nucleotide changes (dN) to synonymous nucleotide
changes (dS) was applied to the lineage-specific SNPs (see 3.2.6). A dN/dS >1 indicates
positive selection, <1 indicates purifying selection and a ratio at or close to 1 is regarded
as neutral, or a balance of the two former selective forces. The rate of nonsynonymous
SNP accumulation was first compared across the six lineages. The relatively low
number of SNPs within the MTBC made calculation of dN/dS for individual genes of
questionable value and impossible for the 2,459 (61.2%) genes with no lineage-specific
SNPs. As an alternative approach the dN/dS ratio was calculated using gene
concatenates based firstly on all genes, then gene essentiality and functional categories.
The mean dN/dS for the lineages was 0.67 (ranging from 0.54-0.79), corresponding to
nearly two thirds (64.8%) of SNPs causing a change to the encoded amino acid (Table
3.10). This finding is consistent with the average dN/dS based on all SNPs identified in
21 MTBC genome sequences (dN/dS=0.59), and the sequencing of 89 genes from 108
MTBC strains (dN/dS=0.57) (Comas et al., 2010; Hershberg et al., 2008). If the lineages
are grouped into the ancient and modern categories, the mean dN/dS was 0.61 and 0.72
respectively; whilst a higher rate of nonsynonymous SNP accumulation was found in the
modern lineages, the difference between two is not significant (Mann Whitney U test,
p=0.2118). High dN/dS ratios are often considered to indicate a reduction in purifying
selection (He et al., 2010; Hershberg et al., 2008; Holt et al., 2008), which would
suggest here that all lineages are experiencing the same weak purifying selection.
Alternatively, signals of weak purifying selection may be due to the close relatedness of
the MTBC strains. Rocha et al. (2006) has shown that dN/dS is often higher when the
organisms compared are closely related. Therefore dN/dS becomes dependent on time
due to a lag in the time to remove deleterious nonsynonymous mutations by purifying
selection, and so elevating dN/dS.
To test how the frequencies of nonsynonymous SNPs vary over different timescales, the
ratio of nonsynonymous to synonymous SNPs was compared in different branches of the
phylogenetic tree. No significant difference was found in the SNP ratio from the lineage
branches compared to the external branches, which includes SNPs from the twenty-eight
extant strains used in the phylogeny (Mann Whitney U test, p = 0.1033). The mean

3.3 Results
73
lineage branch ratio was 1.9, whilst the external branches 1.7 (Appendix D), suggesting
that nonsynonymous SNP accumulation in the MTBC is a consistent feature irrespective
of time.
Table 3.10. The rate of nonsynonymous SNP accumulation across the lineages. The
dN/dS ratio was used, which measures the accumulation of nonsynonymous SNPs
against the background rate of synonymous SNPs.
Lineage
5
Lineage
6
Lineage
1
Lineage
4
Lineage
2
Lineage
3
Modern
Nonsynonymous
SNP
385 374 238 96 74 182 172
Synonymous
SNP
213 206 156 46 33 117 78
Nonsynonymous
positions (N)
2968425 2968425 2968425 2968425 2968425 2968425 2968425
Synonymous
positions (S)
1052024 1052024 1052024 1052024 1052024 1052024 1052024
dN rate 0.000130 0.000126 0.000081 0.000032 0.000025 0.000061 0.000058
dS rate 0.000202 0.000196 0.000148 0.000044 0.000031 0.000111 0.000074
dN/dS 0.64 0.64 0.54 0.74 0.79 0.55 0.78
3.3.7.1 Nonsynonymous SNPs within essential genes
The previous method was based on total sequence concatenates which is quite a blunt
method for detecting selection, likely averaging both purifying and potential positive
selection in the sequences. Further concatenates were generated based on biologically
relevant categories. Firstly, genes were grouped by those shown to be essential for
growth by transposon mutagenesis (Sassetti et al., 2003; Sassetti & Rubin, 2003). Based
on the findings in other bacteria and evolutionary theory, it would be expected for less
nonsynonymous SNPs to accumulate within genes that are essential to the cell (Jordan et
al., 2002). There were 335 (14.0%) nonsynonymous SNPs and 212 (8.9%) synonymous
SNPs within essential genes, leaving the remaining 1215 (50.8%) nonsynonymous and
630 (26.3%) synonymous SNPs within nonessential genes. Adjusting for differences in
the nucleotide length of the two categories using the number of potential

3.3 Results
74
nonsynonymous SNP positions, it was found that significantly less nonsynonymous
SNPs were within essential genes (X2, p=0.0011). Whilst the average dN/dS for essential
genes was lower than nonessential (0.56 and 0.68 respectively), indicating that essential
genes are more conserved than nonessential.
3.3.7.2 Nonsynonymous SNPs within functional gene categories genes
Gene concatenates were next generated for all gene functional categories based on the
Tuberculist database. Seven categories were tested: 1. information pathways, 2.
intermediate metabolism and respiration, 3. lipid metabolism, 4. cell wall and cell wall
processes, 5. conserved hypothetical, 6. virulence-detoxification and adaptation and 7.
regulatory proteins (Lew et al., 2011). In Figure 3.11A, the dN/dS ratios across these
categories are shown. A one-way ANOVA of the dN/dS for each lineage and functional
category found an uneven distribution (Kruskal-Wallis test, p=0.0084). Following
multiple testing correction it was seen that the dN/dS between the information pathways
and regulatory protein categories was significantly different (Dunn's Multiple
Comparison Test, p<0.05). It might be expected for the information pathways class to
have the lowest number of nonsynonymous SNPs due to the critical function of these
genes within cell, such as in DNA replication and repair. This was confirmed by
comparison of the percentage of essential genes per functional category to the dN/dS
ratio, which found a significant correlation (Spearman r = -0.8929, p = 0.0123) (Figure
3.11B).
Whilst there was evidence of gene function categories varying by the level of low
purifying selection, only genes within the regulatory category showed strong signs of
positive selection in multiple lineages (mean dN/dS = 1.16) (Table 3.11). Stratifying the
regulatory functional category by lineage, the dN/dS was > 1 in Lineages 3, 4, 5 and 6.
Focusing on this category, 84 regulatory proteins harboured 132 lineage-specific SNPs -
101 nonsynonymous and 31 synonymous. This corresponds to a nonsynonymous to
synonymous ratio of 3.3, compared to the mean of ratio of 1.9 found across all
functional categories. Potential positive selection (dN/dS >1) was also seen in the
intermediary metabolism and respiration category for just Lineage 2 (dN/dS=1.49), and
in lipid metabolism also for Lineage 2 (dN/dS=1.13) and the modern lineage branch
(dN/dS =1.39) (Figure 3.11A).
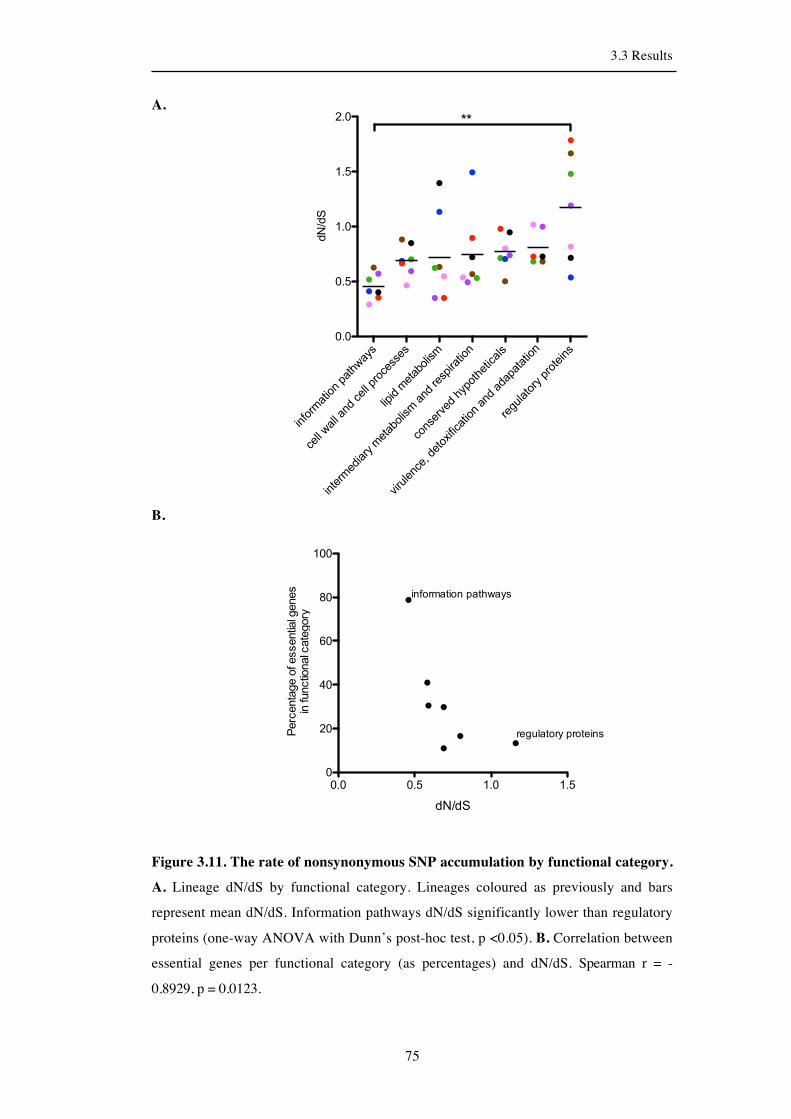
3.3 Results
75
A.
B.
Figure 3.11. The rate of nonsynonymous SNP accumulation by functional category.
A. Lineage dN/dS by functional category. Lineages coloured as previously and bars
represent mean dN/dS. Information pathways dN/dS significantly lower than regulatory
proteins (one-way ANOVA with Dunn’s post-hoc test, p <0.05). B. Correlation between
essential genes per functional category (as percentages) and dN/dS. Spearman r = -
0.8929, p = 0.0123.
!"#$%&'(!$")*'(+,'-.
/011),'11)'"2)/011)*%$/0..0.
1!*!2)&0('3$1!.&
!"(0%&02!'%-)&0('3$1!.&)'"2)%0.*!%'(!$"
/$".0%402)+-*$(+0(!/'1.
4!%510"/06)20($7!#!/'(!$")'"2)'2'*'('(!$"
%0851'($%-)*%$(0!".
9:9
9:;
<:9
<:;
=:9 >>
2?@2A
0.0 0.5 1.0 1.50
20
40
60
80
100
information1pathways
regulatory1proteins
dN/dS
Percentage1of1essential1genes1
in1functional1category

3.3 Results
76
Table 3.11. The rate of nonsynonymous SNP accumulation in each functional
category. The nonsynonymous/synonymous ratio and dN/dS ratio is shown. N= all
possible nonsynonymous positions, S = all possible synonymous positions.
N
onsy
nony
mou
s SN
Ps
Syno
nym
ous
SNPs
nons
ynon
ymou
s /sy
nony
mou
s
N S dN/dS
information pathways 96 73 1.3 202427 70831 0.46 lipid metabolism 168 99 1.7 294422 102505 0.59 intermediary metabolism and respiration 394 237 1.7 765073 268496 0.58 cell wall and cell processes 377 197 1.9 595063 214706 0.69 conserved hypotheticals 344 175 2.0 594619 209012 0.69 virulence, detoxification, adaptation 64 29 2.2 106294 38498 0.80 regulatory proteins 101 31 3.3 123975 44208 1.16

3.4 Discussion
77
3.4 Discussion
3.4.1 Strengths and limitations of this study
This study used recently published MTBC genomes sequenced by high-throughput
sequencing technology to identify for the first time all SNPs that contribute to the
background genetic variation within the six lineages of the MTBC. At the time of this
study about thirty globally representative strains from all of the lineages had been
sequenced and the genomes made publicly available. It is likely that a discovery bias
exists within this small genome set, as illustrated in Figure 3.2 where it was seen that the
lineages with the most genome sequences (Lineages 1, 2 and 4) had the greatest within-
lineage diversity. Lineages 5 and 6 only had two genome sequences available to use in
this study. However, this study was designed to capture variation within the internal
basal branches of each lineage through exploitation of the clonal population structure of
the MTBC, and this should circumvent any discovery bias. Theoretically, as backward
mutations are rare in the MTBC, genome sequences from two strains belonging to the
same lineage would capture all lineage-specific SNPs for the respective lineage, and
additional genomes will only serve to reduce the branch length and so the number of
lineage-specific SNPs. Finally, twenty-one of the genomes used to construct the genome
phylogeny were selected from a wider collection of 875 strains characterised previously
by the analysis of deletions across the genome (Comas et al., 2010; Gagneux et al.,
2006a; Hershberg et al., 2008). Therefore, whilst it is expected that future studies will
sequence ever-greater numbers of MTBC strains, the lineage-specific SNPs identified in
this study are expected to be robust.
Removal of SNPs found within repetitive regions, such as in phages, and the PE and
PPE gene families, will likely have resulted in the loss of potentially important variation
within the MTBC lineages. Pe genes are characterised by the presence of a proline-
glutamic acid (PE), whilst ppe genes contain a proline-proline-glutamic acid (PPE); both

3.4 Discussion
78
families are highly variable in size and contain extensive repetitiveness of their C-
terminal regions (Cole et al., 1998). Excluded regions total ~10% of the coding genome,
and recently it has been shown that the large pe and ppe families harbour about 3-fold
higher frequency of nonsynonymous SNPs compared to non-pe/ppe genes (McEvoy et
al., 2012), which would suggest that a pool of lineage-specific variation might have been
missed in this study. It was necessary to remove SNPs identified in these regions due to
inherent difficulties encountered in sequencing through repetitive regions using the
second generation short read technologies, such the Illumina sequenced strains used in
this study. SNPs were detected in these regions in the lineage branches, but they would
need to be confirmed by methods beyond the scope of this study. This is a common
disadvantage of current short read sequencing technology (Loman et al., 2012), and
developments in sequencing technology with longer read lengths will likely remove this
current limitation (Branton et al., 2008).
3.4.2 General characteristics of lineage-specific diversity
Prior to identification of the lineage-specific SNPs, a 28-genome phylogeny was built
using a non-redundant set of variable nucleotide positions derived from the genome
sequences. The phylogeny was largely derived from the genome sequences published
previously (Comas et al., 2010), and supplementing by other recently published genome
sequences available in the EBI SRA. An additional strain (N0031), known to be a rare
Lineage 2 strain based on a previous MLSA study, was sequenced for this project to
widen diversity in this lineage (Hershberg et al., 2008). The topology of the resulting
phylogeny was highly congruent with other MTBC phylogenies based on SNPs and
other markers, such as deletions, further highlighting the clonal population structure of
the MTBC (Comas et al., 2010; Gagneux et al., 2006a).
In total 2,794 SNPs lineage-specific SNPs were identified, with each lineage differing
by an average of 400 SNPs. The ancient lineages (Lineages 1, 5 and 6) harboured the
most lineage-specific SNPs, which is likely a reflection of the greater time that these
lineages have had to accumulate mutations. On average, two-thirds of all coding SNPs
were nonsynonymous and therefore cause a change in the encoded amino acid. This is a
feature of the MTBC, and has been previously identified at the genome level
(Fleischmann et al., 2002; Hershberg et al., 2008). Nonsynonymous SNPs are more
3.4 Discussion
79
likely than synonymous SNPs to have a functional effect, which raises the possibility
that this variation will have functional consequences in the respective MTBC lineages.
The ability to isolate the total background SNP variation that contributes to the diversity
of all strains from a particular lineage (lineage-specific SNPs) was fundamental to this
study. This was only possible due to the negligible level of recombination seen in the
MTBC (Liu et al., 2006), and because back mutations are rarely observed (Casali et al.,
2012). Therefore a SNP in the parental strain becomes a defining marker for the rest of
the progeny. It has previously been reported that homoplasic nucleotide positions are
rare in the MTBC, in which a SNP cannot be explained without convergence when
mapped onto the tree, and typically found only in cases of drug resistance or
compensatory mutations (Casali et al., 2012; Comas et al., 2011). Similar examples
have been found in other bacterial studies, such as the sequencing of MRSA strains,
where the authors found few homoplasic SNPs but when identified, corresponded to
mutations conferring antibiotic resistance (Harris et al., 2010). In this study it was
found that there were only four cases of homoplasic SNPs (0.14% of all lineage-specific
SNPs), in which lineage-specific SNPs with the same nucleotide change were present in
more than one lineage (Table 3.4). Independent fixation of SNPs across multiple
lineages could represent signals of selective pressure acting on these positions, and this
was strengthened by the distribution of the four SNPs, whereby they cluster within two
genes and are within a few nucleotides of each other. Whilst these may have biological
significance, the respective genes are not associated with drug resistance. Further work
would be needed to confirm these SNPs and to understand if these SNPs have biological
function.
The lineage-specific SNPs can also be exploited in SNP typing assays to genotype
strains, either at the lineage or from any sub-lineage level (Bergval et al., 2012; Kahla et
al., 2011; Stucki et al., 2012). SNP typing is suggested to be the new gold standard of
phylogenetic classification of MTBC (Comas et al., 2009), and the majority of the SNPs
identified in the lineage branches in this study, excluding the above homoplasies, would
be applicable to such typing assays. At the epidemiological level, genotyping of strains
has also been driven by the need for rapid tests to identify drug resistant strains.
Resistance to first-line TB drugs rifampicin and isoniazid (Multidrug resistance or
MDR-TB), and now also to some second-line drugs (extensively drug resistant
tuberculosis or XDR-TB) has led to a growth in molecular genotypic drug susceptibility
testing, such as the Genotype MTBDRplus (Hain Life science) and Xpert MTB/RIF

3.4 Discussion
80
(Cepheid) (Boehme et al., 2011; Hillemann et al., 2007; McNerney et al., 2012). Several
SNPs were identified within drug resistant associated genes that are not associated with
drug resistance, but act as evolutionary markers (Table 3.9). Previous studies have
identified highly prevalent mutations within drug resistant strains, but these have been
shown here to be lineage-specific markers. Other studies have also questioned some
associations of SNPs with drug resistance. A significant association of a SNP within
Rv2629 and rifampicin resistance was found based on a study of over 100 rifampicin resistant strains (Wang et al., 2007), but this was subsequently shown to be a
phylogenetic marker of Lineage 2, specifically of the Beijing group of strains(Homolka
et al., 2009)(Homolka et al., 2009)(Homolka et al., 2009)(Homolka et al.,
2009)(Homolka et al., 2009). Similar approaches have been applied to inhA SNPs with
isoniazid resistance, and embC SNPs with ethambutol resistance, that are instead
phylogenetic markers and unlikely the cause of drug resistance (Projahn et al., 2011;
Ramaswamy et al., 2000). From the perspectives of typing strains for evolutionary
analysis, and linking genotype to phenotype to identify potential molecular causes of
drug resistance, it is clear that an understanding of the underlying phylogenetic structure
of the MTBC is critical.
Whilst several lineage-specific SNPs within genes associated with drug resistance are
unlikely to be direct causes of resistance, some could play an indirect role in modulating
the fitness cost of drug resistant mutations. It has been shown that strains from different
lineages but with identical rifampicin resistance mutations show different levels of
fitness cost (Gagneux et al., 2006b). In a wider context, the Beijing family of strains
within Lineage 2 is often associated with drug resistance (Borrell & Gagneux, 2009;
Parwati et al., 2010). It has been suggested therefore that strain genetic background
plays a role in the spread of drug resistance strains (Muller et al., 2013), although the
actual molecular mechanisms of this are currently unknown. Pre-existing mutations in
genes associated with drug resistance, such as the lineage-specific SNPs found in this
study, may increase the tolerance of the cell to future drug resistance mutations through
higher baseline fitness, or epistatic interactions between the genetic background of the
strain and drug resistance mutations (Muller et al., 2013).
3.4.3 Insights into the evolution of M. tuberculosis lineages
It has been hypothesised that, due to historical human migrations and serial transmission
bottlenecks due to the low-infectious dose of tuberculosis, the MTBC have small

3.4 Discussion
81
effective populations size (Hershberg et al., 2008). This phenomenon can lead to
increased random genetic drift compared to natural selection, limiting the removal of
potential functional mutations (Smith et al., 2006a). As discussed above, about two-
thirds of all coding SNPs cause a change in the encoded amino acid, however
nonsynonymous SNPs that cause the introduction or change of existing stop codons
would highly likely cause a loss of function. Although rare (1.3% of all lineage-specific
SNPs), thirty-five lineage-specific pseudogenes were identified due to the introduction
of stop codons in the lineage branches. These genes may have been allowed to lose their
function either due to the genome-wide loss of selective constraint in the MTBC, or
potentially selection may have been relaxed during adaptation to a new niche in the
respective lineages. The former hypothesis is more likely however, as no difference was
found between the frequency of pseudogene creation or functional category of affected
gene and the specific lineage. Furthermore, most genes were conserved hypotheticals
and all but one nonessential to growth; the exception was senX3, but the nonsense SNP
in Lineage 6 resulted in a modest loss of one amino acid, unlikely to affect function. The
annotated H37Rv genome sequence contains thirteen pseudogenes (Lew et al., 2011),
and it is likely that all of these pseudogenes are the result of random drift, which will
eventually be removed by deletions leaving a tighter packed and eventually more
reduced genome.
With such little variation in MTBC it is not currently possible to measure selection in
each gene, although future whole genome studies employing low hundreds to thousands
of MTBC genomes may enable this. An approach to analyse selection in DNA sequence
data is to use dN/dS ratio, which provides a measure of the accumulation of
nonsynonymous SNPs against the background of assumed silent synonymous SNPs. The
dN/dS measure has been applied to many bacterial species to understand the
evolutionary histories, including Salmonella typhi (Roumagnac et al., 2006),
Clostridium difficile (He et al., 2010) and previously in the MTBC (Hershberg et al.,
2008). However, the method was originally developed for the analysis of genetic
sequences from divergent species (Kimura, 1977), and it has recently been suggested
that it is inappropriate for the analysis for variation within a population (Kryazhimskiy
& Plotkin, 2008). The problem with such comparisons is the potential short times scales
involved, whereby slightly deleterious mutations that will have been removed by
selection cannot be separated from substitutions that are fixed in the population (Rocha
et al., 2006); this has been shown to lead to high dN/dS values for closely related
bacteria, often approaching 1 (Rocha et al., 2006). If this is the case in the MTBC, it

3.4 Discussion
82
might be expected for the external branches of the phylogeny, which includes SNPs
from the extant strains, to harbour more nonsynonymous SNPs than the lineage-specific
SNPs that were the focus of this study. Mutations would be expected to decrease over
time as they are purged by purifying selection. In this study, the ratio of nonsynonymous
to synonymous SNPs was not different between the external tips of the tree compared to
the lineage branches (ranging from a ratio of 1.9 in the lineage branches, to 1.7 in the
external). This is in agreement with other studies (Hershberg et al., 2008), and together
shows that nonsynonymous SNPs are not more intensely purged than synonymous
SNPs, which would suggest that the high dN/dS is not due to close relatedness of the
strains.
Previous studies of MTBC variation found genome-wide dN/dS values of 0.57
(Hershberg et al., 2008) and 0.60 (Comas et al., 2010). These suggest strongly reduced
purifying selection acting within MTBC. It has been suggested that the cause of this
reduced selection is due to the small effective population size of the MTBC, which is a
consequence of the clonality of the MTBC and serial population bottlenecks during
transmission of TB (Hershberg et al., 2008; Smith et al., 2006a). The mean dN/dS for
the lineage branches found in this study was 0.67, with no significant difference in the
overall dN/dS per lineage. The lack of significant differences between the lineages
suggests that the hypothesised reduction in purifying selection is a general feature across
the lineages. Categorising all genes by essentiality, the effects of purifying selection
could however still be detected in the MTBC, with significantly fewer nonsynonymous
SNPs in essential genes. Furthermore, splitting genes by annotated function, the gene
category with critical function to the cell had the lowest dN/dS. This information
pathways category consists of genes involved in critical cellular functions, including
genes involved in transcriptional and translational machinery. At the other end of the
spectrum, the regulatory gene category had the greatest accumulation of
nonsynonymous SNPs; four of the lineages (Lineages 3, 4, 5 and 6) had dN/dS ratios >1,
indicating potential positive selection within this class, with three to five times more
nonsynonymous to synonymous SNPs.
High frequencies of nonsynonymous SNPs in regulatory genes have been detected
previously. In 2011, Schürch et al. sequenced several isolates from the Beijing family of
the MTBC, a subgroup of Lineage 2, and found overrepresentation of nonsynonymous
SNPs in the regulatory and associated signalling transduction pathways (Schürch et al.,
2011). As previously discussed, in this study gene concatenates were used, which has

3.4 Discussion
83
the disadvantage of averaging the selective forces acting on the sequences and thereby
providing a summary of the pressure acting on the sequences; it is not possible to
identify individual genes potentially under positive selection. Furthermore, analysing the
frequency of SNPs clustering within genes, it was found that no genes harboured a rate
that deviated from the expected Poisson distribution. This suggests that specific genes in
the regulatory category are not highly variable, but that the whole category is
accumulating the greatest ratio of nonsynonymous SNPs, which in turn may affect the
regulatory networks of the respective lineages. Overall, this has shown that the loss of
selective constraint is a common feature of all lineages, and functional genetic diversity
is anticipated, specifically due to the high number of amino acid changing SNPs.

4.1 Introduction
84
Chapter 4 In silico prediction of functional
Single Nucleotide Polymorphisms
4.1 Introduction
Current knowledge on the effect of genetic variation in the M. tuberculosis Complex
(MTBC) is limited, but it has been suggested that much of the genetic variation in the
MTBC will have functional consequences due to a reduction in purifying selection
(Hershberg et al., 2008). This concept was further investigated by Hershberg et al.
through comparison of the rates of nonsynonymous SNPs, and therefore amino acid
changes, within conserved amino acid positions between the MTBC and M. canetti
(Hershberg et al., 2008). Positions were classified as conserved based on the gene
sequences of all other mycobacterial species. Reduced selection would be detected by a
difference in the number of amino acid changes falling in conserved and variable sites
between M. canetti and the MTBC. This was found to be the case, with nonsynonymous
SNPs falling in conserved amino acid positions 27% of the time in M. canetti, but just
over double the frequency (58%) was found in MTBC.
While underscoring the reduced selective constraint in MTBC, this also raises the
possibility that much of the genetic variation could have a functional impact.
Nonsynonymous SNPs have the potential to affect gene expression or the function of the
encoded protein, which can have a range of phenotypic consequences to the cell. Most
nonsynonymous SNPs are deleterious and eventually removed through the process of
purifying selection (Balbi & Feil, 2007), but as demonstrated in this and other studies,
the capacity to remove such SNPs is diminished in the MTBC due to low levels of
purifying selection. This raises the question of how many and which nonsynonymous

4.1 Introduction
85
SNPs actually have a functional consequence. Based on an extrapolation of the
aforementioned MLSA dataset, the actual number of functional SNPs was estimated.
Specifically, the decreased number of nonsynonymous SNPs falling in conserved
positions in M. canetti was used to estimate the number of nonsynonymous SNPs that
would have been removed in the MTBC if purifying selection was similar to that of M.
canetti, or any other Actinobacteria. It was suggested that about 40% of the amino acid
changes in the MTBC would result in functional consequences, and if the small gene set
was unbiased, genome-wide this translates to about 300 functional SNPs per average
pairwise comparison of MTBC strains; strains that diverged at a closer time point would
have would have few functional SNPs whilst the most divergent strain comparisons
would have up to 500 functional SNPs (Hershberg et al., 2008).
Whilst the study represented the most complete analysis of genetic diversity at the time,
the MLSA approach assays variation within a small sample of the genome. Whole
genome sequencing datasets enable this hypothesis to be tested without risk of potential
gene selection bias, and critically all of the predicted functional SNPs can be identified
for the first time. Focus is made on the nonsynonymous SNPs identified in Chapter 3.
This is the dominant SNP type identified in the MTBC, and is more amenable to in
silico prediction methods due to the inherent property of causing amino acid change,
which can be measured by the methods described below.
The main body of research into predicting the effects of nonsynonymous SNPs has been
undertaken in eukaryotic systems, specifically in human based genetics studies (Ng &
Henikoff, 2006). SNPs constitute about the 90% of human protein sequence variability
(Collins et al., 1998), and the importance of nonsynonymous SNPs in humans is
illustrated by the database containing disease-causing variants, the Human Gene
Mutation Database (HGMD) (Stenson et al., 2012). In this database, nonsynonymous
SNPs make up about half of the genetic variants that are known to cause disease
(Stenson et al., 2012). In silico methods fall into two main groups, either based on
sequence or structural information, and some hybrid methods now exist using a mix of
the two approaches (Thusberg & Vihinen, 2009). The overarching basis of all amino
acid substitution based predictions is the evidence that mutations which effect protein
function tend to occur at evolutionary conserved positions, suggesting that predictions
could be based on sequence homology (Miller & Kumar, 2001). It was also found that
mutations had common structural features that distinguish them from neutral SNPs,
suggesting that structural features could also be used in predictions (Sunyaev et al.,
4.1 Introduction
86
2000; Wang & Moult, 2001). In 2001, Wang & Moult used the human SNPdb database
to model disease-causing mutations onto their respective wild-type protein structures
and found that 83% of disease-causing mutations affect protein stability. These key
studies spawned the development of algorithms to differentiate between functional and
neutral SNPs. Some are based on sequence homology, such as SIFT (Ng & Henikoff,
2003) and PANTHER (Thomas et al., 2003), whilst others use structural features such as
TopoSNP (Stitziel et al., 2004). As described, some combine many predictive features,
and one example is the prediction method PolyPhen (Ramensky et al., 2002).
4.1.1 Aims
The work presented in this chapter is a comprehensive genome-wide prediction and
characterisation of MTBC lineage-specific nonsynonymous SNPs. The specific aims
were to:
• computationally predict functional nonsynonymous SNPs.
• gain insight into the impact of functional SNPs across the lineages.
• generate a focused SNP set that can be followed in experimental systems.
4.2 Materials and Methods
87
4.2 Materials and Methods
4.2.1 SIFT
Prediction of nonsynonymous SNPs likely to affect protein functional was performed
using the Sorting Intolerant From Tolerant (SIFT) algorithm (Ng & Henikoff, 2003).
SIFT version 4.0.2 (downloaded February 2010) was installed as a stand-alone version
on a Linux server. A custom bash routine was written to analyse all SNPs in several
batches.
The SIFT prediction is based on sequence conservation and the type of amino acid
change. Briefly, SIFT looks for homologs in other bacteria of the gene of interest and 1)
scores the conservation of the positions where mutations are found, and 2) weights this
score by the nature of the amino acid change. These measures are incorporated into a
normalised probability score, with scores ≤ 0.05 indicating a functional SNP prediction.
The classification threshold was previously optimised for performance on a data set
comprising of 55 LacI-related sequences, including paralogs (Ng & Henikoff, 2001).
Furthermore, if sequence alignments over the SNP position were at a depth <3 then
prediction was excluded.
A further conservation measure was also used to prevent the prediction of mutations on
sequences too conserved, which would contaminate the multiple sequence alignment
and bias SIFT to predicting more functional SNPs. The recommended <3.5 conservation
score threshold was used, thereby filtering those genes and associated predictions above
this threshold. As a bacterial database to generate the protein sequence alignment, all
publicly available mycobacterial genome sequences outside of the M. tuberculosis
complex (MTBC) were used. Therefore predictions were based on mycobacterial
homologs, but not on species that are evolutionary too close to the query sequences,
which could again contaminate the alignment with sequences likely to harbour the SNP

4.2 Materials and Methods
88
allele to be tested. The MTBC database consisted of thirteen complete mycobacterial
genomes, seen in Figure 4.1 and Table 4.1.
Figure 4.1. SIFT database phylogeny. BLAST database constructed for SIFT.
Neighbour-Joining phylogeny based on concatenated 16S RNA and rpoB nucleotide
sequences from the thirteen available mycobacterial genomes. Node support after 1000
bootstrap repetitions shown on branches. Scale bar indicates number of SNPs. The tree
is rooted using the outgroup Nocardia farcinica. The MTBC was not included to prevent
contamination of the predictions by closely related sequences; if present the MTBC
would diverge from M. leprae.
M. leprae (TN)
M. leprae (Br4923)
M. ulcerans (AGY99)
M. marinum (M)
M. avium subsp. paratuberculosis (K10)
M. avium (104)
M. abscessus (ATCC 19977)
M. smegmatis (MC2 155)
M. sp. JLS
M. sp. MCS
M. sp. KMS
M. gilvum (PYR-GCK)
M. vanbaalenii (PYR-1)
Nocardia farcinica (IFM 10152)
100
100
100
91
100
100
100
100
88
100
56
50

4.2 Materials and Methods
89
Table 4.1. SIFT database of non-MTBC species. Thirteen complete whole genome
sequences were published at time of this study. Genomes downloaded from NCBI.
4.2.2 Indels
Short indels (ranging from 1 to about 20 nt) were identified in Lineage 1 and 2 genome
strains using the indelpe module in MAQ (Li et al., 2008). All Lineage 1 and 2 genomes
used in Chapter 3 were used in this analysis. The tab delimited output file includes: start
position, indel type (inserted/deleted nucleotides). From this file it was possible to
identify frameshift mutations as those not divisible by three, the codon length. Indels are
inherently difficult to identify in short read data, and so only a targeted analysis of two
lineages was performed.
4.2.3 Homology modelling
Prediction of protein structure was performed using Protein Homology/analogy
Recognition Engine V 2.0 (Phyre2) (Kelley & Sternberg, 2009). Phyre2 is available at:
http://www.sbg.bio.ic.ac.uk/phyre2. Detailed description of the Phyre2 server has been
Genome Description M. leprae TN Causative agent of human leprosy. Leads to permanent
damage to the skin, nerves, limbs and eyes if left untreated
M. leprae Br4923 As above M. ulcerans AGY99 An emerging pathogen that causes Buruli ulcer M. marinum M Causes a tuberculosis-like disease in cold-blooded
animals, and a peripheral granulomatous disease in humans
M. avium subsp. Paratuberculosis K10
Causes tuberculosis in birds and disseminated infections in immunocompromised humans
M. avium 104 See above M. abscessus ATCC 19977 Environmental bacterium that causes lung, wound, and
skin infections M. smegmatis str. MC2 155
Generally non-pathogenic, capable of causing soft tissue lesions
M. sp. JLS A pyrene-degrading bacterium isolated from the soil M. sp. MCS As above M. sp. KMS As above M. gilvum PYR-GCK As above M. vanbaalenii PYR-1 Capable of degrading a variety of aromatic hydrocarbons

4.2 Materials and Methods
90
previously described (Bennett-Lovsey et al., 2008; Kelley & Sternberg, 2009; Mao et
al., 2012). Briefly, nine ancestral (wild-type) regulatory protein-coding sequences were
submitted to the phyre2 server. A non-redundant fold library is constructed based on
known protein sequences mined from the Structural Classification of Proteins (SCOP)
database and Protein Data Bank (PDB). The query protein sequence is scanned against a
non-redundant sequence database, and a profile Hidden Markov model (HMM)
generated. A PSI-Blast is used to collect close and remote sequence homologues, an
alignment is constructed and secondary structure predicted. The profile HMM and the
secondary structure are then used to scan the fold library. This alignment process returns
a score on which all alignments are ranked, and an E-value is generated. Top twenty
scoring matches are then used to generate full 3-D models of each sequence and reported
to the user. For each regulatory protein, the highest confidence model (>99%) with the
greatest coverage was used in the subsequent analysis. Whilst it was possible to generate
a homology model for all regulators, for four proteins the structure did not cover the
SNP region and so was not used in later analysis.
4.2.4 Change in protein stability
Prediction of SNPs that cause a destabilisation of the protein structure was made using
CUPSAT (Parthiban et al., 2006). The CUPSAT server is available at: http://cupsat.tu-
bs.de/. CUPSAT predicts the change in free energy of protein unfolding between wild-
type and mutant proteins (ΔΔG) using structural environment specific atom potentials
and torsion angle potentials. The prediction is based on existing PDB protein structures,
or user supplied structures. The output consists of information about mutation site, its
structural features (solvent accessibility, secondary structure and torsion angles), and
comprehensive information about changes in protein stability for nineteen possible
substitutions of a specific amino acid mutation (Parthiban et al., 2006). Protein stability
is categorised as destabilising by a loss of protein stability (-ΔΔG) or stabilising if
protein stability increases (+ΔΔG). Changes in stability of < 0.5 ΔΔG are not
considered significant, and are classified as neutral mutations.

4.3 Results
91
4.3 Results
4.3.1 Predicting functional SNPs within control set
The Sorting Intolerant From Tolerant (SIFT) algorithm was first tested on a set of SNPs
that are highly likely to affect protein function in the MTBC. Drug resistance in the
MTBC is largely caused by SNPs (Ramaswamy & Musser, 1998; Riska et al., 2000),
and many of these drug resistance-conferring mutations have been identified and are
housed in the TBDream database (Sandgren et al., 2009) (database downloaded on 07-
06-10). In total a non-redundant set of 87 SNPs was extracted, consisting of SNPs from
the following genes: ahpC, kasA and katG (SNPs associated with Isoniazid resistance),
embB (ethambutol resistance), gyrA and gyrB (fluroquinolone resistance), pncA
(pyrazinamide resistance) rpoB (rifampicin resistance).
In addition to the drug resistance conferring SNPs, a literature search of experimentally
determined functional SNPs in the MTBC was conducted to supplement the test set.
SNPs from two additional genes: pykA and mmaA3 were included from this search (Behr
et al., 2000; Keating et al., 2005). One of the early signs of variation amongst the
MTBC was the variation in carbon utilisation (Goldman, 1963; Winder & Brennan,
1966). A characteristic of M. bovis was the inability to grow on glycerol as a sole carbon
source, unlike M. tuberculosis, and instead requiring the addition of pyruvate to the
growth medium in vitro (Wayne, 1994). A mutation within pykA in M. bovis, encoding
pyruvate kinase, was found to render this enzyme inactive and thereby disrupting the use
of carbohydrates as an energy source (Keating et al., 2005). The nonsynonymous SNP
(E220D) is also found in strains of M. africanum and M. microti (an infection in Voles),
and these cultures are also supplemented with pyruvate (Keating et al., 2005; Wayne,
1994). The second nonsynonymous SNP (G98D) in mmaA3 is present within most
strains of M. bovis BCG, such as BCG-Pasteur (Behr et al., 2000). A defining
characteristic of mycobacteria is their capacity to synthesise mycolic acids, and it had

4.3 Results
92
been known that some BCG strains could not synthesis methoxymycolates, one type of
mycolic acid (Minnikin et al., 1983). The G98D mutation was subsequently found to be
responsible for this difference (Behr et al., 2000; Yuan et al., 1998).
SIFT was applied to the test SNP set and the results filtered as described (section 4.2.1),
removing regions covered by <3 homologs and alignments with too little sequence
variation with which to form a reliable prediction. In total 63 SNP predictions were
made for the control set, and 48 (78.7%) of the drug resistance associated SNPs were
predicted to impact protein function, leaving the remaining 13 SNPs (21.3%) predicted
to be tolerated. The two pykA and mmaA3 SNPs were also predicted functional, both
receiving the lowest SIFT scores of 0.00. Together, nearly 80% of the SNP set was
predicted functional, which may suggest a false negative error rate of 20%. Although it
should be stressed that not all of the SNPs within the drug resistance set are
experimentally confirmed to be involved in drug resistance, and instead causally
associated. Additionally, promoter mutations could also be the cause of drug resistance,
such as the inhA promoter mutations that cause isoniazid resistance (Musser et al.,
1996); non-coding SNPs can inherently not be tested in this type of analysis.
4.3.2 Predicted functional nonsynonymous SNPs
All lineage-specific nonsynonymous SNPs indentified in Chapter 3 were entered into the
dataset for this study (N=1550 SNPs). Predictions could be made for 1339 (86.4%) of
the SNPs. Removal of predictions based on genes that were highly conserved reduced
this set by 37.8% (506 SNPs), leaving 833 SNP predictions. SNPs within genes that
harboured little sequence diversity were not included as such predictions would be
biased, potentially causing increased functional mutation calls and thereby increased
false positive error rate (Ng & Henikoff, 2003).
In total, 371 nonsynonymous SNPs were predicted to affect gene function (Table 4.2).
The ancient lineages (Lineages 1, 5 and 6) were found to harbour nearly double the
number of predicted functional SNPs than the modern lineages (246 vs 125 functional
SNPs respectively). However, the three ancient lineages also have the longest branch
lengths as shown in Chapter 3. To counter for any influence of gene branch length, the
number of functional and tolerated SNPs was expressed as percentages (Figure 4.2). The
percentage of SNPs predicted functional, for which predictions could be made, ranged

4.3 Results
93
from 40.9-48.4% across the Lineages, with a mean of 44.5%. There was no significant
difference between the frequency of predicted functional and tolerated SNPs across the
lineages (Mann Whitney, p = 0.4817). Additionally, no difference was observed
between the number of functional SNPs by the ancient and modern classification, with a
mean of 44.7% and 44.1% predicted functional SNPs respectively.
As a further control, all genes with predicted functional SNPs were categorised as
essential or nonessential on the basis of transposon mutagenesis screens (Sassetti et al.,
2003; Sassetti & Rubin, 2003). Using these two categories 54 genes (14.6%) of the
functional predictions were essential. This would suggest a 14.6% false positive error
rate for SIFT predictions, which is also close to the previously described false positive
error rate for the SIFT algorithm (~20%) (Ng & Henikoff, 2003).

4.3 Results
94
Table 4.2. Predicted tolerated and functional SNPs using SIFT. Based on SIFT score
≤ 0.05 are predicted functional, and genes with conservation scores not < 3.5 were
filtered.
Lineage Tolerated Functional
Total
predictions
L1 79 74 153
L2 25 18 43
L3 52 44 96
L4 33 23 56
L5 111 89 200
L6 118 83 201
Modern branch 44 40 84
462 371 833
Figure 4.2. SIFT predictions. To account for differences in lineage branch lengths, the
percentage of SNPs predicted as being functional and tolerated is shown. Horizontal
dashed line indicates the average percentage of predicted functional SNPs (44.5%).
Linea
ge 1
Linea
ge 5
Linea
ge 6
Linea
ge 2
Linea
ge 3
Linea
ge 4
Modern
linea
ge0
20
40
60
80
100
Tolerated SNP
Functional SNP
Num
ber o
f SN
Ps (
%)

4.3 Results
95
4.3.3 Impact of nonsynonymous SNPs outside of the human adapted MTBC
To test if the high percentage of predicted functional SNPs is restricted to the MTBC or
is a common phenomenon in mycobacteria, all SNPs were identified between the
reconstructed ancestor of the MTBC sequences and M. canetti, the closely related
outgroup of the MTBC. Out of a total 12,319 coding SNPs, 4,245 (34.5%) were
nonsynonymous. Compared to the percentage of nonsynonymous SNPs found within the
lineage branches of the MTBC (64.8%), M. canetti has nearly half the number of
nonsynonymous SNPs. Screening these nonsynonymous SNPs for potential functional
impact using SIFT, it was found that there were significantly more predicted functional
SNPs in the MTBC. Out of total 2,416 possible predictions, 522 (21.6%) were predicted
functional (chi-square, p<0.0001). This would suggest that in contrast to the MTBC, the
majority of changes in M. canetti are functionally neutral.
4.3.4 Clustering of functional SNPs
There was little evidence of functional SNPs clustering within specific genes, which
could be indicative of adaptive selection. The majority of genes did not harbour a
predicted functional SNP (3701 genes, 92.1%), whilst those that did ranged from 0-5
SNPs per gene, as shown Figure 4.3A. The frequency of SNPs mainly followed the
expected distribution seen by the Poisson model fitted to the data, however there were a
few exceptions: Rv2079, fadD15 (Rv2187) and Rv0465c. The three genes that deviate
from the expected number of SNPs had SNP numbers ranging from 4-5 per gene (Figure
4.3B).
All three genes are above the average gene length of 1003nt, ranging from 1425-2514nt,
which could account for the increased number of predicted functional SNPs. However,
out of the fifteen nonsynonymous SNPs found within the three genes, only one was not
predicted to be functional, which would not be expected based on the genome-wide
distribution of predicted functional and tolerated SNPs (chi-square, p=0.0002).
Therefore, whilst these are relatively long genes, this does not account for the skewed
number of predicted functional nonsynonymous SNPs.
Not much is known about Rv2079, which has four predicted functional SNPs. It is a
conserved hypothetical gene of unknown function, and SNPs are found in four lineages

4.3 Results
96
(1, 2, 5 and 6); in Lineage 2 a nonsynonymous SNP causes the introduction of a stop
codon. Combined with evidence that this gene is nonessential for growth based on
transposon screens (Sassetti et al., 2003; Sassetti & Rubin, 2003), it is possible that
functional mutations are accumulating as Rv2079 it is either incorrectly annotated as a
gene, or in the case of Lineage 2 has become a pseudogene. The other outliers were
fadD15 and Rv0465c, which contain five predicted functional SNPs each. The genes
belong to different functional categories, lipid metabolism and regulation proteins,
respectively. As before, fadD15 functional SNPs are across multiple lineages (1, 3, 4
and 6), and one SNP is also present in the modern lineage branch. Therefore all the
Modern lineages have one or two functional SNPs in fadD15. Furthermore, in Lineages
1 and 5, the two SNPs are nonsense and result in the introduction of stop codons in the
lineages. Function is again not known for fadD15, but it is encodes a fatty-acid-CoA
synthetase and is likely involved in lipid degradation (Cole et al., 1998).
The other gene with five predicted functional SNPs, Rv0465c, is a probable
transcriptional regulator (Cole et al., 1998). It shares high sequence identity with the
RamB protein from Corynebacterium glutamicum, which is in the same phylum as M.
tuberculosis. As well as binding to its own promoter to autoregulate expression, RamB
controls isocitate lyase (icl1) which is part of the glyoxyate cycle (Micklinghoff et al.,
2009). Although not annotated in the most current release of the Tuberculist database
(Release 26, December 2012), it has been given the gene name ramB by Micklinghoff et
al. (2009), and this has been adopted in the following sections. Characteristic of
regulators, the mycobacterial ramB has a DNA binding domain, which is in the N-
terminus of the 465 amino acid protein, including the helix-turn-helix domain (HTH),
from amino acid residues 21 to 40, as based on the PROSITE database. One of the two
predicted functional SNPs in Lineage 6 is located within the HTH domain (N36D),
which might be expected to directly affect the capacity of the protein to bind DNA. All
other functional SNPs, found in Lineages 1, 4 and 5, are located throughout the first half
protein length, leaving only Lineage 2 and 3 with a likely functioning ramB.
Next, the distribution of the predicted functional SNPs across the genome was
calculated, shown in Figure 4.4. Functional SNPs were located across the genome, and
appear to follow the same distribution profile of the nonsynonymous SNP frequencies,
as identified in Chapter 3. On average, there is one functional SNP per 10.9kb of coding
sequence.

4.3 Results
97
Figure 4.3. Distribution of predicted functional SNPs per gene. A. SNPs per gene
range from 0-5, with actual number of genes shown at top of bar. Line indicates
predicted values under a Poisson distribution fitted to the data. B. y-axis potted on a
log10 scale to highlight deviation from the expected number at high SNP numbers per
gene.
A
B
0 1 2 3 4 50
1000
2000
3000
4000
27835 3 1 2
3701
Number of SNPs in gene
Pre
dict
ed fu
nctio
nal
SN
Ps
0 1 2 3 4 5
1
10
100
1000
Number of SNPs in gene
Pre
dict
ed fu
nctio
nal
SN
Ps
(Log
10)

4.3 Results
98
Figure 4.4. Frequency distribution of predicted functional SNPs across genome.
SNPs were placed into bins of 0.1Mb. Right y-axis predicted functional SNPs, left y-
axis nonsynonymous SNPs.
0 1 2 3 40
5
10
15
20
0
20
40
60Predicted functional SNPsNonsynonymous SNPs
Genome position (Mb)
Pre
dict
ed fu
nctio
nal S
NP
s Nonsynonym
ous SN
Ps

4.3 Results
99
4.3.5 Functional category analysis of functional SNPs
To determine if the predicted functional SNPs are within specific gene categories or
instead evenly distributed, the genes with predicted functional SNPs were grouped by
the Tuberculist functional categories (Lew et al., 2011). The percentage of functional
SNPs within each of the eight functional categories was compared to the percentage
representation of the respective category genome-wide, and is shown in Figure 4.5. In
this way, the unequal distribution of genes within specific categories was normalised
and functional SNP distribution expressed as a ratio. Ratios >1 represent functional
categories over-represented with functional SNPs, whereas <1 indicates under-
representation. Categories significantly over-represented with functional SNPs were
lipid metabolism (2.4-fold) and regulatory proteins (1.6-fold) (chi-square, false
discovery rate adjusted p < 0.05). Interestingly, information pathways were the most
under-represented category, with 2.0-fold less predicted functional SNPs that would
have been expected (chi-square, false discovery rate adjusted p=0.04) (Table 4.3). Genes
within the conserved category were also significantly under-represented.
Figure 4.5. Functional category representation. Values on the x-axis are ratios,
representing the deviation from the expected number of predicted functional SNPs per
category. Ratios > 1 indicate overrepresentation, <1 underrepresentation, and ~1
indicates that the number of predicted functional SNPs is on par with the expected
number. Categories are based on Tuberculist annotations. * indicates p <0.05 by
individual chi-square test followed by multiple test correction (False Discovery Rate
method) (Benjamini & Hochberg, 1995) .
!3 !2 1 2 3
information-pathways
conserved-hypotheticals
virulence,-detoxification,-adaptation
intermediary-metabolism-and-respiration
cell-wall-and-cell-processes
regulatory-proteins
unknown
lipid-metabolism *
*
*
*
Functional-category-representation

4.3 Results
100
Table 4.3. Functional category representation. The number of predicted functional
SNPs within genes from each respective category. Representation of category expressed
as ratios. Independent chi-square tests performed for all categories, followed by multiple
test correction (False Discovery Rate method) (Benjamini & Hochberg, 1995).
Functional category Gene
number
Functional
SNPs Representation
chi-square
(adjusted
p-value)
information pathways 242 12 -2.0 0.04
conserved hypotheticals 1031 63 -1.6 <0.01
virulence, detoxification,
adaptation 238 17 -1.4 0.27
intermediary metabolism
and respiration 936 88 -1.1 0.55
cell wall and cell processes 773 91 1.2 0.18
regulatory proteins 198 31 1.6 0.04
unknown 16 3 1.9 0.55
lipid metabolism 271 66 2.4 <0.01
An alternative method to account for the number of functional SNPs per category was
also calculated. This was based on the number of functional SNPs per potential
nonsynonymous SNP position in each functional category. Using this method, it was
again found that the information pathways category had accumulated the least number of
functional SNPs (12 functional SNPs out of 202,427 potential nonsynonymous
positions, 0.006%). The lipid and regulatory categories had accumulated the most
functional SNPs, with 0.02% and 0.03% of all potential nonsynonymous positions
harbouring a functional SNP respectively. In summary, this method highlights the same
gene categories over and under represented found previously.
Stratification of the predicted functional SNPs by lineage in the functional categories by
one-way ANOVA found no significant difference (Kruskal-Wallis test, p=0.99). This
would suggest that whilst there is a significant difference in representation of functional
SNPs within the above four gene categories, it is not driven by specific lineages but
instead a phenomena across the MTBC lineages.

4.3 Results
101
4.3.6 Functional impairment of Lineage 1 and 2 regulatory proteins
It has been shown that two functional categories, regulatory proteins and lipid
metabolism, have accumulated a greater number of predicted functional SNPs than
expected. The following section focuses on the over-represented regulatory category,
and specifically on the predicted functional mutations within Lineages 1 and 2, which
are the focus of the transcriptomic study in Chapter 5. This provides an opportunity to
combine additional predictive information such as structural features, to the previous
sequence based predictions, whilst also providing a reduced SNP set to initially guide
the transcriptome analysis.
Eleven genes within the two lineages harbour lineage-specific SNPs predicted by SIFT
analysis as likely to impair protein function, and a further gene harbours a nonsense
mutation (Table 4.4). Targeted analysis of insertion and deletion (indel) mutations in the
lineage branches identified a further two genes with mutations that cause frameshift
mutations (Table 4.4). The frameshift mutation in Lineage 2 removes the existing stop
codon, likely causing run through and fusion with the downstream gene Rv3829c.
Similarly, the two base frameshift deletion within Rv1028c (kdpD) at chromosome
position 1151486 leads to the introduction of stop codon at codon position 235 and a
resulting 625 (72.8%) amino acid truncation of the ancestral protein. kdpD is a two
component transcriptional sensor and controls the expression of the kdpABC operon,
which in Escherichia coli is involved in potassium transport at low potassium
concentrations (Walderhaug et al., 1992). A third indel was found within mce1R
(Rv0165c), at chromosome position 194305. However, the same two-nucleotide
insertion (consisting of two CC nucleotides) was found across all Lineage 1 and 2
strains, and so was removed from the analysis as this likely represents a two base
deletion that is specific to the H37Rv sequence used in the reference based mapping.

4.3 Results
102
Table 4.4. Transcriptional regulators with predicted functional SNPs and indels.
Eleven SNPs with prediction functional SNPs based on SIFT analysis. One SNP causes
a nonsense mutation (stop gain). Two indels cause frameshift mutations. n/a: not
possible to predict with SIFT.
4.3.6.1 Change in protein stability
The sequence-based predictions of functional impairment of transcriptional regulators
were refined through incorporation of structural based information. The location of each
SNP was placed in the context of protein domain information, such as identification of
SNPs within the functionally important DNA binding helix-turn-helix (HTH) domain.
Protein domain annotations were extracted from the Pfam database (Punta et al., 2012).
These were then complemented with predictions on the protein stability (ΔG) of wild-
type and mutant protein structures, enabling the change in protein stability (ΔΔG) to be
Gene Regulator type SNP Mutation Lineage SIFT
score
Rv1846c BlaI penicillinase repressor T 2096430 G L57R 1 0.05
Rv3082c VirS AraC T 3447480 G L316R 1 0.01
Rv3167c TetR C 3536008 A P17Q 1 0.02
Rv0465c RamB HTH-XRE A 555945 G Q121R 1 0.02
Rv1032c TcrS 2-component sensor C 1157771 G S62C 1 0.01
Rv3736 AraC G 4187063 A G144R 1 0.01
Rv0844c NarL 2-component regulator G 940602 C G169R 2 0.00
Rv0377 LysR G 455325 C R302P 2 0.00
Rv0275 TetR T 331588 C L24S Modern 0.00
Rv0981 MprA 2-component regulator A 1097023 G S70G Modern 0.04
Rv2359 Zur Fur G 2641840 A R64H Modern 0.02
Rv2788 SirR Fe-dependent
repressor
C 3097349 Q131X 1 n/a
Rv3830c TetR insertion:
4305063 T
S208
frameshift
2 n/a
Rv1028c KdpD 2-component sensor deletion:
1151486 AC
H67
frameshift
1 n/a

4.3 Results
103
calculated. Compromised protein folding and decreased stability of the protein product
are major pathogenic consequences of nonsynonymous SNPs, affecting the ability of the
protein to function (Wang & Moult, 2001; Yue et al., 2005).
To calculate ΔΔG it is necessary to have protein structures for each of the regulators.
Only two of the eleven regulators with predicted functional SNPs have had their protein
structures resolved and are publicly available in the Protein Data Bank (PDB) (Burley,
2013); these are BlaI (PDB ID: 2G9W) and NarL (3EUL) (Sala et al., 2009; Schnell et
al., 2008). For the remaining nine regulators, homology modeling was performed using
the Phyre2 server (Kelley & Sternberg, 2009) as described in Methods (section 4.2.3).
Following this it was still not possible to construct protein models for four of the
regulators, either due to the low quality of the model or because the SNP position was
not covered. The remaining seven regulators were entered into the analysis.
The CUPSAT server was used to predict ΔΔG (Parthiban et al., 2006). Protein stability
is categorised as destabilising (-ΔΔG), neutral (0 ΔΔG) or stabilising (+ΔΔG). Changes
in stability of < 0.5 ΔΔG are not considered significant (see section 4.2.4). Five of the
regulator SNPs were predicted to cause a loss of protein stability, one protein structure
increased in stability following the SNP, and one prediction of energy change was too
small to classify as either stabilising or destabilising, and so is likely neutral (Table 4.5).
Combined with the protein domain information, five of the destabilising SNPs were
located within the HTH DNA binding domains, and likely affect the regulatory function
of the protein: Rv0275, Rv0844c (narL), Rv1846c (BlaI), Rv3082c (virS) and Rv3167c.
These were classified as having “high predictive scores” and form a reduced set of
transcriptional regulators predicted to be functionally impaired (Table 4.5). For example,
a SNP in Lineage 1 strains introduces an arginine residue into the conserved position of
the virS HTH domain, which is predicted to destabilise the structure and cause a loss of
function (Figure 4.6).
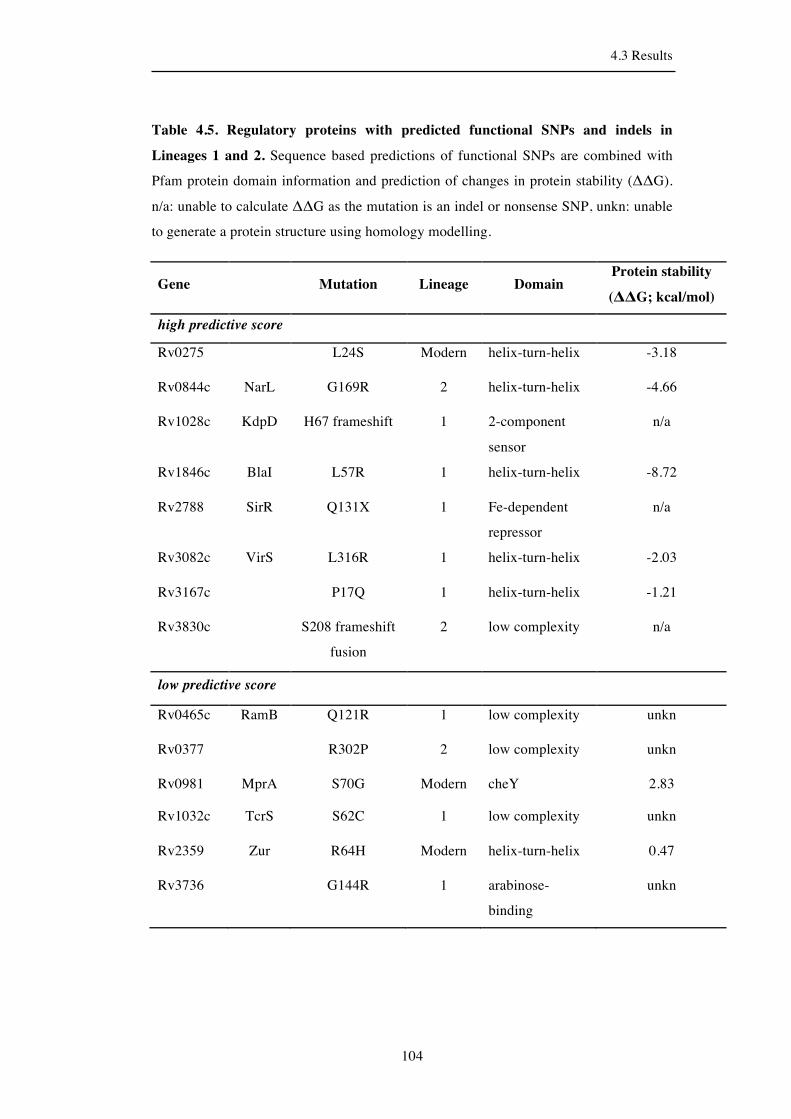
4.3 Results
104
Table 4.5. Regulatory proteins with predicted functional SNPs and indels in
Lineages 1 and 2. Sequence based predictions of functional SNPs are combined with
Pfam protein domain information and prediction of changes in protein stability (ΔΔG).
n/a: unable to calculate ΔΔG as the mutation is an indel or nonsense SNP, unkn: unable
to generate a protein structure using homology modelling.
Gene Mutation Lineage Domain Protein stability
(ΔΔG; kcal/mol)
high predictive score
Rv0275 L24S Modern helix-turn-helix -3.18
Rv0844c NarL G169R 2 helix-turn-helix -4.66
Rv1028c KdpD H67 frameshift 1 2-component
sensor
n/a
Rv1846c BlaI L57R 1 helix-turn-helix -8.72
Rv2788 SirR Q131X 1 Fe-dependent
repressor
n/a
Rv3082c VirS L316R 1 helix-turn-helix -2.03
Rv3167c P17Q 1 helix-turn-helix -1.21
Rv3830c S208 frameshift
fusion
2 low complexity n/a
low predictive score
Rv0465c RamB Q121R 1 low complexity unkn
Rv0377 R302P 2 low complexity unkn
Rv0981 MprA S70G Modern cheY 2.83
Rv1032c TcrS S62C 1 low complexity unkn
Rv2359 Zur R64H Modern helix-turn-helix 0.47
Rv3736 G144R 1 arabinose-
binding
unkn

4.3 Results
105
Figure 4.6. Predicted loss of function of virS transcriptional regulator in Lineage 1.
Homology model of wild-type VirS protein, covering amino acid residues 214 - 334.
Arrow indicates Lineage 1 SNP at amino acid position 316 within the HTH domain.
CUPSAT analysis of the ancestral and mutant protein predicts a destabilisation of the
structure (ΔΔG = -2.03 kcal/mol). Sequence conservation of region used in SIFT
prediction shown on right hand side, with the ancestral MTBC sequence shown at the
top of the sequence alignment. Standard one-letter amino acids nomenclature used, and
X indicating a gap in the alignment.
L316R
281QUERY LIERERRAQA ARYLAQPGLY LSQIAVLLGY SEQSALNRSC RRWFGMTPRQ YRAYGGVSGR *mmi:MMAR_3320 VVDDVRREVT ERYLRDSDMT LTHLARQLGY AEQSVLSRSC QRWFGASPAS LRAXXXXXXX Xmmi:MMAR_5276 LIDEVRKETA DRYLRTTAMS LSHLARELGY AEQSVLTRSC KRWFGIGPAA YRAXXXXXXX Xmul:MUL_4350 LIDEVRKETA DRYLRTTAMS LSHLARELGY AEQSVLTRSC KRWFGIGPAA YRAXXXXXXX Xmab:MAB_3997c LVDQIRREAA ERLLSDTDLS LDHLSRQLGY AEQSVFTRSC KRWFGTTPSA YRSXXXXXXX Xmgi:Mflv_5495 LVDQTRRDTA QRLLLDTALS LDQLACPLXX XXXXXXXXXX XXXXXXXXXX XXXXXXXXXX Xmab:MAB_3623 LLDTIRLDLA DHLVTSDRHS LTEISEMLAF SSPSNFSRWF RGHRAMSPRT WRXXXXXXXX Xmmc:Mmcs_3216 LRQSFLRERA ILRLLDRSLS VSEIAAELGY AELTNFTHAF KRWTGRSPRH FRXXXXXXXX Xmkm:Mkms_3278 LRQSFLRERA ILRLLDRSLS VSEIAAELGY AELTNFTHAF KRWTGRSPRH FRXXXXXXXX Xmjl:Mjls_3227 LRQSFLRERA ILRLLDRSLS VSEIAAELGY AELTNFTHAF KRWTGRSPRH FRXXXXXXXX Xmgi:Mflv_4594 LRQSCLRESA MMLLITRSMS ASQIATELGY GDLANFSHAF KRWTGRSPSE YRXXXXXXXX Xmab:MAB_0715c IRDAALRTEA IKSLEDGSES LNDLSVRLGF SELSAFTRAF RRWTGASPAQ YRXXXXXXXX Xmab:MAB_2050 LRQSFLQERA ILRILDRSVS VSEIAAELGY ADLTNFTHAF KRWTGRSPRH FRXXXXXXXX Xmmi:MMAR_3156 LRQAFLRERA MLQLLDRSLS VSEIATDLGY SDLANFSHAF KRWTGRSPSE FRXXXXXXXX X
320 310

4.4 Discussion
106
4.4 Discussion
4.4.1 Strengths and limitations of the study
The overall aim of this study was to computationally measure the impact of SNPs in the
MTBC, focusing specifically on SNPs that contribute to lineage-specific variation
identified in Chapter 3. Over 1,500 nonsynonymous SNPs were identified in the lineage
branches of MTBC, and the phenotypic effects of these are unknown. Unlike other
bacterial species, the majority of SNPs in MTBC (over two-thirds) are nonsynonymous,
and this SNP set was the focus of this computational study. Such SNPs are more
tractable to computational prediction methods than synonymous and intergenic SNPs, as
the impact of the amino acid substitutions can be measured using the properties of the
amino acid, such as residue volume change, as well as the evolutionary conservation of
the specific nucleotide position based on multiple sequence alignments. This is reflected
in the development of computational prediction methods based mainly on
nonsynonymous SNPs (Ng & Henikoff, 2006). However, clearly noncoding SNPs can
also have an impact on gene function, such as the mutation of regulatory regions found
in M. tuberculosis drug resistance (Müller et al., 2011; Riska et al., 2000). More recently
it has also been suggested that synonymous SNPs are less silent than previously
assumed (Plotkin & Kudla, 2011). Despite not having an effect on the resulting protein
sequence, synonymous SNPs, and therefore synonymous codon changes, have shaped
gene expression through the phenomenon of codon-usage bias (Plotkin & Kudla, 2011).
Differential use of synonymous codons can effect RNA processing, protein translation
and protein folding (Plotkin & Kudla, 2011); industrial applications have exploited this
to increase gene expression over 1000-fold through introduction of synonymous SNP
changes (Gustafsson et al., 2004). Furthermore, in human based studies, a synonymous
mutation has also been shown to change the substrate specificity of the multidrug-
resistance protein 1 (MDR1), although the precise mechanism is not yet understood
(Kimchi-Sarfaty et al., 2007; Komar, 2007). Together this demonstrates the potential

4.4 Discussion
107
functional importance of all SNP types, and it is likely that future study of M.
tuberculosis genomic variation will attribute instances of functional variation not only to
nonsynonymous SNPs but the latter two SNP types as well.
Whilst experimental methods exist to characterise the functional effect of SNPs, such as
site-directed mutagenesis, studying the molecular effects of mutations in the MTBC is
time-consuming, laborious and unfeasible at this scale, therefore computational methods
can provide useful and reliable information about the effects of amino acid substitutions
at an initial stage. There are two main methods to predict the functional effect of coding
nonsynonymous SNPs. The first relies on mapping the SNP to the three-dimensional
protein structure and the latter takes a sequence-based approach, assessing the nature of
the position and introduced amino acid type. At the time of writing, there were protein
structures for 259 (6.4%) of all annotated M. tuberculosis proteins in the Protein Data
Bank (Burley, 2013). This number has not increased significantly in the interim period,
and currently 314 genes have associated protein structures (December, 2012) (Burley,
2013). To ensure that this was a comprehensive study of the effects of lineage-specific
nonsynonymous SNPs, it was decided to use the latter prediction method based on
sequence homology, thus maximising the number of SNP predictions. The method
chosen was the Sorting Intolerant From Tolerant (SIFT) algorithm (Ng & Henikoff,
2003). Although SIFT relies solely on amino acid sequence to make the prediction, it
has been shown to perform similarly to methods based on different evolutionary and
structural features, and critically can be applied to many more of the lineage-specific
SNPs (Saunders & Baker, 2002; Sunyaev et al., 2001). It has been suggested that a
combination of the two main prediction methods (sequence and structural based) will
likely improve the accuracy of predictions (Bao & Cui, 2005; Thusberg & Vihinen,
2009), but the chosen method was viewed as an acceptable trade-off. More in depth
structural work can be applied at a later targeted stage, as was used in this study on the
genes within the regulatory protein category. However, even at this stage, four of the
eleven (36.4%) regulatory proteins with nonsynonymous SNPs could not be entered into
structural based predictions, owing to the lack of structural information; for the
remaining proteins only two had been experimentally determined, requiring intensive
homology modeling to increase the size of the structural dataset.
Moving from SNPs, short insertion and deletions (indels) also have potential functional
consequences, particularly indels that are of a length not divisible by three and so lead to
a change in the reading frame. However, inference of indels from next-generation

4.4 Discussion
108
sequence data is challenging, and so far methods for identifying these lag behind
methods for calling SNPs in terms of sensitivity and specificity (Albers et al., 2011). For
this reason, it was decided to not include a genome-wide analysis of indels, but focus on
a few potential indels in genes involved in regulatory function instead. Indels are also
more rare than SNPs in the MTBC, and for these reasons the identification of SNPs has
had the greatest attention in such studies so far. They are effectively the lower hanging
fruit. It is likely that these issues will be resolved and indels will have more attention as
newer algorithms to detect them are developed (Albers et al., 2011), and as potentially
longer reads from third generation sequencing technologies are utilised.
4.4.2 Validation of the SIFT method
For the first time it was possible to identify all potential functional SNPs in the lineages
of MTBC. As described in Chapter 3, these SNPs represent the background variation
that contributes to the underlying lineage genetic diversity. Identification of SNPs more
likely to contribute to functional diversity focuses later analyses on predicted
phenotypically important SNPs, and on a broader scale tests the hypothesis that a high
proportion of SNPs within the MTBC will be functional, likely due to reduced purifying
selection acting within MTBC (Hershberg et al., 2008).
The SIFT algorithm was first run on a test SNP set that would be expected to be
enriched for functional SNPs, and so act as positive control for the performance of the
method. The set was based on SNPs associated with drug resistance from the current
release of the TBDReam database (Sandgren et al., 2009). It was found that 79.4% of
SNPs were predicted functional by SIFT, leaving 20.6% of SNPs associated with drug
resistance predicted to be functionally neutral. This potential false negative error rate of
~20% is close to that previously described by the authors of SIFT (Ng & Henikoff,
2001; Ng & Henikoff, 2003). However, it is important to note that the majority of SNPs
in the positive control set are putative mutations found in drug resistant clinical M.
tuberculosis isolates, and so may be causally related and not involved in drug resistance
(Sandgren et al., 2009). This will likely mean that the control set has some SNPs that are
not functional and so is not a completely robust test of the SIFT algorithm. As an
alternative test, it was found that significantly fewer predicted functional SNPs were
found within the genes previously characterised as being essential for growth, and that
functional SNPs that did fall within the group of essential genes (14.6%) is again close

4.4 Discussion
109
to the expected false positive error rate of SIFT. Together this provides confidence in the
later SNP predictions.
4.4.3 Half of lineage-specific SNPs are predicted to have functional consequences
Applying SIFT to all lineage-specific SNPs, it was possible to make predictions for
>85% of the set, and strikingly it was found that just under half were predicted to have a
functional effect. The mean percentage of functional SNPs for all lineages was 44.5%
and no significant difference was found between the individual lineages, or by grouping
lineages into ancient and modern categories. This prediction is very close to the estimate
made by Hershberg et al. (2008). The authors of this former study estimated that ~40%
of the SNPs within MTBC are functional by extrapolating from the SNPs found within
the set of 89 genes sequenced in 99 human M. tuberculosis isolates (Hershberg et al.,
2008). In contrast to the high proportion of functional SNPs in the MTBC, all SNPs
between an M. canetti strain, the closely related outlier from the MTBC, and the
reconstructed M. tuberculosis ancestor were identified and it was found that only 21.6%
of the nonsynonymous SNPs were predicted to be functional, which is less than half of
the proportion seen in the MTBC. This suggests that the hypothesised low frequency of
purifying selection acting with MTBC is generating substantial diversity. Interestingly, a
similar phenomenon has been observed in humans, where recent demographic
expansions have led to the accumulation of low frequency genetic variants associated
with strong functional effects (Keinan & Clark, 2012; Tennessen et al., 2012).
Considering the tight link between the MTBC and its human host, it is interesting to
speculate that these human expansions might have had a similar effect on the genetic
diversity of the MTBC (Hershberg et al., 2008).
Although purifying selection is likely reduced in MTBC, it was still possible to detect
signals of this force through increased removal of predicted functional SNPs within
genes classed as essential for growth compared to nonessential genes and also by
clustering of SNPs beyond the expected distribution. When grouped by functional
category, genes encoding proteins involved in the information pathways category
accumulated significantly less predicted functional SNPs than expected. Conversely,
genes encoding proteins that perform regulatory functions and those involved in lipid
metabolism were over-represented with functional SNPs. Interestingly, it was also found
that the transcriptional regulator ramB had accumulated more functional SNPs than

4.4 Discussion
110
expected, spanning four of the lineages. Following the regulatory protein category, focus
was made on Lineage 1 and 2 SNPs; the two respective lineages form the transcriptomic
study in Chapter 5, and so a focused analysis was performed through integration of
additional mutational and structural information to identify likely impaired functional
regulators for the proceeding study. It was found that several SNPs lie within the HTH
DNA binding domain of the regulatory proteins, such as a Lineage 1 SNP in virS. VirS
regulates its own transcription and is also a positive regulator of an adjacent divergently-
expressed MymA locus, which has experimentally been shown to be involved in
virulence in guinea pigs (Singh et al., 2003; Singh et al., 2005). Together with several
frameshift mutations arising from short indels, it is hypothesised that specific lineages
have functionally impaired regulators and this has the potential to give rise to
phenotypic diversity. Such SNPs should be detectable at the transcriptional level, and
part of the following chapter (Chapter 5) explores this hypothesis.
In summary, this study has identified a set of nonsynonymous SNPs likely to have
functional consequences in MTBC. However, it is not possible using the SIFT
predictions to predict how these mutations affect protein function. There are four
possible evolutionary fates for SNPs: The mutant is beneficial; causes a severe fitness
cost and so is lost from the population; is functionally neutral; or finally is neither
beneficial or excessively harmful, but slightly deleterious (Balbi & Feil, 2007). Slightly
deleterious SNPs are the largest class, and in Escherichia coli it has been estimated that
for every beneficial mutation there are 105 slightly deleterious mutations (Kibota &
Lynch, 1996). As seen in Figure 4.7, it can be anticipated that many of the predicted
functional SNPs identified in this study will fall within this slightly deleterious category,
whilst the proportion of SNPs that have a greater impact or are “more” functional is
unknown, but likely determined by a combination of selective and stochastic forces,
such as the level of purifying selection acting within the organism.

4.4 Discussion
111
Figure 4.7. Spectrum of functional SNPs. The consequence of nonsynonymous SNPs
range from tolerated/neutral to functional and at the extreme results in cell death, and
therefore are not observed in the bacterial population. In MTBC ~40% SNPs were
predicted functional in this study, but severity is unknown.
Increasing severity of SNP
Incr
easi
ng n
umbe
r of
SN
Ps
harmful, cell death
functional SNPs (~40%)
tolerated SNPs
(~60%)
“more” functional SNPs (?%)

5.1 Introduction
112
Chapter 5 Screening the effect of lineage-
specific variation by sequence-based
transcriptional profiling
5.1 Introduction
M. tuberculosis infection is defined by a typically protracted period of asymptomatic
infection followed by progression to active disease in a minority of individuals.
Throughout these stages of infection, M. tuberculosis is exposed to a range of
microenvironments, including acidic pH, reactive oxygen species, and nutrient
starvation (Barry et al., 2009). Genome sequencing of the M. tuberculosis reference
strain H37Rv by Cole et al. revealed a complex network of transcriptional regulation,
including thirteen sigma factors, eleven two-component regulators, eleven serine-
threonine protein kinases and over one hundred predicted transcription factors (Cole et
al., 1998). At the initiation of this study, the extent of transcriptional variation between
clinical isolates from the six main lineages was unknown, and the effect of the
underlying genetic diversity to such variation was an open question.
In 2007, a microarray based study comparing H37Rv and the animal adapted M. bovis
growing under steady state conditions revealed that the human and bovine pathogens
showed differential expression of ninety two genes, which encoded a range of functions,
including cell wall and secreted proteins, transcriptional regulators, PE/PPE proteins,
lipid metabolism and toxin–antitoxin pairs (Golby et al., 2007). It is now known that
there are on average ~1500 SNPs separating any MTBC strain (section 3.3.1), which
raises the likelihood that human-adapted MTBC strains will also display a similar
5.1 Introduction
113
quantity of differential expression. Shortly after identification of the main six human
adapted MTBC lineages, a microarray-based study in 2010 surveyed for the first time
differences in gene expression amongst clinical isolates of the MTBC (Homolka et al.,
2010). The study was based on a total fifteen MTBC clinical isolates from Lineage 1,
the Beijing group of Lineage 2, two sub-lineages from Lineage 4 and Lineage 6. The
study found specific transcriptional patterns in vitro and in intracellular growth based on
the ancient and modern lineage groupings, demonstrating that strains from defined
phylogenetic groups display similar gene expression, which suggests the importance of
understanding the underlying genetic background. The strains used in the study were not
genome sequenced which limited the scope of the study, and it was not possible to relate
to specific genetic variation.
The previous chapters would not have been possible without the availability of whole
genome sequences, and such data now is crucial to experiments linking genotype to
phenotype. Previous transcriptomic studies have relied on microarray based methods,
but recent advances in DNA sequencing technologies has enabled the determination of
RNA expression through sequencing of cDNA prepared by reverse transcription of total
cellular RNA (RNA-seq), which provides dynamic ranges several orders of magnitude
greater than other technologies, whilst at the greatest possible resolution. The first
sequence based transcriptome of M. tuberculosis strain H37Rv was published in 2011 by
Arnvig et al., and whilst this was not a clinical isolate, this demonstrated the power of
RNA-seq to capture the complete transcriptional landscape of M. tuberculosis (Arnvig et
al., 2011).
5.1.1 Aims
The aims of this chapter were to survey the transcriptome profiles of M. tuberculosis
clinical isolates from Lineages 1 and 2, and to understand the effects of lineage-specific
variation identified in the previous Chapters. Specific aims were to:
• characterise M. tuberculosis transcriptomes using a sequence based approach
• capture lineage-specific transcription profiles in the transcriptome sets
• explore the functional impact of lineage-specific SNPs identified in Chapter 3
and 4

5.2 Methods
114
5.2 Methods
5.2.1 Clinical isolates in study
5.2.1.1 Strains sequenced using RNA-seq
Strains are from a collection of M. tuberculosis isolates from foreign-born tuberculosis
patients in San Francisco, who contracted the infection in their country of origin
(Gagneux et al., 2006a). All strains are drug susceptible and have been typed in studies
(Table 5.1) (Gagneux et al., 2006a; Hershberg et al., 2008). Three strains were selected
from Lineages 1 and 2 respectively, to represent the genetic diversity in the lineages.
Figure 5.1 shows the previously described MTBC phylogeny based on MLSA analysis,
and the strains used in the RNA-seq study are highlighted (Hershberg et al., 2008). From
Lineage 1, two strains are from the large Rim of Indian subgroup (strains N0072 and
N0153) and a representative of the Philippines subgroup (strain N0157). Two Beijing
strains from Lineage 2 were selected (strain N0145 and N0052) and a less common non-
Beijing strain (N0031). Figure 5.1 uses the original naming schema, but from this point
on the later adopted ‘N’ number strain naming will be referred to. To preserve the two
naming conventions both have been used in Table 5.1. All strains have been genome
sequenced in previous studies or as part of this thesis.
5.2.1.2 Additional growth curve experiment strains
The determination of growth rates for the RNA-seq study strains was supplemented by
the clinical isolates shown in Table 5.2. In total six strains from Lineage 1 and 2 were
included to explore potential lineage-specific differences in exponential phase growth
rate. The reference laboratory strain H37Rv was also included.

5.2 Methods
115
Table 5.1. Lineage 1 and 2 strains used in the RNA-seq study. All strains were
previously genome sequenced except strain N0031, which was sequenced for this thesis
in Chapter 3. This study refers to the strain names used in the Gagneux group, but
original strain names used by Hershberg et al. (2008) are shown for reference. In
addition to lineage, the region of difference (RD), which has been historically used to
type the strains, is indicated. Geographic distribution and prevalence of lineage based on
previous classifications (Coscolla & Gagneux, 2010).
Strain MLSA strain name Lineage RD
lineage
Lineage geographic distribution
Patient origin
N0153 T83 1 RD239 Rim of Indian Ocean Vietnam
N0072 EAS053 1 RD239 Rim of Indian Ocean India
N0157 T92 1 RD239 The Philippines The Philippines N0145 T67 2 RD105 Beijing China N0052 98_1833 2 RD105 Beijing China
N0031 94_M4241A 2 RD105 Non-Beijing China
Table 5.2. Additional strains used in growth curve experiment. Three additional
strains from Lineage 1 and Lineage 2 were included in the growth curve experiments in
combination with the previously described six RNA-seq study strains. All are clinical
strains and isolated as part of the San Francisco strain collection (Gagneux et al.,
2006a). Genome column indicates genome sequencing status of strain.
Strain Strain ID Lineage RD lineage Patient origin Genome
N0043
96_4329
1 RD239
Burma
Y
N0075 EAS080 1 RD239 Vietnam N
N0121
T17
1 RD239
The Philippines
Y
N0041
96_2104
2 RD105
Vietnam
N
N0053
98_1863
2 RD105
China
Y
N0140
T47 2 RD105 Macau N

5.2 Methods
116
5.2.1.3 Additional qRT-PCR strains
The confirmation of select lineage-specific expression of genes by qRT-PCR used all
previous RNA-seq strains and the addition of four Lineage 1 and 2 strains. These are
shown below in Table 5.3.
Table 5.3 Additional strains used in qRT-PCR confirmation. Two strains from
Lineage 1 and Lineage 2 were included in the RNA-seq confirmation. All are clinical
strains and isolated as part of the San Francisco strain collection (Gagneux et al.,
2006a). Genome column indicates genome sequencing status of strain. One strain is
currently not genome sequenced but this was not required for the aims of the qRT-PCR
study.
Strain Strain ID Lineage RD
lineage Patient origin Genome
N0043
96_4329
1 RD239
Burma
Y
N0121
T17
1 RD239
The Philippines
Y
N0041
96_2104
2 RD105
Vietnam
N
N0053
98_1863
2 RD105
China
Y

5.2 Methods
117
Figure 5.1. Strains sequenced in RNA-seq study. Circles indicate the six Lineage 1
and 2 strains used in the RNA-seq study. Phylogenetic tree of MTBC adapted from
(Hershberg et al., 2008). Image reproduced under the Creative Commons Attribution
License (CCAL).

5.2 Methods
118
5.2.2 Cluster analysis
Hierarchical cluster analysis of the transcriptomes was performed using the hclust
function in R by the complete linkage method. Spearman distances were calculated from
the dissimilarity matrix of pairwise correlations of total gene expression (N=4,015
genes), expressed as Reads Per Kilobase per Million mapped reads (RPKM). Clade
support using 1000 bootstrap replications was performed using the R function pvclust.
Comparison of the total gene expression per strain to SNP distance was performed with
normalised read counts that were transformed using the variance stabilising
transformation (VST), and implemented in the DESeq package (Anders & Huber, 2010).
VST is a monotonous function, and is calculated for each sample such that variance in
the count data becomes independent of the mean.
5.2.3 Differential expression analysis
Statistical testing for the main differential expression analysis was performed using
DESeq (Anders & Huber, 2010). DESeq is a method based on the negative binomial
distribution and implemented in the R statistical environment. Raw reads were
normalised first using DESeq to adjust for differences in library sizes. Reads from
technical replicates were combined and treated as one sample. Gene deletions at either
strain or lineage level were first removed from the analysis (N=223 genes); deletions
were identified based on genome coverage using the respective strains genome, with a
threshold of <90% gene coverage to define a deletion. Normalised expression of features
(annotated genes, antisense or sRNAs) that overlapped with strains from different
lineages due to strain specific expression were filtered and removed, with 1,606 features
entered into the analysis. For the purpose of testing for lineage-specific differential
expression in DESeq, strains from the same lineage were treated as biological replicates,
and the mean expression from the two lineages compared. Significant differential
expression was defined as p<0.05 (p-value adjusted for multiple testing using
Benjamini-Hochberg method).
5.2 Methods
119
5.2.4 Transcriptional Start Site (TSS) calling
Custom Perl scripts were written for TSS calling. Briefly, the increment in reads from
one genome position to the next consecutive base was calculated for all genomic
positions, with an increment significantly above the average background coverage
defined as candidate TSS. TSS peak height was considered as representative of the level
of expression of the TSS. To build a genome-wide TSS map for M. tuberculosis,
automated annotation of the putative TSS detected according to genomic distribution
similar to previous TSS analysis using RNA-seq data (Sharma et al., 2010b).
5.3 Results
120
5.3 Results
5.3.1 Growth rate in vitro
It was critical to isolate the transcriptomes of all study strains from the same
physiological state, ensuring that differential transcription is not simply a reflection of
the stage of growth. RNA was harvested at two growth phases in this study, mid-
exponential and stationary; and these were defined as an Optical Density (OD600) of 0.4
to 0.6 and one week after an OD of 1.0, respectively. A difficulty of working with
clinical strains compared to well-used reference strains is that the growth rates are
largely unknown, which are required to standardise the RNA extraction process.
Three representative strains from Lineage 1 and 2 were selected for the RNA-seq study
(section 5.2.1.1, and the growth of the six strains was monitored over a 14-day period. In
a defined 7H9 media (section 2.1.3) culture density (OD600) was measured daily from the
initial inoculation (day 0). From frozen stocks, strains were grown in 10mls 7H9 for two
days prior to transfer into roller bottles used for the growth curves and all RNA
extractions. At day 0, a calculated volume was transferred from the pre-culture to start
all growth curves at OD 0.01. This experiment was also used to identify any lineage
level differences between growth rates in vitro, and three additional strains from both
Lineage 1 and 2 were included to increase the sample size and so the statistical power of
the test. Additional clinical isolates are described in section 5.2.1.2. The H37Rv
laboratory strain was also included as a reference.

5.3 Results
121
Figure 5.2. In vitro growth curves. A. Growth of twelve strains from Lineage 1 and 2,
plus H37Rv. B. Strains pooled by lineage. Error bars are the standard error of the mean
(SEM). All strains were grown in three independent experiments, and under the same
conditions. Strains are coloured using previously defined lineage colouring.
0 1 2 3 4 5 6 7 8 9 10 11 12 13 140.001
0.01
0.1
1
10 N0121
N0145
N0043
N0053N0041N0031
N0072N0153N0157
N0052
H37RvN0140
N0075
Days from inoculum
Opt
ical
Den
sity
(OD
600)
a)
0 1 2 3 4 5 6 7 8 9 10 11 12 13 140.01
0.1
1
10
Lineage 1Lineage 2H37Rv
Days from inoculum
Opt
ical
Den
sity
(OD
600)
b)
A
B

5.3 Results
122
Growth rates of the clinical strains did vary with a trend for Lineage 2 strains to continue
into late-exponential phase for longer that Lineage 1 strains (Figure 5.2A). This was
reflected in higher OD600 readings for Lineage 2, with the Lineage 2 strain N0145
reaching an OD600 of ~10, the highest of all strains. The reference strain H37Rv is in the
middle of the growth rates. By day 9 to 10 all strains had entered stationary phase.
Figure 5.2B plots all strains from the same lineage as replicates, confirming the
observation that Lineage 2 strains do continue in late-exponential phase for
comparatively longer. However, mid-exponential growth is similar for all strains
irrespective of lineage. As pre-cultures were used, all strains were in exponential growth
at day zero, the start of the growth curve. Between days three and four, strains leave
mid-logarithmic and enter late-logarithmic growth. For these experiments, mid-
logarithmic growth was defined as OD ≤ 0.6.
Strain specific doubling times are shown in Table 5.4. Exponential doubling times range
from 13.8 ± 0.2 hrs (strain N0043) to 24.2 ± 0.6 hrs (strain N0075). This shows that the
doubling times of the clinical strains can range by up to 10 hrs, which is important when
synchronising RNA extraction experiments. Whilst there is some variability in the
specific growth rates of the strains, this was not significant at the lineage level. The
mean lineage exponential doubling time for Lineage 1 was 18.2 ± 1.8 hrs and for
Lineage 2 was 16.4 ± 0.5 hrs (two tailed students t-test, p=0.35).
!

5.3 Results
123
Table 5.4. In vitro growth rates. Doubling times in hours are shown for exponential
phase growth with the SEM. All strains were grown in at least three independent
experiments, under conditions detailed in 2.1.4. Lineage mean doubling time also
shown. The laboratory strain H37Rv was used as a reference. Asterisks (*) identify
strains used in RNA-seq study.
Strain Lineage Doubling time (hrs)
Error (SEM)
Lineage mean doubling time (hrs)
N0043 1 13.8 0.2
18.2
N0072 * 1 16.1 0.8 N0075 1 24.2 0.6 N0121 1 16.0 0.4 N0153 * 1 23.2 1.9 N0157 * 1 15.9 0.4 N0031 * 2 16.2 0.1
16.4
N0041 2 18.1 2.0 N0052 * 2 16.2 2.1 N0053 2 16.6 2.1 N0140 2 16.9 1.9 N0145 * 2 14.4 0.6 H37Rv 4 18.0 1.7 18.0

5.3 Results
124
5.3.2 RNA isolation and Illumina ready libraries
Following extraction of RNA, sample concentration was measured by Nanodrop and
RNA quality by Agilent 2100 BioAnalyser. The BioAnalyser is a nanofluidics device
that performs size fractionation and quantification of DNA, RNA, or protein samples.
Only high quality samples, based on the electropherogram and expressed as an RNA
Integrity Number (RIN) ≥8, were used in later analysis (Figure 5.3A). Samples were
rigorously DNase treated to remove potential DNA contamination from the RNA
extraction, and entered into the Illumina library construction stage. Two main cDNA
library types were constructed, the first was based on a modified Illumina stand-specific
protocol for sequencing all RNA species (section 2.5.1). In total nine high quality cDNA
libraries were constructed, including three technical replicates. Only libraries with
concentrations >10µg/ml and with the expected size distribution of adapter cDNA
fragments were sequenced (Figure 5.3B). The second main library method depleted
processed RNAs in the samples, and was used in Transcriptional Start Site (TSS)
mapping. RNA was sent to Vertis Biotechnologie AG and four libraries constructed
(section 2.5.2).
A. B.
Figure 5.3. Quality control of RNA-seq samples by Bioanalyser. Migration time of
sample shown in seconds on x-axis, and fluorescence units (FU) on y-axis. A. Integrity
of total RNA following RNA isolation and DNase treatment for strain N0052. The two
largest peaks are rRNA 16S and 23S, and the area under the peaks used as a metric of
RNA quality (RIN). B. Quality of strain N0052 Illumina strand-specific RNA-seq
library. Lower and upper size markers are 15 bp and 1500 bp. Distribution of cDNA
library fragments expected to be 180-200 bp, corresponding to 60-80 seconds.
�$''(3
�0!,�''��!-/'.-�"*,��� !,
�����3($� �����
�����10&(053$5,10� ��0*�:.
�� ���
�0!,�''��!-/'.-�"*,�-�(+'!������ ��������
�����3($� ���� �
�����10&(053$5,10� ���0*�:.
3�����$5,1� �4����4"� ���
�����05(*3,58��6/%(3������� ���������������
�,�#(!).�.��'!�"*,�-�(+'!������ ��������
��(! �.�,.��%(!��-� �) ��%(!��-� �,!� ��*"�.*.�'��,!�16S 39.55 43.61 83.3 19.023S 44.91 49.02 117.6 26.9
��� ��
�0!,�''��!-/'.-�"*,�-�(+'!������ ��������
�����3($� �����
�����10&(053$5,10� �0*�:.
3�����$5,1� �4����4"� ��
�����05(*3,58��6/%(3������� ���������������
�,�#(!).�.��'!�"*,�-�(+'!������ ��������
��(! �.�,.��%(!��-� �) ��%(!��-� �,!� ��*"�.*.�'��,!�16S 38.92 42.28 60.9 24.723S 45.45 48.27 72.3 29.3
������
�0!,�''��!-/'.-�"*,�-�(+'!������ ��������
�����3($� �� �
�����10&(053$5,10� ��0*�:.
3�����$5,1� �4����4"� ���
�����05(*3,58��6/%(3������� ���������������
�,�#(!).�.��'!�"*,�-�(+'!������ ��������
��(! �.�,.��%(!��-� �) ��%(!��-� �,!� ��*"�.*.�'��,!�16S 40.41 42.34 32.5 26.323S 45.85 49.59 7.0 5.7
����72(35��������������� 9��1283,*+5������������*,.(05��(&+01.1*,(4���0&� �3,05('� �����������
�����!1+!,.��,*&�,2*.!��*.�'�������)*���� ��� ��������������������1� �$*( 1)� �
�3($5('��1',),('�
��������� ���������������$5$��$5+�
�31-$3815(��15$.������$01��!���31-$3815(��15$.������$01#����������#�����#��� ���7$'
�44$8��.$44�
�'!�.,*+$!,*#,�(��/((�,2
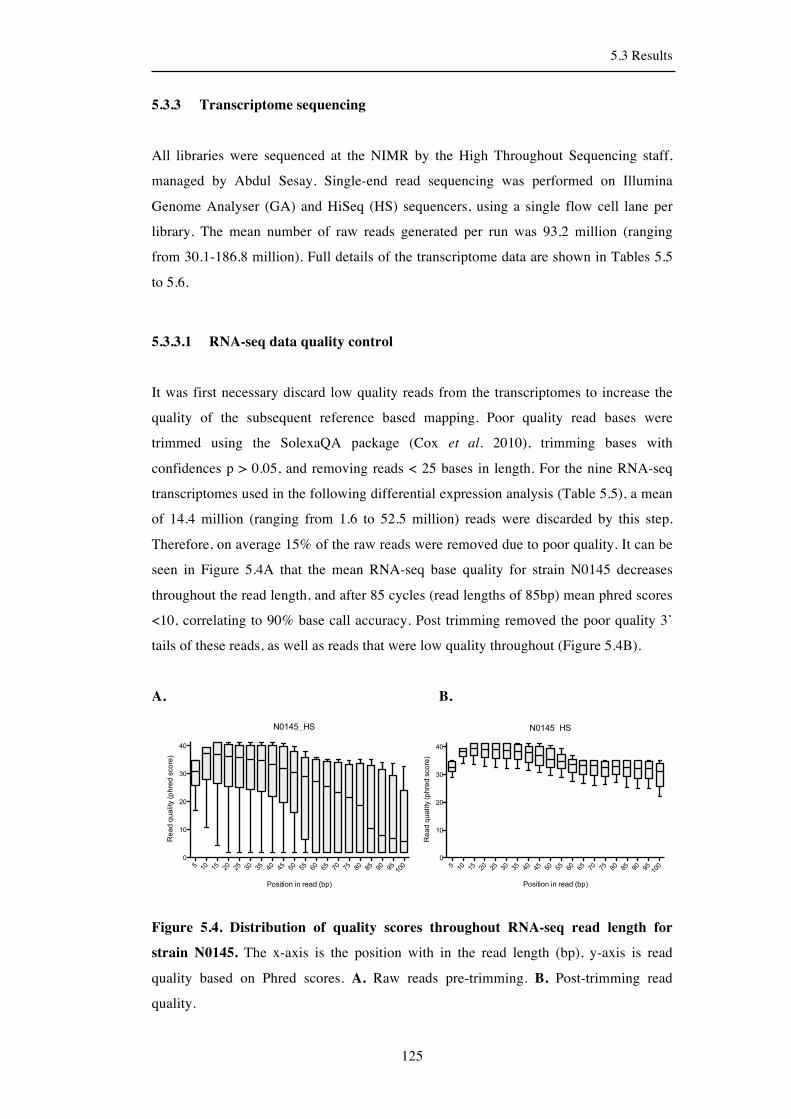
5.3 Results
125
5.3.3 Transcriptome sequencing
All libraries were sequenced at the NIMR by the High Throughout Sequencing staff,
managed by Abdul Sesay. Single-end read sequencing was performed on Illumina
Genome Analyser (GA) and HiSeq (HS) sequencers, using a single flow cell lane per
library. The mean number of raw reads generated per run was 93.2 million (ranging
from 30.1-186.8 million). Full details of the transcriptome data are shown in Tables 5.5
to 5.6.
5.3.3.1 RNA-seq data quality control
It was first necessary discard low quality reads from the transcriptomes to increase the
quality of the subsequent reference based mapping. Poor quality read bases were
trimmed using the SolexaQA package (Cox et al. 2010), trimming bases with
confidences p > 0.05, and removing reads < 25 bases in length. For the nine RNA-seq
transcriptomes used in the following differential expression analysis (Table 5.5), a mean
of 14.4 million (ranging from 1.6 to 52.5 million) reads were discarded by this step.
Therefore, on average 15% of the raw reads were removed due to poor quality. It can be
seen in Figure 5.4A that the mean RNA-seq base quality for strain N0145 decreases
throughout the read length, and after 85 cycles (read lengths of 85bp) mean phred scores
<10, correlating to 90% base call accuracy. Post trimming removed the poor quality 3’
tails of these reads, as well as reads that were low quality throughout (Figure 5.4B).
A. B.
Figure 5.4. Distribution of quality scores throughout RNA-seq read length for
strain N0145. The x-axis is the position with in the read length (bp), y-axis is read
quality based on Phred scores. A. Raw reads pre-trimming. B. Post-trimming read
quality.
N0145_HS
5 10 15 20 25 30 35 40 45 50 55 60 65 70 75 80 85 90 95 100
0
10
20
30
40
Position in read (bp)
Rea
d qu
ality
(phr
ed s
core
)
N0145_HS
5 10 15 20 25 30 35 40 45 50 55 60 65 70 75 80 85 90 95 100
0
10
20
30
40
Position in read (bp)
Rea
d qu
ality
(phr
ed s
core
)

5.3 Results
126
Table 5.5. Details of exponential phase transcriptomes used in differential
expression analysis. The nine transcriptomes were constructed using the same Illumina
RNA-seq method (section 2.5.1). Sample ID was used to track the sample through the
sequencing pipeline. Two Illumina machines were used to sequence the technical
replicates; HiSeq2000 (HS) and the Genome Analyser GAIIx (GA). Fold coverage was
calculated as the amount of sequence data mapped, excluding rRNAs (16S, 23S and 5S
subunits), divided by the genome size of H37Rv, which was used for the reference-
based assembly of the transcriptomes (4411532 bp). A. Six strains sequenced on the HS
platform. B. Technical replicates for strains N0145, N0031 and N0153.
A.
Sample 1 2 3 4 5 6
Sample ID GR1 GR2 GR16 GR5 GR6 GR15 Machine HS HS HS HS HS HS Strain N0145 N0031 N0052 N0072 N0157 N0153 Lineage L2 L2 L2 L1 L1 L1 Growth phase EXP EXP EXP EXP EXP EXP Read Length SE 101bp SE 101bp SE 60bp SE 101bp SE 101bp SE 60bp Mapped reads (Million) 47.476144 41.065818 152.323131 44.946409 39.208057 148.026386
Unmapped reads (Million) 30.552533 21.408397 20.090865 13.226052 9.695711 20.899070
rRNA reads 44.530529 38.050982 142.691893 41.303614 36.843853 138.358711 Non- rRNA (Mb) 218.2 219.5 327.5 268.8 169.3 473.7
Fold coverage 49.5 49.8 74.2 60.9 38.4 107.4
B.
Sample 7 (t) 8 (t) 9 (t)
Sample ID GR1 GR2 GR13 Machine GA GA HS Strain N0145 N0031 N0153 Lineage L2 L2 L1 Growth phase EXP EXP EXP Read Length SE 75bp SE 75bp SE 101bp Mapped reads (Million) 22.670235 21.866688 37.070182
Unmapped reads (Million)
8.067401 6.538578 26.419337
rRNA reads 21.800412 20.914537 34.574916 Non- rRNA (Mb) 58.0 63.5 69.9
Fold coverage 13.2 14.4 15.8

5.3 Results
127
Table 5.6. Transcriptomes used in TSS mapping. Exponential and stationary phase
transcriptomes of strains N0153 and N0145 were generated; these were chosen as
representative Lineage 1 and 2 strains. cDNA libraries ready for sequencing were
constructed by Vertis Biotechnologie AG and sequenced at NIMR.
Sample 13 14 15 16
ID GR1 GR2 145_s4 153_s4 Machine HS HS GA GA
Strain N0145 N0153 N0145 N0153
Lineage L2 L1 L2 L1 Growth phase EXP EXP STAT STAT Read Length SE 50bp SE 76bp SE 76bp SE 76bp Mapped reads (Million) 7.966042 24.649725 18.745600 21.574243
Unmapped reads (Million) 0.726967 1.839590 0.834070 1.863064
rRNA reads 2.200098 3.144389 11.548229 10.708733
Non- rRNA (Mb) 288.3 1290.3 431.8 651.9
Fold coverage 65.4 292.0 97.9 147.8
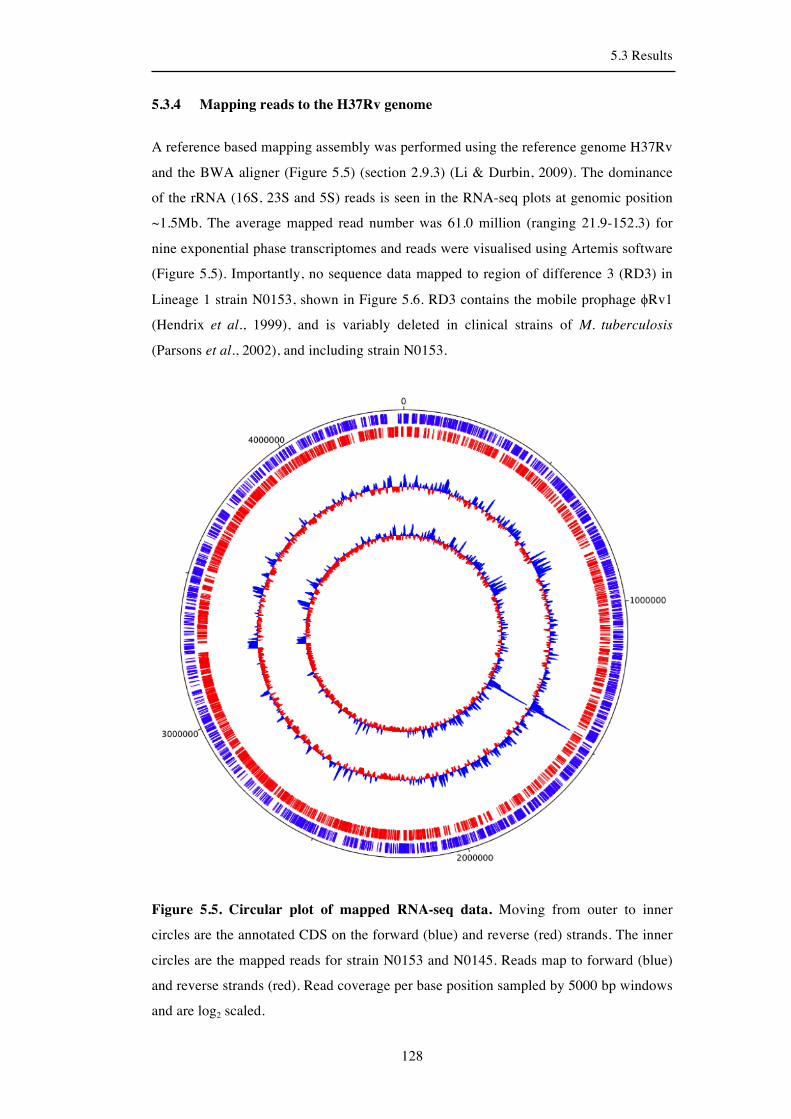
5.3 Results
128
5.3.4 Mapping reads to the H37Rv genome
A reference based mapping assembly was performed using the reference genome H37Rv
and the BWA aligner (Figure 5.5) (section 2.9.3) (Li & Durbin, 2009). The dominance
of the rRNA (16S, 23S and 5S) reads is seen in the RNA-seq plots at genomic position
~1.5Mb. The average mapped read number was 61.0 million (ranging 21.9-152.3) for
nine exponential phase transcriptomes and reads were visualised using Artemis software
(Figure 5.5). Importantly, no sequence data mapped to region of difference 3 (RD3) in
Lineage 1 strain N0153, shown in Figure 5.6. RD3 contains the mobile prophage ϕRv1
(Hendrix et al., 1999), and is variably deleted in clinical strains of M. tuberculosis
(Parsons et al., 2002), and including strain N0153.
Figure 5.5. Circular plot of mapped RNA-seq data. Moving from outer to inner
circles are the annotated CDS on the forward (blue) and reverse (red) strands. The inner
circles are the mapped reads for strain N0153 and N0145. Reads map to forward (blue)
and reverse strands (red). Read coverage per base position sampled by 5000 bp windows
and are log2 scaled.

5.3 Results
129
Figure 5.6. Representation of transcriptome plot based on Artemis. y-axis shows
sequence depth, and all plots scaled to a depth of 30 bases (scale bar on bottom plot).
Reads on forward strand in blue, and reverse strand in red. Part of RD3 is shown for
Lineage 1 strains N0157, N0072 and N0153, which is variably deleted in the MTBC.
5.3.5 Identifying strain specific gene deletions
It is known from previous studies that the number of genes within clinical strains is
variable due to gene deletions at the lineage and strain specific level (Tsolaki et al.,
2004). One region that includes sixteen gene deletions relative to the reference strain
H37Rv was shown previously in Figure 5.6. A microarray based study has identified
224 gene deletions (5.6% of all annotated genes) in a survey of one hundred clinical
isolates (Tsolaki et al., 2004). This has important ramifications for the following
differential expression analysis, and these deletions need to be removed to prevent the
identification of changes in expression due to deletions. A Perl script was written to
identify gene deletions and based on the genome coverage depths for the respective
strains (Appendix A), allowing the removal of only genes deleted in the six strains. This
also presented an opportunity to investigate the nature of the gene deletions within the
strains. In total genome-wide scanning in the genomes identified 223 genes that were
deleted in one or more strain. This was based on a cut-off threshold of <90% base
coverage per annotated gene (Figure 5.7).
N01
57
N00
72
N01
53
Line
age
1
Rv1576c Rv1575
!"0
30
Rv1574 Rv1573
Rv1572c Rv1571

5.3 Results
130
Figure 5.7. Distribution of gene deletions in the six RNA-seq study strains. In total
223 genes were classed as deletions. Strains are hierarchical clustered based on
deletions, and genes (rows) clustered and grouped based on existing gene functional
categories. Deletions found within genes annotated as PE/PPE functional category were
excluded from the analysis.
!"#$%&'()
!""%(&'()
!""*#&'()
!"#%+&'#)
!"#%*&'#)
!""+(&&'#)
,-./0123,4&5,32-678&&&&&&
9378-,:-;&<4532<-269108
672-,=-;61,4&=-21>3068=&17;&,-856,12637
67?3,=12637&512<@148
9-00&@100&17;&9-00&@100&5,39-88-8
678-,2637&8-A8&17;&5<1.-8
0656;&=-21>3068=
/7B73@7
:6,/0-79-C&;-23D6?6912637C1;15212637
0 10 100
Percentage of gene deleted
!Rv1
!Rv2

5.3 Results
131
Hierarchical clustering based on the identified gene deletions clustered the six strains by
lineage and sub-lineage, following the known genome phylogeny. This is expected due
to the clonality of the MTBC. Grouping the gene deletions first by functional category
and then genomic position it was seen that large blocks of deletions within the insertion
sequences and phages section are largely made up of deletions of the prophages. There
are two prophages in the H37Rv genome, designated ϕRv1 (Rv1572c-Rv1588c) and
ϕRv2 (Rv2646-Rv2659c) (Cole et al., 1998; Hendrix et al., 1999). The first prophage
ϕRv1 is not present in all Lineage 2 strains and N0153 from Lineage 1. This is an
example of convergent evolution, whereby ϕRv is not present across more than one
lineage, although it is not known if the phage was deleted in these strains or was never
inserted originally. Strain N0153 and N0072 also do not have the second prophage
(ϕRv2). Whilst deletions were distributed throughout all gene categories, there was a
disproportionate representation of several categories based on the genome-wide number
of genes within the category (Figure 5.8). Using a χ² test followed by multiple testing
correction a significant overrepresentation of gene deletions within the insertion
sequence and phages category was identified (p=0.0009). Expressed as a ratio of the
genes within the category versus the genome-wide number, insertion sequences and
phages were 11-fold over-represented. Under-represented groups were intermediary
metabolism and respiration (p=0.004) and genes involved in information pathways
(p=0.04), which were 2-fold and 5-fold under-represented respectively.
As expected, significantly more genes classed as nonessential for growth based on
previous classifications were present in the deleted gene set (Sassetti et al., 2003;
Sassetti & Rubin, 2003) (χ², <0.0001). However, ten deleted genes (6.4% of all
deletions) were defined as being essential. Four of the genes are annotated as conserved
hypotheticals, and the remaining are genes involved in cell wall and cellular processes
(Rv0383c, Rv1974), lipid metabolism (fadD30, desA3), intermediary metabolism and
respiration (Rv1524), and information pathways (infB). Four of these deletions have
been identified in the previously described microarray based study of one hundred
clinical MTBC isolates (Tsolaki et al., 2004). The infB deletion has not been previously
identified, and was surprising as the encoded InfB protein is an essential initiation factor
of the protein synthesis machinery (Boelens & Gualerzi, 2002). However, the deletion
was just within the threshold of defining a gene deletion used in this study, with 11.1%
of the gene deleted in strain N0153, and <6% in strain N0145.

5.3 Results
132
Figure 5.8. Distribution of gene deletions grouped by gene function category. For
each category the number of deleted genes (black) and non-deleted genes (white) is
shown. Actual deleted gene numbers are shown on top of bars. Gene categories with a
statistically significant departure from the expected number of deletions are identified by
asterisk (*). Categories were tested using a χ² test followed by multiple testing
correction (False discovery rate method). * p <0.05, ** p<0.01, *** p<0.001. All
functional categories except the PE/PPE category were included in the analysis.
0 400 800 1200
virulence detoxification and adaptation
lipid metabolism
information pathways
cell wall and cell processes
intermediary metabolism and respiration
unknown
regulatory proteins
conserved hypotheticals
insertion seqs and phages
DeletedNon-deleted
76
2 *
24
18 **
2
8
28
62 ***
Number of genes
5.3 Results
133
5.3.6 Clustering of strains at the total sample level
The transcriptomic data was first clustered at the total sample level rather than at the
level of individual genes. This provides a meaningful analysis of overall expression
patterns in the samples, allowing the stratification of strains based only on expression.
This provided the first broad analysis of how closely related strains belonging to the
same lineage were in terms of transcription, and how the genetic diversity between
Lineage 1 and 2 is reflected in functional expression. Clustering was based first on gene
expression, or the messenger RNA (mRNA), and then antisense expression, which is
transcription that is complementary to the mRNA, and so from the noncoding strand of
DNA.
5.3.6.1 Clustering of strains by gene expression
Gene expression from all annotated genes excluded those identified as deleted in section
5.3.5. To enable the comparison of different expression levels, data was normalised as
reads per kilobase per million reads (RPKM). The RPKM measure was designed to
reflect the molar concentration of a transcript in the starting sample by normalising for
RNA length and the total number of reads the transcriptome data set (Mortazavi et al.,
2008). Pairwise spearman correlations of RPKM normalised gene expression were
calculated for all samples, converted into dissimilarities, and the distances between the
samples clustered using hierarchical clustering. The resulting dendogram is shown in
Figure 5.9. Branches show bootstrap confidence following 1000 bootstrap replicates,
indicating high statistical support. Strains from the same lineage were more closely
related than those from a different lineage. The three transcriptomes sequenced as
technical replicates, strains N0153 (HS 2), N0145 (GA) and N0031 (GA), were highly
related to their respective replicate transcriptome. Technical replicates were from the
same source of total RNA for each respective strain, but were from separate cDNA
library construction. In the case of Lineage 2 strains N0145 and N0031, cDNA was
sequenced as part of an earlier run on an Illumina Genome Analyser (indicated by the
GA suffix), as opposed to later Illumina HiSeq runs (indicated by the HS suffix) for all
other strains.
In addition to the sequenced clinical strains, three transcriptomes of the reference strain
H37Rv were included in clustering analysis. The transcriptomes were previously

5.3 Results
134
published by Arnvig et al. (2011). Strains were grown in the same growth media as this
study and RNA extracted from exponential phase growth. The method to generate
cDNA libraries was not the same as this study, but cDNA was sequenced using the
Illumina platform. The three transcriptomes were from three biological replicates, which
have similar gene expression, shown in Figure 5.9. Interestingly, whilst the three H37Rv
strains tightly cluster together, they are clearly distinct from all Lineage 1 and 2 strains,
suggesting the laboratory strain is an outlier relative to the clinical strains with respect to
its transcriptional profile.
Comparing back to the underlying genotype, transcriptome diversity parallels genome
diversity for the clinical strains (Figure 5.10), whilst the H37Rv transcriptomes do not fit
within the expected topology. Based on the genome phylogeny, H37Rv would be
expected to cluster alongside Lineage 2 strains and form part of the modern lineages;
instead it is clearly outside of Lineage 2 as well as Lineage 1. Whilst the clinical strains
did cluster by lineage, the parallel to genotype broke down at the sub-lineage level, for
example, Lineage 2 Beijing strain N0145 clustered with N0031, despite being
genetically closer to N0052, the other Beijing strain in the study.
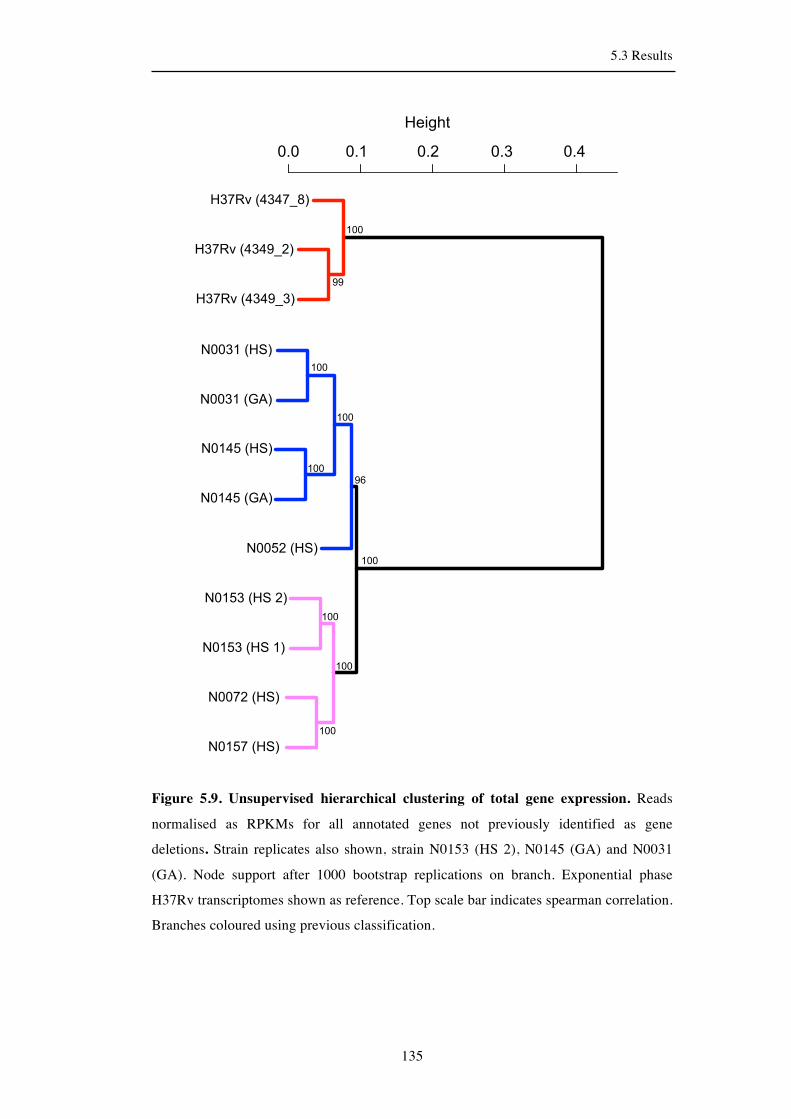
5.3 Results
135
Figure 5.9. Unsupervised hierarchical clustering of total gene expression. Reads
normalised as RPKMs for all annotated genes not previously identified as gene
deletions. Strain replicates also shown, strain N0153 (HS 2), N0145 (GA) and N0031
(GA). Node support after 1000 bootstrap replications on branch. Exponential phase
H37Rv transcriptomes shown as reference. Top scale bar indicates spearman correlation.
Branches coloured using previous classification.
!"#$%&'("(#)*+
!"#$%&'("(,)-+
!"#$%&'("(,)"+
./01"&'!2&-+
./01"&'!2&0+
.//#-&'!2+
./01#&'!2+
.//1-&'!2+
./0(1&'!2+
./0(1&'34+
.//"0&'!2+
.//"0&'34+
/5/ /50 /5- /5" /5(
!6789:
0//
0//
0//
0//
,,
0//
0//
0//
,;
0//

5.3 Results
136
Figure 5.10. Relationship of genotypic to transcriptomic diversity. Left hand side
image shows the 28-genome MTBC phylogeny constructed in Chapter 3. Right hand
side image shows the unsupervised hierarchical clustering of gene expression. The
transcriptome diversity parallels genome diversity for the clinical strains.
!"# !"$ !"% !"& '"!
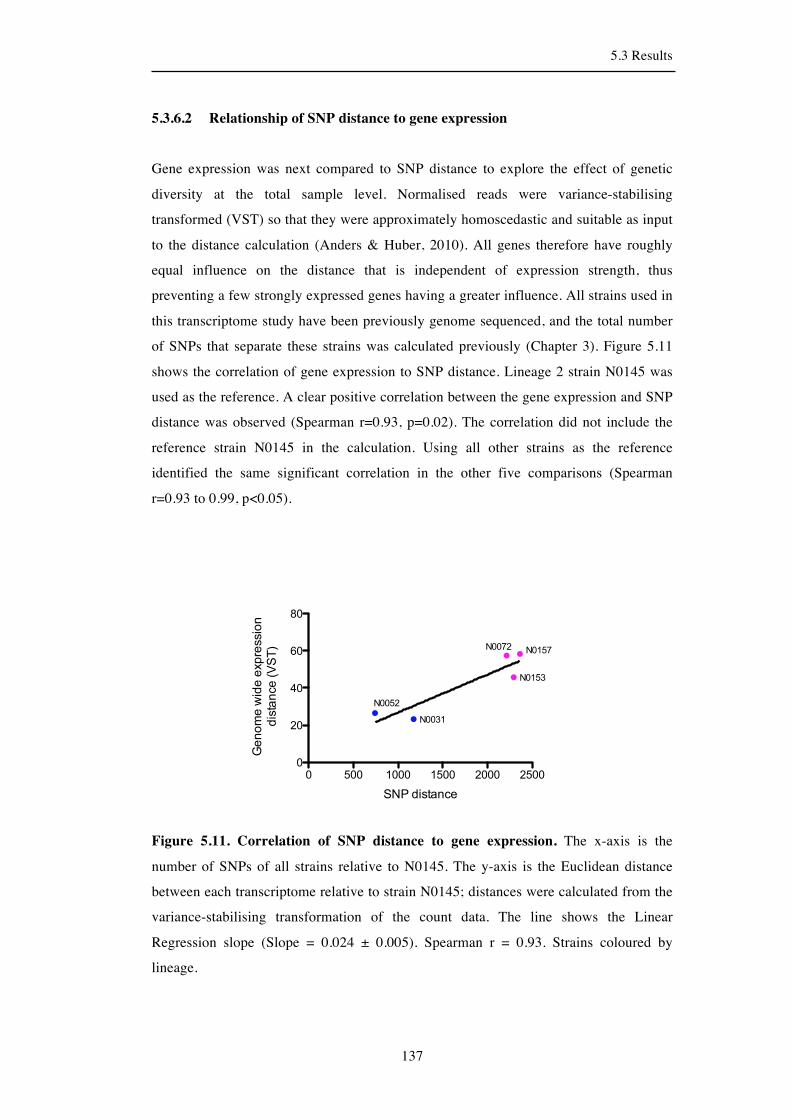
5.3 Results
137
5.3.6.2 Relationship of SNP distance to gene expression
Gene expression was next compared to SNP distance to explore the effect of genetic
diversity at the total sample level. Normalised reads were variance-stabilising
transformed (VST) so that they were approximately homoscedastic and suitable as input
to the distance calculation (Anders & Huber, 2010). All genes therefore have roughly
equal influence on the distance that is independent of expression strength, thus
preventing a few strongly expressed genes having a greater influence. All strains used in
this transcriptome study have been previously genome sequenced, and the total number
of SNPs that separate these strains was calculated previously (Chapter 3). Figure 5.11
shows the correlation of gene expression to SNP distance. Lineage 2 strain N0145 was
used as the reference. A clear positive correlation between the gene expression and SNP
distance was observed (Spearman r=0.93, p=0.02). The correlation did not include the
reference strain N0145 in the calculation. Using all other strains as the reference
identified the same significant correlation in the other five comparisons (Spearman
r=0.93 to 0.99, p<0.05).
Figure 5.11. Correlation of SNP distance to gene expression. The x-axis is the
number of SNPs of all strains relative to N0145. The y-axis is the Euclidean distance
between each transcriptome relative to strain N0145; distances were calculated from the
variance-stabilising transformation of the count data. The line shows the Linear
Regression slope (Slope = 0.024 ± 0.005). Spearman r = 0.93. Strains coloured by
lineage.
N0145&VSD&expression&distance&vs&snp&distance
0 500 1000 1500 2000 25000
20
40
60
80
N0052
N0031
N0157N0072
N0153
SNP&distance
Genome&wide&expression
distance&(VST)

5.3 Results
138
5.3.7 Clustering of strains by antisense expression
A similar sample level analysis was also performed for the antisense transcriptomes. The
hierarchical clustering of total antisense per transcriptome sample is shown in Figure
5.12. As seen previously for gene expression, strains from the same lineage clustered
closer together based on transcriptional expression than those from the other lineage.
However, within-lineage comparisons again did not follow the finer sub-lineage
structure of the genome phylogeny. Lineage 1 strain N0153 and N0072 did not cluster
together, despite being genetically closer than the third Lineage 1 strain N0157 based on
SNP distance.
Interestingly, the two technical replicates for Lineage 2, N0145 (GA) and N0031 (GA),
clustered based on gene expression (Figure 5.9), but not by antisense expression (Figure
5.12). The replicates can be linked by both being sequenced on the Illumina GA
machine (GA) which might be affecting the level of antisense detected in these
transcriptomes. The two replicates had the lowest number of mapped reads (ranging
21.9-22.6 million reads) compared to the mean 78.8 million reads for the six non-
technical replicates. This may suggest that less abundant and rare antisense transcripts
were not detected in these technical replicates due to the low level of sequencing depth,
and this similarity was identified in this analysis.

5.3 Results
139
Figure 5.12. Unsupervised hierarchical clustering of total antisense expression.
Reads normalised as RPKMs for all annotated genes not previously identified as gene
deletions. Strain replicates also shown, strain N0153 (HS 2), N0145 (GA) and N0031
(GA). Node support after 1000 bootstrap replications on branch. Top scale bar indicates
spearman correlation. Branches coloured using previous classification.
!"#$%&'()&*+
!"#$%&'()&#+
!"",*&'()+
!"#$,&'()+
!""$*&'()+
!"#-$&'()+
!""%#&'()+
!"#-$&'./+
!""%#&'./+
"0"$ "0#" "0#$ "0*" "0*$(12345
$6
#""
#""
77
#""
78
77

5.3 Results
140
5.3.8 Testing for differential expression in RNA-seq data
Measurement of transcription by sequencing is a recent development and currently there
is no clear consensus on a standard method to test for differential expression from
generated RNA-seq data (Dillies et al., 2012). Normalisation is necessary to ensure that
expression levels are comparable across samples (different cDNA libraries) and also
across annotated features to enable valid inferences about the differential expression of
features within or across samples (Robinson & Oshlack, 2010). Importantly,
normalisation must ensure that read counts arising from a transcript are proportional to
the length of the transcript and the total depth of the sample. In section 5.3.6 the RPKM
method was used to normalise the data at the total sample level, but Robinson and
Oshlack argue that RPKM may not be appropriate for normalisation between libraries of
different biological conditions (Robinson & Oshlack, 2010). Central to their argument is
that the total number of reads in a sequencing experiment is limited, and this sequencing
real estate is competed for by highly expressed genes, leaving less available for the
remaining genes. Thus if one sample contains highly expressed genes that are not
expressed in other samples, this sampling artifact can skew the differential analysis,
giving rise to higher false positive rates and less power to detect true differences.
Scaling the libraries with RPKM will not solve the problem due to the assumption that
the unknown total RNA is the same for all libraries.
There are now a number of methods which make a better assumption that the RNA
output of a core set of genes is similar between samples, and this is used to create a
scaling factor for the samples; several R bioconductor packages implement this, such as
DESeq (Anders & Huber, 2010), baySeq (Hardcastle & Kelly, 2010) and edgeR
(Robinson et al., 2010b). All three methods were tested on the transcriptome set. Raw
count data for each annotated feature in the technical transcriptome replicates were
combined, generating six RNA-seq samples to use in the analysis. To test for differential
expression at the lineage level, strains from the same lineage were treated as biological
replicates tested in the three above methods. A statistical cut-off of p <0.05 (False
Discovery rate corrected) was used to identify statistically significant expression. Figure
5.13 shows the number of genes identified as differentially expressed. There was
considerable overlap in the genes identified as displaying lineage-specific gene
expression, although the number of statistically significant genes ranged from 76 genes
using baySeq, to 336 genes identified with edgeR; edgeR identified all of the same
genes as DESeq (112 genes). For this study all differential expression analysis was

5.3 Results
141
performed using the latter method, DESeq, which was chosen as the best compromise of
sensitivity and the size of number of differentially expressed genes identified.
Figure 5.13. Venn diagram comparing edgeR, DESeq and baySeq differential
expression methods. The number of genes identified as differentially expressed using
three methods for identifying significantly different gene expression between Lineage 1
and 2 strains. Significance defined as p <0.05 following multiple testing correction.
5.3.9 Lineage-specific gene expression
A total of 112 genes were identified as having a lineage-specific pattern of differential
gene expression (based on a statistical cut-off of p<0.05); 88 (78.6%) were higher in
Lineage 1, and 24 (21.4%) more highly expressed in Lineage 2 strains (Figure 5.14).
The complete list is shown in Appendix E. Differentially expressed genes were present
in all Tuberculist functional categories. Twenty-six of the genes were identified as
differentially expressed in previous microarray comparisons of ancient versus modern
lineages or M. tuberculosis H37Rv versus M. bovis (a subgroup within Lineage 6)
(Golby et al., 2007; Homolka et al., 2010). The greatest significant fold change in gene
expression was galK (Rv0620), which is involved in galactose metabolism, and was 39-
fold higher in Lineage 1 strains. Antisense expression of Rv0842, a conserved integral
membrane protein of unknown function, was 197-fold higher in Lineage 2 strains.
Differential expression of galK was not detected in the previous microarray analysis,
whilst it was not possible to measure antisense expression in the experiment design
(Homolka et al., 2010).
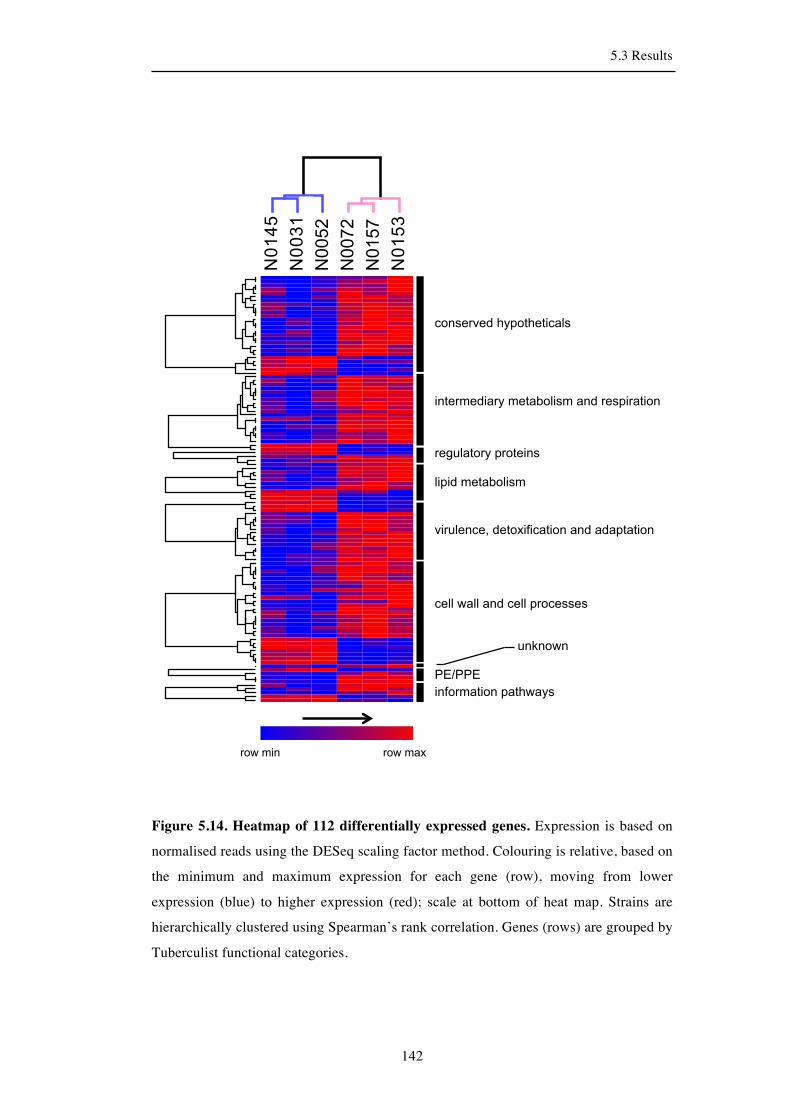
5.3 Results
142
Figure 5.14. Heatmap of 112 differentially expressed genes. Expression is based on
normalised reads using the DESeq scaling factor method. Colouring is relative, based on
the minimum and maximum expression for each gene (row), moving from lower
expression (blue) to higher expression (red); scale at bottom of heat map. Strains are
hierarchically clustered using Spearman’s rank correlation. Genes (rows) are grouped by
Tuberculist functional categories.
!"#$%
!""&#
!""%'
!""('
!"#%(
!"#%&
conserved hypotheticals
intermediary metabolism and respiration
regulatory proteins
lipid metabolism
virulence, detoxification and adaptation
information pathways PE/PPE
cell wall and cell processes
unknown
row min row max

5.3 Results
143
5.3.9.1 Transcriptional regulators
Eight transcriptional regulators were identified in Chapter 4 to harbour lineage-specific
SNPs or indel mutations predicted to impair the function of the encoded regulatory
protein. Three of the regulatory proteins with predicted functional SNPs, Rv0275c, virS
(Rv3082c) and Rv3167c were identified in the set of lineage-specific differentially
expressed genes. These are shown in Table 5.7.
VirS has previously been shown to act as an inhibitor of its own transcription and as a
positive regulator of the adjacent divergently-expressed MymA locus (Rv3083-3085,
Rv3086-3089) (Singh et al., 2003). Consistent with its predicted functional impairment
by substitution of arginine for leucine within the helix-turn-helix (HTH) DNA-binding
domain, virS expression was 17-fold higher in Lineage 1 than Lineage 2, but with no
effect on expression of MymA. Targets of transcriptional regulators Rv0275c and
Rv3167c are unknown, but the proximity of transcriptional start sites (TSS), identified
by additional 5’ enriched RNA-seq transcriptomes (section 2.5.2), suggested that
binding of the regulators to upstream sequences would repress transcription of the
adjacent divergent genes Rv0276 and Rv3168 (Figure 5.15). Expression of Rv0276
followed Rv0275c in being 10-fold higher in Lineage 2, although it fell outside of the
statistical cut-off (p=0.08), whilst Rv3178 expression was 5-fold higher in Lineage 1
(p=0.12).
Table 5.7. Differential expression associated with lineage-specific amino acid
mutations. SNPs: Three out of the eight transcriptional regulators with predicted
functional lineage-specific SNPs were differentially expressed at the lineage level. Fold
change relative to Lineage 1. Modern lineage represents SNPs in Lineage 2, 3, and 4.
Frameshift indels: a single base insertion in the regulator Rv3830c was predicted to
impair function. Expression of the adjacent genes, Rv3829c and Rv3831, was higher in
the predicted intact regulator.
Gene Function Fold change Mutation SNP
lineage Predicted functional SNPs Rv0275c transcriptional regulator 0.4 L24S Modern Rv3082c virS transcriptional regulator 12.0 L316R 1 Rv3167c transcriptional regulator 3.7 P17Q 1 Frameshift indels Rv3829c phytoene dehydrogenase 0.05 inactive Rv3830c 2 Rv3831 hypothetical 0.1 inactive Rv3830c 2

5.3 Results
144
Figure 5.15. TSS mapping for differential expression of divergently regulated
genes. Reads mapping to forward strand in blue, and reads corresponding to reverse
strand in red. Scale bar indicating maximum read depth at right of trace. For two of the
strains (Lineage 1 N0153 and Lineage 2 N0145), additional RNA-seq was performed
after a 5’ phosphate-dependent exonuclease digestion step to facilitate mapping of
transcriptional start sites (TSS). A. Differential expression of Rv0276 due to predicted
impaired Rv0275c regulator. Overlapping TSS suggest that Rv0275c acts as a repressor
of Rv0276. B. Differential expression of Rv3168 due to the predicted impaired
Rv3167c regulator. Again TSS show some overlap.
In addition to mutations introduced by SNPs, a frameshift insertion mutation in Lineage
2 was predicted to inactivate Rv3830c due to the resulting fusion with Rv3829c (Table
5.7). Although no significant change was observed in expression of Rv3830c itself, a 14-
fold and 21-fold increase in expression of Rv3829c and Rv3831 in Lineage 2 suggested
that the functional protein may act as a repressor of the two flanking genes, and that this
regulation is lost in the case of mutant allele.
It was not possible to identify a lineage-specific transcriptional signature for the
remaining four regulators, NarL, BlaI, SirR and KdpD, which were also predicted to be
functionally impaired (Chapter 4). This may be due to incorrect predictions, or
alternatively culture conditions other than routine exponential growth may be required to
uncover defects in associated regulatory responses.
N01
53
N01
45
0
6000
Rv3168 Rv3167c
0
500 N
0153
N
0145
!"
!" 0
1200
Rv0276 Rv0275c
0
1200 A B

5.3 Results
145
5.3.9.2 Expression of the DosR regulon in strains from the Beijing family
It has previously been reported that genes belonging to the DosR regulon are expressed
during exponential growth in strains belonging to the Beijing family (Homolka et al.,
2010; Reed et al., 2007), but this elevation was not found at the lineage level in this
analysis. Only Rv1733c met statistical criteria for up-regulation in Lineage 2 (p=0.023),
but an enhanced DosR response was clearly seen in strains N0145 and N0052 (Figure
5.16). The outlying strain, N0031, belongs to a basal branch of Lineage 2 that diversified
prior to expansion of the major Beijing branches represented by N0145 and N0052.
A 350kb genomic duplication that includes the DosR operon has been identified in the
Beijing strains and has been suggested to contribute to constitutive expression of the
DosR regulon (Domenech et al., 2010; Weiner et al., 2012). This duplication is present
in N0145 and N0031, but absent from N0052, and therefore cannot account for the
observed differential pattern of DosR expression in our study (Figure 5.17).

5.3 Results
146
Figure 5.16. Heat map of dosR regulon. Normalised expression represented as fold
change relative to the mean. Note * Rv0571c, Rv0572c deleted in strain N0157. Hclust
of strains based on dosR regulon separates Beijing strains N0145 and N0052. N=48 plus
small RNA MTS1338. Black indicates no expression. Scale at bottom.
0.1 1 10

5.3 Results
147
Figure 5.17. Duplication of dosR region. Genome read depth across the genome for
the six in RNA-seq strains. Genome depth maximum height cut-off at 255 bases. Arrows
show the position of the dosR operon within the duplicated region in Lineage 2 strains
N0145 (a Beijing strain) and N0031 (non-Beijing strain). The previously published
genomic duplication that includes the dosR operon extends from 3.5 to 3.8Mb
(Domenech et al., 2010), although in strain N0031 the duplication is shorter in length.
Amino acid changing mutations that might alter the function of DosR or related
regulatory components were not found. However, a Beijing-specific synonymous SNP
(C 3500149 T) was identified within Rv3134c, which encodes a Universal Stress protein
(USP) domain, and is itself a member of the DosR regulon (Gerasimova et al., 2011).
Rv3134c is immediately upstream of dosR and the SNP generates a TAnnnT -10
consensus motif that is characteristic of actinomycetes promoters (where n represents
any base) (Figure 5.18A). The classical prokaryotic promoter structure that is recognized
by σ70 sigma factors has been defined based on studies of numerous E. coli promoters
(Hawley & McClure, 1983), and similar sequences have been identified in other bacteria
(Newton-Foot & Gey van Pittius, 2012). The promoter sequence determines the level of
expression of a gene and is recognised as the DNA sequence between 10 and 35 bases
upstream of the TSS. The TSS is usually a purine base (A or G base), and the -10
sequence, also known as the Pribnow box, is a highly conserved hexamer centered about
0
255
N01
57
N00
72
N01
53
N00
52
N01
45
Line
age
1 Li
neag
e 2
N00
31
0 1 2 3 4
Genome position (Mb)
dosR
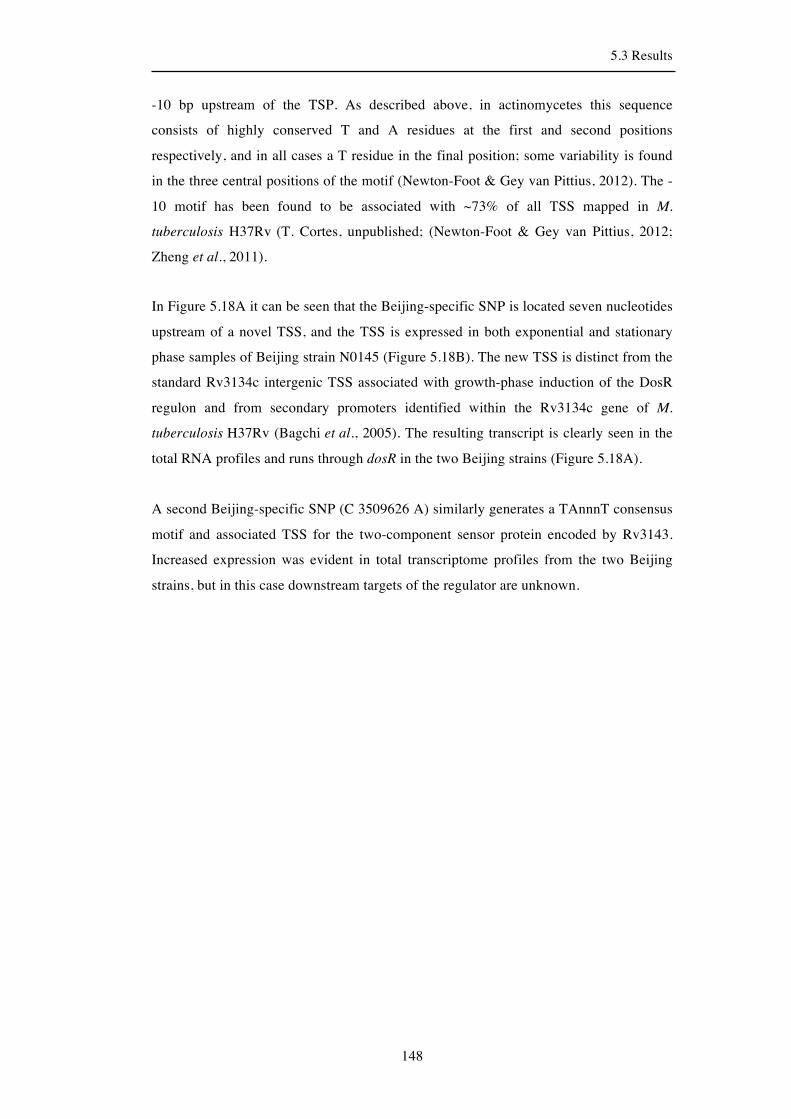
5.3 Results
148
-10 bp upstream of the TSP. As described above, in actinomycetes this sequence
consists of highly conserved T and A residues at the first and second positions
respectively, and in all cases a T residue in the final position; some variability is found
in the three central positions of the motif (Newton-Foot & Gey van Pittius, 2012). The -
10 motif has been found to be associated with ~73% of all TSS mapped in M.
tuberculosis H37Rv (T. Cortes, unpublished; (Newton-Foot & Gey van Pittius, 2012;
Zheng et al., 2011).
In Figure 5.18A it can be seen that the Beijing-specific SNP is located seven nucleotides
upstream of a novel TSS, and the TSS is expressed in both exponential and stationary
phase samples of Beijing strain N0145 (Figure 5.18B). The new TSS is distinct from the
standard Rv3134c intergenic TSS associated with growth-phase induction of the DosR
regulon and from secondary promoters identified within the Rv3134c gene of M.
tuberculosis H37Rv (Bagchi et al., 2005). The resulting transcript is clearly seen in the
total RNA profiles and runs through dosR in the two Beijing strains (Figure 5.18A).
A second Beijing-specific SNP (C 3509626 A) similarly generates a TAnnnT consensus
motif and associated TSS for the two-component sensor protein encoded by Rv3143.
Increased expression was evident in total transcriptome profiles from the two Beijing
strains, but in this case downstream targets of the regulator are unknown.

5.3 Results
149
A.
B.
Figure 5.18. DosR regulon and SNP-associated TSS. A. Mapped RNA-seq reads in
Lineage 2 strains over the DosR region. Reads mapping to forward strand in blue, and
reads corresponding to reverse strand in red; plots are shown at an identical scale with scale
bar indicating maximum read depth included in the bottom panel. The C/T SNP in Beijing
strains is indicated with asterisk (*), and the new TSS 7 nucleotides from created -10
box highlighted. Numbering is based on the M. tuberculosis H37Rv genome. B. RNA-
seq TSS mapping for Beijing strain N0145 (Lineage 2) and N0153 (Lineage 1) grown in
exponential and stationary phase conditions; TSS shown with arrows. The Beijing-
specific TSS within Rv3134c is expressed in exponential and stationary phase.
N00
52
N01
45
Line
age
2
N00
31
Rv3134c 0
1500
!"
dosR dosS
!"
0.1 1 10
3'-GccgagtTcacatgtacgcggttggccgacgggacaagctgc-5'
A
3500142 -10 box
Figure 2
!"
B
C
C 3500149 T
Rv3134c
!" !"
N01
53
N01
45
Sta
tiona
ry
0
16000
0
3000
N01
53
N01
45
Exp
onen
tial
Rv3134c
Rv3134c
!" !"
N01
53
N01
45
Sta
tiona
ry
0
16000
0
3000
N01
53
N01
45
Exp
onen
tial
Rv3134c

5.3 Results
150
5.3.9.3 SNP-associated TSS
The influence of SNP-associated TSS in generating transcriptional diversity was next
explored in the rest of the gene set with lineage-specific transcriptional profiles.
Alignment of lineage-specific SNPs with a total transcriptome map of M. tuberculosis
(strain H37Rv, T. Cortes unpublished) identified ninety-four instances (1.2% of 7601
TSS) in which a SNP fell within the 30-nucleotide region upstream of a TSS. The
frequency was markedly higher amongst the 168 differentially expressed genes and
antisense identified in this study, with 23 of the respective TSS harbouring one or more
SNPs in this upstream region (χ2, p<0.0001). In ten cases, lineage-specific SNPs
generated a new TAnnnT consensus motif linked to a new TSS (Table 5.8).
Table 5.8. Ten differentially expressed genes associated with change in promoter
sequence. Fold change relative to Lineage 1, with >1 higher Lineage 1 expression, <1
higher Lineage 2 expression. Modern lineage includes Lineages 2, 3 and 4. The final
mutation column shows the nucleotide change and genomic position as based on H37Rv
coordinates, and in brackets the -10 motif created (SNP in bold upper). Sequences read
in the 5’ to 3’direction.
Differentially expressed gene Function Fold
change Lineage
with SNP Mutation
Rv0469 umaA mycolic acid modification 2.2 1 C 560664 T
(tacaaT)
Rv0557 mgtA mannosyltransferase 3.2 1 C 649345 T
(tatgcT)
Rv0724A - methyltransferase 3.6 1 C 817696 T (tattcT)
Rv1781c malQ glucanotransferase 2.2 1 T 2017560 A (tAcggt)
Rv2051c ppm1 ppm synthase 2.2 1 C 2309356 T (taccaT) & T467I
Rv2765 - dienelactone hydrolase 7.4 1 C 3074830 T
(tactaT)
Rv3366 spoU tRNA methyltransferase 0.2
2 G 3778011 A (taccAg)
2 G 3778012 T (taccaT)
Rv3679 & Rv3680 - anion transport
ATPase 0.1/0.2 Modern C 4119246 T (tatgaT)
Rv3812 PE_PGRS62 hypothetical 2.5 1 C 4276306 T (Taatgt)
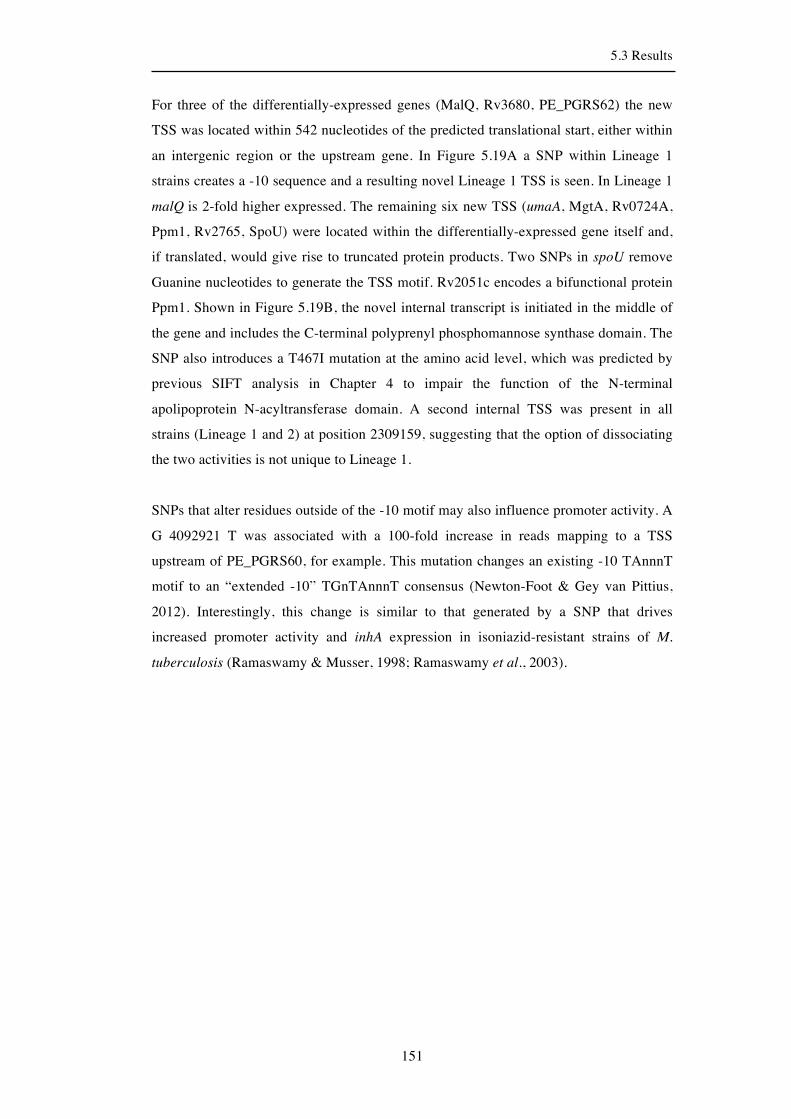
5.3 Results
151
For three of the differentially-expressed genes (MalQ, Rv3680, PE_PGRS62) the new
TSS was located within 542 nucleotides of the predicted translational start, either within
an intergenic region or the upstream gene. In Figure 5.19A a SNP within Lineage 1
strains creates a -10 sequence and a resulting novel Lineage 1 TSS is seen. In Lineage 1
malQ is 2-fold higher expressed. The remaining six new TSS (umaA, MgtA, Rv0724A,
Ppm1, Rv2765, SpoU) were located within the differentially-expressed gene itself and,
if translated, would give rise to truncated protein products. Two SNPs in spoU remove
Guanine nucleotides to generate the TSS motif. Rv2051c encodes a bifunctional protein
Ppm1. Shown in Figure 5.19B, the novel internal transcript is initiated in the middle of
the gene and includes the C-terminal polyprenyl phosphomannose synthase domain. The
SNP also introduces a T467I mutation at the amino acid level, which was predicted by
previous SIFT analysis in Chapter 4 to impair the function of the N-terminal
apolipoprotein N-acyltransferase domain. A second internal TSS was present in all
strains (Lineage 1 and 2) at position 2309159, suggesting that the option of dissociating
the two activities is not unique to Lineage 1.
SNPs that alter residues outside of the -10 motif may also influence promoter activity. A
G 4092921 T was associated with a 100-fold increase in reads mapping to a TSS
upstream of PE_PGRS60, for example. This mutation changes an existing -10 TAnnnT
motif to an “extended -10” TGnTAnnnT consensus (Newton-Foot & Gey van Pittius,
2012). Interestingly, this change is similar to that generated by a SNP that drives
increased promoter activity and inhA expression in isoniazid-resistant strains of M.
tuberculosis (Ramaswamy & Musser, 1998; Ramaswamy et al., 2003).

5.3 Results
152
A.
B.
Figure 5.19. SNP-associated TSS leading to differential gene expression. A. Lineage
1 SNP (T 2017560 A) is associated with a new TSS and 2.2-fold increased expression of
malQ in the respective strains. B. Internal coding TSS: A Lineage 1 SNP (C 2309356 T)
within ppm1 is associated with a new TSS and 2.2-fold up regulation of ppm1
transcription. The nonsynonymous SNP is predicted to impair lipoprotein N-
acyltransferase activity. A second internal TSS present in all strains is also indicated in
the TSS mapping inset.
N01
57
N01
53
N00
72
N00
52
N01
45
Line
age
1 Li
neag
e 2
N00
31
malQ eccB5
0
500
!"
!"
!"
eccB5
N01
53
N01
45
malQ eccB5
!"
B A Figure 3
N01
57
N01
53
N00
72
N00
52
N01
45
Line
age
1 Li
neag
e 2
N00
31
ppm1 Rv2050
0
250 !"
!"
!"
eccB5
N01
53
N01
45
ppm1 !"
N01
57
N01
53
N00
72
N00
52
N01
45
Line
age
1 Li
neag
e 2
N00
31
umaA
0
2000
!"
fadB2
pcaA
!"
!"
eccB5
N01
53
N01
45
!"
umaA pcaA
N01
57
N01
53
N00
72
N00
52
N01
45
Line
age
1 Li
neag
e 2
N00
31
deaD
0
300
!"
!"
!"eccB5
N01
53
N01
45
deaD
!"
D C
N01
57
N01
53
N00
72
N00
52
N01
45
Line
age
1 Li
neag
e 2
N00
31
malQ eccB5
0
500
!"
!"
!"
eccB5
N01
53
N01
45
malQ eccB5
!"
B A Figure 3
N01
57
N01
53
N00
72
N00
52
N01
45
Line
age
1 Li
neag
e 2
N00
31
ppm1 Rv2050
0
250 !"
!"
!"
eccB5
N01
53
N01
45
ppm1 !"
N01
57
N01
53
N00
72
N00
52
N01
45
Line
age
1 Li
neag
e 2
N00
31
umaA
0
2000
!"
fadB2
pcaA
!"
!"
eccB5
N01
53
N01
45
!"
umaA pcaA
N01
57
N01
53
N00
72
N00
52
N01
45
Line
age
1 Li
neag
e 2
N00
31
deaD
0
300
!"
!"
!"eccB5
N01
53
N01
45
deaD
!"
D C

5.3 Results
153
5.3.9.4 Differential antisense expression
A parallel analysis of antisense transcription identified similar conservation by lineage,
with a differential expression pattern for 56 genes; 23 were higher in Lineage 1, and 33
in Lineage 2 (Appendix E). Antisense RNAs are transcripts encoded on the strand that is
complementary to protein-coding genes. The transcripts are generated either from
internal TSS, or from overlapping 3’ untranslated regions (UTRs) in convergent gene
pairs, which has been identified previously in the transcriptome of H37Rv (Arnvig et al.,
2011). Three of the differentially expressed 3’ UTR antisense transcripts (pcaA, Rv1898
and ribD) were associated with SNPs that create a new TAnnnT-linked forward TSS in
the adjacent divergent gene (Table 5.9). In the case of pcaA, shown in Figure 5.20A, a 2-
fold increase in umaA gene expression and 4-fold increase in pcaA antisense expression
was detected. For a further six antisense transcripts (Rv0552, Rv0842, Rv0874c, deaD,
Rv2672 and FadE20), introduction of a TAnnnT motif on the reverse strand was
associated with new TSS arising within the gene itself. In the case of deaD, a Lineage 2
C to T SNP (a modern branch SNP) creates a new motif and TSS on both the forward
and reverse strands of DNA, causing a 41-fold increase in Lineage 2 (Figure 5.20B).
Table 5.9. Nine differentially expressed antisense associated with introduction of
SNP-associated TSS. Mutation column shows SNP lineage (1, 2 or Modern). Where
appropriate, predicted functional amino acid changes are shown and the sequence of
new -10 and extended motifs with the SNP allele indicated in uppercase. Nucleotide
positions are based on H37Rv genome. Sequences read in the 5’ to 3’direction.
Gene Function Fold change
Lineage with SNP Mutation
Rv0470c pcaA mycolic acid modification
4.1 1
C 560664 T (tacaaT)
Rv0552 hydrolase 8.6 1
C 643483 T (tacacT)
Rv0842 membrane protein 0.01 Modern
C 938246 T (taggcT)
Rv0874c hypothetical 0.2 2
C 972980 T (taggcT)
Rv1253 deaD RNA helicase 0.02 Modern
C 1400396 T (tatcaT)
Rv1898 hypothetical 0.1 Modern
C 2145878 T (tacccT)
Rv2671/72 ribD riboflavin biosynthesis
82.2/8.2 1
C 2987918 T (tacacT)
Rv2724c fadE20 acyl-CoA dehydrogenase
0.1 2
C 3036826 T (tagcaT)

5.3 Results
154
A.
B.
Figure 5.20. SNP-associated TSS leading to differential antisense expression. A. A
SNP-associated TSS in 3’ region of umaA in Lineage 1 strains is associated with higher
umaA gene expression (2.2-fold) and pcaA antisense expression (4.1-fold). B. A SNP
within deaD in all Lineage 2 strains is associated with a new TSS and 41.2-fold increase
in antisense transcription. The SNP also creates a -10 consensus on the forward strand;
this is associated with a new TSS but has no significant impact on the level of sense
transcription.
N01
57
N01
53
N00
72
N00
52
N01
45
Line
age
1 Li
neag
e 2
N00
31
malQ eccB5
0
500
!"
!"
!"
eccB5
N01
53
N01
45
malQ eccB5
!"
B A Figure 3
N01
57
N01
53
N00
72
N00
52
N01
45
Line
age
1 Li
neag
e 2
N00
31
ppm1 Rv2050
0
250 !"
!"
!"
eccB5
N01
53
N01
45
ppm1 !"
N01
57
N01
53
N00
72
N00
52
N01
45
Line
age
1 Li
neag
e 2
N00
31
umaA
0
2000
!"
fadB2
pcaA
!"
!"
eccB5
N01
53
N01
45
!"
umaA pcaA
N01
57
N01
53
N00
72
N00
52
N01
45
Line
age
1 Li
neag
e 2
N00
31
deaD
0
300
!"
!"
!"eccB5
N01
53
N01
45
deaD
!"
D C
N01
57
N01
53
N00
72
N00
52
N01
45
Line
age
1 Li
neag
e 2
N00
31
malQ eccB5
0
500
!"
!"
!"
eccB5
N01
53
N01
45
malQ eccB5
!"
B A Figure 3
N01
57
N01
53
N00
72
N00
52
N01
45
Line
age
1 Li
neag
e 2
N00
31
ppm1 Rv2050
0
250 !"
!"
!"
eccB5
N01
53
N01
45
ppm1 !"
N01
57
N01
53
N00
72
N00
52
N01
45
Line
age
1 Li
neag
e 2
N00
31
umaA
0
2000
!"
fadB2
pcaA
!"
!"
eccB5
N01
53
N01
45
!"
umaA pcaA
N01
57
N01
53
N00
72
N00
52
N01
45
Line
age
1 Li
neag
e 2
N00
31
deaD
0
300
!"
!"
!"eccB5
N01
53
N01
45
deaD
!"
D C

5.3 Results
155
Although not a lineage example, a highly expressed antisense transcript in Lineage 1
strain N0157 in ino1, an essential gene involved in virulence (Movahedzadeh et al.,
2004), also has a new TAnnnT motif created by a C 50557 T SNP. Interestingly, this is a
homoplasic SNP, which are rare in M. tuberculosis (Comas et al., 2009; Schürch et al.,
2011). The SNP is present in a sub-branch of Lineage 4, including strain H37Rv, which
also expresses the antisense transcript (Arnvig & Young, 2012).
5.3.10 Enrichment of toxin-antitoxins
It was not possible to identify direct SNP-associations for the remainder of the genes
showing lineage-specific patterns of differential expression. It is likely that their
differential expression reflects downstream consequences of primary mutations.
Analysis of the panel of differentially-expressed genes according to functional category
identified a 2-fold over-representation of proteins involved in virulence, detoxification
and adaptation. This was found to be driven by ten toxin-antitoxins (TA) genes, and a
separate classification of all TA as an independent category revealed 2.9-fold over-
representation in the differentially expressed set compared to the genome representation
(χ2, p=0.03) (Figure 5.21). The full table is shown in Appendix F. Six of the TA were
chosen and the pattern of differential gene expression seen by RNA-seq was confirmed
by quantitative RT-PCR (Figure 5.22). Additional strains were included in this analysis
to widen the lineage set (section 5.2.1.3). vapB10 fell outside of the RNA-seq
statistically significant cutoff (p=0.06) but by qRT-PCR this was also shown to be
differentially expressed.

5.3 Results
156
Figure 5.21. Over-representation of differentially expressed toxin-antitoxins. Ratio
of significant differential gene expression grouped by functional category, compared to
the genome-wide representation of the category. Values on the x-axis represents the
difference as fold-change, positive fold-change indicates over-representation of a
particular function category, negative values under-representation, whereas a fold-
change of one indicates no difference. As a separate toxin-antitoxin category, there were
2.9-fold more toxin-antitoxins than expected (χ2, p=0.03).
Figure 5.22. Validation of select RNA-seq differentially expressed toxin- antitoxins
(solid bars) by qRT-PCR (striped bars). Fold change relative to Lineage 1 expression
on y-axis (log10 scale), and bars coloured by lineage with higher expression. Error bars
for qRT-PCR indicate the standard deviation of three biological replicates.
!
!"
!""
#$%&'()*+,-''.%$,/
0*123 0*124 5*6788 5*678! 5*67!" 5*69!" 5*69!3":!
A B
!" # " $
%&'()*+,%(&-.+,/0+12%&,3)*34%+)1-*3,+5(6%2*-+&4-)32.%)+,%(&789778)3:;6+,()1-.)(,3%&2<(&23)=34-/1.(,/3,%<+626%.%4-*3,+5(6%2*<366-0+66-+&4-<366-.)(<32232=%);63&<3>-43,(?%'%<+,%(&>-+4+.,+,%(&;&@&(0&,(?%&!+&,%,(?%&2!
A;&<,%(&+6-<+,3:()1-)3.)323&,+,%(&-B)+,%(C
!
RNAseq qRT-PCR
Figure 4
!
!"
!""
#$%&'()*+,-''.%$,/
0*123 0*124 5*6788 5*678! 5*67!" 5*69!" 5*69!3":!
A B
!" # " $
%&'()*+,%(&-.+,/0+12%&,3)*34%+)1-*3,+5(6%2*-+&4-)32.%)+,%(&789778)3:;6+,()1-.)(,3%&2<(&23)=34-/1.(,/3,%<+626%.%4-*3,+5(6%2*<366-0+66-+&4-<366-.)(<32232=%);63&<3>-43,(?%'%<+,%(&>-+4+.,+,%(&;&@&(0&,(?%&!+&,%,(?%&2!
A;&<,%(&+6-<+,3:()1-)3.)323&,+,%(&-B)+,%(C
!
RNAseq qRT-PCR
Figure 4

5.3 Results
157
Table 5.10. Ten differentially expressed toxin-antitoxins (TA). Mutation column
shows SNP lineage (1, 2 or Modern). Where appropriate, predicted functional amino
acid changes are shown and the sequence of new -10 and extended motifs with the SNP
allele indicated in uppercase. Nucleotide positions are based on H37Rv genome.
Gene Function Fold
change
Lineage
with SNP Mutation
Rv1103c mazE3 antitoxin 2.2
Rv1397c vapC10 toxin 0.1 Modern G103D
Rv2063 mazE7 antitoxin 15.7
Rv2063A mazF7 toxin 4.9 1 R101P
Rv2274A mazE8 antitoxin 3.2
Rv2526 vapB17 antitoxin 0.2
Rv2527 vapC17 toxin 0.1
Rv2596 vapC40 toxin 2.2
Rv2758c vapB21 antitoxin 2.5
Rv2830c vapB22 antitoxin 2.5 Modern G 3137237 A
Transcription of TA modules is generally repressed by binding of the cognate toxin-
antitoxin complex to the promoter region, and activated when the antitoxin is degraded
in response to signals associated with environmental stress (Buts et al., 2005).
Differential expression could result from mutations that affect stability or repressor
activity of the toxin-antitoxin complex, mutations that alter promoter sequences, or
mutations that alter proteolytic activity in the cell. Two differentially-expressed toxins
have nonsynonymous lineage-specific SNPs; VapC10 (Lineage 2, G103D) and MazF7
(Lineage 1, R101P) (Table 5.10), but the SIFT algorithm was unable to predict
functional consequences for these mutations. All TA pairs with detectable transcripts
were expressed from a single major TSS. In two cases the TSS was located within the
annotated coding sequence, and suggesting that the translational start sites are annotated
incorrectly. In the majority of cases (31 out of 51 expressed TA pairs; 60.8%), the TA
pairs were encoded by leaderless mRNAs. A single TSS-associated SNP was identified;
with position -1 of the VapB22 (Rv2830c) TSS switched from G to A in Lineage 2
strains with a decrease in expression.
5.3 Results
158
Due to the lack of direct SNP associations it could be concluded that differential
expression of TA genes reflects general differences in regulatory networks between the
two lineages. A series of genes that are preferentially expressed in Lineage 1 strains
have previously been implicated in the H37Rv response to acid stress and cell wall
damage, including ahpC and ahpD, fabD and lpqS (Fisher et al., 2002). Up-regulation of
these genes may be associated with the stress-related sigma factor sigB (Rv2710), which
has 2-fold higher expression Lineage 1, but falls outside the statistical cut-off (p=0.06).
5.4 Discussion
159
5.4 Discussion
5.4.1 Strengths and limitations of the study
This aim of this study was to identify the lineage-specific expression profiles of Lineage
1 and 2 and to relate this back to the underlying genotype of the respective lineages. For
the first time the total RNA expression of clinical MTBC strains was uncovered using a
sequence-based approach. The RNA-seq data generated has intrinsic advantages of
previous transcriptional analysis methods that rely on hybridisation of targeted
oligonucleotides to specific loci (qRT-PCR), hybridisation of cDNA of multiple probes
(Microarray) or labeled probes binding to RNA (Northern blotting) (Croucher &
Thomson, 2010). Firstly, RNA-seq is not biased as there is no reliance on prior
knowledge of the sequence using probes, therefore all transcripts are studied, including
all gene (mRNA), antisense and non-coding transcription. Secondly, as the method is
sequence based, the resolution is more precise than hybridisation, effectively sampling
all positions within the transcripts, and non-specific hybridisation is not an issue (Kane
et al., 2000). Finally, the dynamic range of RNA-seq is effectively unlimited, and
defined by the amount of sequence coverage that can be generated in the experiment,
whereas the detection of fluorescence or radioactivity can become saturated using
microarrays. Ultimately, the transcriptome data generated in this study is more
discriminatory at high and low expression levels, and provides an unbiased view of
transcription in the MTBC strains.
Whilst one of the advantages of the RNA-seq method is the sampling of all RNA
species, this can also become a draw back through dominance of the transcriptome data
by highly expressed transcripts, such as ribosomal RNA. In this study, about 90% of the
total sequence data was attributed to rRNA, effectively saturating the dataset by out-
competing all other mRNA transcripts for sequence data. Exclusion of such transcripts is
more difficult than with microarray experiments, where rRNA probes can simply be

5.4 Discussion
160
omitted from the chip design. Several methods exist to remove abundant transcripts,
including the use of terminator exonucleases that specifically degrade transcripts with a
5’-monophosphate group (Sharma et al., 2010a), or hybridization of magnetic beads
linked to oligonucleotides complementary to rRNAs (Camarena et al., 2010; Yoder-
Himes et al., 2009). Although such methods are attractive, the significant increased cost
of using these, potential for sample degradation and introduced bias (Croucher et al.,
2009; Yi et al., 2011) and the availability of the high sequence output from the Ilumina
HiSeq2000 sequencer at NIMR rendered these options unnecessary for the differential
expression analysis performed in this study. However, the former terminator
exonuclease method was used in transcriptional start site (TSS) mapping analysis, which
effectively biased the sequence coverage to the 5’ end of transcripts thus facilitating the
accurate mapping of TSS. As larger studies wish to sequence more strains, it may
become necessary to use a depletion step to enable multiplexing of cDNA from multiple
strains into a single Illumina flowcell lane, such as the recently release Epicentre
ScriptSeq v2 preparation kit (Cat. No. RSBC10948) in 2012, which allows up to twelve
indexed cDNA libraries to be pooled together into one lane, therefore decreasing the
cost of sequencing and providing a rapid increase in potential experiment size.
The experimental design of this study was to identify the lineage-specific expression
profiles of two MTBC lineages. The RNA-seq data was therefore mapped to a common
reference genome sequence using M. tuberculosis genome annotations based on H37Rv;
in this case the sequence was the reconstructed ancestor of the MTBC determined from
the phylogeny in Chapter 3, and the annotations was based on Tuberculist annotations
(Lew et al., 2011). This is advantageous as the number of genes is common to the
dataset, allowing comparison of expression levels across all strains. However, a
disadvantage of using a reference-based mapping process is the ignorance to the
expression of any novel transcripts present in the samples. About a quarter (23.3%) of
the filtered high quality transcriptome data did not map to the reference genome, which
could suggest that some highly expressed transcripts are not detected in this analysis.
The mapping algorithm (BWA) (Li & Durbin, 2009) and parameters used could
accommodate gaps of up to three mismatches, and therefore larger indels may account
for some of these sequences not mapped. But future non-reference based de novo
mapping of the sequences has the potential to indentify novel transcripts not present in
the reference strain H37Rv, although such analyses are computational very expensive
and would be more effective using paired-end reads instead of the single-end reads
generated in this study (Schulz et al., 2012).

5.4 Discussion
161
5.4.2 Lineage-specific expression
Clustering analysis of the transcriptome samples identified significant correlation in
transcription between strains of the same lineage based on both sense and antisense
expression, suggesting that the underlying lineage-specific variation is functional and
results in differential transcription. This was strengthened by the positive correlation
between the number of diverging SNPs and gene expression distance (Figure 5.11). At
the gene level, differential analysis identified a total of 112 genes with significant
lineage-specific patterns of expression. A quarter of the genes (26 out of 112 genes)
were identified as differentially expressed in previous microarray comparisons of
ancient versus modern lineages or M. tuberculosis H37Rv versus Mycobacterium bovis
(within Lineage 6) suggesting that the RNA-seq method is concordant to other gene
expression methods (Golby et al., 2007; Homolka et al., 2010). Furthermore, qRT-PCR
analysis of a select number of differentially expressed genes identified the same
direction of fold change identified in the RNA-seq data, and despite the addition of
strains not used in the RNA-seq study; this strengthens the case that there is not a
selection bias in the strains used, and that the lineage-specific patterns of expression are
a general phenomenon of the respective lineage.
A parallel analysis of antisense transcription identified similar conservation by lineage
with a differential expression pattern for 56 genes. Pervasive expression of antisense
transcripts has been recognised as a common feature of bacterial transcriptomes (Lasa et
al., 2011; Raghavan et al., 2012). Comparison of upstream sequences in Escherichia
coli and Salmonella typhimurium suggest that selective pressure for conservation of
antisense promoters is lower than in the case of sense promoters (Raghavan et al., 2012).
Parallel sequencing of the above genomes by Raghavan et al. identified only eight
common highly expressed antisense in both species out the approximately one hundred
antisense from orthologous gene pairs found between the two species. This could have
been due to a species-specific function of the antisense, but no evidence of conservation
was found within strains of E. coli either (Raghavan et al., 2012). In contrast, this study
found a broadly similar pattern of sense and antisense diversity in the MTBC lineage
comparison, which could reflect the reduced purifying selection and increased genetic
drift within MTBC (Hershberg et al., 2008). Currently, the biological significance of
antisense transcripts is unknown, and in the thousands of proposed antisense in E. coli
only a few have been functionally characterised (Fozo et al., 2008; Kawano et al.,
2007). The conservation of antisense in a lineage-specific pattern in the MTBC is

5.4 Discussion
162
interesting and suggests a functional role. It is possible that double-stranded RNA
molecules differ from single-stranded mRNAs in their efficiency of translation and
susceptibility to degradation which could add another layer of regulation (Thomason &
Storz, 2010), which should not be ignored in future studies of MTBC diversity.
5.4.3 Linking genotype to phenotypic consequences at the transcriptional level
Bioinformatic analyses in Chapters 3 and 4 suggested a high percentage of
nonsynonymous SNPs identified across the MTBC were likely to impair protein
function. In this study, three mechanisms by which transcriptome diversity is generated
were identified and these are discussed in the following sections.
5.4.3.1 Transcriptional regulators
Focusing on Lineages 1 and 2, functional impairment of eight transcriptional regulators
was predicted in Chapter 4. Transcriptional profiling provided confirmatory evidence in
four of these cases, virS, Rv0275c, Rv3167c, and Rv3830c. Increased transcription was
observed for three regulatory proteins with mutations affecting the helix-turn-helix
motif, consistent with a loss of autorepression. Elevated expression of VirS in Lineage 1
recapitulates results of a previous microarray comparison of modern and ancient
lineages (Homolka et al., 2010), with the absence of activation of the associated MymA
regulon providing further indication that the mutant VirS lacks functional activity.
Differential expression of virS has also been observed in the comparison of M.
tuberculosis and M. bovis transcriptomes, with 10-fold higher virS expression in M.
bovis (Golby et al., 2007); interestingly another virS lineage-specific SNP was found at
amino acid residue 322, six amino acids away from the above Lineage 1 SNP, and this
defines all animal-adapted MTBC strains, leading to a change in amino acid also
predicted to be functional by SIFT (R322C). Experimental deletion of VirS in M.
tuberculosis H37Rv resulted in pleiotropic cell wall defects and reduced growth in the
spleen of guinea pigs (Singh et al., 2005), raising the possibility that this mutation may
reduce the virulence of Lineage 1 strains. Transcription of Rv0275c and Rv3167c was
similarly upregulated in strains carrying the mutant allele. Neither of these proteins have
been characterised, but RNA-seq profiles were consistent with the functional proteins
acting as autorepressors and inhibitors of adjacent genes. Predicted inactivation of
Rv3830c by a frameshift mutation causing fusion to an adjacent protein did not result in

5.4 Discussion
163
a significant change in expression, but flanking genes (phytoene dehydrogenase
Rv3829c, and Rv3131 with unknown function) were markedly upregulated in Lineage 2.
Whilst for the remaining four transcriptional regulators no detectable transcriptional
phenotype was found in this study, analysis of the response to specific stimuli other than
in exponential phase culture may uncover functional defects. For example, the BlaI
regulator is activated in the presence of beta-lactams (Sala et al., 2009), and therefore
the predicted impaired BlaI in Lineage 1 may only be identified in these conditions.
Similarly, low potassium may uncover functional defects of KdpD in Lineage 1 strains;
kdpE is a sensor protein of the Kdp postassium transport system (Steyn et al., 2003;
Walderhaug et al., 1992).
5.4.3.2 SNP-associated TSS
In addition to amino acid changes in regulatory proteins, genes with lineage-specific
patterns of differential expression were characterised by a high frequency of SNPs
associated with transcriptional start sites (TSS). A striking observation was that SNPs
generating a -10 consensus motif (TAnnnT) were frequently associated with the
emergence of a new TSS. SNP-created TAnnnT motifs could account for 19 of the 168
(11%) lineage-specific differentially expressed genes and antisense, and also for
exponential phase expression of the DosR regulon in the Beijing family. SNPs falling
outside of the -10 motif may also affect promoter activity. Creation of an “extended” -10
consensus (TGnTAnnnT) resulted in enhanced expression, and changes at the -1
position were associated with higher TSS activity.
In addition to their effect on expression of downstream genes, as in the case of
Rv3134c/DosR for example, TSS arising within coding regions may also play a role in
generating functionally active truncated proteins. Ppm1 (Rv2051c) is a bifunctional
enzyme, fusing an N-terminal apolipoprotein N-acyltransferase with a polyprenyl
phosphomannose synthase that are encoded by separate genes in other mycobacteria
(Gurcha et al., 2002). Combination of the two activities in a single polypeptide is likely
to assist in coordination of the final steps in post-translation of glycosylated lipoproteins:
the N-acyltransferase completes the tri-acyl lipid tail, and polyprenyl mannose provides
the sugar donor glycosylation. An internal TSS provides the option of separating the two
activities, freeing the polyprenyl phosphomannose synthase to participate in other
glycosylation pathways. The presence of a conserved internal TSS suggests that this

5.4 Discussion
164
option is retained by all members of the MTBC, with additional flexibility in Lineage 1
provided by a SNP that is associated with a new TSS and predicted impairment of N-
acyltransferase activity. It has been proposed that changes in the mannosylation of cell
surface components have an important impact on recognition of mycobacteria by
receptors on innate immune cells (Torrelles & Schlesinger, 2010), and redistribution of
mannose between lipoglycans and lipoproteins represents an attractive hypothesis to
account for the differential inflammatory response to Lineage 1 and Lineage 2 strains
(Portevin et al., 2011). Enhanced Lineage 1 transcription of mgtA (Rv0557, previously
also referred to as “PimB”) could also contribute to differences in macrophage
phenotype (Torrelles et al., 2009).
New TSS associated with SNP-generated TAnnnT motifs were also observed at a
similar frequency in antisense orientation. The biological significance of antisense
transcripts is unknown; it is possible that double-stranded RNA molecules differ from
single-stranded mRNAs in their efficiency of translation and susceptibility to
degradation. Identification of a Lineage 1 SNP associated with a new TSS in UmaA that
generates antisense to the adjacent pcaA raises the intriguing possibility of a mechanism
for co-ordinated regulation of the two genes. Both proteins are involved in modification
of mycolic acids and lineage-specific differential expression could again contribute to
variation in innate immune reactivity (Rao et al., 2006; Barkan et al., 2012).
More generally, this study has uncovered a potentially important mechanism of
generating transcriptional diversity through SNP-associated TSS. Mutation drives
evolution and adaptation on which selection acts, but mutation is not a completely
stochastic process, and several biases exist (Hershberg & Petrov, 2010). It has been
shown that mutation is AT-biased in clonal organisms including M. tuberculosis, and is
dominated by nucleotide transitions from C or G to T or A (Hershberg & Petrov, 2010).
This was also found to be the case in the Lineage-specific SNPs identified in Chapter 3
(Figure 5.23), with a mean of 64.5% of all SNPs resulting in a G to A or C to T
transition. Together this suggests the potential for many other SNP-associated TSS
within the MTBC, and should be focused on initially in subsequent transcriptome
studies, along with predicted functional mutations at the amino acid level described
earlier.

5.4 Discussion
165
Figure 5.23. Rates of the types of nucleotide mutations across A. nonsynonymous,
B. synonymous and C. intergenic regions. Lineage-specific SNPs result in G/C to A/T
transitions 56.7% for all nonsynonymous SNPs, 76.2% for all synonymous SNPs and
60.7% for all intergenic SNPs.
5.4.3.3 Landscaping of toxin antitoxins
For the remaining differentially expressed genes no direct genotypic link was identified,
and it is presumed that they reflect secondary adaptive responses. The most striking
feature was the over-representation of toxin-antitoxin (TA) gene pairs, contributing to
ten percent of the total set of differentially expressed genes. Differential expression of
TAs is also a feature of previous microarray studies comparing M. bovis with M.
tuberculosis (Golby et al., 2007), and “ancient” with “modern” strains (Homolka et al.,
2010). TA systems were originally identified by their role in plasmid maintenance, but
they are now recognised as a common feature of bacterial genomes (Pandey & Gerdes,
2005). With 62 TA pairs in the current Tuberculist database (Lew et al., 2011), M.
tuberculosis has more TAs than any other intracellular bacterium (Makarova et al.,
2009; Pandey & Gerdes, 2005). The toxin component is typically an endonuclease, with
activity directed towards ribosome-associated mRNAs, rRNAs and tmRNA, resulting in
G/C C/G G/T C/A A/T T/A A/C T/G G/A C/T A/G T/C0
5
10
15
20
25
Per
cent
age
of
inte
rgen
ic S
NP
s
G/C C/G G/T C/A A/T T/A A/C T/G G/A C/T A/G T/C0
10
20
30
40
Per
cent
age
of
syno
nym
ous
SN
Ps
G/C C/G G/T C/A A/T T/A A/C T/G G/A C/T A/G T/C0
5
10
15
20
25
Per
cent
age
of
nons
ynon
ymou
s S
NP
s
A.! B.!
C.!

5.4 Discussion
166
blockage of translation. An attractive hypothesis is that the role of TAs in M.
tuberculosis is to drive the bacteria into reversible growth arrest in unfavourable
environments, by responding to changes in antitoxin stability and proteolytic activities.
Based on this model, the differential expression of TA genes is interpreted as a read-out
of lineage differences in environmental sensing. Comparison of the overall TA
transcription response suggests that the core lineage pattern is overlaid by strain-specific
responses, and it can be envisaged that variability in the combined proteolytic and
transcriptional regulatory network could readily generate heterogeneity within clonal
populations.
6 Final discussion
167
Chapter 6 Final discussion
In this thesis, M. tuberculosis, the principal etiologic agent of tuberculosis in humans,
was investigated at the population level using genomic and transcriptomic approaches
made possible through use of new DNA sequencing technologies. Prior to this study, it
had been hypothesised that a high percentage of genetic diversity in the MTBC will be
functional due to a low frequency of purifying selection (Hershberg et al., 2008). The
MTBC is known to exist as six major lineages, and the overarching aim of this study
was to explore the nature of the genetic diversity at the lineage level and identify the
extent to which this has translated into functional diversity at the transcriptional level.
The results of these studies, their impact, and avenues for future work are discussed in
the following section.
The potential to further our understanding of MTBC diversity was underscored by the
defining study in 2010 by Comas et al. which provided the first representative genome-
wide phylogeny of global genetic diversity at the single nucleotide resolution (Comas et
al., 2010). Twenty-one isolates were selected from a global collection of strains, creating
a robust genomic framework on which to base future analyses. In Chapter 3, the clonal
population structure of the MTBC was exploited to reveal for the first time all lineage-
specific SNPs, which were captured using an expanded 28-genome phylogeny. This was
only possible due to the absence of horizontal gene transfer and recombination in the
MTBC, resulting in the situation whereby the MTBC evolves by decent. This property
was underscored by the extremely low level of homoplasic SNPs, with only 0.14% of all
lineage-specific SNPs present in more than one lineage. SNPs are the most abundant
form of genetic diversity in the MTBC and as such this variation is anticipated to
significantly contribute to the genetic background of the lineages. Accounting for
potential discovery bias in the set of genomes used, the 2,794 SNP set is robust and will
not be expected to change significantly in future studies. From a mechanistic point of

6 Final discussion
168
view, the SNPs identified in this study are directly applicable to SNP based typing
assays, as has been demonstrated recently (Stucki & Gagneux, 2012). Previously,
deletions identified in the M. tuberculosis genome have proved useful targets for typing
(Kong et al., 2006), but efforts are moving towards SNP typing as genome sequencing
costs decrease (Comas et al., 2009). In addition to typing newly isolated strains,
knowledge of the underlying background genetic variation is important for excluding
phylogentically informative SNPs from those associated with drug resistance,
demonstrated by the presence of lineage-specific SNPs identified in this study that were
also present in the database housing the largest collection of mutations causally linked to
drug resistance (Sandgren et al., 2009).
From an evolutionary perspective, the hypothesised reduced selective constraint in the
MTBC might be assumed to create a situation whereby nonsynonymous SNPs are
accumulating in genes with no discrimination to biological function (Hershberg et al.,
2008). The degree of purifying selection was first tested in the lineage-specific set using
the dN/dS measure and it was found that similar low levels of purifying selection was
present in all lineages. As a validation of these results, the dN/dS ratios were congruent
to those found in different MTBC SNP datasets that focused on either a restricted
number of genes (Hershberg et al., 2008) or more generally on all identified SNPs
(Comas et al., 2010). Due to the genome-wide nature of this study, it was possible to
focus down into gene functional categories to ask if there is no difference in purifying
selection, and so if all categories are experiencing the same random genetic drift. It was
found that this was not the case, with a gradient in the removal of nonsynonymous
SNPs; the information pathways category harboured the least number of SNPs, whilst a
significant accumulation of amino acid changing SNPs in the regulatory category was
observed. Interesting it has been previously found that genes involved in essential
functions have a greater level of purifying selection (Comas et al., 2010), which was
also observed in this study, and it was found that this is likely the influencing factor in
the observed result; the information category has the highest proportion of essential
genes whilst the regulatory has the lowest. It has been previously reported that genome
sequencing of strains from the Beijing group of Lineage 2 found an overrepresentation
of nonsynonymous SNPs in regulatory coding genes (Schürch et al., 2011). Together
this suggests that firstly, whilst low purifying selection is acting across all lineages and
gene categories, removal of potential deleterious SNPs is still detectable, and secondly,
the enrichment of nonsynonymous SNPs in genes with a regulatory function could result
in alterations in the response to environmental signals between the lineages.

6 Final discussion
169
Whilst the lineage-specific SNP set is an important pool of genetic diversity, the
identification of nearly three thousand SNPs is difficult to manage from a phenotypic
point of view. As part of a need to generate a focused SNP set for later phenotypic
analysis, and to further understand the genome-wide effect of the observed high
nonsynonymous SNP frequency in Chapter 3, a predictive computational approach was
undertaken in Chapter 4. Based on evolutionary information it was found that nearly half
of all nonsynonymous SNPs introduce an amino acid change at positions conserved in
all other mycobacteria, and therefore are likely to have a functional effect. This confirms
a previous expectation for a high number of functional SNPs based on a restricted
MLSA dataset (Hershberg et al., 2008), and strengthens the observation that this is a
phenomenon specific to the MTBC and not mycobacteria-wide; the same method
applied to the MTBC outlier, M. canetti, found half the level of predicted functional
SNPs. Together this suggests a significant potential for functional diversity in the
MTBC due to nonsynonymous SNPs. The MTBC is thought to have originated in
Africa, and the association with humans over a long time frame has likely resulted in
interactions between human genetic diversity and MTBC variation (Gagneux, 2012).
Interestingly, a similar phenomenon to that found in this study has also been observed in
humans, where recent demographic expansions have distorted basic principles of
population genetics and lead to the accumulation of low frequency genetic variants
associated with strong functional effects (Keinan & Clark, 2012; Tennessen et al.,
2012).
In light of the current slew of genome sequencing studies and corresponding explosion
in growth of databases including dbSNP and DGV (Iafrate et al., 2004; Sherry et al.,
1999), on the human genetics side, and Tuberculist, TBDB and PATRIC on the MTBC
side (Lew et al., 2011; Gillespie et al., 2011; Reddy et al., 2009), it can be envisaged
that the field is rapidly on course to cataloguing the majority of genetic variation. The
activity of this field is demonstrated by a simple pubmed search for “whole genome
sequencing” and “SNPs”, which identified 501 research article and review hits over the
course of this thesis (2009 to 2013). It is therefore reasonable to state that we now have a
good understanding of what the genetic differences are in the MTBC at the lineage level.
As a side note, the MTBC field is struggling to keep up with the growth in genome
sequencing projects in terms of database curation and access, and is in need of a new
online resource to house and integrate recently identified genetic variation (Stucki &
Gagneux, 2012). Keeping with the human genetics theme, it is estimated that 90% of

6 Final discussion
170
sequence variants in humans are SNPs (Collins et al., 1998), with each person thought to
be heterozygous for 24,000-40,000 nonsynonymous SNPs (Cargill et al., 1999), whilst
this study found an average pairwise difference of ~1000 nonsynonymous SNPs
between any one MTBC strain. However, there is a much less complete picture of what
these variants do. In response to this, the computational approaches used in this study in
Chapter 4 have been largely developed to facilitate human genetics research with a need
to filter potential deleterious SNPs from those that are neutral. Ultimately it is
anticipated that genomics will translate into real world clinical settings, informing
diagnostics and treatment in personalised medicine (Evans & Relling, 1999; Laing et al.,
2011). It was interesting to see in Chapter 5 that some of the functional genetic variation
was due to nucleotide level changes that were not nonsynonymous and therefore not the
focus of the computational tools. Nonsynonymous SNPs are classically thought of as
having a higher potential to affect function that synonymous SNPs, which are usually
regarded as neutral. Here the synonymous mutations are shown to give rise to novel
TSS; the SNP predicted to be involved in constitutive expression of DosR in Beijing
strains is synonymous. This stresses the importance of appreciating diversity outside of
the classical focus on nonsynonymous SNPs which are the focus of most computational
resources to predict SNPs (Mooney, 2005).
One of the most exciting aspects of this thesis has been to combine multidisciplinary
methods to strengthen and further understand MTBC diversity. Bioinformatic analyses
in Chapters 3 and 4 suggested that a high percentage of nonsynonymous SNPs identified
across the MTBC likely impair protein function. Chapter 5 explored the potential effects
of genetic variation within the total transcriptomes of clinical MTBC isolates. Prior to
this study, there were no examples of an integrated MTBC genome and transcriptome
analysis, and whilst one recent microarray based study used a rational approach to
selecting strains from different lineages, the underlying genotype was unknown
(Homolka et al., 2010). The aims of the chapter were firstly to survey the transcriptome
profiles of M. tuberculosis clinical isolates from Lineages 1 and 2 using a sequence
based approach, and secondly to understand the effects of the identified lineage-specific
variation. The importance of this study was therefore to establish direct links between
genetic differences observed amongst clinical isolates of the MTBC and phenotypic
consequences at the level of transcription. Transitioning from large-scale whole genome
sequencing of strains to transcriptome analysis using high throughput sequencing is one
of the next frontiers in the understanding of MTBC diversity, and it can be anticipated
that as throughput continues to increase, thanks to improvements in sequencing

6 Final discussion
171
technology, and costs decrease from economies of scale, transcriptome sequencing will
be feasible for many more clinical strains.
The work undertaken in this thesis is positioned at the interface of genomic and
transcriptional systems. Genomic diversity that is specific to each of the MTBC lineages
was identified and the effects of this variation screened in the next biological level -
transcription. Analysis was guided by predictions of potential functional mutations using
an in silico approach. One example of a predicted functional SNP within a regulatory
protein with a detectable phenotype at the transcriptional level was virS. The
hypothesised functional defect with virS in Lineage 1 strains correlates with another virS
SNP found in M. bovis strains and evidence of a similiar transcriptional phenotype
observed by a previous microarray study (Golby et al., 2007). Verification of the
predicted defective virS in Lineage 1 strains and M.bovis is under in investigation at
NIMR, with purified recombinant virS protein currently undergoing DNase footprinting
to ascertain the virS binding site in addition to in vitro transcription assays. A second
example under further investigation is the cause of constitutive DosR expression in the
Beijing sub-family of Lineage 2. It was hypothesised in this thesis that this is due to a
synonymous SNP within all Beijing strains that was seen in the RNA-seq data to
introduce a new transcriptional start site (TSS). Following verification that the SNP is
the cause of the new TSS and associated increased DosR transcription, it would then be
necessary to follow this into the level of translation through measurement of protein
abundance. In a wider context, the relevance of increased DosR to virulence in mouse
models and ultimately epidemiology in humans is not clear (Bartek et al., 2009; Boon &
Dick, 2012). The understanding of tuberculosis at all biological levels is currently an
active field of research, with large collaborations utilising a systems biology approach in
the United States (TB Systems Biology - Stanford University and the Broad Institute)
and Europe (SysteMTb). While these projects are largely based on the reference MTBC
strain H37Rv, it is anticipated that use of clinical stains, such as those used in this study,
will provide important biological insight into the impact of MTBC genetic variation. At
NIMR the approach used in this thesis is also being applied at the proteomic and
metabolomic levels.
In conclusion, this thesis has for the first time captured the genetic diversity that
separates the MTBC lineages, and demonstrates that such diversity generates
transcriptional diversity between the two MTBC lineages focused on in this study, and it
is highly likely that similar mechanisms occur in the other lineages. This underpins the

6 Final discussion
172
importance of the holistic scientific approach that was undertaken in thesis and is in
contrast to the gene centric focus of reductionism. This studies strength comes from the
power to analyse all SNPs across the genome, uncovering examples of functional SNPs
in a data-driven approach, and the potential pool of additional functional SNPs predicted
across all functional categories. To understand MTBC diversity, genomic data should
not be interpreted in isolation, but instead integrated with other biological systems, as
suggested for DosR above. An example of the importance of not treating mutations in
isolation is demonstrated by the phenomenon of epistasis, whereby the phenotypic effect
of one mutation differs depending on the presence of another mutation (Lehner, 2011).
A role for epistatis in M. tuberculosis has been recently reported for the evolution of
drug resistant strains (Borrell et al., 2013), but epistatis has been implicated in many
other biological processes, ranging from pathway organization, mutational load, and
genomic complexity (Breen et al., 2012). Therefore, the lineage-specific SNPs identified
in this thesis provide a framework on which further studies of the effects of MTBC
genomic diversity can be based; firstly as an approach to interrogating genome datasets,
secondly in demonstrating a mechanistic way of generating diversity, and finally as a
resource to the TB community.
Finally, whilst genetic diversity has been uncovered in this thesis, it remains to be shown
whether this has biological consequences during infection. Both lineages are highly
successful pathogens with proven ability to maintain transmission cycles over tens of
thousands of years, and it is likely that phenotypic diversity will reflect adaptation to
different circumstances rather than loss or gain of ability to cause disease. The
differences detected here suggest that strains from the two lineages may present
alternative ligand repertoires to host cells, and respond differently to environmental
changes generated by the host immune response. This in turn may confer varying
degrees of fitness in different epidemiological settings. Understanding the message layer
between a cell and its genome, through studies such as those undertaken in this thesis
will help connect genotype and phenotype, and are needed along with integration of
other biological systems to provide a full understanding of the nature and phenotypic
consequence of MTBC diversity in relation to human TB disease. Finally, it is
important to note that this thesis focused on the common underlying genetic differences
between the MTBC lineages, reflecting events occurring 40,000 to 60,000 years ago
(Hershberg et al., 2008). It has been hypothesised that the MTBC and humans have been
co-evolving and are thus shaped by this longstanding association (Gagneux, 2012), it is
therefore interesting to speculate that focusing on different evolutionary timescales, such

6 Final discussion
173
as the last two hundred years, might reveal selective pressures in the MTBC associated
with the great expansion in human population numbers over this period of time. As well
as providing an opportunity to discern the ongoing evolution of the MTBC population,
such timescales could highlight the response to pressures associated with HIV and drug-
resistance and ultimately help design better tools and effective control strategies for one
of the world’s oldest humans diseases.

REFERENCES
174
References
Achtman, M. (2008). Evolution, population structure, and phylogeography of
genetically monomorphic bacterial pathogens. Annu Rev Microbiol 62 53-70.
Albers, C. A., Lunter, G., MacArthur, D. G., McVean, G., Ouwehand, W. H. &
Durbin, R. (2011). Dindel: accurate indel calls from short-read data. Genome Res 21,
961-973.
Alexander, K. A., Laver, P. N., Michel, A. L., Williams, M., van Helden, P. D.,
Warren, R. M. & Gey van Pittius, N. C. (2010). Novel Mycobacterium tuberculosis
complex pathogen, M. mungi. Emerg Infect Dis 16, 1296-1299.
Anders, S. & Huber, W. (2010). Differential expression analysis for sequence count
data. Genome Biol 11, R106.
Arnvig, K. & Young, D. (2012). Non-coding RNA and its potential role in
Mycobacterium tuberculosis pathogenesis. RNA Biol 9.
Arnvig, K. B., Comas, I., Thomson, N. R., Houghton, J., Boshoff, H. I., Croucher,
N. J., Rose, G., Perkins, T. T., Parkhill, J., Dougan, G. & Young, D. B. (2011).
Sequence-based analysis uncovers an abundance of non-coding RNA in the total
transcriptome of Mycobacterium tuberculosis. PLoS Pathog 7, e1002342.
Atlas, R. M. & Snyder, J. W. (2006). Handbook of media for clinical microbiology:
CRC.

REFERENCES
175
Bagchi, G., Chauhan, S., Sharma, D. & Tyagi, J. S. (2005). Transcription and
autoregulation of the Rv3134c-devR-devS operon of Mycobacterium tuberculosis.
Microbiology 151, 4045-4053.
Baker, L., Brown, T., Maiden, M. C. & Drobniewski, F. (2004). Silent nucleotide
polymorphisms and a phylogeny for Mycobacterium tuberculosis. Emerging Infect Dis
10, 1568-1577.
Balbi, K. J. & Feil, E. J. (2007). The rise and fall of deleterious mutation. Res
Microbiol 158, 779-786.
Bao, L. & Cui, Y. (2005). Prediction of the phenotypic effects of non-synonymous
single nucleotide polymorphisms using structural and evolutionary information.
Bioinformatics 21, 2185-2190.
Barkan, D., Hedhli, D., Yan, H. G., Huygen, K. & Glickman, M. S. (2012).
Mycobacterium tuberculosis lacking all mycolic acid cyclopropanation is viable but
highly attenuated and hyperinflammatory in mice. Infect Immun 80, 1958-1968.
Barry, C. E., Boshoff, H. I., Dartois, V., Dick, T., Ehrt, S., Flynn, J., Schnappinger,
D., Wilkinson, R. J. & Young, D. B. (2009). The spectrum of latent tuberculosis:
rethinking the biology and intervention strategies. Nature reviews Microbiology 7, 845-
855.
Barry, C. E., 3rd (2001). Interpreting cell wall 'virulence factors' of Mycobacterium
tuberculosis. Trends Microbiol 9, 237-241.
Bartek, I. L., Rutherford, R., Gruppo, V., Morton, R. A., Morris, R. P., Klein, M.
R., Visconti, K. C., Ryan, G. J., Schoolnik, G. K., Lenaerts, A. & Voskuil, M. I.
(2009). The DosR regulon of M. tuberculosis and antibacterial tolerance. Tuberculosis
(Edinb) 89, 310-316.
Behr, M. A., Schroeder, B. G., Brinkman, J. N., Slayden, R. A. & Barry, C. E.
(2000). A point mutation in the mma3 gene is responsible for impaired methoxymycolic
acid production in Mycobacterium bovis BCG strains obtained after 1927. J Bacteriol
182, 3394-3399.

REFERENCES
176
Bellamy, R., Beyers, N., McAdam, K. P., Ruwende, C., Gie, R., Samaai, P., Bester,
D., Meyer, M., Corrah, T., Collin, M., Camidge, D. R., Wilkinson, D., Hoal-Van
Helden, E., Whittle, H. C., Amos, W., van Helden, P. & Hill, A. V. (2000). Genetic
susceptibility to tuberculosis in Africans: a genome-wide scan. Proc Natl Acad Sci U S
A 97, 8005-8009.
Benjamini, Y. & Hochberg, Y. (1995). Controlling the false discovery rate: a practical
and powerful approach to multiple testing. J R Stat Soc Series B Stat Methodol 57 289-
300.
Bennett-Lovsey, R. M., Herbert, A. D., Sternberg, M. J. & Kelley, L. A. (2008).
Exploring the extremes of sequence/structure space with ensemble fold recognition in
the program Phyre. Proteins 70, 611-625.
Bentley, D. R., Balasubramanian, S., Swerdlow, H. P., Smith, G. P., Milton, J.,
Brown, C. G., Hall, K. P., Evers, D. J., Barnes, C. L., Bignell, H. R., Boutell, J. M.,
Bryant, J., Carter, R. J., Keira Cheetham, R., Cox, A. J., Ellis, D. J., Flatbush, M.
R., Gormley, N. A., Humphray, S. J., Irving, L. J., Karbelashvili, M. S., Kirk, S.
M., Li, H., Liu, X., Maisinger, K. S., Murray, L. J., Obradovic, B., Ost, T.,
Parkinson, M. L., Pratt, M. R., Rasolonjatovo, I. M., Reed, M. T., Rigatti, R.,
Rodighiero, C., Ross, M. T., Sabot, A., Sankar, S. V., Scally, A., Schroth, G. P.,
Smith, M. E., Smith, V. P., Spiridou, A., Torrance, P. E., Tzonev, S. S., Vermaas, E.
H., Walter, K., Wu, X., Zhang, L., Alam, M. D., Anastasi, C., Aniebo, I. C., Bailey,
D. M., Bancarz, I. R., Banerjee, S., Barbour, S. G., Baybayan, P. A., Benoit, V. A.,
Benson, K. F., Bevis, C., Black, P. J., Boodhun, A., Brennan, J. S., Bridgham, J. A.,
Brown, R. C., Brown, A. A., Buermann, D. H., Bundu, A. A., Burrows, J. C.,
Carter, N. P., Castillo, N., Chiara, E. C. M., Chang, S., Neil Cooley, R., Crake, N.
R., Dada, O. O., Diakoumakos, K. D., Dominguez-Fernandez, B., Earnshaw, D. J.,
Egbujor, U. C., Elmore, D. W., Etchin, S. S., Ewan, M. R., Fedurco, M., Fraser, L.
J., Fuentes Fajardo, K. V., Scott Furey, W., George, D., Gietzen, K. J., Goddard, C.
P., Golda, G. S., Granieri, P. A., Green, D. E., Gustafson, D. L., Hansen, N. F.,
Harnish, K., Haudenschild, C. D., Heyer, N. I., Hims, M. M., Ho, J. T., Horgan, A.
M., Hoschler, K., Hurwitz, S., Ivanov, D. V., Johnson, M. Q., James, T., Huw
Jones, T. A., Kang, G. D., Kerelska, T. H., Kersey, A. D., Khrebtukova, I.,
Kindwall, A. P., Kingsbury, Z., Kokko-Gonzales, P. I., Kumar, A., Laurent, M. A.,
REFERENCES
177
Lawley, C. T., Lee, S. E., Lee, X., Liao, A. K., Loch, J. A., Lok, M., Luo, S.,
Mammen, R. M., Martin, J. W., McCauley, P. G., McNitt, P., Mehta, P., Moon, K.
W., Mullens, J. W., Newington, T., Ning, Z., Ling Ng, B., Novo, S. M., O'Neill, M.
J., Osborne, M. A., Osnowski, A., Ostadan, O., Paraschos, L. L., Pickering, L.,
Pike, A. C., Chris Pinkard, D., Pliskin, D. P., Podhasky, J., Quijano, V. J., Raczy,
C., Rae, V. H., Rawlings, S. R., Chiva Rodriguez, A., Roe, P. M., Rogers, J., Rogert
Bacigalupo, M. C., Romanov, N., Romieu, A., Roth, R. K., Rourke, N. J., Ruediger,
S. T., Rusman, E., Sanches-Kuiper, R. M., Schenker, M. R., Seoane, J. M., Shaw, R.
J., Shiver, M. K., Short, S. W., Sizto, N. L., Sluis, J. P., Smith, M. A., Ernest Sohna
Sohna, J., Spence, E. J., Stevens, K., Sutton, N., Szajkowski, L., Tregidgo, C. L.,
Turcatti, G., Vandevondele, S., Verhovsky, Y., Virk, S. M., Wakelin, S., Walcott, G.
C., Wang, J., Worsley, G. J., Yan, J., Yau, L., Zuerlein, M., Mullikin, J. C., Hurles,
M. E., McCooke, N. J., West, J. S., Oaks, F. L., Lundberg, P. L., Klenerman, D.,
Durbin, R. & Smith, A. J. (2008). Accurate whole human genome sequencing using
reversible terminator chemistry. Nature 456, 53-59.
Bentley, S. (2010). Taming the next-gen beast. Nature reviews Microbiology 8, 161.
Bentley, S. D., Comas, I., Bryant, J. M., Walker, D., Smith, N. H., Harris, S. R.,
Thurston, S., Gagneux, S., Wood, J., Antonio, M., Quail, M. A., Gehre, F.,
Adegbola, R. A., Parkhill, J. & de Jong, B. C. (2012). The genome of Mycobacterium
africanum West African 2 reveals a lineage-specific locus and genome erosion common
to the M. tuberculosis complex. PLoS neglected tropical diseases 6, e1552.
Bergval, I., Sengstake, S., Brankova, N., Levterova, V., Abadia, E., Tadumaze, N.,
Bablishvili, N., Akhalaia, M., Tuin, K., Schuitema, A., Panaiotov, S., Bachiyska, E.,
Kantardjiev, T., de Zwaan, R., Schurch, A., van Soolingen, D., van 't Hoog, A.,
Cobelens, F., Aspindzelashvili, R., Sola, C., Klatser, P. & Anthony, R. (2012).
Combined species identification, genotyping, and drug resistance detection of
Mycobacterium tuberculosis cultures by MLPA on a bead-based array. PLoS One 7,
e43240.
Boehme, C. C., Nicol, M. P., Nabeta, P., Michael, J. S., Gotuzzo, E., Tahirli, R.,
Gler, M. T., Blakemore, R., Worodria, W., Gray, C., Huang, L., Caceres, T.,
Mehdiyev, R., Raymond, L., Whitelaw, A., Sagadevan, K., Alexander, H., Albert,
H., Cobelens, F., Cox, H., Alland, D. & Perkins, M. D. (2011). Feasibility, diagnostic

REFERENCES
178
accuracy, and effectiveness of decentralised use of the Xpert MTB/RIF test for diagnosis
of tuberculosis and multidrug resistance: a multicentre implementation study. Lancet
377, 1495-1505.
Boelens, R. & Gualerzi, C. O. (2002). Structure and function of bacterial initiation
factors. Current Protein and Peptide Science 3, 107-119.
Boon, C. & Dick, T. (2012). How Mycobacterium tuberculosis goes to sleep: the
dormancy survival regulator DosR a decade later. Future Microbiol 7, 513-518.
Borrell, S. & Gagneux, S. (2009). Infectiousness, reproductive fitness and evolution of
drug-resistant Mycobacterium tuberculosis. Int J Tuberc Lung Dis 13, 1456-1466.
Borrell, S., Teo, Y., Giardina, F., Streicher, E. M., Klopper, M., Feldmann, J.,
Muller, B., Victor, T. C. & Gagneux, S. (2013). Epistasis between antibiotic resistance
mutations drives the evolution of extensively drug-resistant tuberculosis. EMPH, 65-74.
Branton, D., Deamer, D. W., Marziali, A., Bayley, H., Benner, S. A., Butler, T., Di
Ventra, M., Garaj, S., Hibbs, A., Huang, X., Jovanovich, S. B., Krstic, P. S.,
Lindsay, S., Ling, X. S., Mastrangelo, C. H., Meller, A., Oliver, J. S., Pershin, Y. V.,
Ramsey, J. M., Riehn, R., Soni, G. V., Tabard-Cossa, V., Wanunu, M., Wiggin, M.
& Schloss, J. A. (2008). The potential and challenges of nanopore sequencing. Nat
Biotechnol 26, 1146-1153.
Breen, M. S., Kemena, C., Vlasov, P. K., Notredame, C. & Kondrashov, F. A.
(2012). Epistasis as the primary factor in molecular evolution. Nature 490, 535-538.
Brosch, R., Gordon, S. V., Marmiesse, M., Brodin, P., Buchrieser, C., Eiglmeier,
K., Garnier, T., Gutierrez, C., Hewinson, G., Kremer, K., Parsons, L. M., Pym, A.
S., Samper, S., van Soolingen, D. & Cole, S. T. (2002). A new evolutionary scenario
for the Mycobacterium tuberculosis complex. Proc Natl Acad Sci U S A 99, 3684-3689.
Brudey, K., Driscoll, J. R., Rigouts, L., Prodinger, W. M., Gori, A., Al-Hajoj, S. A.,
Allix, C., Aristimuno, L., Arora, J., Baumanis, V., Binder, L., Cafrune, P., Cataldi,
A., Cheong, S., Diel, R., Ellermeier, C., Evans, J. T., Fauville-Dufaux, M.,
Ferdinand, S., Garcia de Viedma, D., Garzelli, C., Gazzola, L., Gomes, H. M.,

REFERENCES
179
Guttierez, M. C., Hawkey, P. M., van Helden, P. D., Kadival, G. V., Kreiswirth, B.
N., Kremer, K., Kubin, M., Kulkarni, S. P., Liens, B., Lillebaek, T., Ho, M. L.,
Martin, C., Mokrousov, I., Narvskaia, O., Ngeow, Y. F., Naumann, L., Niemann, S.,
Parwati, I., Rahim, Z., Rasolofo-Razanamparany, V., Rasolonavalona, T., Rossetti,
M. L., Rusch-Gerdes, S., Sajduda, A., Samper, S., Shemyakin, I. G., Singh, U. B.,
Somoskovi, A., Skuce, R. A., van Soolingen, D., Streicher, E. M., Suffys, P. N.,
Tortoli, E., Tracevska, T., Vincent, V., Victor, T. C., Warren, R. M., Yap, S. F.,
Zaman, K., Portaels, F., Rastogi, N. & Sola, C. (2006). Mycobacterium tuberculosis
complex genetic diversity: mining the fourth international spoligotyping database
(SpolDB4) for classification, population genetics and epidemiology. BMC Microbiol 6,
23.
Burley, S. K. (2013). PDB40: The Protein Data Bank celebrates its 40th birthday.
Biopolymers 99, 165-169.
Buts, L., Lah, J., Dao-Thi, M. H., Wyns, L. & Loris, R. (2005). Toxin-antitoxin
modules as bacterial metabolic stress managers. Trends Biochem Sci 30, 672-679.
Camarena, L., Bruno, V., Euskirchen, G., Poggio, S. & Snyder, M. (2010).
Molecular mechanisms of ethanol-induced pathogenesis revealed by RNA-sequencing.
PLoS Pathog 6, e1000834.
Cargill, M., Altshuler, D., Ireland, J., Sklar, P., Ardlie, K., Patil, N., Shaw, N.,
Lane, C. R., Lim, E. P., Kalyanaraman, N., Nemesh, J., Ziaugra, L., Friedland, L.,
Rolfe, A., Warrington, J., Lipshutz, R., Daley, G. Q. & Lander, E. S. (1999).
Characterization of single-nucleotide polymorphisms in coding regions of human genes.
Nat Genet 22, 231-238.
Carver, T., Berriman, M., Tivey, A., Patel, C., Böhme, U., Barrell, B. G., Parkhill,
J. & Rajandream, M. A. (2008). Artemis and ACT: viewing, annotating and
comparing sequences stored in a relational database. Bioinformatics (Oxford, England)
24, 2672-2676.
Casali, N., Nikolayevskyy, V., Balabanova, Y., Ignatyeva, O., Kontsevaya, I.,
Harris, S. R., Bentley, S. D., Parkhill, J., Nejentsev, S., Hoffner, S. E., Horstmann,

REFERENCES
180
R. D., Brown, T. & Drobniewski, F. (2012). Microevolution of extensively drug-
resistant tuberculosis in Russia. Genome Res 22, 735-745.
Caws, M., Thwaites, G., Stepniewska, K., Nguyen, T. N., Nguyen, T. H., Nguyen, T.
P., Mai, N. T., Phan, M. D., Tran, H. L., Tran, T. H., van Soolingen, D., Kremer,
K., Nguyen, V. V., Nguyen, T. C. & Farrar, J. (2006). Beijing genotype of
Mycobacterium tuberculosis is significantly associated with human immunodeficiency
virus infection and multidrug resistance in cases of tuberculous meningitis. J Clin
Microbiol 44, 3934-3939.
Caws, M., Thwaites, G., Dunstan, S., Hawn, T. R., Lan, N. T., Thuong, N. T.,
Stepniewska, K., Huyen, M. N., Bang, N. D., Loc, T. H., Gagneux, S., van
Soolingen, D., Kremer, K., van der Sande, M., Small, P., Anh, P. T., Chinh, N. T.,
Quy, H. T., Duyen, N. T., Tho, D. Q., Hieu, N. T., Torok, E., Hien, T. T., Dung, N.
H., Nhu, N. T., Duy, P. M., van Vinh Chau, N. & Farrar, J. (2008). The influence of
host and bacterial genotype on the development of disseminated disease with
Mycobacterium tuberculosis. PLoS Pathog 4, e1000034.
Chesne-Seck, M. L., Barilone, N., Boudou, F., Gonzalo Asensio, J., Kolattukudy, P.
E., Martin, C., Cole, S. T., Gicquel, B., Gopaul, D. N. & Jackson, M. (2008). A point
mutation in the two-component regulator PhoP-PhoR accounts for the absence of
polyketide-derived acyltrehaloses but not that of phthiocerol dimycocerosates in
Mycobacterium tuberculosis H37Ra. J Bacteriol 190, 1329-1334.
Cingolani, P., Platts, A., Wang le, L., Coon, M., Nguyen, T., Wang, L., Land, S. J.,
Lu, X. & Ruden, D. M. (2012). A program for annotating and predicting the effects of
single nucleotide polymorphisms, SnpEff: SNPs in the genome of Drosophila
melanogaster strain w1118; iso-2; iso-3. Fly (Austin) 6, 80-92.
Coar, T. (1982). The aphorisms of Hippocrates with a Translation into Latin, and
English. Birmingham: Gryphon Editions.
Cock, P. J., Fields, C. J., Goto, N., Heuer, M. L. & Rice, P. M. (2009). The Sanger
FASTQ file format for sequences with quality scores, and the Solexa/Illumina FASTQ
variants. Nucleic Acids Res 38, 1767-1771.

REFERENCES
181
Cohan, F. M. (2002). What are bacterial species? Annu Rev Microbiol 56 457-487.
Cole, S. T., Brosch, R., Parkhill, J., Garnier, T., Churcher, C., Harris, D., Gordon,
S. V., Eiglmeier, K., Gas, S., Barry, C. E., Tekaia, F., Badcock, K., Basham, D.,
Brown, D., Chillingworth, T., Connor, R., Davies, R., Devlin, K., Feltwell, T.,
Gentles, S., Hamlin, N., Holroyd, S., Hornsby, T., Jagels, K., Krogh, A., McLean,
J., Moule, S., Murphy, L., Oliver, K., Osborne, J., Quail, M. A., Rajandream, M.
A., Rogers, J., Rutter, S., Seeger, K., Skelton, J., Squares, R., Squares, S., Sulston,
J. E., Taylor, K., Whitehead, S. & Barrell, B. G. (1998). Deciphering the biology of
Mycobacterium tuberculosis from the complete genome sequence. Nature 393, 537-544.
Collins, F. S., Brooks, L. D. & Chakravarti, A. (1998). A DNA polymorphism
discovery resource for research on human genetic variation. Genome Res 8, 1229-1231.
Comas, I. & Gagneux, S. (2009). The past and future of tuberculosis research. PLoS
Pathog 5, e1000600.
Comas, I., Homolka, S., Niemann, S. & Gagneux, S. (2009). Genotyping of
genetically monomorphic bacteria: DNA sequencing in Mycobacterium tuberculosis
highlights the limitations of current methodologies. PLoS ONE 4, e7815.
Comas, I., Chakravartti, J., Small, P., Galagan, J., Niemann, S., Kremer, K., Ernst,
J. & Gagneux, S. (2010). Human T cell epitopes of Mycobacterium tuberculosis are
evolutionarily hyperconserved. Nat Genet 42, 498-503.
Comas, I., Borrell, S., Roetzer, A., Rose, G., Malla, B., Kato-Maeda, M., Galagan,
J., Niemann, S. & Gagneux, S. (2011). Whole-genome sequencing of rifampicin-
resistant Mycobacterium tuberculosis strains identifies compensatory mutations in RNA
polymerase genes. Nat Genet 44, 106-110.
Constant, P., Perez, E., Malaga, W., Laneelle, M. A., Saurel, O., Daffe, M. &
Guilhot, C. (2002). Role of the pks15/1 gene in the biosynthesis of phenolglycolipids in
the Mycobacterium tuberculosis complex. Evidence that all strains synthesize
glycosylated p-hydroxybenzoic methyl esters and that strains devoid of
phenolglycolipids harbor a frameshift mutation in the pks15/1 gene. J Biol Chem 277,
38148-38158.

REFERENCES
182
Coscolla, M. & Gagneux, S. (2010). Does M. tuberculosis genomic diversity explain
disease diversity? Drug Discov Today Dis Mech 7, e43-e59.
Cowley, D., Govender, D., February, B., Wolfe, M., Steyn, L., Evans, J., Wilkinson,
R. J. & Nicol, M. P. (2008). Recent and rapid emergence of W-Beijing strains of
Mycobacterium tuberculosis in Cape Town, South Africa. Clin Infect Dis 47, 1252-
1259.
Cox, M. P., Peterson, D. A. & Biggs, P. J. (2010). SolexaQA: At-a-glance quality
assessment of Illumina second-generation sequencing data. BMC Bioinformatics 11,
485.
Croucher, N. J., Fookes, M. C., Perkins, T. T., Turner, D. J., Marguerat, S. B.,
Keane, T., Quail, M. A., He, M., Assefa, S., Bahler, J., Kingsley, R. A., Parkhill, J.,
Bentley, S. D., Dougan, G. & Thomson, N. R. (2009). A simple method for directional
transcriptome sequencing using Illumina technology. Nucleic Acids Res 37, e148.
Croucher, N. J. & Thomson, N. R. (2010). Studying bacterial transcriptomes using
RNA-seq. Curr Opin Microbiol 13, 619-624.
Daniel, T. M. (1997). Captain of death: the story of tuberculosis. Rochester, NY:
University of Rochester Press.
de Jong, B. C., Hill, P. C., Aiken, A., Awine, T., Antonio, M., Adetifa, I. M.,
Jackson-Sillah, D. J., Fox, A., Deriemer, K., Gagneux, S., Borgdorff, M. W.,
McAdam, K. P., Corrah, T., Small, P. M. & Adegbola, R. A. (2008). Progression to
active tuberculosis, but not transmission, varies by Mycobacterium tuberculosis lineage
in The Gambia. J Infect Dis 198, 1037-1043.
de Jong, B. C., Antonio, M., Awine, T., Ogungbemi, K., de Jong, Y. P., Gagneux, S.,
DeRiemer, K., Zozio, T., Rastogi, N., Borgdorff, M., Hill, P. C. & Adegbola, R. A.
(2009). Use of spoligotyping and large sequence polymorphisms to study the population
structure of the Mycobacterium tuberculosis complex in a cohort study of consecutive
smear-positive tuberculosis cases in The Gambia. J Clin Microbiol 47, 994-1001.

REFERENCES
183
de Jong, B. C., Antonio, M. & Gagneux, S. (2010). Mycobacterium africanum--review
of an important cause of human tuberculosis in West Africa. PLoS Negl Trop Dis 4,
e744.
de la Rua-Domenech, R. (2006). Human Mycobacterium bovis infection in the United
Kingdom: Incidence, risks, control measures and review of the zoonotic aspects of
bovine tuberculosis. Tuberculosis (Edinb) 86, 77-109.
Dillies, M. A., Rau, A., Aubert, J., Hennequet-Antier, C., Jeanmougin, M., Servant,
N., Keime, C., Marot, G., Castel, D., Estelle, J., Guernec, G., Jagla, B., Jouneau, L.,
Laloe, D., Le Gall, C., Schaeffer, B., Le Crom, S., Guedj, M. & Jaffrezic, F. (2012).
A comprehensive evaluation of normalization methods for Illumina high-throughput
RNA sequencing data analysis. Brief Bioinform.
Domenech, P. & Reed, M. B. (2009). Rapid and spontaneous loss of phthiocerol
dimycocerosate (PDIM) from Mycobacterium tuberculosis grown in vitro: implications
for virulence studies. Microbiology 155, 3532-3543.
Domenech, P., Kolly, G. S., Leon-Solis, L., Fallow, A. & Reed, M. B. (2010).
Massive gene duplication event among clinical isolates of the Mycobacterium
tuberculosis W/Beijing family. J Bacteriol 192, 4562-4570.
Donoghue, H. D., Spigelman, M., Greenblatt, C. L., Lev-Maor, G., Bar-Gal, G. K.,
Matheson, C., Vernon, K., Nerlich, A. G. & Zink, A. R. (2004). Tuberculosis: from
prehistory to Robert Koch, as revealed by ancient DNA. Lancet Infect Dis 4, 584-592.
Ellis, R. C. & Zabrowarny, L. A. (1993). Safer staining method for acid fast bacilli. J
Clin Pathol 46, 559-560.
Evans, J. T., Smith, E. G., Banerjee, A., Smith, R. M., Dale, J., Innes, J. A., Hunt,
D., Tweddell, A., Wood, A., Anderson, C., Hewinson, R. G., Smith, N. H., Hawkey,
P. M. & Sonnenberg, P. (2007). Cluster of human tuberculosis caused by
Mycobacterium bovis: evidence for person-to-person transmission in the UK. Lancet
369, 1270-1276.

REFERENCES
184
Evans, W. E. & Relling, M. V. (1999). Pharmacogenomics: translating functional
genomics into rational therapeutics. Science 286, 487-491.
Filiatrault, M. J., Stodghill, P. V., Myers, C. R., Bronstein, P. A., Butcher, B. G.,
Lam, H., Grills, G., Schweitzer, P., Wang, W., Schneider, D. J. & Cartinhour, S. W.
(2011). Genome-wide identification of transcriptional start sites in the plant pathogen
Pseudomonas syringae pv. tomato str. DC3000. PLoS One 6, e29335.
Filliol, I., Driscoll, J. R., van Soolingen, D., Kreiswirth, B. N., Kremer, K.,
Valetudie, G., Dang, D. A., Barlow, R., Banerjee, D., Bifani, P. J., Brudey, K.,
Cataldi, A., Cooksey, R. C., Cousins, D. V., Dale, J. W., Dellagostin, O. A.,
Drobniewski, F., Engelmann, G., Ferdinand, S., Gascoyne-Binzi, D., Gordon, M.,
Gutierrez, M. C., Haas, W. H., Heersma, H., Kassa-Kelembho, E., Ho, M. L.,
Makristathis, A., Mammina, C., Martin, G., Mostrom, P., Mokrousov, I.,
Narbonne, V., Narvskaya, O., Nastasi, A., Niobe-Eyangoh, S. N., Pape, J. W.,
Rasolofo-Razanamparany, V., Ridell, M., Rossetti, M. L., Stauffer, F., Suffys, P. N.,
Takiff, H., Texier-Maugein, J., Vincent, V., de Waard, J. H., Sola, C. & Rastogi, N.
(2003). Snapshot of moving and expanding clones of Mycobacterium tuberculosis and
their global distribution assessed by spoligotyping in an international study. J Clin
Microbiol 41, 1963-1970.
Firdessa, R., Berg, S., Hailu, E., Schelling, E., Gumi, B., Erenso, G., Gadisa, E.,
Kiros, T., Habtamu, M., Hussein, J., Zinsstag, J., Robertson, B. D., Ameni, G.,
Lohan, A., Loftus, B., Comas, I., Gagneux, S., Tschopp, R., Yamuah, L., Hewinson,
G., Gordon, S. V., Young, D. B. & Aseffa, A. (2013). Mycobacterial lineages causing
pulmonary and extrapulmonary tuberculosis, Ethiopia. Emerg Infect Dis 19 460-463.
Fisher, M. A., Plikaytis, B. B. & Shinnick, T. M. (2002). Microarray analysis of the
Mycobacterium tuberculosis transcriptional response to the acidic conditions found in
phagosomes. J Bacteriol 184, 4025-4032.
Fleischmann, R. D., Alland, D., Eisen, J. A., Carpenter, L., White, O., Peterson, J.,
DeBoy, R., Dodson, R., Gwinn, M., Haft, D., Hickey, E., Kolonay, J. F., Nelson, W.
C., Umayam, L. A., Ermolaeva, M., Salzberg, S. L., Delcher, A., Utterback, T.,
Weidman, J., Khouri, H., Gill, J., Mikula, A., Bishai, W., Jacobs Jr, W. R., Jr.,

REFERENCES
185
Venter, J. C. & Fraser, C. M. (2002). Whole-genome comparison of Mycobacterium
tuberculosis clinical and laboratory strains. J Bacteriol 184, 5479-5490.
Forrellad, M. A., Klepp, L. I., Gioffre, A., Sabio, Y. G. J., Morbidoni, H. R.,
Santangelo, M. D., Cataldi, A. A. & Bigi, F. (2012). Virulence factors of the
Mycobacterium tuberculosis complex. Virulence 4.
Fozo, E. M., Hemm, M. R. & Storz, G. (2008). Small toxic proteins and the antisense
RNAs that repress them. Microbiol Mol Biol Rev 72, 579-589, Table of Contents.
Gagneux, S., DeRiemer, K., Van, T., Kato-Maeda, M., de Jong, B. C., Narayanan,
S., Nicol, M., Niemann, S., Kremer, K., Gutierrez, M. C., Hilty, M., Hopewell, P. C.
& Small, P. M. (2006a). Variable host-pathogen compatibility in Mycobacterium
tuberculosis. Proc Natl Acad Sci U S A 103, 2869-2873.
Gagneux, S., Long, C. D., Small, P. M., Van, T., Schoolnik, G. K. & Bohannan, B.
J. M. (2006b). The competitive cost of antibiotic resistance in Mycobacterium
tuberculosis. Science 312, 1944-1946.
Gagneux, S. & Small, P. M. (2007). Global phylogeography of Mycobacterium
tuberculosis and implications for tuberculosis product development. Lancet Infect Dis 7,
328-337.
Gagneux, S. (2012). Host-pathogen coevolution in human tuberculosis. Philos Trans R
Soc Lond B Biol Sci 367, 850-859.
Gao, Q., Kripke, K. E., Saldanha, A. J., Yan, W., Holmes, S. & Small, P. M. (2005).
Gene expression diversity among Mycobacterium tuberculosis clinical isolates.
Microbiology (Reading, England) 151, 5-14.
Garnier, T., Eiglmeier, K., Camus, J. C., Medina, N., Mansoor, H., Pryor, M.,
Duthoy, S., Grondin, S., Lacroix, C., Monsempe, C., Simon, S., Harris, B., Atkin,
R., Doggett, J., Mayes, R., Keating, L., Wheeler, P. R., Parkhill, J., Barrell, B. G.,
Cole, S. T., Gordon, S. V. & Hewinson, R. G. (2003). The complete genome sequence
of Mycobacterium bovis. Proc Natl Acad Sci U S A 100, 7877-7882.
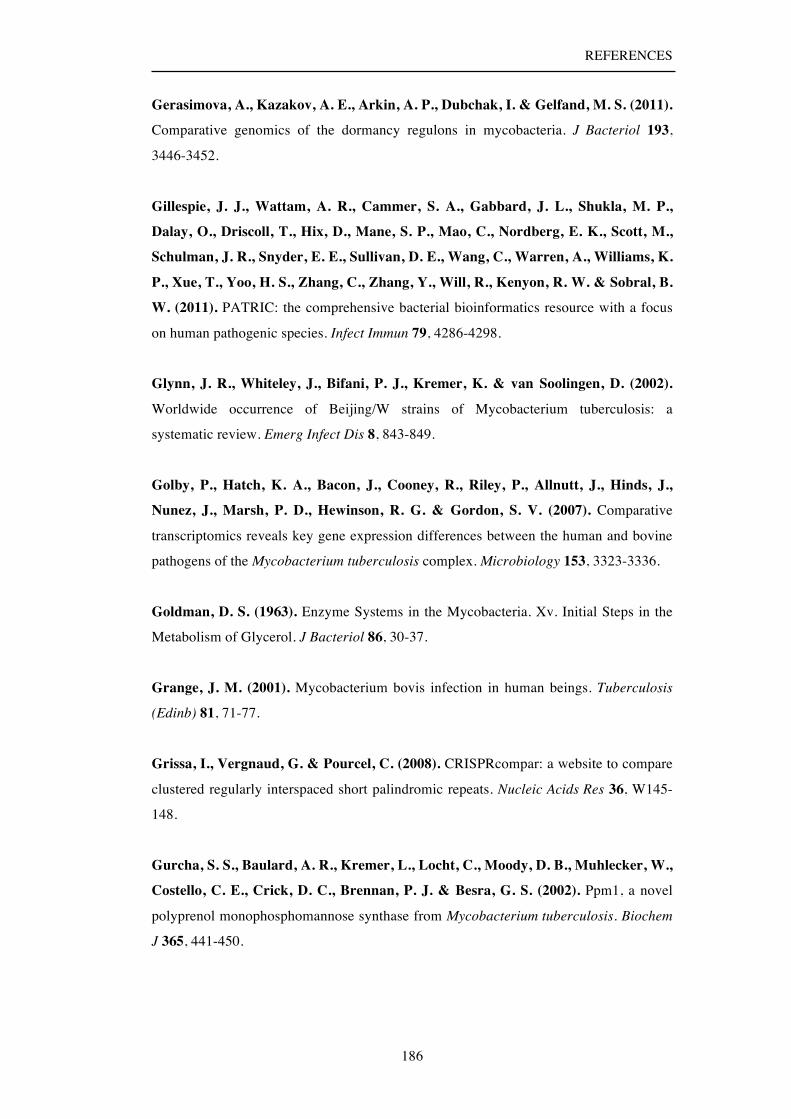
REFERENCES
186
Gerasimova, A., Kazakov, A. E., Arkin, A. P., Dubchak, I. & Gelfand, M. S. (2011).
Comparative genomics of the dormancy regulons in mycobacteria. J Bacteriol 193,
3446-3452.
Gillespie, J. J., Wattam, A. R., Cammer, S. A., Gabbard, J. L., Shukla, M. P.,
Dalay, O., Driscoll, T., Hix, D., Mane, S. P., Mao, C., Nordberg, E. K., Scott, M.,
Schulman, J. R., Snyder, E. E., Sullivan, D. E., Wang, C., Warren, A., Williams, K.
P., Xue, T., Yoo, H. S., Zhang, C., Zhang, Y., Will, R., Kenyon, R. W. & Sobral, B.
W. (2011). PATRIC: the comprehensive bacterial bioinformatics resource with a focus
on human pathogenic species. Infect Immun 79, 4286-4298.
Glynn, J. R., Whiteley, J., Bifani, P. J., Kremer, K. & van Soolingen, D. (2002).
Worldwide occurrence of Beijing/W strains of Mycobacterium tuberculosis: a
systematic review. Emerg Infect Dis 8, 843-849.
Golby, P., Hatch, K. A., Bacon, J., Cooney, R., Riley, P., Allnutt, J., Hinds, J.,
Nunez, J., Marsh, P. D., Hewinson, R. G. & Gordon, S. V. (2007). Comparative
transcriptomics reveals key gene expression differences between the human and bovine
pathogens of the Mycobacterium tuberculosis complex. Microbiology 153, 3323-3336.
Goldman, D. S. (1963). Enzyme Systems in the Mycobacteria. Xv. Initial Steps in the
Metabolism of Glycerol. J Bacteriol 86, 30-37.
Grange, J. M. (2001). Mycobacterium bovis infection in human beings. Tuberculosis
(Edinb) 81, 71-77.
Grissa, I., Vergnaud, G. & Pourcel, C. (2008). CRISPRcompar: a website to compare
clustered regularly interspaced short palindromic repeats. Nucleic Acids Res 36, W145-
148.
Gurcha, S. S., Baulard, A. R., Kremer, L., Locht, C., Moody, D. B., Muhlecker, W.,
Costello, C. E., Crick, D. C., Brennan, P. J. & Besra, G. S. (2002). Ppm1, a novel
polyprenol monophosphomannose synthase from Mycobacterium tuberculosis. Biochem
J 365, 441-450.

REFERENCES
187
Gustafsson, C., Govindarajan, S. & Minshull, J. (2004). Codon bias and heterologous
protein expression. Trends Biotechnol 22, 346-353.
Gutierrez, M. C., Brisse, S., Brosch, R., Fabre, M., Omaïs, B., Marmiesse, M.,
Supply, P. & Vincent, V. (2005). Ancient origin and gene mosaicism of the progenitor
of Mycobacterium tuberculosis. PLoS Path 1, e5.
Hardcastle, T. J. & Kelly, K. A. (2010). baySeq: empirical Bayesian methods for
identifying differential expression in sequence count data. BMC Bioinformatics 11, 422.
Harris, S. R., Feil, E. J., Holden, M. T., Quail, M. A., Nickerson, E. K., Chantratita,
N., Gardete, S., Tavares, A., Day, N., Lindsay, J. A., Edgeworth, J. D., de
Lencastre, H., Parkhill, J., Peacock, S. J. & Bentley, S. D. (2010). Evolution of
MRSA during hospital transmission and intercontinental spread. Science (New York, NY)
327, 469-474.
Hawley, D. K. & McClure, W. R. (1983). Compilation and analysis of Escherichia coli
promoter DNA sequences. Nucleic Acids Res 11, 2237-2255.
He, M., Sebaihia, M., Lawley, T. D., Stabler, R. A., Dawson, L. F., Martin, M. J.,
Holt, K. E., Seth-Smith, H. M., Quail, M. A., Rance, R., Brooks, K., Churcher, C.,
Harris, D., Bentley, S. D., Burrows, C., Clark, L., Corton, C., Murray, V., Rose, G.,
Thurston, S., van Tonder, A., Walker, D., Wren, B. W., Dougan, G. & Parkhill, J.
(2010). Evolutionary dynamics of Clostridium difficile over short and long time scales.
Proceedings of the National Academy of Sciences of the United States of America.
Hendrix, R. W., Smith, M. C., Burns, R. N., Ford, M. E. & Hatfull, G. F. (1999).
Evolutionary relationships among diverse bacteriophages and prophages: all the world's
a phage. Proceedings of the National Academy of Sciences of the United States of
America 96, 2192-2197.
Heng, L. (2008).MAQ: Mapping and Assembly with Qualities.
Hershberg, R., Lipatov, M., Small, P. M., Sheffer, H., Niemann, S., Homolka, S.,
Roach, J. C., Kremer, K., Petrov, D. A., Feldman, M. W. & Gagneux, S. (2008).

REFERENCES
188
High functional diversity in Mycobacterium tuberculosis driven by genetic drift and
human demography. PLoS Biol 6, e311.
Hershberg, R. & Petrov, D. A. (2010). Evidence that mutation is universally biased
towards AT in bacteria. PLoS Genet 6.
Heym, B., Alzari, P. M., Honore, N. & Cole, S. T. (1995). Missense mutations in the
catalase-peroxidase gene, katG, are associated with isoniazid resistance in
Mycobacterium tuberculosis. Mol Microbiol 15, 235-245.
Hillemann, D., Rusch-Gerdes, S. & Richter, E. (2007). Evaluation of the GenoType
MTBDRplus assay for rifampin and isoniazid susceptibility testing of Mycobacterium
tuberculosis strains and clinical specimens. J Clin Microbiol 45, 2635-2640.
Hirsh, A. E., Tsolaki, A. G., DeRiemer, K., Feldman, M. W. & Small, P. M. (2004).
Stable association between strains of Mycobacterium tuberculosis and their human host
populations. Proc Natl Acad Sci U S A 101, 4871-4876.
Ho, D. D., Neumann, A. U., Perelson, A. S., Chen, W., Leonard, J. M. &
Markowitz, M. (1995). Rapid turnover of plasma virions and CD4 lymphocytes in
HIV-1 infection. Nature 373, 123-126.
Holt, K. E., Parkhill, J., Mazzoni, C. J., Roumagnac, P., Weill, F. X., Goodhead, I.,
Rance, R., Baker, S., Maskell, D. J., Wain, J., Dolecek, C., Achtman, M. & Dougan,
G. (2008). High-throughput sequencing provides insights into genome variation and
evolution in Salmonella Typhi. Nat Genet 40, 987-993.
Homolka, S., Köser, C., Archer, J., Rüsch-Gerdes, S. & Niemann, S. (2009). Single-
nucleotide polymorphisms in Rv2629 are specific for Mycobacterium tuberculosis
genotypes Beijing and Ghana but not associated with rifampin resistance. J Clin
Microbiol 47, 223-226.
Homolka, S., Niemann, S., Russell, D. G. & Rohde, K. H. (2010). Functional genetic
diversity among Mycobacterium tuberculosis complex clinical isolates: delineation of
conserved core and lineage-specific transcriptomes during intracellular survival. PLoS
Path 6, e1000988.

REFERENCES
189
Iafrate, A. J., Feuk, L., Rivera, M. N., Listewnik, M. L., Donahoe, P. K., Qi, Y.,
Scherer, S. W. & Lee, C. (2004). Detection of large-scale variation in the human
genome. Nat Genet 36, 949-951.
Ioerger, T. R., Feng, Y., Ganesula, K., Chen, X., Dobos, K. M., Fortune, S., Jacobs,
W. R., Mizrahi, V., Parish, T., Rubin, E., Sassetti, C. & Sacchettini, J. C. (2010).
Variation among genome sequences of H37Rv strains of Mycobacterium tuberculosis
from multiple laboratories. J Bacteriol 192, 3645-3653.
Jones, T. F., Craig, A. S., Valway, S. E., Woodley, C. L. & Schaffner, W. (1999).
Transmission of tuberculosis in a jail. Ann Intern Med 131, 557-563.
Jordan, I. K., Rogozin, I. B., Wolf, Y. I. & Koonin, E. V. (2002). Essential genes are
more evolutionarily conserved than are nonessential genes in bacteria. Genome Res 12,
962-968.
Kahla, I. B., Henry, M., Boukadida, J. & Drancourt, M. (2011). Pyrosequencing
assay for rapid identification of Mycobacterium tuberculosis complex species. BMC Res
Notes 4, 423.
Kane, M. D., Jatkoe, T. A., Stumpf, C. R., Lu, J., Thomas, J. D. & Madore, S. J.
(2000). Assessment of the sensitivity and specificity of oligonucleotide (50mer)
microarrays. Nucleic Acids Res 28, 4552-4557.
Kaplan, G., Post, F. A., Moreira, A. L., Wainwright, H., Kreiswirth, B. N.,
Tanverdi, M., Mathema, B., Ramaswamy, S. V., Walther, G., Steyn, L. M., Barry,
C. E., 3rd & Bekker, L. G. (2003). Mycobacterium tuberculosis growth at the cavity
surface: a microenvironment with failed immunity. Infect Immun 71, 7099-7108.
Kawano, M., Aravind, L. & Storz, G. (2007). An antisense RNA controls synthesis of
an SOS-induced toxin evolved from an antitoxin. Mol Microbiol 64, 738-754.
Keating, L. A., Wheeler, P. R., Mansoor, H., Inwald, J. K., Dale, J., Hewinson, R.
G. & Gordon, S. V. (2005). The pyruvate requirement of some members of the
REFERENCES
190
Mycobacterium tuberculosis complex is due to an inactive pyruvate kinase: implications
for in vivo growth. Mol Microbiol 56, 163-174.
Keinan, A. & Clark, A. G. (2012). Recent explosive human population growth has
resulted in an excess of rare genetic variants. Science 336, 740-743.
Kelley, L. A. & Sternberg, M. J. (2009). Protein structure prediction on the Web: a
case study using the Phyre server. Nat Protoc 4, 363-371.
Kibota, T. T. & Lynch, M. (1996). Estimate of the genomic mutation rate deleterious
to overall fitness in E. coli. Nature 381, 694-696.
Kimchi-Sarfaty, C., Oh, J. M., Kim, I. W., Sauna, Z. E., Calcagno, A. M.,
Ambudkar, S. V. & Gottesman, M. M. (2007). A "silent" polymorphism in the MDR1
gene changes substrate specificity. Science 315, 525-528.
Kimura, M. (1977). Preponderance of synonymous changes as evidence for the neutral
theory of molecular evolution. Nature 267, 275-276.
Komar, A. A. (2007). Silent SNPs: impact on gene function and phenotype.
Pharmacogenomics 8, 1075-1080.
Kong, Y., Cave, M. D., Yang, D., Zhang, L., Marrs, C. F., Foxman, B., Bates, J. H.,
Wilson, F., Mukasa, L. N. & Yang, Z. H. (2005). Distribution of insertion- and
deletion-associated genetic polymorphisms among four Mycobacterium tuberculosis
phospholipase C genes and associations with extrathoracic tuberculosis: a population-
based study. J Clin Microbiol 43, 6048-6053.
Kong, Y., Cave, M. D., Zhang, L., Foxman, B., Marrs, C. F., Bates, J. H. & Yang,
Z. H. (2006). Population-based study of deletions in five different genomic regions of
Mycobacterium tuberculosis and possible clinical relevance of the deletions. J Clin
Microbiol 44, 3940-3946.
Kong, Y., Cave, M. D., Zhang, L., Foxman, B., Marrs, C. F., Bates, J. H. & Yang,
Z. H. (2007). Association between Mycobacterium tuberculosis Beijing/W lineage strain
infection and extrathoracic tuberculosis: Insights from epidemiologic and clinical
REFERENCES
191
characterization of the three principal genetic groups of M. tuberculosis clinical isolates.
J Clin Microbiol 45, 409-414.
Korber, B. (2000). HIV Signature and Sequence Variation Analysis. In Computational
Analysis of HIV Molecular Sequences, pp. 55-72. Edited by A. G. Rodrigo & G. H.
Learn: Kluwer Academic Publishers, Dordrecht, Netherlands.
Koser, C. U., Summers, D. K. & Archer, J. A. (2011). Thr270Ile in embC (Rv3793) is
not a marker for ethambutol resistance in the Mycobacterium tuberculosis complex.
Antimicrob Agents Chemother 55, 1825.
Kryazhimskiy, S. & Plotkin, J. B. (2008). The population genetics of dN/dS. PLoS
Genet 4, e1000304.
Kumar, A., Toledo, J. C., Patel, R. P., Lancaster, J. R., Jr. & Steyn, A. J. (2007).
Mycobacterium tuberculosis DosS is a redox sensor and DosT is a hypoxia sensor. Proc
Natl Acad Sci U S A 104, 11568-11573.
Laing, R. E., Hess, P., Shen, Y., Wang, J. & Hu, S. X. (2011). The role and impact of
SNPs in pharmacogenomics and personalized medicine. Curr Drug Metab 12, 460-486.
Lasa, I., Toledo-Arana, A., Dobin, A., Villanueva, M., de los Mozos, I. R., Vergara-
Irigaray, M., Segura, V., Fagegaltier, D., Penades, J. R., Valle, J., Solano, C. &
Gingeras, T. R. (2011). Genome-wide antisense transcription drives mRNA processing
in bacteria. Proc Natl Acad Sci U S A 108, 20172-20177.
Lehner, B. (2011). Molecular mechanisms of epistasis within and between genes.
Trends Genet 27, 323-331.
Lew, J. M., Kapopoulou, A., Jones, L. M. & Cole, S. T. (2011). TubercuList--10 years
after. Tuberculosis (Edinb) 91, 1-7.
Li, H., Ruan, J. & Durbin, R. (2008). Mapping short DNA sequencing reads and
calling variants using mapping quality scores. Genome Res 18, 1851-1858.

REFERENCES
192
Li, H. & Durbin, R. (2009). Fast and accurate short read alignment with Burrows-
Wheeler transform. Bioinformatics 25, 1754-1760.
Li, H., Handsaker, B., Wysoker, A., Fennell, T., Ruan, J., Homer, N., Marth, G.,
Abecasis, G. & Durbin, R. (2009). The Sequence Alignment/Map format and
SAMtools. Bioinformatics 25, 2078-2079.
Lindstedt, B. A. (2005). Multiple-locus variable number tandem repeats analysis for
genetic fingerprinting of pathogenic bacteria. Electrophoresis 26, 2567-2582.
Liu, X., Gutacker, M. M., Musser, J. M. & Fu, Y. X. (2006). Evidence for
recombination in Mycobacterium tuberculosis. J Bacteriol 188, 8169-8177.
Liveris, D., Schwartz, J. J., Geertman, R. & Schwartz, I. (1993). Molecular cloning
and sequencing of infC, the gene encoding translation initiation factor IF3, from four
enterobacterial species. FEMS Microbiol Lett 112, 211-216.
Loman, N., Constantinidou, C., Chan, J. Z., Halachev, M., Sergeant, M., Penn, C.,
Robinson, E. & Pallen, M. (2012). High-throughput bacterial genome sequencing: an
embarrassment of choice, a world of opportunity. Nature reviews Microbiology.
Madigan, M. T., Martinko, J. M. & Parker, J. (2003). Brock Biology of
Microorganisms10th ed. Pearson Education.
Makarova, K. S., Wolf, Y. I. & Koonin, E. V. (2009). Comprehensive comparative-
genomic analysis of type 2 toxin-antitoxin systems and related mobile stress response
systems in prokaryotes. Biol Direct 4, 19.
Malen, H., Berven, F. S., Fladmark, K. E. & Wiker, H. G. (2007). Comprehensive
analysis of exported proteins from Mycobacterium tuberculosis H37Rv. Proteomics 7,
1702-1718.
Malys, N. & McCarthy, J. E. (2011). Translation initiation: variations in the
mechanism can be anticipated. Cell Mol Life Sci 68, 991-1003.

REFERENCES
193
Manca, C., Tsenova, L., Barry, C. E., 3rd, Bergtold, A., Freeman, S., Haslett, P. A.,
Musser, J. M., Freedman, V. H. & Kaplan, G. (1999). Mycobacterium tuberculosis
CDC1551 induces a more vigorous host response in vivo and in vitro, but is not more
virulent than other clinical isolates. J Immunol 162, 6740-6746.
Manca, C., Tsenova, L., Bergtold, A., Freeman, S., Tovey, M., Musser, J. M.,
Barry, C. E., 3rd, Freedman, V. H. & Kaplan, G. (2001). Virulence of a
Mycobacterium tuberculosis clinical isolate in mice is determined by failure to induce
Th1 type immunity and is associated with induction of IFN-alpha /beta. Proc Natl Acad
Sci U S A 98, 5752-5757.
Manca, C., Tsenova, L., Freeman, S., Barczak, A. K., Tovey, M., Murray, P. J.,
Barry, C. & Kaplan, G. (2005). Hypervirulent M. tuberculosis W/Beijing strains
upregulate type I IFNs and increase expression of negative regulators of the Jak-Stat
pathway. J Interferon Cytokine Res 25, 694-701.
Mao, C., Shukla, M., Larrouy-Maumus, G., Dix, F. L., Kelley, L. A., Sternberg, M.
J., Sobral, B. W. & de Carvalho, L. P. (2012). Functional assignment of
Mycobacterium tuberculosis proteome revealed by genome-scale fold-recognition.
Tuberculosis (Edinb).
Marguerat, S. & Bähler, J. (2010). RNA-seq: from technology to biology. Cell Mol
Life Sci.
McEvoy, C. R., Cloete, R., Muller, B., Schurch, A. C., van Helden, P. D., Gagneux,
S., Warren, R. M. & Gey van Pittius, N. C. (2012). Comparative analysis of
Mycobacterium tuberculosis pe and ppe genes reveals high sequence variation and an
apparent absence of selective constraints. PLoS One 7, e30593.
McNerney, R., Maeurer, M., Abubakar, I., Marais, B., McHugh, T. D., Ford, N.,
Weyer, K., Lawn, S., Grobusch, M. P., Memish, Z., Squire, S. B., Pantaleo, G.,
Chakaya, J., Casenghi, M., Migliori, G. B., Mwaba, P., Zijenah, L., Hoelscher, M.,
Cox, H., Swaminathan, S., Kim, P. S., Schito, M., Harari, A., Bates, M., Schwank,
S., O'Grady, J., Pletschette, M., Ditui, L., Atun, R. & Zumla, A. (2012).
Tuberculosis diagnostics and biomarkers: needs, challenges, recent advances, and
opportunities. J Infect Dis 205 Suppl 2, S147-158.

REFERENCES
194
Meyer, M. & Kircher, M. (2010). Illumina sequencing library preparation for highly
multiplexed target capture and sequencing. Cold Spring Harb Protoc 2010, pdb
prot5448.
Micklinghoff, J. C., Breitinger, K. J., Schmidt, M., Geffers, R., Eikmanns, B. J. &
Bange, F. C. (2009). Role of the transcriptional regulator RamB (Rv0465c) in the
control of the glyoxylate cycle in Mycobacterium tuberculosis. J Bacteriol 191, 7260-
7269.
Miller, M. P. & Kumar, S. (2001). Understanding human disease mutations through
the use of interspecific genetic variation. Hum Mol Genet 10, 2319-2328.
Minnikin, D. E., Minnikin, S. M., Dobson, G., Goodfellow, M., Portaels, F., van den
Breen, L. & Sesardic, D. (1983). Mycolic acid patterns of four vaccine strains of
Mycobacterium bovis BCG. J Gen Microbiol 129, 889-891.
Mitchison, D. A., Wallace, J. G., Bhatia, A. L., Selkon, J. B., Subbaiah, T. V. &
Lancaster, M. C. (1960). A comparison of the virulence in guinea-pigs of South Indian
and British tubercle bacilli. Tubercle 41, 1-22.
Mitchison, D. A., Selkon, J. B. & Lloyd, J. (1963). Virulence in the Guinea-Pig,
Susceptibility to Hydrogen Peroxide, and Catalase Activity of Isoniazid-Sensitive
Tubercle Bacilli from South Indian and British Patients. J Pathol Bacteriol 86, 377-386.
Mooney, S. (2005). Bioinformatics approaches and resources for single nucleotide
polymorphism functional analysis. Brief Bioinformatics 6, 44-56.
Mortazavi, A., Williams, B. A., McCue, K., Schaeffer, L. & Wold, B. (2008).
Mapping and quantifying mammalian transcriptomes by RNA-Seq. Nat Methods 5, 621-
628.
Movahedzadeh, F., Smith, D. A., Norman, R. A., Dinadayala, P., Murray-Rust, J.,
Russell, D. G., Kendall, S. L., Rison, S. C., McAlister, M. S., Bancroft, G. J.,
McDonald, N. Q., Daffe, M., Av-Gay, Y. & Stoker, N. G. (2004). The Mycobacterium

REFERENCES
195
tuberculosis ino1 gene is essential for growth and virulence. Mol Microbiol 51, 1003-
1014.
Muller, B., Borrell, S., Rose, G. & Gagneux, S. (2013). The heterogeneous evolution
of multidrug-resistant Mycobacterium tuberculosis. Trends Genet.
Müller, B., Streicher, E. M., Hoek, K. G., Tait, M., Trollip, A., Bosman, M. E.,
Coetzee, G. J., Chabula-Nxiweni, E. M., Hoosain, E., Gey van Pittius, N. C., Victor,
T. C., van Helden, P. D. & Warren, R. M. (2011). inhA promoter mutations: a
gateway to extensively drug-resistant tuberculosis in South Africa? The international
journal of tuberculosis and lung disease : the official journal of the International Union
against Tuberculosis and Lung Disease 15, 344-351.
Musser, J. M., Kapur, V., Williams, D. L., Kreiswirth, B. N., van Soolingen, D. &
van Embden, J. D. (1996). Characterization of the catalase-peroxidase gene (katG) and
inhA locus in isoniazid-resistant and -susceptible strains of Mycobacterium tuberculosis
by automated DNA sequencing: restricted array of mutations associated with drug
resistance. J Infect Dis 173, 196-202.
Musser, J. M., Amin, A. & Ramaswamy, S. (2000). Negligible genetic diversity of
mycobacterium tuberculosis host immune system protein targets: evidence of limited
selective pressure. Genetics 155, 7-16.
Nerlich, A. G., Haas, C. J., Zink, A., Szeimies, U. & Hagedorn, H. G. (1997).
Molecular evidence for tuberculosis in an ancient Egyptian mummy. Lancet 350, 1404.
Newton-Foot, M. & Gey van Pittius, N. C. (2012). The complex architecture of
mycobacterial promoters. Tuberculosis (Edinb).
Ng, P. C. & Henikoff, S. (2001). Predicting deleterious amino acid substitutions.
Genome Res 11, 863-874.
Ng, P. C. & Henikoff, S. (2003). SIFT: Predicting amino acid changes that affect
protein function. Nucleic Acids Res 31, 3812-3814.

REFERENCES
196
Ng, P. C. & Henikoff, S. (2006). Predicting the effects of amino acid substitutions on
protein function. Annual review of genomics and human genetics 7, 61-80.
Nicol, M. P. & Wilkinson, R. J. (2008). The clinical consequences of strain diversity in
Mycobacterium tuberculosis. Trans R Soc Trop Med Hyg 102, 955-965.
Pandey, D. P. & Gerdes, K. (2005). Toxin-antitoxin loci are highly abundant in free-
living but lost from host-associated prokaryotes. Nucleic Acids Res 33, 966-976.
Parish, T. & Stoker, N. G. (2001). Mycobacterium tuberculosis protocols. Totowa, NJ:
Humana Press.
Parsons, L. M., Brosch, R., Cole, S. T., Somoskovi, A., Loder, A., Bretzel, G., Van
Soolingen, D., Hale, Y. M. & Salfinger, M. (2002). Rapid and simple approach for
identification of Mycobacterium tuberculosis complex isolates by PCR-based genomic
deletion analysis. J Clin Microbiol 40, 2339-2345.
Parsons, S., Smith, S. G., Martins, Q., Horsnell, W. G., Gous, T. A., Streicher, E.
M., Warren, R. M., van Helden, P. D. & Gey van Pittius, N. C. (2008). Pulmonary
infection due to the dassie bacillus (Mycobacterium tuberculosis complex sp.) in a free-
living dassie (rock hyrax-Procavia capensis) from South Africa. Tuberculosis (Edinb)
88, 80-83.
Parthiban, V., Gromiha, M. M. & Schomburg, D. (2006). CUPSAT: prediction of
protein stability upon point mutations. Nucleic Acids Res 34, W239-242.
Parwati, I., van Crevel, R. & van Soolingen, D. (2010). Possible underlying
mechanisms for successful emergence of the Mycobacterium tuberculosis Beijing
genotype strains. Lancet Infect Dis 10, 103-111.
Perkins, T. T., Kingsley, R. A., Fookes, M. C., Gardner, P. P., James, K. D., Yu, L.,
Assefa, S. A., He, M., Croucher, N. J., Pickard, D. J., Maskell, D. J., Parkhill, J.,
Choudhary, J., Thomson, N. R. & Dougan, G. (2009). A strand-specific RNA-Seq
analysis of the transcriptome of the typhoid bacillus Salmonella typhi. PLoS Genet 5,
e1000569.
REFERENCES
197
Plotkin, J. B. & Kudla, G. (2011). Synonymous but not the same: the causes and
consequences of codon bias. Nat Rev Genet 12, 32-42.
Portevin, D., Gagneux, S., Comas, I. & Young, D. (2011). Human macrophage
responses to clinical isolates from the Mycobacterium tuberculosis complex discriminate
between ancient and modern lineages. PLoS Pathog 7, e1001307.
Projahn, M., Koser, C., Homolka, S., Summers, D., Archer, J. & Niemann, S.
(2011). Polymorphisms in Isoniazid and Prothionamide Resistance Genes of the
Mycobacterium tuberculosis Complex. Antimicrobial agents and chemotherapy 55,
4408-4411.
Punta, M., Coggill, P. C., Eberhardt, R. Y., Mistry, J., Tate, J., Boursnell, C., Pang,
N., Forslund, K., Ceric, G., Clements, J., Heger, A., Holm, L., Sonnhammer, E. L.,
Eddy, S. R., Bateman, A. & Finn, R. D. (2012). The Pfam protein families database.
Nucleic Acids Res 40, D290-301.
Qi, W., Kaser, M., Roltgen, K., Yeboah-Manu, D. & Pluschke, G. (2009). Genomic
diversity and evolution of Mycobacterium ulcerans revealed by next-generation
sequencing. PLoS Pathog 5, e1000580.
Qian, L., Van Embden, J. D., Van Der Zanden, A. G., Weltevreden, E. F., Duanmu,
H. & Douglas, J. T. (1999). Retrospective analysis of the Beijing family of
Mycobacterium tuberculosis in preserved lung tissues. J Clin Microbiol 37, 471-474.
Quinlan, A. R. & Hall, I. M. (2010). BEDTools: a flexible suite of utilities for
comparing genomic features. Bioinformatics 26, 841-842.
Raghavan, R., Sloan, D. B. & Ochman, H. (2012). Antisense transcription is pervasive
but rarely conserved in enteric bacteria. MBio 3.
Ramaswamy, S. & Musser, J. M. (1998). Molecular genetic basis of antimicrobial
agent resistance in Mycobacterium tuberculosis: 1998 update. Tuber Lung Dis 79, 3-29.
Ramaswamy, S. V., Amin, A. G., Goksel, S., Stager, C. E., Dou, S. J., El Sahly, H.,
Moghazeh, S. L., Kreiswirth, B. N. & Musser, J. M. (2000). Molecular genetic

REFERENCES
198
analysis of nucleotide polymorphisms associated with ethambutol resistance in human
isolates of Mycobacterium tuberculosis. Antimicrob Agents Chemother 44, 326-336.
Ramaswamy, S. V., Reich, R., Dou, S. J., Jasperse, L., Pan, X., Wanger, A.,
Quitugua, T. & Graviss, E. A. (2003). Single nucleotide polymorphisms in genes
associated with isoniazid resistance in Mycobacterium tuberculosis. Antimicrob Agents
Chemother 47, 1241-1250.
Ramensky, V., Bork, P. & Sunyaev, S. (2002). Human non-synonymous SNPs: server
and survey. Nucleic Acids Res 30, 3894.
Rao, V., Gao, F., Chen, B., Jacobs, W. R., Jr. & Glickman, M. S. (2006). Trans-
cyclopropanation of mycolic acids on trehalose dimycolate suppresses Mycobacterium
tuberculosis -induced inflammation and virulence. J Clin Invest 116, 1660-1667.
Reddy, T. B., Riley, R., Wymore, F., Montgomery, P., DeCaprio, D., Engels, R.,
Gellesch, M., Hubble, J., Jen, D., Jin, H., Koehrsen, M., Larson, L., Mao, M.,
Nitzberg, M., Sisk, P., Stolte, C., Weiner, B., White, J., Zachariah, Z. K., Sherlock,
G., Galagan, J. E., Ball, C. A. & Schoolnik, G. K. (2009). TB database: an integrated
platform for tuberculosis research. Nucleic Acids Res 37, D499-508.
Reed, M. B., Domenech, P., Manca, C., Su, H., Barczak, A. K., Kreiswirth, B. N.,
Kaplan, G. & Barry, C. E., 3rd (2004). A glycolipid of hypervirulent tuberculosis
strains that inhibits the innate immune response. Nature 431, 84-87.
Reed, M. B., Gagneux, S., Deriemer, K., Small, P. M. & Barry, C. E., 3rd (2007).
The W-Beijing lineage of Mycobacterium tuberculosis overproduces triglycerides and
has the DosR dormancy regulon constitutively upregulated. J Bacteriol 189, 2583-2589.
Reed, M. B., Pichler, V. K., McIntosh, F., Mattia, A., Fallow, A., Masala, S.,
Domenech, P., Zwerling, A., Thibert, L., Menzies, D., Schwartzman, K. & Behr, M.
A. (2009). Major Mycobacterium tuberculosis lineages associate with patient country of
origin. J Clin Microbiol 47, 1119-1128.
Riska, P. F., Jacobs, W. R., Jr. & Alland, D. (2000). Molecular determinants of drug
resistance in tuberculosis. Int J Tuberc Lung Dis 4, S4-10.
REFERENCES
199
Robinson, D. A., Falush, D. & Feil, E. J. (2010a). Bacterial population genetics in
infectious disease. Hoboken, N.J.: Wiley-Blackwell.
Robinson, M. D., McCarthy, D. J. & Smyth, G. K. (2010b). edgeR: a Bioconductor
package for differential expression analysis of digital gene expression data.
Bioinformatics 26, 139-140.
Robinson, M. D. & Oshlack, A. (2010). A scaling normalization method for
differential expression analysis of RNA-seq data. Genome Biol 11, R25.
Rocha, E. P., Smith, J. M., Hurst, L. D., Holden, M. T., Cooper, J. E., Smith, N. H.
& Feil, E. J. (2006). Comparisons of dN/dS are time dependent for closely related
bacterial genomes. J Theor Biol 239, 226-235.
Roumagnac, P., Weill, F. X., Dolecek, C., Baker, S., Brisse, S., Chinh, N. T., Le, T.
A., Acosta, C. J., Farrar, J., Dougan, G. & Achtman, M. (2006). Evolutionary history
of Salmonella typhi. Science 314, 1301-1304.
Rozen, S. & Skaletsky, H. (2000). Primer3 on the WWW for general users and for
biologist programmers. Methods Mol Biol 132, 365-386.
Russell, D. G., Barry, C. E. & Flynn, J. L. (2010). Tuberculosis: what we don't know
can, and does, hurt us. Science (New York, NY) 328, 852-856.
Sala, C., Haouz, A., Saul, F., Miras, I., Rosenkrands, I., Alzari, P. & Cole, S. T.
(2009). Genome-wide regulon and crystal structure of BlaI (Rv1846c) from
Mycobacterium tuberculosis. Mol Microbiol 71, 1102-1116.
Salo, W. L., Aufderheide, A. C., Buikstra, J. & Holcomb, T. A. (1994). Identification
of Mycobacterium tuberculosis DNA in a pre-Columbian Peruvian mummy. Proc Natl
Acad Sci U S A 91, 2091-2094.
Sandgren, A., Strong, M., Muthukrishnan, P., Weiner, B. K., Church, G. M. &
Murray, M. B. (2009). Tuberculosis drug resistance mutation database. PLoS Med 6,
e2.
REFERENCES
200
Sassetti, C. M., Boyd, D. H. & Rubin, E. J. (2003). Genes required for mycobacterial
growth defined by high density mutagenesis. Mol Microbiol 48, 77-84.
Sassetti, C. M. & Rubin, E. J. (2003). Genetic requirements for mycobacterial survival
during infection. Proc Natl Acad Sci U S A 100, 12989-12994.
Saunders, C. T. & Baker, D. (2002). Evaluation of structural and evolutionary
contributions to deleterious mutation prediction. J Mol Biol 322, 891-901.
Schena, M., Heller, R. A., Theriault, T. P., Konrad, K., Lachenmeier, E. & Davis,
R. W. (1998). Microarrays: biotechnology's discovery platform for functional genomics.
Trends Biotechnol 16, 301-306.
Schnell, R., Agren, D. & Schneider, G. (2008). 1.9 A structure of the signal receiver
domain of the putative response regulator NarL from Mycobacterium tuberculosis. Acta
Crystallogr Sect F Struct Biol Cryst Commun 64, 1096-1100.
Schulz, M. H., Zerbino, D. R., Vingron, M. & Birney, E. (2012). Oases: robust de
novo RNA-seq assembly across the dynamic range of expression levels. Bioinformatics
28, 1086-1092.
Schürch, A. C., Kremer, K., Warren, R. M., Hung, N. V., Zhao, Y., Wan, K.,
Boeree, M. J., Siezen, R. J., Smith, N. H. & van Soolingen, D. (2011). Mutations in
the regulatory network underlie the recent clonal expansion of a dominant subclone of
the Mycobacterium tuberculosis Beijing genotype. Infect, Genet Evol 11, 587-597.
Sharma, C. M., Hoffmann, S., Darfeuille, F., Reignier, J., Findeiss, S., Sittka, A.,
Chabas, S., Reiche, K., Hackermüller, J., Reinhardt, R., Stadler, P. F. & Vogel, J.
(2010a). The primary transcriptome of the major human pathogen Helicobacter pylori.
Nature 464, 250-255.
Sharma, C. M., Hoffmann, S., Darfeuille, F., Reignier, J., Findeiss, S., Sittka, A.,
Chabas, S., Reiche, K., Hackermuller, J., Reinhardt, R., Stadler, P. F. & Vogel, J.
(2010b). The primary transcriptome of the major human pathogen Helicobacter pylori.
Nature 464, 250-255.

REFERENCES
201
Shendure, J. & Ji, H. (2008). Next-generation DNA sequencing. Nat Biotechnol 26,
1135-1145.
Sherman, D. R., Mdluli, K., Hickey, M. J., Arain, T. M., Morris, S. L., Barry, C. E.,
3rd & Stover, C. K. (1996). Compensatory ahpC gene expression in isoniazid-resistant
Mycobacterium tuberculosis. Science 272, 1641-1643.
Sherry, S. T., Ward, M. & Sirotkin, K. (1999). dbSNP-database for single nucleotide
polymorphisms and other classes of minor genetic variation. Genome Res 9, 677-679.
Singh, A., Jain, S., Gupta, S., Das, T. & Tyagi, A. K. (2003). mymA operon of
Mycobacterium tuberculosis: its regulation and importance in the cell envelope. FEMS
Microbiol Lett 227, 53-63.
Singh, A., Gupta, R., Vishwakarma, R. A., N, P. C., Ramanathan, V. D. & Tyagi, A.
K. (2005). Requirement of the mymA operon for appropriate cell wall ultrastructure and
persistence of Mycobacterium tuberculosis in the spleens of guinea pigs. J Bacteriol
187, 4173-4186.
Sinsimer, D., Huet, G., Manca, C., Tsenova, L., Koo, M. S., Kurepina, N., Kana, B.,
Mathema, B., Marras, S. A., Kreiswirth, B. N., Guilhot, C. & Kaplan, G. (2008).
The phenolic glycolipid of Mycobacterium tuberculosis differentially modulates the
early host cytokine response but does not in itself confer hypervirulence. Infect Immun
76, 3027-3036.
Smith, N. H., Gordon, S. V., de la Rua-Domenech, R., Clifton-Hadley, R. S. &
Hewinson, R. G. (2006a). Bottlenecks and broomsticks: the molecular evolution of
Mycobacterium bovis. Nat Rev Microbiol 4, 670-681.
Smith, N. H., Kremer, K., Inwald, J., Dale, J., Driscoll, J. R., Gordon, S. V., van
Soolingen, D., Hewinson, R. G. & Smith, J. M. (2006b). Ecotypes of the
Mycobacterium tuberculosis complex. J Theor Biol 239, 220-225.
Sreevatsan, S., Pan, X., Stockbauer, K. E., Connell, N. D., Kreiswirth, B. N.,
Whittam, T. S. & Musser, J. M. (1997a). Restricted structural gene polymorphism in

REFERENCES
202
the Mycobacterium tuberculosis complex indicates evolutionarily recent global
dissemination. Proc Natl Acad Sci U S A 94, 9869-9874.
Sreevatsan, S., Stockbauer, K. E., Pan, X., Kreiswirth, B. N., Moghazeh, S. L.,
Jacobs, W. R., Jr., Telenti, A. & Musser, J. M. (1997b). Ethambutol resistance in
Mycobacterium tuberculosis: critical role of embB mutations. Antimicrob Agents
Chemother 41, 1677-1681.
Srivastava, S., Garg, A., Ayyagari, A., Nyati, K. K., Dhole, T. N. & Dwivedi, S. K.
(2006). Nucleotide polymorphism associated with ethambutol resistance in clinical
isolates of Mycobacterium tuberculosis. Curr Microbiol 53, 401-405.
Srivastava, S., Ayyagari, A., Dhole, T. N., Nyati, K. K. & Dwivedi, S. K. (2009). emb
nucleotide polymorphisms and the role of embB306 mutations in Mycobacterium
tuberculosis resistance to ethambutol. Int J Med Microbiol 299, 269-280.
Stahl, D. A. & Urbance, J. W. (1990). The division between fast- and slow-growing
species corresponds to natural relationships among the mycobacteria. J Bacteriol 172,
116-124.
Steenken, W. (1935). Lysis of tubercle bacilli in vitro. Proc Soc Exptl Biol Med 33
253–255.
Stenson, P. D., Ball, E. V., Mort, M., Phillips, A. D., Shaw, K. & Cooper, D. N.
(2012). The Human Gene Mutation Database (HGMD) and its exploitation in the fields
of personalized genomics and molecular evolution. Curr Protoc Bioinformatics Chapter
1, Unit1 13.
Steyn, A. J. C., Joseph, J. & Bloom, B. R. (2003). Interaction of the sensor module of
Mycobacterium tuberculosis H37Rv KdpD with members of the Lpr family. Mol
Microbiol 47, 1075-1089.
Stitziel, N. O., Binkowski, T. A., Tseng, Y. Y., Kasif, S. & Liang, J. (2004). topoSNP:
a topographic database of non-synonymous single nucleotide polymorphisms with and
without known disease association. Nucleic Acids Res 32, D520-522.

REFERENCES
203
Stucki, D. & Gagneux, S. (2012). Single nucleotide polymorphisms in Mycobacterium
tuberculosis and the need for a curated database. Tuberculosis (Edinb).
Stucki, D., Malla, B., Hostettler, S., Huna, T., Feldmann, J., Yeboah-Manu, D.,
Borrell, S., Fenner, L., Comas, I., Coscolla, M. & Gagneux, S. (2012). Two new
rapid SNP-typing methods for classifying Mycobacterium tuberculosis complex into the
main phylogenetic lineages. PLoS One 7, e41253.
Sunyaev, S., Ramensky, V. & Bork, P. (2000). Towards a structural basis of human
non-synonymous single nucleotide polymorphisms. Trends Genet 16, 198-200.
Sunyaev, S., Ramensky, V., Koch, I., Lathe, W., Kondrashov, A. S. & Bork, P.
(2001). Prediction of deleterious human alleles. Hum Mol Genet 10, 591-597.
Supply, P., Lesjean, S., Savine, E., Kremer, K., van Soolingen, D. & Locht, C.
(2001). Automated high-throughput genotyping for study of global epidemiology of
Mycobacterium tuberculosis based on mycobacterial interspersed repetitive units. J Clin
Microbiol 39, 3563-3571.
Supply, P., Warren, R. M., Banuls, A. L., Lesjean, S., Van Der Spuy, G. D., Lewis,
L. A., Tibayrenc, M., Van Helden, P. D. & Locht, C. (2003). Linkage disequilibrium
between minisatellite loci supports clonal evolution of Mycobacterium tuberculosis in a
high tuberculosis incidence area. Mol Microbiol 47, 529-538.
Supply, P., Marceau, M., Mangenot, S., Roche, D., Rouanet, C., Khanna, V.,
Majlessi, L., Criscuolo, A., Tap, J., Pawlik, A., Fiette, L., Orgeur, M., Fabre, M.,
Parmentier, C., Frigui, W., Simeone, R., Boritsch, E. C., Debrie, A. S., Willery, E.,
Walker, D., Quail, M. A., Ma, L., Bouchier, C., Salvignol, G., Sayes, F.,
Cascioferro, A., Seemann, T., Barbe, V., Locht, C., Gutierrez, M. C., Leclerc, C.,
Bentley, S. D., Stinear, T. P., Brisse, S., Medigue, C., Parkhill, J., Cruveiller, S. &
Brosch, R. (2013). Genomic analysis of smooth tubercle bacilli provides insights into
ancestry and pathoadaptation of Mycobacterium tuberculosis. Nat Genet 45, 172-179.
Tamura, K., Peterson, D., Peterson, N., Stecher, G., Nei, M. & Kumar, S. (2011).
MEGA5: molecular evolutionary genetics analysis using maximum likelihood,
evolutionary distance, and maximum parsimony methods. Mol Biol Evol 28, 2731-2739.

REFERENCES
204
Team_RDC (2008). R Development Core Team. Vienna: R Foundation for Statistical
Computing.
Tennessen, J. A., Bigham, A. W., O'Connor, T. D., Fu, W., Kenny, E. E., Gravel, S.,
McGee, S., Do, R., Liu, X., Jun, G., Kang, H. M., Jordan, D., Leal, S. M., Gabriel,
S., Rieder, M. J., Abecasis, G., Altshuler, D., Nickerson, D. A., Boerwinkle, E.,
Sunyaev, S., Bustamante, C. D., Bamshad, M. J. & Akey, J. M. (2012). Evolution
and functional impact of rare coding variation from deep sequencing of human exomes.
Science 337, 64-69.
Thomas, P. D., Campbell, M. J., Kejariwal, A., Mi, H., Karlak, B., Daverman, R.,
Diemer, K., Muruganujan, A. & Narechania, A. (2003). PANTHER: a library of
protein families and subfamilies indexed by function. Genome Res 13, 2129-2141.
Thomason, M. & Storz, G. (2010). Bacterial antisense RNAs: how many are there, and
what are they doing? Annu Rev Genet 44, 167-188.
Thusberg, J. & Vihinen, M. (2009). Pathogenic or not? And if so, then how? Studying
the effects of missense mutations using bioinformatics methods. Hum Mutat 30, 703-
714.
Torrelles, J. B., DesJardin, L. E., MacNeil, J., Kaufman, T. M., Kutzbach, B.,
Knaup, R., McCarthy, T. R., Gurcha, S. S., Besra, G. S., Clegg, S. & Schlesinger, L.
S. (2009). Inactivation of Mycobacterium tuberculosis mannosyltransferase pimB
reduces the cell wall lipoarabinomannan and lipomannan content and increases the rate
of bacterial-induced human macrophage cell death. Glycobiology 19, 743-755.
Torrelles, J. B. & Schlesinger, L. S. (2010). Diversity in Mycobacterium tuberculosis
mannosylated cell wall determinants impacts adaptation to the host. Tuberculosis
(Edinb) 90, 84-93.
Tsolaki, A. G., Hirsh, A. E., DeRiemer, K., Enciso, J. A., Wong, M. Z., Hannan, M.,
Goguet de la Salmoniere, Y. O., Aman, K., Kato-Maeda, M. & Small, P. M. (2004).
Functional and evolutionary genomics of Mycobacterium tuberculosis: insights from

REFERENCES
205
genomic deletions in 100 strains. Proceedings of the National Academy of Sciences of
the United States of America 101, 4865-4870.
Valway, S. E., Sanchez, M. P., Shinnick, T. F., Orme, I., Agerton, T., Hoy, D.,
Jones, J. S., Westmoreland, H. & Onorato, I. M. (1998). An outbreak involving
extensive transmission of a virulent strain of Mycobacterium tuberculosis. N Engl J Med
338, 633-639.
van Embden, J. D., Cave, M. D., Crawford, J. T., Dale, J. W., Eisenach, K. D.,
Gicquel, B., Hermans, P., Martin, C., McAdam, R., Shinnick, T. M. & et al. (1993).
Strain identification of Mycobacterium tuberculosis by DNA fingerprinting:
recommendations for a standardized methodology. J Clin Microbiol 31, 406-409.
van Soolingen, D., Hermans, P. W., de Haas, P. E., Soll, D. R. & van Embden, J. D.
(1991). Occurrence and stability of insertion sequences in Mycobacterium tuberculosis
complex strains: evaluation of an insertion sequence-dependent DNA polymorphism as
a tool in the epidemiology of tuberculosis. J Clin Microbiol 29, 2578-2586.
van Soolingen, D., Hoogenboezem, T., de Haas, P. E., Hermans, P. W., Koedam, M.
A., Teppema, K. S., Brennan, P. J., Besra, G. S., Portaels, F., Top, J., Schouls, L.
M. & van Embden, J. D. (1997). A novel pathogenic taxon of the Mycobacterium
tuberculosis complex, Canetti: characterization of an exceptional isolate from Africa. Int
J Syst Bacteriol 47, 1236-1245.
Van Soolingen, D. (2001). Molecular epidemiology of tuberculosis and other
mycobacterial infections: main methodologies and achievements. J Intern Med 249, 1-
26.
Walderhaug, M. O., Polarek, J. W., Voelkner, P., Daniel, J. M., Hesse, J. E.,
Altendorf, K. & Epstein, W. (1992). KdpD and KdpE, proteins that control expression
of the kdpABC operon, are members of the two-component sensor-effector class of
regulators. J Bacteriol 174, 2152-2159.
Wang, Q., Yue, J., Zhang, L., Xu, Y., Chen, J., Zhang, M., Zhu, B. & Wang, H.
(2007). A newly identified 191A/C mutation in the Rv2629 gene that was significantly

REFERENCES
206
associated with rifampin resistance in Mycobacterium tuberculosis. J Proteome Res 6,
4564-4571.
Wang, Z. & Moult, J. (2001). SNPs, protein structure, and disease. Hum Mutat 17,
263-270.
Wayne, L. G. (1994). Tuberculosis: Pathogenesis, Protection, and Control.
Washington, D.C: American Society for Microbiology Press.
Weiner, B., Gomez, J., Victor, T. C., Warren, R. M., Sloutsky, A., Plikaytis, B. B.,
Posey, J. E., van Helden, P. D., Gey van Pittius, N. C., Koehrsen, M., Sisk, P.,
Stolte, C., White, J., Gagneux, S., Birren, B., Hung, D., Murray, M. & Galagan, J.
(2012). Independent large scale duplications in multiple M. tuberculosis lineages
overlapping the same genomic region. PLoS One 7, e26038.
Weniger, T., Krawczyk, J., Supply, P., Niemann, S. & Harmsen, D. (2010). MIRU-
VNTRplus: a web tool for polyphasic genotyping of Mycobacterium tuberculosis
complex bacteria. Nucleic Acids Res 38, W326-331.
WHO (2012).WHO 2012 Global tuberculosis control—surveillance, planning,
financing. Geneva.
Winder, F. G. & Brennan, P. J. (1966). Initial steps in the metabolism of glycerol by
Mycobacterium tuberculosis. J Bacteriol 92, 1846-1847.
Yi, H., Cho, Y. J., Won, S., Lee, J. E., Jin Yu, H., Kim, S., Schroth, G. P., Luo, S. &
Chun, J. (2011). Duplex-specific nuclease efficiently removes rRNA for prokaryotic
RNA-seq. Nucleic Acids Res.
Yoder-Himes, D. R., Chain, P. S., Zhu, Y., Wurtzel, O., Rubin, E. M., Tiedje, J. M.
& Sorek, R. (2009). Mapping the Burkholderia cenocepacia niche response via high-
throughput sequencing. Proc Natl Acad Sci U S A 106, 3976-3981.
Yuan, Y., Zhu, Y., Crane, D. D. & Barry, C. E., 3rd (1998). The effect of oxygenated
mycolic acid composition on cell wall function and macrophage growth in
Mycobacterium tuberculosis. Mol Microbiol 29, 1449-1458.

REFERENCES
207
Yue, P., Li, Z. & Moult, J. (2005). Loss of protein structure stability as a major
causative factor in monogenic disease. J Mol Biol 353, 459-473.
Zheng, X., Hu, G., She, Z. & Zhu, H. (2011). Leaderless genes in bacteria: clue to the
evolution of translation initiation mechanisms in prokaryotes. BMC Genomics 12, 361.

APPENDIX((
208
Appendix: A-G

Appendix A: genomeDeletions.pl
209
Appendix A
Perl script (genomeDeletions.pl) to identify large deletions within genome sequencing
data. Script takes as input the Artemis genome coverage file format.
genomeDeletions.pl
#!/usr/bin/perl -w
#################################################################
# Find deletions using Artemis per base coverage file #
# #
# usage: perl findGeneDeletions [artemis coverage file] #
#[annotation file] [% threshold] #
# #
# Percentage cutoff set by command argument 3 #
# #
# Graham Rose 05.2011 #
# #
#################################################################
################# Arguments from commandline ####################
if ($#ARGV != 2 ) {
print "\nusage: perl findGeneDeletions.pl [artemis coverage
file] [H37Rv annotation file] [% deletion threshold eg: 50]\n\n";
exit;
}
open FILEIN_ONE, $ARGV[0] or die "Can't open STDOUT: $!\n";
@genomeCoverage = <FILEIN_ONE>;
close(FILEIN_ONE);
open FILEIN_TWO, $ARGV[1] or die "Can't open STDOUT: $!\n";
@annotations = <FILEIN_TWO>;
close(FILEIN_TWO);
$threshold = $ARGV[2];

Appendix A: genomeDeletions.pl
210
########################## Main logic ###########################
foreach $line_in_annotations(@annotations)
{
chomp($line_in_annotations);
$line_in_annotations =~ /(\w+)\s+(\w+)\s+(\w+)\s+(\w+)/;
$geneStart = $1-1; #catch +1 error
$geneEnd = $2;
#$direction = $3;
$geneName = $4;
$geneLength = $geneEnd-$geneStart;
$geneLength2 = $geneLength;
$zeros = 0;
$numberNonZero = 0;
while($geneStart != $geneEnd)
{
#push(@array,$genomeCoverage[$geneStart]);
if($genomeCoverage[$geneStart] == 0)
{
$zeros++;
}
$geneStart++;
}
#$length = @array;
#print "$geneName length = $geneLength2\n";
#print "$geneName Number of zeros = $zeros\n";
$numberNonZero = ($geneLength2-$zeros);
$percentZero = (($zeros/$geneLength2)*100);
$rounded = sprintf "%.2f", $percentZero;
############################## Output ###########################
if($rounded >= $threshold)
{
print "Deletion: $geneName (% deleted: $rounded)\n";
}
}
print "\ncomplete\n\n";

Appendix B. Lineage-specific SNPs
211
Appendix B
Lineage-specific SNPs
All lineage-specific MTBC SNPs. SNPs are ordered by genomic position. Alleles are
relative to the coding strand. If SNPs are in intergenic regions, alleles are based on the
forward strand. Ancestral allele based on the reconstructed most recent common ancestor of
the MTBC. Mutation column shows codon position and amino acid change if the SNP is
nonsynonymous.

Appendix B. Lineage-specific SNPs
212
Lineage Genomic position
Ancestral allele
Derived allele Mutation type Gene Mutation
modern 2532 C T synonymous Rv0002 L161L 5 3192 A G nonsynonymous Rv0002 N381D 3 3446 C T nonsynonymous Rv0003 A56V 5 3452 T C nonsynonymous Rv0003 L58S 1 6112 G C nonsynonymous Rv0005 M330I 1 8452 C T nonsynonymous Rv0006 A384V 6 8493 C T nonsynonymous Rv0006 L398F modern 9143 C T synonymous Rv0006 I614I 5 9566 C T synonymous Rv0006 Y755Y 2 11820 C G intergenic - - 3 12204 C T synonymous Rv0008c L36L 1 13298 C G nonsynonymous Rv0010c I87M modern 13460 C T synonymous Rv0010c D33D 6 13482 C T nonsynonymous Rv0010c A26V 5 13579 C T intergenic - - modern 14401 G A nonsynonymous Rv0012 E105K 2 14861 G T nonsynonymous Rv0012 G258V 4 15117 G C nonsynonymous Rv0013 M68I 5 16720 G C nonsynonymous Rv0014c V251L modern 21819 G T nonsynonymous Rv0018c A455S 1 22961 A C nonsynonymous Rv0018c D74A modern 23174 T G nonsynonymous Rv0018c L3R 6 24780 A G nonsynonymous Rv0020c D222G 5 25386 G A nonsynonymous Rv0020c G20D 6 26053 G C nonsynonymous Rv0021c A277P 1 26347 G C nonsynonymous Rv0021c D179H 5 26783 G A synonymous Rv0021c A33A 3 26957 C G intergenic - - modern 27469 G A intergenic - - 3 27487 G A intergenic - - 5 27947 C T nonsynonymous Rv0023 A118V 1 27996 T C synonymous Rv0023 Y134Y 5 31807 C T synonymous Rv0028 R98R 5 32776 G T synonymous Rv0029 T240T 6 33137 C G nonsynonymous Rv0029 L361V 2 36008 G C nonsynonymous Rv0032 D572H 6 36304 T G synonymous Rv0032 A670A modern 36538 C T synonymous Rv0032 S748S 2 37305 C G nonsynonymous Rv0035 S16W 2 39158 G C synonymous Rv0036c R224R modern 39758 C T synonymous Rv0036c H24H 5 39786 G C nonsynonymous Rv0036c S15T 5 40177 G A synonymous Rv0037c L342L 6 41241 G A intergenic - - 4 42281 T G nonsynonymous Rv0039c F24C modern 43945 G A synonymous Rv0041 V128V 5 46297 T C synonymous Rv0041 Y912Y 5 47877 A C nonsynonymous Rv0043c D75A 5 50059 A T nonsynonymous Rv0046c I356F

Appendix B. Lineage-specific SNPs
213
6 51113 C T synonymous Rv0046c H4H 5 51892 A G nonsynonymous Rv0048c Y269C 3 53422 G A intergenic - - 3 54842 G T nonsynonymous Rv0050 A394S 3 56001 G A synonymous Rv0051 Q102Q 5 58875 C T nonsynonymous Rv0054 T97I 5 60059 C T nonsynonymous Rv0057 T55M 5 60300 G A synonymous Rv0057 V135V 6 62367 G A nonsynonymous Rv0058 V658I 2 63146 G T intergenic - - 1 64028 C T synonymous Rv0060 P40P 3 65083 G A synonymous Rv0061 G31G 1 65159 G A nonsynonymous Rv0061 A57T 1 65663 C G nonsynonymous Rv0062 H38D 3 66632 C T nonsynonymous Rv0062 P361S 1 66892 C G intergenic - - 3 67012 C T synonymous Rv0063 T30T 1 68174 T C nonsynonymous Rv0063 S418P 3 69984 C A synonymous Rv0064 A455A 4 70267 T G nonsynonymous Rv0064 F550V 5 71203 C G nonsynonymous Rv0064 Q862E 5 71203 C T stopgain Rv0064 Q862X 3 72549 G A nonsynonymous Rv0066c G655S 5 73148 C T nonsynonymous Rv0066c A455V 6 74161 G C nonsynonymous Rv0066c K117N 1 74737 A C nonsynonymous Rv0067c E154D 5 75313 A C nonsynonymous Rv0068 T5P 6 76147 C G nonsynonymous Rv0068 Q283E 5 77327 T G nonsynonymous Rv0069c I99S 6 78103 A G nonsynonymous Rv0070c E265G 1 79479 T C intergenic - - 6 84238 T G synonymous Rv0075 G81G 5 86587 C A synonymous Rv0078 I20I 2 87468 G A nonsynonymous Rv0078A E112K 5 87499 C T synonymous Rv0078A F101F 5 87973 C T intergenic - - 6 89113 T G nonsynonymous Rv0080 V31G modern 89200 T G nonsynonymous Rv0080 V60G 5 89474 G A synonymous Rv0080 T151T 6 89535 C T intergenic - - 1 89871 C T synonymous Rv0081 D99D 6 91001 C T nonsynonymous Rv0083 P201L 6 92016 T G nonsynonymous Rv0083 D539E 5 95867 G T nonsynonymous Rv0087 A152S modern 97696 C T intergenic - - 1 98966 G C nonsynonymous Rv0090 A163P 6 100589 A G nonsynonymous Rv0092 T3A modern 103600 C T nonsynonymous Rv0093c R22C 6 104712 T C intergenic - - 6 111651 G A nonsynonymous Rv0101 D551N 5 113059 C A nonsynonymous Rv0101 P1020H 1 115499 T G synonymous Rv0101 R1833R 6 116901 T G nonsynonymous Rv0101 C2301G
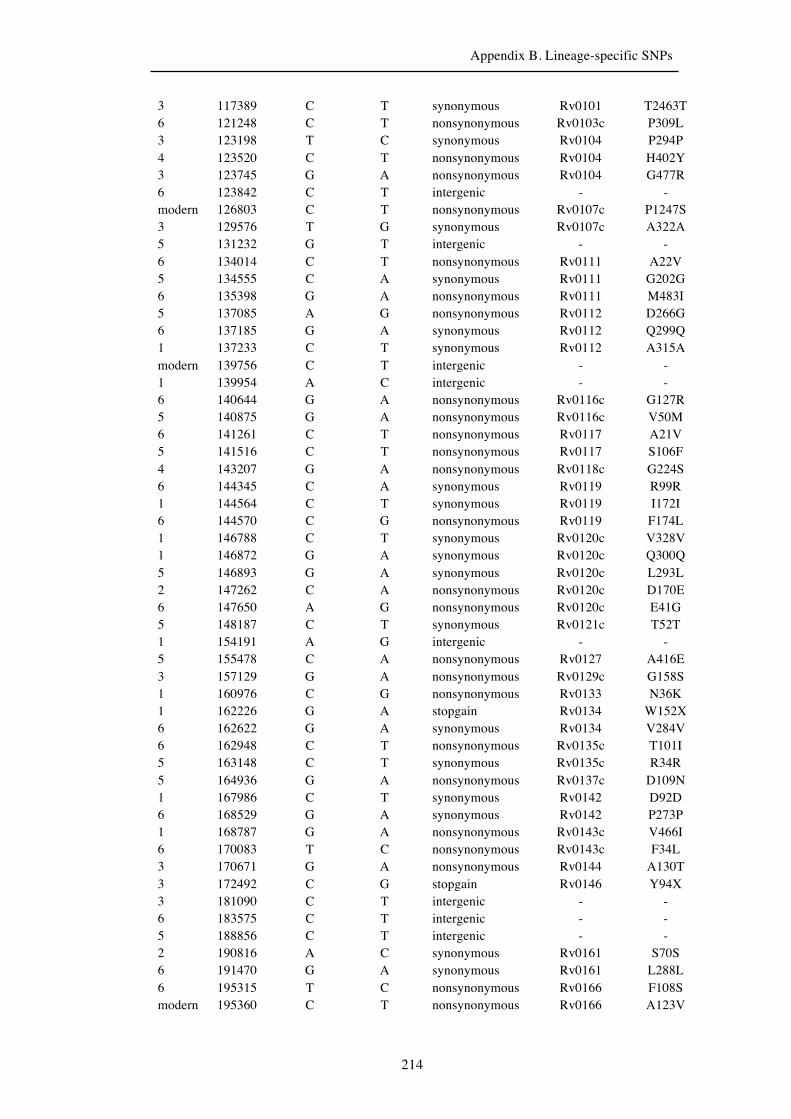
Appendix B. Lineage-specific SNPs
214
3 117389 C T synonymous Rv0101 T2463T 6 121248 C T nonsynonymous Rv0103c P309L 3 123198 T C synonymous Rv0104 P294P 4 123520 C T nonsynonymous Rv0104 H402Y 3 123745 G A nonsynonymous Rv0104 G477R 6 123842 C T intergenic - - modern 126803 C T nonsynonymous Rv0107c P1247S 3 129576 T G synonymous Rv0107c A322A 5 131232 G T intergenic - - 6 134014 C T nonsynonymous Rv0111 A22V 5 134555 C A synonymous Rv0111 G202G 6 135398 G A nonsynonymous Rv0111 M483I 5 137085 A G nonsynonymous Rv0112 D266G 6 137185 G A synonymous Rv0112 Q299Q 1 137233 C T synonymous Rv0112 A315A modern 139756 C T intergenic - - 1 139954 A C intergenic - - 6 140644 G A nonsynonymous Rv0116c G127R 5 140875 G A nonsynonymous Rv0116c V50M 6 141261 C T nonsynonymous Rv0117 A21V 5 141516 C T nonsynonymous Rv0117 S106F 4 143207 G A nonsynonymous Rv0118c G224S 6 144345 C A synonymous Rv0119 R99R 1 144564 C T synonymous Rv0119 I172I 6 144570 C G nonsynonymous Rv0119 F174L 1 146788 C T synonymous Rv0120c V328V 1 146872 G A synonymous Rv0120c Q300Q 5 146893 G A synonymous Rv0120c L293L 2 147262 C A nonsynonymous Rv0120c D170E 6 147650 A G nonsynonymous Rv0120c E41G 5 148187 C T synonymous Rv0121c T52T 1 154191 A G intergenic - - 5 155478 C A nonsynonymous Rv0127 A416E 3 157129 G A nonsynonymous Rv0129c G158S 1 160976 C G nonsynonymous Rv0133 N36K 1 162226 G A stopgain Rv0134 W152X 6 162622 G A synonymous Rv0134 V284V 6 162948 C T nonsynonymous Rv0135c T101I 5 163148 C T synonymous Rv0135c R34R 5 164936 G A nonsynonymous Rv0137c D109N 1 167986 C T synonymous Rv0142 D92D 6 168529 G A synonymous Rv0142 P273P 1 168787 G A nonsynonymous Rv0143c V466I 6 170083 T C nonsynonymous Rv0143c F34L 3 170671 G A nonsynonymous Rv0144 A130T 3 172492 C G stopgain Rv0146 Y94X 3 181090 C T intergenic - - 6 183575 C T intergenic - - 5 188856 C T intergenic - - 2 190816 A C synonymous Rv0161 S70S 6 191470 G A synonymous Rv0161 L288L 6 195315 T C nonsynonymous Rv0166 F108S modern 195360 C T nonsynonymous Rv0166 A123V

Appendix B. Lineage-specific SNPs
215
1 196874 C T nonsynonymous Rv0167 T5I 6 198313 C A nonsynonymous Rv0168 D218E 3 198401 G T nonsynonymous Rv0168 G248C 4 199470 G T nonsynonymous Rv0169 A313S 5 199734 C G nonsynonymous Rv0169 P401A 6 201567 G C nonsynonymous Rv0171 E212D 5 202229 C G nonsynonymous Rv0171 A433G 6 203639 G A synonymous Rv0172 L388L 5 204315 A G nonsynonymous Rv0173 K84R 4 206481 G C synonymous Rv0174 P417P 4 206484 T G synonymous Rv0174 G418G 3 207079 G C nonsynonymous Rv0175 R89P 5 208299 C T nonsynonymous Rv0176 P283L modern 208318 C T synonymous Rv0176 I289I modern 208320 G A nonsynonymous Rv0176 S290N modern 208321 C G nonsynonymous Rv0176 S290R modern 208321 C T synonymous Rv0176 S290S 6 208403 C T nonsynonymous Rv0176 P318S 6 210442 G A nonsynonymous Rv0179c R124H 3 210624 G A synonymous Rv0179c L63L 1 211993 G T nonsynonymous Rv0180c K86N 1 215238 C T synonymous Rv0184 D90D 4 217201 C T synonymous Rv0186 N311N 3 218599 T C intergenic - - modern 223752 G C nonsynonymous Rv0192A G49A 3 224338 C T nonsynonymous Rv0192 P259S 5 224414 A G intergenic - - 6 225416 T C nonsynonymous Rv0193c W386R modern 225668 A G nonsynonymous Rv0193c S302G 1 226676 G A intergenic - - 5 227468 C T synonymous Rv0194 V197V 5 229448 G C nonsynonymous Rv0194 L857F 2 230170 C T nonsynonymous Rv0194 P1098L 5 230197 C T nonsynonymous Rv0194 T1107I modern 233358 C A synonymous Rv0197 V376V modern 233364 C G nonsynonymous Rv0197 S378R 5 233377 C T nonsynonymous Rv0197 H383Y 4 234493 C G nonsynonymous Rv0197 L755V 5 240032 G T nonsynonymous Rv0202c A421S modern 243598 G A nonsynonymous Rv0205 R72H 1 244550 T C synonymous Rv0206c R923R 6 245921 C G nonsynonymous Rv0206c D466E 6 246169 T A nonsynonymous Rv0206c F384I 5 248946 C T intergenic - - 4 249522 C T nonsynonymous Rv0209 A162V 5 251176 C A nonsynonymous Rv0210 L353M 4 251575 A G nonsynonymous Rv0210 T486A modern 251669 C T intergenic - - 5 253046 A C nonsynonymous Rv0211 K422T 6 254508 G C nonsynonymous Rv0212c G45R 1 254903 G T nonsynonymous Rv0213c G350C 3 255373 A G nonsynonymous Rv0213c D193G 5 256001 G T intergenic - -

Appendix B. Lineage-specific SNPs
216
3 257071 C T synonymous Rv0214 Y336Y 5 258470 T C synonymous Rv0215c G129G 5 258561 T G nonsynonymous Rv0215c L99R modern 260282 A C nonsynonymous Rv0217c T184P 6 260610 G A synonymous Rv0217c L74L 1 263149 A C nonsynonymous Rv0220 E113A 2 264129 G A nonsynonymous Rv0221 M21I 1 264298 C A nonsynonymous Rv0221 Q78K 1 264984 C G synonymous Rv0221 T306T 3 264992 T C nonsynonymous Rv0221 L309P 3 266405 G A nonsynonymous Rv0223c G454S 6 272306 G T synonymous Rv0227c A178A 1 272678 G A synonymous Rv0227c A54A 6 273558 C G synonymous Rv0228 S168S 3 274463 G T nonsynonymous Rv0229c R175L 5 274584 T C nonsynonymous Rv0229c S135P 6 275367 C A nonsynonymous Rv0230c D199E 3 276539 G C nonsynonymous Rv0231 G161A 5 277865 G C intergenic - - 5 281405 C A nonsynonymous Rv0235c P404T 6 282537 C A synonymous Rv0235c I26I 2 282892 G A synonymous Rv0236c T1320T 5 285653 G A nonsynonymous Rv0236c R400Q 3 289253 C T synonymous Rv0239 D50D 1 290374 A G nonsynonymous Rv0241c H94R 5 291830 A C nonsynonymous Rv0242c D67A 5 295645 C T intergenic - - 3 301341 G T synonymous Rv0249c P105P 6 301687 C T intergenic - - 5 306201 A G nonsynonymous Rv0254c H50R 5 309681 C G intergenic - - modern 309765 T C stoplost Rv0257 X23R 6 310129 T C intergenic - - 6 310132 G A intergenic - - 6 315069 G T nonsynonymous Rv0263c R233L modern 320180 C T synonymous Rv0266c I325I 6 323306 A G intergenic - - 3 324812 C T synonymous Rv0270 D82D 4 325505 C T synonymous Rv0270 V313V 1 326002 A G nonsynonymous Rv0270 D479G 6 327312 A G nonsynonymous Rv0271c K384E 3 328569 G C intergenic - - 5 331309 T C nonsynonymous Rv0275c L117P modern 331588 T C nonsynonymous Rv0275c L24S modern 333212 C G intergenic - - modern 333292 G A intergenic - - 6 333394 G C synonymous Rv0277A S8S 3 339230 G C intergenic - - 4 342146 C A nonsynonymous Rv0282 A6E 3 342873 C T synonymous Rv0282 V248V modern 343281 C G synonymous Rv0282 A384A 5 344258 G A synonymous Rv0283 V79V 1 344288 C G synonymous Rv0283 S89S

Appendix B. Lineage-specific SNPs
217
6 344957 A G nonsynonymous Rv0283 I312M 5 345317 G C synonymous Rv0283 V432V 6 352058 G T nonsynonymous Rv0288 A71S 5 352646 G A synonymous Rv0289 P166P 3 353197 C T nonsynonymous Rv0290 R39C 2 353309 G A nonsynonymous Rv0290 S76N 2 353365 G A nonsynonymous Rv0290 A95T 5 357538 A G nonsynonymous Rv0293c H176R 1 357582 C T synonymous Rv0293c H161H 3 358473 G C nonsynonymous Rv0294 W101C 6 360585 G A nonsynonymous Rv0296c E191K 3 363563 G A nonsynonymous Rv0299 A30T 5 376237 G A synonymous Rv0306 L108L 6 378032 G A synonymous Rv0309 A34A 1 378357 T G nonsynonymous Rv0309 S143A 6 378404 G A synonymous Rv0309 P158P 1 378939 C G synonymous Rv0310c R70R 5 379687 C T synonymous Rv0311 V172V modern 381030 G A nonsynonymous Rv0312 G159S 6 382243 C T nonsynonymous Rv0312 P563L 6 382489 C T intergenic - - 4 392261 C T stopgain Rv0325 Q75X 1 393941 G A nonsynonymous Rv0327c M35I 6 394900 C T stopgain Rv0329c R141X 1 396750 G A nonsynonymous Rv0331 V184I 3 402836 C T synonymous Rv0337c Y109Y 6 402881 C T synonymous Rv0337c D94D 6 405274 C A nonsynonymous Rv0338c L190I 6 405854 C G intergenic - - 1 406274 A G synonymous Rv0339c A725A 5 408006 C A nonsynonymous Rv0339c P148Q 5 408935 C T nonsynonymous Rv0340 A101V 5 409079 G A nonsynonymous Rv0340 G149E modern 412280 G T nonsynonymous Rv0342 Q481H 5 414876 C G synonymous Rv0344c G22G 1 420405 C T nonsynonymous Rv0350 R191C 3 422678 G A nonsynonymous Rv0352 R76H 1 424250 A G intergenic - - modern 438271 A G nonsynonymous Rv0359 T252A 3 438470 G A synonymous Rv0360c K90K 1 439711 T C intergenic - - 3 440365 G A synonymous Rv0362 S165S 3 440878 C T synonymous Rv0362 T336T 5 441062 G T nonsynonymous Rv0362 A398S 6 441891 A G nonsynonymous Rv0363c I137V 5 442468 G A nonsynonymous Rv0364 G25D 5 443471 G A nonsynonymous Rv0365c A243T 6 443897 C T synonymous Rv0365c L101L 5 445696 C A stopgain Rv0368c S277X 6 445737 G A synonymous Rv0368c P263P 4 445780 A G nonsynonymous Rv0368c H249R modern 447442 A G nonsynonymous Rv0370c E201G 1 447525 C G nonsynonymous Rv0370c I173M
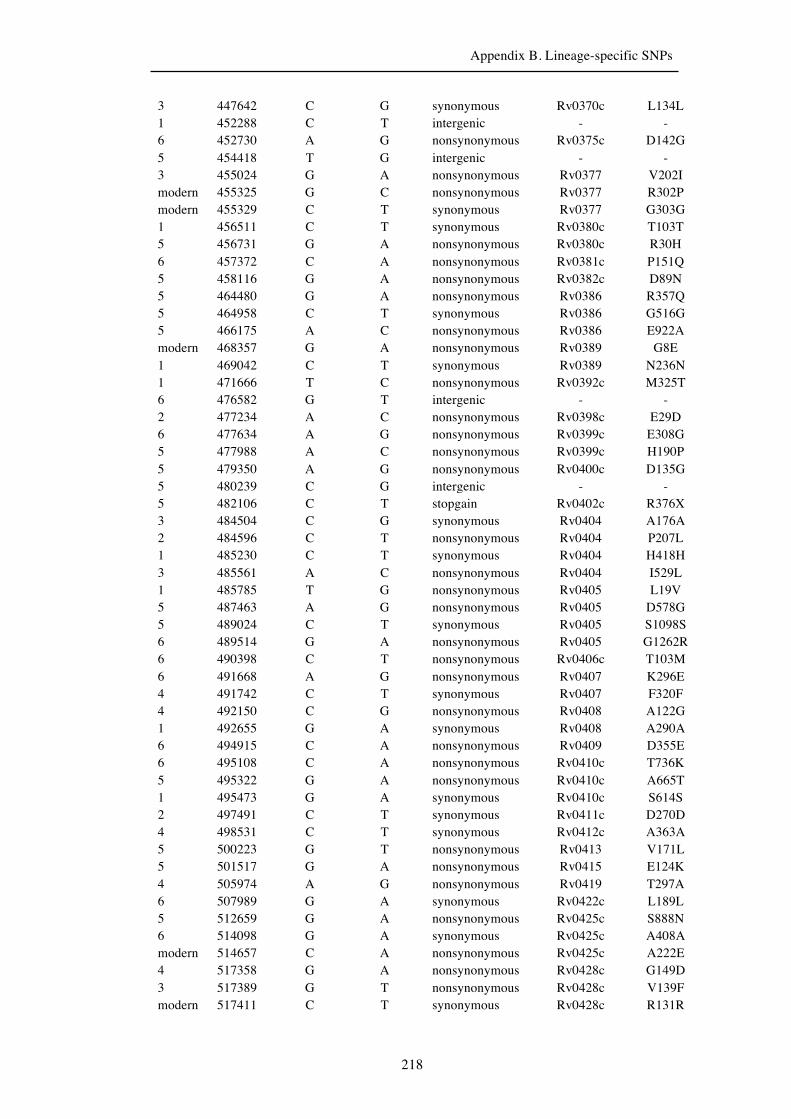
Appendix B. Lineage-specific SNPs
218
3 447642 C G synonymous Rv0370c L134L 1 452288 C T intergenic - - 6 452730 A G nonsynonymous Rv0375c D142G 5 454418 T G intergenic - - 3 455024 G A nonsynonymous Rv0377 V202I modern 455325 G C nonsynonymous Rv0377 R302P modern 455329 C T synonymous Rv0377 G303G 1 456511 C T synonymous Rv0380c T103T 5 456731 G A nonsynonymous Rv0380c R30H 6 457372 C A nonsynonymous Rv0381c P151Q 5 458116 G A nonsynonymous Rv0382c D89N 5 464480 G A nonsynonymous Rv0386 R357Q 5 464958 C T synonymous Rv0386 G516G 5 466175 A C nonsynonymous Rv0386 E922A modern 468357 G A nonsynonymous Rv0389 G8E 1 469042 C T synonymous Rv0389 N236N 1 471666 T C nonsynonymous Rv0392c M325T 6 476582 G T intergenic - - 2 477234 A C nonsynonymous Rv0398c E29D 6 477634 A G nonsynonymous Rv0399c E308G 5 477988 A C nonsynonymous Rv0399c H190P 5 479350 A G nonsynonymous Rv0400c D135G 5 480239 C G intergenic - - 5 482106 C T stopgain Rv0402c R376X 3 484504 C G synonymous Rv0404 A176A 2 484596 C T nonsynonymous Rv0404 P207L 1 485230 C T synonymous Rv0404 H418H 3 485561 A C nonsynonymous Rv0404 I529L 1 485785 T G nonsynonymous Rv0405 L19V 5 487463 A G nonsynonymous Rv0405 D578G 5 489024 C T synonymous Rv0405 S1098S 6 489514 G A nonsynonymous Rv0405 G1262R 6 490398 C T nonsynonymous Rv0406c T103M 6 491668 A G nonsynonymous Rv0407 K296E 4 491742 C T synonymous Rv0407 F320F 4 492150 C G nonsynonymous Rv0408 A122G 1 492655 G A synonymous Rv0408 A290A 6 494915 C A nonsynonymous Rv0409 D355E 6 495108 C A nonsynonymous Rv0410c T736K 5 495322 G A nonsynonymous Rv0410c A665T 1 495473 G A synonymous Rv0410c S614S 2 497491 C T synonymous Rv0411c D270D 4 498531 C T synonymous Rv0412c A363A 5 500223 G T nonsynonymous Rv0413 V171L 5 501517 G A nonsynonymous Rv0415 E124K 4 505974 A G nonsynonymous Rv0419 T297A 6 507989 G A synonymous Rv0422c L189L 5 512659 G A nonsynonymous Rv0425c S888N 6 514098 G A synonymous Rv0425c A408A modern 514657 C A nonsynonymous Rv0425c A222E 4 517358 G A nonsynonymous Rv0428c G149D 3 517389 G T nonsynonymous Rv0428c V139F modern 517411 C T synonymous Rv0428c R131R

Appendix B. Lineage-specific SNPs
219
6 518166 C A synonymous Rv0429c R77R modern 519185 G T nonsynonymous Rv0431 G38V 6 519331 A G nonsynonymous Rv0431 T87A 5 519872 C T synonymous Rv0432 F91F modern 522081 G A nonsynonymous Rv0434 A190T 3 523654 G A nonsynonymous Rv0435c A294T 6 524802 C T nonsynonymous Rv0436c P197S 5 525205 C T synonymous Rv0436c R62R 5 525540 A C synonymous Rv0437c A181A 6 526255 C T nonsynonymous Rv0438c P369L 6 526406 C T nonsynonymous Rv0438c P319S modern 527316 C G nonsynonymous Rv0438c I15M modern 528354 A C intergenic - - 6 529147 C G synonymous Rv0440 T180T 6 532927 G C intergenic - - 5 534205 G A synonymous Rv0445c R64R modern 534427 A T intergenic - - 5 536070 G A synonymous Rv0447c R146R 6 538762 G A synonymous Rv0450c L910L 5 539019 C T nonsynonymous Rv0450c H825Y 2 542014 C G intergenic - - 4 546357 C T synonymous Rv0456c T149T 6 547013 G A intergenic - - 3 548326 A G nonsynonymous Rv0457c T428A 1 549251 G A stopgain Rv0457c W119X 5 554297 C T synonymous Rv0463 D94D 5 554493 G T synonymous Rv0464c A131A 5 555621 A C nonsynonymous Rv0465c K229T 1 555945 A G nonsynonymous Rv0465c Q121R 4 555991 C T nonsynonymous Rv0465c R106C 1 556035 C A nonsynonymous Rv0465c P91Q 6 556089 T C nonsynonymous Rv0465c V73A 6 556201 A G nonsynonymous Rv0465c N36D 5 558750 C T synonymous Rv0467 T408T 1 560664 C T synonymous Rv0469 N259N 1 560666 A G nonsynonymous Rv0469 K260R 6 560857 G C synonymous Rv0470c L285L 3 562064 G C nonsynonymous Rv0470A W77C 3 562066 T C nonsynonymous Rv0470A W77R 5 562322 A C nonsynonymous Rv0471c E131A 5 563965 C T synonymous Rv0473 G134G 1 564723 C T nonsynonymous Rv0473 T387M modern 565404 T G synonymous Rv0474 R128R 1 568693 C A nonsynonymous Rv0479c A92E 5 569841 C T intergenic - - 5 573190 C T synonymous Rv0484c G204G modern 573384 C A nonsynonymous Rv0484c L140I 3 579284 T C intergenic - - 1 580336 C A synonymous Rv0490 R330R 6 580576 C T stopgain Rv0490 R410X 4 584171 G A nonsynonymous Rv0493c G174S modern 584511 A C synonymous Rv0493c T60T 5 588160 G T nonsynonymous Rv0497 A262S

Appendix B. Lineage-specific SNPs
220
5 588733 C G nonsynonymous Rv0498 P137A 5 589808 A C nonsynonymous Rv0499 D209A 6 590622 C G synonymous Rv0500 G180G modern 590763 C G nonsynonymous Rv0500 D227E 5 591470 G A intergenic - - 1 591965 G A synonymous Rv0501 A104A 6 592494 G A nonsynonymous Rv0501 G281R 1 595501 C T nonsynonymous Rv0505c A362V 6 598244 C T nonsynonymous Rv0507 T349I 6 598723 G T nonsynonymous Rv0507 D509Y 6 599363 C G nonsynonymous Rv0507 S722C 4 599868 G A synonymous Rv0507 R890R 5 601315 G A nonsynonymous Rv0509 R292H 5 609003 C G nonsynonymous Rv0517 I86M 5 610787 G A synonymous Rv0518 E200E 6 611373 A G synonymous Rv0519c Q234Q 3 611977 G A nonsynonymous Rv0519c G33D 5 613957 G T nonsynonymous Rv0522 R307L 1 615938 G A synonymous Rv0524 E368E 1 621390 G A nonsynonymous Rv0530 V162I 5 622361 G A synonymous Rv0531 R11R 1 627350 C G nonsynonymous Rv0536 P35A 2 627485 G A nonsynonymous Rv0536 V80I 2 628864 A G nonsynonymous Rv0537c T290A 6 628906 C T synonymous Rv0537c L276L 3 629714 C T synonymous Rv0537c D6D 6 630018 A G intergenic - - 6 631296 G A synonymous Rv0538 P419P 3 635139 C G synonymous Rv0542c G122G 5 635775 G A nonsynonymous Rv0543c R34H 6 640129 C T intergenic - - 2 640954 A G intergenic - - 1 643483 G A nonsynonymous Rv0552 G199S 6 644439 C T synonymous Rv0552 A517A 5 644472 T C synonymous Rv0552 G528G 5 646048 C G synonymous Rv0554 P194P 1 646531 A T synonymous Rv0555 T78T 5 648756 C T nonsynonymous Rv0557 T74M 4 648856 C T synonymous Rv0557 G107G 1 649345 C T synonymous Rv0557 A270A 5 649446 G A nonsynonymous Rv0557 G304D 3 652950 T C synonymous Rv0562 R60R 6 654603 A G nonsynonymous Rv0563 E242G 6 655382 A G nonsynonymous Rv0564c T190A 1 655707 C T synonymous Rv0564c V81V 4 655986 G T intergenic - - 6 656432 G A nonsynonymous Rv0565c G347S 2 657142 G A nonsynonymous Rv0565c R110H modern 657578 C T synonymous Rv0566c D154D 6 658923 C G nonsynonymous Rv0567 F201L 6 659019 C T synonymous Rv0567 D233D 4 659341 C T intergenic - - 5 660153 T G nonsynonymous Rv0568 L235R

Appendix B. Lineage-specific SNPs
221
4 662911 C T synonymous Rv0570 A539A 5 666713 T G nonsynonymous Rv0573c L177R 5 667950 C T stopgain Rv0574c Q149X 6 669225 A G nonsynonymous Rv0575c Y174C 6 669231 A C nonsynonymous Rv0575c E172A 5 669406 G A nonsynonymous Rv0575c E114K 4 670545 A G nonsynonymous Rv0576 H233R 1 678440 G A synonymous Rv0583c T212T 5 678934 G T nonsynonymous Rv0583c A48S modern 684290 G A intergenic - - 3 684376 T C intergenic - - 1 685955 G A nonsynonymous Rv0588 A10T 3 686123 C A nonsynonymous Rv0588 L66M 5 686146 C T synonymous Rv0588 G73G 6 687074 C T nonsynonymous Rv0589 P85L 6 688260 G A nonsynonymous Rv0590 V77I modern 690248 A C nonsynonymous Rv0591 N397T 4 690450 C A synonymous Rv0591 A464A 2 696917 G T intergenic - - 5 697196 C T synonymous Rv0598c D124D modern 700776 C T nonsynonymous Rv0604 P180S 1 704997 C T stopgain Rv0610c Q305X modern 705602 G A nonsynonymous Rv0610c S103N 6 705988 G C nonsynonymous Rv0611c E119D 2 707334 A G nonsynonymous Rv0613c T728A 3 708056 A G nonsynonymous Rv0613c H487R 5 708263 T C nonsynonymous Rv0613c L418S 6 709150 C T synonymous Rv0613c D122D 4 713310 C T nonsynonymous Rv0620 R199C 6 713802 C T nonsynonymous Rv0620 R363C modern 715266 G A stopgain Rv0621 W355X 6 717062 C T intergenic - - 5 717558 C G synonymous Rv0625c G112G modern 717588 C T synonymous Rv0625c V102V 1 720863 C A synonymous Rv0629c A290A 1 722852 C T nonsynonymous Rv0630c P721L 1 726498 G T synonymous Rv0631c L603L 5 728532 A C intergenic - - 6 729114 C T synonymous Rv0632c G55G 3 729685 G A nonsynonymous Rv0633c R161Q 1 730087 C T nonsynonymous Rv0633c A27V 5 731750 G C nonsynonymous Rv0634B L13F 1 734116 T C nonsynonymous Rv0638 M127T 5 735135 G A nonsynonymous Rv0640 M38I 6 735252 C T synonymous Rv0640 A77A 6 736919 C A nonsynonymous Rv0642c F95L 6 738820 G T nonsynonymous Rv0644c R114L 5 738899 G A nonsynonymous Rv0644c V88I 5 740038 C G synonymous Rv0645c A50A 6 742633 G A intergenic - - 5 745835 C G synonymous Rv0648 G1039G 1 749968 T C intergenic - - 1 752046 C T nonsynonymous Rv0655 A177V

Appendix B. Lineage-specific SNPs
222
3 753174 G T nonsynonymous Rv0656c W65L 1 753668 C T intergenic - - 1 754387 C T nonsynonymous Rv0658c T8I 6 754754 C T synonymous Rv0659c R80R 2 757139 C A nonsynonymous Rv0663 R335S 4 757182 G A nonsynonymous Rv0663 G349D 3 759746 C T intergenic - - 6 760969 C T nonsynonymous Rv0667 S388L 6 761723 A C nonsynonymous Rv0667 E639D 3 762434 T G synonymous Rv0667 G876G 4 763031 C T synonymous Rv0667 A1075A 1 763884 C T nonsynonymous Rv0668 A172V 1 763886 C A synonymous Rv0668 R173R 3 767339 A G intergenic - - 1 767609 A G intergenic - - 5 769406 G A synonymous Rv0669c L64L 6 772596 T C synonymous Rv0672 R371R 5 773021 G A nonsynonymous Rv0672 R513Q 4 776100 T C nonsynonymous Rv0676c I794T 6 781075 G C nonsynonymous Rv0681 A119P 1 786137 A C intergenic - - 3 788615 G C nonsynonymous Rv0688 G226R 1 797597 C T nonsynonymous Rv0697 T222M 2 798355 G C nonsynonymous Rv0697 A475P 3 798779 T C intergenic - - 3 798934 C A synonymous Rv0698 R34R 1 800357 C A intergenic - - 5 801959 C T synonymous Rv0702 R166R 6 807012 G T nonsynonymous Rv0711 W226C 3 807405 C T synonymous Rv0711 S357S 1 810287 C G synonymous Rv0713 T114T 1 811492 C G synonymous Rv0714 V40V 2 811753 C T synonymous Rv0715 H4H 1 812502 C T synonymous Rv0716 V148V modern 815236 C T nonsynonymous Rv0723 T16I modern 815851 G A synonymous Rv0724 R63R 6 816732 G A nonsynonymous Rv0724 S357N 6 816862 G T synonymous Rv0724 V400V 5 817489 T C synonymous Rv0724 T609T 1 817696 C T nonsynonymous Rv0725c P250L 1 819213 A G nonsynonymous Rv0726c E143G 3 820734 T C nonsynonymous Rv0728c V248A 4 820752 A G nonsynonymous Rv0728c H242R modern 821907 C T nonsynonymous Rv0729 P134L 1 829719 G A intergenic - - modern 832246 G A synonymous Rv0740 Q157Q 3 834857 G A nonsynonymous Rv0744c M30I 6 841095 T G nonsynonymous Rv0748 V50G 5 841139 C T synonymous Rv0748 L65L 1 841494 C G synonymous Rv0749 L89L 1 841495 A G nonsynonymous Rv0749 M90V 6 841629 G T synonymous Rv0749 S134S 6 843751 G T nonsynonymous Rv0752c A222S

Appendix B. Lineage-specific SNPs
223
4 847995 C T intergenic - - 5 850047 C T intergenic - - 1 850985 T C nonsynonymous Rv0756c I161T 6 851104 G A synonymous Rv0756c A121A 6 851562 G A intergenic - - 3 857643 G C nonsynonymous Rv0764c G132A 3 858464 T C nonsynonymous Rv0765c V134A 5 861279 A C nonsynonymous Rv0768 E123A 6 862664 C T synonymous Rv0769 L85L 5 863975 G T synonymous Rv0770 R240R 1 865761 C T synonymous Rv0772 H392H 6 866448 G A synonymous Rv0773c T314T 6 867745 A G nonsynonymous Rv0774c T203A 5 869036 C T nonsynonymous Rv0776c T243I modern 871271 C A nonsynonymous Rv0777 P422T 5 872863 A C nonsynonymous Rv0779c T144P 5 883072 C T nonsynonymous Rv0788 R105C 1 885689 C A nonsynonymous Rv0791c T51K 6 886178 C A nonsynonymous Rv0792c L157I 5 892659 C T synonymous Rv0799c T205T modern 894888 C T synonymous Rv0801 S86S 1 895082 T C nonsynonymous Rv0802c F183L 1 895120 G A nonsynonymous Rv0802c R170H 3 896979 T C nonsynonymous Rv0803 V387A 6 900065 C A synonymous Rv0806c T422T 6 901327 C G nonsynonymous Rv0806c P2A 5 901358 G A intergenic - - 5 904367 G C nonsynonymous Rv0809 D215H 5 905344 G T nonsynonymous Rv0811c G333C 3 906742 T C nonsynonymous Rv0812 V107A 5 907906 G A nonsynonymous Rv0813c R38H 5 908033 G C intergenic - - 1 910015 G T nonsynonymous Rv0816c A7S 5 910282 C A synonymous Rv0817c S187S modern 911261 C T nonsynonymous Rv0818 P97L modern 913274 G C synonymous Rv0820 S183S modern 916046 C A nonsynonymous Rv0822c P89H 6 916350 G A intergenic - - 6 916714 C A synonymous Rv0823c L311L 6 917259 G T nonsynonymous Rv0823c G130C 5 919007 T G nonsynonymous Rv0825c C183G 6 919382 T C nonsynonymous Rv0825c F58L 6 919384 A G nonsynonymous Rv0825c Y57C 3 919551 G A synonymous Rv0825c V1V 6 920333 C T nonsynonymous Rv0826 P234S 5 921429 C T nonsynonymous Rv0828c P62L 4 931123 C T synonymous Rv0835 Y57Y 6 932252 C A intergenic - - 4 932280 G A stopgain Rv0836c W218X modern 933699 A C synonymous Rv0837c G111G 4 934230 G C intergenic - - 4 934611 T G intergenic - - 6 937614 C A nonsynonymous Rv0841 H8N

Appendix B. Lineage-specific SNPs
224
modern 938246 G A synonymous Rv0842 L45L 2 940602 G C nonsynonymous Rv0844c G169R 6 941054 C T nonsynonymous Rv0844c P18L 4 941845 A C nonsynonymous Rv0845 E219A 5 941849 A C nonsynonymous Rv0845 E220D 3 942616 C A intergenic - - 6 944725 C T nonsynonymous Rv0847 A128V 3 945238 G T nonsynonymous Rv0848 A101S modern 948294 G A nonsynonymous Rv0851c G59S 3 950116 G C nonsynonymous Rv0853c A335P modern 951142 A C intergenic - - 1 952597 C T synonymous Rv0855 I322I 5 954131 G A nonsynonymous Rv0858c V264M 5 955631 C T synonymous Rv0859 G185G 3 957306 C T synonymous Rv0860 A338A 6 959369 G A synonymous Rv0861c S261S 4 960367 C T nonsynonymous Rv0862c S749L 6 962133 C A nonsynonymous Rv0862c D160E 5 964400 C A nonsynonymous Rv0867c T379K 3 964969 A G synonymous Rv0867c A189A 5 965648 G T intergenic - - 6 972484 C T intergenic - - 2 972980 G A nonsynonymous Rv0874c G243S 6 975915 G C nonsynonymous Rv0876c R8P 1 976043 G T intergenic - - 6 982363 C A synonymous Rv0884c G64G 1 987601 C T synonymous Rv0888 G123G 6 988043 T C nonsynonymous Rv0888 Y271H 5 991740 A G nonsynonymous Rv0890c Q286R 3 991939 C T nonsynonymous Rv0890c R220C 6 994678 C G nonsynonymous Rv0892 L276V 1 996219 C T nonsynonymous Rv0893c A26V 3 996263 C T synonymous Rv0893c T11T 6 996284 G A synonymous Rv0893c E4E 6 1000732 A G nonsynonymous Rv0896 T421A 3 1002172 C T nonsynonymous Rv0897c R82W 1 1002342 A G nonsynonymous Rv0897c Y25C 5 1004177 A C nonsynonymous Rv0901 E74A 3 1007198 T C nonsynonymous Rv0904c L328P 6 1007708 G A nonsynonymous Rv0904c G158E 3 1008460 C T nonsynonymous Rv0905 S85F 1 1009490 C T stopgain Rv0906 Q183X 3 1009500 C T nonsynonymous Rv0906 P186L 6 1009957 G A synonymous Rv0906 L338L 3 1012815 C G nonsynonymous Rv0908 A362G 6 1013635 C T synonymous Rv0908 V635V modern 1014815 G T nonsynonymous Rv0909 Q45H 2 1022003 A C intergenic - - 1 1022613 G A nonsynonymous Rv0917 R176Q 3 1023911 C G intergenic - - 4 1024346 G A nonsynonymous Rv0918 G46S 5 1025135 T C nonsynonymous Rv0919 L151P 3 1029586 C T nonsynonymous Rv0923c P331L

Appendix B. Lineage-specific SNPs
225
1 1029997 T C nonsynonymous Rv0923c V194A 1 1032524 A G nonsynonymous Rv0925c D37G 6 1034238 T C synonymous Rv0927c L132L 3 1034381 C T nonsynonymous Rv0927c A84V 5 1038813 C T nonsynonymous Rv0931c H368Y modern 1040706 G T nonsynonymous Rv0932c A115S 1 1043136 C T nonsynonymous Rv0934 T341I 6 1043169 T C nonsynonymous Rv0934 V352A 1 1048102 G A nonsynonymous Rv0938 R656H 6 1049460 A T nonsynonymous Rv0939 D350V 5 1050523 G T intergenic - - 5 1053653 G A synonymous Rv0943c R28R 6 1054136 C T synonymous Rv0944 T124T 4 1054784 G C nonsynonymous Rv0945 G180R 5 1058309 A G nonsynonymous Rv0949 D17G 1 1061386 A G nonsynonymous Rv0950c E90G modern 1063765 A G nonsynonymous Rv0952 K209R 1 1063922 C T synonymous Rv0952 G261G 1 1066038 A G synonymous Rv0954 *304* 6 1069146 C T synonymous Rv0957 G314G 3 1071349 G C nonsynonymous Rv0959 G32A 1 1072342 A G nonsynonymous Rv0959 D363G 1 1075169 A G intergenic - - 5 1077102 G A synonymous Rv0965c A32A 1 1077754 G A nonsynonymous Rv0966c A28T 4 1080192 A G nonsynonymous Rv0969 N484D 1 1083755 T C nonsynonymous Rv0973c S666P 1 1086648 G T nonsynonymous Rv0974c R233L 6 1095053 G T nonsynonymous Rv0979A K56N modern 1097023 A G nonsynonymous Rv0981 S70G 5 1097633 C T synonymous Rv0982 A42A 4 1098523 A T nonsynonymous Rv0982 H339L 2 1102468 C A synonymous Rv0986 G222G 5 1104499 A G nonsynonymous Rv0987 D653G 4 1104690 G T nonsynonymous Rv0987 V717F modern 1105284 A G nonsynonymous Rv0988 I57V 5 1105557 G T nonsynonymous Rv0988 A148S 3 1106099 C T synonymous Rv0988 I328I 5 1107024 A G nonsynonymous Rv0989c D120G 6 1107897 C T nonsynonymous Rv0990c A68V 4 1107940 G T nonsynonymous Rv0990c A54S modern 1109163 C G nonsynonymous Rv0992c I3M 3 1110721 T C synonymous Rv0994 R151R modern 1110956 G T nonsynonymous Rv0994 G230C 1 1111518 T C nonsynonymous Rv0994 V417A 3 1111852 G T nonsynonymous Rv0995 D81Y modern 1113290 C G nonsynonymous Rv0996 Q303E 5 1114129 T G intergenic - - 6 1117308 C T synonymous Rv1001 L42L 1 1117405 C T nonsynonymous Rv1001 T74I 6 1118270 A G synonymous Rv1001 V362V 6 1119597 G C nonsynonymous Rv1002c V115L 1 1119739 G A synonymous Rv1002c L67L

Appendix B. Lineage-specific SNPs
226
6 1122175 C G intergenic - - modern 1123597 C T nonsynonymous Rv1005c S1L modern 1131300 A G nonsynonymous Rv1012 N58S 3 1139089 G C synonymous Rv1020 T41T 1 1139222 G A nonsynonymous Rv1020 A86T 5 1139497 C T synonymous Rv1020 T177T 5 1141069 G T synonymous Rv1020 A701A modern 1143832 C A nonsynonymous Rv1022 P33T 3 1144409 T G nonsynonymous Rv1022 I225S 4 1144585 G A nonsynonymous Rv1023 G8R 5 1145442 C G synonymous Rv1023 G293G 4 1148259 G A intergenic - - 6 1149547 G A nonsynonymous Rv1028c A714T 6 1150490 G C synonymous Rv1028c S399S 6 1150803 G A nonsynonymous Rv1028c G295D 1 1151490 C G nonsynonymous Rv1028c T66R 3 1152805 T A nonsynonymous Rv1029 L265Q 3 1152863 A G synonymous Rv1029 Q284Q 3 1153388 C T synonymous Rv1029 N459N 6 1153920 C T nonsynonymous Rv1030 T66I 6 1154634 T C nonsynonymous Rv1030 V304A 1 1155700 C T synonymous Rv1030 I659I 5 1155819 T C nonsynonymous Rv1030 V699A 5 1156224 C T synonymous Rv1031 G124G 6 1156704 A G nonsynonymous Rv1032c T418A 1 1157771 C G nonsynonymous Rv1032c S62C 3 1164571 A G intergenic - - modern 1165521 T A intergenic - - 2 1168776 A C nonsynonymous Rv1046c R151S 2 1175343 C T intergenic - - 6 1177815 A G nonsynonymous Rv1056 D63G 1 1184826 G T nonsynonymous Rv1061 R271L 5 1186287 C A synonymous Rv1063c A179A 5 1190588 G A intergenic - - 5 1192641 C A nonsynonymous Rv1069c H545N 1 1192830 C T nonsynonymous Rv1069c R482W 5 1196194 C T intergenic - - 6 1197169 G C intergenic - - 1 1199019 A G nonsynonymous Rv1074c T119A 2 1201581 A C nonsynonymous Rv1076 Q272P 5 1203264 C T intergenic - - modern 1203824 C T nonsynonymous Rv1078 T171I 4 1211369 C A nonsynonymous Rv1086 R259S 5 1213925 C T intergenic - - 5 1215581 A C nonsynonymous Rv1089A H22P 6 1220180 C T nonsynonymous Rv1092c R3W modern 1220570 T G intergenic - - 6 1224174 C T nonsynonymous Rv1095 A393V 6 1225198 C T nonsynonymous Rv1096 P272S 6 1226021 C A nonsynonymous Rv1097c Q42K 1 1228116 T C nonsynonymous Rv1099c I156T 4 1230778 T C nonsynonymous Rv1102c I65T 5 1232089 C T intergenic - -
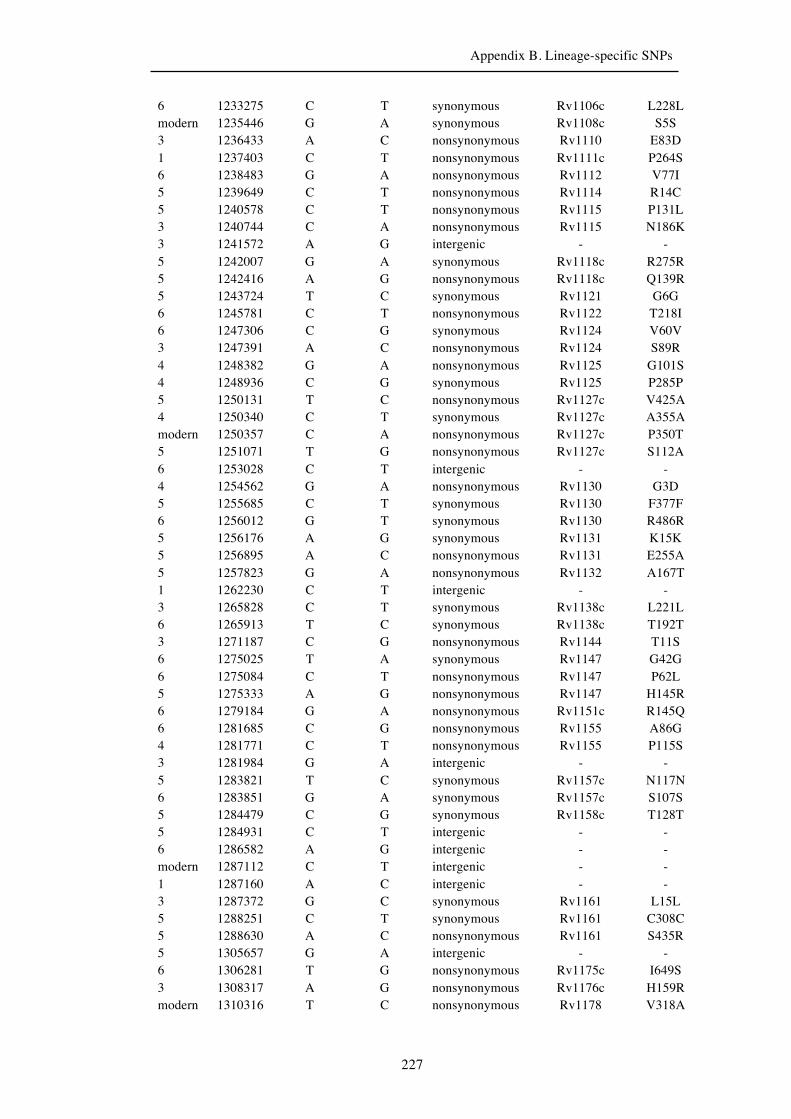
Appendix B. Lineage-specific SNPs
227
6 1233275 C T synonymous Rv1106c L228L modern 1235446 G A synonymous Rv1108c S5S 3 1236433 A C nonsynonymous Rv1110 E83D 1 1237403 C T nonsynonymous Rv1111c P264S 6 1238483 G A nonsynonymous Rv1112 V77I 5 1239649 C T nonsynonymous Rv1114 R14C 5 1240578 C T nonsynonymous Rv1115 P131L 3 1240744 C A nonsynonymous Rv1115 N186K 3 1241572 A G intergenic - - 5 1242007 G A synonymous Rv1118c R275R 5 1242416 A G nonsynonymous Rv1118c Q139R 5 1243724 T C synonymous Rv1121 G6G 6 1245781 C T nonsynonymous Rv1122 T218I 6 1247306 C G synonymous Rv1124 V60V 3 1247391 A C nonsynonymous Rv1124 S89R 4 1248382 G A nonsynonymous Rv1125 G101S 4 1248936 C G synonymous Rv1125 P285P 5 1250131 T C nonsynonymous Rv1127c V425A 4 1250340 C T synonymous Rv1127c A355A modern 1250357 C A nonsynonymous Rv1127c P350T 5 1251071 T G nonsynonymous Rv1127c S112A 6 1253028 C T intergenic - - 4 1254562 G A nonsynonymous Rv1130 G3D 5 1255685 C T synonymous Rv1130 F377F 6 1256012 G T synonymous Rv1130 R486R 5 1256176 A G synonymous Rv1131 K15K 5 1256895 A C nonsynonymous Rv1131 E255A 5 1257823 G A nonsynonymous Rv1132 A167T 1 1262230 C T intergenic - - 3 1265828 C T synonymous Rv1138c L221L 6 1265913 T C synonymous Rv1138c T192T 3 1271187 C G nonsynonymous Rv1144 T11S 6 1275025 T A synonymous Rv1147 G42G 6 1275084 C T nonsynonymous Rv1147 P62L 5 1275333 A G nonsynonymous Rv1147 H145R 6 1279184 G A nonsynonymous Rv1151c R145Q 6 1281685 C G nonsynonymous Rv1155 A86G 4 1281771 C T nonsynonymous Rv1155 P115S 3 1281984 G A intergenic - - 5 1283821 T C synonymous Rv1157c N117N 6 1283851 G A synonymous Rv1157c S107S 5 1284479 C G synonymous Rv1158c T128T 5 1284931 C T intergenic - - 6 1286582 A G intergenic - - modern 1287112 C T intergenic - - 1 1287160 A C intergenic - - 3 1287372 G C synonymous Rv1161 L15L 5 1288251 C T synonymous Rv1161 C308C 5 1288630 A C nonsynonymous Rv1161 S435R 5 1305657 G A intergenic - - 6 1306281 T G nonsynonymous Rv1175c I649S 3 1308317 A G nonsynonymous Rv1176c H159R modern 1310316 T C nonsynonymous Rv1178 V318A

Appendix B. Lineage-specific SNPs
228
5 1313128 C A synonymous Rv1179c R58R 5 1313131 C A nonsynonymous Rv1179c R57S 6 1313726 T C nonsynonymous Rv1180 V1A 6 1314261 G A synonymous Rv1180 S179S 1 1314617 C T nonsynonymous Rv1180 A298V 5 1316651 A G nonsynonymous Rv1181 Q473R 2 1317655 C T synonymous Rv1181 L808L 6 1318990 C T nonsynonymous Rv1181 L1253F 1 1320508 G A synonymous Rv1182 V158V 1 1320614 C G nonsynonymous Rv1182 L194V 3 1325650 G A intergenic - - 2 1329234 C T synonymous Rv1186c D24D 5 1331789 C T nonsynonymous Rv1188 R257C 3 1340784 T C synonymous Rv1197 G42G modern 1341040 A C nonsynonymous Rv1198 D12A 1 1344857 G A nonsynonymous Rv1201c G105S 3 1345016 G A nonsynonymous Rv1201c A52T 6 1347173 G A synonymous Rv1204c L484L 6 1347264 C T nonsynonymous Rv1204c T454M 1 1348520 G T synonymous Rv1204c L35L 1 1348521 T C nonsynonymous Rv1204c L35P 4 1351172 G A intergenic - - 5 1352566 C T synonymous Rv1208 H141H 6 1355937 C T synonymous Rv1213 F34F 1 1356648 C T synonymous Rv1213 D271D 5 1358934 A C nonsynonymous Rv1215c S171R modern 1358940 T G nonsynonymous Rv1215c S169A 5 1359908 T G nonsynonymous Rv1216c V80G 5 1360604 G A nonsynonymous Rv1217c V400I 6 1366736 T C nonsynonymous Rv1223 F288L 6 1367208 G A nonsynonymous Rv1223 S445N 4 1367484 G T nonsynonymous Rv1224 G8W 6 1368133 G T nonsynonymous Rv1225c A197S modern 1368947 C T nonsynonymous Rv1226c A450V 1 1369389 G A nonsynonymous Rv1226c G303S 1 1369735 C T synonymous Rv1226c Y187Y 3 1371470 G A nonsynonymous Rv1228 R184H 6 1372002 G A synonymous Rv1229c L316L 5 1372975 C G nonsynonymous Rv1230c A408G 6 1373576 T C nonsynonymous Rv1230c W208R 1 1374578 G A nonsynonymous Rv1231c R96H 1 1374639 A T nonsynonymous Rv1231c N76Y 6 1375349 G T nonsynonymous Rv1232c G274W 5 1377185 C G synonymous Rv1234 L70L 3 1377568 A G synonymous Rv1235 V15V 5 1383185 A C intergenic - - 5 1383970 A C nonsynonymous Rv1240 D253A 6 1384188 C A nonsynonymous Rv1240 L326I 6 1384255 G T intergenic - - 1 1387211 G A nonsynonymous Rv1244 A119T 6 1387580 C A nonsynonymous Rv1244 Q242K 6 1388517 G A nonsynonymous Rv1245c V38I 1 1389866 G A nonsynonymous Rv1248c G1063S

Appendix B. Lineage-specific SNPs
229
6 1390089 G A synonymous Rv1248c A988A 4 1390763 A G nonsynonymous Rv1248c M764V 6 1391728 G A nonsynonymous Rv1248c R442H modern 1395010 G A nonsynonymous Rv1250 G278R 3 1396618 G T stopgain Rv1251c E875X modern 1397201 C T synonymous Rv1251c N680N 1 1397215 G C nonsynonymous Rv1251c G676R 5 1397633 G A synonymous Rv1251c K536K modern 1400396 G A nonsynonymous Rv1253 V143M 3 1401033 C T nonsynonymous Rv1253 S355L 5 1403266 G C nonsynonymous Rv1255c A41P 6 1404738 C T synonymous Rv1257c L449L 6 1406685 T C nonsynonymous Rv1258c V219A 5 1407273 A T nonsynonymous Rv1258c D23V modern 1410062 G C nonsynonymous Rv1262c R104P 5 1413242 G T intergenic - - 6 1414870 C T nonsynonymous Rv1266c T324I 6 1416633 C G nonsynonymous Rv1267c L239V 1 1417019 G A nonsynonymous Rv1267c C110Y modern 1417554 C G intergenic - - 1 1417793 C T synonymous Rv1268c T188T 5 1419373 A G nonsynonymous Rv1270c T126A 5 1422079 G C nonsynonymous Rv1272c R76P 3 1422666 G A nonsynonymous Rv1273c G462E 3 1422667 G A nonsynonymous Rv1273c G462R modern 1424699 C T nonsynonymous Rv1274 P168L 1 1426928 C T synonymous Rv1277 F255F 5 1436284 T C synonymous Rv1283c G278G 6 1438981 C T synonymous Rv1286 L25L 3 1440090 C T nonsynonymous Rv1286 T395I 3 1441545 G A synonymous Rv1288 A66A 6 1442734 C G intergenic - - 1 1443354 C T synonymous Rv1289 A196A 1 1445977 C T intergenic - - 3 1450316 C T synonymous Rv1294 A314A 6 1452717 C T nonsynonymous Rv1296 P241S 6 1453680 C T synonymous Rv1297 T159T 6 1454811 C T synonymous Rv1297 N536N modern 1458144 A C nonsynonymous Rv1301 Q196P 6 1461251 G T synonymous Rv1305 A69A 5 1463143 C T nonsynonymous Rv1307 S434L 5 1465542 A C nonsynonymous Rv1309 Y220S 6 1467735 G A synonymous Rv1312 G16G 3 1478357 C A synonymous Rv1317c P254P 4 1479085 G A nonsynonymous Rv1317c V12I 1 1480972 A G synonymous Rv1319c E510E 5 1481038 G A synonymous Rv1319c L488L 3 1481563 G A synonymous Rv1319c E313E 5 1482978 G A nonsynonymous Rv1320c A414T 6 1486647 G C nonsynonymous Rv1323 Q262H 5 1487674 G A nonsynonymous Rv1324 A172T 6 1490140 G A nonsynonymous Rv1326c A725T 4 1490905 C T nonsynonymous Rv1326c P470S
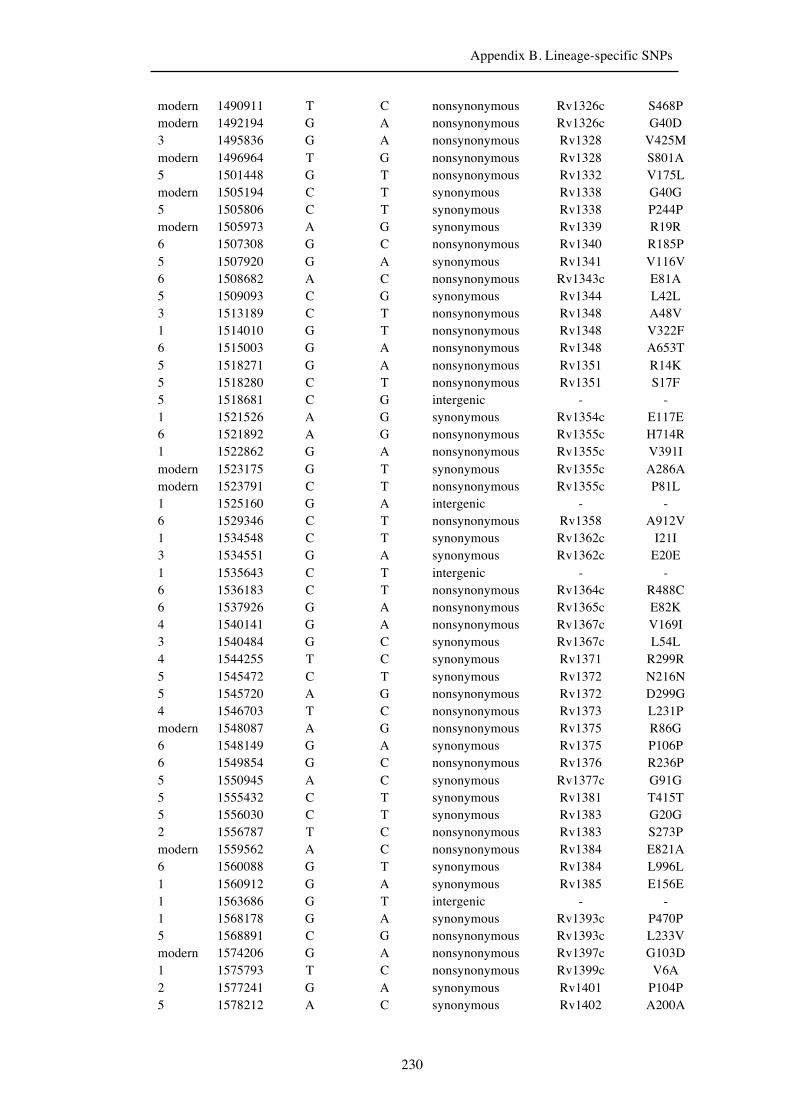
Appendix B. Lineage-specific SNPs
230
modern 1490911 T C nonsynonymous Rv1326c S468P modern 1492194 G A nonsynonymous Rv1326c G40D 3 1495836 G A nonsynonymous Rv1328 V425M modern 1496964 T G nonsynonymous Rv1328 S801A 5 1501448 G T nonsynonymous Rv1332 V175L modern 1505194 C T synonymous Rv1338 G40G 5 1505806 C T synonymous Rv1338 P244P modern 1505973 A G synonymous Rv1339 R19R 6 1507308 G C nonsynonymous Rv1340 R185P 5 1507920 G A synonymous Rv1341 V116V 6 1508682 A C nonsynonymous Rv1343c E81A 5 1509093 C G synonymous Rv1344 L42L 3 1513189 C T nonsynonymous Rv1348 A48V 1 1514010 G T nonsynonymous Rv1348 V322F 6 1515003 G A nonsynonymous Rv1348 A653T 5 1518271 G A nonsynonymous Rv1351 R14K 5 1518280 C T nonsynonymous Rv1351 S17F 5 1518681 C G intergenic - - 1 1521526 A G synonymous Rv1354c E117E 6 1521892 A G nonsynonymous Rv1355c H714R 1 1522862 G A nonsynonymous Rv1355c V391I modern 1523175 G T synonymous Rv1355c A286A modern 1523791 C T nonsynonymous Rv1355c P81L 1 1525160 G A intergenic - - 6 1529346 C T nonsynonymous Rv1358 A912V 1 1534548 C T synonymous Rv1362c I21I 3 1534551 G A synonymous Rv1362c E20E 1 1535643 C T intergenic - - 6 1536183 C T nonsynonymous Rv1364c R488C 6 1537926 G A nonsynonymous Rv1365c E82K 4 1540141 G A nonsynonymous Rv1367c V169I 3 1540484 G C synonymous Rv1367c L54L 4 1544255 T C synonymous Rv1371 R299R 5 1545472 C T synonymous Rv1372 N216N 5 1545720 A G nonsynonymous Rv1372 D299G 4 1546703 T C nonsynonymous Rv1373 L231P modern 1548087 A G nonsynonymous Rv1375 R86G 6 1548149 G A synonymous Rv1375 P106P 6 1549854 G C nonsynonymous Rv1376 R236P 5 1550945 A C synonymous Rv1377c G91G 5 1555432 C T synonymous Rv1381 T415T 5 1556030 C T synonymous Rv1383 G20G 2 1556787 T C nonsynonymous Rv1383 S273P modern 1559562 A C nonsynonymous Rv1384 E821A 6 1560088 G T synonymous Rv1384 L996L 1 1560912 G A synonymous Rv1385 E156E 1 1563686 G T intergenic - - 1 1568178 G A synonymous Rv1393c P470P 5 1568891 C G nonsynonymous Rv1393c L233V modern 1574206 G A nonsynonymous Rv1397c G103D 1 1575793 T C nonsynonymous Rv1399c V6A 2 1577241 G A synonymous Rv1401 P104P 5 1578212 A C synonymous Rv1402 A200A

Appendix B. Lineage-specific SNPs
231
1 1580181 C T nonsynonymous Rv1403c P81L 1 1581377 G A nonsynonymous Rv1405c G198D 6 1581727 C T synonymous Rv1405c P81P modern 1584379 C A nonsynonymous Rv1407 L427I 5 1585032 C T synonymous Rv1408 V178V modern 1585283 C A nonsynonymous Rv1409 N30K modern 1585404 A G nonsynonymous Rv1409 T71A 6 1585900 C T nonsynonymous Rv1409 P236L 1 1589739 C T synonymous Rv1413 G118G 1 1590555 C T synonymous Rv1415 T53T 5 1591039 G A nonsynonymous Rv1415 A215T 5 1593536 T C nonsynonymous Rv1419 L11P 6 1593652 G A nonsynonymous Rv1419 A50T 5 1593762 C A synonymous Rv1419 P86P 5 1593762 C T synonymous Rv1419 P86P 6 1598404 C A nonsynonymous Rv1423 L167I 3 1599557 G C nonsynonymous Rv1424c R33T modern 1600685 T C nonsynonymous Rv1425 L343P 1 1601528 G A nonsynonymous Rv1426c C265Y 5 1601722 G A synonymous Rv1426c P200P 5 1603637 A G nonsynonymous Rv1427c N98D 1 1604290 T A nonsynonymous Rv1428c V157D 5 1605016 C T synonymous Rv1429 L47L 5 1605569 T C nonsynonymous Rv1429 V231A 4 1608276 C A nonsynonymous Rv1431 T65N 5 1611024 C T synonymous Rv1432 T392T modern 1611283 C T intergenic - - 3 1614143 G A synonymous Rv1436 L279L 1 1616831 A G intergenic - - 1 1617833 C T intergenic - - 6 1620178 A C nonsynonymous Rv1442 M130L 6 1620179 T C nonsynonymous Rv1442 M130T 1 1625259 T G nonsynonymous Rv1446c I36S 6 1629058 C T nonsynonymous Rv1449c S381L modern 1639418 G A synonymous Rv1453 L346L modern 1639643 C T synonymous Rv1453 R421R 5 1639699 T G nonsynonymous Rv1454c V321G modern 1640442 A G synonymous Rv1454c G73G 2 1643864 A G nonsynonymous Rv1458c T133A 1 1644250 C G nonsynonymous Rv1458c A4G 6 1646982 C T nonsynonymous Rv1460 A266V 1 1647830 G A nonsynonymous Rv1461 G281D 5 1648089 G T synonymous Rv1461 L367L 5 1648224 C T synonymous Rv1461 H412H 5 1649265 G A synonymous Rv1461 L759L 3 1650406 C A nonsynonymous Rv1462 T294N 2 1651308 A G nonsynonymous Rv1463 E198G 5 1658030 C T synonymous Rv1469 I356I 1 1658535 G T nonsynonymous Rv1469 V525F 6 1659318 C T synonymous Rv1470 G113G 1 1659902 T C nonsynonymous Rv1472 V47A modern 1659994 T C nonsynonymous Rv1472 S78P 6 1662719 C G synonymous Rv1474c A162A
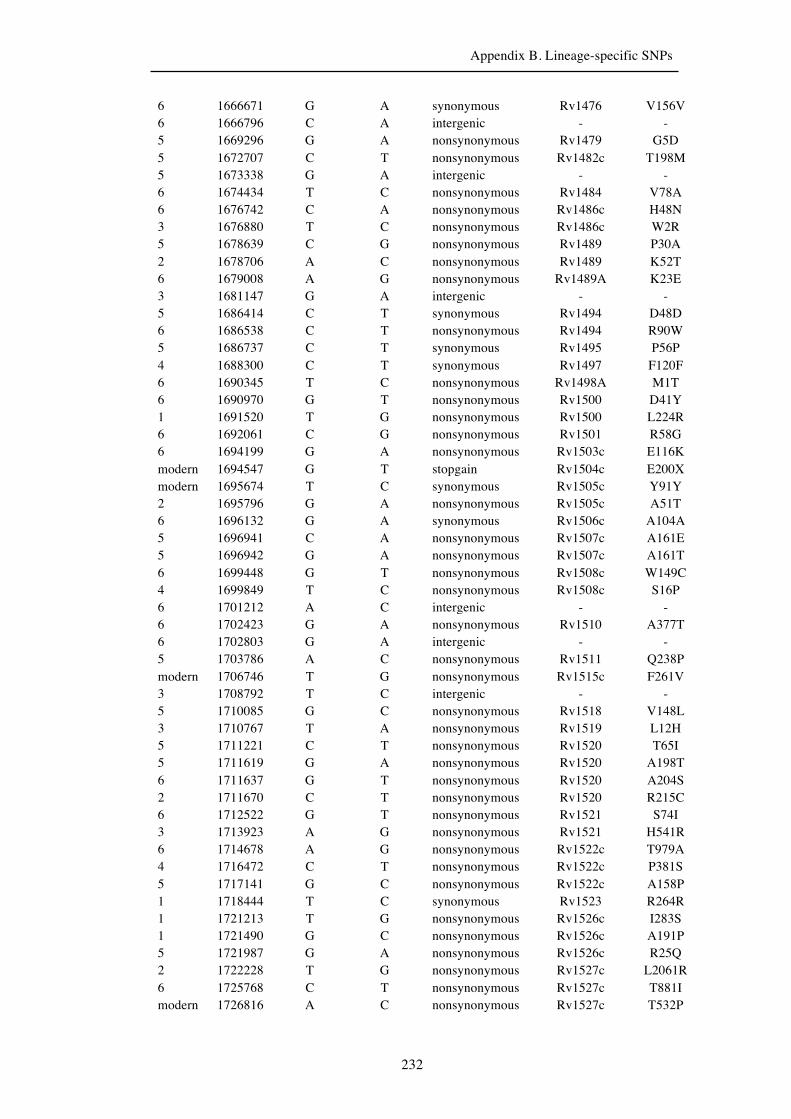
Appendix B. Lineage-specific SNPs
232
6 1666671 G A synonymous Rv1476 V156V 6 1666796 C A intergenic - - 5 1669296 G A nonsynonymous Rv1479 G5D 5 1672707 C T nonsynonymous Rv1482c T198M 5 1673338 G A intergenic - - 6 1674434 T C nonsynonymous Rv1484 V78A 6 1676742 C A nonsynonymous Rv1486c H48N 3 1676880 T C nonsynonymous Rv1486c W2R 5 1678639 C G nonsynonymous Rv1489 P30A 2 1678706 A C nonsynonymous Rv1489 K52T 6 1679008 A G nonsynonymous Rv1489A K23E 3 1681147 G A intergenic - - 5 1686414 C T synonymous Rv1494 D48D 6 1686538 C T nonsynonymous Rv1494 R90W 5 1686737 C T synonymous Rv1495 P56P 4 1688300 C T synonymous Rv1497 F120F 6 1690345 T C nonsynonymous Rv1498A M1T 6 1690970 G T nonsynonymous Rv1500 D41Y 1 1691520 T G nonsynonymous Rv1500 L224R 6 1692061 C G nonsynonymous Rv1501 R58G 6 1694199 G A nonsynonymous Rv1503c E116K modern 1694547 G T stopgain Rv1504c E200X modern 1695674 T C synonymous Rv1505c Y91Y 2 1695796 G A nonsynonymous Rv1505c A51T 6 1696132 G A synonymous Rv1506c A104A 5 1696941 C A nonsynonymous Rv1507c A161E 5 1696942 G A nonsynonymous Rv1507c A161T 6 1699448 G T nonsynonymous Rv1508c W149C 4 1699849 T C nonsynonymous Rv1508c S16P 6 1701212 A C intergenic - - 6 1702423 G A nonsynonymous Rv1510 A377T 6 1702803 G A intergenic - - 5 1703786 A C nonsynonymous Rv1511 Q238P modern 1706746 T G nonsynonymous Rv1515c F261V 3 1708792 T C intergenic - - 5 1710085 G C nonsynonymous Rv1518 V148L 3 1710767 T A nonsynonymous Rv1519 L12H 5 1711221 C T nonsynonymous Rv1520 T65I 5 1711619 G A nonsynonymous Rv1520 A198T 6 1711637 G T nonsynonymous Rv1520 A204S 2 1711670 C T nonsynonymous Rv1520 R215C 6 1712522 G T nonsynonymous Rv1521 S74I 3 1713923 A G nonsynonymous Rv1521 H541R 6 1714678 A G nonsynonymous Rv1522c T979A 4 1716472 C T nonsynonymous Rv1522c P381S 5 1717141 G C nonsynonymous Rv1522c A158P 1 1718444 T C synonymous Rv1523 R264R 1 1721213 T G nonsynonymous Rv1526c I283S 1 1721490 G C nonsynonymous Rv1526c A191P 5 1721987 G A nonsynonymous Rv1526c R25Q 2 1722228 T G nonsynonymous Rv1527c L2061R 6 1725768 C T nonsynonymous Rv1527c T881I modern 1726816 A C nonsynonymous Rv1527c T532P
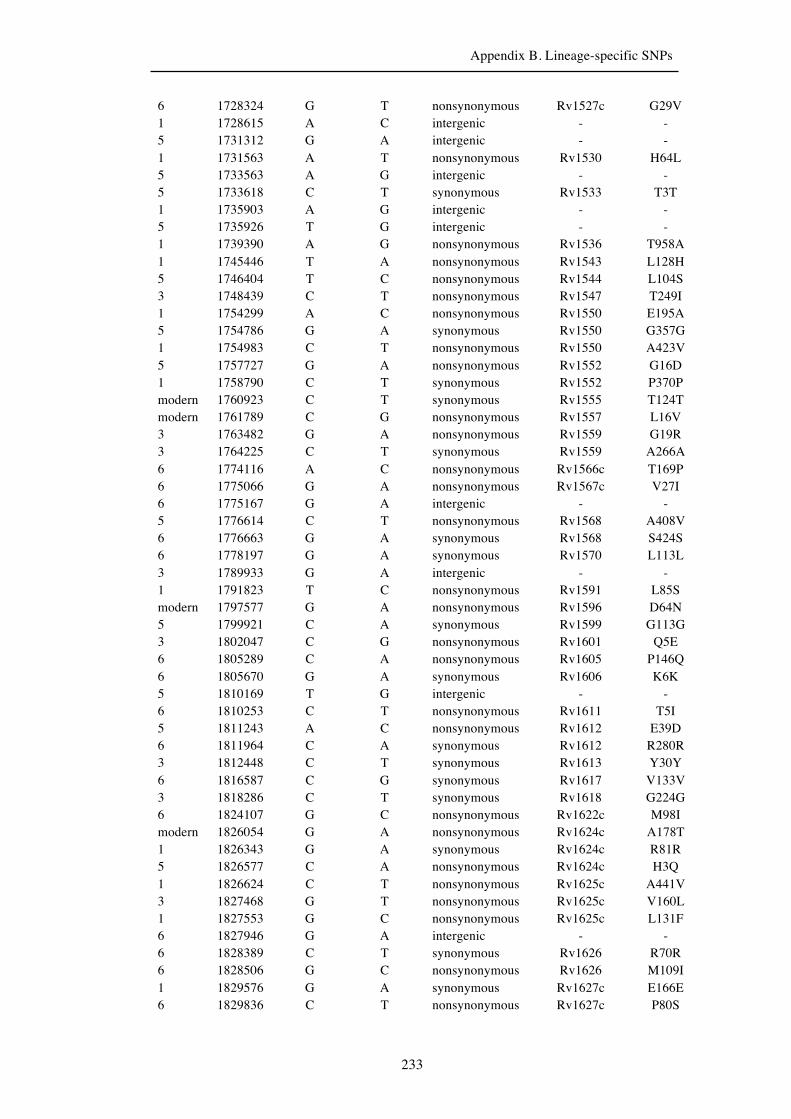
Appendix B. Lineage-specific SNPs
233
6 1728324 G T nonsynonymous Rv1527c G29V 1 1728615 A C intergenic - - 5 1731312 G A intergenic - - 1 1731563 A T nonsynonymous Rv1530 H64L 5 1733563 A G intergenic - - 5 1733618 C T synonymous Rv1533 T3T 1 1735903 A G intergenic - - 5 1735926 T G intergenic - - 1 1739390 A G nonsynonymous Rv1536 T958A 1 1745446 T A nonsynonymous Rv1543 L128H 5 1746404 T C nonsynonymous Rv1544 L104S 3 1748439 C T nonsynonymous Rv1547 T249I 1 1754299 A C nonsynonymous Rv1550 E195A 5 1754786 G A synonymous Rv1550 G357G 1 1754983 C T nonsynonymous Rv1550 A423V 5 1757727 G A nonsynonymous Rv1552 G16D 1 1758790 C T synonymous Rv1552 P370P modern 1760923 C T synonymous Rv1555 T124T modern 1761789 C G nonsynonymous Rv1557 L16V 3 1763482 G A nonsynonymous Rv1559 G19R 3 1764225 C T synonymous Rv1559 A266A 6 1774116 A C nonsynonymous Rv1566c T169P 6 1775066 G A nonsynonymous Rv1567c V27I 6 1775167 G A intergenic - - 5 1776614 C T nonsynonymous Rv1568 A408V 6 1776663 G A synonymous Rv1568 S424S 6 1778197 G A synonymous Rv1570 L113L 3 1789933 G A intergenic - - 1 1791823 T C nonsynonymous Rv1591 L85S modern 1797577 G A nonsynonymous Rv1596 D64N 5 1799921 C A synonymous Rv1599 G113G 3 1802047 C G nonsynonymous Rv1601 Q5E 6 1805289 C A nonsynonymous Rv1605 P146Q 6 1805670 G A synonymous Rv1606 K6K 5 1810169 T G intergenic - - 6 1810253 C T nonsynonymous Rv1611 T5I 5 1811243 A C nonsynonymous Rv1612 E39D 6 1811964 C A synonymous Rv1612 R280R 3 1812448 C T synonymous Rv1613 Y30Y 6 1816587 C G synonymous Rv1617 V133V 3 1818286 C T synonymous Rv1618 G224G 6 1824107 G C nonsynonymous Rv1622c M98I modern 1826054 G A nonsynonymous Rv1624c A178T 1 1826343 G A synonymous Rv1624c R81R 5 1826577 C A nonsynonymous Rv1624c H3Q 1 1826624 C T nonsynonymous Rv1625c A441V 3 1827468 G T nonsynonymous Rv1625c V160L 1 1827553 G C nonsynonymous Rv1625c L131F 6 1827946 G A intergenic - - 6 1828389 C T synonymous Rv1626 R70R 6 1828506 G C nonsynonymous Rv1626 M109I 1 1829576 G A synonymous Rv1627c E166E 6 1829836 C T nonsynonymous Rv1627c P80S

Appendix B. Lineage-specific SNPs
234
2 1831220 A C nonsynonymous Rv1629 T186P 2 1831226 A G nonsynonymous Rv1629 R188G 2 1831288 C T synonymous Rv1629 P208P 3 1832509 C G synonymous Rv1629 T615T 1 1832642 G T nonsynonymous Rv1629 G660C 1 1832643 G C nonsynonymous Rv1629 G660A 3 1833025 C T synonymous Rv1629 D787D 2 1834177 A C synonymous Rv1630 R212R 3 1836417 G T synonymous Rv1632c G138G 6 1837168 G T nonsynonymous Rv1633 A32S modern 1839260 G T synonymous Rv1634 L31L 1 1839329 G A synonymous Rv1634 R54R 4 1839759 C G nonsynonymous Rv1634 R198G 6 1840543 C T nonsynonymous Rv1634 S459F 6 1841538 G A synonymous Rv1635c A235A 5 1846092 C T synonymous Rv1638 Y784Y 6 1846552 G T nonsynonymous Rv1638 A938S 5 1846854 C T synonymous Rv1638A Y40Y 1 1848147 G T synonymous Rv1639c V104V 5 1848963 G T nonsynonymous Rv1640c D1025Y 1 1849191 A G nonsynonymous Rv1640c I949V 4 1849609 G A synonymous Rv1640c R809R 5 1849814 T C nonsynonymous Rv1640c V741A 3 1852877 A C stoplost Rv1641 X202S 5 1853565 G A nonsynonymous Rv1643 A128T 1 1853974 C T synonymous Rv1644 G123G 6 1855260 G A synonymous Rv1645c S65S 4 1859559 A C nonsynonymous Rv1649 D276A 1 1859989 C T nonsynonymous Rv1650 R78W 5 1862099 C A nonsynonymous Rv1650 T781N 6 1867707 C T synonymous Rv1653 P359P 6 1870031 A C nonsynonymous Rv1656 Q37P 5 1870194 G C nonsynonymous Rv1656 L91F modern 1872959 G A synonymous Rv1659 R107R 3 1873700 G A synonymous Rv1659 L354L 1 1873954 G T nonsynonymous Rv1659 R439L 5 1874985 A C nonsynonymous Rv1660 T276P 6 1875585 C T synonymous Rv1661 T94T 1 1876739 T G nonsynonymous Rv1661 V479G 2 1877744 A C nonsynonymous Rv1661 E814A 6 1882180 C T synonymous Rv1662 A159A 6 1885481 C G nonsynonymous Rv1662 R1260G 6 1886077 G A synonymous Rv1662 A1458A 1 1886263 C G nonsynonymous Rv1662 H1520Q 1 1887284 G A nonsynonymous Rv1663 R258Q modern 1889073 C G nonsynonymous Rv1664 P350A 5 1890948 T G nonsynonymous Rv1664 L975V 2 1897608 G A synonymous Rv1672c L200L 1 1897646 C G nonsynonymous Rv1672c P188A 6 1900021 C T intergenic - - modern 1900800 C T nonsynonymous Rv1675c A59V 1 1902156 G A nonsynonymous Rv1677 G137R 6 1903173 C T synonymous Rv1678 I259I

Appendix B. Lineage-specific SNPs
235
modern 1906336 G A intergenic - - 1 1907177 C T nonsynonymous Rv1682 R259W 6 1907794 G A synonymous Rv1683 V67V 3 1908598 G A synonymous Rv1683 R335R 5 1909456 C T synonymous Rv1683 A621A 5 1911301 G A synonymous Rv1685c A33A 6 1912024 G T nonsynonymous Rv1686c V20F 6 1912582 C T synonymous Rv1687c A113A 6 1912617 G A nonsynonymous Rv1687c D102N 6 1914570 A C synonymous Rv1689 A323A modern 1920120 T G synonymous Rv1696 P146P 5 1923633 C T nonsynonymous Rv1698 H297Y 1 1923985 G A nonsynonymous Rv1699 V53I modern 1924959 C T synonymous Rv1699 G377G 3 1925136 G A synonymous Rv1699 V436V 3 1926029 T C nonsynonymous Rv1700 Y150H modern 1931470 A G intergenic - - modern 1935695 G T nonsynonymous Rv1707 A272S modern 1936525 A G nonsynonymous Rv1708 T56A 6 1937727 G T nonsynonymous Rv1709 A139S 5 1939007 A C nonsynonymous Rv1711 Q57P 1 1940307 G T nonsynonymous Rv1713 W7L 5 1942121 C T nonsynonymous Rv1714 A90V 5 1946975 C G intergenic - - 3 1946999 T G intergenic - - 5 1951438 C T nonsynonymous Rv1725c P105L 6 1951764 G A intergenic - - modern 1952160 C T synonymous Rv1726 T103T 3 1952743 G A nonsynonymous Rv1726 V298M 5 1955339 A C synonymous Rv1729c A77A 6 1955686 G A intergenic - - 2 1955941 C G nonsynonymous Rv1730c D435E 1 1956930 A C nonsynonymous Rv1730c T106P 6 1958423 C T synonymous Rv1731 I249I 5 1961730 C T nonsynonymous Rv1735c A20V 1 1963383 C T synonymous Rv1736c Y268Y modern 1963957 G A nonsynonymous Rv1736c G77D 5 1964984 G A synonymous Rv1737c R129R 6 1965434 A G intergenic - - 2 1967543 G T nonsynonymous Rv1739c G32V 6 1968116 A C nonsynonymous Rv1741 K67T 5 1968284 C T nonsynonymous Rv1742 R38W 6 1970407 G T synonymous Rv1743 P468P 6 1970432 G A nonsynonymous Rv1743 A477T 4 1971725 G C synonymous Rv1745c R89R 5 1971965 A C synonymous Rv1745c P9P 3 1972901 C T nonsynonymous Rv1746 A255V 6 1975960 G T synonymous Rv1747 S777S 3 1977646 C T synonymous Rv1749c A80A 1 1978807 C A nonsynonymous Rv1750c A254D 1 1979026 G A nonsynonymous Rv1750c S181N 2 1980652 G T synonymous Rv1751 P344P 5 1989054 A T nonsynonymous Rv1758 I5F

Appendix B. Lineage-specific SNPs
236
5 1989057 G A nonsynonymous Rv1758 G6R 1 1989370 C T nonsynonymous Rv1758 P110L 5 1989553 G C nonsynonymous Rv1758 G171A 6 1992683 C T intergenic - - 3 1993561 T C nonsynonymous Rv1760 C137R 6 1993683 C T synonymous Rv1760 V177V 5 1997460 G A synonymous Rv1765c R352R 3 2003252 C T synonymous Rv1769 A209A 5 2005152 G A synonymous Rv1770 E425E 5 2005607 T G nonsynonymous Rv1771 S149R 6 2005758 G C nonsynonymous Rv1771 E200Q 6 2006954 C T intergenic - - 5 2007015 C G intergenic - - 5 2008140 A C synonymous Rv1774 P103P 4 2010614 A G intergenic - - 3 2010880 T G synonymous Rv1777 G75G 3 2011568 G C nonsynonymous Rv1777 E305Q 1 2013943 C G nonsynonymous Rv1779c D179E modern 2017291 G A synonymous Rv1781c R62R 1 2017560 A T intergenic - - 5 2017860 C T nonsynonymous Rv1782 R41C 6 2017861 G A nonsynonymous Rv1782 R41H 5 2018883 G C nonsynonymous Rv1782 G382R modern 2019236 G T synonymous Rv1782 P499P 1 2023211 G T nonsynonymous Rv1784 V860F 6 2025032 C T intergenic - - 6 2032898 C T nonsynonymous Rv1795 P220L 6 2033021 G A nonsynonymous Rv1795 G261D 5 2033307 T C synonymous Rv1795 A356A 3 2034676 C T synonymous Rv1796 I316I 1 2035937 G A nonsynonymous Rv1797 R152H 5 2047454 G A intergenic - - 6 2049907 G A intergenic - - 6 2053439 C T intergenic - - 6 2053762 C T nonsynonymous Rv1811 A107V 3 2056184 C T intergenic - - 5 2060377 C T synonymous Rv1817 Y261Y 6 2060557 C T synonymous Rv1817 F321F 5 2060606 C T nonsynonymous Rv1817 H338Y modern 2062922 G A nonsynonymous Rv1819c V603I 6 2063121 A T synonymous Rv1819c P536P 1 2066471 T C synonymous Rv1821 G5G 5 2069546 T C nonsynonymous Rv1822 V156A 6 2071192 C T nonsynonymous Rv1825 R53W 6 2071410 C T synonymous Rv1825 D125D modern 2072190 C A nonsynonymous Rv1826 A80E 2 2072313 C A nonsynonymous Rv1826 T121K 5 2080594 C T synonymous Rv1834 R255R 1 2083124 A G nonsynonymous Rv1836c S505G 5 2087453 T C nonsynonymous Rv1838c I67T 3 2087652 G A nonsynonymous Rv1838c V1M 1 2090306 C T nonsynonymous Rv1841c P138L 5 2090366 T C nonsynonymous Rv1841c M118T

Appendix B. Lineage-specific SNPs
237
6 2090776 T C nonsynonymous Rv1842c L437S 1 2092391 C A synonymous Rv1843c I436I 1 2092970 G A synonymous Rv1843c L243L modern 2093715 C T intergenic - - 5 2095234 G T nonsynonymous Rv1845c R312L 1 2096094 G A synonymous Rv1845c T25T 1 2096430 T G nonsynonymous Rv1846c L57R modern 2097144 C G nonsynonymous Rv1847 L90V 5 2099402 T G nonsynonymous Rv1850 V481G 5 2099631 C T synonymous Rv1850 G557G 5 2101921 G A synonymous Rv1854c S374S 5 2103112 C A intergenic - - 1 2104779 G A synonymous Rv1856c G15G 5 2107050 G A synonymous Rv1859 V159V 6 2107511 C T nonsynonymous Rv1859 T313M 6 2108374 C T synonymous Rv1860 D213D 4 2108890 C A intergenic - - 5 2108980 A T intergenic - - modern 2110365 C A synonymous Rv1862 T274T 6 2115064 C T nonsynonymous Rv1866 A642V 6 2115776 C T nonsynonymous Rv1867 P5S modern 2120796 T A stopgain Rv1870c L212X 6 2122380 C G nonsynonymous Rv1872c L258V 5 2122443 G T nonsynonymous Rv1872c A237S modern 2122625 C T nonsynonymous Rv1872c A176V 4 2122976 C G nonsynonymous Rv1872c A59G 5 2123146 G A synonymous Rv1872c A2A 6 2124926 T C intergenic - - 5 2125054 C T intergenic - - 6 2125863 C T intergenic - - 6 2127646 C T synonymous Rv1877 T581T modern 2128372 G A synonymous Rv1878 T117T modern 2129281 A C synonymous Rv1878 A420A modern 2130529 G A intergenic - - 5 2130784 G A synonymous Rv1880c P358P 1 2132062 G C nonsynonymous Rv1881c G90R 5 2132077 A G nonsynonymous Rv1881c I85V 5 2136642 C T nonsynonymous Rv1887 L129F 1 2138767 C G nonsynonymous Rv1889c A84G 5 2140748 G C synonymous Rv1894c A374A 3 2142250 C T intergenic - - 6 2143839 A G nonsynonymous Rv1896c E203G modern 2145878 C T nonsynonymous Rv1899c P123L 6 2150754 A G nonsynonymous Rv1903 T131A modern 2151678 A C nonsynonymous Rv1905c T240P 3 2151780 C A nonsynonymous Rv1905c Q206K 3 2153184 T G intergenic - - 4 2154724 T G nonsynonymous Rv1908c L463R 6 2155503 C T synonymous Rv1908c T203T modern 2156868 A C synonymous Rv1910c G144G 4 2158109 G A nonsynonymous Rv1912c G328D 5 2158190 T G nonsynonymous Rv1912c I301S 3 2158905 G T stopgain Rv1912c G63X

Appendix B. Lineage-specific SNPs
238
6 2159337 G T synonymous Rv1913 A49A 6 2167564 G T intergenic - - 6 2172012 G C nonsynonymous Rv1920 M130I 2 2172380 A C nonsynonymous Rv1920 E253A 3 2172526 T G stoplost Rv1921c X424G 5 2173728 C A nonsynonymous Rv1921c A23D 5 2176006 C A synonymous Rv1923 G278G 5 2176648 T G nonsynonymous Rv1924c W95G modern 2177073 C T intergenic - - 1 2177968 G T synonymous Rv1925 A294A 5 2178941 G A nonsynonymous Rv1925 V619M 6 2181541 C A synonymous Rv1929c P122P 1 2185358 C T synonymous Rv1934c T277T 2 2185674 T C nonsynonymous Rv1934c I172T 3 2186127 C T nonsynonymous Rv1934c A21V 3 2186236 G A synonymous Rv1935c P308P 5 2186371 C T synonymous Rv1935c A263A 5 2186421 A C nonsynonymous Rv1935c T247P 5 2195637 T G nonsynonymous Rv1944c Y100D 6 2195922 A G nonsynonymous Rv1944c T5A 6 2195923 T G nonsynonymous Rv1944c D4E 4 2199052 C G nonsynonymous Rv1948c R5G 6 2199061 A C nonsynonymous Rv1948c T2P modern 2199416 C T nonsynonymous Rv1949c L207F 5 2206970 G A intergenic - - 5 2208538 G A stopgain Rv1965 W11X 4 2209465 A G nonsynonymous Rv1966 T47A 5 2210198 A G nonsynonymous Rv1966 Y291C 3 2216345 C A synonymous Rv1971 P363P 1 2216370 G C nonsynonymous Rv1971 G372R modern 2218012 G A synonymous Rv1974 A118A 1 2218488 G C nonsynonymous Rv1975 S146T 3 2220947 A G nonsynonymous Rv1978 M14V 6 2221313 G A nonsynonymous Rv1978 A136T modern 2222308 G A nonsynonymous Rv1979c G286D 5 2223902 T A nonsynonymous Rv1980c I43N 6 2225175 T G nonsynonymous Rv1981c L5R 4 2229801 C G synonymous Rv1985c P34P modern 2231486 G A intergenic - - 1 2237497 C G nonsynonymous Rv1993c L27V 1 2238930 A C intergenic - - 1 2239055 C T nonsynonymous Rv1996 P18S 1 2240062 C G intergenic - - 1 2241646 C T synonymous Rv1997 A496A modern 2241742 G A synonymous Rv1997 P528P 1 2242808 G A nonsynonymous Rv1997 A884T modern 2243034 C A nonsynonymous Rv1998c R230S 6 2244343 C A synonymous Rv1999c R266R 3 2245916 T G synonymous Rv2000 A236A 5 2246459 C A synonymous Rv2000 A417A modern 2246960 C G synonymous Rv2001 V43V 1 2249035 T C nonsynonymous Rv2003c M129T 1 2255942 G T nonsynonymous Rv2006 R1314L

Appendix B. Lineage-specific SNPs
239
4 2260100 T C intergenic - - 6 2261693 G C intergenic - - 6 2265993 A C nonsynonymous Rv2019 Q2P 6 2266051 C T synonymous Rv2019 G21G 2 2267015 A G synonymous Rv2021c A32A 6 2267976 C A synonymous Rv2023c R45R 2 2268627 C G nonsynonymous Rv2023A Q34E 5 2268887 C G nonsynonymous Rv2024c L452V 6 2269376 C T nonsynonymous Rv2024c R289C 6 2274463 T G nonsynonymous Rv2027c L16V 3 2275764 C T nonsynonymous Rv2029c L221F 6 2275771 A G synonymous Rv2029c A218A 6 2276918 T C synonymous Rv2030c H523H 5 2278426 C A nonsynonymous Rv2030c R21S 6 2281289 G T intergenic - - modern 2282376 T C nonsynonymous Rv2036 V93A modern 2282377 T C synonymous Rv2036 V93V 5 2283293 C G synonymous Rv2037c T143T 3 2284456 A C nonsynonymous Rv2038c E114A 3 2285558 C T synonymous Rv2039c C28C 2 2288085 C G synonymous Rv2042c A199A 5 2290062 G A nonsynonymous Rv2045c A387T 5 2291331 C A synonymous Rv2046 G21G 5 2291331 C T synonymous Rv2046 G21G 2 2294007 A G nonsynonymous Rv2047c T174A 3 2296876 G C nonsynonymous Rv2048c G3371R 1 2297766 C T nonsynonymous Rv2048c A3074V modern 2301089 G A synonymous Rv2048c L1966L 5 2304017 G A synonymous Rv2048c L990L 3 2306472 A T nonsynonymous Rv2048c Y172F 3 2306472 A G nonsynonymous Rv2048c Y172C 3 2309203 C T nonsynonymous Rv2051c A518V 1 2309356 C T nonsynonymous Rv2051c T467I 5 2313815 G A nonsynonymous Rv2054 A231T 1 2321358 G C nonsynonymous Rv2063A R101P 5 2323291 C T synonymous Rv2066 A39A 6 2323880 T C synonymous Rv2066 L236L 3 2325320 A G nonsynonymous Rv2067c D184G 1 2327904 A C nonsynonymous Rv2070c I108L 5 2328420 G A synonymous Rv2071c T186T 4 2328543 G A nonsynonymous Rv2071c M145I 6 2328627 G A synonymous Rv2071c A117A 5 2328820 A G nonsynonymous Rv2071c D53G 6 2329466 G A synonymous Rv2072c P227P 1 2331255 C T nonsynonymous Rv2074 A88V 4 2331620 G T synonymous Rv2075c G420G 4 2331789 A C nonsynonymous Rv2075c Q364P 3 2333215 G A nonsynonymous Rv2076c C25Y 3 2335080 T C synonymous Rv2078 L8L 1 2335500 C T nonsynonymous Rv2079 A49V 5 2335650 G A nonsynonymous Rv2079 G99D 6 2336985 G C nonsynonymous Rv2079 G544A 2 2337179 C T stopgain Rv2079 Q609X
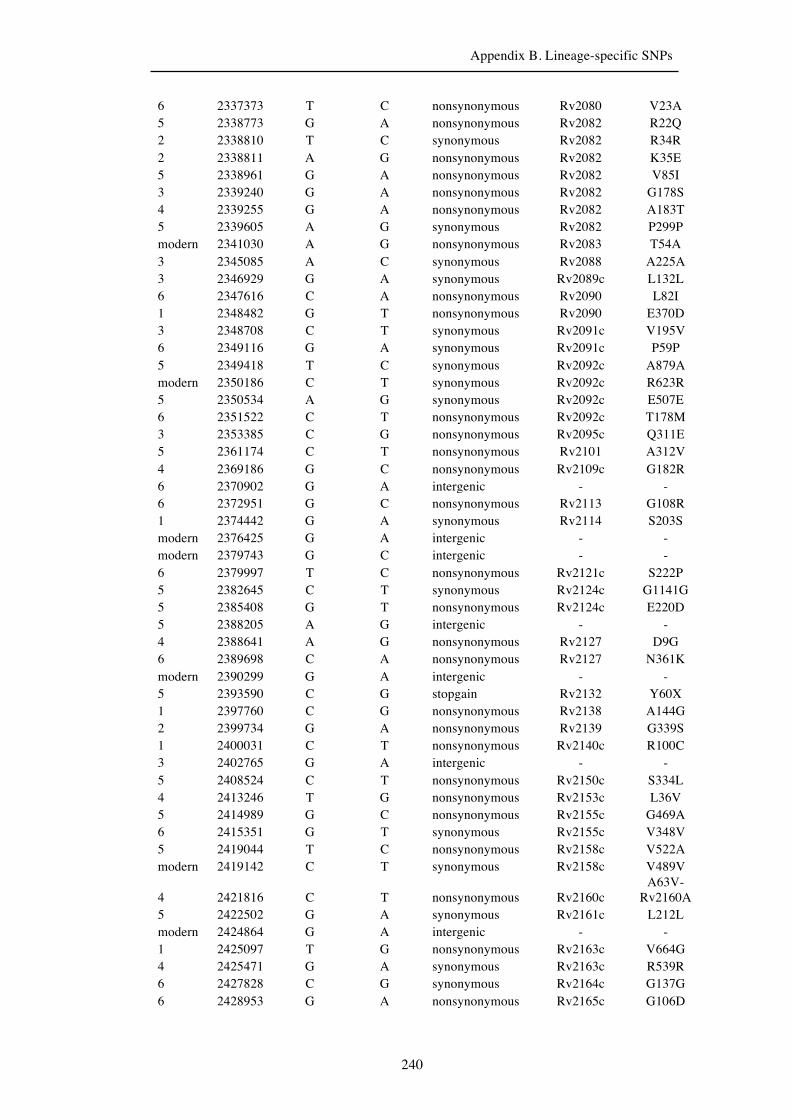
Appendix B. Lineage-specific SNPs
240
6 2337373 T C nonsynonymous Rv2080 V23A 5 2338773 G A nonsynonymous Rv2082 R22Q 2 2338810 T C synonymous Rv2082 R34R 2 2338811 A G nonsynonymous Rv2082 K35E 5 2338961 G A nonsynonymous Rv2082 V85I 3 2339240 G A nonsynonymous Rv2082 G178S 4 2339255 G A nonsynonymous Rv2082 A183T 5 2339605 A G synonymous Rv2082 P299P modern 2341030 A G nonsynonymous Rv2083 T54A 3 2345085 A C synonymous Rv2088 A225A 3 2346929 G A synonymous Rv2089c L132L 6 2347616 C A nonsynonymous Rv2090 L82I 1 2348482 G T nonsynonymous Rv2090 E370D 3 2348708 C T synonymous Rv2091c V195V 6 2349116 G A synonymous Rv2091c P59P 5 2349418 T C synonymous Rv2092c A879A modern 2350186 C T synonymous Rv2092c R623R 5 2350534 A G synonymous Rv2092c E507E 6 2351522 C T nonsynonymous Rv2092c T178M 3 2353385 C G nonsynonymous Rv2095c Q311E 5 2361174 C T nonsynonymous Rv2101 A312V 4 2369186 G C nonsynonymous Rv2109c G182R 6 2370902 G A intergenic - - 6 2372951 G C nonsynonymous Rv2113 G108R 1 2374442 G A synonymous Rv2114 S203S modern 2376425 G A intergenic - - modern 2379743 G C intergenic - - 6 2379997 T C nonsynonymous Rv2121c S222P 5 2382645 C T synonymous Rv2124c G1141G 5 2385408 G T nonsynonymous Rv2124c E220D 5 2388205 A G intergenic - - 4 2388641 A G nonsynonymous Rv2127 D9G 6 2389698 C A nonsynonymous Rv2127 N361K modern 2390299 G A intergenic - - 5 2393590 C G stopgain Rv2132 Y60X 1 2397760 C G nonsynonymous Rv2138 A144G 2 2399734 G A nonsynonymous Rv2139 G339S 1 2400031 C T nonsynonymous Rv2140c R100C 3 2402765 G A intergenic - - 5 2408524 C T nonsynonymous Rv2150c S334L 4 2413246 T G nonsynonymous Rv2153c L36V 5 2414989 G C nonsynonymous Rv2155c G469A 6 2415351 G T synonymous Rv2155c V348V 5 2419044 T C nonsynonymous Rv2158c V522A modern 2419142 C T synonymous Rv2158c V489V
4 2421816 C T nonsynonymous Rv2160c A63V-
Rv2160A 5 2422502 G A synonymous Rv2161c L212L modern 2424864 G A intergenic - - 1 2425097 T G nonsynonymous Rv2163c V664G 4 2425471 G A synonymous Rv2163c R539R 6 2427828 C G synonymous Rv2164c G137G 6 2428953 G A nonsynonymous Rv2165c G106D

Appendix B. Lineage-specific SNPs
241
5 2432185 A G intergenic - - 3 2434749 C T intergenic - - 6 2435582 G A nonsynonymous Rv2173 A246T modern 2437259 T G nonsynonymous Rv2174 S451A 6 2437837 C T nonsynonymous Rv2175c P17L 6 2438094 T G nonsynonymous Rv2176 S52A 3 2440935 C G synonymous Rv2178c S262S 6 2443508 G T nonsynonymous Rv2181 L69F 5 2445414 C A intergenic - - 6 2447150 C A synonymous Rv2185c P117P 6 2447426 C A synonymous Rv2185c I25I modern 2447539 G A intergenic - - 1 2448288 G A stopgain Rv2187 W43X 6 2448402 C A stopgain Rv2187 Y81X 4 2448458 T C nonsynonymous Rv2187 I100T modern 2449295 A G nonsynonymous Rv2187 E379G 3 2449826 C G nonsynonymous Rv2187 S556W 1 2450045 C T nonsynonymous Rv2188c T369M 1 2451081 G C nonsynonymous Rv2188c E24Q 3 2452452 C T nonsynonymous Rv2190c T274M 5 2452657 G T nonsynonymous Rv2190c V206F 6 2453933 C A nonsynonymous Rv2191 R39S 6 2458234 A C nonsynonymous Rv2194 K228Q 6 2461545 G T nonsynonymous Rv2197c A202S 5 2463455 G A synonymous Rv2199c R66R 5 2465721 T C nonsynonymous Rv2201 V242A 1 2470485 G T intergenic - - 4 2470591 C A intergenic - - 3 2472029 T G nonsynonymous Rv2207 W207G modern 2472956 C T nonsynonymous Rv2208 S155L 6 2474271 G A nonsynonymous Rv2209 G291E 5 2477562 C T synonymous Rv2212 L125L 3 2477984 G A synonymous Rv2212 S265S 6 2478180 C A nonsynonymous Rv2212 L331I 3 2478619 G A synonymous Rv2213 L94L 6 2478967 C G nonsynonymous Rv2213 F210L 3 2480809 C G nonsynonymous Rv2214c A298G 5 2485956 G A synonymous Rv2218 E228E 5 2488898 C A nonsynonymous Rv2220 D428E 5 2489855 G A synonymous Rv2221c T833T 5 2490116 A C synonymous Rv2221c A746A 5 2493513 A G nonsynonymous Rv2222c Q77R 3 2494430 G C nonsynonymous Rv2223c G324R modern 2495500 G A synonymous Rv2224c L508L 5 2498200 G T nonsynonymous Rv2225 M153I 5 2500610 G A intergenic - - 6 2500697 C T intergenic - - 1 2500892 C T intergenic - - modern 2501148 C T nonsynonymous Rv2227 A73V 6 2501401 G T synonymous Rv2227 P157P 6 2501668 G A synonymous Rv2228c L357L 5 2503257 C T synonymous Rv2229c I72I 5 2503491 A C nonsynonymous Rv2230c E373A

Appendix B. Lineage-specific SNPs
242
1 2503549 G T nonsynonymous Rv2230c A354S 3 2504177 G A synonymous Rv2230c E144E 1 2508395 G A synonymous Rv2235 P253P 5 2508857 C T synonymous Rv2236c A173A 1 2509181 G C synonymous Rv2236c V65V 6 2509362 C T nonsynonymous Rv2236c T5I 2 2510350 C G intergenic - - modern 2511712 A C nonsynonymous Rv2240c K259T 5 2512359 C T synonymous Rv2240c A43A 6 2514867 G A nonsynonymous Rv2241 A777T 3 2516271 T C nonsynonymous Rv2242 M323T 5 2516804 A C synonymous Rv2243 A6A modern 2518132 T C synonymous Rv2245 T6T 6 2520466 G A synonymous Rv2246 A357A 2 2521428 A G nonsynonymous Rv2247 D229G 6 2522284 G A intergenic - - 5 2522650 T C synonymous Rv2248 R97R 6 2522878 C A synonymous Rv2248 L173L 5 2525534 C T nonsynonymous Rv2250A R45C 6 2526709 T C nonsynonymous Rv2251 M382T 1 2528931 C T synonymous Rv2254c N15N 5 2530101 A T nonsynonymous Rv2257c D241V 1 2530434 C A nonsynonymous Rv2257c P130H 5 2531033 C G nonsynonymous Rv2258c P289A 5 2531035 T C nonsynonymous Rv2258c V288A 5 2532788 A G nonsynonymous Rv2259 T182A 3 2536312 C T synonymous Rv2263 R224R 1 2538793 G A nonsynonymous Rv2265 G32S 3 2540554 T C nonsynonymous Rv2266 S151P 3 2541477 C G intergenic - - 3 2542543 C T nonsynonymous Rv2267c R90C 2 2543395 A G synonymous Rv2268c E294E 6 2544466 G A synonymous Rv2269c R52R 1 2544979 T A nonsynonymous Rv2270 H94Q 1 2547274 A G nonsynonymous Rv2275 D131G 2 2548700 C T nonsynonymous Rv2276 H318Y 5 2549057 C A intergenic - - 6 2550019 G T nonsynonymous Rv2277c R4L 1 2553682 C T synonymous Rv2281 Y170Y 5 2561261 T C nonsynonymous Rv2287 V520A modern 2562783 C T nonsynonymous Rv2290 A62V 5 2562933 T C nonsynonymous Rv2290 I112T modern 2563958 C A nonsynonymous Rv2291 A262E 6 2566596 G C intergenic - - 1 2569593 A G nonsynonymous Rv2298 H171R 6 2571678 C T stopgain Rv2299c Q109X 5 2572854 A T nonsynonymous Rv2300c K52M 1 2573434 G T nonsynonymous Rv2301 W140C 1 2574598 G A nonsynonymous Rv2303c S141N 5 2574950 A G nonsynonymous Rv2303c I24V 6 2576251 G A nonsynonymous Rv2305 G148D 5 2576863 G C nonsynonymous Rv2305 S352T modern 2577246 G A nonsynonymous Rv2306A V47I

Appendix B. Lineage-specific SNPs
243
6 2577994 C T nonsynonymous Rv2307c R235W modern 2581109 A C synonymous Rv2308 R231R 1 2582324 G A intergenic - - 2 2586076 G C synonymous Rv2314c R405R 6 2590122 G A synonymous Rv2317 V142V 3 2591172 G A nonsynonymous Rv2318 A219T 6 2592510 C T nonsynonymous Rv2319c R73C 6 2593621 C A nonsynonymous Rv2320c A178E 6 2596056 G A nonsynonymous Rv2323c V72I 5 2598899 C A nonsynonymous Rv2326c T350N 1 2602575 C T nonsynonymous Rv2329c P296L 5 2603523 G C intergenic - - modern 2605293 T G nonsynonymous Rv2332 D62E modern 2608488 C T intergenic - - 5 2609302 G C nonsynonymous Rv2334 K169N 1 2611704 A C synonymous Rv2336 R290R 6 2614882 G A nonsynonymous Rv2339 A64T 3 2615413 A G nonsynonymous Rv2339 T241A 5 2615969 C A nonsynonymous Rv2339 A426E 5 2616527 G T nonsynonymous Rv2339 R612L 5 2617442 C A stopgain Rv2339 S917X 4 2619271 C T intergenic - - 1 2622508 G A synonymous Rv2344c L415L 5 2622927 C G nonsynonymous Rv2344c P276A 6 2623603 A G synonymous Rv2344c A50A 6 2623917 T C nonsynonymous Rv2345 S33P 6 2624945 C A nonsynonymous Rv2345 D375E 3 2624986 T G nonsynonymous Rv2345 V389G 4 2625924 G A synonymous Rv2346c A83A 5 2626018 A G nonsynonymous Rv2346c E52G 3 2626095 G C synonymous Rv2346c A26A modern 2626108 C G nonsynonymous Rv2346c A22G modern 2626189 A C intergenic - - modern 2626191 T C intergenic - - 3 2626513 A T nonsynonymous Rv2347c T3S 3 2626514 A C synonymous Rv2347c A2A 3 2626600 G A intergenic - - modern 2631641 C A synonymous Rv2351c P145P 3 2632362 T C intergenic - - 6 2632373 C A intergenic - - modern 2632500 G A intergenic - - 1 2637088 C T intergenic - - 6 2641813 C T nonsynonymous Rv2359 A55V 6 2641828 T C nonsynonymous Rv2359 V60A modern 2641840 G A nonsynonymous Rv2359 R64H 1 2643653 C T synonymous Rv2362c G202G 5 2645780 G A synonymous Rv2364c L298L 3 2652254 C G nonsynonymous Rv2372c A191G 1 2652908 G C nonsynonymous Rv2373c E360D 5 2656136 T A intergenic - - 3 2656635 C T nonsynonymous Rv2378c P357S 1 2660319 C G nonsynonymous Rv2379c D589E 1 2660319 C T synonymous Rv2379c D589D

Appendix B. Lineage-specific SNPs
244
3 2661039 C T synonymous Rv2379c I349I 1 2663210 C T synonymous Rv2380c A1302A 5 2663463 G T nonsynonymous Rv2380c R1218L 6 2672906 C T nonsynonymous Rv2383c L978F 2 2673818 G C nonsynonymous Rv2383c V674L 5 2682158 C T nonsynonymous Rv2388c L329F 5 2683729 A G nonsynonymous Rv2390c S180G 1 2688225 G C nonsynonymous Rv2394 M72I 3 2688700 C T nonsynonymous Rv2394 P231S 6 2688726 T C synonymous Rv2394 A239A 6 2689193 G A nonsynonymous Rv2394 R395Q 3 2690160 A G nonsynonymous Rv2395 N30S modern 2691713 C T nonsynonymous Rv2395 P548S 6 2692608 A G intergenic - - 1 2696977 C G synonymous Rv2400c A246A 6 2697218 G T nonsynonymous Rv2400c R166L 3 2700222 T C nonsynonymous Rv2402 L565P 5 2701940 C T nonsynonymous Rv2404c P437S 5 2702166 C A synonymous Rv2404c R361R 5 2702403 T C synonymous Rv2404c L282L 5 2702612 G T nonsynonymous Rv2404c G213C 6 2703018 C A synonymous Rv2404c G77G 5 2703964 G A intergenic - - 1 2704291 C T synonymous Rv2406c I49I modern 2704884 A T nonsynonymous Rv2407 H63L 6 2705145 C A nonsynonymous Rv2407 T150K modern 2709795 C T synonymous Rv2411c A57A 6 2710422 G A nonsynonymous Rv2413c A294T 2 2711722 A C synonymous Rv2414c P385P 3 2712328 G A synonymous Rv2414c P183P modern 2712913 T G nonsynonymous Rv2415c L291R 6 2719057 G A intergenic - - 3 2720069 G A nonsynonymous Rv2423 G158E 3 2720444 C T nonsynonymous Rv2423 S283F 4 2723506 G A synonymous Rv2426c L226L 5 2724331 A G nonsynonymous Rv2427c I383V 1 2726051 C T nonsynonymous Rv2427A L13F 3 2726105 G A intergenic - - 1 2727037 A T nonsynonymous Rv2429 M78L 6 2730360 C T synonymous Rv2434c V67V 5 2730711 C T nonsynonymous Rv2435c A680V 1 2731741 C T synonymous Rv2435c L337L 6 2733100 G T intergenic - - 2 2734482 A T nonsynonymous Rv2437 Y36F 3 2738221 C T synonymous Rv2439c I9I 6 2739242 T C nonsynonymous Rv2440c S149P 4 2740693 C T intergenic - - 2 2741209 G A synonymous Rv2443 L167L 5 2741269 C A synonymous Rv2443 G187G 5 2744225 T C synonymous Rv2444c L254L 1 2745739 G A intergenic - - 1 2745839 C T synonymous Rv2446c A100A 5 2748366 G T nonsynonymous Rv2448c E620D

Appendix B. Lineage-specific SNPs
245
6 2751300 C T synonymous Rv2449c T91T 5 2752132 T C synonymous Rv2450c L17L 5 2753821 C G nonsynonymous Rv2454c A309G 3 2753869 T C nonsynonymous Rv2454c V293A 1 2755112 C T synonymous Rv2455c I531I 6 2757464 G T synonymous Rv2456c L243L 1 2759534 C G intergenic - - 1 2764206 T C synonymous Rv2462c D362D modern 2764939 T C nonsynonymous Rv2462c L118P 6 2770011 T G synonymous Rv2467 A342A 3 2771383 A G nonsynonymous Rv2467 S800G 6 2772741 G T nonsynonymous Rv2469c A99S 6 2772760 C G synonymous Rv2469c S92S 6 2772954 A G nonsynonymous Rv2469c S28G 1 2773955 G C nonsynonymous Rv2471 S131T 3 2782498 C T synonymous Rv2477c D515D 5 2784162 C A nonsynonymous Rv2478c D149E 6 2789237 A G nonsynonymous Rv2482c D16G 2 2789798 C A synonymous Rv2483c R409R modern 2790458 G T nonsynonymous Rv2483c G189C 4 2791098 A G nonsynonymous Rv2484c D466G 1 2791257 T A nonsynonymous Rv2484c I413N modern 2791475 C T synonymous Rv2484c A340A 3 2798595 G A synonymous Rv2488c A762A 1 2799493 T G nonsynonymous Rv2488c I463S 4 2807486 A C nonsynonymous Rv2492 D70A 5 2808296 G A nonsynonymous Rv2493 E72K 1 2809895 C T synonymous Rv2495c L15L 5 2810816 A G nonsynonymous Rv2496c E56G 5 2811013 G A nonsynonymous Rv2497c E362K 6 2813515 C T synonymous Rv2499c L72L 6 2817056 G A synonymous Rv2502c A473A 1 2817158 G T nonsynonymous Rv2502c M439I 3 2817747 C T nonsynonymous Rv2502c A243V 5 2819093 C G nonsynonymous Rv2503c A12G 6 2819183 C T nonsynonymous Rv2504c R230W 5 2820743 T C nonsynonymous Rv2505c V285A 5 2822701 A C synonymous Rv2507 P88P 6 2823743 C A nonsynonymous Rv2508c A284E 1 2824432 C T synonymous Rv2508c T54T 4 2825466 A G synonymous Rv2509 K263K 1 2828104 C T intergenic - - 6 2831046 C T nonsynonymous Rv2514c A98V 2 2833329 C T nonsynonymous Rv2516c A62V 6 2835261 G A nonsynonymous Rv2518c M25I 5 2839648 G A nonsynonymous Rv2523c V95I 4 2841022 C T nonsynonymous Rv2524c R2771C 5 2843482 C T nonsynonymous Rv2524c P1951S 5 2844125 G T synonymous Rv2524c P1736P 6 2844335 G T synonymous Rv2524c T1666T 4 2847281 C T synonymous Rv2524c D684D 6 2847318 G C nonsynonymous Rv2524c G672A 6 2847737 C T synonymous Rv2524c I532I

Appendix B. Lineage-specific SNPs
246
6 2848800 C T nonsynonymous Rv2524c A178V 6 2851746 A G intergenic - - 5 2852798 C T intergenic - - 5 2854669 T C synonymous Rv2530c D6D 6 2854864 C T nonsynonymous Rv2530A A15V 5 2855231 T C nonsynonymous Rv2531c F851L 6 2855422 T C nonsynonymous Rv2531c I787T 5 2855959 C T nonsynonymous Rv2531c P608L modern 2858669 A C nonsynonymous Rv2533c D19A 5 2859147 G A synonymous Rv2534c K48K 3 2867254 A G nonsynonymous Rv2544 H44R 2 2867298 C A nonsynonymous Rv2544 H59N 2 2867347 A G nonsynonymous Rv2544 Q75R 2 2867401 A C nonsynonymous Rv2544 N93T 2 2867756 T C synonymous Rv2544 I211I 5 2868769 G A nonsynonymous Rv2547 G55D 1 2869242 T C intergenic - - modern 2870386 T C intergenic - - 6 2871717 G A nonsynonymous Rv2552c R100Q 5 2874162 C T nonsynonymous Rv2555c A775V 5 2875717 A C nonsynonymous Rv2555c I257L 6 2875808 G C nonsynonymous Rv2555c K226N modern 2878980 A G nonsynonymous Rv2559c D317G 1 2881244 A G intergenic - - 3 2881337 C T intergenic - - 3 2881569 A G nonsynonymous Rv2561 E54G 5 2881938 G C nonsynonymous Rv2562 G61R 6 2886400 G A nonsynonymous Rv2566 G10S 4 2886570 G A synonymous Rv2566 E66E 6 2886640 C G nonsynonymous Rv2566 L90V 6 2887964 C T nonsynonymous Rv2566 A531V 6 2891366 G A synonymous Rv2567 A524A 6 2892917 C T synonymous Rv2568c L185L 6 2894322 C G nonsynonymous Rv2569c D29E 6 2894458 C T intergenic - - 1 2894594 G A nonsynonymous Rv2570 G28D 1 2894642 A G nonsynonymous Rv2570 E44G 3 2895473 T C nonsynonymous Rv2571c F163S 6 2896260 C T nonsynonymous Rv2572c A515V 1 2897528 C T synonymous Rv2572c A92A 3 2897660 A G synonymous Rv2572c A48A modern 2897871 G A intergenic - - 1 2899890 G T nonsynonymous Rv2575 Q184H 6 2900967 G A nonsynonymous Rv2577 G17E 3 2903050 C T nonsynonymous Rv2578c T161I 6 2904550 G A intergenic - - 6 2904864 T C nonsynonymous Rv2580c M410T 5 2910483 C A nonsynonymous Rv2584c L140I 3 2910852 G C nonsynonymous Rv2584c A17P 6 2912815 G A synonymous Rv2586c G399G 5 2919947 T C nonsynonymous Rv2590 F693L 5 2921513 C G intergenic - - 5 2921541 A C intergenic - -

Appendix B. Lineage-specific SNPs
247
3 2925462 T A intergenic - - 1 2925683 G A synonymous Rv2595 L64L 4 2925962 C T nonsynonymous Rv2596 R77C 5 2926445 G A nonsynonymous Rv2597 A31T 1 2926882 C T synonymous Rv2597 R176R 5 2927086 G A nonsynonymous Rv2598 R34Q modern 2927511 T G nonsynonymous Rv2599 I12S 6 2927864 G A nonsynonymous Rv2599 G130S 5 2934398 C G synonymous Rv2607 T67T 6 2939177 T C synonymous Rv2611c Y262Y 1 2940608 G A nonsynonymous Rv2612c S2N 3 2941179 C T synonymous Rv2613c R6R 6 2945042 C G intergenic - - 5 2945389 G A synonymous Rv2616 A20A 2 2948230 C T nonsynonymous Rv2621c A110V 3 2948524 A T nonsynonymous Rv2621c E12V 1 2948650 T C synonymous Rv2622 R5R 3 2949251 G A nonsynonymous Rv2622 V206I modern 2953307 T G intergenic - - 6 2954318 C T nonsynonymous Rv2627c T144M modern 2955233 T C nonsynonymous Rv2628 L59S 5 2955343 G A nonsynonymous Rv2628 A96T 5 2958044 G T nonsynonymous Rv2631 G158V 3 2958693 G A synonymous Rv2631 A374A 3 2959257 A T intergenic - - 3 2959265 A T intergenic - - modern 2959324 G A intergenic - - 3 2964594 G A nonsynonymous Rv2638 A64T 5 2964876 G C intergenic - - 6 2968468 G C intergenic - - 2 2969197 A G intergenic - - modern 2970017 C G intergenic - - modern 2970019 A G intergenic - - 6 2972107 C T intergenic - - 5 2976579 C T intergenic - - modern 2980970 G T nonsynonymous Rv2660c C74F 5 2981030 C G nonsynonymous Rv2660c P54R 5 2981688 A G synonymous Rv2662 A69A 6 2984105 G A nonsynonymous Rv2667 M70I modern 2985216 A G nonsynonymous Rv2668 K162E 1 2987918 G A synonymous Rv2672 R79R 5 2988374 C T synonymous Rv2672 A231A 4 2988630 G C nonsynonymous Rv2672 D317H 5 2991646 G T synonymous Rv2675c V97V 1 2992564 C T nonsynonymous Rv2676c S22L 1 2993523 A G nonsynonymous Rv2677c Q157R 4 2994187 G A synonymous Rv2678c L292L 5 2998287 G C nonsynonymous Rv2682c G561A modern 3000362 C T nonsynonymous Rv2683 S84L 5 3001754 G T nonsynonymous Rv2684 A381S 4 3003115 G C nonsynonymous Rv2685 G378A 5 3004427 G T nonsynonymous Rv2687c V108L modern 3006898 T C synonymous Rv2689c Y55Y

Appendix B. Lineage-specific SNPs
248
modern 3007238 C T stopgain Rv2690c R658X 5 3009738 A C nonsynonymous Rv2691 Q132P 5 3009759 G C nonsynonymous Rv2691 W139S 3 3010014 G A nonsynonymous Rv2691 G224E 4 3010420 G A nonsynonymous Rv2692 V133I 2 3010993 G A nonsynonymous Rv2693c G126R 6 3011566 C A nonsynonymous Rv2694c R68S 3 3011837 A G intergenic - - 6 3011903 G A intergenic - - 6 3014016 G A synonymous Rv2697c L44L 1 3015379 G A synonymous Rv2700 P59P 5 3015639 A G nonsynonymous Rv2700 Q146R 5 3015834 T C nonsynonymous Rv2700 I211T 5 3016149 C G nonsynonymous Rv2701c A196G 6 3016608 A C nonsynonymous Rv2701c D43A 6 3022369 G T intergenic - - 2 3024021 C A synonymous Rv2711 R153R 1 3025431 C T intergenic - - 3 3027548 C T nonsynonymous Rv2714 P162S modern 3027606 G C nonsynonymous Rv2714 W181S 4 3027798 C T nonsynonymous Rv2714 A245V 6 3029177 C T synonymous Rv2716 A2A 6 3029360 C T synonymous Rv2716 T63T 4 3031168 C T nonsynonymous Rv2719c H124Y 1 3031285 T A nonsynonymous Rv2719c L85M 2 3033189 C T synonymous Rv2721c P477P 5 3035033 C T nonsynonymous Rv2723 S42L 2 3036826 G A nonsynonymous Rv2724c V156M 5 3037048 G A nonsynonymous Rv2724c E82K 5 3037196 G A synonymous Rv2724c A32A 6 3037234 C T nonsynonymous Rv2724c R20C 5 3039020 G A nonsynonymous Rv2726c V261I 6 3039842 T A nonsynonymous Rv2727c W310R 3 3040344 G A synonymous Rv2727c E142E 3 3043700 C T synonymous Rv2731 A225A 6 3043960 C G nonsynonymous Rv2731 A312G 6 3049728 A C nonsynonymous Rv2737c Q566P 5 3050362 G T nonsynonymous Rv2737c D355Y 5 3051911 C T synonymous Rv2738c G34G 5 3052223 T G nonsynonymous Rv2739c W323G 5 3056742 C A nonsynonymous Rv2743c T164K 6 3057309 C T nonsynonymous Rv2744c P252L 6 3057375 G A nonsynonymous Rv2744c R230Q 3 3059791 G C intergenic - - 6 3068710 G T nonsynonymous Rv2756c K458N 5 3068778 G A nonsynonymous Rv2756c E436K 3 3069566 G A nonsynonymous Rv2756c G173D modern 3069805 G C synonymous Rv2756c V93V 3 3072285 T G nonsynonymous Rv2761c L119R 1 3074830 C T synonymous Rv2765 Y65Y 3 3076172 G A nonsynonymous Rv2766c D67N 6 3085752 C T synonymous Rv2778c R144R 1 3086261 A G nonsynonymous Rv2779c Q165R

Appendix B. Lineage-specific SNPs
249
6 3086728 G A nonsynonymous Rv2779c M9I 5 3086788 C T intergenic - - 5 3087187 C G nonsynonymous Rv2780 A123G 5 3087190 A C nonsynonymous Rv2780 D124A modern 3088625 C T synonymous Rv2781c V120V 3 3089299 G C nonsynonymous Rv2782c G355R 5 3096576 G A nonsynonymous Rv2787 R489Q 1 3097349 C T stopgain Rv2788 Q131X 5 3098714 A G synonymous Rv2789c S75S 6 3103497 G T nonsynonymous Rv2794c W148C 4 3104189 C T synonymous Rv2795c C241C modern 3105144 T G nonsynonymous Rv2796c F159C 5 3106231 G A synonymous Rv2797c A359A 5 3106491 C T stopgain Rv2797c Q273X 5 3108299 T G nonsynonymous Rv2799 S178A 3 3111280 C T nonsynonymous Rv2802c L182F 2 3111476 G A synonymous Rv2802c S116S 3 3112700 G A nonsynonymous Rv2804c G132D
4 3112877 A G nonsynonymous Rv2805 D4G-
Rv2804c 1 3114814 G A intergenic - - 5 3115108 G A synonymous Rv2808 E21E 5 3116253 C A nonsynonymous Rv2811 Q39K modern 3118449 G A nonsynonymous Rv2813 V76I 6 3119277 G C intergenic - - modern 3119513 T C intergenic - - modern 3119737 G C intergenic - - modern 3119740 T G intergenic - - modern 3119741 T A intergenic - - 6 3119769 A G intergenic - - 1 3120212 G A intergenic - - 5 3121880 G A intergenic - - 5 3122621 C G intergenic - - modern 3122949 C T intergenic - - 1 3122954 C T intergenic - - 3 3123247 T A intergenic - - 6 3123291 C T intergenic - - 5 3125087 T G nonsynonymous Rv2818c I353S 6 3125180 G C nonsynonymous Rv2818c R322P 6 3125235 C T stopgain Rv2818c Q304X 6 3127466 A C synonymous Rv2820c R269R 5 3128667 C T synonymous Rv2821c L99L 5 3130150 C G nonsynonymous Rv2823c R542G 1 3132956 C A nonsynonymous Rv2825c A195E 1 3132975 G C nonsynonymous Rv2825c V189L 4 3133054 C G nonsynonymous Rv2825c C162W 4 3133055 G C nonsynonymous Rv2825c C162S 6 3134839 C T synonymous Rv2827c R215R 1 3135852 C A nonsynonymous Rv2828c A161E 1 3135950 G C synonymous Rv2828c S128S 6 3137026 T G nonsynonymous Rv2830c S67A modern 3137237 C T intergenic - - 1 3137681 G A synonymous Rv2831 V137V

Appendix B. Lineage-specific SNPs
250
6 3146953 A G synonymous Rv2839c E307E 6 3147243 C T nonsynonymous Rv2839c P211S 6 3148174 T C nonsynonymous Rv2840c Y29H 6 3148356 G A intergenic - - 5 3148511 A C nonsynonymous Rv2841c E306D 6 3149678 G A nonsynonymous Rv2842c R100H 5 3151813 C T nonsynonymous Rv2845c R380C 6 3152837 G C synonymous Rv2845c A38A 6 3155164 C T synonymous Rv2847c S236S 5 3157540 A G nonsynonymous Rv2849c Q202R 5 3158512 C T stopgain Rv2850c R515X 5 3159164 C T synonymous Rv2850c D297D 5 3165203 A G intergenic - - 3 3165807 G A synonymous Rv2855 V201V 3 3168492 G A intergenic - - 1 3169993 T C nonsynonymous Rv2858c L244P 6 3172564 C A nonsynonymous Rv2860c T146N 6 3173645 G C nonsynonymous Rv2861c G125R 3 3174013 C T nonsynonymous Rv2861c P2L 4 3174496 C T nonsynonymous Rv2862c R50C 5 3175460 G A synonymous Rv2864c L602L 4 3180988 T G nonsynonymous Rv2869c F259V 5 3184670 T C intergenic - - 6 3187539 C T synonymous Rv2875 V170V 5 3187718 G A nonsynonymous Rv2876 S19N 6 3187792 T C nonsynonymous Rv2876 W44R 5 3188332 C T synonymous Rv2877c V180V 1 3188428 G A synonymous Rv2877c P148P modern 3188769 C T nonsynonymous Rv2877c H35Y 4 3189242 C T synonymous Rv2878c A52A modern 3189580 C T intergenic - - 1 3190342 C T nonsynonymous Rv2880c P113S 5 3193575 C T synonymous Rv2884 A61A 1 3197917 C T synonymous Rv2888c G123G 5 3199103 C T nonsynonymous Rv2889c A2V modern 3200304 G A synonymous Rv2891 V13V 3 3200478 G A synonymous Rv2891 L71L 6 3202515 G A synonymous Rv2893 A32A 1 3202629 C T synonymous Rv2893 H70H 3 3202731 A C synonymous Rv2893 G104G 5 3205077 T C synonymous Rv2895c D52D 3 3208600 C T synonymous Rv2899c Y269Y 3 3212723 G T synonymous Rv2902c A78A 6 3213255 G A synonymous Rv2903c K200K 5 3214120 T C nonsynonymous Rv2904c V45A 1 3214481 G T intergenic - - 3 3219500 A T nonsynonymous Rv2912c K121M 1 3229692 C T nonsynonymous Rv2918c A330V 1 3233605 C T synonymous Rv2921c L179L 3 3236442 C T synonymous Rv2922c H455H 3 3236497 T A nonsynonymous Rv2922c V437E 6 3236716 T G nonsynonymous Rv2922c L364R 5 3238190 C A nonsynonymous Rv2923c L104M

Appendix B. Lineage-specific SNPs
251
1 3241244 C T nonsynonymous Rv2927c T239I 5 3242131 G A intergenic - - 6 3243312 C G intergenic - - 6 3244091 C A nonsynonymous Rv2930 A132E 3 3244113 T C synonymous Rv2930 P139P modern 3244414 G A nonsynonymous Rv2930 V240M 1 3247089 G A nonsynonymous Rv2931 G549S 3 3247298 C A synonymous Rv2931 G618G 3 3247319 C T synonymous Rv2931 G625G 3 3247340 G A synonymous Rv2931 V632V 6 3247579 G A nonsynonymous Rv2931 R712Q 1 3254758 A C synonymous Rv2932 P1229P modern 3254880 T G nonsynonymous Rv2932 L1270R 6 3255169 A G synonymous Rv2932 A1366A 5 3265806 A G nonsynonymous Rv2934 I1187V 4 3266030 G A synonymous Rv2934 S1261S modern 3271037 G A nonsynonymous Rv2935 D1101N 3 3273107 C A synonymous Rv2936 A298A modern 3273138 G C nonsynonymous Rv2936 D309H 1 3274545 G A synonymous Rv2938 L158L 5 3275857 G C synonymous Rv2939 L303L 2 3276703 A C nonsynonymous Rv2940c T2005P 6 3277599 C G nonsynonymous Rv2940c A1706G 1 3280132 C T nonsynonymous Rv2940c R862W 6 3281634 C T nonsynonymous Rv2940c A361V 6 3283592 G C synonymous Rv2941 G86G 2 3284855 C T synonymous Rv2941 I507I 6 3286107 C A synonymous Rv2942 V346V 6 3286566 C T synonymous Rv2942 A499A 5 3286789 G A nonsynonymous Rv2942 G574S 1 3293423 T C synonymous Rv2946c D977D 1 3293601 A G nonsynonymous Rv2946c Q918R 1 3295124 G A synonymous Rv2946c R410R modern 3296721 C G nonsynonymous Rv2947c R374G 5 3296934 G T nonsynonymous Rv2947c A303S 5 3296935 G T synonymous Rv2947c L302L 5 3297989 A G nonsynonymous Rv2948c I656V 5 3298691 A C synonymous Rv2948c R422R 1 3299413 C T nonsynonymous Rv2948c A181V 5 3300479 T G nonsynonymous Rv2949c V31G 3 3302589 A C intergenic - - modern 3302683 T C intergenic - - 2 3304966 G A nonsynonymous Rv2952 G176R 1 3306169 T C synonymous Rv2953 T297T 1 3306175 G C synonymous Rv2953 A299A 3 3306441 G A nonsynonymous Rv2953 R388Q 1 3306594 T G intergenic - - 1 3308446 A G nonsynonymous Rv2955c T34A 5 3309071 G A nonsynonymous Rv2956 G135D 5 3309916 C A nonsynonymous Rv2957 F149L modern 3311119 G C synonymous Rv2958c V294V 3 3312620 G T nonsynonymous Rv2959c E73D 1 3312942 G A intergenic - -

Appendix B. Lineage-specific SNPs
252
4 3314412 C T synonymous Rv2962c A237A 6 3317795 G C intergenic - - 5 3320271 G A nonsynonymous Rv2967c A926T 5 3325336 C T nonsynonymous Rv2970c A123V 1 3326150 A G nonsynonymous Rv2971 D17G 4 3326554 C A nonsynonymous Rv2971 H152N 1 3328495 C G synonymous Rv2973c R484R 1 3336528 T A intergenic - - 5 3345427 T C nonsynonymous Rv2988c S217P 6 3346980 G A nonsynonymous Rv2990c G247E 6 3348258 G A nonsynonymous Rv2991 A93T 3 3348536 C T intergenic - - 3 3349917 C T nonsynonymous Rv2992c H121Y 5 3351172 G A intergenic - - 1 3351472 G A stopgain Rv2994 W68X 6 3353082 C G synonymous Rv2995c T129T 3 3355949 A C nonsynonymous Rv2997 D284A 6 3356517 T C synonymous Rv2997 P473P 5 3356624 G C intergenic - - 3 3357464 C G intergenic - - 6 3363185 A T intergenic - - 5 3363584 G A synonymous Rv3004 T79T 1 3365841 C T nonsynonymous Rv3007c P204S 1 3366420 G C nonsynonymous Rv3007c G11R modern 3369869 T G intergenic - - modern 3371260 G A nonsynonymous Rv3011c V59I 1 3378828 G T nonsynonymous Rv3019c W58C 6 3383287 A G nonsynonymous Rv3024c K201R 3 3385218 G A nonsynonymous Rv3026c G287E 6 3389840 C A nonsynonymous Rv3030 T247N 5 3391138 G A nonsynonymous Rv3031 S406N 6 3393311 C T intergenic - - 3 3393640 C T synonymous Rv3033 N87N 5 3395038 G A intergenic - - 3 3395654 G A synonymous Rv3035 L92L 6 3395847 G T nonsynonymous Rv3035 V157F 5 3399945 A C nonsynonymous Rv3039c E80A 6 3400476 G T nonsynonymous Rv3040c A195S 1 3401850 C T synonymous Rv3041c D23D 1 3406798 G A nonsynonymous Rv3045 A172T 1 3407028 C T synonymous Rv3045 N248N 3 3413785 G A nonsynonymous Rv3051c V128I modern 3415332 G A intergenic - - 5 3416432 G A nonsynonymous Rv3055 V118I 5 3416630 G A nonsynonymous Rv3055 G184S 4 3420825 G A nonsynonymous Rv3059 G445D 1 3424462 G A synonymous Rv3061c L322L 6 3425523 T C intergenic - - 6 3425952 C A synonymous Rv3062 G123G 5 3426279 C A nonsynonymous Rv3062 S232R 1 3427632 C T synonymous Rv3063 A130A 3 3428897 G C nonsynonymous Rv3063 R552P 6 3429605 G A intergenic - -

Appendix B. Lineage-specific SNPs
253
1 3431407 G T intergenic - - 5 3431529 C T synonymous Rv3067 P34P 5 3433326 G A synonymous Rv3068c L99L 3 3437007 G C nonsynonymous Rv3074 A77P 6 3438386 C T synonymous Rv3075c I196I modern 3440542 G A synonymous Rv3077 G334G 1 3442240 G T stopgain Rv3079c E120X 5 3445777 G C nonsynonymous Rv3080c R71P 1 3447480 T G nonsynonymous Rv3082c L316R 1 3448714 G C nonsynonymous Rv3083 D71H 1 3453382 C T nonsynonymous Rv3087 A153V 4 3454263 G C nonsynonymous Rv3087 V447L 5 3457858 C A intergenic - - 3 3459081 G C nonsynonymous Rv3090 A291P 1 3460765 G C synonymous Rv3091 P550P 6 3463724 G T synonymous Rv3094c A56A modern 3464629 G A nonsynonymous Rv3096 G28E 4 3467465 C G synonymous Rv3098c A66A 1 3474597 C A synonymous Rv3106 V197V modern 3475159 G A nonsynonymous Rv3106 D385N 5 3478253 C A nonsynonymous Rv3109 A202E 5 3478767 G A intergenic - - 1 3479561 G A nonsynonymous Rv3111 D131N 6 3479798 G A synonymous Rv3112 G33G 4 3480789 C T nonsynonymous Rv3114 P11S 2 3487108 C T synonymous Rv3121 A200A 3 3488122 G A nonsynonymous Rv3122 G12R 6 3488556 G T nonsynonymous Rv3122 R156S 6 3488687 G A nonsynonymous Rv3123 R40Q 6 3489340 C G intergenic - - 3 3489665 C T nonsynonymous Rv3124 P54S 6 3493823 T C nonsynonymous Rv3128c L120S 5 3496002 A C nonsynonymous Rv3130c E122A 1 3497586 G C synonymous Rv3132c A560A modern 3498418 C T nonsynonymous Rv3132c T283I 5 3499247 G A nonsynonymous Rv3132c V7I 3 3499497 C G nonsynonymous Rv3133c A140G 5 3503284 A G intergenic - - 5 3504184 T A intergenic - - 5 3504410 C A nonsynonymous Rv3138 H72Q modern 3505005 C A nonsynonymous Rv3138 P271T 5 3506470 G A nonsynonymous Rv3139 A370T 6 3508970 A G synonymous Rv3141 E292E modern 3509091 C G intergenic - - 3 3509231 C T nonsynonymous Rv3142c R106C 3 3509301 C G synonymous Rv3142c V82V 5 3511335 T G intergenic - - 3 3515467 C T nonsynonymous Rv3150 P19L modern 3521044 G A nonsynonymous Rv3153 A180T 1 3526986 A G synonymous Rv3158 A399A 1 3530145 G T nonsynonymous Rv3161c D332Y 4 3530955 C G nonsynonymous Rv3161c L62V 1 3533759 C T synonymous Rv3164c P49P
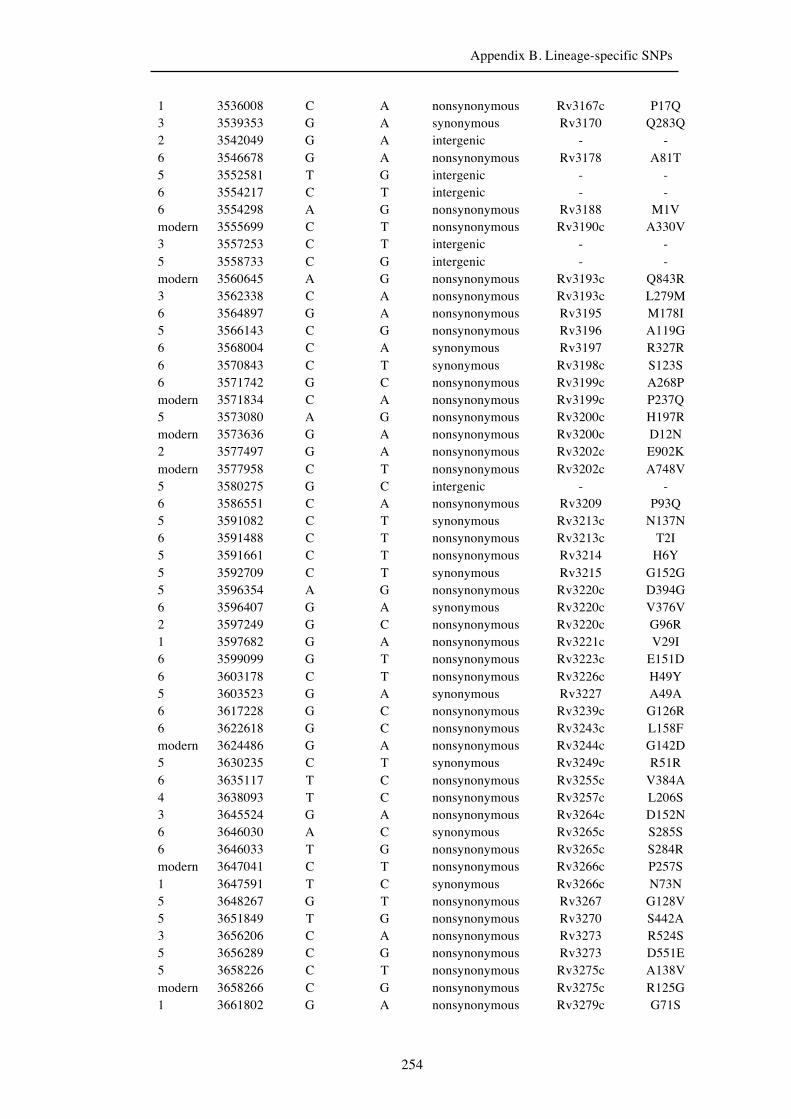
Appendix B. Lineage-specific SNPs
254
1 3536008 C A nonsynonymous Rv3167c P17Q 3 3539353 G A synonymous Rv3170 Q283Q 2 3542049 G A intergenic - - 6 3546678 G A nonsynonymous Rv3178 A81T 5 3552581 T G intergenic - - 6 3554217 C T intergenic - - 6 3554298 A G nonsynonymous Rv3188 M1V modern 3555699 C T nonsynonymous Rv3190c A330V 3 3557253 C T intergenic - - 5 3558733 C G intergenic - - modern 3560645 A G nonsynonymous Rv3193c Q843R 3 3562338 C A nonsynonymous Rv3193c L279M 6 3564897 G A nonsynonymous Rv3195 M178I 5 3566143 C G nonsynonymous Rv3196 A119G 6 3568004 C A synonymous Rv3197 R327R 6 3570843 C T synonymous Rv3198c S123S 6 3571742 G C nonsynonymous Rv3199c A268P modern 3571834 C A nonsynonymous Rv3199c P237Q 5 3573080 A G nonsynonymous Rv3200c H197R modern 3573636 G A nonsynonymous Rv3200c D12N 2 3577497 G A nonsynonymous Rv3202c E902K modern 3577958 C T nonsynonymous Rv3202c A748V 5 3580275 G C intergenic - - 6 3586551 C A nonsynonymous Rv3209 P93Q 5 3591082 C T synonymous Rv3213c N137N 6 3591488 C T nonsynonymous Rv3213c T2I 5 3591661 C T nonsynonymous Rv3214 H6Y 5 3592709 C T synonymous Rv3215 G152G 5 3596354 A G nonsynonymous Rv3220c D394G 6 3596407 G A synonymous Rv3220c V376V 2 3597249 G C nonsynonymous Rv3220c G96R 1 3597682 G A nonsynonymous Rv3221c V29I 6 3599099 G T nonsynonymous Rv3223c E151D 6 3603178 C T nonsynonymous Rv3226c H49Y 5 3603523 G A synonymous Rv3227 A49A 6 3617228 G C nonsynonymous Rv3239c G126R 6 3622618 G C nonsynonymous Rv3243c L158F modern 3624486 G A nonsynonymous Rv3244c G142D 5 3630235 C T synonymous Rv3249c R51R 6 3635117 T C nonsynonymous Rv3255c V384A 4 3638093 T C nonsynonymous Rv3257c L206S 3 3645524 G A nonsynonymous Rv3264c D152N 6 3646030 A C synonymous Rv3265c S285S 6 3646033 T G nonsynonymous Rv3265c S284R modern 3647041 C T nonsynonymous Rv3266c P257S 1 3647591 T C synonymous Rv3266c N73N 5 3648267 G T nonsynonymous Rv3267 G128V 5 3651849 T G nonsynonymous Rv3270 S442A 3 3656206 C A nonsynonymous Rv3273 R524S 5 3656289 C G nonsynonymous Rv3273 D551E 5 3658226 C T nonsynonymous Rv3275c A138V modern 3658266 C G nonsynonymous Rv3275c R125G 1 3661802 G A nonsynonymous Rv3279c G71S

Appendix B. Lineage-specific SNPs
255
4 3670040 A G synonymous Rv3289c A124A 1 3670118 C A synonymous Rv3289c G98G 1 3671532 C G nonsynonymous Rv3290c A88G 1 3671843 A C intergenic - - 1 3672105 C G nonsynonymous Rv3291c H65D 6 3673210 G T nonsynonymous Rv3292 G295C 2 3674157 T A nonsynonymous Rv3293 C186S 5 3674194 G C nonsynonymous Rv3293 G198A 1 3678091 G A synonymous Rv3296 P439P 3 3678094 C T synonymous Rv3296 A440A 2 3678249 A C nonsynonymous Rv3296 K492T 3 3679764 G A nonsynonymous Rv3296 S997N modern 3679949 G A nonsynonymous Rv3296 E1059K 6 3681349 C A synonymous Rv3297 T10T 4 3681548 C A synonymous Rv3297 R77R 1 3683237 C A synonymous Rv3299c A909A 1 3683715 A C nonsynonymous Rv3299c Q750P 5 3684169 G T nonsynonymous Rv3299c D599Y 5 3685487 G A synonymous Rv3299c L159L 3 3685510 A G nonsynonymous Rv3299c S152G 1 3687372 T C nonsynonymous Rv3301c L69S 6 3688648 C T synonymous Rv3302c R265R 4 3690016 C T nonsynonymous Rv3303c S308L 6 3693548 G A nonsynonymous Rv3306c A148T 4 3693681 G T synonymous Rv3306c A103A modern 3696181 G A nonsynonymous Rv3308 G440S 3 3697585 C T nonsynonymous Rv3310 L130F modern 3697708 G A nonsynonymous Rv3310 A171T 5 3701552 G A synonymous Rv3313c E211E 6 3702543 C T nonsynonymous Rv3314c R309W 1 3704261 C A nonsynonymous Rv3316 L54I 6 3705098 G A synonymous Rv3318 V33V 5 3705776 C T synonymous Rv3318 R259R 6 3706343 C T synonymous Rv3318 N448N 5 3708317 G A intergenic - - 5 3708768 C T synonymous Rv3322c A95A 3 3714639 G A nonsynonymous Rv3329 R83H 3 3715775 C T intergenic - - 3 3729342 C T nonsynonymous Rv3342 A240V modern 3743549 G A intergenic - - 1 3753414 T G intergenic - - modern 3753415 G C intergenic - - 6 3755443 G A intergenic - - 6 3767368 T G nonsynonymous Rv3351c V258G 1 3770325 G A nonsynonymous Rv3356c A109T 3 3771009 T G synonymous Rv3357 S79S modern 3771628 C A synonymous Rv3359 I95I modern 3772616 A G intergenic - - 1 3774506 C T synonymous Rv3364c G123G 2 3775409 A G nonsynonymous Rv3365c Q698R 2 3775441 T G nonsynonymous Rv3365c S687R 6 3775639 C A synonymous Rv3365c G621G 6 3776265 C A synonymous Rv3365c R413R
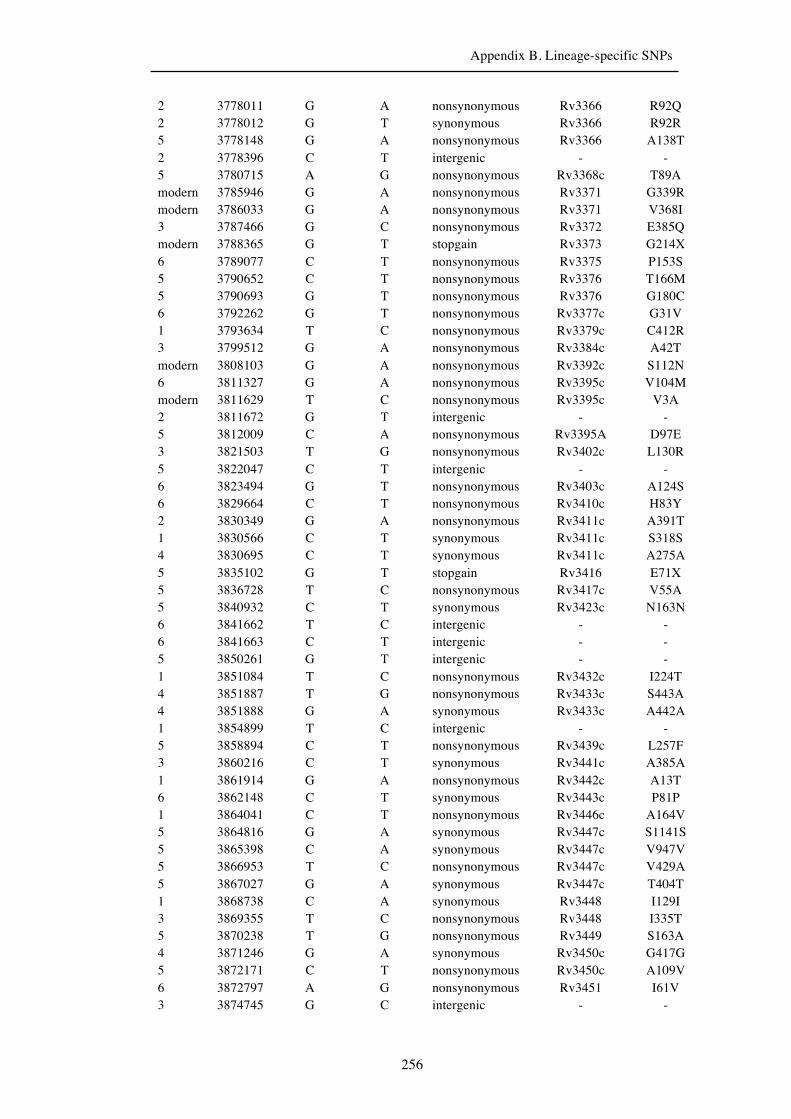
Appendix B. Lineage-specific SNPs
256
2 3778011 G A nonsynonymous Rv3366 R92Q 2 3778012 G T synonymous Rv3366 R92R 5 3778148 G A nonsynonymous Rv3366 A138T 2 3778396 C T intergenic - - 5 3780715 A G nonsynonymous Rv3368c T89A modern 3785946 G A nonsynonymous Rv3371 G339R modern 3786033 G A nonsynonymous Rv3371 V368I 3 3787466 G C nonsynonymous Rv3372 E385Q modern 3788365 G T stopgain Rv3373 G214X 6 3789077 C T nonsynonymous Rv3375 P153S 5 3790652 C T nonsynonymous Rv3376 T166M 5 3790693 G T nonsynonymous Rv3376 G180C 6 3792262 G T nonsynonymous Rv3377c G31V 1 3793634 T C nonsynonymous Rv3379c C412R 3 3799512 G A nonsynonymous Rv3384c A42T modern 3808103 G A nonsynonymous Rv3392c S112N 6 3811327 G A nonsynonymous Rv3395c V104M modern 3811629 T C nonsynonymous Rv3395c V3A 2 3811672 G T intergenic - - 5 3812009 C A nonsynonymous Rv3395A D97E 3 3821503 T G nonsynonymous Rv3402c L130R 5 3822047 C T intergenic - - 6 3823494 G T nonsynonymous Rv3403c A124S 6 3829664 C T nonsynonymous Rv3410c H83Y 2 3830349 G A nonsynonymous Rv3411c A391T 1 3830566 C T synonymous Rv3411c S318S 4 3830695 C T synonymous Rv3411c A275A 5 3835102 G T stopgain Rv3416 E71X 5 3836728 T C nonsynonymous Rv3417c V55A 5 3840932 C T synonymous Rv3423c N163N 6 3841662 T C intergenic - - 6 3841663 C T intergenic - - 5 3850261 G T intergenic - - 1 3851084 T C nonsynonymous Rv3432c I224T 4 3851887 T G nonsynonymous Rv3433c S443A 4 3851888 G A synonymous Rv3433c A442A 1 3854899 T C intergenic - - 5 3858894 C T nonsynonymous Rv3439c L257F 3 3860216 C T synonymous Rv3441c A385A 1 3861914 G A nonsynonymous Rv3442c A13T 6 3862148 C T synonymous Rv3443c P81P 1 3864041 C T nonsynonymous Rv3446c A164V 5 3864816 G A synonymous Rv3447c S1141S 5 3865398 C A synonymous Rv3447c V947V 5 3866953 T C nonsynonymous Rv3447c V429A 5 3867027 G A synonymous Rv3447c T404T 1 3868738 C A synonymous Rv3448 I129I 3 3869355 T C nonsynonymous Rv3448 I335T 5 3870238 T G nonsynonymous Rv3449 S163A 4 3871246 G A synonymous Rv3450c G417G 5 3872171 C T nonsynonymous Rv3450c A109V 6 3872797 A G nonsynonymous Rv3451 I61V 3 3874745 G C intergenic - -

Appendix B. Lineage-specific SNPs
257
5 3875633 A G nonsynonymous Rv3454 Y271C 5 3876305 C G nonsynonymous Rv3455c T214S 1 3876953 C T synonymous Rv3456c V160V 3 3880175 C A intergenic - - 5 3882025 G A synonymous Rv3464 L63L 6 3883278 A G nonsynonymous Rv3465 T149A 1 3883467 A G intergenic - - 6 3893290 C T nonsynonymous Rv3476c A144V 4 3893480 T C nonsynonymous Rv3476c F81L 4 3895727 A C intergenic - - 6 3898522 G A synonymous Rv3479 S901S modern 3898869 A C nonsynonymous Rv3479 N1017T 1 3899654 G T nonsynonymous Rv3480c R250L 5 3902782 G C nonsynonymous Rv3483c A11P 3 3908062 C T intergenic - - 4 3909235 C G nonsynonymous Rv3490 L334V 5 3909589 G A nonsynonymous Rv3490 G452R 1 3913737 C T synonymous Rv3495c A266A 3 3918649 A G synonymous Rv3499c G184G 5 3919261 G A nonsynonymous Rv3500c A268T 1 3920109 C A synonymous Rv3501c I251I 1 3921094 G A nonsynonymous Rv3502c R316H modern 3922836 C T synonymous Rv3504 D122D 5 3923267 A C nonsynonymous Rv3504 E266A 6 3939062 C G nonsynonymous Rv3510c L66V 5 3939405 G T intergenic - - 5 3945304 C G nonsynonymous Rv3513c Q149E 5 3951036 C G nonsynonymous Rv3515c Q479E 5 3953660 A C nonsynonymous Rv3517 Q77P 3 3954222 G C nonsynonymous Rv3517 E264D 5 3956535 G A synonymous Rv3520c V278V 5 3957514 C T intergenic - - 1 3958007 C T nonsynonymous Rv3521 H163Y 5 3964234 A T intergenic - - 6 3968375 C G synonymous Rv3531c S190S 6 3968618 C T synonymous Rv3531c T109T 2 3970594 C G intergenic - - 1 3974142 C T nonsynonymous Rv3535c P120L 2 3979990 G C nonsynonymous Rv3540c V224L 6 3980437 T G nonsynonymous Rv3540c S75A 6 3981329 C T nonsynonymous Rv3542c H218Y 4 3984321 T C synonymous Rv3545c H375H 1 3984926 C T synonymous Rv3545c L174L 5 3986987 G T synonymous Rv3547 L48L 5 3987180 G A nonsynonymous Rv3547 D113N 1 3989107 C T intergenic - - modern 3989914 T G nonsynonymous Rv3551 S7A 3 3990093 C T synonymous Rv3551 V66V 2 3993058 G A nonsynonymous Rv3554 G125E 3 3994101 A G nonsynonymous Rv3554 I473V modern 3994898 C T nonsynonymous Rv3555c R268W 6 3995060 G T nonsynonymous Rv3555c V214F 6 3999774 C T nonsynonymous Rv3559c A221V

Appendix B. Lineage-specific SNPs
258
5 3999805 A G nonsynonymous Rv3559c T211A 2 4001622 T C intergenic - - 6 4001813 G A synonymous Rv3561 V59V 6 4002847 C A nonsynonymous Rv3561 T404N 1 4003645 C T nonsynonymous Rv3562 A162V 6 4004907 A T nonsynonymous Rv3563 E206V 4 4005114 C G nonsynonymous Rv3563 S275W 5 4006943 G A synonymous Rv3565 V248V 3 4007272 G A nonsynonymous Rv3565 R358Q 6 4007432 G A nonsynonymous Rv3566c E251K 5 4008252 G A nonsynonymous Rv3566A G61D 4 4008747 C T nonsynonymous Rv3567c T179I 5 4008863 A G synonymous Rv3567c S140S 5 4011992 C T synonymous Rv3570c N93N modern 4012219 G A nonsynonymous Rv3570c D18N 5 4012274 C T intergenic - - 3 4012286 C T intergenic - - 1 4013076 G A synonymous Rv3571 G220G 1 4014431 G A synonymous Rv3573c P594P 1 4019103 G T intergenic - - 6 4021757 C A synonymous Rv3579c R213R 1 4022652 C T synonymous Rv3580c S384S 1 4024079 A G nonsynonymous Rv3581c Q90R 5 4026414 G A intergenic - - 1 4026800 G C synonymous Rv3585 A119A 4 4028752 G A nonsynonymous Rv3586 A288T 6 4031202 C A nonsynonymous Rv3589 A237D 5 4033260 C T intergenic - - 3 4033711 T C nonsynonymous Rv3591c V111A 6 4035242 C A nonsynonymous Rv3593 F297L 1 4040517 T C nonsynonymous Rv3596c V63A 5 4040824 G A intergenic - - 2 4041581 G A nonsynonymous Rv3598c A454T 5 4041899 A C nonsynonymous Rv3598c I348L 3 4044872 C T synonymous Rv3602c G113G 5 4045844 C T nonsynonymous Rv3603c T92I 6 4046218 G A intergenic - - 6 4051853 T C nonsynonymous Rv3610c V344A 3 4052349 A C nonsynonymous Rv3610c K179Q modern 4054637 C T synonymous Rv3614c G20G 4 4056416 A C intergenic - - 2 4056693 G T intergenic - - 3 4057036 A G intergenic - - 1 4058711 T C nonsynonymous Rv3618 L5S 3 4059186 G T synonymous Rv3618 A163A 5 4060201 C T nonsynonymous Rv3619c S23L 5 4062582 C G nonsynonymous Rv3623 A19G 6 4064918 G A nonsynonymous Rv3626c G329D 6 4067044 C T nonsynonymous Rv3627c A81V modern 4067152 T C nonsynonymous Rv3627c V45A 5 4067386 C T intergenic - - 6 4069598 T C nonsynonymous Rv3630 S142P 1 4069797 C T nonsynonymous Rv3630 S208L
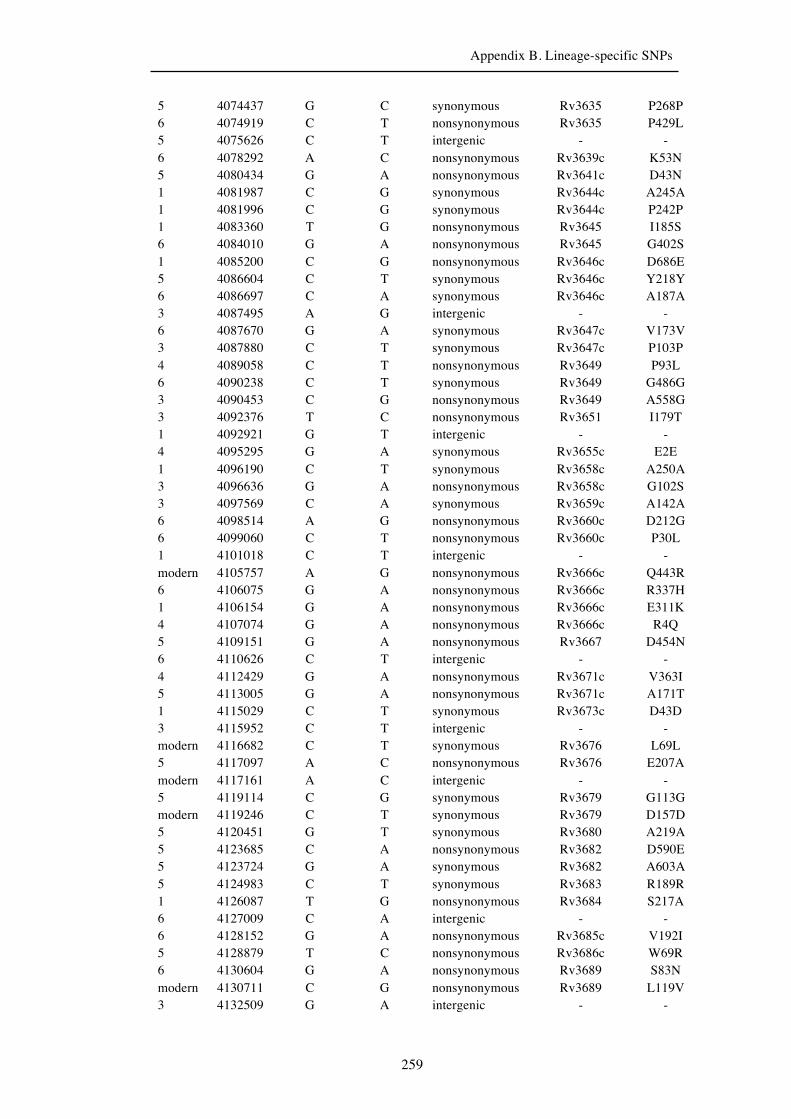
Appendix B. Lineage-specific SNPs
259
5 4074437 G C synonymous Rv3635 P268P 6 4074919 C T nonsynonymous Rv3635 P429L 5 4075626 C T intergenic - - 6 4078292 A C nonsynonymous Rv3639c K53N 5 4080434 G A nonsynonymous Rv3641c D43N 1 4081987 C G synonymous Rv3644c A245A 1 4081996 C G synonymous Rv3644c P242P 1 4083360 T G nonsynonymous Rv3645 I185S 6 4084010 G A nonsynonymous Rv3645 G402S 1 4085200 C G nonsynonymous Rv3646c D686E 5 4086604 C T synonymous Rv3646c Y218Y 6 4086697 C A synonymous Rv3646c A187A 3 4087495 A G intergenic - - 6 4087670 G A synonymous Rv3647c V173V 3 4087880 C T synonymous Rv3647c P103P 4 4089058 C T nonsynonymous Rv3649 P93L 6 4090238 C T synonymous Rv3649 G486G 3 4090453 C G nonsynonymous Rv3649 A558G 3 4092376 T C nonsynonymous Rv3651 I179T 1 4092921 G T intergenic - - 4 4095295 G A synonymous Rv3655c E2E 1 4096190 C T synonymous Rv3658c A250A 3 4096636 G A nonsynonymous Rv3658c G102S 3 4097569 C A synonymous Rv3659c A142A 6 4098514 A G nonsynonymous Rv3660c D212G 6 4099060 C T nonsynonymous Rv3660c P30L 1 4101018 C T intergenic - - modern 4105757 A G nonsynonymous Rv3666c Q443R 6 4106075 G A nonsynonymous Rv3666c R337H 1 4106154 G A nonsynonymous Rv3666c E311K 4 4107074 G A nonsynonymous Rv3666c R4Q 5 4109151 G A nonsynonymous Rv3667 D454N 6 4110626 C T intergenic - - 4 4112429 G A nonsynonymous Rv3671c V363I 5 4113005 G A nonsynonymous Rv3671c A171T 1 4115029 C T synonymous Rv3673c D43D 3 4115952 C T intergenic - - modern 4116682 C T synonymous Rv3676 L69L 5 4117097 A C nonsynonymous Rv3676 E207A modern 4117161 A C intergenic - - 5 4119114 C G synonymous Rv3679 G113G modern 4119246 C T synonymous Rv3679 D157D 5 4120451 G T synonymous Rv3680 A219A 5 4123685 C A nonsynonymous Rv3682 D590E 5 4123724 G A synonymous Rv3682 A603A 5 4124983 C T synonymous Rv3683 R189R 1 4126087 T G nonsynonymous Rv3684 S217A 6 4127009 C A intergenic - - 6 4128152 G A nonsynonymous Rv3685c V192I 5 4128879 T C nonsynonymous Rv3686c W69R 6 4130604 G A nonsynonymous Rv3689 S83N modern 4130711 C G nonsynonymous Rv3689 L119V 3 4132509 G A intergenic - -

Appendix B. Lineage-specific SNPs
260
2 4133316 A T nonsynonymous Rv3691 T267S 5 4133466 T C synonymous Rv3691 L317L 1 4133907 G A nonsynonymous Rv3692 R131H 5 4134341 G A nonsynonymous Rv3692 V276I 5 4134401 G A nonsynonymous Rv3692 A296T 5 4137136 G A intergenic - - 1 4137190 T C intergenic - - modern 4138377 C T nonsynonymous Rv3696c A460V 3 4138622 C T synonymous Rv3696c R378R 5 4139131 G A nonsynonymous Rv3696c E209K 6 4141285 C T nonsynonymous Rv3698 R265C 3 4142192 G A nonsynonymous Rv3699 G50E 1 4142689 G A nonsynonymous Rv3699 E216K 5 4144371 A G synonymous Rv3701c V182V 4 4145737 C T synonymous Rv3703c Y385Y 6 4148162 G T nonsynonymous Rv3704c A9S 5 4153687 C T intergenic - - 1 4155266 C G synonymous Rv3710 G469G modern 4156239 C T nonsynonymous Rv3711c A164V 4 4156503 A G nonsynonymous Rv3711c D76G 6 4158032 A C nonsynonymous Rv3712 K351T modern 4158361 G A synonymous Rv3713 P45P 1 4160536 C T synonymous Rv3716c G126G 5 4161854 G T synonymous Rv3718c V135V 1 4163558 G C nonsynonymous Rv3719 S418T 3 4166290 C T nonsynonymous Rv3721c H148Y 2 4167656 T C nonsynonymous Rv3722c M158T 1 4169719 C T synonymous Rv3724B A38A 6 4172173 A C nonsynonymous Rv3726 R251S 6 4173849 C T nonsynonymous Rv3727 R299C 2 4174131 G C nonsynonymous Rv3727 G393R 4 4179089 T C nonsynonymous Rv3729 S269P 6 4179391 G A stopgain Rv3729 W369X 2 4179832 G C nonsynonymous Rv3729 Q516H 2 4182387 G C synonymous Rv3731 V210V 6 4183288 G A nonsynonymous Rv3732 G119S 6 4183602 C T synonymous Rv3732 A223A 6 4186050 G T intergenic - - 6 4186864 C T synonymous Rv3736 I77I 1 4187063 G A nonsynonymous Rv3736 G144R 5 4189191 G T nonsynonymous Rv3737 R498L modern 4190532 C A intergenic - - 1 4190596 A C intergenic - - 5 4190639 G A intergenic - - 6 4192341 C T synonymous Rv3741c R171R 5 4192797 A G synonymous Rv3741c Q19Q 6 4193449 G C nonsynonymous Rv3743c G642A 6 4193641 T C nonsynonymous Rv3743c V578A 6 4195182 C T synonymous Rv3743c C64C 3 4195390 A T intergenic - - 3 4195799 C A synonymous Rv3744 G120G 6 4195897 C T synonymous Rv3745c L68L modern 4197189 G A intergenic - -
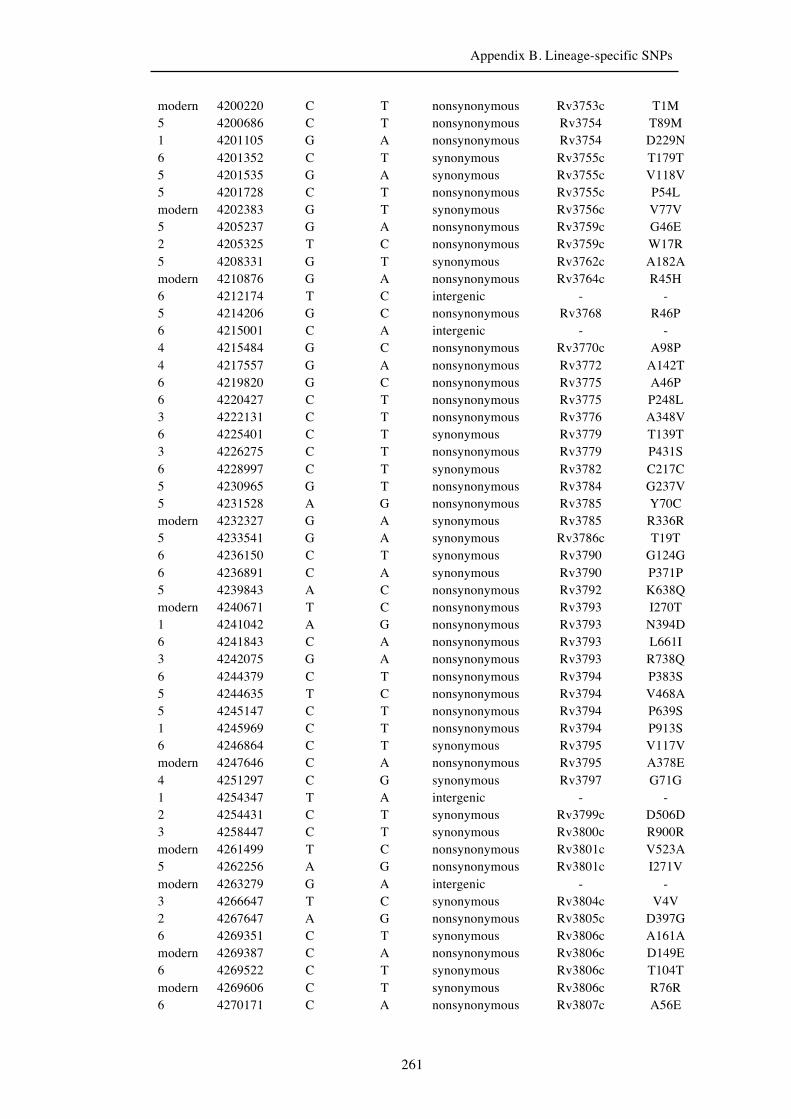
Appendix B. Lineage-specific SNPs
261
modern 4200220 C T nonsynonymous Rv3753c T1M 5 4200686 C T nonsynonymous Rv3754 T89M 1 4201105 G A nonsynonymous Rv3754 D229N 6 4201352 C T synonymous Rv3755c T179T 5 4201535 G A synonymous Rv3755c V118V 5 4201728 C T nonsynonymous Rv3755c P54L modern 4202383 G T synonymous Rv3756c V77V 5 4205237 G A nonsynonymous Rv3759c G46E 2 4205325 T C nonsynonymous Rv3759c W17R 5 4208331 G T synonymous Rv3762c A182A modern 4210876 G A nonsynonymous Rv3764c R45H 6 4212174 T C intergenic - - 5 4214206 G C nonsynonymous Rv3768 R46P 6 4215001 C A intergenic - - 4 4215484 G C nonsynonymous Rv3770c A98P 4 4217557 G A nonsynonymous Rv3772 A142T 6 4219820 G C nonsynonymous Rv3775 A46P 6 4220427 C T nonsynonymous Rv3775 P248L 3 4222131 C T nonsynonymous Rv3776 A348V 6 4225401 C T synonymous Rv3779 T139T 3 4226275 C T nonsynonymous Rv3779 P431S 6 4228997 C T synonymous Rv3782 C217C 5 4230965 G T nonsynonymous Rv3784 G237V 5 4231528 A G nonsynonymous Rv3785 Y70C modern 4232327 G A synonymous Rv3785 R336R 5 4233541 G A synonymous Rv3786c T19T 6 4236150 C T synonymous Rv3790 G124G 6 4236891 C A synonymous Rv3790 P371P 5 4239843 A C nonsynonymous Rv3792 K638Q modern 4240671 T C nonsynonymous Rv3793 I270T 1 4241042 A G nonsynonymous Rv3793 N394D 6 4241843 C A nonsynonymous Rv3793 L661I 3 4242075 G A nonsynonymous Rv3793 R738Q 6 4244379 C T nonsynonymous Rv3794 P383S 5 4244635 T C nonsynonymous Rv3794 V468A 5 4245147 C T nonsynonymous Rv3794 P639S 1 4245969 C T nonsynonymous Rv3794 P913S 6 4246864 C T synonymous Rv3795 V117V modern 4247646 C A nonsynonymous Rv3795 A378E 4 4251297 C G synonymous Rv3797 G71G 1 4254347 T A intergenic - - 2 4254431 C T synonymous Rv3799c D506D 3 4258447 C T synonymous Rv3800c R900R modern 4261499 T C nonsynonymous Rv3801c V523A 5 4262256 A G nonsynonymous Rv3801c I271V modern 4263279 G A intergenic - - 3 4266647 T C synonymous Rv3804c V4V 2 4267647 A G nonsynonymous Rv3805c D397G 6 4269351 C T synonymous Rv3806c A161A modern 4269387 C A nonsynonymous Rv3806c D149E 6 4269522 C T synonymous Rv3806c T104T modern 4269606 C T synonymous Rv3806c R76R 6 4270171 C A nonsynonymous Rv3807c A56E

Appendix B. Lineage-specific SNPs
262
5 4271348 C T nonsynonymous Rv3808c A311V 6 4271498 T C nonsynonymous Rv3808c L261P 6 4272211 G A synonymous Rv3808c V23V 5 4275241 C A synonymous Rv3811 L148L 1 4275935 A G nonsynonymous Rv3811 M380V 1 4276306 C T synonymous Rv3811 G503G 1 4280441 G T synonymous Rv3815c P116P 1 4281143 G C synonymous Rv3816c V143V 1 4281272 C T synonymous Rv3816c Y100Y 2 4284429 C T nonsynonymous Rv3820c P466L 3 4286826 A G nonsynonymous Rv3822 K36E 4 4287164 G A synonymous Rv3822 G148G modern 4287361 T C nonsynonymous Rv3822 V214A 6 4289216 G A nonsynonymous Rv3823c G772S modern 4289953 C T nonsynonymous Rv3823c A526V 2 4290135 G A synonymous Rv3823c L465L modern 4290564 A C synonymous Rv3823c A322A modern 4290827 C G nonsynonymous Rv3823c R235G 6 4292095 G T synonymous Rv3824c A360A 5 4292317 C T synonymous Rv3824c F286F 3 4292941 C T synonymous Rv3824c H78H 5 4293133 G C nonsynonymous Rv3824c W14C 5 4296229 A G nonsynonymous Rv3825c D1126G 1 4296381 C A synonymous Rv3825c T1075T 2 4301075 G C nonsynonymous Rv3826 E422Q 1 4303407 T G nonsynonymous Rv3829c S534R 6 4303554 C A synonymous Rv3829c G485G 6 4303675 T C nonsynonymous Rv3829c L445P 5 4304824 C G nonsynonymous Rv3829c P62R 3 4305243 C T nonsynonymous Rv3830c P148L 5 4306059 C T synonymous Rv3831 A101A 1 4306339 C A nonsynonymous Rv3832c A158E 1 4307344 C G nonsynonymous Rv3833 L160V 2 4308395 C T synonymous Rv3834c L174L 6 4308991 G A intergenic - - 4 4313128 T C nonsynonymous Rv3839 S122P 5 4313357 G A nonsynonymous Rv3839 R198H 1 4314843 C T synonymous Rv3842c D240D 6 4316322 G A nonsynonymous Rv3843c R92H modern 4316566 C G nonsynonymous Rv3843c R11G 5 4317750 C T intergenic - - modern 4318425 G C intergenic - - 5 4319352 T C synonymous Rv3845 A24A 2 4319985 G C intergenic - - 6 4320299 G A intergenic - - 5 4322042 G A nonsynonymous Rv3847 A169T modern 4323006 A G synonymous Rv3848 A227A 6 4326465 A G nonsynonymous Rv3854c I337V 5 4326928 C T synonymous Rv3854c G182G 5 4327103 G A nonsynonymous Rv3854c G124D 3 4328492 C T nonsynonymous Rv3856c A306V 5 4328644 T C synonymous Rv3856c R255R 4 4329782 A G intergenic - -

Appendix B. Lineage-specific SNPs
263
6 4330238 G A nonsynonymous Rv3858c R423H 6 4333284 A G nonsynonymous Rv3859c N933S modern 4334425 G C nonsynonymous Rv3859c E553Q modern 4336597 A C intergenic - - 3 4336991 C T nonsynonymous Rv3860 A72V 1 4337574 A G synonymous Rv3860 E266E 1 4338603 G A intergenic - - 5 4339610 G A synonymous Rv3863 L254L 6 4339880 C T synonymous Rv3863 A344A 5 4340964 A C nonsynonymous Rv3864 D232A 5 4340966 C A nonsynonymous Rv3864 L233I 5 4340999 G T nonsynonymous Rv3864 E244L 5 4341000 A T nonsynonymous Rv3864 E244V 5 4343653 G A nonsynonymous Rv3868 G114S 3 4343784 G A synonymous Rv3868 K157K 1 4344058 T C nonsynonymous Rv3868 S249P 5 4345036 A C intergenic - - 3 4345548 G A nonsynonymous Rv3869 M170I 6 4346843 C A synonymous Rv3870 T121T 5 4347337 C A nonsynonymous Rv3870 A286D 5 4357657 C T nonsynonymous Rv3879c A709V 1 4357773 C T synonymous Rv3879c T670T 2 4357804 A C nonsynonymous Rv3879c E660A 1 4357946 G A nonsynonymous Rv3879c G613S 6 4358866 C T nonsynonymous Rv3879c P306L 6 4359202 C T nonsynonymous Rv3879c S194F 5 4361250 T C nonsynonymous Rv3881c Y226H 6 4362384 G C nonsynonymous Rv3882c G346A 2 4362568 A C synonymous Rv3882c R285R 6 4364323 C T synonymous Rv3883c D145D 6 4365212 A G nonsynonymous Rv3884c N543D modern 4367649 C T synonymous Rv3885c Y291Y 1 4369499 C T synonymous Rv3886c P224P 5 4371331 G T nonsynonymous Rv3887c K118N 6 4372275 G A synonymous Rv3888c G144G 4 4372353 G C synonymous Rv3888c R118R modern 4374228 G A nonsynonymous Rv3891c A49T modern 4377033 G C synonymous Rv3894c S1140S 2 4378504 A G nonsynonymous Rv3894c D650G 6 4378608 C T synonymous Rv3894c Y615Y 6 4382296 A G nonsynonymous Rv3896c I186V 5 4382553 C T nonsynonymous Rv3896c A100V 1 4383442 A G nonsynonymous Rv3897c I67V 4 4383655 C T stopgain Rv3898c Q111X 4 4384007 G C intergenic - - modern 4385187 C T nonsynonymous Rv3899c P65S 6 4386257 C G nonsynonymous Rv3900c P18A 6 4386625 G A nonsynonymous Rv3901c V64M 5 4386746 A G nonsynonymous Rv3901c I23M 5 4387392 C T synonymous Rv3902c F168F 5 4387423 C T nonsynonymous Rv3902c S158F 5 4388976 C T nonsynonymous Rv3903c P486L 1 4390380 T C nonsynonymous Rv3903c V18A

Appendix B. Lineage-specific SNPs
264
6 4393838 C T synonymous Rv3908 L130L modern 4394210 C G nonsynonymous Rv3909 R7G modern 4395387 G A nonsynonymous Rv3909 S399N 3 4396495 C A synonymous Rv3909 G768G 5 4397110 G A nonsynonymous Rv3910 V172M 5 4397374 G A nonsynonymous Rv3910 A260T 5 4397763 C A synonymous Rv3910 P389P 6 4398223 C T nonsynonymous Rv3910 R543W 1 4398732 G A synonymous Rv3910 L712L 5 4399422 G A synonymous Rv3910 A942A 6 4400663 C G nonsynonymous Rv3911 R160G 5 4400947 C G nonsynonymous Rv3912 D26E 1 4401400 A G synonymous Rv3912 P177P 3 4401509 C T nonsynonymous Rv3912 R214W 4 4407588 G A synonymous Rv3919c A205A 1 4407873 G T synonymous Rv3919c V110V 6 4408570 C T nonsynonymous Rv3920c R110W modern 4408920 G A intergenic - - 4 4408923 T C intergenic - - 3 4409954 C G nonsynonymous Rv3921c A39G 1 4410386 C A synonymous Rv3922c R10R 1 4411016 G A intergenic - -

Appendix C: Lineage-specific SNPs within genes associated with drug resistance
265
Appendix C
Lineage-specific SNPs located within genes associated with M. tuberculosis drug
resistance, as identified in the TBDreaMDB database. Last column indicates drug
resistance: EMB, ethambutol; FLQ, flouroquinolones; INH, isoniazid; RIF, rifampicin;
SM, streptomycin.
Lineage Genomic position
Ancestral allele
Derived allele Mutation type Gene Mutation DR
5 408935 C T nonsynonymous Rv0340 A101V EMB 5 409079 G A nonsynonymous Rv0340 G149E EMB 6 1416633 G C nonsynonymous embR L239V EMB 1 1417019 C T nonsynonymous embR C110Y EMB 5 1507920 G A synonymous Rv1341 V116V EMB 3 3489665 C T nonsynonymous moaR1 P54S EMB 3 3645524 C T nonsynonymous manB D152N EMB 1 3647591 A G synonymous rmlD N73N EMB modern 3647041 G A nonsynonymous rmlD P257S EMB modern 4240671 T C nonsynonymous embC I270T EMB 1 4241042 A G nonsynonymous embC N394D EMB 6 4241843 C A nonsynonymous embC L661I EMB 3 4242075 G A nonsynonymous embC R738Q EMB 6 4244379 C T nonsynonymous embA P383S EMB 5 4244635 T C nonsynonymous embA V468A EMB 5 4245147 C T nonsynonymous embA P639S EMB 1 4245969 C T nonsynonymous embA P913S EMB 6 4246864 C T synonymous embB V117V EMB modern 4247646 C A nonsynonymous embB A378E EMB 6 1674434 T C nonsynonymous inhA V78A ETH 5 4326928 G A synonymous ethA G182G ETH 6 4326465 T C nonsynonymous ethA I337V ETH 5 4327103 C T nonsynonymous ethA G124D ETH 1 6112 G C nonsynonymous gyrB M330I FLQ modern 9143 C T synonymous gyrA I614I FLQ 5 9566 C T synonymous gyrA Y755Y FLQ 1 8452 C T nonsynonymous gyrA A384V FLQ 6 8493 C T nonsynonymous gyrA L398F FLQ 3 157129 C T nonsynonymous fbpC G158S INH modern 412280 G T nonsynonymous iniA Q481H INH 5 2101921 C T synonymous ndh S374S INH 6 2155503 G A synonymous katG T203T INH 4 2154724 A C nonsynonymous katG L463R INH 3 2516271 T C nonsynonymous Rv2242 M323T INH 5 2516804 A C synonymous fabD A6A INH modern 2518132 T C synonymous kasA T6T INH

Appendix C: Lineage-specific SNPs within genes associated with drug resistance
266
2 2521428 A G nonsynonymous accD6 D229G INH 1 2726051 G A nonsynonymous oxyR' L13F INH 5 3506470 G A nonsynonymous fadE24 A370T INH 6 4007432 C T nonsynonymous nat E251K INH
3 2726105 G A intergenic #N/A -
oxyR/ahpC upstream
3 762434 T G synonymous rpoB G876G RIF 4 763031 C T synonymous rpoB A1075A RIF 6 760969 C T nonsynonymous rpoB S388L RIF 6 761723 A C nonsynonymous rpoB E639D RIF
3 759746 C T intergenic #N/A -
rpoB upstream
4 4407588 C T synonymous gid A205A SM 1 4407873 C A synonymous gid V110V SM

Appendix D: Nonsynonymous/synonymous SNP ratio
267
Appendix D
Nonsynonymous to synonymous SNP ratios for the 28 genomes used in the study. A.
Ratio based on lineage branch SNPs. B. Ratio based on all SNPs within each of the 28
strains used in the study. This ratio therefore includes the singleton SNPs present in the
extant strains.
A. Lineage-specific SNPs (internal branches)
Lineage Nonsynonymous SNP Synonymous SNP Nonsynonymous /
Synonymous 1 238 156 1.5 5 385 213 1.8 6 374 206 1.8 2 74 33 2.2 3 182 117 1.6 4 96 46 2.1
Modern branch 172 78 2.2 Average - - 1.9

Appendix D: Nonsynonymous/synonymous SNP ratio
268
B. SNPs in external branches
Strain Lineage Nonsynonymous SNP Synonymous SNP Nonsynonymous /
Synonymous MTB_95_0545 1 473 296 1.7 MTB_K21 1 525 325 1.7 MTB_K67 1 495 313 1.6 MTB_K93 1 486 303 1.7 MTB_T17 1 464 317 1.4 MTB_T83 1 464 307 1.5 MTB_T92 1 506 314 1.7 MTB_N0070 1 489 331 1.4 MTB_N0072 1 491 341 1.4 MAF_11821_03 5 546 321 1.5 MAF_5444_04 5 523 329 1.2 MAF_4141_04 6 590 353 1.5 MAF_GM_0981 6 605 353 1.6 MTB_00_1695 2 527 259 2.0 MTB_98_1833 2 518 271 1.9 MTB_M4100A 2 506 279 1.8 MTB_T67 2 530 273 1.9 MTB_T85 2 534 273 1.9 MTB_N0031 2 514 256 2.0 MTB_91_0079 3 492 295 1.7 MTB_K49 3 490 282 1.9 MTB_SG1 3 525 301 1.9 MTB_4783_04 4 475 262 1.8 MTB_erdman 4 445 229 1.9 MTB_GM_1503 4 472 282 1.6 MTB_H37Rv 4 504 283 1.7 MTB_K37 4 440 242 1.8 MTB_KZN_605 4 461 249 1.8 Average - - - 1.7

Appendix E: RNA-seq differential expression
269
Appendix E
Differentially expressed genes, antisense and sRNAs between Lineage 1 and 2. A. Sense
transcription (gene expression). B. Antisense transcription. C. sRNAs.
A. Sense transcription (N=112)
Gene L
inea
ge 1
Lin
eage
2
Fold
ch
ange
p-value Functional category
Rv0027 76.2 28.5 2.7 1.23E-02 conserved hypotheticals Rv0028 58.1 23.5 2.5 1.51E-02 conserved hypotheticals Rv0082 126.5 35.7 3.5 9.27E-03 intermediary metabolism and
respiration Rv0130 htdZ 121.0 48.1 2.5 1.11E-02 intermediary metabolism and
respiration Rv0157A 144.8 66.1 2.2 1.85E-02 conserved hypotheticals Rv0193c 206.1 78.7 2.6 2.28E-02 conserved hypotheticals Rv0250c 322.7 780.7 0.4 3.71E-02 conserved hypotheticals Rv0275c 131.3 359.4 0.4 3.67E-02 regulatory proteins Rv0469 umaA 2628.7 1217.0 2.2 3.75E-02 lipid metabolism Rv0553 menC 361.9 57.8 6.3 1.79E-03 intermediary metabolism and
respiration Rv0554 bpoC 542.4 239.8 2.3 1.88E-02 virulence, detoxification,
adaptation Rv0557 mgtA 410.6 127.6 3.2 3.14E-05 lipid metabolism Rv0619 galTb 66.8 9.7 6.9 5.12E-07 intermediary metabolism and
respiration Rv0620 galK 37.7 1.0 39.3 5.12E-07 intermediary metabolism and
respiration Rv0653c 156.2 53.2 2.9 1.34E-02 regulatory proteins Rv0686 159.6 477.5 0.3 5.00E-04 cell wall and cell processes Rv0724A 210.0 58.6 3.6 4.84E-03 conserved hypotheticals Rv0783c emrB 544.3 244.1 2.2 3.58E-02 cell wall and cell processes Rv0847 lpqS 236.7 46.7 5.1 1.00E-02 cell wall and cell processes Rv0877 991.9 431.9 2.3 4.03E-02 conserved hypotheticals Rv0890c 1871.3 872.9 2.1 1.65E-02 regulatory proteins Rv1044 79.3 27.5 2.9 7.62E-03 conserved hypotheticals Rv1075c 755.3 298.4 2.5 1.85E-02 cell wall and cell processes Rv1103c mazE3 126.3 57.7 2.2 3.57E-02 virulence, detoxification,
adaptation Rv1233c 5340.6 1249.2 4.3 3.08E-02 cell wall and cell processes Rv1397c vapC10 86.0 862.7 0.1 6.10E-04 virulence, detoxification,
adaptation Rv1433 1469.9 414.0 3.6 4.09E-04 cell wall and cell processes Rv1440 secG 990.7 376.2 2.6 1.99E-02 cell wall and cell processes

Appendix E: RNA-seq differential expression
270
Rv1503c 462.9 55.1 8.4 3.35E-04 conserved hypotheticals Rv1504c 355.2 30.8 11.5 6.04E-15 conserved hypotheticals Rv1505c 1726.9 137.5 12.6 2.53E-19 conserved hypotheticals Rv1506c 475.6 205.2 2.3 4.06E-03 unknown Rv1508c 1550.0 731.3 2.1 4.45E-02 cell wall and cell processes Rv1530 adh 162.8 71.4 2.3 3.65E-02 intermediary metabolism and
respiration Rv1541c lprI 283.8 135.2 2.1 2.20E-02 cell wall and cell processes Rv1551 plsB1 401.3 90.9 4.4 1.25E-06 lipid metabolism Rv1592c 3281.5 701.5 4.7 1.12E-06 conserved hypotheticals Rv1661 pks7 389.2 957.0 0.4 2.07E-03 lipid metabolism Rv1699 pyrG 1516.8 790.4 1.9 3.12E-02 intermediary metabolism and
respiration Rv1733c 24.0 60.9 0.4 2.28E-02 cell wall and cell processes Rv1749c 767.2 404.9 1.9 2.84E-02 cell wall and cell processes Rv1778c 1019.2 404.1 2.5 2.14E-03 conserved hypotheticals Rv1781c malQ 211.9 94.3 2.2 3.08E-02 intermediary metabolism and
respiration Rv1895 275.9 74.4 3.7 7.17E-05 intermediary metabolism and
respiration Rv1912c fadB5 969.7 451.6 2.1 1.65E-02 lipid metabolism Rv1918c PPE35 536.3 1278.3 0.4 1.51E-02 PE/PPE Rv1925 fadD31 728.0 2531.8 0.3 3.80E-05 lipid metabolism Rv1926c mpt63 12021.3 3363.3 3.6 4.29E-02 cell wall and cell processes Rv1929c 1032.0 430.0 2.4 1.11E-02 conserved hypotheticals Rv1979c 250.3 540.7 0.5 1.28E-02 cell wall and cell processes Rv1980c mpt64 914.6 2468.6 0.4 1.28E-02 cell wall and cell processes Rv1981c nrdF1 4224.9 971.0 4.4 1.10E-07 information pathways Rv2051c ppm1 1963.9 901.7 2.2 3.97E-02 cell wall and cell processes Rv2063 mazE7 1210.6 77.3 15.7 2.38E-03 virulence, detoxification,
adaptation Rv2063A mazF7 153.6 31.1 4.9 8.05E-07 virulence, detoxification,
adaptation Rv2080 lppJ 358.4 64.7 5.5 5.36E-09 cell wall and cell processes Rv2090 224.9 92.5 2.4 2.40E-02 information pathways Rv2144c 4074.8 1755.5 2.3 1.56E-02 cell wall and cell processes Rv2161c 62.6 802.9 0.1 1.50E-13 intermediary metabolism and
respiration Rv2189c 51.9 159.3 0.3 6.10E-04 conserved hypotheticals Rv2211c gcvT 2460.5 1131.1 2.2 3.61E-02 intermediary metabolism and
respiration Rv2243 fabD 1747.5 756.7 2.3 3.44E-03 lipid metabolism Rv2274A mazE8 62.8 19.4 3.2 8.15E-03 virulence, detoxification,
adaptation Rv2331 182.0 59.7 3.0 4.86E-03 conserved hypotheticals Rv2428 ahpC 1089.1 326.6 3.3 6.31E-05 virulence, detoxification,
adaptation Rv2429 ahpD 307.3 129.9 2.4 1.49E-02 virulence, detoxification,
adaptation Rv2478c 171.7 54.6 3.1 3.58E-02 conserved hypotheticals Rv2497c bkdA 2822.7 1525.3 1.9 3.58E-02 intermediary metabolism and
respiration Rv2518c ldtB 1508.5 383.2 3.9 2.99E-03 cell wall and cell processes

Appendix E: RNA-seq differential expression
271
Rv2525c 1076.0 520.7 2.1 1.77E-02 conserved hypotheticals Rv2526 vapB17 233.2 1505.4 0.2 3.34E-09 virulence, detoxification,
adaptation Rv2527 vapC17 60.2 553.3 0.1 3.02E-10 virulence, detoxification,
adaptation Rv2528c mrr 113.5 49.2 2.3 1.37E-02 information pathways Rv2573 50.5 14.5 3.5 2.48E-03 conserved hypotheticals Rv2596 vapC40 215.1 96.2 2.2 4.57E-02 virulence, detoxification,
adaptation Rv2697c dut 2014.8 642.7 3.1 6.63E-04 intermediary metabolism and
respiration Rv2707 1353.7 592.0 2.3 1.02E-02 conserved hypotheticals Rv2719c 358.6 130.3 2.8 3.14E-04 cell wall and cell processes Rv2729c 292.2 125.2 2.3 3.58E-02 cell wall and cell processes Rv2758c vapB21 599.5 242.1 2.5 1.37E-02 virulence, detoxification,
adaptation Rv2765 413.4 55.8 7.4 2.21E-11 intermediary metabolism and
respiration Rv2809 763.7 361.3 2.1 2.96E-02 conserved hypotheticals Rv2830c vapB22 290.5 101.5 2.9 1.81E-03 virulence, detoxification,
adaptation Rv2843 215.4 88.0 2.4 2.71E-02 cell wall and cell processes Rv2870c dxr 1241.2 419.3 3.0 2.63E-03 intermediary metabolism and
respiration Rv2938 drrC 708.9 264.5 2.7 2.99E-03 cell wall and cell processes Rv2952 1325.5 666.5 2.0 3.08E-02 intermediary metabolism and
respiration Rv3082c virS 780.3 45.8 17.0 4.09E-20 regulatory proteins Rv3167c 92.0 24.8 3.7 5.19E-05 regulatory proteins Rv3168 1695.7 343.5 4.9 1.25E-06 conserved hypotheticals Rv3196A 134.0 342.0 0.4 3.75E-02 conserved hypotheticals Rv3198c uvrD2 510.1 1224.9 0.4 1.44E-02 information pathways Rv3233c 159.0 747.3 0.2 1.27E-06 lipid metabolism Rv3242c 19.2 54.7 0.4 2.81E-02 conserved hypotheticals Rv3350c PPE56 818.8 318.3 2.6 2.66E-02 PE/PPE Rv3366 spoU 42.5 201.8 0.2 4.35E-06 information pathways Rv3389c htdY 1481.1 504.3 2.9 2.07E-03 intermediary metabolism and
respiration Rv3415c 307.7 89.3 3.4 4.15E-04 conserved hypotheticals Rv3435c 2667.0 826.7 3.2 4.09E-04 cell wall and cell processes Rv3446c 153.0 13.7 11.2 3.58E-06 conserved hypotheticals Rv3500c yrbE4B 1711.8 469.8 3.6 5.19E-05 virulence, detoxification,
adaptation Rv3540c ltp2 1111.1 355.3 3.1 6.08E-03 lipid metabolism Rv3652 PE_PGRS
60 1200.2 74.1 16.2 1.27E-16 PE/PPE
Rv3679 413.8 4344.3 0.1 2.55E-04 cell wall and cell processes Rv3680 570.5 2840.3 0.2 1.25E-06 cell wall and cell processes Rv3695 58.3 268.2 0.2 1.60E-05 cell wall and cell processes Rv3741c 35.7 10.3 3.5 1.85E-02 intermediary metabolism and
respiration Rv3742c 90.7 23.8 3.8 1.05E-02 intermediary metabolism and
respiration

Appendix E: RNA-seq differential expression
272
Rv3810 pirG 1826.3 879.2 2.1 2.61E-02 cell wall and cell processes Rv3812 PE_PGRS
62 219.3 86.9 2.5 6.39E-03 PE/PPE
Rv3829c 409.9 8412.8 0.05 6.32E-05 intermediary metabolism and respiration
Rv3831 52.4 739.0 0.1 1.02E-02 conserved hypotheticals
B. Antisense transcription (N=56)
Gene
Lin
eage
1
Lin
eage
2
Fold
ch
ange
p-value Functional category
Rv0213c 1389.4 539.0 2.6 3.64E-02 intermediary metabolism and respiration
Rv0345 241.8 787.6 0.3 3.82E-02 conserved hypotheticals Rv0354c PPE7 168.2 600.4 0.3 1.04E-02 PE/PPE Rv0423c thiC 43.2 7.7 5.6 1.98E-02 intermediary metabolism and
respiration Rv0440 groEL2 154.3 14.0 11.0 2.59E-07 virulence, detoxification,
adaptation Rv0470c pcaA 844.3 205.3 4.1 8.88E-04 lipid metabolism Rv0482 murB 19.2 67.9 0.3 4.10E-02 cell wall and cell processes Rv0524 hemL 31.2 123.2 0.3 3.95E-02 intermediary metabolism and
respiration Rv0552 744.1 86.1 8.6 8.11E-08 conserved hypotheticals Rv0557 mgtA 161.8 23.9 6.8 2.19E-04 lipid metabolism Rv0635 hadA 36.2 3.1 11.8 3.70E-02 intermediary metabolism and
respiration Rv0682 rpsL 14.4 0.0 inf 2.29E-02 information pathways Rv0689c 56.2 243.1 0.2 1.81E-02 conserved hypotheticals Rv0842 3.6 528.6 0.01 6.42E-06 cell wall and cell processes Rv0870c 209.3 32.2 6.5 1.52E-04 cell wall and cell processes Rv0874c 120.3 590.0 0.2 6.52E-04 conserved hypotheticals Rv0970 30.3 109.0 0.3 3.82E-02 cell wall and cell processes Rv1087A 68.1 285.9 0.2 2.21E-02 cell wall and cell processes Rv1093 glyA1 119.7 8.2 14.7 5.96E-03 intermediary metabolism and
respiration Rv1253 deaD 15.1 624.0 0.02 2.67E-16 information pathways Rv1453 73.4 222.7 0.3 4.10E-02 regulatory proteins Rv1477 ripA 243.7 87.4 2.8 4.77E-02 virulence, detoxification,
adaptation Rv1505c 31.1 121.8 0.3 1.98E-02 conserved hypotheticals Rv1567c 109.9 353.7 0.3 2.30E-02 cell wall and cell processes Rv1700 161.4 3.2 49.7 2.50E-02 information pathways Rv1898 10.6 138.7 0.1 1.09E-02 conserved hypotheticals Rv1900c lipJ 27.9 99.7 0.3 4.62E-02 intermediary metabolism and
respiration
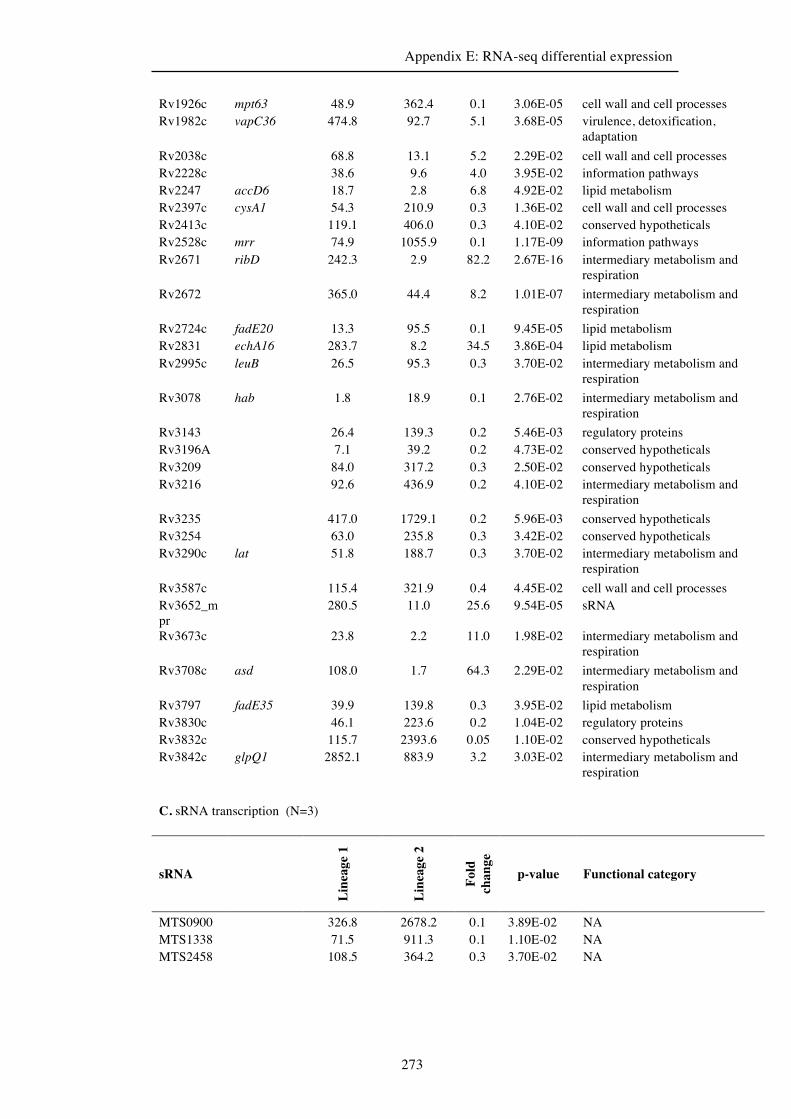
Appendix E: RNA-seq differential expression
273
Rv1926c mpt63 48.9 362.4 0.1 3.06E-05 cell wall and cell processes Rv1982c vapC36 474.8 92.7 5.1 3.68E-05 virulence, detoxification,
adaptation Rv2038c 68.8 13.1 5.2 2.29E-02 cell wall and cell processes Rv2228c 38.6 9.6 4.0 3.95E-02 information pathways Rv2247 accD6 18.7 2.8 6.8 4.92E-02 lipid metabolism Rv2397c cysA1 54.3 210.9 0.3 1.36E-02 cell wall and cell processes Rv2413c 119.1 406.0 0.3 4.10E-02 conserved hypotheticals Rv2528c mrr 74.9 1055.9 0.1 1.17E-09 information pathways Rv2671 ribD 242.3 2.9 82.2 2.67E-16 intermediary metabolism and
respiration Rv2672 365.0 44.4 8.2 1.01E-07 intermediary metabolism and
respiration Rv2724c fadE20 13.3 95.5 0.1 9.45E-05 lipid metabolism Rv2831 echA16 283.7 8.2 34.5 3.86E-04 lipid metabolism Rv2995c leuB 26.5 95.3 0.3 3.70E-02 intermediary metabolism and
respiration Rv3078 hab 1.8 18.9 0.1 2.76E-02 intermediary metabolism and
respiration Rv3143 26.4 139.3 0.2 5.46E-03 regulatory proteins Rv3196A 7.1 39.2 0.2 4.73E-02 conserved hypotheticals Rv3209 84.0 317.2 0.3 2.50E-02 conserved hypotheticals Rv3216 92.6 436.9 0.2 4.10E-02 intermediary metabolism and
respiration Rv3235 417.0 1729.1 0.2 5.96E-03 conserved hypotheticals Rv3254 63.0 235.8 0.3 3.42E-02 conserved hypotheticals Rv3290c lat 51.8 188.7 0.3 3.70E-02 intermediary metabolism and
respiration Rv3587c 115.4 321.9 0.4 4.45E-02 cell wall and cell processes Rv3652_mpr
280.5 11.0 25.6 9.54E-05 sRNA
Rv3673c 23.8 2.2 11.0 1.98E-02 intermediary metabolism and respiration
Rv3708c asd 108.0 1.7 64.3 2.29E-02 intermediary metabolism and respiration
Rv3797 fadE35 39.9 139.8 0.3 3.95E-02 lipid metabolism Rv3830c 46.1 223.6 0.2 1.04E-02 regulatory proteins Rv3832c 115.7 2393.6 0.05 1.10E-02 conserved hypotheticals Rv3842c glpQ1 2852.1 883.9 3.2 3.03E-02 intermediary metabolism and
respiration C. sRNA transcription (N=3)
sRNA
Lin
eage
1
Lin
eage
2
Fold
ch
ange
p-value Functional category
MTS0900 326.8 2678.2 0.1 3.89E-02 NA MTS1338 71.5 911.3 0.1 1.10E-02 NA MTS2458 108.5 364.2 0.3 3.70E-02 NA

Appendix F: Functional categories
274
Appendix F
Functional category representation for differentially expressed genes. Toxin-antitoxins
were found to be significantly over-represented.
Functional class N
umbe
r of
gen
es
anno
tate
d in
ge
nom
e
Diff
eren
tially
ex
pres
sed
gene
s
Diff
eren
tially
ex
pres
sed
gene
s (%
)
Rep
rese
ntat
ion
(fol
d ch
ange
from
ex
pect
ed)
χ2 (a
djus
ted
p-
valu
e)
information pathways 243 5 4.5 0.7 0.97 intermediary metabolism and respiration 925 20 17.9 0.8 0.47
PE/PPE 168 4 3.6 0.9 0.97 regulatory proteins 198 5 4.5 0.9 0.97 conserved hypotheticals 1042 27 24.1 0.9 0.97 lipid metabolism 271 9 8.0 1.2 0.47 cell wall and cell processes 773 27 24.1 1.3 0.97
virulence, detoxification, adaptation 112 4 3.6 1.3 0.97
unknown 16 1 0.9 2.2 0.97 toxin-antitoxins 124 10 8.9 2.9 0.03

Appendix G: Publications
275
Appendix G
List of Publications
Rose, G., Cortes, T., Comas, I., Coscolla, M., Gagneux. S. & Young, D. B. (2013).
Mapping genotype-phenotype diversity amongst clinical isolates of Mycobacterium
tuberculosis by sequence based profiling. Under review.
Cortes, T., Schubert, O., Rose, G., Arnvig, K. B., Comas, I., Aebersold, R. &
Young, D. B. (2013). Genome-wide mapping of transcriptional start sites defines an
extensive leaderless transcriptome in Mycobacterium tuberculosis. Under review.
Kato-Maeda, M., Ho, C., Passarelli, B., Banaei, N., Grinsdale, J., Flores, L.,
Anderson, J., Murray, M., Rose, G., Kawamura, L. M., Pourmand, N., Tariq, M.
A., Gagneux, S., Hopewell, P. C. (2013). Use of Whole Genome Sequencing to
Determine the Microevolution of Mycobacterium tuberculosis during an Outbreak. PLoS
One. 8(3) e58235.
Muller, B., Borrell, S., Rose, G. & Gagneux, S. (2012). The heterogeneous evolution
of multidrug-resistant Mycobacterium tuberculosis. Trends Genet. 29(3) 160-9.
Comas, I., Borrell, S., Roetzer, A., Rose, G., Malla, B., Kato-Maeda, M., Galagan,
J., Niemann, S. & Gagneux, S. (2011). Whole-genome sequencing of rifampicin-
resistant Mycobacterium tuberculosis strains identifies compensatory mutations in RNA
polymerase genes. Nat Genet 44(1) 106-110.
Arnvig, K. B., Comas, I., Thomson, N. R., Houghton, J., Boshoff, H. I., Croucher,
N. J., Rose, G., Perkins, T. T., Parkhill, J., Dougan, G. & Young, D. B. (2011).
Sequence-based analysis uncovers an abundance of non-coding RNA in the total
transcriptome of Mycobacterium tuberculosis. PLoS Pathog 7(11) e1002342.