Quantitative Lineage Analysis of the Origin of Frog Primary ...
Upload
khangminh22Category
view
0download
0
Evolutionary recruitment and assembly of embryonic alternative splicing programs: insights form the
Deuterostomia lineage
Demian Burguera Hernández
ADVERTIMENT. La consulta d’aquesta tesi queda condicionada a l’acceptació de les següents condicions d'ús: La difusió d’aquesta tesi per mitjà del servei TDX (www.tdx.cat) i a través del Dipòsit Digital de la UB (diposit.ub.edu) ha estat autoritzada pels titulars dels drets de propietat intel·lectual únicament per a usos privats emmarcats en activitats d’investigació i docència. No s’autoritza la seva reproducció amb finalitats de lucre ni la seva difusió i posada a disposició des d’un lloc aliè al servei TDX ni al Dipòsit Digital de la UB. No s’autoritza la presentació del seu contingut en una finestra o marc aliè a TDX o al Dipòsit Digital de la UB (framing). Aquesta reserva de drets afecta tant al resum de presentació de la tesi com als seus continguts. En la utilització o cita de parts de la tesi és obligat indicar el nom de la persona autora. ADVERTENCIA. La consulta de esta tesis queda condicionada a la aceptación de las siguientes condiciones de uso: La difusión de esta tesis por medio del servicio TDR (www.tdx.cat) y a través del Repositorio Digital de la UB (diposit.ub.edu) ha sido autorizada por los titulares de los derechos de propiedad intelectual únicamente para usos privados enmarcados en actividades de investigación y docencia. No se autoriza su reproducción con finalidades de lucro ni su difusión y puesta a disposición desde un sitio ajeno al servicio TDR o al Repositorio Digital de la UB. No se autoriza la presentación de su contenido en una ventana o marco ajeno a TDR o al Repositorio Digital de la UB (framing). Esta reserva de derechos afecta tanto al resumen de presentación de la tesis como a sus contenidos. En la utilización o cita de partes de la tesis es obligado indicar el nombre de la persona autora. WARNING. On having consulted this thesis you’re accepting the following use conditions: Spreading this thesis by the TDX (www.tdx.cat) service and by the UB Digital Repository (diposit.ub.edu) has been authorized by the titular of the intellectual property rights only for private uses placed in investigation and teaching activities. Reproduction with lucrative aims is not authorized nor its spreading and availability from a site foreign to the TDX service or to the UB Digital Repository. Introducing its content in a window or frame foreign to the TDX service or to the UB Digital Repository is not authorized (framing). Those rights affect to the presentation summary of the thesis as well as to its contents. In the using or citation of parts of the thesis it’s obliged to indicate the name of the author.

EVOLUTIONARY RECRUITMENT AND ASSEMBLY OF EMBRYONIC ALTERNATIVE SPLICING PROGRAMS
Insights from the Deuterostomia lineage
Memòria presentada per en Demian Burguera Hernández
per optar al títol de Doctor
Tesi realitzada sota la direcció del Dr. Jordi Garcia Fernàndez i el Dr. Manuel Irimia al Departament de Genètica, Microbiologia i Estadística de
la Universitat de Barcelona
Dr. Jordi Garcia Fernàndez Dr. Manuel Irimia Demian Burguera Director de la tesi director de la tesi autor
Maig 2017


Per als qui promouen el pensament crític i l’organització horitzontal col·lectiva
com a eines fonamentals vers l’emancipació popular.


“Las falacias y las flaquezas del pensamiento humano generan problemas sistemáticos y predecibles cuando intentamos comprender las complejidades de la realidad externa.
Entre estos puntos débiles, nuestros intentos persistentes de construir sistemas que son hermosos en abstracto, lógicamente impecables y globalmente simplificados, siempre
nos hacen salir del camino.”
Stephen Jay Gould, Lying stones from Marrakech.


ÍNDICE
INTRODUCCIÓN ........................................................................................................... 1
Macroevolución y las causas orgánicas de la complejidad biológica .............................. 3
Del genoma al organismo: la importancia de establecer conexiones. ............................... 6
Distintos elementos del genoma, el transcriptoma y el proteoma coordinan juntos la
regulación génica .............................................................................................................. 8
Splicing alternativo y su conexión con la estructura génica ............................................ 10
Impacto funcional de los eventos de splicing alternativo ................................................ 13
Dinámicas evolutivas globales de la regulación génica mediante splicing alternativo ... 16
Mecanismos moleculares de regulación del splicing alternativo .................................... 17
Factores de splicing alternativo involucrados en el desarrollo embrionario .................. 19
Evolución y características de los organismos deuteróstomos ........................................ 21
Strongylocentrotus purpuratus ...................................................................................... 24
Brachiostoma lanceolatum ............................................................................................ 26
Ciona intestinalis .......................................................................................................... 29
Danio rerio .................................................................................................................... 32
OBJETIVOS .................................................................................................................. 37
RESULTADOS .............................................................................................................. 39
Capítulo 1: Preliminary insights into the tissue-regulated alternative splicing landscape
in deuterostome species .................................................................................................. 43
Capítulo 2: Characterization of RbFox and Nova ontogenetic functions in sea urchin
and the evolution of their expression patterns across distant species .............................. 51
Nova function is involved in gastrulation movements in sea urchin embryo ............... 51

RbFox activity is conserved in the myogenic mesoderm and co-opted into lineage-
specific developmental processes among deuterostomes. ............................................... 56
Capítulo 3: Evolutionary recruitment of flexible Esrp-dependent splicing programs into
diverse embryonic morphogenetic processes .................................................................. 67
esrp1 and esrp2 involved in multiple morphogenetic processes in zebrafish .............. 67
Esrp is able to modulate the motility of the mesenchymal cell lineage in Ciona ........ 71
Esrp expression in amphioxus embryos ........................................................................ 75
Evolutionary comparison of Esrp-dependent programs ............................................... 78
Regulation of Fgfr regulation is conserved across chordate phylum ............................ 81
Fgfr AS evolved independently in multiple Bilateria lineages ..................................... 83
Figuras suplementarias ................................................................................................. 85
MÉTODOS ................................................................................................................... 101
DISCUSIÓN ................................................................................................................. 115
Patrones macroevolutivos del splicing específico de tejido en deuteróstomos ............. 115
Evolución de la expresión y función ontogénica de los factores RbFox y Nova ............ 119
Reclutamiento de programas de splicing dependientes de los factores Esrp en diversos
procesos morfogenéticos de deuteróstomos .................................................................. 124
Reflexión general sobre la evolución de los programas de AS .................................... 128
CONCLUSIONES ....................................................................................................... 133
BIBLIOGRAFÍA ......................................................................................................... 137
ANEXO ......................................................................................................................... 157

INTRODUCCIÓN

Introducción
3
Macroevolución y las causas orgánicas de la complejidad biológica.
Desde la aparición de los primeros organismos en el registro fósil, hemos observado la
huella de formas de vida poblando el planeta a lo largo de su cronología. Con la suficiente
perspectiva geológica, cada época temporal presenta organismos morfológicamente
diferentes en mayor o menor grado. Hoy en día sabemos que estos organismos están
relacionados con las formas predecesoras y, en ocasiones, también con las posteriores. La
transformación de los seres vivos, que conecta filogenéticamente a todas las especies, es
el proceso responsable de la generación de la biodiversidad acumulada en el historial
evolutivo terrestre.
Esta diversidad se compone de organismos con diferentes patrones estructurales a
múltiples niveles. Tradicionalmente, la división más profunda reconocida entre seres
vivos es la que separa a procariotas y eucariotas, actualmente matizada en bacterias,
arqueas y eucariotas. Otro gran eje de clasificación estructural podría establecerse entre
linajes unicelulares y multicelulares. Siendo los primeros organismos del planeta seres
unicelulares, el nivel de organización multicelular surgió independientemente en diversos
clados como los hongos, las plantas o los animales (también llamados metazoos). Esta
transición a la multicelularidad abrió las puertas a la aparición de múltiples planes
corporales en el linaje de los metazoos, así como de una infinidad de innovaciones a nivel
de tipos celulares y órganos.
La acumulación de estos nuevos caracteres a lo largo de trayectorias macroevolutivas
dispares ha generado, en ciertos grupos animales, seres de complejidad estructural y
funcional creciente. Sin embargo, este fenómeno no debe interpretarse como la pauta
general del cambio organísmico, pues la evolución no genera inevitablemente formas más
complejas que las anteriores dentro de un conjunto filético. Análisis cladísticos a diversas
escalas revelan que el cambio macroevolutivo procede en todas las direcciones respecto
al nivel de complejidad, siendo comunes tanto las simplificaciones o pérdidas de
caracteres como las modificaciones o ganancias de los mismos (Finlay and Esteban,
2009). Por otro lado, una gradación intuitiva de la complejidad estructural puede resultar
fácil de aplicar para organismos muy extremos, pero resulta mucho más complicada de

Introducción
4
medir a la hora de comparar organismos menos dispares. Se han intentado aplicar
diferentes parámetros para objetivizar estas cuantificaciones, como el número de tipos
celulares, aunque esta clase de aproximaciones pueden resultar deficientes para medir la
complejidad al nivel funcional y estructural entre organismos (Bell and Mooers, 1997).
Uno de los objetivos principales de la biología evolutiva desde sus inicios ha sido
comprender el origen de esta complejidad variable. El descubrimiento del ADN como
responsable de transferir la información genética de una generación a otra puso el foco
sobre éstas moléculas para dilucidar las causas orgánicas de las diferencias en la
complejidad de los organismos. Se estudió el tamaño de los genomas de especies
eucariotas dispares para intentar trazar una correlación entre la cantidad de ADN y la
complejidad organísmica (Mirsky and Ris, 1951). Sin embargo, los datos obtenidos
rechazaron cualquier relación lineal, un resultado que fue etiquetado como el enigma del
valor-C (Gregory, 2004). Más tarde, se descubrió que los genomas estaban repletos de
regiones no codificantes que parecían no tener función. Esto condujo a ciertos autores a
proponer que en realidad lo importante era el número de genes codificantes, no la cantidad
total de ADN (Moore, 1984). No obstante, la secuenciación entera de genomas ha
revelado una situación similar a la anterior, conocida como la paradoja del valor-G: no
existe una correlación directa entre la complejidad percibida y el número de genes o
familias génicas de una especie (Hahn and Wray, 2002).
Estas paradojas aparentes han recibido diversas explicaciones. Algunos autores, en la
línea de sus predecesores, siguen sugiriendo que tiene que existir mayor cantidad de algún
tipo de elemento derivado del genoma en los grupos de organismos con estructuras más
elaboradas o complejas. La mayoría de estos investigadores apunta al transcriptoma, es
decir, al conjunto de tránscritos expresados por el genoma. Sus planteamientos podrían
dividirse principalmente en dos frentes no excluyentes, el que aboga por la importancia
de los tránscritos no codificantes (Djebali et al., 2012), y el que destaca la cantidad de
genes codificantes que presentan diversidad transcripcional mediante la producción de
isoformas proteicas (Kanapin et al., 2010). Es necesario aclarar que ambas afirmaciones
reposan mayormente sobre un trasfondo ideológico pan-adaptacionista, en el que se
asume que la mayoría de elementos detectados a nivel de transcriptoma posee una función

Introducción
5
a nivel organísmico. Si bien es cierto que se han descrito roles moleculares relevantes
para ambos tipos de eventos transcripcionales en casos particulares, la relevancia
funcional para la mayor parte de estos elementos constituye una incógnita (Niu and Jiang,
2013). De hecho, otros autores han argumentado que muchos de estos elementos no tienen
por qué presentar una función seleccionada adaptativamente, si no que probablemente
sean consecuencia de una transcripción espuria o ruidosa que no interfiere de manera
deletérea con los roles esenciales del organismo (Doolittle et al., 2014).
En los últimos años se han publicado estudios aislados comparando datos
transcriptómicos entre conjuntos todavía muy limitados de organismos, donde aseguran
detectar una correlación entre los niveles de splicing alternativo (AS) y la complejidad
organísmica (Chen et al., 2014). El splicing alternativo puede describirse brevemente
como un proceso de regulación génica capaz de producir más de un tipo de tránscrito a
partir de un solo locus génico. Sin embargo, toda precaución es poca a la hora de
establecer una relación causal subyacente a estas correlaciones observadas, especialmente
cuando la complejidad es cuantificada en base al número de tipos celulares. Además,
diversos estudios sugieren que la maquinaria molecular encargada del splicing podría
producir niveles elevados de isoformas sin ninguna función, que serían consecuencia de
fallos del proceso en determinados contextos celulares (Pickrell et al., 2010). De hecho,
han empezado a detectarse casos particulares que rompen claramente la asociación entre
complejidad organísmica y AS. El ejemplo más llamativo es el del alga unicelular
Bigellowiella natans, que presenta una de las tasas de AS más elevadas detectadas hasta
el momento, sólo comparables al cerebro humano (Curtis et al., 2012). Interesantemente,
el análisis del tipo de AS detectado en B. natans revela que una gran parte de los eventos
observados son probablemente atribuibles a una producción descontrolada de isoformas
sin función específica.
De todos modos, sí que parece plausible que determinados tipos celulares controlen parte
de su actividad fisiológica mediante la regulación coordinada de un número elevado de
eventos funcionales de AS. Uno de los casos más evidente detectados hasta el momento
en animales es el sistema nervioso de organismos vertebrados que, aparte de exhibir una
de las frecuencias más elevadas de AS junto a los testículos, presenta los mayores niveles

Introducción
6
de conservación reguladora (Barbosa-Morais et al., 2012; Raj and Blencowe, 2015).
Además, la proporción de exones alternativos con regulación específica de tejido que
respetan la pauta de lectura es más elevada en muestras neuronales respecto al conjunto
del resto de órganos (Irimia et al., 2014). Estos datos apuntan a un uso frecuente de este
mecanismo regulador para la producción de isoformas proteicas específicas de neuronas,
que posiblemente presenten propiedades moleculares distintas y necesarias en estas
células. Paralelamente, un análisis transcriptómico en la mosca Drosophila melanogaster
detectó niveles más elevados de producción de isoformas en los ganglios nerviosos
respecto al resto de órganos, aunque aproximadamente la mitad se debían al uso de
promotores alternativos (James B Brown et al., 2014). Por tanto, es probable que estos
altos niveles de regulación génica por AS en el sistema nervioso de vertebrados e insectos
refleje una herramienta funcional recurrente de los tipos celulares neurales.
Por otro lado, la clase de perspectivas que buscan las raíces de la complejidad organísmica
en base a una supuesta complejidad transcriptómica podrían resultar excesivamente
reduccionistas. En este sentido, son necesarios planteamientos alternativos que otorguen
menos relevancia a la cantidad de elementos singulares del genoma y sus transcriptomas
asociados, y más importancia a cómo éstos interaccionan entre sí. Sin negar la aportación
individual necesaria de elementos moleculares diversos, el interés se centra en las
conexiones establecidas entre ellos para generar complejidad funcional. Este enfoque
prioriza la comprensión de las intrincadas relaciones entre el genoma y el organismo,
investigando los procesos reguladores que producen la diversidad estructural y funcional
interpretando la información genómica. En el estudio macroevolutivo, dicha perspectiva
pretende dar una explicación materialista a aquellos cambios orgánicos que transcienden
el nivel poblacional y quedan establecidos a un nivel jerárquico superior, desde las
especies hasta clados mucho más amplios.
Del genoma al organismo: la importancia de establecer conexiones.
Los organismos multicelulares, especialmente los animales, adquieren sus principales
órganos y estructuras mayoritariamente durante el desarrollo embrionario. Partiendo de
una sola célula en la reproducción sexual, se generan múltiples tipos celulares en
Introducción
7
localizaciones embrionarias determinadas que son las encargadas de construir los
diferentes órganos dentro de un plan estructural armónico. A pesar de compartir
mayoritariamente la misma secuencia genómica, los diferentes tipos celulares expresan
tránscritos distintos de manera dinámica para controlar su identidad y fisiología, además
de determinar la capacidad de interacción con otras células. El desarrollo es un proceso
altamente intrincado en el que los tejidos embrionarios proliferan y se diferencian de
manera coordinada para construir un organismo funcional respecto a un rol ecológico
concreto. La alteración de estos procesos de desarrollo mediante modificaciones de la
secuencia genómica es una de las herramientas básicas de la evolución para producir
cambio orgánico duradero.
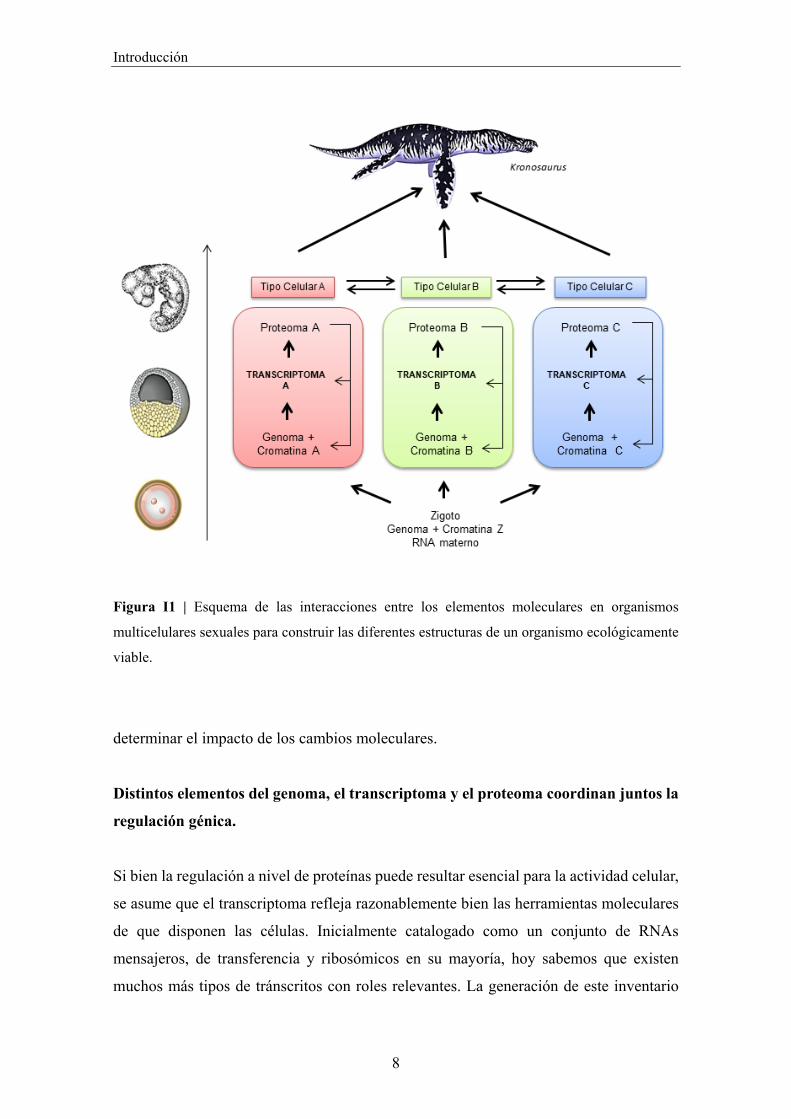
Puesto que la relación entre un genoma y su organismo resultante es muy compleja y
difícil de predecir, es necesario analizar los niveles de organización biológica intermedios
para conseguir conectar ambos extremos. Al nivel molecular, diversos procesos se
coordinan física y temporalmente para obtener determinados RNAs en cada tipo celular.
Estos fenómenos forman parte de lo que se conoce como regulación de la expresión
génica, y son responsables de la producción de distintos tránscritos en contextos
diferentes, cuyo conjunto se denomina transcriptoma. Un porcentaje de dichas moléculas
de RNA contiene información codificante, que será traducida por la maquinaria ribosomal
en cadenas de péptidos, la suma de los cuales constituye el proteoma.
Conjuntamente, estos elementos moleculares son los encargados de establecer a nivel
celular una identidad, características fisiológicas concretas y capacidad de respuesta a
estímulos externos. Las propiedades comunicativas entre células de un mismo y
diferentes tejidos mediarán la coordinación necesaria para la formación de las estructuras
del organismo a nivel macroscópico. Para comprender tanto la función de esta
variabilidad molecular como para establecer la mecánica del cambio organísmico, son
necesarias aproximaciones desde los distintos niveles de organización biológica. Por un
lado, el estudio de los elementos genómicos, transcriptómicos y proteómicos es
imprescindible para establecer diferencias moleculares entre especies y plantear las
posibles bases materiales de la evolución estructural y funcional. Paralelamente, se
requieren herramientas y conceptos de campos como la biología del desarrollo, para
Introducción
8
Figura I1 | Esquema de las interacciones entre los elementos moleculares en organismos
multicelulares sexuales para construir las diferentes estructuras de un organismo ecológicamente
viable.
determinar el impacto de los cambios moleculares.
Distintos elementos del genoma, el transcriptoma y el proteoma coordinan juntos la
regulación génica.
Si bien la regulación a nivel de proteínas puede resultar esencial para la actividad celular,
se asume que el transcriptoma refleja razonablemente bien las herramientas moleculares
de que disponen las células. Inicialmente catalogado como un conjunto de RNAs
mensajeros, de transferencia y ribosómicos en su mayoría, hoy sabemos que existen
muchos más tipos de tránscritos con roles relevantes. La generación de este inventario

Introducción
9
molecular, si bien codificado en última instancia por el genoma, está lejos de ser un
proceso unidireccional y estático pues requiere de la interacción física continuada de
elementos del genoma, el transcriptoma y el proteoma. Estos elementos se coordinan
modulando la producción de un conjunto específico de tránscritos mediante procesos
complejos como la transcripción, el splicing alternativo, el editing, o la poliadenilación.
Para comprender la función de estas capas de regulación génica es necesario identificar
los factores que intervienen en esos procesos, la lógica reguladora que los conecta, y las
consecuencias fenotípicas que provoca su ausencia.
Tradicionalmente, la mayoría de estudios sobre expresión diferencial ha focalizado en el
proceso de transcripción génica. La atención recibida es entendible puesto que constituye
el primer paso, y probablemente el más central, en la generación de tránscritos. Aunque
se trata de un fenómeno complejo que consta de múltiples etapas, la transcripción génica
se concibe como la producción de moléculas de RNA mediante la lectura de un molde de
DNA. Además del tránscrito y la cadena molde, durante la regulación de este proceso
intervienen múltiples elementos procedentes mayoritariamente del genoma y el proteoma.
El genoma aporta promotores basales, enhancers, silencers y aisladores. Estos elementos
influyen en la activación o la represión de la transcripción mediante su interacción con
una multitud de componentes del proteoma, como los factores de transcripción o las
proteínas modificadoras de la cromatina (Calo and Wysocka, 2013). Por otro lado, cada
vez son más los casos encontrados de tránscritos no codificantes que intervienen en la
modulación de eventos de transcripción, involucrando también al transcriptoma (Geisler
and Coller, 2013). De esta manera, la búsqueda de las causas concretas de los cambios en
la expresión génica entre tejidos celulares o especies suele proceder mediante el estudio
de la interacción de estos elementos.
No obstante, la importancia de otros mecanismos de regulación génica que operan a nivel
post-transcripcional es cada día más clara. Por ejemplo, existen moléculas muy pequeñas
de RNA, llamadas microRNAs, cuya función está relacionada con la degradación de uno
o múltiples tránscritos diana, controlando así los niveles de expresión génica (Jonas and
Izaurralde, 2015). Por otro lado, también se dan mecanismos reguladores que pueden
producir secuencias distintas de RNA a partir de un solo locus génico, conocidas como

Introducción
10
isoformas. Esta capacidad reside parcialmente en la maquinaria transcripcional mediante
el uso de promotores alternativos que generan tránscritos diferenciados en la región 5’.
Sin embargo, la regulación post-transcripcional permite ampliar la diversidad de
secuencias de las isoformas en las regiones internas y finales de los RNAs. Entre estos
procesos reguladores destaca el splicing alternativo (AS), un mecanismo que sucede
durante la maduración de los tránscritos. La maquinaria spliceosomal interacciona con
secuencias específicas del tránscrito saliente, a menudo a través de proteínas auxiliares
específicas de tejido (proteoma) y en ocasiones también con el DNA molde (genoma) o
estructuras secundarias y ediciones del RNA (transcriptoma), para generar unas isoformas
determinadas (Gonzalez et al., 2015; Lev Maor et al., 2015; Zhou et al., 2014).
Splicing alternativo y su conexión con la estructura génica.
La regulación mediante splicing alternativo está indefectiblemente ligada a la estructura
génica. La inmensa mayoría de genomas eucariotas contiene una proporción muy variable
de unos elementos llamados intrones spliceosomales (a los que se va a hacer referencia
como “intrones” en el texto subsiguiente para simplificar). Estos elementos forman parte
de la secuencia interna de algunos genes, pero son eliminados de los tránscritos maduros
durante o después de la transcripción. Desde su descubrimiento, las secuencias génicas
han quedado divididas entre aquellas que serán incluídas en el tránscrito final, los exones,
y las que no, los intrones. Los exones pueden contener tanto información codificante para
proteínas (CDS) como secuencia no codificante (UTRs). Por su parte, los intrones son
generalmente considerados como elementos no codificantes, aunque se han llegado a
describir algunos casos que sí lo son (Irimia et al., 2008; Marquez et al., 2015).
A nivel macroevolutivo, esta disposición de la estructura génica no es una característica
estática de cada locus. Genes ortólogos de linajes separados pueden exhibir estructuras
muy diferentes respecto al número de exones que los forman. Este proceso se puede deber
tanto a la ganancia y pérdida de intrones como a la aparición de nuevos exones (Merkin
et al., 2015; Schmitz and Brosius, 2011). Entre los mecanismos moleculares más comunes
de generación de nuevos exones se encuentra la duplicación de secuencias de ADN. Ésta
puede darse frecuentemente a partir de una región interna del mismo gen, aunque también

Introducción
11
se han descrito casos de duplicación de exones procedentes de otros loci (exon shuffling).
Otro proceso capaz originar nuevos exones es la inserción de elementos móviles
transponibles dentro de secuencias intrónicas, donde algunos fragmentos de la nueva
secuencia pueden pasar a incluirse en los transcritos maduros tras unas pocas mutaciones.
Finalmente, otra vía que pueden contribuir al exoma es la “exonización” de regiones
intrónicas, fenómeno conocido como evolución exónica de novo.
El hallazgo de intrones en prácticamente todas las especies eucariotas estudiadas, ha
conducido a la afirmación de que éstos aparecieron antes de la separación del último
ancestro eucariota (Irimia and Roy, 2014). El número de intrones puede ser muy variable
en distintos genomas: mientras que los humanos poseemos una media de unos 8,5 intrones
por gen, la levadura Saccharomyces cerevisiae contiene solo 0,05. Estas densidades
intrónicas elevadas o inferiores se hallan distribuidas de manera compleja en la filogenia
eucariota, puesto que los organismos con muchos y pocos intrones no presentan ninguna
separación cladística coherente (Collén et al., 2013). Esta situación es debida a escenarios
históricos particulares de cada linaje. Por un lado, se han documentado casos de
conservación intrónica profunda entre especies o grupos muy distantes, mientras que
también se han documentado episodios de ganancia o pérdida masiva de intrones durante
la evolución de múltiples linajes eucariotas (Csuros et al., 2011).
El proceso molecular de exclusión de los intrones está catalizado por la maquinaria
spliceosomal, que consta de cinco RNAs pequeños (snRNAs) y más de doscientas
proteínas (Wahl et al., 2009). La estructura de la mayoría de intrones está compuesta por
elementos cuya secuencia es reconocida por dicha maquinaria para la realización de la
reacción de splicing. Sus elementos básicos son los sitios de splicing a 5’ y 3’ en los
extremos del intrón, la adenosina catalítica del punto de ramificación (branch point), y el
tracto de polipirimidinas (polypirimidine tract) (Irimia and Blencowe, 2012). El resto de
la secuencia intrónica es muy variable tanto en contenido como en tamaño (Irimia and
Roy, 2008), habiéndose encontrado casos extremos en un mismo genoma que divergen
en longitud por más de un millón de pares de bases. En algunos casos, la longitud de
ciertos intrones podría estar relacionada con la presencia de elementos reguladores en la
secuencia genómica (Irimia et al., 2011b) (artículo anexo 1).
Introducción
12
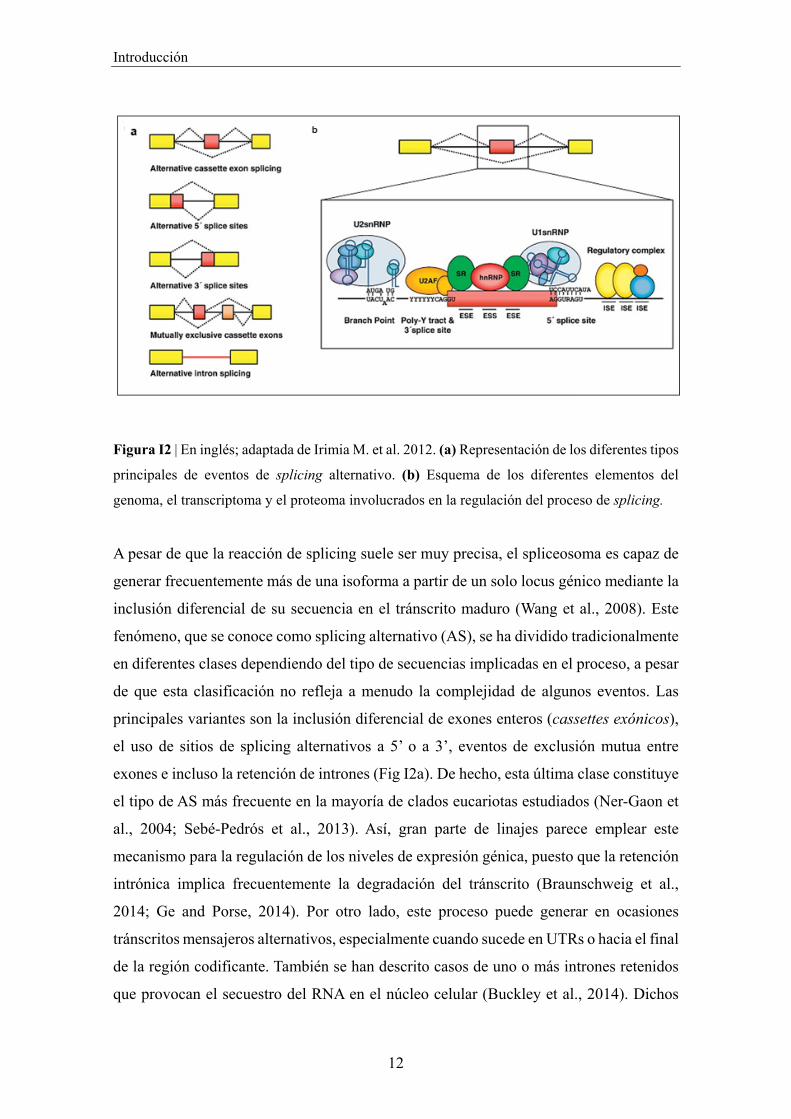
Figura I2 | En inglés; adaptada de Irimia M. et al. 2012. (a) Representación de los diferentes tipos
principales de eventos de splicing alternativo. (b) Esquema de los diferentes elementos del
genoma, el transcriptoma y el proteoma involucrados en la regulación del proceso de splicing.
A pesar de que la reacción de splicing suele ser muy precisa, el spliceosoma es capaz de
generar frecuentemente más de una isoforma a partir de un solo locus génico mediante la
inclusión diferencial de su secuencia en el tránscrito maduro (Wang et al., 2008). Este
fenómeno, que se conoce como splicing alternativo (AS), se ha dividido tradicionalmente
en diferentes clases dependiendo del tipo de secuencias implicadas en el proceso, a pesar
de que esta clasificación no refleja a menudo la complejidad de algunos eventos. Las
principales variantes son la inclusión diferencial de exones enteros (cassettes exónicos),
el uso de sitios de splicing alternativos a 5’ o a 3’, eventos de exclusión mutua entre
exones e incluso la retención de intrones (Fig I2a). De hecho, esta última clase constituye
el tipo de AS más frecuente en la mayoría de clados eucariotas estudiados (Ner-Gaon et
al., 2004; Sebé-Pedrós et al., 2013). Así, gran parte de linajes parece emplear este
mecanismo para la regulación de los niveles de expresión génica, puesto que la retención
intrónica implica frecuentemente la degradación del tránscrito (Braunschweig et al.,
2014; Ge and Porse, 2014). Por otro lado, este proceso puede generar en ocasiones
tránscritos mensajeros alternativos, especialmente cuando sucede en UTRs o hacia el final
de la región codificante. También se han descrito casos de uno o más intrones retenidos
que provocan el secuestro del RNA en el núcleo celular (Buckley et al., 2014). Dichos

Introducción
13
intrones son eliminados del tránscrito dependiendo de una señal molecular determinada,
pasando al citoplasma para ser traducidos en el momento apropiado. Otros casos de
retención intrónica han sido relacionados también con el transporte citoplasmático del
tránscrito afectado (Buckley et al., 2011) .
Unos pocos grupos filogenéticos presentan también proporciones elevadas de otros tipos
de AS, especialmente respecto a la inclusión diferencial de exones cassette, como los
eumetazoos. Este tipo de regulación también puede afectar a la expresión génica, por
ejemplo, mediante la inclusión de codones stop prematuros que provocan la degradación
del tránscrito por la vía NMD (non-sense mediated decay). Sin embargo, el potencial de
este tipo de eventos abarca muchas otras posibilidades. Este proceso genera
frecuentemente proteínas con secuencias de aminoácidos parcialmente diferentes,
alterando en ocasiones distintos aspectos de su función molecular. Se han descrito
isoformas proteicas que difieren en estabilidad, localización celular, actividad enzimática,
etc (Kelemen et al., 2013). Recientemente, un análisis global sobre los dominios
peptídicos de humano afectados por AS apunta a un impacto frecuente de este proceso en
regiones desorganizadas que determinan la afinidad de las interacciones proteicas (Ellis
et al., 2012). En resumen, este mecanismo ofrece la posibilidad de ajustar, innovar o
incluso antagonizar las funciones moleculares del gen implicado dependiendo del
contexto celular.
Impacto funcional de los eventos de splicing alternativo.
Resulta muy complicado predecir las consecuencias funcionales de eventos particulares
incluso a nivel molecular, siendo necesaria una aproximación experimental para
desentrañar su utilidad en el organismo. Hasta la fecha, se han descrito numerosos eventos
de splicing alternativo con un impacto constatado a nivel celular u organísmico,
especialmente en aquellos que se encuentran conservados en más de una especie.
Uno de los casos más estudiados de evento funcional y conservado determina la identidad
sexual en varias especies de insectos (Gempe et al., 2009). En embriones de Drosophila
dotados de cromosomas sexuales homólogos, se produce la inclusión del cuarto exón en

Introducción
14
los tránscritos del factor de transcripción doublesex. Las dos isoformas se unen a las
mismas regiones de ADN, pero presentan funciones bioquímicas generalmente opuestas
respecto a la activación o represión de sus genes diana (Coschigano and Wensink, 1993).
La presencia de la isoforma que incluye el cuarto exón en las hembras reprime la
transcripción del programa de diferenciación sexual masculino. A pesar de que no todos
los hexápodos presentan el mismo mecanismo, la aparición de esta regulación ha sido
trazado hasta la base del clado, apoyando el AS de doublesex como el sistema molecular
de determinación sexual ancestral en insectos (Price et al., 2015). Interesantemente, tanto
las cascadas activadoras de esta regulación como los elementos activables por dicho
factor de transcripción se encuentran mucho menos conservados entre distintos grupos de
insectos (Shukla and Nagaraju, 2010).
Otro evento de splicing funcional de origen incierto es el descrito en algunas especies de
vertebrados en diversos miembros de la familia Fgfr (Fgfr1, Fgfr2 y Fgfr3) que codifican
para receptores de los ligandos Fgf. Estos genes presentan dos exones alternativos
mutuamente excluyentes, llamados IIIb y IIIc, que codifican parte del tercer dominio
inmunoglobulina de la proteína (Turner and Grose, 2010) (Fig. I3a). Ambas isoformas
difieren en su capacidad de interacción respecto a los diferentes ligandos Fgf (Miki et al.,
1992). Las isoformas que incluyen el exón IIIb, expresadas en células epiteliales,
muestran una mayor afinidad por los ligandos secretados por células mesenquimales
(Fgf3, Fgf7, Fgf10, etc) (Fig. I3b). La situación es la inversa para las células
mesenquimales, cuyos receptores contienen el exón IIIc, proporcionándoles más afinidad
por ligandos provenientes de células epiteliales (Fgf2, Fgf4, Fgf8, etc). Este sistema
contribuye a generar una señalización cruzada entre tejidos epiteliales y mesenquimales
de diversos órganos en desarrollo (Figura I3). En consecuencia, la morfogénesis de
estructuras como las extremidades, los pulmones o el oído interno se ve severamente
afectada tras la eliminación selectiva del exón IIIb en tejidos epiteliales de ratón (De
Moerlooze et al., 2000; Pirvola et al., 2000) (Fig I3c).
Por otro lado, también se han descrito eventos de AS específicos de especie o de grupos
muy reducidos con roles claramente funcionales. Uno de los más interesantes por su papel
adaptativo se encuentra en el gen TRVP1, un sensor térmico involucrado en la detección

Introducción
15
Figura I3 | En inglés. (a,b) Adaptada de Turner et al. 2010. (a) Esquema del evento de splicing mutuamente excluyente de los genes Fgfr1, Fgfr2 y Fgfr3 de mamíferos, que produce la inclusion del exón IIIb en epitelios y el exon IIIc en mesénquima. (b) Representación de aquellos ligandos con mayor afinidad para las dos isoformas producidas mediante la regulación post-transcripcional de dicho evento en el gen Fgfr2. (c) Adaptada de Ornitz et al. 2015. Esquema de las interacciones señalizadoras mediante la via FGF durante el desarrollo del primordio de la extremidad en ratón.
de temperaturas nocivas para el organismo (~40ºC) (Gracheva et al., 2011). Este gen
contiene un exón alternativo compartido por diversos quirópteros cuya inclusión genera
una proteína más corta en la región C- terminal. Esta isoforma, que reduce el umbral de
detección térmico hasta los 31ºC, se expresa a unos niveles prácticamente residuales en
los órganos sensoriales de murciélagos que se alimentan de frutas o insectos. Sin
embargo, la inclusión de este exón particular está potenciada específicamente en el
ganglio trigémino del vampiro Desmodus rotundus. Dicha estructura contiene las fibras
sensoriales responsables de la detección de radiación infrarroja (>29ºC) emitida por la
sangre caliente de sus presas. Por tanto, la regulación precisa de este evento de splicing
está probablemente asociada a una adaptación evolutiva reciente de esta especie
hematófaga.

Introducción
16
Dinámicas evolutivas globales de la regulación génica mediante splicing alternativo.
A pesar de los casos descritos de eventos particulares de splicing con regulación similar
en clados relativamente grandes, estudios transcriptómicos amplios apuntan hacia
escenarios de baja conservación global. Por ejemplo, la comparación de los niveles de
inclusión de exones cassette en distintos órganos de mamíferos y otros vertebrados reveló
mayor similitud de los patrones de splicing entre los tejidos de una misma especie que
entre órganos homólogos en general (Barbosa-Morais et al., 2012; Merkin et al., 2012).
Este resultado es opuesto al obtenido mediante el cotejo interespecífico de los patrones
de expresión génica, lo que sugiere tasas evolutivas comparativamente más elevadas en
la regulación por AS. De hecho, un análisis reciente utilizando cinco especies de
Drosophila ha descrito un resultado muy similar (Gibilisco et al., 2016). La repetición de
este escenario en otros linajes podría apuntar a un fenómeno general respecto a las
velocidades evolutivas relativas de la regulación génica por transcripción y por splicing.
No obstante, resulta adecuado recalcar que también se han descrito conjuntos conservados
de exones alternativos cuya inclusión es regulada coordinadamente durante algún proceso
biológico o en un tipo celular concreto. Por ejemplo, el corazón de mamíferos y aves sufre
cambios dramáticos en los niveles de inclusión de una amplia batería de exones después
del nacimiento (Kalsotra et al., 2008). Por otro lado, el sistema nervioso central constituye
el órgano de vertebrados con las tasas más elevadas de similitud entre especies respecto
a sus patrones de splicing alternativo. Especialmente conservada se encuentra la
regulación de un programa de exones alternativos de entre 3 y 27 nucleótidos, cuya
inclusión está mayormente potenciada en neuronas (Irimia et al., 2014). Estos
microexones, a pesar de constituir alrededor del 1% de eventos de AS totales, representan
un tercio de los exones neurales conservados entre humano y ratón que generan isoformas
proteicas.

Introducción
17
Mecanismos moleculares de regulación del splicing alternativo.
Como se ha mencionado anteriomente, la función celular u organísmica de las variantes
de splicing está íntimamente ligada a una regulación adecuada en determinados contextos
celulares. Esta regulación precisa de diversos factores para controlar los niveles de
inclusión exónica. Se han descrito múltiples tipos de elementos moleculares que modulan
el reconocimiento de la estructura génica por el spliceosoma y permiten regular la
proporción de las distintas isoformas producidas por un gen (Wang et al., 2015). Entre
estos componentes, destacan por un lado determinadas secuencias de bases situadas
normalmente en los exones y/o intrones que forman parte del evento regulado (elementos
en cis). Estas secuencias, una vez transcritas a RNA, constituyen sitios de unión para
determinadas proteínas (elementos en trans) capaces de interaccionar con el spliceosoma
directa o indirectamente modificando su actividad. Dichas proteínas auxiliares, conocidas
como factores de splicing, pueden provocar tanto un incremento como una disminución
en los niveles de inclusión exónica dependiendo del evento y el contexto celular (Fu and
Ares, 2014). El nivel de expresión variable de este conjunto de factores de splicing influye
decisivamente en el balance global de isoformas en los distintos tipos celulares (Fig. I4a).
Estos factores proteicos que intervienen en la regulación de eventos de AS acostumbran
a presentar niveles de expresión muy variables en distintos órganos o tipos celulares
(Grosso et al., 2008). Mientras que algunos de ellos se encuentran en niveles
suficientemente elevados para ejercer su actividad en un conjunto relativamente amplio
de tejidos, otros factores presentan patrones de expresión muy restringidos. En este
sentido, se han descrito casos de proteínas reguladoras cuya expresión únicamente es
detectada en un tipo celular (Raj et al., 2014). A pesar de la variabilidad respecto a la
proporción de órganos distintos donde se expresa cada uno de estos péptidos, buena parte
de ellos son referidos en la bibliografía como factores de splicing específicos de tejido.
Por otro lado, aquellos factores con actividad en más de un tipo celular pueden ejercer
actividades reguladoras distintas dependiendo de la presencia cambiante de cofactores en
cada contexto celular (Vuong et al., 2016) (Fig. I4b). De hecho, esta combinatoria
particular de factores en cada tejido, ligada a un estado regulador determinado, resulta
muy similar a la descrita tradicionalmente para los factores de transcripción.

Introducción
18
Figura I4 | (a) Adaptado de Vuong C.K. et al. 2016. Esquema sobre la cooperación específica en cada evento de distintos factores de splicing para generar el transcriptoma de un tipo cellular dado. (b) En inglés; adaptado de Gonvoy J. et al. 2017. Representación de las interacciones específicas de tejido que provocan la inclusion diferencial de distintos exones en cerebro, músculo o ambos. La flechas verdes simbolizan actividad potenciadora, mientras que las rojas son silenciadoras.

Introducción
19
Factores de splicing alternativo involucrados en el desarrollo embrionario.
Mientras que algunos de estos factores regulan una cantidad notablemente reducida y
específica de eventos de AS (Traunmuller et al., 2016), otros ejercen su impacto funcional
sobre numerosas dianas. Debido a la influencia extensa de estos últimos casos sobre el
transcriptoma celular, a menudo se hace referencia al conjunto de sus eventos regulados
como programas de AS. Bajo esta nomenclatura también subyace la idea de que estos
grupos de eventos sujetos a un regulador en trans determinado están frecuentemente
involucrados en funciones celulares comunes. Según esta perspectiva, la expresión de un
factor determinado en un contexto celular dado produciría las isoformas propicias para
llevar a cabo procesos fisiológicos concretos (Vuong et al., 2016). Si bien este modelo
puede pecar en ocasiones de excesivamente simplista o generalista, probablemente resulta
acertado para subconjuntos amplios de los eventos diana. De esta forma, un factor dado
puede estar implicado en más de un rol fisiológico determinado tanto en diferentes
órganos como dentro de un mismo tipo celular (Raj and Blencowe, 2015). En esta línea,
se han empezado a identificar familias de factores de splicing cuyas funciones están
relacionadas con procesos del desarrollo variados, especialmente en organismos modelo.
Es el caso, por ejemplo, de las familias génicas Nova (neuro-oncological ventral antigen)
y RbFox (RNA binding protein, Fox1-homolog). Los factores que forman parte de estas
familias en mamíferos (Nova1, Nova2, RbFox1, RbFox2 y RbFox3) se expresan durante
el desarrollo del sistema nervioso en células cuyo destino celular ya ha sido determinado
como neuronal (Jensen et al., 2000; Underwood et al., 2005). Entre los principales papeles
funcionales descritos para la familia Nova en estos tejidos se encuentran la migración de
progenitores mitóticos en la médula espinal, la laminación cortical o el disparo de las
neuronas motoras (Gallego-Paez et al., 2017) (Fig. I5a). La familia RbFox está
involucrada también en la arquitectura del córtex cerebral, así como en la formación de
dendritas en neuronas excitatorias o el crecimiento del cerebelo (Gehman et al., 2012,
2011; Hamada et al., 2015). De hecho, ambos factores regulan el splicing de algunos
eventos diana comunes, con interacciones tanto sinérgicas, como aditivas o antagónicas
(Zhang et al., 2010). Por otro lado, estos genes también desempeñan roles fisiológicos en
órganos no neurales de vertebrados. La família Nova está involucrada en termogénesis en

Introducción
20
el tejido adiposo (Vernia et al., 2016), así como en la formación del lumen vascular
durante la angiogénesis (Giampietro et al., 2015). Por su parte, algunos genes RbFox están
implicados en procesos como la fusión de mioblastos (Singh et al., 2014) (Fig. I5b) o la
función cardíaca (Gallagher et al., 2011; Gao et al., 2016).
Figura I5 | En inglés. (a) Adaptado de Gallego-Paez L.M. et al. 2017. Nova2 promueve la migración en la corteza cerebral de ratón de células ya determinadas como neuronas mediante la regulación de las isoformas del gen Dab1. (b) Adaptado de Singh R.K. et al. 2014. La actividad de RbFox2 en mioblastos murinos en cultivo promueve la fusión de estas células para formar fibras musculares multinucleadas a través del splicing de los genes Mef2d y Rock2. (c) Adaptado de Kalsotra A. et al. 2011. El gen Esrp1 promueve el fenotipo epithelial en diversos cultivos celulares humanos mediante la regulación de la inclusion exónica en una batería de genes, como en el caso de CD44.
Otro tipo de variabilidad respecto la expresión tisular es la observada en famílias de
factores de splicing como Esrp. Los dos parálogos encontrados en mamíferos, Esrp1 y
Esrp2, se expresan en ratón en múltiples órganos de manera muy dinámica durante el
embrionario (Revil and Jerome-Majewska, 2013). Sin embargo, su expresión se ha

Introducción
21
considerado específica de tipo celular en un sentido histológico, ya que se describió
restringida a tejidos epiteliales. La función de ambos genes fue primeramente relacionada
con la capacidad de influir en transiciones epitelio-mesénquima en cultivos celulares
humanos (Warzecha et al., 2010). En estos estudios, una interrupción de la actividad de
Esrp1 produjo una pérdida de adhesión celular y un incremento en su motilidad (Fig. I5c).
Coherentemente, muchos de los eventos de splicing regulados por estos factores suceden
en genes involucrados en adhesión celular y migración (Dittmar et al., 2012). La
generación reciente de mutantes murinos para Esrp1 y Esrp2, tanto por separado como
conjuntamente, ha revelado su implicación en múltiples procesos morfogenéticos (Bebee
et al., 2015). Los fenotipos observados se han adjudicado presumiblemente a una
distorsión de diversas interacciones organogenéticas entre tejidos epiteliales y
mesenquimales.
La implicación de estos programas de AS en diversos procesos mediante la modulación
de propiedades o roles celulares concretos, coloca a sus factores reguladores como
miembros relevantes en las redes génicas del desarrollo. Puesto que la modificación de
dichas redes es responsable del cambio estructural entre linajes, su comparativa puede
aportar pistas sobre la base molecular de la evolución organísmica. Por tanto, es
importante entender las similitudes y diferencias en la expresión y función ontogenética
de los factores de splicing alternativo, así como entre los conjuntos de eventos que regulan
a nivel transcriptómico. Este tipo de aproximación permitirá valorar tanto la plasticidad
evolutiva de los programas de AS como su conexión con procesos celulares ligados al
desarrollo de caracteres fenotípicos. Dicha perspectiva es capaz de conectar más
comprensiblemente los distintos niveles de organización biológica en comparación con
el inventariado de isoformas totales en cada especie.
Evolución y características de los organismos deuteróstomos.
La utilización de un conjunto de especies anidadas respecto a su separación cladística
resulta conveniente para valorar la magnitud de los cambios evolutivos a diferentes
escalas filogenéticas. Este uso estratégico de organismos pertenecientes a grupos
relativamente lejanos pero relacionados permite también la inferencia de escenarios

Introducción
22
macroevolutivos más precisos. Dado que la mayor parte de datos publicados para los
factores de splicing pertenecen a animales vertebrados (y en especial, mamíferos), en la
presente tesis se ha trabajado con especies de este grupo y de aquellos linajes más
cercanos a ellos. De este modo, los organismos que forman parte del trabajo experimental
son cordados y equinodermos. El grupo filogenético que incluye a estos dos filos y a los
hemicordados, grupo hermano de los equinodermos, son los deuteróstomos
(Deuterostomia), cuyo origen se haya probablemente en el periodo Ediacárico (635-542
Ma). Un esquema de las principales relaciones filogenéticas de este grupo puede
visualizarse en la Figura I6 (Sansom et al., 2010).
Figura I6 | En inglés; adaptado de Sansom R. et al 2010. Relaciones taxonómicas de los principales grupos de animales deuteróstomos. Las ramas cortas constituyen organismos extinguidos. Cada color representa la gama de posibles posiciones filogenéticas de diferentes fósiles cámbricos. Debido a esta incertidumbre, resulta complicado hacerse una idea precisa de muchos de los caracteres estructurales del ancestro de cada linaje.

Introducción
23
La disparidad de planes corporales de los tres filos constituyentes complica la
reconstrucción de las características corporales de su último ancestro común. Los
deuteróstomos comparten la formación del ano a partir del blastoporo, motivo por el que
recibieron su nombre taxonómico. No obstante, la deuterostomía ontogénica no
constituye una característica única de este grupo, pues también está presente en algunos
linajes de protóstomos e incluso se ha propuesto que podría representar la condición
ancestral de bilaterales (Martín-Durán et al., 2012). Aun así, parece existir consenso al
menos sobre un carácter sinapomórfico hallado en individuos adultos, embriones o fósiles
de los tres clados: las hendiduras faríngeas. Se ha llegado incluso a relacionar este rasgo
con un agrupamiento génico conservado de cuatro factores de transcripción expresados
coordinadamente durante el desarrollo de la faringe en embriones de vertebrados y
hemicordados (Simakov et al., 2015). Además, algunos autores establecen también un
origen común entre el cartílago acelular faríngeo de hemicordados y anfioxo (Rychel et
al., 2006). Otra estructura propuesta como homóloga entre cordados y hemicordados es
el cordón nervioso dorsal, aunque esta relación está mucho más discutida (Kaul and Stach,
2010).
En general, numerosos caracteres no presentan una correspondencia anatómica clara entre
los distintos filos de deuteróstomos. Sin embargo, ciertas estructuras difícilmente
homologables entre grupos muestran una similitud notable respecto a sus bases
moleculares subyacentes. Un caso interesante es el de las redes génicas descritas en las
regiones que rodean los organizadores secundarios del sistema nervioso central de
vertebrados (Pani et al., 2012). Muchos de los genes implicados parecen seguir una lógica
reguladora muy parecida en torno a los límites de la proboscis, el collar y el tronco de
embriones hemicordados. A pesar de haber sido reclutadas para la formación de
estructuras distintas, es probable que un conjunto de interacciones génicas esenciales se
haya mantenido estable para establecer fronteras morfológicas en el eje anteroposterior.
Este caso ilustra la posibilidad de desacoplamiento entre programas genéticos
razonablemente conservados y los caracteres organísmicos que producen en linajes
evolutivos distantes.
Introducción
24
A continuación, una breve descripción de los principales organismos deuteróstomos
empleados en la presente tesis, incluyendo sus procesos ontogénicos más estudiados en
el apartado experimental:
Strongylocentrotus purpuratus: Perteneciente al filo de los equinodermos, en esta tesis
se ha trabajado con el erizo de mar púrpura (Strongylocentrotus purpuratus), cuya
distribución natural se sitúa en las costas del Océano Pacífico norteamericano. Los
individuos adultos presentan pentamerismo, con un fino epitelio recubriendo un
endoesqueleto formado por carbonato cálcico. El esqueleto está formado por placas que
se extienden desde la boca hasta el ano y que presentan múltiples agujeros a través de los
que emergen los pies ambulacrales. Estos pies ambulacrales, revestidos de musculatura,
forman parte de un sistema vascular hidráulico conectado al exterior a través del
madreporito, ubicado cerca del ano. El órgano ambulacral confiere movilidad al animal,
además de ayudarle a conducir los alimentos hasta la boca. Ésta, situada en la parte
inferior, contiene un órgano masticatorio formado por una compleja estructura esquelética
y muscular consistente en un armazón pentagonal, conocida como linterna de Aristóteles.
Su sistema nervioso consiste en un anillo neural que rodea la boca del que surgen cinco
nervios parejos a los canales radiales del sistema ambulacral (Fig. I7a).
Sin embargo, dicho plan corporal no aparece hasta pasado un proceso de metamorfosis,
pues las primeras fases del desarrollo generan una larva con simetría bilateral. Este
fenómeno es extensible a todas las clases de equinodermos, si bien cada clase presenta un
tipo de larva particular en el sentido morfológico. En Strongylocentrotus, el zigoto se
compartimentiza a través de divisiones celulares siguiendo un patrón radial.
Aproximadamente hacia la sexta división, las capas germinales ya han sido especificadas.
El estadio de blástula se alcanza hacia las 24 horas post-fertilización (hpf) a una
temperatura de 15ºC. Hacia las 48hpf el embrión ha alcanzado un estadio de gástrula
avanzado, y a las 72hpf ya es reconocible la estructura en forma de prisma característica
de la larva pluteus.
Uno de los primeros procesos morfogenéticos reconocibles en el estadio de blástula es el
ingreso de las células mesenquimales primarias (PMCs) en el blastocele mediante una

Introducción
25
Figura I7 | (a) En inglés. Adaptado de Abiogenesis. Dibujo de los principales órganos de un erizo de mar adulto. (b) Adaptado de Staveley 2011. Esquema del desarrollo de un embrión euequinoideo. Las células rojas marcan el mesénquima primario, las azules, el secudario. O, oral; Ab, aboral (c) Adaptado de Gildor 2015. Dibujo que muestra la integración de las células pigmentarias (color malva) en el ectodermo aboral (color verde). (d) Adaptado de Lapratz et al. 2009. Representación por colores de las tres regiones primordiales del ectodermo en una gastrula y una larva plúteus.

Introducción
26
transición de epitelio a mesénquima (Ettensohn, 2009). Una vez ingresadas, las PMCs
forman un sincitio alrededor de la invaginación endodérmica y finalmente excretan una
matriz biomineral que constituirá el esqueleto larvario (Fig. I7b). El resto de células
mesodérmicas permanece en forma epitelial hasta que comienza la gastrulación, cuando
ingresan también en el blastocele junto a la invaginación endodérmica y quedan
dispuestos alrededor de la punta del arquénteron (McClay, 2011) (Fig. I7b). Este conjunto
de tejidos, conocido como células mesenquimales secundarias (SMCs) o mesodermo no-
esqueletogénico (NSM), se divide básicamente en cuatro grupos: precursores de células
pigmentarias, blastocelares, de las bolsas celómicas, y miogénicas. Estas últimas, después
de un proceso de fusión celular, forman las fibras musculares que rodean al esófago en la
fase pluteus (Andrikou et al., 2013). Por su parte, las precursoras de las células
pigmentarias migran durante las primeras fases de la gastrulación hacia el ectodermo
aboral, en el que se integran mediante un proceso de transición mesénquima-a-epitelio
(MET) (Gibson and Burke, 1985) (Fig. I7c). El ectodermo, que constituye la superficie
del embrión, puede dividirse principalmente en aboral, oral, y banda ciliar (Lapraz et al.,
2009). Esta última estructura se distribuye en forma de anillo en el estadio de blástula,
separando a las dos otras regiones (Fig. I7d). En la banda ciliar se formarán las neuronas,
así como los cilios que la larva usará para nadar. El ectodermo oral forma parte de la
región donde se formará la apertura del tracto digestivo anterior, mientras que el
ectodermo aboral constituirá la mayor superficie del embrión durante la fase pluteus.
Branchiostoma lanceolatum: El término anfioxo se aplica a aquellos animales
pertenecientes al subfilo de los cefalocordados. Este grupo constituye una rama basal
dentro de los cordados actuales puesto que los otros dos clados, los urocordados y los
vertebrados, son grupos hermanos (Delsuc et al., 2006). La anatomía del anfioxo adulto
presenta múltiples puntos de similitud respecto a la de un vertebrado, aunque de mayor
simplicidad general (Fig. I8a). Estos animales poseen características típicas del prototipo
cordado, como un cordón nervioso dorsal, una notocorda subyacente, un sistema
digestivo ventral, perforaciones faríngeas, musculatura axial agrupada en bloques, o la
cola post-anal. Además, también presentan órganos supuestamente homólogos a la
glándula tiroides y la adenohipófisis de vertebrados, conocidos como el endostilo y la
foseta pre-oral, respectivamente. Sin embargo, carecen de muchos de los órganos
Introducción
27
compartidos por los vertebrados, como sistemas sensitivos pares (ojos, oídos), esqueleto
interno o diversas estructuras derivadas de la cresta neural (cráneo).
Los anfioxos son animales filtradores que viven en zonas costeras en fondos arenosos.
Durante su alimentación, a menudo adoptan una posición en la que entierran gran parte
de su cuerpo, dejando al extremo más anterior sobresalir del bentos. Anatómicamente, un
capuchón oral cubre la obertura anterior de la faringe, del que sobresalen los cirros
bucales que impiden la entrada de grandes partículas. El aparato filtrador faríngeo
presenta hendiduras para permitir la salida de una corriente de agua unidireccional hacia
el atrio. Las partículas alimenticias se adhieren a una banda dorsal en el surco epibranquial
mediante una sustancia mucosa, segregada por el endostilo y las células secretoras de las
barras faríngeas. A continuación, el alimento pasa al tubo digestivo, donde es objeto de
un proceso de desmenuzamiento mecánico. Los fragmentos más pequeños son
conducidos a través de cilios hacia el ciego digestivo, donde se produce la absorción de
los nutrientes, mientras que el material desechado sale al exterior a través del ano. El agua
acumulada en el atrio es expulsada a través del atrioporo.
Los huevos del anfioxo contienen muy poco vitelo, motivo que favorece un proceso de
segmentación aparentemente sencillo. Las divisiones de los blastómeros, cada vez menos
sincrónicas, conducen a una blástula de 32 células que rodean al blastocele lleno de
líquido. La gastrulación tiene lugar por la invaginación de la pared del polo vegetativo.
El embrión transiciona de una capa de blastómeros a una doble capa laminar de células
que forman el ectodermo y el endomesodermo (Fig. I8c). Por su lado, el epitelio ventral
del arquénteron se replegará para formar el tracto digestivo, la faringe y otros derivados
endodérmicos. A partir de evaginaciones del endomesodermo, se forman unos pares de
saquitos mesodérmicos cuyas cavidades darán lugar al celoma (Terazawa and Satoh,
1997) . El mesodermo situado en la línea media dorsal entre los saquitos se diferencia en
el cordomesodermo, que originará el primordio de la notocorda central y dos secciones
laterales que darán lugar a los somitas (Mansfield et al., 2015) (Fig. I8d). El
cordomesodermo estimula a su vez la generación de una placa neural en el ectodermo
superpuesto, que se convertirá en un tubo neural después de que ambos lados epidérmicos
se fusionen en la línea media durante la neurulación (Holland and Holland, 2001).

Introducción
28
Figura I8 | En inglés. (a,b) Adaptado de Bertrand et al 2011. (a) Fotografía de un especímen de Branchiostoma lanceolatum. (b) Dibujo del plan corporal de un anfioxo adulto y sus principales órganos. (c) Adaptado de I. Stanek. Esquema representando el desarrollo y separación de las capas germinales en estadíos consecutivos de un embrión de anfioxo. El ectodermo está coloreado en azul, el endodermo en amarillo, el mesodermo somítico en rojo y la notocorda en verde. Los dibujos simulan un corte transversal. (d) Adaptado de Hatscheck 1881. Representación coronal de la disposición de las capas germinales en una néurula de anfioxo. (e-f) Adaptado de Kaltenbach et al. 2010. (e) Fotografía obtenida por microscopía electronica de barrido de una néurula de anfioxo que ha sido despojada de la epidermis. El recuadro marca las células procedentes del ectodermo ventral que migran hacia posiciones dorsales. (f) Representación gráfica del proceso de migración e integración de las células determinadas como neuronas epidérmicas sensoriales.
Uno de los procesos más peculiares durante la embriogénesis del anfioxo es la formación
de las neuronas epidérmicas sensoriales, que formarían el sistema nervioso periférico.
Los precursores de dicha población neuronal se originan en una zona del ectodermo
ventral, delaminan al especio sub-ectodérmico y migran hacia regiones dorsales del
embrión, donde se integran en la epidermis (Benito-Gutiérrez et al., 2005; Kaltenbach et
al., 2009) (Figura I8e,f). Algunos autores que han estudiado el programa molecular

Introducción
29
involucrado en el desarrollo de estas células han sugerido similitudes respecto a los
mecanismos genéticos utilizados por poblaciones del sistema nervioso periférico en
vertebrados, especialmente los derivados de las placodas (Lu et al., 2012).
El tubo neural del embrión de los cefalocordados no presenta las deformaciones
complejas propias del sistema nervioso central (CNS) de los vertebrados, donde las
diferentes partes exhiben diferencias morfológicas claras. También están ausentes los
organizadores secundarios liberadores de morfógenos responsables de una parte
importante de la diferenciación anatómica en vertebrados, como la ZLI (zona limitans
intrathalamica) o el istmo (Irimia et al., 2010a). Sin embargo, un análisis detallado de la
placa neural del estadío de néurula media de anfioxo ha revelado una alta complejidad en
su genoarquitectura, incluyendo la conservación de la expresión relativa de diversos
marcadores respecto al bauplan de vertebrados (Albuixech-Crespo et al., 2017) (artículo
anexo 2). Una de las conclusiones más interesantes de dicho artículo es la identificación
en anfioxo de una región homóloga al tálamo, el pretecho y el mesencéfalo, cuyo
desarrollo depende de la ZLI y el istmo en vertebrados. Como se ha mencionado
anteriormente, en hemicordados se han descrito programas moleculares muy similares a
los de los organizadores secundarios de vertebrados (Pani et al., 2012). Además, se han
encontrado enhancers del morfógeno de la ZLI (sonic hedgehog) en regiones genómicas
homólogas en vertebrados y Saccoglossus que son funcionalmente intercambiables (Yao
et al., 2016). Estos datos han alentado un debate sobre si los organizadores secundarios
del CNS podrían haber estado presentes en el último ancestro de los cordados actuales y
perdidos secundariamente en el linaje de los cefalocordados. De ser así, el sistema
nervioso del anfioxo podría representar una simplificación estructural respecto a los
cordados troncales.
Ciona intestinalis: Las ascidias son animales sésiles pertenecientes al subfilo de los
urocordados, grupo hermano de los vertebrados. Una de las características más
representativas de este clado es la túnica, una substancia parecida a la celulosa segregada
por la epidermis que forma la pared del cuerpo en individuos adultos. Entre estas paredes
se encuentran el cestillo branquial, una amplia cavidad atrial y las vísceras. Existe un
sifón inhalante y otro exhalante para la entrada y salida respectivas de una corriente de
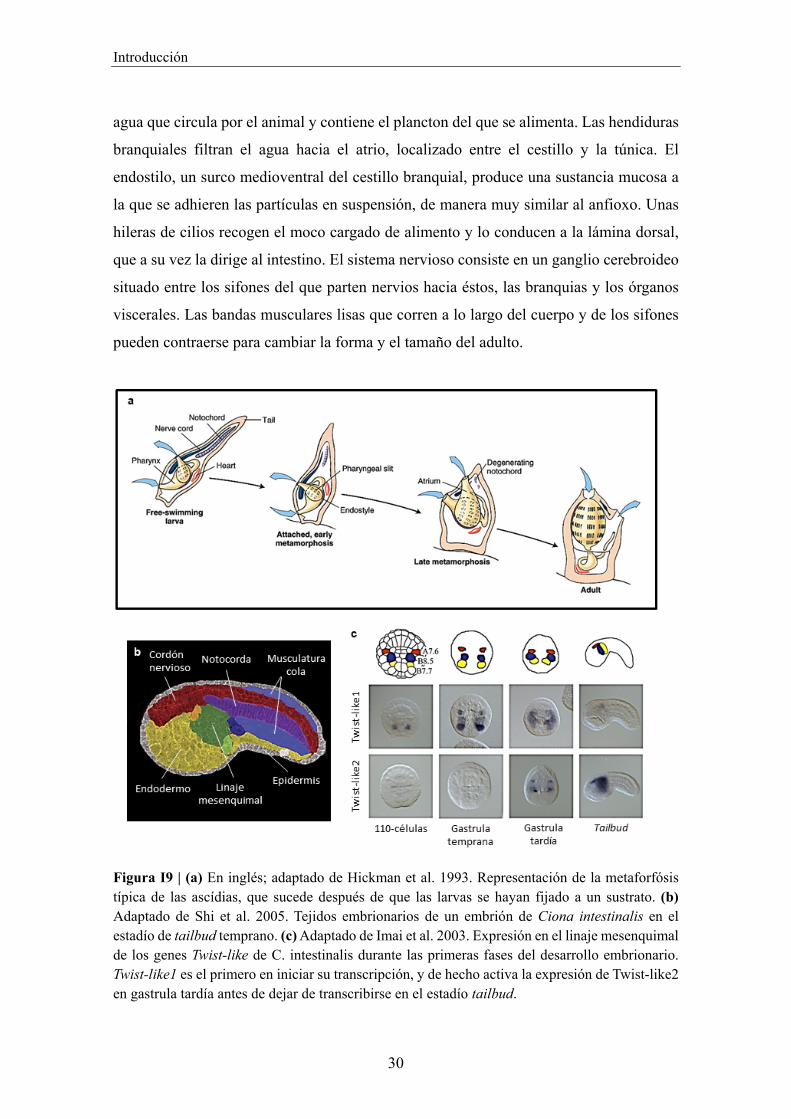
Introducción
30
agua que circula por el animal y contiene el plancton del que se alimenta. Las hendiduras
branquiales filtran el agua hacia el atrio, localizado entre el cestillo y la túnica. El
endostilo, un surco medioventral del cestillo branquial, produce una sustancia mucosa a
la que se adhieren las partículas en suspensión, de manera muy similar al anfioxo. Unas
hileras de cilios recogen el moco cargado de alimento y lo conducen a la lámina dorsal,
que a su vez la dirige al intestino. El sistema nervioso consiste en un ganglio cerebroideo
situado entre los sifones del que parten nervios hacia éstos, las branquias y los órganos
viscerales. Las bandas musculares lisas que corren a lo largo del cuerpo y de los sifones
pueden contraerse para cambiar la forma y el tamaño del adulto.
Figura I9 | (a) En inglés; adaptado de Hickman et al. 1993. Representación de la metaforfósis típica de las ascídias, que sucede después de que las larvas se hayan fijado a un sustrato. (b) Adaptado de Shi et al. 2005. Tejidos embrionarios de un embrión de Ciona intestinalis en el estadío de tailbud temprano. (c) Adaptado de Imai et al. 2003. Expresión en el linaje mesenquimal de los genes Twist-like de C. intestinalis durante las primeras fases del desarrollo embrionario. Twist-like1 es el primero en iniciar su transcripción, y de hecho activa la expresión de Twist-like2 en gastrula tardía antes de dejar de transcribirse en el estadío tailbud.

Introducción
31
Esta organización corporal puede recordar poco a la de un vertebrado o incluso al
prototipo cordado. No obstante, la fase embrionaria de las ascidias resulta mucho más
semejante (Passamaneck and Di Gregorio, 2005) (Fig. I9b). Estos animales presentan una
larva planctónica con capacidad natatoria cuya función es la de encontrar un sustrato
adecuado al que fijarse mediante unas papilas adhesivas. Los embriones desarrollan un
tubo neural dorsal e incluso una vesícula sensorial, además de un órgano fotorreceptor (el
ocelo) y un sensor de balance gravitatorio (el otolito). Estos órganos constituyen un
supuesto equipo de navegación implicado en la orientación de la larva. Durante la
ontogénesis, también presentan una notocorda turgente en la cola, que carece de células
vacuoladas. Parejas a esta notocorda se ubican las células musculares estriadas, que se
contraen a la vez a cada lado para doblar la cola. Una vez adheridas al sustrato, las larvas
comienzan un proceso de metamorfosis absorbiendo las células de la cola, incluyendo los
músculos, la notocorda, parte del cordón nervioso y la epidermis (Holland, 2016) (Fig
I9a).
Recientemente, estudios embriológicos en Ciona intestinalis han revelado nuevos
caracteres o tipos celulares en común con vertebrados, que se pensaban exclusivos de
estos últimos. Por ejemplo, se han descrito células con doble función quimiosensorial y
neurosecretora que son candidatas a provenir del mismo tipo celular ancestral que algunas
neuronas derivadas de las placodas sensoriales de vertebrados (Abitua et al., 2015).
También se ha propuesto que determinadas células del borde de la placa neural podrían
constituir una cresta neural rudimentaria que da lugar tanto a células pigmentarias como
a neuronas migratorias periféricas, de manera similar a vertebrados (Abitua et al., 2012;
Stolfi et al., 2015). Por otro lado, las ascidias también presentan tipos celulares peculiares
durante la embriogénesis, como el linaje mesenquimal (Fig. I9c). Dicho tejido proviene
de tres pares de blastómeros en el estadio de 110 células (A7.6, B7.7 y B8.5) que
comparten la expresión del factor de transcripción Twist-like1 (Imai, 2003). Estas células
se dividen en fases posteriores del desarrollo y forman tres subgrupos mesenquimales
similares pero diferenciados (Tokuoka et al., 2004). Poco antes de cesar su expresión
completamente en el estadio de early tailbud, Twist-like1 promueve la transcripción de su
homólogo Twist-like2, que permanece activado en el linaje mesenquimal durante unas
cuantas fases ontogenéticas subsiguientes. Estas células migrarán posteriormente hacia la
Introducción
32
parte anterior del tronco y formarán partes de diversos órganos del juvenil y el adulto
(Tokuoka et al., 2005). Es interesante remarcar que, si bien Twist-like1 es indispensable
para la determinación celular, Twist-like2 parece involucrado en conferir capacidad
migratoria a las células (Abitua et al., 2012).
Danio rerio: El pez cebra es un teleósteo ciprínido de agua dulce, próximo
filogenéticamente a carpas y barbos, originario del sudeste asiático. Se trata de una
especie muy utilizada en biología del desarrollo debido a la facilidad en su estabulación,
reproducción y manipulación de embriones. Este organismo pertenece al clado de los
gnatóstomos, que junto con los ciclóstomos (lampreas y mixinos) constituyen el subfilo
de los vertebrados. Dicho linaje presenta múltiples estructuras novedosas, como un
cráneo que protege al cerebro, un esqueleto cartilaginoso u óseo conectado por una
columna axial vertebral, o extremidades locomotoras que sobresalen del tronco en
número parejo o impar. El sistema nervioso está altamente elaborado respecto a los otros
grupos de cordados, compuesto por un encéfalo, médula espinal y numerosos ganglios y
nervios. Asimismo, poseen diversos órganos sensoriales muy desarrollados agrupados en
su mayoría en el cráneo, como ojos, oídos o el sistema olfactor. El origen evolutivo de
este diseño corporal podría estar relacionado con un modo de vida activo, posiblemente
consecuencia de una alimentación macrófaga ligada a la depredación.
El desarrollo embrionario del pez cebra comienza, después de una fecundación externa,
con una segmentación en la región libre del abundante vitelo, el blastodisco (Kimmel et
al., 1988) (Fig. I10a). Durante la gastrulación, se genera un movimiento de epibolia en el
que las células internas migran hacia afuera para intercalarse con las externas, lo que
provoca un adelgazamiento del blastodermo a la vez que éste se expande hacia el polo
vegetal del embrión. La neurulación sucede mediante un proceso peculiar, donde las
células de la placa se pliegan en la línea media para constituir la quilla neural, que después
se abrirá internamente dando lugar a la característica estructura hueca del tubo neural
(Lowery and Sive, 2004). A continuación, en el estadio de faríngula, comienza un período
donde se formarán los principales órganos del embrión mediante procesos
morfogenéticos. Muchos de estos procesos dependerán de la interacción señalizadora a
nivel molecular entre distintos tejidos. Especialmente abundante durante el desarrollo es

Introducción
33
Figura I10 | En inglés. (a) Adaptado de D’Costa et al. 2009. Representación de los primeros estadíos embrionarios y el ciclo vital del pez cebra. (b) Adaptado de Dougherty et al. 2013. Izquierda, esquema que muestra los pasos ontogenéticos de la formación del paladar, incluyendo la migración e integración de una población de la cresta neural en la estructura cartilaginosa del hueso etmoides. Derecha, representación de las partes que componen el paladar en humano y pez cebra según su origen embriológico, que es equivalente en ambos organismos. La linea de pez utilizada contiene un enhancer del gen Sox10 controlando la expression de la proteína fotoconvertible Kaede, que ha sido alterada en la población migratoria supraocular mediante manipulación con un microscopio de fluorescencia.

Introducción
34
neurulación (Klymkowsky et al., 2010). Estas células tienen la capacidad de migrar
durante la ontogenia a diversas localizaciones corporales donde se diferencian en distintos
tipos celulares como melanocitos, condrocitos o células de Schwann. De este modo,
constituyen una parte relevante del material celular de diversos órganos, como el corazón,
la señalización cruzada entre tipos celulares epiteliales y mesenquimales (Gilbert, 2013).
Un ejemplo de estos casos es la interacción molecular entre la cresta apical ectodérmica,
un epitelio localizado en la parte distal de la extremidad creciente, y las células
mesenquimáticas del mesodermo subyacente (Zeller et al., 2009). Este intercambio de
moléculas señalizadoras se ha revelado clave para la proliferación y diferenciación de las
células esqueléticas y musculares que conforman las extremidades (Masselink et al.,
2016).
Por otro lado, es interesante destacar que en los vertebrados muchos órganos se forman
mediante el acoplamiento de poblaciones celulares diversas que pueden tener orígenes
embrionarios diferentes. Una de las estructuras embrionarias que mejor ejemplifica dicho
fenómeno es la cresta neural. También conocida como “la cuarta capa germinal”, la cresta
neural proviene de las células del borde de la placa neural, que se localizan en la parte
más dorsal del tubo nervioso una vez concluida lalos ganglios sensoriales o el cartílago
craneal. En este último caso, un proceso morfogenético concreto relacionado con las
células de la cresta ha sido especialmente estudiado: la formación del paladar (Mork and
Crump, 2015). El paladar constituye el techo de la cavidad oral y está formado en un
principio por condrocitos que se mineralizan en los vertebrados con huesos (teleóstomos).
Tanto en peces como en mamíferos, uno de los procesos básicos durante la ontogenia del
paladar es la integración de dos poblaciones distintas de la cresta neural craneal (Swartz
et al., 2011) (Fig. I10b). Una de estas poblaciones se extiende bajo la vesícula óptica y
forma las regiones laterales del paladar, mientras que una población distinta migra por
encima del ojo y se integra en medio de esa estructura (Dougherty et al., 2013) (Figura
I10).

OBJETIVOS

Objetivos
37
Durante la realización de la presente tesis, se han marcado los siguientes objetivos principales:
1.- Identificar aquellos exones alternativos con patrones de inclusión y exclusión
diferencial en varios tejidos de organismos deuteróstomos. (Capítulo 1)
2.- A fin de inferir escenarios macroevolutivos de ensamblaje de programas de splicing
alternativo:
a) Caracterizar la expresión y/o la función embrionaria de determinadas familias de
factores reguladores de splicing en especies de cordados y equinodermos. (Capítulos 2 y
3)
b) Investigar la conexión entre los fenotipos obtenidos y la alteración de los programas
post-transcripcionales derivados de la perturbación de dichos factores. (Capítulos 2 y 3)
c) Estudiar la evolución de los programas de splicing regulados por un mismo factor,
tanto a nivel exónico como génico, en un contexto filogenético amplio. (Capítulo 3)


RESULTADOS


Capítulo 1


Capítulo 1
43
C1: Preliminary insights into the tissue-regulated alternative splicing landscape in
deuterostome species
To begin unravelling macroevolutionary trends among AS patterns in the deuterostome
lineage, we aimed to quantify the relative abundance of tissue-specific splicing events in
distinct organs of two bony vertebrates, one chondrichthyan, one cephalochordate and
one echinoderm. In particular, the species included in the analysis were: zebrafish (Danio
rerio), human (Homo sapiens), elephant shark (Callorhinchus milii), amphioxus
(Branchiostoma lanceolatum) and purple sea urchin (Strongylocentrotus purpuratus). We
selected 7 tissues for each species, matched for homology when possible, specially within
vertebrates (neural, muscle, male and female gonads, digestive tube and hepatic). For
vertebrate species, we used publicly available RNA-seq data. For sea urchin, we
generated deep coverage RNA-seq for radial nerve (neural), lantern (muscle) and gut, and
used other tissues from public sources (Tu et al., 2012). For the amphioxus B.
lanceolatum, we generated high-coverage RNA-seq samples from embryonic and
dissected adult organs. Since this species lacks a published genome, we used these data,
along with data coming from other labs, to annotate the B. lanceolatum genome pre-
release using a combination of RNA-seq tools and EVidenceModeler (EVM) (see
Methods).
Using the vast-tools pipeline, for each species, we first filtered our AS events that did not
have enough read coverage in at least three out of the seven samples. Next, we defined
alternative exons in coding genes as those with Percent Spliced In (PSI) value between
15% and 85% in at least one sample. Then, to characterize those exons with a tissue-
biased inclusion and exclusion pattern, we quantified the number of exons with a
differential PSI (∆PSI = PSI in tissue A – PSI in tissue B) value greater than a given
threshold in one tissue compared to all other samples. We used two different thresholds,
∆PSI > 15 and ∆PSI > 25, to check the effect of a more permissive and a more restrictive
definition of tissue-specificity, respectively (Fig. R1 and Fig. R2). Using the most relaxed
definition (∆PSI >15), between 51 and 64% of exons showed tissue-biased regulation in
all species. An increase of the specificity threshold (∆PSI >25) reduced about half the
percentage of tissue-biased exons in human, shark and sea urchin, while a softer decrease

Resultados
44
Figure R1

Capítulo 1
45
Figure R2

Resultados
46
Figure R1 and R2 | Differentially regulated AS exons in a given organ detected with dPSI>15 (R1) and dPSI>25 (R2). Blue bars represent the number of exons with differentially regulated maximum inclusion in a given sample versus the rest (UP), while dark red bars represent those exons with a significant tissue-specific skipping (DOWN). In amphioxus, “Hepatic” sample refers to the digestive cecum organ, for simplicity. In sea urchin, AxialG refers to the axial gland, and R.Nerve to the radial nerve organ. IR, intron retention; Alt5, alternative 5’ acceptor; Alt3, alternative 3’ donor; AltEX, alternative exon cassette.
to 42% was observed in zebrafish and amphioxus.
Some common patterns were observed across all species. On one hand, comparison
between the seven adult organs in each species revealed that the nervous system showed
the highest number of exons with up-regulated inclusion using ∆PSI > 25 as cut-off (Table
R1). However, the magnitude of this difference in the number of detected neural-
enhanced exons versus other tissues was variable among species. The purple sea urchin,
in particular, showed the more balanced levels of organ-specific exons, with samples
presenting fold-differences below 1.5 (∆PSI >15) or 2 (∆PSI >25) relative to the radial
nerve in all cases but in the axial gland. Interestingly, the restrictive analysis increased
the distance between nervous system and most other organs, although proportions were
generally maintained in muscle of chordates and most sea urchin tissues.
On the other hand, differentially down-regulated exons exhibited a more complex
landscape. Those exons presented relatively similar numbers than enhanced ones in a
given sample of non-human organisms, especially in ∆PSI >15 analysis. A recurrent
exception to this pattern was observed for neural and muscle tissues in several species,
that showed a substantial decrease in skipped versus included exons in most cases.
Strikingly, human presented very high relative levels of organ-specific down-regulated
exons. In this species, the lungs were detected as the most extreme sample, even
exceeding the already elevated number of differentially skipped exons in both muscle and
neural tissues. This result points to organ-specific skipping regulation as a more recurrent
phenomenon in this primate organism relative to the other studied deuterostomes.
However, these results may be confound by the use of different RNA-seq sources and
lack of replicates, and it is therefore difficult to draw specific conclusions about the
diversity of patterns observed for tissue-specific skipping.

Capítulo 1
47
Table R1 | This tables show the proportion of neural up-regulated exons relative to all other tissues (neural/given organ) in each species in both dPSI>15 and dPSI>25 analysis. Green color is for values above 2-fold. Yellow color is for values between 1,5 and 2-fold. Red color is for values between 1 and 1,5-fold. Blue color is for values below 1.


Capítulo 2


Capítulo 2
51
C2: Characterization of RbFox and Nova ontogenetic functions in sea urchin and
the evolution of their expression patterns across distant species.
Characterization of differentially spliced events in multiple species is important for
understanding the evolutionary dynamics regarding relative abundance of this regulatory
mechanism in particular organs. Nevertheless, this approach is limited in terms of
unveiling the organismic function of those sets of tissue-specific alternative isoforms.
Regulation of alternative splicing events is usually performed by RNA-binding proteins
that interact with the spliceosome to enhance or silence the inclusion of multiple exons in
one or few tissues or cell-types. Investigating the expression and organismic roles of those
factors can contribute to unveil the evolution and function of coordinated alternative
splicing programs that are often deployed in coherent biological processes.
For example, RbFox and Nova splicing factors are involved in the development of certain
structures, including the central nervous system, in studied bony vertebrates. On one
hand, an evolutionary scenario leading to the assembly of neural-specific splicing
programs regulated by Nova proteins in chordates has been proposed based on embryonic
expression (Irimia et al., 2011a) (Annexed article 3). On the other hand, a similar
macroevolutionary perspective for RbFox ontogenetic role is lacking, as reported analysis
have been restricted to vertebrates and fast-evolving ecdisozoans. Furthermore, there is
no functional data regarding the embryonic function of both gene families, neither their
regulated splicing programs, in deuterostome organisms other than mouse or zebrafish.
Nova function is involved in gastrulation movements in sea urchin embryo. To begin unravel the developmental function of Nova splicing factor in an organism
closely related to the chordate phylum, we investigated its role in the purple sea urchin
(Strongylocentrotus purpuratus). The sole Nova ortholog of this species was described to
be expressed in an endomesodermal ring of cells surrounding the future blastopore in
mesenchyme blastula embryos (24hpf) and subsequently restricted to the hindgut region
during gastrula stages (36-48hpf) (Fig. R3a) (Irimia et al., 2011a). In fact, this pattern is
very similar to the one previously described for the Mediterranean urchin Paracentrotus
lividus (Röttinger et al., 2006), which suggests a certain degree of functional conservation

Resultados
52
Figure R3 | Endoderm invagination is impaired during gastrulation in Nova knock-down embryos. (a) WISH using Nova and Endo16 anti-sense probes in Strongylocentrotus purpuratus embryos at three different developmental stages (24hpf, 36hpf, 48hpf). (b) Statistics regarding the gastrulation phenotype in 48hpf embryos injected with both splicing (SplMO) and translation (trMO) morpholinos. (c) Number of differentially regulated splicing events, classified by type, obtained by RNA-seq comparison between 3 replicates of control and trMO injected embryos. Blue color is used for those events whose inclusion is promoted by Nova, while red color represents those events with down-regulated inclusion by Nova factor. IR, intron retention; Alt5, alternative 5’ acceptor; Alt3, alternative 3’ donor; AltEX, alternative exon cassette.

Capítulo 2
53
for this gene within the Echinacea lineage.
We designed two morpholino molecules to knock-down Nova function in sea urchin
embryos, one of them blocking translation (ATG-MO) and another one blocking the 3’
splice site of exon 3 (Spl-MO). Eggs were injected separately with the two morpholinos
to ensure the specificity of the experiment. In both cases, a significant fraction of injected
embryos showed an impairment in the invagination movements of the endoderm tissue
that occur during gastrulation. While some of embryos exhibited a reduced gut at 48hpf
that did not reach the animal side of the gastrula, most of them presented an apparent fail
in gastrulation initiation (Fig. R3b). A whole mount in situ hybridization (WMISH) of
Endo16, a marker for endoderm specification, showed no change in expression at 24hpf
and 36hpf (Fig. R3a). This suggests that the phenotype is not due to an error in cell lineage
determination, but more probably related to morphogenetic disturbance.
To check the transcriptomic impact of Nova knock-down during sea urchin
embryogenesis, we performed three independent replicas of RNA sequencing (RNA-seq)
from control and ATG-MO injected embryos at 24hpf stage. Using vastools pipeline, we
identified differentially-regulated splicing events (dPSI ≥ 10) between control and knock-
down blastulas. We found 1.695 exon cassettes with down-regulated inclusion in Nova
depleted embryos, suggesting a profound molecular affectation. Surprisingly, a great
percentage of those exons (~66%) are constitutively included in a relatively complete set
of developmental and adult public samples. Thus, a possible explanation for this result is
that one or more of Nova-regulated alternative exon targets may produce a direct or
indirect impairment of the constitutive spliceosomal function in knock-down embryos.
Alternatively, Nova might act as protein co-factor needed to catalyse the inclusion of
some of these constitutive exons in their expressing cells.

Resultados
54
Figure R4 | Nova family gene expression in adult organs of deuterostome and protostome species (in cRPKMs). Gene expression values are obtained from RNA-seq samples measured in corrected Reads per Kilobase per Million reads (cRKPMs). Species shown in this figure are zebrafish (Danio rerio), human (Homo sapiens), elephant shark (Callorhinchus milii), European amphioxus (Branchiostoma lanceolatum), purple sea urchin (Strongylocentrotus purpuratus), octopus (Octopus vulgaris), fruit fly (Drosophila melanogaster) and the centipede (Strigamia maritima).

Capítulo 2
55
We also aimed to characterize relative Nova expression in adult organs of five
deuterostomes and three protostome species using RNA-seq data (Fig. R4). We found
high transcription of Nova genes in the central nervous system (CNS) in organisms from
the chordate phylum. Nevertheless, while both paralogues of zebrafish exhibit a quite
clear neural-specific pattern, human genes presented a less clean picture, with Nova2
transcription exhibiting similar levels in brain and lungs (which are highly enriched in
endothelial tissue). Along these lines, Nova1 also showed elevated presence in male and
female gonads in elephant shark. Moreover, fainter but noticeable expression was
detected in amphioxus muscular tissue, as has been previously reported by qPCR data
(Irimia et al., 2011a). Interestingly, the purple sea urchin showed a much less tissue-
enriched pattern, with the radial nerve being one of the organs with lowest expression.
Within the protostomes, the two arthropods and one cephalopod species presented higher
abundance of Nova transcripts in the male gonads, although Drosophila melanogaster
exhibited comparable expression levels in the nervous system. These results point to
complex evolutionary trajectories of this gene family including scenarios of conservation
and recruitment of Nova function in certain organs within distinct metazoan clades.
Resultados
56
RbFox activity is conserved in the myogenic mesoderm and co-opted into lineage-
specific developmental processes among deuterostomes.
To unravel the evolution RbFox gene family expression patterns during development, we
performed whole mount in situ hybridization (WISH) in several non-vertebrate
deuterostome species. We found the sole RbFox homologues expressed in the embryonic
mesoderm of all studied organisms (Figure R5). In the urochordate Ciona intestinalis, we
observed expression in the tail in muscular and notochord tissues at tailbud stage. In
Branchiostoma lanceolatum, a cephalochordate species, RbFox transcription was
detected along dorsal mesoderm at mid-neurula stage. This tissue-specific pattern was
maintained at late neurula stage, as individual somites derived from the adaxial mesoderm
were stained. In Strongylocentrotus purpuratus, expression of RbFox was clearly detected
in the skeletogenic mesenchyme at blastula stages (18hpf and 24hpf) and in the myogenic
cell lineage in gastrula embryos (48hpf). In addition, transcription of this gene in other
mesodermal non-skeletogenic tissues during blastula stage was also observed, although
assays with additional markers would be further needed to unveil the precise cell
lineage/s. In summary, these expression patterns suggest the possibility that RbFox gene
family was expressed in the myogenic embryonic mesoderm of the last common ancestor
of deuterostomes. Moreover, they also point to co-option of this gene family in the
ingressing skeletogenic mesenchyme of at least one echinoid species and into brain
development of bony vertebrates.
Next, to investigate the ontogenetic role of this splicing factor in a non-chordate species,
we aimed to knock-down RbFox function during embryogenesis. We designed two
different morpholino molecules to ensure the specificity of our experimental approach. A
first morpholino was designed to block splicing of exon 5 (SplMO), which contains the
sequence coding for the internal part of the only RNA Recognition Motif (RRM) domain
of the encoded protein. Injected embryos collected at 24hpf showed missplicing of the
targeted exon, with usage of a cryptic splice site located within the adjacent intron (Figure
R6a). The transcript resulting from this experimental manipulation contained a premature
stop codon (PTC), leading to the production of a non-functional peptide.

Capítulo 2
57
Figure R5 | RbFox genes are expressed in myogenic mesoderm of studied deuterostome species and also in developing CNS of vertebrate species. (a-d) Pictures adapted from Thisse 2004 and Gallagher et al. 2010. WISH for RbFox gene family members in zebrafish embryos around 32hpf show expression in central nervous system in case of RbFox1, RbFox2 and RbFox3 (a,b), in myogenic cells in RbFox2 and RbFox4 (c,d). (e,f) WISH of RbFox gene in mid-tailbud embryos of Ciona intestinalis show a strong expression pattern in the muscle cell lineage, located in the tail, along with slightly weaker expression in the notochord. e is lateral view, f is dorsal view. (g-j) WISH of RbFox ortholog in embryos of Branchiostoma lanceolatum at middle neurula stage (g,h) reveals transcription in paraxial mesoderm, that is maintained in the somites coming from this tissue in late neurulas (i,j). g and i are lateral views; h and j are dorsal views. (k-m) WISH for RbFox transcripts in Strongylocentrotus purpuratus embryos at 18hpf (k), 24hpf (l) and 48hpf (m) showed a mesodermal expression patterning, with clear staining of the primary mesenchyme during its ingression into the blastocele cavity (l) and in the myogenic lineage at gastrula stage (m).

Resultados
58
Figure R6 | RbFox knock-down in sea urchin embryos with two different morpholino molecules. (a) Left, schematic representation of the gene structure of RbFox gene of Strongylocentrotus purpuratus, with boxes representing exons, and horizontal lines representing introns. The binding region of the Spl MO is marked with a thicker line at the exon 5 donor site. Targeted exon codes for the internal part of the RRM domain. Right, transcriptional alteration produced by morpholino injection, with the included intronic region painted in red. PTC, premature termination codon. (b) Up, schematic representation of the multiple alternative first exons of RbFox gene in sea urchin, and their relative position relative to exon 2. Down, a graphic showing the relative abundance of RNA-seq reads from sea urchin embryo stages that map to the junction of each of the first annotated exons with exon 2. Blue column marks the developmental period when co-injection of both E1bMO and E1eMO is supposed to be more effective.
We then aimed to design a second morpholino in a region overlapping the ATG codon to
block translation of the protein. However, similar to vertebrate’s case, we found five
alternative promoters containing in-frame ATG codons that may constitute translation
initiators. To understand the differential usage of those promoters, we used publicly
available RNA-seq data spanning 10hpf to 48hpf embryonic stages. We quantified the
proportion of reads mapping to exon junctions formed by the sequence transcribed by

Capítulo 2
59
each promoter and the first constitutive exon of the transcript (Figure R6b). Obtained
results pointed to a dynamic use of the different promoters during development. Exons
E1b and E1e were the most frequently transcribed at 24hpf and 30hpf. On the other hand,
exons E1a, and specially E1d, were predominant at 40hpf and 48hpf. Thus, to maximize
down-regulation of RbFox gene expression around 24hpf, we designed two morpholinos
blocking translation of the transcripts containing exons E1b (E1bMO) and E1e (E1eMO).
As RbFox gene is expressed in skeletogenic mesenchyme during blastula stage and in
myogenic cells at gastrula stage, we checked the development of those organs in knock-
down embryos at pluteus stage (Fig. R7). Embryos injected with SplMO developed into
larvae with complete absence of skeletal structure (92,5%) or with very small rudimentary
spicules (7,5%) at 72hpf. We observed the same phenotypes in embryos injected with
both E1bMO and E1eMO, although in this case the proportion of pluteus larvae with
rudimentary spicules was higher (73%) compared to the absolute lack of a calcium
carbonate skeleton (25%). We also studied the development of the muscular
circumesophageal ring tissue using an antibody against myosin heavy chain (MHC). This
staining allowed us to quantify that most SplMO injected embryos presented an impaired
circumesophageal ring (73%), with muscle cells not fused or disorganized, and even a
noticeable percentage of larvae showed no ring presence at all (19%).
On contrary, E1bMO and E1eMO co-injection lead to a normal MHC ring in most cases
(94%), while only a minority showed impairment of muscular structure (6%). This data
seems to reflect differential promoter usage in mesodermal tissues. RbFox is strongly
expressed in primary mesenchyme at 24hpf, when most active promoters produce
isoforms containing exons E1b and E1e, and in the myogenic lineage at 48hpf, when
transcripts mainly contain exons E1a and E1d. Thus, blocking the two most active
promoters during primary mesenchyme ingression at 24hpf have wide structural
consequences for the larvae skeleton, but not for the development of the muscular
circumesophageal ring.
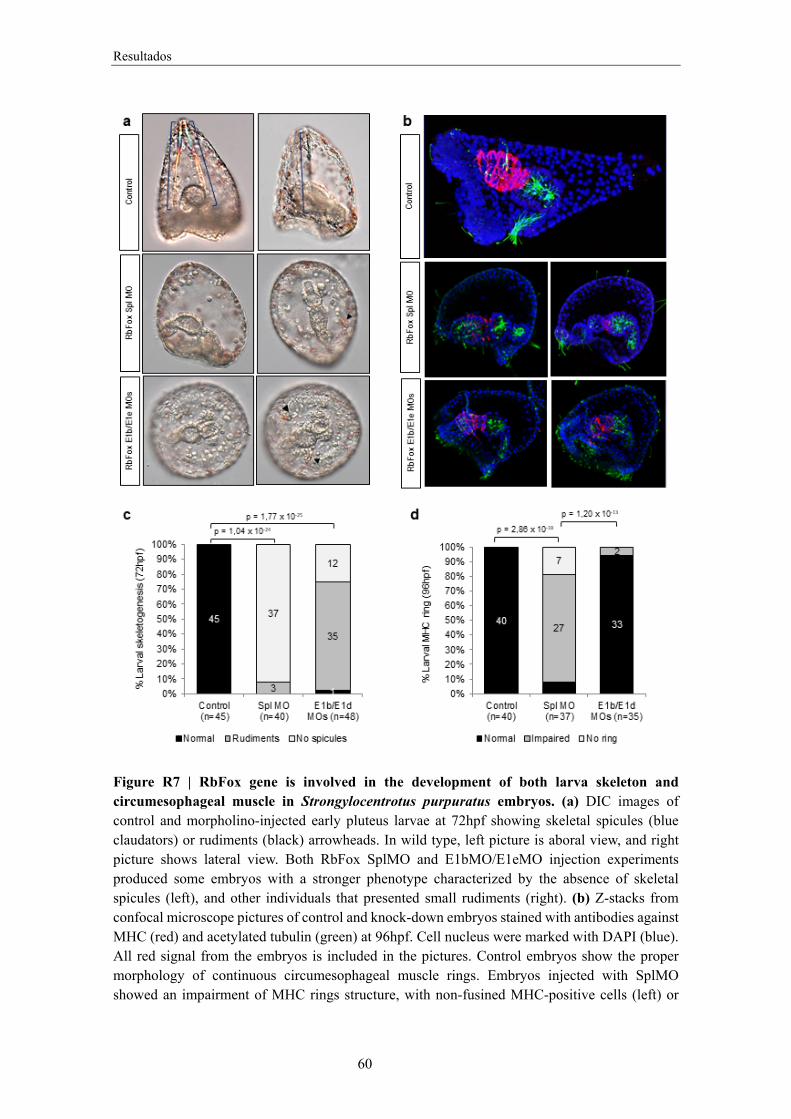
Resultados
60
Figure R7 | RbFox gene is involved in the development of both larva skeleton and circumesophageal muscle in Strongylocentrotus purpuratus embryos. (a) DIC images of control and morpholino-injected early pluteus larvae at 72hpf showing skeletal spicules (blue claudators) or rudiments (black) arrowheads. In wild type, left picture is aboral view, and right picture shows lateral view. Both RbFox SplMO and E1bMO/E1eMO injection experiments produced some embryos with a stronger phenotype characterized by the absence of skeletal spicules (left), and other individuals that presented small rudiments (right). (b) Z-stacks from confocal microscope pictures of control and knock-down embryos stained with antibodies against MHC (red) and acetylated tubulin (green) at 96hpf. Cell nucleus were marked with DAPI (blue). All red signal from the embryos is included in the pictures. Control embryos show the proper morphology of continuous circumesophageal muscle rings. Embryos injected with SplMO showed an impairment of MHC rings structure, with non-fusined MHC-positive cells (left) or

Capítulo 2
61
even a complete absence of differentiated muscle cells surrounding the foregut (left). However, embryos with double E1b/E1e morpholino injection showed normal ring (left) or a softer impairment of the structure. (c) Statistics regarding the skeleton phenotype in the knockdown experiments show a stronger effect in case of SplMO injection. (d) Statistics regarding the muscular phenotype in the knockdown experiments show that the phenotype is greatly restricted to the SplMO injection.
To get insights into the molecular function of RbFox in purple sea urchin, we performed
RNA-seq of 3 replicas of wild type and Spl-MO injected embryos at blastula stage (24hpf)
(Fig R8). We identified multiple cases of differentially regulated splicing events: 204
exon cassettes, 49 alternative donor sites, 13 alternative acceptor sites and 29 intron
retentions. Interestingly, among the obtained events, we detected an RbFox-silenced exon
in Fgfr1, a member of the Fgf signalling receptor family. This gene was previously
reported to be expressed in both the myogenic mesodermal lineage and in the ectodermal
apical organ during early development. Moreover, a knock-down of Fgfr1 in sea urchin
embryos revealed a very similar phenotype to that of RbFox in terms of muscle formation
(Andrikou et al., 2015). We then performed an in-silico analysis that identified two
canonical RbFox binding sites within the 160nt adjacent nucleotides of the upstream
intron, suggesting direct regulation of this event by the splicing factor.
Finally, we also characterized the expression of RbFox family in multiple adult tissues
from diverse species using the same RNA-seq samples as in the Nova analysis (Fig. R9).
Surprisingly, all non-vertebrate organisms showed the highest relative levels of RbFox
mRNA in the nervous system. This pattern was similar in general terms for vertebrate
species, although maximum levels were observed in muscle for some homologs like
human RbFox1 or zebrafish RbFox4. Consistent with published data for mammals,
RbFox2 gene seems to present the more promiscuous expression among the different
paralogs. These results point to three main conclusions: (i) RbFox family could be related
to AS regulation in the adult nervous system since the origin of Bilateria; (ii) embryonic
RbFox transcription is decoupled from adult pattern in terms of neural expression in non-
vertebrate deuterostome species; (iii) RbFox paralogs from vertebrate organisms present
notable evolutionary plasticity regarding their relative expression levels in distinct
tissues.

Resultados
62
Figure R8 | Inclusion levels of numerous AS events in sea urchin blastula change upon RbFox knock-down, including one Fgfr1 exon. (a) Number of differentially regulated splicing events, classified by type, obtained by RNA-seq comparison between 3 replicates of control and SplMO injected embryos. Blue color is used for events whose inclusion is promoted by RbFox, while red color represents those events with down-regulated inclusion by RbFox factor. IR, intron retention; Alt5, alternative 5’ acceptor; Alt3, alternative 3’ donor; AltEX, alternative exon cassette. (b) Left, a graphic showing the inclusion levels (PSI) of an Fgfr1 exon in the three replicates of control and RbFox knock-down embryos in sea urchin embryos at 24hpf. Lines are drawn at the mean value for control (red) and SplMO injected (blue) samples. Right, Rt-PCRs showing the different isoform balance if Fgfr1 splicing between control and SplMO cDNAs
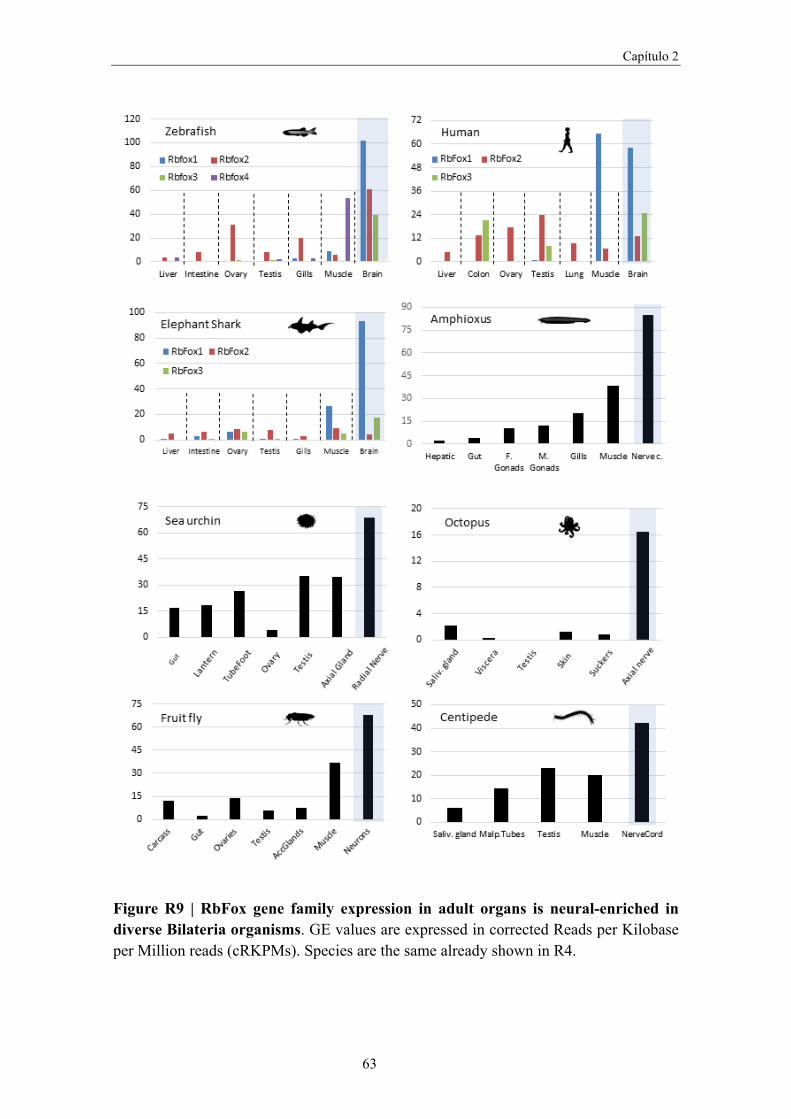
Capítulo 2
63
Figure R9 | RbFox gene family expression in adult organs is neural-enriched in diverse Bilateria organisms. GE values are expressed in corrected Reads per Kilobase per Million reads (cRKPMs). Species are the same already shown in R4.


Capítulo 3


Capítulo 3
67
C3: Evolutionary recruitment of flexible Esrp-dependent splicing programs into
diverse embryonic morphogenetic processes
Epithelial-mesenchymal interplays are essential to many organogenetic processes in
vertebrates (Gilbert, 2013; Wagner, 2014). These tissues often interact in morphogenetic
interfaces through the exchange of cells and signaling molecules (Niswander et al., 1994;
Thesleff et al., 1995). Despite the great diversity of cell types across the embryo, the
majority can be classified as showing either mesenchymal or epithelial characteristics.
This broad distinction, which is independent of tissue origin, has also been shown to be
reflected in the patterns of gene expression and alternative splicing (AS) (Mallinjoud et
al., 2014). Those transcriptomic programs confer partly antagonistic morphogenetic
properties to epithelial and mesenchymal tissues by modulating certain cellular features,
such as adhesion, motility and polarity.
Several morphogenesis-associated AS events are directly regulated by the Epithelial
Splicing Regulatory Protein (Esrp) genes in mammalian species (Claude C Warzecha et
al., 2009). Esrp1 and Esrp2 were originally identified as positive regulators of IIIb exon
inclusion of the Fgfr2 gene (Claude C. Warzecha et al., 2009). They encode RNA-binding
proteins that are dynamically expressed mainly in a subset of epithelial tissues during
mouse development (Revil and Jerome-Majewska, 2013), although mesenchymal
expression has also been reported in chicken (Sagnol et al., 2016). Recently, double
knockout (DKO) mice for both Esrp genes were shown to display severe organogenetic
defects, and a complete shift to exon IIIc inclusion in Fgfr1, Fgfr2 and Fgfr3 (Bebee et
al., 2015). In addition, many Esrp exon targets were identified in genes involved in cell-
cell adhesion, cell polarity and migration (Warzecha et al., 2010). However, the degree of
evolutionary conservation and diversity of Esrp morphogenetic functions and its
regulated AS programs at a large phylogenetic scale remain unknown.
esrp1 and esrp2 are involved in multiple morphogenetic processes in zebrafish
development.
A broad phylogenetic analysis showed that Esrp predates the origin of metazoans and that
a single copy of Esrp has been maintained in most metazoan groups with the exception

Resultados
68
of the vertebrate lineage, in which two copies are present in all studied species
(Supplementary Fig. R1 and R2). To investigate the evolution of Esrp roles, we first
examined the expression and function of the two Esrp paralogs (esrp1 and esrp2) in
zebrafish. A highly dynamic expression pattern was observed for both genes during the
development of zebrafish using whole-mount in situ hybridization (WMISH) (Fig. R10a
and Supplementary Fig. R3a). At early stages, both genes displayed different expression
patterns. esrp1 transcripts were detected in the whole epidermis at 14 hours post-
fertilization (hpf), but its expression was restricted to the posterior part of the embryo at
16hpf. On the other hand, esrp2 was found only in the hatching gland rudiment at these
stages. However, from 24hpf to 5 days post-fertilization (dpf), the expression of both
genes converged in most territories. Their transcription was transiently activated during
the development of multiple organs, including the olfactory epithelium, otic vesicle,
pharynx, epidermis and notochord. esrp2 showed expression in a few additional tissues
such as pronephros, hatching gland, liver and heart.
Next, we used the CRISPR-Cas9 system to generate loss-of-function zebrafish mutant
lines for esrp1 and esrp2. We targeted single guide-RNAs to the first and third exons of
esrp1 and esrp2, respectively (Fig. R10b). For esrp1, we selected a mutant allele with a
168-bp deletion and 14-bp insertion that induced the usage of an upstream cryptic splice
donor, resulting in skipping of the whole coding sequence of exon 1, including the start
codon. For esrp2, we selected a mutant allele with a 17-bp frame-disrupting deletion that
produced a premature stop codon before the translation of any RNA-binding domain and
that was predicted to trigger non-sense mediated decay (Fig. R10b). To determine the
functional impact of these mutations, we attempted to clone the full-length version of
both mutant and wild type (WT) alleles in a pcDNA3.1 vector and transfect the construct
into human 293T cells. Whereas expression of the WT allele of zebrafish esrp1 was able
to modify the splicing pattern of previously reported endogenous targets (EXOC7,
ARHGAP17 and FGFR1) in the same way as its human orthologue (Warzecha et al.,
2010), expression of the mutant esrp1 allele did not produce any measurable effect in
exon inclusion levels (Supplementary Fig. R3m). We were unable to clone the full-length
transcript of the mutant esrp2 allele due to its very reduced expression (Supplementary
Fig. R3n), supporting that the selected esrp2 allele is also a functionally null mutant.

Capítulo 3
69
Figure R10 | Expression and developmental roles of esrp1 and esrp2 in zebrafish. (a) WMISH for esrp1 and esrp2 in Danio rerio wild type embryos. At 14hpf, esrp1 transcripts were observed in embryonic epidermis, while esrp2 expression was only detected in the polster (po). At 16hpf, esrp1 was restricted to the posterior and tailbud (tb) epidermis, whereas esrp2 persisted in the hatching gland rudiment (hr) and mild expression started to be detected in the otic placode (ot). By 20hpf, esrp1 was found in the tailbud epidermis and more subtly in the olfactory placode (ol), while esrp2 appeared in new territories such as pronephros (pn) and ectodermal cells of tailbud fin fold (ff). At 24hpf, expression of both paralogs presented a similar pattern including olfactory and otic placodes, cloaca (cl) and epidermis (ep), although esrp2 was also observed in the hatching gland (hg). By 36hpf, both genes were detected in the inner ear epithelium (ie), notochord (nt), and phanynx (ph), and esrp2 was also observed in the heart (he). At 48hpf, expression was found predominantly in inner ear and pharynx. (b) Left: Schematic representation of the genomic and
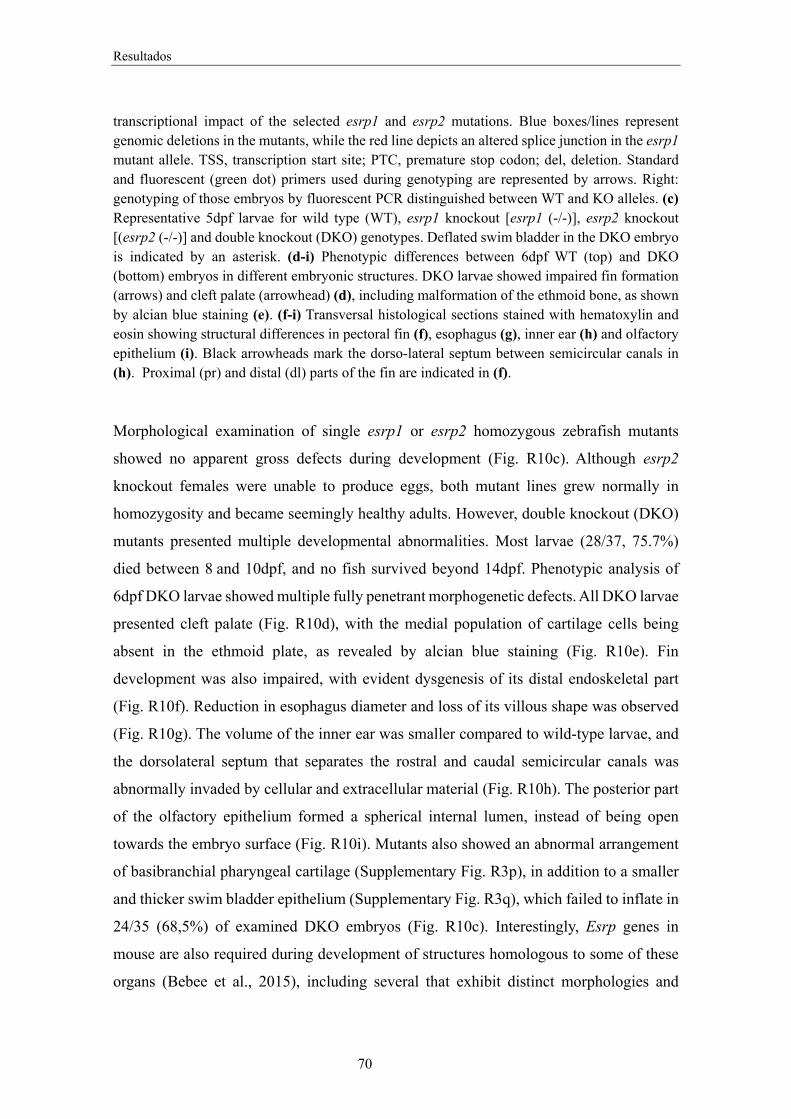
Resultados
70
transcriptional impact of the selected esrp1 and esrp2 mutations. Blue boxes/lines represent genomic deletions in the mutants, while the red line depicts an altered splice junction in the esrp1 mutant allele. TSS, transcription start site; PTC, premature stop codon; del, deletion. Standard and fluorescent (green dot) primers used during genotyping are represented by arrows. Right: genotyping of those embryos by fluorescent PCR distinguished between WT and KO alleles. (c) Representative 5dpf larvae for wild type (WT), esrp1 knockout [esrp1 (-/-)], esrp2 knockout [(esrp2 (-/-)] and double knockout (DKO) genotypes. Deflated swim bladder in the DKO embryo is indicated by an asterisk. (d-i) Phenotypic differences between 6dpf WT (top) and DKO (bottom) embryos in different embryonic structures. DKO larvae showed impaired fin formation (arrows) and cleft palate (arrowhead) (d), including malformation of the ethmoid bone, as shown by alcian blue staining (e). (f-i) Transversal histological sections stained with hematoxylin and eosin showing structural differences in pectoral fin (f), esophagus (g), inner ear (h) and olfactory epithelium (i). Black arrowheads mark the dorso-lateral septum between semicircular canals in (h). Proximal (pr) and distal (dl) parts of the fin are indicated in (f).
Morphological examination of single esrp1 or esrp2 homozygous zebrafish mutants
showed no apparent gross defects during development (Fig. R10c). Although esrp2
knockout females were unable to produce eggs, both mutant lines grew normally in
homozygosity and became seemingly healthy adults. However, double knockout (DKO)
mutants presented multiple developmental abnormalities. Most larvae (28/37, 75.7%)
died between 8 and 10dpf, and no fish survived beyond 14dpf. Phenotypic analysis of
6dpf DKO larvae showed multiple fully penetrant morphogenetic defects. All DKO larvae
presented cleft palate (Fig. R10d), with the medial population of cartilage cells being
absent in the ethmoid plate, as revealed by alcian blue staining (Fig. R10e). Fin
development was also impaired, with evident dysgenesis of its distal endoskeletal part
(Fig. R10f). Reduction in esophagus diameter and loss of its villous shape was observed
(Fig. R10g). The volume of the inner ear was smaller compared to wild-type larvae, and
the dorsolateral septum that separates the rostral and caudal semicircular canals was
abnormally invaded by cellular and extracellular material (Fig. R10h). The posterior part
of the olfactory epithelium formed a spherical internal lumen, instead of being open
towards the embryo surface (Fig. R10i). Mutants also showed an abnormal arrangement
of basibranchial pharyngeal cartilage (Supplementary Fig. R3p), in addition to a smaller
and thicker swim bladder epithelium (Supplementary Fig. R3q), which failed to inflate in
24/35 (68,5%) of examined DKO embryos (Fig. R10c). Interestingly, Esrp genes in
mouse are also required during development of structures homologous to some of these
organs (Bebee et al., 2015), including several that exhibit distinct morphologies and

Capítulo 3
71
functions compared to zebrafish, such as the lungs/swim bladder, palate skeleton and
pectoral limbs/fins.
To characterize the phenotype of the DKO embryos at the molecular level, we performed
RNA-seq of two replicates of DKO 5dpf and age-matched WT larvae (see Methods).
Differential gene expression analysis identified 248 and 609 down-regulated and up-
regulated genes, respectively. Gene Ontology (GO) enrichment analysis showed
functional categories that were highly consistent with some of the observed phenotypes,
such as skeletal system development and sensory perception (Supplementary Fig. R3r).
Interestingly, other significantly enriched categories pointed to specific impaired
processes at the cellular level such as cell-cell adhesion, cell-matrix adhesion and cell
component morphogenesis.
Esrp is able to modulate the motility of the mesenchymal cell lineage in vase
tunicates.
To examine the diversity of roles that Esrp genes play during embryogenesis beyond the
vertebrate clade, we first studied the ascidian Ciona intestinalis, a species belonging to
its sister group, the tunicates (Delsuc et al., 2006). Expression of the single Esrp ortholog
present in the Ciona genome was detected in the embryonic epidermis after neurulation,
as in the case of vertebrates (Fig. R11). In addition, Esrp expression was also observed in
a bilateral domain located within the mesenchymal lineage from early to late tailbud
stage. Ciona mesenchymal cells derive from the Twist-like1-expressing A7.6 [trunk
lateral cells], B7.7, and B8.5 blastomeres of the 110-cell stage embryo (Imai, 2003). As
development proceeds, those cells divide and give rise to three mesenchymal sub-lineages
that are located in a region of the trunk adjacent to the tail during mid-tailbud stages.
Twist-like1 enhances the transcription of several mesenchymal genes, including Twist-
like2, before being downregulated around mid-tailbud stage (Imai, 2003; Tokuoka et al.,
2004). In subsequent stages, a number of cells coming from the Twist-like2-positive
lineage migrate towards the anterior part of the trunk to contribute to the formation of
mesodermal organs (Tokuoka et al., 2005).

Resultados
72
Figure R11 | Esrp is expressed in a subpopulation of TLCs in Ciona and is able to modulate cell motility in the mesenchymal lineage. (a) Esrp expression (green) is detected at 10hpf by fluorescent WMISH in the epidermis and in some cells within the mesenchymal lineage, as shown by co-staining with mCherry driven by the Twist promoter, which labels the Twist-like1-derived cell lineage. (b-c) Esrp (green) is expressed in the TLC lineage as shown by co-staining with Hand-r>LHG/LexAOP>H2B::mCherry (red) in 13hpf and 14hpf embryos in lateral (b) and dorso-lateral (c) views, respectively. aTLC: Anterior TLCs, pTLC: posterior TLCs. (d-l) Double fluorescent WMISH for Esrp (red) and Twist-like2 (green), with the exception of (j), which corresponds to colorimetric Esrp mRNA staining (purple). At middle tailbud stage, Esrp expression is detected in both epidermis and mesenchymal cell lineage (the latter is marked by arrows). (m-m’) Mesenchymal lineage in wild type larvae at 18hpf stained in red using the Twist>CD4::mCherry construct. Tyrp1/2a>2xGFP, which labeled pigment sensory organs in green, was used as co-electroporation control plasmid. (n-n’) Mesenchymal lineage stained in larvae co-electroporated with Twist>CD4::mCherry and Twist>Esrp constructs. The trunk region is shown in (m-n), while tail segments are shown in (m’-n’). (o) Quantification of the different phenotypes of mesenchymal cell lineage motility observed in Twist>Esrp and control larvae. These included individuals with abnormal migration in the trunk (‘Trunk’), with ectopic mCherry positive cells in the tail (‘Tail’) or both phenotypes (‘Trunk + Tail’). P-values correspond to a two-sided Fisher Exact tests (‘Normal’ vs rest).
We confirmed the expression of Esrp within the mesenchymal lineage with a double-
staining assay. Fertilized eggs were electroporated with a construct (Twist>CD4::mChe)
carrying the Twist-like1 promoter driving the expression of the membrane-targeted

Capítulo 3
73
Cherry (mChe) protein as a reporter (Gline et al., 2015). An anti-mChe antibody was used
to track the mesenchymal cell lineage, while endogenous Esrp expression was visualized
by fluorescent WMISH (Fig. R11a). A similar assay using a LexA/LexAop system driven
by the Hand-r proximal enhancer (Tolkin and Christiaen, 2016) narrowed the identity of
this Esrp-expressing domain down to a subset of posterior trunk lateral cells (Fig.
R11b,c). This mesenchymal lineage contributes to the formation of specific organs like
the oral siphon muscle and the epithelium of the 1st/2nd gill-slits (Tokuoka et al., 2005).
To unravel the dynamics of these Twist-like1-derived Esrp-positive cells, we next
performed a double WMISH with probes for Esrp and Twist-like2. This showed that the
expression of both genes is rapidly regulated during development and soon acquire a
mutually exclusive expression pattern, which becomes evident by late tailbud stage (Fig.
R11g-i). At late tailbud II stage, Twist-like2 was restricted to anterior mesenchymal
domains, while Esrp transcripts were only detected in the posterior-most part of the trunk
(Fig. R11j-l).
The common developmental origin of these two cell populations, the function of Twist-
like2 as a key inducer of cellular migration (Abitua et al., 2012), and the described
antagonistic roles of Esrp and Twist genes in mammalian cells (Shapiro et al., 2011) led
us to hypothesize that Esrp may confer particular morphogenetic properties to the subset
of cells within the mesenchymal lineage in which it is expressed. To test this possibility,
we ectopically expressed Esrp in all mesenchymal cells (Twist>Esrp) during early stages,
together with Twist>CD4::mChe to visualize them. We fixed embryos at larval stage,
when a large part of the cell migration towards the anterior part of the trunk has occurred.
We observed two main phenotypes associated with an abnormal mesenchymal
distribution in 75% of individuals (n=70). In all affected embryos, migrating mChe-
positive cells were found only in the lateral sides adjacent to the epidermis, but not
through the middle part of the trunk (Fig. R11m-n,o). In addition, 35% of co-
electroporated larvae also showed ectopic mChe-positive cells distributed along the tail,
which were only very rarely observed in control individuals (Fig. R11o). Interestingly, a
previous study found that some cells derived from B7.7 and B8.5 mesenchymal lineages,
which normally do not express Esrp, localized in the tail of Twist-like1 knockdown of

Resultados
74
Ciona larvae, integrating muscular and endodermal tissues (Tokuoka et al., 2005).
Altogether, our results thus suggest that Esrp may modulate motility properties of the
mesenchymal cell lineage in ascidians, as well as compromise topological cellular fate
when ectopically expressed.
Esrp expression in amphioxus embryos is associated with different morphogenetic
processes.
We next investigated Esrp expression in the amphioxus Branchiostoma lanceolatum, a
cephalochordate species that shares many developmental processes and a general
bodyplan with vertebrates (Garcia-Fernàndez et al., 2009). Amphioxus Esrp showed a
highly dynamic expression pattern during embryo development (Fig. R12). In early
neurula embryos (14hpf), Esrp transcripts were observed in the border region, an
ectodermal tissue adjacent to the neural plate (Fig. R12a). During neurulation, Esrp was
strongly expressed along the ectodermal hinge points of neural tube closure (Fig. R12b-
c). Right after neurulation (21hpf), transcription of Esrp was extended to the epidermis
of the whole embryo (Fig. R12d). Finally, in pre-mouth larvae stages, the expression was
restricted to the tailbud region, anterior ectoderm, and, strikingly, in a few cells near and
within the dorsal epidermis (Fig. R12e-g). Because of their shape and location, the latter
group of cells may correspond to a previously described population of epidermal sensory
neurons (Benito-Gutiérrez et al., 2005; Kaltenbach et al., 2009; Lu et al., 2012). These
cells have been reported to delaminate from the ventral ectoderm, migrate underneath the
epithelium towards the dorsal part of the embryo and re-integrate into the ectoderm,
where they become sensory cells. Based on its dorsal expression, we speculate that Esrp
might contribute to the process of epithelial integration at the final migratory stages.

Capítulo 3
75
Figure R12 | Esrp is expressed dynamically in the non-neural ectoderm during amphioxus embryo development. WMISH of Esrp in Branchiostoma lanceolatum embryos. Anterior is to the left in all cases. (a) 14hpf early neurula (dorsal view) showing expression in the border region (br) next to the neural plate (npl). (b,c) 16hpf and 18hpf mid-neurula embryos (dorsal view) stained most strongly in the ectodermal cells next to the neural plate border and that form the hinge points (hp) during neural tube closure. The location of the neuropore (npo) is indicated. (d) In 21hpf late neurula (dorsal view), Esrp expression is extended throughout the whole epidermis (ep). (e-f) Early (30hpf) and late (36hpf) pre-mouth stages (lateral views) showing Esrp-positive cells in anterior ectoderm, tail bud epithelia and in a few cells that likely corresponding to migrating sensory cells during dorsal incorporation or already integrated into the epithelium (black arrows). (g) Dorsal (D) view shows the epidermal location those Esrp-positive cells.
Esrp is involved in ciliogenesis repression in ectodermal cells and the mesenchymal-
to-epithelial transition of pigment cells in sea urchin.
We next investigated the functions of Esrp in the purple sea urchin Strongylocentrotus
purpuratus (hereafter referred as ‘sea urchin’). This organism belongs to Ambulacraria, a
lineage closely related to chordates, with a transcriptome-based annotated genome and
available genetic tools. Colorimetric WMISHs revealed Esrp expression in the ectoderm
and mesoderm in one half of the embryo at blastula stage (24hpf) (Fig. R13a,b). At later
stages (36hpf), expression became more complex in the mesoderm (Fig 4c). Expression
was no longer detected at gastrula (48hpf) or early pluteus stage (72hpf). Fluorescent
WMISH confirmed Esrp expression in the ectoderm and non-skeletogenic mesodermal
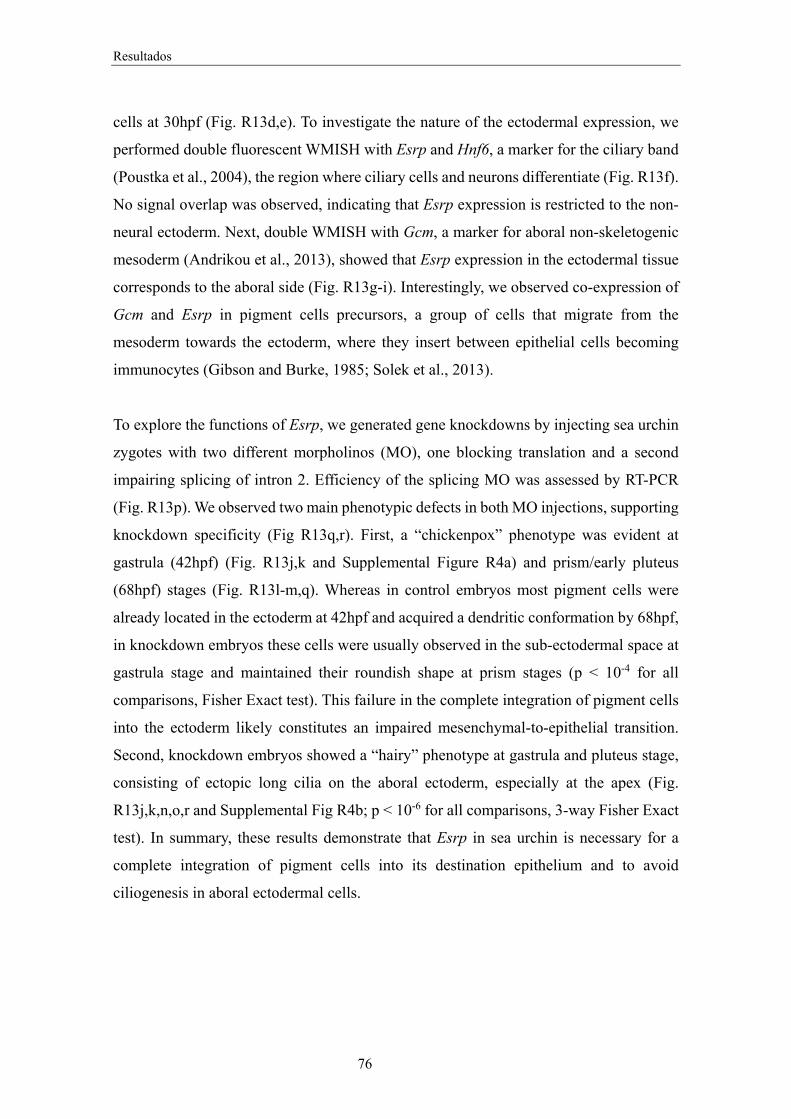
Resultados
76
cells at 30hpf (Fig. R13d,e). To investigate the nature of the ectodermal expression, we
performed double fluorescent WMISH with Esrp and Hnf6, a marker for the ciliary band
(Poustka et al., 2004), the region where ciliary cells and neurons differentiate (Fig. R13f).
No signal overlap was observed, indicating that Esrp expression is restricted to the non-
neural ectoderm. Next, double WMISH with Gcm, a marker for aboral non-skeletogenic
mesoderm (Andrikou et al., 2013), showed that Esrp expression in the ectodermal tissue
corresponds to the aboral side (Fig. R13g-i). Interestingly, we observed co-expression of
Gcm and Esrp in pigment cells precursors, a group of cells that migrate from the
mesoderm towards the ectoderm, where they insert between epithelial cells becoming
immunocytes (Gibson and Burke, 1985; Solek et al., 2013).
To explore the functions of Esrp, we generated gene knockdowns by injecting sea urchin
zygotes with two different morpholinos (MO), one blocking translation and a second
impairing splicing of intron 2. Efficiency of the splicing MO was assessed by RT-PCR
(Fig. R13p). We observed two main phenotypic defects in both MO injections, supporting
knockdown specificity (Fig R13q,r). First, a “chickenpox” phenotype was evident at
gastrula (42hpf) (Fig. R13j,k and Supplemental Figure R4a) and prism/early pluteus
(68hpf) stages (Fig. R13l-m,q). Whereas in control embryos most pigment cells were
already located in the ectoderm at 42hpf and acquired a dendritic conformation by 68hpf,
in knockdown embryos these cells were usually observed in the sub-ectodermal space at
gastrula stage and maintained their roundish shape at prism stages (p < 10-4 for all
comparisons, Fisher Exact test). This failure in the complete integration of pigment cells
into the ectoderm likely constitutes an impaired mesenchymal-to-epithelial transition.
Second, knockdown embryos showed a “hairy” phenotype at gastrula and pluteus stage,
consisting of ectopic long cilia on the aboral ectoderm, especially at the apex (Fig.
R13j,k,n,o,r and Supplemental Fig R4b; p < 10-6 for all comparisons, 3-way Fisher Exact
test). In summary, these results demonstrate that Esrp in sea urchin is necessary for a
complete integration of pigment cells into its destination epithelium and to avoid
ciliogenesis in aboral ectodermal cells.
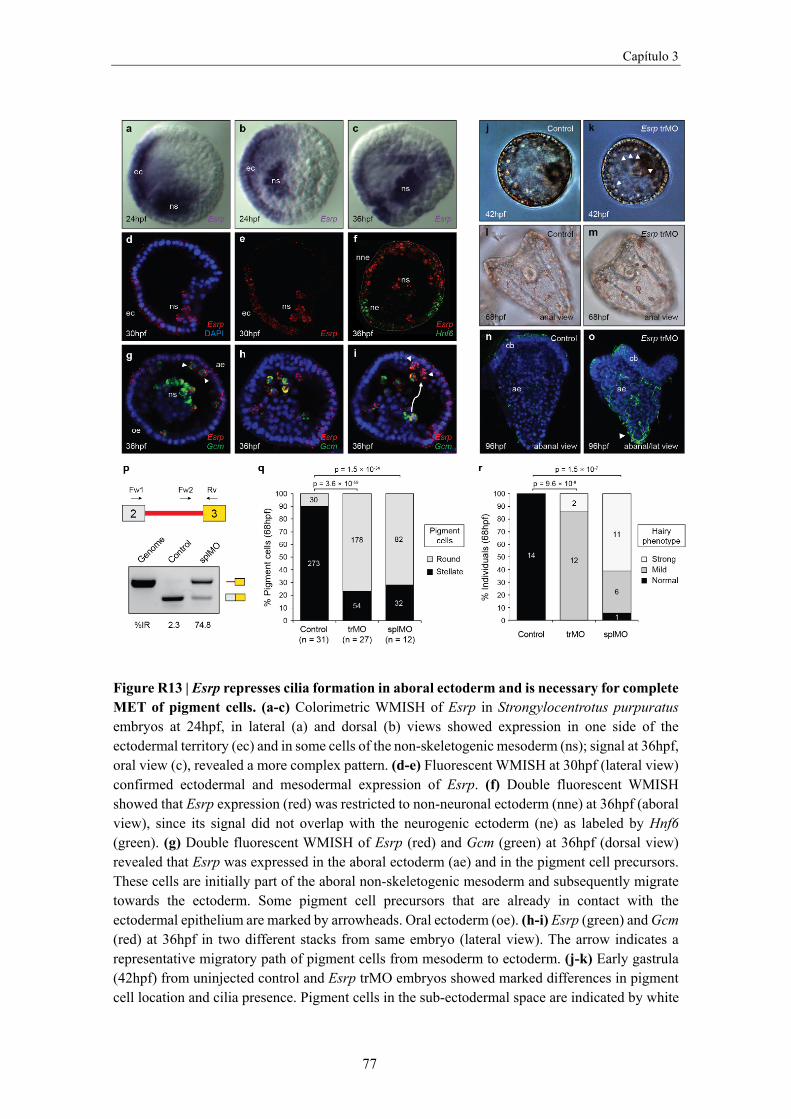
Capítulo 3
77
Figure R13 | Esrp represses cilia formation in aboral ectoderm and is necessary for complete MET of pigment cells. (a-c) Colorimetric WMISH of Esrp in Strongylocentrotus purpuratus embryos at 24hpf, in lateral (a) and dorsal (b) views showed expression in one side of the ectodermal territory (ec) and in some cells of the non-skeletogenic mesoderm (ns); signal at 36hpf, oral view (c), revealed a more complex pattern. (d-e) Fluorescent WMISH at 30hpf (lateral view) confirmed ectodermal and mesodermal expression of Esrp. (f) Double fluorescent WMISH showed that Esrp expression (red) was restricted to non-neuronal ectoderm (nne) at 36hpf (aboral view), since its signal did not overlap with the neurogenic ectoderm (ne) as labeled by Hnf6 (green). (g) Double fluorescent WMISH of Esrp (red) and Gcm (green) at 36hpf (dorsal view) revealed that Esrp was expressed in the aboral ectoderm (ae) and in the pigment cell precursors. These cells are initially part of the aboral non-skeletogenic mesoderm and subsequently migrate towards the ectoderm. Some pigment cell precursors that are already in contact with the ectodermal epithelium are marked by arrowheads. Oral ectoderm (oe). (h-i) Esrp (green) and Gcm (red) at 36hpf in two different stacks from same embryo (lateral view). The arrow indicates a representative migratory path of pigment cells from mesoderm to ectoderm. (j-k) Early gastrula (42hpf) from uninjected control and Esrp trMO embryos showed marked differences in pigment cell location and cilia presence. Pigment cells in the sub-ectodermal space are indicated by white
Resultados
78
arrowheads. (l-m) Early pluteus larvae (68hpf) in lateral view show marked differences in pigment cell morphology in control and Esrp trMO embryos (stellate and roundish, respectively). (n,o) Ectopic embryonic cilia stained with acetylated tubulin in the aboral ectoderm (ae) of 96hpf Esrp-trMO injected embryos. Apex is marked by a white arrowhead. Ciliary band (cb). (p) RT-PCRs showing the levels of intron 2 retention in Esrp transcripts from control and Esrp splMO embryos; genomic DNA was used as a reference for intron inclusion. (q) Quantification of pigment cell morphology in control, Esrp trMO and splMO knockdown 68hpf embryos (sum of 3 independent experiments). (r) Quantification of the ‘hairy’ phenotype in control, Esrp trMO and spMO knockdown 68hpf embryos (sum of 2 independent experiments). P-values correspond to 2-way (q) or 3-way (r) two-sided Fisher Exact tests.
To further characterize these developmental defects, we generated RNA-seq data for two
replicates of SplMO-injected embryos at 24hpf and age-matched controls. These data
confirmed our RT-PCRs results showing a high level of retention of Esrp intron 2 due to
the morpholino effect (Supplementary Fig. R4c). Differential gene expression analysis
identified 360 and 712 downregulated and upregulated genes, respectively. Interestingly,
some enriched GO categories for these gene sets were similar to those found for the
zebrafish DKO analysis, including cell-cell adhesion, cell component morphogenesis and
ectoderm development (Supplementary Fig. R4d). We also observed a significant
enrichment for functions related to nervous system development among the upregulated
genes, consistent with a possible failure in proper non-neural ectoderm specification.
Evolutionary comparison of Esrp-dependent programs.
Next, we investigated the origin and evolution of alternative exon programs regulated by
Esrp across multiple phylogenetic timescales using our zebrafish and sea urchin RNA-
seq data, as well as previously published RNA-seq data for Esrp perturbations in mouse
epidermis (Bebee et al., 2015) and three human cell cultures (Dittmar et al., 2012; Yang
et al., 2016). Importantly, this approach detected both direct and indirect Esrp-regulated
events, hereafter referred together as Esrp-dependent. We identified 188 differentially
spliced cassette exons in sea urchin, 494 in zebrafish, 254 in mouse and 336 in human
(see Methods for details). In all species, these exons were found enriched in genes
associated to certain GO terms such as vesicle-mediated transport, GEF activity, and actin
cytoskeleton cell components (Supplementary Fig. R5). Additionally, we detected lower
numbers of other types of AS regulatory changes, such as alternative 5′ or 3′ splice site

Capítulo 3
79
choice and intron retention (Fig. R14a). RT-PCR assays validated all tested differentially
regulated exons in zebrafish (∆PSI correlation R2 = 0.90, n=15) and in sea urchin (R2 =
0.89, n=12) (Supplementary Fig. R6).
To understand the evolution of Esrp-dependent programs at the exon level, we performed
automatic comparisons followed by manual curation to detect high confidence
homologous coding cassette exons within conserved gene intron-exon structures
(Supplementary File 2 and see Methods). A large fraction of alternative exons was
detected as Esrp-dependent only in one of the studied species, ranging from 47.8%
(110/232) in mouse to 99.5% (180/181) in sea urchin (Fig. R14b). However, comparisons
between closely and distantly related organisms uncovered different scenarios with
regards to the sources for exon recruitment. On the one hand, most non-overlapping Esrp-
dependent exons in vertebrates could be found in the other species, ranging from 93% in
mouse to 52% in zebrafish (Fig. R14b). On the other hand, we only detected homologous
counterparts in any of the studied genomes for 21% of sea urchin non-overlapping exons.
When focusing on the full set of 308 human Esrp-dependent exons, 82.5% had a
homologous exon in mouse, most of which were also alternatively spliced in the rodent
species (Fig. R14c). Among the latter subset, 116 exons were also identified as Esrp-
dependent in mouse. These events include numerous previously described Esrp-
dependent exons in genes such as Scrib, Nf2, Enah and Grhl1 (Bebee et al., 2015). From
this set of shared mammalian targets, we found homologous exons in zebrafish for 70
cases (60%), most of which were also alternatively spliced in this species (Fig. R14c).
Interestingly, we detected a core set of 22 homologous exons classified as Esrp-dependent
in the three vertebrate species, including some in genes previously associated with
morphogenetic processes (Warzecha and Carstens, 2012) (e.g. Numb, p120-catenin,
Arhgap17 or Itga6). However, most of these exons (90.9%) did not have a detected
homologous counterpart in sea urchin, and the two exons identified in the echinoderm
genome did not exhibit Esrp-dependent differential regulation (Fig. R14c). From the total
set of Esrp-dependent exons in sea urchin, only one homologous exon showed changes
in inclusion also in human (Fig. R14b), but was constitutively spliced in both mouse and
zebrafish, suggesting that Esrp-dependent regulation was independently acquired.

Resultados
80
Figure R14 | Evolution of Esrp-dependent splicing programs. (a) Number Esrp-dependent AS events by type detected in zebrafish, sea urchin, human and mouse RNA-seq samples. Blue/red bars correspond to Esrp-enhanced/silenced inclusion of the alternative sequence. IR, intron retention; Alt5, alternative 5′ splice site choice; Alt3, alternative 3′ splice site choice; AltEx, alternative cassette exons. (b) Venn diagram showing the overlap among Esrp-dependent cassette exons in coding regions in the four species. For exons with clade-specific Esrp-dependent regulation, the percent of exons with no homology in any of the other species is provided (Nh). (c) Summary of conservation at the level of genomic presence, alternative splicing and Esrp-dependency for human Esrp-dependent coding exons in other species. Shared Esrp-dependent exons between the previous phylogenetic group is classified in the test species into three categories: (i) the exon is not detected in the genome (top row, discontinuous line); (ii) the homologous exon is detected in the genome, but it is constitutively spliced (middle row, grey exon); and (iii) the homologous exon is alternatively spliced (bottom row, yellow exon, bold numbers). Below this exon type classification, number of Esrp-dependent exons shared by the two species/lineages.
Along these lines, we also identified 49 orthologous genes whose alternative splicing was
dependent on Esrp in at least two species, but in which the specific regulated exons were
different (i.e. non-homologous). Twenty one of these cases involved sea urchin and at
least one vertebrate, and impact genes related to diverse morphogenetic processes in
metazoans (Boehlke et al., 2015; Bouchet et al., 2016; Jung et al., 2011; Laprise et al.,

Capítulo 3
81
2010; Zhao et al., 2013) (e.g. Exoc7, Slain2, Epb41, Ift88 and Scrib). Moreover, we
further observed a significant fraction of target genes with more than one Esrp-dependent
exon, ranging from 5.2% in sea urchin to 19.1% in zebrafish. These observations highlight
the evolutionary plasticity of some genes for multiple acquisition of AS regulation. An
interesting case is Cd44, which acquired at least nine Esrp-dependent exons within the
mammalian clade, and is involved in ureteric branching in mouse (Pohl et al., 2000), a
process affected in Esrp1 KO mice (Bebee et al., 2016).
Regulation of Fgfr AS by Esrp is conserved across the chordate phylum.
Among the 22 Esrp-dependent homologous AS event groups shared by the three
vertebrate species, one case involved multiple paralogous genes of the Fgfr family.
Evolutionary conservation of the mutually exclusive exons encoding the IgIII domain of
fgfr2 had been previously reported for zebrafish (Liu et al., 2011). As in mammals
(Vainikka et al., 1992), we found homologous AS events also in fgfr1a, fgfr1b and fgfr3,
but not in fgfr4. RT-PCR assays for those Fgfr genes showed a complete isoform switch
towards the mesenchymal IIIc exons in zebrafish esrp1 and esrp2 DKO embryos (Fig.
R15a). Interestingly, the Fgfr ortholog of sea urchin harbored only one exon homologous
to those alternatively spliced in vertebrates and it was constitutively included in all
transcripts (see below). Therefore, to assess when this AS event originated during
evolution, we first turned to the chordate amphioxus. We found that the sole amphioxus
Fgfr gene harbors exons homologous to IIIb and IIIc that are also alternatively spliced in
a mutually exclusive manner. In addition, a cephalochordate-specific exon was found in
this genomic region (exon IIIx; Fig R15b). RT-PCR assays on dissected adult tissues
showed that Esrp expression was only strongly detected in the amphioxus skin, where the
highest inclusion of exon IIIb was also observed (Fig R15b). An amphioxus-specific
isoform including both exons IIIx and IIIc was also detected in this tissue, while inclusion
of exon IIIc alone was nearly absent. On the other hand, the rest of the tissues express
predominantly the isoform containing only the exon IIIc.
To gain further insights into the regulatory evolution of this event, we made two minigene
constructs, one comprising the whole genomic region spanning the amphioxus Fgfr AS

Resultados
82
event, and one lacking the amphioxus-specific exon IIIx (Fig. R15c). These minigenes
were individually transfected into human 293T cells together with an expression vector
containing the amphioxus or the zebrafish full-length Esrp transcripts. Remarkably,
despite considerable mis-splicing of the minigenes in 293T cells, amphioxus Esrp acted
as a major regulator of Fgfr AS, promoting inclusion of IIIb exon in both minigenes (Fig.
R15c). On the other hand, zebrafish esrp1 produced only very mild changes compared to
the control, despite both amphioxus and zebrafish Esrp genes were able to modify the AS
pattern of endogenous exon targets as the human ESRP1 (Fig. R15d and Supplementary
Fig. R7). Therefore, altogether, these results provide two main insights into the evolution
of Fgfr AS regulation: (i) its mutually exclusive regulation by Esrp originated before the
last common ancestor of chordates; and (ii) it acquired lineage-specific regulatory
requirements in trans in cephalochordates.
Figure R15 | Fgfr AS is regulated by Esrp genes in vertebrates and amphioxus. (a) RT-PCR assays showing differential Fgfr exon IIIb and IIIc inclusion in wild type versus DKO 5dpf zebrafish embryos. (b) RT-PCR assays for Fgfr AS in different amphioxus adult tissues, depicted in a transversal section. Nc, nerve cord, ms, muscle, gl, gills, hd, hepatic diverticulum, nt, notochord, sk, skin. Reverse primers were designed in both exons IIIb and IIIc (arrows) and used together in the same PCR reactions. (c) Top: schematic representation of pcDNA3.1-based minigene constructs containing the genomic region spanning the Fgfr AS event of Branchiostoma lanceolatum, with (pcDNA3.1-BlaFGFR) and without (pcDNA3.1-BlaFGFRΔIIIx) exon IIIx.
Capítulo 3
83
Bottom: relative intensity of fluorescent RT-PCR bands supporting differential inclusion of exons IIIb and IIIc when transfecting the minigenes alone (Control) or together with a plasmid containing either amphioxus or zebrafish full-length Esrp transcripts (BlaEsrp and DreEsrp1, respectively). Despite significant mis-splicing of the minigene in all conditions, only the amphioxus construct was able to induce a dramatic switch towards exon IIIb inclusion. Primers were designed in the neighboring constitutive exons (arrows). (d) RT-PCR assays for endogenous human AS events in the same control, BlaEsrp or DreEsrp1 transfected 293T cells showing that the amphioxus and zebrafish Esrp constructs are able to modulate endogenous Esrp-dependent events in a similar manner. Esrp-enhanced isoforms are marked with a black arrowhead.
Fgfr AS evolved independently in several Bilateria lineages.
Given the remarkable conservation across chordates (for over 550 million years of
independent evolution), we next studied the evolution of Fgfr AS in further detail. A gene
structure analysis for Bilateria species showed that vertebrate exons IIIb and IIIc are the
result of a single tandem exon duplication that occurred at the base of the chordate
phylum, before the split of its three main sub-phyla (Fig. R16). In contrast to chordates,
the single pro-orthologous exon IIIb/IIIc is found as constitutively included in all
observed transcripts from all studied non-chordate species. However, previous studies
reported other AS events in the genomic locus encoding the region homologous to the
IgIII domain in two non-vertebrate species (the purple sea urchin (McCoon et al., 1998;
Mistry et al., 2003) and the red flour beetle (Sharma et al., 2015)), and we further show
that a diverse array of AS events independently evolved in most studied lineages (Fig.
R16). In particular, the previously reported alternative exon in sea urchin is located
upstream of exon IIIb/c and exhibits no sequence similarity with its neighboring exons.
Moreover, its inclusion was not detected as Esrp-dependent, which is consistent with the
non-overlapping expression of Fgfr and Esrp genes during sea urchin's development
(Andrikou et al., 2015). Remarkably, this exon is also present and alternatively spliced
across the Ambulacraria clade, which comprises echinoderms and hemichordates phyla.
In summary, our phylogenetic survey shows that this genomic region is a hotspot for
recurrent AS evolution across Bilateria, likely due to its potential to modulate FGF
signaling (Miki et al., 1992).

Resultados
84
Figure R16 | Gene structure and AS at the IgIII domain of the Fgfr gene family in metazoans. Schematic representation of the AS diversity in the region encoding the homolog of the Fgfr IgIII domain for zebrafish (Danio rerio), vase tunicate (Ciona intestinalis), amphioxus (Branchiostoma lanceolatum), purple sea urchin (Strongylocentrotus purpuratus), acorn worm (Saccoglossus kowalevskii), honey bee (Apis mellifera), red flour beetle (Tribolium castaneum), fruit fly (Drosophila melanogaster), pacific oyster (Crassostrea gigas) and starlet sea anemone (Nematostella vectensis). Homologous to vertebrate exons IIIa, IIIb and IIIc are shown in purple, blue and red, respectively. The non-chordate pro-orthologous exon of exons IIIb and IIIc is colored half blue and half red. The amphioxus- and ambulacrarian-specific alternative exons are depicted in green and yellow, respectively. Light violet colors are used for the insect-specific mutually exclusive event involving exon IIIa, and brown and light blue for oyster-specific exons. Grey exons are constitutive in all species. Fruit fly orthologues (heartless and branchless) are intronless genes.

85
Figuras suplementarias

Figuras Suplementarias
86
Supplementary Figure R1

Figuras Suplementarias
87
Supplementary Figure R1 | Protein domain composition of Esrp homologous genes in eukaryotic species. All represented eukaryotes share a DnaQ-like exonuclease domain in their Esrp homologous genes. Variation arises from the number of RRM6 domains, a specific type of RNA-binding domain. The alveolata species Tetrahymena termophila, and the rodhophyte Galdieria sulphuraria have three and four RRM6 domains, respectively. In the amebozoan Acanthamoeba castellanii and the fungi Spizellomyces punctatus, more closely related to metazoans, only one RRM6 domain was found. Zinc finger domains were also detected in those species. Four RRM6 domains were found in orthologues from choanoflagelate and metazoan species. However, partial or no detection of a fourth RRM6 domain was observed in some species, especially in Esrp1 genes from vertebrates. Partial DAZAP2 and FAM70 domains were also detected in human genes, but with low e-values. Other species in the figure are the choanoflagelate Mylnosiga fluctuans, the demosponge Petrosia ficiformis, the priapulid Priapulus caudatus, the chondrichthyan Callorhincus milii, the dinosaur Falco cherrug and the mammal Homo sapiens.

Figuras Suplementarias
88
Supplementary Figure R2

Figuras Suplementarias
89
Supplementary Figure R2 | Phylogenetic analysis reveals a lineage-specific duplication of Esrp genes in vertebrates. Most species shown in the tree belong to metazoan lineages, with the exception of choanoflagelates Salpingoeca urceolata and Salpingoeca qvevrii. Vertebrates: Homo sapiens (Hsa), Mus musculus (Mmu), Gallus Gallus (Gga), Chelonia mydas (Cmy), Callorhincus milii (Cmi), Latimeria chalumnae (Lch) and Danio rerio (Dre). Urochordates: Ciona intestinalis (Cin). Cephalochordates: Branchiostoma lanceolatum (Bla) and Asymmetron lucayanum (Alu). Hemichordates: Ptycodera flava (Pfl) and Saccoglossus kowalevskii (Sko). Echinoderms: Ophiocoma echinata (Oec), Strongylocentrotus purpuratus (Spu) and Patiria miniata (Pmi). Lophotrochozoans: Crassostea gigas (Cgi), Aplysia californica (Aca) and Lingula anatina (Lan). Ecdysozoans: Priapulus caudatus (Pca), Parasteatoda tepidariorum (Pte), Tribolium castaneum (Tca) and Drosophila melanogaster (Dre). Cnidarians: Exaiptasia pallida (Epa) and Nematostella vectensis (Nve). Sponges: Cliona varians (Cva), Petrosia ficiformis (Pfi) and Ephydatia muelleri (Emu).

Figuras Suplementarias
90
Supplementary Figure R3

Figuras Suplementarias
91
Supplementary Figure R3 | Developmental expression and impact of Esrp genes in zebrafish. Additional details of WMISH for esrp1 and esrp2 in zebrafish embryos. (a,b) Similar expression of esrp1 and esrp2 was detected in 5dpf embryos in inner ear (ie) and craniofacial cartilaginous (cc) tissue. Signal was also observed in stomach (st) and swim bladder (sb), although non-specific staining of those hollow organs by NBT/BCIP precipitation could not be ruled out. esrp2 was additionally found in the liver (lv). (c-e) Broad expression of esrp1 in the tail bud ectoderm was maintained at 18hpf (c), reached its highest intensity by 20hpf (d), and became restricted to the median fin fold (ff) by 24hpf (e), when it was also observed in cloaca (cl) tissue. (f) 48hpf embryo heads showed expression of esrp1 predominantly in pharynx (ph) and inner ear (ie). (g) Detail of esrp1 expression in the head of 5dpf embryos in craniofacial cartilague (cc) and inner ear (ie). (h-l) esrp2 expression was also detected in a few territories where esrp1 was not observed, including the polster (po) at 14hpf (h), that later develops into the hatching gland (hg) by 24hpf (i), and in the pronephros (pr) (j); it shared expression with esrp1 in structures such as olfactory placode (white arrowheads) (k, 24hpf) and inner ear ventral epithelium (l, 32hpf). (m) Ectopic expression of wild type, but not mutant, zebrafish esrp1 transcripts in human 293T cells produced splicing changes in endogenous ESRP1 human targets. Black arrowheads indicate Esrp-enhanced isoforms. (n) Expression of esrp1 and esrp2 expression in 5dpf embryos quantified by RNA-seq shows a clear reduction in the steady-state mRNA levels of both genes in DKO embryos. Boxes represent the range of expression in the two replicates. (p,q) Phenotypic comparison of transversal sections stained with hematoxylin and eosin from 6dpf embryos shows impaired development of visceral skeleton (p) and swim bladder (q). (r) Significantly enriched GO terms for down- and up-regulated genes in DKO 5dpf embryos.

Figuras Suplementarias
92
Supplementary Figure R4

Figuras Suplementarias
93
Supplementary Figure R4 | Developmental and transcriptomic impact of Esrp in sea urchin. (a) Quantification of pigment cell morphology in control and Esrp trMO knockdown embryos at 42hpf. (b) Quantification of the ‘hairy’ phenotype in control and Esrp trMO knockdown embryos at 42hpf. P-values correspond to 2-way (a) or 3-way (b) two-sided Fisher Exact tests. (c) RNA-seq reads mapping to the genomic region spanning exons 2 and 3 of Esrp in control and SplMO injected embryos. (d) GO terms enriched in genes with down- and up-regulated expression in 24hpf embryos upon splMO treatment.
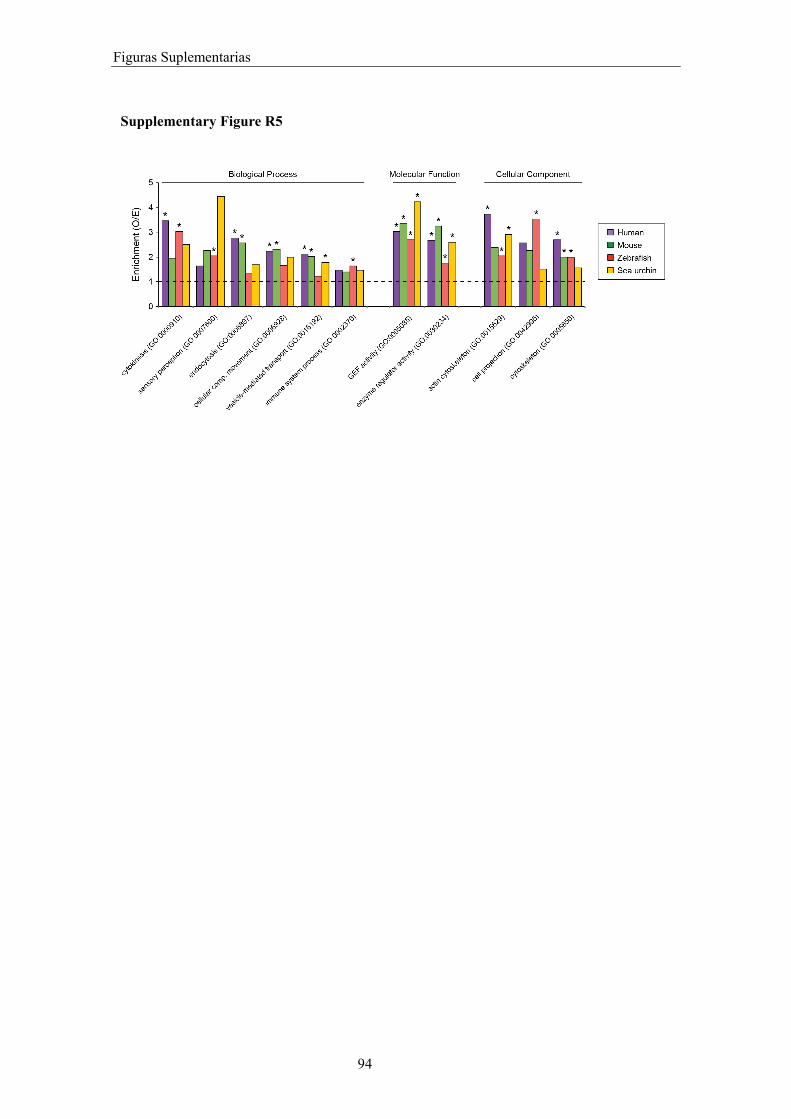
Figuras Suplementarias
94
Supplementary Figure R5
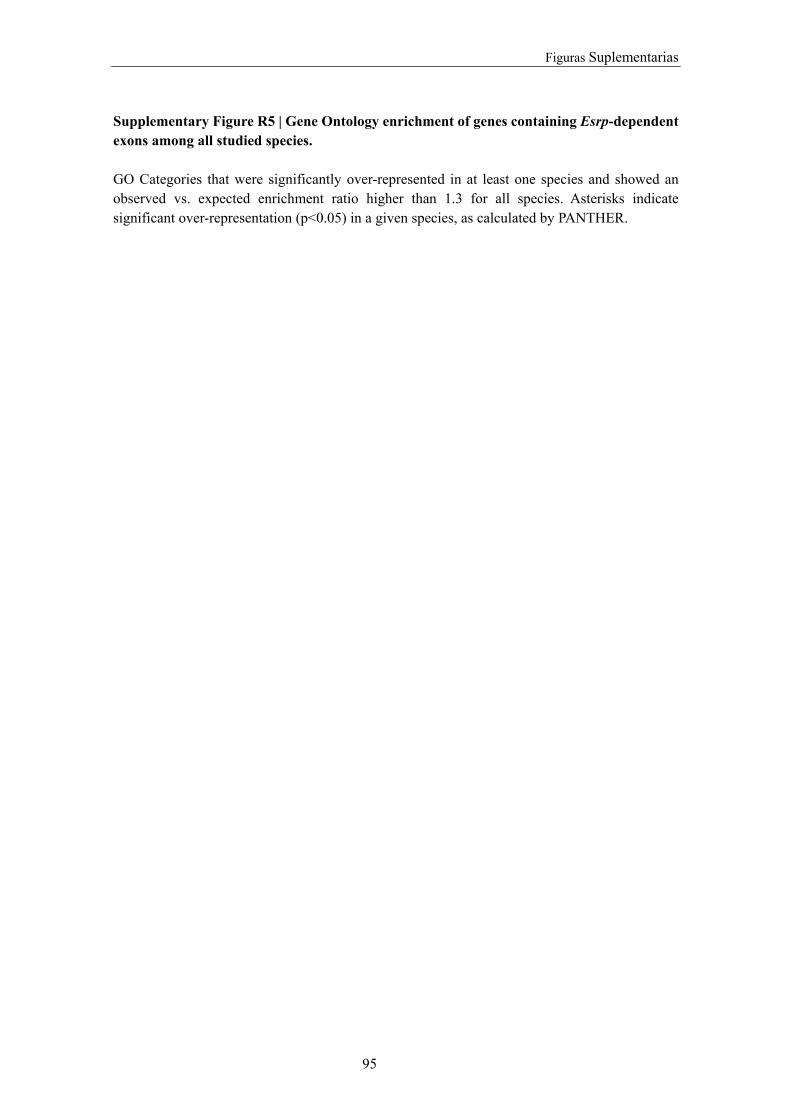
Figuras Suplementarias
95
Supplementary Figure R5 | Gene Ontology enrichment of genes containing Esrp-dependent exons among all studied species. GO Categories that were significantly over-represented in at least one species and showed an observed vs. expected enrichment ratio higher than 1.3 for all species. Asterisks indicate significant over-representation (p<0.05) in a given species, as calculated by PANTHER.

Figuras Suplementarias
96
Supplementary Figure R6

Figuras Suplementarias
97
Supplementary Figure R6 | Validation of Esrp-dependent exons by RT-PCR. RT-PCR (dark colors) and RNA-seq (light colors) based quantification of exon inclusion for a subset of 15 and 12 representative Esrp-dependent exons in wild type (blue) and Esrp-depleted (red) zebrafish and sea urchin embryos, respectively. Bottom-right: correlation between ΔPSI values obtained by RNA-seq and PCRs. Strong correlations are observed both in case of zebrafish (R2=0.90, black dots) and sea urchin (R2=0.89, grey dots).

Figuras Suplementarias
98
Supplementary Figure R7

Figuras Suplementarias
99
Supplementary Figure R7 | Esrp transcripts from amphioxus and zebrafish change the splicing pattern of endogenous human Esrp-dependent exons in 293T cells. RT-PCR quantifications of ΔPSI changes in endogenous exons in 293T cells after transfection of expression vectors containing amphioxus (BlaEsrp) or zebrafish (DreEsrp1) ORF sequences. Error bars correspond to the standard error of three independent replicates.


MÉTODOS


Métodos
103
Domain and phylogenetic analyses of Esrp genes. Putative Esrp orthologs for all
organisms included in Supplementary Fig. 1 and 2 were identified by combining blastp
and tblastn searches against NCBI databases and resources specific for sponges (Riesgo
et al., 2014) and choanoflagellates Salpingoeca urceolata, Salpingoeca qvevrii, and
Mylnosiga Fluctuans from unpublished transcriptomes provided by Daniel Richter.
Domain detection was performed using the NCBI conserved domain search function
(Marchler-Bauer et al., 2015) (https://www.ncbi.nlm.nih.gov/Structure/cdd/wrpsb.cgi).
To reconstruct the phylogenetic relationships of Esrp genes among the Apoikozoa clade
(Metazoa + Choanoflagellata), we first aligned protein sequences with MAFFT (Katoh
and Standley, 2013). Neighbor-joining algorithm, as implemented by MEGA7 with
default parameters and a JTT substitution model, was employed for tree reconstruction
using only conserved positions of the multi-sequence alignment, as identified by MAFFT.
Zebrafish experimental procedures. Breeding zebrafish (Danio rerio) were maintained
at 28°C on a 14 hours light/10 hours dark cycle as previously described. All protocols
used have been approved by the Institutional Animal Care and Use Ethic Committee
(PRBB–IACUEC), and implemented according to national and European regulations. All
experiments were carried out in accordance with the principles of the 3Rs.
To investigate the expression of Esrp genes during development, embryos were raised at
28ºC for staging(Kimmel et al., 1995) and fixed overnight with 4% paraformaldehyde
(PFA) in PBS at 4ºC. RNA probes were labeled with digoxigenin, and WMISH was
performed as previously described(Thisse and Thisse, 2008). To create loss-of-function
zebrafish lines for esrp1 and esrp2, we used the CRISPR-Cas9 system. We first assessed
the presence of multiple promoter in both genes looking at RNA-seq-based annotations
and H3K4me3 Chip-seq peaks at their respective loci in the UCSC browser. Since each
gene had only one promoter, we designed single guide RNAs (gRNAs) targeting the first
and third exons of esrp1 and esrp2, respectively. The genomic target sites were identified
using a publicly available web tool (http://crispr.mit.edu/). Selected targeted gRNA
sequences corresponded to: 5′-GGAGCAAGTGGGGATAAGTTGGG-3′ for esrp1 and
5′-GGAGACCGGGCTCACTGCCGAGG-3′ for esrp2. The CRISPR-Cas9 approach was
performed following the protocol from Chen and Wente laboratories, as previously

Métodos
104
described for zebrafish (Jao et al., 2013). Engineered vectors were obtained from
Addgene. One nl of a mixed solution containing gRNA (80 ng/µl) and purified Cas9
mRNA (150 ng/µl) was microinjected into one-cell stage zebrafish embryos. F0 founders
were crossed with a wild type strain, and F1 individuals genotyped by fin clipping to
select the appropriate mutations. We selected the following mutations for further analyses:
a 168-bp deletion together with a 14-bp insertion that induced the usage of a cryptic splice
donor upstream the start codon for esrp1, and a 17-bp frame-disrupting deletion for esrp2
(Fig. 1c). Crosses between male and female heterozygous individuals carrying the same
mutation were set to obtain single KO mutant lines in the F2 generation. In addition,
individuals from these esrp1 and esrp2 F1 lines were crossed to obtain a F2 generation of
double heterozygous. DKO embryos were obtained in subsequent F3 generations from
intercrosses between F2 double heterozygous fish, at the expected Mendelian ratio.
Sequences of the primers used for genotyping are provided in Supplementary Table 4.
For histological analysis, fixed embryos were progressively dehydrated in ethanol and
xylol, embedded in paraffin, sectioned in transversal orientation with a microtome at 7-
10 µm thickness, stained with haematoxilyn and eosin, and mounted with DPX (Eukitt).
Alcian blue staining of chondrocytes at 6dpf embryos was performed according to the
Zebrafish Book (Westerfield, 2007).
Vase tunicate experimental procedures. Adult Ciona intestinalis animals were
collected from both the Gulf of Naples and M-REP (San Diego CA, USA). Ripe oocytes
and sperm were collected surgically and kept separately until in vitro fertilization. We
used chemical dechorionation to eliminate the chorion and follicular cells surrounding
the eggs. Dechorionated eggs were then in vitro fertilized using sperm from various
individuals. Fertilized eggs were washed in Millipore-filtered sea water, and transferred
to a solution containing 0.77M Mannitol and 50–80mg of the plasmid DNA used for
electroporation. Electroporation was carried out in Bio-Rad Gene Pulser 0.4 cm cuvettes,
using Gene Pulser II (Bio-Rad). Each experiment was performed at least three times.
Embryos were staged according to an standard developmental timeline (Hotta et al.,
2007). A DIG-labelled probe for RbFox and Esrp and a fluorescein-labelled probe for
Twist-like2 were transcribed with Sp6 RNA polymerase (Roche) and purified with the

Métodos
105
RNeasy Mini Kit (Qiagen). WMISH, antibody stainings and embryo manipulations were
performed as previously described (Racioppi et al., 2014). To generate the Twist>Esrp
construct, we cloned a genomic region upstream Twist-like1 reported to be active in the
mesenchymal lineage (Abitua et al., 2012). As transcripts for the predicted full-length
Esrp locus were not detected using a mix of embryonic Ciona cDNAs, we cloned the
most highly expressed isoform during development for overexpression experiments. This
isoform lacks the exonuclease domain at the N-terminus as a result of splice-leader trans-
splicing, but contains all RNA-binding domains.
Amphioxus experimental procedures. Adult Branchiostoma lanceolatum animals were
collected in Banyuls (France) and Mataró (Catalonia). Spawning of reproductive
individuals was done as previously reported (Fuentes et al., 2007). Embryos were cultured
in filtered sea water at 17ºC and fixed in 4% PFA in MOPS buffer overnight at 4ºC.
WMISH was performed with digoxigenin labeled RNA probes for RbFox and Esrp and
performed as previously described (Irimia et al., 2010b). BM Purple (Sigma) was used as
chromogenic substrate.
Sea urchin experimental procedures. Adult Strongylocentrotus purpuratus specimens
were obtained from the Kerckhoff Marine Laboratory, California Institute of Technology,
Pasadena CA, USA. Spawning was induced by vigorous shaking of animals, and embryos
were cultured at 15ºC in diluted (9:10) stilled water with 0.22 μm filtered Mediterranean
Sea water. Embryos were fixed in 4% PFA in MOPS buffer. RNA probes were
differentially labelled with digoxigenin (Esrp) and fluorescein (Hnf6, Gcm) in double
assays. RbFox, Nova and Endo16 probes were al labelled with digoxinenin. Colorimetric
and fluorescent WMISH and immunohistochemistry with anti-acetilated tubulin antibody
were performed according to previous reports (Andrikou et al., 2013). For Hnf6 and Gcm
WMISH assays, we used previously published probes (Poustka et al., 2004; Ransick and
Davidson, 2006). To knockdown Esrp, two different morpholinos were designed, one
targeting the single annotated translation start site (5′-
CCAGATAGTTAAACGCCATTTTTCC-3′) and one the 3′ splice site of the third exon in
order to induce intron retention (5′- AGTTGTCAAGCTGCGAAAATGATGA-3′).
Morpholinos were obtained from GeneTools and injected (about 6-8 pl per injection) in

Métodos
106
zygotes at a 300 uM concentration in the presence of 0,12M KCl. Sequences of primers
used to clone the Esrp probe and test intron 2 retention are provided in Supplementary
Table 4.
RNA extraction, library preparation and RNA sequencing. RNA extractions were
performed using the RNeasy Qiagen MiniKit (for zebrafish embryos) or the RNaquous
(Ambion) (for sea urchin embryos). Trizol extraction (Invitrogen) according to
manufacturer’s instructions was employed to obtain total RNA from adult amphioxus
tissues. All RNA samples were subjected to DNAse treatment. First-strand cDNAs for
RT-PCR assays were generated using SuperScript III Reverse Transcriptase (Invitrogen).
Libraries for Illumina high-throughput RNA sequencing were produced from poly-A
selected RNA as described by the manufacturer, and Illumina HiSeq2500 machines in
high yield mode were used for sequencing. Two replicates for DKO fish embryos and
age-matched controls at 5dpf, and two replicates of splicing morpholino-treated sea
urchin embryos at 24hpf and matched controls were sequenced, producing an average of
~145 and ~80 million 125-nucleotide paired-end reads per zebrafish and sea urchin
sample, respectively. Raw sequence data were submitted to Gene Expression Omnibus
(GSE97267). For human, we used RNA-seq from previous studies (Dittmar et al., 2012;
Yang et al., 2016), including one replicate of a ESRP1 mRNA knockdown (KD) in PNT2
cell line, three replicates of ESRP1 and ESRP2 knockdowns in H358 cells, and a replicate
of overexpression (OE) of ESRP1 in MB231 cell line. For mouse, we used previously
published RNA-seq data for two replicates of embryonic epidermis from Esrp1 and Esrp2
DKO and control mice at the E18.5 stage (Bebee et al., 2015).
B. lanceolatum genome annotation. Dissection of several adult tissues and collection of
different embryonic stages from Branchiostoma lanceolatum species was performed
before RNA extraction of those biological samples. Obtained RNA-seq reads from each
condition were aligned to an unpublished assembly of the genomic sequence (sequenced
and assembled by Genoscope and Ferdinand Marletaz, respectively) using Tophat2. The
corresponding BAM outputs were merged into a single file and processed by Cufflinks to
produce gene structures. Independently, a de novo transcriptome assembly was performed
using Trinity software separately for each RNA-seq sample. Obtained transcripts were

Métodos
107
aligned to the genome using PASA. Both genome annotations were merged and filtered
to obtain non-redundant transcripts. Finally, trandecoder tool was employed to classify
those genes with a putative open reading frame, that were used in downstream analysis
as protein coding genes.
Differential gene expression analysis. Gene expression levels for zebrafish and sea
urchin were quantified from RNA-seq data using the cRPKM metrics (Labbé et al., 2012),
which employs a single transcript per gene as reference and performs a length correction
to account for non-uniquely mapped positions. We used Ensembl version 80 as zebrafish
gene annotation (Zv10 assembly) and Spur-v3.1 for sea urchin, retrieved from
EchinoBase (previously SpBase; http://www.echinobase.org/). To identify differentially
expressed genes in Esrp loss-of-function embryos in each species, we first filtered out
genes that did not have: (i) a minimal expression of cRPKM>2 in both replicates in at
least one condition (control or loss-of-function); and (ii) at least 50 raw reads supporting
expression in at least one sample. For the remaining genes, we required a minimum fold
difference of 2 (for zebrafish) or 1.5 (for sea urchin) between the average expression
levels in the two conditions, and a fold difference of at least 1.5 (for zebrafish) or 1.2 (for
sea urchin) between all pairwise comparisons between each group’s replicates.
Identification of Esrp-dependent exons from RNA-seq data. To quantify all major
types of AS from RNA-seq data, we implemented vast-tools (Irimia et al., 2014)
(https://github.com/vastgroup/vast-tools) for zebrafish and sea urchin. This software uses
different modules to identify and quantify simple and complex exon skipping events,
intron retention and alternative 5’ and 3’ splice site choices. It has been extensively used
to identify differentially spliced AS events in human, mouse, chicken and planarians,
providing high validation rates in RT-PCR assays (Braunschweig et al., 2014; Gueroussov
et al., 2015; Solana et al., 2016). Associated VASTDB files to run vast-tools gene
expression and AS analyses on zebrafish (species key “Dre”) and sea urchin (species key
“Spu”) can be downloaded at http://vastdb.crg.eu/libs/vastdb.dre.10.03.17.tar.gz (Dre)
and http://vastdb.crg.eu/libs/vastdb.spu.10.03.17.tar.gz (Spu). vast-tools was also used to
quantify AS from human and mouse RNA-seq samples. For each AS event and processed
sample in each species, vast-tools provided a table with the percent of alternative
Métodos
108
sequence inclusion (using the metric 'Percent Splice In', PSI) and a score related to the
number of reads supporting this PSI (Irimia et al., 2014) (N<VLOW<LOW<OK<SOK;
see https://github.com/vastgroup/vast-tools for further details).
Next, to identify differentially spliced exons in each organism, we performed the
following steps. For zebrafish, sea urchin and mouse we required that a given AS event
had sufficient read coverage (score VLOW or higher in the vast-tools output) in all
compared samples (two control and two loss-of-function replicates). Then, we required:
(i) a minimum absolute PSI change (ΔPSI) between the averages of 15 (for zebrafish and
mouse) or 10 (for sea urchin); and (ii) a minimum ΔPSI of 5 between all pairwise
comparisons of control and Esrp loss-of-function samples. For IR, we further required
that the binomial test for read imbalance (Braunschweig et al., 2014) was not significant
(p<0.05) in any of the samples. For human, since we used three different sources, we
produced a combined dataset consisting of AS events that were differentially spliced
(|ΔPSI| > 15 between the control and KD averages, and |ΔPSI| > 5 for all pairwise replicate
comparisons in the same direction) in either of the following groupings: (i) the three
replicate pairs of the H358 KD experiment; (ii) the PNT2 KD single-replicate experiment
and a merged sample of the H358 KD replicates (i.e. pulling all the reads for the three
replicates together in each condition to increase read coverage); (iii) the PNT2 KD and
MB231 ESRP1 overexpression single-replicate data (the ΔPSI values should be in the
opposite direction); and (iv) the merged H358 KD dataset and the MB231 ESRP1
overexpression dataset (again with ΔPSI values in the opposite direction). All these
comparisons were performed as implemented by the vast-tools module “compare”, using
the following parameters: --min_dPSI 15 --min_range 5 --p_IR. Finally, cassette exons in
a given species that had an homologous counterpart detected as Esrp-dependent in
another species but that did not pass the initial read coverage filters were re-evaluated and
were considered Esrp-dependent if: (i) the total number of reads supporting the PSI was
at least five in each sample, and (ii) their PSI values fulfilled the cut-offs described above
for the corresponding species.
Gene Ontology analysis. We used PANTHER statistical overrepresentation test (version
11.1 released 2016-10-24; http://www.pantherdb.org/) with default settings to investigate

Métodos
109
functional gene enrichment for all species. Sea urchin gene identifiers from v3.1 (starting
with WHL22) were converted to SPU identifiers using the conversion table provided by
EchinoBase. For differentially expressed genes, we used as background all genes that
passed the same initial quality filters (minimal expression of cRPKM>2 in both replicates
of at least one condition and a minimum of 50 raw reads in at least one sample),
corresponding to 10,666 genes for zebrafish and 13,574 for sea urchin. For differentially
spliced exons, we used raw p-values and employed as background all multiexonic genes
that fulfilled the same read coverage criteria described above. In total, this corresponded
to 11,140 genes in human, 8,501 in mouse, 14,939 in zebrafish and 10,370 in sea urchin.
Next, to compare enrichment of specific GO categories among all four species, we
selected those categories that were significantly over-represented in at least one species
(p-value < 0.05), and tested enrichment (ratio observed vs. expected) in the raw
PANTHER outputs. GO categories that had a ratio > 1.3 in all four species were selected
and plotted in Supplementary Fig. R5.
RT-PCR validations and quantitative fluorescent PCRs. Fluorescent PCRs were
performed using forward oligonucleotides marked with a HEX fluorophore reporter
(Sigma), with emission at 556 nm. Capillary electrophoresis was performed and analysis
and quantification of the amplicons was made with GeneScan software. 500Rox from
AppliedBiosystems (Life Technologies) was used as a standard size marker.
Building of homologous exon clusters. The clusters of homologous exons in coding
regions were assembled according to the following steps. First, clusters of homologous
human, mouse, zebrafish and sea urchin coding genes were built with information from
OMA (Altenhoff et al., 2013), Multiparanoid (Alexeyenko et al., 2006) and BlastP, using
the longest protein isoform for each protein-coding genes. For OMA and Multiparanoid,
a pair of genes was considered to be homologous if they belong to the same gene cluster.
For BlastP, genes were related if they were in the first three hits in a reciprocal manner
between pair of species. Gene clusters were built from orthologous gene pairs that were
supported at least by 2 out of the 3 aforementioned approaches, and employing a
subsequent guilt-by-association approach. In parallel, aminoacid sequences of all Esrp-
dependent exons were mapped to all protein isoforms of the harboring genes to obtain a

Métodos
110
non-redundant set of proteins for each species that contain all Esrp-dependent exons.
Then, those protein sequences were aligned in a pairwise manner to all isoforms of their
gene homologous counterparts using MAFFT. Exon-intron structure information was
introduced to the resulting alignment, by intercalating intron positions and their
corresponding phase.
For each Esrp-dependent exon in species A, conservation in species B was assessed based
on (i) local exon-intron structure, and (ii) exon sequence similarly. Conservation of
upstream and/or downstream flanking introns in the aligned region was considered
positive if there were two aligned intron positions in identical phase and a maximum
deviation of 3 positions. Exon sequence conservation was considered significant if the
pairwise similarity was higher than 20%. However, if an exon significantly aligned with
more than one exon in the other species, local realignment with those exon sequences was
performed, and the exon with the highest similarity was kept. With this information, a
pair of homologous exons was automatically assigned if the pairwise sequence alignment
of the alternative exon and at least one flanking constitutive exon was significant, and
both flanking intron positions were conserved. Cases were manually evaluated if: (i) the
sequence alignment of the alternative exon and at least one constitutive exon was
significant, but at least one of the flanking intron positions was not detected automatically
as conserved; or (ii) the upstream and downstream intron positions were conserved, but a
low similarity score was obtained for the alternative exon. After this classification, for
those exons in human, mouse and zebrafish with no detected homologous counterparts,
an additional homology search was performed using liftOver software
(http://genome.ucsc.edu/cgi-bin/hgLiftOver) followed by manual curation. Homologous
exon clusters of Esrp-dependent exons were assembled based on these individually
identified exon pairs using a guilt-by-association approach.
Amphioxus Fgfr AS minigenes and cell cultures. The full-length Esrp open reading
frame (ORF) from B. lanceolatum and esrp1 ORF from D. rerio were amplified from
cDNA using iProof High Fidelity Polymerase (BioRad) and cloned into the pcDNA3.1
vector (Thermo Fisher Scientific). To generate the minigenes for the amphioxus Fgfr AS
event, the B. lanceolatum genomic region spanning the AS event was amplified and

Métodos
111
cloned into pcDNA3.1; the deletion to generate BlaFgfr-ΔIIIx was generated by PCR
using iProof polymerase with reversed oligos in the flanking intronic regions and the wild
type minigene as template. Human 293T cells were co-transfected with the minigenes
plus a vector encoding amphioxus Esrp, zebrafish esrp1 or an empty vector, using
Lipofectamine 2000 (Invitrogen) according to manufacturer’s instructions. Total RNA
was extracted 24 hours after transfection using RNeasy Mini Kit (QIAGEN), cDNA was
prepared using SuperScript III (Invitrogen) according to manufacturer’s instructions. RT-
PCRs for the endogenous AS events and the minigenes were performed using oligos
annealing to the adjacent constitutive exons. Amphioxus Fgfr amplicons obtained from
RT-PCRs were sequenced for isoform identification.
Genome sources and gene annotation. To understand the origins and evolution of the
mutually exclusive exons IIIb and IIIc found in the Fgfr paralogs of vertebrates, we
performed a comparative analysis in non-vertebrate species. First, we searched for Fgfr
loci and transcripts in phylogenetically key species that have available genomic and
transcriptomic information. Transcript isoforms were obtained by tblastn searches using
the human FGFR2 transcripts as query against public transcriptomes or ESTs databases.
Genomic sequences were obtained from public genome databases for Nematostella
vectensis (nemVec1, JGI), Crassostrea gigas, (oyster_v9, JGI), Drosophila melanogaster
(dm6, FlyBase), Tribolium castaneum (triCas2, BeetleBase), Apis mellifera (apiMel2,
Baylor College of Medicine), Saccoglossus kowalevskii (Skow_1.1, Baylor College of
Medicine), Strongylocentrotus purpuratus (Spur_v3.1, EchinoBase), Ciona intestinalis
(ci2, Aniseed) and Danio rerio (danRer10, Ensembl). Sequencing of amplicons from
genomic DNA and tissue-specific cDNA was also carried out for Branchiostoma
lanceolatum. With this information, Genewise software
(http://www.ebi.ac.uk/Tools/psa/genewise/) was employed to annotate gene structures for
each species. Finally, to compare intron/exon structures of the homologous regions to
vertebrate’s Fgfr IgIII domain, we performed interspecific multiple protein alignments
with MAFFT, which were manually curated using intron position information and
summarized in Fig. R16.


DISCUSIÓN

Discusión
115
Patrones macroevolutivos del splicing específico de tejido en deuteróstomos Recientemente, el desarrollo de las técnicas de secuenciación masiva ha permitido
realizar las primeras aproximaciones globales a las dinámicas transcriptómicas en los
principales organismos modelo. Uno de los procesos moleculares que afecta a las
diferencias reguladoras entre distintos órganos, tejidos o tipos celulares es el splicing
alternativo. Sin embargo, la todavía abrumadora falta de datos o análisis transcriptómicos
para muchos linajes filogenéticos dificulta la compresión de los patrones macroevolutivos
de este mecanismo regulador. En la presente tesis se ha realizado un intento inicial de
comparar los paisajes post-transcripcionales de unos pocos deuteróstomos, incluyendo
organismos no vertebrados. La detección de eventos de splicing con regulación específica
de tejido está condicionada por los parámetros que definen dicha especificidad, al ser las
diferencias entre los niveles de inclusión en distintos órganos altamente cuantitativas en
general.
La utilización de un ΔPSI mayor de 15 entre el valor de inclusión máximo o mínimo de
una muestra respecto a todas las demás consigue clasificar casi dos tercios de los exones
alternativos totales como diferencialmente regulados en un órgano concreto en cuatro de
las cinco especies estudiadas. Sin embargo, un aumento del umbral de detección hasta un
ΔPSI mayor de 25 reduce esta proporción hasta un tercio en varios organismos.
Curiosamente, este descenso no es igual de marcado en pez cebra y anfioxo, apuntando a
una mayor abundancia de patrones específicos pronunciados en algunos organismos.
Resulta interesante destacar que un análisis similar publicado en Drosophila reveló hasta
un 63% de exones alternativos con inclusión/exclusión específica de tejidos adultos
exhibiendo un ΔPSI mayor de 50. (Gibilisco et al., 2016). En este díptero, la mitad de la
producción de isoformas totales se concentra en tan solo 42 genes (James B. Brown et al.,
2014). Dichos genes, algunos con la capacidad potencial de generar cientos de tránscritos
alternativos, presentan un patrón de expresión sesgado hacia un solo tejido. Por tanto, las
diferencias entre especies en la proporción de AS regulado diferencialmente en un órgano
concreto podrían ser debidas en parte a la distribución génica de los eventos con
regulación intra-tisular.
Aquellos exones no detectados como diferencialmente regulados en una muestra respecto

Discusión
116
al resto presentan por tanto patrones de inclusión y exclusión más balanceados. Existen
diversos factores que pueden ser causa de este fenómeno. Los distintos transcriptomas de
un organismo emergen desde el nivel celular, con lo que órganos formados por diferentes
tipos celulares pueden enmascarar la regulación específica de exones en tejidos con
identidades celulares minoritarias o muy variadas. Además, se han descrito eventos con
inclusión variable dentro de un mismo tipo celular dependiendo de su estado fisiológico
concreto (Gu et al., 2012). Por otro lado, también hay órganos distintos que poseen tipos
celulares cercanos, ontogenética o funcionalmente, que pueden presentar programas de
splicing similares, anulando la especificidad a nivel de órgano. Podría ser el caso, por
ejemplo, de tejidos con abundancia de células epiteliales, que compartirían la inclusión o
exclusión diferencial de ciertos exones relacionados con propiedades como la adhesión
celular (Mallinjoud et al., 2014). Finalmente, también se han descrito casos donde tejidos
biológicos distintos co-regulan ciertos exones alternativos de manera muy similar. Por
estos motivos, un porcentaje probablemente elevado de eventos funcionales de splicing
alternativo no presenta especificidad reguladora de tipo celular o tejido cuando se realizan
aproximaciones transcriptómicas desde órganos enteros.
En la presente tesis se ha observado un mayor número de exones diferencialmente
incluidos en el sistema nervioso respecto al resto de órganos seleccionados en nueve de
diez comparaciones (5 especies y 2 parámetros de dPSI distintos). Sin embargo, la
distancia respecto a la cantidad detectada de exones “específicos” en otros órganos resulta
variable entre organismos. El mamífero Homo sapiens y el equinoideo Strongylocentrotus
purpuratus muestran niveles similares de inclusión diferencial entre algunos o la mayoría
de órganos no neurales, respectivamente. Por un lado, estos datos apuntan a la hipótesis
de que tejidos como el músculo y los testículos aumentaron sustancialmente su
proporción de exones diferencialmente incluídos dentro de un clado sarcopterígio
indeterminado que contiene el linaje de los primates. Por otro lado, las diferencias aún
menos sesgadas en erizo de mar abren la puerta a dos escenarios simplificados: (i) algunas
especies o linajes de deuteróstomos podrían haber reducido notablemente su proporción
de exones específicos neurales respecto al resto de tejidos; (ii) un aumento significativo
en los niveles de inclusión diferencial neural sucedió durante el origen de los cordados.
La determinación de la probabilidad de estos escenarios está ligada al éxito en la

Discusión
117
reconstrucción de las características transcriptómicas del ancestro de los deuteróstomos.
Análisis ampliados a otros grupos filogenéticos podrían contribuir tanto a discernir la
probabilidad de los escenarios mencionados, como a dibujar patrones y tendencias
macroevolutivas generales de la regulación específica de tejido mediante splicing
alternativo.
Las comparaciones entre las cantidades absolutas de exones alternativos en cada especie
son tentadoras. Sin embargo, la confrontación directa de estos valores debe realizarse con
cautela debido a múltiples sesgos inherentes en los análisis. Entre los factores que afectan
a la identificación de exones alternativos están el ensamblaje y la anotación genómica,
los niveles de polimorfismo, o la calidad y profundidad de cubrimiento (coverage) de las
muestras de RNA-seq. De este modo, organismos como la especie humana con una
anotación genómica muy cuidada presentan implícitamente una capacidad de detección
de eventos alternativos más elevada que el resto de especies. No obstante, organismos
como pez cebra o anfioxo muestran un número mayor de exones diferencialmente
incluídos en el sistema nervioso. Por tanto, dentro de los cordados, los elevados niveles
de inclusión exónica específica del sistema nervioso adulto parecen estar más ligados a
la fisiología de los circuitos y tipos neurales que a la elaboración estructural del órgano
en el que se integran.
Los motivos funcionales de todo este splicing alternativo específico de tejido en el sistema
nervioso constituyen una incógnita. Actualmente no existe una explicación clara y
contundente, puesto que una comprensión profunda de la funcionalidad organísmica de
estos eventos alternativos requiere un trabajo detallado de cada caso particular. Por el tipo
de genes que presentan splicing alternativo en mamíferos, una parte importante podría
estar asociada a procesos dinámicos propios de los circuitos neuronales, como la
plasticidad sináptica o la excitabilidad neuronal. Resulta interesante mencionar que
diversos mecanismos de regulación post-transcripcional parecen estar especialmente
activos en células neurales de distintos clados animales (Kiebler et al., 2013), como la
edición de RNA en ganglios cerebrales de cefalópodos coloideos (Liscovitch-Brauer et
al., 2017).
Por otro lado, la especie humana es el único de los cinco organismos estudiados en este
Discusión
118
trabajo que presenta más exones diferencialmente excluídos que incluídos en el conjunto
total de los órganos estudiados. Esta predominancia relativa de la exclusión exónica en
ciertos linajes ha sido descrita en casos particulares como la familia Cerkl, cuyos
ortólogos de humano y ratón codifican para más de veinte y treinta isoformas,
mayoritariamente mediante la exclusión de exones conservados (Garanto et al., 2011).
Sin embargo, otros linajes de vertebrados producen entre dos y cinco tránscritos a través
de promotores alternativos, inclusión de exones no conservados, y algún caso de skipping
(Riera et al., 2013) (artículo anexo 4). A nivel transcriptómico general, análisis
suplementarios en otras especies de vertebrados son necesarias para revelar tanto el origen
evolutivo de esta “transición” en humanos a mayores niveles de exclusión diferencial
como su frecuencia filogenética en otros clados. Algunos análisis han apuntado a los
primates como el linaje animal con mayores niveles de producción de isoformas mediante
splicing alternativo (Barbosa-Morais et al., 2012), aunque la recolección de datos
genómicos y transcriptómicos de alta calidad en un conjunto amplio de grupos
filogenéticos es necesaria para la confirmación de este escenario.
Es importante tener en cuenta que no todos los elementos que forman parte del
transcriptoma son resultado de procesos de selección positiva o negativa. Es probable que
un porcentaje no negligible de isoformas generadas por AS en un contexto celular
concreto no presente una función específica. Estos elementos pueden ser producidos tanto
por fallos en la maquinaria de splicing, o como un subproducto relativamente constante,
aunque sin propósito, del ambiente molecular. Dicho tipo de variaciones
transcripcionales, si bien pueden resultar muy abundantes en un organismo dado,
tenderían a presentar una trayectoria evolutiva breve si no son objeto de un proceso
selectivo en algún linaje. Por otro lado, resulta interesante especular sobre las
implicaciones de este tipo de ruido transcriptómico bajo la luz de la teoría jerárquica de
la selección de especies. En este sentido, aquellos linajes que a escala organísmica puedan
soportar un ruido más elevado dispondran también de un número mayor de elementos
transcriptómicos co-optables durante procesos macroevolutivos determinantes como la
especiación.

Discusión
119
Evolución de la expresión y función ontogénica de los factores RbFox y Nova
La expresión y/o función de un número cada vez más elevado de familias génicas que
codifican proteínas de unión a RNA y tienen la capacidad de modular el splicing
alternativo de múltiples eventos ha sido descrita en mamíferos o peces. Muchas de estas
familias presentan uno o más de sus miembros expresados en células neurales, hecho que
podría explicar los elevados niveles relativos de regulación diferencial en este tejido.
Entre estos factores se encuentran las familias Nova y RbFox, con la mayoría de sus
parálogos fuertemente expresados en el sistema nervioso central de humano, ratón y pez
cebra (Jensen et al., 2000; Underwood et al., 2005). Paralelamente, se han descrito roles
fisiológicos adicionales para ambos factores en algunas de esas especies, como en el
músculo esquelético y el corazón en caso de genes RbFox o en el tejido adiposo en caso
de Nova (Gallagher et al., 2011; Vernia et al., 2016).
Con el propósito de comprender las trayectorias macroevolutivas de ambas familias
génicas, en la presente tesis se han caracterizado los niveles relativos de expresión de
dichos factores en varios tejidos adultos de distintos organismos bilaterales. Los
resultados obtenidos reflejan escenarios diferentes en cuanto al origen del patrón neural
descrito en vertebrados. Por un lado, los miembros de la familia Nova están expresados
mayormente en el sistema nervioso de los vertebrados estudiados, anfioxo y D.
melanogaster, pero no en las especies estudiadas de erizo de mar, el pulpo o el ciempiés.
Por tanto, el escenario más parsimonioso bajo estos datos sería el de una potenciación de
los niveles de expresión neural tanto en la base de los cordados como en algún ancestro
de la mosca no compartido con el miriápodo Strigamia. Por otro lado, exceptuando algún
parálogo en vertebrados, los genes RbFox sí presentan los niveles de transcripción más
elevados en el órgano nervioso de todos los organismos analizados. Así, resulta plausible
proponer un origen ancestral y una conservación general de la actividad reguladora de
RbFox en el sistema nervioso de protóstomos y deuteróstomos.
En mamíferos, las dos famílias parecen tener roles fisiológicos ligados a procesos
sinápticos propios del tejido neuronal. Por ejemplo, RbFox1 está implicado en la
regulación del splicing de muchos componentes sinápticos excitatorios, mientras que el

Discusión
120
gen Nova2 influye en el balance de isoformas de varios genes involucrados en conexiones
neuronales inhibidoras, presentando fenotipos acordes en los dos casos (Gehman et al.,
2011; Jensen et al., 2000). Interesantemente, estudios muy recientes han descrito que la
expresión neuronal de ambos genes potencia la memoria en Drosophila, en el caso de
RbFox a través del control de la excitación neuronal (Guven-Ozkan et al., 2016). En
consecuencia, resulta tentador especular sobre la posibilidad de que los genes RbFox
presenten funciones relacionadas con excitación neuronal en otros clados de animales
bilaterales. Si bien el programa post-transcripcional regulado por RbFox en neuronas de
la mosca de la fruta no ha sido investigado, Nova parece ejercer su función principalmente
a través de la regulación de un evento de retención intrónica en el gen Orb2A (Gill et al.,
2017). Aclarar el origen de esta conexión reguladora podría proporcionar una mejor
comprensión de los pasos evolutivos que facilitan ganancias de función a través de
eventos particulares de splicing alternativo.
Otros órganos aparte del sistema nervioso presentan patrones de expresión consistentes
dentro de algunos clados para miembros de ambas familias de factores. Es el caso de las
gónadas masculinas de protóstomos en el caso de Nova, o de los niveles relativamente
elevados en el músculo esquelético de cordados para diferentes homólogos RbFox.
Además, algunas especies exhiben niveles de expresión relativamente altos de manera
particular en varios órganos. Estas observaciones sugieren que ambas familias presentan
múltiples funciones organísmicas en distintos linajes evolutivos, apoyando una alta
frecuencia de co-opción de estos reguladores post-transcripcionales en tejidos adultos a
diversas escalas evolutivas. En consecuencia, la nomenclatura clásica que se refiere a
estos factores como “específicos de tejido” puede resultar confusa o desfasada en muchos
casos, puesto que parecen tener roles relevantes en múltiples órganos.
Un estudio anterior reveló los patrones de expresión de la familia Nova durante el
desarrollo embrionario de diversos metazoos (Irimia et al., 2011a) (artículo anexo 3).
Entre las conclusiones principales de dicho trabajo se encuentra la aparición de una
expresión neural significativa en la base de los cordados. Este escenario resulta similar
respecto a la expresión relativa de los genes Nova caracterizada en los tejidos de diversos
organismos en estadio reproductivo en el presente trabajo. Sin embargo, el análisis de los

Discusión
121
patrones de expresión de la familia RbFox en diversos deuteróstomos ha revelado un
escenario más discordante entre las etapas embrionaria y adulta. De este modo, mientras
que todos los estadios embrionarios de los cordados y el equinodermo estudiados
presentan expresión en el linaje celular miogénico, tan solo se ha observado un patrón
neural en algunos parálogos de organismos vertebrados. La interpretación más
parsimoniosa apunta a una función embrionaria ancestral en el mesodermo muscular,
mientras que la actividad de la familia RbFox habría sido intercalada en el desarrollo del
sistema nervioso durante la evolución de los vertebrados.
El análisis de la función embrionaria de Nova en el erizo de mar ha desvelado su
implicación en los movimientos de invaginación que sufre el endodermo en el polo
vegetal al inicio de la gastrulación. Este rol ontogénico dista mucho de aquellos descritos
para sus ortólogos en otros organismos, como la migración neuronal en el córtex de
mamíferos, la formación del lumen vascular en pez cebra o la estructuración y secreción
apical de las glándulas salivares de Drosophila (Giampietro et al., 2015; Hamada et al.,
2016; Seshaiah et al., 2001). No obstante, es lícito recalcar que las funciones descritas
durante el desarrollo en las especies estudiadas, incluyendo erizo, constituyen
mayormente procesos morfogenéticos. De hecho, se han detectado problemas de
polaridad celular colectiva tanto en fenotipos de vertebrados como en D. melanogaster.
A pesar de que estas similitudes a nivel celular deben tomarse con precaución, constituyen
una propuesta sobre un posible rol de Nova compartido a esa escala por embriones de
distintos filos. Una investigación sobre los mecanismos celulares que impiden la
gastrulación en S. purpuratus podría aportar más evidencia a favor o en contra de esa
hipótesis.
No existen muchos datos sobre la función embrionaria de los factores RbFox en el linaje
muscular exceptuando unos pocos estudios en pez cebra, donde se han descrito fenotipos
relacionados con la organización miofibrilar, incluyendo afectaciones ultraestructurales
en los sarcómeros (Gallagher et al., 2011). Los resultados obtenidos en erizo de mar
muestran que RbFox también es necesario para el desarrollo de la musculatura de origen
mesodérmico en este organismo. La formación alrededor del esófago de los anillos de
miosina del tipo II (MHC), proteína codificada por el gen de diferenciación terminal
Discusión
122
MHC18, se ve alterada cuando la expresión de todas las isoformas de RbFox está
perturbada. No obstante, con los datos disponibles es complicado determinar si este fallo
se debe a problemas en la determinación del destino celular o en el proceso de
diferenciación donde suceden las transformaciones morfogenéticas propias de la
población muscular. Entre estas últimas, se encuentra la fusión de los mioblastos en la
fase pluteus para formar las bandas musculares (Andrikou et al., 2013). Resulta
interesante remarcar que el gen RbFox2 de ratón está implicado en la fusión celular que
acontece durante la miogénesis en cultivos de mioblastos (Singh et al., 2014). Por otro
lado, el receptor de señalización celular Fgfr1 está relacionado con la especificación
muscular en este organismo a través de la activación de factores de transcripción que
bloquean la determinación celular y potencian la expresión de marcadores de
diferenciación (Andrikou et al., 2015). La identificación de Fgfr1 como una probable
diana directa de RbFox en el erizo de mar apunta a un posible rol de este factor de splicing
en la red de especificación-diferenciación.
El músculo embrionario es una de las poblaciones celulares que expresan factores de la
familia RbFox en el nemátodo C. elegans. Resulta interesante remarcar que la regulación
por RbFox de varios eventos de splicing musculares en esta especie se lleva a cabo a
través de su co-operación física con otra proteína, llamada sup-12 (Rbm24/38 en
vertebrados) (Mackereth, 2014). Este factor pertenece a una familia de reguladores
maestros del splicing alternativo del tejido muscular tanto en C. elegans como en
vertebrados, donde su actividad es necesaria para la diferenciación miogénica y la
formación de sarcómeros (Grifone et al., 2014; Kuroyanagi et al., 2007). Resulta
interesante recalcar que el patrón de expresión embrionaria de los homólogos de
Rbm24/38 en anfioxo y C. intestinalis también exhiben un patrón predominantemente
muscular (datos no mostrados). Además, la interacción protéica entre miembros de la
familia RbFox y Rbm24/38 ha sido descrita en humano en ensayos experimentales (Lim
et al., 2006). En definitiva, esta interacción podría ser un mecanismo molecular
conservado entre deuteróstomos y protóstomos que permitiría la regulación específica
diferencial de eventos de splicing mediante la co-operación de RbFox y Rbm24/38 en el
tejido muscular.

Discusión
123
Además de su papel durante la miogénesis, S. purpuratus ha reclutado la actividad de
RbFox durante la ingresión en el blastocele del mesénquima primario, el tejido que acaba
formando el esqueleto larvario. A pesar de que tanto los euechinoideos, como los
cidaroideos y las ofiuras poseen un esqueleto larvario, tan sólo los primeros presentan un
mesénquima primario derivado de micrómeros, convirtiendo a este ingreso celular en una
apomorfía morfogenética (Ettensohn, 2009). La función necesaria de RbFox durante el
estadío de blástula en el desarrollo del esqueleto larvario revela otro caso de reclutamiento
de un factor regulador de splicing para un proceso ontogénico específico de linaje. Por
otro lado, en vertebrados se han descrito múltiples roles de la familia RbFox durante el
desarrollo del sistema nervioso, como la laminación cortical o la migración de neuronas
Purkinje en el cerebelo (Gallego-Paez et al., 2017). En resumen, los miembros de esta
familia de factores de splicing han sido co-optados independientemente para la
morfogénesis de distintas estructuras embrionarias en varios linajes de deuteróstomos.
En la presente tesis, se han detectado múltiples eventos de splicing diferencialmente
regulados en la fase de blástula del equinodermo S. purpuratus tras la inyección de
morpholinos noqueadores de la expresión de Nova y RbFox. Obviamente, estos conjuntos
de eventos contienen tanto dianas directas, con las que el factor interacciona físicamente,
como dianas indirectas donde la alteración del patrón de splicing es debida al desbarajuste
transcriptómico derivado de los cambios en la regulación directa. Por un lado, la cantidad
de exones diferencialmente regulados tras la manipulación de la expresión de RbFox en
embriones ha sido cuantificada alrededor de los doscientos casos. Paralelamente, la
reducción de la actividad de Nova ha identificado más de mil setecientos. Esta diferencia
espectacular en el número de exones dependientes podría reflejar un alto número de casos
indirectos para Nova, la mayor parte de los cuales serían incluso constitutivos en
condiciones normales. Entre las explicaciones más plausibles para este fenómeno se
encuentran: (i) uno o múltiples eventos regulados directa o indirectamente por Nova que
afecten la función de algún elemento de la maquinaria spliceosomal; (ii) la co-opción de
Nova en el endodermo como un miembro spliceosomal auxiliar que asegura la inclusión
exónica en múltiples casos; (iii) un efecto no-específico del morpholino inyectado que
provocaría una perturbación de varios procesos constitutivos de splicing,
independientemente de la función de Nova.
Discusión
124
Reclutamiento de programas de splicing dependientes de los factores Esrp en
diversos procesos morfogenéticos de deuteróstomos
Los genes Esrp1 y Esrp2 han sido descritos en mamíferos como factores de splicing
específicos de tipos celulares epiteliales (Claude C Warzecha et al., 2009). Su función ha
sido relacionada en este clado con la regulación de propiedades celulares antagónicas
entre tejidos epiteliales y mesenquimales, como la adhesión o la motilidad celular
(Dittmar et al., 2012). En el presente trabajo, se ha observado una expresión muy
dinámica de esta familia génica en los embriones de todas las especies de deuteróstomos
estudiadas. En pez cebra, el patrón transcripcional de ambos genes resulta muy similar al
de ratón en múltiples estructuras epiteliales homólogas, sugiriendo un grado de
conservación generalmente elevado de las funciones de Esrp entre ambos linajes de
vertebrados (Revil and Jerome-Majewska, 2013). Sin embargo, parece haber diferencias
respecto a los requerimientos ontogenéticos de ambos parálogos en ratón y pez cebra.
Mientras que los ratones mutantes para Esrp1 presentan múltiples defectos morfológicos
y mortalidad neonatal (Bebee et al., 2015), los peces KO para su ortólogo en cebrita no
muestran ningún fenotipo evidente. Por otro lado, los mutantes para Esrp2 de ratón son
viables y reproductores, mientras que las hembras de los teleósteos noqueados son
aparentemente estériles. Así, tan solo los mutantes dobles de pez cebra exhiben anomalías
morfogenéticas graves en su desarrollo. Este resultado refleja niveles de solapamiento
funcional diferentes entre ambos parálogos en los dos organismos, que serían
notablemente mayores en pez cebra.
La expresión de genes Esrp también ha sido reclutada por algunas estructuras específicas
de linaje dentro de los vertebrados, como los folículos pilosos y los esbozos mamarios en
mamíferos o la glándula de eclosión en teleósteos. Además, algunas estructuras
conservadas presentan expresión clara solamente de uno de los parálogos, como el hígado
post-natal de ratón, donde Esrp2 está involucrado en la diferenciación terminal y la
competencia funcional de los hepatocitos (Bhate et al., 2015). También se ha observado
expresión de factores Esrp en la notocorda y corazón del cebrita, aunque no se ha podido
determinar si ésta se da en los componentes mesenquimales o epiteliales de esos órganos.
Resulta interesante destacar que se han empezado a describir patrones de expresión
Discusión
125
mesenquimales para miembros Esrp en organismos vertebrados, por ejemplo en las
células indiferenciadas de la musculatura lisa gastrointestinal del pollo, tejido en el que
Esrp1 promueve la proliferación (Sagnol et al., 2016). Por tanto, parece adecuado asumir
una gama funcional en vertebrados más allá del control de la adhesión celular y motilidad
en tejidos epiteliales.
El presente trabajo ha revelado una expresión ontogénica dinámica de la familia Esrp en
el ectodermo no neural de todos los deuteróstomos estudiados. Así, los cordados exhiben
un claro incremento en la detección de tránscritos en la epidermis justo al final de la
neurulación. En comparación, los embriones de erizo de mar presentan un patrón sesgado
hacia el ectodermo aboral tanto previa como paralelamente a la gastrulación. A pesar de
las diferencias heterocrónicas y de identidad celular, esto sugiere la posibilidad de un rol
primitivo en el ectodermo no neural del ancestro deuteróstomo. Sin embargo, merece la
pena ser precavidos respecto a esta afirmación, puesto que los roles ontogénicos descritos
en estos tejidos en ratón y erizo difieren enormemente y podrían ser consecuencia de
reclutamientos génicos independientes.
Por otro lado, la expresión y/o la función de factores Esrp ha sido detectada en estos
organismos en células mesenquimales involucradas en procesos morfogenéticos. En S.
purpuratus, células pigmentarias mesodérmicas que expresan Esrp se integran en el
ectodermo mediante una transición mesénquima-a-epitelio, un proceso que se ve alterado
tras la perturbación de dicho factor. Una función similar podría explicar la expresión de
Esrp en un presunto conjunto de precursores neuronales migradores que se incorporan al
ectodermo dorsal en anfioxo. De todos modos, la identificación definitiva de esas células
está pendiente de confirmación experimental. En C. intestinalis, Esrp parece modular
propiedades relacionadas con la motilidad celular en poblaciones concretas del linaje
mesenquimal. En vertebrados, las células migradoras provenientes de la cresta neural que
se integran en la parte anteromedial del paladar están ausentes en dicha estructura en los
dobles mutantes de ratón y cebrita. Este fenotipo podría estar relacionado con un fallo en
el proceso de integración de esas poblaciones celulares en el cartílago craneal. A favor de
esta hipótesis está el hecho de que la familia Esrp ha sido frecuentemente relacionada con
cambios en la adhesión celular y transiciones epitelio-a-mesénquima en cultivos celulares

Discusión
126
humanos y cáncer (Shapiro et al., 2011). Sin embargo, la confirmación definitiva de que
estos factores regulan procesos de este tipo durante la embriogénesis de vertebrados
requerirá de análisis experimentales adicionales.
A pesar de este uso evolutivo recurrente de Esrp en procesos morfogenéticos relacionados
con propiedades o interfaces epitelio-mesenquimales, muchos de los exones cuya
inclusión depende de estos factores muestran una regulación específica de linaje. El
ejemplo más extremo se da entre el erizo de mar y los organismos vertebrados, donde no
se han detectado exones alternativos regulados por Esrp conservados en ambos filos.
Estas observaciones son consistentes con una divergencia intercladal rápida respecto a la
regulación de los eventos particulares de splicing alternativo (Barbosa-Morais et al.,
2012; Julien et al., 2016; Merkin et al., 2012). Aun así, merece la pena tener en cuenta
que la cantidad de exones homólogos regulados compartidos entre especies representa
una infraestimación con toda seguridad. Los datos transcriptómicos utilizados provienen
de fuentes biológicas profundamente heterogéneas: monocultivos de tres tipos celulares
en humano, epidermis embrionaria de ratón, larvas de cebrita y blástulas de erizo de mar.
La actividad de los factores de splicing depende frecuentemente del contexto celular en
el que se encuentran, por lo que es posible que exones que no son detectados como
diferencialmente regulados en una muestra determinada sí lo sean en otra. Además, no
todos los eventos investigados presentan un cubrimiento (coverage) de reads suficiente
en todas las réplicas para determinar con seguridad su porcentaje de inclusión. Por otro
lado, los resultados obtenidos mediante secuenciación de embriones enteros muy
probablemente contengan una proporción significativamente incrementada de dianas
indirectas respecto aquellas muestran que provienen de un solo tejido celular. La
discriminación entre exones regulados directa e indirectamente utilizando técnicas como
el CLIP-seq, aclararía las posibles diferencias entre los niveles de conservación de ambos
conjuntos.
Dentro de vertebrados, los eventos dependientes de Esrp no compartidos entre especies
proceden mayoritariamente de exones pre-existentes, que serían usualmente alternativos
en los otros organismos analizados. Resulta interesante constatar que algunos linajes
presentan tasas más elevadas de reclutamiento de exones huérfanos que otras, como

Discusión
127
evidencia el caso humano en comparación con ratón. Por el contrario, sólo una quinta
parte de los exones diferencialmente regulados en erizo presentan homólogos en
vertebrados. Estos datos sugieren que el ensamblaje de los programas de splicing en los
clados de metazoos más distantes procede frecuentemente mediante el reclutamiento de
exones específicos de linaje. De todos modos, sí se ha detectado regulación por Esrp en
múltiples dianas homólogas a nivel de gen entre todos los organismos. Si bien el escenario
evolutivo responsable de dicha situación resulta incierto, esta observación podría explicar
las semejanzas funcionales interfiléticas descritas a escala celular.
A pesar de la acumulación de profundas diferencias estructurales entre actinopterígios y
sarcopterígios desde su separación filogenética en el Silúrico, algunos roles
morfogenéticos de Esrp se han revelado conservados entre estos clados. Dicha afirmación
se fundamenta en la similitud apreciable de los fenotipos descritos en ratón y pez cebra
para múltiples caracteres homólogos (Bebee et al., 2015). Esta situación tiene un reflejo
a nivel molecular por un conjunto de al menos 22 exones homólogos que presentan
niveles de inclusión diferencial dependientes de Esrp en las tres especies de vertebrados
analizadas. La lista incluye a miembros de la familia Fgfr, que codifican para receptores
de la vía de señalización celular FGF. De hecho, la mayoría de las estructuras afectadas
en los mutantes de Esrp en ratón y cebrita expresan genes Fgfr, e incluso presentan
fenotipos similares a los descritos en mutantes condicionales para la isoforma epitelial de
Fgfr2 en el roedor (De Moerlooze et al., 2000). Esta relación es consistente con el
descubrimiento de que, igual que sus ortólogos de ratón, los factores Esrp de pez cebra
son necesarios para la inclusión del exón epitelial IIIb en tejidos embrionarios. Por lo
tanto, una de las principales causas moleculares de los fenotipos observados en los dobles
mutantes es probablemente la interrupción de la señalización FGF cruzada entre epitelios
y mesénquima durante el desarrollo de los órganos afectados. De hecho, esta conexión
reguladora podría explicar el pronunciado sesgo de expresión en tejidos epiteliales de la
familia Esrp en vertebrados. Curiosamente, el ratón mutante condicional para Fgfr2b, que
no expresa ninguna de las dos isoformas en tejidos epiteliales, no desarrolla extremidades
en absoluto. Contrariamente, la mayoría de los dobles mutantes para los factores Esrp
exhiben aletas pectorales o extremidades anteriores con una desestructuración acentuada
especialmente en la parte más distal. Esta observación sugiere que la regulación del
Discusión
128
splicing alternativo del receptor Ffgr2 no es imprescindible para el crecimiento inicial de
la extremidad, pero sí para su desarrollo posterior.
Finalmente, se ha podido determinar que la regulación del splicing alternativo
dependiente de Esrp en los genes Fgfr se originó en el ancestro de los cordados tras la
duplicación en tándem de un exón pro-homólogo de los exones IIIb y IIIc. En
consecuencia, los cordados evolucionaron una manera única de utilizar la vía FGF a
través de la inclusión diferencial del exón IIIb en tejidos que expresan Esrp. Este sistema
ha sido explotado recurrentemente por los vertebrados en múltiples procesos
morfogenéticos, que han reclutado la señalización FGF para regular las interacciones
moleculares entre epitelio y mesénquima requeridas durante el desarrollo de diversos
órganos. Sorprendentemente, varios eventos de splicing alternativo han evolucionado
independientemente en ortólogos Fgfr en regiones homólogas que codifican para
dominios immunoglobulina en otros filos. Parece lícito especular con que muchos de
estos eventos podrían contribuir a modular la afinidad del receptor por distintos ligandos
Fgf. De todos modos, su rol organísmico dependerá de la lógica reguladora del splicing
en cada linaje. Por ejemplo, de acuerdo a los resultados obtenidos en esta tesis, los
embriones de erizo de mar producirían diferentes isoformas de Fgfr1 en el mesodermo
muscular y el ectodermo neural mediante la expresión de RbFox en el primero. Por
último, este caso ilustra como mutaciones en la estructura génica probablemente neutrales
en el momento de su aparición pueden tener un impacto a largo plazo. En el ejemplo
estudiado, la ganancia de un intrón en medio de un exón codificante generó un hotspot
genómico con un gran potencial macroevolutivo en los Bilateria.
Reflexión general sobre la evolución de los programas de splicing alternativo
Como se ha descrito en esta tesis y en otros tantos trabajos anteriores, la regulación
precisa de diferentes programas de AS resulta esencial durante el desarrollo embrionario
animal. Esta afirmación se halla respaldada por los fallos morfológicos y fisiológicos
descritos en mutantes para factores de splicing con expresión restringida a contextos o
procesos celulares concretos. De todos modos, parece sensato mostrar cautela a la hora
de atribuir toda la causalidad de los fenotipos observados a perturbaciones en eventos de
Discusión
129
AS. En el fondo, estos factores reguladores constituyen proteínas de unión a RNA, y como
tales tienen la capacidad potencial de controlar múltiples procesos post-transcripcionales
más allá del splicing. En neuronas, por ejemplo, se han publicado diversos casos que
demuestran un papel relevante para varios de estos péptidos en el transporte de mRNAs
hacia las sinápsis. También se ha detectado un número elevado de dianas génicas para
varios factores a través de la poliadenilación alternativa o la estabilidad del tránscrito
mediante unión a las UTRs (Dittmar et al., 2012).
Resultaría interesante investigar la cantidad de eventos diana de AS cuya desregulación
en los mutantes y knockdowns realmente provoca los fenotipos observados. Es imaginable
que la flexibilidad evolutiva asociada al AS pueda estar relacionada con un impacto
funcional variable de los diferentes eventos regulados en una especie dada. Dentro de esta
lógica, es probable que cada programa de splicing contenga un número reducido de dianas
centrales, generalmente más conservadas, que serían las responsables troncales de los
procesos afectados. Contrariamente, muchos de los eventos regulados tendrían una
participación pequeña y no imprescindible que podría ser fácilmente eliminada o
sustituida evolutivamente conforme a las necesidades organísmicas circunstanciales. A
nivel molecular, estudios de la conexión entre el mapa genotípico y los valores de PSI de
eventos particulares han aportado luz sobre la enorme sensibilidad del splicing alternativo
a mutaciones puntuales (Julien et al., 2016).
Por otro lado, los reguladores de splicing alternativo son frecuentemente co-optados en
diferentes clados para contribuir en procesos ontogénicos diversos. Resulta interesante
especular acerca de las etapas a través de las que procede dicha exaptación molecular.
Una de las posibilidades es que el regulador sea aprovechado para cambiar o fortalecer el
balance de isoformas de uno o unos pocos eventos particulares, aprovechando su
capacidad de unión al tránscrito inmaduro debido a su conexión reguladora ancestral en
otro contexto celular. Otra opción es que la ganancia de función se ejecute mediante la
interacción proteica con la maquinaria spliceosomal u algún co-factor concreto del nuevo
ambiente en el que se ha inserido, como se ha descrito recientemente para un sub-conjunto
de eventos influenciados por RbFox (Damianov et al., 2016). En ambos casos, la
expansión de su actividad reguladora podría proceder a través de la ganancia progresiva

Discusión
130
de secuencias de unión en la vecindad genómica de exones alternativos, constitutivos o
crípticos cuyos niveles de inclusión sea conveniente modular o reforzar.
Ciertamente, la aparición de elementos moleculares novedosos puede proporcionar un
impulso importante hacia la materialización de nuevos caracteres o funciones. Sin
embargo, en múltiples ocasiones simplemente constituyen una manera alternativa de
ejercer roles fisiológicos o construir estructuras previamente existentes. De este modo,
muchos cambios moleculares en elementos funcionales pueden llegar a fijarse debido a
su capacidad de suplir a componentes primitivos. Por ejemplo, hay trabajos que sugieren
que las secuencias reguladoras de splicing podrían cambiar rápidamente entre especies a
pesar del mantenimiento de los niveles de inclusión (Julien et al., 2016). Por tanto, es
importante recalcar que no todas las sinapomorfias funcionales genómicas o
transcriptómicas de un linaje particular tienen por qué estar ligadas a novedades
evolutivas propias de ese grupo.

CONCLUSIONES


Conclusiones
133
Conclusiones:
1) La cuantificación de casos de inclusión exónica diferencial en órganos adultos de
las especies investigadas muestran una mayor proporción en general en el sistema
nervioso de cordados, mientras que el erizo de mar púrpura presenta niveles más
balanceados entre tejidos.
2) La especie humana exhibe una mayor cantidad de exones con exclusión
diferencial en el conjunto de eventos con regulación específica de tejido, en
comparación con los casos de inclusión, respecto al resto de especies estudiadas.
3) Los genes Nova presentan un paralelismo entre embriones y organismos adultos
respecto a la ganancia de expresión neural en el origen de los cordados.
4) El ortólogo Nova de S. purpuratus está involucrado en la ejecución de los
movimientos celulares de invaginación del endodermo durante la gastrulación.
5) La actividad en el sistema nervioso adulto de la familia RbFox representa
probablemente una plesiomorfía de organismos bilaterales. Sin embargo, es
posible que la función embrionaria ancestral en deuteróstomos estuviese
relacionada con el desarrollo miogénico.
6) El ortólogo de RbFox de erizo de mar está implicado en la formación tanto del
esqueleto larvario como del tejido muscular mesodérmico. Esta última función
podría estar relacionada con la regulación del splicing alternativo del gen Fgfr1.
7) La función de la familia de factores de splicing Esrp ha sido co-optada por
múltiples estructuras o tejidos celulares en los distintos linajes de deuteróstomos.
8) La familia Esrp presenta roles biológicos diversos en las especies estudiadas, pero
usualmente ligados a morfogénesis. A nivel celular, su actividad morfogenética
parece frecuentemente asociada a la regulación de propiedades celulares como la
adhesión y la motilidad celular.
9) Esrp1 y 2 coordinan en vertebrados la señalización molecular entre epitelio y
mesénquima en diversos procesos organogenéticos a través la regulación de un
evento de splicing en genes Ffgr que se originó en un ancestro de los cordados.


BIBLIOGRAFÍA


Bibliografía
137
BIBLIOGRAFÍA
Abitua, P.B., Gainous, T.B., Kaczmarczyk, A.N., Winchell, C.J., Hudson, C., Kamata, K.,
Nakagawa, M., Tsuda, M., Kusakabe, T.G., Levine, M., 2015. The pre-vertebrate origins
of neurogenic placodes. Nature 524, 462–465. doi:10.1038/nature14657
Abitua, P.B., Wagner, E., Navarrete, I.A., Levine, M., 2012. Identification of a rudimentary
neural crest in a non-vertebrate chordate. Nature 492, 104–7. doi:10.1038/nature11589
Albuixech-Crespo, B., López-Blanch, L., Burguera, D., Maeso, I., Sánchez-Arrones, L.,
Moreno-Bravo, J.A., Somorjai, I., Pascual-Anaya, J., Puelles, E., Bovolenta, P., Garcia-
Fernàndez, J., Puelles, L., Irimia, M., Ferran, J.L., 2017. Molecular regionalization of the
developing amphioxus neural tube challenges major partitions of the vertebrate brain.
PLOS Biol. 15, e2001573. doi:10.1371/journal.pbio.2001573
Alexeyenko, A., Tamas, I., Liu, G., Sonnhammer, E.L.L., 2006. Automatic clustering of
orthologs and inparalogs shared by multiple proteomes, in: Bioinformatics.
doi:10.1093/bioinformatics/btl213
Altenhoff, A.M., Gil, M., Gonnet, G.H., Dessimoz, C., 2013. Inferring Hierarchical Orthologous
Groups from Orthologous Gene Pairs. PLoS One 8. doi:10.1371/journal.pone.0053786
Andrikou, C., Iovene, E., Rizzo, F., Oliveri, P., Arnone, M.I., 2013. Myogenesis in the sea
urchin embryo: the molecular fingerprint of the myoblast precursors. Evodevo 4, 33.
doi:10.1186/2041-9139-4-33
Andrikou, C., Pai, C.Y., Su, Y.H., Arnone, M.I., 2015. Logics and properties of a genetic
regulatory program that drives embryonic muscle development in an echinoderm. Elife 4,
1–22. doi:10.7554/eLife.07343
Barbosa-Morais, N.L., Irimia, M., Pan, Q., Xiong, H.Y., Gueroussov, S., Lee, L.J., Slobodeniuc,
V., Kutter, C., Watt, S., Colak, R., Kim, T., Misquitta-Ali, C.M., Wilson, M.D., Kim, P.M.,
Odom, D.T., Frey, B.J., Blencowe, B.J., 2012. The evolutionary landscape of alternative
splicing in vertebrate species. Science (80-. ). 338, 1587–1593.
doi:10.1126/science.1230612
Bebee, T.W., Park, J.W., Sheridan, K.I., Warzecha, C.C., Cieply, B.W., Rohacek, A.M., Xing, Y.,
Carstens, R.P., 2015. The splicing regulators Esrp1 and Esrp2 direct an epithelial splicing
program essential for mammalian development. Elife 4. doi:10.7554/eLife.08954
Bebee, T.W., Sims-Lucas, S., Park, J.W., Bushnell, D., Cieply, B., Xing, Y., Bates, C.M.,
Carstens, R.P., 2016. Ablation of the epithelial-specific splicing factor Esrp1 results in
ureteric branching defects and reduced nephron number. Dev. Dyn. 245, 991–1000.
doi:10.1002/dvdy.24431
Bell, G., Mooers, A.O., 1997. Size and complexity among multicellular organisms. Biol. J.

Bibliografía
138
Linn. Soc. 60, 345–363. doi:10.1111/j.1095-8312.1997.tb01500.x
Benito-Gutiérrez, È., Illas, M., Comella, J.X., Garcia-Fernàndez, J., 2005. Outlining the nascent
nervous system of Branchiostoma floridae (amphioxus) by the pan-neural marker
AmphiElav, in: Brain Research Bulletin. pp. 518–521.
doi:10.1016/j.brainresbull.2005.03.007
Bhate, A., Parker, D.J., Bebee, T.W., Ahn, J., Arif, W., Rashan, E.H., Chorghade, S., Chau, A.,
Lee, J.-H., Anakk, S., Carstens, R.P., Xiao, X., Kalsotra, A., 2015. ESRP2 controls an adult
splicing programme in hepatocytes to support postnatal liver maturation. Nat. Commun. 6,
8768. doi:10.1038/ncomms9768
Boehlke, C., Janusch, H., Hamann, C., Powelske, C., Mergen, M., Herbst, H., Kotsis, F.,
Nitschke, R., Kuehn, E.W., 2015. A cilia independent role of Ift88/polaris during cell
migration. PLoS One 10. doi:10.1371/journal.pone.0140378
Bouchet, B.P., Noordstra, I., van Amersfoort, M., Katrukha, E.A., Ammon, Y.-C., ter Hoeve,
N.D., Hodgson, L., Dogterom, M., Derksen, P.W.B., Akhmanova, A., 2016. Mesenchymal
Cell Invasion Requires Cooperative Regulation of Persistent Microtubule Growth by
SLAIN2 and CLASP1. Dev. Cell 1–16. doi:10.1016/j.devcel.2016.11.009
Braunschweig, U., Barbosa-Morais, N.L., Pan, Q., Nachman, E.N., Alipanahi, B.,
Gonatopoulos-Pournatzis, T., Frey, B., Irimia, M., Blencowe, B.J., 2014. Widespread
intron retention in mammals functionally tunes transcriptomes. Genome Res. 24, 1774–
1786. doi:10.1101/gr.177790.114
Brown, J.B., Boley, N., Eisman, R., May, G.E., Stoiber, M.H., Duff, M.O., Booth, B.W., Wen,
J., Park, S., Suzuki, A.M., Wan, K.H., Yu, C., Zhang, D., Carlson, J.W., Cherbas, L., Eads,
B.D., Miller, D., Mockaitis, K., Roberts, J., Davis, C.A., Frise, E., Hammonds, A.S.,
Olson, S., Shenker, S., Sturgill, D., Samsonova, A.A., Weiszmann, R., Robinson, G.,
Hernandez, J., Andrews, J., Bickel, P.J., Carninci, P., Cherbas, P., Gingeras, T.R., Hoskins,
R.A., Kaufman, T.C., Lai, E.C., Oliver, B., Perrimon, N., Graveley, B.R., Celniker, S.E.,
2014. Diversity and dynamics of the Drosophila transcriptome. Nature 512, 393–399.
doi:10.1038/nature12962
Brown, J.B., Boley, N., Eisman, R., May, G.E., Stoiber, M.H., Duff, M.O., Booth, B.W., Wen,
J., Park, S., Suzuki, A.M., Wan, K.H., Yu, C., Zhang, D., Carlson, J.W., Cherbas, L., Eads,
B.D., Miller, D., Mockaitis, K., Roberts, J., Davis, C. a, Frise, E., Hammonds, A.S., Olson,
S., Shenker, S., Sturgill, D., Samsonova, A. a, Weiszmann, R., Robinson, G., Hernandez,
J., Andrews, J., Bickel, P.J., Carninci, P., Cherbas, P., Gingeras, T.R., Hoskins, R. a,
Kaufman, T.C., Lai, E.C., Oliver, B., Perrimon, N., Graveley, B.R., Celniker, S.E., 2014.
Diversity and dynamics of the Drosophila transcriptome. Nature 512, 1–7.

Bibliografía
139
doi:10.1038/nature12962
Buckley, P.T., Khaladkar, M., Kim, J., Eberwine, J., 2014. Cytoplasmic intron retention,
function, splicing, and the sentinel RNA hypothesis. Wiley Interdiscip. Rev. RNA.
doi:10.1002/wrna.1203
Buckley, P.T., Lee, M.T., Sul, J.Y., Miyashiro, K.Y., Bell, T.J., Fisher, S.A., Kim, J., Eberwine,
J., 2011. Cytoplasmic Intron Sequence-Retaining Transcripts Can Be Dendritically
Targeted via ID Element Retrotransposons. Neuron 69, 877–884.
doi:10.1016/j.neuron.2011.02.028
Calo, E., Wysocka, J., 2013. Modification of Enhancer Chromatin: What, How, and Why? Mol.
Cell. doi:10.1016/j.molcel.2013.01.038
Chen, L., Bush, S.J., Tovar-Corona, J.M., Castillo-Morales, A., Urrutia, A.O., 2014. Correcting
for differential transcript coverage reveals a strong relationship between alternative
splicing and organism complexity. Mol. Biol. Evol. 31, 1402–1413.
doi:10.1093/molbev/msu083
Collén, J., Porcel, B., Carré, W., Ball, S.G., Chaparro, C., Tonon, T., Barbeyron, T., Michel, G.,
Noel, B., Valentin, K., Elias, M., Artiguenave, F., Arun, A., Aury, J.-M., Barbosa-Neto,
J.F., Bothwell, J.H., Bouget, F.-Y., Brillet, L., Cabello-Hurtado, F., Capella-Gutiérrez, S.,
Charrier, B., Cladière, L., Cock, J.M., Coelho, S.M., Colleoni, C., Czjzek, M., Da Silva,
C., Delage, L., Denoeud, F., Deschamps, P., Dittami, S.M., Gabaldón, T., Gachon, C.M.M.,
Groisillier, A., Hervé, C., Jabbari, K., Katinka, M., Kloareg, B., Kowalczyk, N., Labadie,
K., Leblanc, C., Lopez, P.J., McLachlan, D.H., Meslet-Cladiere, L., Moustafa, A., Nehr,
Z., Nyvall Collén, P., Panaud, O., Partensky, F., Poulain, J., Rensing, S.A., Rousvoal, S.,
Samson, G., Symeonidi, A., Weissenbach, J., Zambounis, A., Wincker, P., Boyen, C., 2013.
Genome structure and metabolic features in the red seaweed Chondrus crispus shed light
on evolution of the Archaeplastida. PNAS 110, 5247–52. doi:10.1073/pnas.1221259110
Coschigano, K.T., Wensink, P.C., 1993. Sex-specific transcriptional regulation by the male and
female doublesex proteins of Drosophila. Genes Dev. 7, 42–54. doi:10.1101/gad.7.1.42
Csuros, M., Rogozin, I.B., Koonin, E. V., 2011. A detailed history of intron-rich eukaryotic
ancestors inferred from a global survey of 100 complete genomes. PLoS Comput. Biol. 7.
doi:10.1371/journal.pcbi.1002150
Curtis, B.A., Tanifuji, G., Burki, F., Gruber, A., Irimia, M., Maruyama, S., Arias, M.C., Ball,
S.G., Gile, G.H., Hirakawa, Y., Hopkins, J.F., Kuo, A., Rensing, S.A., Schmutz, J.,
Symeonidi, A., Elias, M., Eveleigh, R.J.M., Herman, E.K., Klute, M.J., Nakayama, T.,
Oborník, M., Reyes-Prieto, A., Armbrust, E.V., Aves, S.J., Beiko, R.G., Coutinho, P.,
Dacks, J.B., Durnford, D.G., Fast, N.M., Green, B.R., Grisdale, C.J., Hempel, F.,

Bibliografía
140
Henrissat, B., Höppner, M.P., Ishida, K.-I., Kim, E., Kořený, L., Kroth, P.G., Liu, Y.,
Malik, S.-B., Maier, U.G., McRose, D., Mock, T., Neilson, J.A.D., Onodera, N.T., Poole,
A.M., Pritham, E.J., Richards, T.A., Rocap, G., Roy, S.W., Sarai, C., Schaack, S., Shirato,
S., Slamovits, C.H., Spencer, D.F., Suzuki, S., Worden, A.Z., Zauner, S., Barry, K., Bell,
C., Bharti, A.K., Crow, J.A., Grimwood, J., Kramer, R., Lindquist, E., Lucas, S., Salamov,
A., McFadden, G.I., Lane, C.E., Keeling, P.J., Gray, M.W., Grigoriev, I. V., Archibald,
J.M., 2012. Algal genomes reveal evolutionary mosaicism and the fate of nucleomorphs.
Nature 492, 59–65. doi:10.1038/nature11681
Damianov, A., Ying, Y., Lin, C.H., Lee, J.A., Tran, D., Vashisht, A.A., Bahrami-Samani, E.,
Xing, Y., Martin, K.C., Wohlschlegel, J.A., Black, D.L., 2016. Rbfox Proteins Regulate
Splicing as Part of a Large Multiprotein Complex LASR. Cell 165, 606–619.
doi:10.1016/j.cell.2016.03.040
De Moerlooze, L., Spencer-Dene, B., Revest, J.M., Hajihosseini, M., Rosewell, I., Dickson, C.,
Amaya, E., Musci, T., Kirschner, M., Araki, K., Araki, M., Miyazaki, J.-I., Vassalli, P.,
Arman, E., Haffner-Krausz, R., Chen, Y., Heath, J.K., Lonai, P., Bellusci, S., Grindley, J.,
Emoto, H., Itoh, N., Hogan, B.L.M., Cardoso, W. V., Itoh, A., Nogawa, H., Mason, I.,
Brody, J.S., Carstens, R., Mckeehan, W., Garcia-Blanco, M., Carstens, R.P., Eaton, J. V.,
Krigman, H.R., Walther, P.J., Garciablanco, M.A., Celli, G., Larochelle, W.J., MacKem,
S., Sharp, R., Merlino, G., Ciruna, B.G., Schwartz, L., Harpal, K., Yamaguchi, T.P.,
Rossant, J., Colvin, J.S., Bohne, B.A., Harding, G.W., McEwen, D.G., Ornitz, D.M.,
Crossley, P.H., Minowada, G., MacArthur, C.A., Martin, G.R., Gatto, F. Del, Plet, A.,
Gesnel, M.-C., Fort, C., Breathnach, R., DeMoerlooze, L., Dickson, C., Deng, C.,
Wynshaw, B.A., Zhou, F., Kuo, A., Leder, P., Deng, C.X., Bedford, M., Li, C.L., Xu, X.L.,
Yang, X., Dunmore, J., Leder, P., Deng, C.X., Wynshaw-Boris, A., Shen, M.M.,
Daugherty, C., Ornitz, D.M., Leder, P., DeVore, D.L., Horvitz, H.R., Stern, M.J., Ericson,
J., Norlin, S., Jessell, T.M., Edlund, T., Fantl, V., Stamp, G., Andrews, A., Rosewell, I.,
Dickson, C., Finch, P., Cunha, G., Rubin, J., Wong, J., Ron, D., Gilbert, E., Gatto, F. Del,
Gesnel, M.-C., Fort, C., Breathnach, R., Gu, H., Zou, Y.-R., Rajewsky, K., Guo, L.,
Degenstein, L., Fuchs, E., Igarashi, M., Finch, P., Aaronson, S., Jackson, D., Bresnick, J.,
Rosewell, I., Crafton, T., Poulsom, R., Stamp, G., Dickson, C., Johnson, D., Williams, L.,
Kettunen, P., Karavanova, I., Thesleff, I., Laird, P., Zijderveld, A., Linders, K., Rudnicki,
M., Jaenisch, R., Berns, A., Mahmood, R., Bresnick, J., Hornbruch, A., Mahony, C.,
Morton, N., Colquhoun, K., Martin, P., Lumsden, A., Dickson, C., Mason, I., Mansour,
S.L., Goddard, J.M., Capecchi, M.R., Mason, I., Fuller-Pace, F., Smith, R., Dickson, C.,
Mathieu, M., Chatelain, E., Ornitz, D., Bresnick, J., Mason, I., Kiefer, P., Dickson, C.,

Bibliografía
141
McKeehan, W.L., Wang, F., Kan, M., McLeod, M., Miki, T., Bottaro, D., Fleming, T.,
Smith, C.L., Burgess, W., Chan, A., Aaronson, S., Min, H., Danilenko, D., Scully, S.,
Bolon, B., Ring, B., Tarpley, J., DeRose, M., Simonet, W., Ohuchi, H., Nakagawa, T.,
Yamamoto, A., Araga, A., Ohata, T., Ishimaru, Y., Yoshioka, H., Kuwana, T., Nohno, T.,
Yamasaki, M., Itoh, N., Noji, S., Ornitz, D.M., Xu, J.S., Colvin, J.S., McEwen, D.G.,
MacArthur, C.A., Coulier, F., Gao, G.X., Goldfarb, M., Orr-Urtreger, A., Bedford, M.,
Burakova, T., Arman, E., Zimmer, Y., Yayon, A., Givol, D., Lonai, P., Peters, K., Werner,
S., Chen, G., Williams, L., Peters, K., Werner, S., Liao, X., Wert, S., Whitsett, J., Williams,
L., Qiao, J., Uzzo, R., Obara-Ishihara, T., Degenstein, L., Fuchs, E., Herzlinger, D.,
Reichman-Fried, M., Shilo, B.Z., Robinson, M.L., MacMillan-Crow, L.A., Thompson,
J.A., Overbeek, P.A., Satokata, I., Maas, R., Sekine, K., Ohuchi, H., Fujiwara, M.,
Yamasaki, M., Yoshizawa, T., Sato, T., Yagishita, N., Matsui, D., Koga, Y., Itoh, N., Kato,
S., Thesleff, I., Sharpe, P., Treier, M., Gleiberman, A., O’Connell, S., Szeto, D., McMahon,
J., McMahon, A., Rosenfeld, M., Vogel, A., Rodriguez, C., Izpisua-Belmonte, J.C.,
Weinstein, M., Xu, X.L., Ohyama, K., Deng, C.X., Werner, S., Smola, H., Liao, X.,
Longaker, M., Krieg, T., Hofschneider, P., Williams, L., Werner, S., Weinberg, W., Liao,
X., Peters, K., Blessing, M., Yuspa, S., Weiner, R., Williams, L., Wilkinson, D., Bhatt, S.,
McMahon, A., Xu, X.L., Weinstein, M., Li, C.L., Naski, M., Cohen, R.I., Ornitz, D.M.,
Leder, P., Deng, C.X., Yamaguchi, F., Saya, H., Bruner, J.M., Morrison, R.S., Yamaguchi,
T.P., Rossant, J., Yamasaki, M., Miyake, A., Tagashira, S., Itoh, N., 2000. An important
role for the IIIb isoform of fibroblast growth factor receptor 2 (FGFR2) in mesenchymal-
epithelial signalling during mouse organogenesis. Development 127, 483–492.
doi:10.1016/0092-8674(91)90616-7
Delsuc, F., Brinkmann, H., Chourrout, D., Philippe, H., 2006. Tunicates and not
cephalochordates are the closest living relatives of vertebrates. Nature 439, 965–968.
doi:10.1038/nature04336
Dittmar, K.A., Jiang, P., Park, J.W., Amirikian, K., Wan, J., Shen, S., Xing, Y., Carstens, R.P.,
2012. Genome-Wide Determination of a Broad ESRP-Regulated Posttranscriptional
Network by High-Throughput Sequencing. Mol. Cell. Biol. 32, 1468–1482.
doi:10.1128/MCB.06536-11
Djebali, S., Davis, C.A., Merkel, A., Dobin, A., Lassmann, T., Mortazavi, A., Tanzer, A.,
Lagarde, J., Lin, W., Schlesinger, F., Xue, C., Marinov, G.K., Khatun, J., Williams, B.A.,
Zaleski, C., Rozowsky, J., Röder, M., Kokocinski, F., Abdelhamid, R.F., Alioto, T.,
Antoshechkin, I., Baer, M.T., Bar, N.S., Batut, P., Bell, K., Bell, I., Chakrabortty, S., Chen,
X., Chrast, J., Curado, J., Derrien, T., Drenkow, J., Dumais, E., Dumais, J., Duttagupta, R.,

Bibliografía
142
Falconnet, E., Fastuca, M., Fejes-Toth, K., Ferreira, P., Foissac, S., Fullwood, M.J., Gao,
H., Gonzalez, D., Gordon, A., Gunawardena, H., Howald, C., Jha, S., Johnson, R.,
Kapranov, P., King, B., Kingswood, C., Luo, O.J., Park, E., Persaud, K., Preall, J.B.,
Ribeca, P., Risk, B., Robyr, D., Sammeth, M., Schaffer, L., See, L.-H., Shahab, A.,
Skancke, J., Suzuki, A.M., Takahashi, H., Tilgner, H., Trout, D., Walters, N., Wang, H.,
Wrobel, J., Yu, Y., Ruan, X., Hayashizaki, Y., Harrow, J., Gerstein, M., Hubbard, T.,
Reymond, A., Antonarakis, S.E., Hannon, G., Giddings, M.C., Ruan, Y., Wold, B.,
Carninci, P., Guigó, R., Gingeras, T.R., 2012. Landscape of transcription in human cells.
Nature 489, 101–108. doi:10.1038/nature11233
Doolittle, F., Brunet, T.D.P., Linquist, S., Gregory, T.R., 2014. Distinguishing between
“Function” and “Effect” in genome biology. Genome Biol. Evol. doi:10.1093/gbe/evu098
Dougherty, M., Kamel, G., Grimaldi, M., Gfrerer, L., Shubinets, V., Ethier, R., Hickey, G.,
Cornell, R. a, Liao, E.C., 2013. Distinct requirements for wnt9a and irf6 in extension and
integration mechanisms during zebrafish palate morphogenesis. Development 140, 76–81.
doi:10.1242/dev.080473
Ellis, J.D., Barrios-Rodiles, M., Çolak, R., Irimia, M., Kim, T.H., Calarco, J.A., Wang, X., Pan,
Q., O’Hanlon, D., Kim, P.M., Wrana, J.L., Blencowe, B.J., 2012. Tissue-Specific
Alternative Splicing Remodels Protein-Protein Interaction Networks. Mol. Cell 46, 884–
892. doi:10.1016/j.molcel.2012.05.037
Ettensohn, C.A., 2009. Lessons from a gene regulatory network: echinoderm skeletogenesis
provides insights into evolution, plasticity and morphogenesis. Development 136, 11–21.
doi:10.1242/dev.023564
Finlay, B.J., Esteban, G.F., 2009. Can Biological Complexity Be Rationalized? Bioscience 59,
333–340. doi:10.1525/bio.2009.59.4.11
Fu, X.-D., Ares, M., 2014. Context-dependent control of alternative splicing by RNA-binding
proteins. Nat. Rev. Genet. 15, 689–701. doi:10.1038/nrg3778
Fuentes, M., Benito, E., Bertrand, S., Paris, M., Mignardor, A., Godoy, L., Jimenez-Delgado, S.,
Oliveri, D., Candiani, S., Hirsinger, E., D’Aniello, S., Pascual-Anaya, J., Maeso, I.,
Pestarino, M., Vernier, P., Nicolas, J., Schubert, M., Laudet, V., Geneviere, A.M., Albalat,
R., Garcia-Fernàndez, J., Holland, N.D., Escrivà, H., 2007. Insights Into Spawning
Behavior and Development of the European Amphioxus (Branchiostoma lanceolatum). J.
Exp. Zool. B. Mol. Dev. Evol. 308, 484–493. doi:10.1002/jez.b
Gallagher, T.L., Arribere, J.A., Geurts, P.A., Exner, C.R.T., McDonald, K.L., Dill, K.K., Marr,
H.L., Adkar, S.S., Garnett, A.T., Amacher, S.L., Conboy, J.G., 2011. Rbfox-regulated
alternative splicing is critical for zebrafish cardiac and skeletal muscle functions. Dev.

Bibliografía
143
Biol. 359, 251–261. doi:10.1016/j.ydbio.2011.08.025
Gallego-Paez, L.M., Bordone, M.C., Leote, A.C., Saraiva-Agostinho, N., Ascens??o-Ferreira,
M., Barbosa-Morais, N.L., 2017. Alternative splicing: the pledge, the turn, and the
prestige: The key role of alternative splicing in human biological systems. Hum. Genet. 1–
28. doi:10.1007/s00439-017-1790-y
Gao, C., Ren, S., Lee, J., Qiu, J., Chapski, D.J., Rau, C.D., Zhou, Y., Abdellatif, M., Nakano, A.,
Vondriska, T.M., Xiao, X., Fu, X., Chen, J., Wang, Y., 2016. RBFox1-mediated RNA
splicing regulates cardiac hypertrophy and heart failure. J. Clin. Invest. 126, 195–206.
doi:10.1172/JCI84015DS1
Garanto, A., Riera, M., Pomares, E., Permanyer, J., de Castro-Miró, M., Sava, F., Abril, J.F.,
Marfany, G., Gonzàlez-Duarte, R., 2011. High transcriptional complexity of the retinitis
pigmentosa CERKL gene in human and mouse. Investig. Ophthalmol. Vis. Sci. 52, 5202–
5214. doi:10.1167/iovs.10-7101
Garcia-Fernàndez, J., Jiménez-Delgado, S., Pascual-Anaya, J., Maeso, I., Irimia, M.,
Minguillón, C., Benito-Gutiérrez, È., Gardenyes, J., Bertrand, S., D’Aniello, S., 2009.
From the American to the European amphioxus: Towards experimental Evo-Devo at the
origin of chordates. Int. J. Dev. Biol. doi:10.1387/ijdb.072436jg
Ge, Y., Porse, B.T., 2014. The functional consequences of intron retention: Alternative splicing
coupled to NMD as a regulator of gene expression. BioEssays 36, 236–243.
doi:10.1002/bies.201300156
Gehman, L.T., Meera, P., Stoilov, P., Shiue, L., O’Brien, J.E., Meisler, M.H., Ares, M., Otis,
T.S., Black, D.L., 2012. The splicing regulator Rbfox2 is required for both cerebellar
development and mature motor function. Genes Dev. 26, 445–460.
doi:10.1101/gad.182477.111
Gehman, L.T., Stoilov, P., Maguire, J., Damianov, A., Lin, C.-H., Shiue, L., Ares, M., Mody, I.,
Black, D.L., 2011. The splicing regulator Rbfox1 (A2BP1) controls neuronal excitation in
the mammalian brain. Nat. Genet. 43, 706–711. doi:10.1038/ng.841
Geisler, S., Coller, J., 2013. RNA in unexpected places: long non-coding RNA functions in
diverse cellular contexts. Nat. Rev. Mol. Cell Biol. 14, 699–712. doi:10.1038/nrm3679
Gempe, T., Hasselmann, M., Schiøtt, M., Hause, G., Otte, M., Beye, M., 2009. Sex
determination in honeybees: Two separate mechanisms induce and maintain the female
pathway. PLoS Biol. 7. doi:10.1371/journal.pbio.1000222
Giampietro, C., Deflorian, G., Gallo, S., Di Matteo, A., Pradella, D., Bonomi, S., Belloni, E.,
Nyqvist, D., Quaranta, V., Confalonieri, S., Bertalot, G., Orsenigo, F., Pisati, F., Ferrero,
E., Biamonti, G., Fredrickx, E., Taveggia, C., Wyatt, C.D.R., Irimia, M., Di Fiore, P.P.,

Bibliografía
144
Blencowe, B.J., Dejana, E., Ghigna, C., 2015. The alternative splicing factor Nova2
regulates vascular development and lumen formation. Nat. Commun. 6, 8479.
doi:10.1038/ncomms9479
Gibilisco, L., Zhou, Q., Mahajan, S., Bachtrog, D., 2016. Alternative Splicing within and
between Drosophila Species, Sexes, Tissues, and Developmental Stages. PLoS Genet. 12.
doi:10.1371/journal.pgen.1006464
Gibson, a W., Burke, R.D., 1985. The origin of pigment cells in embryos of the sea urchin
Strongylocentrotus purpuratus. Dev. Biol. 107, 414–419.
Gilbert, S.F., 2013. Developmental Biology. Dev. Biol.
Gill, J., Park, Y., McGinnis, J.P., Perez-Sanchez, C., Blanchette, M., Si, K., 2017. Regulated
Intron Removal Integrates Motivational State and Experience. Cell 169, 836–848.e15.
doi:10.1016/j.cell.2017.05.006
Gline, S., Kaplan, N., Bernadskaya, Y., Abdu, Y., Christiaen, L., 2015. Surrounding tissues
canalize motile cardiopharyngeal progenitors towards collective polarity and directed
migration. Development 142, 544–54. doi:10.1242/dev.115444
Gonzalez, I., Munita, R., Agirre, E., Dittmer, T.A., Gysling, K., Misteli, T., Luco, R.F., 2015. A
lncRNA regulates alternative splicing via establishment of a splicing-specific chromatin
signature. Nat. Struct. Mol. Biol. doi:10.1038/nsmb.3005
Gracheva, E.O., Cordero-Morales, J.F., González-Carcacía, J.A., Ingolia, N.T., Manno, C.,
Aranguren, C.I., Weissman, J.S., Julius, D., 2011. Ganglion-specific splicing of TRPV1
underlies infrared sensation in vampire bats. Nature 476, 88–91. doi:10.1038/nature10245
Gregory, T.R., 2004. Macroevolution, hierarchy theory, and the C-value enigma. Paleobiology
30, 179–202. doi:10.1666/0094-8373(2004)030<0179:MHTATC>2.0.CO;2
Grifone, R., Xie, X., Bourgeois, A., Saquet, A., Duprez, D., Shi, D.L., 2014. The RNA-binding
protein Rbm24 is transiently expressed in myoblasts and is required for myogenic
differentiation during vertebrate development. Mech. Dev. 134, 1–15.
doi:10.1016/j.mod.2014.08.003
Grosso, A.R., Gomes, A.Q., Barbosa-Morais, N.L., Caldeira, S., Thorne, N.P., Grech, G., von
Lindern, M., Carmo-Fonseca, M., 2008. Tissue-specific splicing factor gene expression
signatures. Nucleic Acids Res. 36, 4823–4832. doi:10.1093/nar/gkn463
Gu, Y., Barry, J., McDougel, R., Terman, D., Gu, C., 2012. Alternative splicing regulates Kv3.1
polarized targeting to adjust maximal spiking frequency. J. Biol. Chem. 287, 1755–1769.
doi:10.1074/jbc.M111.299305
Gueroussov, S., Gonatopoulos-Pournatzis, T., Irimia, M., Raj, B., Lin, Z.-Y., Gingras, A.-C.,
Blencowe, B.J., 2015. An alternative splicing event amplifies evolutionary differences
Bibliografía
145
between vertebrates. Science (80-. ). 349, 868–873. doi:10.1126/science.aaa8381
Guven-Ozkan, T., Busto, G.U., Schutte, S.S., Cervantes-Sandoval, I., O’Dowd, D.K., Davis,
R.L., 2016. MiR-980 Is a Memory Suppressor MicroRNA that Regulates the Autism-
Susceptibility Gene A2bp1. Cell Rep. 14, 1698–1709. doi:10.1016/j.celrep.2016.01.040
Hahn, M.W., Wray, G.A., 2002. The g-value paradox. Evol. Dev. 4, 73–75. doi:10.1046/j.1525-
142X.2002.01069.x
Hamada, N., Ito, H., Iwamoto, I., Morishita, R., Tabata, H., Nagata, K., 2015. Role of the
cytoplasmic isoform of RBFOX1/A2BP1 in establishing the architecture of the developing
cerebral cortex. Mol. Autism 6, 56. doi:10.1186/s13229-015-0049-5
Hamada, N., Ito, H., Nishijo, T., Iwamoto, I., Morishita, R., Tabata, H., Momiyama, T., Nagata,
K.-I., 2016. Essential role of the nuclear isoform of RBFOX1, a candidate gene for autism
spectrum disorders, in the brain development. Sci. Rep. 6, 30805. doi:10.1038/srep30805
Holland, L.Z., 2016. Tunicates. Curr. Biol. 26, R146–R152. doi:10.1016/j.cub.2015.12.024
Holland, L.Z., Holland, N.D., 2001. Evolution of neural crest and placodes: amphioxus as a
model for the ancestral vertebrate? J. Anat. doi:10.1046/j.1469-7580.2001.19910085.x
Hotta, K., Mitsuhara, K., Takahashi, H., Inaba, K., Oka, K., Gojobori, T., Ikeo, K., 2007. A web-
based interactive developmental table for the Ascidian Ciona intestinalis, including 3D
real-image embryo reconstructions: I. From fertilized egg to hatching larva. Dev. Dyn.
236, 1790–1805. doi:10.1002/dvdy.21188
Imai, K.S., 2003. A Twist-like bHLH gene is a downstream factor of an endogenous FGF and
determines mesenchymal fate in the ascidian embryos. Development 130, 4461–4472.
doi:10.1242/dev.00652
Irimia, M., Blencowe, B.J., 2012. Alternative splicing: Decoding an expansive regulatory layer.
Curr. Opin. Cell Biol. doi:10.1016/j.ceb.2012.03.005
Irimia, M., Denuc, A., Burguera, D., Somorjai, I., Martín-Durán, J.M., Genikhovich, G.,
Jimenez-Delgado, S., Technau, U., Roy, S.W., Marfany, G., Garcia-Fernàndez, J., 2011a.
Stepwise assembly of the Nova-regulated alternative splicing network in the vertebrate
brain. Proc. Natl. Acad. Sci. U. S. A. 108, 5319–24.
Irimia, M., Maeso, I., Burguera, D., Hidalgo-Sanchez, M., Puelles, L., Roy, S.W., Garcia-
Fernàndez, J., Ferran, J.L., 2011b. Contrasting 5′ and 3′ evolutionary histories and frequent
evolutionary convergence in Meis/hth gene structures. Genome Biol. Evol. 3, 551–564.
Irimia, M., Pineiro, C., Maeso, I., Gomez-Skarmeta, J.L., Casares, F., Garcia-Fernandez, J.,
Piñeiro, C., Maeso, I., Gómez-Skarmeta, J.L., Casares, F., Garcia-Fernàndez, J., 2010a.
Conserved developmental expression of Fezf in chordates and Drosophila and the origin of
the Zona Limitans Intrathalamica (ZLI) brain organizer. Evodevo 1, 7. doi:10.1186/2041-

Bibliografía
146
9139-1-7
Irimia, M., Piñeiro, C., Maeso, I., Gómez-Skarmeta, J.L., Casares, F., Garcia-Fernàndez, J.,
2010b. Conserved developmental expression of Fezf in chordates and Drosophila and the
origin of the Zona Limitans Intrathalamica (ZLI) brain organizer. Evodevo 1, 7.
doi:10.1186/2041-9139-1-7
Irimia, M., Roy, S.W., 2014. Origin of spliceosomal introns and alternative splicing. Cold
Spring Harb. Perspect. Biol. 6. doi:10.1101/cshperspect.a016071
Irimia, M., Roy, S.W., 2008. Spliceosomal introns as tools for genomic and evolutionary
analysis. Nucleic Acids Res. doi:10.1093/nar/gkn012
Irimia, M., Rukov, J.L., Penny, D., Vinther, J., Garcia-Fernandez, J., Roy, S.W., 2008. Origin of
introns by “intronization” of exonic sequences. Trends Genet.
doi:10.1016/j.tig.2008.05.007
Irimia, M., Weatheritt, R.J., Ellis, J.D., Parikshak, N.N., Gonatopoulos-Pournatzis, T., Babor,
M., Quesnel-Vallières, M., Tapial, J., Raj, B., O’Hanlon, D., Barrios-Rodiles, M.,
Sternberg, M.J.E., Cordes, S.P., Roth, F.P., Wrana, J.L., Geschwind, D.H., Blencowe, B.J.,
2014. A highly conserved program of neuronal microexons is misregulated in autistic
brains. Cell 159, 1511–1523. doi:10.1016/j.cell.2014.11.035
Jao, L.-E., Wente, S.R., Chen, W., 2013. Efficient multiplex biallelic zebrafish genome editing
using a CRISPR nuclease system. Proc. Natl. Acad. Sci. U. S. A. 110, 13904–9.
doi:10.1073/pnas.1308335110
Jensen, K.B., Dredge, B.K., Stefani, G., Zhong, R., Buckanovich, R.J., Okano, H.J., Yang,
Y.Y.L., Darnell, R.B., 2000. Nova-1 Regulates Neuron-Specific Alternative Splicing and Is
Essential for Neuronal Viability. Neuron 25, 359–371. doi:10.1016/S0896-6273(00)80900-
9
Jonas, S., Izaurralde, E., 2015. Towards a molecular understanding of microRNA-mediated gene
silencing. Nat. Rev. Genet. 16, 421–433. doi:10.1038/nrg3965
Julien, P., Miñana, B., Baeza-Centurion, P., Valcárcel, J., Lehner, B., 2016. The complete local
genotype–phenotype landscape for the alternative splicing of a human exon. Nat.
Commun. 7, 11558. doi:10.1038/ncomms11558
Jung, Y., Kissil, J.L., McCarty, J.H., 2011. ??8 integrin and band 4.1B cooperatively regulate
morphogenesis of the embryonic heart. Dev. Dyn. 240, 271–277. doi:10.1002/dvdy.22513
Kalsotra, A., Xiao, X., Ward, A.J., Castle, J.C., Johnson, J.M., Burge, C.B., Cooper, T. a, 2008.
A postnatal switch of CELF and MBNL proteins reprograms alternative splicing in the
developing heart. Proc. Natl. Acad. Sci. U. S. A. 105, 20333–20338.
doi:10.1073/pnas.0809045105
Bibliografía
147
Kaltenbach, S.L., Yu, J.K., Holland, N.D., 2009. The origin and migration of the earliest-
developing sensory neurons in the peripheral nervous system of amphioxus. Evol. Dev. 11,
142–151. doi:10.1111/j.1525-142X.2009.00315.x
Kanapin, A.A., Mulder, N., Kuznetsov, V.A., 2010. Projection of gene-protein networks to the
functional space of the proteome and its application to analysis of organism complexity.
BMC Genomics 11 Suppl 1, S4+. doi:10.1186/1471-2164-11-S1-S4
Katoh, K., Standley, D.M., 2013. MAFFT multiple sequence alignment software version 7:
Improvements in performance and usability. Mol. Biol. Evol. 30, 772–780.
doi:10.1093/molbev/mst010
Kaul, S., Stach, T., 2010. Ontogeny of the collar cord: Neurulation in the hemichordate
Saccoglossus Kowalevskii. J. Morphol. 271, 1240–1259. doi:10.1002/jmor.10868
Kelemen, O., Convertini, P., Zhang, Z., Wen, Y., Shen, M., Falaleeva, M., Stamm, S., 2013.
Function of alternative splicing. Gene. doi:10.1016/j.gene.2012.07.083
Kiebler, M., Scheiffele, P., Ule, J., 2013. What, where, and when: the importance of post-
transcriptional regulation in the brain. Front. Neurosci. doi:10.1038/nrg3141
Kimmel, C.B., Ballard, W.W., Kimmel, S.R., Ullmann, B., Schilling, T.F., 1995. Stages of
embryonic development of the zebrafish. Dev. Dyn. 203, 253–310.
doi:10.1002/aja.1002030302
Kimmel, C.B., Sepich, D.S., Trevarrow, B., 1988. Development of segmentation in zebrafish.
Development 104 Suppl, 197–207.
Klymkowsky, M.W., Rossi, C.C., Artinger, K.B., 2010. Mechanisms driving neural crest
induction and migration in the zebrafish and Xenopus laevis. Cell Adhes. Migr.
doi:10.4161/cam.4.4.12962
Kuroyanagi, H., Ohno, G., Mitani, S., Hagiwara, M., 2007. The Fox-1 Family and SUP-12
Coordinately Regulate Tissue-Specific Alternative Splicing In Vivo. Mol. Cell. Biol. 27,
8612–8621. doi:10.1128/MCB.01508-07
Labbé, R.M., Irimia, M., Currie, K.W., Lin, A., Zhu, S.J., Brown, D.D.R., Ross, E.J., Voisin, V.,
Bader, G.D., Blencowe, B.J., Pearson, B.J., 2012. A Comparative transcriptomic analysis
reveals conserved features of stem cell pluripotency in planarians and mammals. Stem
Cells 30, 1734–1745. doi:10.1002/stem.1144
Lapraz, F., Besnardeau, L., Lepage, T., 2009. Patterning of the dorsal-ventral axis in
echinoderms: Insights into the evolution of the BMP-chordin signaling network. PLoS
Biol. 7. doi:10.1371/journal.pbio.1000248
Laprise, P., Paul, S.M., Boulanger, J., Robbins, R.M., Beitel, G.J., Tepass, U., 2010. Epithelial
Polarity Proteins Regulate Drosophila Tracheal Tube Size in Parallel to the Luminal

Bibliografía
148
Matrix Pathway. Curr. Biol. 20, 55–61. doi:10.1016/j.cub.2009.11.017
Lev Maor, G., Yearim, A., Ast, G., 2015. The alternative role of DNA methylation in splicing
regulation. Trends Genet. doi:10.1016/j.tig.2015.03.002
Lim, J., Hao, T., Shaw, C., Patel, A.J., Szabo, G., Rual, J.F., Fisk, C.J., Li, N., Smolyar, A., Hill,
D.E., Barabasi, A.L., Vidal, M., Zoghbi, H.Y., 2006. A protein-protein interaction network
for human inherited ataxias and disorders of Purkinje cell degeneration. Cell 125, 801–
814. doi:10.1016/j.cell.2006.03.032
Liscovitch-Brauer, N., Alon, S., Porath, H.T., Elstein, B., Unger, R., Ziv, T., Admon, A.,
Levanon, E.Y., Rosenthal, J.J.C., Eisenberg, E., 2017. Trade-off between Transcriptome
Plasticity and Genome Evolution in Cephalopods. Cell 169, 191–202.e11.
doi:10.1016/j.cell.2017.03.025
Liu, D.W., Hsu, C.H., Tsai, S.M., Hsiao, C. Der, Wang, W.P., 2011. A variant of Fibroblast
growth factor receptor 2 (Fgfr2) regulates left-right asymmetry in Zebrafish. PLoS One 6.
doi:10.1371/journal.pone.0021793
Lowery, L.A., Sive, H., 2004. Strategies of vertebrate neurulation and a re-evaluation of teleost
neural tube formation. Mech. Dev. doi:10.1016/j.mod.2004.04.022
Lu, T.-M., Luo, Y.-J., Yu, J.-K., 2012. BMP and Delta/Notch signaling control the development
of amphioxus epidermal sensory neurons: insights into the evolution of the peripheral
sensory system. Development 139, 2020–2030. doi:10.1242/dev.073833
Mackereth, C.D., 2014. Splicing factor SUP-12 and the molecular complexity of apparent
cooperativity. Worm 3, e991240. doi:10.4161/21624054.2014.991240
Mallinjoud, P., Villemin, J.P., Mortada, H., Espinoza, M.P., Desmet, F.O., Samaan, S., Chautard,
E., Tranchevent, L.C., Auboeuf, D., 2014. Endothelial, epithelial, and fibroblast cells
exhibit specific splicing programs independently of their tissue of origin. Genome Res. 24,
511–521. doi:10.1101/gr.162933.113
Mansfield, J.H., Haller, E., Holland, N.D., Brent, A.E., 2015. Development of somites and their
derivatives in amphioxus, and implications for the evolution of vertebrate somites.
Evodevo 6, 21. doi:10.1186/s13227-015-0007-5
Marchler-Bauer, A., Derbyshire, M.K., Gonzales, N.R., Lu, S., Chitsaz, F., Geer, L.Y., Geer,
R.C., He, J., Gwadz, M., Hurwitz, D.I., Lanczycki, C.J., Lu, F., Marchler, G.H., Song, J.S.,
Thanki, N., Wang, Z., Yamashita, R.A., Zhang, D., Zheng, C., Bryant, S.H., 2015. CDD:
NCBI’s conserved domain database. Nucleic Acids Res. 43, D222–D226.
doi:10.1093/nar/gku1221
Marquez, Y., H??pfler, M., Ayatollahi, Z., Barta, A., Kalyna, M., 2015. Unmasking alternative
splicing inside protein-coding exons defines exitrons and their role in proteome plasticity.

Bibliografía
149
Genome Res. 25, 995–1007. doi:10.1101/gr.186585.114
Martín-Durán, J.M., Janssen, R., Wennberg, S., Budd, G.E., Hejnol, A., 2012. Deuterostomic
development in the protostome Priapulus caudatus. Curr. Biol. 22, 2161–2166.
doi:10.1016/j.cub.2012.09.037
Masselink, W., Cole, N.J., Fenyes, F., Berger, S., Sonntag, C., Wood, A., Nguyen, P.D., Cohen,
N., Knopf, F., Weidinger, G., Hall, T.E., Currie, P.D., 2016. A somitic contribution to the
apical ectodermal ridge is essential for fin formation. Nature 535, 542–546.
doi:10.1038/nature18953
McClay, D.R., 2011. Evolutionary crossroads in developmental biology: sea urchins.
Development 138, 2639–48. doi:10.1242/dev.048967
McCoon, P.E., Blackstone, E., Angerer, R.C., Angerer, L.M., 1998. Sea urchin FGFR muscle-
specific expression: posttranscriptional regulation in embryos and adults. Dev. Biol. 200,
171–81. doi:10.1006/dbio.1998.8943
Merkin, J., Russell, C., Chen, P., Burge, C.B., 2012. Evolutionary dynamics of gene and isoform
regulation in Mammalian tissues. Science 338, 1593–9. doi:10.1126/science.1228186
Merkin, J.J., Chen, P., Alexis, M.S., Hautaniemi, S.K., Burge, C.B., 2015. Origins and impacts
of new Mammalian Exons. Cell Rep. 10, 1993–2006. doi:10.1016/j.celrep.2015.02.058
Miki, T., Bottaro, D.P., Fleming, T.P., Smith, C.L., Burgess, W.H., Chan, a M., Aaronson, S. a,
1992. Determination of ligand-binding specificity by alternative splicing: two distinct
growth factor receptors encoded by a single gene. Proc. Natl. Acad. Sci. U. S. A. 89, 246–
250. doi:10.1073/pnas.89.1.246
Mirsky, a E., Ris, H., 1951. The desoxyribonucleic acid content of animal cells and its
evolutionary significance. J. Gen. Physiol. 34, 451–462. doi:10.1085/jgp.34.4.451
Mistry, N., Harrington, W., Lasda, E., Wagner, E.J., Garcia-Blanco, M. a, 2003. Of urchins and
men: evolution of an alternative splicing unit in fibroblast growth factor receptor genes.
RNA 9, 209–217. doi:10.1261/rna.2470903
Moore, G.P., 1984. The C-value paradox. Bioscience 34, 425–429. doi:10.2307/1309631
Mork, L., Crump, G., 2015. Zebrafish Craniofacial Development. A Window into Early
Patterning, in: Current Topics in Developmental Biology. pp. 235–269.
doi:10.1016/bs.ctdb.2015.07.001
Ner-Gaon, H., Halachmi, R., Savaldi-Goldstein, S., Rubin, E., Ophir, R., Fluhr, R., 2004. Intron
retention is a major phenomenon in alternative splicing in Arabidopsis. Plant J. 39, 877–
885. doi:10.1111/j.1365-313X.2004.02172.x
Niswander, L., Jeffrey, S., Martin, G.R., Tickle, C., 1994. A positive feedback loop coordinates
growth and patterning in the vertebrate limb. Nature 371, 609–612. doi:10.1038/371609a0

Bibliografía
150
Niu, D.K., Jiang, L., 2013. Can ENCODE tell us how much junk DNA we carry in our genome?
Biochem. Biophys. Res. Commun. doi:10.1016/j.bbrc.2012.12.074
Pani, A.M., Mullarkey, E.E., Aronowicz, J., Assimacopoulos, S., Grove, E.A., Lowe, C.J., 2012.
Ancient deuterostome origins of vertebrate brain signalling centres. Nature 483, 289–294.
doi:10.1038/nature10838
Passamaneck, Y.J., Di Gregorio, A., 2005. Ciona intestinalis: Chordate development made
simple. Dev. Dyn. doi:10.1002/dvdy.20300
Pickrell, J.K., Pai, A.A., Gilad, Y., Pritchard, J.K., 2010. Noisy splicing drives mRNA isoform
diversity in human cells. PLoS Genet. 6, 1–11. doi:10.1371/journal.pgen.1001236
Pirvola, U., Spencer-Dene, B., Xing-Qun, L., Kettunen, P., Thesleff, I., Fritzsch, B., Dickson,
C., Ylikoski, J., 2000. FGF/FGFR-2(IIIb) signaling is essential for inner ear
morphogenesis. J Neurosci 20, 6125–6134. doi:20/16/6125 [pii]
Pohl, M., Sakurai, H., Stuart, R.O., Nigam, S.K., 2000. Role of hyaluronan and CD44 in in vitro
branching morphogenesis of ureteric bud cells. Dev. Biol. 224, 312–325.
doi:10.1006/dbio.2000.9783
Poustka, A.J., Kühn, A., Radosavljevic, V., Wellenreuther, R., Lehrach, H., Panopoulou, G.,
2004. On the origin of the chordate central nervous system: Expression of onecut in the
sea urchin embryo. Evol. Dev. 6, 227–236. doi:10.1111/j.1525-142X.2004.04028.x
Price, D.C., Egizi, A., Fonseca, D.M., 2015. The ubiquity and ancestry of insect doublesex. Sci.
Rep. 5, 13068. doi:10.1038/srep13068
Racioppi, C., Kamal, A.K., Razy-Krajka, F., Gambardella, G., Zanetti, L., di Bernardo, D.,
Sanges, R., Christiaen, L.A., Ristoratore, F., 2014. Fibroblast growth factor signalling
controls nervous system patterning and pigment cell formation in Ciona intestinalis. Nat.
Commun. 5, 4830. doi:10.1038/ncomms5830
Raj, B., Blencowe, B.J., 2015. Alternative Splicing in the Mammalian Nervous System: Recent
Insights into Mechanisms and Functional Roles. Neuron 87, 14–27.
doi:10.1016/j.neuron.2015.05.004
Raj, B., Irimia, M., Braunschweig, U., Sterne-Weiler, T., O’Hanlon, D., Lin, Z.Y., Chen, G.I.,
Easton, L.E., Ule, J., Gingras, A.C., Eyras, E., Blencowe, B.J., 2014. A global regulatory
mechanism for activating an exon network required for neurogenesis. Mol. Cell 56, 90–
103. doi:10.1016/j.molcel.2014.08.011
Ransick, A., Davidson, E.H., 2006. cis-regulatory processing of Notch signaling input to the sea
urchin glial cells missing gene during mesoderm specification. Dev. Biol. 297, 587–602.
doi:10.1016/j.ydbio.2006.05.037
Revil, T., Jerome-Majewska, L.A., 2013. During Embryogenesis, Esrp1 Expression Is Restricted

Bibliografía
151
to a Subset of Epithelial Cells and Is Associated With Splicing of a Number of
Developmentally Important Genes. Dev. Dyn. 242, 281–290. doi:10.1002/dvdy.23918
Riera, M., Burguera, D., Garcia-Fernàndez, J., Gonzàlez-Duarte, R., 2013. CERKL Knockdown
Causes Retinal Degeneration in Zebrafish. PLoS One 8.
Riesgo, A., Farrar, N., Windsor, P.J., Giribet, G., Leys, S.P., 2014. The analysis of eight
transcriptomes from all poriferan classes reveals surprising genetic complexity in sponges.
Mol. Biol. Evol. 31, 1102–1120. doi:10.1093/molbev/msu057
Röttinger, E., Besnardeau, L., Lepage, T., 2006. Expression pattern of three putative RNA-
binding proteins during early development of the sea urchin Paracentrotus lividus. Gene
Expr. Patterns 6, 864–872. doi:10.1016/j.modgep.2006.02.006
Rychel, A.L., Smith, S.E., Shimamoto, H.T., Swalla, B.J., 2006. Evolution and development of
the chordates: Collagen and pharyngeal cartilage. Mol. Biol. Evol.
doi:10.1093/molbev/msj055
Sagnol, S., Marchal, S., Yang, Y., Allemand, F., de Santa Barbara, P., 2016. Epithelial Splicing
Regulatory Protein 1 (ESRP1) is a new regulator of stomach smooth muscle development
and plasticity. Dev. Biol. doi:10.1016/j.ydbio.2016.04.015
Sansom, R.S., Gabbott, S.E., Purnell, M.A., 2010. Non-random decay of chordate characters
causes bias in fossil interpretation. Nature 463, 797–800. doi:10.1038/nature08745
Schmitz, J., Brosius, J., 2011. Exonization of transposed elements: A challenge and opportunity
for evolution. Biochimie. doi:10.1016/j.biochi.2011.07.014
Seb??-Pedr??s, A., Irimia, M., del Campo, J., Parra-Acero, H., Russ, C., Nusbaum, C.,
Blencowe, B.J., Ruiz-Trillo, I., 2013. Regulated aggregative multicellularity in a close
unicellular relative of metazoa. Elife 2013. doi:10.7554/eLife.01287
Seshaiah, P., Miller, B., Myat, M.M., Andrew, D.J., 2001. pasilla, the Drosophila Homologue of
the Human Nova-1 and Nova-2 Proteins, Is Required for Normal Secretion in the Salivary
Gland. Dev. Biol. 239, 309–322. doi:10.1006/dbio.2001.0429
Shapiro, I.M., Cheng, A.W., Flytzanis, N.C., Balsamo, M., Condeelis, J.S., Oktay, M.H., Burge,
C.B., Gertler, F.B., 2011. An emt-driven alternative splicing program occurs in human
breast cancer and modulates cellular phenotype. PLoS Genet. 7.
doi:10.1371/journal.pgen.1002218
Sharma, R., Beer, K., Iwanov, K., Schmöhl, F., Beckmann, P.I., Schröder, R., 2015. The single
fgf receptor gene in the beetle Tribolium castaneum codes for two isoforms that integrate
FGF8-and Branchless-dependent signals. Dev. Biol. 402, 264–275.
doi:10.1016/j.ydbio.2015.04.001
Shukla, J.N., Nagaraju, J., 2010. Doublesex: A conserved downstream gene controlled by

Bibliografía
152
diverse upstream regulators. J. Genet. doi:10.1007/s12041-010-0046-6
Simakov, O., Kawashima, T., Marlétaz, F., Jenkins, J., Koyanagi, R., Mitros, T., Hisata, K.,
Bredeson, J., Shoguchi, E., Gyoja, F., Yue, J.-X., Chen, Y.-C., Freeman, R.M., Sasaki, A.,
Hikosaka-Katayama, T., Sato, A., Fujie, M., Baughman, K.W., Levine, J., Gonzalez, P.,
Cameron, C., Fritzenwanker, J.H., Pani, A.M., Goto, H., Kanda, M., Arakaki, N.,
Yamasaki, S., Qu, J., Cree, A., Ding, Y., Dinh, H.H., Dugan, S., Holder, M., Jhangiani,
S.N., Kovar, C.L., Lee, S.L., Lewis, L.R., Morton, D., Nazareth, L. V., Okwuonu, G.,
Santibanez, J., Chen, R., Richards, S., Muzny, D.M., Gillis, A., Peshkin, L., Wu, M.,
Humphreys, T., Su, Y.-H., Putnam, N.H., Schmutz, J., Fujiyama, A., Yu, J.-K., Tagawa, K.,
Worley, K.C., Gibbs, R.A., Kirschner, M.W., Lowe, C.J., Satoh, N., Rokhsar, D.S.,
Gerhart, J., 2015. Hemichordate genomes and deuterostome origins. Nature 527, 459–465.
doi:10.1038/nature16150
Singh, R.K., Xia, Z., Bland, C.S., Kalsotra, A., Scavuzzo, M.A., Curk, T., Ule, J., Li, W.,
Cooper, T.A., 2014. Rbfox2-coordinated alternative splicing of Mef2d and Rock2 controls
myoblast fusion during myogenesis. Mol. Cell 55, 592–603.
doi:10.1016/j.molcel.2014.06.035
Solana, J., Irimia, M., Ayoub, S., Orejuela, M.R., Zywitza, V., Jens, M., Tapial, J., Ray, D.,
Morris, Q., Hughes, T.R., Blencowe, B.J., Rajewsky, N., 2016. Conserved functional
antagonism of CELF and MBNL proteins controls stem cell-specific alternative splicing in
planarians. Elife 5. doi:10.7554/eLife.16797.001
Solek, C.M., Oliveri, P., Loza-Coll, M., Schrankel, C.S., Ho, E.C.H., Wang, G., Rast, J.P., 2013.
An ancient role for Gata-1/2/3 and Scl transcription factor homologs in the development of
immunocytes. Dev. Biol. 382, 280–292. doi:10.1016/j.ydbio.2013.06.019
Stolfi, A., Ryan, K., Meinertzhagen, I.A., Christiaen, L., 2015. Migratory neuronal progenitors
arise from the neural plate borders in tunicates. Nature 527, 371–374.
doi:10.1038/nature15758
Swartz, M.E., Sheehan-Rooney, K., Dixon, M.J., Eberhart, J.K., 2011. Examination of a
palatogenic gene program in zebrafish. Dev. Dyn. 240, 2204–2220.
doi:10.1002/dvdy.22713
Terazawa, K., Satoh, N., 1997. Formation of the chordamesoderm in the amphioxus embryo:
Analysis with Brachyury and fork head/HNF-3 genes. Dev. Genes Evol. 207, 1–11.
doi:10.1007/s004270050086
Thesleff, I., Vaahtokari, A., Partanen, A.M., 1995. Regulation of organogenesis. Common
molecular mechanisms regulating the development of teeth and other organs. Int. J. Dev.
Biol.

Bibliografía
153
Thisse, C., Thisse, B., 2008. High-resolution in situ hybridization to whole-mount zebrafish
embryos. Nat. Protoc. 3, 59–69. doi:10.1038/nprot.2007.514
Tokuoka, M., Imai, K.S., Satou, Y., Satoh, N., 2004. Three distinct lineages of mesenchymal
cells in Ciona intestinalis embryos demonstrated by specific gene expression. Dev. Biol.
274, 211–224. doi:10.1016/j.ydbio.2004.07.007
Tokuoka, M., Satoh, N., Satou, Y., 2005. A bHLH transcription factor gene, Twist-like1, is
essential for the formation of mesodermal tissues of Ciona juveniles. Dev. Biol. 288, 387–
396. doi:10.1016/j.ydbio.2005.09.018
Tolkin, T., Christiaen, L., 2016. Rewiring of an ancestral Tbx1/10-Ebf-Mrf network for
pharyngeal muscle specification in distinct embryonic lineages, bioRxiv.
doi:10.1101/039289
Traunmuller, L., Gomez, A.M., Nguyen, T.-M., Scheiffele, P., 2016. Control of neuronal
synapse specification by a highly dedicated alternative splicing program. Science (80-. ).
352, 982–986. doi:10.1126/science.aaf2397
Tu, Q., Cameron, R.A., Worley, K.C., Gibbs, R.A., Davidson, E.H., 2012. Gene structure in the
sea urchin Strongylocentrotus purpuratus based on transcriptome analysis. Genome Res.
22, 2079–2087. doi:10.1101/gr.139170.112
Turner, N., Grose, R., 2010. Fibroblast growth factor signalling: from development to cancer.
Nat. Rev. Cancer 10, 116–129. doi:10.1038/nrc2780
Underwood, J.G., Boutz, P.L., Dougherty, J.D., Stoilov, P., Black, D.L., 2005. Homologues of
the Caenorhabditis elegans Fox-1 Protein Are Neuronal Splicing Regulators in Mammals.
Mol. Cell. Biol. 25, 10005–10016. doi:10.1128/MCB.25.22.10005-10016.2005
Vainikka, S., Partanen, J., Bellosta, P., Coulier, F., Birnbaum, D., Basilico, C., Jaye, M., Alitalo,
K., 1992. Fibroblast growth factor receptor-4 shows novel features in genomic structure,
ligand binding and signal transduction. EMBO J. 11, 4273–80.
Vernia, S., Edwards, Y.J.K., Han, M.S., Cavanagh-Kyros, J., Barrett, T., Kim, J.K., Davis, R.J.,
2016. An alternative splicing program promotes adipose tissue thermogenesis. Elife 5.
doi:10.7554/eLife.17672
Vuong, C.K., Black, D.L., Zheng, S., 2016. The neurogenetics of alternative splicing. Nat. Rev.
Neurosci. 17, 265–281. doi:10.1038/nrn.2016.27
Wagner, G., 2014. Homology, Genes, and Evolutionary Innovation, Uma {é}tica para quantos?
doi:10.1017/CBO9781107415324.004
Wahl, M.C., Will, C.L., Lührmann, R., 2009. The Spliceosome: Design Principles of a Dynamic
RNP Machine. Cell. doi:10.1016/j.cell.2009.02.009
Wang, E.T., Sandberg, R., Luo, S., Khrebtukova, I., Zhang, L., Mayr, C., Kingsmore, S.F.,
Bibliografía
154
Schroth, G.P., Burge, C.B., 2008. Alternative isoform regulation in human tissue
transcriptomes. Nature 456, 470–476. doi:10.1038/nature07509
Wang, Y., Liu, J., Huang, B.O., Xu, Y.-M., Li, J., Huang, L.-F., Lin, J., Zhang, J., Min, Q.-H.,
Yang, W.-M., Wang, X.-Z., 2015. Mechanism of alternative splicing and its regulation.
Biomed. reports 3, 152–158. doi:10.3892/br.2014.407
Warzecha, C.C., Carstens, R.P., 2012. Complex changes in alternative pre-mRNA splicing play
a central role in the epithelial-to-mesenchymal transition (EMT). Semin. Cancer Biol.
doi:10.1016/j.semcancer.2012.04.003
Warzecha, C.C., Jiang, P., Amirikian, K., Dittmar, K. a, Lu, H., Shen, S., Guo, W., Xing, Y.,
Carstens, R.P., 2010. An ESRP-regulated splicing programme is abrogated during the
epithelial-mesenchymal transition. EMBO J. 29, 3286–3300. doi:10.1038/emboj.2010.195
Warzecha, C.C., Sato, T.K., Nabet, B., Hogenesch, J.B., Carstens, R.P., 2009. ESRP1 and
ESRP2 Are Epithelial Cell-Type-Specific Regulators of FGFR2 Splicing. Mol. Cell 33,
591–601. doi:10.1016/j.molcel.2009.01.025
Warzecha, C.C., Shen, S., Xing, Y., Carstens, R.P., 2009. The epithelial splicing factors ESRP1
and ESRP2 positively and negatively regulate diverse types of alternative splicing events.
RNA Biol. 6, 546–562. doi:10.4161/rna.6.5.9606
Westerfield, M., 2007. The Zebrafish Book. A Guide for the Laboratory Use of Zebrafish (Danio
rerio), 5th Edition. Univ. Oregon Press. Eugene.
Yang, Y., Park, J.W., Bebee, T.W., Warzecha, C.C., Guo, Y., Shang, X., Xing, Y., Carstens, R.P.,
2016. Determination of a Comprehensive Alternative Splicing Regulatory Network and
Combinatorial Regulation by Key Factors during the Epithelial-to-Mesenchymal
Transition. Mol Cell Biol 36, 1704–1719. doi:10.1128/MCB.00019-16
Yao, Y., Minor, P.J., Zhao, Y.-T., Jeong, Y., Pani, A.M., King, A.N., Symmons, O., Gan, L.,
Cardoso, W. V, Spitz, F., Lowe, C.J., Epstein, D.J., 2016. Cis-regulatory architecture of a
brain signaling center predates the origin of chordates. Nat. Genet. 48.
doi:10.1038/ng.3542
Zeller, R., López-Ríos, J., Zuniga, A., 2009. Vertebrate limb bud development: moving towards
integrative analysis of organogenesis. Nat. Rev. Genet. 10, 845–858. doi:10.1038/nrg2681
Zhang, C., Frias, M.A., Mele, A., Ruggiu, M., Eom, T., Marney, C.B., Wang, H., Licatalosi,
D.D., Fak, J.J., Darnell, R.B., 2010. Integrative Modeling Defines the Nova Splicing-
Regulatory Network and Its Combinatorial Controls. Science (80-. ). 329, 439–443.
doi:10.1126/science.1191150
Zhao, Y., Liu, J., Yang, C., Capraro, B., Baumgart, T., Bradley, R., Ramakrishnan, N., Xu, X.,
Radhakrishnan, R., Svitkina, T., Guo, W., 2013. Exo70 generates membrane curvature for

Bibliografía
155
morphogenesis and cell migration. Dev. Cell 26, 266–278.
doi:10.1016/j.devcel.2013.07.007
Zhou, H.L., Luo, G., Wise, J.A., Lou, H., 2014. Regulation of alternative splicing by local
histone modifications: Potential roles for RNA-guided mechanisms. Nucleic Acids Res.
42, 701–713. doi:10.1093/nar/gkt875


ANEXO


Artículo anexo 1


Contrasting 5’ and 3’ Evolutionary Histories and FrequentEvolutionary Convergence in Meis/hth Gene Structures
Manuel Irimia*,�,§,1,2, Ignacio Maeso�,§,1, Demian Burguera1,§, Matıas Hidalgo-Sanchez3, Luis Puelles4,Scott W. Roy2, Jordi Garcia-Fernandez1, and Jose Luis Ferran4
1Department of Genetics, School of Biology, University of Barcelona, Barcelona, Spain2Department of Biology, Stanford University, Stanford, California3Department of Cell Biology, School of Science, University of Extremadura, Badajoz, Spain4Department of Human Anatomy and Psychobiology, School of Medicine, University of Murcia, Murcia, Spain
�Present address: Banting and Best Department of Medical Research, Donnelly Centre, University of Toronto, Toronto, Ontario, Canada
�Present address: Department of Zoology, University of Oxford, South Parks Road, Oxford, OX1 3PS, UK
§These authors contributed equally to this work
*Corresponding author: E-mail: [email protected]; [email protected]; [email protected]; [email protected].
Accepted: 4 June 2011
Abstract
Organisms show striking differences in genome structure; however, the functional implications and fundamental forces that
govern these differences remain obscure. The intron–exon organization of nuclear genes is involved in a particularly largevariety of structures and functional roles. We performed a 22-species study of Meis/hth genes, intron-rich homeodomain-
containing transcription factors involved in a wide range of developmental processes. Our study revealed three surprising results
that suggest important and very different functions for Meis intron–exon structures. First, we find unexpected conservation
across species of intron positions and lengths along most of the Meis locus. This contrasts with the high degree of structural
divergence found in genome-wide studies and may attest to conserved regulatory elements residing within these conserved
introns. Second, we find very different evolutionary histories for the 5# and 3# regions of the gene. The 5#-most 10 exons,
which encode the highly conserved Meis domain and homeodomain, show striking conservation. By contrast, the 3# of the
gene, which encodes several domains implicated in transcriptional activation and response to cell signaling, shows a remarkablyactive evolutionary history, with diverse isoforms and frequent creation and loss of new exons and splice sites. This region-
specific diversity suggests evolutionary ‘‘tinkering,’’ with alternative splicing allowing for more subtle regulation of protein
function. Third, we find a large number of cases of convergent evolution in the 3# region, including 1) parallel losses of
ancestral coding sequence, 2) parallel gains of external and internal splice sites, and 3) recurrent truncation of C-terminal
coding regions. These results attest to the importance of locus-specific splicing functions in differences in structural evolution
across genes, as well as to commonalities of forces shaping the evolution of individual genes along different lineages.
Key words: intron–exon structures, alternative splicing, homeobox transcription factors, convergent evolution.
Introduction
Intron–exon structures are highly variable both between and
within species. Within metazoans, some species such as hu-
mans have an average of ;9 introns per gene, whereas
others, such as flies, have nearly three times less (Roy and
Irimia 2009b). A large number of genome-wide interspecies
comparisons of intron–exon structures have revealed the
history of change and stasis in intron–exon structures under-
lying these differences. Modern differences largely reflect
orders-of-magnitude differences in the rates of intron
creation and loss between species (Roy and Penny 2006).At one extreme, orthologous genes from deeply diverged
species including vertebrates, the cnidarian Nematostella,
and the placozoan Trichoplax have nearly identical intro-
n–exon structures within conserved coding regions, indicat-
ing a striking dearth of intron creation and loss changes
across hundreds of millions of years (Roy et al. 2003;
Coulombe-Huntington and Majewski 2007a; Putnam
et al. 2007; Srivastava et al. 2008). At the other extreme,
ª The Author(s) 2011. Published by Oxford University Press on behalf of the Society for Molecular Biology and Evolution.
This is an Open Access article distributed under the terms of the Creative Commons Attribution Non-Commercial License (http://creativecommons.org/licenses/by-nc/
2.5), which permits unrestricted non-commercial use, distribution, and reproduction in any medium, provided the original work is properly cited.
Genome Biol. Evol. 3:551–564. doi:10.1093/gbe/evr056 Advance Access publication June 16, 2011 551
GBE

intron positions in lineages such as urochordates andCaenorhabditis nematodes only rarely correspond to intron
positions in other lineages, indicating wholesale intron loss
and gain (Seo et al. 2001; Rogozin et al. 2003; Edvardsen
et al. 2004; Coulombe-Huntington and Majewski 2007b;
Putnam et al. 2008).
While powerful for understanding general evolutionary
trends, such studies may overlook differences in evolution-
ary mode between different genes or different intronswithin the same species. Intron–exon structures vary dra-
matically across genes: within humans, intron numbers
range from hundreds of intronless genes to the 363-exon
TITIN gene (Bang et al. 2001), and intron lengths span four
orders-of-magnitude (from ;100 bp to ;1 Mbp). It is
known that splicing encodes a large number of locus-
specific functions (production of specific alternative tran-
scripts, regulation of specific genes by production of steriletranscripts by splicing, etc. [e.g., Schmucker et al. 2000;
Irimia et al. 2010]); as such, intron function and level of dis-
pensability is likely to vary considerably across genes and
introns within the same species. Systematic evolutionary dif-
ferences have also been observed, often related to transcript
position. For instance, in some species, the first (5#-most)
intron within a coding sequence tends to be longer, and
to exhibit more interspecific sequence conservation, consis-tent with greater frequencies of functional elements
(Bergman and Kreitman 2001; Marais et al. 2005; Hughes
et al. 2008). Striking differences in the incidence and lengths
of introns are also observed between translated and un-
translated regions of genes (Hong et al. 2006; Scofield
et al. 2007; Hughes et al. 2008), also suggesting different
evolutionary dynamics in different classes of introns. How-
ever, genome-wide studies tend to average across introns ofdifferent modes and levels of functionality, perhaps inaccu-
rately sketching a portrait of intron evolution as a largely
stochastic and random process.
Here, we employ an alternative approach, using
many-species studies of an individual gene family to try
to discern commonalities of evolution across species and dif-
ferences between introns within the same genome. We
studied myeloid ecotropic viral integration site homologue(Meis) genes (Moskow et al. 1995, called homothorax[hth] in Drosophila [Rieckhof et al. 1997]). In contrast to
most homeobox genes, which contain one or no introns,
Meis genes contain 10 or 11 introns in most metazoans.
Meis are deeply conserved homeodomain-containing tran-
scription factors of the TALE (three-amino acid loop exten-
sion) superclass, involved in a wide variety biological
processes, ranging from hematopoiesis (Hisa et al. 2004;Azcoitia et al. 2005) to limb development and regeneration
(Mercader et al. 1999; Mercader et al. 2005). Meis1 and
Meis2 have overlapping but distinct dynamic expression do-
mains in the developing central nervous system, related to
patterning of the developing telencephalon (Toresson et al.
2000), pretectum (Ferran et al. 2007), and hindbrain (Dibneret al. 2001; Choe et al. 2002; Wassef et al. 2008). In
Drosophila, hth has also been implicated in several biological
processes, some of them in common with vertebrates (Pai
et al. 1998; Mercader et al. 1999).
Most vertebrates contain three paralogs of Meis(Nakamura et al. 1996; Sanchez-Guardado et al. 2011), dat-
ing to the two rounds of whole-genome duplication (WGD)
at the base of vertebrates (Dehal and Boore 2005; Putnamet al. 2008). Adding to MEIS protein diversity, Meis genes
have been shown to be alternatively spliced. For instance,
exon ‘‘12a’’ of the vertebrate Meis1 gene is alternatively
spliced: the Meis1A isoform contains exon 12a (fig. 1A),
but the Meis1B isoform does not, leading to an alternative
C-terminus, encoded by the downstream exon 12b, and to
higher transcriptional activator capacities than both
Meis1A- and the Meis-related pknox1 gene, especially in re-sponse to protein kinase A (PKA) and TrichostatinA (TSA)
(Maeda et al. 2001; Huang et al. 2005). Alternative splicing
(AS) of exons homologous to 12a, as well as other AS
events, have been reported for the Meis2 and Meis3 genes
in vertebrates (Oulad-Abdelghani et al. 1997; Yang et al.
2000; Williams et al. 2005; Shim et al. 2007; Hyman-Walsh
et al. 2010; Sanchez-Guardado et al. 2011).
Here we investigate the evolution of intron–exon struc-tures and AS of Meis genes across metazoans. We find very
different evolutionary histories for the 5# and 3# regions of
the gene. Intron–exon structures of the 5#-most region, cor-
responding to the first ;1,000 nt of the coding sequence,
are highly similar across species, with the positions and rel-
ative sizes of the first 9 intron positions being highly
conserved across studied species. Unexpectedly, this conser-
vation extends to metazoan groups with intron–exon struc-tures that are generally very divergent, such as flies,
nematodes and tunicates, suggesting functional constraints
opposing intron loss. On the other hand, the C-terminal
coding regions exhibit a complex and surprising history
marked by creation and loss of introns and exons, gain
and loss of AS of various gene regions, and a remarkable
variety of cases of parallel evolution at the levels of genome,
gene transcripts, and gene function. These differences in theevolution of intron–exon structures and splicing across Meisgenes are likely to reflect, at least in part, qualitatively dif-
ferent protein and regulatory functions encoded by different
genic regions. These results underscore the utility of many-
species studies for understanding the functional genomics
of introns and splicing.
Materials and Methods
Genome Sources and Gene Annotation
We used the following genome sequence assemblies and
expression data (expressed sequence tags [ESTs]) from the
following sources: Trichoplax adhaerens Grell-BS-1999
Irimia et al. GBE
552 Genome Biol. Evol. 3:551–564. doi:10.1093/gbe/evr056 Advance Access publication June 16, 2011

FIG. 1.—Evolution of the intron–exon structures of the C-termini of Meis/hth. (A) Schematic representation of the intron–exon structure of
a prototypical vertebrate Meis gene. The conserved long size of introns 6–9 are indicated by a double slash. Homologous coding regions (exons) in the
3# are indicated by colors: 10 (dark blue), 10# (light blue), 11 (red), 12a (light green), and 12b (dark green). (B) Diversity of intron–exon structures of exons
10–12b in metazoans. The different genomic gains (þ) and losses (�) of regions or splice sites (5# splice site (SS) or 3# ss, colored according to the exon),
assuming parsimony, are indicated in the branches of the schematic tree on the left-hand side. Solid vertical bars between colors represent a conserved 5# ss,
and GC 5# ss are indicated above each line. Asterisks represent termination codons and gray blocks indicate UTR exons. Split gray/colored boxes
Evolution of Meis Gene Structures in Metazoans GBE
Genome Biol. Evol. 3:551–564. doi:10.1093/gbe/evr056 Advance Access publication June 16, 2011 553

v1.0 (Srivastava et al. 2008), N. vectensis v1.0 (Putnam et al.2007), Branchiostoma floridae v1.0 (Putnam et al. 2008),
Ciona intestinalis v2.0 and v1.0 (Dehal et al. 2002), Takifugurubripes v4.0, Xenopus tropicalis v4.1 (Hellsten et al. 2010),
Daphnia pulex v1.0, Helobdella robusta v1.0, Lottia gigan-tea v1.0 and Capitella teleta v1.0, at DOE Joint Genome In-
stitute (JGI) Web page (http://genome.jgi-psf.org/
euk_home.html), and of Strongylocentrotus purpuratusBuild 2.1 (Sea Urchin Genome Sequencing Consortiumet al. 2006), Apis mellifera Amel_4.0, Tribolium castaneumBuild 2.1 (Tribolium Genome Sequencing Consortium et al.
2008), Drosophila melanogaster Build Fb5.3 (Adams et al.
2000), Danio rerio Zv8, Gallus gallus v2.1 (Chicken Genome
Sequencing Consortium 2004), Anolis carolinensisAnoCar1.0, Homo sapiens Build GRCh37 (Lander et al.
2001; Venter et al. 2001), Mus musculus Build 37.1
(Waterston et al. 2002), and Acyrtosiphon pisum Build1.1, at the NCBI Web page (http://www.ncbi.nlm.nih.gov/
blast/Blast.cgi) and/or Ensembl Web page (http://www.
ensembl.org), Trichinella spiralis at the NCBI Web page for un-
finished eukaryotic genomes (http://www.ncbi.nlm.nih.gov/
sutils/genom_table.cgi?organism5eukaryotes), Brugia malayiBMA1 (Ghedin et al. 2007) at TIGR Web page (http://blast.
jcvi.org/er-blast/index.cgi?project5bma1), Caenorhabditiselegans WS213 (Caenorhabditis elegans SequencingConsortium1998) atWormBase (http://www.wormbase.org),
and Saccoglossus kowalevskii 09 December 2008 scaffolds
at HGSC Baylor College of Medicine Web page
(http://blast.hgsc.bcm.tmc.edu/blast.hgsc?organism520).
Additional sequences from arthropods without available
genome resources (those included in supplementary fig. S1)
were retrieved through TBlastN searches against the nucleo-
tide collection database at the NCBI Web page. In more poorlyannotated genomes, Meis candidates were searched by
TBlastN and gene annotation was then performed by down-
loading the whole associated genomic region and identifying
each exon by mapping available expression data and/or by
similarity of sequence using ClustalW and Blast2seq. Available
automatic gene predictions were also used. Combining the
different sources of data, most exon boundaries could be
determined unambiguously (supplementary table S1). Intronsand exons were named following the vertebrate nomencla-
ture (exons 12 and 13 were named 12a and 12b [Sanchez-
Guardado et al. 2011] and insect-specific exons between an-
cestral exons 7 and 8 were not counted [supplementary
fig. S1]). Intron–exon structures of the 5’ untranslated regions
(UTRs) are not described here due to the lack of expression
data for most species and difficulty to assess intron position
conservation in noncoding sequences over long phylogeneticranges.
Median, average and average excluding the top 5%
intron lengths and intergenic distances (supplementary ta-
ble S2) were calculated for each genome using custom Perl
scripts on GTF (Ensemble), GFF (JGI), or GBK (NCBI) files or
obtained from Irimia, Maeso, and Garcia-Fernandez (2008).
Phylogenetic Analyses
Meis/hth protein sequences from multiple species were
aligned using MAFFT (Katoh et al. 2002, 2005) as imple-
mented in Jalview 2.4 (Waterhouse et al. 2009), and the
alignments were manually curated by using informationon intron positions (Irimia and Roy 2008). Two different phy-
logenetic analyses were performed. First, to establish orthol-
ogy of all studied Meis/hth genes, we used an alignment
containing only the highly conserved Meis and Homeobox
domains and including several Meis-related pknox proteins
as outgroups (supplementary fig. S2A). Second, to allow
confident assignment of paralogy relationships within
vertebrates, the number of positions included in the align-ment was increased using the whole protein sequence
(except exon 1 and the alternatively spliced 3# regions
[exons 10# to 12b]), and fast-evolving species were excluded
(supplementary fig. S2B). Phylogenetic trees were
generated by the Bayesian method with MrBayes 3.1.2
(Huelsenbeck and Ronquist 2001; Ronquist and
Huelsenbeck 2003) using two independent runs (each with
four chains). Model selection using ProtTest (Drummondand Strimmer 2001; Guindon and Gascuel 2003; Abascal
et al. 2005), convergence determination, burn-in, and con-
sensus tree calculations were done as previously described
(D’Aniello et al. 2008).
cDNA Samples and Reverse Transcription–Polymerase Chain Reaction of Alternative SplicingEvents
RNA from adult and/or embryonic vertebrate (D. rerio,
X. tropicalis, A. carolinensis, G. gallus, and M. musculus)tissues and different amphioxus (B. lanceolatum) develop-mental stages was extracted using RNeasy Mini Kit (Qiagen),
and retrotranscriptions were done using SuperScript III Re-
verse Transcriptase (Invitrogen), according to manufacturer.
One A. carolinensis adult animal was bought in a local pet
shop. All animals were sacrificed following standard and
ethically approved procedures by the European Union and
the Spanish government for laboratory animals.
indicate regions that are either translated or 3#UTR depending on splice form. (C) Sequence alignment for some representative bilaterians and the two non-
bilaterians showing sequence conservation at each exon. Within the boxes, ‘‘1’’ indicates a phase 1 intron, and an asterisk represents absence of an intron at
that position. Highlighted positions correspond to 60% of similar amino acid types across studied genes, as generated by BioEdit.
Irimia et al. GBE
554 Genome Biol. Evol. 3:551–564. doi:10.1093/gbe/evr056 Advance Access publication June 16, 2011

For reverse transcription–polymerase chain reaction(RT-PCR) analyses, we designed two sets of primers for each
gene in each studied species (S. purpuratus, B. lanceolatum,
D. rerio, X. tropicalis, A. carolinensis, G. gallus, and M. mus-culus). The first set spans exons 10, 10#, and 11 and the
second one exons 11, 12a (when present), and12b, to yield
all isoforms of the 3# region present in the studied set of
tissues. All primer sequences are provided in supplementary
table S3. RT-PCR were done trying to minimize the numberof cycles and at least 3# of elongation to diminish the
PCR bias for short isoforms (Rukov et al. 2007), except
for those probing exon 10# inclusion (supplementary
fig. S3), for which we used 36 cycles in each of two rounds
of amplification.
Results
Meis Gene Complements in Metazoans
We studied 7 vertebrate and 15 invertebrate genomes,
spanning all major metazoan clades (deuterostomes, proto-
stomes, lophotrochozoans, and non-bilaterians). In most
studied invertebrates, we found only 1 Meis/hth ortholog,
including the basal branching non-bilaterians T. adhaerensand N. vectensis. However, we found four Meis genes in the
lophotrochozoan H. robusta; in addition, two paralogs have
been described in two distantly related spiders (Prpic et al.
2003; Pechmann and Prpic 2009), Cupiennius salei and
Acanthoscurria geniculata, for which full genome sequen-
ces are not yet available. Among vertebrates, Meis
FIG. 2.—Evolution of intron–exon structures and alternative splicing of the 3# end of vertebrate Meis genes. Diversity of intron–exon structures of
exons 10–12b in vertebrates. The different genomic gains (þ) and losses (�) of regions, assuming parsimony, are indicated in the branches of the
schematic tree on the left-hand side. Solid vertical bars between colors represent a conserved 5# splice site (SS), and GC 5# ss are indicated above each
line. Asterisks represent termination codons and gray blocks indicate UTR exons. Split gray/colored boxes indicate regions that are either translated or 3#
UTR depending on splice form. RT-PCR results for each event are shown on the right-hand side.
Evolution of Meis Gene Structures in Metazoans GBE
Genome Biol. Evol. 3:551–564. doi:10.1093/gbe/evr056 Advance Access publication June 16, 2011 555
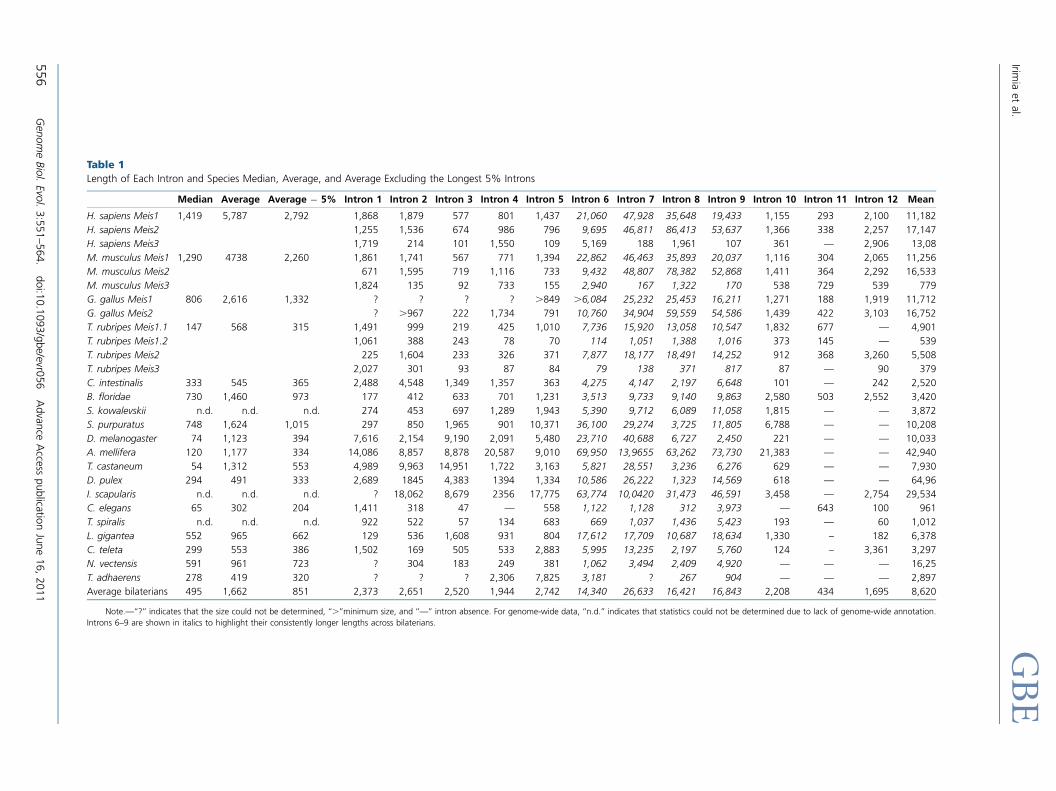
Table 1
Length of Each Intron and Species Median, Average, and Average Excluding the Longest 5% Introns
Median Average Average � 5% Intron 1 Intron 2 Intron 3 Intron 4 Intron 5 Intron 6 Intron 7 Intron 8 Intron 9 Intron 10 Intron 11 Intron 12 Mean
H. sapiens Meis1 1,419 5,787 2,792 1,868 1,879 577 801 1,437 21,060 47,928 35,648 19,433 1,155 293 2,100 11,182
H. sapiens Meis2 1,255 1,536 674 986 796 9,695 46,811 86,413 53,637 1,366 338 2,257 17,147
H. sapiens Meis3 1,719 214 101 1,550 109 5,169 188 1,961 107 361 — 2,906 13,08
M. musculus Meis1 1,290 4738 2,260 1,861 1,741 567 771 1,394 22,862 46,463 35,893 20,037 1,116 304 2,065 11,256
M. musculus Meis2 671 1,595 719 1,116 733 9,432 48,807 78,382 52,868 1,411 364 2,292 16,533
M. musculus Meis3 1,824 135 92 733 155 2,940 167 1,322 170 538 729 539 779
G. gallus Meis1 806 2,616 1,332 ? ? ? ? .849 .6,084 25,232 25,453 16,211 1,271 188 1,919 11,712
G. gallus Meis2 ? .967 222 1,734 791 10,760 34,904 59,559 54,586 1,439 422 3,103 16,752
T. rubripes Meis1.1 147 568 315 1,491 999 219 425 1,010 7,736 15,920 13,058 10,547 1,832 677 — 4,901
T. rubripes Meis1.2 1,061 388 243 78 70 114 1,051 1,388 1,016 373 145 — 539
T. rubripes Meis2 225 1,604 233 326 371 7,877 18,177 18,491 14,252 912 368 3,260 5,508
T. rubripes Meis3 2,027 301 93 87 84 79 138 371 817 87 — 90 379
C. intestinalis 333 545 365 2,488 4,548 1,349 1,357 363 4,275 4,147 2,197 6,648 101 — 242 2,520
B. floridae 730 1,460 973 177 412 633 701 1,231 3,513 9,733 9,140 9,863 2,580 503 2,552 3,420
S. kowalevskii n.d. n.d. n.d. 274 453 697 1,289 1,943 5,390 9,712 6,089 11,058 1,815 — — 3,872
S. purpuratus 748 1,624 1,015 297 850 1,965 901 10,371 36,100 29,274 3,725 11,805 6,788 — — 10,208
D. melanogaster 74 1,123 394 7,616 2,154 9,190 2,091 5,480 23,710 40,688 6,727 2,450 221 — — 10,033
A. mellifera 120 1,177 334 14,086 8,857 8,878 20,587 9,010 69,950 13,9655 63,262 73,730 21,383 — — 42,940
T. castaneum 54 1,312 553 4,989 9,963 14,951 1,722 3,163 5,821 28,551 3,236 6,276 629 — — 7,930
D. pulex 294 491 333 2,689 1845 4,383 1394 1,334 10,586 26,222 1,323 14,569 618 — — 64,96
I. scapularis n.d. n.d. n.d. ? 18,062 8,679 2356 17,775 63,774 10,0420 31,473 46,591 3,458 — 2,754 29,534
C. elegans 65 302 204 1,411 318 47 — 558 1,122 1,128 312 3,973 — 643 100 961
T. spiralis n.d. n.d. n.d. 922 522 57 134 683 669 1,037 1,436 5,423 193 — 60 1,012
L. gigantea 552 965 662 129 536 1,608 931 804 17,612 17,709 10,687 18,634 1,330 – 182 6,378
C. teleta 299 553 386 1,502 169 505 533 2,883 5,995 13,235 2,197 5,760 124 – 3,361 3,297
N. vectensis 591 961 723 ? 304 183 249 381 1,062 3,494 2,409 4,920 — — — 16,25
T. adhaerens 278 419 320 ? ? ? 2,306 7,825 3,181 ? 267 904 — — — 2,897
Average bilaterians 495 1,662 851 2,373 2,651 2,520 1,944 2,742 14,340 26,633 16,421 16,843 2,208 434 1,695 8,620
Note.—‘‘?’’ indicates that the size could not be determined, ‘‘.’’minimum size, and ‘‘—’’ intron absence. For genome-wide data, ‘‘n.d.’’ indicates that statistics could not be determined due to lack of genome-wide annotation.
Introns 6–9 are shown in italics to highlight their consistently longer lengths across bilaterians.
Irimia
etal.
GBE
556
Gen
omeBiol.Evo
l.3:5
51–5
64.
doi:1
0.1
093/g
be/evr0
56
Advan
ceA
ccesspublicatio
nJu
ne
16,
2011
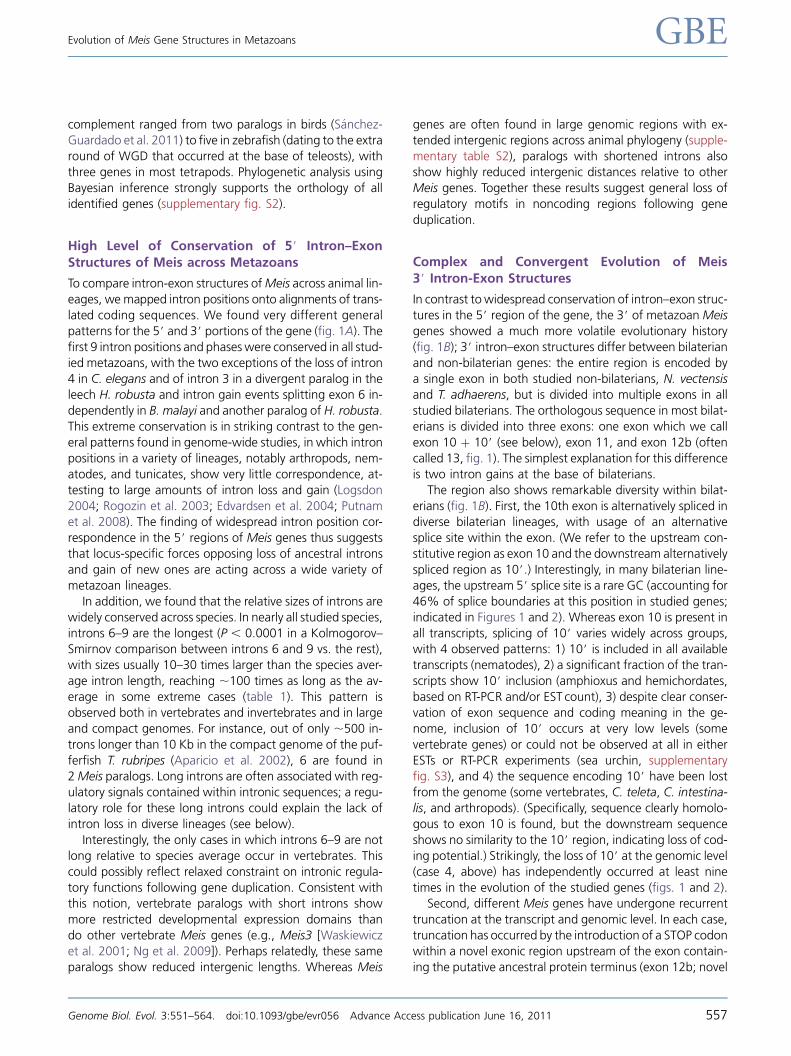
complement ranged from two paralogs in birds (Sanchez-Guardado et al. 2011) to five in zebrafish (dating to the extra
round of WGD that occurred at the base of teleosts), with
three genes in most tetrapods. Phylogenetic analysis using
Bayesian inference strongly supports the orthology of all
identified genes (supplementary fig. S2).
High Level of Conservation of 5# Intron–ExonStructures of Meis across Metazoans
To compare intron-exon structures of Meis across animal lin-
eages, we mapped intron positions onto alignments of trans-
lated coding sequences. We found very different general
patterns for the 5# and 3# portions of the gene (fig. 1A). The
first 9 intron positions and phases were conserved in all stud-
ied metazoans, with the two exceptions of the loss of intron
4 in C. elegans and of intron 3 in a divergent paralog in theleech H. robusta and intron gain events splitting exon 6 in-
dependently in B. malayi and another paralog of H. robusta.
This extreme conservation is in striking contrast to the gen-
eral patterns found in genome-wide studies, in which intron
positions in a variety of lineages, notably arthropods, nem-
atodes, and tunicates, show very little correspondence, at-
testing to large amounts of intron loss and gain (Logsdon
2004; Rogozin et al. 2003; Edvardsen et al. 2004; Putnamet al. 2008). The finding of widespread intron position cor-
respondence in the 5# regions of Meis genes thus suggests
that locus-specific forces opposing loss of ancestral introns
and gain of new ones are acting across a wide variety of
metazoan lineages.
In addition, we found that the relative sizes of introns are
widely conserved across species. In nearly all studied species,
introns 6–9 are the longest (P , 0.0001 in a Kolmogorov–Smirnov comparison between introns 6 and 9 vs. the rest),
with sizes usually 10–30 times larger than the species aver-
age intron length, reaching ;100 times as long as the av-
erage in some extreme cases (table 1). This pattern is
observed both in vertebrates and invertebrates and in large
and compact genomes. For instance, out of only ;500 in-
trons longer than 10 Kb in the compact genome of the puf-
ferfish T. rubripes (Aparicio et al. 2002), 6 are found in2 Meis paralogs. Long introns are often associated with reg-
ulatory signals contained within intronic sequences; a regu-
latory role for these long introns could explain the lack of
intron loss in diverse lineages (see below).
Interestingly, the only cases in which introns 6–9 are not
long relative to species average occur in vertebrates. This
could possibly reflect relaxed constraint on intronic regula-
tory functions following gene duplication. Consistent withthis notion, vertebrate paralogs with short introns show
more restricted developmental expression domains than
do other vertebrate Meis genes (e.g., Meis3 [Waskiewicz
et al. 2001; Ng et al. 2009]). Perhaps relatedly, these same
paralogs show reduced intergenic lengths. Whereas Meis
genes are often found in large genomic regions with ex-tended intergenic regions across animal phylogeny (supple-
mentary table S2), paralogs with shortened introns also
show highly reduced intergenic distances relative to other
Meis genes. Together these results suggest general loss of
regulatory motifs in noncoding regions following gene
duplication.
Complex and Convergent Evolution of Meis3# Intron-Exon Structures
In contrast to widespread conservation of intron–exon struc-
tures in the 5# region of the gene, the 3# of metazoan Meisgenes showed a much more volatile evolutionary history
(fig. 1B); 3# intron–exon structures differ between bilaterian
and non-bilaterian genes: the entire region is encoded by
a single exon in both studied non-bilaterians, N. vectensisand T. adhaerens, but is divided into multiple exons in all
studied bilaterians. The orthologous sequence in most bilat-
erians is divided into three exons: one exon which we call
exon 10 þ 10# (see below), exon 11, and exon 12b (often
called 13, fig. 1). The simplest explanation for this difference
is two intron gains at the base of bilaterians.
The region also shows remarkable diversity within bilat-
erians (fig. 1B). First, the 10th exon is alternatively spliced indiverse bilaterian lineages, with usage of an alternative
splice site within the exon. (We refer to the upstream con-
stitutive region as exon 10 and the downstream alternatively
spliced region as 10#.) Interestingly, in many bilaterian line-
ages, the upstream 5# splice site is a rare GC (accounting for
46% of splice boundaries at this position in studied genes;
indicated in Figures 1 and 2). Whereas exon 10 is present in
all transcripts, splicing of 10# varies widely across groups,with 4 observed patterns: 1) 10# is included in all available
transcripts (nematodes), 2) a significant fraction of the tran-
scripts show 10# inclusion (amphioxus and hemichordates,
based on RT-PCR and/or EST count), 3) despite clear conser-
vation of exon sequence and coding meaning in the ge-
nome, inclusion of 10# occurs at very low levels (some
vertebrate genes) or could not be observed at all in either
ESTs or RT-PCR experiments (sea urchin, supplementaryfig. S3), and 4) the sequence encoding 10# have been lost
from the genome (some vertebrates, C. teleta, C. intestina-lis, and arthropods). (Specifically, sequence clearly homolo-
gous to exon 10 is found, but the downstream sequence
shows no similarity to the 10# region, indicating loss of cod-
ing potential.) Strikingly, the loss of 10# at the genomic level
(case 4, above) has independently occurred at least nine
times in the evolution of the studied genes (figs. 1 and 2).Second, different Meis genes have undergone recurrent
truncation at the transcript and genomic level. In each case,
truncation has occurred by the introduction of a STOP codon
within a novel exonic region upstream of the exon contain-
ing the putative ancestral protein terminus (exon 12b; novel
Evolution of Meis Gene Structures in Metazoans GBE
Genome Biol. Evol. 3:551–564. doi:10.1093/gbe/evr056 Advance Access publication June 16, 2011 557

and ancestral STOPs are indicated by asterisks in figs. 1 and2). 1) In some groups, the inferred ancestral situation has
been maintained, with the terminal exon constitutively en-
coding the STOP codon (C. intestinalis, lophotrochozoans,
some vertebrates, some ecdysozoans). 2) In chordates,
a new alternative STOP-containing exon has arisen by an un-
known mechanism (exon 12a, light green in figs. 1 and 2).
The new exon is alternatively spliced; its inclusion leads to
premature termination, leaving the ancestral exon 12b as3# untranslated region (3# UTR, depicted as half grey). 3)
In Ambulacraria (sea urchin and hemichordates), a new
downstream splice site has evolved for exon 11, which is al-
ternatively spliced. Use of the new 5# splice site introduces
‘‘extra’’ downstream sequence (pink), which includes a new
STOP codon; as in the case of exon 12a the resulting MEIS
protein has a novel C-terminus, and all of exon 12b lies
downstream of the STOP codon as 3# UTR. Interestingly,in sea urchin, the ancestral exon 11 splice site has been lost,
implying constitutive use of the new STOP codon and pro-
tein truncation. RT-PCR analyses throughout the early devel-
opment of sea urchin confirmed that only the new terminal
isoform is expressed (supplementary fig. S3). 4) Finally, in
Pancrustacea (insects and crustaceans [D. pulex]), we found
a situation similar to sea urchin: the termination codon is
located in a downstream extension of exon 11, and no12b coding meaning is recognized in the untranslated
downstream exon. Importantly, in the last three cases (2–
4), the protein sequence, structure, and function of C-ter-
minus of Meis, which harbors the capacities for transcrip-
tional activation and Hox interaction (Yang et al. 2000;
Huang et al. 2005; Williams et al. 2005; Hyman-Walsh
et al. 2010), are likely to be highly modified relative to
the ancestral protein.Other specific molecular elaborations have also evolved in
several lineages (fig. 1B). For instance, the hemichordate
S. kowalevskii shows an additional alternative 5# splice site
within the exon 10# region (i.e., three alternative splice sites
for the same exon 10 þ 10#), producing an exon with an
intermediate length (42 nucleotides less than the entire
10 þ 10# exon). On the other hand, exon 11 in chordates
has evolved a 5# extension of different lengths across speciesby emergence of an alternative upstream 3# splice site,
resulting in an extended alternative coding sequence (pre-
viously described for mammalian Meis2 (Oulad-Abdelghani
et al. 1997)). Similarly, in the lophotrochozoan L. gigantea,
exon 12b has a constitutive (i.e., not alternative) 5# exten-
sion of ;35 codons, consistent with loss of the ancestral 3#splice site and use of a novel upstream site. Finally, nemat-
odes exhibit loss and gain of introns, with loss of the ances-tral phase 1 intron between exons 11 and 12b, and gain of
a new phase 2 intron at a nearby site in a common ancestor
of Trichinella, Brugia, and Caenorhabditis, and subsequent
loss of the intron between exons 10# and 11 in Caenorhab-ditis (fig. 1B). In stark contrast to this 3# diversity, only little
transcriptional variation was found in the 5’ of the gene. ASin insects and vertebrates produce homeodomain-less pro-
teins (which are, indeed, C-terminal truncations) with dis-
tinct functions (Yang et al. 2000; Noro et al. 2006);
similarly, alternative acceptor site choice within exon 6 in
the vertebrate-derived paralog Meis3 results in a protein
without a meis domain (Hyman-Walsh et al. 2010). In addi-
tion, the annelid C. teleta has a mutually exclusive tandem
exon duplication of exon 9 which results in two proteins thatdiffer by only 5 aa substitutions (supplementary table S1),
and insects and arthropods harbor 1–3 lineage-specific
exons between the ancestral exons 7 and 8 (supplementary
fig. S1).
Evolution of Alternative Splicing in Chordate MeisGenes
We next focused on chordates, studying the different AS
events of the 3# regions of Meis genes within 17 genes
in 6 chordate species, both in silico and by RT-PCR (fig. 2)and supplementary figs. S4–6. We designed two sets of pri-
mers, one spanning exons 10, 10#, and 11 and the other
spanning exons 11, (12a), and 12b (see Materials and Meth-
ods), and performed RT-PCRs for all Meis genes from six spe-
cies (amphioxus, zebrafish, X. tropicalis, the anole lizard A.
carolinensis, chicken, and mouse), a total of 34 AS events.
For exon 10þ 10#, we found that exon 10# is included at
very low levels in Meis of different vertebrates, only detect-
able using 10#-specific primers and a high number of PCR
cycles for most species and tissues (supplementary fig. S4,
see Materials and Methods). This is consistent with observa-
tions in human patients (Xiong et al. 2009) and in available
ESTs (27/27 and 6/6 ESTs in humans and mouse shown ex-
clusion of exon 10#). Perhaps relatedly, exon 10# coding
meaning has been lost at the genomic level at least 6 times
in vertebrate Meis genes, including all Meis3 genes, the
Meis2 genes of zebrafish, Xenopus, and mammals, the
Meis1 gene of lizard, the Meis1.2 gene of zebrafish; in ad-
dition, in-frame STOP codons interrupt this region in chicken
Meis2 (fig. 2), suggesting a process of ongoing loss of this
region from the gene.
For exon 11, we observed complex patterns for the 5#extension (orange blocks). This extension with conserved
coding meaning (often 21 nt) is found in a wide variety
of vertebrate genes, suggesting emergence of an alternative
upstream splice site in chordate ancestors. As with exon 10#,the phylogenetic distribution of this alternative splice site is
highly punctate, with 4 parallel losses—in zebrafish
Meis1.1/.2, zebrafish Meis2.1, tetrapod Meis3 (fig. 2),
and C. intestinalis Meis. In addition, although the genomic
sequences of both Meis1 and Meis2 genes contain the po-
tential splice site and conserved coding sequence, use of the
splice site was only observed in Meis2 genes (fig. 2). The fre-
quency of usage in Meis2 is conserved both across species
Irimia et al. GBE
558 Genome Biol. Evol. 3:551–564. doi:10.1093/gbe/evr056 Advance Access publication June 16, 2011

and development (;50% in various vertebrates, andthroughout different tissues of several vertebrate species
[supplementary fig. S5 and Sanchez-Guardado et al.
2011], similar to the pattern in amphioxus [supplementary
fig. S6A]).
For exons 12a/12b, exon 12a shows very high levels of
inclusion in nearly all paralogs of all vertebrate species;
the only exceptions are Xenopus Meis3, which show more
moderate levels of inclusion, and zebrafish and humanMeis3, which have lost the exon entirely (fig. 2 and supple-
mentary fig. S5). Meis1 paralogs seem to have slightly lower
levels of inclusion of exon 12a than Meis2, although the in-
clusion level is still higher than 90% (fig. 2). The high exon
12a inclusion level was found in a wide range of different
tissues in several vertebrate species (supplementary fig.
S5), in accordance with previous reports (Azcoitia et al.
2005; Williams et al. 2005; Sanchez-Guardado et al.2011). Nonetheless, the possibility that a specific cell type
in a particular developmental stage show a different splicing
pattern cannot be ruled out (e.g. (Oulad-Abdelghani et al.
1997)). However, despite the fact that frequent inclusion of
exon 12a may imply only infrequent translation of exon 12b,
the ancestral coding meaning of exon 12b has been highly
conserved in the vast majority of vertebrate Meis genes; the
only exceptions are anole lizard Meis3, which seems to havelost the entire exon, and zebrafish Meis1.2, which has
a much shorter sequence. Interestingly, the basal inverte-
brate chordate amphioxus shows significantly lower levels
of exon 12a inclusion (i.e., higher levels of the ancestral
isoform [supplementary fig. S6B]).
Discussion
We report the broadest evolutionary comparison of splicingdiversity in a homeobox gene family to date. Three aspects
of our 22-species comparison of metazoan Meis genes are
of particular note: 1) conservation of intron positions and
relative sizes across bilaterians, 2) striking differences in di-
versity and evolutionary patterns between the 5# and 3# re-
gions of the gene, suggesting very different functions for
introns and splicing for the two regions, and 3) convergent
evolution of a variety of features of the alternative transcrip-tome of the 3# region, suggesting similar selective forces
acting on gene function across widely diverged species.
These results show the utility of many-species studies for re-
vealing modes of constraint and innovation acting at indi-
vidual intronic loci and suggest a general strategy for
comparative genomic analysis of splicing function.
Intron–Exon Structures and the Conservation-Implies-Function Paradigm
Comparative genomics has contributed a tremendous
amount to our understanding of genome function. Argu-
ably, the most productive paradigm has been ‘‘conservation
implies function’’: in the face of ongoing mutation, only
functional genomic features maintained by purifying selec-tion will be retained over long evolutionary times (although
for exceptions to this paradigm and a contrasting discussion,
see Monroe 2009; Alexander et al. 2010). In the context of
base pair substitutions and other small-scale sequence
mutations, searches for conservation have utilized baseline
mutation rates estimated from rates of changes for various
classes of putatively neutral sites (e.g., synonymous or in-
tronic sites) in order to identify slow-evolving and thus pu-tatively functional sequences. While formally applicable to
FIG. 3.—Summary of previous studies showing the different
functional properties of C-terminal isoforms. (A) Differences in activity
as transcriptional activators between C-terminal isoforms within each
paralogous Meis gene in mammals. Top: histogram showing the ratio
for activity of B (excluding 12a) versus A (including 12a) isoforms. Data
for Meis1 correspond to a protein fusion of the activation domain (AD,
C-terminus) from each of the isoforms. Meis2 data correspond to
comparisons of full-length proteins and averaging the values for
isoforms derived of inclusion/exclusion of exon 11#. Bottom: table
summarizing the phenotypic results after injecting two different
concentrations of full-length Meis1A or Meis1B isoforms in Xenopus
embryos. Note that the intensity of the effect is not only isoform
dependent but also concentration dependent. (B) Different C-terminal
isoforms have different responses to TSA treatment. Histogram showing
the fold-increase in transcriptional activation after TSA treatment for
each Meis1 isoform, Meis2A.2 (excluding 11# but including 12a) and the
related pknox1 gene. References: (1) Huang et al. (2005), (2) Yang et al.
(2000), (3) Maeda et al. (2001), and (4) Shim et al. (2007).
Evolution of Meis Gene Structures in Metazoans GBE
Genome Biol. Evol. 3:551–564. doi:10.1093/gbe/evr056 Advance Access publication June 16, 2011 559

intron–exon structures, this strategy has met with complica-tions in practice. First, there is no clear subset of putatively
neutrally evolving introns; indeed, there is no consensus as
to whether introns are generally beneficial, neutral, or del-
eterious or how the impact of introns on fitness might vary
across lineages (Doolittle 1978; Lynch 2002). Second, the
relevant molecular mutational mechanisms—in particular,
those that lead to intron creation and loss from the ge-
nome—remain obscure and are known to be diverse(Llopart et al. 2002; Roy and Gilbert 2005; Stajich and
Dietrich 2006; Irimia, Rukov, et al. 2008; Li et al. 2009;
Roy and Irimia 2009a; Worden et al. 2009). Third, the ge-
nome-wide near absence of intron loss and gain over many
millions of years in a variety of different groups of eukar-
yotes (e.g., vertebrates, and some genera of apicomplexans
and fungi) suggests the possibility that intron loss and/or
gain mutations simply do not occur in some lineages (Royand Hartl 2006; Roy et al. 2006), in which case evolutionary
conservation would not imply function.
The availability of many full genomes from diverse species
allows us to circumvent these obstacles, at least in part.
Here, we report the case of Meis homeobox genes. In con-
trast to the large amounts of intron loss and gain in some
animal species observed in genome-wide comparisons (Seo
et al. 2001; Rogozin et al. 2003; Edvardsen et al. 2004; Cou-lombe-Huntington and Majewski 2007b; Putnam et al.
2008), Meis genes have experienced almost no intron loss
or gain in any studied species, particularly within the first ten
exons of the gene. Unexpected conservation extends to the
size of conserved introns: although intron size is thought to
be relatively labile and not to persist over long evolutionary
distances, Meis genes show clear conservation of relative in-
tron sizes across genomically diverse species. Interestingly,long introns are known to show higher sequence conserva-
tion than short introns (Bergman and Kreitman 2001; Parsch
2003; Haddrill et al. 2005; Marais et al. 2005; Halligan and
Keightley 2006; Parsch et al. 2010). The negative correlation
between intron length and sequence divergence holds even
within the set of longest introns, suggesting that the density
of conserved sequence elements within introns may in-
crease with intron length (Halligan and Keightley 2006).Thus, one possible explanation for the conserved long in-
trons in Meis/hth is that they contain regulatory elements
important for gene expression (Bergman and Kreitman
2001). Meis/hth genes are known to harbor the largest
(or one of the largest) sets of associated highly conserved
noncoding regions (HCNRs) in both vertebrates and in flies
(Sandelin et al. 2004; Woolfe et al. 2005; Engstrom et al.
2007), with nearly a hundred associated HCNRs, dependingon the study. Many of these HCNRs lie within these long in-
trons (Engstrom et al. 2007; Visel et al. 2007; Dong et al.
2009; Xiong et al. 2009) and, in some cases, show even
higher sequence conservation than the surrounding coding
exons (Engstrom et al. 2007). Importantly, some of these el-
ements have been shown to drive positive enhancer expres-sion in reporter assays in mammals (Visel et al. 2007) or even
to be involved in posttranscriptional regulation in dipterans
(Glazov et al. 2005). Together, the conservation at the levels
of intron loss/gain and intron size suggests that the introns
in the 5# region of Meis could encode conserved regulatory
functions, leading to their retention across metazoans. Inter-
estingly, the notion of Meis genes as hot spots for long-scale
regulatory landscapes could extend beyond the transcribedregions: we also found that Meis genes are associated with
large intergenic regions devoid of other genes (i.e., gene de-
serts) upstream and/or downstream Meis/hth genes in all
studied metazoans (supplementary table S2), with the ex-
ceptions of some vertebrate Meis paralogs discussed above.
As with intron lengths, longer intergenic regions are known
to show less sequence divergence across species (Halligan
and Keightley 2006).
Very Different Evolutionary Histories for 5# and 3#Regions of Meis Genes: Functional Causes andConsequences
In addition to general contrasts between Meis and genome-
wide gene structure evolution, we found contrasting evolu-
tionary histories for intron–exon structures of the 5# and 3#regions of Meis family genes (fig. 1A). As discussed above,
the first 10 exons show remarkable conservation, with po-
sitions and relative sizes of the first 9 introns conserved
across metazoans; by contrast, the 3# of the gene shows
a remarkable diversity of structures, evidencing intron
and exon creation and loss, and great flexibility in AS pat-
terns. These patterns echo findings in gene sequence evo-
lution, in which different regions of the same protein mayshow opposed patterns of constraint or positive selection.
As with coding sequences, regional differences in protein
function provide insight into the organismal functions un-
dergoing potentially adaptive evolution. The conserved 5#region encodes the highly conserved Pbx-interacting Meis
(hth) domain and DNA-binding homeobox (Berthelsen
et al. 1998; Mukherjee and Burglin 2007), and the interven-
ing introns may be implicated in developmental transcrip-tional regulation. By contrast, the variable 3# region
encodes interaction domains including the transcriptional
activation domain and regulatory modules that modify pro-
tein transcriptional activity and response to cell signaling
(Yang et al. 2000; Huang et al. 2005). For instance, regions
within exons 11, 12a, and 12b affect transcriptional activa-
tor activity of human Meis1 proteins by mediating respon-
siveness to PKA and TSA (Huang et al. 2005; Shim et al.2007), and inclusion of exon 12a lowers transcriptional ac-
tivation in frogs and mammals (Yang et al. 2000; Maeda
et al. 2001; Huang et al. 2005); (fig. 3). Shifting combina-
tions of different isoforms and paralogs could thus allow
subtle spatiotemporal control of Meis1 protein
Irimia et al. GBE
560 Genome Biol. Evol. 3:551–564. doi:10.1093/gbe/evr056 Advance Access publication June 16, 2011

transcriptional activity (Huang et al. 2005; Heine et al. 2008;Sanchez-Guardado et al. 2011). Such modulation would be
particularly powerful given MEIS proteins’ ability to enhance
cell proliferation by transcriptional activation of cell cycle
genes (Bessa et al. 2008; Heine et al. 2008): the quantitative
combination of isoforms and paralogs present in each cell
will likely affect the level of transcriptional activation of
the target genes, and thus the proliferation rates. The 3# re-
gion would therefore be a rich substrate for the evolution ofdifferent elaborations that could provide functional regula-
tory potential. Interestingly, this adaptation was likely aided
by the gain of two introns in early bilaterians, splitting a sin-
gle exon into three, allowing for a larger palette of poten-
tially adaptive splicing-related mutations.
Deeply Conserved Splicing Functions in Bilaterians
Notably, our results show thatMeis/hth genes harbor several
cases of deeply conserved AS (Irimia et al. 2009). The AS of
exon 10# is a bilaterian innovation and has been maintained
in some lineages since the very origin of bilaterians, repre-
senting one of the most ancestral AS events described to
date (e.g., Mistry et al. 2003; Kalyna et al. 2006; Damianov
and Black 2010). In addition, AS of exons 11 and 12a have
likely arisen within chordate ancestors and have beenconserved between amphioxus and vertebrates for some
600 My. This deep conservation of alternatively spliced
sequences differs from the general low conservation of
AS in different metazoan groups (reviewed in Irimia et al.
2009).
Frequent Gene Structural Convergence in Bilater-ian Meis Evolution
Another striking result is the large number of cases of
convergent evolution by identical or very similar sequence
changes in different species in 3#Meis regions. As with con-
vergent protein changes in multiple lineages, these parallel
changes suggest similar selective pressures acting in very dif-
ferent species; that these changes are restricted to the post-transcriptional regulatory domains of MEIS proteins
suggests that evolution may have ‘‘used’’ and reused a finite
set of accessible mechanisms for modulation of Meisfunction.
Recurrent Loss of Conserved Ancestral Sequence.We find several cases of convergent loss of conserved
ancestral sequences. First, the sequence of 3# end of exon
10 (which we call 10#) is highly conserved across a widevariety of bilaterian and non-bilaterian genes (fig. 1C), indi-
cating function; yet, this region has been independently lost
from genomic copies of Meis genes at least nine times and is
only very infrequently observed in transcripts of some genes
that do contain it, begging the question of this sequence
region’s mode of function. Similarly, the coding sequence
of exon 12b is conserved between studied non-bilaterians
and various bilaterians but has been lost by constitutive proteintruncations in three independent lineages (Pancrustacea, sea
urchin and Meis3 in Anolis). In a third case, an ancestral ver-
tebrate 5# extension of exon 11 has been retained in many
vertebrate genes but lost in 4 genic lineages; and the ancestral
chordate AS exon 12a has been lost twice. Notably, these los-
ses of conserved ancestral sequence have affected both puta-
tively constitutively and alternatively spliced ancestral Meisgene regions.
Recurrent Evolution of Truncated C-Termini inBilaterians.One of the most striking observations concerns the regula-
tion of the novel alternative exon 12a in vertebrates. Exon
12a is nearly constitutive in most vertebrate Meis genes,
which is surprising because inclusion of this exon signifi-cantly attenuates transcriptional activation in vertebrate
MEIS proteins, especially for Meis1 (Yang et al. 2000; Maeda
et al. 2001; Huang et al. 2005). The scarce use of the most
active, ancestral isoform may suggest that the emergence of
exon 12a in chordates could have been associated with in-
creasingly strict regulatory control of Meis target genes. This
observation fits with postulates of the cybernetic theory of
control in complex systems, which hold that the prevalenceof negative regulatory mechanisms over positive ones in-
creases system’s stability (Wiener 1948). Notably, Ambula-
craria and arthropods have independently achieved an
equivalent situation by a different mechanism: evolution
of constitutive 3# extensions of exon 11 including premature
stop codons. Insofar as these truncations also attenuate ac-
tivator activity, these convergent patterns hint at an evolu-
tionary trend towards more strictly regulated MEIS proteinsin bilaterians.
The Fitness Effects of Introns and the Origins ofGenome Complexity
Much discussion of spliceosomal introns has emphasized
perspectives in which introns are neutral or slightly delete-
rious elements, potentially leading to evolutionary histories
that are dominated by differences in mutation rates or ef-
fective population sizes (Lynch 2007). This study provides
potential examples of two types of exceptions to this para-digm. First, widespread conservation of 5#Meis intron–exon
structures suggests strong purifying selection acting against
intron loss in these regions. Second, the recurrent genera-
tion of very similar structures in the 3# gene region suggests
that alteration of intron–exon structures has been a frequent
mechanism for adaptation. These findings join an increas-
ingly long list of intronic loci encoding important organismal
functions. Nonetheless, given the sheer number of introns inmany metazoan genomes—reaching 200,000 in human
and other vertebrate genomes—the proportion of introns
whose loss is opposed by selection remains very much an
open question, with answers ranging from a small minority
Evolution of Meis Gene Structures in Metazoans GBE
Genome Biol. Evol. 3:551–564. doi:10.1093/gbe/evr056 Advance Access publication June 16, 2011 561

to a clear majority still being well within the realm of pos-sibility.
Concluding Remarks
The diversity of structures, functions, and mechanisms asso-
ciated with transcript splicing, and uncertainty about the
general fitness consequences of introns, complicate efforts
to understand the function of individual introns. The current
report details a case in which the evolution of one gene fam-ily contrasts strikingly with genome-wide patterns, suggest-
ing purifying selection on intron–exon structures and
suggesting functional roles for splicing in these genes. These
results indicate the utility of many-species comparisons
between introns within a genome. Future research should
research toward explicit models for divergence in intron–
exon structures among large sets of metazoans, to allow
for systematic prediction of intron functionality across line-ages and loci.
Supplementary Material
Supplementary figure S1–S6 and tables S1–S3 are available
at Genome Biology and Evolution online (http://www.
oxfordjournals.org/our_journals/gbe/).
Acknowledgments
We thank Salvatore D’Aniello for kindly helping with the ex-
periments, Jose L. Gomez-Skarmeta for the X. tropicalissamples and Maria Ina Arnone for the S. purpuratus sam-
ples. M.I., I.M., and J.G.F. were funded by grants
BFU2005-00252 and BMC2008-03776 from the Spanish
Ministerio de Educacion y Ciencia; M.I. and I.M. held FPI
and FPU fellowships, respectively; M.H.S., by FUNDESA-
LUD-PRIS09043 and BFU2010-19461; and L.P. and J.L.F.
by BFU2008-04156 and SENECA Foundation contract
04548/GERM/06-10891.
Literature CitedAbascal F, Zardoya R, Posada D. 2005. ProtTest: selection of best-fit
models of protein evolution. Bioinformatics. 21:2104–2105.
Adams MD, et al. 2000. The genome sequence of Drosophila
melanogaster. Science. 287:2185–2195.
Alexander RP, Fang G, Rozowsky J, Snyder M, Gerstein MB. 2010.
Annotating non-coding regions of the genome. Nat Rev Genet.
11:559–571.
Aparicio S, et al. 2002. Whole-genome shotgun assembly and analysis
of the genome of Fugu rubripes. Science. 297:1301–1310.
Azcoitia V, Aracil M, Martınez-A C, Torres M. 2005. The homeodomain
protein Meis1 is essential for definitive hematopoiesis and vascular
patterning in the mouse embryo. Dev Biol. 280:307–320.
Bang ML, et al. 2001. The complete gene sequence of titin, expression
of an unusual approximately 700-kDa titin isoform, and its
interaction with obscurin identify a novel Z-line to I-ban linking
system. Circ Res. 89:1065–1072.
Bergman CM, Kreitman M. 2001. Analysis of conserved noncoding DNA
in Drosophila reveals similar constraints in intergenic and intronic
sequences. Genome Res. 11:1335–1345.
Berthelsen J, Zappavigna V, Mavilio F, Blasi F. 1998. Prep1, a novel
functional partner of Pbx proteins. EMBO J. 17:1423–1433.
Bessa J, et al. 2008. meis1 regulates cyclin D1 and c-myc expression, and
controls the proliferation of the multipotent cells in the early
developing zebrafish eye. Development. 135:799–803.
Choe SK, Vlachakis N, Sagerstrom CG. 2002. Meis family proteins are
required for hindbrain development in the zebrafish. Development.
129:585–595.
Caenorhabditis elegans Sequencing Consortium. 1998. Genome se-
quence of the nematode C. elegans: a platform for investigating
biology. Science. 282:2012–2018.
Chicken Genome Sequencing Consortium. 2004. Sequence and
comparative analysis of the chicken genome provide unique
perspectives on vertebrate evolution. Nature. 432:695–716.
Sea Urchin Genome Sequencing Consortium et al. 2006. The genome of
the sea urchin Strongylocentrotus purpuratus. Science. 314:941–952.
Tribolium Genome Sequencing Consortium et al. 2008. The genome of
the model beetle and pest Tribolium castaneum. Nature. 452:
949–955.
Coulombe-Huntington J, Majewski J. 2007a. Characterization of intron
loss events in mammals. Genome Res. 17:23–32.
Coulombe-Huntington J, Majewski J. 2007b. Intron loss and gain in
drosophila. Mol Biol Evol. 24:2842–2850.
D’Aniello S, et al. 2008. Gene expansion and retention leads to a diverse
tyrosine kinase superfamily in amphioxus. Mol Biol Evol.
25:1841–1854.
Damianov A, Black DL. 2010. Autoregulation of Fox protein expression
to produce dominant negative splicing factors. RNA. 16:405–416.
Dehal P, Boore JL. 2005. Two rounds of whole genome duplication in the
ancestral vertebrate. PLoS Biol. 3:e314.
Dehal P, et al. 2002. The draft genome of Ciona intestinalis: insights into
chordate and vertebrate origins. Science. 298:2157–2167.
Dibner C, Elias S, Frank D. 2001. XMeis3 protein activity is required for
proper hindbrain patterning in Xenopus laevis embryos. Develop-
ment 128:3415–3426.
Dong X, Fredman D, Lenhard B. 2009. Synorth: exploring the evolution
of synteny and long-range regulatory interactions in vertebrate
genomes. Genome Biol. 10:R86.
Doolittle WF. 1978. Genes in pieces: were they ever together? Nature.
272:581–582.
Drummond A, Strimmer K. 2001. PAL: an object-oriented programming
library for molecular evolution and phylogenetics. Bioinformatics.
17:662–663.
Edvardsen RB, et al. 2004. Hypervariable and highly divergent intron/
exon organizations in the chordate Oikopleura dioica. J Mol Evol.
59:448–457.
Engstrom PG, Ho Sui SJ, Drivenes O, Becker TS, Lenhard B. 2007.
Genomic regulatory blocks underlie extensive microsynteny conser-
vation in insects. Genome Res. 17:1898–1908.
Ferran JL, Sanchez-Arrones L, Sandoval JE, Puelles L. 2007. A model of
early molecular regionalization in the chicken embryonic pretectum.
J Comp Neurol. 505:379–403.
Ghedin E, et al. 2007. Draft genome of the filarial nematode parasite
Brugia malayi. Science. 317:1756–1760.
Glazov EA, Pheasant M, McGraw EA, Bejerano G, Mattick JS. 2005.
Ultraconserved elements in insect genomes: a highly conserved
intronic sequence implicated in the control of homothorax mRNA
splicing. Genome Res. 15:800–808.
Irimia et al. GBE
562 Genome Biol. Evol. 3:551–564. doi:10.1093/gbe/evr056 Advance Access publication June 16, 2011

Guindon S, Gascuel O. 2003. A simple, fast, and accurate algorithm to
estimate large phylogenies by maximum likelihood. Syst Biol.
52:696–704.
Haddrill PR, Charlesworth B, Halligan DL, Andolfatto P. 2005. Patterns of
intron sequence evolution in Drosophila are dependent upon length
and GC content. Genome Biol. 6:R67.
Halligan DL, Keightley PD. 2006. Ubiquitous selective constraints in the
Drosophila genome revealed by a genome-wide interspecies
comparison. Genome Res. 16:875–884.
Heine P, Dohle E, Bumsted-O’Brien K, Engelkamp D, Schulte D. 2008.
Evidence for an evolutionary conserved role of homothorax/Meis1/2
during vertebrate retina development. Development. 135:805–811.
Hellsten U, et al. 2010. The genome of the Western clawed frog
Xenopus tropicalis. Science. 328:633–636.
Hisa T, et al. 2004. Hematopoietic, angiogenic and eye defects in Meis1
mutant animals. EMBO J. 23:450–459.
Hong X, Scofield DG, Lynch M. 2006. Intron size, abundance, and
distribution within untranslated regions of genes. Mol Biol Evol.
23:2392–2404.
Huang H, et al. 2005. MEIS C termini harbor transcriptional activation
domains that respond to cell signaling. J Biol Chem.
280:10119–10127.
Huelsenbeck JP, Ronquist F. 2001. MRBAYES: Bayesian inference of
phylogenetic trees. Bioinformatics. 17:754–755.
Hughes SS, Buckley CO, Neafsey DE. 2008. Complex selection on intron
size in Cryptococcus neoformans. Mol Biol Evol. 25:247–253.
Hyman-Walsh C, Bjerke GA, Wotton D. 2010. An autoinhibitory effect
of the homothorax domain of Meis2. FEBS J. 277:2584–2597.
Irimia M, Maeso I, Garcia-Fernandez J. 2008. Convergent evolution of
clustering of Iroquois homeobox genes across metazoans. Mol Biol
Evol. 25:1521–1525.
Irimia M, Maeso I, Gunning PW, Garcia-Fernandez J, Roy SW. 2010.
Internal and external paralogy in the evolution of Tropomyosin
genes in metazoans. Mol Biol Evol. 27:1504–1517.
Irimia M, Roy SW. 2008. Spliceosomal introns as tools for genomic and
evolutionary analysis. Nucleic Acids Res. 36:1703–1712.
Irimia M, et al. 2008. Origin of introns by ’intronization’ of exonic
sequences. Trends Genet. 24:378–381.
Irimia M, Rukov JL, Roy SW, Vinther J, Garcia-Fernandez J. 2009.
Quantitative regulation of alternative splicing in evolution and
development. Bioessays. 31:40–50.
Kalyna M, Lopato S, Voronin V, Barta A. 2006. Evolutionary conservation
and regulation of particular alternative splicing events in plant SR
proteins. Nucleic Acids Res. 34:4395–4405.
Katoh K, Kuma K, Toh H, Miyata T. 2005. MAFFT version 5:
improvement in accuracy of multiple sequence alignment. Nucleic
Acids Res. 33:511–518.
Katoh K, Misawa K, Kuma K, Miyata T. 2002. MAFFT: a novel method
for rapid multiple sequence alignment based on fast Fourier
transform. Nucleic Acids Res. 30:3059–3066.
Lander ES, et al. 2001. Initial sequencing and analysis of the human
genome. Nature. 409:860–921.
Li W, Tucker AE, Sung W, Thomas WK, Lynch M. 2009. Extensive, recent
intron gains in Daphnia populations. Science. 326:1260–1262.
Llopart A, Comeron JM, Brunet FG, Lachaise D, Long M. 2002. Intron
presence-absence polymorphism in Drosophila driven by positive
Darwinian selection. Proc Natl Acad Sci U S A. 99:8121–8126.
Logsdon J. 2004. Worm genomes hold the smoking guns of intron gain.
Proc Natl Acad Sci U S A. 101:11195–11196.
Lynch M. 2007. The Origins of Genome Architecture. Sunderland (MA):
Sinauer Associates.
Lynch M. 2002. Intron evolution as a population-genetic process. Proc
Natl Acad Sci U S A. 99:6118–6123.
Maeda R, et al. 2001. Xmeis1, a protooncogene involved in specifying
neural crest cell fate in Xenopus embryos. Oncogene. 20:1329–1342.
Marais G, Nouvellet P, Keightley PD, Charlesworth B. 2005. Intron size
and exon evolution in Drosophila. Genetics. 170:481–485.
Mercader N, et al. 1999. Conserved regulation of proximodistal limb axis
development by Meis1/Hth. Nature. 402:425–429.
Mercader N, Tanaka EM, Torres M. 2005. Proximodistal identity during
vertebrate limb regeneration is regulated by Meis homeodomain
proteins. Development. 132:4131–4142.
Mistry N, Harrington W, Lasda E, Wagner EJ, Garcia-Blanco MA. 2003.
Of urchins and men: evolution of an alternative splicing unit in
fibroblast growth factor receptor genes. RNA. 9:209–217.
Monroe D. 2009. Genetics. Genomic clues to DNA treasure sometimes
lead nowhere. Science. 325:142–143.
Moskow JJ, Bullrich F, Huebner K, Daar IO, Buchberg AM. 1995. Meis1,
a PBX1-related homeobox gene involved in myeloid leukemia in
BXH-2 mice. Mol Cell Biol. 15:5434.
Mukherjee K, Burglin TR. 2007. Comprehensive analysis of animal TALE
homeobox genes: new conserved motifs and cases of accelerated
evolution. J Mol Evol. 65:137–153.
Nakamura T, Jenkins NA, Copeland NG. 1996. Identification of a new
family of Pbx-related homeobox genes. Oncogene. 13:2235–2242.
Ng L, et al. 2009. An anatomic gene expression atlas of the adult mouse
brain. Nat Neurosci. 12:356–362.
Noro B, Culi J, McKay DJ, Zhang W, Mann RS. 2006. Distinct functions
of homeodomain-containing and homeodomain-less isoforms
encoded by homothorax. Genes Dev. 20:1636–1650.
Oulad-Abdelghani M, et al. 1997. Meis2, a novel mouse Pbx-related
homeobox gene induced by retinoic acid during differentiation of
P19 embryonal carcinoma cells. Dev Dyn. 210:173–183.
Pai CY, et al. 1998. The homothorax homeoprotein activates the nuclear
localization of another homeoprotein, extradenticle, and suppresses
eye development in Drosophila. Genes Dev. 12:435–446.
Parsch J. 2003. Selective constraints on intron evolution in Drosophil.
Genetics. 165:1843–1851.
Parsch J, Novozhilov S, Saminadin-Peter SS, Wong KM, Andolfatto P.
2010. On the utility of short intron sequences as a reference for the
detection of positive and negative selection in Drosophila. Mol Biol
Evol. 27:1226–1234.
Pechmann M, Prpic NM. 2009. Appendage patterning in the South
American bird spider Acanthoscurria geniculata (Araneae: mygalo-
morphae). Dev Genes Evol. 219:189–198.
Prpic NM, Janssen R, Wigand B, Klingler M, Damen WG. 2003. Gene
expression in spider appendages reveals reversal of exd/hth spatial
specificity, altered leg gap gene dynamics, and suggests divergent
distal morphogen signaling. Dev Biol. 264:119–140.
Putnam N, et al. 2008. The amphioxus genome and the evolution of the
chordate karyotype. Nature. 453:1064–1071.
Putnam NH, et al. 2007. Sea anemone genome reveals ancestral
Eumetazoan gene repertoire and genomic organization. Science.
317:86–94.
Rieckhof GE, Casares F, Ryoo HD, Abu-Shaar M, Mann RS. 1997.
Nuclear translocation of extradenticle requires homothorax, which
encodes an extradenticle-related homeodomain protein. Cell. 91:
171–183.
Rogozin IB, Wolf YI, Sorokin AV, Mirkin BG, Koonin EV. 2003.
Remarkable interkingdom conservation of intron positions and
massive, lineage-specific intron loss and gain in eukaryotic
evolution. Curr Biol. 13:1512–1517.
Evolution of Meis Gene Structures in Metazoans GBE
Genome Biol. Evol. 3:551–564. doi:10.1093/gbe/evr056 Advance Access publication June 16, 2011 563

Ronquist F, Huelsenbeck JP. 2003. MrBayes 3: Bayesian phylogenetic
inference under mixed models. Bioinformatics. 19:1572–1574.
Roy SW, Fedorov A, Gilbert W. 2003. Large-scale comparison of intron
positions in mammalian genes shows intron loss but no gain. Proc
Natl Acad Sci U S A. 100:7158–7162.
Roy SW, Gilbert W. 2005. The pattern of intron loss. Proc Natl Acad Sci
U S A. 102:713–718.
Roy SW, Hartl DL. 2006. Very little intron loss/gain in Plasmodium: intron
loss/gain mutation rates and intron number. Genome Res.
16:750–756.
Roy SW, Irimia M. 2009a. Mystery of intron gain: new data and new
models. Trends Genet. 25:67–73.
Roy SW, Irimia M. 2009b. Splicing in the eukaryotic ancestor: form,
function and dysfunction. Trends Ecol Evol. 24:447–455.
Roy SW, Irimia M, Penny D. 2006. Very little intron gain in Entamoeba
histolytica genes laterally transferred from prokaryotes. Mol Biol
Evol. 23:1824–1827.
Roy SW, Penny D. 2006. Large-scale intron conservation and order-of-
magnitude variation in intron loss/gain rates in apicomplexan
evolution. Genome Res. 16:1270–1275.
Rukov JL, et al. 2007. High qualitative and quantitative conservation of
alternative splicing in Caenorhabditis elegans and Caenorhabditis
briggsae. Mol Biol Evol. 24:909–917.
Sanchez-Guardado LO, et al. 2011. Distinct and redundant expression
and transcriptional diversity of Meis gene paralogs during chicken
development. Dev Dyn. 240:1475–1492.
Sandelin A, et al. 2004. Arrays of ultraconserved non-coding regions
span the loci of key developmental genes in vertebrate genomes.
BMC Genomics. 5:99.
Schmucker D, et al. 2000. Drosophila Dscam is an axon guidance receptor
exhibiting extraordinary molecular diversity. Cell. 101:671–684.
Scofield DG, Hong X, Lynch M. 2007. Position of the final intron in full-
length transcripts: determined by NMD? Mol Biol Evol. 24:896–899.
Seo H-C, et al. 2001. Miniature genome in the marine chordate
Oikopleura dioica. Science. 294:2506.
Shim S, Kim Y, Shin J, Kim J, Park S. 2007. Regulation of EphA8 gene
expression by TALE homeobox transcription factors during de-
velopment of the mesencephalon. Mol Cell Biol. 27:1614–1630.
Srivastava M, et al. 2008. The Trichoplax genome and the nature of
placozoans. Nature. 454:955–960.
Stajich JE, Dietrich FS. 2006. Evidence of mRNA-mediated intron loss in
the human-pathogenic fungus Cryptococcus neoformans. Eukaryot
Cell. 5:789–793.
Toresson H, Parmar M, Campbell K. 2000. Expression of Meis and Pbx
genes and their protein products in the developing telencephalon:
implications for regional differentiation. Mech Dev. 94:183–187.
Venter JC, et al. 2001. The sequence of the human genome. Science.
291:1304–1351.
Visel A, Minovitsky S, Dubchak I, Pennacchio LA. 2007. VISTA Enhancer
Browser—a database of tissue-specific human enhancers. Nucleic
Acids Res. 35:D88–D92.
Waskiewicz AJ, Rikhof HA, Hernandez RE, Moens CB. 2001. Zebrafish
Meis functions to stabilize Pbx proteins and regulate hindbrain
patterning. Development. 128:4139–4151.
Wassef MA, et al. 2008. Rostral hindbrain patterning involves the direct
activation of a Krox20 transcriptional enhancer by Hox/Pbx and Meis
factors. Development. 135:3369–3378.
Waterhouse AM, Procter JB, Martin DM, Clamp M, Barton GJ. 2009.
Jalview version 2—a multiple sequence alignment editor and
analysis workbench. Bioinformatics. 25:1189–1191.
Waterston R, et al. 2002. Initial sequencing and comparative analysis of
the mouse genome. Nature. 420:520–562.
Wiener N. 1948. Cybernetics or control and communication in the
animal and the machine. New York: John Wiley & Sons Inc.
Williams TM, Williams ME, Innis JW. 2005. Range of HOX/TALE
superclass associations and protein domain requirements for
HOXA13:MEIS interaction. Dev Biol. 277:457–471.
Woolfe A, et al. 2005. Highly conserved non-coding sequences are
associated with vertebrate development. PLoS Biol. 3:e7.
Worden AZ, et al. 2009. Green evolution and dynamic adaptations
revealed by genomes of the marine picoeukaryotes micromonas.
Science. 324:268–272.
Xiong L, et al. 2009. MEIS1 intronic risk haplotype associated with
restless legs syndrome affects its mRNA and protein expression
levels. Hum Mol Genet. 18:1065–1074.
Yang Y, et al. 2000. Three-amino acid extension loop homeodomain
proteins Meis2 and TGIF differentially regulate transcription. J Biol
Chem. 275:20734–20741.
Associate editor: John Archibald
Irimia et al. GBE
564 Genome Biol. Evol. 3:551–564. doi:10.1093/gbe/evr056 Advance Access publication June 16, 2011

Artículo anexo 2

RESEARCH ARTICLE
Molecular regionalization of the developing
amphioxus neural tube challenges major
partitions of the vertebrate brain
Beatriz Albuixech-Crespo1, Laura Lopez-Blanch2,3☯, Demian Burguera1,2,3☯,
Ignacio Maeso4, Luisa Sanchez-Arrones5, Juan Antonio Moreno-Bravo6,
Ildiko Somorjai7,8, Juan Pascual-Anaya9, Eduardo Puelles6, Paola Bovolenta5,
Jordi Garcia-Fernàndez1*, Luis Puelles10,11*, Manuel Irimia2,3*, Jose Luis Ferran10,11*
1 Department of Genetics, School of Biology, and Institut de Biomedicina (IBUB), University of Barcelona,
Barcelona, Spain, 2 Centre for Genomic Regulation (CRG), Barcelona Institute of Science and Technology
(BIST), Barcelona, Spain, 3 Universitat Pompeu Fabra (UPF), Barcelona, Spain, 4 Centro Andaluz de
Biologıa del Desarrollo (CSIC/UPO/JA), Sevilla, Spain, 5 Centro de Biologıa Molecular Severo Ochoa CSIC-
UAM and CIBERER, ISCIII, Madrid, Spain, 6 Instituto de Neurociencias, UMH-CSIC, Campus de San Juan,
Sant Joan d’Alacant, Alicante, Spain, 7 The Scottish Oceans Institute, University of St Andrews, St Andrews,
Fife, Scotland, United Kingdom, 8 Biomedical Sciences Research Complex, University of St Andrews, Fife,
Scotland, United Kingdom, 9 Evolutionary Morphology Laboratory, RIKEN, Kobe, Japan, 10 Department of
Human Anatomy and Psychobiology, School of Medicine, University of Murcia, Murcia, Spain, 11 Institute of
Biomedical Research of Murcia (IMIB), Virgen de la Arrixaca University Hospital, University of Murcia, Murcia,
Spain
☯ These authors contributed equally to this work.
* [email protected] (MI); [email protected] (JGF); [email protected] (LP); [email protected] (JLF)
Abstract
All vertebrate brains develop following a common Bauplan defined by anteroposterior (AP)
and dorsoventral (DV) subdivisions, characterized by largely conserved differential expres-
sion of gene markers. However, it is still unclear how this Bauplan originated during evolu-
tion. We studied the relative expression of 48 genes with key roles in vertebrate neural
patterning in a representative amphioxus embryonic stage. Unlike nonchordates, amphi-
oxus develops its central nervous system (CNS) from a neural plate that is homologous to
that of vertebrates, allowing direct topological comparisons. The resulting genoarchitectonic
model revealed that the amphioxus incipient neural tube is unexpectedly complex, consist-
ing of several AP and DV molecular partitions. Strikingly, comparison with vertebrates indi-
cates that the vertebrate thalamus, pretectum, and midbrain domains jointly correspond to a
single amphioxus region, which we termed Di-Mesencephalic primordium (DiMes). This
suggests that these domains have a common developmental and evolutionary origin, as
supported by functional experiments manipulating secondary organizers in zebrafish and
mice.
Author summary
According to textbooks, vertebrate brains develop from a neural tube that rapidly becomes
regionalized into the forebrain (which includes the secondary prosencephalon and
PLOS Biology | https://doi.org/10.1371/journal.pbio.2001573 April 19, 2017 1 / 34
a1111111111
a1111111111
a1111111111
a1111111111
a1111111111
OPENACCESS
Citation: Albuixech-Crespo B, Lopez-Blanch L,
Burguera D, Maeso I, Sanchez-Arrones L, Moreno-
Bravo JA, et al. (2017) Molecular regionalization of
the developing amphioxus neural tube challenges
major partitions of the vertebrate brain. PLoS Biol
15(4): e2001573. https://doi.org/10.1371/journal.
pbio.2001573
Academic Editor: Marianne Bronner, California
Institute of Technology, United States of America
Received: November 14, 2016
Accepted: March 22, 2017
Published: April 19, 2017
Copyright: © 2017 Albuixech-Crespo et al. This is
an open access article distributed under the terms
of the Creative Commons Attribution License,
which permits unrestricted use, distribution, and
reproduction in any medium, provided the original
author and source are credited.
Data Availability Statement: All relevant data are
within the paper and its Supporting Information
files.
Funding: Spanish Ministry of Economy and
Competitiveness and European FEDER funds
(grant number BFU2014-57516-P). To Luis Puelles
and Jose Luis Ferran. The funder had no role in
study design, data collection and analysis, decision
to publish, or preparation of the manuscript.
European Research Council (grant number ERC-

diencephalon), midbrain, and hindbrain. These regions are then further subdivided; in
particular, the diencephalon gives rise to the prethalamus, thalamus, and pretectum. How-
ever, embryological manipulations of brain signaling centers showed that the prethalamus
behaves very differently than the thalamus and pretectum, which largely share their devel-
opmental potential with the midbrain. Therefore, this classic partition scheme might not
be fully consistent from a developmental perspective. To better understand the origin and
evolution of the regionalization of the vertebrate brain, we built a comprehensive molecu-
lar model of the incipient neural tube of amphioxus, an invertebrate chordate that shares
multiple features with its vertebrate relatives. This model shows that the amphioxus ner-
vous system is unexpectedly complex, sharing its basic blueprint with that of vertebrates.
However, a single undivided region in amphioxus, which we termed Di-Mesencephalic
primordium (DiMes), unambiguously corresponds to the region encompassing the thala-
mus, pretectum, and midbrain in vertebrates, indicating that these regions are also more
closely related evolutionarily. Therefore, the diencephalon as a neuroanatomical compart-
ment as well as the classic separation between forebrain and midbrain in vertebrates seem
inconsistent from both an evolutionary and developmental perspective.
Introduction
The vertebrate brain is arguably the most complex structure in nature. All vertebrates show a
highly conserved construction plan, or Bauplan, of their central nervous system (CNS), which
involves several major anatomical and genetic partitions and their subsequent subdivisions
[1]. Understanding how this Bauplan has originated during evolution has been a matter of
intense research and debate, but there is still no satisfactory answer. Do homologues to major
vertebrate brain partitions exist in invertebrate species? Have new vertebrate partitions origi-
nated by subdivision and specialization of preexisting structures? Did positional genetic pat-
terning mechanisms predate the origin of recognizable neuroanatomical regions, or did both
originate concomitantly?
These and related questions have been investigated mainly from an evolutionary develop-
mental (Evo-Devo) perspective, since early developing brains have not yet undergone complex
morphogenetic deformations and are thus more amenable to evolutionary comparisons
between distantly related species. In the case of vertebrates, the CNS arises very early in embry-
onic development via neural induction. The neuroectodermal plate represents the earliest CNS
primordium, which then folds into a closed tube during neurulation. Already at neural plate
stages, the CNS becomes regionalized molecularly into large anteroposterior (AP) regions.
According to the prosomeric model [2–4], this Bauplan includes the secondary prosencepha-
lon and diencephalon proper (forebrain), midbrain, hindbrain, and spinal cord (Fig 1A and
1B). These primary regions are further partitioned into smaller transverse AP units, identified
as brain segments or neuromeres (Fig 1B). Two lineal neuroepithelial signal sources known as
secondary organizers are crucial for this process: the zona limitans intrathalamica (ZLI or
mid-diencephalic organizer) and the isthmic organizer (IsO, located in the Midbrain–Hind-
brain Boundary, MHB; Fig 1B). These organizers are characterized by the release of diffused
morphogen signals (SHH and FGF8/WNT1, respectively) and are involved in AP regionaliza-
tion and differential specification of the diencephalic, mesencephalic, and some rostral rhom-
bencephalic neuromeres [5–13].
Furthermore, along the neural tube, each neuromere is composed of four continuous dor-
soventral (DV) domains: roof, alar, basal, and floor plate regions (Fig 1A–1D). Importantly,
Genoarchitecture of the amphioxus developing nervous system
PLOS Biology | https://doi.org/10.1371/journal.pbio.2001573 April 19, 2017 2 / 34
StG-LS2-637591). To Manuel Irimia. The funder
had no role in study design, data collection and
analysis, decision to publish, or preparation of the
manuscript. Spanish Ministry of Economy and
Competitiveness (grant number SEV-2012-0208).
Centro de Excelencia Severo Ochoa (to CRG,
Manuel Irimia). The funder had no role in study
design, data collection and analysis, decision to
publish, or preparation of the manuscript. Spanish
Ministry of Economy and Competitiveness (grant
number BFU2014-58908-P). To Jordi Garcia-
Fernadez. The funder had no role in study design,
data collection and analysis, decision to publish, or
preparation of the manuscript. Seneca Foundation,
Comunidad de Murcia (grant number 19904/
GERM/15). To Luis Puelles. The funder had no role
in study design, data collection and analysis,
decision to publish, or preparation of the
manuscript. Generalitat de Catalunya (grant
number). ICREA Academia Prize to Jordi Garcia-
Fernandez. The funder had no role in study design,
data collection and analysis, decision to publish, or
preparation of the manuscript. Spanish Ministry of
Economy and Competitiveness (grant number
BFU2013-43213-P). To Paola Bovolenta. The
funder had no role in study design, data collection
and analysis, decision to publish, or preparation of
the manuscript. Spanish Ministry of Economy and
Competitiveness (grant number BFU2014-55076-
P). To Manuel Irimia. Including an FPI PhD
fellowship to Laura Lopez-Blanch. The funder had
no role in study design, data collection and
analysis, decision to publish, or preparation of the
manuscript. Marine Alliance for Science and
Technology Scotland (MASTS) (grant number). To
Ildiko Somorjai. The funder had no role in study
design, data collection and analysis, decision to
publish, or preparation of the manuscript.
Competing interests: The authors have declared
that no competing interests exist.
Abbreviations: 4MO, quadruple morpholino; AP,
anteroposterior; ARCH, archencephalic
prototagma; CNS, central nervous system; DEU,
deuteroencephalic prototagma; DiMes, Di-
Mesencephalic primordium; DV, dorsoventral; Evo-
Devo, evolutionary developmental biology; hpf, h
post fertilization; HH5, Hamburger–Hamilton 5;
HyPTh, hypothalamo-prethalamic primordium; IsO,
isthmic organizer; KO, knockout; MHB, Midbrain–
Hindbrain Boundary; p1, pretectum diencephalic
prosomere; p2, thalamus diencephalic prosomere;
p3, prethalamus diencephalic prosomere; PHy,
peduncular hypothalamic prosomere; RhSp,
Rhombencephalo-Spinal primordium; THy,
terminal hypothalamic prosomere; ZLI, zona
limitans intrathalamica.

the prospective DV pattern is already observed at neural plate stages, corresponding to its
mediolateral dimension (Fig 1A, 1C and 1D): the future floor corresponds to the neural plate
midline, whereas the future roof lies at the border of the neural plate. The rostral end of the
neural plate is thus morphologically singular because the floor does not reach the anterior bor-
der of the plate but ends rostrally at the prospective mamillary hypothalamic region, in coinci-
dence with the underlying rostral tip of the notochord [14]; therefore, the roof, alar, and basal
plates concentrically cross the midline at the terminal wall (future acroterminal domain), curv-
ing around the rostral end of the floor plate (Fig 1A, [2,4,15]).
An important breakthrough in the study of comparative neuroanatomy and the evolution-
ary origin of CNSs has been the observation that each established AP and DV anatomical
Fig 1. Bauplan of the vertebrate central nervous system (CNS). Schematic representation of the Bauplan of the
vertebrate CNS according to the updated prosomeric model (Puelles and Rubenstein, 2015) at neural plate and early
neural tube closure stages. (A) Schematic dorsal view of a representative neural plate of vertebrates depicting the
components that define the longitudinal axis: floor plate (fp, in green) and parallel basal (bp), alar (ap) and roof (rp, in
red) plates. Note that the fp does not reach the rostral boundary of the neural plate, whereas the bp, ap, and rp go
around the fp; a similar phenomena can be observed in the caudal end of the neural plate. This peculiarity defines a
rostral-most dorsoventral (DV) region termed acroterminal domain (ATD). From this domain, several anteroposterior
(AP) partitions can be defined molecularly from rostral to caudal: secondary prosencephalon (SP) and diencephalon
proper (D) (classic forebrain components), midbrain (MB), rhombencephalon (Rh), and spinal cord (SC) regions. (B)
Schematic lateral view of an early closed neural tube in a more advanced stage of regionalization. Longitudinal
components are indicated as fp (green), bp, ap, and rp (red). At this stage, the vertebrate neural tube is characterized
by several definitive neuromeric units (i.e., AP partitions with all the DV components). The forebrain is subdivided into
SP, with peduncular and terminal prosomeres (hp1 and hp2, respectively), which include the hypothalamic region,
telencephalon (Tel), and the optic vesicles, and D (with prosomeres 1, 2, and 3 [p1–p3], which are represented at the
ap level by pretectum [PT], thalamus [Th], and prethalamus [PTh], respectively). More caudally, MB, Rh, and SC
regions are identified (for simplicity, their respective neuromeric components are not depicted). The secondary
organizers zona limitans intrathalamica (ZLI) and the isthmic organizer (IsO) are located between the PTh and Th
regions, and the MB and Rh regions, respectively. (C) The transversal section throughout the open neural plate in (A),
showing the main longitudinal components (fp, bp, ap, and rp) arranged medio-laterally at this stage. (D) Cross section
through the closed neural tube, showing the DV relationships of the same longitudinal components highlighted in (C).
https://doi.org/10.1371/journal.pbio.2001573.g001
Genoarchitecture of the amphioxus developing nervous system
PLOS Biology | https://doi.org/10.1371/journal.pbio.2001573 April 19, 2017 3 / 34

partition in a given species is characterized by the differential expression of specific gene mark-
ers early in development in a combinatorial code that we refer to as genoarchitecture [14].
These molecular codes create clear-cut molecular boundaries between the neuromeres, and
often correspond with visible external bulges due to the differential proliferation of the progen-
itors because of their distinct genoarchitectonic profiles [3,15]. Strikingly, the number of neu-
romeric units and their associated genoarchitecture is highly conserved in all vertebrate
groups, including the basal-branching agnathans [16–34]. This implies that a fundamentally
conserved anatomical CNS Bauplan and its corresponding genetic blueprint have existed at
least since the last common ancestor of vertebrates.
Therefore, a major approach to understanding the origins of this Bauplan has been to inves-
tigate the expression of orthologs of key gene markers in chordate and nonchordate inverte-
brate species. Remarkably, a subset of these markers show fixed relative AP positions,
suggesting that some of the regional genoarchitectonic codes of vertebrates were established
prior to the origin of the vertebrate brain Bauplan. For example, the transverse genetic bound-
aries defined by the abutting expression of Fezf/Irx and Otx/Gbx—which in vertebrates corre-
spond to the anatomical positions in which the ZLI and IsO secondary organizers will develop,
respectively—are observed in the CNSs of species as diverged as amphioxus and fruit flies [35–
37]; although, these sites lack the expression of the morphogens responsible for the organizer
activity in vertebrates [38–41]. Moreover, some markers expressed in the annelid Platynereisdurmeilii show remarkable topologic similarity with the mediolateral and AP molecular pat-
tern in vertebrates [42–44]. In one of the most striking cases of genetic patterning conservation
observed between vertebrates and invertebrates, the diffuse epidermal nervous system of hemi-
chordates displays multiple vertebrate-like AP genetic codes, including a ZLI-like domain with
equivalent relative expression of hh, six3, fng, otx, and wnt8 orthologs and an IsO-like region
coexpressing fgf8/17/18and wnt1, suggesting conservation of the underlying genetic programs
despite the fact that they are patterning divergent structures in the two lineages [45–48].
Altogether, these studies thus suggest that multiple defining genetic programs that pattern
the vertebrate brain predate its evolutionary emergence. However, the major limitation of
these nonchordate model systems to investigate the origin of the vertebrate brain Bauplan is
the lack of an unambiguous anatomical and topological reference system. Even under the
assumption that the nervous systems of these invertebrate phyla are truly homologous to the
vertebrate CNS, each one has its own set of clade-specific characters and thus correspond to
different variational modalities of CNSs [49]. This impedes direct topological comparisons,
leaving similarities of gene expression patterns as the only support for any hypothesized
homology assignment. For this reason, the cephalochordate amphioxus has traditionally been
the most studied invertebrate species for comparative analyses with vertebrates. Unlike non-
chordates, amphioxus develops its tubular CNS from a neural plate in the same way that verte-
brates do, thus allowing direct topological comparisons of prospective brain regions.
Furthermore, unlike tunicates, cephalochordates have undergone slow evolutionary rates,
both genomically and morphologically [50,51]. Multiple studies on this organism have shown,
for instance, that the Otx/Gbx and Fez/Irx genetic boundaries [36,37,52] as well as part of its
neural Hox AP patterning [53–57] are conserved with vertebrates. Similarly, orthologs of
many other key vertebrate genes have been implicated in neural function and development in
amphioxus (see S1 Table for a list of previously described gene expression patterns in amphi-
oxus with relevance to CNS development that have been used in this study). These reports,
together with multiple comprehensive and integrating reviews [41,58–64], have provided
important insights on the presence of molecularly-defined partitions in the developing amphi-
oxus CNS. Nonetheless, these studies have been performed by different research groups, using
different amphioxus species, and usually focused on the expression of a single gene at multiple
Genoarchitecture of the amphioxus developing nervous system
PLOS Biology | https://doi.org/10.1371/journal.pbio.2001573 April 19, 2017 4 / 34

embryonic stages. This has made the systematic integration and accurate combinatorial analy-
ses of these expression patterns a complex task.
To address these difficulties, we mapped here 48 genes with well-known roles in vertebrate
CNS patterning on a single amphioxus developmental stage, the 7-somite mid-neurula, in
which a wide spectrum of orthologs of vertebrate neural gene markers is expressed. With these
data, we propose an integrative model of the molecular regionalization of the amphioxus
developing CNS that is consistent and comparable with the prosomeric model of the vertebrate
CNS Bauplan. Our results show that, at the mid-neurula stage, the amphioxus CNS primor-
dium has an unexpectedly complex genoarchitecture, with three major molecularly distin-
guishable AP divisions (and some secondary subdivisions) and a set of standard DV zones.
Strikingly, direct topological comparison between the molecular models of the two lineages, as
well as extensive novel and previously reported functional data, suggest that the vertebrate ter-
ritory comprising the diencephalic neuromeric units corresponding to thalamus and pretec-
tum (prosomeres p2, p1), but not the prethalamus (p3), share with the midbrain a common
ontogenetic and evolutionary origin, and, altogether, are homologous to a nonregionalized
Pax4/6-positive domain in amphioxus, which we termed Diencephalo-Mesencephalic primor-
dium (DiMes). Whether resulting from an increase in complexity in vertebrates or, alterna-
tively, a simplification in amphioxus compared to the last common ancestor of chordates,
these results suggest that the differences in AP Bauplan complexity between the two lineages
are likely linked to the secondary organizers of vertebrates (ZLI and IsO), which are absent in
amphioxus. Experimental abrogation and manipulation of these organizers in vertebrate spe-
cies generate phenotypic defects that are consistent with this hypothesis.
Results
Molecular markers define and regionalize the amphioxus floor plate
AP and DV subdivisions in developing chordate neural tubes are defined according to axial
references. Conventionally, such references are provided in vertebrates by the axial mesoderm
(the notochord), the floor plate, roof plate, and alar–basal boundary within the lateral walls of
the neural tube, all of which are topologically parallel to each other (Fig 1). Amphioxus has a
notochord, which extends singularly beyond the forebrain [65], and a floor plate [66–70]. As
previously reported for the Floridan amphioxus Branchiostoma floridae [71,72], we observed
in the European amphioxus B. lanceolatum that the gene FoxA2-1 is a selective marker of the
notochord (Fig 2A–2A000, 2E and 2F), while Nkx2.1 seems to be a general floor plate marker at
the 7-somite neurula stage (Fig 2B–2B000). As in vertebrates, in which its expression in the floor
plate is transient [73], Nkx2.1 expression is highly dynamic during amphioxus CNS develop-
ment (S1 Fig). Nkx2.1 is observed along the entire presumptive floor plate at early- and mid-
larval stages, but it subsequently becomes restricted rostralwards.
Since the whole neural tube of amphioxus sits on top of the notochord, it should be, in the-
ory, regarded as topographically epichordal. Thus, as the floor plate is induced vertically by the
notochord [74–76], we a priori expected the amphioxus floor plate to extend all along the acro-
terminal neural midline (up to the neuropore), in contrast to the vertebrate floor plate, which
stops at the mamillary pouch of the hypothalamus, coinciding with the approximate position
of the rostral tip of the notochord (Fig 1A and 1B; [2,4]). Instead, we observed that the floor
plate, defined by Nkx2.1 expression, does not reach the anterior neural border, but it ends in a
slightly expanded median patch that recalls the mamillary hypothalamic ending observed in
vertebrates (Fig 2B and 2B0 insets, K; see also [66]). Interestingly, Hedgehog (Hh), which is a
well-established floor plate marker in vertebrates [74,77,78], and Nkx6 are also expressed in
the amphioxus floor plate, but their anterior limit of expression is more caudal than that of
Genoarchitecture of the amphioxus developing nervous system
PLOS Biology | https://doi.org/10.1371/journal.pbio.2001573 April 19, 2017 5 / 34

Nkx2.1 (Figs 2C–2C000, 2K, 2L and 7D–7D00; a similar expression for Hh has been reported in
B. floridae [69]). Goosecoid (Gsc) is also expressed in the floor plate (in contrast to previous
reports [79]) in a variable and patchy pattern that might reflect cyclic dynamic changes (Fig
2D–2D000). These markers differentiate two major floor plate AP regions: (i) a rostral-most
median floor domain characterized by only Nkx2.1 expression, which corresponds to the floor
plate of the forebrain region that we refer to as the amphioxus hypothalamo-prethalamic
Fig 2. Molecular regionalization of the amphioxus floor plate and axial mesoderm. (A-A0 0 0) FoxA2-1 is expressed throughout the notochord, as shown by
whole-mount in situ hybridization in dorsal (A) and lateral (A0) views and in situ hybridization in cryostat transversal sections (A0 0,A0 0 0). (B-B0 0 0) Nk2.1 mRNA is
expressed throughout the entire floor plate, as observed in dorsal (B) and lateral (B0) views, and in cryostat transversal sections (B0 0,B0 0 0). Insets in (B) and (B0)
show the combined FoxA2-1 and Nkx2.1 expression patterns using pseudocolors, indicating that Nkx2.1 is expressed above the notochord but does not reach its
rostral boundary. (C-C0 0 0) Hh mRNA is detected in most of the floor plate, with exception of the rostral-most portion (hypothalamo-prethalamic primordium [HyPTh]
floor plate) as observed in dorsal (C) and lateral (C’) views, and in cryostat transversal sections (C0 0, C0 0 0). (D-D0 0 0) Gsc expression is observed in different rostro-
caudal patches in dorsal (D) and lateral (D0) views and in cryostat transversal sections (D0 0, D0 0 0). E-J) Detailed analysis of the rostral end of the notochord using
whole-mount data at 18 h post fertilization (hpf) and 21 hpf stages further supports that FoxA2-1 (E,F) is present throughout the entire length of the notochord; IrxB
(G) and Hh (H,I) are absent rostrally and expressed caudally, and Six3/6 (I) is expressed only in the rostral tip. (K,L) The rostral molecular code (Six3/6 and
FoxA2-1 positive, but IrxB and Hh negative) is summarized in dorsal (K) and lateral (L) schematic representations. In cryostat sections, asterisks mark somites,
and arrowheads indicate neural expression; red and green dotted lines delineate the notochord and neural plate, respectively. Abbreviations: np, neural plate; ec,
ectoderm; en, endoderm; n, notochord; fp, floor plate; am, axial mesoderm. Scale bar: 50 μm.
https://doi.org/10.1371/journal.pbio.2001573.g002
Genoarchitecture of the amphioxus developing nervous system
PLOS Biology | https://doi.org/10.1371/journal.pbio.2001573 April 19, 2017 6 / 34

primordium (HyPTh; see below and Fig 2K and 2L); and (ii) the rest of the floor plate, defined
by Hh, Gsc, Nkx6, and Nkx2.1 expression.
Molecular heterogeneity of the amphioxus axial mesoderm: Notochord
and a possible prechordal primordium
We next examined the genoarchitecture of the amphioxus axial mesoderm to assess the exis-
tence of a putative prechordal plate homolog. According to the updated prosomeric model
[2,4], the latter tissue lies topologically rostral to the neural primordium and the notochord
(Fig 1B). As mentioned above, FoxA2-1 labels the whole amphioxus prospective notochord
(Fig 2A–2A000). On the other hand, the expression of both Hh and IrxB in the axial notochordal
tissue does not reach the rostral tip of the FoxA2-1–positive domain, stopping beneath the ros-
tral end of the Nkx2.1–positive HyPTh floor plate (Fig 2L, 2E–2J; it should be noted, however,
that IrxB expression seems to reach the anterior tip of the notochord in B. floridae [80]). More-
over, in the amphioxus axial mesoderm, Six3/6 expression was observed exclusively in the ros-
tral tip of the FoxA2-1–positive domain, beyond the Hh/IrxB–positive part of the notochord
(Fig 2K, 2L and 2J; see also [81]). Interestingly, this Six3/6 expression is maintained at later
stages, when the notochord is fully formed [81], indicating that its rostral tip has a distinct
molecular signature compared to the rest of the notochord. Remarkably, in vertebrates, Six3 is
expressed in the prechordal plate but not in the notochord at any level [24]; therefore, the ros-
tral notochordal tip of amphioxus might represent a possible prechordal plate homologue, pre-
viously unrecognized due to its histologic similarity to the notochord proper (see Discussion).
Finally, we found that Gbx expression appears restricted to a more caudal sector of the
notochord, whose rostral border is posterior to the caudal boundary of the HyPTh neural
domain (Figs 2K, 2L, 3F and 3L inset). Previous studies [37] and other observations described
below suggest that the Gbx-expressing domain of the notochord and overlying neural tissue
begins at the rostral end of the major region we term Rhombencephalo-Spinal primordium
(RhSp; Fig 2L). In summary, we observed that the amphioxus axial mesoderm is subdivided
molecularly into various regions, which have direct correspondence with major subdivisions
in the overlaying neural plate.
The incipient neural tube of amphioxus possesses distinct floor, basal,
and alar plates
Previous gene expression studies provided evidence for the presence of longitudinal zones
positioned parallel to the floor plate, implying DV patterning in the amphioxus CNS [69,82].
We thus investigated the extent of DV regionalization and its related boundaries by systemati-
cally searching for gene expression patterns with specific DV domains. We found that most of
the examined patterns could be classified into three groups (Figs 3–9): (i) peripheral genes,
with expression restricted to the periphery of the neural plate (future topologically dorsal or
alar zone; Six3/6, Lhx2/9b, Zic, Msx, Pax2/5/8, Pax3/7, Nova); (ii) internal genes, with expres-
sion domains respecting the former peripheral longitudinal zone (Pou3f, Sim, FoxD, Meis, Lef,Lhx1/5, Hox3, Hox6, FoxB); and (iii) pan-DV genes, expressed across both aforementioned
domains (Otx, Gbx, Fezf, Irx, Pax4/6, Six3/6, Nkx2.2, Meis, Rx, Hox1, Wnt3, Wnt7, Nova, Ebf).A few markers were ascribed to two of these categories since they have DV expression subdo-
mains that differ depending on the AP partition in which they are expressed (see below and
Fig 9). Altogether, these patterns suggest the existence of continuous basal and alar plate zones
that extend longitudinally throughout the amphioxus neural tube primordium. As in verte-
brates, the right and left moieties meet frontally around the rostral end of the floor plate (Fig
10A), as clearly exemplified by the alar expression of Lhx2/9b (Fig 6C0 and 6C00).
Genoarchitecture of the amphioxus developing nervous system
PLOS Biology | https://doi.org/10.1371/journal.pbio.2001573 April 19, 2017 7 / 34

Fig 3. Three major molecular anteroposterior (AP) regions are observed in the incipient amphioxus neural tube. (A) Whole-mount in situ
hybridization of chicken Otx2 at Hamburger–Hamilton 5 (HH5) stage. (B,C) Expression of amphioxus Otx at 21 h post fertilization (hpf) in dorsal (B) and
lateral (C) views. (D) Whole-mount in situ hybridization of chicken Gbx2 at HH5 stage. (E,F) Expression of amphioxus Gbx at 21 hpf in dorsal (E) and lateral
(F) views. G) Whole-mount in situ hybridization of chicken Fezf2 at HH5 stage. (H,I) Expression of amphioxus Otx at 21 hpf in dorsal (H) and lateral (I)
views. (J) Schematic representation of HH5 chicken neural plate with the archencephalic prototagma (ARCH) and deuteroencephalic prototagma (DEU)
domains depicted. The boundary between ARCH and DEU correspond to the border between Otx2 and Gbx2 expression patterns (A,D). (K,L) Double
chromogenic in situ hybridization combining amphioxus Fezf and Gbx probes in dorsal (K) and lateral (L) views, showing two subdivisions in the amphioxus
ARCH territory: a rostral hypothalamo-prethalamic primordium (HyPTh) domain (Fezf and Otx positive) and a caudal Di-Mesencephalic primordium (DiMes)
domain (Fezf negative and Otx positive) (L0). (M) Schematic representation of the three major AP subdivisions in the amphioxus central nervous system
(CNS) at the 21 hpf stage and the relative expression of their key markers. (N,O) Single chromogenic in situ hybridization with an amphioxus IrxB probe in
dorsal (N) an lateral (O) views. Insets in B, E, H, K, and N depict the neural components of the corresponding gene expression patterns. Arrowheads mark
the ARCH–DEU boundary, and asterisks mark the corresponding limit at the notochord level, based on Gbx expression. Abbreviations: n, notochord. Scale
bar: 50 μm.
https://doi.org/10.1371/journal.pbio.2001573.g003
Genoarchitecture of the amphioxus developing nervous system
PLOS Biology | https://doi.org/10.1371/journal.pbio.2001573 April 19, 2017 8 / 34
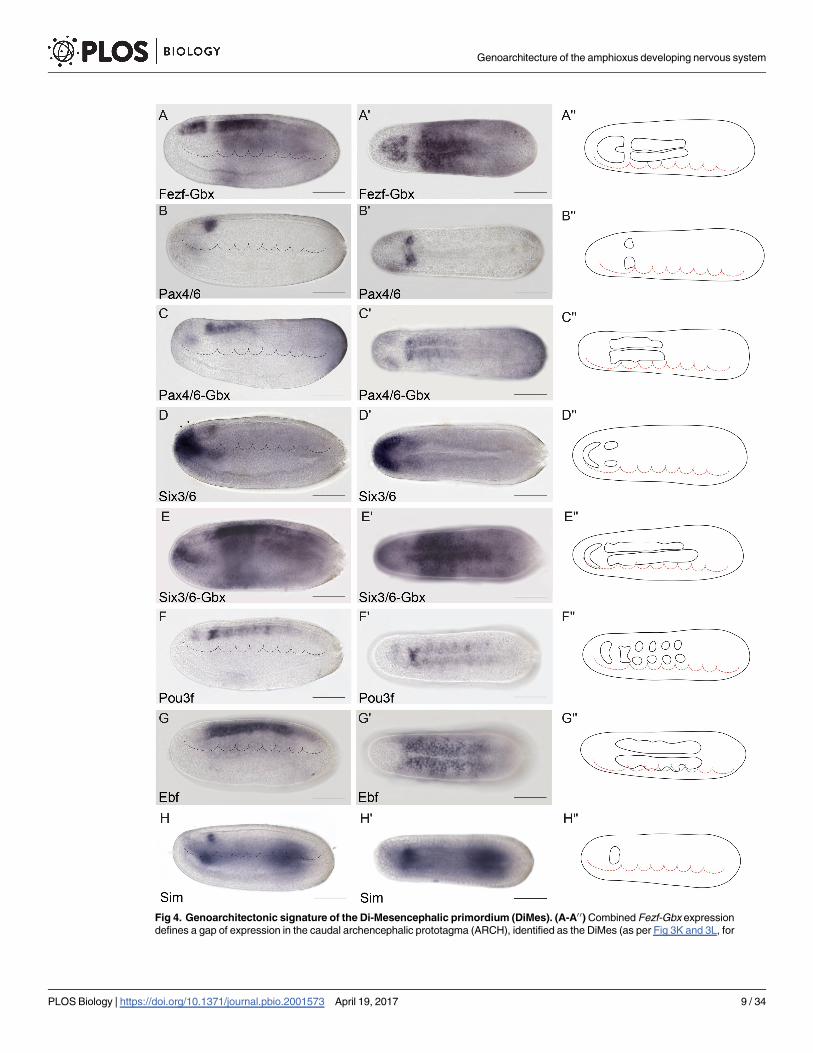
Fig 4. Genoarchitectonic signature of the Di-Mesencephalic primordium (DiMes). (A-A0 0) Combined Fezf-Gbx expression
defines a gap of expression in the caudal archencephalic prototagma (ARCH), identified as the DiMes (as per Fig 3K and 3L, for
Genoarchitecture of the amphioxus developing nervous system
PLOS Biology | https://doi.org/10.1371/journal.pbio.2001573 April 19, 2017 9 / 34

Conserved Otx and Gbx expression patterns define a primary AP
partition
In all vertebrates, dynamic antagonistic expression of Otx (rostral) and Gbx (caudal) in the
neural plate eventually reaches an equilibrium at the caudal end of the midbrain, defining the
MHB (Fig 3A and 3D; [5,83–88]). Clonal labeling studies performed in frogs at the 64 blasto-
mere stage showed that this is the earliest detectable brain transverse boundary [89]. A compa-
rable boundary is also present in amphioxus, aligned between the first and second somites
[37], which we further corroborated at the 7-somite neurula stage in B. lanceolatum (Fig 3B–
3F). Accordingly, it was suggested that the first intersomitic limit of amphioxus roughly marks
the genetic homolog of the MHB of vertebrates [37,52,53,58,90]. Thus, it can be postulated
that these early expression domains in both lineages define the boundary between a rostral
Otx-positive “archencephalic prototagma” (ARCH; Fig 3J and 3M) and a caudal Gbx-positive
“deuteroencephalic prototagma” (DEU; Fig 3J and 3M). In addition to Gbx, several other
amphioxus genes show specific expression within DEU at this stage, abutting rostrally the
ARCH–DEU boundary (Wnt3, Wnt7, FoxB, Pax2/5/8, and Msx; Figs 6G–6H00 and 7E–7G00).
The archencephalon is regionalized anteroposteriorly into the HyPTh
and DiMes regions
We previously showed that the ARCH domain can be subdivided anteroposteriorly based on
Fezf and Irx expression [36]. In both vertebrates and amphioxus, Fezf genes are expressed in
the rostral-most part of the CNS at early neural tube stages, creating an anterior subdomain
within the Otx-positive territory (Fig 3G–3I) and thus leaving a gap between the caudal end of
their expression and the start of that of Gbx in DEU (Fig 3K and 3L). On the other hand, Irxgenes are expressed within this gap, abutting rostrally with Fezf and extending posteriorly into
the Gbx-positive DEU tagma (Fig 3K–3O). Studies in Xenopus, zebrafish, and mice, comparing
Fezf and Irx expression patterns with fate mapping data, have shown that the transverse Fezf-Irx interface marks the prethalamo–thalamic boundary where the ZLI will develop [21,91–94].
Based on the expression patterns observed in the 7-somite amphioxus neurula, we accordingly
defined a rostral Fezf-positive HyPTh and a caudal Irx-positive DiMes intercalated between
the Fezf-positive and Gbx-positive domains (Fig 3K–3O). Remarkably, several genes, including
Pax4/6, Six3/6, Pou3f, and Sim, are expressed specifically or most strongly within the DiMes
(Fig 4, see also Fig 8A–8C00), supporting the distinct identity of this region. Moreover, other
genes in addition to Fezf appear restricted to HyPTh (e.g., Rx throughout it, Fig 5B and 5B00,
and FoxD in its basal plate subdomain, Fig 5C and 5C00; see also Figs 8D–8E00 and 9) or have
distinct expression subdomains within HyPTh (e.g., Nova, S2C and S200 Fig). On the other
hand, other markers, such as Ebf, are expressed caudally to the Fezf/Irx limit, similarly to the
three Irx genes (IrxA-C)(Figs 3N, 3O, 4G, 4G0, 6A and 6B00).
Triple fluorescent in situ hybridization and confocal 3-D reconstruction show that the Fezf-positive HyPTh, the Pax4/6-positive DiMes and the Gbx-positive RhSp domains abut sharply
reference). (B-E0 0) Whole-mount chromogenic in situ hybridization of Pax4/6 (B-B0 0) or Six3/6 (D-D0 0) alone or each one combined with
Gbx in a double in situ hybridization (C-C0 0 and E0-E0 0, respectively) reveal that both genes are expressed in the DiMes domain. The
two arrowheads in (D) indicate the expression of Six3/6 in Rostral-hypothalamo–prethalamic primordium (Rostral-HyPTh). (F-F0 0)
Pou3f is highly expressed in DiMes but with a decreased signal in the Rostral-HyPTh and Intermediate-HyPTh primordia and in some
areas of the deuteroencephalic prototagma (DEU). (G-G0 0) Ebf mRNA was detected in the DiMes and DEU domains. (H-H0 0) Sim
neural expression was observed exclusively in the DiMes domain at the analyzed stage. Expression patterns correspond to lateral
(A-H) or dorsal views (A0-H0) at the 21 h post fertilization (hpf) embryonic stage and are represented in schematics dorsal views (A0 0-
H0 0). Somites (dotted lines) were used as main landmarks to localize the position of the patterns analyzed in the late neural plate. Scale
bar: 50 μm.
https://doi.org/10.1371/journal.pbio.2001573.g004
Genoarchitecture of the amphioxus developing nervous system
PLOS Biology | https://doi.org/10.1371/journal.pbio.2001573 April 19, 2017 10 / 34

Fig 5. Genoarchitectonic signatures of the hypothalamo-prethalamic primordium (HyPTh) (I). (A-A0 0) Combined Fezf-Gbx
expression defines a Fezf-positive rostral archencephalic prototagma (ARCH) territory identified as HyPTh (as per Fig 3K and 3L, for
Genoarchitecture of the amphioxus developing nervous system
PLOS Biology | https://doi.org/10.1371/journal.pbio.2001573 April 19, 2017 11 / 34

one another. Interestingly, the intermediate domain, DiMes, is very small, consisting only of
two rows of cells along the AP dimension (Fig 8A–8B00). Analogous fluorescent in situ hybrid-
ization comparison of Fezf, Six3/6, and Gbx patterns shows that Six3/6 is also strongly
expressed in the DiMes compartment (Fig 8C–8C00). The Fezf and Gbx markers are expressed
with similar mutual relationships also at the 4/5-somite (early neurula) stage (S3A–S3B0 Fig),
leaving an expression gap where weak Six3/6 signal can already be detected (S3E–S3F0 Fig).
Therefore, both the ARCH/DEU limit and the HyPTh and DiMes subdivisions within ARCH
are established very early in amphioxus CNS development.
The HyPTh is divided into three AP domains
We next sought to identify further AP molecular partitions within the HyPTh and DiMes fore-
brain domains of the 7-somite neurula. Unlike the DiMes, for which we could not identify any
molecular subdivision, eight examined markers showed restricted expression domains within
HyPTh, sometimes limited to either alar or basal regions. Their combined pattern is consistent
with the existence of three AP subdivisions within the HyPTh, which we termed Rostral
HyPTh, Intermediate HyPTh and Caudal HyPTh (Rostral-HyPTh, Interm-HyPTh, Caudal-
HyPTh; Fig 10A; see Discussion for possible homology relationships with partitions in the ver-
tebrate forebrain). For instance, the expression of six rostral markers (Nkx2.2, Nova, Meis,Pou3f, Lef, Lhx2/9b) appears across Rostral-HyPTh and Interm-HyPTh, but seems to respect a
transverse double row of cells that lie anterior to the Irx-expressing DiMes; topologically, this
caudal negative domain of HyPTh (Caudal-HyPTh) would correspond in vertebrates to the
primordium of the prethalamic region (Fig 10A). This partition can be visualized as a gap of
negative labeling, e.g., by double in situ hybridization for Meis and IrxC or for Nkx2.2 and IrxB(Figs 5G–5G0 and 8F–8F00, respectively).
While Nkx2.2 and Nova signals are present at both alar and basal levels of Rostral-HyPTh
and Interm-HyPTh (but not in the corresponding part of the floor plate; Fig 5D–5D00 and
S3C–S3C00 Fig; see schematic details of expression in Fig 9), Pou3f, Meis, and Lef expression is
restricted to the local basal region (also respecting the floor plate; Figs 4F–4F00, 5F–5F00 and
5H–5H00, respectively), and Lhx2/9b expression appears selectively in the peripheral alar region
(Fig 6C–6C00). Six3/6 is the only studied marker restricted to the Rostral-HyPTh, specifically in
the alar plate (Figs 2J, 4D–4D00 and 8C–8C00; similar expression of Six3/6 in the anterior-most
part of the neural plate was also reported in B. floridae [81]). On the other hand, Zic, which is a
well-known marker of the alar and roof plates in the CNS of vertebrates [95], is expressed
throughout the presumptive alar plate of the HyPTh, but its expression is significantly stronger
at the Caudal-HyPTh, showing decreasing signal towards the rostral alar parts of the HyPTh
complex (S2G–S2G00 Fig). In contrast to the major HyPTh and DiMes partitions, the three
HyPTh molecular subdivisions are not fully established at the 4/5-somite stage (S3 Fig).
reference). (B-B0 0) Rx is specifically expressed throughout the entire HyPTh primordium. (C-C0 0) Neural expression of FoxD was
detected only in the basal and floor plates of HyPTh. (D-E0 0) Nkx2.2 is expressed in the Rostral-HyPTh and Interm-HyPTh domains
but not in Caudal-HyPTh (D-D0 0), as observed by a large gap in a double in situ hybridization for Nkx2.2 and Gbx (E-E0 0). (F-G0 0)
Similarly, Meis mRNA is only detected in the basal plate of the Rostral and Intermediate domains of HyPTh (F-F0 0), leaving a gap of
expression when combined with IrxC (G-G0 0). Further expression of Meis is also detected in specific deuteroencephalic prototagma
(DEU) areas (F-F0 0). (H-H0 0) Lef is expressed in the basal plate of Rostral-HyPTh and Interm-HyPTh. Expression patterns correspond
to lateral (A-H) or dorsal views (A0-H0) at the 21 h post fertilization (hpf) embryonic stage and are represented in schematics dorsal
views (A0 0-H0 0). Somites (dotted lines) were used as main landmarks to localize the position of the patterns analyzed in the late neural
plate. Scale bar: 50 μm.
https://doi.org/10.1371/journal.pbio.2001573.g005
Genoarchitecture of the amphioxus developing nervous system
PLOS Biology | https://doi.org/10.1371/journal.pbio.2001573 April 19, 2017 12 / 34

Fig 6. Genoarchitectonic signatures of the hypothalamo-prethalamic primordium (HyPTh) (II). (A-A0 0) IrxA mRNA expression is
observed from the HyPTh/Di-Mesencephalic primordium (DiMes) boundary extending caudally to the rostral portion of the Rhomben-
cephalo-Spinal primordium (RhSp) domain. (B-B0 0) IrxC mRNA expression is observed from the HyPTh/DiMes boundary, extending
Genoarchitecture of the amphioxus developing nervous system
PLOS Biology | https://doi.org/10.1371/journal.pbio.2001573 April 19, 2017 13 / 34

Anteroposterior regionalization of the amphioxus DEU domain
Numerous amphioxus genes have been previously reported to show iterative expression
domains within the DEU, suggesting the existence of characteristic subdivisions within this
partition ([96–99], and see S1 Table). Consistent with these studies, we identified several
molecular AP partitions within the rostral-most subdomain of DEU, referred to here as the
RhSp, which roughly ends caudal to the fifth somite at the 7-somite neurula stage (Figs 9C and
10A). Gbx, Wnt3, Wnt7, and FoxB appear selectively expressed throughout the RhSp; all of
them abut rostrally the DiMes/RhSp boundary, and their expression domains end at different
caudal levels, either coinciding with the end of somite five or extending further caudalwards
(Figs 3E, 3F, 6G–6G00, 6H–6H00 and 7E–7E00). Gbx, Wnt3, and Wnt7 occupy both alar and
basal regions (but not the floor plate), as previously described [37,100,101], while FoxB is
restricted to basal areas (Fig 7E; see also [102]). Hox1, Hox3, and Hox6 genes are also expressed
along alar and basal parts of the RhSp, with rostral expression borders that correspond with
the intersomitic limits S3/S4, S4/S5, and S5/S6, respectively (Fig 7A–7C00; see also [53–57]). As
mentioned above, these molecular partitions are complemented by patterns of iterated spots
with negative intervals, which can be aligned with the center (Lhx1/5 and Pou3f, Figs 6E–6E00
and 4F–4F00) or posterior half of the somites (Nova, S2C–S2C00 Fig) or the inter-somitic
boundaries (Pax3/7, S2E–S2E00 Fig). In the case of Pax2/5/8, patches are less well defined, par-
ticularly caudally, where they become nearly continuous (Fig 7F–7F00). Finally, some genes
show isolated spots of expression located at different positions within the RhSp AP subdivi-
sions: Msx (Fig 7G–7G00), Meis (Fig 5F–5F00), Zic (S2G–S2G00 Fig), Nkx6 (Fig 7D–7D00), and
Otp (Fig 6F–6F00), sometimes correlating with the prospective position of the future pigmented
photoreceptor spot.
Experimental suppression of the ZLI and IsO organizers in vertebrates
alters di-mesencephalic patterning and generates a remnant that
resembles the amphioxus DiMes
A major implication of our comparison of the overall CNS genoarchitecture between amphi-
oxus and vertebrates is that the small amphioxus Pax4/6-positive DiMes corresponds topologi-
cally to the large vertebrate region comprising the thalamus, pretectum, and midbrain (Fig
10A–10B00, see Discussion). Patterning of this territory in vertebrates occurs under the dual
control of the secondary brain organizers (ZLI and IsO, see Introduction), which induce the
molecular subdivision and differential growth of an initially Pax6-positive primordium.
Among other effects, these organizers inhibit the expression of Pax6 at the two ends of the ter-
ritory so that Pax6 signal becomes restricted to the caudal pretectum (p1) and the epithalamus
(dorsal-most part of p2)(Fig 11C0). Accordingly, we hypothesized that the small size and the
caudally to the rostral portion of the RhSp domain. (C-D0 0) Lhx2/9b marks the alar plate in the Rostral-HyPTh and Intermediate-HyPTh
domains (C-C0 0), as shown by a gap of expression in a double in situ hybridization between Lhx2/9b and IrxC (D-D0 0). The lateral view of
Six3/6 expression (inset in C) is provided for comparison with Lhx2/9b and highlights the restricted expression of Six3/6 to the Rostral-
HyPTh (compare the region between the arrow and the single arrowhead, which corresponds to the Rostral-HyPTh and Intermediate-
HyPTh domains, with the region between the arrow and double arrowhead, which includes only the Rostral-HyPTh domain (C,C0)). On the
other hand, a dorsal view of Fezf (inset in C0) shows expression across both the alar and basal plates of the HyPTh. (E,E0 0) Lhx1/5 mRNA
expression is observed only in the basal plate of the HyPTh and DiMes primordia and in some RhSp subdivisions (see inset in C0 for
comparison). (F-F0 0) Otp is a key hypothalamic marker in vertebrates but was only found in amphioxus in one domain at the RhSp region.
(G-H0 0) Wnt3 and Wnt7 mRNAs were detected from the DiMes/RhSp border, extending caudally in the entire RhSp region. Expression
patterns correspond to lateral (A-G) or dorsal views (A0-G0) at the 21 h post fertilization (hpf) embryonic stage and are represented in
schematics dorsal views (A0 0-G0 0). Somites (dotted lines) were used as main landmarks to localize the position of the patterns analyzed in
the late neural plate. Scale bar: 50 μm.
https://doi.org/10.1371/journal.pbio.2001573.g006
Genoarchitecture of the amphioxus developing nervous system
PLOS Biology | https://doi.org/10.1371/journal.pbio.2001573 April 19, 2017 14 / 34

Fig 7. Genoarchitectonic signatures of the Rhombencephalo-Spinal primordium (RhSp). (A-C0 0). Hox1, Hox3, and Hox6
were expressed in the alar and basal plates of some caudal domains of the RhSp region in a sequential rostro-caudal order. (D-D0 0)
Nkx6 was detected at different degrees of expression mainly at the floor plate of the Di-Mesencephalic primordium (DiMes) and
RhSp domains and a localized bilateral spot at the equivalent position of the fifth somite. (E-E´´) FoxB mRNA was observed
extending caudally from the DiMes/RhSp border into the basal plate of the entire RhSp region. (F-G´´) Pax2/5/8 and Msx mRNAs
were detected in some patches in the alar plate of the RhSp region. Expression patterns correspond to lateral (A-G) or dorsal views
(A0-G0) at the 21 h post fertilization (hpf) embryonic stage, and are represented in schematics dorsal views (A0 0-G0 0). Somites (dotted
lines) were used as main landmarks to localize the position of the patterns analyzed in the late neural plate. Scale bar: 50 μm.
https://doi.org/10.1371/journal.pbio.2001573.g007
Genoarchitecture of the amphioxus developing nervous system
PLOS Biology | https://doi.org/10.1371/journal.pbio.2001573 April 19, 2017 15 / 34

Fig 8. Precise genetic boundaries define three major anteroposterior (AP) partitions. (A-B0 0) Triple
fluorescent in situ hybridization combining Fezf-Pax4/6-Gbx in lateral (A) and dorsal views (A0) reveals clear-
cut boundaries between the hypothalamo–prethalamic primordium (HyPTh) Fezf+, the Di-Mesencephalic
Genoarchitecture of the amphioxus developing nervous system
PLOS Biology | https://doi.org/10.1371/journal.pbio.2001573 April 19, 2017 16 / 34

lack of internal regionalization of the DiMes, particularly with respect to Pax4/6 expression,
may be, at least in part, related to the absence of ZLI-like and IsO-like effects in amphioxus.
To gather support for this hypothesis, we turned first to loss-of-function transgenic mouse
lines in which either the ZLI or the IsO are absent. Double Fezf1-/-Fezf2-/- mutants [103] lack
the ZLI organizer and largely lose the molecular identity of the alar thalamic field, displaying
expanded expression of the pretectal markers Pax6+ and Ebf1+ (Fig 11B and 11B0–11B0000); the
midbrain was not altered in these mice. We also studied En1cre/+; Fgf8flox/flox mice (see Materi-
als and Methods) in which the IsO is deleted across the MHB [104]. The resulting phenotype
showed a reduction of the AP dimension of the pretecto-mesencephalic region down to one-
third of its normal size and an abnormal caudal expansion of PAX6 immunoreaction (as well
as of the posterior commissure), suggesting a lack of differential specification of the midbrain
versus the pretectum (Fig 11C and 11C0–11C0000); in this case, the thalamus seemed normal.
Next, we tried to eliminate both the ZLI and the IsO together in zebrafish, using quadruple
morpholino (4MO) treatment against otx1a, otx2, eng2a, and eng2b. Although effects in neural
progenitors of other areas cannot be ruled out, double morpholinos against otx1a and otx2were successfully used previously to specifically abolish the ZLI [105], while double morpho-
lino treatment against eng2a and eng2b caused the loss of the IsO [106], and expression of
pax6a throughout the midbrain remnant [107]. Strikingly, the normal pax6a-negative gaps
corresponding to the alar plate of the midbrain and diencephalic thalamus were abolished or
severely reduced in nearly all (84%) 4MO specimens tested (Fig 11F; n = 75, p = 3.84 × 10⁻³¹,
one-sided Fisher Exact test), often resulting in a continuous expression of pax6a between the
rostral conserved part of the forebrain and the hindbrain (Fig 11G, 11H, 11K and 11L and sagit-
tal sections in insets in Fig 11H and 11L). Supporting the effective suppression of the two orga-
nizers in this experiment, we observed disappearance of the dorsal ZLI spike expression of shhaand of the MHB-related transverse band of wnt1 expression (Fig 11D, 11E, 11H, 11I, 11L and
11M). In addition, all 4MO embryos showed a significant reduction of the zebrafish DiMes-like
remnant at 28 h post fertilization (hpf) compared to the controls (Fig 11G0 and 11K0).
Discussion
Previous studies using gene markers have shown that the developing amphioxus CNS displays
marked spatial molecular heterogeneity at different developmental stages ([61,97,102,108–
112] and see S1 Table). However, most of these studies focused on individual genes across
primordium (DiMes) Pax4/6+, and the Rhombencephalo-Spinal primordium (RhSp) Gbx+ regions; details are
summarized in a 3-D reconstruction (B,B0). A magnified view of Pax4/6 expression combined with DAPI showed
that the DiMes domain consists of two rows of cells along the AP axis (asterisks)(A0 0,B0 0). (C-C0 0) Triple fluorescent
in situ hybridization combining Fezf-Six3/6-Gbx probes in lateral (C) and dorsal views (C0) confirms a rostral Fezf
+ domain (HyPTh), a caudal Gbx+ domain (RhSp), and a double-negative domain in between characterized by
Six3/6 expression (DiMes). A magnified view (C0 0) helps to visualize a rostral domain with Six3/6 and Fezf coex-
pression (yellow staining, arrow) that we identified as the Rostral-HyPTh domain. (D-D0 0) Double fluorescent in situ
hybridization combining Rx and IrxB probes in lateral (D) and dorsal views (D´) show that Rx is expressed in the
entire HyPTh territory, stopping caudally at the HyPTh/DiMes boundary; details can be observed in the magnified
view (D0 0). (E-E0 0) Double fluorescent in situ hybridization combining FoxD and Pax4/6 probes in lateral (E), dorsal
(E0), and magnified dorsal (E0 0) views shows that the small territory expressing FoxD corresponds to the basal
plate of the entire HyPTh primordium, stopping caudally at the DiMes border. (F-F0 0) Double fluorescent in situ
hybridization combining Nk2.2 and IrxB probes in lateral (F), dorsal (F0), and magnified dorsal (F0 0) views deter-
mines that Nk2.2 is expressed only in the alar and basal plate of the Rostral-HyPTh and Intermediate-HyPTh
domains, leaving a negative gap corresponding to the Caudal-HyPTh domain. (G-G0) Double fluorescent in situ
hybridization combining Pax3/7 and Gbx probes identifies patches of Pax3/7 expression in the Caudal-HyPTh
domain. (H,H0) Double fluorescent in situ hybridization combining Nkx2.1 and IrxB probes shows that Nk2.1
expression in the floor plate extends rostrally beyond the HyPTh/DiMes boundary. Scale bar in A-H0: 50 μm
except A0 0 and B0 0, scale bar: 5 μm.
https://doi.org/10.1371/journal.pbio.2001573.g008
Genoarchitecture of the amphioxus developing nervous system
PLOS Biology | https://doi.org/10.1371/journal.pbio.2001573 April 19, 2017 17 / 34

diverse developmental time points, making it difficult to precisely compare the relative posi-
tions of their expression patterns and to elaborate a unified map. In this study, we built a com-
prehensive genoarchitectonic model of the amphioxus developing CNS by mapping many
gene markers at a single developmental stage, allowing homochronic comparisons of gene
expression patterns. We used 48 gene markers whose orthologs have known expression pat-
terns in the developing vertebrate CNS and a well-established morphological interpretation
within an explicit Bauplan (the updated prosomeric model [2,4]). We focused primarily on the
Fig 9. Schematic representation of informative markers used in this study. (A) Main tagmata and Hypothalamo-Prethalamic (HyPTh), Di-
Mesencephalic (DiMes), and Rhombencephalo-Spinal (RhSp) primordia. (B) HyPTh internal subdivisions. (C) RhSp internal subdivisions.
https://doi.org/10.1371/journal.pbio.2001573.g009
Genoarchitecture of the amphioxus developing nervous system
PLOS Biology | https://doi.org/10.1371/journal.pbio.2001573 April 19, 2017 18 / 34

Fig 10. Genoarchitectonic model of the developing central nervous system (CNS) at the amphioxus 7-somite neurula stage. (A) Summary of all
identified anteroposterior (AP) and dorsoventral (DV) partitions of the neural plate of amphioxus. (B-B0 0) Topological comparison of major molecular
subdivisions between cephalochordates and vertebrates. (C,C0) Neural plate model highlighting the basal and alar plates of Rostral-hypothalamo–
prethalamic primordium (Rostral-HyPTh) (orange) and the whole floor plate domain (gray) and its correspondence in a late larval stage (adapted from [90]).
(C0 0) Vertebrate neural tube highlighting the Terminal-Hypothalamic prosomere (orange) and the whole floor plate (grey).
https://doi.org/10.1371/journal.pbio.2001573.g010
Genoarchitecture of the amphioxus developing nervous system
PLOS Biology | https://doi.org/10.1371/journal.pbio.2001573 April 19, 2017 19 / 34
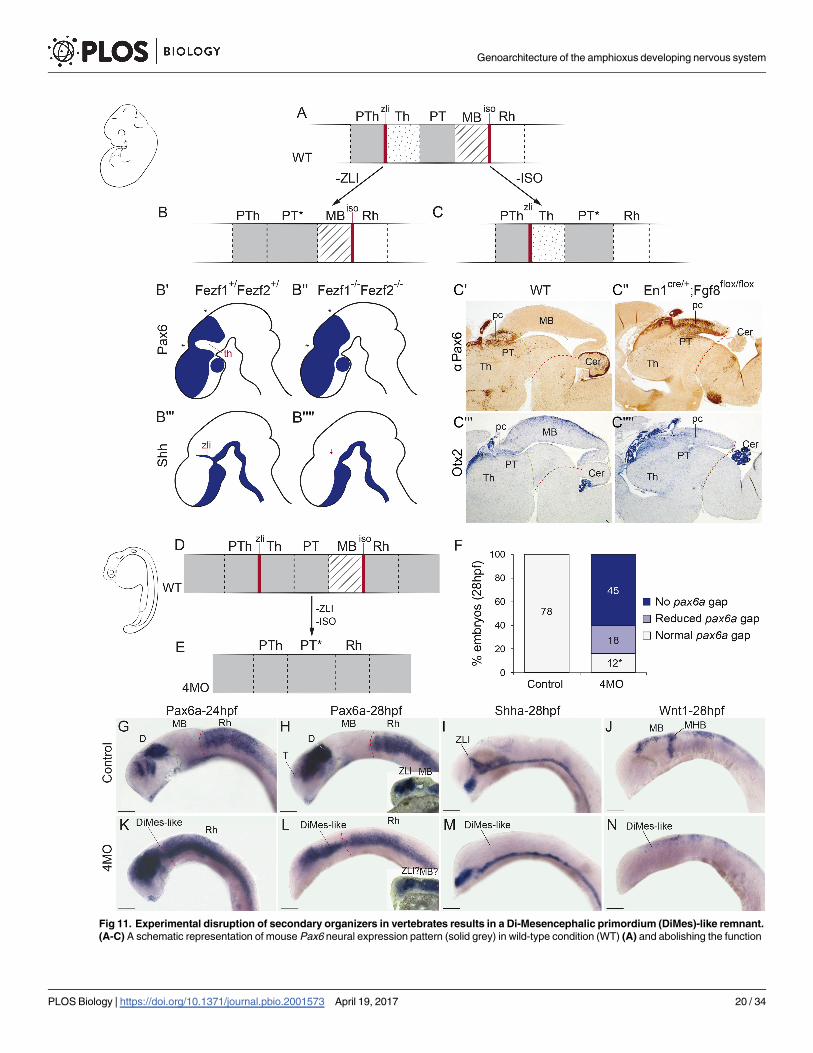
Fig 11. Experimental disruption of secondary organizers in vertebrates results in a Di-Mesencephalic primordium (DiMes)-like remnant.
(A-C) A schematic representation of mouse Pax6 neural expression pattern (solid grey) in wild-type condition (WT) (A) and abolishing the function
Genoarchitecture of the amphioxus developing nervous system
PLOS Biology | https://doi.org/10.1371/journal.pbio.2001573 April 19, 2017 20 / 34

7-somite neurula stage, in which the majority (43/48, 89.6%) of the examined gene markers
were expressed in the incipient neural tube. By the combination of these gene markers, we pro-
pose a genoarchitectonic model that, although simpler than that of vertebrates, reveals an
unexpected complexity of molecularly defined regions in the developing amphioxus CNS,
comprising at least nine AP and three distinct DV partitions (Fig 10). This model provides a
base for future exploration of the development of the amphioxus CNS at earlier and later
developmental stages and should help in elucidating the ontogenetic origins of larval and adult
brain structures. Furthermore, it allows direct topological comparisons with equivalent gen-
oarchitectonic models in vertebrates, since both lineages develop their CNS through homolo-
gous neural plates, providing more solid evidence for homology assignments between
topologically equivalent regions than mere similarities of relative gene expression patterns.
Integrative genoarchitectonic model of the amphioxus incipient neural
tube
Consistent with previous results [37,59,64], our data show that the incipient amphioxus neural
tube is molecularly divided anteroposteriorly into a rostral archencephalic (ARCH) and a cau-
dal deuterencephalic (DEU) portions from very early stages, similarly to vertebrates (Fig 10A
and 10B). Traditionally, three main AP divisions are defined in the vertebrate ARCH (Fig 1):
the secondary prosencephalon (encompassing hypothalamus plus telencephalon), the dien-
cephalon, and the midbrain. On the contrary, the ARCH of amphioxus shows only two main
divisions, which we termed DiMes and HyPTh (Fig 10B). DiMes is a small caudal region con-
sisting of two rows of cells that occupies the topological position corresponding in vertebrates
to the midbrain and the two diencephalic segments that lie caudal to the ZLI organizer; no
internal subdivisions were detected within DiMes. In contrast, the HyPTh encompasses three
molecularly distinct segments: a relatively large, bipartite, putative hypothalamus-homolog
region (where neither telencephalic nor optic vesicles are present [113]) plus a caudal region
that occupies the topological position corresponding to the vertebrate prethalamus. In the case
of the DEU, its rostral portion, referred to here as RhSp primordium, may represent a field-
homolog of the vertebrate hindbrain, and shows a number of gene expression patterns that
configure periodic segment-like territories (Fig 9C).
Notably, these major AP partitions of the developing CNS are mirrored by molecularly
defined subdivisions in the underlying axial mesoderm. Indeed, we provide evidence that the
distinct molecular entity at the rostral tip of the amphioxus notochord may be homologous to
the vertebrate prechordal plate, being thus essentially different from the notochord proper that
underlies the brain floor plate (Fig 2). This potentially prechordal region lies topologically ros-
tral to the HyPTh (not under it), as occurs with the prechordal plate in vertebrates [2,4], and is
characterized by the absence of Hh and Nkx6 and the specific expression of Six3/6, which is
also characteristic of the vertebrate prechordal plate [24]. Therefore, it is possible that this
of the zona limitans intrathalamica (ZLI) (B) or isthmic organizers (IsO) (C). (B0-B0 0 0 0) Drawings adapted from the results of Hirata et al. 2006 upon
ZLI abrogation during mouse development. (C0-C0 0) Immunohistochemical detection of αPax6. (C0 0 0-C0 0 0 0) In situ hybridizations for Otx. (C0) and
(C0 0 0) are WT expression domains of Pax6 and Otx, whereas (C0 0) and (C0 0 0 0) are conditional En2-Fgf8 knockout (KO) mice. (D,E) Schematic
representation of pax6a gene expression (solid grey) in zebrafish embryos in WT (D) or quadruple morpholino knockdown (4MO) of otx1a, otx2,
eng2a, and eng2b (E) conditions. (F) Quantification of the phenotypes observed upon 4MO treatment. All treated embryos showed a reduction in
the size of the gap, even those scored as normal (indicated by an asterisk). Embryos with “reduced pax6a gap” showed only a very small
expression gap, often with weak pax6a expression in it. Embryos with “no pax6a gap” had a continuous expression of the gene. (G-N) Expression
patterns of key genes in WT (G-J) or 4MO (K-N) embryos. Insets in H and L showed sagittal sections of a different representative embryo.
Sections of the indicated embryos. Abbreviations: Cer, cerebellum; D, diencephalon; Rh, rhombencephalon; pc, posterior commissure; pTh,
prethalamus; Th, thalamus; PT, pretectum; MB, midbrain; MHB, midbrain–hindbrain boundary; T, telencephalon. Anterior is to the left. Scale
bar = 100 μm.
https://doi.org/10.1371/journal.pbio.2001573.g011
Genoarchitecture of the amphioxus developing nervous system
PLOS Biology | https://doi.org/10.1371/journal.pbio.2001573 April 19, 2017 21 / 34

special notochord-looking region—which also shows unusual proliferation and rostralward
growth [70,114]—may correspond to a variant prechordal plate homolog and/or plays partly
equivalent signaling functions to this structure in amphioxus, despite the absence of some key
vertebrate prechordal markers (Gsc, noggin, and chordin [79,115]).
Finally, regarding DV patterning, multiple markers provide extensive evidence for continu-
ous molecularly distinct floor, basal, and alar zones throughout the length of the incipient neu-
ral tube (Figs 9 and 10). Although we did not find selective markers for the roof plate, it is
possible that these may exist at later stages, upon neural tube closure. Consistent with the idea
that the alar plate and roof plate are not differentially specified in amphioxus at these stages,
orthologs of several vertebrate neural plate border makers (e.g., Pax3/7, Msx, and Zic) were
found to be expressed broadly in the alar plate (Fig 9; observed also in B. floridae [116]).
Possible homology relationships between HyPTh partitions and
vertebrate forebrain neuromeres
According to the updated prosomeric model [4], the nontelencephalic part of the vertebrate
secondary prosencephalon can be subdivided into two main neuromeres: terminal (THy, hp2)
and peduncular (PHy, hp1) hypothalamic prosomeres. In addition, THy includes a specialized
rostral-most median part extending dorsoventrally, the acroterminal area [2,4,117](Fig 10C00).
This molecularly distinct domain produces a number of specialized formations along the DV
axis, including the alar preoptic lamina terminalis, the optic chiasma, the eye vesicles, the basal
median eminence, and the neurohypophysis.
In amphioxus, HyPTh represents a relatively large, molecularly distinct forebrain region
lying rostral to the DiMes. This domain has specific expression of Fezf throughout (Fig 9),
which is also absent caudal to the ZLI limit in vertebrates [93,103,118]. Our analysis suggests
that there are three molecularly distinct AP subdivisions within the amphioxus HyPTh, which
we termed Rostral-HyPTh, Interm-HyPTh, and Caudal-HyPTh. By direct topological ascrip-
tion, these might correspond, respectively, to the transverse THy (including a rostromedian
acroterminal region) and PHy hypothalamic segments and a prethalamus-like segment next to
the DiMes.
Six3/6 was the only studied marker that selectively labeled Rostral-HyPTh. Remarkably, in
mice, Six3 is expressed extensively dorsoventrally across the alar and basal zones of THy
(including the acroterminal area), whereas Six6 signal is restricted to a ventral suprachiasmatic
part of the THy acroterminal alar plate, but none of them are expressed at PHy [2,117]. These
data support a genetic equivalence between the Rostral-HyPTh and THy, in addition to their
topological correspondence. Moreover, amphioxus develops in its acroterminal region (orange
domain in Fig 10C and 10C0) a median primordial eye patch and, ventral to it, a median group
of “infundibular cells” [90], which are located above the most anterior floor plate cells (gray
cells in Fig 10C) and might represent a homologue of the vertebrate neurohypophysis. As men-
tioned above, in vertebrates, both the eyes and the neurohypophysis develop from the acro-
terminal area [2], further supporting the homology of vertebrate and amphioxus acroterminal
domains and thus of Rostral-HyPTh and THy (Fig 10C–10C00).
In the case of the Caudal-HyPTh primordium, its topological position, lying directly rostral
to the Fezf-Irx boundary, provides grounds to suggest field homology with the vertebrate pre-
thalamus. Importantly, previous studies indicate that Fezf genes are essential to specify the pre-
thalamic domain in vertebrates; however, unlike regions within the vertebrate DiMes
counterpart (see below), this specification is independent of the ZLI organizing activity and
occurs prior to its formation [93,103] and is thus compatible with the amphioxus scenario at
the examined stage. Nonetheless, it should be noted that, although more weakly expressed, the
Genoarchitecture of the amphioxus developing nervous system
PLOS Biology | https://doi.org/10.1371/journal.pbio.2001573 April 19, 2017 22 / 34

presence of Rx expression in Caudal-HyPTh (absent in the prethalamus of vertebrates [118]),
suggests the alternative possibility that this partition may represent a primordium homolog to
both the peduncular hypothalamus and prethalamic region.
Close developmental and evolutionary relationship of thalamus,
pretectum, and midbrain
One of the most striking implications of our results is that the small, Pax4/6-positive DiMes of
amphioxus corresponds topologically to the region comprising the vertebrate thalamus, pre-
tectum, and midbrain (Fig 10). While this area is not subdivided in amphioxus and consists
only of two cell rows at the neurula stage, the equivalent vertebrate region shows three major
partitions and extensive cell proliferation. These partitions in vertebrates originate during
development as a consequence of the action of the secondary brain organizers on a Pax6-posi-
tive primordium. In particular, Shh signaling from the ZLI is crucial for the specification of the
thalamus [6–8,119], and Fgf8 and Wnt1 expression from the IsO are necessary for proper mid-
brain specification and differential caudal growth [5,10,12,13,120–123]. Moreover, due to the
action of these organizers, the expression of Pax6 in this primordium is mainly restricted to
the pretectum and the epithalamus and becomes absent in the ventricular zone of the thalamus
and midbrain (Fig 11) [124,125].
Therefore, altogether, these data suggest that the vertebrate thalamus, pretectum, and mid-
brain share a common origin, both ontogenetically (from an early and transient Pax6-positive
area found between the prospective ZLI and IsO levels) and phylogenetically (homologous to
the amphioxus DiMes region). This hypothesis has two major implications for our under-
standing of the vertebrate brain Bauplan and its evolutionary origins. First, it implies that two
of the diencephalic prosomeres—pretectum (p1) and thalamus (p2)—are more evolutionarily
related to the midbrain than they are to the third diencephalic prosomere—the prethalamus
(p3)—which would, in turn, be more related with the secondary prosencephalon (see previous
section). That is, the diencephalon proper would be neither an evolutionarily nor an ontoge-
netically primordial subdivision of the vertebrate brain. This striking implication is further
supported by the differential responses of these regions to experimental manipulation of the
organizers and their associated signaling molecules. Chicken-quail heterotopic grafts of the
ZLI, as well as focalized ectopic expression of SHH using beads in chicken embryos, show that
only pretectum and midbrain, but not the prethalamus, are competent to be re-patterned to a
thalamic fate [6,7,119]. Similarly, quail-chick, rat-chick, or mouse-chick heterotopic grafts of
the IsO generate an ectopic midbrain in pretectal and thalamic regions, but never in the pre-
thalamus and secondary prosencephalon [126–129]. That is, thalamus, pretectum, and mid-
brain have similar developmental potentials that are not shared by the prethalamus. In fact,
our hypothesis provides a plausible ontogenetic explanation that has long been missing for
these intriguing observations, underscoring its explanatory power.
A second major related implication of our hypothesis is that the vertebrate thalamus, pre-
tectum, and midbrain jointly share altogether a common ancestor with the amphioxus DiMes.
Since neither Hh nor Fgf8 and Wnt1, the key morphogens involved in ZLI and IsO activity,
respectively, are expressed at the corresponding topological positions in amphioxus
[40,69,130–132], it is plausible to speculate that vertebrate thalamus, pretectum, and midbrain
partitions may have emerged evolutionarily from an ancestral Pax4/6-positive DiMes-like
region concomitantly to the evolution of the ZLI and IsO brain organizers as orthogonal sig-
naling centers. Alternatively, the undivided, small amphioxus DiMes may represent an evolu-
tionary simplification upon the loss of the organizers [47,48], if they were already patterning
the neural plate-derived CNS of the last common ancestor of chordates. Irrespectively, a major
Genoarchitecture of the amphioxus developing nervous system
PLOS Biology | https://doi.org/10.1371/journal.pbio.2001573 April 19, 2017 23 / 34

prediction of both evolutionary hypotheses is that suppression of the organizers during verte-
brate development should result in a (relatively) homogeneous, smaller, undivided, and fully
Pax6-positive region lying between recognizable prethalamus and hindbrain, as we observed
in mouse and zebrafish embryos with suppressed ZLI and/or IsO (Fig 11, and see also
[103,107,133–136]). Although the converse experiment—the induction of ectopic organizers
in amphioxus—is still not technically possible, future methodological developments could
allow assessing if and how the DiMes may respond to these morphogens.
Finally, an independent line of evidence supporting the functional homology between the
amphioxus DiMes and the corresponding vertebrate regions comes from the retinal projec-
tions in the two lineages. In vertebrates, primary eye projections target mainly the midbrain
(optic tectum/superior colliculus), while secondary eye projections target mainly the pretec-
tum and thalamus and, to a lesser extent, prethalamus and hypothalamus [137]. In amphioxus,
projections from the single frontal eye have recently been mapped to a Pax4/6-positive region
in the four gill slit larval stage [138], which likely corresponds to a DiMes derivative based on
its topological position and Pax4/6 expression.
Concluding remarks
Our comprehensive genoarchitectonic model of the developing amphioxus CNS at mid-neu-
rula stage sheds new light onto the origins of the vertebrate brain. First, it shows that the basic
blueprint of the vertebrate brain Bauplan was already present in the last common ancestor of
chordates. The major AP and DV partitions identified in amphioxus have direct topological
correspondence with vertebrate counterparts, even though these may be further elaborated in
vertebrates. Such is the case of the eye vesicles and the telencephalon developing as alar expan-
sions of a HyPTh-like region or the growth and regionalization of a DiMes-like region into
thalamus, pretectum, and mesencephalon. Secondly, it highlights the importance of the evolu-
tion of secondary organizers in the gain or loss of brain partitions. Thirdly, it allowed us to
propose novel homologies between amphioxus and vertebrate structures, such as the acro-
terminal hypothalamic area and the prechordal plate. Finally, it casts doubts on the relevance
of the classic separation between forebrain and midbrain in vertebrates from an evolutionary
and developmental perspective, suggesting that a redefinition of the main AP regions into
which the vertebrate brain is classically divided (forebrain, midbrain, and hindbrain) could
provide a better conceptual framework to understand the origins of the vertebrate brain.
Materials and methods
Ethics statement
All animal work in this study has been conducted following the Spanish and European legisla-
tion. Adult fish were only used to obtain eggs through natural mating (ethical committee
approval number: 635/2014). All mouse experiments were performed according to protocols
approved by the Universidad Miguel Hernandez OEP committee (UMH.IN.EP.01.13) and
Conselleria Generalitat Valenciana (2014/VSC/PEA/00055). Chicken experiments were per-
formed according to protocols approved by the ethical committee from the University of Mur-
cia (137/2015).
Gene annotation and cloning
For all the previously annotated genes in the B. floridae genome, primer pairs were designed to
span the full-length coding sequence when possible. A liquid cDNA library from different
developmental stages of the European amphioxus (B. lanceolatum) was screened by PCR using
Genoarchitecture of the amphioxus developing nervous system
PLOS Biology | https://doi.org/10.1371/journal.pbio.2001573 April 19, 2017 24 / 34
B. floridae specific primers. For previously unannotated genes, we performed tBLASTN
searches in the B. floridae JGI v1.0 genome, using the aminoacidic sequences of the vertebrate
orthologs. The corresponding genomic sequences were retrieved and a gene model was pre-
dicted by GeneWise2 and GeneScan, as previously described [139]. Cloned B. lanceolatummRNAs used for in situ hybridization are available in S2 Table.
Amphioxus embryo collection, whole-mount in situ hybridization, and
histology
Ripe adult amphioxus specimens were collected in Argelès-sur-mer, France. Spawning was
induced as previously described [140] in a dry laboratory in Barcelona, Spain. After in vitro
fertilization, embryos were cultured at 18 ºC for 15 h or 21 h (4/5 somite and 7 somite stages,
respectively) and fixed with 4% PFA in MOPS buffer overnight at 4˚C.
Chromogenic whole-mount in situ hybridization was performed as previously described
[36] using Nitrobluetetrazolium/bromochloroindolyl phosphate (NBT/BCIP) or BMP purple
(Roche) as chromogenic substrate for the final alkaline phosphatase. Following whole-mount
in situ hybridization, selected embryos were embedded in a 0.1 M PBS solution with 15% gela-
tine and 20% sucrose, frozen in isopentane, and sectioned with a cryostat at 12–14 μm-thick.
Double-fluorescent in situ hybridizations were performed essentially as nonfluorescent in situ
hybridizations, as described in [141] with two extra steps of incubation in 5% NAC and (50
mM DTT, 1% NP40, 0.5% SDS) in PBS1X before the hybridization step.
Dinitrophenol (DNP)-labeled antisense riboprobes were synthesized using DNP-11-UTP
labeling reagent (PerkinElmer), and DIG-labeled antisense riboprobes were synthesized using
DIG RNA labeling mix (Roche). Labeled riboprobes were detected using anti-DNP-POD (Per-
kin Elmer) and anti-DIG-POD (Roche) antibodies, and green and red fluorescent signals
amplified with TSA -Plus -Fluorescein and Tetrarhodamine systems (Perkin Elmer),
respectively.
Images were acquired using a Leica TCS-SPII confocal microscope or a Zeiss Axiophot.
Confocal datasets were deconvolved with Huygens Professional version 16.05 (Scientific Vol-
ume Imaging, The Netherlands, http://svi.nl), analyzed, and assembled with ImageJ; for panels
B and B0 in Fig 8, images were further processed with Imaris (7.2.3, Bitplane AG, software
available at http://bitplane.com).
Fish husbandry, morpholino treatments, and in situ hybridization in
zebrafish embryos
Breeding zebrafish (Danio rerio) were maintained at 28˚C on a 14 h light/10 h dark cycle as
described in [142]. To disrupt the ZLI and IsO secondary organizers together, we performed a
quadruple transient knockdown using four morpholino-antisense oligomers (MOs) that had
been previously described to abolish each of the organizers individually: otx1a and otx2 MO’s
for the ZLI [105], and eng2a and eng2b for the IsO [106]. As injection controls, we used a com-
bination of the two nontargeting MOs that were used in the original articles (a morpholino-
sense oligomer against twhh (Cont1) [105] and a standard control MO (Cont2) [106]). The
combination of experiment or control MOs was injected at the one-cell stage into the yolk at
the following concentrations (based on the original sources): otx1a (0.25 mM), otx2 (0.25
mM), eng2a (0.5 mM), eng2b (0.5 mM), Cont1 (0.5 mM), Cont2 (1 mM). Each embryo was
injected with 1.5 nl of the MO mix (injection of 1.0 nl produced similar, yet milder, pheno-
types, whereas injection of 2.0 nl resulted in full mortality). Four independent experiments
were performed (in different days), injecting approximately 100 eggs per condition and
experiment.
Genoarchitecture of the amphioxus developing nervous system
PLOS Biology | https://doi.org/10.1371/journal.pbio.2001573 April 19, 2017 25 / 34
Injected embryos were fixed in 4% PFA overnight at 4 ºC and used for whole-mount in situ
hybridization as previously described [143]. A subset of stained embryos was cryosectioned,
and both sections and whole embryos were mounted in 80% glycerol-PBS and photographed
in a Zeiss Axiophot microscope. The full list of probe sequences is available in S3 Table.
Analysis of gene knockouts in mice
The Fgf8 conditional mutant was generated by the Gail R. Martin laboratory [120], and the
transgenic mouse line expressing cre under the En1 promoter was generated in the Dr. Wolf-
gang Wurst laboratory [144]. Mutant embryos were generated by crossing double heterozy-
gous males (En1cre/+; Fgf8flox/+) with homozygous Fgf8flox/flox conditional females.
Immunohistochemistry (PAX-6) and in situ hybridization (Otx2) in paraffin sections were
performed as previously described [145]. The primary PAX-6 rabbit polyclonal IgG antibody
was diluted in PBTG (1:500; PRB-278P/Covance). The Otx2 probe was synthesized as in [86].
In situ hybridization in chicken embryos
All the procedures involving extraction of brain samples and further tissue processing were
done as previously described [146]. Fertilized chicken (Gallus gallus domesticus) eggs were
bought from a national farm (Granja Santa Isabel; Cordoba, Spain) and incubated at 38 ºC and
65% controlled humidity in a forced draft incubator until the Hamburger–Hamilton stage five
(HH5) [147]. Embryos were fixed by immersion in 4% paraformaldehyde in 0.1M phosphate
buffered saline (PBS, pH 7.4) during 16 h at 4 ºC. Whole-mount in situ hybridization was
done as previously described [146] using probes for Otx2 and Gbx2 reported in [24]. Fezf2probe was cloned using the following primers: F, GCTACAAACCCTTCGTCTGC and R,
GCTCAGGGTCACTTGCTACC.
Supporting information
S1 Fig. Temporal expression of Nk2.1 during amphioxus development. Lateral views (A-F,
F’), dorsal views (A’-E’), and schematic drawings (A”-F”) of the neural component of Nk2.1
gene expression pattern from 15 to 36 hours post-fertilization. Anterior is to the left except in
F. Somites are indicated using red dotted lines. Scale bar = 50μm.
(TIF)
S2 Fig. Additional gene markers used in this study. Other markers with neural expression
used in this study in lateral (A-G) or dorsal views (A’-G’), and drawings of the neural compo-
nent of each gene expression pattern with the relative position of somites (A”-G’). Markers
with no expression in the amphioxus developing CNS at this stage are showed in lateral (H-N)
and dorsal views (H’-N’). Anterior is to the left. Scale bar = 50μm.
(TIF)
S3 Fig. Expression of key gene markers at early neural stage.
(TIF)
S1 Table. Information on the neural expression of genes used in this study.
(XLSX)
S2 Table. Probes of amphioxus used for in situ hybridization.
(XLSX)
S3 Table. Probes of zebrafish used for in situ hybridization.
(XLSX)
Genoarchitecture of the amphioxus developing nervous system
PLOS Biology | https://doi.org/10.1371/journal.pbio.2001573 April 19, 2017 26 / 34

Acknowledgments
We thank Hector Escrivà and Stephanie Bertrand for providing access to amphioxus embryos,
Nicholas Holland, Linda Holland; and Sky Yu for helpful comments on the manuscript, and
Manel Bosch (CCiT-UB) for microscope imaging assistance.
Author Contributions
Conceptualization: Beatriz Albuixech-Crespo, Ignacio Maeso, Eduardo Puelles, Luis Puelles,
Manuel Irimia, Jose Luis Ferran.
Data curation: Beatriz Albuixech-Crespo, Ignacio Maeso, Manuel Irimia, Jose Luis Ferran.
Funding acquisition: Jordi Garcia-Fernàndez, Luis Puelles, Manuel Irimia, Jose Luis Ferran.
Investigation: Beatriz Albuixech-Crespo, Laura Lopez-Blanch, Demian Burguera, Luisa San-
chez-Arrones, Juan Antonio Moreno-Bravo, Ildiko Somorjai, Juan Pascual-Anaya, Manuel
Irimia, Jose Luis Ferran.
Methodology: Beatriz Albuixech-Crespo, Laura Lopez-Blanch, Demian Burguera, Luisa San-
chez-Arrones, Juan Antonio Moreno-Bravo, Ildiko Somorjai, Juan Pascual-Anaya, Manuel
Irimia, Jose Luis Ferran.
Project administration: Jordi Garcia-Fernàndez, Manuel Irimia.
Resources: Eduardo Puelles, Jordi Garcia-Fernàndez, Manuel Irimia, Jose Luis Ferran.
Supervision: Eduardo Puelles, Paola Bovolenta, Jordi Garcia-Fernàndez, Luis Puelles, Manuel
Irimia, Jose Luis Ferran.
Visualization: Beatriz Albuixech-Crespo, Luis Puelles, Manuel Irimia, Jose Luis Ferran.
Writing – original draft: Luis Puelles, Manuel Irimia, Jose Luis Ferran.
Writing – review & editing: Beatriz Albuixech-Crespo, Ignacio Maeso, Ildiko Somorjai, Juan
Pascual-Anaya, Paola Bovolenta, Luis Puelles, Manuel Irimia, Jose Luis Ferran.
References1. Nieuwenhuys R, Puelles L. Towards a New Neuromorphology. Cham: Springer International Publish-
ing; 2016.
2. Puelles L, Martinez-de-la-Torre M, Bardet SM, Rubenstein JLR. Hypothalamus. In: Watson C, Paxi-
nos G, Puelles L, editors. The mouse neurvous system, London, San Diego, CA: Academic Press/
Elsevier; 2012, p. 221–312.
3. Puelles L. Plan of the Developing Vertebrate Nervous System. In: Rubenstein JLR, Rakic P, editors.
Pattering and Cell Type Specification in the Developing CNS and PNS, vol. 1, Amsterdam: Academic
Press; 2013, p. 187–209.
4. Puelles L, Rubenstein JLR. A new scenario of hypothalamic organization: rationale of new hypotheses
introduced in the updated prosomeric model. Front Neuroanat 2015; 9:27. https://doi.org/10.3389/
fnana.2015.00027 PMID: 25852489
5. Hidalgo-Sanchez M, Millet S, Bloch-Gallego E, Alvarado-Mallart RM. Specification of the meso-
isthmo-cerebellar region: The Otx2/Gbx2 boundary. Brain Res Rev 2005; 49:134–49. https://doi.org/
10.1016/j.brainresrev.2005.01.010 PMID: 16111544
6. Kiecker C, Lumsden A. Hedgehog signaling from the ZLI regulates diencephalic regional identity. Nat
Neurosci 2004; 7:1242–9. https://doi.org/10.1038/nn1338 PMID: 15494730
7. Vieira C, Garda AL, Shimamura K, Martinez S. Thalamic development induced by Shh in the chick
embryo. Dev Biol 2005; 284:351–63. https://doi.org/10.1016/j.ydbio.2005.05.031 PMID: 16026780
8. Vue TY, Bluske K, Alishahi A, Yang LL, Koyano-Nakagawa N, Novitch B, et al. Sonic hedgehog signal-
ing controls thalamic progenitor identity and nuclei specification in mice. JNeurosci 2009; 29:4484–97.
Genoarchitecture of the amphioxus developing nervous system
PLOS Biology | https://doi.org/10.1371/journal.pbio.2001573 April 19, 2017 27 / 34

9. Crossley PH, Martinez S, Martin GR. Midbrain development induced by FGF8 in the chick embryo.
Nature 1996; 380:66–8. https://doi.org/10.1038/380066a0 PMID: 8598907
10. Lee SM, Danielian PS, Fritzsch B, McMahon AP. Evidence that FGF8 signalling from the midbrain-
hindbrain junction regulates growth and polarity in the developing midbrain. Development 1997;
124:959–69. PMID: 9056772
11. Martinez S, Crossley PH, Cobos I, Rubenstein JL, Martin GR. FGF8 induces formation of an ectopic
isthmic organizer and isthmocerebellar development via a repressive effect on Otx2 expression.
Development 1999; 126:1189–200. PMID: 10021338
12. Reifers F, Bohli H, Walsh EC, Crossley PH, Stainier DY, Brand M. Fgf8 is mutated in zebrafish acere-
bellar (ace) mutants and is required for maintenance of midbrain-hindbrain boundary development
and somitogenesis. Development 1998; 125:2381–95. PMID: 9609821
13. Vieira C, Pombero A, Garcıa-Lopez R, Gimeno L, Echevarria D, Martınez S. Molecular mechanisms
controlling brain development: An overview of neuroepithelial secondary organizers. Int J Dev Biol
2010; 54:7–20. https://doi.org/10.1387/ijdb.092853cv PMID: 19876817
14. Puelles L, Ferran JL. Concept of neural genoarchitecture and its genomic fundament. Front Neuroanat
2012; 6:47. https://doi.org/10.3389/fnana.2012.00047 PMID: 23181010
15. Shimamura K, Hartigan DJ, Martinez S, Puelles L, Rubenstein JL. Longitudinal organization of the
anterior neural plate and neural tube. Development 1995; 121:3923–33. PMID: 8575293
16. Nieuwenhuys R, Nicholson C. Lampreys, Petromyzontidae. In: Donkelar HJ, Nicholson, editors. The
Central Nervous System of Vertebrates, Berlin: Springer; 1998, p. 397–496.
17. Nieuwenhuys R. Deuterostome brains: synopsis and commentary. Brain ResBull 2002; 57:257–70.
18. Nieuwenhuys R. The forebrain of actinopterygians revisited. Brain BehavEvol 2009; 73:229–52.
19. Murakami Y, Uchida K, Rijli FM, Kuratani S. Evolution of the brain developmental plan: Insights from
agnathans. Dev Biol 2005; 280:249–59. https://doi.org/10.1016/j.ydbio.2005.02.008 PMID: 15882571
20. Osorio J, Mazan S, Retaux S. Organisation of the lamprey (Lampetra fluviatilis) embryonic brain:
insights from LIM-homeodomain, Pax and hedgehog genes. DevBiol 2005; 288:100–12.
21. Staudt N, Houart C. The prethalamus is established during gastrulation and influences diencephalic
regionalization. PLoS Biol 2007; 5:878–88.
22. Ferran JL, Sanchez-Arrones L, Bardet SM, Sandoval JE, Martınez-de-la-Torre M, Puelles L. Early pre-
tectal gene expression pattern shows a conserved anteroposterior tripartition in mouse and chicken.
Brain Res Bull 2008; 75:295–8. https://doi.org/10.1016/j.brainresbull.2007.10.039 PMID: 18331887
23. Ferran JL, de Oliveira ED, Merchan P, Sandoval JE, Sanchez-Arrones L, Martınez-de-la-Torre M,
et al. Genoarchitectonic profile of developing nuclear groups in the chicken pretectum. J Comp Neurol
2009; 517:405–51. https://doi.org/10.1002/cne.22115 PMID: 19790262
24. Sanchez-Arrones L, Ferran JL, Rodrıguez-Gallardo L, Puelles L. Incipient forebrain boundaries traced
by differential gene expression and fate mapping in the chick neural plate. Dev Biol 2009; 335:43–65.
https://doi.org/10.1016/j.ydbio.2009.08.012 PMID: 19699194
25. Morona R, Ferran JL, Puelles L, Gonzalez A. Embryonic genoarchitecture of the pretectum in Xeno-
pus laevis: A conserved pattern in tetrapods. J Comp Neurol 2011; 519:1024–50. https://doi.org/10.
1002/cne.22548 PMID: 21344401
26. Pose-Mendez S, Candal E, Mazan S, Rodrıguez-Moldes I. Genoarchitecture of the rostral hindbrain of
a shark: basis for understanding the emergence of the cerebellum at the agnathan-gnathostome tran-
sition. Brain Struct Funct 2016; 221:1321–35. https://doi.org/10.1007/s00429-014-0973-8 PMID:
25552316
27. Mueller T, Wullimann MF. An evolutionary interpretation of teleostean forebrain anatomy. Brain Beha-
vEvol 2009; 74:30–42.
28. Hauptmann G, Soll I, Gerster T. The early embryonic zebrafish forebrain is subdivided into molecularly
distinct transverse and longitudinal domains. Brain ResBull 2002; 57:371–5.
29. Lauter G, Soll I, Hauptmann G. Molecular characterization of prosomeric and intraprosomeric subdivi-
sions of the embryonic zebrafish diencephalon. JComp Neurol 2013; 521:1093–118.
30. Pombal MA, Megıas M, Bardet SM, Puelles L. New and old thoughts on the segmental organization of
the forebrain in lampreys. Brain Behav Evol 2009; 74:7–19. https://doi.org/10.1159/000229009 PMID:
19729892
31. Martınez-de-la-Torre M, Pombal MA, Puelles L. Distal-less-like protein distribution in the larval lam-
prey forebrain. Neuroscience 2011; 178:270–84. https://doi.org/10.1016/j.neuroscience.2010.12.030
PMID: 21185911
32. Morona R, Ferran JL, Puelles L, Gonzalez A. Gene expression analysis of developing cell groups in
the pretectal region of Xenopus laevis. JComp Neurol 2016; 0:1–38.
Genoarchitecture of the amphioxus developing nervous system
PLOS Biology | https://doi.org/10.1371/journal.pbio.2001573 April 19, 2017 28 / 34
33. Santos-Duran GN, Menuet A, Lagadec R, Mayeur H, Ferreiro-Galve S, Mazan S, et al. Prosomeric
organization of the hypothalamus in an elasmobranch, the catshark Scyliorhinus canicula. Front Neu-
roanat 2015; 9:37. https://doi.org/10.3389/fnana.2015.00037 PMID: 25904850
34. Sugahara F, Pascual-Anaya J, Oisi Y, Kuraku S, Aota S, Adachi N, et al. Evidence from cyclostomes
for complex regionalization of the ancestral vertebrate brain. Nature 2016; 531:97–100. https://doi.
org/10.1038/nature16518 PMID: 26878236
35. Hirth F, Kammermeier L, Frei E, Walldorf U, Noll M, Reichert H. An urbilaterian origin of the tripartite
brain: developmental genetic insights from Drosophila. Development 2003; 130:2365–73. PMID:
12702651
36. Irimia M, Piñeiro C, Maeso I, Gomez-Skarmeta JL, Casares F, Garcia-Fernàndez J, et al. Conserved
developmental expression of Fezf in chordates and Drosophila and the origin of the Zona Limitans
Intrathalamica (ZLI) brain organizer. Evodevo 2010; 1:7. https://doi.org/10.1186/2041-9139-1-7
PMID: 20849572
37. Castro LFC, Rasmussen SLK, Holland PWH, Holland ND, Holland LZ. A Gbx homeobox gene in
amphioxus: Insights into ancestry of the ANTP class and evolution of the midbrain/hindbrain boundary.
Dev Biol 2006; 295:40–51. https://doi.org/10.1016/j.ydbio.2006.03.003 PMID: 16687133
38. Kozmik Z, Holland ND, Kalousova A, Paces J, Schubert M, Holland LZ. Characterization of an amphi-
oxus paired box gene, AmphiPax2/5/8: developmental expression patterns in optic support cells,
nephridium, thyroid-like structures and pharyngeal gill slits, but not in the midbrain-hindbrain boundary
region. Development 1999; 126:1295–304. PMID: 10021347
39. Takahashi T, Holland PWH. Amphioxus and ascidian Dmbx homeobox genes give clues to the verte-
brate origins of midbrain development. Development 2004; 131:3285–94. https://doi.org/10.1242/dev.
01201 PMID: 15201221
40. Holland LZ, Kene M, Williams N a, Holland ND. Sequence and embryonic expression of the amphi-
oxus engrailed gene (AmphiEn): the metameric pattern of transcription resembles that of its segment-
polarity homolog in Drosophila. Development 1997; 124:1723–32. PMID: 9165120
41. Shimeld SM, Holland ND. Amphioxus molecular biology: insights into vertebrate evolution and devel-
opmental mechanisms. Can J Zool 2005; 83:90–100.
42. Arendt D, Denes AS, Jekely G, Tessmar-Raible K. The evolution of nervous system centralization.
Anim Evol Genomes, Foss Trees 2009; 363:1523–8.
43. Denes AS, Jekely G, Steinmetz PRH, Raible F, Snyman H, Prud’homme B, et al. Molecular Architec-
ture of Annelid Nerve Cord Supports Common Origin of Nervous System Centralization in Bilateria.
Cell 2007; 129:277–88. https://doi.org/10.1016/j.cell.2007.02.040 PMID: 17448990
44. Steinmetz PRH, Kostyuchenko RP, Fischer A, Arendt D. The segmental pattern of otx, gbx, and Hox
genes in the annelid Platynereis dumerilii. Evol Dev 2011; 13:72–9. https://doi.org/10.1111/j.1525-
142X.2010.00457.x PMID: 21210944
45. Lowe CJ, Terasaki M, Wu M, Freeman RM Jr., Runft L, Kwan K, et al. Dorsoventral patterning in hemi-
chordates: Insights into early chordate evolution. PLoS Biol 2006; 4:1603–19.
46. Lowe CJ, Wu M, Salic A, Evans L, Lander E, Stange-Thomann N, et al. Anteroposterior patterning in
hemichordates and the origins of the chordate nervous system. Cell 2003; 113:853–65. PMID:
12837244
47. Pani AM, Mullarkey EE, Aronowicz J, Assimacopoulos S, Grove EA, Lowe CJ. Ancient deuterostome
origins of vertebrate brain signalling centres. Nature 2012; 483:289–94. https://doi.org/10.1038/
nature10838 PMID: 22422262
48. Yao Y, Minor PJ, Zhao Y-T, Jeong Y, Pani AM, King AN, et al. Cis-regulatory architecture of a brain
signaling center predates the origin of chordates. Nat Genet 2016;48.
49. Wagner G. Homology, Genes, and Evolutionary Innovation. vol. XXXIII. princeton university press;
2014.
50. Dehal P, Satou Y, Campbell RK, Chapman J, Degnan B, De Tomaso A, et al. The Draft Genome of
Ciona intestinalis: Insights into Chordate and Vertebrate Origins. Science (80-) 2002;298.
51. Putnam NH, Butts T, Ferrier DEK, Furlong RF, Hellsten U, Kawashima T, et al. The amphioxus
genome and the evolution of the chordate karyotype. Nature 2008; 453:1064–71. https://doi.org/10.
1038/nature06967 PMID: 18563158
52. Williams N a Holland PW. Gene and domain duplication in the chordate Otx gene family: insights from
amphioxus Otx. Mol Biol Evol 1998; 15:600–7. PMID: 9580990
53. Wada H, Garcia-Fernandez J, Holland PW, Garcia-Fernàndez J, Holland PW. Colinear and segmental
expression of amphioxus Hox genes. Dev Biol 1999; 213:131–41. https://doi.org/10.1006/dbio.1999.
9369 PMID: 10452851
Genoarchitecture of the amphioxus developing nervous system
PLOS Biology | https://doi.org/10.1371/journal.pbio.2001573 April 19, 2017 29 / 34

54. Holland PW, Holland LZ, Williams N a, Holland ND. An amphioxus homeobox gene: sequence conser-
vation, spatial expression during development and insights into vertebrate evolution. Development
1992; 116:653–61. PMID: 1363226
55. Garcia-Fernandez J, Holland PW, Garcia-Fernandez J, Holland PW. Archetypal organization of the
amphioxus Hox gene cluster. Nature 1994; 370:563–6. https://doi.org/10.1038/370563a0 PMID:
7914353
56. Pascual-Anaya J, Adachi N, Alvarez S, Kuratani S, D’Aniello S, Garcia-Fernandez J, et al. Broken
colinearity of the amphioxus Hox cluster. Evodevo 2012; 3:28. https://doi.org/10.1186/2041-9139-3-
28 PMID: 23198682
57. Schubert M, Holland ND, Laudet V, Holland LZ. A retinoic acid-Hox hierarchy controls both anterior/
posterior patterning and neuronal specification in the developing central nervous system of the cepha-
lochordate amphioxus. Dev Biol 2006; 296:190–202. https://doi.org/10.1016/j.ydbio.2006.04.457
PMID: 16750825
58. Holland LZ, Holland ND. Chordate origins of the vertebrate central nervous system. Curr Opin Neuro-
biol 1999; 9:596–602. https://doi.org/10.1016/S0959-4388(99)00003-3 PMID: 10508734
59. Holland LZ, Carvalho JE, Escriva H, Laudet V, Schubert M, Shimeld SM, et al. Evolution of bilaterian
central nervous systems: a single origin? Evodevo 2013; 4:27. https://doi.org/10.1186/2041-9139-4-
27 PMID: 24098981
60. Bertrand S, Escriva H, EscrivàH. Evolutionary crossroads in developmental biology: amphioxus.
Development 2011; 138:2639–48.
61. Holland ND, Holland LZ, Holland PW. Scenarios for the making of vertebrates. Nature 2015; 520:450–
5. https://doi.org/10.1038/nature14433 PMID: 25903626
62. Northcutt RG. Origin of the Isthmus? A Comparison of the Brains of Lancelets and Vertebrates. J
Comp Neurol 2003; 466:316–8. https://doi.org/10.1002/cne.10892 PMID: 14556289
63. Northcutt RG. Evolution of centralized nervous systems: two schools of evolutionary thought. Proc
Natl Acad Sci U S A 2012; 109 Suppl:10626–33.
64. Holland LZ. Chordate roots of the vertebrate nervous system: expanding the molecular toolkit. Nat
Rev Neurosci 2009; 10:736–46. https://doi.org/10.1038/nrn2703 PMID: 19738625
65. Annona G, Holland ND, D ‘aniello S. Evolution of the notochord. Evodevo 2015; 6.
66. Lacalli TC. Cell morphology in amphioxus nerve cord may reflect the time course of cell differentiation.
Int J Dev Biol 2000; 44:903–6. PMID: 11206331
67. Lacalli TC. Sensory systems in amphioxus: A window on the ancestral chordate condition. Brain
Behav Evol 2004; 64:148–62. https://doi.org/10.1159/000079744 PMID: 15353907
68. Holland LZ, Holland ND. A revised fate map for amphioxus and the evolution of axial patterning in
chordates. Integr Comp Biol 2007; 47:360–72. https://doi.org/10.1093/icb/icm064 PMID: 21672845
69. Shimeld SM. The evolution of the hedgehog gene family in chordates: insights from amphioxus hedge-
hog. Dev Genes Evol 1999; 209:40–7. PMID: 9914417
70. Holland PW, Koschorz B, Holland LZ, Herrmann BG. Conservation of Brachyury (T) genes in amphi-
oxus and vertebrates: developmental and evolutionary implications. Development 1995; 121:4283–
91. PMID: 8575328
71. Terazawa K, Satoh N. Formation of the chordamesoderm in the amphioxus embryo: Analysis with
Brachyury and fork head/HNF-3 genes. Dev Genes Evol 1997; 207:1–11. https://doi.org/10.1007/
s004270050086 PMID: 20607475
72. Venkatesh T V., Holland ND, Holland LZ, Su MT, Bodmer R. Sequence and developmental expres-
sion of amphioxus AmphiNk2-1: Insights into the evolutionary origin of the vertebrate thyroid gland
and forebrain. Dev Genes Evol 1999; 209:254–9. PMID: 10079369
73. Pera EM, Kessel M. Demarcation of ventral territories by the homeobox gene NKX2.1 during early
chick development. DevGenes Evol 1998; 208:168–71.
74. Echelard Y, Epstein DJ, St-Jacques B, Shen L, Mohler J, McMahon JA, et al. Sonic hedgehog, a mem-
ber of a family of putative signaling molecules, is implicated in the regulation of CNS polarity. Cell
1993; 75:1417–30. PMID: 7916661
75. Roelink H, Augsburger A, Heemskerk J, Korzh V, Norlin S, Altaba A, et al. Floor plate and motor neu-
ron induction by vhh-1, a vertebrate homolog of hedgehog expressed by the notochord. Cell 1994;
76:761–75. PMID: 8124714
76. Muller F, Albert S, Blader P, Fischer N, Hallonet M, Strahle U. Direct action of the nodal-related signal
cyclops in induction of sonic hedgehog in the ventral midline of the CNS. Development 2000;
127:3889–97. PMID: 10952887
Genoarchitecture of the amphioxus developing nervous system
PLOS Biology | https://doi.org/10.1371/journal.pbio.2001573 April 19, 2017 30 / 34

77. Marti E, Takada R, Bumcrot DA, Sasaki H, McMahon AP. Distribution of Sonic hedgehog peptides in
the developing chick and mouse embryo. Development 1995; 121:2537–47. PMID: 7671817
78. Ekker SC, Ungar AR, Greenstein P, von Kessler DP, Porter JA, Moon RT, et al. Patterning activities of
vertebrate hedgehog proteins in the developing eye and brain. CurrBiol 1995; 5:944–55.
79. Neidert AH, Panopoulou G, Langeland JA. Amphioxus goosecoid and the evolution of the head orga-
nizer and prechordal plate. Evol Dev 2000; 2:303–10. PMID: 11256375
80. Kaltenbach SL, Holland LZ, Holland ND, Koop D. Developmental expression of the three iroquois
genes of amphioxus (BfIrxA, BfIrxB, and BfIrxC) with special attention to the gastrula organizer and
anteroposterior boundaries in the central nervous system. Gene Expr Patterns 2009; 9:329–34.
https://doi.org/10.1016/j.gep.2009.02.003 PMID: 19233318
81. Kozmik Z, Holland ND, Kreslova J, Oliveri D, Schubert M, Jonasova K, et al. Pax-Six-Eya-Dach net-
work during amphioxus development: Conservation in vitro but context specificity in vivo. Dev Biol
2007; 306:143–59. https://doi.org/10.1016/j.ydbio.2007.03.009 PMID: 17477914
82. Mazet F, Masood S, Luke GN, Holland ND, Shimeld SM. Expression of AmphiCoe, an Amphioxus
COE/EBF Gene, in the Developing Central Nervous System and Epidermal Sensory Neurons. Gene-
sis 2004; 38:58–65. https://doi.org/10.1002/gene.20006 PMID: 14994268
83. Simeone A, Acampora D, Mallamaci A, Stornaiuolo A, D’Apice MR, Nigro V, et al. A vertebrate gene
related to orthodenticle contains a homeodomain of the bicoid class and demarcates anterior neuroec-
toderm in the gastrulating mouse embryo. EMBO J 1993; 12:2735–47. PMID: 8101484
84. Shamim H, Mason I. Expression of Gbx-2 during early development of the chick embryo. MechDev
1998; 76:157–9.
85. Simeone A, Acampora D. The role of Otx2 in organizing the anterior patterning in mouse. IntJDevBiol
2001; 45:337–45.
86. Garda AL, Echevarrıa D, Martınez S. Neuroepithelial co-expression of Gbx2 and Otx2 precedes Fgf8
expression in the isthmic organizer. Mech Dev 2001; 101:111–8. PMID: 11231064
87. Rhinn M, Lun K, Amores A, Yan YL, Postlethwait JH, Brand M. Cloning, expression and relationship of
zebrafish gbx1 and gbx2 genes to Fgf signaling. MechDev 2003; 120:919–36.
88. Von Bubnoff A, Schmidt JE, Kimelman D. The Xenopus laevis homeobox gene Xgbx-2 is an early
marker of anteroposterior patterning in the ectoderm. MechDev 1996; 54:149–60.
89. Jacobson M, Hirose G. Clonal organization of the central nervous system of the frog. II. Clones stem-
ming from individual blastomeres of the 32- and 64-cell stages. JNeurosci 1981; 1:271–84.
90. Lacalli TC, Holland ND, West JE. Landmarks in the Anterior Central Nervous System of Amphioxus
Larvae. Philos Trans R Soc B Biol Sci 1994; 344:165–85.
91. Hashimoto H, Yabe T, Hirata T, Shimizu T, Bae Y, Yamanaka Y, et al. Expression of the zinc finger
gene fez-like in zebrafish forebrain. MechDev 2000; 97:191–5.
92. Matsuo-Takasaki M, Lim JH, Beanan MJ, Sato SM, Sargent TD. Cloning and expression of a novel
zinc finger gene, Fez, transcribed in the forebrain of Xenopus and mouse embryos. MechDev 2000;
93:201–4.
93. Jeong JY, Einhorn Z, Mathur P, Chen L, Lee S, Kawakami K, et al. Patterning the zebrafish diencepha-
lon by the conserved zinc-finger protein Fezl. Development 2007; 134:127–36. https://doi.org/10.
1242/dev.02705 PMID: 17164418
94. Rodrıguez-Seguel E, Alarcon P, Gomez-Skarmeta JL. The Xenopus Irx genes are essential for neural
patterning and define the border between prethalamus and thalamus through mutual antagonism with
the anterior repressors Fezf and Arx. Dev Biol 2009; 329:258–68. https://doi.org/10.1016/j.ydbio.
2009.02.028 PMID: 19268445
95. Nagai T, Aruga J, Takada S, Gunther T, Sporle R, Schughart K, et al. The expression of the mouse
Zic1, Zic2, and Zic3 gene suggests an essential role for Zic genes in body pattern formation. DevBiol
1997; 182:299–313.
96. Langeland JA, Holland LZ, Chastain RA, Holland ND. An amphioxus LIM-homeobox gene, Amphi-
Lim1/5, expressed early in the invaginating organizer region and later in differentiating cells of the kid-
ney and central nervous system 2006; 2:110–6. PMID: 16763670
97. Candiani S, Castagnola P, Oliveri D, Pestarino M. Cloning and developmental expression of
AmphiBrn1/2/4, a POU III gene in amphioxus. Mech Dev 2002; 116:231–4. PMID: 12128231
98. Sharman AC, Shimeld SM, Holland PW. An amphioxus Msx gene expressed predominantly in the dor-
sal neural tube. Dev Genes Evol 1999; 209:260–3. PMID: 10079370
99. Holland LZ, Schubert M, Kozmik Z, Holland ND. AmphiPax3/7, an amphioxus paired box gene:
insights into chordate myogenesis, neurogenesis, and the possible evolutionary precursor of definitive
vertebrate neural crest. Evol Dev 1999; 1:153–65. PMID: 11324100
Genoarchitecture of the amphioxus developing nervous system
PLOS Biology | https://doi.org/10.1371/journal.pbio.2001573 April 19, 2017 31 / 34

100. Schubert M, Holland LZ, Stokes MD, Holland ND. Three amphioxus Wnt genes (AmphiWnt3,
AmphiWnt5, and AmphiWnt6) associated with the tail bud: the evolution of somitogenesis in chor-
dates. Dev Biol 2001; 240:262–73. https://doi.org/10.1006/dbio.2001.0460 PMID: 11784062
101. Somorjai I, Bertrand S, Camasses A, Haguenauer A, Escriva H. Evidence for stasis and not genetic
piracy in developmental expression patterns of Branchiostoma lanceolatum and Branchiostoma flori-
dae, two amphioxus species that have evolved independently over the course of 200 Myr. Dev Genes
Evol 2008; 218:703–13. https://doi.org/10.1007/s00427-008-0256-6 PMID: 18843503
102. Mazet F, Shimeld SM. The evolution of chordate neural segmentation. Dev Biol 2002; 251:258–70.
PMID: 12435356
103. Hirata T. Zinc-finger genes Fez and Fez-like function in the establishment of diencephalon subdivi-
sions. Development 2006; 133:3993–4004. https://doi.org/10.1242/dev.02585 PMID: 16971467
104. Chi CL, Martinez S, Wurst W, Martin GR. The isthmic organizer signal FGF8 is required for cell sur-
vival in the prospective midbrain and cerebellum. Development 2003; 130:2633–44. PMID: 12736208
105. Scholpp S, Foucher I, Staudt N, Peukert D, Lumsden A, Houart C. Otx1l, Otx2 and Irx1b establish and
position the ZLI in the diencephalon. Development 2007; 134:3167–76. https://doi.org/10.1242/dev.
001461 PMID: 17670791
106. Scholpp S, Brand M. Morpholino-Induced Knockdown of Zebrafish Engrailed Genes eng2 and eng3
Reveals Redundant and Unique Functions in Midbrain–Hindbrain Boundary Development 2001;
133:129–33.
107. Scholpp S, Brand M. Integrity of the Midbrain Region Is Required to Maintain the Diencephalic-Mesen-
cephalic Boundary in Zebrafish no isthmus/pax2.1 Mutants. Dev Dyn 2003; 228:313–22. https://doi.
org/10.1002/dvdy.10384 PMID: 14579372
108. Holland LZ. Evolution of basal deuterostome nervous systems. J Exp Biol 2015; 218:637–45. https://
doi.org/10.1242/jeb.109108 PMID: 25696827
109. Holland LZ, Schubert M, Holland ND, Neuman T. Evolutionary conservation of the presumptive neural
plate markers AmphiSox1/2/3 and AmphiNeurogenin in the invertebrate chordate amphioxus. Dev
Biol 2000; 226:18–33. https://doi.org/10.1006/dbio.2000.9810 PMID: 10993671
110. Schubert M, Holland LZ, Panopoulou GD, Lehrach H, Holland ND. Characterization of amphioxus
AmphiWnt8: insights into the evolution of patterning of the embryonic dorsoventral axis. Evol Dev
2000; 2:85–92. PMID: 11258394
111. Shimeld SM, van den Heuvel M, Dawber R, Briscoe J. An amphioxus Gli gene reveals conservation of
midline patterning and the evolution of hedgehog signalling diversity in chordates. PLoS ONE 2007; 2:
e864. https://doi.org/10.1371/journal.pone.0000864 PMID: 17848995
112. Gostling NJ, Shimeld SM. Protochordate Zic genes define primitive somite compartments and high-
light molecular changes underlying neural crest evolution. Evol Dev 2003; 5:136–44. PMID: 12622730
113. Lacalli TC. Frontal Eye Circuitry, Rostral Sensory Pathways and Brain Organization in Amphioxus Lar-
vae: Evidence from 3D Reconstructions. Philos Trans R Soc B Biol Sci 1996; 351:243–63.
114. Holland ND, Holland LZ. Stage- and tissue-specific patterns of cell division in embryonic and larval tis-
sues of amphioxus during normal development. Evol Dev 2006; 8:142–9. https://doi.org/10.1111/j.
1525-142X.2006.00085.x PMID: 16509893
115. Yu J-KK, Satou Y, Holland ND, Shin-I T, Kohara Y, Satoh N, et al. Axial patterning in cephalochordates
and the evolution of the organizer. Nature 2007; 445:613–7. https://doi.org/10.1038/nature05472
PMID: 17237766
116. Yu J, Meulemans D, Mckeown SJ, Bronner-fraser M. Insights from the amphioxus genome on the ori-
gin of vertebrate neural crest 2008:1127–32. https://doi.org/10.1101/gr.076208.108 PMID: 18562679
117. Ferran JL, Puelles L, Rubenstein JLR. Molecular codes defining rostrocaudal domains in the embry-
onic mouse hypothalamus. Front Neuroanat 2015; 9:46. https://doi.org/10.3389/fnana.2015.00046
PMID: 25941476
118. Lu F, Kar D, Gruenig N, Zhang ZW, Cousins N, Rodgers HM, et al. Rax Is a Selector Gene for Medio-
basal Hypothalamic Cell Types. J Neurosci 2013; 33:259–72. https://doi.org/10.1523/JNEUROSCI.
0913-12.2013 PMID: 23283339
119. Vieira C, Martinez S. Sonic hedgehog from the basal plate and the zona limitans intrathalamica exhib-
its differential activity on diencephalic molecular regionalization and nuclear structure. Neuroscience
2006; 143:129–40. https://doi.org/10.1016/j.neuroscience.2006.08.032 PMID: 17045408
120. Meyers EN, Lewandoski M, Martin GR. An Fgf8 mutant allelic series generated by Cre- and Flp-medi-
ated recombination. NatGenet 1998; 18:136–41.
121. McMahon AP, Bradley A. The Wnt-1 (int-1) proto-oncogene is required for development of a large
region of the mouse brain. Cell 1990; 62:1073–85. PMID: 2205396
Genoarchitecture of the amphioxus developing nervous system
PLOS Biology | https://doi.org/10.1371/journal.pbio.2001573 April 19, 2017 32 / 34

122. Thomas KR, Capecchi MR. Targeted disruption of the murine int-1 proto-oncogene resulting in severe
abnormalities in midbrain and cerebellar development. Nature 1990; 346:847–50. https://doi.org/10.
1038/346847a0 PMID: 2202907
123. McMahon AP, Joyner AL, Bradley A, McMahon JA. The midbrain-hindbrain phenotype of Wnt-1-/Wnt-
1- mice results from stepwise deletion of engrailed-expressing cells by 9.5 days postcoitum. Cell 1992;
69:581–95. PMID: 1534034
124. Mastick GS, Davis NM, Andrew GL, Easter SS, Acampora D, Mazan S, et al. Pax-6 functions in
boundary formation and axon guidance in the embryonic mouse forebrain. Development 1997;
124:1985–97. PMID: 9169845
125. Ferran JL, Sanchez-Arrones L, Sandoval JE, Puelles L. A model of early molecular regionalization in
the chicken embryonic pretectum. J Comp Neurol 2007; 505:379–403. https://doi.org/10.1002/cne.
21493 PMID: 17912743
126. Gardner CA, Barald KF. The cellular environment controls the expression of engrailed-like protein in
the cranial neuroepithelium of quail-chick chimeric embryos. Development 1991; 113:1037–48. PMID:
1687983
127. Martinez S, Wassef M, Alvarado-Mallart RM. Induction of a mesencephalic phenotype in the 2-day-old
chick prosencephalon is preceded by the early expression of the homeobox gene en. Neuron 1991;
6:971–81. PMID: 1675863
128. Bally-Cuif L, Alvarado-Mallart RM, Darnell DK, Wassef M. Relationship between Wnt-1 and En-2
expression domains during early development of normal and ectopic met-mesencephalon. Develop-
ment 1992; 115:999–1009. PMID: 1360404
129. Bloch-Gallego E, Millet S, Alvarado-Mallart RM. Further observations on the susceptibility of dience-
phalic prosomeres to En-2 induction and on the resulting histogenetic capabilities. Mech Dev 1996;
58:51–63. PMID: 8887316
130. Holland LZ, Holland NN, Schubert M. Developmental expression of AmphiWnt1, an amphioxus gene
in the Wnt1/wingless subfamily. DevGenes Evol 2000; 210:522–4.
131. Bertrand S, Camasses A, Somorjai I, Belgacem MR, Chabrol O, Escande M-LL, et al. Amphioxus
FGF signaling predicts the acquisition of vertebrate morphological traits. Proc Natl Acad Sci U S A
2011; 108:9160–5. https://doi.org/10.1073/pnas.1014235108 PMID: 21571634
132. Shimeld SM. C2H2 zinc finger genes of the Gli, Zic, KLF, SP, Wilms’ tumour, Huckebein, Snail, Ovo,
Spalt, Odd, Blimp-1, Fez and related gene families from Branchiostoma floridae. Dev Genes Evol
2008; 218:639–49. https://doi.org/10.1007/s00427-008-0248-6 PMID: 18795322
133. Lavado A, Lagutin O V, Oliver G. Six3 inactivation causes progressive caudalization and aberrant pat-
terning of the mammalian diencephalon. Development 2008; 135:441–50. https://doi.org/10.1242/
dev.010082 PMID: 18094027
134. Schwarz M, Alvarez-Bolado G, Urbanek P, Busslinger M, Gruss P. Conserved biological function
between Pax-2 and Pax-5 in midbrain and cerebellum development: evidence from targeted muta-
tions. ProcNatlAcadSciUSA 1997; 94:14518–23.
135. Schwarz M, Alvarez-Bolado G, Dressler G, Urbanek Pavel, Busslinger M, Gruss P. Pax2/5 and Pax6
subdivide the early neural tube into three domains. Mech Dev 1999; 82:29–39. PMID: 10354469
136. Urbanek P, Fetka I, Meisler MH, Busslinger M, Urbanek P, Fetka I, et al. Cooperation of Pax2 and
Pax5 in midbrain and cerebellum development. Proc Natl Acad Sci U S A 1997; 94:5703–8. PMID:
9159136
137. Hardie R. Visual System. In: Watson C, Paxinos G, Puelles L, editors. The mouse nervous system,
Amsterdam: Academic Press/Elsevier; 2007, p. 1–26.
138. Suzuki DG, Murakami Y, Escriva H, Wada H. A comparative examination of neural circuit and brain
patterning between the lamprey and amphioxus reveals the evolutionary origin of the vertebrate visual
center. J Comp Neurol 2014; 0:1–11.
139. D’Aniello S, Irimia M, Maeso I, Pascual-Anaya J, Jimenez-Delgado S, Bertrand S, et al. Gene expan-
sion and retention leads to a diverse tyrosine kinase superfamily in amphioxus. Mol Biol Evol 2008;
25:1841–54. https://doi.org/10.1093/molbev/msn132 PMID: 18550616
140. Fuentes M, Benito E, Bertrand S, Paris M, Mignardor A, Godoy L, et al. Insights Into Spawning Behav-
ior and Development of the European Amphioxus (Branchiostoma lanceolatum). J Exp Zool B Mol
Dev Evol 2007; 308:484–93. https://doi.org/10.1002/jez.b.21179 PMID: 17520703
141. Yu JKS, Holland LZ. Amphioxus whole-mount in situ hybridization. Cold Spring Harb Protoc 2009;
4:1–7.
142. Westerfield M. The zebrafish book. A guide for the laboratory use of zebrafish (Danio rerio). 4th ed.
Univ. of Oregon Press; 2000.
Genoarchitecture of the amphioxus developing nervous system
PLOS Biology | https://doi.org/10.1371/journal.pbio.2001573 April 19, 2017 33 / 34

143. Thisse C, Thisse B. High-resolution in situ hybridization to whole-mount zebrafish embryos. Nat Protoc
2008; 3:59–69. https://doi.org/10.1038/nprot.2007.514 PMID: 18193022
144. Kimmel RA, Turnbull DH, Blanquet V, Wurst W, Loomis CA, Joyner AL. Two lineage boundaries coor-
dinate vertebrate apical ectodermal ridge formation. Genes Dev 2000; 14:1377–89. PMID: 10837030
145. Ferran JL, Ayad A, Merchan P, Morales-Delgado N, Sanchez-Arrones L, Alonso A, et al. Exploring
Brain Genoarchitecture by Single and Double Chromogenic In Situ Hybridization (ISH) and Immuno-
histochemistry (IHC) in Whole-Mount Embryos. In: Hauptmann G, editor. In Situ Hybridization Meth-
ods, vol. 99, Neuromethods; 2015, p. 61–82.
146. Ferran JL, Ayad A, Merchan P, Morales-Delgado N, Sanchez-Arrones L, Alonso A, et al. Exploring
Brain Genoarchitecture by Single and Double Chromogenic In Situ Hybridization (ISH) and Immuno-
histochemistry (IHC) on Cryostat, Paraffi n, or Floating Sections. In: Hauptmann G, editor. In Situ
Hybridization Methods, vol. 99, Neuromethods; 2015, p. 83–107.
147. Hamburger V, Hamilton HL. A series of normal stages in the development of the chick embryo. JMor-
phol 1951; 88:49–92.
Genoarchitecture of the amphioxus developing nervous system
PLOS Biology | https://doi.org/10.1371/journal.pbio.2001573 April 19, 2017 34 / 34

Artículo anexo 3


Stepwise assembly of the Nova-regulated alternativesplicing network in the vertebrate brainManuel Irimiaa,1,2, Amanda Denuca, Demián Burgueraa, Ildiko Somorjaia, Jose M. Martín-Durána, Grigory Genikhovichb,Senda Jimenez-Delgadoa,3, Ulrich Technaub, Scott W. Royc,1, Gemma Marfanya,d,1, and Jordi Garcia-Fernàndeza,d,1
aDepartament de Genètica, Facultat de Biologia, Universitat de Barcelona, Barcelona E08028, Spain; bDepartment for Molecular Evolution and Development,Center for Organismal Systems Biology, Faculty of Life Sciences, University of Vienna, 1090 Vienna, Austria; cDepartment of Biology, Stanford University,Stanford, CA 94305; and dInstitut de Biomedicina (IBUB), Universitat de Barcelona, 08007 Barcelona, Spain
Edited* by Christine Guthrie, University of California, San Francisco, CA, and approved February 4, 2011 (received for review August 21, 2010)
Novel organismal structures in metazoans are often undergirded bycomplex gene regulatory networks; as such, understanding theemergenceofnewstructures throughevolution requires reconstruct-ing the series of evolutionary steps leading to these underlyingnetworks. Here, we reconstruct the step-by-step assembly of the ver-tebrate splicing network regulated by Nova, a splicing factor thatmodulates alternative splicing in the vertebrate central nervous sys-tem by binding to clusters of YCAY motifs on pre-RNA transcripts.Transfection of human HEK293T cells with Nova orthologs indicatedvertebrate-like splicing regulatory activity in bilaterian invertebrates,thus Nova acquired the ability to bind YCAY clusters and performvertebrate-like splicing modulation at least before the last commonancestor of bilaterians. In situ hybridization studies in several speciesshowed that Nova expression became restricted to CNS later on,during chordate evolution. Finally, comparative genomics studiesrevealed a diverse history for Nova-regulated exons, with targetexons arising through both de novo exon creation and acquisitionof YCAY motifs by preexisting exons throughout chordate and ver-tebrate history. In addition, we find that tissue-specific Nova expres-sion patterns emerged independently in other lineages, suggestingindependent assembly of tissue-specific regulatory networks.
evo-devo | pasilla | amphioxus
Metazoans exhibit tremendous diversity in body plan pat-terning but widespread conservation of regulatory genes.
This is consistent with new organismal structures arising largely bymodification and reuse of preexisting molecular products. Novelmetazoan body plan structures are often accomplished by generegulatory networks, thus understanding the emergence of novelstructures requires reconstructing the step-by-step assembly of theunderlying networks.The vertebrate brain is a particularly striking example. In addi-
tion to expressing a large fraction of tissue-specific genes, CNSgenes show the highest level of alternative splicing (AS) (1). Thistranscript complexity is regulated by several CNS-specific AS fac-tors, which regulate networks of CNS genes (2–5). We used amultidisciplinary approach to reconstruct the step-by-step origin ofone of these networks, the Nova-regulated splicing network (6, 7).The two Nova genes in mammals are expressed exclusively in theCNS (8–10), enabling tissue-specific regulation of ≈700 AS events(11). Nova regulates specific exons by binding to clusters of tetra-nucleotide [CU]CA[CU] (YCAY) motifs in exons or near splicesites in pre-mRNAs; depending on the position of Nova-bindingsites relative to splice sites, Nova can either enhance or inhibit theinclusion of a particular exon in transcripts (12, 13). Computa-tional and HITS-CLIP studies have allowed genome-wide identi-fication of functional Nova-binding motifs and a predictive RNAmap of AS regulation based on the specific location of YCAYclusters (Fig. 1A) (12, 13). These studies have shown that geneswith functional YCAY clusters are coregulated in the presence ofNova in neurons; notably, most of these genes are involved in axonguidance and synaptic function (4). This regulatory system is verywell conserved across vertebrates:Nova expression is also restricted
to brain in chicken and zebrafish, and conserved YCAY clustersin orthologous positions accurately predict tissue-specific regu-lation of exon inclusion levels between brain and liver (14). Intotal, nearly half of Nova-regulated alternatively spliced exonsand most of their associated YCAY clusters are conserved frommouse to fish (14).As with any regulatory network, the Nova vertebrate network
minimally requires (i) ability of regulatory molecules to affectexpression of target genes (in this case, Nova affecting targetsplicing by binding YCAY clusters); (ii) specific temporal andspatial expression of regulatory molecules (CNS-restricted Novaexpression); (iii) presence of regulatory targets (the genes andexons regulated by Nova); and (iv) sensitivity of targets to regu-latory molecules (YCAY clusters associated with target exons).Because all four elements are minimally required for a network tofunction, their evolutionary order of emergence—that is, the se-ries of steps leading to assembly of the network—is obscure. Forinstance, CNS expression of Nova could have predated or post-dated its binding function or its regulation of specific exons, reg-ulated exons could be ancient and have been recruited for thenetwork, or could be recently created, and so forth. To reconstructthe assembly of the vertebrate Nova network, we studied Novaprotein expression and function, as well as the presence/absenceof Nova target exons, across a variety of invertebrates.
ResultsVertebrate-like Nova Regulatory Activity Evolved Before the LastCommon Ancestor of Chordates. We first asked whether in-vertebrate Nova proteins are capable of regulating AS in a similarmanner to their vertebrate counterparts. We identified putativeorthologs of Nova in the genome sequences of 23 metazoans andconfirmed their orthology by phylogenetic analysis (Fig. S1 andDataset S1). To study Nova protein function, we transfected hu-man embryonic kidney cells (HEK293T), which do not naturallyexpress Nova, with constructs expressing the Nova orthologs fromeither the cnidarian Nematostella vectensis (NvNova), isoform Fof Drosophila melanogaster [DmNova, previously described aspasilla (ps) (15); isoforms are following FlyBase terminology: Fly-base.org], the basal chordate amphioxus (Branchiostoma floridae;BfNova), or the mouse Nova1 (MmNova1, as a positive control).
Author contributions:M.I., G.M., and J.G.-F. designed research;M.I., A.D., D.B., I.S., J.M.M.-D.,G.G., and S.J.-D. performed research;M.I., U.T., and S.W.R. analyzed data; andM.I., G.G., U.T.,S.W.R., G.M., and J.G.-F. wrote the paper.
The authors declare no conflict of interest.
*This Direct Submission article had a prearranged editor.
Data deposition: The sequences reported in this paper have been deposited in the Gen-Bank database (accession nos. JF314355–JF314403).1To whom correospondence may be addressed. E-mail: [email protected], [email protected], [email protected], or [email protected].
2Present address: Department of Biology, Stanford University, Stanford, CA 94305.3Present address: Institute for Bioengineering of Catalonia, E08028 Barcelona, Spain.
This article contains supporting information online at www.pnas.org/lookup/suppl/doi:10.1073/pnas.1012333108/-/DCSupplemental.
www.pnas.org/cgi/doi/10.1073/pnas.1012333108 PNAS | March 29, 2011 | vol. 108 | no. 13 | 5319–5324
EVOLU
TION

Transfected Nova proteins were detected using antibodies againstan N-terminal tag. As expected for a functional splicing factor,Nova proteins were found in the nucleus (Fig. 1B). In addition, wetested isoforms C and D from DmNova, which contain a differentN terminus. These isoforms were found predominantly in the cy-tosol of transfected cells (Fig. S2). This is likely in part due tonuclear exportation, because treatment with leptomycin B signifi-cantly increased nuclear location for both isoforms (P= 0.004 andP = 0.02, respectively; Fig. S2).Toassess the ability of invertebrateNovas to interpret vertebrate-
like splicing signals, we studied splicing of four genes whose
splicing is regulated byNova (“target genes”), used as internal (orendogenous) reporters. We used two criteria to select the fourtarget genes. First, all four are endogenously expressed in non-transformed HEK293T cells and show a Nova-negative AS pat-tern due to the lack of Nova expression in these cells. Second,together, the four targets represent the major types of Nova cis-regulatory elements: splicing enhancers (Nova promotes exoninclusion: NISE1, Brd9; NISE2, Aplp2) and silencers (Nova in-hibits exon inclusion: NESS1, Neo1; NESS2, Map4k4) (Fig. 1A).For each Nova target exon, we used semiquantitative RT-PCR
to compare levels of exon inclusion in transcripts from transfectedand control cells. The effects on splicing patterns varied consid-erably among species. Both mouse and amphioxus Novas pro-duced significant changes in splicing for all four exons (Fig. 1C;P<0.01 for each exon). For all four exons, the changes in inclusionlevels were similar for the two species and in the direction pre-dicted by the position of their YCAY cluster (Fig. 1A) (14), sug-gesting conserved Nova binding function across chordates/deuterostomes (16). The results observed forD. melanogaster andthe cnidarian N. vectensis were less clear. Although changes inexon inclusion levels were observed in the expected direction, theeffects were smaller and often not statistically significant, espe-cially in the case of NvNova (Fig. 1C). Given the evolutionarydivergence, these results could reflect differences in target bindingor differences in Nova recruitment and protein interaction be-tween the invertebrate and mammalian spliceosomes. Consistentwith the latter, a recent study (17) has shown that the DmNovaregulatory map is conserved to that of mammals, suggesting thatthe biochemical properties of Nova protein are conserved at leastacross bilaterians.
Restriction of Nova Expression to CNS Is Specific to Vertebrates andTunicates. We next studiedNova gene expression. We compared insitu hybridization (ISH) ofNova genes during development in eightspecies, spanning all major Eumetazoan groups (Deuterostomes,Ecdysozoans, Lophotrochozoans, and nonbilaterians). We foundgreat variation in expression patterns. Within chordates, similarityof expression to mammalian patterns reflected degree of relate-dness. As expected, expression patterns were well conserved withinvertebrates: both members of the zebrafish Nova family (two“Nova2” genes; Fig. S1) were expressed only in CNS (at stages 36and 48 hpf; Fig. 2 A–D). CNS-specific expression extended to theclosest living relatives of vertebrates, tunicates, represented byCiona intestinalis: CiNova expression was found only in the de-veloping CNS, from neurulation to larval stages (Fig. 2 E–H).However, the basal chordate amphioxus showed a substantiallydifferent expression pattern, albeit with some similarities to ver-tebrates. In contrast to vertebrates, expression was most pro-nounced in mesoderm at early stages: BfNova was first detected inthe presumptive endomesoderm of gastrulae and later in pre-somitic mesoderm of early neurulae (Fig. 2 I–K), with strong me-sodermal staining extending through themid-late neural stage (Fig.2L andM).However, discrete expressionwasdetected in repetitiveneural precursors in the neural plate during mid-late neural stages(Fig. 2 L andM), reminiscent of motoneuron markers (18, 19) andconsistent with vertebrate expression patterns (8). Larval expres-sion is also much broader than in vertebrates: we detectedNova inderivatives of all germ layers, including the cerebral vesicle but alsoothers such as mouth–pharynx-associated structures and hindgut(Fig. 2 N and O). Finally, real-time quantitative PCR analysis ofadult amphioxus tissues (see below) underscored the clear butpartial similarity between amphioxus and vertebrate expression:Nova expression was highest in the neural tube but was also ob-served in muscle and gill tissues (Fig. S3).Perhaps surprisingly, beyond chordates, expression patterns
were very different from vertebrates. Even the hemichordateSaccoglossus kowalevskii, representing the closest living relativesof chordates (Ambulacraria), showed very different expression.
Fig. 1. Transfection of Novas from different species into human HEK293Tcells. (A) Schematic representation of “internal” splicing reporter constructsand predicted Nova RNA-binding sites (modified from ref. 13). We studiedpreviously described Nova-regulated alternatively spliced exons from genesendogenously expressed in HEK293T cells (BRD9, APLP2, NEO1, andMAP4K4).The effect of Nova regulation depends on the locations of Nova bindingsite within the exon or flanking intron, either enhancing (red) or silencing/inhibiting (blue) inclusion of the neighboring exon in mRNA transcripts. (B)Confocal images showing general colocalization between DAPI (blue, stain-ing nuclei) and Alexa 488 (green, labeling Nova) for human HEK293T cellstransfected with Novas frommouse (Nova1), amphioxus, Drosophila (isoformF), or Nematostella. Right: Percentages of nuclear localization of the Novaprotein. (C) Level of exon inclusion within transcripts for internal reportersfor cells transfected with the control (empty pcDNA3.1-HA vector) and forNova constructs from each species. In all cases, mouse Nova1 and amphioxusNova produced highly significant changes in exon inclusion levels in thepredicted direction, compared with the control. Positive/negative values inthe y-axes denote increase/decrease in exon inclusion. */**Statistical signifi-cance at the P < 0.05/0.01 level as assessed by ANOVA.
5320 | www.pnas.org/cgi/doi/10.1073/pnas.1012333108 Irimia et al.

The single Nova gene showed sharply restricted expression topostpharyngeal endoderm throughout development (Fig. 2 P–S);this is consistent with the expression for two other Ambulacrariaspecies, the sea urchins Strongylocentrotus purpuratus and Para-centrotus lividus (Fig. 2 T–W and ref. 20, respectively). Expres-sion in even more distantly related animals was also verydifferent from vertebrates. As previously described, the flyortholog pasilla is expressed in salivary glands (ectodermal de-rivative), gut (endoderm) and, posteriorly, the fat bodies (me-sodermal) (Fig. 2 X and Y) (15); however, no expression wasdetected in CNS at any developmental stage (15). In theLophotrochozoan planarian Schmidtea polychroa, SpolNova1 isfirst detected in scattered cells at St5 and, later, in cerebralganglia and mesenchyme at St7 (Fig. 2 Z and AA). Finally, ex-pression of NvNova in the nonbilaterian N. vectensis was detec-ted in scattered cells around the pharynx from 4 d afterfertilization (most likely endodermal cells from the pharynx, al-though neuronal expression cannot be ruled out) and in singleectodermal cells, possibly neurons, of the tentacles after 6 d afterfertilization (Fig. 2 AB–AE).These results suggest that CNS-specific expression ofNova arose
relatively recently within chordates (Fig. S4), most likely withinthe common ancestor of urochordates and vertebrates and afterthe divergence from cephalochordates. From a broader perspec-tive, the diversity of expression patterns across metazoans indicatesgreat flexibility of Nova expression and organismic function andstrongly suggests that Nova has independently acquired distincttissue-specific expression in different metazoan lineages.
Nova-Regulated AS Network Was Primarily Assembled WithinVertebrates. Finally, we studied evolutionary conservation ofknown mouse Nova-regulated exons that are conserved frommammals to fish [34 exons in 28 genes (14); Materials and Meth-ods]. For each invertebrate chordate, we studied each exon at fourlevels of conservation (21) (Fig. 3A): (i) presence of an ortholo-gous gene in the genome (G), (ii) presence of an orthologous exonin the orthologous gene (E), (iii) AS of the exon (A), and (iv)putative regulatory conservation (i.e., presence of YCAY clustersin similar/equivalent positions) (R).We found that all studied genes had putative orthologs in am-
phioxus (G-level), thus vertebrate/tunicate CNS Nova-regulatedtargets arose within preexisting genes. By contrast, most of thespecific Nova-regulated exons (66.7%, E-level) were not found inamphioxus (either in silico or byRT-PCR;Materials andMethods).Lack of conservation is particularly striking for single exons (thatis, “simple” exons: those that are not part of mutually exclusiveexon sets or more complex AS patterns) for which inclusion isincreased by Nova. Among these exons, 17 of 19 (89.5%) areabsent in amphioxus [vs. 5 of 10 (50%) of Nova-silenced exons;P= 0.030 by a Fisher exact test] (Fig. 3B, Inset). Similarly, simpleminor and major exons [defined as being supported by less andmore than 50% of ESTs, respectively (14)] show significant dif-ferences, with half (7 of 14) of major exons being conservedcompared with no (0 of 15) minor ones (P = 0.002 by Fisher’sexact test). This minor–major difference echoes general patternsof evolutionary conservation of alternatively spliced exons inmetazoans (22, 23).
Fig. 2. DevelopmentalexpressionofNovagenes inEumetazoans.(A–D) ThezebrafishDanio rerio. TheNova2a (A andB) andNova2b(C andD) genes arewidely expressed in the developing CNS. Forty-eight-hourembryosareshownin lateral (AandC) anddorsal (BandD) views. Expression is similar for other developmental stages. (E–H) The urochordate C. intestinalis. CiNova is expressed uniquely indeveloping neural plate in late neurula (E, lateral view; F, dorsal)and in tadpole larvae (G, lateral view; H, dorsal). (I–O) The cepha-lochordate amphioxus (B. lanceolatum). BlNova shows complexexpression during development. BlNova is expressed early in thegastrula endomesoderm (I) and later in the posteriormesodermofearly- and midneurula (J, lateral view; K, dorsal). At late-neurulastages the expression continues in themesoderm but starts also inthe CNS, in somediscrete cells, likelymotoneuronprecursors (pmn)(L, lateral view; M, dorsal). In later stages, expression continues inCNS and mesoderm and begins strongly in ectodermal and endo-dermal structures in the mouth and pharynx regions (N and O).(P–S) The hemichordate S. kowalevskii. Expression of SkNova isrestricted topostpharyngeal endodermduringdevelopment: earlygastrula (P), late gastrula (Q), early neurula embryo (R), and lateneurula (S). (T–W) The sea urchin S. purpuratus. As in the hemi-chordates, SpNova expression is restricted to posterior endomeso-dermat 16- to30-hblastula (T), 30- to38-hgastrulae (UandV), and38- to 50-h gastrula (W) [pictures obtained from theWholemountIn SituHybridization (WISH)database;expressionpattern is similiarto that of P. lividus (20)]. (X and Y) The fruitfly D. melanogaster.Developmental expression of the Nova ortholog Dmps is morecomplex. Expression is detected in salivary glands and digestivetube [pictures obtained from BDGP (38) and described by ref. 15].(Z–AA) The planarian S. polychroa. Developmental expression ofSpolNova1 is observed in scattered cells in thegermbandat stage5(Z) and is subsequently restricted to cerebral ganglia and mesen-chyme at stage 7 (AA); signal in the pharynx is due to probe trap-ping. (AB–AE) The cnidarian N. vectensis. NvNova is ubiquitouslyexpressed at a very low level, with some cells showing a slight up-regulation of the expression in gastrula (26 h after fertilization)(AB). In 4-d planula (AC) the expression is in the prepharyngealendoderm, and in 6d primary polyps (AD and AE) the expressionalso extends to some single cells in the ectoderm of the tentacles.Anterior/oral is to the left in all cases, except P,which is a view fromtheblastopore. (Scalebars, 50μminT–WandAB–AE; 100μminE–S,X, and Y; 250 μm in A–D, Z, and AA.)
Irimia et al. PNAS | March 29, 2011 | vol. 108 | no. 13 | 5321
EVOLU
TION

We next studied splicing and regulation of conserved exons.Of the 11 conserved exons, 7 are alternatively spliced in amphi-oxus (A-level), of which only two genes showed YCAY clusters(R-level) in positions corresponding to mouse YCAY clusters(TPM and JNK) and another (ITGA) showed a putatively func-tionally equivalent cluster. To further analyze these three am-phioxus AS events, we generated minigenes for each case andtested Nova regulation of their splicing by cotransfection withmouse Nova1 in HEK293T cells (Materials and Methods). In eachcase, presence of Nova1 resulted in significantly altered exoninclusion levels in the direction predicted by the positions ofputative Nova binding motifs (relative to the negative control, theempty pcDNA3 vector; Fig. 4). For JNK and ITGA, the directionof the effect of Nova was conserved between mouse and am-phioxus orthologs, consistent with conservation of regulatorypattern and structure.The case of the TPM gene is more complex, however. For the
mutually exclusive exons 6A/6B, amphioxus has a single YCAYsignal (NISE2) near exon 6A, which is conserved with mouse.
Consistent with the prediction, inclusion of amphioxus exon 6Ais enhanced by Nova (Fig. 4C). The mouse case is more com-plicated: in addition to NISE, the mouse TPM3 gene containsa second YCAY signal (NISS2), with an opposite predicted ef-fect (inclusion of exon 6B). Although the predicted net result ofthese two opposed signals is not immediately obvious, consistentwith previous results (4), we found that the net effect of Nova isan increase in exon 6B inclusion (i.e., NISS2 seems to dominate),opposite the finding in amphioxus.Next, to assess the tissue-specific role ofNova in the regulation of
the conserved exons in amphioxus in vivo, we dissected gut, neuraltube, gills, and muscle tissues from an adult individual (Fig. S3).Quantification of Nova expression by quantitative PCR showedthat expression varied across tissues, with the highest expression inneural tube and moderate and weak expression observed in muscleand gills, respectively. No expression was detected in the gut. Theseresults were consistent when either of two different controlhousekeeping genes were used for normalization (GAPDH andcytosolic actin) and across three independent replicates (Table S1).We then compared isoform levels of the three conserved amphi-oxus AS events (TPM, ITGA, and JNK) across tissues. Consistentwith in vivo regulation, Nova-enhanced isoforms for each genewere higher in neural tube than in gut alternative (splicing in gillsand muscle were generally intermediate) (Fig. S3).We also studied conservation of Nova-regulated exons in
C. intestinalis. We found a similar picture to amphioxus (Fig. 3Cand Fig. S5): most vertebrate Nova-regulated exons were notfound in C. intestinalis, and only one conserved exon had a puta-tively conserved YCAY cluster, suggesting significant exon crea-tion and YCAY recruitment after the vertebrate–urochordatedivergence (Fig. 3C). Among exons whose inclusion is increasedby Nova, 15 of 17 of the exons absent in amphioxus were alsoabsent in C. intestinalis (Dataset S2), suggesting little exon crea-tion within vertebrate–urochordate ancestors. Overall, levels ofconservation of both exons andYCAY clusters drops dramaticallyin invertebrates (Fig. 3C).
DiscussionThe case of Nova yields insights into the ordered sequence of evo-lutionary events leading to the construction of regulatory networks.In this case, the regulator first acquired the regulatory function:Nova evolved the ability to bind YCAY clusters and performvertebrate-like splicing modulation at least by the last commonancestor of chordates, and, likely, of bilaterians (17). Second, theregulator acquired the requisite expression patterns: Nova expres-sion became restricted to CNS in chordates, likely in vertebrate–tunicate ancestors. Finally, the regulatory targets arose: in the caseofNova, a combinationofdenovoemergence of newNova-targetedexons and acquisition of Nova regulation by preexisting exons ledto the modern wealth of Nova targets.
Evolution of Nova Targets. Our results attest to a variety of dif-ferent evolutionary histories of Nova-regulated vertebrate exons.First, some exons are ancestral (shared with amphioxus) and thuspredate the assembly of the CNS-specific Nova regulatory net-work. Most ancestral exons lack Nova binding motifs and/orevidence for AS in amphioxus, suggesting that they were ances-trally constitutive exons that were coopted for Nova regulationwell after their origin. Other exons seem to have arisen withinurochordate–vertebrate or vertebrate ancestors or during verte-brate evolution and thus postdate the evolution of CNS-specificNova expression. As with the ancestral exons, some of these lackevidence for Nova binding motifs and/or AS in urochordates and/or vertebrates distantly related to mammals, again suggestingthat the exon first arose and only later was coopted by the Novanetwork (14). Finally, some seem to be Nova-created exons: exonpresence is closely associated with Nova binding motifs. As pre-viously suggested (14), creation of these exons could be directly
Fig. 3. Conservation of the Nova-regulated AS network in chordates. (A)Illustrations of four different levels of evolutionary conservation of ASevents between vertebrates and studied invertebrates (21): presence ofa putatively orthologous gene in the genome (G, white); presence of a pu-tatively orthologous exon in the genome (E, light gray); whether the exon isalso alternatively spliced (A, dark gray); and whether specific regulation ofAS is conserved, in this case assessed by the presence of equivalent YCAYclusters (R, black). (B) Percentage of exons with each of four levels of con-servation in amphioxus. All Nova-regulated genes are conserved in amphi-oxus, but less than 40% of specific Nova-regulated exons are, and only 2 of29 events (6.9%) show mouse-like Nova regulation. (C) Evolutionary con-servation of Nova-regulated exons (E level, gray) and presence of equivalentYCAY clusters (R level, black) between mouse and the inferred vertebrateancestor and the two invertebrate chordates. Vertebrate data from ref. 14.For amphioxus and Ciona, tetrapod- or mammalian-specific exons are as-sumed to be not conserved.
5322 | www.pnas.org/cgi/doi/10.1073/pnas.1012333108 Irimia et al.

attributable to new Nova-binding motifs: the emergence ofYCAY enhancer motifs could have led to the use of nearbycryptic splice sites, leading to creation of a new exon.
Evolution of Nova Expression. In addition, our gene expressionresults indicate a complex history for the biological role of Novathrough metazoan history. First, we find that CNS-restricted ex-pression is a relatively recent occurrence within the chordatelineage, with more complex or more promiscuous expressionpatterns in various invertebrates. This raises the question of thefunction of Nova in these species as well as in early metazoans.The reconstruction of Nova-regulated networks in other phylamay provide insights into this question. Equally intriguing, we findthat Nova has independently acquired tissue-specific expressionpatterns in very different tissues in different metazoans lineages.The expression pattern is especially striking in Ambulacraria, inwhich Nova is largely restricted to the gut. This raises the excitingpossibility of lineage-specific assembly of tissue-specific Nova-regulated AS networks in other lineages.Novamay have served asa powerful and multipurpose tool for the construction of complexregulatory networks, having been put to use for very differentfunctions in different lineages. Regulators with such flexible po-tential functions could be centrally important in the emergence ofcomplex but different structures in related lineages.
Materials and MethodsIn Silico Identification of Nova Orthologs and Phylogenetic Analysis. Usingmouse Nova genes as queries, we performed tBLASTN searches against 17genomes (SI Materials and Methods). We then downloaded each corre-sponding genomic region and built gene models using existing automaticgene model predictions, ESTs, ClustalW alignments of individual exons, and/or GeneWise2 software if necessary. For phylogenetic analysis, describedsequences for ingroups and outgroups were downloaded from GenBank.Full-length amino acid sequences were aligned using ClustalW (24). Phylo-genetic trees were then generated by the Bayesian method with MrBayes3.1.2 (25, 26), with the Dayhoff+Gamma model, as recommended by Prot-Test 1.4 (27–29) as previously described (30) (further details in SI Materialsand Methods).
Nova Constructs, Internal Reporters, and Minigenes. Full-length Nova cDNAsequences frommouse (Nova1), B. floridae, D. melanogaster (ps, isoforms C, D,and F), and N. vectensis were obtained by high-fidelity PCR. Each Nova cDNAsequence was cloned into a pcDNA.3.1 expression vector that contained an in-frame HA epitope at the 5′end to facilitate protein immunodetection. ForDrosophila isoforms, subcellular location was also investigated after 2, 4, and6 h of inhibition of nuclear exportation with 40 nM of leptomycin B (Fig. S2).
Candidate endogenous reporters for AS, namely APLP2, BRD9, MAP4K4,and NEO1, were selected from previously described Nova-regulated events(14) so as to include all major types of Nova cis regulators. Primers in theupstream and downstream constitutive exons were designed for each eventto test the inclusion level of each alternatively spliced exon.
Minigenes for the AS events from mouse TPM3 and amphioxus ITGA andJNKwere generated using primers to amplify the upstream and downstreamconstitutive exons from genomic DNA and cloned into the expression vectorpcDNA.3.1. For BfTPM, only the region containing exons 6A and 6B wascloned, using several primer sets for sequential cloning. To check the ASpattern of each minigene, specific primers in the upstream and downstreamexons were designed. For BfJNK exons A and B were quantified separatelyusing different specific primer sets.
Cell Culture, Transfection, RNA Isolation, and RT-PCR. HEK293T cells were tran-siently cotransfected with either pcDNA.3.1-HA empty vector (negativecontrol) or one of the pcDNA.3.1-HA-Nova constructs. Forty-eight hours aftertransfection, cells were immunodetected according to standard protocolswith anti-HA and AlexaFluor 488-conjugated anti-mouse IgG antibodies.Nuclei were counterstained with DAPI. To test the minigenes, each constructwas cotransfected with either pcDNA.3.1-HA empty vector or pcDNA.3.1-HA-MmNova1. Total RNA was isolated from cells 40 h after transfection, andcDNA was prepared. AS patterns were quantified by measuring RT-PCRproducts performed under specific conditions to avoid PCR bias toward smallfragments (31) (details in SI Materials and Methods). At least three biologicalreplicates were analyzed for each set of experiments.
Cloning of Different Nova Orthologs and in Situ Hybridization. Primers weredesigned to span nearly the full length of the Nova transcript for zebrafish(Nova2a and Nova2b), Branchiostoma lanceolatum, C. intestinalis, S. kowa-levskii, S. polychroa, and N. vectensis. For key species, 3′ UTR (B. lanceolatumand S. kowalevskii) and/or KH-free probes (B. lanceolatum and S. polychroa)were also used (Fig. S6). Standard ISH protocols (32–37) were used for eachspecies at higher hybridization temperatures (5–10 °C higher) to avoid po-
Fig. 4. Experimental validation of predicted Nova-regulated events in amphioxus. For each exon [from ITGA3 (A), JNK2 (B), and TPM3 (C)], schematicrepresentations of the local gene structures for amphioxus and vertebrate are shown at the top, with representative RT-PCR results and estimated percentageof exon inclusion for each studied minigene. Blue/red dots indicate YCAY clusters predicted to function as Nova enhancer/silencers. Blue/red bars indicateNova silenced/enhanced exon inclusion. NISS, Nova intronic splicing silencer; NISE, Nova intronic splicing enhancer. Asterisks indicate in-frame STOP codons.
Irimia et al. PNAS | March 29, 2011 | vol. 108 | no. 13 | 5323
EVOLU
TION

tential cross-hybridization (details in SI Materials and Methods). Pictures ofD. melanogaster and S. purpuratus ISHs were obtained with permission fromthe Berkeley Drosophila Genome Project (BDGP) gene expression project(http://insitu.fruitfly.org) (38) and the WISH database (http://goblet.molgen.mpg.de/eugene/cgi/eugene.pl) (39), respectively.
Analysis of the Vertebrate Nova-Regulated Network in B. floridae and C.intestinalis. Presence of Nova-regulated exons conserved from mammals tofish (14) (Dataset S2) were individually assessed in silico and by RT-PCR inamphioxus and C. intestinalis (details in SI Materials and Methods). Allsequences were uploaded to GenBank (accession nos. JF314355–JF314403).All primer sequences are available upon request. TACC2 could not be studiedin amphioxus and Ciona; TPM data were obtained from ref. 40.
For studied exons that were present in any invertebrate genome, weassessed AS by RT-PCR using cDNAs frommixed stages. For exons that showedAS, we searched in the genome for Nova-binding motifs (YCAY clusters)corresponding to binding motifs described in mouse: either in orthologouspositions or in other positions with generally equivalent effects (14). Weused a permissive definition for YCAY clusters, based on ref. 14: at least
three YCAY motifs within 50 bp, with a maximum inter-YCAY distance of 24bp. Predicted amphioxus motifs were then validated using minigenes.
RT-PCRs of conserved Nova exons in amphioxus (Fig. S3) were performed ontissues from an adult amphioxus individual. Gut, neural tube, gills, and musclewere carefully dissected and RNA extracted and cDNA prepared using standardprotocols. For real-time PCR quantification of Nova expression, GAPDH and cy-tosolic actinwere used as controls for normalization, both yielding similar results.
ACKNOWLEDGMENTS. We thank Salvatore D’Aniello and Chris Lowe forC. intestinalis and S. kowalevskii samples, respectively. This work has beenfunded by Grants BMC2008-03776 (Ministerio de Ciencia e Innovación) andInstitució Catalana de Recerca i Estudis Avançats Academia Prize (Generalitatde Catalunya) (to J.G.F.); and BFU2007-60823 and BFU2010-15656 (Ministeriode Ciencia e Innovación) (to G.M.). Research of U.T. is funded by the Norwe-gian Research Council, the Austrian Science Foundation, and the Marie CurieInitial Training Network-EVONET. M.I. held a Fellowship Program Initiativefellowship, A.D. held a BRD fellowship from the University of Barcelona, I.S.holds a postdoctoral Intra-European Fellowship funded by the Marie CurieFP7 People programme, J.M.M.-D. holds a FPU fellowship, and G.G. holdsa Marie Curie Incoming International Fellowship.
1. Yeo G, Holste D, Kreiman G, Burge CB (2004) Variation in alternative splicing acrosshuman tissues. Genome Biol 5:R74.
2. Boutz PL, et al. (2007) A post-transcriptional regulatory switch in polypyrimidine tract-binding proteins reprograms alternative splicing in developing neurons. Genes Dev21:1636–1652.
3. Calarco JA, et al. (2009) Regulation of vertebrate nervous system alternative splicingand development by an SR-related protein. Cell 138:898–910.
4. Ule J, et al. (2005) Nova regulates brain-specific splicing to shape the synapse. NatGenet 37:844–852.
5. Zhang C, et al. (2008) Defining the regulatory network of the tissue-specific splicingfactors Fox-1 and Fox-2. Genes Dev 22:2550–2563.
6. Warzecha CC, Sato TK, Nabet B, Hogenesch JB, Carstens RP (2009) ESRP1 and ESRP2are epithelial cell-type-specific regulators of FGFR2 splicing. Mol Cell 33:591–601.
7. Matlin AJ, Clark F, Smith CW (2005) Understanding alternative splicing: Towardsa cellular code. Nat Rev Mol Cell Biol 6:386–398.
8. Buckanovich RJ, Posner JB, Darnell RB (1993) Nova, the paraneoplastic Ri antigen, ishomologous to an RNA-binding protein and is specifically expressed in the developingmotor system. Neuron 11:657–672.
9. Buckanovich RJ, Yang YY, Darnell RB (1996) The onconeural antigen Nova-1 is a neuron-specific RNA-binding protein, the activity of which is inhibited by paraneoplasticantibodies. J Neurosci 16:1114–1122.
10. Yang YY, Yin GL, Darnell RB (1998) The neuronal RNA-binding protein Nova-2 isimplicated as the autoantigen targeted in POMA patients with dementia. Proc NatlAcad Sci USA 95:13254–13259.
11. Zhang C, et al. (2010) Integrative modeling defines the Nova splicing-regulatorynetwork and its combinatorial controls. Science 329:439–443.
12. Licatalosi DD, et al. (2008) HITS-CLIP yields genome-wide insights into brain alternativeRNA processing. Nature 456:464–469.
13. Ule J, et al. (2006) An RNA map predicting Nova-dependent splicing regulation.Nature 444:580–586.
14. Jelen N, Ule J, Zivin M, Darnell RB (2007) Evolution of Nova-dependent splicingregulation in the brain. PLoS Genet 3:1838–1847.
15. Seshaiah P, Miller B, Myat MM, Andrew DJ (2001) pasilla, the Drosophila homologueof the human Nova-1 and Nova-2 proteins, is required for normal secretion in thesalivary gland. Dev Biol 239:309–322.
16. Delsuc F, BrinkmannH, ChourroutD, PhilippeH (2006) Tunicates andnot cephalochordatesare the closest living relatives of vertebrates. Nature 439:965–968.
17. Brooks AN, et al. (2010) Conservation of an RNA regulatory map between Drosophilaand mammals. Genome Res, in press.
18. Jackman WR, Langeland JA, Kimmel CB (2000) islet reveals segmentation in theAmphioxus hindbrain homolog. Dev Biol 220:16–26.
19. Candiani S, Lacalli TC, Parodi M, Oliveri D, Pestarino M (2008) The cholinergic genelocus in amphioxus: Molecular characterization and developmental expressionpatterns. Dev Dyn 237:1399–1411.
20. Röttinger E, Besnardeau L, Lepage T (2006) Expression pattern of three putative RNA-binding proteins during early development of the sea urchin Paracentrotus lividus.Gene Expr Patterns 6:864–872.
21. Irimia M, Rukov JL, Roy SW, Vinther JL, Garcia-Fernandez J (2009) Quantitativeregulation of alternative splicing in evolution and development. Bioessays 31:40–50.
22. Modrek B, Lee CJ (2003) Alternative splicing in the human, mouse and rat genomes isassociated with an increased frequency of exon creation and/or loss. Nat Genet 34:177–180.
23. Irimia M, et al. (2008) Widespread evolutionary conservation of alternatively splicedexons in Caenorhabditis. Mol Biol Evol 25:375–382.
24. Higgins DG, Thompson JD, Gibson TJ (1996) Using CLUSTAL for multiple sequencealignments. Methods Enzymol 266:383–402.
25. Huelsenbeck JP, Ronquist F (2001) MRBAYES: Bayesian inference of phylogenetictrees. Bioinformatics 17:754–755.
26. Ronquist F, Huelsenbeck JP (2003) MrBayes 3: Bayesian phylogenetic inference undermixed models. Bioinformatics 19:1572–1574.
27. Drummond A, Strimmer K (2001) PAL: An object-oriented programming library formolecular evolution and phylogenetics. Bioinformatics 17:662–663.
28. Abascal F, Zardoya R, Posada D (2005) ProtTest: Selection of best-fit models of proteinevolution. Bioinformatics 21:2104–2105.
29. Guindon S, Gascuel O (2003) A simple, fast, and accurate algorithm to estimate largephylogenies by maximum likelihood. Syst Biol 52:696–704.
30. D’Aniello S, et al. (2008) Gene expansion and retention leads to a diverse tyrosinekinase superfamily in amphioxus. Mol Biol Evol 25:1841–1854.
31. Rukov JL, et al. (2007) High qualitative and quantitative conservation of alternativesplicing in Caenorhabditis elegans and Caenorhabditis briggsae. Mol Biol Evol 24:909–917.
32. Tena JJ, et al. (2007) Odd-skipped genes encode repressors that control kidneydevelopment. Dev Biol 301:518–531.
33. Irimia M, et al. (2010) Conserved developmental expression of Fezf in chordates andDrosophila and the origin of the Zona Limitans Intrathalamica (ZLI) brain organizer.Evodevo 1:7.
34. Yu JK, Holland LZ (2009) Amphioxus whole-mount in situ hybridization. Cold SpringHarb Protoc 2009:pdb.prot5286.
35. Lowe CJ, Tagawa K, Humphreys T, Kirschner M, Gerhart J (2004) Hemichordateembryos: Procurement, culture, and basic methods. Methods Cell Biol 74:171–194.
36. Martín-Durán JM, Amaya E, Romero R (2010) Germ layer specification and axialpatterning in the embryonic development of the freshwater planarian Schmidteapolychroa. Dev Biol 340:145–158.
37. Genikhovich G, Technau U (2009) In situ hybridization of starlet sea anemone(Nematostella vectensis) embryos, larvae, and polyps. Cold Spring Harb Protoc 2009:pdb.prot5282.
38. Tomancak P, et al. (2007) Global analysis of patterns of gene expression duringDrosophila embryogenesis. Genome Biol 8:R145.
39. Poustka AJ, et al. (2007) A global view of gene expression in lithium and zinc treatedsea urchin embryos: New components of gene regulatory networks. Genome Biol 8:R85.
40. Irimia M, Maeso I, Gunning PW, Garcia-Fernàndez J, Roy SW (2010) Internal andexternal paralogy in the evolution of tropomyosin genes in metazoans. Mol Biol Evol27:1504–1517.
5324 | www.pnas.org/cgi/doi/10.1073/pnas.1012333108 Irimia et al.
Supporting InformationIrimia et al. 10.1073/pnas.1012333108SI Materials and MethodsIn Silico Identification of Nova Orthologs and Phylogenetic Analysis.Using mouse Nova1 and Nova2 genes as queries, we performedtBLASTN searches against 17 genomes: Xenopus tropicalis JGI v4.1(1), Takifugu rubripes JGI v4.0, Branchiostoma floridae JGI v1.0 (2),Trichoplax adhaerens Grell-BS-1999 v1.0 (3), Nematostella vectensisJGI v1.0 (4), Ciona intestinalis JGI v2.0 (5), Daphnia pulex JGI v1.0,Lottia gigantea JGI v1.0, and Capitella teleta JGI v1.0 at theJoint Genome Institute (JGI) Web page (http://genome.jgi-psf.org/euk_home.html); Strongylocentrotus purpuratus Build 2.1 (6), Daniorerio Build Zv8, Tribolium castaneum Build 2.1 (7), and Anophelesgambiae str. PEST (8) at the National Center for Biotechnology In-formation Web page (http://www.ncbi.nlm.nih.gov/blast/Blast.cgi);Anolis carolinensisAnoCar1.0 at theEnsemblWeb page (http://www.ensembl.org); Hydra magnipapillata (9) at the Metazome Web page(http://hydrazome.metazome.net/cgi-bin/gbrowse/hydra/); Schmidteamediterranea at SmedGD (10); and Saccoglossus kowalevskii 2008-Dec-09 linear scaffolds at the Human Genome Sequencing CenterBaylor College of Medicine Blast Web page (http://blast.hgsc.bcm.tmc.edu/blast.hgsc?organism=20). We then downloaded each cor-responding genomic region and built gene models using existing au-tomatic gene model predictions, ESTs, ClustalW alignments ofindividual exons, and/or GeneWise2 software (11) if necessary. An-notation and comparison of intron positions and phases to improvethe alignments were performed as previously described (12). Forphylogenetic analysis, sequences for ingroups (Nova1 and Nova2from Mus musculus and Gallus gallus and ps_K from Drosophilamelanogaster) and outgroups (Trichoplax adhaerens PCBP, and theparalogsM. musculus PCBP1 and PCBP2 andD. melanogaster mub)were downloaded fromGenBank. Full-length amino acid sequenceswere aligned using ClustalW (13). Phylogenetic trees were thengenerated by the Bayesian method with MrBayes 3.1.2 (14, 15), withthe Dayhoff+Gammamodel, as recommended by ProtTest 1.4 (16–18) under the Akaike information and the Bayesian informationcriteria. Two independent runs were performed, each with fourchains. By convention, convergence was reached when the value fortheSDof split frequencies stayedbelow0.01.Burn-inwasdeterminedby plotting parameters across all runs for a given analysis: all treesbefore stationarity and convergence were discarded, and consensustreeswere calculated for the remaining trees (2,500,000 generations).
Nova Constructs, Internal Reporters, and Minigenes. Full-lengthNova cDNA sequences from mouse (Nova1), B. floridae, Dro-sophila psD, andNematostella were obtained by PCR from purifiedRNA, using iProof High-Fidelity DNA Polymerase (BioRad).Each Nova cDNA sequence was cloned into a pcDNA.3.1 ex-pression vector that contained an in-frame HA epitope at the 5′end to facilitate protein immunodetection. All final constructswere verified by sequencing.Candidate endogenous reporters for alternative splicing, namely
APLP2, BRD9, MAP4K4, and NEO1, were selected from pre-viously described Nova-regulated events (19) as to include allmajor types of Nova cis regulators. Primers in the upstream anddownstream constitutive exons were designed for each event to testthe inclusion level of each alternatively spliced exon.Minigenes for the alternative splicing (AS) events from mouse
TPM3 andamphioxus ITGA and JNKwere generatedusingprimersto amplify the upstream and downstream constitutive exons fromgenomic DNA and cloned into the expression vector pcDNA.3.1.For BfTPM, only the region containing exons 6A and 6B wascloned, using several primer sets for sequential cloning. To checkthe AS pattern of each minigene, specific primers in the upstream
and downstream exons were designed. For BfJNK exons A and Bwere quantified separately using different specific primer sets. ForBfTPM one primer spanning each alternatively spliced exon andyielding different final sizes were used in the same PCR. Althoughthe AS pattern of this minigene was complex, the expected bandsfor each exon could be easily quantified. Primer sequences areavailable upon request.
Cell Culture, Transfection, RNA Isolation, and RT-PCR.HEK293T cellswere transiently cotransfected with either pcDNA.3.1-HA emptyvector or each of the pcDNA.3.1-HA-Nova constructs using Lip-ofectamine 2000 (Invitrogen). Forty-eight hours after transfection,cells were immunodetected according to standard protocols withanti-HA (Santa Cruz Biotechnology, 1:300) and AlexaFluor 488-conjugated anti-mouse IgG (Molecular Probes, 1:250) antibodies.Nuclei were counterstained with DAPI (Roche, 1:5,000). Whentesting the minigenes, each construct was cotransfected with eitherpcDNA.3.1-HA empty vector (negative control) or pcDNA.3.1-HA-MmNova1.TotalRNAwas isolated fromcells 40 h after transfection using the
High Pure RNA Isolation Kit (Roche). RT-PCRs were performedusing the Transcriptor High Fidelity cDNA Synthesis Kit (Roche).GAPDHwas used as a control. TheRT-PCRs to test theASpatternswere performed at 32 cycles for internal reporters and 27 cycles forminigenes, using long elongation times (4 min) to avoid PCR biastoward small fragments (20).TheRT-PCRreactionswerequantifiedby Multi Gauge v3.0 software (Fujifilm) after capturing the electro-phoresis image with LAS-4000 MINI (Fujifilm). At least three bi-ological replicates were analyzed for each set of experiments. Thestatistical significance was assessed by ANOVA.
Nuclear Location and Transport of Drosophila Nova Isoforms.Experiments regarding the inhibition of the nuclear transportwere carried out starting with the transient transfection of thedifferent constructs in pcDNA3.1-HA bearing the D. mela-nogaster Nova isoforms C, D, and F. Briefly, HEK293T cells wereseeded on 24-well plates (2.5 × 10⁵ cells/mL). After 12 h, cellswere transiently transfected using Lipofectamine 2000 (In-vitrogen), according to the manufacturer’s instructions. After 48 hof expression, cells were treated with 40 nM leptomycin B(Alomone Labs) for 0 h, 2 h, 4 h, or 6 h and immediately pro-ceeding with two washes in PBS and immunolocalization assays,performed as described above with anti-HA (Santa Cruz Bio-technology, 1:300) and AlexaFluor 488-conjugated anti-mouseIgG (Molecular Probes, 1:250) antibodies. Nuclei were coun-terstained with DAPI (Roche, 1:5,000).
Cloning of Different Nova Orthologs and in Situ Hybridization. Pri-mers were designed to span nearly the full length of the Novatranscript for zebrafish (Nova2a and Nova2b), Branchiostomalanceolatum, C. intestinalis, S. kowalevskii, Schmidtea polychroa,and N. vectensis. For key species, 3′ UTR (B. lanceolatum and S.kowalevskii) and/or KH-free probes (B. lanceolatum and S. pol-ychroa) were also used (Fig. S6). PCR fragments were clonedinto pCRII/TOPO (Invitrogen), and RNA probes were gener-ated using T7 or SP6 RNA polymerases (Roche) using standardprocedures.Zebrafish embryos were raised at 28 °C in standard E3 medium
and fixed at 48-h stages in 4% paraformaldehyde overnight at 4 °C.In situ hybridizations (ISH) were carried out as previously de-scribed (21). B. lanceolatum and C. intestinalis embryos were fixedand hybridized as previously described (22, 23); for C. intestinalis,
Irimia et al. www.pnas.org/cgi/content/short/1012333108 1 of 7

we used 15’ of PK treatment. S. kowalevskii embryos were kindlyprovided by Chris Lowe, and ISH was performed as previouslydescribed (24). S. polychroa embryos were dissected, fixed, andhybridized as previously described (25), using 64 °C as hybridiza-tion temperature. ISH for Nematostella was carried out accordingto ref. 26. Highly stringent conditions were used for all studiedspecies to avoid cross-hybridization with related mRNAs. In ad-dition, for amphioxus an alternative probe was designed spanningthe nonconserved sequence between the second and third KHdomains, to minimize potential cross-hybridization; the same pat-tern was observed. Pictures of D. melanogaster and S. purpuratusISHs were obtained with permission from the BerkeleyDrosophilaGenome Project gene expression project (http://insitu.fruitfly.org)(27) andWISHdatabase (http://goblet.molgen.mpg.de/eugene/cgi/eugene.pl) (28), respectively.
Analysis of the Vertebrate Nova-Regulated Network of AlternativelySpliced Exons in B. floridae and C. intestinalis. Conservation ofNova-regulated exons conserved from mammals to fish, as pre-viously reported (19) (Dataset S2), were assessed in silico and byRT-PCR in the amphioxus B. floridae and the ascidian C. in-testinalis. For each studied gene, tBLASTN were performed oneach invertebrate genome at the JGI Web page. Each genomicregion was then downloaded, and the constitutive upstream anddownstream exons were identified and annotated using availableESTs, sequence similarity comparisons using CLUSTALW, and/or intron position alignments. If the upstream and/or down-stream exons could not be confidently detected, we searched forthe next upstream/downstream exons until we could confidentlyidentify a constitutive exon on each side of the expected alter-natively spliced regions. Then we followed two strategies: firstthe alternatively spliced exons were searched for within the in-tronic sequence by sequence similarity or EST mapping (if theregion could be properly annotated). Second, if the alternativelyspliced exon could not be confidently identified, we designedprimers in the constitutive adjoining exons for each species andperformed RT-PCRs (39 cycles) using a cDNA library frommixed developmental stages. We cloned and sequenced the PCR
products. If the directly upstream and/or downstream exons hadnot been identified in the first screening but were after PCRsequencing, new primers spanning only those exons were de-signed, and a new PCR was performed to assess the presence ofdifferent isoforms. All sequences were uploaded to GeneBank(accession nos. JF314355–JF314403). All primer sequences areavailable upon request. TACC2 could not be studied in amphi-oxus and Ciona; TPM data were obtained from ref. 29.For the alternatively spliced exons that were present at any
invertebrate genome, we assessed AS by RT-PCR using cDNAsfrom mixed stages. For the positive cases at the AS level, wesearched in the genome forNova-binding motifs (YCAY clusters)at orthologous positions or in other locations with generallyequivalent effects to the Nova-binding sites described in mouse(19).We used a permissive definition for YCAY clusters, based onref. 19: at least threeYCAY clusters within 50 bp, with amaximuminter-YCAY distance of 24 bp, which were then validated usingminigenes for the case of amphioxus.Putative Nova-regulated AS events in the vertebrate ancestor
(Fig. 3C, main text) were inferred from the exons conserved frommammals to fish (19), using YCAY cluster scores from ref. 19, ifavailable, or studying conservation of each mouse YCAY clusterin the orthologs and ohnologs (paralogs resulting from the tworounds of whole-genome duplication) from available fish ge-nomes (T. rubripes, Tetraodon nigroviridis, Oryzas latipes, D. rerio,and Gasterosteus aculeatus).RT-PCRs of conserved Nova exons in amphioxus (Fig. S3)
were performed on tissues from an adult amphioxus individual.Gut, neural tube, gills, and muscle were carefully dissected andRNA extracted and cDNA prepared using standard protocols.For real-time PCR quantification of Nova expression, GAPDHand cytosolic actin were used as controls for normalization, bothyielding similar results. Real-time PCRs were performed usingSYBR GREEN PCR Master Mix (Applied Biosystems) withstandard conditions and 7 ng of cDNA for each sample. Threereplicated were performed for each sample and set of primers.
1. Hellsten U, et al. (2010) The genome of the Western clawed frog Xenopus tropicalis.Science 328:633–636.
2. Putnam NH, et al. (2008) The amphioxus genome and the evolution of the chordatekaryotype. Nature 453:1064–1071.
3. Srivastava M, et al. (2008) The Trichoplax genome and the nature of placozoans.Nature 454:955–960.
4. Putnam NH, et al. (2007) Sea anemone genome reveals ancestral eumetazoan generepertoire and genomic organization. Science 317:86–94.
5. Dehal P, et al. (2002) The draft genome of Ciona intestinalis: Insights into chordateand vertebrate origins. Science 298:2157–2167.
6. Sodergren E, et al. (2006) Sea Urchin Genome Sequencing Consortium (2006) Thegenome of the sea urchin Strongylocentrotus purpuratus. Science 314:941–952.
7. Richards S, et al. (2008) Tribolium Genome Sequencing Consortium (2008) Thegenome of the model beetle and pest Tribolium castaneum. Nature 452:949–955.
8. Holt RA, et al. (2002) The genome sequence of the malaria mosquito Anophelesgambiae. Science 298:129–149.
9. Chapman JA, et al. (2010) The dynamic genome of Hydra. Nature 464:592–596.10. Robb SM, Ross E, Sánchez Alvarado A (2008) SmedGD: The Schmidtea mediterranea
genome database. Nucleic Acids Res 36(Database issue):D599–D606.11. Birney E, Durbin R (2000) Using GeneWise in the Drosophila annotation experiment.
Genome Res 10:547–548.12. D’Aniello S, et al. (2008) Gene expansion and retention leads to a diverse tyrosine
kinase superfamily in amphioxus. Mol Biol Evol 25:1841–1854.13. Higgins DG, Thompson JD, Gibson TJ (1996) Using CLUSTAL for multiple sequence
alignments. Methods Enzymol 266:383–402.14. Huelsenbeck JP, Ronquist F (2001) MRBAYES: Bayesian inference of phylogenetic
trees. Bioinformatics 17:754–755.15. Ronquist F, Huelsenbeck JP (2003) MrBayes 3: Bayesian phylogenetic inference under
mixed models. Bioinformatics 19:1572–1574.16. Drummond A, Strimmer K (2001) PAL: An object-oriented programming library for
molecular evolution and phylogenetics. Bioinformatics 17:662–663.
17. Abascal F, Zardoya R, Posada D (2005) ProtTest: Selection of best-fit models of proteinevolution. Bioinformatics 21:2104–2105.
18. Guindon S, Gascuel O (2003) A simple, fast, and accurate algorithm to estimate largephylogenies by maximum likelihood. Syst Biol 52:696–704.
19. Jelen N, Ule J, Zivin M, Darnell RB (2007) Evolution of Nova-dependent splicingregulation in the brain. PLoS Genet 3:1838–1847.
20. Rukov JL, et al. (2007) High qualitative and quantitative conservation of alternativesplicing in Caenorhabditis elegans and Caenorhabditis briggsae. Mol Biol Evol 24:909–917.
21. Tena JJ, et al. (2007) Odd-skipped genes encode repressors that control kidneydevelopment. Dev Biol 301:518–531.
22. Irimia M, et al. (2010) Conserved developmental expression of Fezf in chordates andDrosophila and the origin of the Zona Limitans Intrathalamica (ZLI) brain organizer.Evodevo 1:7.
23. Yu JK, Holland LZ (2009) Amphioxus whole-mount in situ hybridization. Cold SpringHarb Protoc 2009:pdb.prot5286.
24. Lowe CJ, Tagawa K, Humphreys T, Kirschner M, Gerhart J (2004) Hemichordateembryos: Procurement, culture, and basic methods. Methods Cell Biol 74:171–194.
25. Martín-Durán JM, Amaya E, Romero R (2010) Germ layer specification and axialpatterning in the embryonic development of the freshwater planarian Schmidteapolychroa. Dev Biol 340:145–158.
26. Genikhovich G, Technau U (2009) In situ hybridization of starlet sea anemone(Nematostella vectensis) embryos, larvae, and polyps. Cold Spring Harb Protoc 2009:pdb.prot5282.
27. Tomancak P, et al. (2007) Global analysis of patterns of gene expression duringDrosophila embryogenesis. Genome Biol 8:R145.
28. Poustka AJ, et al. (2007) A global view of gene expression in lithium and zinc treated seaurchin embryos: New components of gene regulatory networks. Genome Biol 8:R85.
29. Irimia M, Maeso I, Gunning PW, Garcia-Fernàndez J, Roy SW (2010) Internal andexternal paralogy in the evolution of tropomyosin genes in metazoans. Mol Biol Evol27:1504–1517.
Irimia et al. www.pnas.org/cgi/content/short/1012333108 2 of 7
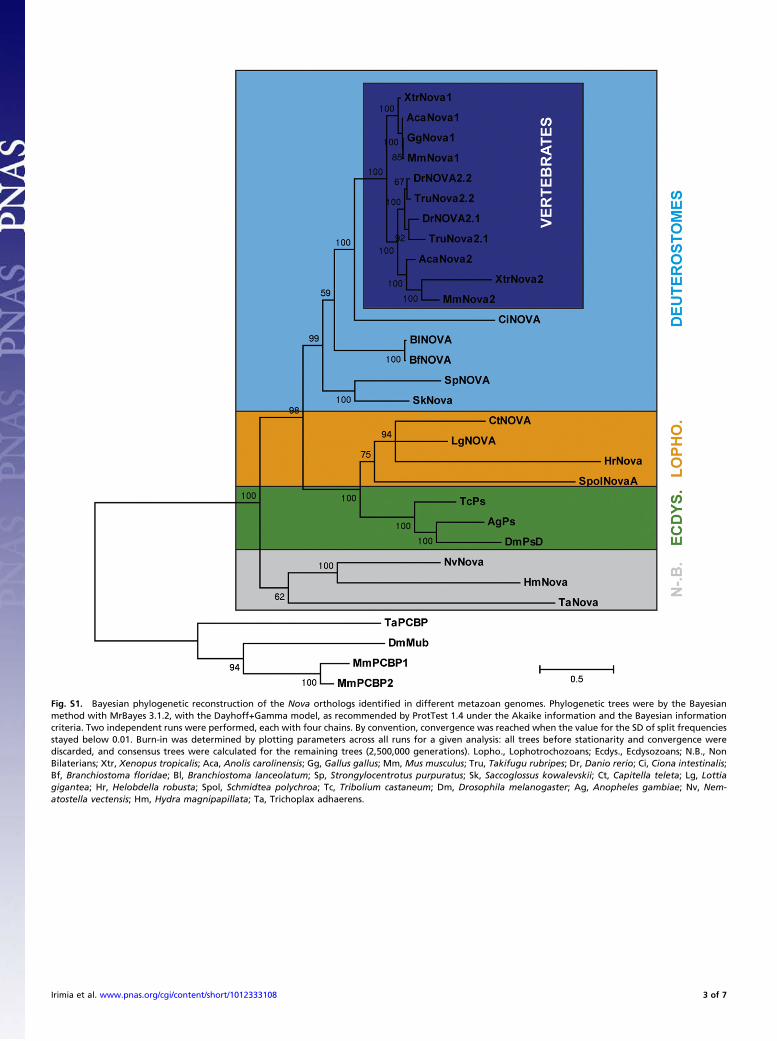
Fig. S1. Bayesian phylogenetic reconstruction of the Nova orthologs identified in different metazoan genomes. Phylogenetic trees were by the Bayesianmethod with MrBayes 3.1.2, with the Dayhoff+Gamma model, as recommended by ProtTest 1.4 under the Akaike information and the Bayesian informationcriteria. Two independent runs were performed, each with four chains. By convention, convergence was reached when the value for the SD of split frequenciesstayed below 0.01. Burn-in was determined by plotting parameters across all runs for a given analysis: all trees before stationarity and convergence werediscarded, and consensus trees were calculated for the remaining trees (2,500,000 generations). Lopho., Lophotrochozoans; Ecdys., Ecdysozoans; N.B., NonBilaterians; Xtr, Xenopus tropicalis; Aca, Anolis carolinensis; Gg, Gallus gallus; Mm, Mus musculus; Tru, Takifugu rubripes; Dr, Danio rerio; Ci, Ciona intestinalis;Bf, Branchiostoma floridae; Bl, Branchiostoma lanceolatum; Sp, Strongylocentrotus purpuratus; Sk, Saccoglossus kowalevskii; Ct, Capitella teleta; Lg, Lottiagigantea; Hr, Helobdella robusta; Spol, Schmidtea polychroa; Tc, Tribolium castaneum; Dm, Drosophila melanogaster; Ag, Anopheles gambiae; Nv, Nem-atostella vectensis; Hm, Hydra magnipapillata; Ta, Trichoplax adhaerens.
Irimia et al. www.pnas.org/cgi/content/short/1012333108 3 of 7

Fig. S2. Nuclear location of Drosophila Nova (pasilla) isoforms. (A) Confocal images of transfected cells (green) with DAPI staining (blue) showing nuclear and/or cytosolic location for each isoform. (B) Percentage of nuclear location of Drosophila Nova isoforms C, D, and F. (C) Percentage of nuclear location ofDrosophila Nova isoforms C (black) and D (white) after 0, 2, 4, and 6 h of 40 nM leptomycin B.
Irimia et al. www.pnas.org/cgi/content/short/1012333108 4 of 7
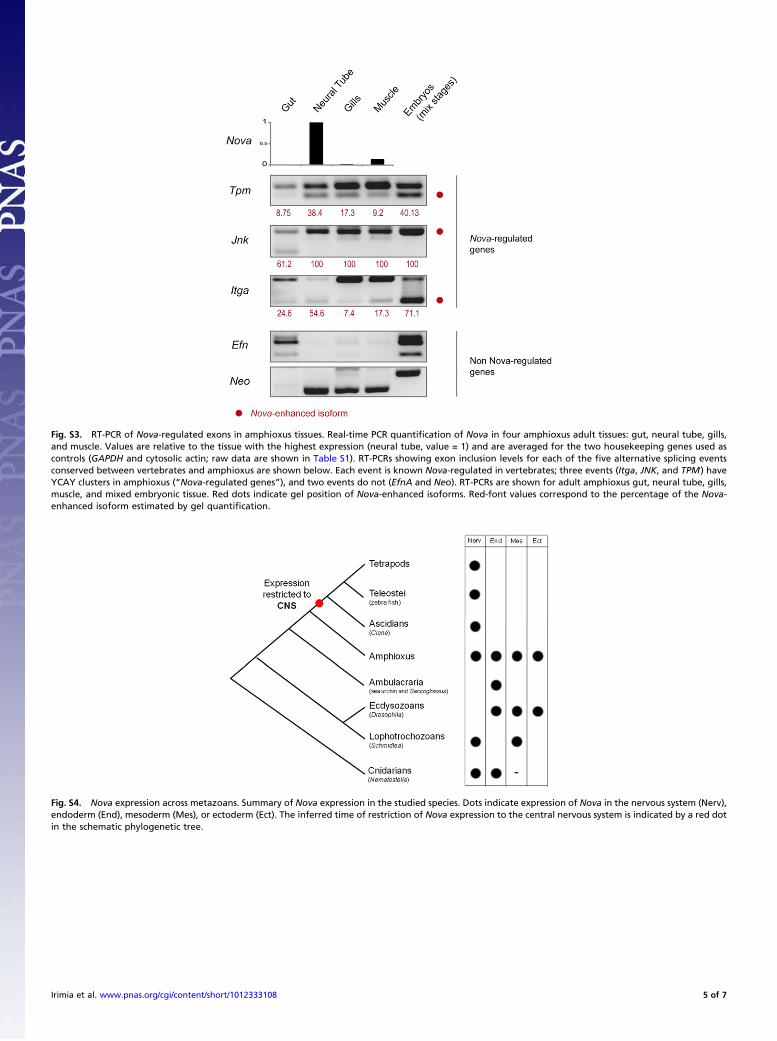
Fig. S3. RT-PCR of Nova-regulated exons in amphioxus tissues. Real-time PCR quantification of Nova in four amphioxus adult tissues: gut, neural tube, gills,and muscle. Values are relative to the tissue with the highest expression (neural tube, value = 1) and are averaged for the two housekeeping genes used ascontrols (GAPDH and cytosolic actin; raw data are shown in Table S1). RT-PCRs showing exon inclusion levels for each of the five alternative splicing eventsconserved between vertebrates and amphioxus are shown below. Each event is known Nova-regulated in vertebrates; three events (Itga, JNK, and TPM) haveYCAY clusters in amphioxus (“Nova-regulated genes”), and two events do not (EfnA and Neo). RT-PCRs are shown for adult amphioxus gut, neural tube, gills,muscle, and mixed embryonic tissue. Red dots indicate gel position of Nova-enhanced isoforms. Red-font values correspond to the percentage of the Nova-enhanced isoform estimated by gel quantification.
Fig. S4. Nova expression across metazoans. Summary of Nova expression in the studied species. Dots indicate expression of Nova in the nervous system (Nerv),endoderm (End), mesoderm (Mes), or ectoderm (Ect). The inferred time of restriction of Nova expression to the central nervous system is indicated by a red dotin the schematic phylogenetic tree.
Irimia et al. www.pnas.org/cgi/content/short/1012333108 5 of 7
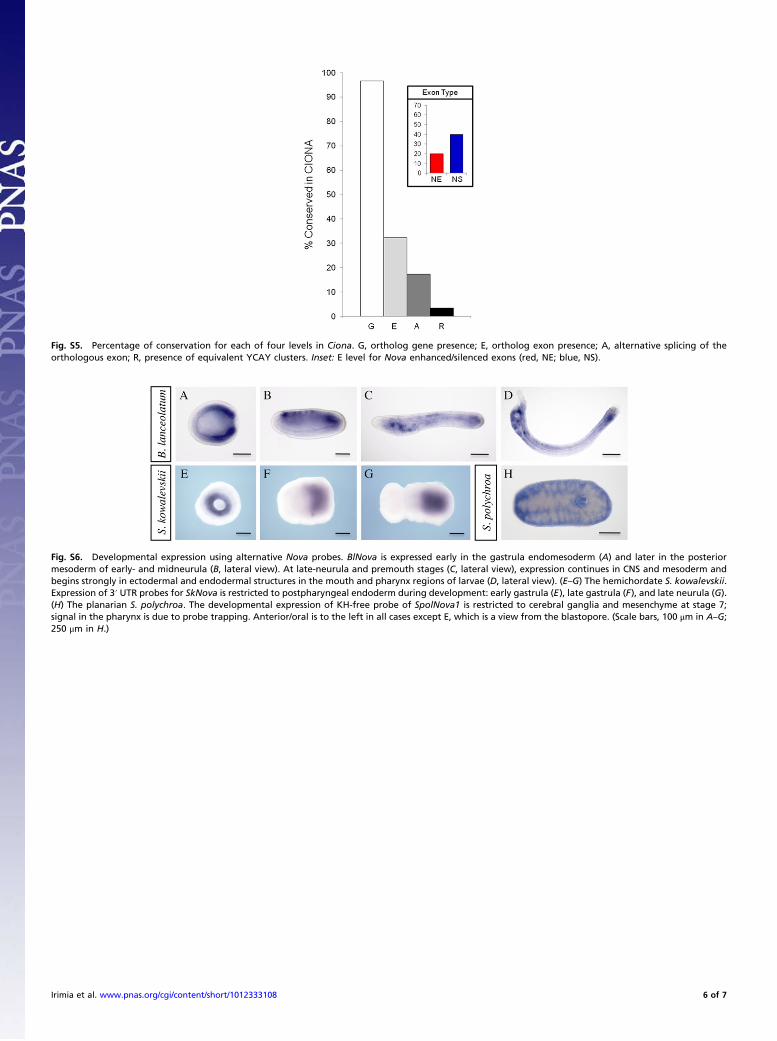
Fig. S5. Percentage of conservation for each of four levels in Ciona. G, ortholog gene presence; E, ortholog exon presence; A, alternative splicing of theorthologous exon; R, presence of equivalent YCAY clusters. Inset: E level for Nova enhanced/silenced exons (red, NE; blue, NS).
Fig. S6. Developmental expression using alternative Nova probes. BlNova is expressed early in the gastrula endomesoderm (A) and later in the posteriormesoderm of early- and midneurula (B, lateral view). At late-neurula and premouth stages (C, lateral view), expression continues in CNS and mesoderm andbegins strongly in ectodermal and endodermal structures in the mouth and pharynx regions of larvae (D, lateral view). (E–G) The hemichordate S. kowalevskii.Expression of 3′ UTR probes for SkNova is restricted to postpharyngeal endoderm during development: early gastrula (E), late gastrula (F), and late neurula (G).(H) The planarian S. polychroa. The developmental expression of KH-free probe of SpolNova1 is restricted to cerebral ganglia and mesenchyme at stage 7;signal in the pharynx is due to probe trapping. Anterior/oral is to the left in all cases except E, which is a view from the blastopore. (Scale bars, 100 μm in A–G;250 μm in H.)
Irimia et al. www.pnas.org/cgi/content/short/1012333108 6 of 7
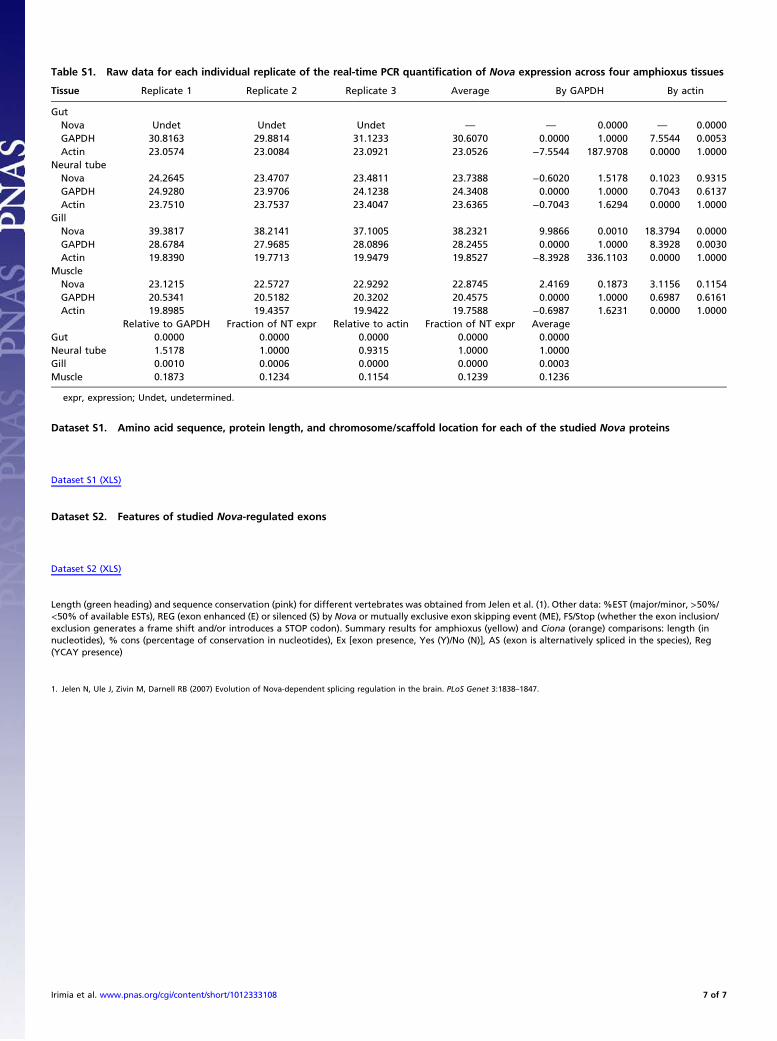
Table S1. Raw data for each individual replicate of the real-time PCR quantification of Nova expression across four amphioxus tissues
Tissue Replicate 1 Replicate 2 Replicate 3 Average By GAPDH By actin
GutNova Undet Undet Undet — — 0.0000 — 0.0000GAPDH 30.8163 29.8814 31.1233 30.6070 0.0000 1.0000 7.5544 0.0053Actin 23.0574 23.0084 23.0921 23.0526 −7.5544 187.9708 0.0000 1.0000
Neural tubeNova 24.2645 23.4707 23.4811 23.7388 −0.6020 1.5178 0.1023 0.9315GAPDH 24.9280 23.9706 24.1238 24.3408 0.0000 1.0000 0.7043 0.6137Actin 23.7510 23.7537 23.4047 23.6365 −0.7043 1.6294 0.0000 1.0000
GillNova 39.3817 38.2141 37.1005 38.2321 9.9866 0.0010 18.3794 0.0000GAPDH 28.6784 27.9685 28.0896 28.2455 0.0000 1.0000 8.3928 0.0030Actin 19.8390 19.7713 19.9479 19.8527 −8.3928 336.1103 0.0000 1.0000
MuscleNova 23.1215 22.5727 22.9292 22.8745 2.4169 0.1873 3.1156 0.1154GAPDH 20.5341 20.5182 20.3202 20.4575 0.0000 1.0000 0.6987 0.6161Actin 19.8985 19.4357 19.9422 19.7588 −0.6987 1.6231 0.0000 1.0000
Relative to GAPDH Fraction of NT expr Relative to actin Fraction of NT expr AverageGut 0.0000 0.0000 0.0000 0.0000 0.0000Neural tube 1.5178 1.0000 0.9315 1.0000 1.0000Gill 0.0010 0.0006 0.0000 0.0000 0.0003Muscle 0.1873 0.1234 0.1154 0.1239 0.1236
expr, expression; Undet, undetermined.
Dataset S1. Amino acid sequence, protein length, and chromosome/scaffold location for each of the studied Nova proteins
Dataset S1 (XLS)
Dataset S2. Features of studied Nova-regulated exons
Dataset S2 (XLS)
Length (green heading) and sequence conservation (pink) for different vertebrates was obtained from Jelen et al. (1). Other data: %EST (major/minor, >50%/<50% of available ESTs), REG (exon enhanced (E) or silenced (S) by Nova or mutually exclusive exon skipping event (ME), FS/Stop (whether the exon inclusion/exclusion generates a frame shift and/or introduces a STOP codon). Summary results for amphioxus (yellow) and Ciona (orange) comparisons: length (innucleotides), % cons (percentage of conservation in nucleotides), Ex [exon presence, Yes (Y)/No (N)], AS (exon is alternatively spliced in the species), Reg(YCAY presence)
1. Jelen N, Ule J, Zivin M, Darnell RB (2007) Evolution of Nova-dependent splicing regulation in the brain. PLoS Genet 3:1838–1847.
Irimia et al. www.pnas.org/cgi/content/short/1012333108 7 of 7

Artículo anexo 4


CERKL Knockdown Causes Retinal Degeneration inZebrafishMarina Riera1,2,3, Demian Burguera1,2, Jordi Garcia-Fernandez1,2, Roser Gonzalez-Duarte1,2,3*
1 Departament de Genetica, Facultat de Biologia, Universitat de Barcelona, Barcelona, Spain, 2 Institut de Biomedicina (IBUB), Universitat de Barcelona, Barcelona, Spain,
3 CIBERER, Instituto de Salud Carlos III, Barcelona, Spain
Abstract
The human CERKL gene is responsible for common and severe forms of retinal dystrophies. Despite intense in vitro studiesat the molecular and cellular level and in vivo analyses of the retina of murine knockout models, CERKL function remainsunknown. In this study, we aimed to approach the developmental and functional features of cerkl in Danio rerio within anEvo-Devo framework. We show that gene expression increases from early developmental stages until the formation of theretina in the optic cup. Unlike the high mRNA-CERKL isoform multiplicity shown in mammals, the moderate transcriptionalcomplexity in fish facilitates phenotypic studies derived from gene silencing. Moreover, of relevance to pathogenicity,teleost CERKL shares the two main human protein isoforms. Morpholino injection has been used to generate a cerklknockdown zebrafish model. The morphant phenotype results in abnormal eye development with lamination defects,failure to develop photoreceptor outer segments, increased apoptosis of retinal cells and small eyes. Our data support thatzebrafish Cerkl does not interfere with proliferation and neural differentiation during early developmental stages but isrelevant for survival and protection of the retinal tissue. Overall, we propose that this zebrafish model is a powerful tool tounveil CERKL contribution to human retinal degeneration.
Citation: Riera M, Burguera D, Garcia-Fernandez J, Gonzalez-Duarte R (2013) CERKL Knockdown Causes Retinal Degeneration in Zebrafish. PLoS ONE 8(5): e64048.doi:10.1371/journal.pone.0064048
Editor: Hector Escriva, Laboratoire Arago, France
Received December 24, 2012; Accepted April 8, 2013; Published May 9, 2013
Copyright: � 2013 Riera et al. This is an open-access article distributed under the terms of the Creative Commons Attribution License, which permitsunrestricted use, distribution, and reproduction in any medium, provided the original author and source are credited.
Funding: This study was supported by grants SAF2009-08079 (Ministerio de Ciencia e Innovacion), SGR2009-1427 (Generalitat de Catalunya), CIBERER (U718),Retina Asturias and ONCE to RGD, and BFU2011-23291 (Ministerio de Ciencia e Innovacion) and ICREA Academia Prize (Generalitat de Catalunya) to JGF. Thefunders had no role in study design, data collection and analysis, decision to publish, or preparation of the manuscript.
Competing Interests: The authors have declared that no competing interests exist.
* E-mail: [email protected]
Introduction
Retinal dystrophies (RD), the major cause of incurable familial
blindness in the Western world, are monogenic disorders
characterized by progressive dysfunction of photoreceptor and
retinal pigment epithelium (RPE) cells [1]. RD is a group of
extremely heterogeneous diseases that show substantial clinical
and genetic overlap. Moreover, mutations in a single gene appear
to be associated to distinct clinical entities [2], as is the case for
CERKL, that was initially characterized as an autosomal recessive
Retinitis Pigmentosa (RP) gene [3], [4], [5], [6], [7], [8], and later
shown to promote Cone-Rod Dystrophy (CRD), a RD disorder
associated to a more severe phenotype [9], [10].
Highthroughput technologies have greatly improved our
knowledge of the genetic basis of RD. Indeed, more than 180
RD genes have already been reported and this number is
constantly increasing (Retnet, https://sph.uth.tmc.edu/retnet/).
However, although RD genes are known to be involved in a
variety of cellular and molecular processes in the retina, we are still
far from understanding the contribution of most of them to the
disease. CERKL ranks in this class, as all previous attempts have
failed to provide valuable clues to explain its involvement in
photoreceptor degeneration.
Human CERKL was initially identified as a 13 exon-gene, which
encoded a polypeptide of 532 amino acids. This protein shared an
integral diacylglycerol kinase (DAGK) signature [3] with Cer-
amide Kinase (CERK), an ubiquitously expressed paralog with
ceramide kinase activity involved in cell survival and proliferation
[11]. In CERKL, all the in vivo and in vitro assays with reported
CERK substrates and a variety of lipid mixtures have failed to
show any kinase activity [12], [13], [14], [15], [16]. Concerning
cell survival, overexpression of CERKL in cultured cells showed
protection against apoptosis induced by oxidative stress [14].
Moreover, studies with transfected cell lines have shown a
dynamic subcellular localization of CERKL, shifting from the
cytoplasm, where the protein is mainly associated to the
endoplasmic reticulum and Golgi membranes, to the nucleus
[14]. CERKL intracellular traffic regulation seems to be directed
by two nuclear localization signals (NLSs) and two nuclear export
signals (NESs) [6], [12], [13]. Concerning CERKL localization in
the retina, immunohistochemistry on mouse cryosections revealed
strong localization in cones, faint in rods, and moderate at the
ganglion cell (GCL) and inner nuclear layers (INL) [17], [18], [19].
CERKL performance in the retina has been also approached
through an accurate assessment of its transcriptional products in
several tissues. Interestingly, in the retina, human and mouse
CERKL revealed an unexpected high repertoire of mRNA isoforms
(.20 isoforms in human and .30 in mouse were validated), which
emerged from alternative splicing and additional promoters,
among them that of NEUROD1 gene [17], [18]. The high
heterogeneity presumed at the protein level, together with its
dynamic subcellular localization probably accounts for the multi-
functional character of CERKL.
PLOS ONE | www.plosone.org 1 May 2013 | Volume 8 | Issue 5 | e64048

Animal models, whether natural or transgenic, provide
invaluable tools for studies of disease pathogenesis and the
identification of therapeutic targets [20]. To date, two mouse
models of CERKL have been constructed. The first was
obtained by deletion of the alternatively spliced exon 5, where
the most prevalent mutation (R257X) is found [21]. The second
was generated in our group by the deletion of the proximal
promoter and exon 1. Both mouse models were viable and
fertile, and did not show gross morphological alterations in the
retina. Our targeted Cerkl deletion resulted in a knockdown
rather than a knockout model, as gene transcription was attained
from two previously unreported alternative promoters [19].
Moderate dysfunction was observed in the ganglion and/or
amacrine cells, supported by aberrant electroretinographic
recordings and increased retinal apoptosis and gliosis, whereas
photoreceptor cells showed WT features [19]. The failure to
reproduce the human phenotype in the mouse, not unusual in
other hereditary retinal disorders, prompted us to explore
zebrafish as an alternative model. In this context, Danio rerio
seems to be an excellent tool to understand the mechanisms of
human visual disorders, because human and zebrafish share the
main cell types and general structure of the eye. Moreover,
zebrafish biology allows ready access to all developmental stages,
and the optical transparency of embryos and larvae allow real-
time imaging of developing pathologies [22]. The ontogeny of
the zebrafish eye begins as an evagination from the developing
forebrain around 12 hours postfertilization (hpf), and ocular
development is largely completed by 72 hpf, at which time the
first visual responses can be detected [23], [24], [25], [26]. In
this study we have identified the zebrafish cerkl ortholog, studied
its expression during development and in the adult tissues, and
drawn comparisons with vertebrate species. Besides, we have
generated cerkl zebrafish knockdowns by morpholino injection
and characterized a range of developmental abnormalities in the
morphant phenotype, including retinal degeneration and apop-
tosis-like cell death. Finally, our analyses highlight our model as
a simple and amenable tool to analyse CERKL contribution to
RD pathogenesis.
Materials and Methods
Ethics statementAll procedures were performed according to the ARVO
Statement for the Use of Animals in Ophthalmic and Vision
Research, as well as the regulations of the Animal Care facilities at
the University of Barcelona. The study was approved by the Ethics
Committee for Animal Experimentation (CEEA) of the University
of Barcelona. When needed, animals were sacrificed with excess of
anaesthetic MS222, following the approved protocols.
Animal handling, tissue dissection and preparation of thesamples
Zebrafish (Danio rerio) were maintained at 28.5uC on a 14-hour
light/10-hour dark cycle. The transgenic strain ath5:GFP was a
kind gift from Carolina Minguillon. Fertilized eggs were obtained
and grown in incubators, and embryos were staged as described
[27], [28]. Specific tissues and organs were dissected from adult
zebrafish and immediately frozen in liquid nitrogen.
Identification of CERKL orthologsThe human CERKL isoform 1 (NM_201548.4) amino acid
sequence was used as a query for a BLASTp search (http://www.
ncbi.nlm.nih.gov). Protein sequences from several species were
compared running a CLUSTALW2 alignment (www.ebi.ac.uk).
Conservation of CERKL across different species was evaluated
with the Jalview program (version 2.7).
RNA-seq expression analysisAvailable RNA-seq data on zebrafish developmental stages and
adult tissues was used to quantify cerkl expression according to the
previously defined cRPKM value [29]. The reported RNA-seq
data used in this study are shown in Table S1.
RNA extraction and RT-PCRRNAs from a pool of zebrafish, frog and chicken embryos at
different stages of development or from different tissues of adult
specimens were extracted using the RNeasy Mini or Micro Kit
(Qiagen, Valencia, CA), following the manufacter’s instructions.
RT-PCR assays were carried out with the Transcriptor High
Fidelity cDNA Synthesis Kit (Roche Diagnostics, Indianapolis,
IN), using 200 ng of total RNA. For semi-quantitative analysis, the
cDNA was amplified according to standard protocols using
GoTaq polymerase (Promega, Madison, WI). The level of
expression and characterization of different isoforms was per-
formed using a forward primer located in the 59UTR and a
reverse primer in the 39UTR (Table S2). b-actin, ODC and Gapdh
were used for normalization in zebrafish, frog and gallus samples,
respectively (see primer sequences in Table S2). All PCR products
were resolved on agarose gel electrophoresis and sequenced.
Cloning and overexpression of zebrafish CERKL incultured cells
The full-length zebrafish cerkl transcript was amplified from
adult retina oligo-dT cDNA using specific primers carrying BamHI
and XhoI restriction enzyme sites (see primer sequences, Table S2).
The cDNA was inserted into a modified version of the pcDNA3.1
vector (Clontech Laboratories, Inc., Mountain View, CA) that
adds a C-terminal hemagglutinin (HA) tag.
For protein expression, COS-7 cells were seeded and transfect-
ed using Lipofectamine 2000 reagent (Invitrogen Life Technolo-
gies, Carlsbad, CA), according to the manufacturer’s protocol.
After 48 h, immunolocalization was performed as previously
described [14] incubating the cells with 1:275 anti-HA mouse
monoclonal antibody (Covance, Princeton, NJ) followed by 1:300
AlexaFluor 488-conjugated anti-mouse secondary antibody (In-
vitrogen Life Technologies). Slides were counter-stained with
1:5000 DAPI (Roche Diagnostics, Indianapolis, IN) nuclear blue
dye in PBS for 15 min. All preparations were mounted in
Flouprep medium (BioMerieux, Craponne, France) and analyzed
by confocal microscopy (SP2, Leica Microsystems, Wetzlar,
Germany).
Histology and in situ hybridizationEmbryos and adult zebrafish eyecups were fixed in 4%
paraformaldehyde (PFA). For cryosections, embryos and adult
eyecups were rinsed in sucrose at 4uC (successive incubations at
20% for 30 min, 30% for 30 min and 40% sucrose for 12 h) and
then were embedded in O.C.T (Tissue-Tek, Sakura Finetech,
Torrance, CA) and sectioned at 217uC. In situ hybridization on
whole-mounts and cryosections were performed as previously
described [30], [31] using digoxigenin (DIG)-labelled RNA sense
and antisense probes (see primer sequences in Table S2). The BM
Purple AP Substrate (Roche Diagnostics, Indianapolis, IN) reagent
was used. Sections were cover-slipped with Fluoprep (Biomerieux,
Craponne, France) and photographed using a Leica DFC Camera
connected to a Leica DM IL optic microscope (Leica Micro-
systems).
ZFcerkl Knockdown Model
PLOS ONE | www.plosone.org 2 May 2013 | Volume 8 | Issue 5 | e64048
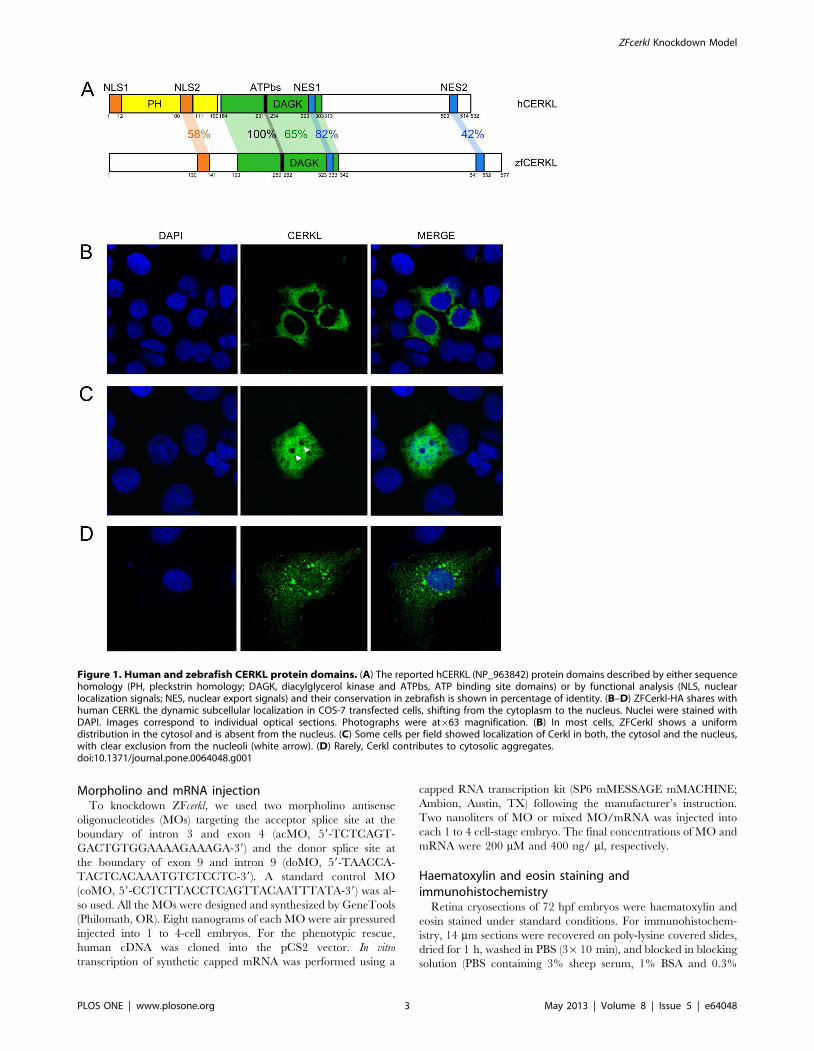
Morpholino and mRNA injectionTo knockdown ZFcerkl, we used two morpholino antisense
oligonucleotides (MOs) targeting the acceptor splice site at the
boundary of intron 3 and exon 4 (acMO, 59-TCTCAGT-
GACTGTGGAAAAGAAAGA-39) and the donor splice site at
the boundary of exon 9 and intron 9 (doMO, 59-TAACCA-
TACTCACAAATGTCTCCTC-39). A standard control MO
(coMO, 59-CCTCTTACCTCAGTTACAATTTATA-39) was al-
so used. All the MOs were designed and synthesized by GeneTools
(Philomath, OR). Eight nanograms of each MO were air pressured
injected into 1 to 4-cell embryos. For the phenotypic rescue,
human cDNA was cloned into the pCS2 vector. In vitro
transcription of synthetic capped mRNA was performed using a
capped RNA transcription kit (SP6 mMESSAGE mMACHINE;
Ambion, Austin, TX) following the manufacturer’s instruction.
Two nanoliters of MO or mixed MO/mRNA was injected into
each 1 to 4 cell-stage embryo. The final concentrations of MO and
mRNA were 200 mM and 400 ng/ ml, respectively.
Haematoxylin and eosin staining andimmunohistochemistry
Retina cryosections of 72 hpf embryos were haematoxylin and
eosin stained under standard conditions. For immunohistochem-
istry, 14 mm sections were recovered on poly-lysine covered slides,
dried for 1 h, washed in PBS (3610 min), and blocked in blocking
solution (PBS containing 3% sheep serum, 1% BSA and 0.3%
Figure 1. Human and zebrafish CERKL protein domains. (A) The reported hCERKL (NP_963842) protein domains described by either sequencehomology (PH, pleckstrin homology; DAGK, diacylglycerol kinase and ATPbs, ATP binding site domains) or by functional analysis (NLS, nuclearlocalization signals; NES, nuclear export signals) and their conservation in zebrafish is shown in percentage of identity. (B–D) ZFCerkl-HA shares withhuman CERKL the dynamic subcellular localization in COS-7 transfected cells, shifting from the cytoplasm to the nucleus. Nuclei were stained withDAPI. Images correspond to individual optical sections. Photographs were at663 magnification. (B) In most cells, ZFCerkl shows a uniformdistribution in the cytosol and is absent from the nucleus. (C) Some cells per field showed localization of Cerkl in both, the cytosol and the nucleus,with clear exclusion from the nucleoli (white arrow). (D) Rarely, Cerkl contributes to cytosolic aggregates.doi:10.1371/journal.pone.0064048.g001
ZFcerkl Knockdown Model
PLOS ONE | www.plosone.org 3 May 2013 | Volume 8 | Issue 5 | e64048

Triton X-100) for 60 min at room temperature (RT). Incubation
with peanut agglutinin (PNA) conjugated to Alexa Fluor 647
(40 mg/ml; Invitrogen Life Technologies) and the primary
antibody mouse anti-rhodopsin (1:500, Abcam, Cambridge, MA)
was performed overnight at RT in blocking solution. Sections were
rinsed three times in PBS again, followed by incubation with
Alexa-Fluor568 goat anti-rabbit as secondary antibody (1:300,
Invitrogen Life Technologies). Nuclei were stained with DAPI
(Roche Diagnostics), sections were mounted in Fluoprep medium
(Biomerieux) and analyzed by confocal microscope (SP5, Leica
Microsystems). For eye measurements, 14 mm thick cryosections
were examined under the microscope and imaged. Eye size was
taken from the anterior to the posterior edge using the Fiji
software. Significant differences between groups were analyzed by
the Student’s t-test.
Apoptotic cells in the retina cryosections of 72 hpf morphants
were detected by immunofluorescence using anti-active Caspase-3
as primary antibody (1:200, BD Pharmingen, San Jose, CA) and
Alexa-Fluor568 goat anti-rabbit as secondary antibody (1:300,
Invitrogen Life Technologies) following the protocols already
described. For apoptosis quantification, nuclei were counted using
the Fiji software.
Results
Homology search and cloning of the zebrafish cerklTo identify zebrafish cerkl (ZFcerkl), a BLAST search of the
Ensembl zebrafish database was performed using the human
CERKL protein isoform 1 sequence (NP_963842). A single copy
of the zebrafish cerkl gene was detected, encompassing 195 kb on
Figure 2. Expression of cerkl transcripts during embryonic development and adult tissues. (A) Temporal and spatial expression ofzebrafish (Dre) cerkl assessed by RT-PCR (top) and RNA-seq data retrieved from databases (bottom) at different developmental stages and adulttissues. (B and C) Expression of cerkl in developmental stages and tissues of frog (Xtr) and chicken (Gga). hpf, hours post-fertilisation; dpf, days post-fertilization; st, stage.doi:10.1371/journal.pone.0064048.g002
ZFcerkl Knockdown Model
PLOS ONE | www.plosone.org 4 May 2013 | Volume 8 | Issue 5 | e64048

chromosome 9. The genomic region of ZFcerkl shows conserved
synteny over more than 1,8 Mb with the human CERKL locus on
chromosome 2, and both largely share the same gene order and
transcriptional orientation, with the only exception of a chromo-
somal inversion encompassing 4 genes (dnajc, frzb, nckap1, dusp19)
located 59 upstream of cerkl (Fig. S1).
The predicted zebrafish transcript encompasses 13 exons, spans
approximately 2 kb and encodes a protein of 577 amino acids, the
latter showing 59% identity and 82% similarity with the human
counterpart. CERKL alignments between zebrafish and human
revealed 65% identity between the DAGK domains (Fig. 1A). The
ATP binding site (ATPbs) GGDG motif contained in this domain,
already described in CERK, was fully conserved not only in
zebrafish but also in 5 vertebrate species (Fig. S2). Concerning the
nuclear localization and export signals (NLS and NES, respec-
tively), the human NLS1 sequence (MPWRRRRNRVSA) was not
conserved in zebrafish, neither in the rest of the species analysed,
whereas NLS2 (SVKLKRRCSVKQ) showed 58% identity, with
preservation of all but one (L) of the five key residues (underlined).
The NES1 (LHIIMGHVQL) and NES2 (LMEVASEVHIRL)
domains of human and zebrafish CERKL displayed 82% and
42% identities, respectively. The in silico predicted pleckstrin
homology (PH) domain, essential for CERK localization, translo-
cation, and enzymatic activity in human, encoded in exons 1 and 2
[32], showed very low conservation among vertebrate species.
Remarkably, the multi-species comparison of CERKL protein
sequences revealed two previously unidentified highly conserved
regions, one in exon 7 (hCERKL, 318–352 aa), and the other
encompassing exons 10 and 11 (hCERKL, 400–448 aa), with
unassigned function so far (Fig. S2).
On the basis of these predictions, specific primers were designed
(Table S2) to clone zebrafish cerkl cDNA by RT-PCR into a
modified version of the pcDNA 3.1 vector that adds a C-terminal
hemagglutinin (HA) tag. The construct was transfected into COS-
7 cells, and an anti-HA immunodetection was performed. The
ZFCerkl protein shared with hCERKL the dynamic subcellular
localization, shifting from the cytoplasm (where is found with a
uniform pattern or in aggregates) to the nucleus. Remarkably, in
contrast with the human homolog, ZFCerkl showed clear
exclusion from the nucleoli (Fig. 1B–D).
Regulated expression of vertebrate cerkl orthologsduring embryogenesis and in adult tissues
The temporal and spatial expression pattern of ZFcerkl during
embryogenesis was examined by semi-quantitative RT-PCR
(Fig. 2A, see Table S2 for primer sequences). Expression was
faint at early developmental stages, from 75%-epiboly (8 hpf) up to
the 8-somite stage (13 hpf) embryos, followed by two marked
increases in gene expression around the 22-somite (20 hpf) and
30 hpf stages, just when the optic cup starts forming the neural
retina [33]. Moreover, the expression persisted during develop-
ment up to 6 days post fecundation (dpf), reaching a maximum at
4 dpf. Adult tissue expression was examined in total RNA from
eye, brain, gill, fin, heart, liver, muscle and stomach. Expression
was highest in eye, moderate in brain, heart and kidney, and low
in gills. Our RT-PCR semiquantitative analysis was supported by
available zebrafish RNA-seq data (Fig. 2A) [34], [35], [36], [37],
[38].
We then aimed to assess whether cerkl tissue-specific regulation
and developmental expression was evolutionary conserved among
other vertebrate species: Gallus gallus and Xenopus tropicalis. In
agreement with mammals, cerkl expression in both species was
mainly detected in eye and brain (Fig. 2B and C) [17], [18], which
suggested a conserved role in the eye and the anterior central
nervous system (CNS). Interestingly, high levels of transcription
were also detected in the lung of Gallus. Further work should clarify
if this is a case of cerkl co-option in the avian lineage.
Tissue specific expression in zebrafish was also assessed in whole
embryos and in embryonic and adult retinas by in situ hybridiza-
tion (ISH) (Fig. 3). Crx antisense and cerkl sense riboprobes were
used as positive and negative controls, respectively. Faint Cerkl
expression was already detected at 24 hpf by whole-mount ISH
(Fig. 3A). Fifty hpf embryos showed cerkl expression restricted to
the anterior region and, particularly, in the eye and brain (Fig. 3B).
To further characterize the retinal expression pattern, ISH on
cryosections was performed. Our data revealed strong hybridiza-
tion signal at 72 hpf embryos in the three nuclear layers (Fig. 3C),
whereas adult expression concentrated in the inner segment of
photoreceptors and staining was not homogeneous along the inner
nuclear and ganglion cell layers (Fig. 3D).
Alternative splicing and the NeuroD1 promoter amongvertebrates
To assess and compare the diversity of cerkl mRNA isoforms in
vertebrate, 45-cycle PCR reactions were performed using primers
located in exons 1 and 13 of cerkl of Danio rerio, Gallus gallus and
Xenopus tropicalis (Fig. 4A). Keeping in mind that some AS events
and additional alternative promoters could have escaped our
experimental approach, 3 cerkl mRNA variants were identified in
zebrafish, 2 in Xenopus tropicalis and 3 in Gallus gallus. In zebrafish,
Figure 3. Cerkl in situ hybridization on embryo and adultzebrafish. (A and B) Whole-mount RNA in situ hybridization analysisshowing cerkl expression in the retina and brain of embryos at 24 and50 hpf. R, retina; L, lens. (C and D) In situ hybridization on zebrafishretina cryosections of 72 hpf embryos and adult tissue. Cerkl expressionis detected in the three nuclear layers of the embryo retina, whereasadult expression appears in the inner segment of the photoreceptorsand some cells located at the basal layer of the INL. Positive control(antisense CRX), strongly labels the inner photoreceptor segment andinner nuclear layer. The negative control was performed with sensecerkl. RPE, retinal pigment epithelium; PR, photoreceptor; ONL, outernuclear layer; OPL, outer plexiform layer; INL, inner nuclear layer; IPL,inner plexiform layer; GCL, ganglion cell layer.doi:10.1371/journal.pone.0064048.g003
ZFcerkl Knockdown Model
PLOS ONE | www.plosone.org 5 May 2013 | Volume 8 | Issue 5 | e64048

variant 1 was the major isoform and encompassed all the exons;
variant 2 skipped exon 10 and encoded a C-terminus truncated
protein without the NES2 domain; and variant 3, adult eye-
specific, was generated from a novel splice donor site within exon
1. In the later form, protein synthesis would start at a conserved
methionine in exon 5, as already described in human [18], and
Figure 4. Alternatively spliced cerkl isoforms in vertebrates. (A) Scheme of the cerkl mRNA transcripts identified in zebrafish (Dre), frog (Xtr)and chicken (Gga). Exons are boxed and the coding sequence (CDS) for each isoform, considering the largest ORF, is shown in black. Grey boxesrepresent alternative ORFs. Protein length (in aa) is indicated (right column). (B) Schematic view of CERKL gene structure as well as the translationalimpact of all alternative exons (AEs) detected in Danio rerio (Dre), Xenopus tropicalis (Xtr), Gallus gallus (Gga), Mus musculus (Mmu) and Homo sapiens(Hsa). Exons preserved in all protein isoforms are shown by empty boxes. AEs are colored: light green, if when skipped, the ORF is not altered; darkgreen for those that maintain the ORF when skipped together; red, if they contain an in-frame stop codon and thus, when preserved, produce atruncated C-terminus protein. In blue, exonic sequences that, when skipped, the ORF generates a premature stop codon; black underlined flattenedboxes indicate partial/complete intron retention associated to truncated peptides, purple depicts the regions preserved when NEUROD1 promotestranscription. The latter isoforms lead to whole exon 1 depletion and subsequent loss of the conventional initiator methionine. In the canonicalhuman and zebrafish CERKL first exon two donor splice sites are contained, one at the 39end of the exon, and the other in the middle (the boundaryshown in orange). When this second splice site is used, protein translation begins in exon 5. Asterisks show initiator methionines validated in humanonly but conserved among vertebrates. A methionine in exon 2 of Gallus gallus that could be used to initiate translation when exon 1 is skipped isdepicted by a triangle. The number of CERKL isoforms in each species is indicated (right column). PTC: premature termination codon; TIS: translationinitiation site.doi:10.1371/journal.pone.0064048.g004
ZFcerkl Knockdown Model
PLOS ONE | www.plosone.org 6 May 2013 | Volume 8 | Issue 5 | e64048

truncation would affect the full NLS2 and ATP binding site
signatures, and a fraction of the DAGK domain. In Xenopus
tropicalis: variant 1 was the main isoform with all the canonical
exons, and variant 2, eye-specific, incorporate an alternative exon
(3b), between exons 3 and 4, containing an in-frame stop codon. In
Gallus gallus: variant 1, the main isoform, comprised all the
annotated exons; variant 2 included a stop-containing exon (5b,
between exons 5 and 6) and encoded a C-terminal truncated
protein; and variant 3, skipped exon 6 and generated an in-frame
shortened peptide.
We also aimed to characterize CERKL expression in the three
analysed species from the upstream transcriptional start site (TSS)
of NEUROD1 [18], [19], a transcriptional factor involved in
photoreceptor development [39]. RT-PCR eye cDNA assays with
specific primers spanning the neuroD1 59UTR and exon 2 or 13 of
cerkl showed that NeuroD1 promoted cerkl expression in chicken,
but not in zebrafish or frog. The use of the alternative promoter
generated a novel 59UTR exon, between neuroD1 and cerkl Gallus
genes, and generated two new isoforms (named 4 and 5) (Fig. 4A).
If translated, the peptides would show truncations at the N-
terminus, as the canonical methionine in exon 1 was skipped and
translation could be initiated from a species-specific methionine in
exon 2. A general picture of the alternative exons and their impact
on the predicted ORF in human, mouse, chicken, frog and
zebrafish CERKL is shown in Fig. 4B.
Validation of cerkl morpholinosTo evaluate whether the knockdown of ZFcerkl caused a retinal
defect, two antisense morpholinos (MOs) that targeted all mRNA
isoforms were used, acMo and doMO (see the Material and
Methods section), and a standard negative control (coMO). In
order to assess splicing blockage by ZFcerkl MOs, we performed
RT-PCR analyses from a pool of 10–12 embryos at different
stages (24, 30, 52 and 72 hpf) using specific primers flanking the
target region (Fig. 5A, black arrows). In the case of acMO, almost
complete depletion (85%) of cerkl transcripts was attained, whereas
doMO blockage was less intense, only reaching the 35%. The poor
blocking ability of doMO was taken to mimic the heterozygous
condition of human carriers.
To further investigate the putative ZFcerkl aberrant splice
products produced by acMO and doMO blocking, semi-quanti-
tative RT-PCR assays were devised. Nor exon skipping neither
intron retention could be identified using specific primers located
at the flanking exons or introns of each MO targets. Assuming that
transcripts from the targeted alleles would have skipped exon 4 or
exon 9, or retained intron 3 or intron 9, in acMO and doMo,
respectively, a premature translation-termination codon (PTC)
would appear in all cases. To verify if the PTC-containing
mRNAs-ZFCerkl were degraded via the nonsense-mediated
mRNA decay (NMD) surveillance mechanism, another RT-PCR
assay was carried out with two pairs of primers located in exons far
away from the original morpholino targets (see Table S2 for
primer sequences). Expression levels were in accordance with
Figure 5. Effects of ZFcerkl silencing in eye development. (A) Two morpholinos targeting an acceptor (acMO) and donor splice site (doMO) ofZFcerkl were used. The morpholino targeting site is depicted by a discontinuous line. To assess the knockdown effect, a RT-PCR analysis of controland ZFcerkl morphants injected with 8 ng of MO was performed (primers used are depicted with arrows). Silencing with acMO was almost complete,when compared with cerkl expression in 72 hpf control MO-injected embryos (coMO), whereas in doMO animals the WT spliced isoform wasdecreased by 35%. b-Actin was used for normalization. (B) acMO-injected embryos displayed either small eye phenotype (named mild phenotype) orvery small eye, small head, and body and curved tail (named severe phenotype). White double-head arrows denote diameter of the eyes. * denotessmall and curved head in severe-phenotype morphants. (C) Phenotype frequency of morphants. The cerkl-knockdown phenotype was rescued whenhuman CERKL mRNA was co-injected with acMO. n, number of individuals. (D) Eye size (in diameter) was measured in at least ten independentembryos from each group. Data were analyzed by t-test and are presented as mean 6 SEM. ** P,0.001. Mean eye size was 253.4 mm for control,172.7 mm for acMO and 239 mm for doMO morphants.doi:10.1371/journal.pone.0064048.g005
ZFcerkl Knockdown Model
PLOS ONE | www.plosone.org 7 May 2013 | Volume 8 | Issue 5 | e64048

those reported for the first pair of primers in each case, thus
supporting NMD transcript depletion (Fig. S3). Indeed, this is in
agreement with late reports showing that NMD effectors are
deeply involved in zebrafish embryonic development and survival
[40].
ZFcerkl suppression in retinopathyIn accordance with our previous observations showing greater
blocking ability for the acMO, microinjection of 8 ng MO into 1
to 4 cell-stage embryos resulted in morphogenesis defects in 73%
of the animals, whereas no mutant phenotypes were observed
neither with doMO-, nor with coMO- injected embryos, from
stage 24 hpf to 5 dpf. First evidences of distortions in the visual
system were detected at 48 hpf. The main traits were eye size
reduction with overall structure preservation and clear boundaries
between the lens and the neural retina in acMO embryos. By
72 hpf, around 70% of the acMO morphants showed the small
eye phenotype (‘‘mild’’ form), and some (23%) also exhibited small
heads, markedly curved body axes and short tails (‘‘severe’’ form)
(Fig. 5B). Phenotypic rescue was attained after co-injection of the
acMO and the mRNA encoding human wild type CERKL
(Fig. 5C). Analyses of the diameter length of the eye on histological
sections indicated a 29% reduction of the acMO treated embryos
compared with coMO animals (Fig. 5D).
To investigate the effect of cerkl knockdown on retinal
development, histological and immunological analysis of 72 hpf
retinas of ZFcerkl-deficient morphants and controls were carried
out. By this stage, the outer segment of photoreceptors is normally
formed. In our case, the acMO-injected morphants showed
defective lamination as the three retina cell layers (GCL, INL and
outer nuclear layer, ONL) were absent, whereas wild type
lamination was observed in doMO and control embryos
(Fig. 6A). Moreover, the outer segments of rod and cone
photoreceptors (detected with anti-rhodopsin and anti-PNA,
respectively) were absent in acMO embryos (Fig. 6B, C). The
development of the retinal pigmented epithelium (RPE) was
unaffected. Another relevant trait of the acMO morphants was the
abnormal lens morphology, possibly related to the retardation of
ocular development because of cerkl knockdown.
Knockdown of ZFcerkl leads to cell deathThe aberrant eye phenotype could be due to increased cell
death or reduced proliferation. Immunodetection of Caspase-3 (a
marker of the first stages of apoptosis [41]) was used to assess cell
death in single optical sections (Fig. 7A). Positive cells were scored
in 4 independent embryos from each group. Our results revealed a
16-fold increase of cell death in acMO embryos (Fig. 7B) and
supported increased apoptosis of retinal cells.
Cerkl does not contribute to retinal cell proliferation andearly differentiation
To assess if the acMO phenotype in zebrafish was due to
defective cell proliferation or differentiation during early retinal
development or a secondary degeneration process, whole-mount
ISH assays with early retinal markers pax6a and otx2 were
performed (Fig. 8A and B). Pax6a contributes to the control of cell
Figure 6. Eye histology in control and ZFcerkl morpholino-injected embryos at 72 hpf. (A) Zebrafish eye sections were stained with H&E.Control morphants (coMO) showed normal retinal lamination with three cell layers (GCL, INL, and ONL). In ‘‘mild’’ acMO-injected embryos, laminationdid not occur and the three layers were not visible. The retinal pigment epithelium (RPE) developed normally in control and ZFcerkl morphants. (B)Immunostaining with anti-rhodopsin and (C) anti-PNA identified rod and cone outer segments, respectively, in control and doMO morphants. Outersegments were absent in acMO morphants. Nuclei were stained with DAPI. Some nonspecific staining was seen in the lens when stained with PNA.Photographs were at640 magnification.doi:10.1371/journal.pone.0064048.g006
ZFcerkl Knockdown Model
PLOS ONE | www.plosone.org 8 May 2013 | Volume 8 | Issue 5 | e64048

proliferation, maintenance of the retinogenic potential of the
retina progenitor cells, and amacrine cell fate specification [42],
whereas otx2 is a key regulatory gene for retinal photoreceptor
determination [43]. Our results indicated that at early stages, 22
and 24 hpf, when in the optic vesicle all cells are still proliferating,
the expression pattern of both, pax6a and otx2, was unaffected in
the acMO morphants. As expected, pax6a was detected in the
developing forebrain, hindbrain, spinal cord, and eye, and otx2 in
the eye and midbrain. At 48 and even more evident at 72 hpf,
when all cells are postmitotic, the acMO embryos exhibited a
considerable decrease in hybridization intensity compared to the
controls, treated and stained under the same conditions. The
distribution of differentiation markers in the acMO morphants was
further analyzed using the ath5:GFP transgenic strain. Ath5 is a
transcription factor expressed in a wave-like pattern that prefigures
the wave of the retinal ganglion cell (RGC) genesis, the first cell
type to differentiate in the vertebrate retina, which has been
previously reported as affected in our mouse model Cerkl2/2. The
wave of ath5 expression and RGC differentiation in zebrafish
occurred during the second day post-fertilization, starting in the
ventronasal patch and spreading from there to the rest of the nasal
and central retina [28]. By 48 hpf, the RGC wave filled the central
and peripheral retina in control embryos, whereas it was delayed
in acMO morphants (Fig. 8C). Hence, our results suggested that
cerkl was not essential for driving the RGC differentiation wave, as
the ventronasal patch was formed and the wave started spreading.
However, in agreement with the above results in cell death, the
delay and disorganization in RGC neurogenesis supported Cerkl
contribution to cell survival, and suggested that the small eye
phenotype and the defective retina lamination were a consequence
of a secondary degeneration process.
Discussion
After intense studies, the role in photoreceptor degeneration of
CERKL, a gene causing autosomal recessive RP and CRD [3], has
remained elusive up to now. We have gathered data showing that
CERKL protects cells form oxidative stress [14] and, lately, in our
Cerkl2/2 murine model, in favor of a consistent and notable
decrease of the retinal sphingolipid content particularly, the
glucosyl/galactosylceramide species [16]. Although these results
could be suggestive of CERKL and glucosylceramide involvement
against oxidative stress, we still are far from understanding
CERKL role in pathogenesis. In this work, we have aimed to gain
new insights into CERKL retinal function generating a zebrafish
knockdown model.
Transfection of ZFCerkl in cultured COS-7 cells supported the
dynamic nuclear-cytoplasmic localization (Fig. 1) and the NLS2
major role in directing nuclear trafficking as previously described
in human [13]. The role of CERKL in the nucleus is still unclear
and does not seem to be related to the transcriptional regulation of
sphingolipid-related genes [16]. However, the physiological
relevance of NLS2 is stressed by its structural conservation across
species and R106S, a mutation-causing RP, precisely located in
this domain [6].
We have shown that high transcriptional complexity of CERKL
in mammals (namely human and mouse) arise from the
Figure 7. Increased cell death in ZFcerkl morpholino (acMO)-injected embryos. (A) Immunodetection of apoptosis by anti-active Caspase-3in retina cryosections of 72 hpf control (coMO) and ZFcerkl morpholino-injected embryos (acMO and doMO). Caspase-3-positive cells (shown in red)increased in acMO morphants. Nuclei were stained with DAPI. (B) The percentage of apoptotic cells in each retina within a single cell layer wasquantified in four independent embryos from each group, plotted and analysed by t-test. Data are presented as mean 6 SEM. * P = 0.005.doi:10.1371/journal.pone.0064048.g007
ZFcerkl Knockdown Model
PLOS ONE | www.plosone.org 9 May 2013 | Volume 8 | Issue 5 | e64048

combination of tissue-specific promoters (among them NEUROD1)
and alternative splicing [17], [18], [19]. Although the regulatory
meaning of AS is largely unknown, even sometimes considered as
background spliceosomal noise [44], [45], [46], it could also be
related to the fine-tuning of key biological processes. Interestingly,
recent work has revealed that adaptive novelties have arisen
through changes in AS regulation, as ganglion-specific splicing of
TRPV1 underlies infrared sensation in vampire bats [47]. Thus, we
aimed to assess cerkl transcript diversity in zebrafish, as well as in
frog and gallus, and compare them with those reported for mouse
and human. Our data showed that the full length (13 exons)
coding region was the only isoform shared, and that AS events
were seldom conserved in CERKL. In terms of exon cassettes,
exons 3, 4 and 5 were alternatively spliced only in human and
mouse, which supported an evolutionary novelty acquired at some
point in the mammalian lineage. Concerning the identification in
mouse and chicken of alternative exons between exon 5 and 6 (5b),
both bearing a premature stop codon, the convergent inclusion of
introns seems the most probably scenario, although an homolo-
gous origin could not be fully discarded. Our data are in
Figure 8. Expression of retina cell markers in acMO-injected embryos at early developmental stages. (A and B) At 22 and 24 hpf, thespatiotemporal pattern of pax6a (A) and otx2 (B) in acMO-injected animals was similar to that of controls: pax6a was detected in the forebrain,hindbrain, spinal cord and eye, and otx2 in the eye and midbrain. By 48 and becoming more evident at 72 hpf, acMO embryos exhibited a markedreduction in the expression of both markers. (C) The expression of the ath5 transcription factor was assessed in vivo in acMO-injected embryos of thetransgenic ath5:GFP strain. At 48 hpf, the wave of ath5 expression, which prefigures the wave of retinal ganglion cell genesis, filled the central andperipheral retina of control embryos, whereas the pattern appeared delayed and disorganized in the acMO morphants, although RGC genesis wasnot fully abolished. * denotes the ventronasal patch of RGC genesis.doi:10.1371/journal.pone.0064048.g008
ZFcerkl Knockdown Model
PLOS ONE | www.plosone.org 10 May 2013 | Volume 8 | Issue 5 | e64048

agreement with the low level of conservation of AS events between
vertebrate groups, especially those involving reading frame
disruption [48], [49]. Interestingly, the use of NEUROD1 as an
alternative promoter for CERKL expression appears to be
restricted to the amniote species analysed (Fig. 4). Concerning
translation, the shorter N-terminal Cerkl protein isoform of
zebrafish is the truncated species that mostly resembles the
corresponding size variant of mammals.
Cerkl morpholino knockdown treatment in wild-type zebrafish
embryos clearly affected eye size (Fig. 5) and retinal morphology.
At 72 hpf, morphant retinas were defective in lamination and the
photoreceptors lacked the outer segments, normally present at this
stage (Fig. 6). The number of apoptotic retinal cells was
significantly increased in Cerkl-deficient embryos. Cell death did
not appear to affect other ocular structures, as cornea and RPE,
which highlighted that cerkl knockdown effects were restricted to
the retina. Similar defects have also been observed for genes
encoding transcription factors (e.g., math5, NR2E3) [50], [51], cell
cycle regulators (e.g., Cdkn1b/c, cdk5) [52], and photoreceptor
ciliary proteins (e.g., RPGR, RP2, TOPORS, BBS9) [53], [54],
[55], [56]. Whether the shared phenotype reveals functional
overlaps or secondary effects of retinal neurodegeneration,
remains to be elucidated. The analysis of different early retinal
development markers in acMO morphants suggested that Cerkl
might contribute to cell survival but not to cell proliferation or
differentiation during early retina development (Fig. 8), in
agreement with the reported anti-apoptotic effects reported in
cell cultures and animal models [14], [19], [57].
CERKL mutations causing RP and CRD disorders are inherited
as an autosomal recessive trait. Unlike the phenotype observed in
zebrafish cerkl-knockdown embryos, patients do not exhibit
developmental abnormalities, and neurodegeneration begins at
the second-third decade of life. In addition to a dose-dependent
effect, another plausible explanation for the lack of developmental
defects in humans may be an increased level of complexity,
redundancy or robustness in the retinal gene network of mammals
that allows for compensation during embryonic development, but
fails to maintain a proper function in adulthood.
In conclusion, we propose that although human, mouse and
zebrafish CERKL phenotype features could be partially dose-
dependent, further experiments are needed to identify the
functional relevance of each isoform and their individual
contribution to the pathogenic threshold. Moreover, the species-
specific differences observed deserve further analysis at the
temporal and cell-specific level. Interestingly, the availability of a
zebrafish model is a powerful tool to elucidate how cerkl depletion
results in the occurrence of apoptotic cell death after defective
retinal lamination and photoreceptor outer segment formation,
and provides new scenarios to understand human retinal
degeneration.
Supporting Information
Figure S1 Syntenic organization of the CERKL genomicregion. Schematic view of the structure and gene organization of
the 1.8 Mb genomic locus encompassing CERKL in Homo sapiens
(Hsa), Xenopus tropicalis (Xtr) and Danio rerio (Dre). The discontin-
uous lines in the Xenopus locus represent the end of the scaffold.
Conserved genes are shown in color, while empty arrows depict
the end of the syntenic region. Two chromosomal rearrangements
are shown in the compared region: a tandem duplication of the
TTN gene in zebrafish, located at the right border, and a
chromosomal inversion encompassing 4 genes (at the left
boundary, framed in red). Concerning the inverted segment,
human and Xenopus tropicalis share gene order and orientation,
suggesting that the chromosome rearrangement took place after
the split of tetrapod and teleost lineages. Ancestral condition is
unknown, as basal vertebrate genome assemblies are not available.
(TIF)
Figure S2 Conservation of CERKL across differentspecies. Accession numbers for the amino acid sequence of each
species are: NP_963842, human (Homo sapiens); XP_002799006,
macaque (Macaca mulatta); XP_002712274, rabbit (Oryctolagus
cuniculus); NP_001041641, mouse (Mus musculus); XP_002932061,
frog (Xenopus tropicalis), XP_421973, chicken (Gallus gallus);
NP_001082943, zebrafish (Danio rerio).
(TIF)
Figure S3 Validation of cerkl morpholinos. Transcrip-
tional products obtained with the following sets of primers: (A)
exons 3-5 and 11-13 for acMO samples, and (B) exons 8-10 and
11-13 for doMO samples. The comparable decrease in band
intensity suggests transcript depletion in both cerkl morphants.
(TIF)
Table S1 Zebrafish RNA-seq data. The reported RNA-seq
data showing tissue resource, accession number and name of the
study are indicated.
(DOCX)
Table S2 Primer sequences used for gene expression, cloning
and in situ hybridization. The sequences of all the primers used are
shown.
(DOCX)
Acknowledgments
We would like to acknowledge the generous support and technical advice
from Dr. Carolina Minguillon, Dr. Maria Marsal, Amayra Hernandez-
Vega and Xavier Esteban on Danio rerio manipulation and mating. The
cDNAs from Xenopus tropicalis and Gallus gallus were a kind gift from Dr. Jose
Luis Ferran. We also want to thank Manuel Irimia for his help with RNA-
seq analysis and Enrique Navas for helping with the laboratory
experiments.
Author Contributions
Conceived and designed the experiments: MR DB JGF RGD. Performed
the experiments: MR DB. Analyzed the data: MR DB. Contributed
reagents/materials/analysis tools: MR DB JGF RGD. Wrote the paper:
MR DB JGF RGD.
References
1. den Hollander AI, Black A, Bennett J, Cremers FP (2010) Lighting a candle in
the dark: advances in genetics and gene therapy of recessive retinal dystrophies.
J Clin Invest 120(9): 3042-53.
2. Berger W, Kloeckener-Gruissem B, Neidhardt J (2010) The molecular basis of
human retinal and vitreoretinal diseases. Prog Retin Eye Res 29(5): 335-75.
3. Tuson M, Marfany G, Gonzalez-Duarte R (2004) Mutation of CERKL, a novel
human ceramide kinase gene, causes autosomal recessive retinitis pigmentosa
(RP26). Am J Hum Genet 74(1): 128-38.
4. Auslender N, Sharon D, Abbasi AH, Garzozi HJ, Banin E, et al. (2007) A
common founder mutation of CERKL underlies autosomal recessive retinal
degeneration with early macular involvement among Yemenite Jews. Invest
Ophthalmol Vis Sci 48(12): 5431-8.
5. Pomares E, Marfany G, Brion MJ, Carracedo A, Gonzalez-Duarte R (2007)
Novel high-throughput SNP genotyping cosegregation analysis for genetic
diagnosis of autosomal recessive retinitis pigmentosa and Leber congenital
amaurosis. Hum Mutat 28(5): 511-6.
ZFcerkl Knockdown Model
PLOS ONE | www.plosone.org 11 May 2013 | Volume 8 | Issue 5 | e64048

6. Ali M, Ramprasad VL, Soumittra N, Mohamed MD, Jafri H, et al. (2008) A
missense mutation in the nuclear localization signal sequence of CERKL(p.R106S) causes autosomal recessive retinal degeneration. Mol Vis 14: 1960-4.
7. Avila-Fernandez A, Riveiro-Alvarez R, Vallespin E, Wilke R, Tapias I, et al.
(2008) CERKL mutations and associated phenotypes in seven Spanish familieswith autosomal recessive retinitis pigmentosa. Invest Ophthalmol Vis Sci 49(6):
2709-13.8. Tang Z, Wang Z, Wang Z, Ke T, Wang QK, et al. (2009) Novel compound
heterozygous mutations in CERKL cause autosomal recessive retinitis
pigmentosa in a nonconsanguineous Chinese family. Arch Ophthalmol 127(8):1077-8.
9. Aleman TS, Soumittra N, Cideciyan AV, Sumaroka AM, Ramprasad VL, et al.(2009) CERKL mutations cause an autosomal recessive cone-rod dystrophy with
inner retinopathy. Invest Ophthalmol Vis Sci 50(12): 5944-54.10. Littink KW, Koenekoop RK, van den Born LI, Collin RW, Moruz L, et al.
(2010) Homozygosity mapping in patients with cone-rod dystrophy: novel
mutations and clinical characterizations. Invest Ophthalmol Vis Sci 51(11):5943-51.
11. Sugiura M, Kono K, Liu H, Shimizugawa T, Minekura H, et al. (2002)Ceramide kinase, a novel lipid kinase. Molecular cloning and functional
characterization. J Biol Chem 277(26): 23294-300.
12. Bornancin F, Mechtcheriakova D, Stora S, Graf C, Wlachos A, et al. (2005)Characterization of a ceramide kinase-like protein. Biochim Biophys Acta
1687(1-3): 31-43.13. Inagaki Y, Mitsutake S, Igarashi Y (2006) Identification of a nuclear localization
signal in the retinitis pigmentosa-mutated RP26 protein, ceramide kinase-likeprotein. Biochem Biophys Res Commun 343(3): 982-7.
14. Tuson M, Garanto A, Gonzalez-Duarte R, Marfany G (2009) Overexpression of
CERKL, a gene responsible for retinitis pigmentosa in humans, protects cellsfrom apoptosis induced by oxidative stress. Mol Vis 15: 168-80.
15. Nevet MJ, Vekslin S, Dizhoor AM, Olshevskaya EV, Tidhar R, et al. (2012)Ceramide Kinase-Like (CERKL) Interacts with Neuronal Calcium Sensor
Proteins in the Retina in a Cation-Dependent Manner. Invest Ophthalmol Vis
Sci 53(8): 4565-74.16. Garanto A, Nawajes MM, Egido-Gabas M, Marfany G, Fabrias G, et al. (2013)
Specific sphingolipid content decrease in Cerkl knockdown mouse retinas.Experimental Eye Research In press.
17. Vekslin S, Ben-Yosef T (2010) Spatiotemporal expression pattern of ceramidekinase-like in the mouse retina. Mol Vis 16: 2539-49.
18. Garanto A, Riera M, Pomares E, Permanyer J, de Castro-Miro M, et al. (2011)
High transcriptional complexity of the retinitis pigmentosa CERKL gene inhuman and mouse. Invest Ophthalmol Vis Sci 52(8): 5202-14.
19. Garanto A, Vicente-Tejedor J, Riera M, de la Villa P, Gonzalez-Duarte R, et al.(2012) Targeted knockdown of Cerkl, a retinal dystrophy gene, causes mild
affectation of the retinal ganglion cell layer. Biochim Biophys Acta 1822(8):
1258-69.20. Rivas MA, Vecino E (2009) Animal models and different therapies for treatment
of retinitis pigmentosa. Histol Histopathol 24(10): 1295-322.21. Graf C, Niwa S, Muller M, Kinzel B, Bornancin F (2008) Wild-type levels of
ceramide and ceramide-1-phosphate in the retina of ceramide kinase-like-deficient mice. Biochem Biophys Res Commun 373(1): 159-63.
22. Lieschke GJ, Currie PD (2007) Animal models of human disease: zebrafish swim
into view. Nat Rev Genet 8(5): 353-67.23. Morris AC (2011) The genetics of ocular disorders: insights from the zebrafish.
Birth Defects Res C Embryo Today 93(3): 215-28.24. Gestri G, Link BA, Neuhauss SC (2011) The visual system of zebrafish and its
use to model human ocular diseases. Dev Neurobiol 72(3): 302-27.
25. Maurer CM, Huang YY, Neuhauss SC (2011) Application of zebrafishoculomotor behavior to model human disorders. Rev Neurosci 22(1): 5-16.
26. Fadool JM, Dowling JE (2008) Zebrafish: a model system for the study of eyegenetics. Prog Retin Eye Res 27(1): 89-110.
27. Dowling J (1987) The Retina: An Approachable Part of the Brain. Cambridge,
MA: Harvard Universitry Press.28. Kay JN, Link BA, Baier H (2005) Staggered cell-intrinsic timing of ath5
expression underlies the wave of ganglion cell neurogenesis in the zebrafishretina. Development 132(11): 2573-85.
29. Labbe RM, Irimia M, Currie KW, Lin A, Zhu SJ, et al. (2012) A comparativetranscriptomic analysis reveals conserved features of stem cell pluripotency in
planarians and mammals. Stem Cells 30(8): 1734-45.
30. Thisse C, Thisse B (2008) High-resolution in situ hybridization to whole-mountzebrafish embryos. Nat Protoc 3(1): 59-69.
31. Yan YL, Miller CT, Nissen RM, Singer A, Liu D, et al. (2002) A zebrafish sox9gene required for cartilage morphogenesis. Development 129(21): 5065-79.
32. Carre A, Graf C, Stora S, Mechtcheriakova D, Csonga R, et al. (2004) Ceramide
kinase targeting and activity determined by its N-terminal pleckstrin homologydomain. Biochem Biophys Res Commun 324(4): 1215-9.
33. Li Z, Hu M, Ochocinska MJ, Joseph NM, Easter SS, Jr. (2000) Modulation of
cell proliferation in the embryonic retina of zebrafish (Danio rerio). Dev Dyn219(3): 391-401.
34. Luo J, Uribe RA, Hayton S, Calinescu AA, Gross JM, et al. (2012) Midkine-Afunctions upstream of Id2a to regulate cell cycle kinetics in the developing
vertebrate retina. Neural Dev 7(1): 33.
35. Pauli A, Valen E, Lin MF, Garber M, Vastenhouw NL, et al. (2012) Systematicidentification of long noncoding RNAs expressed during zebrafish embryogen-
esis. Genome Res 22(3): 577-91.36. Scott GR, Johnston IA (2012) Temperature during embryonic development has
persistent effects on thermal acclimation capacity in zebrafish. Proc Natl AcadSci U S A 109(35): 14247-52.
37. Ulitsky I, Shkumatava A, Jan CH, Subtelny AO, Koppstein D, et al. (2012)
Extensive alternative polyadenylation during zebrafish development. GenomeRes 22(10): 2054-66.
38. Yang D, Liu Q, Yang M, Wu H, Wang Q, et al. (2012) RNA-seq livertranscriptome analysis reveals an activated MHC-I pathway and an inhibited
MHC-II pathway at the early stage of vaccine immunization in zebrafish. BMC
Genomics 13: 319.39. Brockerhoff SE, Fadool JM (2011) Genetics of photoreceptor degeneration and
regeneration in zebrafish. Cell Mol Life Sci 68(4): 651-9.40. Wittkopp N, Huntzinger E, Weiler C, Sauliere J, Schmidt S, et al. (2009)
Nonsense-mediated mRNA decay effectors are essential for zebrafish embryonicdevelopment and survival. Mol Cell Biol 29(13): 3517-28.
41. Rodriguez-Mari A, Canestro C, Bremiller RA, Nguyen-Johnson A, Asakawa K,
et al. (2010) Sex reversal in zebrafish fancl mutants is caused by Tp53-mediatedgerm cell apoptosis. PLoS Genet 6(7): e1001034.
42. Lakowski J, Majumder A, Lauderdale JD (2007) Mechanisms controlling Pax6isoform expression in the retina have been conserved between teleosts and
mammals. Dev Biol 307(2): 498-520.
43. Nishida A, Furukawa A, Koike C, Tano Y, Aizawa S, et al. (2003) Otx2homeobox gene controls retinal photoreceptor cell fate and pineal gland
development. Nat Neurosci 6(12): 1255-63.44. Melamud E, Moult J (2009) Stochastic noise in splicing machinery. Nucleic
Acids Res 37(14): 4873-86.45. Melamud E, Moult J (2009) Structural implication of splicing stochastics.
Nucleic Acids Res 37(14): 4862-72.
46. Ellis JD, Barrios-Rodiles M, Colak R, Irimia M, Kim T, et al. (2012) Tissue-specific alternative splicing remodels protein-protein interaction networks. Mol
Cell 46(6): 884-92.47. Gracheva EO, Cordero-Morales JF, Gonzalez-Carcacia JA, Ingolia NT, Manno
C, et al. (2011) Ganglion-specific splicing of TRPV1 underlies infrared sensation
in vampire bats. Nature 476(7358): 88-91.48. Barbosa-Morais NL, Irimia M, Pan Q, Xiong HY, Gueroussov S, et al. (2012)
The evolutionary landscape of alternative splicing in vertebrate species. Science338(6114): 1587-93.
49. Merkin J, Russell C, Chen P, Burge CB (2012) Evolutionary dynamics of geneand isoform regulation in Mammalian tissues. Science 338(6114): 1593-9.
50. Wang SW, Kim BS, Ding K, Wang H, Sun D, et al. (2001) Requirement for
math5 in the development of retinal ganglion cells. Genes Dev 15(1): 24-9.51. Haider NB, Naggert JK, Nishina PM (2001) Excess cone cell proliferation due to
lack of a functional NR2E3 causes retinal dysplasia and degeneration in rd7/rd7mice. Hum Mol Genet 10(16): 1619-26.
52. Dyer MA, Cepko CL (2001) p27Kip1 and p57Kip2 regulate proliferation in
distinct retinal progenitor cell populations. J Neurosci 21(12): 4259-71.53. Shu X, Zeng Z, Gautier P, Lennon A, Gakovic M, et al. (2010) Zebrafish Rpgr is
required for normal retinal development and plays a role in dynein-basedretrograde transport processes. Hum Mol Genet 19(4): 657-70.
54. Shu X, Zeng Z, Gautier P, Lennon A, Gakovic M, et al. (2011) Knockdown of
the zebrafish ortholog of the retinitis pigmentosa 2 (RP2) gene results in retinaldegeneration. Invest Ophthalmol Vis Sci 52(6): 2960-6.
55. Veleri S, Bishop K, Dalle Nogare DE, English MA, Foskett TJ, et al. (2012)Knockdown of Bardet-Biedl syndrome gene BBS9/PTHB1 leads to cilia defects.
PLoS One 7(3): e34389.56. Chakarova CF, Khanna H, Shah AZ, Patil SB, Sedmak T, et al. (2012)
TOPORS, implicated in retinal degeneration, is a cilia-centrosomal protein.
Hum Mol Genet 20(5): 975-87.57. Mandal NA, Tran JT, Saadi A, Rahman AK, Huynh TP, et al. (2012)
Expression and localization of CERKL in the mammalian retina, its response tolight-stress, and relationship with NeuroD1 gene. Exp Eye Res 106: 24-33.
ZFcerkl Knockdown Model
PLOS ONE | www.plosone.org 12 May 2013 | Volume 8 | Issue 5 | e64048


Agraïments
A Manu. Por el camino recorrido y por constituir mi mayor apoyo durante la tesis. Por el
algoritmo macroevolutivo. Por llevarme a todos lados al principio. Por Toronto y los
koreanos. Porque casi no hay mail que no respondas al instante. Por co-optarme en el
CRG para acabar lo empezado. Por entender lo necesario que es el respeto mútuo. Porque
esta tesis no se explica sin tus fraseos y tus solos.
Al Jordi, per pescar-me des del primer moment. Per totes les oportunitats brindades, per
la confiança i per no negar-me mai res, especialment els plans més delirants. A Carlos, el
tudelano más majo que conozco (y seguramente que existe). Freak is the new black ;) A
la Bea, pels inicis i per si un dia les coses milloren. A l’Aina, per transmetre’m sempre
bon rotllo. A la Roser, per les canyes a Banyuls, les sortides en vaixell i la camisa de
franel·la. A l’Ari, l’Anna, la Rocío, el William i l’Steph, per recordar-me com és de
necessari romandre motivat. Als qui han format part de les planàries humanes: Cisco,
Chema, Sara, Susana, María, Loli, Miquels, Marta, Àlex, Jose, Eudald, Gus, Nídia... a les
mosques i als nouvinguts que no he arribat a conèixer, molta sort!
A la anterior generación de anfioxos. A Nacho, por ser un referente en sentido crítico y
alguien del que siempre es interesante conocer su opinión. Por las veces que hemos tenido
tiempo suficiente para charlar tranquilamente, menos seguro de las que me hubiesen
gustado. A Champi, por las risas que me echo cuando coincidimos y lo que me apetecería
colaborar contigo alguna vez. Ojalá algun día me anime y te haga una visita a Japón. A
Ildiko, por hacerme entender que la poyata es una cosa seria, y que los mejores
experimentos requieren paciencia y dedicación. A Senda, no coincidimos en el ambiente
cefalocordado, pero siempre me has ayudado cuando ha estado en tu mano.
Al meu “tron”, el Kike. Per ser el millor descobriment d’aquesta tesi. Perquè sense tu,
aquests anys no haurien estat ni una centèssima part d’enriquidors, divertits i interessants
del que han sigut. Per tots els moments d’aprenentatge i fascinació per l’evolució que
hem viscut junts, perquè l’única ciència que val la pena és la que es comparteix. Espero
que mai deixem de veure’ns, explicar-nos la vida, xerrar de literatura, política, filosofía…
i d’enviar-nos fistradas diodenarls, tikitikitii! I el més important, per la nostra amistat.
Perquè tot això només hagi estat una molt bona introducció.
A Salvatore, por ser un colega jefazo con una ilusión y unas ganas de hacer ciencia que
son contagiosas. Por las cuatro (!) estancias en Napoli y tu constante interés y
preocupación por mis movidas. To Ina, my window to the sea urchin world. For
everything you showed to me, the ~2500 embryo injections, and your honest interest to
discuss all the results. To Mena and Nietta, always available to give me clues about the
urochordate mysteries. To Claudia (Cuomo), for all the times you helped me with a
thousand things, even getting sperm from the urchins. I wouldn’t get half of my results if
you were not there. To Ylenia, because you are an example of kindness, amazing talent
and professionality. You deserve the best. To Margherita, for all the good vibrations I got
from you. Hope to meet you from time to time in exotic international meetings ;) To
Carmen, because of your brave character, good judgement, and being a reference in terms
of following your own path. To Evgeniya, who demonstrated me that being both crazy
and a great person is not incompatible. To Ivan and Alberto for being old-school biologists
who know that the true beauty is under the sea. To Rosaria, we did not coincide many
times, but you always seemed to me extremely enthusiastic and friendly. To Claudia
(Racioppi), because I still do not know how I’ve been so lucky to collaborate with you. I
wish you all lots of personal and scientific satisfaction.
To my beloved, tiny but mighty, CRG colleagues. Según voy entrando al lab: A Lucía,
por ser una dinamizador laboral y social nata. A Antonio, por tu inapreciable ayuda y tu
sanísimo escepticismo científico, estás hecho un gran investigador. A Andre, por disfrutar
como nadie de mi receta de castañas al microondas. A Javi, por tu perenne buen talante y
lo jachondo que eres siempre. Exon skipping. To Chris, for your sense of humor and your
patience with me when I don’t understand your pirate accent. Al Jon, per soportar millor
o pitjor les meves punkarrades. Al Jordi, perquè tot i que va ser molt breu, hi ha persones
amb les que connectes de seguida. To Beth, for being such an easy-going person who
knows that life deserves to be experienced with passion and excitement. A la Laura, per
la teva motivació zoo-neuro-freak i les teves ganes inacabables d’aprendre coses noves.
To Thom, for your interesting reflections without prior notice that are unexpected. A
Bárbara, por tu buen rollito, tus consejos y sabiduría poyatiles y tu compromiso de hacer
siempre un trabajo excelente. A Vicky, por ser una luchadora increíble, tenemos mucho
que aprender de ti, no tengo ninguna duda de que lo vas a petar. Y por supuesto, a Yamile,
por los millones de mails a cualquier hora, reuniones, conversaciones, más mails e
imitaciones de acento pésimas que has tenido que aguantar. No sé que hubiera hecho sin

tu ayuda. Te debo todas las cenas, cervezas, margaritas y tequilas del mundo. Gracias por
ser tan simpática y efusiva, me lo he pasado genial contigo. Espero que todo te vaya bien
chido, nomás!
A Ana, mi esponjóloga preferida, por tu actitud vital y lo natural que es para ti echar un
cable siempre. Por ser un reflejo del tipo de científico que me gustaría ser. A Chelo, por
el pretecho y porque si tú no me has librado de díscolo, ya nadie podrá. Por las semanas
en Murcia y por tomarnos en serio cuando lo normal hubiera sido darnos por unos giles
pelotudos. A Lucía, porque se nota a la legua lo buena gente y buena investigadora que
eres. Mucho ánimo con tu tesis, ojalá pudiese ayudarte tanto como lo has hecho tu
conmigo. A la Marina, per enfrontar-nos plegats al cruel món dels zebrafish que habiten
peixeres diabòliques d’universitat. Pels moments divertits i emocionants que vam passar
tot i les dificultats afegides ;)
A la troupe biòloga (i adoptats), especialment als qui s’han quedat pringant a la facultat
uns anyets més post-carrera per fer això que en diuen tesi/curros/WTF. A l’Alba, per ser
de les persones més amables, simpàtiques i altruistes que conec. Pel teu interès sincer
envers els qui t’envolten. Al David, perquè és brutal com de ràpid pots arribar a apreciar
i a sobre fer-te amic per sempre d’un infiltrat. Ja pots estar tranquil respecte les potencials
escriptures funeràries. Al Mays, perquè poques persones em transmeten tant bon feeling
com en mr. Mojo Working. N’hem de fer una de grossa quan acabem la tesi. A la Berta,
per tots els dinars 13:45h i lo fàcil que és parlar amb tu. Al Marc, per ser tant autèntic i
preparar una mistela que tombaria un senglar. A Nora, por Tarifa, las metanorfosis y por
apuntaros a swing. Al meu brother Eudald, què t’he de dir mamonasso. Doncs que espero
que seguim igual tota la vida, però amb més temps per veuren’s i fer coses plegats. Ens
ho hauriem de manegar per col·laborar amb algun tema i tenir l’excusa perfecte per fer-
nos unes visites post-cock. A la familia Llorente Martínez, incloent-hi el membre més
recent. En especial, al futur profe Edukator Melenas, perquè algun dia ens ho muntarem
per anar a la Polinesia amb unes barbes gegants a gaudir de l’oceà i comentar les
vicissituts del gran F.
A l’Anna, una pontsicana internacional, per tots els bons moments viscuts, els viatges per
Quebec, Nepal, Sardenya, etc... Espero que tot et vagi genial per Vancouver, perquè t’ho
mereixes. Als meus companys de pis durant aquests darrers anys. A l’Esmail, pels gin-

tonics, els limoncellos i la bogeria final de tesi... que per fi s’ha acabat! Et desitjo el millor
a Noruega i que puguis surfejar sempre que el cos t’ho demani. A la Marta, per fer-me
riure amb els teus comentaris asalvatjats que no passarien cap tipus de censura. A Aran,
por todas las comidas, cafeses e interesantes conversaciones tete-a-tete. Por ser una gran
compi, colega, y prácticamente familia ;). To Greta, my favourite anglo-italian person,
whose natural sympathy and kindness made us become her instant friends. Al Pablo i a
l’Uri, per mantenir l’amistat durant totes les nostres etapes vitals des dels 90. Si es que ja
tenim una edat...
A mi familia, por haberme apoyado y animado siempre en todo. Por transmitirme unos
valores que me han permitido comprender cuales son las cosas verdaderamente
importantes. Así da gusto. Os quiero.
A tothom qui em deixo perquè he d’entregar la tesi d’una vegada...
Una abraçada,
Demi
Copyright © 2022 FDOKUMEN