THE PROBLEM OF LINEAGE IN GIS
39
Transcript of THE PROBLEM OF LINEAGE IN GIS


National Center for Geographic Information and Analysis
LINEAGE IN GIS:
THE PROBLEM AND A SOLUTION
David P. LanterNCGIA Fellow, Department of GeographyUniversity of California at Santa Barbara
Santa Barbara, CA 93106
NCGIA Technical Paper 90-6Sept. 1990

THE PROBLEM OF LINEAGE IN GIS
David P. LanterDepartment of GeographyUniversity of California
Santa Barbara, California 93106(805) 961-8616
ABSTRACT. This paper focuses attention on a fundamental geographic structure: the GIS application. Lineagedocumentation specifies an application’s source data, transformations, and input/output specifications. Such information is inherentlycausal, communicating the theory embodied in a GIS application and the meaning of its product. A number of techniques forautomating lineage information are examined. None are found to be capable of documenting data lineage.
KEYWORDS: GIS, Application, Automated documentation, Spatial data quality, Spatial data transfer standards, Geographicstructure.

A geographic information system (GIS) is computer software designed to collect, store, retrieve, manipulate, and displayobjects defined as points, lines, or areas (Tomlinson et al. 1976; Marble 1984; Clarke 1986; and Dueker 1987). The GISs uniqueability to manipulate existing data and "synthesize" new spatial entities separates it from other information processing technologies(Burrough 1986; Cowmen 1988). This ability to create new entities results from programmed code for making explicit features fromimplicitly expressed spatial relations between data stored in the GIS database. Goodchild refers to this process as spatial analysis(Goodchild 1987). Transforming existing data into new data is a double-edged sword. The resulting database may have moreinformation than the old one. The meaning of the new information, however, is exogenous and not found in the data (Tobler 1979).
To address the problem of interpreting the meaning of derived spatial data the National Committee for Digital CartographicData Standards (NCDCDS) has proposed that exchanged cartographic data be accompanied by a ‘lineage' statement within a formalquality report (Morrison 1988). The committee's definition of lineage is information describing source materials and transformationsused to derive final digital cartographic data files (Chrisman 1983a; Morrison 1988). The lineage report is intended to serve as acommunication mechanism between data producers and users. It is a "truth in labeling" approach to cartographic data quality reporting(Moellering 1987). The producer's responsibility is to label the GIS derived data product with information concerning its sourcematerials and processing history. The user's responsibility is to interpret such information and determine the data’s fitness for use(Chrisman 1983; Grady 1988).
This paper focuses attention on the structure of spatial data lineage. A number of automated systems are examined, includinghistory files, version control systems, map librarians, and polygon attributes. A critical review illustrates that none of these methodsare capable of fulfilling the informational requirements of a lineage report. A system that would meet such requirements would detailthe characteristics of cartographic sources, the topologic relationships between source, intermediate and product layers, and thetransformations applied to sources to derive GIS applications output products.
The Temporal Topology Component
Langran and Chrisman differentiate between two temporal axes relating to cartographic change (Langran and Chrisman1988). World time' tracks changes to geographic features occurring on the surface of the Earth. Tagging each feature with a time-stamp marks time on this axis and facilitates tracking it as it changes over many dates (Basoglu and Morrison 1977; Armstrong 1988;Langran 1988; Langran, 1989). The world time axis is important to producers of map products having strict requirements for currencyand historical accountability (Hunter 1988; Vrana 1989).
'Database time' differs from 'world time', according to Langran and Chrisman, in that its concern is for tracking entry ofspatial entities into a geographic database (Langran and Chrisman 1988). This begins, they argue, when the first data is entered intothe database and ends on the last data entry. Langran and Chrisman's, definition of database time, however, cuts short the length of theaxis. From the view of a GIS, database time extends beyond the phase of data collection and storage and continues through phases ofretrieval, manipulation, and display. It marks not only the changing nature of geographic entities as they are stored within a database,but also the derivation of new ones as they are derived by geographic information processing. Lengthening the 'database time' axisthus makes it useful for structuring transformations recorded within lineage documentation of a GIS application.
Langran and Chrisman suggest that topologies are useful not only for organizing spatial data, but for structuring thecartographic time axes to track changing cartographic features in a geographic database (Langran and Chrisman 1988). They instruct,
... just as the spatial topological data structure would provide a means ofnavigating from an object to its neighbor in space, the corresponding temporaldata structure would provide a means of navigating from a state or a version toits neighbor in time. (p. 7)
Tomlin's cartographic model (Tomlin 1990) is useful for focusing attention on such topologies taking place within GISapplications. The cartographic model’s diagrammatic specification explicitly records the flow of maps through transformationsapplied throughout the course of geographic information processing (Tomlin and Berry 1979; Tomlin 1983). The model records thesequence of transformations thematic layers undergo from source materials through intermediate processes to final products. It is aspecial form of data flow diagram depicting layers as nodes and transformations as labeled directed links. The resulting networkrepresentation specifies an application's processes and data interfaces between them (Martin and McClure 1985). Its graphicalrepresentation expresses the morphology of a GIS application. An example cartographic model is illustrated in Figure 1.

Recording processing steps applied to geographic data in a cartographic model provides a powerful mechanism fordocumenting input/output relationships inherent in a GIS application. Examining the cartographic model reveals the entire history oftransformations applied to source materials throughout the course of a GIS application. It captures two of three important aspects oflineage information: input/output


relationships and transformations. This information when combined with descriptions of source materials is lineage documentation.
Lineage Documentation As Geographical Structure
Tobler suggests, "a geographic structure is a transformation of geographic data, a theory, or model of reality" (Tobler 1979,105). Lineage information is such a geographic structure. It documents source data, transformations, and input/output specificationsillustrating the derivation of cartographic products within a GIS application. By representing causal structure, cartographic lineage canbe viewed as a theory or model of geographic reality. This structure communicates the meaning of the derived map.
Analysis of a derived map’s lineage provides understanding of the geographic reality it represents. It also makes obviouswhen a GIS application is based on flawed logic. This is important. If the theory encoded in a GIS application is not clearlyunderstood, then a correct interpretation of the resulting map is not possible. Recording this information along with documentingsources has critical relevance to decision makers using information derived by GIS applications.
By representing structure, lineage documentation transforms the GIS application into material reality. It expresses the natureof source data, input/output relationships, and transformations. Documentation of sources and sequences of transformations expressedin terms of commands and command modifier values has the potential of simultaneously reflecting and reinforcing the world view andspatial thought of the institution applying them to analyze digital representations of the world. As a result, lineage documentationprovides cultural cartographers with material necessary to study the cultural context of GIS-based decision making (Rundstrom 1990).
The Problem of Lineage In GIS
Lineage documentation is important to interpreting the nature and quality of a GIS derived map products. However, it is usedrarely if at all. Vonderohe and Chrisman (1989) report that of six interrelated spatial data quality components: lineage, positionalaccuracy, attribute accuracy, logical completeness and currency, lineage is the only one that is "not testable" in the course of spatialdata processing (Vonderohe and Chrisman 1985). This is because no technique for automatically creating and manipulating lineageinformation has been suggested in the geographic literature. The sections that follow review existing aspatial and spatial methods fortracking lineage in various information systems.
Tracking Lineage in Aspatial Systems
Systems for documenting and tracking changes to data files within an information system are common in computerenvironments. These methods range from simple history files, log files and audit files to more complicated schemes of trackingupdates to programmed source code and text documents.
History Files. The most basic form of documenting changes to a data file is through use of a "history file" (Figure 2). Thiscapability is often part of a computer’s operating system and provides a way for the system administrator to keep track of commandsgiven to the system by users. An examination of a history file will yield commands used and subsequent changes made to various filesby users. An example of such a history can be found in the UNIX operating system (McGilton and Morgan 1983).

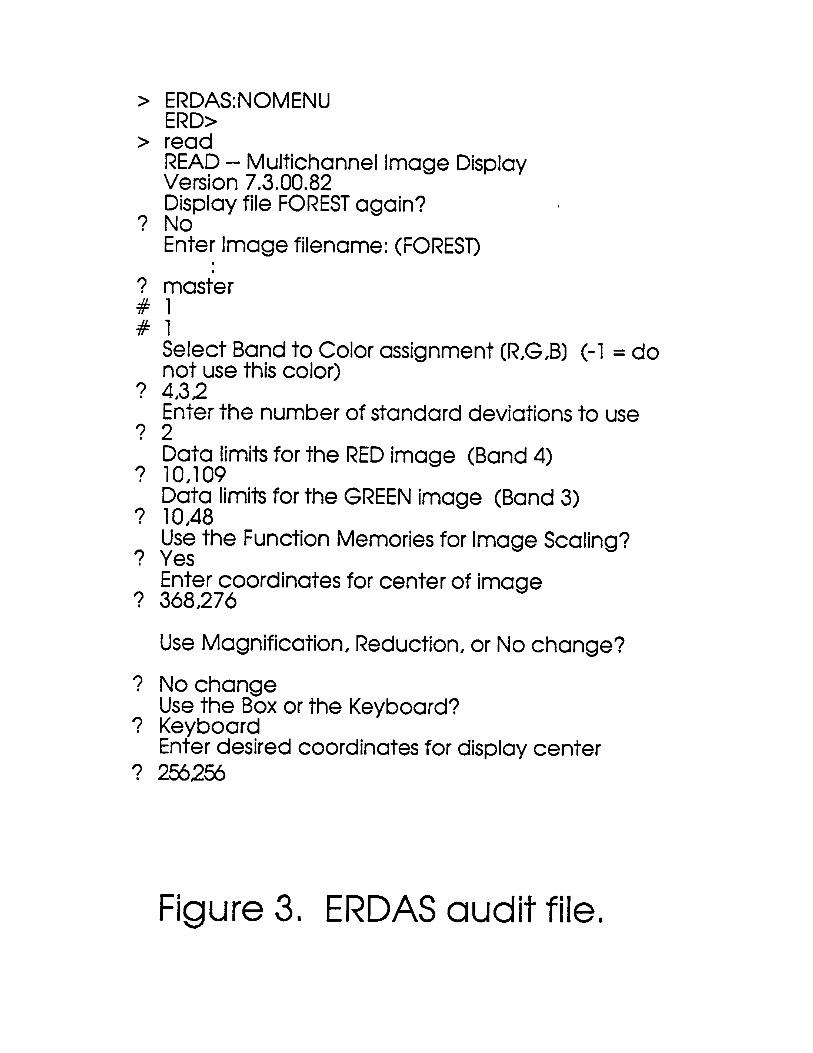
Audit and Log Files. Variations on the history approach include the ’audit’ and ’log’ files. These systems provide detailedlistings of user commands and system output (Figures 3 and 4). Audit or ’watch’ files typically record the entry and system responsesfor each given command. In addition, log files record date, elapsed time, and amount of system resources used during execution ofeach command. Examples of such facilities can be found in the ERDAS and ARC/INFO systems.
Each of the history, audit, and log files has serious short comings related to lineage documentation. They do not documentthe nature of data sources input into the GIS database. Nor do they provide any connectivity to specific data layers within the database.As a result, many pages of output or CRT screens of data must be reviewed to determine what transformations were made to specificmaps by user entered commands. While they are able to capture commands as typed by users, these facilities are unable to explicitlyrepresent topological input/output relationships between sources and derived spatial data products. Due to the dynamic nature ofspatial information systems such manual approaches to determining all the source data and transformations resulting in a given mapare inadequate.
Version Control Systems. Version Control Systems track revisions made to documents and program source code. They aresoftware engineering tools often supplied along with hardware by computer manufactures such as Control Data Corporation, IBM,


SUN, Univac, and others. One example is the Source Control and Configuration System (’SCCS’) originally part of the BerkeleyUNIX operating system. SCCS is a library of operating system functions enabling users to maintain a file of revisions to source codedocuments created in the course of software development (Allman 1984).
The SCCS stores the initial document and file of changes (’deltas’) to that document associated with each revision (Figure 5).The delta is the set of differences between each revision and the previous revision. Each delta is accompanied by a time and date-stamp and an optional user comment. Using this file of deltas, a user can start with an initial document and more forward in timerecreating any subsequent version. Alternatively, other version control systems store the complete current versions of a documenttogether with a series of deltas containing the history of revisions made over time. This allows the user to move backward in time torecreate any previous version. Polytron’s PVCS is an example of this latter type (Kinzer and Kinnaird 1987).
Version control systems provide a mechanisms for both documenting sources and explicitly representing input/outputrelationships. Their major limitation results from their inability to create meaningful deltas from spatial data. In addition, they lack anautomated capability for documenting the transformations applied to input layers used to derive a product. Users of version controlsystems tracking changes to aspatial data could cope with this limitation by manually keying in text to describe each transformationand its associated parameters.

Tracking Lineage in GIS
Consumers taking advantage of a growing range of source materials and automated map derivation tools feel the need forlineage information. GIS users participating in even small projects are quickly realize their ability to create new maps exceeds theirability to track the processes used to create them (Moore 1983).
To address the problem of lineage in GIS, Krogulecki and Parks have proposed a system of standard forms to manuallydocument digital map creation (Krogulecki and Parks 1988). Information concerning source digitized materials are entered by GISusers into a log book along with specific transformations applied in the course of file creation. This information can then be typed intoa computer file and exchanged as a file header field of free text with an associated layer (Guptill 1987; Cooper 1989). One problemwith the manual approach to lineage reporting is that it requires a conscientious effort on the part of all users to fill out forms at eachstep of a spatial application. A means for automatically creating lineage documentation and associating it with a derived GIS dataproduct is clearly preferable.
A review of various commercial geographic information system manuals (from ESRI, ERDAS, Geobased, and IIBM) andtelephone interviews with technical staff of other GIS vendors and systems integrators (Anderson Consulting, Deltasystems,GeoVision, Intergraph, Kork, McDonald Douglas, Software-AG, Synercom, USA-CERL, and Wild Heerbrug) reveals many systemshave capabilities for maintaining history, log, and audit files, but all lack an automated lineage tracing capability. Some vendors arguethat their systems maintained critical data management information within "map librarians", or as "polygon overlay attributes".
Map Librarians. In general, map librarians are a series of tools for partitioning and organizing a geographic database bylocation and theme (Aronson and Morehouse 1984). They provide a spatial and thematic framework for organizing a cartographicdatabase. This framework is a basis for establishing checking-in and checking-out procedures. Such procedures are useful forcontrolling the process of data archival. This ability to control a data archive facilitates implementing standards of data contentconsistency (ESRI 1989).
Map librarians, however, are not intended to record the lineage of derived maps. While data sources may be stored as layerswithin a map library, the sources are not documented with attributes concerning date (in world time), scale, projection, agency, andaccuracy. In addition, librarians are not equipped to record the dynamic nature of database structure with temporal topology as newlayers are created, nor the history of transformations applied when various layers are used to produce a product.
Polygon Overlay Attributes. Of the various families of spatial analytic functions polygon overlay is one of the mostpowerful. Polygon overlay functions are set theoretic operations. Such operations involve the superimposition of spatially registeredthematic map layers. The result is a composite representation exhaustively specifying the spatial interaction of thematicallydifferentiated geographic features contained within input layers.
Systems supporting spatially topological polygon overlay often handle spatial and aspatial data separately. In topologicalpolygon overlay the newly derived geographic features inherit their aspatial attributes from input features. The aspatial attributes maybe organized as attribute tables transferred from sources and merged as annotation of the derived features. Often the new attributesmaintain a symbolic connection to their ‘parental' input layers. In these cases database time topology is maintained as attributes of thelayer created by the overlay. This is illustrated in Figure 6.
Examination of the attributes inherited by a new feature reveals a lack of documentation concerning the type of overlay (e.g.union or intersection) and command modifiers (e.g. tolerances) used to derive the resulting map. Thus, critical information fordetermining the lineage of a product derived by topological overly is missing.
In addition to neglecting documentation of transformations, such systems often lack annotation concerning the nature ofimported or digitized source layers. Such systems also often lack documenting imported or digitized source layers with lineageattributes. Another problem concerns the fact that many GIS applications are not based solely on map overlay. GIS applications oftenuse other types of transformations (e.g. buffer generation, aspatial attribute selection, contiguity or connectivity determination). Incontrast to those derived by polygon overlay, features and layers resulting from these operations are not connected to their inputs. Insummary, systems supporting topologic polygon overlay often lack documentation concerning data sources, transformations andassociated parameters. While they do document inputs related to features derived by polygon overlay, they do not documentinput/output relationships between a number of other important GIS operators.

Conclusion
Lineage information has been defined as consisting of three components. These components are: source data description,transformation documentation, and input/output specifications. The combination of the three is a complete description of the structureof a GIS application. As such, lineage information expresses the logic resulting in derived data. It is a model useful for communicatingthe theory embodied in a GIS application and the meaning of its derived data product.
A number of automated techniques were examined and found to be ill-equipped for creating or maintaining such criticallineage information. History lists, log and audit files document transformations and parameters lack source description andinput/output specifications. Map librarians lack all three components of lineage information: source description, transformationdocumentation, and input/output specification. Polygon overlay attributes maintain input/output specifications but neglect sourcedescription and transformation documentation. While such systems do document the use of data sources used in deriving layers bytopologic polygon overlay, they do so for a limited number of transformations.
The only systems found to have the potential to include the three informational components of lineage are manual ones.Combining source descriptions with the application detailing of a cartographic model is a useful method of specifying a lineage reportfor a GIS application’s product. Automating this information will insure systematic documentation of the lineage qualities of derivedGIS data products.


REFERENCES
Allman, E. 1984. "An Introduction to the Source Code Control System", UNIX Programmer’s Manual Supplementary Documents,Computer Science Division, Berkeley, CA:Department of Electrical Engineering and Computer Science, University of California.
Armstrong, M.P. 1988. "Temporality in Spatial Databases", Proceedings of GIS/LIS ’88, Falls Church, VA: American Congress onSurveying and Mapping, 2:880-889.
Aronson, P. and S. Morehouse 1983. "The ARC/INFO Map Library: A Design for a Digital Geographic Database", Proceedings of theSixth International Symposium on Automated Cartography; Steering Committee of the Canadian National Committee for the SixthInternational Symposium on Automated Cartography, 1:372-382.
Basoglu, U. and J.L. Morrison 1977. "The Efficient Hierarchical Data Structure for the U.S. Historical County Goundary Data File",Harvard Papers on GIS, Volume 4. G. Dutton, ed. Reading, Massachusetts: Addison-Wesley.
Burrough, P.A. 1986. Principles of Geographical Information Systems for Land Resources Assessment, Oxford: Clarendon Press.
Chrisman, N. R. 1983. "The Role of Quality Information in the Long-Term Functioning of a Geographic Information System",Proceedings of the Sixth International Symposium on Automated Cartography; Steering Committee of the Canadian NationalCommittee for the Sixth International Symposium on Automated Cartography, 1:303-312
Clarke, K.C. 1986. "Advances in Geographic Information Systems", Compu. Environ. Urban Systems, 10(3/4):175-184
Cooper, A.K. 1989. "The South African Standard for the Exchange of Digital Geo-Referenced Information", Proceedings of the NinthInternational Symposium on Computer-Assisted Cartography, Falls Church, VA: American Congress on Surveying and Mapping745-753.
Cowen, D.J. 1988. "GIS vs. CAD vs. DBMS: What are the Differences?", Photogrammetric Engineering and Remote Sensing,54(11):1551-1555
Deuker, K.J. 1987. "Geographic Information Systems and Computer-Aided Mapping", APA Journal, Summer
ERDAS 1985. ERDAS USERS MANUAL Revision 7.2, Atlanta, GA:ERDAS Inc.
ESRI 1987. ARC/NFO USERS GUIDE, Redlands, CA:Environmental Systems Research Institute.
ESRI 1989. LIBRARIAN USERS GUIDE, Redlands, CA:Environmental Systems Research Institute.
Grady, R.K. 1988. "Data Lineage in Land and Geographic Information Systems", Proceedings of GIS/LIS ’88, Falls Church,VA:American Congress on Surveying and Mapping; 2:722-730.
Goodchild, M. 1987. "A Spatial Analytic Perspective on Geographical Information Systems", International Journal of GeographicInformation Systems, 1(4):327-334.
Guptill, S.C. 1987. "Techniques for Managing Digital Cartographic Data", Proceedings of the 13th International CartographicConference, International Cartographic Association, 4:221-226.
Hunter, G.J. 1988. "Non-current Data and Geographical Information Systems: A Case for Data Retention", International Journal ofGeographical Information Systems, 2(3):281-286.
Kinzer, D.and R. Kinnaird 1987. POLYTRON VERSION CONTROL SYSTEM USER’S MANUAL, Beaverton, OR:PolytronCorporation.
Krogulecki, M. and B.O. Parks 1988. "A Prototype Decision Guide and Audit Log for Preparation of Spatial Data Bases", Proceedingsof GIS/LIS ’88, Falls Church, VA:American Congress on Surveying and Mapping, 2:711-721.
Langran, G. 1988. "Temporal GIS Design Tradeoffs", Proceedings of GIS/LIS ’88, Falls Church, VA:American Congress onSurveying and Mapping, 2:890-899
Langran, G. 1989. "A Review of Temporal Database Research and Its Use in GIS Applications", International Journal of GeographicInformation Systems", 3(2):215-232.
Langran, G. and N. Chrisman 1988. "A Framework for Temporal Geographic Information", Cartographica, 25(3):1-14.
Marble, D.F. 1984. "Geographic Information Systems: An Overview", PECORA 9. Proceedings Spatial Information Technologies forRemote Sensing Today and Tomorrow, 19-24
Marble, D.F. et al. 1983. "Geographic Information Systems and Remote Sensing", The Manual of Remote Sensing, Falls Church,VA:American Society of Photogrammetry, 1:923-958
Martin, J. and C. McClure 1985. Diagramming Techniques for Analysts an Programmers, Englewood Cliffs, N.J.:Prentice-Hall Inc.
McGilton, H. and R. Morgan 1983. Introducing the UNIX System. McGraw-Hill Book Company; New York, pp. 485-486
Moellering, H. ed. 1985. Digital Cartogrpahic Data Standards: An Interim proposed Standard. Report 6, National Committee forDigital Cartographic Data Standards, Columbus, OH: Ohio State University.
Moellering, H. ed. 1987. Issues in Digital Cartographic Data Standards. Columbus, 12 Report 8, National Committee for DigitalCartographic Data Standards, OH: Ohio State University.
Moore, H. 1983. "The Impact of Computer Technology in the Mapping Environment", Proceedings of the Sixth InternationalSymposium on Automated Cartography; Steering Committee of the Canadian National Committee for the Sixth InternationalSymposium on Automated Cartography, Vol. 1 pp. 60-68
Morrison, J. 1988. "The Proposed Standard for Digital Cartographic Data", The American Cartographer, Volume 15, Number 1
Rundstrom, R.A. 1990. "A Cultural Interpretation of Inuit Map Accuracy", The Geographical Review,80(2):155-168.
Tobler, W.R. 1979. "A Transformational View of Cartography", The American Cartographer 6(2):101-106.
Tomlin, C.D. 1983. Digital Cartographic Modeling Techniques in Environmental Planning, Unpublished Ph D. Dissertation, YaleUniversity.
Tomlin, C.D. 1990. Geographic Information Systems and Cartographic Modeling, Englewood Cliffs: NJ: Prentice-Hall, Inc.
Tomlin and Berry 1979. "A Mathematical Structure for Cartographic Modeling in Environmental Analysis", Proceedings of theAmerican Congress on Surveying and Mapping, American Congress on Surveying and Mapping, Falls Church, VA, pp. 269-283.
Tomlinson, R.F., Calkins, H.W., and Marble, D.F., 1976. Computer Handling o Geographical Data , Paris: UNESCO Press.
Vonderohe, A.P. and N.R. Chrisman 1985. "Tests to Establish the Quality of Digital Cartographic Data: Some Examples from theDane County Land Records Project", Proceedings of the Seventh International Symposium on Computer-Assisted Cartography,American Congress on Surveying and Mapping; Falls Church, VA, pp. 552-559
Vrana, R. 1989. "Historical Data as an Explicit Component of Land Information Systems", International Journal of GeographicalInformation Systems, Vol. 3 No. 1 pp. 33-49

DESIGN OF A LINEAGE-BASED META-DATABASE FOR GIS
David P. LanterDepartment of Geography
University of CaliforniaSanta Barbara, California 93106
(805) 961-8616
ABSTRACT. This paper presents the conceptual design of a meta-database system for documenting data sources and GIStransformations applied to derive cartographic products. Artificial intelligence techniques of semantic networks are used to organizeinput-output relationships between map layers and frames to organize lineage attributes characterizing source, intermediate, andproduct layers. An illustrative example indicates that a lineage meta-database enables GIS users to engage in source assessmentthroughout their analysis of spatial data sets.
KEYWORDS: GIS database management, Spatial data lineage, artificial intelligence, semantic networks, frames, sourceassessment

One reason GIS data lineage documentation has not been automated in geographic information systems is that its structurehas not been well understood. Lineage documentation is based on three components. These components are: source description, detailsof transformations, and input/output relationships between layers. When the three are combined they model the structure of a GISapplication. Study of a lineage model documenting the structure of a GIS application makes possible an understanding of a derivedcartographic data product. This paper presents a technique for automating lineage information and documenting the content andstructure of a GIS database.
A system design capable of acquiring and manipulating cartographic data lineage information is based on two levels: ageographic level and a 'meta-data’ level (Smith and Pazner 1984; Abler 1987; Gahegan and Roberts 1988; Salge' and Sclafer 1989;Feuchtwanger 1989). The geographic level contains spatial and aspatial information stored in traditional GIS data structures. Themeta-data level contains abstract information describing data stored in the geographic level. Therefore, implementing the meta-datalevel creates an information system about the GIS's database.
Salge' and Sclafer suggest that the meta-data level contain quality and genealogical specifications for the geographic data(Figure 1). This concept is useful for automating and manipulating lineage information. The result is a lineage meta-database systemfor tracking data entering the GIS and the transformations applied once they are there.

Conceptual Design
There are many approaches to organizing spatial data in geographic information systems including the ’Least Common’ or’Integrated Geographical Unit’ (Chrisman, 1975), and object-oriented models (Kjerne and Dueker 1986; Charlwood et al. 1987;Herring 1987; Gahegan and Roberts 1988; Egenhofer and Frank 1989). The automated lineage meta-database system presented in thisstudy is oriented towards layer-based geographic information systems. The layer-based GIS model, illustrated in Figure 2, separatesindividual themes of data into a set of registered overlays (Chrisman and Niemann 1985; Kjerne and Dueker 1986; Aronson 1987;Bracken and Webster 1989). Layer-based geographic information systems are chosen because they are commonly available and wellunderstood. Examples of layer-based GIS include the vector-based ARC/INFO and the raster-based Map Analysis Package.
In a companion article it was suggested that the relationships between derived maps and their sources is topological. Suchconnectivity between an application’s layers is readily represented with Tomlin and Berry’s cartographic model (Tomlin and Berry1979). The cartographic model is a diagramming convention for representing map data flowing through a GIS application as theyundergo transformations from source material through intermediate states to final products. The model’s three basic building blocksare: thematic layers, processes, and data flows. From a pictorial standpoint, these transformations are documented by arrowsrepresenting data flows between layers. Processes transforming layers are documented as annotations along flow arrows. The result isa flowchart illustrating a sequence of data transformations necessary to achieve the desired map product.
Tomlin and Berry suggest cartographic modeling is a means of sequentially ordering GIS operators as if they weremathematical functions in a conventional algebraic expression (Tomlin and Berry 1979; Berry 1987)." An illustration of cartographicmodeling in an application to determine parcels over an aquifer at risk from a discharge of hazardous pesticides.


The application begins with: a parcel map (LOTS), an underground water aquifer map (ZONE), and a lot from parcel maphaving a hazardous discharge of pesticides. The pesticides may have a horizontal range of flow of a certain distance (130 ft.). The taskis to find where a buffer zone of pollution threatens the aquifer, and inform owners of parcels at risk of tainted water. A simplifiedcartographic model for this application is diagrammed in Figure 3.
The cartographic model is an elegant approach that helps potential users to understand how a GIS derived data product wasproduced. For example, the complete cartographic model illustrated in Figure 3 shows COW is derived from several intermediatelayers, all tracing their lineage back to LOTS and ZONES. Questions concerning the processing required to create COW can also beanswered by examination of the cartographic model.
Thus, in layer-based geographic information systems: maps are layers, GIS operations transform individual or combinationsof layers to derive new layers. The cartographic model is a powerful mechanism for documenting the temporal topology of spatial datalineage inherent in GIS applications. However, it is typically used informally if it is used at all.
Missing from the cartographic model, however, is documentation of the source layers. If either are the output of some otherapplication, then that application’s cartographic model would reveal its lineage and point to the original data sources contributing to aproduc (e.g. COW). Questions concerning the original input scale, source agencies, projection, etc. can only be answered withdocumentation of those layers (e.g. LOTS and ZONES). For the cartographic model to be useful for automated lineage tracing it mustbe adapted to include attributes of three layer types within GIS applications.


A taxonomy of source, intermediate, and product layers serves as a basis for structuring layer attributes needed to tracespatial data lineage. These attributes are needed to encode the conditions of the steps of a geographic algorithm (e.g. parameters,algorithms, mathematical transformations, etc.), characteristics of the map layers inherent in them (e.g. source, data, scale, use,responsibility etc.), as wen as their uses in decision making. This information is critical to an understanding of derived maps resultingfrom spatial information processing.
Source layers are original inputs to a spatial database. The National Committee for Digital Cartographic Data Standards(Morrison 1988) suggest source documentation includes lineage information concerning name, feature types, date, responsible agency,scale, projection, and accuracy. Documenting database sources with this kind of information is fundamental to determining their utilityand their "offspring’s" utility for GIS-based spatial analysis.
Intermediate layers bridge the gap between source and final products. Therefore, they require documentation concerning thenature of the transformation used in their derivation. Products layers output from the system for use in decision making. Theirexistence does not indicate any finality in terms of their use in subsequent processing. Rather, they record a pause in a continuing GISdatabase life cycle. Products are intermediate layers requiring documentation of the transformation used for their creation. In addition,products may be documented with information concerning their use in decision making. Such information might include the decisionmakers using them, their role in decision making, release dates, and those responsible for their maintenance.
Design Considerations
A design of a lineage information program (’LIP’) capable of creating and managing a lineage meta-database is based upon aset of general assumptions. The design presented here assumes the following: a layer-based geographic information system, thetemporal topology of lineage between database layers inherent in spatial applications, and computer programming techniques ofsemantic networks and frames. As shall be demonstrated knowledge-based techniques of semantic networks and frames serve asbuilding blocks for creating a lineage meta-database.
Knowledge representations are data structures in which knowledge about a particular problem domain is stored. Suchstructures are important because they are useful for representing information about recurring patterns extracted from our experience(Rich 1983). A semantic network is a general framework in which knowledge is organized as a set of nodes connected by labeledlinks. Since relationships are explicitly represented as links in a graph, a semantic network traversal algorithm could make relevantassociations by simply following links (Luger and Stubblefield 1989).
Semantic network representation of a domain, such as a geographic application, assigns semantic meaning to nodes and links.Parent and child relationships are useful metaphors for describing the order found in the graph structure of GIS applications. Nodesrepresent map layers within a GIS database. Links denote semantic parent and child relationships between layers. These relationshipsconnect input and output maps of spatial transformation processes within GIS applications.
Parent links indicate which output layers are the direct result of processing a particular input layer. They answer thegenealogical question: Who are my descendants? Child links indicate which input layers a particular output layer was derived from.They answer the lineage question: From whom am I derived? In Figure 4, Map-1 has one parent link pointing to MAP-2. Map-2 hasone child link pointing to MAP- 1.
Semantic networks can serve as a basis for differentiating layers within geographic applications. Figure 5 illustrates thesemantic network representation of an application to create the final product layer COW from sources LOTS and ZONES. Theproperties made clear from the semantic network of parent/child relationships relate to source layers intermediate layers, and finalproducts. If a layer lacks child links it must be a source layer within the horizon of the GIS database. In Figure 5, LOTS and ZONESlack such links.
The fact that a layer lacks links pointing to input data layers indicates it was obtained from data originating outside thedatabase. If child links exist, then the spatial data layer is an intermediate layer. In the Figure 5 it can be observed that COV1, COV2,COV3, and COV4 are intermediate layers having child links. AR intermediate layers are associated with parent layers from whichthey are derived. These parent layers are accessible through child links. If an intermediate layer’s parent links are empty, then it is anapplication’s final product. COW is a final product because it is an intermediate layer that lacks parent links.


Thus, transforming a geographic application into a semantic network of parent/child links makes it possible to distinguishdifferent types of geographic data layers. Source layers have parent but lack child links. Intermediate layers have child links and mayor may not have parent links. An application’s product layer is an intermediate layer that has child but no parent links.
The use of frames embodies the concept that knowledge relevant to a particular phenomenon can be represented (Minsky,1975). Frames usually consist of a name of a phenomenon and a listing of attributes that describe it. These attributes are usually called"slots" and the values documenting instances of the phenomena fill the slots.
Frames serve as structures to store attributes of entities. Therefore, they are useful in organizing lineage attributes of layerswithin GIS applications. One frame is designed to store documentation about such things as a layers date, scale, and projection.Another stores information about the command used to transform a layer’s inputs. A third handles attributes that document a layer’suse in decision making.
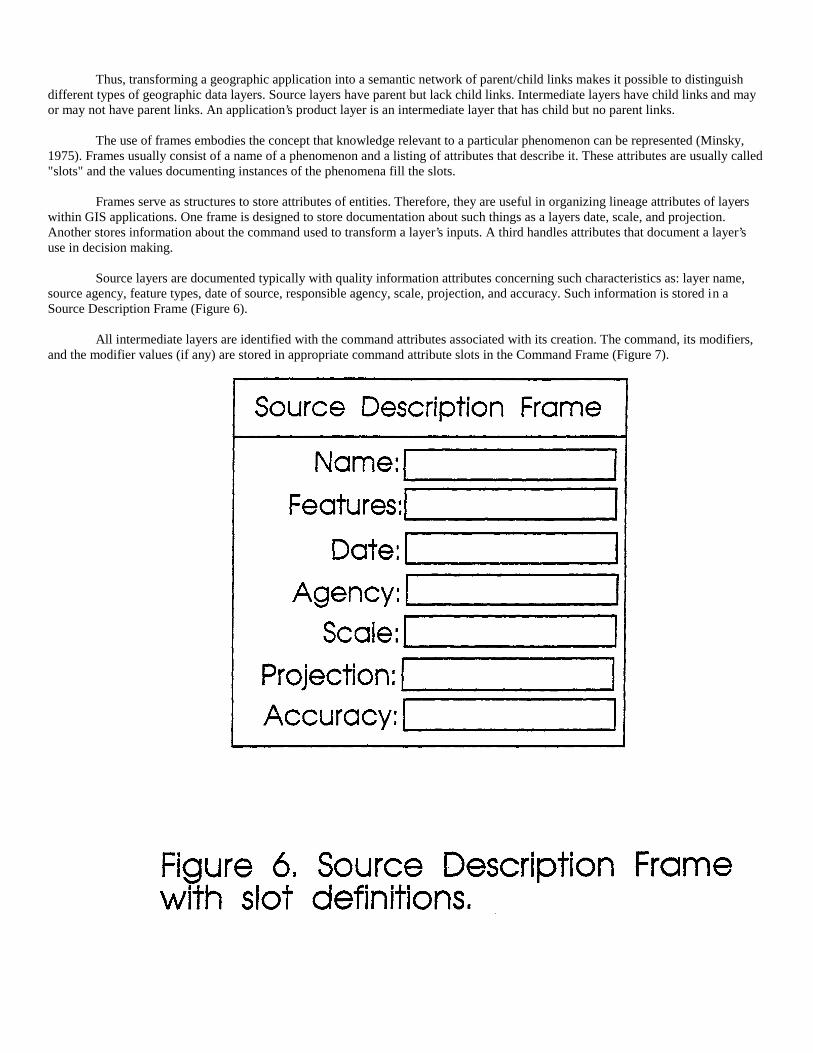
Source layers are documented typically with quality information attributes concerning such characteristics as: layer name,source agency, feature types, date of source, responsible agency, scale, projection, and accuracy. Such information is stored in aSource Description Frame (Figure 6).
All intermediate layers are identified with the command attributes associated with its creation. The command, its modifiers,and the modifier values (if any) are stored in appropriate command attribute slots in the Command Frame (Figure 7).

An application’s product is typically used in a decision making process. Each Product, therefore, is documented withattributes concerning: to what use it Win be applied, who the users are, who is the person responsible for creating it, what is thatperson’s affiliation (department or agency), and the product’s release date. This information is contained in a Product Frame (Figure 8).
The lineage knowledge representation is a hybrid data structure consisting of semantic parent/child links between three typesof layers with their associated source, command, and product frames. Figure 9 illustrates that source layers have a Source DescriptionFrame. Intermediate layers created from the sources have their own Command Frames documenting the command that created it. Anapplication’s product has a Product Frame documenting its use in decision making. Thus, original inputs, intermediate layer and finalproduct are linked by parent links pointing from input layers to derived layers, and child links pointing from outputs to inputs theywere derived from.
The hybrid semantic network/frame structure models the theory implicit in the GIS application. It supports the design offunctions capable of lineage deduction by navigating links and accessing frame slots. Encoding this information in a separate lineagemeta-database makes it possible for the lineage information program (LIP) to report on the sources and transformations used in spatialapplications.
Functional Design
The structure of the LEP/GIS relationship is shown in Figure 10. User entered GIS commands are first processed by the LIPthen passed to the GIS which executes them to derive new information or query the GIS database. As data manipulation commandsare executed the LIP creates a knowledge representation of the relationships between input map layers and output map layers storedwithin the GIS database. As the knowledge representation evolves, the transformational relationship between input and output layersis modeled. The LIP not only keeps track of the geographic information system commands as history, log, and audit files do, butcreates an explicit record of how individual layers are related to one another.


The LIP utilizes building blocks depicted in Figure 11: parser, knowledge representer, and knowledge representationinterrogator. Each consists of software modules coded in LISP. GIS commands presented to the parser which extracts input/outputrelationships, commands and command modifiers. This information is passed from parser to knowledge representer for update of theknowledge representation. The evolving lineage knowledge representation is stored in the meta-database to model the GIS application.Subsequently, the knowledge interrogator provides a mechanism for manipulating the meta-database to answer questions concerninglineage.
The creation of the lineage knowledge representation begins with a user command for loading a data layer into the GIS.During the initialization process, the knowledge representer creates a representation in the meta-database of the data layer. The LIPthen calls the Source Description Frame creation routine which requests documentation of the name of the data file, features containedwithin the data layer, date of the source, agency responsible for the source, scale of the source, projection of the source, and a measureof accuracy of the source. The Source Description Frame creation routine fills the frame slots with associated lineage attributes inputby the user (Figure 12).


As the user enters subsequent commands to the GIS the LIP’s parser intercepts it and extracts information concerning eachtransformation. If each subsequent GIS data transformation command is valid, and the initial layers are properly entered along withtheir source description attributes, the parsed representation of the GIS command (i.e. the input/output layers, and command andcommand modifiers) is presented to the knowledge representer by the parser. The knowledge representer uses this information toupdate the knowledge representation by adding a node, links, and frames concerning the newly created GIS layer. In this fashion, anew transformation is added to the lineage knowledge representation (Figure 12).
If the users command is one that exports a layer from the spatial database or plots it on a graphic output device, the parsersignals the knowledge representer to prompt the user for information to be included in the slots of the Product Frame. This informationincludes: to what use will the product be applied, who the users are, who is the responsible person for creating the map product, whatis the person! s affiliation (department or agency) and date of release of the product. This information is then placed into the layer’sproduct frame (Figure 12).
The knowledge representation interrogator allows a user to request information found during search of the lineage knowledgerepresentation stored in the meta-database. Such requests are answered by functions that traverse child and parent links and accessattribute information stored in the various frames. These functions determine answers to queries concerning lineage or genealogy ofmaps stored in the GIS database.
In lineage search, child links are followed to determine the ancestry of a particular layer in the database. During the course ofsuch a query, the contents of intermediate layer command frames can be viewed to determine the transformations used to create aparticular layer. When a source layer is found at the end of a child link, the Source Description Frame is accessed to retrieve attributesconcerning the data sources. Thus, the knowledge representation interrogator may be used to trace the lineage of any final outputproduct back to source layers. Further, determinations concerning sources are made by analysis of the slots of the Source DescriptionFrame.
Genealogy questions determine the layers a particular source contributed to. For example, the effect of updates to a particularsource input layer can be traced through the lineage knowledge representation to determine which intermediate layers to recreate inthe course of updating an affected output product. In such a case, parent links of the updated source are queried to determinedescendents affected by the change. Accessing the command frame of each child provides the material needed (i.e. commands andmodifiers) to apply to layers of the previous ’generation’ to recreate and update the layer in question. In this case, beginning withsource layers, each child layer is visited in turn, and command and command modifiers extracted from the command frames. Thecommands that transformed parent layers into child layer are applied to update the corresponding layer in the spatial database. Whenthis is done the child’s parent links are followed and the updating process is applied until the product is finally recreated. In this way,an updated product can be created.
Evaluation
An illustrative example serves as a basis for evaluating the lineage meta-database concept. the application begins with: aparcel map (LOTS), an underground water aquifer map (ZONE), and a lot from parcel map that has a hazardous discharge ofpesticides that can flow through the ground (The lot with discharge has a polygon ID# = 10). We assume that pesticides have a rangeof flow of a certain distance (130 ft.) The task is to find where a buffer zone of pollution overlaps the aquifer, and inform the landowners whose parcels might have tainted water that their portion of the aquifer overlaps the pollution buffer zone.
ARC/INFO commands to execute the task:
1. reselect lots cov1 polyres lots# = 10
2. buffer cov 1 cov2 # # 130 # poly3. intersect zones cov2 cov34. intersect lots cov3 cov4
The user-LIP interaction is illustrated in the following figures. The user enters a command, and the lineage meta-databasesystem parses it (Figure 13). The LIP then updates its knowledge representation. As sources are entered into the database the LIPrequests quality information that is not normally part of the GIS data entry process. Subsequent processing of the sources finds the LIPextracting and storing input output relationships between layers, commands, and command modifiers. At any time the user can querythe lineage information program and retrieve information concerning sources, transformations, or data products (Figure 14).
The interaction between a user and a GIS with a lineage meta-database stands in sharp contrast to the application run withoutthe benefit of a lineage meta-database. The only information available to the user concerning the relationships between layers in the

spatial database are the time/date stamps associated with them in the directory listings. At any time throughout the course of theapplication the user can request a listing of the contents of the directory from the operating system and see the order in which thelayers were created.


Figure 15 illustrates the directory at the end of the application. After COW was created, the directory contains among otherrecords: LOTS, ZONES, COV1, COV2, COV3, and COV4. What is lacking is information concerning the connectivity between thelayers. That is, after the application is over, it is not clear which layers were sources, which were intermediate layers used as stepstoward the final product, and which layer (if any) was an application product.
Conclusion
The node and pointer representations of semantic networks provide a basis for structuring input-output relationships betweenmap layers. Frames serve to organize lineage attributes characterizing source layers in Source Description Frames, transformations inCommand Frames associated with intermediate layers, and uses of product maps in Product Frames. Thus, a hybrid knowledgerepresentation of semantic networks and frames has been demonstrated as a useful means of structuring lineage information.
The lineage meta-database concept and the functional design of the lineage information program presented in this study is astep toward more powerful and intelligent geographical tools. The example demonstrates that a GIS/LIP combination is an ’interesting’alternative to a GIS alone. Creating and providing access to lineage information embodied in hybrid semantic network./frameknowledge representations opens up the possibility of engaging in source assessment throughout the manipulation of GIS data sets.

REFERENCES
Abler, R.F. 1987. "The National Science Foundation National Center for Geographic Information and Analysis", International Journalof Geographical Information Systems, 1(4):303-326.
Aronson, P. 1987. "Attribute Handling for Geographic Information Systems", Proceedings of the Eighth International Symposium onComputer-Assisted Cartography, Falls Church, VA:American Congress on Surveying and Mapping, pp. 346-355.
Berry, J.K. 1987. "Fundamental Operations in Computer-Assisted Map Analysis", International Journal of Geographical InformationSystems, 1(2):119-136.
Bracken, I. and C. Webster 1989. "Toward a Typology of Geographical Information Systems", International Journal of GeographicalInformation Systems, 3(2):137-152.
Charlwood, G., and others. 1987. "Developing a DBMS for Geographic Information: A Review", Eighth International Symposium onCommputer-Assisted Cartography, Falls Church, VA:American Congress on Surveying and Mapping, pp.302-315.
Chrisman, N.R. 1975, "Topological Information Systems for Geographic Representations", Proceedings of the InternationalSymposium on Computer-Assisted Cartography, Reston, VA:American Congress on Surveying and Mapping, pp.346-351
Chrisman, N.R. and B. Niemann 1985. "Alternative Routes to a Multipurpose Cadastre: Merging Institutional and TechnicalReasoning", Proceedings of the Seventh International Symposium on Automated Cartography, Falls Church, VA:AmericanCongress on Surveying and Mapping, pp. 84-93.
Egenhofer, M.J. and A.U. Frank 1989. "Object-Oriented Modeling in GIS: Inheritance and Propogation", Proceedings of the NinthInternational Symposium on Computer-Assisted Cartography, American Congress on Surveying and Mapping; Falls Church,VA, pp.588-598.
Feuchtwanger, M. 1989. "Geographical Logical Database Model Requirements", Proceedings of the Ninth International Symposiumon Computer-Assisted Cartography, Falls Church, VA:American Congress on Surveying and Mapping, 599-609.
Gahegan, M.N. and S.A. Roberts 1988. "An Intelligent, Object-Oriented Geographical Information System", International Journal ofGeographical Information Systems, 2(2):101-110.
Goodchild, M. 1987. "A Spatial Analytic Perspective on Geographical Information Systems", International Journal of GeographicInformation Systems, 1(4):327-334.
Herring, J.R. 1987. "TIGRIS: Topologically Integrated Geographic Information System", Eighth International Symposium onComputer-Assisted Cartography, Falls Church, VA:American Congress on Surveying and Mapping, pp. 282-291.
Kjerne, D. and K.J. Dueker 1986. "Modeling Cadastral Spatial Relationships Using an Object-Oriented Language", Proceedings of theSecond International Symposium on Spacial Data Handling, Williamsville, NY:International Geographical UnionCommission on Geographical Data Sensing and Processing, pp. 142-157.
Luger, G.F. and W.A. Stubblefield 1989. Artificial Intelligence and the Design of Expert Systems, Redwood City, CA:TheBengamin/Cummings Publishing Company, Inc.
Minsky, M. 1975. "A Framework for Representing Knowledge, The Psychology of Computer Vision, P. Winston (Ed.), New York,NY:McGraw-Hill
Morrison, J. 1988. "The Proposed Standard for Digital Cartographic Data", The American Cartographer,15(l).
Moyer, D.D. 1985, "Multipurpose Land Information Systems in Wisconsin: Content and Process", Assessment Digest,September/October, pp. 13-18
Rich, Elaine 1983. Artificial Intelligence, New York:NY:McGraw-Hill Book Company.

Salge, F. and M.N. Scalfer 1989. "A Geographic Data Model Based on HBDS Concepts: The IGN Cartographic Data Base Model",Proceedings of the Ninth International Symposium on Computer-Assisted Cartography, Falls Church, VA:AmericanCongress on Surveying and Mapping, 110- 117.
Smith, T.R. and M. Pazner 1984. "Knowledge-Based Control of Search and Learning in a Large-Scale GIS", Proceedings of theInternational Symposium on Spatial Data Handling, Geographisches Institut, Abteilung Katographie/EDV, UniversitatZurich-Irchel, 2:498-519
Tomlin, C.D. 1983, Digital Cartographic Modeling Techniques in Environmental Planning, Dissertation, Yale University
Tomlin, C.D. and J.K. Berry 1979. "A Mathematical Structure for Cartographic Modeling in Environmental Analysis", Proceedings ofthe American Congress on Surveying and Mapping, Falls Church, VA:American Congress on Surveying and Mapping, pp.269-283.