Functional Genomic Examinations Of Interactions Between ...
287
Washington University in St. Louis Washington University Open Scholarship All eses and Dissertations (ETDs) January 2010 Functional Genomic Examinations Of Interactions Between Common Members Of e Human Gut Microbiota Michael Mahowald Washington University in St. Louis Follow this and additional works at: hps://openscholarship.wustl.edu/etd is Dissertation is brought to you for free and open access by Washington University Open Scholarship. It has been accepted for inclusion in All eses and Dissertations (ETDs) by an authorized administrator of Washington University Open Scholarship. For more information, please contact [email protected]. Recommended Citation Mahowald, Michael, "Functional Genomic Examinations Of Interactions Between Common Members Of e Human Gut Microbiota" (2010). All eses and Dissertations (ETDs). 222. hps://openscholarship.wustl.edu/etd/222
-
Upload
khangminh22 -
Category
Documents
-
view
1 -
download
0
Transcript of Functional Genomic Examinations Of Interactions Between ...

Washington University in St. LouisWashington University Open Scholarship
All Theses and Dissertations (ETDs)
January 2010
Functional Genomic Examinations Of InteractionsBetween Common Members Of The Human GutMicrobiotaMichael MahowaldWashington University in St. Louis
Follow this and additional works at: https://openscholarship.wustl.edu/etd
This Dissertation is brought to you for free and open access by Washington University Open Scholarship. It has been accepted for inclusion in AllTheses and Dissertations (ETDs) by an authorized administrator of Washington University Open Scholarship. For more information, please [email protected].
Recommended CitationMahowald, Michael, "Functional Genomic Examinations Of Interactions Between Common Members Of The Human GutMicrobiota" (2010). All Theses and Dissertations (ETDs). 222.https://openscholarship.wustl.edu/etd/222

WASHINGTON UNIVERSITY
Division of Biology and Biomedical Sciences
Molecular Microbiology and Microbial Pathogenesis
Dissertation Examination Committee: Jeffrey I. Gordon, Chair
Douglas E. Berg Michael G. Caparon Daniel E. Goldberg Elaine R. Mardis
Clay F. Semenkovich
FUNCTIONAL GENOMIC EXAMINATIONS OF INTERACTIONS BETWEEN
COMMON MEMBERS OF THE HUMAN GUT MICROBIOTA
by
Michael Anthony Mahowald
A dissertation presented to the Graduate School of Arts and Sciences
of Washington University in partial fulfillment of the
requirements for the degree of Doctor of Philosophy
May 2010
Saint Louis, Missouri

Copyright by
Michael Anthony Mahowald
2010

ii
Dedication
To my parents, Anthony P. and Mary Briody Mahowald
iii
ABSTRACT OF THE DISSERTATION
Functional genomic examinations of interactions between
common members of the human gut microbiota
by
Michael Anthony Mahowald
Doctor of Philosophy in Biology and Biomedical Sciences(Molecular Microbiology and Microbial Pathogenesis)
Washington University in St. Louis, 2010
Professor Jeffrey I. Gordon, Chairperson
The adult human gut microbiota consists of hundreds to thousands of bacterial spe-
cies, the majority belonging to the Bacteroidetes and the Firmicutes. Differences in the bal-
ance between these phyla has been linked to obesity in mice and humans. However, little
is known about their interactions in vivo. I have used comparative and functional genom-
ics, proteomics and biochemical assays to identify the ways they marshal their genomic
resources to adapt to life together in the distal gut.
I first annotated the complete genome sequences of two human gut Bacteroidetes
(Bacteroides vulgatus and Parabacteroides distasonis) and two Firmicutes (Eubacterium
rectale and E. eligens). By comparing the genomes of all sequenced gut Bacteroidetes
and Firmicutes, I found that gut Bacteroidetes’ genomes contain large groups of genes
responsible for (i) sensing, binding, and metabolizing the varied polysaccharides that they
encounter in the distal intestine; and (ii) constructing their polysaccharide capsules. These
portions of their genomes have been shaped by lateral gene transfer, including phage and
conjugative transposons, as well as by gene duplication. By colonizing germ-free mice
with B. thetaiotaomicron, or B. vulgatus, or both species together, I documented that B.
vulgatus upregulates its unique glycan-degrading enzymes to adapt to the presence of B.

iv
thetaiotaomicron.
In contrast to the Bacteroidetes, the Firmicutes have smaller genomes, a signifi-
cantly smaller proportion of glycan-degrading genes, and are suited to degrade a more
specialized assortment of dietary carbohydrates. By colonizing germ-free mice with E.
rectale and/or B. thetaiotaomicron, I showed that B. thetaiotaomicron, like B. vulgatus,
upregulates its unique glycoside hydrolase activities to adapt to the presence of E. rectale,
increasing its degradation of host-derived glycans that E. rectale cannot use. In contrast,
E. rectale downregulates its polysaccharide degradation genes and upregulates nutrient
transporters, likely allowing it to access sugars released by B. thetaiotaomicron’s glycoside
hydrolases. These models of the human gut microbiota illustrate niche specialization and
functional redundancy within the Bacteroidetes, the adaptable niche specialization that
likely underlies the success of Firmicutes in this habitat, and the importance of host glycans
as a nutrient foundation that ensures ecosystem stability.

v
Acknowledgements
Jeffrey Gordon’s lab has been an amazing place to do research. His constant en-
couragement and indomitable enthusiasm are incredible to behold, and have been an enor-
mous boost at the times when I’ve felt things ought to be going better. I am enormously
thankful for the trust and patience he has shown me as I’ve learned my way over the years.
The amount of freedom I’ve had to explore scientifically has been wonderful and is clearly
quite unique. His attitude makes his lab a fun place to be a student.
Without a doubt the best aspect of the lab has been the outstanding group of people
he has brought together and continues to renew. I count myself enormously privileged to
have had the chance to interact with and learn from everyone who has been a part of his dy-
namic group. I could not have accomplished any of this work without more help, expertise,
enthusiasm, advice, support, and care from the whole group than I can possibly recount.
Nonetheless, a few deserve special mention.
Jill Manchester, in addition to her fabulous abilities as a biochemist (without whom
virtually none of the biochemical assays reported here would have been done), has been
a great lab mom, extremely caring and supportive throughout, in spite of all the forgotten
messes I’ve left around the lab (sorry!). Sabrina Wagoner, Dave O’Donnell and Maria
Karlsson are all incredibly talented and patient and made all the mouse work, among many
other things, possible. It’s hard to imagine how the Gordon lab could function without
them.
Dr. Janaki Guruge and my classmate Lara Crock started work in the lab on E.
rectale, and I am very thankful to them for the groundwork that made my way forward
much, much easier. Janaki has been a great friend and source of microbiological advice
and laughs.
I started my work in the lab with J. F. Rawls, who was as good a mentor, and as kind
a person, as I have encountered. Aside from his outstanding science, his ability to plan and
vi
see the big picture outlook for his work were and are an inspiring example and served as a
perfect introduction to the lab.
Federico Rey and Henning Seedorf have been of particular help with the second
half of this work; they have both taught me an enormous amount about bacterial metabo-
lism and been a true joy to work with. Their help, enthusiasm and generosity has made
this work far better than it could have been otherwise. Eric Martens holds an encyclope-
dic knowledge of microbiology in general and the B. theta genome in particular, and has
been a model example of technical and scientific rigor and focus – not to mention a fun
and kind individual and master brewer. I counted on Buck Samuel as a constant source of
technical and grad-student-life advice and generous and careful feedback. The lab would
have been a substantially more difficult place to be a student without him. Dan Peterson
and Peter Crawford have both been fountains of career advice and encouragement, as well
as extremely valuable constructive criticism and perspective, whom I’ll miss a great deal.
Swaine Chen has helped deepen my understanding of biostatistics and has also been a
great source of critical feedback. Priya Sudarsanam has made a great bay-mate over the
last year and helped me keep my lab work in proper perspective even as she’s challenged
me to think more deeply about it. Justin Sonnenburg was a valuable glycobiology resource.
Ruth Ley offered much of her always creative critique and insight to all matters to do with
microbial ecology. Doug Leip taught me much about software design and scripting, and
has been a supportive friend.
Marios Giannakis and I entered Wash. U. as classmates, and his friendship has been
a great blessing over the last six years since we joined the Gordon lab; I hope it will be so
for years to come. He was (and remains) the one person I know I can ask for instantaneous
recall of anything I might have once known in medical school or college; combining an
incredible memory with intellect, enthusiasm, and kindness to match made his influence on
me, and I venture to suppose, the lab in general, one that will be missed. He brings the same

vii
enthusiasm to everything from major league eating to studying chronic atrophic gastritis
(although in some ways those two aren’t so unrelated).
Pete Turnbaugh entered the lab soon after I did, and his critiques probably have an
even larger part of the work shown here than I realize – and that, by the way, is saying quite
a lot. His scientific opinion, as well as his taste in movies, has been an inspiration over the
years, and hopefully will continue to be.
Many other friends within the medical school, especially Vinod Rao, Tina Ling,
Chung Lee, Bill Hucker, Bryson Katona, Ram Akilesh and Bill McCoy, have been sup-
portive of all my efforts. Many a good time spent over a pitcher, a few rounds of darts, or
a good dinner will be fondly remembered. Also, of course, the MSTP staff, Brian Sullivan,
Andrew Richards, Christy Durbin and Liz Bayer, have been a huge help with keeping ev-
erything going behind the scenes, and more importantly, in setting up, together with the
directors, Dan Goldberg and Wayne Yokoyama, such a well-oiled machine of a program.
Their work over the years has saved me much trouble (and excessive class time) and made
for a much nicer experience. My thesis committee, particularly my chair, Doug Berg, has
offered great advice and much of their time to this project, and I thank them for their help.
Laura Kyro, Stephanie Amen and Debbie Peterson are the three highly able assistants in
the C.G.S., without whom countless tasks, not least of them piecing together this thesis,
would be much more difficult.
Finally, and most importantly, I want to thank my family. My father introduced
me to science before I can remember. His curiosity and enthusiasm for inquiry have been
infectious and taught me the most important things I’ve had to have to enjoy the journey to
this point. If I’d followed more of his advice along way, I’d be even better off, but without
him I’d never have reached this point. My parents’ unconditional love, support and encour-
agement mean more to me than I know how to express or deserve. My two sisters have
always told me that I had it easy, because they were older and had to learn all the hard les-
viii
sons, so that I could learn from. Frankly, they’re right, and not just in growing up: Maureen
went to grad school first and offered all manner of advice on how to pick a lab. But both
of them are always encouraging to me, and are always quick to help me set my priorities
straight and remember that the most important things are, in fact, not in lab. Lastly but far
from least, my thanks to my enormously talented and exceedingly generous wife, Grace,
whose love and support of me seem to know no bounds, and without whom I think I’ve
pretty nearly forgotten how to survive.

ix
Dedication ........................................................................................................................... iiAbstract of the Dissertation ............................................................................................... iiiAcknowledgements ..............................................................................................................vTable of Contents ............................................................................................................... ixList of Figures ................................................................................................................. xivList of Tables .................................................................................................................... xviCurriculum Vitae ............................................................................................................ xviii
Chapter 1
Introduction
Introduction ..........................................................................................................................2Diversity of the gut microbiota ............................................................................................2Gut microbial affects on adiposity .......................................................................................4Meet the gut microbiota: Bacteroidetes ...............................................................................6Meet the gut microbiota: Firmicutes ....................................................................................8Overview of the dissertation ................................................................................................9References ..........................................................................................................................13Figure Legends ...................................................................................................................19Figures................................................................................................................................20
Chapter 2
Evolution of symbiotic bacteria in the distal human intestine
Abstract ..............................................................................................................................24Introduction ........................................................................................................................25Results ................................................................................................................................26
Functional categorization of genomic adaptations to the distal human gut habitat ... ................................................................................................................................26
Niche specialization of Bacteroidetes ....................................................................28
Table of Contents

x
Lateral gene transfer ..............................................................................................30
The role of lateral gene transfer in the evolution of capsular polysaccharide biosynthesis (CPS) loci ..........................................................................................33
Conjugative transposons, phage and other mechanisms involved in promoting CPS diversity ........................................................................................................34
Conjugative transposons ............................................................................34
Phages ........................................................................................................35
Phase variation ...........................................................................................35
Fkp and fucose utilization ..........................................................................36
The role of gene duplication in diversification of gut Bacteroidetes: a case study of SusC/SusD paralogs ..........................................................................................36
Discussion ..........................................................................................................................38Materials and Methods .......................................................................................................40
Genome sequencing ...............................................................................................40
Functional comparisons .........................................................................................42
16S rRNA phylogeny .............................................................................................43
Laterally transferred genes .....................................................................................43
SusC/SusD alignments ...........................................................................................47
Acknowledgements ................................................................................................48
References ..........................................................................................................................50Figure Legends ...................................................................................................................57Figures................................................................................................................................61Supplemental Information .................................................................................................66
Overview of strategy used to identify lateral gene transfer ...................................66
Supplemental References ...................................................................................................70Supplemental Figure Legends ............................................................................................75Supplemental Figures .........................................................................................................76Supplemental Table Legends .............................................................................................81Supplemental Tables ..........................................................................................................83

xi
Chapter 3
Characterizing a model human gut microbiota composed of members of its two dominant phyla
Introduction ......................................................................................................................100Results and Discussion ....................................................................................................102
Comparative genomic studies of human gut-associated Firmicutes and Bacteroidetes ........................................................................................................102
Evidence for nutrient sharing ...............................................................................107
Proteomic studies of this simplified two-component model of the human gut microbiome ..........................................................................................................110
Putting the niche adaptations of B. thetaiotaomicron and E. rectale in perspective: a model gut community containing B. thetaiotaomicron and B. vulgatus............111
Prospectus ........................................................................................................................112Materials and Methods .....................................................................................................114
Genome comparisons ...........................................................................................114
GeneChip Analysis ...............................................................................................114
Other methods ..................................................................................................................115Acknowledgements ..........................................................................................................115References ........................................................................................................................116Figure Legends .................................................................................................................119Figures..............................................................................................................................121Table Legend ....................................................................................................................124Table .................................................................................................................................125Supplemental Information ...............................................................................................126
Methods................................................................................................................126
Bacterial culture .......................................................................................126
Genome sequencing .................................................................................126
Animal husbandry ....................................................................................127
Quantitative PCR measurements of colonization ....................................128
GeneChip design, hybridization and data analysis ..................................129
Proteomic analyses of cecal contents .......................................................130
Biochemical analyses ...............................................................................131

xii
Supplemental References .................................................................................................132Supplemental Figure Legends ..........................................................................................137Supplemental Figures .......................................................................................................141Supplemental Table Legends ...........................................................................................147Supplemental Tables ........................................................................................................150
Chapter 4
Future Directions
Host adiposity in simplified microbial communities .......................................................181
Microbial-dependent increases in feed efficiency ................................................184
Microbial affects on the host: beyond energy balance .....................................................186References ........................................................................................................................188Figure Legends .................................................................................................................191Figures..............................................................................................................................192
Appendices
APPENDIX A ..................................................................................................................195Peter J. Turnbaugh, Ruth E. Ley, Michael A. Mahowald, Vincent Magrini, Elaine R. Mardis and Jeffrey I. GordonAn obesity-associated gut microbiome with increased capacity for energy harvest Nature. 2006 Dec 21;444(7122):1027-31.
APPENDIX B ..................................................................................................................229John F. Rawls, Michael A. Mahowald, Ruth E. Ley and Jeffrey I. GordonReciprocal Gut Microbiota Transplants from Zebrafish and Mice to Germ-free Recipients Reveal Host Habitat SelectionCell. 2006 Oct 20;127(2):423-33.
APPENDIX C ..................................................................................................................251John F. Rawls, Michael A. Mahowald, Andrew L. Goodman, Chad M. Trent, and Jeffrey I. GordonIn.vivo imaging and genetic analysis link bacterial motility and symbiosis in the zebrafish gutProc Natl Acad Sci U S A. 2007 May 1;104(18):7622-7.

xiii
APPENDIX D ..................................................................................................................258Mahowald MA,* Rey FE,* Seedorf H, Turnbaugh PJ, Fulton RS, Wollam A, Shah N, Wang C, Magrini V, Wilson RK, Cantarel BL, Coutinho PM, Henrissat B, Crock LW, Russell A, Verberkmoes NC, Hettich RL, Gordon JICharacterizing a model human gut microbiota composed of members of its two dominant bacterial phyla.Proc Natl Acad Sci U S A. 2009 Apr 7;106(14):5859-64

xiv
List of Figures
Chapter 1
Introduction
Figure 1. Unweighted pair group method with arithmetic mean (UPGMA) clustering
of bacterial communities for each host based on pair-wise differences
determined using the UniFrac metric. ........................................................20
Figure 2. Phylogenic relationships of select human gut-associated Firmicutes and
Bacteroidetes. .............................................................................................21
Chapter 2
Evolution of symbiotic bacteria in the distal human intestine
Figure 1. Phylogenetic Relationships of Fully Sequenced Bacteroidetes .................61
Figure 2. Sensing, Regulatory, and Carbohydrate Metabolism Genes Are Enriched
among All Gut-Associated Bacteroidete ..................................................62s
Figure 3. Analyses of Lateral Gene Transfer Events in Bacteroidetes Lineages
Reveal Its Contribution to Niche Specialization ........................................63
Figure 4. Evolutionary Mechanisms That Impact Bacteroidetes CPS Loci ..............64
Figure 5. Cladogram Comparison of SusC/SusD Pairs Shows Both Specialized and
Shared Branches among the Bacteroidetes ................................................65
Figure S1. B. distasonis ATCC 8503 and B. vulgatus ATCC 8482 Chromosomes .....76
Figure S2. COG-Based Characterization of All Proteins with Annotated Functions in
the Proteomes of Sequenced Bacteroidetes ...............................................78
Figure S3. Pairwise Alignments of the Human Gut Bacteroidetes Genomes Reveal
Rapid Deterioration of Global Synteny with Increasing Phylogenetic
Distance ......................................................................................................79
Figure S4. CPS Loci Are the Most Polymorphic Regions in the Gut Bacteroidetes
Genomes ....................................................................................................80
xv
Chapter 3
Characterizing a model human gut microbiota composed of members of its two dominant phyla
Figure 1 Response of E. rectale to co-colonization with B. thetaiotaomicron.......121
Figure 2 Co-colonization affects the efficiency of fermentation with an increased
NAD:NADH ratio and increased acetate production. ..............................122
Figure 3 Proposed model of the metabolic responses of E. rectale to B.
thetaiotaomicron. .....................................................................................123
Figure S1 Phylogenic relationships of human gut-associated Firmicutes and
Bacteroidetes surveyed in the present study. ...........................................141
Figure S2 Genes involved in carbohydrate metabolism and energy production whose
representation is significant enriched or depleted in sequenced human gut-
associated Firmicutes and Bacterodetes. ..................................................142
Figure S3 Comparison of glycoside hydrolases and polysaccharide lyases repertoires
of E. rectale, E. eligens, B. vulgatus and B. thetaiotaomicron. ...............143
Figure S4 Creation of a minimal synthetic human gut microbiota composed of
a sequenced Firmicute (E. rectale) and a sequenced Bacteroidetes (B.
thetaiotaomicron). ....................................................................................144
Figure S5 In vitro plate-based assay showing that sugars released by B.
thetaiotaomicron are utilized by E. rectale, allowing its colonies to grow
larger.........................................................................................................145
Figure S6 B. vulgatus adapts to the presence of B. thetaiotaomicron by upregulating
its unique repertoire of polysaccharide degrading enzymes. ...................146
Chapter 4
Future Directions
Figure 1. Fat pad to body weight ratios for three independent colonization
experiments show a trend toward increased adiposity with co-colonization
in two out of three experiments. ..............................................................192
Figure 2. The impact of purified diets on membership in a simplified model human
gut microbiota. .........................................................................................193

xvi
List of Tables
Chapter 2
Evolution of symbiotic bacteria in the distal human intestine
Table S1. Comparison of Genome Parameters for B. distasonis ATCC 8503, B.
vulgatus ATCC 8482, B. thetaiotaomicron ATCC 29148, B. fragilis NCTC
9343, and B. fragilis YCH 46 ....................................................................83
Table S2. Shared Orthologs in B. distasonis ATCC 8503, B. vulgatus ATCC 8482,
B. thetaiotaomicron ATCC 29148, and B. fragilis Strains NCTC 9343 and
YCH 46 (On attached CD) .........................................................................84
Table S3. Glycoside Hydrolases Found in B. distasonis ATCC 8503, B. vulgatus
ATCC 8482, B. thetaiotaomicron ATCC 29148, and B. fragilis Strains
NCTC 9343 and YCH 46 ...........................................................................85
Table S4. List of Putative Xenologs in B. distasonis ATCC 8503, B. vulgatus ATCC
8482, B. thetaiotaomicron ATCC 29148, B. fragilis NCTC 9343, and B.
fragilis YCH 46 (On attached CD) ............................................................86
Table S5. CPS Loci of B. distasonis ATCC 8503, B. vulgatus ATCC 8482, B.
thetaiotaomicron ATCC 29148, B. fragilis NCTC 9343, and B. fragilis
YCH 46 (On attached CD) .........................................................................87
Table S6. CPS Loci Are among the Most Polymorphic Regions in the Two B. fragilis
Genomes ....................................................................................................88Table S7. ECF-σ Factor–Containing Polysaccharide Utilization Gene Clusters in B.
distasonis ATCC 8503 and B. vulgatus ATCC 8482 ..................................89
Chapter 3
Characterizing a model human gut microbiota composed of members of its two dominant phyla
Table 1. Proteins detected by mass spectrometry of the cecal contents of
gnotobiotic mice. ......................................................................................125
Table S1. Summary of results of genome finishing for E. rectale strain ATCC 33656
and E. eligens strain ATCC 27750. ..........................................................150
Table S2. Annotated finished genome of E. rectale strain ATCC 33656 (On attached
CD) ...........................................................................................................151

xvii
Table S3. Annotated finished genome of E. eligens strain ATCC 27750 (On attached
CD) ...........................................................................................................152
Table S4. CAZy categorization of glycoside hydrolase and polysaccharide lysase
genes in the sequenced human gut-derived bacterial species surveyed. ..153
Table S5. Growth of B. thetaiotaomicron, B. vulgatus and E. rectale in defined
medium with the indicated carbon sources. .............................................156
Table S6. Custom GeneChip containing genes from six common human gut
microbes, representing two bacterial phyla and two domains of life. .....159
Table S7. GeneChip probesets yielding ≥60% Present calls when hybridized to
cDNAs prepared from the cecal contents of mice colonized with the
indicated species. .....................................................................................160
Table S8. List of B. thetaiotaomicron genes whose expression in the ceca of
gnotobiotic mice was significantly affected by E. rectale. ......................162
Table S9. List of E. rectale genes whose expression in the ceca of gnotobiotic mice
was significantly affected by the presence of B. thetaiotaomicron. .........163
Table S10. Changes in E. rectale gene expression when comparing E. rectale’s transcription during logarithmic phase growth on tryptone-glucose (T-G) medium with its transcriptome during mono-colonization of the cecum (On attached CD). ....................................................................................174
Table S11. Proteomic analysis of the cecal contents of gnotobiotic mice. (On attached
CD) ...........................................................................................................175
Table S12. Summary of the validation of hypothetical and previously unannotated
proteins in E. rectale and B. thetaiotaomicron using tandem mass
spectrometry. ............................................................................................176
Table S13. List of B. thetaiotaomicron genes whose expression in the ceca of
gnotobiotic mice was significantly affected by the presence of
B. vulgatus. ...............................................................................................177
Table S14. List of B. vulgatus genes whose expression in the ceca of gnotobiotic mice
was significantly affected by the presence of B. thetaiotaomicron. .........178
Chapter 4
Future Directions
Table 1. Composition of a proposed basic diet for examination of microbial
community contributions to obesity .........................................................194

xviii
Curriculum Vitae
Name: Michael Anthony Mahowald
Date of Birth: August 23, 1976
Address: 4355 Maryland Ave., #427St. Louis, MO 63108
Telephone: (314) 533-2584
Business address: Center for Genome Sciences, Box 8510Washington University in St. Louis 4444 Forest Park Blvd. St. Louis, MO 63108 Telephone: (314) 362-3963 Fax: (314) 362-2156
E-mail: [email protected]
Education:
2002-present Medical Scientist Training Program (MSTP)Ph.D. in Molecular Microbiology and Microbial Pathogenesis MD/Ph.D. candidate Washington University in St. Louis School of Medicine Ph.D. advisor: Jeffrey I. Gordon
1995-1999 Bachelor of ArtsSwarthmore College, Swarthmore, PA Major in Biology
Research Experience:
2004-present Ph.D. studentLaboratory of Jeffrey I. Gordon Title of thesis: Functional and comparative genomic examinations of interactions between common members of the human gut microbiota
2003 MSTP research rotationLaboratory of Virginia Miller Dept. of Molecular Microbiology Washington University in St. Louis School of Medicine. Conducted a screen for virulence factors in a murine inhalation model of Klebsiella pneumoniae pneumonia.
2002 MSTP research rotationLaboratory of Michael Caparon Dept. of Molecular Microbiology

xix
Washington University in St. Louis School of Medicine Screened Streptococcus pyogenes transposon library for novel secreted proteins.
2001-2002 Research AssistantLaboratory of Thomas Gajewski University of Chicago, IL Conducting clinical trials and surveillance of cancer immunotherapies.
2000-2001 Research AssistantLaboratory of Bruce Lahn University of Chicago, IL Studied the molecular evolution of the primate nervous system
1997, 1998 Summer Research AssistantLaboratory of Steven L. ReinerUniversity of Chicago, IL Studying the immune response toLeishmania infection and the development of murine helper T cells.
1996 Summer Research AssistantLaboratory of Michael Wade University of Chicago, IL Studying speciation of Tribolium flour beetles.
1994 Summer Research InternLaboratory of R. Michael Garavito University of Chicago, IL Developing purification scheme for F
1F
0 ATPase.
Teaching Experience:
2004 Teaching AssistantCell and Organ Systems Biology: Physiology (1st year)Washington University in St. Louis School of Medicine. Coursemaster: Robert Wilkinson
1999-2000 High School TeacherCristo Rey Jesuit High School Capuchin Franciscan Volunteer Corps and Americorps Chicago, IL Teaching 10th grade Biology, 12th grade Human Anatomy and 11th grade Algebra classes.
1998 Teaching AssistantComputer Science 10: UNIX and C Swarthmore College, Swarthmore, PA. Professor: James Marshall

xx
Honors and Fellowships:
2006-8 Infectious Diseases Training Grant (NIH)Washington University in St. Louis School of Medicine
1998 Sigma Xi Scientific Research Society, Student Member
1998 Gwen Knapp Summer Research FellowKnapp Center for Lupus and Immunology Research University of Chicago, IL
Manuscripts in preparation:
Mahowald GK, Moon C, Khor B, Mahowald MA, Sleckman BP. Intron-dependent nonsense-mediated decay of TCR-ß locus transcripts in developing thymocytes. In preparation.
Publications:
Mahowald GK, Baron JM, Mahowald MA, Kulkarni S, Bredemeyer AL, Bassing CH, Sleckman BP. Aberrantly resolved Rag-mediated DNA breaks in Atm-deficient lymphocytes target chromosomal breakpoints in cis. Proc Natl Acad Sci U S A., 2009 Oct 27;106(43):18339-44.
Mahowald MA,* Rey FE,* Seedorf H, Turnbaugh PJ, Fulton RS, Wollam A, Shah N, Wang C, Magrini V, Wilson RK, Cantarel BL, Coutinho PM, Henrissat B, Crock LW, Russell A, Verberkmoes NC, Hettich RL, Gordon JI. Characterizing a model human gut microbiota composed of members of its two dominant bacterial phyla. Proc Natl Acad Sci U S A. 2009 Apr 7;106(14):5859-64.
Xu, X.*, M.A. Mahowald*, R.E. Ley, C.A. Lozupone, M. Hamady, E.C. Martens, B. Henrissat, P.M. Coutinho, P. Minx, P. Latreille, H. Cordum, A. Van Brunt, K. Kim, R. Fulton, S.W. Clifton, R.K. Wilson, R.D. Knight, and J.I. Gordon. Evolution of symbiotic bacteria in the distal human intestine. PLoS Biology, 2007 June 19; 5(7): e156.
Rawls J.F., M.A. Mahowald, A.L. Goodman, C.M. Trent, and J.I. Gordon (2007). In vivo imaging and genetic analysis link bacterial motility and symbiosis in the zebrafish gut. Proc Natl Acad Sci U S A. 104(18): 7622-7.
Turnbaugh, P.J., R.E. Ley, M.A. Mahowald, V. Magrini, E.R. Mardis and J.I. Gordon. An obesity-associated gut microbiome with increased capacity for energy harvest. Nature, 2006 December 21; 444(7122): 1027-31.
Rawls, J.F., M.A. Mahowald, R.E. Ley, and J.I. Gordon (2006). Reciprocal gut microbiota transplants from zebrafish and mice to germ-free recipients reveal host habitat selection. Cell 127(2): 423-33.
Aklilu, M., W.M. Stadler, M. Markiewicz, N.J. Vogelzang, M. Mahowald, M. Johnson and T.F. Gajewski (2004). Depletion of normal B cells with rituximab as an adjunct to IL-2 therapy for renal cell carcinoma and melanoma. Ann Oncol 15(7): 1109-14.
Dorus, S., E.J. Vallender, P.D. Evans, J.R. Anderson, S.L. Gilbert, M. Mahowald, G.J. Wyckoff, C.M. Malcom and B.T. Lahn (2004). Accelerated evolution of nervous system genes in the origin of Homo sapiens. Cell 119(7): 1027-40.
xxi
Harlin, H., A.S. Artz, M. Mahowald, B.I. Rini, T. Zimmerman, N.J. Vogelzang and T.F. Gajewski (2004). Clinical responses following nonmyeloablative allogeneic stem cell transplantation for renal cell carcinoma are associated with expansion of CD8+ IFN-gamma-producing T cells. Bone Marrow Transplant 33(5): 491-7.
Bird, J.J., D.R. Brown, A.C. Mullen, N.H. Moskowitz, M.A. Mahowald, J.R. Sider, T.F. Gajewski, C.R. Wang and S.L. Reiner (1998). Helper T cell differentiation is controlled by the cell cycle. Immunity 9(2): 229-37.
* Contributed equally

1
Chapter 1
Introduction

2
Introduction
Studies of germ-free animals have revealed that the mammalian gut microbial community
(‘microbiota’) is essential to normal host development, nutrition and health. It stimulates
normal gut and immune system development, and synthesizes essential vitamins and fer-
ments otherwise indigestible dietary polysaccharides (“fiber”) to short chain fatty acids
(SCFA), principally acetate, propionate, and butyrate, which are absorbed by the gut epi-
thelium and used for energy [1]. This process accounts for up to 10% of our daily calories
[2].
Diversity of the gut microbiota
In humans, the gut microbial community contains an estimated 1014 organisms;
most of these reside in our distal gut, and most belong to the domain Bacteria, although the
other two domains of life (Archaea and Eukarya) are also represented. The total number of
microbial cells inhabiting our gut is estimated to be ~10-fold more than the total number of
human cells in our adult body [3].
Among the Bacteria, hundreds to thousands of species-level phylogenetic types
(phylotypes) are present in the distal gut microbiota [4, 5]. The community is dominated,
however, by just two Bacterial phyla: the Bacteroidetes and the Firmicutes [4-6]. Results
obtained from the small number of individuals and demographic groups sampled thus far
have led to the conclusion that there are no microbial species-level phylotypes associated
with all adult human guts [4]. Detailed, culture-independent surveys have revealed that
the dominant phylotypes within this community can vary greatly between individuals, and
even in the same individual over time [4, 7]. However, the current view, based on these
culture-independent surveys, is that the overall microbiota membership in an individual
adult remains relatively constant despite variation between dominant types.
3
Analyses of humans as well as animal models suggest that the stability of overall
membership extends beyond a single generation. Analyses of twin pairs and their moth-
ers indicate that gut communities cluster by families, suggesting that the microbiota is
vertically transmitted [4, 8]. Mouse and other mammalian studies support this notion. For
instance, 16S rRNA sequence-based analyses of the gut microbiotas of female mice and
their offspring (separated at weaning and individually housed) have demonstrated that two
mothers who are sisters produce offspring whose gut microbiota is more similar to one
another, and to their mothers, than to the offspring of an unrelated mother of the same in-
bred strain [7]. Furthermore, a survey of the gut microbiotas of 59 non-human mammalian
species (including 17 non-human primate lineages) showed that individuals belonging to a
given mammalian species (‘conspecifics’) harbor closely related gut communities indepen-
dent of their provenance (i.e., whether animals are in one of two different zoos, or are in the
wild or domesticated), suggesting that vertical transmission of the microbiota is a general
characteristic of mammals [9].
This global mammalian gut survey indicated that diet, host phylogeny and diges-
tive physiology/gut structure (i.e., foregut vs. midgut and hindgut fermenters) contribute to
microbiota structure (Figure 1). Most extant mammals are herbivores, although ancestral
mammals are thought to have been carnivorous. The microbial solution to herbivory has
been similar among mammals: in other words, there are shared features of gut microbial
community structure among herbivores, and these encompass animals that occupy quite
distinctive positions in the mammalian tree. Increased plant consumption is also associated
with the increased diversity in the gut microbiota (herbivory > omnivory > carnivory) [9].
This richness likely reflects the vast chemical complexity of glycosidic linkages present in
plant polysaccharides and the relatively paltry number of glycoside hydrolases and poly-
saccharide lyases present in mammalian genomes. As noted above, microbial fermentation
of these polysaccharides allows for harvest of energy from the diet that would otherwise
be lost.

4
Gut microbial affects on adiposity
Given its importance in health, it is not surprising that changes in the gut microbial
community have been observed in various pathological states. Members of our lab found
that inoculation of adult germ-free mice with a distal gut microbial community harvested
from conventionally raised animals (a process known as “conventionalization”) induces a
rapid and sustained increase in body fat (within 10 days) despite a decrease in food con-
sumption. This occurs in multiple mouse strains, in male and female animals, and does not
require mature T- or B-lymphocytes or Ppar-α [10]. Conventionalization increases fermen-
tation of polysaccharides to SCFA, which are then absorbed from the gut and metabolized
by the body, stimulating de novo lipogenesis in the liver [10]. Colonization also represses
expression of fasting induced adipose factor (Fiaf) in the gut epithelium. Fiaf is a secreted
protein that inhibits lipoprotein lipase (LPL), a key enzyme involved in uptake of lipids
into adipocytes and other tissues. Suppression of intestinal Fiaf expression produces a sig-
nificant increase in LPL activity in adipocytes and a concomitant increase in adiposity
[10]. Studies of gnotobiotic Fiaf-/- and wild type littermates have established the important
contribution of Fiaf to the microbiota-induced increase in adiposity [10]. However, the
microbial factors that lead to these shifts in Fiaf expression remain uncertain. Studies of
germ-free and conventionalized wild type and knockout mice have identified other genes
whose expression in the gut epithelium is essential for this microbiota-dependent increase
in adiposity [11]. Thus, the microbiota regulates both sides of the energy balance equation:
the efficiency with which energy is harvested from the diet as well as host signaling path-
ways that are important for modulating how absorbed energy is processed and deposited
in adipocytes.
Additional experiments suggest that the microbiota and its genes (microbiome)
should be considered as possible risk factors for development of obesity. Both genetically
obese (ob/ob) mice, as well as obese humans, possess a significantly higher proportion of
Firmicutes and reduced proportion of Bacteroidetes than their lean counterparts [7, 12].

5
The difference in relative proportions of the Firmcutes and the Bacteroidetes is not
due to any specific clades within either phylum, and studies of runted ob/ob mice suggest
that it is not due to increased food consumption per se. Transfer of the distal gut microbial
community from ob/ob mice to wild type (+/+) germ-free recipients produces a larger gain
in adiposity than does transfer of the microbiota from lean +/+ donors to +/+ germ-free
recipients, after 2 weeks [13]. This was correlated with increased SCFA production and
decreased energy content in feces, suggesting increased energy extraction by the obese
microbial community. Consistent with these results, metagenomic sequencing of the gut
microbiomes of ob/ob and +/+ littermates revealed an increased representation of micro-
bial genes involved in processing of dietary polysaccharides in the former compared to the
latter.
As obese humans lose weight, the proportion of Bacteroidetes in their guts rises
progressively, with the magnitude of the increase correlating significantly with their weight
loss. Intriguingly, this change in the proportion of Bacteroidetes to Firmicutes occurred
both in individuals placed on both a low fat and on a low carbohydrate diet [7]. These find-
ings in humans indicate that gut microbial ecology is dynamically linked to obesity. The
studies in mice, particularly the microbiota transplant experiments and comparative meta-
genomic analyses, suggest that the microbiota is a mediator of increased adiposity and that
the phenotype is transmissible.
More recently, members of the lab have examined the effects of obesity induced by
consumption of a prototypic Western diet, enriched in fats and simple sugars, on the dis-
tal gut microbiota and microbiome [14]. Similar to ob/ob mice, there was a phylum wide
suppression of Bacteroidetes in animals with diet-induced obesity (DIO) compared to lean
controls who had consumed a standard, polysaccharide rich, low fat diet. Unlike the ob/
ob microbiota, the proportional increase in the Firmicutes in this model was attributable
to a bloom in a single clade within the Mollicutes class of Firmicutes. This bloom did not
require a functional adaptive or innate immune system since it occurred in both Rag1-/- and

6
Myd88-/- hosts, and was reversible when adiposity was stabilized or reduced by switching
animals to a reduced calorie low fat or low carbohydrate diet [14]. Comparative metag-
enomic analyses of the microbiome revealed an enrichment in genes involved in import
and processing of dietary sugars associated with DIO. Microbiota transplant experiments
showed that the adiposity phenotype could be transmitted to germ-free recipients [14].
Together, these findings further emphasize the dynamic interrelationship between gut mi-
crobial community structure, diet, and energy balance.
Large scale, phylum-wide changes in the gut microbiota make dissection of the
contributions of individual members of this community to energy/nutrient harvest very
challenging. Therefore, the goal of my thesis has been to conduct comparative genomic,
functional genomic and biochemical analyses of the ways in which human gut-derived
Bacteroidetes and Firmicutes interact in vivo. I have done so by constructing a simplified
model of the human gut microbial community in gnotobiotic mice, using sequenced mem-
bers of our distal intestinal microbiota.
Meet the gut microbiota: Bacteroidetes
The Bacteroidetes are Gram-negative obligate anaerobic bacilli (for a 16S rRNA
based phylogenetic tree see Figure 2). Human gut Bacteroidetes have long been studied as
opportunistic pathogens; in particular, Bacteroides fragilis is the most commonly isolated
organism from abdominal abscesses, vastly overrepresented among such isolates com-
pared to its proportion within the gut microbial community [15]. In healthy individuals,
though, Bacteroidetes are commensal, or perhaps mutualistic, members of the community.
A number of studies over the last decade have significantly improved our understanding of
the metabolism and properties of a model Bacteroides species, B. thetaiotaomicron, on a
genomic level.
Completion of the first Bacteroides genome sequence revealed a bacterium with
an unprecedented genomic structure. B. thetaiotaomicron’s 6.2 Mbp genome possesses

7
240 glycoside hydrolases and polysaccharide lyases; in comparison, the 500-fold larger
human genome possesses only 99. These enzymes are organized into gene clusters, termed
polysaccharide utilization loci (PULs), that contain various combinations of glycosidic
enzymes. There are 88 individual PULs in the B. thetaiotaomicron genome [16], and oth-
er gut and non-gut Bacteroidetes also possess PULs [17-20]. All PULs identified to date
possess two linked genes encoding homologs of two outer membrane proteins, SusC and
SusD, that are components of the first identified PUL - the starch utilization system (Sus)
[21]. SusC is predicted to be a TonB-dependent, β-barrel-type outer membrane transporter
and is essential for importing α1,4-linked glucose polymers into the periplasm. SusD is
an outer membrane α-helical starch binding lipoprotein needed for growth on starch mol-
ecules containing ≥6 glucose units [22]. The conserved genomic organization of the PULs
[17], together with the frequent presence of linked genes encoding sensor/regulator func-
tions (e.g., ECF-σ/anti-σ factor pairs, ‘hybrid’ two component phosphorelay systems, plus
others) have given rise to the notion that individual PULs encode the functions needed to
act as carbohydrate substrate-specific sensing and acquisition systems [16].
GeneChip analyses of B. thetaiotaomicron gene expression in the distal guts of
gnotobiotic mice colonized with this organism alone indicate that B. thetaiotaomicron is
capable of harvesting dietary plant glycans as well as host mucosal glycans [16, 23, 24].
Specifically, comparison of the transcriptional profiles of B. thetaiotaomicron in the ceca
of adult gnotobiotic mice fed a standard, plant polysaccharide-rich chow versus (i) a diet
rich in simple sugars but devoid of plant polysaccharides [16, 24] and (ii) suckling mice
(diet rich in oligosaccharides; [23]) revealed that in both polysaccharide-poor conditions,
B. thetaiotaomicron downregulates a variety of PULs targeting plant-derived glycans, and
upregulates other PULs predicted to access and process host-derived mucin glycans. Many
of the same loci are also induced in log-phase growth in minimal medium supplemented
with porcine gastric mucin as the sole carbon source, compared to minimal medium plus
glucose [16]. The capacity to turn to host glycans as a nutrient source when dietary poly-

8
saccharides are not available may be very advantageous: this type of opportunitistic, or
flexible foraging for glycans could help B. thetaiotaomicron to (i) maintain its foothold
in the very competitive distal gut microbiota; (ii) be transmitted from mothers to her off-
spring; (iii) provide the products of polysaccharide fermentation to other members of the
community (i.e., promotion of syntrophic relationships), and (iv) contribute to ecosystem
robustness [16].
Meet the gut microbiota: Firmicutes
Firmicutes are diverse group of low-GC Gram-positive Bacteria (for a 16S rRNA-
based tree, see Figure 2). The global mammalian gut microbiota survey described earlier
revealed that the Firmicutes are inevitably present in mammalian GI tracts and are the
dominant phylum [9]. Abundant human gut-associated Firmicutes are less well studied
than Bacteroidetes. However, they have several properties that are important to mamma-
lian physiology. One is the capacity to produce butyrate. Butyrate is one of the principal
fermentation products of the gut microbial community, and is generated by phylotypes
scattered throughout the Firmicutes phylogenetic tree (e.g., see lineages marked with an
asterisk in Figure 2). Compared to other SCFAs, butyrate is preferentially absorbed and
utilized by the gut epithelium [25, 26]. Since it is longer than the other commonly gener-
ated SFCAs, it yields more energy upon oxidation.
Butyrate has profound effects on the growth of colonic cell lines in vitro, a fact that
has led to many investigations concerning its role in mediating the long-studied link be-
tween diet and colorectal carcinoma. Butyrate can inhibit inflammation, and induces apop-
tosis as well as differentiation in adenocarcinoma-derived gut epithelial cell lineages [27].
The majority of animal studies have shown that increasing butyrate concentrations (e.g.,
by feeding slowly fermented fiber, or by colonization with butyrate-producing organisms),
correlates with reduced epithelial proliferation, and decreased incidence of precancerous
lesions [28-31]. However, other studies show opposing effects [32-34]. These results may

9
conflict because the consumption of fiber or bacteria, as in all these in vivo studies, pro-
duces poorly defined shifts in the microbial community structure and metabolic activity.
Other metabolic activities associated with members of the Firmicutes include the
7-α dehydroxylation of bile acids to yield the secondary bile acids deoxycholate and litho-
cholate, which have been implicated in promoting colon cancer [35, 36]; production of
conjugated linoleic acids, which have been implicated in decreasing both adiposity and
cancer risk [37]; and acetogenesis, a process by which acetate is produced by reductive
fixation of carbon dioxide via the Wood-Ljungdahl pathway [38].
At the start of this thesis project, very few genome structures of common human gut
Firmicutes were defined, and many branches of the tree were completely unrepresented by
genomic sequence. Similarly, their niche space remained poorly defined, and potentially
vast.
Overview of the dissertation
The goal of this thesis was to better characterize the genomic and metabolic prop-
erties of the two dominant phyla of mammalian gut bacteria, the Bacteroidetes and the
Firmicutes, and use a more simplified model microbial community to explore the way in
which they adapt themselves to life in the gut and to one another.
Chapter 2 describes the insights gained from the complete genomic sequencing of
two common members of the Bacteroidetes, B. vulgatus and P. distasonis. I compared the
genome content of these two Bacteroidetes with the five available completed Bacteroi-
detes genomes, including three gut Bacteroidetes (two strains of B. fragilis as well as B.
thetaiotaomicron), and two non-gut Bacteroidetes (Cytophaga hutchinsonii and Porphy-
romonas gingivalis). I assigned all the proteins from these seven genomes to functional
categories, and compared the proportion of genes in each category in each genome. I found
that gut Bacteroidetes in general could be differentiated from their non-gut relatives by the

10
large proportion of genes devoted to environmental sensing, carbohydrate metabolism, and
membrane transport; these genes are typically arranged in PULs, like those present in B.
thetaiotaomicron. I then showed that although all the gut Bacteroidetes share large numbers
of genes in these functional categories, the individual genes in each represented category
have diverged substantially, suggesting some niche differentiation among Bacteroidetes.
The genomes of B. vulgatus and P. distasonis possess a significantly smaller proportion
of glycoside hydrolases and other carbohydrate-active enzymes than B. thetaiotaomicron.
P. distasonis possesses a larger proportion of predicted proteases, while B. vulgatus has a
larger proportion of genes involved in degrading pectins, as well as genes involved in pro-
cessing xylans, which B. thetaiotaomicron is unable to utilize.
We then used a phylogenetic approach to identify genes within these species that
were acquired due to lateral gene transfer (LGT) from outside the Bacteroidetes phylum.
The results indicated that an average of 5.5% of the genes in each genome were acquired
via this mechanism. We observed predicted conjugative transposons and prophage ele-
ments within some of these loci, suggesting that these transmissible elements are at least
partially responsible for the large number of laterally transferred genes within these loci.
In Chapter 3, I built on these observations by comparing the genomes of gut Firmi-
cutes to those of Bacteroidetes, and assessing the ways in which model members of each
phylum adapt themselves to coexistence with each other in the distal gut habitats of gnoto-
biotic mice. First, I annotated the first two finished genomes from human gut Clostridium
Cluster XIVa, one of the most common gut Firmicute clades. By comparing these genome
sequences with the genome sequences of 16 other gut Firmicutes and those of human gut
Bacteroidetes, I was able to show that gut Firmicutes possess smaller genomes, a signifi-
cantly smaller proportion of glycan-degrading genes, and a more specialized or restricted
ability to acquire and process carbohydrates compared to the Bacteroidetes. Four gut Fir-
micutes also possess flagellar genes, suggesting that motility helps them adopt a more
11
specialized lifestyle in which they are able to move to areas where their preferred nutrient
source is abundant.
To test whether these predicted differences in the ability to process exogenous car-
bohydrates reflect niches that are important in the gut, I identified differences in the abil-
ity of three sequenced human gut symbionts to grow on different carbon sources in vitro.
This demonstrates that, as predicted, B. thetaiotaomicron and B. vulgatus grow on many
more simple and complex sugars than does E. rectale. However, B. vulgatus does success-
fully degrade pectin and xylan substrates that B. thetaiotaomicron cannot, while E. rectale
grows on at least one substrate that neither Bacteroides is able to utilize, namely cellobiose,
the disaccharide building block of plant cell walls.
To determine whether their differences in polysaccharide utilization were important
to the metabolism of these microbes in the guts of mice, I colonized germ-free mice with
B. thetaiotaomicron or E. rectale alone (monoassociation), or together (co-colonization),
and similarly, with either B. thetaiotaomicron or B. vulgatus, or both together. I found that
B. vulgatus almost exclusively upregulated operons of genes involved in xylan and pectin
degradation in co-colonization compared to monoassociation – i.e., the same classes of
glycan-degrading genes that were predicted to encode its unique activities. B. thetaiotao-
micron’s response to the presence of E. rectale was similar: it upregulated PULs invoved in
the degradation of host-derived mucin glycans such as α-mannans, which E. rectale cannot
utilize. These responses are similar to those seen when B. thetaiotaomicron interacts with
other bacterial lineages [39].
On the other hand, E. rectale’s response to B. thetaiotaomicron was quite dis-
tinct. Carbohydrate metabolic genes, particularly glycoside hydrolases, were proportion-
ally overrepresented among the downregulated genes when comparing the transcriptome
expressed in vivo in co-colonization versus monoassociation. Instead, E. rectale became
more selective in the glycans it utilized, upregulating four predicted sugar transport genes,

12
while downregulating 14. It also induced a variety of amino acid and peptide transporters.
E. rectale broadly upregulated expression of translational and biosynthetic genes, as well
as central metabolic regulators, similar to what I observed during log-phase growth in vitro,
suggesting that it had sufficient or even improved access to nutrients in the presence of B.
thetaiotaomicron in vivo. In vitro studies confirmed that E. rectale is able to harvest simple
sugars released by the enzymes expressed by B. thetaiotaomicron.
Together, these comparative genomic, functional genomic and biochemical studies,
conducted using gnotobiotic models of the human gut microbiota, illustrate niche spe-
cialization and functional redundancy within the Bacteroidetes. Furthermore, they demon-
strate the adaptable niche specialization that likely underlies the success of Firmicutes in
this habitat. Finally, these studies underscore the importance of host glycans as a nutrient
foundation that ensures ecosystem stability.
13
References
1. Hooper, L.V., T. Midtvedt, and J.I. Gordon, 2002. How host-microbial interactions
shape the nutrient environment of the mammalian intestine. Annu Rev Nutr, 22 p.
283-307.
2. Roberfroid, M.B., 1999. Caloric Value of Inulin and Oligofructose. J. Nutrition,
129 (7 (Supplement)), p. 1436S-1437S.
3. Luckey, T.D., 1972. Introduction to intestinal microecology. Am J Clin Nutr, 25
(12), p. 1292-4.
4. Turnbaugh, P.J., M. Hamady, T. Yatsunenko, B.L. Cantarel, A. Duncan, R.E. Ley,
M.L. Sogin, W.J. Jones, B.A. Roe, J.P. Affourtit, B. Henrissat, A.C. Heath, R.
Knight, and J.I. Gordon, 2008. Inheritance of a core gut microbiome in obese and
lean monozygotic twin pairs. submitted.
5. Eckburg, P.B., E.M. Bik, C.N. Bernstein, E. Purdom, L. Dethlefsen, M. Sargent,
S.R. Gill, K.E. Nelson, and D.A. Relman, 2005. Diversity of the human intestinal
microbial flora. Science, 308 (5728), p. 1635-8.
6. Ley, R.E., R. Knight, and J.I. Gordon, 2007. The human microbiome: eliminating
the biomedical/environmental dichotomy in microbial ecology. Environ Microbiol,
9 (1), p. 3-4.
7. Ley, R.E., P.J. Turnbaugh, S. Klein, and J.I. Gordon, 2006. Microbial ecology:
human gut microbes associated with obesity. Nature, 444 (7122), p. 1022-3.
8. Zoetendal, E.G., A.D. Akkermans, and W.M. De Vos, 1998. Temperature gradient
gel electrophoresis analysis of 16S rRNA from human fecal samples reveals stable
and host-specific communities of active bacteria. Appl Environ Microbiol, 64 (10),
p. 3854-9.
14
9. Ley, R.E., M. Hamady, C. Lozupone, P.J. Turnbaugh, R.R. Ramey, J.S. Bircher,
M.L. Schlegel, T.A. Tucker, M.D. Schrenzel, R. Knight, and J.I. Gordon, 2008.
Evolution of mammals and their gut microbes. Science, 320 (5883), p. 1647-51.
10. Backhed, F., H. Ding, T. Wang, L.V. Hooper, G.Y. Koh, A. Nagy, C.F. Semenkovich,
and J.I. Gordon, 2004. The gut microbiota as an environmental factor that regulates
fat storage. Proc Natl Acad Sci U S A, 101 (44), p. 15718-23.
11. Samuel, B.S., A. Shaito, T. Motoike, F.E. Rey, F. Backhed, J.K. Manchester, R.E.
Hammer, S.C. Williams, J. Crowley, M. Yanagisawa, and J.I. Gordon, 2008. Effects
of the gut microbiota on host adiposity are modulated by the short chain fatty acid
binding G protein-coupled receptor, Gpr41. Proc Natl Acad Sci U S A, submitted.
12. Ley, R.E., F. Backhed, P. Turnbaugh, C.A. Lozupone, R.D. Knight, and J.I. Gordon,
2005. Obesity alters gut microbial ecology. Proc Natl Acad Sci U S A, 102 (31), p.
11070-5.
13. Turnbaugh, P.J., R.E. Ley, M.A. Mahowald, V. Magrini, E.R. Mardis, and J.I.
Gordon, 2006. An obesity-associated gut microbiome with increased capacity for
energy harvest. Nature, 444 (7122), p. 1027-31.
14. Turnbaugh, P.J., F. Backhed, L. Fulton, and J.I. Gordon, 2008. Diet-induced obesity
is linked to marked but reversible alterations in the mouse distal gut microbiome.
Cell Host Microbe, 3 (4), p. 213-23.
15. Polk, B.F. and D.L. Kasper, 1977. Bacteroides fragilis subspecies in clinical isolates.
Ann Intern Med, 86 (5), p. 569-71.
16. Martens, E.C., H.C. Chiang, and J.I. Gordon, 2008. Mucosal Glycan Foraging
Enhances the Fitness and Transmission of a Saccharolytic Human Gut Symbiont.
submitted.
17. Xu, J., M.A. Mahowald, R.E. Ley, C.A. Lozupone, M. Hamady, E.C. Martens, B.

15
Henrissat, P.M. Coutinho, P. Minx, P. Latreille, H. Cordum, A. Van Brunt, K. Kim,
R.S. Fulton, L.A. Fulton, S.W. Clifton, R.K. Wilson, R.D. Knight, and J.I. Gordon,
2007. Evolution of Symbiotic Bacteria in the Distal Human Intestine. PLoS Biol, 5
(7), p. e156.
18. Xie, G., D.C. Bruce, J.F. Challacombe, O. Chertkov, J.C. Detter, P. Gilna, C.S.
Han, S. Lucas, M. Misra, G.L. Myers, P. Richardson, R. Tapia, N. Thayer, L.S.
Thompson, T.S. Brettin, B. Henrissat, D.B. Wilson, and M.J. McBride, 2007.
Genome sequence of the cellulolytic gliding bacterium Cytophaga hutchinsonii.
Appl Environ Microbiol, 73 (11), p. 3536-46.
19. Bauer, M., M. Kube, H. Teeling, M. Richter, T. Lombardot, E. Allers, C.A.
Wurdemann, C. Quast, H. Kuhl, F. Knaust, D. Woebken, K. Bischof, M. Mussmann,
J.V. Choudhuri, F. Meyer, R. Reinhardt, R.I. Amann, and F.O. Glockner, 2006.
Whole genome analysis of the marine Bacteroidetes ‘Gramella forsetii’ reveals
adaptations to degradation of polymeric organic matter. Environ Microbiol, 8 (12),
p. 2201-13.
20. Pinhassi, J., J.P. Bowman, O.I. Nedashkovskaya, I. Lekunberri, L. Gomez-
Consarnau, and C. Pedros-Alio, 2006. Leeuwenhoekiella blandensis sp. nov., a
genome-sequenced marine member of the family Flavobacteriaceae. Int J Syst Evol
Microbiol, 56 (Pt 7), p. 1489-93.
21. Reeves, A.R., G.R. Wang, and A.A. Salyers, 1997. Characterization of four
outer membrane proteins that play a role in utilization of starch by Bacteroides
thetaiotaomicron. J Bacteriol, 179 (3), p. 643-9.
22. Koropatkin, N.M., E.C. Martens, J.I. Gordon, and T.J. Smith, 2008. Starch
catabolism by a prominent human gut symbiont is directed by the recognition of
amylose helices. Structure, 16 (7), p. 1105-15.

16
23. Bjursell, M.K., E.C. Martens, and J.I. Gordon, 2006. Functional genomic and
metabolic studies of the adaptations of a prominent adult human gut symbiont,
Bacteroides thetaiotaomicron, to the suckling period. J Biol Chem, 281 (47), p.
36269-79.
24. Sonnenburg, J.L., J. Xu, D.D. Leip, C.H. Chen, B.P. Westover, J. Weatherford, J.D.
Buhler, and J.I. Gordon, 2005. Glycan foraging in vivo by an intestine-adapted
bacterial symbiont. Science, 307 (5717), p. 1955-9.
25. Bergman, E.N., 1990. Energy contributions of volatile fatty acids from the
gastrointestinal tract in various species. Physiol Rev, 70 (2), p. 567-90.
26. Ritzhaupt, A., I.S. Wood, A. Ellis, K.B. Hosie, and S.P. Shirazi-Beechey, 1998.
Identification and characterization of a monocarboxylate transporter (MCT1) in pig
and human colon: its potential to transport L-lactate as well as butyrate. J Physiol,
513 ( Pt 3) p. 719-32.
27. Medina, V., B. Edmonds, G.P. Young, R. James, S. Appleton, and P.D. Zalewski,
1997. Induction of caspase-3 protease activity and apoptosis by butyrate and
trichostatin A (inhibitors of histone deacetylase): dependence on protein synthesis
and synergy with a mitochondrial/cytochrome c-dependent pathway. Cancer Res,
57 (17), p. 3697-707.
28. Ohkawara, S., H. Furuya, K. Nagashima, N. Asanuma, and T. Hino, 2005. Oral
administration of butyrivibrio fibrisolvens, a butyrate-producing bacterium,
decreases the formation of aberrant crypt foci in the colon and rectum of mice. J
Nutr, 135 (12), p. 2878-83.
29. Nakanishi, S., K. Kataoka, T. Kuwahara, and Y. Ohnishi, 2003. Effects of high
amylose maize starch and Clostridium butyricum on metabolism in colonic
microbiota and formation of azoxymethane-induced aberrant crypt foci in the rat
colon. Microbiol Immunol, 47 (12), p. 951-8.

17
30. Cassidy, A., S.A. Bingham, and J.H. Cummings, 1994. Starch intake and colorectal
cancer risk: an international comparison. Br J Cancer, 69 (5), p. 937-42.
31. McIntyre, A., P.R. Gibson, and G.P. Young, 1993. Butyrate production from dietary
fibre and protection against large bowel cancer in a rat model. Gut, 34 (3), p. 386-
91.
32. Folino, M., A. McIntyre, and G.P. Young, 1995. Dietary fibers differ in their effects
on large bowel epithelial proliferation and fecal fermentation-dependent events in
rats. J Nutr, 125 (6), p. 1521-8.
33. Zoran, D.L., N.D. Turner, S.S. Taddeo, R.S. Chapkin, and J.R. Lupton, 1997. Wheat
bran diet reduces tumor incidence in a rat model of colon cancer independent of
effects on distal luminal butyrate concentrations. J Nutr, 127 (11), p. 2217-25.
34. Lupton, J.R. and P.P. Kurtz, 1993. Relationship of colonic luminal short-chain fatty
acids and pH to in vivo cell proliferation in rats. J Nutr, 123 (9), p. 1522-30.
35. Ridlon, J.M., D.J. Kang, and P.B. Hylemon, 2006. Bile salt biotransformations by
human intestinal bacteria. J Lipid Res, 47 (2), p. 241-59.
36. Bernstein, H., C. Bernstein, C.M. Payne, K. Dvorakova, and H. Garewal, 2005.
Bile acids as carcinogens in human gastrointestinal cancers. Mutat Res, 589 (1), p.
47-65.
37. Devillard, E., F.M. McIntosh, S.H. Duncan, and R.J. Wallace, 2007. Metabolism of
linoleic acid by human gut bacteria: different routes for biosynthesis of conjugated
linoleic acid. J Bacteriol, 189 (6), p. 2566-70.
38. Drake, H.L., K. Küsel, and C. Matthies, Acetogenic Prokaryotes, in Prokaryotes,
M. Dowrkin, S. Falkow, E. Rosenberg, K.H. Schleifer, and E. Stackebrandt, Editors.
2006, Springer: New York. p. 354-420.
18
39. Sonnenburg, J.L., C.T. Chen, and J.I. Gordon, 2006. Genomic and metabolic studies
of the impact of probiotics on a model gut symbiont and host. PLoS Biol, 4 (12), p.
e413.
40. Lozupone, C., M. Hamady, and R. Knight, 2006. UniFrac--an online tool for
comparing microbial community diversity in a phylogenetic context. BMC
Bioinformatics, 7 p. 371.
41. DeSantis, T.Z., Jr., P. Hugenholtz, K. Keller, E.L. Brodie, N. Larsen, Y.M. Piceno,
R. Phan, and G.L. Andersen, 2006. NAST: a multiple sequence alignment server
for comparative analysis of 16S rRNA genes. Nucleic Acids Res, 34 (Web Server
issue), p. W394-9.
42. Ludwig, W., O. Strunk, R. Westram, L. Richter, H. Meier, Yadhukumar, A. Buchner,
T. Lai, S. Steppi, G. Jobb, W. Forster, I. Brettske, S. Gerber, A.W. Ginhart, O.
Gross, S. Grumann, S. Hermann, R. Jost, A. Konig, T. Liss, R. Lussmann, M. May,
B. Nonhoff, B. Reichel, R. Strehlow, A. Stamatakis, N. Stuckmann, A. Vilbig, M.
Lenke, T. Ludwig, A. Bode, and K.H. Schleifer, 2004. ARB: a software environment
for sequence data. Nucleic Acids Res, 32 (4), p. 1363-71.

19
Figure Legends
Figure 1. Unweighted pair group method with arithmetic mean (UPGMA) clustering
of bacterial communities for each host based on pair-wise differences determined us-
ing the UniFrac metric. The tree shows clustering based on species, diet and gut type (fo-
regut fermenter, hindgut fermenter). UniFrac is based on the premise that related commu-
nities share an evolutionary history that can be estimated as the fraction of shared branch
length in a common phylogenetic tree [40]. The tree was constructed by computing the
UniFrac metric based on a neighbor-joining tree of the 21,619 16S rRNA gene sequences
in the mammalian gut survey [9]. Labels are colored according to diet (carnivores, red;
herbivores, green; omnivores, blue). Vertical bars located to the left of animal names in-
dicate coclustering of conspecific hosts. Non-clustering conspecifics are indicated with
same-color stars. Details concerning the human samples are provided in parentheses and
include sample ID, descriptors used in the original studies and PubMed ID for each study
where available (e.g., T0 and T4 refer to the initial and one-year time point samples for lean
control subjects 13 and 14 in PubMed ID 17183309). The circles and squares at internal
nodes in the tree indicate jackknife support of ≥50% for 100 iterations; the key at the upper
right corner of the figure shows the minimum number of sequences retained per sample for
each jackknife analysis. Figure taken from [9].
Figure 2. Phylogenic relationships of select human gut-associated Firmicutes and
Bacteroidetes. A phylogeny, based on 16S rRNA gene sequences, showing the relation-
ships between representatives from the two dominant bacterial phyla in the gut microbiota.
Green, genomes generated by the Human Gut Microbiome Initiative (www.genome.gov/
Pages/Research/Sequencing/SeqProposals/HGMISeq.pdf). Black, other available related
genomes. Red, organisms sequenced as part of this work. Asterisks denote those organisms
known to produce butyrate. The phylogenetic tree was created by aligning 16S rRNA gene
sequences from each genome using the NAST aligner [41], importing the alignment into
Arb [42], and then adding them to an existing database of 16S rRNA sequences derived
from enumerations of the human gut [5, 7].

20
Figures
Figure 1.
0
21 seqs 50 seqs 75 seqs 100 seqs 125 seqs 150 seqs 225 seqs 250 seqs
Asian Elephant 1 (AE1; STL) Asian Elephant 3 (AE3; STL)
Echidna (ECH; STL)
Giant Panda (GP; SD) Spectacled Bear (SB; STL)
Red Panda (RP; STL) Red Panda (RPSD; SD)
American Black Bear 1 (BB1; STL) American Black Bear 2 (BB2; STL) Hedgehog (HH; STL) Polar Bear 1 (PB1; STL) Polar Bear 2 (PB2; STL)
Seba ’ s Short T ailed Bat (bat; STL)
Cheetah 3 (CE3; STL)
African Elephant (AFEL; Namibia)
African Elephant 3 (AFEL3; Namibia) African Elephant (AFYEL; 7-mo old calf; Namibia)
Hartmann ’ s Mountain Zebra (AFZEB; Namibia)
Lion 3 (LI3; STL) Lion 2 (LI2; STL) Lion 1 (LI1; STL)
Cheetah 2 (CE2; STL)
Hyena 1 (HY1; STL) Hyena 2 (HY2; STL)
Armadillo (arma; STL)
Bushdog 1 (bdog1; STL) Bushdog 3 (bdog3; STL)
Naked Molerat (molerat; STL) Douc Langur (DL; SD)
Capybara (CAP; STL) Black Rhinoceros (RH; STL)
Banteng (BG; STL) Indian Rhinoceros (IR; SD)
Asian Elephant 2 (AE2; STL) Grevy ’ s Zebra (GZ; STL) Somali W ild Ass (WA; STL) Horse (horsej; J- domesticated) Horse (horsem; M- domesticated)
Bwindi Gorilla ( W ild)
W estern Lowland Gorilla (GORD; SD)
African Elephant 2 (AFEL2; Namibia)
Prevost ’ s Squirrel (SQ; STL)
Geoffrey ’ s Marmoset (MAR; STL)
Geoldi ’ s Marmoset (CAL; STL)
Black Lemur (BKLE; STL) Bonobo (BNO; SD) Mongoose Lemur (ML; STL) Spider Monkey (SPIM; STL)
Rabbit (RA; STL)
Argali Sheep 2 (AS2; Mongolia) Bighorn Sheep 2 (BH2; Colorado)
Argali Sheep 3 (AS3; Mongolia) Springbok (SBK; Namibia)
Red Kangaroo 1 (KO1; STL) Red Kangaroo 2 (KO2; STL)
Speke ’ s Gazelle 3 (SP3; STL)
Speke ’ s Gazelle 2 (SP2; STL)
Argali Sheep 1 (AS1; Mongolia)
Springbok (SBSD; SD)
T ranscaspian Urial Sheep 1 (TU1; STL) T ranscaspian Urial Sheep 2 (TU2; STL)
Bighorn Sheep (BH1; Colorado) Bighorn Sheep (BHSD: SD) T akin (TAK;SD)
Okapi 2 (OK2; STL) Okapi 3 (OK3; STL)
Okapi 1 (OK1; STL)
Babirusa (BARB; SD) V isayun W arty Pig (VWP; SD)
East Angolan Colobus (EAC; SD)
Giraffe (gir; STL)
Hamadryas Baboon (BAZ; STL) Hamadryas Baboon (AFBAB; Namibia)
Ring- T ailed Lemur (RT; STL)
Eastern Black and White Colobus (COL; STL) Francois Langur (FL; SD)
Rock Hyrax (HRX; STL)
Rock Hyrax (RHSD; SD) Red River Hog (RRH; SD)
Saki (Saki; STL)
Chimpanzee 1 (CHIMP1; STL)
Chimpanzee 2 (CHIMP12; STL) Flying Fox (FF; STL)
W estern Lowland Gorilla (GOR; STL) Orangutan 1 (orang1; STL) Orangutan 2 (orang2; STL)
Human vegetarian woman aged 77 (HumVeg; 12597356)
Human male aged 28 (HumAdO; subj O; 12363017)
Human male aged 27 (HumAdS; subj. S; 12363017) Human male aged 52 (HumAdB; subj. B; 12363017)
Human male aged 32 (HumLC1A; subj. 13 T0, 17183309)
Human male aged 32 (HumLC1B; subj. 14 T0, 17183309) Human male aged 33 (HumLC2A; subj. 13 T4, 17183309) Human male aged 33 (HumLC2B; subj. 14 T4, 17183309)
Human pool of 6 adults (HumNag6; Nagashima, 2006)
Holstein Cattle 13 (Cow1) Holstein Cattle 14 (Cow2) Holstein Cattle 15 (Cow3)
Human male aged 94 (HumOldA; 14524616)
Human female aged 50 (HumEckA; subj. A; 15831718)
Human female aged 88 (HumOldB; 14524616) Human female aged 75 (HumOldC; 14524616)
Human male aged 50 (HumEckB; subj. B; 15831718) Human male aged 43 (HumEckC; subj. C; 15831718) Human male aged 40 (HumSuau; 10543789)
Norway Rat ( W ista r , laboratory)
1 p
u
o
r
G
e r o
v i
b
r e H
s r e t n
e
m
r e f t u
g
e r
o
f e r
o
v i n
r a
C
2 p
u
o
r
G
e r o
v i
n
r a C
1
p
u
o
r G
2
p
u
o
r G
e r
o
v i n
m
O
1
p
u
o
r G
e r
o
v i n
m
O
p 2
u o r G
rb
ivor
ee
H
t u g d n i h y l t s o m
s r e t n e m
r e f

21
Figure 2.
0.10
Ruminococcus obeumClostridium bolteae
Clostridium symbiosumEubacterium rectale
Eubacterium eligensDorea longicatena
Clostridium scindensRuminococcus gnavus
Ruminococcus torquesEubacterium ventriosum
Clostridium sp. L2-50Faecalibacterium prausnitzii
Eubacterium siraeumBacteroides capillosus
Clostridium acetobutylicumClostridium beijerinckii
Clostridium perfringensClostridium difficileEubacterium dolicum
Bacteroides vulgatus
Bacteroides thetaiotaomicronBacteroides fragilis
Bacteroides ovatusBacteroides WH2
Bacteroides uniformis
Parabacteroides distasonisParabacteroides merdae
Porphryromonas gingivalisTannerella forsythus
Bifidobacterium adolescentisBifidobacterium longum
Actinomyces odontolyticus
*
*
*
*
**
**
*
*

22
Chapter 2
Evolution of symbiotic bacteria in the distal human intestine

23
Chapter 2
Jian Xu1,2*, Michael A. Mahowald1*, Ruth E. Ley1, Catherine A. Lozupone3, Micah Hama-
dy4, Eric C. Martens1, Bernard Henrissat5, Pedro M. Coutinho5, Patrick Minx2, Philippe
Latreille2, Holland Cordum2, Andrew Van Brunt2, Kyung Kim2, Robert S. Fulton2, Lucinda
A. Fulton2, Sandra W. Clifton2, Richard K. Wilson1,2, Robin D. Knight6, and Jeffrey I. Gor-
don1
1Center for Genome Sciences and 2Genome Sequencing Center, Washington University
School of Medicine, St. Louis, MO 63108, 3Department of Molecular, Cellular and Devel-
opmental Biology and 4Department of Computer Science, University of Colorado, Boul-
der, CO 80309, 5CNRS-UMR6098, Universités Aix-Marseille I & II, Marseille, France,
and 6Department of Chemistry and Biochemistry, University of Colorado, Boulder, CO
80309
*Contributed equally
Correspondence to: [email protected]; Ph 314:362-7243; Fax 314:362-7047
Running title: Evolution of human gut Bacteroidetes
24
Abstract
The adult human intestine contains trillions of bacteria, representing hundreds of species
and thousands of subspecies. Little is known about the selective pressures that have shaped
and are shaping this community’s component species, which are dominated by members of
the Bacteroidetes and Firmicutes divisions. To examine how the intestinal environment af-
fects microbial genome evolution, we have sequenced the genomes of two members of the
normal distal human gut microbiota, Bacteroides vulgatus and Bacteroides distasonis, and
by comparison with the few other sequenced gut and non-gut Bacteroidetes, analyzed their
niche and habitat adaptations. The results show that lateral gene transfer, mobile elements,
and gene amplification have played important roles in affecting the ability of gut-dwelling
Bacteroidetes to vary their cell surface, sense their environment, and harvest nutrient re-
sources present in the distal intestine. Our findings show that these processes have been a
driving force in the adaptation of Bacteroidetes to the distal gut environment, and empha-
size the importance of considering the evolution of humans from an additional perspective,
namely the evolution of our microbiomes.

25
Introduction
Our distal gut is one of the most densely populated and most thoroughly surveyed
bacterial ecosystems in nature. This microbiota contains more bacterial cells than all of our
body’s other microbial communities combined. The gut microbial community and its col-
lective genome (microbiome) endow us with physiological attributes that we have not had
to evolve on our own, including the ability to break down otherwise indigestible polysac-
charides [1,2]. The most complete 16S rRNA gene sequence-based enumerations available
indicate that >90% of phylogenetic types (phylotypes) belong to just two of the 70 known
divisions of Bacteria, the Bacteroidetes and the Firmicutes, with the remaining phylotypes
distributed among eight other divisions [3]. With an estimated 500-1,000 species, and over
7,000 strains [4], the evolutionary tree of our distal intestinal microbiota can be visualized
as a grove of ten palm trees (divisions), each topped by fronds representing divergent lin-
eages, and with each frond composed of many leaves representing closely related bacteria
[1]. In contrast, soil, Earth’s terrestrial ‘gut’ for degrading organic matter, can be viewed as
a bush, composed of many more intermediate and deeply diverging lineages [5].
It is unclear how selective pressures, microbial community dynamics, and the en-
vironments in which we live shape the genomes and functions of members of our gut
microbiota, and hence our ‘micro-evolution.’ Ecological principles predict that functional
redundancy encoded in genomes from divergent bacterial lineages insures against disrup-
tion of food webs. These principles also predict that host-driven, “top-down” selection for
such redundancy should produce a community composed of distantly related members,
whose genomes convergently evolve functionally similar suites of genes [4]. Lateral gene
transfer (LGT), which allows for rapid transfer of genes under strong selection, such as
those encoding antibiotic resistance [6], represents one way that members of the microbio-
ta could share metabolic and other capabilities. In contrast, competition between members
of a microbiota should exert a “bottom-up” selective pressure that produces specialized
genomes with functionally distinct suites of genes. These distinct suites define ecological

26
niches (professions), and, once established, could be maintained by barriers to homologous
recombination [4].
To explore whether and how these principles apply to the gut microbiota and its
microbiome, we have determined the complete genome sequences of two Bacteroidetes
with highly divergent 16S rRNA phylotypes that are prominently represented in the distal
gut of healthy humans - Bacteroides vulgatus and Bacteroides distasonis (now also known
as Parabacteroides distasonis; [7]). B. distasonis is basal to the Bacteroides clade, and
diverged from the common ancestor of the other Bacteroides prior to their differentiation.
The results of comparisons with other sequenced gut- and non-gut-associated Bacteroi-
detes, described below, provide insights about the evolution of niche specialization in this
highly competitive ecosystem, including the role of lateral gene transfer (LGT).
Results
Functional categorization of genomic adaptations to the distal human gut habitat
The 5,163,189 bp genome of the human gut-derived B. vulgatus type strain ATCC
8482 encodes a predicted 4,088-member proteome, while the 4,811,369 bp genome of B.
distasonis type strain ATCC 8503 possesses 3,867 predicted protein-coding genes (Table
S1 and Figure S1). These genomes were initially compared to the genomes of two oth-
er Bacteroidetes that live in the distal human gut: B. thetaiotaomicron (type stain ATCC
29148; [2] and B. fragilis (strains YCH 46 and NCTC 9343; [8,9]. We identified 1,416 sets
of orthologous protein-coding genes shared among these gut Bacteroidetes; 1,129 (79.7%)
of these conserved gene sets were assigned to COGs (Clusters of Orthologous Groups:
see Figure S2 and Table S2 for a COG-based categorization). The two most prominently
represented COG categories in each of the gut-associated Bacteroidetes proteomes are G
(carbohydrate transport and metabolism) and M (cell wall/membrane/envelope biogen-
esis). The two most prominent COG categories in their shared proteome are E (amino acid

27
transport and metabolism) and J (translation, ribosomal structure and biogenesis) (Figure
S2).
The average pairwise amino acid sequence identity among the shared orthologs
was 82.0% for B. thetaiotaomicron-B. fragilis, 72.1% for B. thetaiotaomicron-B. vulga-
tus, 62.1% for B. thetaiotaomicron-B. distasonis, and 61.7% for B. vulgatus-B. distasonis.
These values are consistent with the 16S rRNA phylogenetic tree for Bacteroidetes (Figure
1). Although the evolution of these gut Bacteroidetes is characterized by comprehensive
deterioration of global synteny (Figure S3), a total of 257 “patches” of local synteny were
identified, composed of adjacent orthologous genes encompassing 765 of the 1,416 shared
orthologs (54%; average of 3.0 orthologs per cluster).
The distal gut microbiota is exposed to several prominent nutrient sources: (i) di-
etary plant polysaccharides that are not digested in the small intestine by the host because
our human proteome lacks the requisite glycoside hydrolases and polysaccharide lyases
(see the Carbohydrate Active Enyzmes database (CAZy) at http://afmb.cnrs-mrs.fr/CAZY/
for a comprehensive annotation of the human ‘glycobiome’), (ii) undigested plant proteins
[10], and (iii) host glycans associated with the continuously renewing epithelium that lines
the gut and with the even more rapidly replenished mucus layer which overlies this epithe-
lium.
To identify genomic features related to adaptation to life within this distal human
gut habitat, we compared shared orthologs among all five completely sequenced gut Bacte-
roidetes genomes to the subset that is shared with the two Bacteroidetes that occupy non-
gut habitats. These non-gut Bacteriodetes are Porphyromonas gingivalis W83, a member of
the human oral microbiota [11], and Cytophaga hutchinsonii ATCC 33406, which is found
in soil (http://www.ncbi.nlm.nih.gov/entrez/query.fcgi?db=genomeprj&cmd=Retrieve&d
opt=Overview&list_uids=54). Each proteome was searched for conserved domains. These
domains were used to assign a functional identifier (InterPro ID) that was then mapped
28
onto GO (Gene Ontology) terms [12] using InterProScan [13]. The results were compiled
and statistical comparisons made between the number of genes assigned to each GO term
in different genomes. The complete list of GO assignments for all seven Bacteroidetes ge-
nomes is available at http://gordonlab.wustl.edu/BvBd.html.
The subset of orthologs shared with non-gut Bacteroidetes is enriched for core met-
abolic activities, suggesting that all Bacteroidetes have inherited a core metabolome from
their common ancestor (Figure 2A, compare data in column 7w versus data in 5w). The
subset of orthologs unique to the gut Bacteroidetes is enriched for genes related to amino
acid biosynthesis, membrane transport, carbon-oxygen lyases, and environment sensing/
regulation (see GO terms highlighted in red/pink in the column labeled 5wU in Figure
2A). Furthermore, while a comparison of each gut-dwelling Bacteroidetes proteome to
the proteomes of its non-gut relatives (Figure 2B) revealed that the four gut species are
all enriched for genes that belong to GO categories related to three general functions: (i)
polysaccharide metabolism, (ii) environmental sensing and gene regulation, and (iii) mem-
brane transport, most of these GO categories are depleted among the subset of orthologs
that are unique to the gut-associated Bacteroidetes (Figure 2A, 5w vs. Bt-G). Thus, while
all four sequenced gut Bacteroidetes species have increased numbers of genes in categories
(i)-(iii), this analysis suggests that each one has evolved a divergent array of sensing, regu-
latory and polysaccharide degradation genes that augment the core metabolome they share
with other members of their division.
Niche specialization of Bacteroidetes
To further define the niches occupied by the gut Bacteroidetes, we compared each
one to B. thetaiotaomicron. B. thetaiotaomicron was selected as the reference species be-
cause there is a wealth of information about its functional attributes. Scanning electron
microscopy, whole genome transcriptional profiling, and mass spectrometry-based me-
tabolomic studies performed in gnotobiotic mice colonized with this prominent human

29
gut symbiont have shown that it is a remarkably flexible forager for polysaccharides that
opportunistically deploys different subsets of its 209 paralogs of SusC and SusD (two outer
membrane proteins involved in the binding and import of starch and maltooligosaccharides
[14,15]), and 226 predicted glycoside hydrolases and 15 polysaccharide lyases, so that it
can feast on dietary or host mucus glycans depending upon the polysaccharide content of
the host’s diet [16] (Table S1).
Compared to the other Bacteroidetes, the B. thetaiotaomicron proteome has the most
glycoside hydrolases known or predicted to degrade plant glycans (e.g., 64 arabinosidases;
our human proteome has none), and the most enzymes for harvesting host glycans (e.g.,
sulfuric ester hydrolases, hexosaminidases and fucosidases) (Figure 2B and Table S3). It
is also the only sequenced gut Bacteroidetes that possesses candidate polysaccharide lyases
for degrading animal tissue glycans (e.g., heparin, chondroitin, hyaluronan; Table S3). B.
thetaiotaomicron’s ability to opportunistically use many glycan sources likely makes it an
important generalist among intestinal Bacteroidetes.
Compared to B. thetaiotaomicron, B. distasonis is a specialist. It has the smallest
genome among the sequenced human gut-associated Bacteroidetes, the smallest repertoire
of genes that are members of the environmental sensing and gene regulation GO catego-
ries, and the smallest number of genes associated with carbon source degradation (Fig-
ure 2B and Table S1). B. distasonis lacks many accessory hemicellulases (arabinosidases,
α-glucuronidases), pectinases, and other polysaccharidases that target non-plant carbohy-
drates, such as chitinases. Moreover, the number of genes present in each CAZy enzyme
class represented in its proteome is markedly reduced compared to the other intestinal
Bacteroidetes (e.g., B. distasonis has only one candidate α-fucosidase while the other gut-
associated species have 9 or 10) (Table S3).
B. distasonis has two classes of carbohydrate-processing enzymes that are more
abundant in its proteome in than the proteomes of other gut Bacteroidetes: CAZy glycoside

30
hydrolase family 13 (α-amylase-related proteins), and family 73 (N-acetylhexosaminidas-
es which can target host glycans as well as bacterial cell walls). Its proteome also contains
more polysaccharide deacetylases (7 versus 4 in B. thetaiotamicron and 1-2 in the B. fra-
gilis strains, as characterized by InterPro ID IPR002509; see http://gordonlab.wustl.edu/
BvBd.html for a complete list of InterPro ID assignments). Host epithelial glycans contain
O-acetylated sugars, including sialic acids, that protect them from direct cleavage by mi-
crobial glycoside hydrolases. Thus, B. distasonis has the capacity to make the deacetylated
products available for itself and other components of the microbiota. Finally, B. distasonis
devotes a greater proportion of its genome to protein degradation than does B. thetaiotao-
micron (GO:0006508, ‘proteolysis’; P<0.0003 by binomial test; Figure 2B).
The B. vulgatus glycobiome has features consistent with ex vivo studies indicating
that its substrate range for polysaccharides is intermediate between that of B. distasonis
and B. thetaiotaomicron [17]. B. vulgatus has the largest and most complete complement
of enzymes that target pectin, a common fruit-associated class of glycans (includes pectin
methylesterases, pectin acetylesterases, polygalacturonases, and accessory δ-4,5 unsaturat-
ed glucuronyl hydrolases). According to the CAZy classification scheme, B. vulgatus is the
only sequenced gut Bacteroidetes with a gene encoding a xylanase (Bv0041c). Together,
these findings reveal overlapping but distinct niches among these gut Bacteroidetes. We
next examined the role of lateral gene transfer in shaping their genomes.
Lateral gene transfer
Determining whether a gene is laterally transferred is widely acknowledged to be
a difficult problem (e.g. [18-21] and Supporting Information). We chose a phylogenetic
approach (see Materials and Methods) to identify genes that appeared to have been later-
ally acquired and probably selected for after the divergence of individual gut species. Our
approach could potentially identify two types of genes: genes that were laterally transferred
only into one lineage, and genes that were lost in all lineages except one. We confirmed

31
that LGT was the more likely scenario for these genes by demonstrating that they differed
in composition from the rest of the genome. This approach allowed us to investigate the
adaptations of individual lineages to their specific niche. For simplicity, we refer to these
genes as ‘laterally transferred’ in the remainder of this study, although a minority of them
may actually represent differential gene loss, which would still likely indicate species-
specific selection [22].
Our approach was to use sensitive, iterated profile searches to retrieve homologs of
each protein-coding gene in the genomes of interest from publicly available databases. We
then built phylogenetic trees of the related sequences, used the NCBI taxonomy database
to assign taxonomy information to each sequence, and employed the Fitch parsimony al-
gorithm [23] to assign the most likely bacterial taxon to each internal node. This analysis
allowed us to differentiate four classes of genes: (i) those whose closest relatives are out-
side the gut Bacteroidetes, suggesting a lateral transfer event and/or differential gene loss;
(ii) those whose closest relative is within the gut Bacteroidetes, indicating likely vertical
inheritance; (iii) those without any homologs in the database (i.e., ‘novel’); and (iv) those
whose pattern of inheritance, whether lateral or vertical, could not be determined (i.e.,
‘unresolved’). Parsimony was used to assign a likely direction (‘in’ or ‘out’) to each lateral
transfer event where possible (see Table S4 and Materials and Methods).
We did not attempt to resolve lateral transfer events within the gut Bacteroidetes in
this study, primarily because the lack of sufficient taxonomic sampling within the Bacte-
roidetes made it impossible to distinguish transfer from biased sampling. Previous studies
have observed that a number of novel genes in other bacterial genomes seem to be laterally
acquired [24]. However, for the purposes of our functional analyses, these novel genes
were excluded because little functional information is available about them. Because we
wished to analyze adaptation to the gut, we also excluded genes that appeared to have been
transferred out of the Bacteroidetes.

32
Our method identified an average of 5.5% of the genes in each genome as being
laterally transferred from outside the gut Bacteroidetes (312 for B. distasonis, 184 for B.
vulgatus, 277 for B. thetaiotaomicron, 199 for B. fragilis NCTC 9343, 214 for B. fragilis
YCH 46, and 103 for P. gingivalis). We verified that the genes we identified as ‘laterally
transferred’ differed from those classified as ‘not transferred’ both in terms of GC content
(p<0.0001 for each genome by two-tailed t-test using Welch’s correction for unequal vari-
ances) and codon bias (p<0.0001 for each genome by chi-squared test). These results, to-
gether with the functions represented by this class of genes (see below), confirm that LGT
is the most likely scenario accounting for these genes, although we cannot rule out ancient
paralogs from the data available because of different rates and patterns of evolution in dif-
ferent lineages, and other confounding factors.
A complete classification of laterally transferred protein-coding genes in the gut
Bacteroidetes, and P. gingivalis, is provided in Table S4. Genes involved in core cellular
processes, such as translation (e.g., ribosomal proteins) are less susceptible to LGT than oth-
er genes [25]. Primary metabolism (GO:0044238) and protein biosynthesis (GO:0006412)
are among the GO terms most enriched in the set of genes not subject to LGT (Figure 3A).
These results suggest that our criteria exclude many genes that would be expected not to
undergo LGT. In contrast, genes that are known to be subject to LGT, such as restriction-
modification systems [26-28], were enriched in the set of laterally transferred genes we
detected (Figure 3B).
B. distasonis has a significantly larger proportion of laterally transferred genes than
the other gut Bacteroidetes (Figure 3C). This excess of LGT does not correlate with a larger
number of identifiable mobile elements: B. distasonis has fewer of the integrases and trans-
posases that can catalyze the insertion of foreign DNA than do the other Bacteroidetes, and
similar numbers of phage (five versus two to five for the other species; see Table S1). The
excess of LGT genes in B. distasonis is also not simply attributable to its more distant phy-
logenetic relationship to the other gut Bacteroidetes, because P. gingivalis does not share

33
this feature (Figure 3C). Instead, B. distasonis has a striking elevation in the proportion
of DNA methylation proteins classified as laterally transferred. Seventy percent of genes
classified as “DNA methylation” (GO:0006306; e.g., restriction-modification systems) are
predicted to be laterally transferred, even though B. distasonis has fewer DNA methylation
genes overall (10 versus an average of 11.5 for other gut Bacteroidetes; Figure 3C). The
combination of a smaller number of restriction-modification systems, together with their
acquisition from unrelated bacteria, would be expected to reduce the barriers to LGT by
allowing B. distasonis to acquire genes from those bacteria. These laterally acquired genes
may contribute to the success of B. distasonis within the gut habitat. For example, among
the set of transferred genes is a ten-gene hydrogenase complex (Figure 3D), which would
allow B. distasonis to use hydrogen as a terminal electron acceptor.
The role of lateral gene transfer in the evolution of capsular polysaccharide biosynthesis
(CPS) loci
Capsular polysaccharide biosynthesis (CPS) locus expression and the functional
importance of capsular structural variation have been best characterized in B. fragilis. For
example, studies in gnotobiotic mice indicate that the zwitterionic capsular polysaccharide
from one B. fragilis CPS locus (PSA) is presented by intestinal dendritic cells, resulting in
expansion of CD4+ T-cells, induction of IFNγ production by the T-helper 1 subtype (Th1),
and reversal of the T-helper 2 (Th2) bias found in the absence of colonization. The result is
a balanced Th1/Th2 cytokine profile that should help promote co-existence with a micro-
biota, and perhaps tolerance to a variety of environmental antigens, including those found
in food [29].
B. vulgatus has 9 CPS loci, while B. distasonis has 13. Like B. thetaiotaomicron (8
CPS loci) and B. fragilis (9 each in strains NCTC 9343 and YCH 46), each CPS cluster is
composed of a pair of linked upstream UpcY and UpcZ homologs that act as a ‘regulatory

34
cassette’, and downstream genes encoding glycosyltransferases, carbohydrate transporters,
and other proteins that form a ‘structural cassette’ (Table S5).
Among gut-associated Bacteroidetes, we found that glycosyltransferases and genes
in CPS loci are enriched for laterally transferred genes (Figure 3B). P. gingivalis, in con-
trast, does not show a biased representation of lateral transfer within its set of glycosyl-
transferases, suggesting that laterally acquired genes serve an important function in provid-
ing new genetic material for the rapid divergence of these loci in gut Bacteroidetes.
CPS loci are among the most polymorphic sites in the four gut-associated Bacte-
roidetes species [30,31]. A comparison of the two sequenced B. fragilis genomes [8,9]
revealed that the genome-wide synteny evident in the two closely related B. fragilis strains
is disrupted in 8 of their 9 CPS loci (Figure S4, Table S6).
Conjugative transposons, phage and other mechanisms involved in promoting CPS
diversity
Conjugative transposons
We observed that conjugative transposons (CTns) are associated with the duplica-
tion of CPS loci within a genome. In B. vulgatus, Bv0624-Bv0699 (75,747 bp) is a copy
of another region (Bv1479c-Bv1560, 75,277 bp) (Figure 4A and Table S5). Each copy
contains a CTn followed by a complete CPS locus. The average amino acid sequence iden-
tity of the 64 homologous gene pairs comprising the repeated regions is 90%. Two exact
28,411 bp copies harbor a major portion of the structural cassettes of these duplicated CPS
loci, plus part of a CTn (Figure 4A). The strict nucleotide-level sequence conservation
in coding and non-coding sequences suggests a recent homologous recombination event
at the structural cassettes of the CPS loci. There is also evidence that the function of CPS
loci can be disrupted by CTns, as in CPS locus 8 of B. fragilis YCH 46 where an α-1,2-
fucosyltransferase gene is interrupted by a 127Kb, 132-gene CTn (Table S5).

35
Phages
Phages also appear to modulate CPS locus function. In B. distasonis, CPS locus 5
contains a block of five genes inserted between its regulatory cassette and genes encoding
carbohydrate biosynthetic enzymes. This inserted segment, oriented in the opposite direc-
tion to the upstream regulatory UpxY (and UpxZ) genes and downstream carbohydrate
biosynthetic genes, consists of a homolog of phage T7 lysozyme (N-acetylmuramoyl-L-
alanine amidase) followed by four genes encoding hypothetical proteins. Three more B.
distasonis CPS loci each harbor a block of these genes (two to five genes per block; each
block with a similar orientation; only the T7 lysozyme is conserved among all copies of the
putative phages; Figure 4B and Table S5).
B. distasonis is the only sequenced type strain where a phage disrupts CPS loci be-
tween their regulatory cassettes and structural cassettes. B. vulgatus has five copies of this
phage, all associated with CPS loci. B. thetaiotaomicron has ten copies, only two of which
are associated with CPS loci, while the B. fragilis strains each have one (Table S5).
Phase variation
LGT, CTn-mediated duplication and translocation of CPS loci, and disruption of
CPS loci by phage appear to operate in combination with at least two other mechanisms
to promote the rich diversity of surface glycan structures in Bacteroidetes. In B. fragilis, a
serine site-specific recombinase (Mpi) regulates expression of 7 of its 8 CPS loci through
phase variation (DNA inversion) at CPS promoters [32]. B. vulgatus, B. distasonis, and B.
thetaiotaomicron have Mpi orthologs (one, three and one, respectively). In addition, five of
the nine CPS loci in B. vulgatus, 11 of the 13 CPS loci in B. distasonis, 4 of the 8 CPS loci
in B. thetaiotaomicron, and only one of the 10 CPS loci in B. fragilis NCTC 9343 have an
gene encoding a tyrosine type site-specific recombinase immediately upstream of a upxY
homolog. This juxtaposition suggests that inversions of some CPS loci may be subjected to
local as well as global regulation. Such sequence inversions were observed in the assem-
36
blies of the B. vulgatus and B. distasonis genomes (data not shown).
Fkp and fucose utilization
B. fragilis can also alter CPS glycan composition by means of Fkp, a protein whose
N-terminus is homologous to mammalian L-fucose-1-P-guanyltransferase and whose C-
terminus is similar to L-fucose kinases. Fkp generates GDP-L-fucose from exogenous L-
fucose; fucose from GDP-L-fucose can be incorporated into CPS glycan structures, thereby
linking L-fucose availability in the organism’s intestinal habitat to CPS capsular structure
[33]. Although Fkp is highly conserved in B. distasonis, B. vulgatus, B. thetaiotaomicron
and B. fragilis, their L-fucose acquisition and utilization capacities are not. B. distasonis,
B. vulgatus, B. thetaiotaomicron, and B. fragilis all possess α-fucosidases for harvesting
L-fucose, which is a common component of host mucus and epithelial cell glycans. In B.
thetaiotaomicron and B. fragilis, a complete fucose utilization system is incorporated into
a gene cluster (fucRIAKXP). In B. vulgatus, this gene cluster (Bv1339c-Bv1341c) contains
an ortholog of B. thetaiotaomicron’s L-fucose-inhibited repressor (R), fucose isomerase (I)
and fucose permease (P), but not L-fuculose-1-phosphate aldolase (A) or L-fuculose kinase
(K). B. distasonis lacks all elements of this gene cluster.
The role of gene duplication in diversification of gut Bacteroidetes: a case study of
SusC/SusD paralogs
As noted above, the gut Bacteroidetes genomes contain large numbers of paralogs
involved in environmental sensing and nutrient acquisition. We used one of the largest
families, the SusC/SusD paralogs (Table S1), as a model for investigating relationships
among members. SusC paralogs are predicted to be TonB-dependent, β-barrel-type outer
membrane proteins. Thus, in addition to binding nutrients such as polysaccharides, SusC
paralogs likely participate in their energy-dependent transport into the periplasmic space
[34]. SusD paralogs are predicted to be secreted and to have an N-terminal lipid tail that

37
would allow them to associate with the outer membrane [14]. Genes encoding SusC and
SusD paralogs are typically positioned adjacent to one another in the B. thetaiotaomicron
genome (102 of 107 loci encoding SusC paralogs), and are often part of multigene clus-
ters that also encode enzymes involved in carbohydrate metabolism (62 of 107 loci) [2].
Eighteen of the 62 clusters that encode SusC/SusD paralogs and glycoside hydrolases,
also contain ECF-σ factors and adjacent anti-σ factors. A subset of SusC paralogs contain
an extra N-terminal domain with homology to the N-terminal domain of the Escherichia
coli FecA iron-dicitrate receptor protein [35]. FecA interacts directly with an anti-σ factor
(FecR) via this domain, thereby controlling gene expression through modulation of its as-
sociated ECF-σ factor (FecI).
These clusters provide case studies of the evolution of gut Bacteroidetes genomes.
Their glycoside hydrolase content varies considerably within a given species (Table S7).
Our studies in B. thetaiotaomicron indicate that ECF-σ factors are required for transcription
of their adjacent polysaccharide utilization gene clusters, and that chromosomally linked
anti-σ factors act as repressors of this transcription. Moreover, several B. thetaiotaomicron
loci containing ECF-σ and anti-σ factors are differentially regulated during growth on vari-
ous complex glycans ([16] and E. C. Martens and J.I. Gordon, unpublished observations),
suggesting that these systems act as components of carbohydrate sensors responsible for
regulating loci appropriate for utilizing available nutrients.
Six of these clusters in B. distasonis (2-6 and 16 in Table S7-A) include predicted
sulfatases, while there are fewer such loci in the other genomes: two clusters in B. vulgatus
(5 and 11 in Table S7-B), four in B. thetaiotaomicron, and three in each of the two B. fra-
gilis strains. These enzymes could be involved in the desulfation of sulfomucins that con-
tain galactose-3-sulfate, galactose-6-sulfate, and N-acetylglucosamine-6-sulfate residues.
These or other sulfatases could also be involved in the desulfation of glycosaminoglycans
such as chondroitin and heparin.

38
To explore the role of gene duplication in the diversification of the Bacteroidetes,
we generated lists of all paired SusC and SusD paralogs from the four gut- and one non-
gut-associated Bacteroidetes species (see Materials and Methods). P. gingivalis has four
such pairs, while the other five intestinal Bacteroidetes species have a total of 370 (Table
S1). A cladogram generated from the multiple sequence alignment shows that many SusC/
SusD pairs have close relatives among several Bacteroidetes. However, certain specialized
groups are unique to each species, with B. thetaiotaomicron containing one particularly
large expansion (Figure 5A). Gene clusters encoding related SusC/SusD pairs also contain
other genes that are closely related to one another. The homology and synteny of these loci
suggest that genomic duplication is a mechanism driving their amplification and diversifi-
cation (e.g., Figure 5B,C). An intriguing feature of some of these amplified loci is that they
contain clusters of genes with unique functions that are located downstream of the ‘core’
duplicated genes; this may serve to further diversify the roles of these loci in nutrient acqui-
sition (e.g., Figure 5B in which diverse dehydrogenase, sulfatase and glycoside hydrolase
functions are included downstream of a syntenic core of amplified genes).
Discussion
The trillions of bacteria that colonize our distal gut largely belong to two bacterial
divisions, and can be classified by 16S rRNA gene sequence analysis into hundreds of “spe-
cies” that share a common ancestry [4,36] but whose genome content may vary consider-
ably. Forces that shape the genome content of bacteria in the gut include the inter-microbial
dynamics of competition and cooperation in resource partitioning that shape complex food
webs, as well as other community-shaping forces, such as phage attacks, that can result in
‘selective sweeps’ that remove cells with similar susceptibilities. In a competitive environ-
ment where innovation in resource acquisition strategies can breed success, and where
resistance to phage can mean surviving a phage selective sweep, bacteria can be expected
to differentiate their genome content. For the host to thrive and produce more gut habitats
39
(by reproducing), the gut microbial ecosystem must be functionally stable over time de-
spite the internal dynamics of the community. The constituent bacteria might therefore be
expected to have a high degree of functional redundancy between species, so that the loss
of one lineage would not adversely impact ecosystem services to the host. Our investiga-
tion of the genomes of human gut Bacteroidetes species shows that the “top-down” forces
imposed by selection at the host-level that would result in a homogenized microbiome, and
the “bottom-up” forces of inter-microbial dynamics that would result in completely differ-
entiated genomes, are both at work in the distal gut. The genomes of the gut Bacteroidetes
species that have been sequenced harbor suites of genes with similar functions, but differ
in the number of genes within functional categories and their specific sequence. It appears
that the differences between genomes are enough to carve out specific niches within the
gut habitat, such that the species are not in direct competition but are sufficiently similar to
confer resistance to disturbance to the host through functional redundancy.
Our findings demonstrate a key role for lateral gene transfer in shaping the adapta-
tion of individual Bacteroidetes to distinct niches within the human gut. It is unclear how
and when laterally transferred genes were introduced during evolution of distal gut Bacte-
roidetes. We have performed 16S rRNA gene sequence-based enumeration studies of the
fecal microbiota of 59 different mammalian species: the results reveal that none of the four
sequenced gut Bacteroidetes species is restricted to the human gut (R. E. Ley and J.I. Gor-
don, unpublished observations). Nonetheless, the impact of lateral gene transfer is likely
profound for these gut symbionts and their human hosts. A large and varied gene pool of
glycosyltransferases provides a capacity for diversification of surface polysaccharide struc-
tures that could endow symbionts with varied capacities to shape a host immune system so
that it can accommodate a microbiota (and perhaps related food and other environmental
antigens). Since the environment surrounding each human being varies, this gene flow may
promote the generation of host-specific microbiomes. Acquisition of new types of carbohy-
drate binding proteins, transporters, and degradation enzymes through both LGT and gene

40
amplification should influence the types of substrates that can be exploited for energy har-
vest. It may also affect our predisposition to conditions such as obesity where the efficiency
of caloric harvest may be influenced by the relationship between an individual’s microbial
glycoside hydrolase repertoire and the glycan content of his/her diet [37,38].
These considerations emphasize the need to have a more comprehensive view of
our genetic landscape as a composite of human and microbial genes, a transcendent view
of human evolution as involving our microbial partners, and a commitment to investigating
human biology in the larger framework of environmental microbiology. Attention to these
issues is timely given the onset of efforts to sequence the human ‘microbiome’ [39]. These
metagenomic studies will allow investigators to address new, but fundamental, questions
about humans. Do we share an identifiable core ‘microbiome’? If there is such a core, how
does the shell of diversity that surrounds the core influence our individual physiologic
properties? How is the human microbiome evolving (within and between individuals) over
varying time scales as a function of our changing diets, lifestyle, and biosphere? Finally,
how should we define members of the microbiome when microbes possess pan-genomes
(all genes present in any of the strains of a species) with varying degrees of ‘openness’ to
acquisition of genes from other microbes?
Materials and Methods
Genome sequencing
The B. vulgatus and B. distasonis genomes were assembled from two types of
whole genome shotgun libraries: a plasmid library with an average insert size of 5Kb, and
a fosmid library with an average insert size of 40Kb. For each genome, both Phrap (http://
www.phrap.org/) and PCAP [40] assemblies were generated and then compared, resulting
in a ‘hybrid’ assembly that takes advantage of the strength of both assemblies. Regions that

41
contained a gap in one assembly but not in the other were made contiguous in the final as-
sembly for finishing by using Consed [41].
Sequence gaps were filled by primer-walking on spanning clones. Physical gaps
were amplified by PCR and closed by sequencing the PCR products. Poor quality regions
were detected using Consed, amplified with PCR, and resequenced. The integrity and accu-
racy of the assembly were verified by clone constraints. Regions of lower coverage, or that
contained ambiguous assemblies, were resolved by sequencing spanning individual fos-
mids. Regions that underwent sequence inversions were identified based on inconsistency
of constraints for a fraction of read pairs in those regions. The final assemblies consisted
of 12.6X and 13.2X sequence coverage for B. vulgatus and B. distasonis respectively. For
each base, the Phred quality value was at least 40.
rRNA and tRNA genes were identified with BLASTN and tRNA-Scan [42], re-
spectively. Proteins coding genes were identified using GLIMMER v.2.0 [43], ORPHEUS
v.2.0 [44] and CRITICA v.0.94h [45]. WUBLAST (http://blast.wustl.edu/) was used to
identify all predicted proteins with significant hits to the NR database. Predicted protein
coding genes containing <60 codons and without significant homology (e-value threshold
of 10-6) to other proteins were eliminated. Gene start site predictions were fine-tuned using
MED-Start [46] and BLAST homology. In general, no overlapping genes were allowed.
Potential frameshift errors were identified by sequence alignment with known proteins,
and confirmed or corrected by re-sequencing. The final set of genes, compiled from the
analysis described above, was manually curated. Protein annotation was based on homol-
ogy searches against public databases and domain analysis with HMMER (http://hmmer.
wustl.edu/). Functional classification was based on homology searches against COGs using
WU-BLAST and COGnitor [47], followed by manual curation. Metabolic pathways were
constructed with reference to KEGG [48]. Phage genes were identified using Prophage
finder [49].

42
Functional comparisons
Orthologs of the five intestinal Bacteroidetes genomes were identified based on (i)
mutual BLASTP best hits with an e-value threshold of 10-6 and (ii) a requirement that each
pair-wise protein alignment covers at least 60% of query length in both search directions.
The amino acid sequences of each set of orthologs were aligned using ClustalW [50] and
processed with Gblocks [51].
CPS loci in the five intestinal Bacteroidetes genomes were defined with the fol-
lowing criteria. First, an intact CPS locus included a UpxY homolog (as annotated) and a
number of downstream genes on the same strand. These downstream genes included those
that encoded functions related to surface polysaccharide synthesis (such as glycosyltrans-
ferases, carbohydrate export proteins, epimerases, glycoside hydrolases, etc), conserved
hypothetical proteins, or hypothetical proteins. Second, the 5’ boundary of each locus was
determined by the UpxY homolog. Third, the 3’ end of each locus generally was positioned
where switch of coding strand occurred. Alternatively, the 3’ end of the locus was posi-
tioned where downstream genes on the same strand encoded functions that were defined
but unrelated to capsular polysaccharide synthesis (e.g., rRNA/tRNA and two-component
signaling systems). However, the 3’ end of the locus was extended if the coding strand was
disrupted by a single hypothetical protein (to accommodate possible annotation errors), or
a mobile element composed of one or multiple genes.
Gene Ontology (GO) categories and InterPro ID were assigned using (InterProScan
release 12.1 [13]). The number of genes in each genome assigned to each GO term, or its
parents in the hierarchy (according to the ontology description available as of June 6, 2006;
[12]), were totaled. All terms assigned to at least 10 genes in a given genome were tested
for overrepresentation, and all terms with a total of 10 genes across all tested genomes
were tested for under-representation. Significantly over- and under-represented genes were
identified using a binomial comparison with the indicated reference set. To control for dif-

43
ferences in the specificity of gene prediction, genes that could not be assigned to a GO cat-
egory were excluded from the reference sets. A correction was then applied to each distinct
set of tests (e.g., over- or under-representation in a genome) to achieve a false discovery
rate of 0.05 for each set [52]. These tests were implemented using the Math::CDF Perl
module (E. Callahan, Environmental Statistics, Fountain City, WI; available at http://www.
cpan.org/), and scripts written in Perl.
16S rRNA phylogeny
Phylogenetic trees were constructed based on alignment of 16S rRNA fragments
using the NAST aligner [53]. The alignment was filtered using a Lane mask, then modeled
using ModelTest 3.7 [54]: a maximum likelihood tree was found by an exhaustive search
using Paup (v. 4.0b10, http://paup.csit.fsu.edu/) employing parameters estimated by Mod-
elTest.
Laterally transferred genes
Overview of strategy used to identify lateral gene transfer - See Supporting In-
formation.
Identifying classes of genes that were potentially laterally transferred or otherwise
under selection in the gut Bacteroidetes - We identified genes that were laterally acquired
and probably selected for after the divergence of gut Bacteroidetes species, and thus po-
tentially involved in niche differentiation. These genes could either have been transferred
into an individual species by lateral gene transfer, or retained in that species despite being
lost in all other related sequenced species. It is difficult, perhaps impossible, to distinguish
these two cases using the tree topology alone. We identified this class of genes by determin-
ing whether each gene met one of the following criteria. (i) No homologs were found in an
augmented NCBI non-redundant protein database (nr, plus the proteins from the newly se-
quenced strains). This case indicated that either (a) the gene has been lost in every other se-

44
quenced organism but retained in this genome, or (b) that the gene was laterally transferred
from an organism that is not represented in the database. (ii) The only homologs found
were from the same species. This case is the same as case (i), except that either (a) the
gene was sequenced multiple times and deposited in the database under separate records,
or (b) there are paralogs, i.e., multiple copies of the gene in the genome being analyzed.
Both case (i) and (ii) were termed ‘novel’. (iii) The only homologs found are either from
the same species or from other divisions or non-gut Bacteroidetes. This case indicates that
the sequence is in this genome, and also in the genome of distantly related organisms, but
not in the closely related gut Bacteroidetes genomes that have been completely sequenced.
This case also provides evidence that the gene was either transferred or retained despite
loss in related organisms. (iv) The gene is more closely related to genes from other divi-
sions or to non-gut Bacteroidetes than it is to other gut Bacteroidetes that are in the tree,
and parsimony analysis indicates that the direction of transfer was into rather than out of
the genome. This pattern is most consistent with lateral gene transfer, although differential
gene loss cannot in principle be ruled out (however, differences in composition between
this class of genes and the rest of the genome provides compelling supporting evidence).
Both case (iii) and (iv) above were termed ‘laterally transferred’ (LGT).
Genomes - We carried out the analysis on six different genomes: Bacteroides vulga-
tus ATCC 8482 and Bacteroides distasonis ATCC 8503, Bacteroides fragilis NCTC 9343
(NC_0023338), Bacteroides fragilis YCH 46 (NC_006347), Bacteroides thetaiotaomicron
ATCC 29148 (NC_004663), and Porphyromonas gingivalis W83 (NC_002950).
Finding homologs - For each gene in each genome, we identified potential homologs
using PSI-BLAST against NCBI’s non-redundant protein database. In order to use all of
the available data for the Bacteroidetes and their relatives, we augmented this database
with proteins predicted by Glimmer (v. 2.0) from draft genomes in the Bacteroidetes group
that were available at NCBI. These additional genomes included Prevotella ruminicola 23
(The Institute for Genomic Research; TIGR; http://www.tigr.org), Prevotella intermedia 17

45
(TIGR), Pelodictyon phaeoclathratiforme BU-1 [Dept. of Energy-Joint Genome Institute
(DOE-JGI); http://www.jgi.doe.gov], Pelodictyon luteolum DSM 273 (DOE-JGI), Chloro-
bium phaeobacteroides DSM 266 (DOE-JGI), Chlorobium limicola DSM 245 (DOE-JGI),
Chlorobium chlorochromatii CaD3 (DOE-JGI), Bacteroides forsythus (TIGR), and Bacte-
roides fragilis 638R (Wellcome Trust Sanger Institute; http://www.sanger.ac.uk).
To find the top BLAST hits using the most stringent e-value threshold possible,
we used a multi-step PSI-BLAST. In the first PSI-BLAST iteration, we used an e-value
threshold of ≤10-50. If fewer than 50 hits were found, we used the hits to make a profile for
a subsequent PSI-BLAST that was four orders of magnitude less stringent (i.e., with an
e-value of 10-46). We repeated this procedure, increasing the e-value by a factor of 10-4 at
each iteration, until either 50 hits were found or, after 12 iterations, the maximum allowed
e-value of 10-6 was reached. To remove from consideration sequences that were signifi-
cant only because of a conserved domain rather than similarity over the whole gene, we
excluded genes that differed from the length of the query sequence by more than 30%. We
also omitted hits that contained gaps greater than 50 amino acids in length or that contained
gaps at greater than 50% of the positions after performing a multiple sequence alignment
with the other sequences in the set.
Making phylogenetic trees - We performed multiple sequence alignment using
MUSCLE [55], omitting sequences that were poorly aligned to the query sequence as de-
scribed above. We used this alignment to make a neighbor-joining tree using ClustalW [50].
We used bootstrapping to collapse nodes that were not statistically supported. Specifically,
we randomly re-sampled columns from the alignment 100 times and made new neighbor
joining trees with ClustalW. We collapsed into polytomies all nodes in the original tree that
were recovered in fewer than 70% of the bootstrap replicates.
Assigning taxonomy information to sequences - We parsed the NCBI taxonomy
database and used it to assign division and genus information for each PSI-BLAST hit in

46
the phylogenetic tree. Sequences that could not be assigned to any particular division were
removed from the tree. We also removed nematode and arthropod genomes, because we
found that these often provided close hits to the Bacteroidetes genomes. We expect that
these bacteria-to-eukaryote hits actually arise because gut and/or salivary gland bacteria
contaminated the DNA preparations used for genomic sequencing. We also used the ge-
nus annotations in the taxonomy to determine whether sequences from the Bacteroidetes
division were from the gut. We assigned sequences as gut Bacteroidetes if they were in
the genera Prevotella, Porphyromonas, Tannerella, Dysgonomonas, or Bacteroides, and as
non-gut Bacteroidetes otherwise.
Finding genes that are laterally transferred or differentially lost (under recent se-
lective pressure) - We used the bootstrap neighbor joining trees to identify genes that met
any of the four criteria described above. We first marked genes ‘novel’ if the PSI-BLAST
protocol returned only the query gene, indicating that they met criterion (i), or if all of the
genes in the tree were from the same species, indicating that they met criterion (ii). We as-
signed each sequence to a species using the NCBI taxonomy. If genes from other species
were present in the tree, we used the following algorithm. (1) Start at the query sequence.
(2) Step back in tree until a bootstrap-supported node containing sequences from a different
species is found. If this node has, as descendants, sequences from other gut Bacteroidetes
only, mark the gene as not laterally transferred (not selected for). If the node has, as descen-
dants, sequences from both gut Bacteroidetes and other divisions or non-gut Bacteroidetes,
mark the gene as unresolved. If the node has, as descendants, sequences from other divi-
sions or non-gut Bacteroidetes only, mark the gene as laterally transferred (selected for)
and proceed to the parsimony analysis. (3) Use parsimony analysis to determine whether
a potential transfer would have been into the Bacteroidetes species (indicating that it is
important for the gut), or out of the Bacteriodetes species into another lineage. Assign divi-
sion information to all internal nodes in the tree using the Fitch parsimony algorithm [23].
These assignments minimize the number of transfers between divisions needed to explain

47
the distribution of divisions in the modern sequences. If the query sequence is surrounded
by many sequences from unrelated divisions, the parsimony analysis will indicate that
the most likely event was a transfer into the species. As noted in Supporting Information
(Overview of strategy used to identify lateral gene transfer), the method we used provides
an automated technique for assigning taxon labels to individual gene trees. Specifically,
we treat each taxon label (division labels, “gut Bacteroidetes”, or “non-gut Bacteroidetes”)
as a character state, and use the Fitch parsimony algorithm [23] to infer the ancestral state
at each node. We are not using this method in the sense of a formal evolutionary model
of taxon switching, but as a heuristic that recaptures the intuition that a phylogenetic tree
with a clade leading to sequences from one taxon that sprouts from within a clade leading
to sequences from a completely different taxon probably represents an lateral gene transfer
event, even if the inner clade is represented by more sequences. This type of strategy has
been widely applied both manually and computationally to detect lineage-specific transfers
(e.g., [56-58]), and is related to a method used in studies of host-parasite co-speciation
[59], a problem that is mathematically equivalent to lateral gene transfer detection.
SusC/SusD alignments
Pairs of genes encoding SusC and SusD paralogs were identified in the Bacteroi-
detes genome sequences by performing individual BLASTP searches against each genome
using amino acid sequences of previously annotated SusC and SusD paralogs as queries.
The low-scoring hits from each search (e-values between 10-4 and
10-10) were themselves used as BLASTP queries to reveal more divergent puta-
tive paralogs in each genome. This process repeated until no new paralogs were identi-
fied. Lists of putative SusC and SusD paralogs were compared for each species. Paralogs
were included in subsequent ClustalW analysis based on the requirement that each had a
separately predicted, adjacent partner. This process was instrumental in excluding related
TonB-dependent hemin, vitamin B12 and iron-siderophore receptors from the list of puta-

48
tive SusC paralogs. The resulting dataset included 374 paralog pairs: 102 in B. thetaiotao-
micron, 69 in B. fragilis NCTC 9343, 65 in B. fragilis YCH 46, 80 in B. vulgatus, 54 in
B. distasonis and four in P. gingivalis. Because polysaccharide binding by SusC and SusD
has been shown to require both polypeptides [14], and because individual SusC and SusD
alignments suggested these paired functions have evolved in parallel (data not shown),
each pair was joined into a single sequence prior to alignment. Sequences were aligned
using ClustalW [50] (version 1.83), and a neighbor-joining cladogram was created from
the alignment using Paup (v. 4.0b10, http://paup.csit.fsu.edu/). Bootstrap values were de-
termined from 100 trees. Branches retained in Figure 5A represent groups with > 70%
bootstrap values.
Acknowledgements
This work was supported by a grant from the National Science Foundation
(EF0333284). C. Lozupone was supported by a NIH pre-doctoral training grant (T32
GM08759), M. Hamady by a gift from the Jane and Charlie Butcher Foundation and W.M.
Keck Foundation RNA Bioinformatics Initiative, and E.C. Martens by a NIH post-doctoral
training grant (T32 HD07409). The sequence data of Cytophaga hutchinsonii ATCC 33406,
Pelodictyon phaeoclathratiforme BU-1; Pelodictyon luteolum DSM 273, Chlorobium pha-
eobacteroides DSM 266, Chlorobium limicola DSM 245 and Chlorobium chlorochromatii
CaD3 were produced by the US Department of Energy Joint Genome Institute (http://
www.jgi.doe.gov/). Preliminary sequence data for Prevotella ruminicola 23, Prevotella
intermedia 17, and Bacteroides forsythus were obtained from The Institute for Genomic
Research through its website at http://www.tigr.org. Sequencing of Prevotella interme-
dia and Prevotella ruminicola 23 was accomplished with support from NIH-NIDCR and
USDA respectively. The draft sequence of Bacteroides fragilis 638R was produced by the
Pathogens Sequencing Group at the Sanger Institute and can be obtained from ftp://ftp.
sanger.ac.uk/pub/pathogens.

49
GenBank Accession Numbers
The genome sequences of B. vulgatus ATCC 8482 and B. distasonis ATCC 8503
have been deposited in GenBank under accession numbers CP000139 and CP000140, re-
spectively.
Abbreviations
LGT – lateral gene transfer; Sus – starch utilization system paralog; CPS – capsular
polysaccharide synthesis

50
References
1. Backhed F, Ley RE, Sonnenburg JL, Peterson DA, Gordon JI (2005) Host-bacterial
mutualism in the human intestine. Science 307: 1915-1920.
2. Xu J, Bjursell MK, Himrod J, Deng S, Carmichael LK, et al. (2003) A genomic
view of the human-Bacteroides thetaiotaomicron symbiosis. Science 299: 2074-
2076.
3. Eckburg PB, Bik EM, Bernstein CN, Purdom E, Dethlefsen L, et al. (2005) Diversity
of the Human Intestinal Microbial Flora. Science.
4. Ley RE, Peterson DA, Gordon JI (2006) Ecological and evolutionary forces shaping
microbial diversity in the human intestine. Cell 124: 837-848.
5. Dunbar J, Barns SM, Ticknor LO, Kuske CR (2002) Empirical and theoretical
bacterial diversity in four Arizona soils. Appl Environ Microbiol 68: 3035-3045.
6. Salyers AA, Gupta A, Wang Y (2004) Human intestinal bacteria as reservoirs for
antibiotic resistance genes. Trends Microbiol 12: 412-416.
7. Sakamoto M, Benno Y (2006) Reclassification of Bacteroides distasonis, Bacteroides
goldsteinii and Bacteroides merdae as Parabacteroides distasonis gen. nov., comb.
nov., Parabacteroides goldsteinii comb. nov. and Parabacteroides merdae comb.
nov. Int J Syst Evol Microbiol 56: 1599-1605.
8. Kuwahara T, Yamashita A, Hirakawa H, Nakayama H, Toh H, et al. (2004) Genomic
analysis of Bacteroides fragilis reveals extensive DNA inversions regulating cell
surface adaptation. Proc Natl Acad Sci U S A 101: 14919-14924.
9. Cerdeno-Tarraga AM, Patrick S, Crossman LC, Blakely G, Abratt V, et al. (2005)
Extensive DNA inversions in the B. fragilis genome control variable gene expression.
Science 307: 1463-1465.

51
10. Millward DJ (1999) The nutritional value of plant-based diets in relation to human
amino acid and protein requirements. Proc Nutr Soc 58: 249-260.
11. Nelson KE, Fleischmann RD, DeBoy RT, Paulsen IT, Fouts DE, et al. (2003)
Complete genome sequence of the oral pathogenic Bacterium porphyromonas
gingivalis strain W83. J Bacteriol 185: 5591-5601.
12. Ashburner M, Ball CA, Blake JA, Botstein D, Butler H, et al. (2000) Gene ontology:
tool for the unification of biology. The Gene Ontology Consortium. Nat Genet 25:
25-29.
13. Mulder NJ, Apweiler R, Attwood TK, Bairoch A, Bateman A, et al. (2005) InterPro,
progress and status in 2005. Nucleic Acids Res 33: D201-205.
14. Shipman JA, Berleman JE, Salyers AA (2000) Characterization of four outer
membrane proteins involved in binding starch to the cell surface of Bacteroides
thetaiotaomicron. J Bacteriol 182: 5365-5372.
15. Cho KH, Salyers AA (2001) Biochemical analysis of interactions between
outer membrane proteins that contribute to starch utilization by Bacteroides
thetaiotaomicron. J Bacteriol 183: 7224-7230.
16. Sonnenburg JL, Xu J, Leip DD, Chen CH, Westover BP, et al. (2005) Glycan
foraging in vivo by an intestine-adapted bacterial symbiont. Science 307: 1955-
1959.
17. Salyers AA, Vercellotti JR, West SE, Wilkins TD (1977) Fermentation of mucin
and plant polysaccharides by strains of Bacteroides from the human colon. Appl
Environ Microbiol 33: 319-322.
18. Ragan MA (2001) On surrogate methods for detecting lateral gene transfer. FEMS
Microbiol Lett 201: 187-191.

52
19. Kurland CG, Canback B, Berg OG (2003) Horizontal gene transfer: a critical view.
Proc Natl Acad Sci U S A 100: 9658-9662.
20. Lawrence JG, Hendrickson H (2003) Lateral gene transfer: when will adolescence
end? Mol Microbiol 50: 739-749.
21. Ragan MA, Harlow TJ, Beiko RG (2006) Do different surrogate methods detect
lateral genetic transfer events of different relative ages? Trends Microbiol 14: 4-8.
22. Berg OG, Kurland CG (2002) Evolution of microbial genomes: sequence acquisition
and loss. Mol Biol Evol 19: 2265-2276.
23. Fitch WM (1970) Distinguishing homologous from analogous proteins. Syst Zool
20: 406-416.
24. Hansen-Wester I, Stecher B, Hensel M (2002) Analyses of the evolutionary
distribution of Salmonella translocated effectors. Infect Immun 70: 1619-1622.
25. Garcia-Vallve S, Romeu A, Palau J (2000) Horizontal gene transfer in bacterial and
archaeal complete genomes. Genome Res 10: 1719-1725.
26. Jeltsch A, Pingoud A (1996) Horizontal gene transfer contributes to the wide
distribution and evolution of type II restriction-modification systems. J Mol Evol
42: 91-96.
27. Nakayama Y, Kobayashi I (1998) Restriction-modification gene complexes as selfish
gene entities: roles of a regulatory system in their establishment, maintenance, and
apoptotic mutual exclusion. Proc Natl Acad Sci U S A 95: 6442-6447.
28. Gressmann H, Linz B, Ghai R, Pleissner KP, Schlapbach R, et al. (2005) Gain and
loss of multiple genes during the evolution of Helicobacter pylori. PLoS Genet 1:
e43.
53
29. Mazmanian SK, Liu CH, Tzianabos AO, Kasper DL (2005) An immunomodulatory
molecule of symbiotic bacteria directs maturation of the host immune system. Cell
122: 107-118.
30. Comstock LE, Coyne MJ, Tzianabos AO, Kasper DL (1999) Interstrain variation of
the polysaccharide B biosynthesis locus of Bacteroides fragilis: characterization of
the region from strain 638R. J Bacteriol 181: 6192-6196.
31. Comstock LE, Pantosti A, Kasper DL (2000) Genetic diversity of the capsular
polysaccharide C biosynthesis region of Bacteroides fragilis. Infect Immun 68:
6182-6188.
32. Coyne MJ, Weinacht KG, Krinos CM, Comstock LE (2003) Mpi recombinase
globally modulates the surface architecture of a human commensal bacterium. Proc
Natl Acad Sci U S A 100: 10446-10451.
33. Coyne MJ, Reinap B, Lee MM, Comstock LE (2005) Human symbionts use a host-
like pathway for surface fucosylation. Science 307: 1778-1781.
34. Reeves AR, D’Elia JN, Frias J, Salyers AA (1996) A Bacteroides thetaiotaomicron
outer membrane protein that is essential for utilization of maltooligosaccharides
and starch. J Bacteriol 178: 823-830.
35. Koebnik R (2005) TonB-dependent trans-envelope signalling: the exception or the
rule? Trends Microbiol 13: 343-347.
36. Eckburg PB, Lepp PW, Relman DA (2003) Archaea and their potential role in
human disease. Infect Immun 71: 591-596.
37. Ley RE, Turnbaugh PJ, Klein S, Gordon JI (2006) Microbial ecology: human gut
microbes associated with obesity. Nature 444: 1022-1023.

54
38. Turnbaugh PJ, Ley RE, Mahowald MA, Magrini V, Mardis ER, et al. (2006) An
obesity-associated gut microbiome with increased capacity for energy harvest.
Nature 444: 1027-1031.
39. Gill SR, Pop M, Deboy RT, Eckburg PB, Turnbaugh PJ, et al. (2006) Metagenomic
analysis of the human distal gut microbiome. Science 312: 1355-1359.
40. Huang X, Wang J, Aluru S, Yang SP, Hillier L (2003) PCAP: a whole-genome
assembly program. Genome Res 13: 2164-2170.
41. Gordon D, Abajian C, Green P (1998) Consed: a graphical tool for sequence
finishing. Genome Res 8: 195-202.
42. Lowe TM, Eddy SR (1997) tRNAscan-SE: a program for improved detection of
transfer RNA genes in genomic sequence. Nucleic Acids Res 25: 955-964.
43. Delcher AL, Harmon D, Kasif S, White O, Salzberg SL (1999) Improved microbial
gene identification with GLIMMER. Nucleic Acids Res 27: 4636-4641.
44. Frishman D, Mironov A, Mewes HW, Gelfand M (1998) Combining diverse
evidence for gene recognition in completely sequenced bacterial genomes. Nucleic
Acids Res 26: 2941-2947.
45. Badger JH, Olsen GJ (1999) CRITICA: coding region identification tool invoking
comparative analysis. Mol Biol Evol 16: 512-524.
46. Zhu HQ, Hu GQ, Ouyang ZQ, Wang J, She ZS (2004) Accuracy improvement
for identifying translation initiation sites in microbial genomes. Bioinformatics 20:
3308-3317.
47. Tatusov RL, Fedorova ND, Jackson JD, Jacobs AR, Kiryutin B, et al. (2003) The
COG database: an updated version includes eukaryotes. BMC Bioinformatics 4:
41.
55
48. Kanehisa M, Goto S, Kawashima S, Okuno Y, Hattori M (2004) The KEGG resource
for deciphering the genome. Nucleic Acids Res 32: D277-280.
49. Bose M, Barber RD (2006) Prophage Finder: a prophage loci prediction tool for
prokaryotic genome sequences. In Silico Biology 6: 0020.
50. Chenna R, Sugawara H, Koike T, Lopez R, Gibson TJ, et al. (2003) Multiple
sequence alignment with the Clustal series of programs. Nucleic Acids Res 31:
3497-3500.
51. Castresana J (2000) Selection of conserved blocks from multiple alignments for
their use in phylogenetic analysis. Mol Biol Evol 17: 540-552.
52. Benjamini Y, Hochberg Y (1995) Controlling the false discovery rate: A practical
and powerful approach to multiple testing. Journal of the Royal Statistical Society
B 57: 289-300.
53. DeSantis TZ, Jr., Hugenholtz P, Keller K, Brodie EL, Larsen N, et al. (2006) NAST:
a multiple sequence alignment server for comparative analysis of 16S rRNA genes.
Nucleic Acids Res 34: W394-399.
54. Posada D, Crandall KA (1998) MODELTEST: testing the model of DNA substitution.
Bioinformatics 14: 817-818.
55. Edgar RC (2004) MUSCLE: multiple sequence alignment with high accuracy and
high throughput. Nucleic Acids Res 32: 1792-1797.
56. Hooper SD, Berg OG (2003) Duplication is more common among laterally
transferred genes than among indigenous genes. Genome Biol 4: R48.
57. Kunin V, Ouzounis CA (2003) GeneTRACE-reconstruction of gene content of
ancestral species. Bioinformatics 19: 1412-1416.
58. Daubin V, Ochman H (2004) Bacterial genomes as new gene homes: the genealogy
of ORFans in E. coli. Genome Res 14: 1036-1042.
56
59. Brooks DR (1981) Hennig’s parasitological method: a proposed solution. Syst Zool
30: 229-249.
60. DeSantis TZ, Dubosarskiy I, Murray SR, Andersen GL (2003) Comprehensive
aligned sequence construction for automated design of effective probes
(CASCADE-P) using 16S rDNA. Bioinformatics 19: 1461-1468.

57
Figure Legends
Figure 1. Phylogenetic relationships of fully sequenced Bacteroidetes. (A) 16S rRNA se-
quences were taken from a previously published alignment created using the NAST aligner
[60]. A maximum likelihood tree was generated using parameters estimated with ModelT-
est 3. 7 and Paup (version 4. 0b11). Terminal branch lengths are not drawn to scale. (B)
The average percent amino acid sequence identities were calculated using ClustalW align-
ments for the 530 sets of 7-way orthologs that include the five intestinal Bacteroidetes
genomes, P. gingivalis and C. hutchinsonii. B. thetaiotaomicron was used as a reference.
Figure 2. Sensing, regulatory and carbohydrate metabolism genes are enriched among
all gut-associated Bacteroidetes. The number of genes assigned to each GO term from
each genome is shown. Significant enrichment is denoted by pink (p<0.05) or red (p<0.001)
while depletion is indicated by light blue (p<0.05) or dark blue (p<0.001), as calculated by
a binomial comparison followed by Benjamini-Hochberg false-discovery rate correction
(see Materials and Methods). (A) Genes assigned to GO terms related to core metabolic
functions are enriched in the subset of common gut-associated Bacteroidetes orthologs
shared with non-gut Bacteroidetes (seven-way comparison; abbreviated 7w), compared to
the reference set of 1,416 orthologs common to the five sequenced gut Bacteroidetes ge-
nomes (5w), suggesting that all Bacteroidetes have inherited a core metabolome from their
common ancestor. The set of orthologs that is not shared with non-gut-associated Bacte-
roidetes (5-way unique; 5wU) is enriched, relative to all orthologs (5w), for genes in three
classes: amino acid biosynthesis; membrane transport; and two-component signal trans-
duction systems, suggesting that these genes were important in the process of adaptation
to the gut and/or other habitats by the common ancestor of gut Bacteroidetes. (B) Various
GO terms related to environmental sensing, gene regulation and carbohydrate degradation
are enriched in gut Bacteroidetes relative to C. hutchinsonii. A similar pattern is observed
relative to P. gingivalis (data not shown). Note that these same classes of genes are depleted
in the subset of shared gut Bacteroidetes orthologs (Figure 2A, 5w) relative to the full B.

58
thetaiotaomicron (Bt) Genome (Figure 2A, Bt-G). Thus, these classes of genes, though
enriched in all gut Bacteroidetes, are widely divergent between them. Others classes of
genes vary between species: B. distasonis and B. vulgatus show an expanded repertoire of
proteases, while B. thetaiotaomicron lacks genes involved in synthesis of cobalamin. Other
abbreviations: B. distasonis (Bd), B. vulgatus (Bv), B. fragilis NCTC 9343 (BfN), B. fra-
gilis YCH 46 (BfY), P. gingivalis (Pg), C. hutchinsonii (Ch), orthologs shared by the five
sequenced gut Bacteroidetes genomes (Bt, Bv, Bd, plus two Bf strains), and Pg (6w),
Figure 3. Analyses of lateral gene transfer events in Bacteroidetes.lineages reveal its
contribution to niche specialization. (A) Genes involved in core metabolic processes are
enriched among non-laterally transferred genes identified by a phylogenetic approach (see
Materials and Methods). The proportion of genes identified as not laterally transferred
in each genome (light blue), as well as assigned to the GO terms ‘Primary metabolism’
(yellow) and ‘Protein biosynthesis’ (red), are shown. Significant increases (enrichment)
relative to each whole genome are shown by an upward pointing arrowhead, and decreases
(depletion) by a downward pointing arrowhead, while the corresponding probability, de-
termined by a binomial test, is denoted by asterisks: *, P<0.05, **; P<0.01, ***; P<0.001.
(B) Laterally transferred genes are enriched among genes assigned to the GO term ‘DNA
methylation’ (e.g., restriction-modification systems) (red), relative to each complete ge-
nome (light blue). Glycosyltransferases (yellow) and genes located within CPS loci (green)
are also enriched within the set of transferred genes. Significance was determined and de-
noted as in panel A. (C) B. distasonis (light blue) possesses a significantly larger proportion
of laterally transferred genes than the other Bacteroidetes, as shown by significant increases
in the proportion of genes in each category of our analysis (‘LGT in’, laterally transferred
into the genome; ‘Novel’, no homologs identified from other species, ‘LGT direction unre-
solved’, laterally transferred but direction unknown; ‘LGT out’, laterally transferred out of
the genome; ‘Unresolved,’ lateral transfer uncertain; see Materials and Methods for de-
tailed explanations of categories and http://gordonlab.wustl.edu/BvBd.html for a complete

59
list of genes in each category). Significant changes, denoted as in panel A, were determined
by a binomial test, using the average proportion within all other genomes used in the analy-
sis as the reference. Other strains are B. vulgatus (red), B. thetaiotaomicron (yellow), B.
fragilis NCTC 9343 (green), B. fragilis YCH 46 (purple) and P. gingivalis (orange). (D) A
prominent laterally transferred locus within B. distasonis contains a 10-gene hydrogenase
complex, likely allowing B. distasonis to use hydrogen as a terminal electron acceptor in
anaerobic respiration. Genes transferred into B. distasonis are colored red, while genes
whose phylogeny could not be resolved are yellow. Letters indicate functional components
of the hydrogenase complex: M, maturation or accessory factor, S, small subunit, L, large
subunit.
Figure 4. Evolutionary mechanisms that impact Bacteroidetes CPS loci..(A) CTn-me-
diated duplication of B. vulgatus CPS loci. Homologous gene pairs in the two duplicated
regions are linked with fine gray lines, underscoring the high level of synteny. Genes con-
stituting CPS locus 1 and 2 are highlighted in red, with the first and last genes numbered.
Green denotes essential component genes of CTns. Blue brackets indicate two sub-regions
that share 100% nucleotide sequence identity. The asterisk indicates three open reading
frames encoding two conserved hypothetical proteins and a hypothetical protein, suggest-
ing an insertion that occurred after the duplication event. (B) Locations of putative glyco-
syltransferase xenologs and inserted phage genes in CPS loci of the sequenced gut Bacte-
roidetes. Color code: integrases (green), UpxY transcriptional regulator homologs (black),
putative xenologs (primarily glycosyltransferases, red), phage genes (blue) and remaining
genes (gray). See Table S5 for functional annotations.
Figure 5. Cladogram comparison of SusC/SusD.pairs shows both specialized and
shared branches among the Bacteroidetes. (A) Cladogram generated from all fully se-
quenced Bacteroidetes. Branches that are unique to each species are color-coded as indi-
cated. The homologous RagA/RagB proteins from P. gingivalis were selected as an arbi-
trary root (dashed branches). Dashed lines surrounding the tree indicate (i) a clade that is

60
dominated by B. thetaiotaomicron SusC/SusD pairs (39/45 pairs, red dashes) and (ii) a
clade that is poorly represented in B. thetaiotaomicron (7/34 pairs, black dashes). Colored
hash marks surrounding the cladogram represent the linkage of two other protein families,
which show syntenic organization within related B. thetaiotaomicron SusC/SusD contain-
ing loci: NHL-repeat containing proteins (light blue) and a group of conserved hypotheti-
cal lipidated proteins (light green). These protein families are not represented in the other
sequenced Bacteroidetes, occur only adjacent to SusC/SusD pairs, and have no predicted
functions. See http://gordonlab.wustl.edu/BvBd.html for locus tags for each taxon, branch
bootstrap values, and lists of SusC/SusD-linked genes. (B) An example of a recently am-
plified polysaccharide utilization locus in which the synteny of three flanking SusC/SusD
genes has been maintained. The locations of the four SusC/SusD pairs encoded within
these amplified clusters are indicated on the cladogram shown in panel A by asterisks. The
locus schematic is arranged so that groups of related proteins (mutual best BLAST hits) are
aligned vertically, within the yellow box. The functions of amplified genes are indicated by
numbers over each vertical column and, where applicable, are color-coded to correspond to
panel A: 1, conserved hypothetical lipidated protein; 2, SusD paralog; 3, SusC paralog, 4,
NHL-repeat containing protein; and 5, glutaminase A (note that in three clusters, this gene
has been partially deleted). Gray-colored genes downstream of each amplified cluster en-
code hypothetical proteins or predicted enzymatic activities (e.g., dehydrogenase, sulfatase
and glycoside hydrolase) that are unique to each cluster. A xenolog that has been inserted
in one gene cluster is indicated in red, other genes are black. Dashed lines connecting gene
clusters show linkage only, and do not correspond to actual genomic distance. (C) An ex-
ample of a recently duplicated locus from B. distasonis that includes duplicated regulatory
genes. Syntenic regions are aligned as in panel B and include a single sulfatase (1, dark
green), a SusD paralog (2, light purple), SusC paralog (3, dark purple), an anti-σ factor (4,
light orange) and an ECF-σ factor (5, dark orange). Two other downstream sulfatase genes
(gray) are also included in one cluster.

61
Figures
Figure 1.
A B

62
Figure 2.
A
B

63
Figure 3.
A
B
C
D
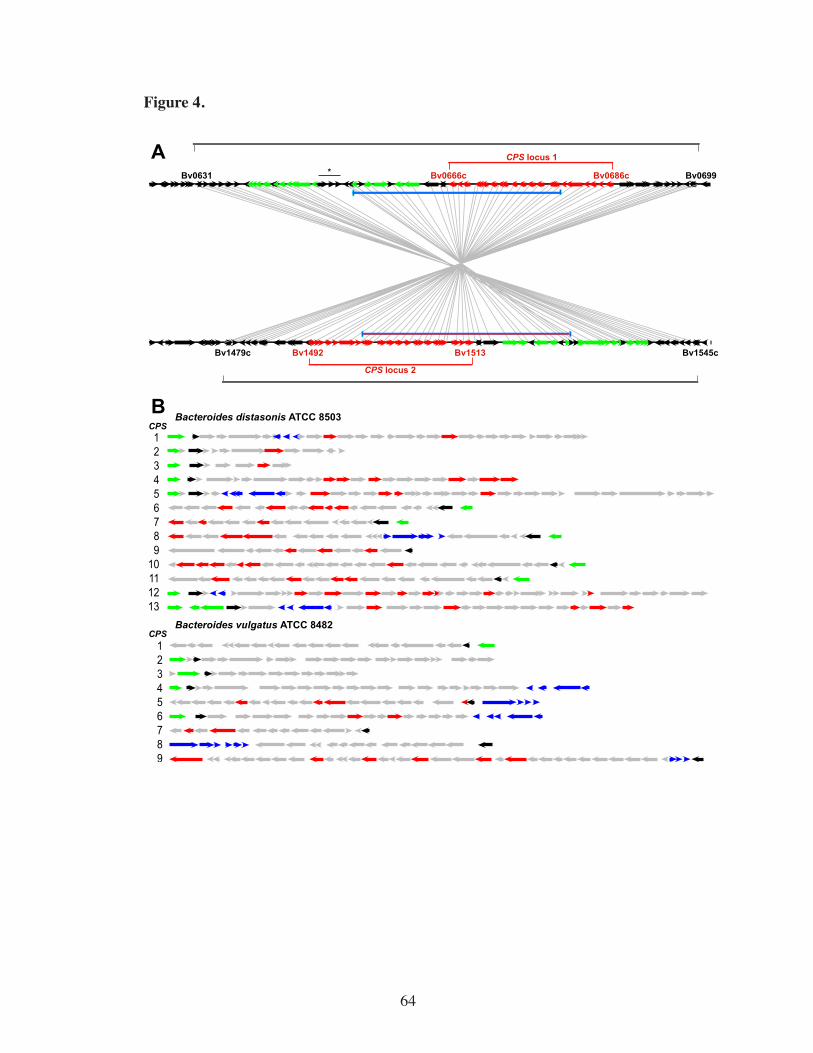
64
Figure 4..
A
B

65
Figure 5
C
B
A

66
Supplemental Information
Overview of strategy used to identify lateral gene transfer
Many approaches have been used to detect LGT for different applications. For ex-
ample, compositional methods based on GC content, dinucleotide frequencies, codon us-
age, and other oligonucleotide frequencies (e.g., [1-5]) are often used to detect transferred
genes within a genome. Techniques such as patterns of BLAST hits (e.g., [6-8]) and ratios
of sequence divergence between different pairs of genes in different pairs of species (e.g.,
[9-12]) have also been used in numerous studies. However, these methods for detecting
lateral gene transfer are typically seen as surrogates for phylogenetic studies [13], and their
sensitivity and specificity have often been criticized. For example, compositional methods
are sensitive to equilibration of the gene composition to the genome composition [14-16],
and BLAST-based methods are sensitive to loss of paralogs, different rates of evolution,
recombination, and many other factors [13,17-21]. Indeed, phylogenetic re-analysis of pu-
tative laterally transferred genes that were originally found by reciprocal BLAST hits has
indicated that many of these identifications were incorrect (e.g., [22,23]). Similarly, appli-
cation of parsimony inference to identify gene losses and gains on a species or rRNA tree
(e.g., [24-27]) is sensitive to the presence of paralogous sequences and other artifacts [19].
Thus, phylogenetic analysis of individual gene trees, often manually applied, is frequently
recommended as the gold standard for lateral gene transfer detection [12,13,17,18,23,28-
30].
Phylogenetic analysis itself is subject to many issues, especially because construct-
ing the tree relies on models of sequence evolution that may be simplified or incorrect
[31,32], because many protein families lack phylogenetic signal [33], or because of arti-
facts of tree reconstruction (e.g., [34,35]). There are several formal statistical tests for tree
congruence, such as the KH test [36], but these tests require that the two trees to be com-
pared contain the same taxa (i.e. multiple sequences from the same taxon are not allowed).

67
Because lineage-specific duplications in the Bacteroidetes are common, as shown by our
analysis (see Results) and previous studies [37-39], applying these tests in an automated
fashion becomes exceedingly complex. In particular, choices about which duplicate genes
to omit affect the values of the test statistics. Additionally, these tests only measure differ-
ences in tree topology, and cannot typically distinguish lateral gene transfer from ancient
loss of paralogs or other unusual phylogenetic events. Thus, although the SH test has been
extremely useful for identifying genes that lead to poor resolution in whole-genome phy-
logenies [19], it is less suitable for asking which genes in a genome have undergone lateral
gene transfer. Similar comments apply to other global tests for changes in tree topology
(e.g., [40-42]) because they cannot handle duplications in any lineage, they cannot be reli-
ably applied on a genome-wide scale. For example, Ge and colleagues were able to find
only 297 orthologous gene clusters across 40 species that were suitable for application of
their method [41].
Because different methods for detecting lateral gene transfer typically have poor
agreement about which genes are detected as transferred [9,12,13,30,43], we decided to
use phylogenetic analysis and to focus on the types of transfers it detects best: transfers
from within one specific lineage to another specific lineage. In particular, because our 16S
rRNA trees showed that the gut Bacteroidetes are well-supported as a monophyletic group,
we decided to focus on those genes that were transferred from a specific lineage outside
this group to individual species within this group. Since we are in the process of gathering
more genomic sequences from Bacteroidetes, we left study of lateral gene transfer within
the gut Bacteroidetes for future work because we expect substantially better resolution for
detecting lateral gene transfer events when better taxonomic sampling within this group is
available.
Our goal was to automatically assign taxon labels to the sequences in individual
gene trees, such that unknown sequences would acquire labels from their close relatives
in a consistent fashion. In order to achieve this outcome, we treated each taxon label as a
68
character state, and inferred the ancestral state at each node using the Fitch parsimony
algorithm [44]. For example, taxon labels might correspond to bacterial divisions, such as
“Firmicutes,” or to other taxonomic groups of interest, such as “gut Bacteroidetes” or “non-
gut Bacteroidetes”. This procedure, which has often been applied either manually or in an
automated fashion to reveal lateral gene transfer among specific lineages (e.g., [45-47]), is
based on the idea that a lateral gene transfer event followed by speciation should typically
be marked by a monophyletic group of sequences from one lineage that stems from within
a paraphyletic group of sequences from a single other lineage. In other words, the transfer
of a gene from lineage X to lineage Y should give a tree in which the sequences from Y are
related to a specific group of sequences within lineage X. We would still count this event
as a transfer from X to Y even if there are more sequences in Y than remain in X, for ex-
ample if Y is a very speciose lineage or is a lineage in which paralogy of the relevant genes
is rampant. The parsimony approach we used is related to Brooks Parsimony Analysis, a
method used for detecting co-speciation between hosts and parasites [48]. The problem of
host-parasite co-speciation is mathematically identical to the problem of relating gene trees
to species trees, because both cases require the analysis of phylogenies in which duplica-
tion, deletion, and switching between hosts (or genomes) are all possible.
There are two types of events that could conceivably lead to the type of phylogeny
in which we are interested (lineage X paraphyletic with respect to lineage Y): lateral trans-
fer from one group to another, and loss of an ancient paralog in all but those two groups.
However, because strong selective advantages are required to maintain transferred genes in
bacterial populations [49] and because the divergence distances are large (mostly from other
bacterial divisions), lateral gene transfer is by far the most likely scenario leading to these
trees. We believe that this method is more suitable for detecting a set of high-confidence
transfers because global measures of phylogenetic incongruence require rejection over the
whole tree, not just for one specific group (potentially leading to high false negative rates),
and are influenced by the many factors that can lead to misplacement of taxa not relevant to
69
our analysis (leading to high false positive rates). We confirmed the likely lateral transfer of
these genes by testing that the GC content and codon usage of genes chosen by our method
differed from those of randomly chosen genes in the genome. Specifically, we compared
the GC contents of transferred and non-transferred genes within each genome (excluding
unresolved genes) using two-sample t tests with Welch’s correction for unequal variances,
and compared the codon usage of transferred and non-transferred genes using chi-squared
tests. Analysis of the functional categories represented by these genes and presence of
groups of genes within apparent genomic islands provided additional supporting evidence
of LGT (see Results).

70
Supplemental References
1. Karlin S, Mrazek J, Campbell AM (1998) Codon usages in different gene classes of
the Escherichia coli genome. Mol Microbiol 29: 1341-1355.
2. Lawrence JG, Ochman H (1998) Molecular archaeology of the Escherichia coli
genome. Proc Natl Acad Sci U S A 95: 9413-9417.
3. Wang HC, Badger J, Kearney P, Li M (2001) Analysis of codon usage patterns of
bacterial genomes using the self-organizing map. Mol Biol Evol 18: 792-800.
4. Hooper SD, Berg OG (2002) Detection of genes with atypical nucleotide sequence
in microbial genomes. J Mol Evol 54: 365-375.
5. Sandberg R, Branden CI, Ernberg I, Coster J (2003) Quantifying the species-
specificity in genomic signatures, synonymous codon choice, amino acid usage
and G+C content. Gene 311: 35-42.
6. Nelson KE, Clayton RA, Gill SR, Gwinn ML, Dodson RJ, et alet al. (1999) Evidence
for lateral gene transfer between Archaea and bacteria from genome sequence of
Thermotoga maritima. Nature 399: 323-329.
7. Lander ES, Linton LM, Birren B, Nusbaum C, Zody MC, et alet al. (2001) Initial
sequencing and analysis of the human genome. Nature 409: 860-921.
8. Pallen MJ, Beatson SA, Bailey CM (2005) Bioinformatics analysis of the locus
for enterocyte effacement provides novel insights into type-III secretion. BMC
Microbiol 5: 9.
9. Syvanen M (2002) On the occurrence of horizontal gene transfer among an
arbitrarily chosen group of 26 genes. J Mol Evol 54: 258-266.
10. Farahi K, Whitman WB, Kraemer ET (2003) RED-T: utilizing the Ratios of
Evolutionary Distances for determination of alternative phylogenetic events.
Bioinformatics 19: 2152-2154.

71
11. Novichkov PS, Omelchenko MV, Gelfand MS, Mironov AA, Wolf YI, et alet al.
(2004) Genome-wide molecular clock and horizontal gene transfer in bacterial
evolution. J Bacteriol 186: 6575-6585.
12. Kechris KJ, Lin JC, Bickel PJ, Glazer AN (2006) Quantitative exploration of the
occurrence of lateral gene transfer by using nitrogen fixation genes as a case study.
Proc Natl Acad Sci U S A 103: 9584-9589.
13. Ragan MA (2001) On surrogate methods for detecting lateral gene transfer. FEMS
Microbiol Lett 201: 187-191.
14. Lawrence JG, Ochman H (1997) Amelioration of bacterial genomes: rates of change
and exchange. J Mol Evol 44: 383-397.
15. Koski LB, Morton RA, Golding GB (2001) Codon bias and base composition are
poor indicators of horizontally transferred genes. Mol Biol Evol 18: 404-412.
16. Wang B (2001) Limitations of compositional approach to identifying horizontally
transferred genes. J Mol Evol 53: 244-250.
17. Ochman H (2001) Lateral and oblique gene transfer. Curr Opin Genet Dev 11: 616-
619.
18. Doolittle WF, Boucher Y, Nesbo CL, Douady CJ, Andersson JO, et alet al. (2003)
How big is the iceberg of which organellar genes in nuclear genomes are but the
tip? Philos Trans R Soc Lond B Biol Sci 358: 39-57; discussion 57-38.
19. Lerat E, Daubin V, Moran NA (2003) From gene trees to organismal phylogeny in
prokaryotes: the case of the gamma-Proteobacteria. PLoS Biol 1: E19.
20. Philippe H, Douady CJ (2003) Horizontal gene transfer and phylogenetics. Curr
Opin Microbiol 6: 498-505.
21. Andersson JO (2005) Lateral gene transfer in eukaryotes. Cell Mol Life Sci 62:
1182-1197.

72
22. Kinsella RJ, McInerney JO (2003) Eukaryotic genes in Mycobacterium tuberculosis?
Possible alternative explanations. Trends Genet 19: 687-689.
23. Genereux DP, Logsdon JM, Jr. (2003) Much ado about bacteria-to-vertebrate lateral
gene transfer. Trends Genet 19: 191-195.
24. Jordan IK, Makarova KS, Spouge JL, Wolf YI, Koonin EV (2001) Lineage-specific
gene expansions in bacterial and archaeal genomes. Genome Res 11: 555-565.
25. Mirkin BG, Fenner TI, Galperin MY, Koonin EV (2003) Algorithms for computing
parsimonious evolutionary scenarios for genome evolution, the last universal
common ancestor and dominance of horizontal gene transfer in the evolution of
prokaryotes. BMC Evol Biol 3: 2.
26. Hao W, Golding GB (2004) Patterns of bacterial gene movement. Mol Biol Evol
21: 1294-1307.
27. Pal C, Papp B, Lercher MJ (2005) Horizontal gene transfer depends on gene content
of the host. Bioinformatics 21 Suppl 2: ii222-ii223.
28. Eisen JA (2000) Horizontal gene transfer among microbial genomes: new insights
from complete genome analysis. Curr Opin Genet Dev 10: 606-611.
29. Kurland CG, Canback B, Berg OG (2003) Horizontal gene transfer: a critical view.
Proc Natl Acad Sci U S A 100: 9658-9662.
30. Ragan MA, Harlow TJ, Beiko RG (2006) Do different surrogate methods detect
lateral genetic transfer events of different relative ages? Trends Microbiol 14: 4-8.
31. Lio P, Goldman N (1998) Models of molecular evolution and phylogeny. Genome
Res 8: 1233-1244.
32. Bollback JP (2002) Bayesian model adequacy and choice in phylogenetics. Mol
Biol Evol 19: 1171-1180.

73
33. Teichmann SA, Mitchison G (1999) Is there a phylogenetic signal in prokaryote
proteins? J Mol Evol 49: 98-107.
34. Doolittle WF (1999) Phylogenetic classification and the universal tree. Science
284: 2124-2129.
35. Thornton JW, DeSalle R (2000) Gene family evolution and homology: genomics
meets phylogenetics. Annu Rev Genomics Hum Genet 1: 41-73.
36. Kishino H, Hasegawa M (1989) Evaluation of the maximum likelihood estimate of
the evolutionary tree topologies from DNA sequence data, and the branching order
in hominoidea. J Mol Evol 29: 170-179.
37. Coyne MJ, Weinacht KG, Krinos CM, Comstock LE (2003) Mpi recombinase
globally modulates the surface architecture of a human commensal bacterium. Proc
Natl Acad Sci U S A 100: 10446-10451.
38. Kuwahara T, Yamashita A, Hirakawa H, Nakayama H, Toh H, et alet al. (2004)
Genomic analysis of Bacteroides fragilis reveals extensive DNA inversions
regulating cell surface adaptation. Proc Natl Acad Sci U S A 101: 14919-14924.
39. Xu J, Bjursell MK, Himrod J, Deng S, Carmichael LK, et alet al. (2003) A genomic
view of the human-Bacteroides thetaiotaomicron symbiosis. Science 299: 2074-
2076.
40. Daubin V, Ochman H (2004) Quartet mapping and the extent of lateral transfer in
bacterial genomes. Mol Biol Evol 21: 86-89.
41. Ge F, Wang LS, Kim J (2005) The cobweb of life revealed by genome-scale
estimates of horizontal gene transfer. PLoS Biol 3: e316.
42. Planet PJ, Sarkar IN (2005) mILD: a tool for constructing and analyzing matrices
of pairwise phylogenetic character incongruence tests. Bioinformatics 21: 4423-
4424.

74
43. Lawrence JG, Ochman H (2002) Reconciling the many faces of lateral gene transfer.
Trends Microbiol 10: 1-4.
44. Fitch WM (1970) Distinguishing homologous from analogous proteins. Syst Zool
20: 406-416.
45. Hooper SD, Berg OG (2003) Duplication is more common among laterally
transferred genes than among indigenous genes. Genome Biol 4: R48.
46. Kunin V, Ouzounis CA (2003) GeneTRACE-reconstruction of gene content of
ancestral species. Bioinformatics 19: 1412-1416.
47. Daubin V, Ochman H (2004) Bacterial genomes as new gene homes: the genealogy
of ORFans in E. coli. Genome Res 14: 1036-1042.
48. Brooks DR (1981) Hennig’s parasitological method: a proposed solution. Syst Zool
30: 229-249.
49. Berg OG, Kurland CG (2002) Evolution of microbial genomes: sequence acquisition
and loss. Mol Biol Evol 19: 2265-2276.
50. Sonnenburg ED, Sonnenburg JL, Manchester JK, Hansen EE, Chiang HC, et alet al.
(2006) A hybrid two-component system protein of a prominent human gut symbiont
couples glycan sensing in vivo to carbohydrate metabolism. Proc Natl Acad Sci U
S A 103: 8834-8839.
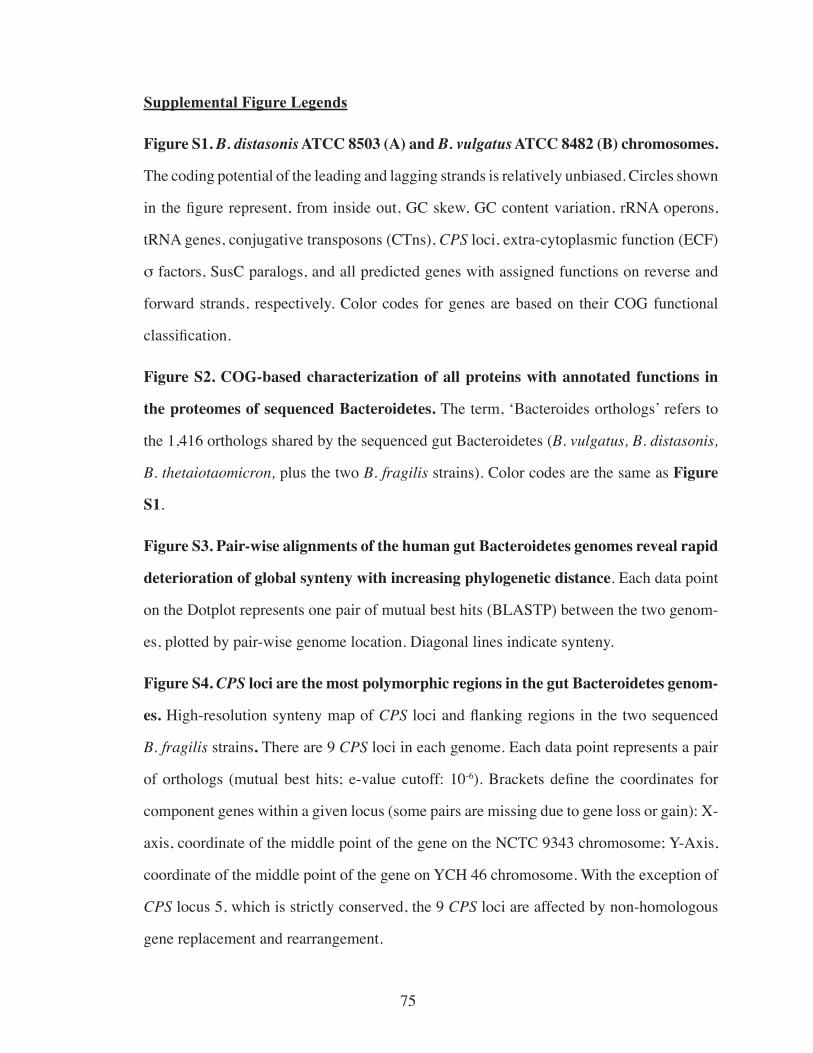
75
Supplemental Figure Legends
Figure S1. B..distasonis ATCC 8503 (A) and B..vulgatus ATCC 8482 (B) chromosomes.
The coding potential of the leading and lagging strands is relatively unbiased. Circles shown
in the figure represent, from inside out, GC skew, GC content variation, rRNA operons,
tRNA genes, conjugative transposons (CTns), CPS loci, extra-cytoplasmic function (ECF)
σ factors, SusC paralogs, and all predicted genes with assigned functions on reverse and
forward strands, respectively. Color codes for genes are based on their COG functional
classification.
Figure S2. COG-based characterization of all proteins with annotated functions in
the proteomes of sequenced Bacteroidetes. The term, ‘Bacteroides orthologs’ refers to
the 1,416 orthologs shared by the sequenced gut Bacteroidetes (B. vulgatus, B. distasonis,
B. thetaiotaomicron, plus the two B. fragilis strains). Color codes are the same as Figure
S1.
Figure S3. Pair-wise alignments of the human gut Bacteroidetes genomes reveal rapid
deterioration of global synteny with increasing phylogenetic distance. Each data point
on the Dotplot represents one pair of mutual best hits (BLASTP) between the two genom-
es, plotted by pair-wise genome location. Diagonal lines indicate synteny.
Figure S4. CPS loci are the most polymorphic regions in the gut Bacteroidetes genom-
es. High-resolution synteny map of CPS loci and flanking regions in the two sequenced
B. fragilis strains. There are 9 CPS loci in each genome. Each data point represents a pair
of orthologs (mutual best hits; e-value cutoff: 10-6). Brackets define the coordinates for
component genes within a given locus (some pairs are missing due to gene loss or gain): X-
axis, coordinate of the middle point of the gene on the NCTC 9343 chromosome; Y-Axis,
coordinate of the middle point of the gene on YCH 46 chromosome. With the exception of
CPS locus 5, which is strictly conserved, the 9 CPS loci are affected by non-homologous
gene replacement and rearrangement.
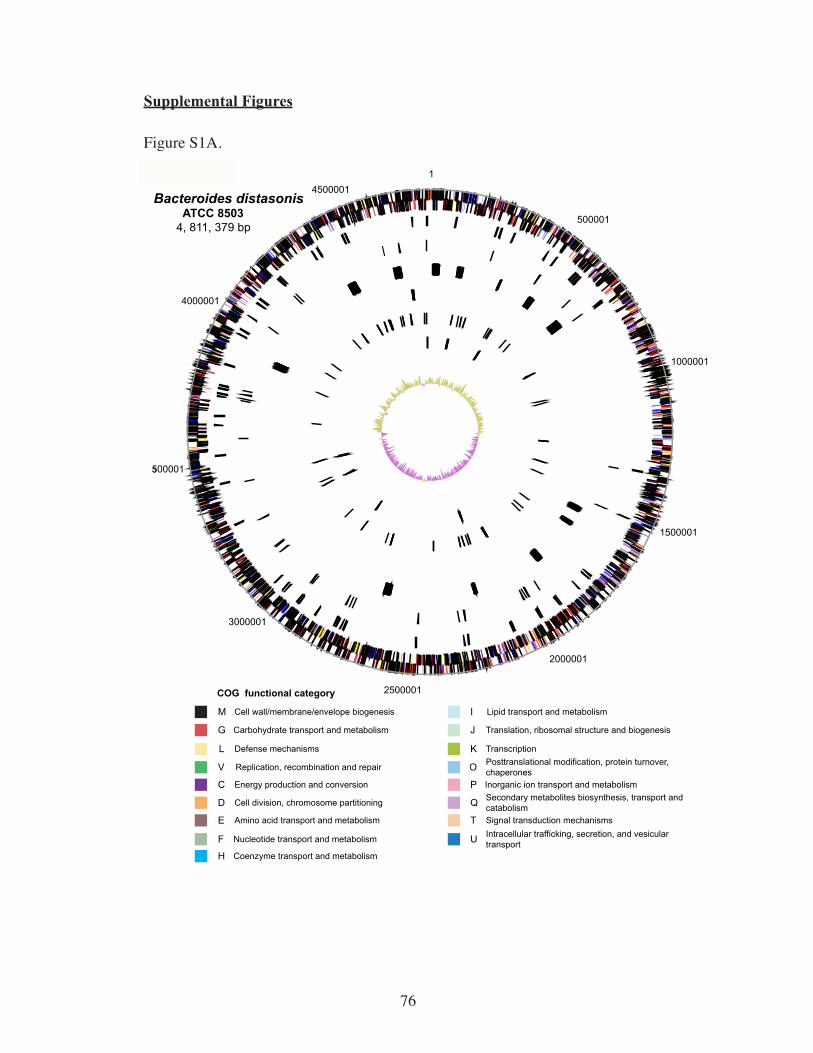
76
Supplemental Figures
Figure S1A.
1
500001
1000001
1500001
2000001
2500001
3000001
3500001
4000001
4500001
Cell wall/membrane/envelope biogenesisM
Carbohydrate transport and metabolismG
L Defense mechanisms
V
Energy production and conversionC
Cell division, chromosome partitioningD
Amino acid transport and metabolismE
Nucleotide transport and metabolismF
Coenzyme transport and metabolismH
Lipid transport and metabolismI
Translation, ribosomal structure and biogenesisJ
TranscriptionKPosttranslational modification, protein turnover, chaperones
O
Inorganic ion transport and metabolismPSecondary metabolites biosynthesis, transport and catabolism
Q
Signal transduction mechanismsTIntracellular trafficking, secretion, and vesicular transport
U
Replication, recombination and repair
COG functional category
FIGURE S1A

77
Figure S1B.

78
Figure S2.

79
Figure S3.

80
Figure S4. 452
FIG
UR
E S
4

81
Supplemental Table Legends
Table S1. Comparison of genome parameters for B..distasonis.ATCC 8503, B..vulgatus
ATCC 8482,.B..thetaiotaomicron.ATCC 29148, B..fragilis NCTC 9343 and B..fragilis.
YCH 46. ‘*’, the numbers of SusC/SusD homologs provided are based on BLASTP e-
value ≤10-20; the numbers shown in parentheses are based on criteria described in SusC/
SusD alignments in Materials and Methods. See http://gordonlab.wustl.edu/BvBd.html
for complete lists of SusC/SusD homologs. A hybrid two-component system protein con-
tains all of the domains present in classical two-component systems but in one polypeptide
[50].
Table S2. Shared orthologs in B..distasonis.ATCC 8503, B..vulgatus ATCC 8482, B..
thetaiotaomicron ATCC 29148, and B..fragilis strains NCTC 9343 and YCH 46. For an
explanation of COG-based functional codes, see Figure S1.
Table S3. Glycoside hydrolases found in B..distasonis.ATCC 8503, B..vulgatus ATCC
8482, B..thetaiotaomicron.ATCC 29148.and B..fragilis.strains NCTC 9343 and YCH 46.
The classification scheme used is described in the Carbohydrate-Active enZYme (CAZy)
database.
Table S4. List of putative xenologs in B..distasonis.ATCC 8503 (A), B..vulgatus ATCC
8482 (B), B..thetaiotaomicron ATCC 29148 (C), B..fragilis NCTC 9343 (D), and B..fra-
gilis.YCH 46 (E). For an explanation of COG-based functional codes, see Figure S1. The
lateral gene transfer (LGT) column defines the predicted evolutionary history of the coding
sequence: LGT-in, laterally transferred into the genome; LGT-out, laterally transferred out
of the genome; LGT-unresolved, laterally transferred but direction unknown. See Materi-
als and Methods for detailed explanations.
Table S5. CPS loci of B..distasonis.ATCC 8503 (A), B..vulgatus ATCC 8482 (B), B..
thetaiotaomicron.ATCC 29148 (C), B.. fragilis NCTC 9343 (D) and B.. fragilis.YCH
46 (E). Shown are Gene ID, annotated function, GC content (%) and the predicted evolu-

82
tionary history of the coding sequence. Code: NOVEL, no homologs found in any other
genomes in public databases; NO, not laterally transferred; UNRESOLVED, whether lat-
erally transferred or not is not resolved; LGT-in, laterally transferred into the genome;
LGT-out, laterally transferred out of the genome; LGT-unresolved, laterally transferred but
direction unknown. See Materials and Methods for detailed explanations. Color codes
are the same as in Figure 4B.
Table S6. CPS loci are among the most polymorphic regions in.the two B..fragilis.ge-
nomes. The P value is based on the tail probability of a binomial distribution. Gene loss/
gain events (3,531 in total) are counted as the difference between the total number of genes
and the total number of genes shared between the two genomes.
Table S7. ECF-σ factor-containing polysaccharide utilization gene clusters in B..dis-
tasonis.ATCC 8503 (A) and B..vulgatus ATCC 8482 (B). The three columns represent
Gene ID, functional annotation and predicted evolutionary history of the gene (labeled as
in Table S5).

83
Supplemental Tables
Table S1
Fea
ture
B.
dis
taso
nis
AT
CC
8503
B.
vulg
atu
s A
TC
C
8482
B.
thet
aio
taom
icro
n
AT
CC
29148
B.
fra
gil
is N
CT
C
93
43
B.
fra
gil
is Y
CH
46
Gen
om
e si
ze (
bp
)4,8
11,3
79
5,1
63,1
89
6,2
60,3
61
5,2
05
,14
05
,27
7,2
74
G +
C (
%)
45.1
42.2
42.8
43
.24
3.3
Pro
tein
cod
ing
(%
)90.3
89.1
89.5
89
.39
0.1
Gen
e d
ensi
ty (
no
. o
f C
DS
per
Kb
)0.8
04
0.7
92
0.7
63
0.8
18
0.8
67
Av
erag
e C
DS
len
gth
(b
p)
1,1
23
1,1
26
1,1
73
1,0
91
1,0
39
Pro
tein
-co
din
g g
enes
(n
o.)
3,8
67
4,0
88
4,7
78
4,1
89
4,5
78
CD
S w
ith
fu
nct
ion
al a
ssig
nm
ent
2,4
27
2,5
05
2,7
09
2,7
53
2,9
59
CD
S w
ith
ou
t fu
nct
ion
al a
sig
nm
ent
1,4
40
1,5
83
2,0
69
1,4
36
1,6
19
con
serv
ed h
yp
oth
etic
al p
rote
in1,0
05
1,1
23
1,5
32
85
89
50
hy
po
thet
ical
pro
tein
435
460
537
57
86
69
Rib
oso
mal
RN
A l
oci
77
56
6
Tra
nsf
er R
NA
s83
85
71
73
74
Co
nju
gat
ive
tran
spo
son
s1
44
22
Tra
nsp
osa
ses
61
121
109
47
60
Ph
ages
53
52
4
Gly
cosi
de
hy
dro
lase
s (G
H)
97
159
226
12
61
32
Po
lysa
cch
arid
e ly
ases
(P
L)
07
15
11
Gly
cosy
ltra
nsf
eras
es (
GT
)78
76
85
79
81
Su
sC h
om
olo
gs*
63 (
60)
89 (
86)
107 (
107)
88
(8
8)
77
(7
7)
Su
sD h
om
olo
gs*
48 (
54)
74 (
80)
57 (
102)
48
(7
1)
47
(6
5)
EC
F-σ
fac
tors
36
41
50
42
41
An
ti-σ
fac
tors
23
21
25
25
25
Hy
bri
d t
wo
-co
mp
on
ent
syst
ems
722
32
14
12
Ta
ble
S1
. C
om
pari
son
of
gen
om
e p
ara
met
ers
for
B.
dis
taso
nis
AT
CC
8503,
B.
vulg
atu
s A
TC
C 8
48
2,
B.
thet
aio
tao
mic
ron
AT
CC
29
14
8, B
. fr
agil
is N
CT
C 9
343 a
nd
B.
fragil
is Y
CH
46.
Leg
end
: ‘*
’, t
he
num
ber
s of
SusC
/SusD
hom
olo
gs
pro
vid
ed a
re b
ased
on B
LA
ST
P e
-val
ue ≤
10
-20;
the
nu
mb
ers
sho
wn
in
par
enth
eses
are
bas
ed o
n c
rite
ria
des
crib
ed i
n S
usC
/SusD
ali
gnm
ents
in M
ate
rials
an
d M
eth
od
s. S
ee h
ttp:/
/gord
on
lab
.wu
stl.
edu
/Bv
Bd
.htm
l fo
r
com
ple
te l
ists
of
SusC
/SusD
hom
olo
gs.
A h
ybri
d t
wo-c
om
ponen
t sy
stem
pro
tein
conta
ins
all
of
the
do
mai
ns
pre
sen
t in
cla
ssic
al t
wo
-
com
po
nen
t sy
stem
s but
in o
ne
poly
pep
tide
(Xu, et
al,
Sci
ence
299:2
074-6
, 2003).
1 o
f 1

84
Table S2.
Please access provided CD for this information.

85
Table S3.
Family IDB. distasonis ATCC
8503B. vulgatus ATCC 8482
B. thetaiotaomicron
ATCC 29148B. fragilis NCTC 9343 B. fragilis YCH 46
Glycosidases and Transglycosidases
2 11 25 33 15 16
3 8 5 10 10 10
5 0 2 1 1 1
10 0 1 0 0 0
13 9 4 7 6 6
15 1 1 0 0 0
16 1 1 3 6 6
18 0 2 7 2 2
20 6 9 14 12 13
23 3 3 3 3 3
24 1 2 0 0 1
25 0 1 1 1 1
26 1 0 0 2 2
27 0 1 5 3 3
28 1 13 9 0 0
29 1 10 9 9 9
30 2 2 2 0 0
31 1 4 6 4 4
32 1 1 4 2 2
33 1 3 1 3 3
35 1 1 3 4 4
36 2 2 3 3 3
38 1 0 2 1 1
42 0 1 1 0 0
43 7 22 32 9 9
51 3 3 4 2 2
53 0 0 1 0 0
57 1 1 1 1 1
63 1 2 0 0 1
65 0 0 0 1 1
66 0 0 1 0 0
67 0 1 1 0 0
73 3 1 1 1 2
76 1 0 10 3 3
77 1 1 1 1 1
78 7 5 6 2 2
84 1 1 1 1 1
88 0 3 4 1 1
89 0 1 3 1 1
92 14 9 23 8 9
93 0 0 1 0 0
95 1 4 5 4 4
97 3 9 10 4 4
99 0 0 1 0 0
Unclassified 2 2 0 0 0
Sub-total 97 159 226 126 132
Polysaccharide Lyases
1 0 1 5 0 0
4 0 1 0 0 0
8 0 0 3 1 1
9 0 2 2 0 0
10 0 1 1 0 0
11 0 2 1 0 0
12 0 0 2 0 0
13 0 0 1 0 0
Sub-total 0 7 15 1 1
Table S3. Glycoside hydrolases found in B. distasonis ATCC 8503, B. vulgatus ATCC 8482, B. thetaiotaomicron
ATCC 29148 and B. fragilis strains NCTC 9343 and YCH 46.
Legend: The classification scheme used is described in the Carbohydrate-Active Enzymes database (CAZy) at
http://afmb.cnrs-mrs.fr/CAZY/.
1 of 1

86
Table S4.
Please access provided CD for this information.

87
Table S5
Please access provided CD for this information.

88
Table S6
Table S6. CPS loci are among the most polymorphic regions in the two B. fragilis genomes.
B. fragilis NCTC 9343 B. fragilis YCH 46
Number of genes in genome 4189 4578
Number of genes in CPS loci 170 204
Number of gene loss/gain events 658 1047
Number of gene loss/gain events in CPS loci 77 109
Probability 8.8E-20 3.3E-21
Legend: The probability value is based on the tail probability of a binomial distribution. Gene loss/gain events are counted as
the difference between the total number of genes in a given strain and the total number of genes shared between the two strains
(3,531 in total).
1 of 1

89
Table S7
Cluster 1
Bd0229 putative RNA polymerase ECF-type sigma factor UNRESOLVED
Bd0230 putative anti-sigma factor UNRESOLVED
Bd0231 putative outer membrane protein, probably involved in nutrient binding NO
Bd0232 putative outer membrane protein probably involved in nutrient binding UNRESOLVED
Bd0233 conserved hypothetical protein NO
Bd0234 glycoside hydrolase family 38, distantly related to alpha-mannosidases NO
Bd0235 putative sodium-dependent transporter NO
Bd0236 helicase domain protein LGT-in
Bd0237 conserved hypothetical protein LGT-in
Bd0238 conserved hypothetical protein LGT-in
Bd0239 putative exonuclease NOVEL
Bd0240 conserved hypothetical protein NO
Bd0241 putative acetyltransferase NOVEL
Cluster 2
Bd1126c two-component system sensor histidine kinase NO
Bd1127c conserved hypothetical protein UNRESOLVED
Bd1128c probable NADH-dependent dehydrogenase NO
Bd1129c oxidoreductase, Gfo/Idh/MocA family NO
Bd1130c putative arylsulfatase NO
Bd1131c putative outer membrane protein, probably involved in nutrient binding NO
Bd1132c putative outer membrane protein, probably involved in nutrient binding NO
Bd1133c putative anti-sigma factor NO
Bd1134c putative RNA polymerase ECF-type sigma factor NO
Cluster 3
Bd1642c mucin-desulfating sulfatase NO
Bd1643c arylsulfatase A LGT-unresolved
Bd1644c putative outer membrane protein, probably involved in nutrient binding NO
Bd1645c putative outer membrane protein, probably involved in nutrient binding NO
Bd1646c putative anti-sigma factor NO
Bd1647 conserved hypothetical protein NO
Bd1648c RNA polymerase ECF-type sigma factor NO
Cluster 4
Bd2026 RNA polymerase ECF-type sigma factor NO
Bd2027 putative anti-sigma factor NO
Bd2028 putative outer membrane protein probably involved in nutrient binding NO
Bd2029 putative outer membrane protein probably involved in nutrient binding NO
Bd2030 putative sulfatase NO
Bd2031 arylsulfatase A UNRESOLVED
Bd2032 putative aminotransferase NO
Bd2033 peptidyl-prolyl cis-trans isomerase SlyD, FKBP-type NO
Bd2034 chorismate synthase NO
Bd2035 putative multidrug resistance protein LGT-in
Cluster 5
Bd2259c conserved hypothetical protein NO
Bd2260c arylsulfatase A LGT-in
Bd2261c putative outer membrane protein probably involved in nutrient binding NO
Bd2262c putative outer membrane protein probably involved in nutrient binding NO
(A). ECF-σ factor-containing polysaccharide utilization gene clusters in B. distasonis ATCC 8503
Table S7. ECF-σ factor-containing polysaccharide utilization gene clusters in B. distasonis ATCC
8503 (A) and B. vulgatus ATCC 8482 (B).
1 of 8

90
Bd2263c putative anti-sigma factor NO
Bd2264c RNA polymerase ECF-type sigma factor NO
Cluster 6
Bd2265c putative secreted sulfatase precursor UNRESOLVED
Bd2266c arylsulfatase A UNRESOLVED
Bd2267c arylsulfatase A LGT-unresolved
Bd2268c conserved hypothetical protein, probably involved in nutrient binding NO
Bd2269c putative outer membrane protein, probably involved in nutrient binding NO
Bd2270c putative anti-sigma factor NO
Bd2271c RNA polymerase ECF-type sigma factor NO
Cluster 7
Bd2277c putative 1-acyl-sn-glycerol-3-phosphate acyltransferase NO
Bd2278c glycoside hydrolase family 92, related to an ill-defined alpha-1,2-mannosidase UNRESOLVED
Bd2279c putative outer membrane protein, probably involved in nutrient binding NO
Bd2280c putative outer membrane protein, probably involved in nutrient binding UNRESOLVED
Bd2281c putative anti-sigma factor NO
Bd2282 RNA polymerase ECF-type sigma factor UNRESOLVED
Cluster 8
Bd2405c hypothetical protein NOVEL
Bd2406c conserved hypothetical protein LGT-unresolved
Bd2407c conserved hypothetical protein UNRESOLVED
Bd2408c glycoside hydrolase family 28, related to polygalacturonases UNRESOLVED
Bd2409c putative outer membrane protein, probably involved in nutrient binding UNRESOLVED
Bd2410c putative outer membrane protein, probably involved in nutrient binding UNRESOLVED
Bd2411c putative anti-sigma factor UNRESOLVED
Bd2412c RNA polymerase ECF-type sigma factor UNRESOLVED
Cluster 9
Bd2413c putative dehydrogenase NO
Bd2414c putative glycosylhydrolase (putative secreted protein) UNRESOLVED
Bd2415c putative outer membrane protein, probably involved in nutrient binding NO
Bd2416c putative outer membrane protein, probably involved in nutrient binding NO
Bd2417c putative anti-sigma factor NO
Bd2418 RNA polymerase ECF-type sigma factor NO
Cluster 10
Bd3036 RNA polymerase ECF-type sigma factor UNRESOLVED
Bd3037 putative anti-sigma factor UNRESOLVED
Bd3038 putative outer membrane protein probably involved in nutrient binding NO
Bd3039 putative outer membrane protein, probably involved in nutrient binding UNRESOLVED
Bd3040 conserved hypothetical protein with endonuclease/exonuclease/phosphatase
family domain
UNRESOLVED
Bd3041 conserved hypothetical protein with endonuclease/exonuclease/phosphatase
family domain
NO
Cluster 11
Bd3042 RNA polymerase ECF-type sigma factor UNRESOLVED
Bd3043 putative anti-sigma factor NO
Bd3044 putative outer membrane protein probably involved in nutrient binding NO
Bd3045 putative outer membrane protein probably involved in nutrient binding NO
Bd3046 conserved hypothetical protein LGT-in
Bd3047 hypothetical protein NOVEL
Bd3048 glycoside hydrolase family 2, candidate beta-glycosidase UNRESOLVED
Bd3049c glycoside hydrolase family 2, candidate beta-glycosidase NO
Bd3050 conserved hypothetical protein NO
Bd3051 putative transmembrane protein UNRESOLVED
2 of 8
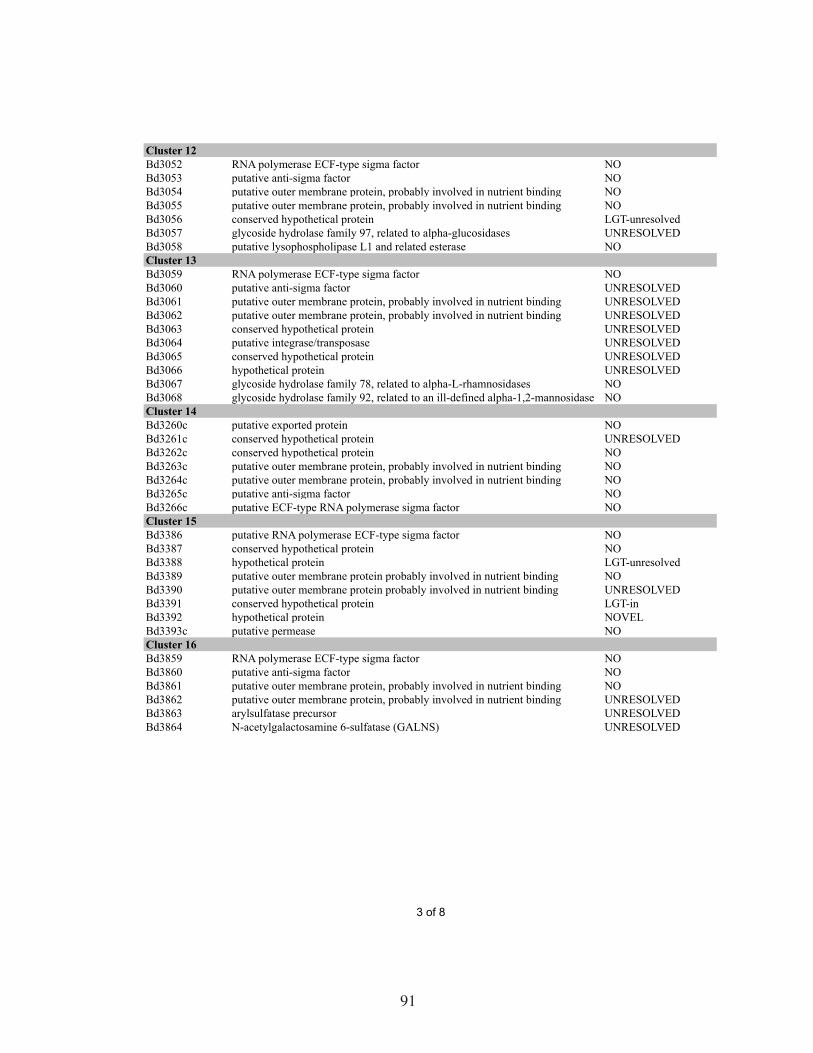
91
Cluster 12
Bd3052 RNA polymerase ECF-type sigma factor NO
Bd3053 putative anti-sigma factor NO
Bd3054 putative outer membrane protein, probably involved in nutrient binding NO
Bd3055 putative outer membrane protein, probably involved in nutrient binding NO
Bd3056 conserved hypothetical protein LGT-unresolved
Bd3057 glycoside hydrolase family 97, related to alpha-glucosidases UNRESOLVED
Bd3058 putative lysophospholipase L1 and related esterase NO
Cluster 13
Bd3059 RNA polymerase ECF-type sigma factor NO
Bd3060 putative anti-sigma factor UNRESOLVED
Bd3061 putative outer membrane protein, probably involved in nutrient binding UNRESOLVED
Bd3062 putative outer membrane protein, probably involved in nutrient binding UNRESOLVED
Bd3063 conserved hypothetical protein UNRESOLVED
Bd3064 putative integrase/transposase UNRESOLVED
Bd3065 conserved hypothetical protein UNRESOLVED
Bd3066 hypothetical protein UNRESOLVED
Bd3067 glycoside hydrolase family 78, related to alpha-L-rhamnosidases NO
Bd3068 glycoside hydrolase family 92, related to an ill-defined alpha-1,2-mannosidase NO
Cluster 14
Bd3260c putative exported protein NO
Bd3261c conserved hypothetical protein UNRESOLVED
Bd3262c conserved hypothetical protein NO
Bd3263c putative outer membrane protein, probably involved in nutrient binding NO
Bd3264c putative outer membrane protein, probably involved in nutrient binding NO
Bd3265c putative anti-sigma factor NO
Bd3266c putative ECF-type RNA polymerase sigma factor NO
Cluster 15
Bd3386 putative RNA polymerase ECF-type sigma factor NO
Bd3387 conserved hypothetical protein NO
Bd3388 hypothetical protein LGT-unresolved
Bd3389 putative outer membrane protein probably involved in nutrient binding NO
Bd3390 putative outer membrane protein probably involved in nutrient binding UNRESOLVED
Bd3391 conserved hypothetical protein LGT-in
Bd3392 hypothetical protein NOVEL
Bd3393c putative permease NO
Cluster 16
Bd3859 RNA polymerase ECF-type sigma factor NO
Bd3860 putative anti-sigma factor NO
Bd3861 putative outer membrane protein, probably involved in nutrient binding NO
Bd3862 putative outer membrane protein, probably involved in nutrient binding UNRESOLVED
Bd3863 arylsulfatase precursor UNRESOLVED
Bd3864 N-acetylgalactosamine 6-sulfatase (GALNS) UNRESOLVED
3 of 8

92
Cluster 1
Bv0103c hypothetical protein NOVEL
Bv0104c conserved hypothetical protein, possible ATP/GTP-binding site UNRESOLVED
Bv0105c putative oxidoreductase NO
Bv0106c putative outer membrane protein, probably involved in nutrient binding NO
Bv0107c putative outer membrane protein, probably involved in nutrient binding NO
Bv0108c putative anti-sigma factor NO
Bv0109c RNA polymerase ECF-type sigma factor NO
Cluster 2
Bv0110c putative thiol:disulfide interchange protein DsbE NO
Bv0111c putative thiol:disulfide interchange protein NO
Bv0112c conserved hypothetical protein NO
Bv0113c conserved hypothetical protein NO
Bv0114c putative regulatory protein NO
Bv0115c glycoside hydrolase family 88, candidate delta-4,5 unsaturated glucuronyl hydrolase NO
Bv0116c glycoside hydrolase family 43, candidate beta-xylosidase/alpha-L-arabinofuranosidase NO
Bv0117c glycoside hydrolase family 97, related to alpha-glucosidases NO
Bv0118c conserved hypothetical protein NO
Bv0119c putative beta-lactamase class C and other penicillin binding proteins LGT-in
Bv0120c conserved hypothetical protein NO
Bv0121c glycoside hydrolase family 28, distantly related to polygalacturonases LGT-out
Bv0122c conserved hypothetical protein NO
Bv0123c conserved hypothetical protein NO
Bv0124c glycoside hydrolase family 28, distantly related to polygalacturonases NO
Bv0125c putative outer membrane protein, probably involved in nutrient binding NO
Bv0126c putative outer membrane protein, probably involved in nutrient binding NO
Bv0127c RNA polymerase ECF-type sigma factor NO
Cluster 3
Bv0132c glycoside hydrolase family 92, related to an ill-defined alpha-1,2-mannosidase UNRESOLVED
Bv0133c glycoside hydrolase family 97, related to alpha-glucosidases NO
Bv0134c putative outer membrane protein, probably involved in nutrient binding UNRESOLVED
Bv0135c putative outer membrane protein, probably involved in nutrient binding NO
Bv0136c putative RNA polymerase ECF-type sigma factor UNRESOLVED
Cluster 3
Bv0293c glycoside hydrolase family 2, related to beta-galactosidases UNRESOLVED
Bv0294c glycoside hydrolase family 63, distantly related to alpha-glycosidases UNRESOLVED
Bv0295c putative outer membrane protein, probably involved in nutrient binding UNRESOLVED
Bv0296c putative outer membrane protein, probably involved in nutrient binding NO
Bv0297c putative anti-sigma factor NO
Bv0298c putative RNA polymerase ECF-type sigma factor NO
Cluster 4
Bv0342c histidyl-tRNA synthetase NO
Bv0343c putative ABC transporter, periplasmic sugar-binding protein LGT-in
Bv0344c transposase UNRESOLVED
Bv0345c ABC-type sugar transport system, periplasmic component LGT-in
Bv0346c putative integral membrane protein NO
Bv0347c conserved hypothetical protein LGT-unresolved
Bv0348c glycerol kinase 2 (ATP:glycerol 3-phosphotransferase 2) LGT-unresolved
Bv0349c transketolase, C-terminal subunit LGT-unresolved
Bv0350c transketolase, N-terminal subunit LGT-unresolved
Bv0351c transcriptional regulator of sugar metabolism LGT-in
(B). ECF-σ factor-containing polysaccharide utilization gene clusters in B. vulgatus ATCC 8482
4 of 8

93
Bv0352c 3,4-dihydroxy-2-butanone 4-phosphate synthase (cyclohydrolase II) LGT-unresolved
Bv0353c conserved hypothetical protein LGT-unresolved
Bv0354c two-component system sensor histidine kinase/response regulator, hybrid ('one-
component system')
NO
Bv0355c putative outer membrane protein, probably involved in nutrient binding UNRESOLVED
Bv0356c putative outer membrane protein, probably involved in nutrient binding NO
Bv0357c conserved hypothetical protein, putative anti-sigma factor NO
Bv0358c RNA polymerase ECF-type sigma factor NO
Cluster 5
Bv0377 putative RNA polymerase ECF-type sigma factor NO
Bv0378 putative anti-sigma factor NO
Bv0379 putative outer membrane protein, probably involved in nutrient binding NO
Bv0380 putative outer membrane protein, probably involved in nutrient binding NO
Bv0381 glycoside hydrolase family 2, candidate beta-glycosidase UNRESOLVED
Bv0382 glycoside hydrolase family 20, distantly related to beta-N-acetylhexosaminidases LGT-unresolved
Bv0383 glycoside hydrolase family 2, candidate beta-glycosidase NO
Bv0384 arylsulfatase NO
Bv0385 hypothetical protein LGT-in
Bv0386 NADH-ubiquinone oxidoreductase subunit NOVEL
Bv0387 hypothetical protein NOVEL
Cluster 6
Bv0472c conserved hypothetical protein UNRESOLVED
Bv0473c glycoside hydrolase family 31, candidate alpha-glycosidase; related to beta- NO
Bv0474c putative outer membrane protein, probably involved in nutrient binding NO
Bv0475c putative outer membrane protein, probably involved in nutrient binding NO
Bv0476c two-component system response regulator NO
Bv0477c glycoside hydrolase family 35, candidate beta-glycosidase; related to beta-
galactosidases
NO
Bv0478c glycoside hydrolase family 51, related to alpha-L-arabinofuranosidases NO
Bv0479c glycoside hydrolase family 43, modular protein with N-terminal domain distantly
related to beta-glycosidases and C-terminal related to beta-xylosidases/alpha-L-
arabinofuranosidases
UNRESOLVED
Bv0480c glycoside hydrolase family 30, candidate beta-glycosidase NO
Bv0481c putative outer membrane protein, probably involved in nutrient binding NO
Bv0482c putative outer membrane protein, probably involved in nutrient binding NO
Bv0483c putative anti-sigma factor NO
Bv0484c putative RNA polymerase ECF-type sigma factor NO
Cluster 7
Bv0593c putative oxidoreductase NO
Bv0594c conserved hypothetical protein NO
Bv0595c putative signal transducer NO
Bv0596c conserved hypothetical protein NO
Bv0597c exo-alpha sialidase NO
Bv0598c conserved hypothetical protein NO
Bv0599c glycoside hydrolase family 18, related to chitinases NO
Bv0600c conserved hypothetical protein NO
Bv0601c putative outer membrane protein, probably involved in nutrient binding NO
Bv0602c glycoside hydrolase family 97, related to alpha-glucosidases NO
Bv0603c putative endonuclease/exonuclease/phosphatase family protein NO
Bv0604c conserved hypothetical protein NO
Bv0605c putative outer membrane protein, probably involved in nutrient binding NO
Bv0606c glycoside hydrolase family 92, related to an ill-defined alpha-1,2-mannosidase NO
Bv0607c glycoside hydrolase family 92, related to an ill-defined alpha-1,2-mannosidase NO
5 of 8

94
Bv0608c putative anti-sigma factor NO
Bv0609c RNA polymerase ECF-type sigma factor NO
Cluster 8
Bv0709c hypothetical protein NOVEL
Bv0710c conserved hypothetical protein NO
Bv0711c conserved hypothetical protein LGT-in
Bv0712c putative outer membrane protein, probably involved in nutrient binding NO
Bv0713c putative outer membrane protein, probably involved in nutrient binding NO
Bv0714c putative anti-sigma factor NO
Bv0715c RNA polymerase ECF-type sigma factor NO
Bv0716c glycoside hydrolase family 36, candidate alpha-glycosidase; related to alpha-
galactosidases
NO
Cluster 9
Bv0915c RNA polymerase ECF-type sigma factor NO
Bv0916 putative anti-sigma factor NO
Bv0917 putative outer membrane protein, probably involved in nutrient binding NO
Bv0918 putative outer membrane protein, probably involved in nutrient binding UNRESOLVED
Bv0919 conserved hypothetical protein NO
Bv0920 conserved hypothetical protein NO
Bv0921 putative oxidoreductase (putative secreted protein) LGT-unresolved
Cluster 10
Bv1025 RNA polymerase ECF-type sigma factor NO
Bv1026 putative anti-sigma factor NOVEL
Bv1027 putative outer membrane protein, probably involved in nutrient binding NO
Bv1028 hypothetical protein NO
Bv1029c erythronate-4-phosphate dehydrogenase NO
Bv1030 glycosyltransferase family 9, related to glycosyltransferases NO
Bv1031 putative acetyltransferase NO
Bv1032 putative LPS biosynthesis related UDP-galactopyranose mutase NO
Bv1033 conserved hypothetical protein NO
Bv1034 conserved hypothetical protein UNRESOLVED
Bv1035 glycosyltransferase family 2, related to beta-glycosyltransferases NO
Bv1036 glycosyltransferase family 2, distantly related to beta-glycosyltransferases UNRESOLVED
Bv1037 glycosyltransferase family 14, related to beta-glycosyltransferases NO
Bv1038 glycosyltransferase family 4, related to alpha-glycosyltransferases NO
Cluster 11
Bv1124 putative ECF sigma factor NO
Bv1125 putative membrane protein NO
Bv1126 putative outer membrane protein, probably involved in nutrient binding NO
Bv1127 putative outer membrane protein, probably involved in nutrient binding NO
Bv1128 sulfatase LGT-unresolved
Bv1129 arylsulfatase precursor NO
Bv1130 putative ATP-binding ABC transporter protein NO
Cluster 12
Bv1663c RNA polymerase ECF-type sigma factor NO
Bv1664 putative anti-sigma factor NO
Bv1665 putative outer membrane protein, probably involved in nutrient binding NO
Bv1666 putative outer membrane protein, probably involved in nutrient binding UNRESOLVED
Bv1667 glycerophosphoryl diester phosphodiesterase NO
Cluster 13
Bv1721c glycoside hydrolase family 28, related to polygalacturonases UNRESOLVED
Bv1722c glycoside hydrolase family 2, candidate beta-glycosidase NO
Bv1723c glycoside hydrolase family 28, related to polygalacturonases UNRESOLVED
6 of 8

95
Bv1724 hypothetical protein NOVEL
Bv1725c iduronate 2-sulfatase precursor NO
Bv1726c putative outer membrane protein, probably involved in nutrient binding NO
Bv1727c putative outer membrane protein, probably involved in nutrient binding NO
Bv1728c putative anti-sigma factor NO
Bv1729 RNA polymerase ECF-type sigma factor NO
Cluster 14
Bv1733 putative ECF-type RNA polymerase sigma factor NO
Bv1734 putative anti-sigma factor NO
Bv1735 putative outer membrane protein, probably involved in nutrient binding NO
Bv1736 putative outer membrane protein, probably involved in nutrient binding NO
Bv1737 conserved hypothetical protein NO
Bv1738 conserved hypothetical protein NO
Bv1739 glycoside hydrolase family 2, candidate beta-glycosidase UNRESOLVED
Bv1740 hypothetical protein NOVEL
Bv1741 glycoside hydrolase family 78, distantly related to alpha-L-rhamnosidases UNRESOLVED
Bv1742 two-component system response regulator NO
Bv1743 aldehyde dehydrogenase A LGT-unresolved
Bv1744 glycoside hydrolase family 43, related to beta-xylosidases/alpha-L- NO
Bv1745 conserved hypothetical protein NO
Bv1746 conserved hypothetical protein NO
Bv1747 conserved hypothetical protein NO
Cluster 15
Bv1758 putative RNA polymerase ECF-type sigma factor NO
Bv1759 putative anti-sigma factor NO
Bv1760 putative outer membrane protein, probably involved in nutrient binding NO
Bv1761 putative outer membrane protein, probably involved in nutrient binding NO
Bv1762 glycoside hydrolase family 2, candidate beta-glycosidase LGT-out
Bv1763 glycoside hydrolase family 2, candidate beta-glycosidase NO
Bv1764 glycoside hydrolase family 31, candidate alpha-glycosidase UNRESOLVED
Bv1765 conserved hypothetical protein UNRESOLVED
Bv1766c putative pectin degradation protein LGT-in
Bv1767 polysaccharide lyase family 10, related to pectate lyases LGT-in
Bv1768 conserved hypothetical protein NO
Bv1769 carbohydrate esterase family 8, modular protein with N-terminal domain distantly
related to pectin acetylesterases and C-terminal domain related to pectin
methylesterases
NO
Bv1770 two-component system sensor histidine kinase/response regulator, hybrid ('one-
component system')
NO
Bv1771 hypothetical protein NO
Bv1772 dipeptidyl peptidase IV NO
Cluster 16
Bv1927c putative thiol-disulfide oxidoreductase UNRESOLVED
Bv1928c putative disulphide-isomerase NO
Bv1929c putative outer membrane protein, probably involved in nutrient binding UNRESOLVED
Bv1930c putative outer membrane protein, probably involved in nutrient binding UNRESOLVED
Bv1931c putative anti-sigma factor NO
Bv1932c RNA polymerase ECF-type sigma factor UNRESOLVED
Bv1933c glycoside hydrolase family 43, candidate beta-xylosidase/alpha-L-arabinofuranosidase NO
Bv1934c conserved hypothetical protein NO
Bv1935c glycoside hydrolase family 28, related to polygalacturonases NO
Cluster 17
Bv1972 RNA polymerase ECF-type sigma factor NO
7 of 8
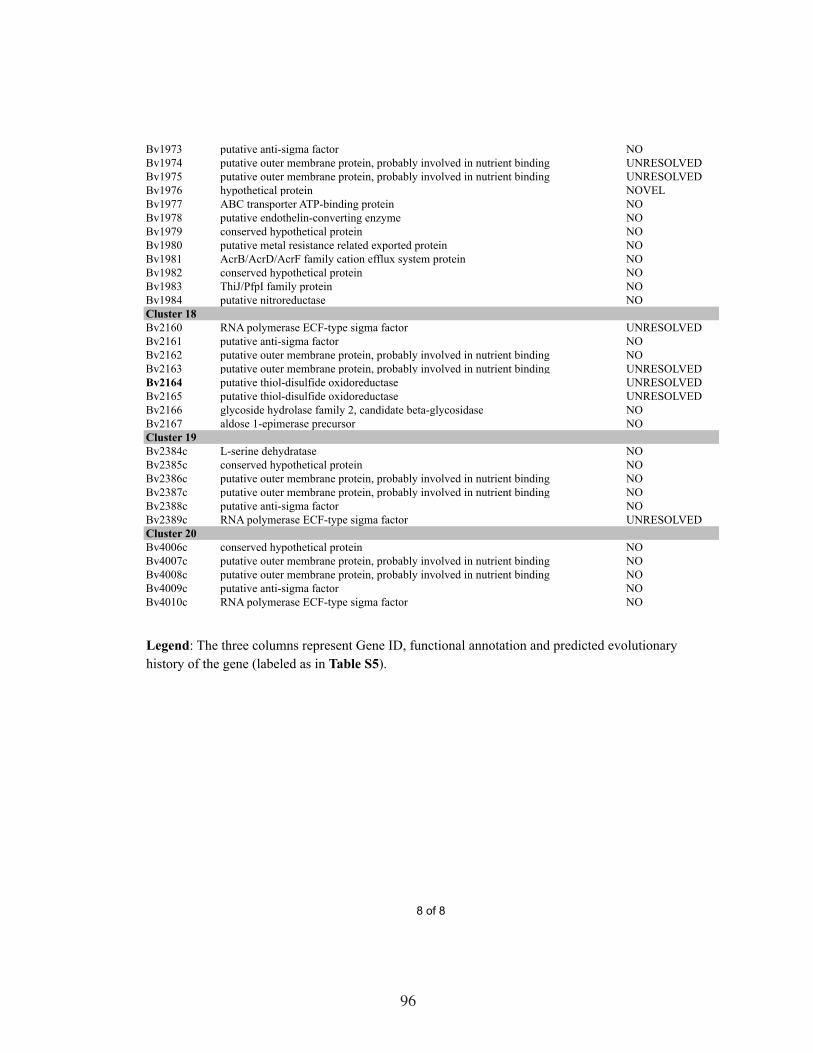
96
Bv1973 putative anti-sigma factor NO
Bv1974 putative outer membrane protein, probably involved in nutrient binding UNRESOLVED
Bv1975 putative outer membrane protein, probably involved in nutrient binding UNRESOLVED
Bv1976 hypothetical protein NOVEL
Bv1977 ABC transporter ATP-binding protein NO
Bv1978 putative endothelin-converting enzyme NO
Bv1979 conserved hypothetical protein NO
Bv1980 putative metal resistance related exported protein NO
Bv1981 AcrB/AcrD/AcrF family cation efflux system protein NO
Bv1982 conserved hypothetical protein NO
Bv1983 ThiJ/PfpI family protein NO
Bv1984 putative nitroreductase NO
Cluster 18
Bv2160 RNA polymerase ECF-type sigma factor UNRESOLVED
Bv2161 putative anti-sigma factor NO
Bv2162 putative outer membrane protein, probably involved in nutrient binding NO
Bv2163 putative outer membrane protein, probably involved in nutrient binding UNRESOLVED
Bv2164 putative thiol-disulfide oxidoreductase UNRESOLVED
Bv2165 putative thiol-disulfide oxidoreductase UNRESOLVED
Bv2166 glycoside hydrolase family 2, candidate beta-glycosidase NO
Bv2167 aldose 1-epimerase precursor NO
Cluster 19
Bv2384c L-serine dehydratase NO
Bv2385c conserved hypothetical protein NO
Bv2386c putative outer membrane protein, probably involved in nutrient binding NO
Bv2387c putative outer membrane protein, probably involved in nutrient binding NO
Bv2388c putative anti-sigma factor NO
Bv2389c RNA polymerase ECF-type sigma factor UNRESOLVED
Cluster 20
Bv4006c conserved hypothetical protein NO
Bv4007c putative outer membrane protein, probably involved in nutrient binding NO
Bv4008c putative outer membrane protein, probably involved in nutrient binding NO
Bv4009c putative anti-sigma factor NO
Bv4010c RNA polymerase ECF-type sigma factor NO
Legend: The three columns represent Gene ID, functional annotation and predicted evolutionary
history of the gene (labeled as in Table S5).
8 of 8

97
Chapter 3
Characterizing a model human gut microbiota composed of members of its two dominant phyla

98
Chapter 3
Michael A. Mahowald1, Federico E. Rey1, Henning Seedorf1, Robert S. Fulton2, Aye Wol-
lam2, Neha Shah2, Chunyan Wang2, Vincent Magrini2, Richard K. Wilson2, Brandi L. Can-
tarel3,4, Pedro M. Coutinho3, Bernard Henrissat3,4, Lara W. Crock1, Alison Russell5, Nathan
C. Verberkmoes5, Robert L. Hettich5, and Jeffrey I. Gordon1
1Center for Genome Sciences, 2Genome Sequencing Center, Washington University School
of Medicine, St. Louis, MO 63108
3Universités Aix-Marseille I and II, Marseille, France and 4CNRS, UMR6098, Marseille,
France, 5Organic and Biological Mass Spectrometry Group, Oak Ridge National Labora-
tory, Oak Ridge, TN 37830
Correspondence to: [email protected]
Key words: human gut Firmicutes and Bacteroidetes; gut microbiome; gnotobiotic mice; func-
tional genomics and proteomics; carbohydrate metabolism; nutrient sharing
Eubacterium rectale ATCC 33656 and Eubacterium eligens ATCC 27750 genome sequences have
been deposited in GenBank under accession numbers CP001107 and CP001104-CP001106, re-
spectively.
99
Abstract
The adult human gut microbial community is dominated by two bacterial phyla, the Firmi-
cutes and the Bacteroidetes. Little is known about the factors that govern the interactions
between their members. We have examined the niches (professions) of representatives of
both phyla in vivo. Finished genome sequences were generated from E. rectale and E. eli-
gens, which belong to Clostridium Cluster XIVa, one of the most common gut Firmicute
clades. Comparison of these and 16 other gut Firmicutes to gut Bacteroidetes indicated that
the former possess smaller genomes and a disproportionately smaller number of glycan-
degrading enzymes. Germ-free mice were then colonized with E. rectale and/or a promi-
nent human gut Bacteroidetes, Bacteroides thetaiotaomicron, followed by whole genome
transcriptional profiling of both organisms in their distal gut (cecal) habitat, high resolution
proteomic analyses of their cecal contents, and biochemical assays of their metabolism. B.
thetaiotaomicron adapts to E. rectale by upregulating expression of a variety of polysac-
charide utilization loci (PULs), encoding numerous glycoside hydrolase gene families, so
that it can degrade an increased variety of glycans that E. rectale cannot access, including
those derived from the host. E. rectale responds to B. thetaiotaomicron by decreasing pro-
duction of its glycan-degrading enzymes, altering its expression of sugar and amino acid
transporters, and facilitating glycolysis by increasing its ratio of NAD+ to NADH in part
via generation of butyrate from acetate, which in turn is utilized by the gut epithelium. In
contrast, co-colonization of germ-free mice with B. thetaiotaomicron and another human
gut Bacteroidetes, B. vulgatus, produces minimal changes in the former’s glycobiome,
while B. vulgatus upregulates genes uniquely represented in its genome that are involved
in the metabolism of pectin and xylans. These models of the human gut microbiota illus-
trate niche specialization and functional redundancy within the Bacteroidetes, the adapt-
able niche specialization that likely underlies the success of Firmicutes in this habitat, and
the importance of host glycans as a nutrient foundation that ensures ecosystem stability.

100
Introduction
The adult human gut houses a bacterial community containing trillions of mem-
bers comprising hundreds to thousands of species-level phylogenetic types (phylotypes).
Culture-independent surveys of this community have revealed remarkable interpersonal
variations in strain- and species-level phylotypes, but a consistent pattern of domination
of this ecosystem, at the phylum level, by the Firmicutes and the Bacteroidetes [1, 2]. This
domination is not a unique feature of humans: a global survey of the guts of 59 other mam-
malian species showed a similar phylum level pattern [3].
Finished genomes are available for several members of the human gut Bacteroi-
detes. Each contains a large repertoire of genes involved in the acquisition and metabo-
lism of polysaccharides: this includes: (i) up to hundreds of glycoside hydrolases (GHs)
and polysaccharide lyases (PLs); (ii) myriad paralogs of SusC and SusD, outer membrane
targeted proteins involved in recognition and import of specific carbohydrate structures
[4]; and (iii) a large array of environmental sensors and regulators [5]. Each of these hu-
man gut Bacteroidetes assembles these genes into multiple, similarly organized, selectively
regulated polysaccharide utilization loci (PULs) that encode functions necessary to detect,
bind, degrade and import carbohydrates encountered in the gut habitat – either from the
diet or from host glycans associated with mucus and the surfaces of epithelial cells [6,
7]. Studies of germ-free mice colonized with Bacteroides thetaiotaomicron alone have
demonstrated that this organism can vary its pattern of PUL expression of as a function of
diet: e.g., during the transition from mother’s milk to a polysaccharide-rich chow encoun-
tered when mice are weaned [6], or when adult mice are switched from a diet rich in plant
polysaccharides to a diet devoid of these glycans and replete with simple sugars (under the
latter conditions, the organism forages host glycans, a strategy that likely contributes to
ecosystem stability [7, 8].

101
Our previous functional genomic studies of the responses of B. thetaiotaomicron
to colonization of the guts of gnotobiotic mice with Bifidobacterium longum, a member of
the Actinobacteria that is prominently represented in the gut microbiota of infants, or with
Lactobacillus casei, a probiotic present in a number of fermented diary products, have
shown that B. thetaiotaomicron responds to the presence of these other microbes by modi-
fying expression of its PULs in ways that expand the breadth of its carbohydrate foraging
activities [9].
These observations underscore the notion that gut microbes live at the intersection
of two forms of selective pressure: bottom-up selection, where fierce competition between
members of a community that approaches a population density of 1011 organisms/ml of
colonic contents drives phylotypes to assume distinct functional roles; and top-down se-
lection, where the host selects for functional redundancy to insure against the failure of
bioreactor functions that could prove highly deleterious [10, 11].
The content, genomic arrangement and functional properties of PULs in sequenced
gut Bacteroidetes illustrate the specialization and functional redundancy within members
of this phylum. They also emphasize how the combined metabolic activities of members
of the microbiota undoubtedly result in interactions that are both very dynamic and over-
whelmingly complex (at least to the human observer), involving multiple potential path-
ways for the processing of substrates (including the order of substrate processing), varying
patterns of physical partitioning of microbes relative to substrates within the ecosystem,
and various schemes for utilization of products of bacterial metabolism. Such a system
likely provides multiple options for processing of a given metabolite, and for the types of
bacteria that can be involved in these activities.
All of this means that the task of defining the interactions of members of the hu-
man gut microbiota is daunting, as is the task of identifying general principles that govern
the operation of this system. In the present study, we have taken a reductionist approach

102
to begin to define interactions between members of the Firmicutes and the Bacteroidetes
that are commonly represented in the human gut microbiota. In the human colon, members
of Clostridium cluster XIVa are one of two abundantly represented clusters of Firmicutes.
Therefore, we have generated the initial two complete genome sequences for members
of the genus Eubacterium in Clostridium cluster XIVa, (the human gut-derived E. rec-
tale strain ATCC 33656 and E. eligens strain ATCC 27750) and compared them with the
draft sequences of 25 other sequenced human gut bacteria belonging to the Firmicutes and
the Bacteroidetes. The interactions between E. rectale and B. thetaiotaomicron were then
characterized by performing whole genome transcriptional profiling of each species after
colonization of the distal guts of gnotobiotic mice with each organism alone or in combina-
tion. The gene expression data were verified by mass spectrometry of cecal proteins, plus
biochemical assays of carbohydrate metabolism. The responses of each organism were
compared to the niche adaptations of B. thetaiotaomicron to another sequenced human gut
Bacteroides, B. vulgatus. These defined model human gut microbiotas (‘synthetic micro-
biomes’) likely illustrate general themes about how members of the dominant gut bacterial
phyla are able to co-exist.
Results and Discussion
Comparative genomic studies of human gut-associated Firmicutes and Bacteroidetes
We produced finished genome sequences for Eubacterium rectale, which contains
a single 3,449,685 bp chromosome encoding 3,627 predicted proteins, and Eubacterium
eligens which contains a 2,144,190 bp chromosome specifying 2,071 predicted proteins,
plus two plasmids (Tables S1-S3).
We classified the predicted proteins in these two genomes using Gene Ontology
(GO) terms generated via Interproscan, and then applied a binomial test to identify func-
tional categories of genes that are either over- or under-represented within (i) 9 sequenced
103
human gut-derived Bacteroidetes [includes the finished genomes of B. thetaiotaomicron,
B. fragilis, B. vulgatus, and Parabacteroides distasonis, plus deep draft assemblies of the
B. caccae, B. ovatus, B. uniformis B. stercoris and P. merdae genomes generated as part of
the human gut microbiome initiative (HGMI; http://genome.wustl.edu/hgm/HGM_front-
page.cgi], and (ii) 16 other human gut Firmicutes where deep draft assemblies were avail-
able through the HGMI (see Figure S1 for a phylogenetic tree).
While the sequenced gut Bacteroidetes all harbor large sets of polysaccharide sens-
ing, acquisition and degradation genes, the gut Firmicutes, including E. rectale and E.
eligens, have smaller genomes and a significantly smaller proportion of genes involved in
glycan degradation (Figure S2). As noted above, the gut-associated Bacteroidetes possess
large families of SusC and SusD paralogs involved in binding and import of glycans, while
the genomes of E. rectale and other gut Firmicutes are enriched for phosphotransferase
systems and ABC transporters (Figure S2). Lacking adhesive organelles, the ability of gut
Bacteroidetes to attach to nutrient platforms consisting of small food particles and host mu-
cus via glycan-specific SusC/SusD outer membrane binding proteins likely increases the
efficiency of oligo- and monosaccharide harvest by adaptively expressed bacterial GHs,
as well as preventing washout from the gut bioreactor [12]. Unlike the surveyed Bacteroi-
detes, several Firmicutes, notably E. rectale, E. eligens, E. siraeum, and Anaerotruncus
colihominis (the later belongs to the Clostridium leptum cluster) possess genes specifying
components of flagellae (Figure S2): these organelles may contribute to persistence within
the gut ecosystem and/or enable these species to move to different microhabitats to access
their preferred nutrient substrates.
Table S4 lists predicted GHs and PLs present in the Firmicutes and Bacteroidetes
surveyed, sorted into families according to the scheme incorporated into the Carbohydrate
Enzymes (CAZy) database (www.cazy.org). The Firmicutes have significantly fewer total
polysaccharide-degrading enzymes than the Bacteroidetes. Nonetheless, most of the sam-
pled Firmicutes have sets of carbohydrate active enzyme families that are more abundant

104
in their genomes than in any known gut Bacteroidetes (highlighted lines of Table S4). For
example, while E. rectale and E. eligens lack a variety of enzymes to degrade host-derived
glycans present in mucus and/or the apical surfaces of gut epithelial cells (e.g., fucosi-
dases and hexosaminidases), E. rectale has a disproportionately large number of predicted
α−amylases (GH family 13; Table S4 and Figure S3). E. eligens has fewer of the latter,
but possesses many enzymes for degrading pectins (e.g. GH family 28, PL families 1 and
9) (Table S4). Among the Bacteroidetes ‘glycobiomes’, there is also evidence of niche spe-
cialization: while B. vulgatus has fewer GHs and PLs overall than B. thetaiotaomicron, it
has a larger assortment of enzymes for degrading pectins (GH family 28 and PL families 1,
10 and 11) and possesses enzymes, which B. thetaiotaomicron lacks, that should enable it
to degrade certain xylans [GH family 10 and Carbohydrate esterase (CE) family 15] (Fig-
ure S3 and Table S4). In vitro assays of the growth of B. thetaiotaomicron, B. vulgatus and
E. rectale in defined medium containing mono- di- and polysaccharides produced results
broadly consistent with these predictions (Table S5).
We chose E. rectale and B. thetaiotaomicron as representatives of these two phyla
for further characterization of their niches in vivo, because of their prominence in culture-
independent surveys of the distal human gut microbiota [1, 10] and because of the pat-
tern of representation of carbohydrate active enzymes in their glycobiomes. We chose B.
vulgatus as a second representative of the Bacteroidetes because of its distinct repertoire
of GHs compared to B. thetaiotaomicron. These choices set the stage for ‘arranged mar-
riages’ between a Firmicute and a Bacteroidetes, and between two Bacteroidetes, hosted by
formerly germ-free mice.
Creating a minimal human gut microbiota in gnotobiotic mice
Young adult male germ-free mice belonging to the NMRI inbred strain were colo-
nized with B. thetaiotaomicron or E. rectale, or both species together. 10-14 d after inocula-
tion by gavage, both species colonized the ceca of recipient germ-free mice fed a standard

105
chow diet rich in plant polysaccharides at levels that were not significantly different (n=4-5
mice/treatment group in each of 3 independent experiments; Figure S4A).
Functional genomic analyses of the minimal human gut microbiome
B..thetaiotaomicron’s response.to E..rectale - A custom, multispecies, human gut
microbiome Affymetrix GeneChip was designed (Tables S6, S7 plus Supplemental Meth-
ods), and used to compare the transcriptional profile of each bacterial species when it was
the sole inhabitant of the cecum (mono-asociated), and when it co-existed together with
the other species (co-colonization). 55 of the 106 B. thetaiotaomicron genes that satisfied
our criteria for being differentially expressed with E. rectale colonization in a statistically
significant manner (Methods) were located in PULs: of these, 51 (93%) were upregulated
(Figure S4B; see Table S8 for a complete list of differentially regulated B. thetaiotaomi-
cron genes).
As noted in the Introduction, two previous studies from our lab examined changes
in B. thetaiotaomicron’s transcriptome in the ceca of mono-associated gnotobiotic mice
when they were switched from a diet rich in plant polysaccharides to a glucose-sucrose
chow [7], or in suckling mice consuming mother’s milk as they transitioned to a stan-
dard chow diet [6]. In both situations, in the absence of dietary plant polysaccharides, B.
thetaiotaomicron adaptively forages on host glycans.
The transcriptional changes induced in B. thetaiotaomicron by co-colonization
with E. rectale overlap with those noted in these two previous datasets (Figure S4C). In
addition, they involve several of the genes upregulated during growth on minimal medium
containing porcine gastric mucin (PGM) as the sole carbon source [8]. For example, in
co-colonized mice and in vitro, B. thetaiotaomicron upregulates two operons (BT3787-
BT3792; BT3774-BT3777; Figure S4D) used in degrading α−mannans, a component
of host O-glycans. (Note that E. rectale is unable to grow in defined medium containing
α-mannan or mannose as the sole carbon sources; Table S5). B. thetaiotaomicron also up-

106
regulates expression of its starch utilization system (Sus) PUL in the presence of E. rectale
(BT 3698-3704; Figure S4D). This well-characterized PUL is essential for degradation of
starch molecules containing ≥6 glucose units [4].
Thus, it appears that B. thetaiotaomicron adapts to the presence of E. rectale by
upregulating expression of a variety of PULs, so that it can broaden its niche and degrade
an increased variety of glycan substrates, including those derived from the host that E. rec-
tale is unable to access. The capacity to access host glycans likely represents an important
trait underpinning microbiota function and stability: glycans in the mucus gel are not only
abundant but consistently represented; mucus could serve as a microhabitat for Bacteroi-
detes spp. to embed in (and adhere to via SusD paralogs) thereby avoiding washout; the
products of polysaccharide digestion/fermentation generated by Bacteroidetes spp. can be
shared with other members of the microbiota that are located in close proximity, including
the Firmicutes.
E..rectale’s.response.to.B..thetaiotaomicron - E. rectale’s response to B. thetaiotao-
micron in the mouse cecum is in marked contrast to B. thetaiotaomicron’s response to E.
rectale. Carbohydrate metabolism genes, and particularly GHs, are significantly overrep-
resented among E. rectale genes that are downregulated in the presence of B. thetaiotao-
micron compared to monoassociation; i.e. 12 of E. rectale’s predicted 51 GHs are down-
regulated while only two are upregulated (Figure 1A,B; see Table S9 for a complete list
of E. rectale genes regulated by the presence of B. thetaiotaomicron). The two upregulated
GH genes [EUBREC_1072, a 6-P-β-glucosidase (GH family 1) and EUBREC_3687, a
cellobiose phosphorylase (GH family 94)], lack export signals and are predicted to break
down cellobiose. Three simple sugar transport systems with predicted specificity for cel-
luobiose, galactoside, and arabinose/lactose (EUBREC_3689, EUBREC_0479, and EU-
BREC_1075-6, respectively) are among the most strongly upregulated genes (highlighted
with arrowheads in Figure 1C).

107
Evidence for nutrient sharing
The concurrent upregulation of sugar transporters and downregulation of GHs not
only suggest that E. rectale is more selective in its sugar degradation in the presence of B.
thetaiotaomicron, but that it may benefit by harvesting sugars released by B. thetaiotao-
micron glycosidases. In vitro studies support the latter notion. Approximately 107 colony-
forming units (CFU) of B. thetaiotaomicron were plated onto the center of agar plates
containing defined medium with various carbon sources plus 102 to 104 CFU of E. rectale.
E. rectale colonies grew to a larger size the closer they were to B. thetaiotaomicron. This
effect was most pronounced on plates with dextran as the carbon source, a glucan that can
be utilized by B. thetaiotaomicron but not by E. rectale (Figure S5, Table S5). In the pres-
ence of a simple sugar that both organisms can utilize (glucose), a simple sugar only uti-
lized by B. thetaiotaomicron (D-arabinose; Table S5), or plating on tryptone alone without
a carbohydrate, the growth effect was considerably reduced (Figure S5).
Transcriptional and biochemical data obtained from gnotobiotic mice further sup-
port the idea that E. rectale is better able to access nutrients in the presence of B. thetaiotao-
micron. In the presence of B. thetaiotaomicron, E. rectale upregulates a significant propor-
tion of genes involved in biosynthetic and amino acid metabolic functions (listed in Figure
1A). Phosphoenolpyruvate carboxykinase (EUBREC_2002) is also upregulated with co-
colonization. This enzyme catalyzes an energy conserving reaction that produces oxaloac-
etate from phosphoenolpyruvate. In a subsequent transanimase reaction oxaloacetate can
be converted to aspartate, linking this branching of the glycolytic pathway with amino acid
biosynthesis. In addition, a number of peptide and amino acid transporters in E. rectale are
upregulated when it encounters B. thetaiotaomicron, as are the central carbon and nitro-
gen regulatory genes CodY (EUBREC_1812), glutamate synthase (EUBREC_1829) and
glutamine synthetase (EUBREC_2543) (Figure 1B). Moreover, the expression profile of
E. rectale in the ceca of co-colonized mice is intermediate between that observed when it
alone colonizes the cecum, and during its exponential phase growth in tryptone-glucose
108
(T-G) medium: i.e., 80% of the genes that are differentially regulated between monoas-
sociation and co-colonization are regulated in the same direction between growth on T-G,
and monoassociation (Table S10). Among these are genes involved in translation, cell en-
velope biogenesis and amino acid biosynthesis. All of these data suggest that the presence
of B. theta increases nutrient availability for E. rectale.
Changes. in.E. rectale’s fermentative.pathways - E. rectale harbors genes (EU-
BREC_733-737 and EUBREC_1017) for the production of butyrate that show high simi-
larity to genes from other Clostridia. This pathway involves the condensation of two
molecules of acetylCoA to form butyrate. Transcriptional and high resolution proteom-
ic analyses (see below) indicate that enzymes involved in the production of butyrate are
among the most highly expressed in cecal extracts prepared from E. rectale colonized mice
(Table S2 and S11).
In vitro studies have shown that E. rectale consumes large amounts of acetate
for butyrate production in the presence of carbohydrates [13]. Several observations sug-
gest that E. rectale utilizes acetate produced by B. thetaiotaomicron to generate increased
amounts of butyrate in vivo: First, E. rectale upregulates a phosphate acetyltransferase
(EUBREC_1443; EC 2.3.1.8), one of two enzymes involved in the interconversion of ace-
tylCoA and acetate (Table S9; GeneChip data verified by qRT-PCR assays in 2 indepen-
dent experiments involving 3-4 mice/treatment group). Second, cecal acetate levels are
significantly lower in co-colonized mice compared to B. thetaiotaomicron monoassociated
mice (Figure 2B). Third, although cecal butyrate levels are similar in E. rectale monoas-
sociated and co-colonized animals (Figure 2C), expression of mouse Mct-1, encoding a
monocarboxylate transporter whose inducer and preferred substrate is butyrate [14, 15], is
significantly higher in the distal gut of co-colonized versus E. rectale monoassociated mice
(p<0.05; Figure 2D). The cecal concentrations of butyrate observed are similar to levels
known to upregulate Mct-1 in colonic epithelial cell lines [14]. Fourth, higher levels of ac-
etate (i.e. those encountered in B. thetaiotaomicron monoassociated mice) are insufficient

109
to induce any change in Mct-1 expression compared to germ-free controls (Figure 2B and
2D). Fifth, levels of other monocarboxylates transported by Mct-1 are unchanged (lactate,
succinate) or significantly decreased (proprionate) in the ceca of co-colonized compared to
E. rectale monoassociated mice (Figure 2E, and data not shown).
Conversion of acetate to butyrate is accompanied by the oxidation of two molecules
of NADH to NAD+, which is required for glycolysis. The butyrylCoA dehydrogenase/
electron transfer flavoprotein (Bcd/Etf) complex (EC 1.3.99.2) in the butyrate production
pathway also offers a recently discovered additional pathway for energy conservation, via
a bifurcation of electrons from NADH to crotonylCoA and ferredoxin [16]. The reduced
ferredoxin in turn may be reoxidized via hydrogenases, or via the membrane-bound oxi-
doreductase, Rnf, which generates sodium-motive force. While our GeneChip data indi-
cated no significant difference in expression of the operon encoding the Bcd/Etf complex
(EUBREC_0735-0737) in E. rectale monoassociated versus co-colonized mice, we ob-
served downregulation of genes that catalyze both of these reduced ferredoxin-dependent
reactions (hydrogenases [EUBREC_1227 and EUBREC_2390, EC:1.12.7.2] and Rnf [EU-
BREC_1641–1646]). This indicates that more of the NADH generated through glycolysis
might be reoxidized in the reduction of crotonylCoA rather than by reduction of ferre-
doxin.
Consistent with these observations, we found that the NAD+/NADH ratio in cecal
contents was significant increased with co-colonization (Figure 2A). A high NAD+/NADH
ratio promotes high rates of glycolysis, since NAD+ is a required cofactor. This shift, there-
fore, may represent an adaptation by E. rectale to the increased nutrient uptake discussed
above. Figure 3 summarizes the metabolic responses of E. rectale to B. thetaiotaomicron.
The pathway for acetate metabolism observed in the model human gut community
composed of B. thetaiotaomicron and E. rectale differs markedly from what is seen in
mice that harbor B. thetaiotaomicron and the principal human gut methanogenic archaeon,

110
Methanobrevibacter smithii. When B. thetaiotaomicron encounters M. smithii in the ceca
of gnotobiotic mice, there is increased production of acetate by B. thetaiotaomicron, no
diversion to butyrate (and no induction of Mct-1; [17] and B. Samuel and J. Gordon, un-
published observations), increased serum acetate levels, and increased adiposity compared
to B. thetaiotaomicron monoassociated controls. In contrast, serum acetate levels and host
adiposity (as measured by fat pad to body weight ratios) are not significantly different
between B. thetaiotaomicron monoassociated and B. thetaiotaomicron-E. rectale co-colo-
nized animals (n=4-5 animals/group; n=3 independent experiments; data not shown).
Proteomic studies of this simplified two-component model of the human gut
microbiome
Model communities, such as the one described above, constructed in gnotobiotic
mice, where microbiome gene content is precisely known and transcriptional data are ob-
tained under controlled conditions, provide a way to test the efficacy of mass spectrometric
methods for characterizing gut microbial community proteomes. Therefore, we assayed lu-
minal contents, collected from the ceca of 8 gnotobiotic mice: (germ-free, monoassociated,
and co-colonized; n=2 mice/treatment group representing two independent biological ex-
periments). Samples were processed by a small sample method, in which cells were lysed
with 6M Guanidine/10mM DTT and heat, proteins were denatured, reduced, and digested
with trypsin, and samples analyzed (in triplicate) using tandem mass spectrometry with a
linear ion trap. All MS/MS spectra were searched with SEQUEST [18] against a combined
database containing predicted proteins from E. rectale, B. thetaiotaomicron, mouse, plant
components of the diet (e.g., rice), and common contaminants (e.g. trypsin). All 8 samples
were coded, and MS measurements conducted in a blinded fashion.
The measured proteomes had high reproducibility in terms of total number of pro-
teins observed and spectra matching to each species. Differentiating unique peptides and
thus unique proteins between E. rectale and B. thetaiotaomicron was straightforward since
111
there are no shared predicted peptides between the two. The resultant microbial species
distributions were exactly as expected from the coded samples. Table 1 summarizes our
results, including the percentage of mRNAs called present in the GeneChip datasets for
which there was an identified protein product. The most abundant identified proteins from
both microbes included ribosomal proteins, elongation factors, chaperones, and proteins
involved in energy metabolism (for a full list of identified proteins, see Table S11 and
http://compbio.ornl.gov/mouse_cecal_microbial_metaproteome/; note that Tables S8
and S9, which list differentially expressed genes in co-colonization experiments, indicate
whether protein products from the transcripts were identified in these mass spectrometry
datasets; in addition, Table S2, which lists the genome annotation for E. rectale, describes
the number of times each protein was identified in our replicate MS/MS analyses). Many
conserved hypothetical and pure hypothetical proteins were identified, as well as 10 genes
in B. thetaiotaomicron whose presence had not been predicted in our initial annotation of
the finished genome (Table S12). Together, these results provide validation of experimen-
tal and computational procedures for proteomic assays of a model gut microbiota, and also
illustrate some of the benefits in obtaining this type of information.
Putting the niche adaptations of B. thetaiotaomicron and E. rectale in perspective: a
model gut community containing B. thetaiotaomicron and B. vulgatus
In a final set of experiments, we colonized adult male NMRI mice consuming a
standard polysaccharide-rich chow diet with B. thetaiotaomicron alone, B. vulgatus alone,
or with both organisms together. Animals were sacrificed 14d after gavage. As with E. rec-
tale and B. thetataiomicron, co-colonization produced similar cecal population densities of
both organisms. Moreover, these levels did not differ significantly from what was observed
with monoassociation (Figure S6A).
The number of genes whose expression was significantly different in co-colonization
compared to monoassociation was very modest: only 7 in the case of B. thetaiotaomicron

112
(6 upregulated; see Table S13 for complete list) and 52 in B. vulgatus (60% upregulated)
(see Table S14 for a complete list). This is consistent with the fact that these two human gut
Bacteroidetes have largely similar capacities to utilize different polysaccharides. Remark-
ably, all of the differentially expressed genes in B. vulgatus that had functional annotations
were located in predicted operons involved in carbohydrate utilization. The upregulated
genes included several involved in degradation/metabolism of pectin and xylans (Figure
S6B,C): i.e., the same genes identified as distinctively represented in the glycobiome of B.
vulgatus compared to B. thetaiotaomicron.
Prospectus
These studies of model human gut microbiotas created in gnotobiotic mice support
a view of the Bacteroidetes, whose genomes contain a disproportionately large number of
glycan-degrading enzymes compared to sequenced Firmicutes, as responding to increasing
diversity by modulating expression of their vast array of PULs. B. vulgatus adapts to the
presence of B. thetaiotaomicron by increasing expression of its unique and enriched classes
of GHs. B. thetaiotaomicron responds to E. rectale by upregulating a variety of loci spe-
cific for host-derived mucin glycans that E. rectale is unable to utilize (e.g. α−mannans).
E. rectale, which like other Firmicutes has a more specialized capacity for glycan degrada-
tion, broadly downregulates its available GHs in the presence of B. thetaiotaomicron, even
though it does not grow efficiently in the absence of carbohydrates. It becomes more selec-
tive in its harvest of sugars, while its transcriptional profile suggests improved access to
nutrients, with a generalized upregulation of biosynthetic genes, including those involved
translation, as well as a set of nutrient transporters that can harvest peptides as well as car-
bohydrate products liberated by gut Bacteroidetes-derived GHs and PLs: i.e., it becomes,
in part, a ‘secondary consumer’ of the buffet of glycans available in the cecum.
We have previously used gnotobiotic mice to show that the efficiency of fermenta-
tion of dietary polysaccharides to short chain fatty acids by B. thetaiotaomicron increases

113
in the presence of M. smithii [17]. Co-colonization increases the density of colonization
of the distal gut by both organisms, increases production of formate and acetate by B.
thetaiotaomicron and allows M. smithii to use H2 and formate produce methane, thereby
preventing the build-up of these fermentation end-products (including NADH) in the gut
bioreactor, and improving the efficiency of carbohydrate metabolism [17]. Removal of
H2 by methanogenic Archaea, by phylogenetically diverse acetogens that use the Wood-
Ljungdhal pathway for synthesis of acetyl CoA from CO2, and/or by Proteobacteria that
reduce sulfate to sulfide, allows B. thetaiotaomicron’s hydrogenase to oxidize NADH to
NAD+, which can then be used for glycolysis. This situation constitutes a mutualism, in
which both members show a clear benefit. The present study, characterizing the interaction
between B. thetaiotaomicron and E. rectale, describes a more nuanced interaction where
there are not significant changes in the level of colonization of either species. It is currently
difficult to determine the benefit versus cost of these interactions. The cost to B. thetaiotao-
micron of liberating simple sugars in excess of what it can absorb may not be large enough
to allow selection against it. Alternatively, B. thetaiotaomicron may benefit from its inter-
action with E. rectale in ways as yet uncharacterized.
It seems likely that as the complexity of the gut community increases, interactions
between B. thetaiotaomicron and E. rectale will either by subsumed or magnified by other
‘similar’ phylogenetic types (as defined by their 16S rRNA sequence and/or by their gly-
cobiomes). Constructing model human gut microbiotas of increasing the complexity in
gnotobiotic mice using sequenced members of our intestinal communities should be very
useful for exploring two ecologic concepts: (i) the neutral theory of community assembly
which posits that most species will share the same general niche (profession), and thus are
likely to be functionally redundant [19], and (ii) the idea that both bottom-up selection,
where fierce competition between members of the microbiota drives phylotypes to assume
distinct functional roles, and top-down selection, where the host selects for functional re-
dundancy to insure against failure of bioreactor functions, operate in our guts [2].

114
Materials and Methods
Genome comparisons
All nucleotide sequences from all contigs of completed assemblies containing both
capillary sequencing and pyrosequencer data, produced as part of the HGMI were down-
loaded from the Washington University Genome Sequencing Center’s website (http://
genome.wustl.edu/pub/organism/Microbes/Human_Gut_Microbiome/) on September 27,
2007. The finished genome sequences of B. thetaiotaomicron VPI-5482, Bacteroides vulg-
atus ATCC 8482, and B. fragilis NCTC9343 were obtained from GenBank.
For comparison purposes, protein-coding genes were identified in all genomes us-
ing YACOP [20]; nonredundant NCBI nucleotide (NT) database dated 9/27/2007). Each
proteome was assigned InterPro numbers and GO terms using InterProScan release 16.1
[21]. Statistical comparisons between genomes were then carried out, as described previ-
ously [5] using perl scripts that are available upon request from the authors.
GeneChip Analysis
RNA was isolated from a 100-300 mg aliquot of frozen cecal contents, and cDNA
synthesized, biotinylated and hybridized to GeneChips, as described previously [17], ex-
cept that 0.1mm zirconia/silica beads (Biospec Products, Bartlesville, OK) were used for
lysis in a bead beater (Biospec) for 4 min at high speed. Genes in a given bacterial spe-
cies that were differentially expressed in mono- versus co-colonization were identified
using CyberT (default parameters) following probe masking and scaling with the MAS5
algorithm (Affymetrix; for details of the methods used to create the mask, see the Methods
section of Supplementary Information).

115
Other methods
Details about bacterial culture, genome sequencing and finishing, animal husband-
ry, quantitative PCR assays of the level of colonization of the ceca of gnotobiotic mice,
GeneChip design and masking, plus proteomic and metabolite assays of cecal contents are
described in the Methods section of Supplementary Information.
Acknowledgements
We are indebted to Maria Karlsson, David O’Donnell for help with gnotobiotic hus-
bandry, Jan Crowley, Janaki Guruge, Jill Manchester, and Sabrina Wagoner for outstanding
technical assistance, Peter Turnbaugh, Janaki Guruge, and Eric Martens for invaluable sug-
gestions, Jian Xu, Sandra Clifton, and our other colleagues at the Washington University
Genome Sequencing Center for assistance with genome sequencing, plus Laura Kyro for
help with graphics. This work was supported by grants from the NSF (0333284) and NIH
(DK30292, DK70977, and DK52574). M.A.M is a member of the Washington University
Medical Scientist Training Program (GM07200) and was also supported by NIH training
grant T32-AI07172.

116
References
1. Eckburg, P.B., E.M. Bik, C.N. Bernstein, E. Purdom, L. Dethlefsen, M. Sargent,
S.R. Gill, K.E. Nelson, and D.A. Relman, 2005. Diversity of the human intestinal
microbial flora. Science, 308 (5728), p. 1635-8.
2. Ley, R.E., D.A. Peterson, and J.I. Gordon, 2006. Ecological and evolutionary forces
shaping microbial diversity in the human intestine. Cell, 124 (4), p. 837-48.
3. Ley, R.E., M. Hamady, C. Lozupone, P.J. Turnbaugh, R.R. Ramey, J.S. Bircher,
M.L. Schlegel, T.A. Tucker, M.D. Schrenzel, R. Knight, and J.I. Gordon, 2008.
Evolution of mammals and their gut microbes. Science, 320 (5883), p. 1647-51.
4. Koropatkin, N.M., E.C. Martens, J.I. Gordon, and T.J. Smith, 2008. Starch
catabolism by a prominent human gut symbiont is directed by the recognition of
amylose helices. Structure, 16 (7), p. 1105-15.
5. Xu, J., M.A. Mahowald, R.E. Ley, C.A. Lozupone, M. Hamady, E.C. Martens, B.
Henrissat, P.M. Coutinho, P. Minx, P. Latreille, H. Cordum, A. Van Brunt, K. Kim,
R.S. Fulton, L.A. Fulton, S.W. Clifton, R.K. Wilson, R.D. Knight, and J.I. Gordon,
2007. Evolution of Symbiotic Bacteria in the Distal Human Intestine. PLoS Biol, 5
(7), p. e156.
6. Bjursell, M.K., E.C. Martens, and J.I. Gordon, 2006. Functional genomic and
metabolic studies of the adaptations of a prominent adult human gut symbiont,
Bacteroides thetaiotaomicron, to the suckling period. J Biol Chem, 281 (47), p.
36269-79.
7. Sonnenburg, J.L., J. Xu, D.D. Leip, C.H. Chen, B.P. Westover, J. Weatherford, J.D.
Buhler, and J.I. Gordon, 2005. Glycan foraging in vivo by an intestine-adapted
bacterial symbiont. Science, 307 (5717), p. 1955-9.

117
8. Martens, E.C., H.C. Chiang, and J.I. Gordon, 2008. Mucosal Glycan Foraging
Enhances the Fitness and Transmission of a Saccharolytic Human Gut Symbiont.
submitted.
9. Sonnenburg, J.L., C.T. Chen, and J.I. Gordon, 2006. Genomic and metabolic studies
of the impact of probiotics on a model gut symbiont and host. PLoS Biol, 4 (12), p.
e413.
10. Ley, R.E., P.J. Turnbaugh, S. Klein, and J.I. Gordon, 2006. Microbial ecology:
human gut microbes associated with obesity. Nature, 444 (7122), p. 1022-3.
11. Lozupone, C.A., M. Hamady, B.L. Cantarel, P.M. Coutinho, B. Henrissat, J.I.
Gordon, and R. Knight, 2008. The Convergence of Carbohydrate Active Gene
Repertoires in Human Gut Microbes. submitted.
12. Sonnenburg, J.L., L.T. Angenent, and J.I. Gordon, 2004. Getting a grip on things:
how do communities of bacterial symbionts become established in our intestine?
Nat Immunol, 5 (6), p. 569-73.
13. Duncan, S.H. and H.J. Flint, 2008. Proposal of a neotype strain (A1-86) for
Eubacterium rectale. Request for an Opinion. Int J Syst Evol Microbiol, 58 (Pt 7),
p. 1735-6.
14. Cuff, M.A., D.W. Lambert, and S.P. Shirazi-Beechey, 2002. Substrate-induced
regulation of the human colonic monocarboxylate transporter, MCT1. J Physiol,
539 (Pt 2), p. 361-71.
15. Ritzhaupt, A., I.S. Wood, A. Ellis, K.B. Hosie, and S.P. Shirazi-Beechey, 1998.
Identification and characterization of a monocarboxylate transporter (MCT1) in pig
and human colon: its potential to transport L-lactate as well as butyrate. J Physiol,
513 ( Pt 3) p. 719-32.
118
16. Li, F., J. Hinderberger, H. Seedorf, J. Zhang, W. Buckel, and R.K. Thauer, 2008.
Coupled ferredoxin and crotonyl coenzyme A (CoA) reduction with NADH
catalyzed by the butyryl-CoA dehydrogenase/Etf complex from Clostridium
kluyveri. J Bacteriol, 190 (3), p. 843-50.
17. Samuel, B.S. and J.I. Gordon, 2006. A humanized gnotobiotic mouse model
of host-archaeal-bacterial mutualism. Proc Natl Acad Sci U S A, 103 (26),
p. 10011-6.
18. Eng, J.K., A.L. McCormack, and J.R. Yates III, 1994. An approach to correlate
tandem mass spectral data of peptides with amino acid sequences in a protein
database. J. Am. Mass Spectrom., 5 p. 976-989.
19. Hubbell, S.P., 2006. Neutral theory and the evolution of ecological equivalence.
Ecology, 87 (6), p. 1387-98.
20. McHardy, A.C., A. Goesmann, A. Puhler, and F. Meyer, 2004. Development of
joint application strategies for two microbial gene finders. Bioinformatics, 20 (10),
p. 1622-31.
21. Quevillon, E., V. Silventoinen, S. Pillai, N. Harte, N. Mulder, R. Apweiler, and R.
Lopez, 2005. InterProScan: protein domains identifier. Nucleic Acids Res, 33 (Web
Server issue), p. W116-20.
22. Sonenshein, A.L., 2007. Control of key metabolic intersections in Bacillus subtilis.
Nat Rev Microbiol, 5 (12), p. 917-27.
23. Commichau, F.M., K. Forchhammer, and J. Stulke, 2006. Regulatory links between
carbon and nitrogen metabolism. Curr Opin Microbiol, 9 (2), p. 167-72.

119
Figure Legends
Figure 1. Response of E.. rectale to co-colonization with B.. thetaiotaomicron. (A) Genes as-
signed to GO terms for carbohydrate metabolism (GO:0005975), transporters (GO: GO:0006810)
and predicted GHs are all significantly overrepresented among down-regulated genes while genes
with GO terms for biosynthesis (GO:0044249), in particular amino acid metabolism (GO:0006520),
are significantly overrepresented among upregulated genes. All categories shown are significantly
different from the genome as a whole. *P<0.05; **P<0.01; ***P<0.001 (binomial test). (B) Heat
map from GeneChip data showing: (i) all significantly regulated GH genes (top), with all but two
are downregulated (both cytoplasmic cellobiose processing enzymes); (ii) upregulation of global
regulator genes (i) CodY, a repressor of starvation-response genes, and (ii) glutamate synthase,
and (iii) glutamine synthetase, which require adequate carbon and nitrogen supplies for activation
[22, 23]. (C) Heat map of all significantly regulated genes assigned to the GO term for transport-
ers (GO:0006810) illustrates that a number of simple sugar transporters are downregulated upon
co-colonization, while peptide and amino acid transporters as well as three predicted simple sugar
transporters (arrows; EUBREC_0479, a galactoside ABC transporter; EUBREC_1075-6, a lactose/
arabinose transport system, and EUBREC_3689, a predicted cellobiose transporter) are upregu-
lated. Differentially regulated genes were identified using the MAS5 algorithm and Cyber-T (see
Table S9 and Materials and Methods). Genes whose differential expression with co-colonization
was further validated by qRT-PCR are highlighted with red lettering (2 independent experiments,
n=4-5 mice per group, 2-3 measurements per gene).
Figure 2. Co-colonization affects the efficiency of fermentation with an increased NAD+:NADH
ratio and increased acetate production. (A) NAD+:NADH ratios are increased in co-colonization
relative to either monoassociation or germ-free mice (n=7-9 per group). (B,C) GC-MS assays of
cecal acetate and butyrate levels (n=6-8 per group). (D) Expression of Mct-1, a monocarboxylate
transporter whose preferred substrate and inducer is butyrate, in the proximal colon (n=3-5 per
group). (E) Cecal propionate concentrations (n=7-9 per group). Mean values ± s.e.m. are plotted; *,
p<0.05, **, p<0.01, *** p<0.001 compared with co-colonization (1-way analysis of variance with
120
Bonferroni correction).
Figure 3. Proposed model of the metabolic responses of E..rectale to B..thetaiotaomicron. B.
thetaiotaomicron increases its break down of complex host glycans (HG) and dietary polysaccha-
rides (DP) into monosaccharides (MS) that E. rectale efficiently takes up using phosphotransferase
systems (Pts) and ABC transporters. Fermentative pathways in B. thetaiotaomicron generate ac-
etate that E. rectale consumes. E. rectale increases its production of butyrate, which is formed from
acetyl-CoA in several reductive steps. This regenerates NAD+ that is reduced during glycolysis,
leading to an increase in the NAD+/NADH ratio. The downregulation of hydrogenase and Rnf may
indicate that E. rectale uses NADH to produce butyrate rather than to generate reduced ferredoxin
or subsequently H2 (via hydrogenase) or sodium motive force (via Rnf). The butyrate in turn in-
duces the monocarboxylate transporter Mct-1 in the host epithelium, causing an increased uptake
of this short chain fatty acid. The constant removal of butyrate from the colon keeps its concentra-
tion low, thus favoring E. rectale’s production of butyrate.
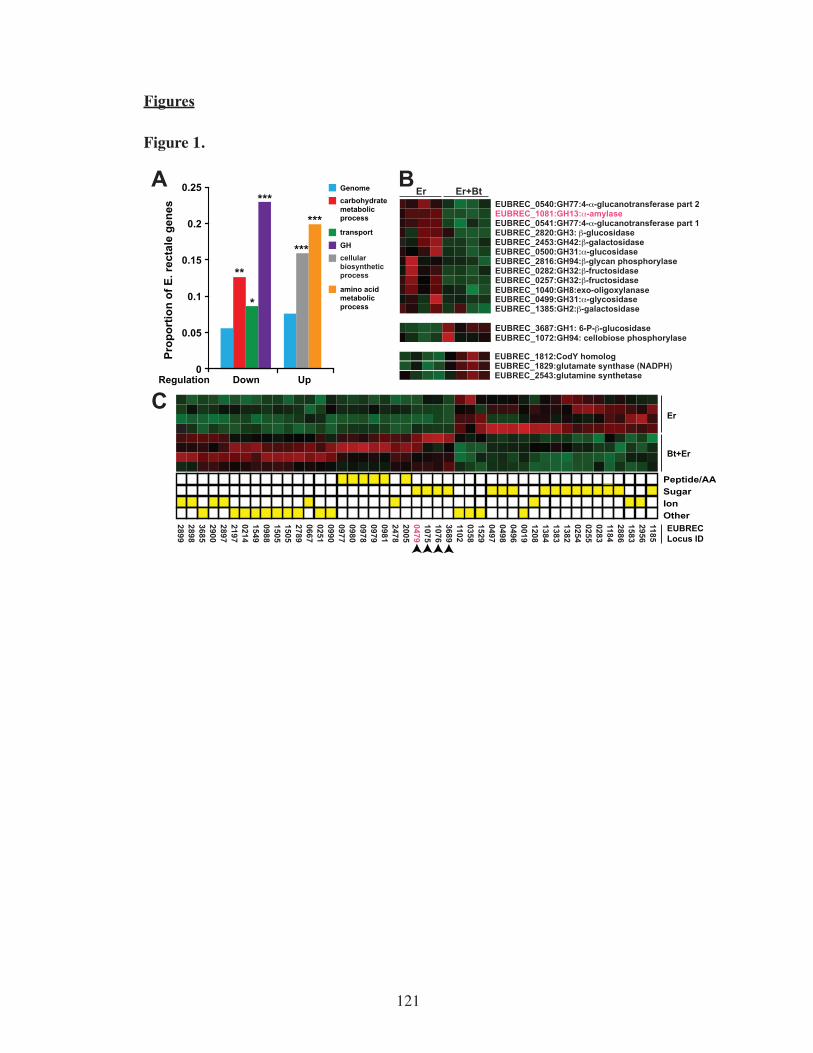
121
Figures
Figure 1.
Peptide/AASugarIonOther
Er
Bt+Er
EUBRECLocus ID
A B
C
cellularbiosyntheticprocess
amino acid metabolicprocess
0
0.05
0.1
0.15
0.2
0.25
**
***
***
*
***
Pro
po
rtio
n o
f E
. rec
tale
gen
es
Genome
Down Up
carbohydratemetabolicprocess
transport
GH
Er Er+Bt
118529561583288611840283025502541382138313841208001904960498049715290358110236891076107504792005247809810979097809800977099002510667278915051505098815490214219728972900368528982899
EUBREC_2820:GH3: β-glucosidase
EUBREC_2816:GH94:β-glycan phosphorylase
EUBREC_1385:GH2:β-galactosidase
EUBREC_1040:GH8:exo-oligoxylanase
EUBREC_1081:GH13:α-amylase
EUBREC_1072:GH94: cellobiose phosphorylase
EUBREC_0282:GH32:β-fructosidase
EUBREC_0500:GH31:α-glucosidase
EUBREC_0499:GH31:α-glycosidase
EUBREC_0257:GH32:β-fructosidase
EUBREC_0540:GH77:4-α-glucanotransferase part 2
EUBREC_0541:GH77:4-α-glucanotransferase part 1
EUBREC_2453:GH42:β-galactosidase
EUBREC_3687:GH1: 6-P-β-glucosidase
EUBREC_1812:CodY homologEUBREC_1829:glutamate synthase (NADPH)EUBREC_2543:glutamine synthetaseRegulation

122
Figure 2.
0
2
4
6
8
10
**
******** ******12
Bt Bt/ErEr Bt Bt/ErEr
NA
D:N
AD
H r
atio
A CB D E
0
5
10
15
20
25
Acetate
0
0.05
0.10
0.15
0.20
0.25
0.30
0.35
0.4
0.45
GF
Butyrate
Bt Bt/ErErGF Bt Bt/ErErGF0
0.5
1.0
1.5
2.0
2.5
3.0
3.5
4.0
MCT-1 expression Propionate
μm
ol/g
cec
al c
on
ten
ts
μm
ol/g
cec
al c
on
ten
ts
fold
dif
fere
nce
μm
ol/g
cec
al c
on
ten
ts
0
1.0
2.0
3.0
4.0
5.0
6.0
Bt Bt/ErErGF

123
Figure 3.
Ac-
CoA
Ac-
CoA
C-6
C-3
-PC
-3
C-4
2 A
DP
2 N
AD
+
2 N
AD
H2
AT
P
acet
ate
cellw
all am
ino
aci
ds
Mct
-1
D-A
la
AT
P Gln
, GluAT
P
DP
HG
MS
Pts
H2
CO
2C
O2
CO
2
E. r
ecta
le
B. t
het
a-io
tao
mic
ron
CoA
Pta
Ack
PO
R
Thl
Cat
Bcd
Etf
Hbd
Crt
PC
K
Am
ino
Aci
dM
etab
olis
m
Pro
pio
nat
e
Pul
Su
ccin
ate
bu
tyra
te
2 N
AD
H2
NA
D+
acet
ate
bu
tyra
te
Pul
Hyd
H2+
2 H
++
Fd r
ed
acet
ate
F1F
0 A
TP
ase
H+
AD
P
AD
P
AT
P
Co
AA
TP
Na+
Rnf
A-E
Fd o
x
Fd o
x
Fd o
x
NA
DH
Fd r
ed
Fd r
ed
Fd r
ed
NA
D+
124
Table Legends
Table 1. Detection of proteins and protein expression by tandem mass spectrometry and gene
chip compared. Mono=Monoassociated mouse cecal contents; Biassoc=Biassociated cecal
contents. Chip -: less than 75% of gene chips with “Present” call for a gene; for E. rectale
this number includes genes not covered by gene chip; in parentheses is the number of chip-
negative genes excluding those not on the chip.

125
Table 1
Mono Biassoc Total Mono Biassoc Total
Detected by
MSMS661 453
680 1608 1367 1687
2139 2010 2150 3798 3865 3995
91% 85% 91% 78% 79% 82%
Chip - / MS/MS +a 132 (7) 83 (7) 135 (8) 40 21 23MS/MS- / Chip + 1608 1638 1603 2280 2569 2357
75% present by
gene chip
E. rectale B. thetaiotaomicron

126
Supplemental Information
Methods
Bacterial culture
Bacterial strains were stored frozen at -80°C in a pre-reduced mixture of two parts
TYG medium [1] to one part glycerol. Bacteria were routinely cultured in TYG medium in
an anaerobic chamber (Coy Lab Products, Grass Lake, MI) under an atmosphere of 40%
CO2, 58% nitrogen, and 2% H2. To assay growth of E. rectale on specific carbon sources, the
organism was cultured on medium containing 1% tryptone, 100mM potassium phosphate
buffer (pH 7.2), 15 mM NaCl, 180µM CaCl2, 100 µM MgCl2, 50 µM MnCl2, 42 µM CoCl2
and 15 µM FeSO4, 1% trace element mix (ATCC), 2µg/ml folinic acid (calcium salt), 1.2
µg/ml hematin, and 1mg/ml menadione. Growth curves for different carbon sources were
acquired at 37°C in the Coy anaerobic chamber using a 96-well plate spectrophotometer
(Tecan Sunrise, Tecan U.S., Durham, NC). Growths were scored as positive if the OD600
measurement rose by ≥0.2 over a 72 h incubation at 37oC.
Genome sequencing
E. rectale and E. eligens were grown to late log phase under anaerobic conditions
in TYG medium. Cells were pelleted from 50 ml cultures and lysed in 11 ml Buffer B1
(Qiagen Genomic DNA buffer set; Qiagen) with 2.2 mg RNAse A, 50 U lysozyme, 50 U
mutanolysin, and 600 U achromopeptidase (all from Sigma) for 30 min at 37°C. Four ml of
Buffer B2 (Qiagen) was added with 10 mg (300 U) proteinase K (Sigma) and incubated at
50°C for 2 h. The DNA was precipitated by adding 1.5 ml of 3M sodium acetate and 30 ml
isopropanol, removed with a sterile glass hook, and washed several times with ethanol.
Unlike E. eligens, genomic DNA from E. rectale was very resistant to standard
cloning techniques. This cloning bias made efforts to produce fosmids ineffective, and left

127
vast regions of the genome uncloned in our primary sequencing vector, pOT. Only half (1.7
Mb) of its genome was represented in our initial assembly containing 228 contigs from
>9X plasmid shotgun reads with a ABI 3730 capillary instrument. Therefore, we generated
>40X coverage of the E. rectale genome through pyrosequencing with a 454 GS20 instru-
ment, and used an additional vector (pJAZZ) for capillary sequencing in order to obtain a
finished genome sequence. Significant manual closure efforts including PCR and sequenc-
ing of products across gaps, manual manipulation of sequence assemblies to resolve misas-
semblies, and sequence editing to ensure accurate base calling. were employed to produce
a final, hand-curated, base-perfect sequence. In our experience, the effort required was
far more extensive than for most finished microbial genomes, due to the repetitive, highly
clone-biased nature of this assembly.
Protein-coding genes were subsequently identified using Glimmer 2.13 [2] and
GeneMarkS [3] using the start site predicted by GeneMarkS where the two overlapped.
‘Missed’ genes were then added by using a translated BLAST of intergenic regions against
the NCBI nonredundant protein database to find conserved ORFs. Additional missed genes
were added to the E. rectale genome using YACOP (trained by Glimmer 2.13) [4]. tRNA,
rRNA and other non-coding RNAs were identified and annotated using tRNAscan-SE [5],
RNAMMER [6], and RFAM [7], respectively. Protein-coding genes were annotated with
the KEGG Orthology group definition using a NCBI BLASTP search [8] of the KEGG
genes database [9] (Mar. 10, 2008), with a minimum bit score of 60.
Animal husbandry
All experiments using mice were performed using protocols approved by the ani-
mal studies committee of Washington University. NMRI-KI mice [10] were maintained
in flexible plastic film isolators under a strict 12h light cycle, and fed a standard poly-
saccharide-rich chow (BK, Zeigler, UK). For colonizations involving B. vulgatus and B.
thetaiotaomicron, mice were maintained on this diet for the duration of the experiment. 6-8

128
week old males were placed on an irradiated polysaccharide-rich chow diet (Harlan-Teklad
#2918, Madison, WI) 10 to 14d prior to colonizations involving B. thetaiotaomicron and
E. rectale.
Animals were colonized via gavage with 108 CFU from an overnight culture of a
B. thetaiotaomicron or B. vulgatus, or a log-phase culture of E. rectale. Gavage with E.
rectale was repeated on three successive days using cells from separate log-phase cultures
begun from separate colonies. Cecal contents and colon tissue were flash frozen in liquid
nitrogen immediately after animals were killed.
Quantitative PCR measurements of colonization
A total of 100–300 mg of frozen cecal contents from each gnotobiotic mouse was
added to 2 ml tubes containing 250 µl 0.1mm-diameter zirconia/silica beads (Biospec Prod-
ucts), 0.5 ml of Buffer A (200 mM NaCl 20 mM EDTA), 210 µl of 20% SDS, and 0.5 ml
of a mixture of phenol:chloroform:isoamyl alcohol (25:24:1; pH 7.9; Ambion, Austin, TX).
Samples were lysed by using a bead beater (BioSpec; ‘‘high’’ setting for 4 min at room
temperature). The aqueous phase was extracted following centrifugation (8,000 x g at 4°C
for 3 min), and the extraction repeated with another 0.5 ml of phenol:chloroform:isoamyl
alcohol and 1 min of vortexing. DNA was precipitated with 0.1 volume of 3M sodium ac-
etate (pH 5) and 1 volume of isopropanol (on ice for 20 min), pelleted (14,000 x g, 20 min
at 4oC) and washed with ethanol. The resulting pellet was resuspended in water and one
half (for E. rectale monoassociations) or one tenth of the DNA (for B. thetaiotaomicron
colonized samples) further cleaned up using a DNAEasy column (Qiagen). qPCR was per-
formed using (i) primers specific to the 16S rRNA gene of B. thetaiotaomicron [11] and the
Clostridium coccoides/E. rectale group (forward: 5’-CGGTACCTGACTAAGAAGC-3’;
reverse: 5’-AGTTT(C/T)ATTCTTGCGAACG-3’) [12] and (ii) conditions described pre-
viously for B. thetaiotaomicron [11]. The amount of DNA from each genome in each PCR
was computed by comparison to a standard curve of genomic DNA prepared in the same

129
manner. Data were converted to genome equivalents by calculating the mass of each fin-
ished genome (2.8 x 10⁵ genome equivalents (GEq) per ng E. rectale DNA, and 1.5 x 10⁵
GEq per ng B. thetaiotaomicron DNA).
GeneChip design, hybridization and data analysis
A custom, six-species human gut microbiome Affymetrix GeneChip was designed
using the finished genome sequences of B. thetaiotaomicron, B. vulgatus, P. distasonis and
M. smithii genomes [13-15], plus draft versions of the E. rectale and E. eligens genomes.
Gene predictions for the Firmicute assemblies were made using Glimmer3 [2]. The design
included 14 probe pairs (perfect match plus mismatch) per CDS (protein coding sequence)
in each draft assembly, and 11 probe pairs for each CDS in a finished genome. The result-
ing coverage, after soft pruning against all 6 microbial genomes and the mouse genome, is
summarized in Table S6.
Non-specific cross-hybridization was controlled in three ways. First, probe
masks for each genome were developed as follows. For analyses involving organisms
for which the finished genomes were used for GeneChip design (B. thetaiotaomicron-B.
vulgatus co-colonizations), a new GeneChip description file (CDF) was created using the
Bio::Affymetrix::CDF perl module obtained from www.cpan.org [16], that included all
genes from the genome of interest. Second, for analyses involving E. rectale-B. thetaiotao-
micron co-colonizations, additional probes were removed to avoid cross-hybridization re-
sulting from misassembly and missing sequences in the E. rectale draft assembly. NCBI
BLASTN [8] was used, with parameters adjusted for small query size (word size 7, no
filtering or gaps), to identify probesets that either failed to find a perfect match in the fin-
ished genomes (once the E. rectale genome was completed), or that registered a hit to more
than one sequence feature with a bit score ≥ 38 (using the default scoring parameters for
BLASTN). This mask reduced the proportion of probesets exhibiting a spurious ‘Present’
call (by Affymetrix software) by 36%. The resulting CDF file was imported into BioCon-

130
ductor using the altcdfenvs package [17], and all expression analyses were performed us-
ing the MAS5 algorithm implemented in BioConductor’s ‘Affy package’ [18], following
masking of GeneChip imperfections with Harshlight [19] - in both cases using the default
parameters. Third, for all analyses we also identified all probesets that registered a ‘Pres-
ent’ call when hybridized to targets generated from the cecal contents of mice that had
been monoassociated with either E. rectale, or B. thetaiotaomicron, or B. vulgatus. These
probesets were also excluded from further analyses and are listed in Table S7.
Proteomic analyses of cecal contents
Cecal contents were pelleted by centrifugation, and the cell pellets processed via a
single tube cell lysis and protein digestion method as follows. Briefly, the cell pellet was re-
suspended in 6M Guanidine/10 mM DTT, heated at 60°C for 1 h followed by an overnight
incubation at 37°C to lyse cells and denature proteins. The guanidine concentration was
diluted to 1 M with 50mM Tris/10mM CaCl2 (pH 7.8) and sequencing grade trypsin (Pro-
mega, Madison, WI) was added (1:100; wt/wt). Digestions were run overnight at 37°C.
Fresh trypsin was then added followed by an additional 4 h incubation at 37°C. The com-
plex peptide solution was subsequently de-salted (Sep-Pak C18 solid phase extraction; Wa-
ters, Milford, MA), concentrated, filtered, aliquoted and frozen at -80°C. All eight samples
were coded and mass spectrometry measurements conducted in a blinded fashion.
Cecal samples were analyzed in technical triplicates using a two-dimensional (2D)
nano-LC MS/MS system with a split-phase column (SCX-RP) [20] on a linear ion trap
(Thermo Fisher Scientific) with each sample consuming a 22 h run as detailed elsewhere
[21, 22]. The linear ion trap (LTQ) settings were as follows: dynamic exclusion set at one;
and five data-dependent MS/MS. Two microscans were averaged for both full and MS/
MS scans and centroid data were collected for all scans. All MS/MS spectra were searched
with the SEQUEST algorithm [23] against a database containing the entire mouse genome,
plus the B. thetaiotaomicron, E. rectale, rice, and yeast genomes (common contaminants

131
such as keratin and trypsin were also included). The SEQUEST settings were as follows:
enzyme type, trypsin; Parent Mass Tolerance, 3.0; Fragment Ion Tolerance, 0.5; up to 4
missed cleavages allowed (internal lysine and arginine residues), and fully tryptic peptides
only (both ends of the peptide must have arisen from a trypsin specific cut, except N and
C-termini of proteins). All datasets were filtered at the individual run level with DTASelect
[24] [Xcorrs of at least 1.8 (+1 ions), 2.5 (+2 ions) 3.5 (+3 ions)]. Only proteins identified
with two fully tryptic peptides were considered. Previous studies with reverse database
searching have shown this filter level to generally give a false positive rate less than 1%
even with large databases [21, 25, 26].
Biochemical analyses
Measurements of acetate, butyrate, propionate, NAD+, NADH, lactate, succinate,
and formate in cecal contents were performed as described previously [11], with the excep-
tion that acetic acid-1-13C,d4 (Sigma) was used as a standard to control for acetate recovery
rather than the isomer listed in the reference.
132
Supplemental References
1. Holdeman, L.V., E.P. Cato, and W.E.C. Moore, Anerobe Laboratory Manual. 4th
Ed. ed. 1977, Blacksburg, VA: Virginia Polytechnic Institute and State University.
2. Delcher, A.L., D. Harmon, S. Kasif, O. White, and S.L. Salzberg, 1999. Improved
microbial gene identification with GLIMMER. Nucleic Acids Res, 27 (23), p. 4636-
41.
3. Besemer, J., A. Lomsadze, and M. Borodovsky, 2001. GeneMarkS: a self-training
method for prediction of gene starts in microbial genomes. Implications for finding
sequence motifs in regulatory regions. Nucleic Acids Res, 29 (12), p. 2607-18.
4. McHardy, A.C., A. Goesmann, A. Puhler, and F. Meyer, 2004. Development of
joint application strategies for two microbial gene finders. Bioinformatics, 20 (10),
p. 1622-31.
5. Lowe, T.M. and S.R. Eddy, 1997. tRNAscan-SE: a program for improved detection
of transfer RNA genes in genomic sequence. Nucleic Acids Res, 25 (5), p. 955-64.
6. Lagesen, K., P. Hallin, E.A. Rodland, H.H. Staerfeldt, T. Rognes, and D.W. Ussery,
2007. RNAmmer: consistent and rapid annotation of ribosomal RNA genes. Nucleic
Acids Res, 35 (9), p. 3100-8.
7. Griffiths-Jones, S., S. Moxon, M. Marshall, A. Khanna, S.R. Eddy, and A. Bateman,
2005. Rfam: annotating non-coding RNAs in complete genomes. Nucleic Acids
Res, 33 (Database issue), p. D121-4.
8. Altschul, S.F., T.L. Madden, A.A. Schaffer, J. Zhang, Z. Zhang, W. Miller, and
D.J. Lipman, 1997. Gapped BLAST and PSI-BLAST: a new generation of protein
database search programs. Nucleic Acids Res, 25 (17), p. 3389-402.
9. Kanehisa, M., S. Goto, M. Hattori, K.F. Aoki-Kinoshita, M. Itoh, S. Kawashima,
T. Katayama, M. Araki, and M. Hirakawa, 2006. From genomics to chemical

133
genomics: new developments in KEGG. Nucleic Acids Res, 34 (Database issue), p.
D354-7.
10. Bry, L., P.G. Falk, T. Midtvedt, and J.I. Gordon, 1996. A model of host-microbial
interactions in an open mammalian ecosystem. Science, 273 (5280), p. 1380-3.
11. Samuel, B.S. and J.I. Gordon, 2006. A humanized gnotobiotic mouse model of
host-archaeal-bacterial mutualism. Proc Natl Acad Sci U S A, 103 (26), p. 10011-
6.
12. Rinttila, T., A. Kassinen, E. Malinen, L. Krogius, and A. Palva, 2004. Development
of an extensive set of 16S rDNA-targeted primers for quantification of pathogenic
and indigenous bacteria in faecal samples by real-time PCR. J Appl Microbiol, 97
(6), p. 1166-77.
13. Samuel, B.S., E.E. Hansen, J.K. Manchester, P.M. Coutinho, B. Henrissat, R. Fulton,
P. Latreille, K. Kim, R.K. Wilson, and J.I. Gordon, 2007. Genomic and metabolic
adaptations of Methanobrevibacter smithii to the human gut. Proc Natl Acad Sci U
S A, 104 (25), p. 10643-8.
14. Xu, J., M.A. Mahowald, R.E. Ley, C.A. Lozupone, M. Hamady, E.C. Martens, B.
Henrissat, P.M. Coutinho, P. Minx, P. Latreille, H. Cordum, A. Van Brunt, K. Kim,
R.S. Fulton, L.A. Fulton, S.W. Clifton, R.K. Wilson, R.D. Knight, and J.I. Gordon,
2007. Evolution of Symbiotic Bacteria in the Distal Human Intestine. PLoS Biol, 5
(7), p. e156.
15. Xu, J., M.K. Bjursell, J. Himrod, S. Deng, L.K. Carmichael, H.C. Chiang, L.V.
Hooper, and J.I. Gordon, 2003. A genomic view of the human-Bacteroides
thetaiotaomicron symbiosis. Science, 299 (5615), p. 2074-6.
16. Hammond, J.P., M.R. Broadley, D.J. Craigon, J. Higgins, Z.F. Emmerson, H.J.
Townsend, P.J. White, and S.T. May, 2005. Using genomic DNA-based probe-
selection to improve the sensitivity of high-density oligonucleotide arrays when

134
applied to heterologous species. Plant Methods, 1 (1), p. 10.
17. Gautier, L., M. Moller, L. Friis-Hansen, and S. Knudsen, 2004. Alternative mapping
of probes to genes for Affymetrix chips. BMC Bioinformatics, 5 p. 111.
18. Gautier, L., L. Cope, B.M. Bolstad, and R.A. Irizarry, 2004. affy--analysis of
Affymetrix GeneChip data at the probe level. Bioinformatics, 20 (3), p. 307-15.
19. Suarez-Farinas, M., M. Pellegrino, K.M. Wittkowski, and M.O. Magnasco,
2005. Harshlight: a “corrective make-up” program for microarray chips. BMC
Bioinformatics, 6 p. 294.
20. McDonald, W.H., R. Ohi, D.T. Miyamoto, T.J. Mitchison, and J.R. Yates III, 2002.
Comparison of three directly coupled HPLC MS/MS strategies for identification of
proteins from complex mixtures: single-dimension LC-MS/MS, 2-phase MudPIT,
and 3-phase MudPIT. Int. J. Mass Spectrom., 219 p. 245-251.
21. Thompson, M.R., N.C. VerBerkmoes, K. Chourey, M. Shah, D.K. Thompson, and
R.L. Hettich, 2007. Dosage-dependent proteome response of Shewanella oneidensis
MR-1 to acute chromate challenge. J Proteome Res, 6 (5), p. 1745-57.
22. VerBerkmoes, N.C., M.B. Shah, P.K. Lankford, D.A. Pelletier, M.B. Strader,
D.L. Tabb, W.H. McDonald, J.W. Barton, G.B. Hurst, L. Hauser, B.H. Davison,
J.T. Beatty, C.S. Harwood, F.R. Tabita, R.L. Hettich, and F.W. Larimer, 2006.
Determination and comparison of the baseline proteomes of the versatile microbe
Rhodopseudomonas palustris under its major metabolic states. J Proteome Res, 5
(2), p. 287-98.
23. Eng, J.K., A.L. McCormack, and J.R. Yates III, 1994. An approach to correlate
tandem mass spectral data of peptides with amino acid sequences in a protein
database. J. Am. Mass Spectrom., 5 p. 976-989.

135
24. Tabb, D.L., W.H. McDonald, and J.R. Yates, 3rd, 2002. DTASelect and Contrast:
tools for assembling and comparing protein identifications from shotgun proteomics.
J Proteome Res, 1 (1), p. 21-6.
25. Lo, I., V.J. Denef, N.C. Verberkmoes, M.B. Shah, D. Goltsman, G. DiBartolo,
G.W. Tyson, E.E. Allen, R.J. Ram, J.C. Detter, P. Richardson, M.P. Thelen, R.L.
Hettich, and J.F. Banfield, 2007. Strain-resolved community proteomics reveals
recombining genomes of acidophilic bacteria. Nature, 446 (7135), p. 537-41.
26. Ram, R.J., N.C. Verberkmoes, M.P. Thelen, G.W. Tyson, B.J. Baker, R.C. Blake,
2nd, M. Shah, R.L. Hettich, and J.F. Banfield, 2005. Community proteomics of a
natural microbial biofilm. Science, 308 (5730), p. 1915-20.
27. DeSantis, T.Z., Jr., P. Hugenholtz, K. Keller, E.L. Brodie, N. Larsen, Y.M. Piceno,
R. Phan, and G.L. Andersen, 2006. NAST: a multiple sequence alignment server
for comparative analysis of 16S rRNA genes. Nucleic Acids Res, 34 (Web Server
issue), p. W394-9.
28. Ludwig, W., O. Strunk, R. Westram, L. Richter, H. Meier, Yadhukumar, A. Buchner,
T. Lai, S. Steppi, G. Jobb, W. Forster, I. Brettske, S. Gerber, A.W. Ginhart, O.
Gross, S. Grumann, S. Hermann, R. Jost, A. Konig, T. Liss, R. Lussmann, M. May,
B. Nonhoff, B. Reichel, R. Strehlow, A. Stamatakis, N. Stuckmann, A. Vilbig, M.
Lenke, T. Ludwig, A. Bode, and K.H. Schleifer, 2004. ARB: a software environment
for sequence data. Nucleic Acids Res, 32 (4), p. 1363-71.
29. Ley, R.E., P.J. Turnbaugh, S. Klein, and J.I. Gordon, 2006. Microbial ecology:
human gut microbes associated with obesity. Nature, 444 (7122), p. 1022-3.
30. Eckburg, P.B., E.M. Bik, C.N. Bernstein, E. Purdom, L. Dethlefsen, M. Sargent,
S.R. Gill, K.E. Nelson, and D.A. Relman, 2005. Diversity of the human intestinal
microbial flora. Science, 308 (5728), p. 1635-8.

136
31. Benjamini, Y. and Y. Hochberg, 1995. Controlling the False Discovery Rate: A
Practical and Powerful Approach to Multiple Testing. Journal of the Royal Statistical
Society. Series B (Methodological), 57 (1), p. 289-300.
32. Martens, E.C., H.C. Chiang, and J.I. Gordon, 2008. Mucosal Glycan Foraging
Enhances the Fitness and Transmission of a Saccharolytic Human Gut Symbiont.
submitted.
33. Reeves, A.R., G.R. Wang, and A.A. Salyers, 1997. Characterization of four
outer membrane proteins that play a role in utilization of starch by Bacteroides
thetaiotaomicron. J Bacteriol, 179 (3), p. 643-9.
137
Supplemental Figure Legends
Figure S1. Phylogenic relationships of human gut-associated Firmicutes and Bacte-
roidetes surveyed in the present study. A phylogeny, based on 16S rRNA gene sequenc-
es, showing the relationships between representatives from two dominant bacterial phyla
in the gut microbiota. Green, genomes generated by the Human Gut Microbiome Initia-
tive (www.genome.gov/Pages/Research/Sequencing/SeqProposals/HGMISeq.pdf). Black,
other available related genomes. Red, organisms used for co-colonization studies described
in the present study. The phylogenetic tree was created by aligning 16S rRNA gene se-
quences from each genome using the NAST aligner [27], importing the alignment into Arb
[28], and then adding them to an existing database of 16S rRNA sequences derived from
enumerations of the human gut [29, 30].
Figure S2. Genes involved in carbohydrate metabolism and energy production whose
representation is significant enriched or depleted in sequenced human gut-associated
Firmicutes and Bacterodetes. The number of genes assigned to each GO term in each ge-
nome is shown. Significance is judged by a binomial test, with multiple hypothesis testing
correction (see Methods) comparing the proportion of genes assigned to a GO term in one
genome versus the average number assigned to the same GO term across all the Firmicutes.
Protein-coding genes were identified using YACOP. Each proteome was assigned InterPro
numbers and GO terms. The Firmicutes also use distinct mechanisms for environmental
sensing and membrane transport. The Bacteroidetes employ a large number of paralogs of
the SusC/D system to bind and import sugars (classified as receptors, GO:0004872), while
the Firmicutes use ABC transporters and phosphotransferase systems (classified as active
membrane transporters, GO:0022804). Color code: red: enriched; blue: depleted; dark,
p<0.001; light, p<0.05) relative to the average of all Bacteroidetes genomes (excluding the
one tested).

138
Figure S3. Comparison of glycoside hydrolases and polysaccharide lyases repertoires
of E..rectale,.E..eligens, B..vulgatus.and B..thetaiotaomicron. The number of genes in
each genome in each CAZy GH or PL family are shown. Families that are significantly de-
pleted relative to B. thetaiotaomicron are colored blue (p<0.001), as judged by a binomial
test followed by Benjamini-Hochberg correction [31]. Families in which the other genom-
es have more members are colored yellow. Families that are absent in B. thetaiotaomicron
are orange. B. thetaiotaomicron has a larger genome and a disproportionately larger as-
sortment of GHs. Both Firmicutes have a reduced capacity to utilize host-derived glycans
(hexosaminidases, mannosidases, and fucosidases; GH20, GH29, GH78, GH95). E. rectale
has a large number of starch-degrading enzymes (GH13), while E. eligens has a capacity to
degrade pectins (PL9, GH28, GH53). See Table S4 or a complete list of all CAZy enzymes
among the sequenced gut Bacteroidetes and Firmicutes examined.
Figure S4. Creation of a minimal synthetic human gut microbiota composed of a se-
quenced Firmicute (E..rectale) and a sequenced Bacteroidetes (B..thetaiotaomicron).
(A) Levels of colonization of the ceca of 11 week-old male gnotobiotic mice colonized
for 14d with one or both organisms. Animals were given an irradiated polysaccharide-
rich chow diet ad libitum. B. thetaiotaomicron and E. rectale colonize the ceca of mice
to similar levels in both monoassociation and bi-association. Error bars denote standard
error of the mean of 2-3 measurements per mouse, 4 mice per group. Results are represen-
tative of 3 independent experiments. (B) Summary of genes showing upregulation in B.
thetaiotaomicron with co-colonization. 55 of the 106 genes are within PULs, and of these,
51 (93%) were upregulated. (C) Summary of B. thetaiotaomicron PUL-associated genes
upregulated with co-colonization and their representation in datasets of genes upregulated
during the suckling-weaning transition, and when adult gnotobiotic mice are switched from
a polysaccharide-rich diet to one devoid of complex glycans and containing simple sugars
(glucose, sucrose). The latter two datasets are composed of all genes upregulated ≥10-fold
relative to log-phase growth in minimal glucose medium [32]. (D) Heat map of GeneChip

139
data from three loci upregulated by B. thetaiotaomicron upon colonization with E. rectale;
two are involved in degradation of α-mannans (left; [32]) which E. rectale cannot access;
the third is the Starch-utilization system (Sus) locus [33], which targets a substrate that
both species can utilize. Maximal relative expression across a row is red; minimal is green.
Differential expression was judged using the MAS5 algorithm and CyberT (see Table S9
and Methods).
Figure S5. In.vitro plate-based assay showing that sugars released by B..thetaiotao-
micron.are utilized by E..rectale,.allowing its colonies to grow larger. E. rectale cells
from an overnight culture were plated on tryptone agar with the indicated carbon sources.
Ten µl of an overnight culture of B. thetaiotaomicron were then spotted in the middle of
the plate (at the right edge of each panel). Note that colonies of E. rectale located closest to
B. thetaiotaomicron grow larger on dextran, a glucose polymer that E. rectale is unable to
degrade. This growth phenotype is due to E. rectale’s ability to acquire glucose monomers
released during the degradation of dextran and not to other growth factors produced by B.
thetaiotaomicron since the effect is not observed in tryptone medium alone (bottom panel),
or in medium with D-arabinose, a simple sugar that E. rectale cannot utilize. Boxed areas
in the upper panels are shown at higher magnification in the lower panels. Bars, 2 mm.
Figure S6. B..vulgatus.adapts to the presence of B.. thetaiotaomicron.by upregulat-
ing its unique repertoire of polysaccharide degrading enzymes. (A) B. vulgatus and B.
thetaiotaomicron colonize germ-free NRMI mice to similar levels in mono- and bi-associ-
ation. Colony forming units (CFU) were measured in the cecum 14 d after gastric gavage
with 108 CFU of one or both bacterial species (n=4 mice/group, 2–3 replicates per mouse;
mean values ± SEM are plotted). (B) Heat map showing three B. vulgatus loci containing
genes involved in xylan and xylose utilization that are significantly upregulated upon co-
colonization with B. thetaiotaomicron. Each column represents one GeneChip hybridized
to cecal contents from one mouse (n=4 per group). (C) A depiction of the predicted xylose-
utilization pathway encoded by the operon displayed in panel B. Red indicates significant

140
upregulation, while violet indicates a level of upregulation that failed to meet the FDR
threshold.

141
Supplemental Figures
Figure S1.
0.10
Ruminococcus obeumClostridium boltae
Clostridium symbiosumEubacterium rectale
Eubacterium eligensDorea longicatena
Clostridium scindensRuminococcus gnavus
Ruminococcus torquesEubacterium ventriosum
Clostridium sp. L2-50Faecalibacterium prausnitzii
Eubacterium siraeumBacteroides capillosus
Clostridium acetobutylicumClostridium beijerinckii
Clostridium perfringensClostridium difficileEubacterium dolicum
Bacteroides vulgatus
Bacteroides thetaiotaomicronBacteroides fragilis
Bacteroides ovatusBacteroides WH2
Bacteroides uniformis
Parabacteroides distasonisParabacteroides merdae
Porphryromonas gingivalisTannerella forsythus
Bifidobacterium adolescentisBifidobacterium longum
Actinomyces odontolyticus

142
Figure S2.
Bac
tero
idet
esF
irm
icu
tes
GO
C
ateg
ory
Des
crip
tio
n
B. caccae B. ovatus B. stercoris B. unifo
rmis B. fr
agilisB. th
etaB. vulgatus P. d
istasonis P. merdae C. bolte
ae C. scindens C. sp. L2-50 C. symbiosum
R. gnavus R. obeum R. torques C. eutactus D. longicatena
A. colihominis
B. capillosus F. p
rausnitzii P. micros E. dolichum E. sira
eum E. ventriosum E. elig
ens E. rectale
To
tal g
enes
2093
2677
1857
2181
2313
2674
2296
2234
2060
3561
2099
1500
2602
2002
1993
1470
1529
1722
1972
2112
1557
977
1294
1352
1480
1563
1792
0030
246
carb
ohyd
rate
bin
ding
2542
2335
2636
3019
2135
2115
2213
1115
1213
1220
115
1314
2110
1500
1679
8gl
ycos
ide
hydr
olas
e97
194
4812
497
162
116
6270
5116
2822
4629
2940
2713
3531
425
4630
2341
0008
484
sulfu
ric e
ster
hyd
rola
se a
ctiv
ity23
2613
2020
3216
2015
13
10
22
23
12
51
00
04
23
0016
651
NA
D(P
)H o
xido
redu
ctas
e17
1716
1616
1716
109
114
33
34
21
23
41
21
21
11
0016
788
este
r hy
drol
ase
9811
383
8987
117
8486
7870
5352
6760
5154
4949
5167
5040
4851
5455
5200
1665
5ox
idor
educ
tase
1515
1414
1415
148
78
22
11
11
00
10
01
01
00
000
0015
0re
com
bina
se a
ctiv
ity2
44
24
35
55
2121
69
1611
117
621
3633
57
411
213
0004
803
tran
spos
ase
activ
ity12
1647
134
2433
215
229
413
1815
147
157
52
222
32
611
Oxy
gen
se
nsi
tivi
ty00
1620
9an
tioxi
dant
act
ivity
1518
88
1511
1811
117
22
63
43
15
25
13
20
01
2
0060
089
mol
ecul
ar tr
ansd
ucer
act
ivity
170
281
123
173
198
253
190
192
155
195
108
7212
989
8944
8564
6386
4714
2755
6473
9500
0487
1si
gnal
tran
sduc
er a
ctiv
ity17
028
112
317
319
825
319
019
215
519
510
872
129
8989
4485
6463
8647
1427
5564
7395
0003
711
tran
scrip
tion
elon
gatio
n re
gula
tor
69
712
139
68
44
33
94
34
44
34
22
32
33
300
0467
3pr
otei
n hi
stid
ine
kina
se a
ctiv
ity56
9337
5761
8951
6843
8952
3463
3948
2040
2822
3421
814
2025
2230
0000
155
two-
com
pone
nt s
enso
r ac
tivity
5286
3453
5783
4560
3486
4730
5637
4317
3927
2027
207
1218
2422
2900
3052
8tr
ansc
riptio
n re
gula
tor
activ
ity16
324
511
916
119
523
817
317
015
144
522
112
732
221
119
012
315
416
516
625
814
152
8611
412
313
116
400
0487
2re
cept
or a
ctiv
ity92
163
6493
105
134
116
9489
53
01
00
13
32
01
01
23
21
0008
565
prot
ein
tran
spor
ter
activ
ity37
4125
3541
4332
3333
127
515
57
56
510
68
35
84
610
0022
804
activ
e tr
ansm
embr
ane
tran
spor
ter
6471
5566
7674
6872
5921
191
8216
013
510
593
8212
393
127
9371
109
7510
397
90
0022
891
subs
trat
e-sp
ecifi
c tr
ansm
embr
ane
tran
spor
ter
9210
675
8910
011
195
9986
202
116
8117
312
395
8979
123
104
117
9262
114
6910
592
88
0015
291
seco
ndar
y ac
tive
tran
smem
bran
e tr
ansp
orte
r30
3623
3537
3735
4031
135
4344
102
6653
3744
7443
5458
1760
2755
5143
0015
399
prim
ary
activ
e tr
ansm
embr
ane
tran
spor
ter
3535
3231
3937
3332
2873
4837
5866
5354
3849
5072
3554
3948
4747
47
0015
144
carb
ohyd
rate
tran
smem
bran
e tr
ansp
orte
r10
147
89
189
129
5911
1011
309
187
2010
2520
453
727
1214
0015
197
pept
ide
tran
spor
ter
00
00
00
00
029
80
203
10
00
94
31
20
20
2M
oti
lity
0019
861
flage
llum
00
02
00
00
021
00
171
00
00
230
01
019
026
23
Tran
spo
rt
En
erg
y p
rod
uct
ion
Mo
bile
el
emen
ts
En
viro
n-
men
tal
sen
sin
g
and
re
gu
lati
on
Po
ly-
sacc
har
ide
met
abo
lism

143
Figure S3.
GH2 various 32 25 3 2GH20 hexosaminidase 20 8 0 0GH43 furanosidase 31 22 2 3GH92 α-1-2-mannosidase 23 9 0 0GH76 α-1-6-mannosidase 10 0 0 0GH97 a-glucosidase 10 7 0 0
GH18chitinase/ glucosaminidase 12 2 1 1
GH28 galacturonase 9 13 0 3GH29 α-fucosidase 9 8 0 0GH1 6-P-ß-glucosidase 0 0 1 1GH25 lysozyme 1 1 4 5GH94 phosphorylase 0 0 3 1PL9 pectate lyase 2 0 0 4GH8 oligoxylanase 0 0 1 0GH13 α-amylase 7 4 13 6GH24 lysozyme 0 1 1 0GH42 ß-galactosidase 1 1 2 0
GH53endo-1,4-galactanase 1 0 2 0
GH77 amylomaltase 1 1 3 1
GH112galacto-N-biose phosphorylase 0 0 1 0
GH10 xylanase 0 1 0 0GH15 α-glycosidase 0 1 0 0GH63 α-glucosidase 0 2 0 0
255 167 52 3017 7 0 7
Total GHTotal PL
B. theta
B. vulg
atus
E. recta
le
E. elig
ensCAZyFamily

144
Figure S4.
BT3787 NHL repeat-containing protein
BT3788 SusC homolog
BT3789 SusD homolog
BT3790 Hypothetical protein
BT3691 Concanavalin A-like lectin/glucanase
BT3792 GH73 putative α-1,6-mannanase
BT3698 SusG, GH13 alpha amylase
BT3699 SusF, outer membrae lipoprotein
BT3700 SusE, outer membrae lipoprotein
BT3701 SusD, outer membrae lipoprotein
BT3702 SusC
BT3703 SusB, GH97 α-glucosidase
BT3704 SusA, GH13 α-amylase
BT3774 GH38 α-mannosidase
BT3775 GT32 Glycosyltransferase
BT3776 GT32 Glycosyltransferase
BT3777 Hypothetical protein
All genes(4778)
788
51 up4 down
42 up9 down
Bt vs Bt+Erregulated
Glucose-Sucrose vspolysaccharide-rich chow
Bt vs Bt+Erup
Suckling vs Weaning
25
63
5 45
7
10
29
PULs alone(843 genes)
Bt Bt+Er
Bt Bt+Er
A B C
1011
1010
109
108
107
106
105
104
103
102
101
100
B. theta E. rectale
Gen
om
e eq
uiv
alen
ts/c
ecu
m
Mono-associationCo-colonization
PULs
D

145
Figure S5.
Tryptone
D-arabinose
Dextran

146
Figurs S6.
B. theta B. vulgatus
CF
U/m
l cec
al c
on
ten
ts
BVU_0354:Ribose permease
BVU_0355:Putative integral membrane protein
BVU_0356:Putative fucose-isomerase
BVU_0357:glycerol/xylulose kinase
BVU_0358:transketolase, C-terminal subunit
BVU_0359:transketolase, N-terminal subunit
BVU_0036:Hypothetical protein
BVU_0037:SusD homolog
BVU_0038:SusC homolog
BVU_0039:GH43 ß-xylosidase
BVU_0040:GH43 ß-xylosidase
BVU_0041:GH10 ß-xylanase
BVU_1983:GH43 xylosidase
BVU_1984:conserved hypothetical protein
BVU_1985:GH28 polygalacturonidase homolog
Bv Bv+Bt
BA
xylose
glycolysis
fructose-6-P
xylulose
xylose(intracellular)
xylulose-6-P
(extracellular)permease / transporter
xylose isomerase5.3.1.5
xylulose kinase2.7.1.17
transketolase2.2.1.1
BVU_0354
BVU_0356
BVU_0357
BVU_0358-9
C
BVU_0354Ribose
permease
BVU_0355hypothetical protein
BVU_0356hypothetical protein
with fucose isomerasedomain
BVU_0357Glycerol/xylulose kinase
BVU_0358transketolase
N-terminal subunit
BVU_0359transketolase,
C-terminal subunit
D
1012
108
104
100
Mono-associationCo-colonization

147
Supplemental Table Legends
Table S1. Summary of results of genome finishing for E..rectale strain ATCC 33656 and E..
eligens strain ATCC 27750.
Table S2. Annotated finished genome of E..rectale strain ATCC 33656. Mean Expr. Fields
give average expression value for each GeneChip condition: T-G = log-phase tryptone-
glucose broth; Mono = cecum, monoassociation; BtEr = cecum, co-colonization with B.
thetaiotaomicron. Abs = “absent” signal; N/A = feature not included in analysis.
Table S3. Annotated finished genome of E..eligens strain ATCC 27750.
Table S4. CAZy categorization of glycoside hydrolase and polysaccharide lysase genes in the
sequenced human gut-derived bacterial species surveyed. Highlighted categories have increased
numbers of genes in gut Firmicutes compared to gut Bacteroidetes.
Table S5. Growth of B..thetaiotaomicron,.B..vulgatus.and E..rectale.in defined medium with
the indicated carbon sources. Differences between B. thetaiotaomicron and the other two species
are highlighted.
Table S6. Custom GeneChip containing genes from six common human gut microbes, rep-
resenting two bacterial phyla and two domains of life. Genome sequences are reported here or
in earlier reports from our group [13-15]. Numbers in parentheses denote remaining GeneChip
features after application of a cross-hybridization probe mask (for details, see Methods).
Table S7. GeneChip probesets yielding ≥60% Present calls when hybridized to cDNAs pre-
pared from the cecal contents of mice colonized with the indicated species. These probesets
were excluded from all analyses involving that species.
Table S8. List of B..thetaiotaomicron genes whose expression in the ceca of gnotobiotic mice
was significantly affected by E..rectale. Significance measured by CyberT; Fold=fold difference
in expression in co-colonization relative to monoassociation; PPDE(p)=posterior probability of dif-
ferential expression for an individual gene; PPDE(<p)= global posterior probability of differential

148
expression for the set of all genes with PPDE≥PPDE(p). PPDE(<p) ≥ 0.95 was used as a cutoff.
Detection by MS/MS lists the number of technical replicates (out of 3) in which each protein was
detected.
Table S9. List of E..rectale.genes whose expression in the ceca of gnotobiotic mice was significant-
ly affected by the presence of B..thetaiotaomicron. Significance measured by CyberT; Fold=fold
difference in expression in co-colonization relative to monoassociation; PPDE(p)=posterior prob-
ability of differential expression for an individual gene; PPDE(<p)= global posterior probability
of differential expression for the set of all genes with PPDE≥PPDE(p). PPDE(<p) ≥ 0.95 and ±1.5
minimum fold change were used as cutoffs. Detection by MS/MS lists the number of technical
replicates (out of 3) in which each protein was detected.
Table S10. Changes in E..rectale gene expression when comparing E..rectale’s transcription
during logarithmic phase growth on tryptone-glucose (T-G) medium with its transcriptome
during mono-colonization of the cecum. Significance measured by CyberT; Fold=fold difference
in expression in co-colonization relative to monoassociation; PPDE(p)=posterior probability of dif-
ferential expression for an individual gene; PPDE(<p)= global posterior probability of differential
expression for the set of all genes with PPDE≥PPDE(p). PPDE(<p) ≥ 0.99 was used as a cutoff.
Table S11. Proteomic analysis of the cecal contents of gnotobiotic mice.
Spectral counts corresponding to every identfied protein are listed for each of 3 replicates per
sample from 2 independent experiments are shown.
Table S12. Summary of the validation of hypothetical and previously unannotated proteins in
E..rectale.and B..thetaiotaomicron using tandem mass spectrometry.
Legend

149
a 12 individual MS/MS runs, three from each of two monoassociated and two B. thetaiotaomicron/E.
rectale co-colonnized mice comprising two independent biological experiments, searched using
SEQUEST (see Methods for details).
bAssignments to a COG or KEGG orthology group or Interpro number (for details, see Methods).
cAdditional genes were identified using GeneMarkS [3] and added to the search database.
Table S13. List of B..thetaiotaomicron genes whose expression in the ceca of gnotobiotic mice
was significantly affected by the presence of B.. vulgatus. Significance measured by CyberT;
Fold=fold difference in expression in co-colonization relative to monoassociation; p-value=p-value
of Baysian t-test; corrected p-value=p-value with Benjamini-Hochberg multiple hypothesis testing
correction applied [31].
Table S14. List of B.. vulgatus genes whose expression in the ceca of gnotobiotic mice was
significantly affected by the presence of B.. thetaiotaomicron. Significance measured by Cy-
berT; Fold=fold difference in expression in co-colonization relative to monoassociation;
PPDE(p)=posterior probability of differential expression for an individual gene; PPDE(<p)= global
posterior probability of differential expression for the set of all genes with PPDE≥PPDE(p).

150
Supplemental Tables
Table S1.
E. rectale E. eligens
Genome size (bp) 3,449,685 2,831,389
Plasmids 0 2 (626 kb, 60 kb)
Predicted proteins 3,627 2,766
tRNAs 57 47
rRNAs 15 15
Other features 20 17
ABI 3730xl Plasmid reads 120,005 reads (9.6x) 37,846 reads (4.0x)
454 GS20 Pyrosequencer 120 Mb (40x) 114 Mb (40x)
Finishing reactions 204 104

151
Table S2.
Please access provided CD for this information.

152
Table S3.
Please access provided CD for this information.

153
Table S4.
Tabl
e S4
.
Glycoside hydrolase /
Polysaccharide lyase family Bacteroidetes total
Firmicutes total B. thetaiotaomicron VPI5482
B. fragilis NCTC9343B. uniformis B. vulgatus B. ovatus B. stercoris B. caccae Parabacteroides distasonis
P. merdae Anaerotruncus colhominis
Clostridium scindensC. boltae Coprococcus eutactus
D. longicatena Eubacterium dolichumE. eligens E. rectale E. siraeum E. ventriosum Faecalibacterium prausnitzii
Clostridium sp. L2-50Peptostreptococcus micros
Ruminococcus gnavus
R. torques R. obeum
GH
Tot
al14
6056
125
513
217
316
729
984
136
9611
813
2455
4329
2430
5257
4331
92
5944
46PL
Tot
al80
1117
21
724
189
02
00
20
00
70
00
00
02
00
GH
10
290
00
00
00
00
00
42
24
11
01
30
05
51
GH
218
236
3215
2225
376
1611
180
12
34
02
32
27
00
62
2G
H3
9529
1010
235
215
108
32
02
22
20
34
22
10
40
3G
H4
09
00
00
00
00
00
03
00
20
00
02
00
02
0G
H5
2022
21
72
70
00
10
00
20
01
113
20
00
20
1G
H8
01
00
00
00
00
00
00
00
00
10
00
00
00
0G
H9
82
00
60
11
00
00
00
20
00
00
00
00
00
0G
H10
70
00
01
60
00
00
00
00
00
00
00
00
00
0G
H13
4898
76
74
56
38
22
610
86
36
136
53
40
95
12G
H15
40
00
11
10
01
00
00
00
00
00
00
00
00
0G
H16
306
46
11
53
71
20
00
10
00
00
40
10
00
0G
H17
01
00
00
00
00
00
00
00
00
00
10
00
00
0G
H18
3017
122
32
92
00
00
23
01
01
10
40
00
22
1G
H20
928
2012
58
137
126
90
00
00
30
00
00
00
04
1G
H23
2726
33
33
33
33
31
22
03
02
11
11
11
40
6G
H24
22
00
01
00
01
00
01
00
00
10
00
00
00
0G
H25
737
11
11
11
10
06
24
31
05
43
21
10
23
0G
H26
98
02
30
30
01
00
01
20
00
05
00
00
00
0G
H27
142
53
01
31
10
00
00
01
00
01
00
00
00
0G
H28
507
90
213
145
31
30
01
00
03
00
02
00
10
0G
H29
567
910
28
74
121
30
10
00
00
02
00
00
21
1G
H30
91
10
22
20
02
00
00
00
00
00
10
00
00
0G
H31
4121
64
64
111
42
30
03
10
20
32
41
00
31
1G
H32
1921
42
41
22
21
10
02
34
20
21
00
00
30
4G
H33
224
23
12
43
31
30
00
00
00
00
00
00
13
0G
H35
181
34
11
20
51
10
00
00
00
01
00
00
00
0G
H36
1819
33
12
31
22
10
02
50
10
32
01
00
22
1G
H38
72
21
20
10
01
00
01
00
00
00
10
00
00
0

154
Glycoside hydrolase /
Polysaccharide lyase family Bacteroidetes total
Firmicutes total B. thetaiotaomicron VPI5482
B. fragilis NCTC9343B. uniformis B. vulgatus B. ovatus B. stercoris B. caccae Parabacteroides distasonis
P. merdae Anaerotruncus colhominis
Clostridium scindensC. boltae Coprococcus eutactus
D. longicatena Eubacterium dolichumE. eligens E. rectale E. siraeum E. ventriosum Faecalibacterium prausnitzii
Clostridium sp. L2-50Peptostreptococcus micros
Ruminococcus gnavus
R. torques R. obeum
GH
424
81
01
11
00
00
01
01
00
02
00
00
01
12
GH
4314
217
319
1722
352
87
110
01
11
03
26
01
00
00
2G
H50
30
00
00
30
00
00
00
00
00
00
00
00
00
0G
H51
246
42
33
40
23
30
01
11
00
11
00
00
01
0G
H53
53
10
10
11
10
00
00
10
00
20
00
00
00
0G
H55
21
00
20
00
00
00
00
00
00
00
10
00
00
0G
H57
90
11
11
11
11
10
00
00
00
00
00
00
00
0G
H59
01
00
00
00
00
00
00
00
00
01
00
00
00
0G
H63
70
00
32
01
01
00
00
00
00
00
00
00
00
0G
H64
01
00
00
00
00
00
00
00
00
00
10
00
00
0G
H65
43
01
10
02
00
00
20
00
00
00
10
00
00
0G
H66
30
10
10
10
00
00
00
00
00
00
00
00
00
0G
H67
40
10
01
20
00
00
00
00
00
00
00
00
00
0G
H68
03
00
00
00
00
00
21
00
00
00
00
00
00
0G
H73
1617
11
11
21
13
50
22
11
21
10
10
11
22
0G
H74
31
00
10
02
00
00
00
00
00
01
00
00
00
0G
H76
291
103
50
81
01
10
00
00
00
00
10
00
00
0G
H77
924
11
11
11
11
11
22
22
11
32
21
00
11
3G
H78
435
62
35
80
27
100
01
00
00
00
01
00
10
2G
H81
04
00
00
00
00
00
00
00
00
00
40
00
00
0G
H84
74
11
11
00
11
10
00
00
10
00
00
00
03
0G
H88
324
41
13
84
60
50
02
00
00
00
01
00
10
0G
H89
142
31
01
40
30
20
00
00
10
00
00
00
01
0G
H91
20
00
00
10
10
00
00
00
00
00
00
00
00
0G
H92
107
123
810
919
65
1413
00
00
00
00
01
00
00
00
GH
931
01
00
00
00
00
00
00
00
00
00
00
00
00
GH
941
120
01
00
00
00
10
02
00
13
21
10
00
01
GH
9532
85
41
47
34
13
00
00
00
10
10
00
03
21
GH
9755
010
49
712
34
33
00
00
00
00
00
00
00
00
GH
981
10
00
01
00
00
00
00
00
00
00
00
01
00
GH
991
01
00
00
00
00
00
00
00
00
00
00
00
00

155
Glycoside hydrolase /
Polysaccharide lyase family Bacteroidetes total
Firmicutes total B. thetaiotaomicron VPI5482
B. fragilis NCTC9343B. uniformis B. vulgatus B. ovatus B. stercoris B. caccae Parabacteroides distasonis
P. merdae Anaerotruncus colhominis
Clostridium scindensC. boltae Coprococcus eutactus
D. longicatena Eubacterium dolichumE. eligens E. rectale E. siraeum E. ventriosum Faecalibacterium prausnitzii
Clostridium sp. L2-50Peptostreptococcus micros
Ruminococcus gnavus
R. torques R. obeum
GH
101
02
00
00
00
00
00
00
00
00
00
00
00
02
0G
H10
539
97
02
713
35
02
00
30
00
20
00
20
02
00
GH
106
140
30
03
41
10
20
00
00
00
00
00
00
00
0G
H10
81
00
01
00
00
00
00
00
00
00
00
00
00
00
GH
109
220
23
35
21
41
10
00
00
00
00
00
00
00
0G
H11
09
02
20
20
02
01
00
00
00
00
00
00
00
00
GH
112
07
00
00
00
00
00
11
00
00
10
01
00
11
1PL
121
35
00
29
32
00
00
00
00
30
00
00
00
00
PL8
170
41
10
23
40
20
00
00
00
00
00
00
00
0PL
97
42
00
02
03
00
00
00
00
40
00
00
00
00
PL10
50
10
02
11
00
00
00
00
00
00
00
00
00
0PL
1110
11
00
35
10
00
00
00
00
00
00
00
01
00
PL12
103
21
00
34
00
00
02
00
00
00
00
00
10
0PL
133
01
00
01
10
00
00
00
00
00
00
00
00
00
PL15
70
10
00
15
00
00
00
00
00
00
00
00
00
0

156
Table S5.
Tabl
e S5
.
Car
bon
sour
ceC
lass
E. recta
le B. theta
iotaomicr
on
B. vulgatu
s
sour
ceSt
erili
zatio
nC
omm
ents
empt
y-
--
FSD
(-)ar
abin
ose
mon
osac
char
ide
-+
+Si
gma
A313
1FS
pent
ose
D(-)
fruct
ose
mon
osac
char
ide
++
+Si
gma
F012
7FS
hexo
seL(
-)fuc
ose
mon
osac
char
ide
-+
+Si
gma
F225
2FS
deox
y-he
xose
D(+
)gal
acto
sem
onos
acch
arid
e+
++
Sigm
a G
0750
FShe
xose
D-g
alac
turo
nic
acid
mon
osac
char
ide
-+
+Fl
uka
7396
0FS
mod
ified
mon
osac
char
ide
D-g
lucu
roni
c ac
idm
onos
acch
arid
e-
++
Sigm
a G
8645
FSm
odifi
ed m
onos
acch
arid
eD
(+)g
luco
sam
ine
mon
osac
char
ide
++
mar
gSi
gma
G48
75FS
mod
ified
mon
osac
char
ide
D(+
)glu
cose
mon
osac
char
ide
++
+Si
gma
G82
70FS
hexo
seD
(+)m
anno
sem
onos
acch
arid
e-
++
Sigm
a M
4625
FShe
xose
N-a
cety
lgal
acto
sam
ine
mon
osac
char
ide
-+
+Si
gma
A279
5FS
mod
ified
mon
osac
char
ide
N-a
cety
lglu
cosa
min
e(G
lcN
AC)
mon
osac
char
ide
++
+Si
gma
A328
6FS
mod
ified
mon
osac
char
ide
N-a
cety
lmur
amic
aci
d (M
urN
AC)
mon
osac
char
ide
--
-Si
gma
A300
7FS
mod
ified
mon
osac
char
ide
N-a
cety
lneu
ram
inic
aci
d (IV
-S)
mon
osac
char
ide
--
+Si
gma
A081
2FS
mod
ified
mon
osac
char
ide
(Sia
lic A
cid)
L-rh
amno
sem
onos
acch
arid
e-
++
Sigm
a R
3875
FSde
oxy-
hexo
seD
(-)rib
ose
mon
osac
char
ide
-+
-Si
gma
R75
00FS
pent
ose
D(+
)xyl
ose
mon
osac
char
ide
++
+Si
gma
X387
7FS
pent
ose
D(+
)cel
lobi
ose
disa
ccha
ride
+-
-Si
gma
C72
52FS
ß(1-
4) g
luco
se d
isac
char
ide
sucr
ose
disa
ccha
ride
-+
+Fi
sher
S5
FSFr
u(al
pha1
-2)G
lc d
isac
char
ide
lact
ose
(b-la
ctos
e)di
sacc
harid
e+
++
Sigm
a L3
750
FSG
al(ß
1-4)
Glc
dis
acch
arid
ech
ondr
oitin
sul
fate
A/C
(b
ovin
e tra
chea
)ho
st, G
AG-
+-
Sigm
a C
9819
AC

157
Car
bon
sour
ceC
lass
E. recta
le B. theta
iotaomicr
on
B. vulgatu
s
sour
ceSt
erili
zatio
nC
omm
ents
derm
atan
sul
fate
host
, GAG
-+
-Si
gma
C37
88AC
hepa
rin (p
orci
ne
muc
osa)
host
, GAG
-+
-Si
gma
H07
77AC
hyal
uron
an (r
oost
er
com
b)ho
st, G
AG-
+-
Sigm
a H
5388
AC
arab
inan
(sug
ar b
eet)
plan
t, pe
ctin
-+
+M
egaz
yme
P-AR
ABAC
arab
inog
alac
tan
(larc
h)pl
ant,
pect
in-
+-
Meg
azym
e P-
ARG
ALAC
plan
t cel
l wal
lpe
ctic
gal
acta
n (p
otat
o)pl
ant,
pect
in-
++
Meg
azym
e P-
GAP
TAC
poly
gala
ctur
onat
e (c
itrus
pe
el)
plan
t, pe
ctin
-+
+M
egaz
yme
P-G
ACT
AC
rham
noga
lact
uron
an I
(pot
ato
pect
in)
plan
t, pe
ctin
--
+M
egaz
yme
P-R
HAM
1AC
arab
inox
ylan
(whe
at)
plan
t, he
mic
ellu
lose
--
-M
egaz
yme
P-W
AXYL
ACar
abin
ose,
xyl
ose
bran
ched
b-gl
ucan
(bar
ley)
plan
t, he
mic
ellu
lose
--
-M
egaz
yme
P-BG
BLAC
gala
ctom
anna
n (c
arob
)pl
ant,
hem
icel
lulo
sem
arg
--
Meg
azym
e P-
GAL
ML
ACga
lact
ose,
man
nan
bran
ched
gluc
oman
nan
(kon
jac)
plan
t, he
mic
ellu
lose
mar
g-
-M
egaz
yme
P-G
LCM
LAC
gluc
ose,
man
nan
linea
rm
ethy
l glu
coro
nyl x
ylan
plan
t, he
mic
ellu
lose
--
+Si
gma
M51
44AC
xyla
n (o
at s
pelt)
(c
larif
ied)
plan
t, he
mic
ellu
lose
mar
g-
-Fl
uka
9559
0AC
hem
icel
lulo
se
xylo
gluc
an (t
amar
ind)
plan
t, he
mic
ellu
lose
--
-M
egaz
yme
P-XY
GLN
AChe
mic
ellu
lose
carb
oxym
ethy
l cel
lulo
sepl
ant,
cellu
lose
--
-Fl
uka
2190
2AC
a-m
anna
n (S
.ce
revi
siae
)ot
her
-+
-Si
gma
M75
04AC
fung
al c
ell w
all
algi
nate
(bro
wn
alga
e)ot
her
--
-Si
gma
1809
47AC
colo
min
ic a
cid
(E. c
oli)
othe
r-
--
Sigm
a C
5762
ACde
xtra
n (L
.m
esen
tero
ides
)ot
her
-+
-Si
gma
D52
51AC
bact
eria
l sec
rete
d
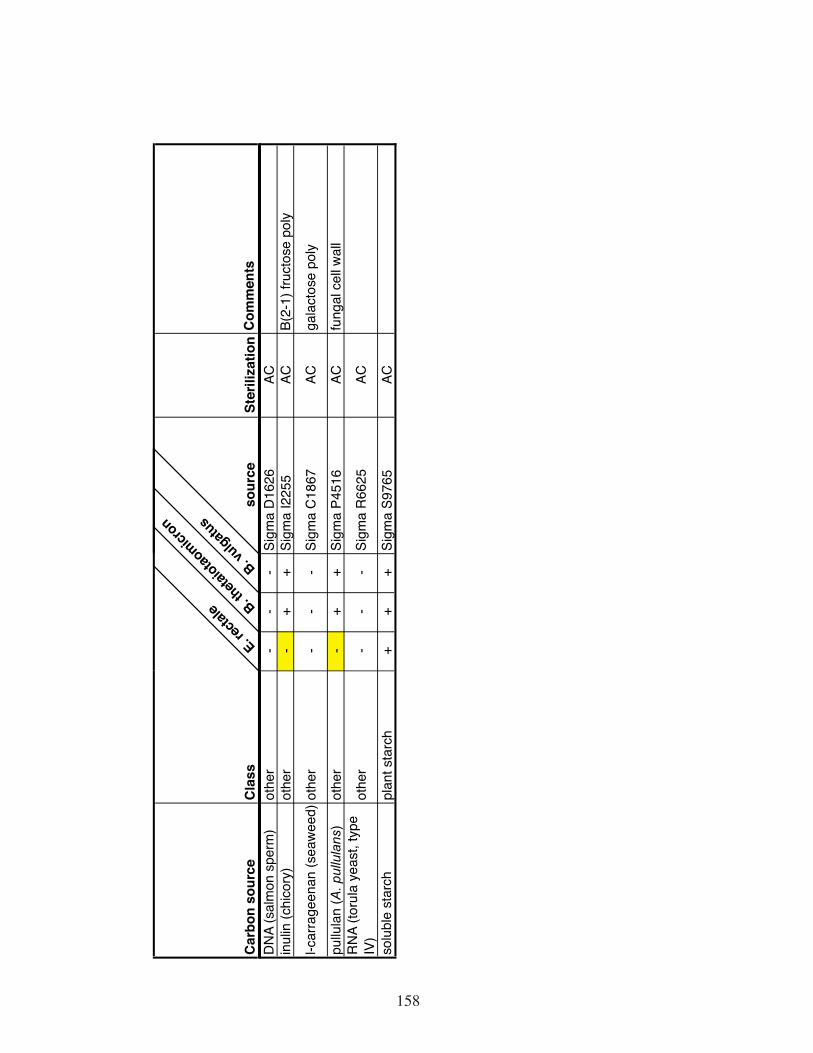
158
Car
bon
sour
ceC
lass
E. recta
le B. theta
iotaomicr
on
B. vulgatu
s
sour
ceSt
erili
zatio
nC
omm
ents
DN
A (s
alm
on s
perm
)ot
her
--
-Si
gma
D16
26AC
inul
in (c
hico
ry)
othe
r-
++
Sigm
a I2
255
ACB(
2-1)
fruc
tose
pol
y
l-car
rage
enan
(sea
wee
d)ot
her
--
-Si
gma
C18
67AC
gala
ctos
e po
ly
pullu
lan
(A. p
ullu
lans
)ot
her
-+
+Si
gma
P451
6AC
fung
al c
ell w
all
RN
A (to
rula
yea
st, t
ype
IV)
othe
r-
--
Sigm
a R
6625
AC
solu
ble
star
chpl
ant s
tarc
h+
++
Sigm
a S9
765
AC

159
Table S6
Table S6.
Species B. theta B. vulgatus P. distasonis E. rectale E. eligens M. smithii
Genes 5059 4557 4140 3699 2852 1838Proteins 4973 4445 4057 3627 2773 1796
Probe pairs 54961(53876) 57313 52355 36943
(32794) 25934 25425
Probe sets 4998(4924) 9400 8441 2644
(2382) 1860 3445
Genescovered
4927(4922) 4303 4008 2600
(2367) 1786 1815
Proteinscovered
4900(4896) 4303 4008 2557
(2348) 1773 1782
Intergenicprobes 0 8508 7198 0 0 4931
% of proteinscovered
99%(98%) 97% 99% 71%
(65%) 64% 99%

160
Table S7.
Table S7.B. theta probe sets cross-hybridizing with B.vulgatus cDNA
B. vulgatus probe sets cross-hybridizing with B.theta cDNA
B. theta probe sets cross-hybridizing with E. rectale cDNA
E. rectale probe sets cross-hybridizing with B. theta cDNA
BT0174_at Bv_tRNA21_x_at BT0101_at Er-060123-0150_atBT0216_at Bv_tRNA22_x_at BT0133_at Er-060123-0898_atBT0332_at Bv_tRNA31_x_at BT0136_at Er-060123-0918_atBT0351_at Bv_tRNA46_x_at BT0154_at Er-060123-0953_atBT0353_at Bv_tRNA70_x_at BT0317_at Er-060123-1056_atBT0413_at Bv_tRNA73_x_at BT0332_at Er-060123-1145_atBT0422_at Bv_tRNA74_x_at BT0366_at Er-060123-1250_atBT0433_at Bv_tRNA84_x_at BT0535_at Er-060123-1311_atBT0623_at Bv0006c_at BT0733_at Er-060123-1330_atBT0701_at Bv0046c_at BT0753_at Er-060123-1481_atBT0703_at Bv0100_at BT0897_at Er-060123-1503_atBT0756_at Bv0205c_at BT0968_at Er-060123-1748_atBT0790_at Bv0230c_at BT1003_at Er-060123-2049_atBT0804_at Bv0326_at BT1012_at Er-060123-2292_atBT0827_at Bv0584c_at BT1095_at Er-060123-2382_atBT1088_at Bv0602c_at BT1105_s_at Er-060123-2406_atBT1103_s_at Bv0797c_s_at BT1107_s_at Er-060123-2446_atBT1104_s_at Bv0903_at BT1449_at Er-060123-2496_atBT1105_s_at Bv0923c_at BT1533_at Er-060123-tRNA12_x_atBT1107_s_at Bv1199_at BT1607_at Er-060123-tRNA17_x_atBT1108_s_at Bv1322_at BT1683_at Er-060123-tRNA50_atBT1109_s_at Bv1361c_at BT16S_rRNA1_copy1_a_atBT1110_s_at Bv1547c_at BT16S_rRNA1_copy2_a_atBT1337_at Bv1567c_at BT16S_rRNA1_copy3_a_atBT1470_at Bv1615c_at BT16S_rRNA1_copy4_a_atBT1523_at Bv1621_at BT1734_atBT1550_at Bv1625_at BT1814_atBT1627_at Bv1630_at BT1851_atBT1691_at Bv1652c_at BT2053_atBT16S_rRNA1_copy1_a_at Bv1872c_at BT2099_atBT16S_rRNA1_copy2_a_at Bv1978_at BT2271_atBT16S_rRNA1_copy3_a_at Bv2075_at BT23S_rRNA1_a_atBT16S_rRNA1_copy4_a_at Bv2090_at BT2448_atBT1766_at Bv2157_at BT2505_atBT1833_at Bv2214_at BT2524_atBT1882_at Bv2256c_at BT2862_atBT1966_at Bv2325c_s_at BT3189_atBT2002_at Bv2384c_at BT3254_atBT2026_at Bv23s_RNA1_a_at BT3411_atBT2157_at Bv2428c_at BT3552_atBT2163_at Bv2548_at BT3644_atBT2191_at Bv2573c_s_at BT3688_atBT2238_at Bv2841_at BT3800_atBT23S_rRNA1_a_at Bv2891_at BT3856_atBT2532_at Bv3373_at BT3935_atBT2553_at Bv3402_at BT3950_atBT2712_at Bv3409_at BT4047_atBT2737_at Bv3434c_s_at BT4064_atBT3020_at Bv3468c_at BT4106_atBT3055_at Bv3472c_at BT4162_atBT3116_at Bv3473c_at BT4289_at

161
B. theta probe sets cross-hybridizing with B.vulgatus cDNA
B. vulgatus probe sets cross-hybridizing with B.theta cDNA
B. theta probe sets cross-hybridizing with E. rectale cDNA
E. rectale probe sets cross-hybridizing with B. theta cDNA
BT3254_at Bv3526_at BT4522_atBT3272_at Bv3622c_at BT4649_atBT3299_at Bv3891_at BT4696_atBT3644_at Bv3957c_at BT4736_atBT3759_at Bv-GM2025_x_at BT4772_atBT3871_at Bv-GM2278_at BT-GM1094_atBT3991_at Bv-GM3714_s_at BT-GM2964_atBT4028_at Bv-GM4208_x_at BT-tRNA45_x_atBT4059_at BT-tRNA64_x_atBT4121_atBT4195_atBT4404_atBT4461_atBT4496_atBT4555_atBT4557_atBT4666_atBT-GM1625_atBT-GM2011_atBT-GM2011_x_atBT-GM2028_atBT-tRNA1_x_atBT-tRNA41_s_atBT-tRNA45_x_atBT-tRNA5_atBT-tRNA5_x_atBT-tRNA55_x_atBT-tRNA58_x_at

162
Table S8.
Tabl
eS8
Locu
s ta
gPr
obe
set
Mon
o-as
soci
atio
nav
erag
e
Bi-
asso
ciat
ion
aver
age
Fold
chan
gePP
DE
(<p)
Mon
o-as
soci
atio
nre
p. 1
Mon
o-as
soci
atio
nre
p. 2
Co-
colo
niza
tion
rep.
1
Co-
colo
niza
tion
rep.
2D
escr
iptio
nBT
_012
5BT
0125
_at
6616
82.
560.
990
00
0N
ADH
:ubi
quin
one
oxid
ored
ucta
sesu
buni
tBT
_017
2BT
0172
_at
114
274
2.41
0.95
00
00
h ypo
thet
ical
pro
tein
BT_0
212
BT02
12_a
t33
172
5.28
0.97
00
00
prot
ease
BT_0
213
BT02
13_a
t23
104
4.46
0.98
00
00
cons
erve
dh y
poth
etic
al p
rote
inBT
_029
2BT
0292
_at
1474
5.49
0.98
00
00
h ypo
thet
ical
pro
tein
BT_0
293
BT02
93_a
t11
696.
470.
990
00
0co
nser
ved
h ypo
thet
ical
pro
tein
BT_0
294
BT02
94_a
t52
570
10.9
11.
000
10
3co
nser
ved
hypo
thet
ical
pro
tein
with
Car
boxy
pept
idas
e re
gula
tory
dom
ain
BT_0
361
BT03
61_a
t56
913
592.
390.
963
33
3Su
sDho
mol
o gBT
_063
6BT
0636
_at
902
420
-2.1
50.
970
00
0pu
tativ
etra
nscr
iptio
nalr
egul
ator
BT_0
639
BT06
39_a
t10
641
-2.5
60.
990
00
0h y
poth
etic
al p
rote
inBT
_086
5BT
0865
_at
1393
4119
2.96
1.00
33
13
puta
tive
chito
bias
eBT
_086
6BT
0866
_at
733
2916
3.98
1.00
33
33
SusD
hom
olo g
BT_0
867
BT08
67_a
t10
1737
343.
671.
003
33
3Su
sCho
mol
o gBT
_102
4BT
1024
_at
7317
02.
320.
980
00
0Su
sDho
mol
o gBT
_102
5BT
1025
_at
6715
52.
320.
980
00
0Su
sCho
mol
o gBT
_102
6BT
1026
_at
8921
52.
410.
990
00
0h y
poth
etic
al p
rote
inBT
_127
3BT
1273
_at
371
907
2.45
0.95
33
22
L-fu
cose
isom
eras
eBT
_150
1BT
1501
_at
144
351
2.44
0.99
00
00
ma j
orou
term
embr
ane
prot
ein
Om
pABT
_150
2BT
1502
_at
1321
2430
1.84
0.95
33
13
cons
erve
dh y
poth
etic
al p
rote
inBT
_150
7BT
1507
_at
154
387
2.50
0.99
33
23
cons
erve
dh y
poth
etic
al p
rote
inBT
_154
1BT
1541
_at
8218
52.
250.
990
00
0ho
mol
o gou
sto
put
ativ
etra
nsm
embr
ane
prot
ein
BT_1
644
BT16
44_a
t10
444.
290.
970
00
0pu
tativ
eC
PSbi
osyn
thes
is g
lyco
syltr
ansf
eras
eBT
_164
6BT
1646
_at
1671
4.33
0.96
00
00
glyc
osid
etra
nsfe
rase
fam
ily2
BT_1
647
BT16
47_a
t22
622.
830.
990
00
0co
nser
ved
hypo
thet
ical
pro
tein
, put
ativ
e in
tegr
al m
embr
ane
prot
ein
BT_1
648
BT16
48_a
t33
102
3.12
0.99
00
00
glyc
osid
etra
nsfe
rase
fam
ily2
BT_1
649
BT16
49_a
t52
158
3.04
1.00
00
00
glyc
osid
etra
nsfe
rase
fam
ily25
BT_1
650
BT16
50_a
t32
983.
050.
980
00
0pu
tativ
ete
icho
icac
idbi
osyn
thes
is p
rote
inF
BT_1
651
BT16
51_a
t34
117
3.45
1.00
00
00
pyro
phos
phor
ylas
eBT
_165
2BT
1652
_at
2512
04.
771.
000
00
0li p
opol
ysac
char
ide
bios
ynth
esis
pro
tein
BT_1
653
BT16
53_a
t34
120
3.52
1.00
00
00
cons
erve
d hy
poth
etic
al p
rote
in w
ith L
ipop
olys
acch
arid
e bi
osyn
thes
isdo
mai
nBT
_165
4BT
1654
_at
3111
93.
811.
003
33
3po
lysi
alic
acid
trans
port
prot
ein
kpsD
pre
curs
orBT
_165
6BT
1656
_at
9961
86.
271.
000
00
0pu
tativ
etra
nscr
iptio
nalr
egul
ator
BT_1
682
BT16
82_a
t25
860
62.
350.
960
01
0Su
sDho
mol
o gBT
_168
9BT
1689
_at
744
1474
1.98
0.97
00
00
oxal
oace
tate
deca
rbox
ylas
ebe
tach
ain
BT_1
719
BT17
19_a
t20
572.
840.
970
00
0su
lfopy
ruva
tede
carb
oxyl
ase
subu
nitb
eta
BT_1
725
BT17
25_a
t10
424.
390.
970
00
0pu
tativ
etra
nscr
iptio
nalr
egul
ator
BT_1
824
BT18
24_a
t57
122
2.14
0.96
00
00
cons
erve
dh y
poth
etic
al p
rote
in, p
utat
ive
perm
ease
BT_2
132
BT21
32_a
t77
294
3.81
1.00
00
00
hom
olo g
ous
toC
yclic
nucl
eotid
e-bi
ndin
gBT
_215
5BT
2155
_at
3348
1667
-2.0
10.
960
00
0h y
poth
etic
al p
rote
inBT
_217
0BT
2170
_at
2288
676
-3.3
81.
000
00
0co
nser
ved
h ypo
thet
ical
pro
tein
BT_2
171
BT21
71_a
t15
4350
2-3
.07
1.00
10
00
puta
tive
anti-
sigm
afa
ctor
BT_2
172
BT21
72_a
t31
665
-4.8
21.
000
00
0Su
sCho
mol
o gBT
_217
3BT
2173
_at
122
26-4
.69
0.99
00
00
SusD
hom
olo g
BT_2
392
BT23
92_a
t41
100
2.43
0.97
30
10
NH
Lre
peat
-con
tain
ing
prot
ein
BT_2
393
BT23
93_a
t36
912.
540.
983
03
0Su
sCho
mol
o gBT
_239
4BT
2394
_at
2881
2.94
0.99
20
00
SusD
hom
olo g
BT_2
395
BT23
95_a
t63
140
2.21
0.98
00
00
h ypo
thet
ical
pro
tein
Det
ectio
nby
MS/
MS
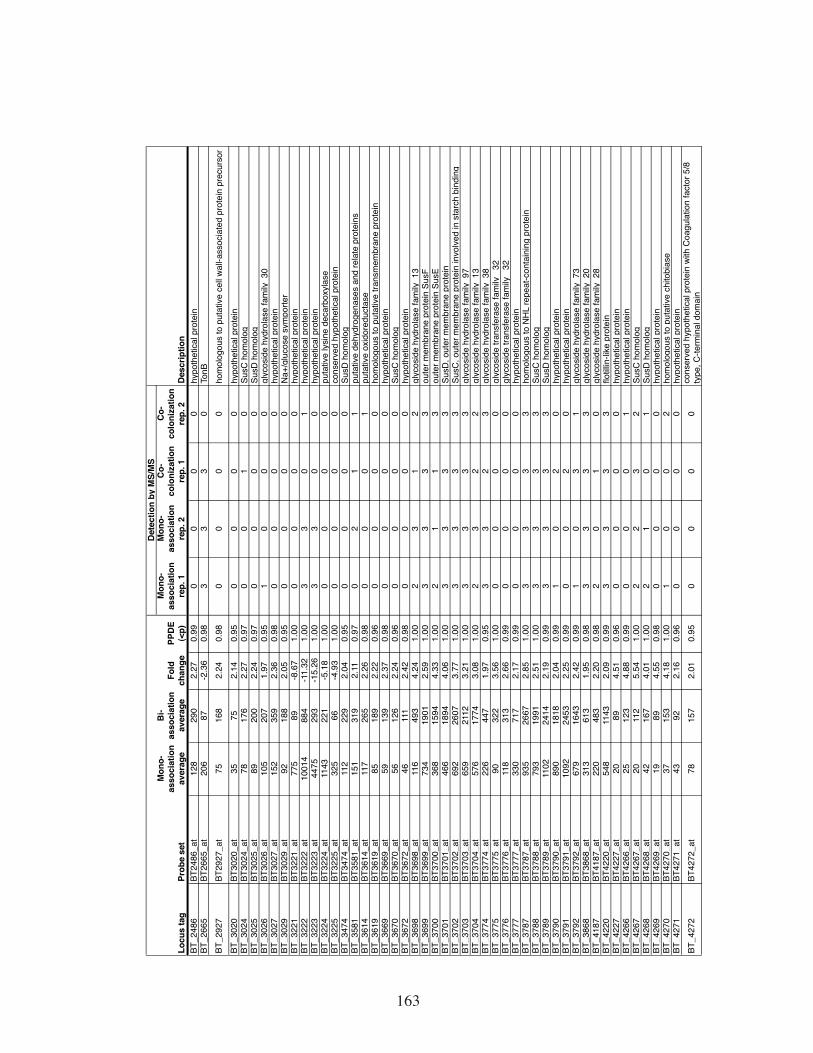
163
Locu
s ta
gPr
obe
set
Mon
o-as
soci
atio
nav
erag
e
Bi-
asso
ciat
ion
aver
age
Fold
chan
gePP
DE
(<p)
Mon
o-as
soci
atio
nre
p. 1
Mon
o-as
soci
atio
nre
p. 2
Co-
colo
niza
tion
rep.
1
Co-
colo
niza
tion
rep.
2D
escr
iptio
n
Det
ectio
nb y
MS/
MS
BT_2
486
BT24
86_a
t12
829
02.
270.
990
00
0h y
poth
etic
alpr
otei
nBT
_266
5BT
2665
_at
206
87-2
.36
0.98
33
30
TonB
BT_2
927
BT29
27_a
t75
168
2.24
0.98
00
00
hom
olog
ous
to p
utat
ive
cell
wal
l-ass
ocia
ted
prot
ein
prec
urso
rBT
_302
0BT
3020
_at
3575
2.14
0.95
00
00
h ypo
thet
ical
prot
ein
BT_3
024
BT30
24_a
t78
176
2.27
0.97
00
10
SusC
hom
olo g
BT_3
025
BT30
25_a
t89
200
2.24
0.97
00
00
SusD
hom
olo g
BT_3
026
BT30
26_a
t10
520
71.
970.
951
00
0gl
ycos
ide
hydr
olas
e fa
mily
30
BT_3
027
BT30
27_a
t15
235
92.
360.
980
00
0h y
poth
etic
alpr
otei
nBT
_302
9BT
3029
_at
9218
82.
050.
950
00
0N
a+/ g
luco
se s
ympo
rter
BT_3
221
BT32
21_a
t77
589
-8.6
71.
000
00
0h y
poth
etic
alpr
otei
nBT
_322
2BT
3222
_at
1001
488
4-1
1.32
1.00
33
01
h ypo
thet
ical
prot
ein
BT_3
223
BT32
23_a
t44
7529
3-1
5.26
1.00
33
00
h ypo
thet
ical
prot
ein
BT_3
224
BT32
24_a
t11
4322
1-5
.18
1.00
00
00
puta
tive
lysi
ne d
ecar
boxy
lase
BT_3
225
BT32
25_a
t32
566
-4.9
31.
000
00
0co
nser
ved
h ypo
thet
ical
prot
ein
BT_3
474
BT34
74_a
t11
222
92.
040.
950
00
0Su
sD h
omol
o gBT
_358
1BT
3581
_at
151
319
2.11
0.97
02
11
puta
tive
dehy
drog
enas
es a
nd re
late
pro
tein
sBT
_361
4BT
3614
_at
117
265
2.26
0.98
00
01
puta
tive
oxid
ored
ucta
seBT
_361
9BT
3619
_at
8518
92.
220.
960
00
0ho
mol
o gou
s to
put
ativ
e tra
nsm
embr
ane
prot
ein
BT_3
669
BT36
69_a
t59
139
2.37
0.98
00
00
h ypo
thet
ical
prot
ein
BT_3
670
BT36
70_a
t56
126
2.24
0.96
00
00
SusC
hom
olo g
BT_3
672
BT36
72_a
t46
111
2.42
0.98
00
00
h ypo
thet
ical
prot
ein
BT_3
698
BT36
98_a
t11
649
34.
241.
002
31
2gl
ycos
ide
hydr
olas
e fa
mily
13
BT_3
699
BT36
99_a
t73
419
012.
591.
003
33
3ou
ter m
embr
ane
prot
ein
SusF
BT_3
700
BT37
00_a
t36
815
944.
331.
002
11
3ou
ter m
embr
ane
prot
ein
SusE
BT_3
701
BT37
01_a
t46
618
944.
061.
003
33
3Su
sD, o
uter
mem
bran
e pr
otei
nBT
_370
2BT
3702
_at
692
2607
3.77
1.00
33
33
SusC
, out
er m
embr
ane
prot
ein
invo
lved
in s
tarc
h bi
ndin
gBT
_370
3BT
3703
_at
659
2112
3.21
1.00
33
33
glyc
osid
e hy
drol
ase
fam
ily 9
7BT
_370
4BT
3704
_at
576
1774
3.08
1.00
23
22
glyc
osid
e hy
drol
ase
fam
ily 1
3BT
_377
4BT
3774
_at
226
447
1.97
0.95
33
23
glyc
osid
e hy
drol
ase
fam
ily 3
8BT
_377
5BT
3775
_at
9032
23.
561.
000
00
0gl
ycos
ide
trans
fera
se fa
mily
32
BT_3
776
BT37
76_a
t11
831
32.
660.
990
00
0gl
ycos
ide
trans
fera
se fa
mily
32
BT_3
777
BT37
77_a
t33
071
72.
170.
990
00
0h y
poth
etic
alpr
otei
nBT
_378
7BT
3787
_at
935
2667
2.85
1.00
33
33
hom
olo g
ous
to N
HL
repe
at-c
onta
inin
gpr
otei
nBT
_378
8BT
3788
_at
793
1991
2.51
1.00
33
33
SusC
hom
olo g
BT_3
789
BT37
89_a
t11
0224
142.
190.
993
33
3Su
sD h
omol
o gBT
_379
0BT
3790
_at
890
1818
2.04
0.99
10
20
h ypo
thet
ical
prot
ein
BT_3
791
BT37
91_a
t10
9224
532.
250.
990
02
0h y
poth
etic
alpr
otei
nBT
_379
2BT
3792
_at
679
1643
2.42
0.99
10
31
glyc
osid
e hy
drol
ase
fam
ily 7
3BT
_386
8BT
3868
_at
313
613
1.95
0.98
33
33
glyc
osid
e hy
drol
ase
fam
ily 2
0BT
_418
7BT
4187
_at
220
483
2.20
0.98
20
10
glyc
osid
e hy
drol
ase
fam
ily 2
8BT
_422
0BT
4220
_at
548
1143
2.09
0.99
33
33
flotil
lin-li
kepr
otei
nBT
_422
7BT
4227
_at
2089
4.51
0.96
00
00
h ypo
thet
ical
prot
ein
BT_4
266
BT42
66_a
t25
123
4.88
0.99
00
01
h ypo
thet
ical
prot
ein
BT_4
267
BT42
67_a
t20
112
5.54
1.00
22
32
SusC
hom
olo g
BT_4
268
BT42
68_a
t42
167
4.01
1.00
21
01
SusD
hom
olo g
BT_4
269
BT42
69_a
t19
894.
550.
980
00
0h y
poth
etic
alpr
otei
nBT
_427
0BT
4270
_at
3715
34.
181.
001
00
2ho
mol
o gou
s to
put
ativ
e ch
itobi
ase
BT_4
271
BT42
71_a
t43
922.
160.
960
00
0h y
poth
etic
alpr
otei
nBT
_427
2BT
4272
_at
7815
72.
010.
950
00
0co
nser
ved
hypo
thet
ical
pro
tein
with
Coa
gula
tion
fact
or 5
/8
t ype
, C-te
rmin
al d
omai
n
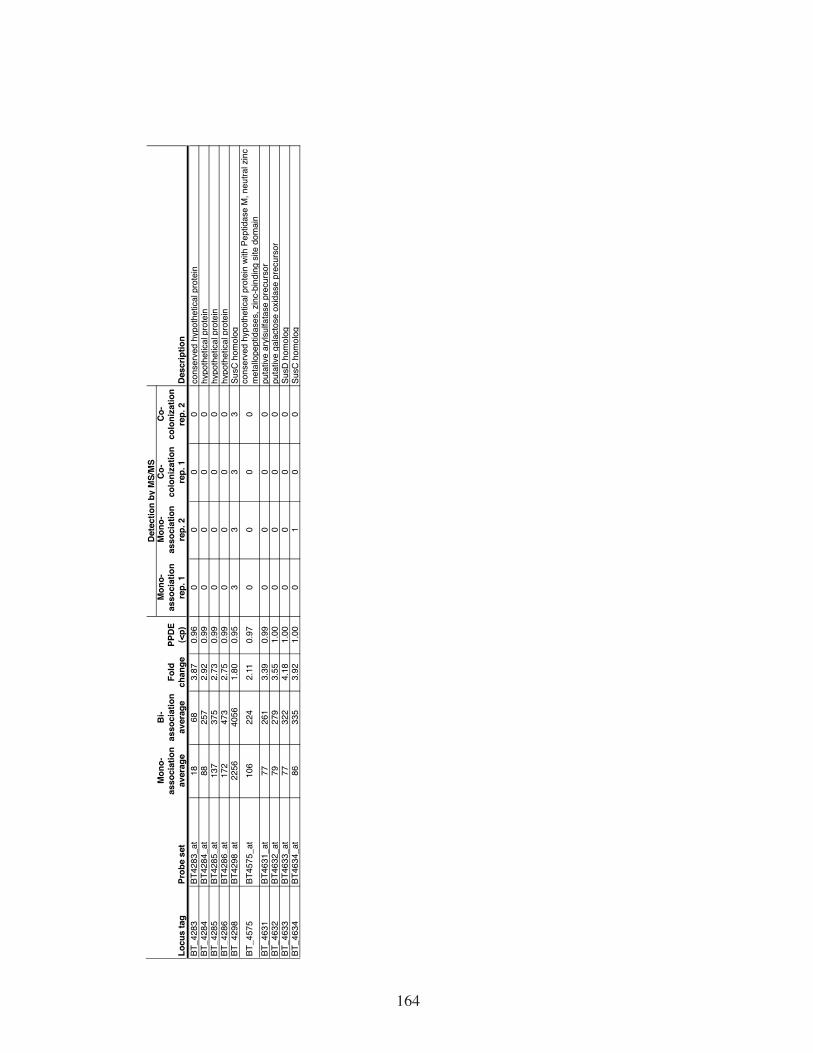
164
Locu
s ta
gPr
obe
set
Mon
o-as
soci
atio
nav
erag
e
Bi-
asso
ciat
ion
aver
age
Fold
chan
gePP
DE
(<p)
Mon
o-as
soci
atio
nre
p. 1
Mon
o-as
soci
atio
nre
p. 2
Co-
colo
niza
tion
rep.
1
Co-
colo
niza
tion
rep.
2D
escr
iptio
n
Det
ectio
nb y
MS/
MS
BT_4
283
BT42
83_a
t18
683.
870.
960
00
0co
nser
ved
h ypo
thet
ical
pro
tein
BT_4
284
BT42
84_a
t88
257
2.92
0.99
00
00
h ypo
thet
ical
pro
tein
BT_4
285
BT42
85_a
t13
737
52.
730.
990
00
0h y
poth
etic
al p
rote
inBT
_428
6BT
4286
_at
172
473
2.75
0.99
00
00
h ypo
thet
ical
pro
tein
BT_4
298
BT42
98_a
t22
5640
561.
800.
953
33
3Su
sCho
mol
o gBT
_457
5BT
4575
_at
106
224
2.11
0.97
00
00
cons
erve
d hy
poth
etic
al p
rote
in w
ith P
eptid
ase
M, n
eutra
l zin
c m
etal
lope
ptid
ases
,zin
c-bi
ndin
gsi
tedo
mai
nBT
_463
1BT
4631
_at
7726
13.
390.
990
00
0pu
tativ
ear
ylsu
lfata
se p
recu
rsor
BT_4
632
BT46
32_a
t79
279
3.55
1.00
00
00
puta
tive
gala
ctos
eox
idas
e pr
ecur
sor
BT_4
633
BT46
33_a
t77
322
4.18
1.00
00
00
SusD
hom
olo g
BT_4
634
BT46
34_a
t86
335
3.92
1.00
01
00
SusC
hom
olo g

165
Table S9.
Mah
owal
d et
al.,
Tab
le S
9
Locu
s ta
gPr
obe
set
Mon
o-as
soci
atio
nav
erag
e
Bi-
asso
ciat
ion
aver
age
Fold
chan
gePP
DE
(<p)
Mon
o-as
soc.
rep.
1
Mon
o-as
soc.
rep.
2
Coc
ol-
oniz
atio
nre
p. 1
Coc
ol-
oniz
atio
nre
p. 2
Des
crip
tion
EUBR
EC_3
638
Er-0
6012
3-00
25_a
t91
144
1.57
0.96
00
00
Hyp
othe
tical
pro
tein
EUBR
EC_3
616
Er-0
6012
3-00
37_a
t25
9-2
.62
0.95
00
00
Hyp
othe
tical
pro
tein
EUBR
EC_3
613
Er-0
6012
3-00
38_a
t17
710
9-1
.62
0.95
00
00
Hyp
othe
tical
pro
tein
EUBR
EC_3
612
Er-0
6012
3-00
39_a
t19
710
5-1
.87
1.00
00
00
chro
mos
ome
parti
tioni
ng p
rote
inEU
BREC
_361
1Er
-060
123-
0040
_at
286
145
-1.9
71.
000
00
0ch
rom
osom
e pa
rtitio
ning
pro
tein
,Par
Bfa
mily
EUBR
EC_3
606
Er-0
6012
3-00
42_a
t66
630
6-2
.17
1.00
00
00
Hyp
othe
tical
pro
tein
EUBR
EC_3
605
Er-0
6012
3-00
43_a
t23
911
1-2
.15
1.00
00
00
Hyp
othe
tical
pro
tein
EUBR
EC_3
604
Er-0
6012
3-00
44_a
t43
717
4-2
.51
1.00
00
00
DN
Are
plic
atio
n pr
otei
nD
naC
EUBR
EC_3
602
Er-0
6012
3-00
46_a
t31
211
3-2
.75
1.00
00
00
t ype
IVse
cret
ion
syst
em p
rote
inVi
rD4
EUBR
EC_3
601
Er-0
6012
3-00
47_a
t18
311
0-1
.66
0.98
00
00
site
-spe
cific
DN
Are
com
bina
seEU
BREC
_359
9Er
-060
123-
0048
_at
6028
-2.1
00.
980
00
0H
ypot
hetic
al p
rote
inEU
BREC
_359
8Er
-060
123-
0049
_at
7136
-1.9
60.
980
00
0D
NA
prim
ase
EUBR
EC_3
597
Er-0
6012
3-00
50_a
t13
485
-1.5
80.
950
00
0H
ypot
hetic
al p
rote
inEU
BREC
_359
3Er
-060
123-
0051
_at
251
95-2
.64
1.00
00
00
t ype
IVse
cret
ion
syst
em p
rote
inVi
rD4
EUBR
EC_3
591
Er-0
6012
3-00
52_a
t63
938
7-1
.65
0.99
00
00
Gnt
Rfa
mil y
trans
crip
tiona
lreg
ulat
orEU
BREC
_359
0Er
-060
123-
0053
_at
503
296
-1.7
00.
990
00
0AB
C-2
t ype
trans
port
syst
emAT
P-bi
ndin
g pr
otei
nEU
BREC
_358
6Er
-060
123-
0056
_at
4213
-3.2
00.
990
00
0H
ypot
hetic
al p
rote
inEU
BREC
_357
8Er
-060
123-
0064
_at
942
589
-1.6
00.
990
00
0si
te-s
peci
ficD
NA
reco
mbi
nase
EUBR
EC_3
576
Er-0
6012
3-00
65_a
t20
675
-2.7
51.
000
00
0H
ypot
hetic
al p
rote
inEU
BREC
_357
4Er
-060
123-
0066
_at
132
53-2
.49
1.00
00
00
Hyp
othe
tical
pro
tein
EUBR
EC_3
573
Er-0
6012
3-00
68_a
t19
294
-2.0
41.
000
00
0H
ypot
hetic
al p
rote
inEU
BREC
_357
1Er
-060
123-
0069
_at
123
45-2
.72
1.00
00
00
Hyp
othe
tical
pro
tein
EUBR
EC_3
569
Er-0
6012
3-00
71_a
t87
34-2
.57
1.00
00
00
Hyp
othe
tical
pro
tein
EUBR
EC_3
566
Er-0
6012
3-00
73_a
t13
355
-2.4
01.
000
00
0H
ypot
hetic
al p
rote
inEU
BREC
_356
3Er
-060
123-
0075
_at
8541
-2.0
80.
980
00
0H
ypot
hetic
al p
rote
inEU
BREC
_354
7Er
-060
123-
0088
_at
8236
-2.2
51.
000
00
0H
ypot
hetic
al p
rote
inEU
BREC
_354
3Er
-060
123-
0089
_at
625
351
-1.7
81.
000
00
0D
NA
poly
mer
ase
VEU
BREC
_352
9Er
-060
123-
0093
_at
398
258
-1.5
40.
990
00
0si
te-s
peci
ficD
NA
reco
mbi
nase
EUBR
EC_3
528
Er-0
6012
3-00
94_a
t25
410
9-2
.33
1.00
00
00
site
-spe
cific
DN
Are
com
bina
seEU
BREC
_352
7Er
-060
123-
0095
_at
350
180
-1.9
51.
000
00
0si
te-s
peci
ficD
NA
reco
mbi
nase
EUBR
EC_3
484
Er-0
6012
3-01
23_a
t85
52-1
.64
0.95
00
00
Hyp
othe
tical
pro
tein
EUBR
EC_3
695
Er-0
6012
3-01
47_a
t29
817
3-1
.72
0.96
00
00
Hyp
othe
tical
pro
tein
EUBR
EC_3
698
Er-0
6012
3-01
49_a
t24
944
41.
791.
003
10
0ch
rom
osom
e pa
rtitio
ning
pro
tein
,Par
Bfa
mily
EUBR
EC_3
704
Er-0
6012
3-01
53_a
t20
2012
12-1
.67
0.99
33
30
halo
alka
nede
halo
gena
seEU
BREC
_370
8Er
-060
123-
0157
_at
295
538
1.82
0.99
33
33
s poI
IIJ-a
ssoc
iate
d pr
otei
nEU
BREC
_370
9Er
-060
123-
0158
_at
336
682
2.03
1.00
00
00
prep
rote
intra
nslo
case
YidC
subu
nit
EUBR
EC_0
001
Er-0
6012
3-01
59_a
t37
059
31.
601.
000
00
0ch
rom
osom
alre
plic
atio
nin
itiat
or p
rote
inD
naA
EUBR
EC_0
002
Er-0
6012
3-01
60_a
t88
613
541.
530.
990
11
0D
NA
poly
mer
ase
EUBR
EC_0
017
Er-0
6012
3-01
73_a
t16
840
-4.1
51.
001
00
0D
eoR
fam
ily tr
ansc
riptio
nal r
egul
ator
, fru
ctos
e op
eron
tra
nscr
iptio
nalr
epre
ssor
EUBR
EC_0
018
Er-0
6012
3-01
74_a
t56
519
8-2
.86
1.00
01
00
1-ph
osph
ofru
ctok
inas
eEU
BREC
_001
9Er
-060
123-
0175
_at
891
306
-2.9
10.
993
32
0pr
otei
n-N
p-ph
osph
ohis
tidin
e-su
gar p
hosp
hotra
nsfe
rase
EUBR
EC_0
028
Er-0
6012
3-01
85_a
t19
410
6-1
.83
0.99
00
00
Hyp
othe
tical
pro
tein
EUBR
EC_0
056
Er-0
6012
3-02
03_a
t82
514
541.
760.
950
00
0N
-ace
t ylm
uram
oyl-L
-ala
nine
amid
ase
EUBR
EC_0
057
Er-0
6012
3-02
05_a
t37
077
62.
101.
003
33
1or
nith
ine
carb
amo y
ltran
sfer
asEU
BREC
_005
8Er
-060
123-
0206
_at
205
428
2.09
1.00
10
00
biot
in-[a
cety
l-CoA
-car
boxy
lase
] lig
ase
/ BirA
fam
ily
trans
crip
tiona
lreg
ulat
or,b
iotin
oper
onre
pres
sor
EUBR
EC_0
060
Er-0
6012
3-02
07_a
t25
045
41.
811.
002
10
0t y
peIII
pan
toth
enat
eki
nase
EUBR
EC_0
061
Er-0
6012
3-02
08_a
t15
834
62.
181.
000
10
0H
ypot
hetic
al p
rote
inEU
BREC
_006
2Er
-060
123-
0209
_at
273
594
2.18
1.00
33
32
trans
cri p
tion
elon
gatio
nfa
ctor
Gre
AEU
BREC
_006
3Er
-060
123-
0210
_at
346
680
1.97
1.00
33
31
l ysy
l-tR
NA
synt
heta
se,c
lass
II
Det
ectio
nby
MS/
MS

166
Locu
s ta
gPr
obe
set
Mon
o-as
soci
atio
nav
erag
e
Bi-
asso
ciat
ion
aver
age
Fold
chan
gePP
DE
(<p)
Mon
o-as
soc.
rep.
1
Mon
o-as
soc.
rep.
2
Coc
ol-
oniz
atio
nre
p. 1
Coc
ol-
oniz
atio
nre
p. 2
Des
crip
tion
Det
ectio
nby
MS/
MS
EUBR
EC_0
069
Er-0
6012
3-02
15_a
t10
6363
6-1
.67
1.00
00
00
Hyp
othe
tical
pro
tein
EUBR
EC_0
079
Er-0
6012
3-02
18_a
t15
7710
08-1
.56
0.99
00
00
inte
gras
e/re
com
bina
seXe
rCEU
BREC
_015
9Er
-060
123-
0270
_at
523
333
-1.5
70.
990
00
0H
ypot
hetic
al p
rote
inEU
BREC
_016
3Er
-060
123-
0271
_at
1628
1003
-1.6
21.
000
00
0D
NA
(cyt
osin
e-5-
)-met
hyltr
ansf
eras
eEU
BREC
_016
6Er
-060
123-
0275
_at
534
338
-1.5
80.
980
00
0H
ypot
hetic
al p
rote
inEU
BREC
_016
7Er
-060
123-
0276
_at
578
352
-1.6
40.
990
00
0H
ypot
hetic
al p
rote
inEU
BREC
_016
8Er
-060
123-
0277
_at
337
217
-1.5
50.
970
00
0H
ypot
hetic
al p
rote
inEU
BREC
_017
5Er
-060
123-
0279
_at
332
216
-1.5
30.
980
00
0H
ypot
hetic
al p
rote
inEU
BREC
_019
0Er
-060
123-
0290
_at
5698
1.73
0.96
10
20
t yro
syl-t
RN
Asy
nthe
tase
EUBR
EC_0
198
Er-0
6012
3-02
97_a
t30
661
72.
011.
000
00
0de
oxyr
ibon
ucle
ase
IVEU
BREC
_021
4Er
-060
123-
0305
_at
8716
11.
860.
990
00
0m
ultid
rug
resi
stan
ce p
rote
in,M
ATE
fam
ilyEU
BREC
_193
7Er
-060
123-
0323
_at
283
980
3.47
1.00
00
00
N-a
cety
lmur
amoy
l-L-a
lani
neam
idas
eEU
BREC
_193
5Er
-060
123-
0324
_at
262
609
2.32
1.00
33
33
poly
ribon
ucle
otid
enu
cleo
tidyl
trans
fera
seEU
BREC
_192
6Er
-060
123-
0333
_at
8212
71.
560.
950
00
0ad
enos
ylco
byric
acid
synt
hase
EUBR
EC_1
924
Er-0
6012
3-03
35_a
t80
144
1.79
0.98
00
00
aden
osyl
cobi
nam
ide
kina
se /
aden
osyl
cobi
nam
ide-
phos
phat
eg u
anyl
yltra
nsfe
rase
EUBR
EC_1
903
Er-0
6012
3-03
52_a
t17
438
92.
241.
001
00
0rib
osom
al p
rote
inL1
1m
ethy
ltran
sfer
ase
EUBR
EC_1
902
Er-0
6012
3-03
53_a
t19
133
41.
750.
990
00
0h y
poth
etic
al p
rote
inEU
BREC
_190
1Er
-060
123-
0354
_at
128
299
2.33
1.00
00
00
c yst
eine
desu
lfura
seEU
BREC
_190
0Er
-060
123-
0355
_at
201
475
2.36
1.00
00
00
thia
min
ebi
osyn
thes
is p
rote
inTh
iIEU
BREC
_189
7Er
-060
123-
0356
_at
193
392
2.02
1.00
00
00
2-al
kena
lred
ucta
seEU
BREC
_188
9Er
-060
123-
0360
_at
3462
1.85
0.96
00
00
Hyp
othe
tical
pro
tein
EUBR
EC_1
869
Er-0
6012
3-03
78_a
t46
072
01.
570.
990
00
0H
ypot
hetic
al p
rote
inEU
BREC
_186
8Er
-060
123-
0380
_at
587
944
1.61
1.00
33
33
glyc
yl-tR
NA
synt
heta
se,c
lass
IIEU
BREC
_186
6Er
-060
123-
0381
_at
500
286
-1.7
50.
990
00
0si
gnal
pep
tidas
eI
EUBR
EC_1
865
Er-0
6012
3-03
82_a
t21
4313
37-1
.60
0.99
00
00
Hyp
othe
tical
pro
tein
EUBR
EC_1
863
Er-0
6012
3-03
84_a
t79
651
3-1
.55
0.97
00
00
sorta
seA
EUBR
EC_1
859
Er-0
6012
3-03
88_a
t12
0579
5-1
.52
0.96
00
00
Hyp
othe
tical
pro
tein
EUBR
EC_1
838
Er-0
6012
3-04
03_a
t25
946
71.
811.
000
00
0H
ypot
hetic
al p
rote
inEU
BREC
_183
0Er
-060
123-
0409
_at
418
696
1.67
1.00
33
30
ferre
doxi
n--N
ADP+
redu
ctas
eEU
BREC
_182
9Er
-060
123-
0410
_at
568
895
1.57
0.99
33
33
glut
amat
esy
ntha
se (N
ADPH
)EU
BREC
_181
3Er
-060
123-
0425
_at
133
230
1.72
0.99
11
00
DN
Ato
pois
omer
ase
IEU
BREC
_181
2Er
-060
123-
0426
_at
9919
21.
940.
992
00
0pl
eiot
ropi
ctra
nscr
iptio
nalr
epre
ssor
Cod
YEU
BREC
_179
6Er
-060
123-
0437
_at
954
1499
1.57
1.00
00
00
Hyp
othe
tical
pro
tein
EUBR
EC_1
795
Er-0
6012
3-04
38_a
t95
914
791.
540.
990
00
0fla
gella
rmot
orsw
itch
prot
ein
FliM
EUBR
EC_1
759
Er-0
6012
3-04
70_a
t47
962.
040.
990
00
0H
ypot
hetic
al p
rote
inEU
BREC
_174
6Er
-060
123-
0480
_at
282
449
1.59
0.99
00
00
DN
Are
pair
prot
ein
Rad
CEU
BREC
_174
3Er
-060
123-
0483
_at
267
408
1.53
0.97
00
00
Hyp
othe
tical
pro
tein
EUBR
EC_1
701
Er-0
6012
3-05
09_a
t19
6711
04-1
.78
1.00
20
00
repr
esso
rLex
AEU
BREC
_169
9Er
-060
123-
0510
_at
175
378
2.16
1.00
00
00
nico
tinat
e-nu
cleo
tide
aden
ylyl
trans
fera
seEU
BREC
_169
8Er
-060
123-
0511
_at
140
294
2.10
1.00
00
00
nico
tinat
e-nu
cleo
tide
aden
ylyl
trans
fera
seEU
BREC
_169
6Er
-060
123-
0512
_at
136
284
2.09
1.00
11
20
GTP
-bin
din g
pro
tein
EUBR
EC_1
691
Er-0
6012
3-05
14_a
t21
133
11.
570.
990
00
0H
ypot
hetic
al p
rote
inEU
BREC
_169
0Er
-060
123-
0515
_at
212
345
1.63
0.99
00
00
Hyp
othe
tical
pro
tein
EUBR
EC_1
677
Er-0
6012
3-05
27_a
t36
555
21.
510.
991
00
0si
te-s
peci
ficD
NA-
met
hyltr
ansf
eras
e (a
deni
ne-s
peci
fic)
EUBR
EC_1
675
Er-0
6012
3-05
28_a
t32
649
71.
530.
990
10
02-
alke
nalr
educ
tase
EUBR
EC_1
673
Er-0
6012
3-05
29_a
t46
983
71.
791.
002
00
0gu
anyl
ate
kina
seEU
BREC
_165
7Er
-060
123-
0538
_at
159
279
1.75
0.98
00
00
Hyp
othe
tical
pro
tein
EUBR
EC_1
655
Er-0
6012
3-05
39_a
t19
534
11.
750.
990
00
0ho
llida y
junc
tion
DN
Ahe
licas
eR
uvA
EUBR
EC_1
652
Er-0
6012
3-05
40_a
t30
256
01.
861.
000
10
02-
alke
nalr
educ
tase
EUBR
EC_1
651
Er-0
6012
3-05
41_a
t25
347
71.
891.
000
00
0gl
utam
ate-
5-se
mia
ldeh
yde
dehy
drog
enas
eEU
BREC
_165
0Er
-060
123-
0543
_at
204
383
1.88
1.00
00
00
5-fo
rmyl
tetra
hydr
ofol
ate
cycl
o-lig
ase
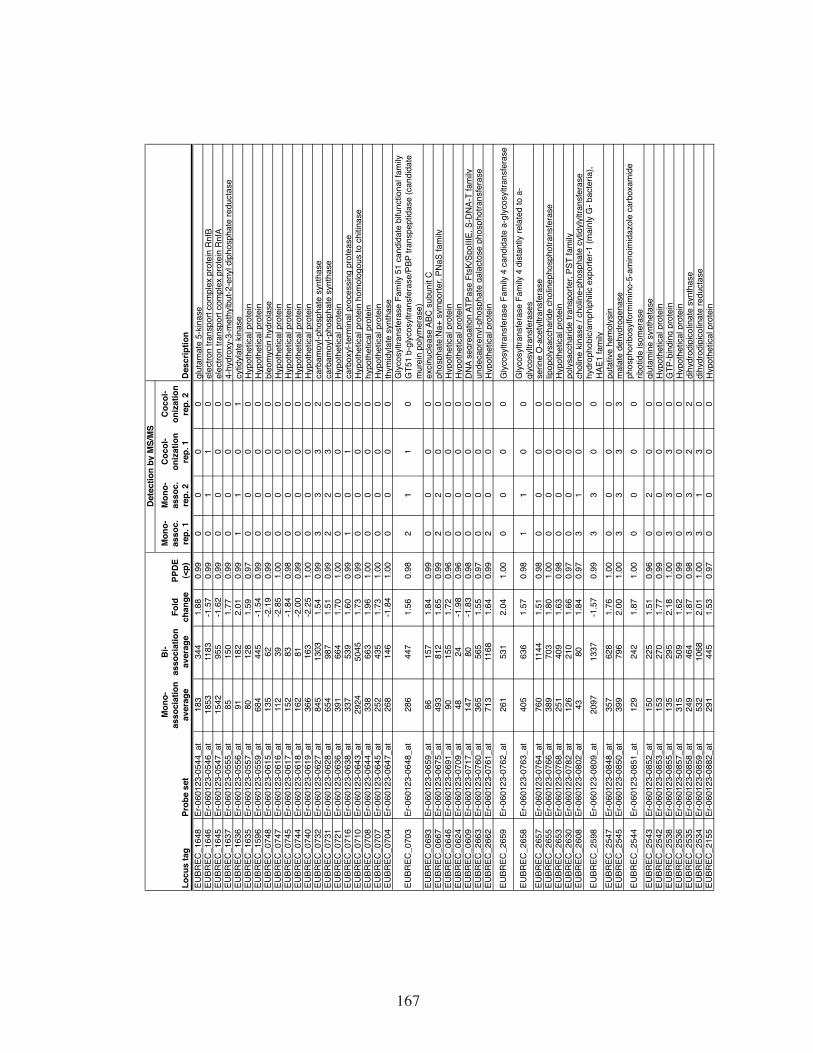
167
Locu
s ta
gPr
obe
set
Mon
o-as
soci
atio
nav
erag
e
Bi-
asso
ciat
ion
aver
age
Fold
chan
gePP
DE
(<p)
Mon
o-as
soc.
rep.
1
Mon
o-as
soc.
rep.
2
Coc
ol-
oniz
atio
nre
p. 1
Coc
ol-
oniz
atio
nre
p. 2
Des
crip
tion
Det
ectio
nby
MS/
MS
EUBR
EC_1
648
Er-0
6012
3-05
44_a
t18
334
41.
880.
990
00
0gl
utam
ate
5-ki
nase
EUBR
EC_1
646
Er-0
6012
3-05
46_a
t18
5311
83-1
.57
0.99
01
10
elec
tron
trans
port
com
plex
pro
tein
Rnf
BEU
BREC
_164
5Er
-060
123-
0547
_at
1542
955
-1.6
20.
990
00
0el
ectro
ntra
nspo
rtco
mpl
ex p
rote
inR
nfA
EUBR
EC_1
637
Er-0
6012
3-05
55_a
t85
150
1.77
0.99
00
00
4-hy
drox
y-3-
met
hylb
ut-2
-eny
ldip
hosp
hate
redu
ctas
eEU
BREC
_163
6Er
-060
123-
0556
_at
9118
22.
010.
991
10
1cy
tidyl
ate
kina
seEU
BREC
_163
5Er
-060
123-
0557
_at
8012
81.
590.
970
00
0H
ypot
hetic
al p
rote
inEU
BREC
_159
6Er
-060
123-
0559
_at
684
445
-1.5
40.
990
00
0H
ypot
hetic
al p
rote
inEU
BREC
_074
8Er
-060
123-
0615
_at
135
62-2
.19
0.99
00
00
bleo
myc
inhy
drol
ase
EUBR
EC_0
747
Er-0
6012
3-06
16_a
t11
239
-2.8
51.
000
00
0H
ypot
hetic
al p
rote
inEU
BREC
_074
5Er
-060
123-
0617
_at
152
83-1
.84
0.98
00
00
Hyp
othe
tical
pro
tein
EUBR
EC_0
744
Er-0
6012
3-06
18_a
t16
281
-2.0
00.
990
00
0H
ypot
hetic
al p
rote
inEU
BREC
_074
0Er
-060
123-
0619
_at
366
163
-2.2
51.
000
00
0H
ypot
hetic
al p
rote
inEU
BREC
_073
2Er
-060
123-
0627
_at
845
1303
1.54
0.99
33
32
carb
amoy
l-pho
spha
tesy
ntha
seEU
BREC
_073
1Er
-060
123-
0628
_at
654
987
1.51
0.99
22
30
carb
amoy
l-pho
spha
tesy
ntha
seEU
BREC
_072
1Er
-060
123-
0636
_at
391
664
1.70
1.00
00
00
Hyp
othe
tical
pro
tein
EUBR
EC_0
716
Er-0
6012
3-06
38_a
t33
753
91.
600.
991
01
0ca
rbox
yl-te
rmin
al p
roce
ssin
g pr
otea
seEU
BREC
_071
0Er
-060
123-
0643
_at
2924
5045
1.73
0.99
00
00
Hyp
othe
tical
pro
tein
hom
olog
ous
to c
hitin
ase
EUBR
EC_0
708
Er-0
6012
3-06
44_a
t33
866
31.
961.
000
00
0hy
poth
etic
al p
rote
inEU
BREC
_070
7Er
-060
123-
0645
_at
252
435
1.73
1.00
00
00
Hyp
othe
tical
pro
tein
EUBR
EC_0
704
Er-0
6012
3-06
47_a
t26
814
6-1
.84
1.00
00
00
thym
idyl
ate
synt
hase
EUBR
EC_0
703
Er-0
6012
3-06
48_a
t28
644
71.
560.
982
11
0G
lyco
syltr
ansf
eras
e Fa
mily
51
cand
idat
e bi
func
tiona
l fam
ily
GT5
1 b-
glyc
osyl
trans
fera
se/P
BP tr
ansp
eptid
ase
(can
dida
te
mur
ein
poly
mer
ase)
EUBR
EC_0
693
Er-0
6012
3-06
59_a
t86
157
1.84
0.99
00
00
exci
nucl
ease
ABC
subu
nitC
EUBR
EC_0
667
Er-0
6012
3-06
75_a
t49
381
21.
650.
992
20
0ph
osph
ate:
Na+
sym
porte
r,PN
aSfa
mily
EUBR
EC_0
646
Er-0
6012
3-06
91_a
t90
155
1.72
0.96
00
00
Hyp
othe
tical
pro
tein
EUBR
EC_0
624
Er-0
6012
3-07
09_a
t48
24-1
.98
0.96
00
00
Hyp
othe
tical
pro
tein
EUBR
EC_0
609
Er-0
6012
3-07
17_a
t14
780
-1.8
30.
980
00
0D
NA
segr
egat
ion
ATPa
seFt
sK/S
poIII
E,S-
DN
A-T
fam
ilyEU
BREC
_266
3Er
-060
123-
0760
_at
365
565
1.55
0.97
00
00
unde
capr
enyl
-pho
spha
te g
alac
tose
pho
spho
trans
fera
seEU
BREC
_266
2Er
-060
123-
0761
_at
713
1168
1.64
0.99
20
00
Hyp
othe
tical
pro
tein
EUBR
EC_2
659
Er-0
6012
3-07
62_a
t26
153
12.
041.
000
00
0G
lyco
syltr
ansf
eras
e Fa
mily
4 c
andi
date
a-g
lyco
syltr
ansf
eras
e
EUBR
EC_2
658
Er-0
6012
3-07
63_a
t40
563
61.
570.
981
10
0G
lyco
syltr
ansf
eras
e Fa
mily
4 d
ista
ntly
rela
ted
to a
-gl
ycos
yltra
nsfe
rase
sEU
BREC
_265
7Er
-060
123-
0764
_at
760
1144
1.51
0.98
00
00
serin
eO
-ace
t yltr
ansf
eras
eEU
BREC
_265
5Er
-060
123-
0766
_at
389
703
1.80
1.00
00
00
li pop
olys
acch
arid
ech
olin
epho
spho
trans
fera
seEU
BREC
_265
3Er
-060
123-
0768
_at
251
409
1.63
0.98
00
00
Hyp
othe
tical
pro
tein
EUBR
EC_2
630
Er-0
6012
3-07
82_a
t12
621
01.
660.
970
00
0po
lysa
ccha
ride
trans
porte
r,PS
Tfa
mily
EUBR
EC_2
608
Er-0
6012
3-08
02_a
t43
801.
840.
973
10
0ch
olin
eki
nase
/cho
line-
phos
phat
ecy
tidyl
yltra
nsfe
rase
EUBR
EC_2
598
Er-0
6012
3-08
09_a
t20
9713
37-1
.57
0.99
33
00
hydr
opho
bic/
amph
iphi
lic e
xpor
ter-1
(mai
nly
G- b
acte
ria),
HAE
1fa
mil y
EUBR
EC_2
547
Er-0
6012
3-08
48_a
t35
762
81.
761.
000
00
0pu
tativ
ehe
mol
ysin
EUBR
EC_2
545
Er-0
6012
3-08
50_a
t39
979
62.
001.
003
33
3m
alat
ede
h ydr
ogen
ase
EUBR
EC_2
544
Er-0
6012
3-08
51_a
t12
924
21.
871.
000
00
0ph
osph
orib
osyl
form
imin
o-5-
amin
oim
idaz
ole
carb
oxam
ide
ribot
ide
isom
eras
eEU
BREC
_254
3Er
-060
123-
0852
_at
150
225
1.51
0.96
02
00
glut
amin
esy
nthe
tase
EUBR
EC_2
542
Er-0
6012
3-08
53_a
t15
327
01.
770.
990
00
0H
ypot
hetic
al p
rote
inEU
BREC
_253
8Er
-060
123-
0855
_at
135
295
2.18
1.00
33
30
GTP
-bin
din g
pro
tein
EUBR
EC_2
536
Er-0
6012
3-08
57_a
t31
550
91.
620.
990
00
0H
ypot
hetic
al p
rote
inEU
BREC
_253
5Er
-060
123-
0858
_at
249
464
1.87
0.98
33
22
dih y
drod
ipic
olin
ate
synt
hase
EUBR
EC_2
534
Er-0
6012
3-08
59_a
t53
210
682.
011.
003
13
0di
h ydr
odip
icol
inat
ere
duct
ase
EUBR
EC_2
155
Er-0
6012
3-08
82_a
t29
144
51.
530.
970
00
0H
ypot
hetic
al p
rote
in

168
Locu
s ta
gPr
obe
set
Mon
o-as
soci
atio
nav
erag
e
Bi-
asso
ciat
ion
aver
age
Fold
chan
gePP
DE
(<p)
Mon
o-as
soc.
rep.
1
Mon
o-as
soc.
rep.
2
Coc
ol-
oniz
atio
nre
p. 1
Coc
ol-
oniz
atio
nre
p. 2
Des
crip
tion
Det
ectio
nby
MS/
MS
EUBR
EC_2
153
Er-0
6012
3-08
84_a
t10
418
61.
790.
990
00
0ar
gini
nosu
ccin
ate
lyas
eEU
BREC
_215
2Er
-060
123-
0885
_at
135
221
1.63
0.99
33
31
aspa
rtate
-sem
iald
ehyd
ede
hydr
ogen
ase
EUBR
EC_2
149
Er-0
6012
3-08
87_a
t40
561
01.
510.
990
00
0H
ypot
hetic
al p
rote
inEU
BREC
_210
1Er
-060
123-
0915
_at
3158
1.89
0.96
00
00
Hyp
othe
tical
pro
tein
EUBR
EC_2
038
Er-0
6012
3-09
42_a
t22
472.
160.
960
00
0H
ypot
hetic
al p
rote
inEU
BREC
_203
2Er
-060
123-
0948
_at
891
566
-1.5
70.
990
00
0tw
o-co
mpo
nent
syst
em,r
espo
nse
regu
lato
rYes
EUBR
EC_2
016
Er-0
6012
3-09
62_a
t12
821
91.
710.
970
00
0H
ypot
hetic
al p
rote
inEU
BREC
_200
7Er
-060
123-
0966
_at
103
166
1.61
0.96
00
00
Gly
cosy
ltran
sfer
ase
Fam
ily 2
8 re
late
d to
b-
glyc
osyl
trans
fera
ses
EUBR
EC_2
005
Er-0
6012
3-09
68_a
t33
982.
981.
001
01
0po
lar a
min
o ac
id tr
ansp
ort s
yste
m s
ubst
rate
-bin
ding
pro
tein
EUBR
EC_2
002
Er-0
6012
3-09
71_a
t31
2952
811.
690.
993
33
3ph
osph
oeno
lpyr
uvat
eca
rbox
ykin
ase
(ATP
)EU
BREC
_199
9Er
-060
123-
0974
_at
313
549
1.75
1.00
33
31
leuc
yl-tR
NA
synt
heta
seEU
BREC
_198
3Er
-060
123-
0986
_at
3693
2.60
0.99
11
20
phen
ylal
anyl
-tRN
Asy
nthe
tase
EUBR
EC_1
982
Er-0
6012
3-09
87_a
t10
117
01.
670.
950
00
0S-
aden
osyl
met
hion
ine:
tRN
Arib
osyl
trans
fera
se-is
omer
ase
EUBR
EC_1
980
Er-0
6012
3-09
88_a
t10
318
21.
760.
970
00
03-
phos
phos
hiki
mat
e1-
carb
oxyv
inyl
trans
fera
seEU
BREC
_197
0Er
-060
123-
0992
_at
6410
81.
680.
960
00
02-
iso p
ropy
lmal
ate
synt
hase
EUBR
EC_1
966
Er-0
6012
3-09
96_a
t39
967
21.
691.
000
00
0H
ypot
hetic
al p
rote
inEU
BREC
_196
5Er
-060
123-
0997
_at
135
237
1.75
1.00
00
00
Hyp
othe
tical
pro
tein
EUBR
EC_1
964
Er-0
6012
3-09
98_a
t21
537
61.
751.
000
00
0al
anin
era
cem
ase
EUBR
EC_2
313
Er-0
6012
3-10
02_a
t62
103
1.68
0.97
00
00
puta
tive
pyru
vate
form
ate
lyas
eac
tivat
ing
enzy
me
EUBR
EC_3
197
Er-0
6012
3-10
12_a
t32
717
7-1
.84
1.00
00
00
Hyp
othe
tical
pro
tein
EUBR
EC_3
197
Er-0
6012
3-10
12_x
_at
303
157
-1.9
31.
000
00
0H
ypot
hetic
al p
rote
inEU
BREC
_321
8Er
-060
123-
1029
_at
3013
-2.3
70.
970
00
0H
ypot
hetic
al p
rote
inEU
BREC
_323
7Er
-060
123-
1041
_at
820
412
-1.9
91.
000
00
0tra
nspo
sase
EUBR
EC_3
238
Er-0
6012
3-10
43_a
t15
984
-1.9
00.
990
00
0tra
nspo
sase
EUBR
EC_3
280
Er-0
6012
3-10
75_a
t18
830
21.
600.
981
10
0H
ypot
hetic
al p
rote
inEU
BREC
_328
7Er
-060
123-
1080
_at
7216
92.
331.
001
00
0AT
P-de
pend
entR
NA
helic
ase
Dea
DEU
BREC
_282
0Er
-060
123-
1085
_at
1900
1262
-1.5
10.
971
31
0G
l yco
side
Hyd
rola
seFa
mily
3ca
ndid
ate
b-gl
ucos
idas
eEU
BREC
_281
6Er
-060
123-
1088
_at
155
101
-1.5
30.
950
00
0G
lyco
side
Hyd
rola
se F
amily
94
dis
tant
ly re
late
d to
b-g
lyca
n ph
osph
oryl
ases
EUBR
EC_2
815
Er-0
6012
3-10
89_a
t11
269
-1.6
30.
950
00
0Ar
aCfa
mil y
trans
crip
tiona
lreg
ulat
orEU
BREC
_280
4Er
-060
123-
1096
_at
161
243
1.51
0.96
00
00
Hyp
othe
tical
pro
tein
EUBR
EC_2
800
Er-0
6012
3-11
00_a
t41
268
41.
661.
000
10
0l y
soph
osph
olip
ase
EUBR
EC_2
789
Er-0
6012
3-11
09_a
t29
665
12.
201.
003
33
3pr
epro
tein
trans
loca
seSe
cAsu
buni
tEU
BREC
_278
6Er
-060
123-
1112
_at
1024
1562
1.52
1.00
33
33
rod
sha p
e-de
term
inin
g pr
otei
nM
reB
and
rela
ted
prot
eins
EUBR
EC_2
785
Er-0
6012
3-11
13_a
t23
242
81.
850.
990
00
0co
mpe
tenc
e pr
otei
nC
omFC
EUBR
EC_2
745
Er-0
6012
3-11
49_a
t34
057
41.
690.
990
00
0H
ypot
hetic
al p
rote
inEU
BREC
_125
3Er
-060
123-
1154
_at
1538
910
-1.6
90.
993
33
1H
ypot
hetic
al p
rote
inEU
BREC
_131
9Er
-060
123-
1192
_at
124
189
1.52
0.96
00
00
phos
pho-
N-a
cety
lmur
amoy
l-pen
tape
ptid
e-tra
nsfe
rase
EUBR
EC_1
343
Er-0
6012
3-12
08_a
t35
795
12.
661.
000
00
0H
ypot
hetic
al p
rote
inEU
BREC
_134
5Er
-060
123-
1209
_at
277
961
3.47
1.00
00
00
Hyp
othe
tical
pro
tein
EUBR
EC_1
346
Er-0
6012
3-12
10_a
t26
487
03.
301.
000
00
0H
ypot
hetic
al p
rote
inEU
BREC
_134
9Er
-060
123-
1212
_at
7917
02.
171.
000
00
0tw
o-co
mpo
nent
sys
tem
, CitB
fam
ily, c
it op
eron
sen
sor
hist
idin
eki
nase
CitA
EUBR
EC_1
350
Er-0
6012
3-12
13_a
t57
819
343.
341.
000
00
0H
ypot
hetic
al p
rote
inEU
BREC
_135
3Er
-060
123-
1214
_at
409
1548
3.78
1.00
00
00
Hyp
othe
tical
pro
tein
EUBR
EC_1
376
Er-0
6012
3-12
34_a
t93
361
8-1
.51
0.98
00
00
Hyp
othe
tical
pro
tein
EUBR
EC_1
379
Er-0
6012
3-12
36_a
t78
432
3-2
.43
1.00
01
00
Hyp
othe
tical
pro
tein
EUBR
EC_1
381
Er-0
6012
3-12
37_a
t47
127
4-1
.72
0.96
00
00
AraC
fam
ily tr
ansc
riptio
nal r
egul
ator
, L-rh
amno
se o
pero
n tra
nscr
iptio
nala
ctiv
ator
Rha
R
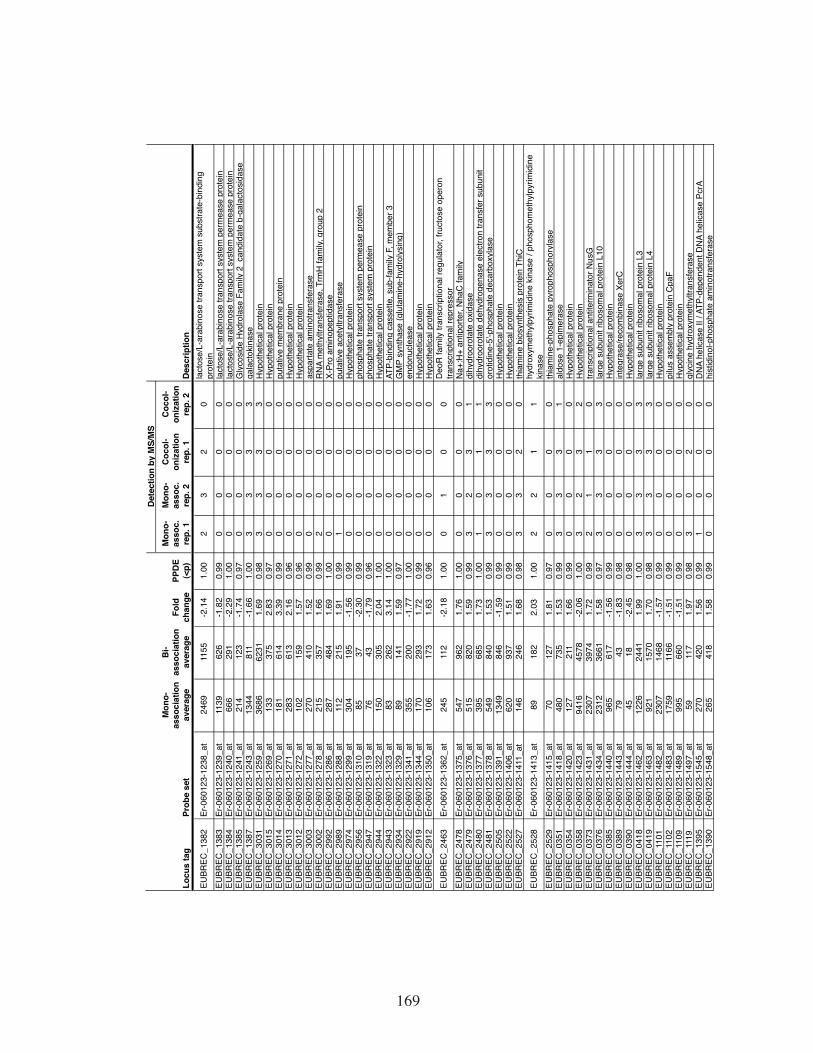
169
Locu
s ta
gPr
obe
set
Mon
o-as
soci
atio
nav
erag
e
Bi-
asso
ciat
ion
aver
age
Fold
chan
gePP
DE
(<p)
Mon
o-as
soc.
rep.
1
Mon
o-as
soc.
rep.
2
Coc
ol-
oniz
atio
nre
p. 1
Coc
ol-
oniz
atio
nre
p. 2
Des
crip
tion
Det
ectio
nby
MS/
MS
EUBR
EC_1
382
Er-0
6012
3-12
38_a
t24
6911
55-2
.14
1.00
23
20
lact
ose/
L-ar
abin
ose
trans
port
syst
em s
ubst
rate
-bin
ding
pr
otei
nEU
BREC
_138
3Er
-060
123-
1239
_at
1139
626
-1.8
20.
990
00
0la
ctos
e/L-
arab
inos
e tra
nspo
rt sy
stem
perm
ease
prot
ein
EUBR
EC_1
384
Er-0
6012
3-12
40_a
t66
629
1-2
.29
1.00
00
00
lact
ose/
L-ar
abin
ose
trans
port
syst
empe
rmea
sepr
otei
nEU
BREC
_138
5Er
-060
123-
1241
_at
214
123
-1.7
40.
970
00
0G
l yco
side
Hyd
rola
se F
amily
2 c
andi
date
b-g
alac
tosi
dase
EUBR
EC_1
387
Er-0
6012
3-12
43_a
t13
4481
1-1
.66
1.00
33
33
gala
ctok
inas
eEU
BREC
_303
1Er
-060
123-
1259
_at
3686
6231
1.69
0.98
33
33
Hyp
othe
tical
prot
ein
EUBR
EC_3
015
Er-0
6012
3-12
69_a
t13
337
52.
830.
970
00
0H
ypot
hetic
alpr
otei
nEU
BREC
_301
4Er
-060
123-
1270
_at
181
614
3.39
0.99
00
00
puta
tive
mem
bran
e pr
otei
nEU
BREC
_301
3Er
-060
123-
1271
_at
283
613
2.16
0.96
00
00
Hyp
othe
tical
prot
ein
EUBR
EC_3
012
Er-0
6012
3-12
72_a
t10
215
91.
570.
960
00
0H
ypot
hetic
alpr
otei
nEU
BREC
_300
3Er
-060
123-
1277
_at
270
410
1.52
0.99
00
00
aspa
rtate
am
inot
rans
fera
seEU
BREC
_300
2Er
-060
123-
1278
_at
215
357
1.66
0.99
20
00
RN
A m
eth y
ltran
sfer
ase,
Trm
H fa
mily
,gro
up 2
EUBR
EC_2
992
Er-0
6012
3-12
86_a
t28
748
41.
691.
000
00
0X-
Pro
amin
o pep
tidas
eEU
BREC
_298
9Er
-060
123-
1288
_at
112
215
1.91
0.99
10
00
puta
tive
acet
yltra
nsfe
rase
EUBR
EC_2
974
Er-0
6012
3-12
99_a
t30
419
5-1
.56
0.99
00
00
Hyp
othe
tical
prot
ein
EUBR
EC_2
956
Er-0
6012
3-13
10_a
t85
37-2
.30
0.99
00
00
phos
phat
e tra
nspo
rt sy
stem
perm
ease
prot
ein
EUBR
EC_2
947
Er-0
6012
3-13
19_a
t76
43-1
.79
0.96
00
00
phos
phat
e tra
nspo
rt sy
stem
prot
ein
EUBR
EC_2
944
Er-0
6012
3-13
22_a
t15
030
52.
041.
000
00
0H
ypot
hetic
alpr
otei
nEU
BREC
_294
3Er
-060
123-
1323
_at
8326
23.
141.
000
00
0AT
P-bi
ndin
g ca
sset
te, s
ub-fa
mily
F, m
embe
r 3EU
BREC
_293
4Er
-060
123-
1329
_at
8914
11.
590.
970
00
0G
MP
s ynt
hase
(glu
tam
ine-
hydr
olys
ing)
EUBR
EC_2
922
Er-0
6012
3-13
41_a
t35
520
0-1
.77
1.00
00
00
endo
nucl
ease
EUBR
EC_2
919
Er-0
6012
3-13
44_a
t17
029
31.
720.
990
00
0H
ypot
hetic
alpr
otei
nEU
BREC
_291
2Er
-060
123-
1350
_at
106
173
1.63
0.96
00
00
Hyp
othe
tical
prot
ein
EUBR
EC_2
463
Er-0
6012
3-13
62_a
t24
511
2-2
.18
1.00
01
00
Deo
R fa
mily
tran
scrip
tiona
l reg
ulat
or, f
ruct
ose
oper
on
trans
crip
tiona
l rep
ress
orEU
BREC
_247
8Er
-060
123-
1375
_at
547
962
1.76
1.00
00
00
Na+
:H+
anti p
orte
r, N
haC
fam
ilyEU
BREC
_247
9Er
-060
123-
1376
_at
515
820
1.59
0.99
32
31
dihy
droo
rota
te o
xida
seEU
BREC
_248
0Er
-060
123-
1377
_at
395
685
1.73
1.00
10
11
dih y
droo
rota
te d
ehyd
roge
nase
ele
ctro
n tra
nsfe
r sub
unit
EUBR
EC_2
481
Er-0
6012
3-13
78_a
t54
984
01.
530.
993
33
3or
otid
ine-
5'- p
hosp
hate
dec
arbo
xyla
seEU
BREC
_250
5Er
-060
123-
1391
_at
1349
846
-1.5
90.
990
00
0H
ypot
hetic
alpr
otei
nEU
BREC
_252
2Er
-060
123-
1406
_at
620
937
1.51
0.99
00
00
Hyp
othe
tical
prot
ein
EUBR
EC_2
527
Er-0
6012
3-14
11_a
t14
624
61.
680.
983
32
0th
iam
ine
bios
ynth
esis
prot
ein
ThiC
EUBR
EC_2
528
Er-0
6012
3-14
13_a
t89
182
2.03
1.00
22
11
hydr
oxym
ethy
lpyr
imid
ine
kina
se /
phos
phom
ethy
lpyr
imid
ine
kina
seEU
BREC
_252
9Er
-060
123-
1415
_at
7012
71.
810.
970
00
0th
iam
ine-
phos
phat
epy
roph
osph
oryl
ase
EUBR
EC_0
351
Er-0
6012
3-14
18_a
t48
073
51.
530.
993
33
1al
dose
1-e
pim
eras
eEU
BREC
_035
4Er
-060
123-
1420
_at
127
211
1.66
0.99
00
00
Hyp
othe
tical
prot
ein
EUBR
EC_0
358
Er-0
6012
3-14
23_a
t94
1645
78-2
.06
1.00
32
32
Hyp
othe
tical
prot
ein
EUBR
EC_0
373
Er-0
6012
3-14
31_a
t23
0739
741.
720.
992
11
0tra
nscr
i ptio
nal a
ntite
rmin
ator
Nus
GEU
BREC
_037
6Er
-060
123-
1434
_at
2312
3661
1.58
0.97
33
33
lar g
e su
buni
t rib
osom
al p
rote
in L
10EU
BREC
_038
5Er
-060
123-
1440
_at
965
617
-1.5
60.
990
00
0H
ypot
hetic
alpr
otei
nEU
BREC
_038
9Er
-060
123-
1443
_at
7943
-1.8
30.
980
00
0in
tegr
ase/
reco
mbi
nase
Xer
CEU
BREC
_039
0Er
-060
123-
1444
_at
4518
-2.4
50.
980
00
0H
ypot
hetic
alpr
otei
nEU
BREC
_041
8Er
-060
123-
1462
_at
1226
2441
1.99
1.00
33
33
lar g
e su
buni
t rib
osom
al p
rote
in L
3EU
BREC
_041
9Er
-060
123-
1463
_at
921
1570
1.70
0.98
33
33
lar g
e su
buni
t rib
osom
al p
rote
in L
4EU
BREC
_110
1Er
-060
123-
1482
_at
2307
1468
-1.5
70.
990
00
0H
ypot
hetic
alpr
otei
nEU
BREC
_110
2Er
-060
123-
1483
_at
1759
1166
-1.5
10.
990
00
0pi
lus
asse
mbl
ypr
otei
n C
paF
EUBR
EC_1
109
Er-0
6012
3-14
89_a
t99
566
0-1
.51
0.99
00
00
Hyp
othe
tical
prot
ein
EUBR
EC_1
119
Er-0
6012
3-14
97_a
t59
117
1.97
0.98
30
20
glyc
ine
hydr
oxym
ethy
ltran
sfer
ase
EUBR
EC_1
395
Er-0
6012
3-15
45_a
t27
042
01.
560.
991
00
0D
NA
helic
ase
II / A
TP-d
e pen
dent
DN
A he
licas
e Pc
rAEU
BREC
_139
0Er
-060
123-
1548
_at
265
418
1.58
0.99
00
00
hist
idin
ol- p
hosp
hate
am
inot
rans
fera
se

170
Locu
s ta
gPr
obe
set
Mon
o-as
soci
atio
nav
erag
e
Bi-
asso
ciat
ion
aver
age
Fold
chan
gePP
DE
(<p)
Mon
o-as
soc.
rep.
1
Mon
o-as
soc.
rep.
2
Coc
ol-
oniz
atio
nre
p. 1
Coc
ol-
oniz
atio
nre
p. 2
Des
crip
tion
Det
ectio
nby
MS/
MS
EUBR
EC_2
841
Er-0
6012
3-15
60_a
t24
112
9-1
.86
1.00
10
00
3-de
hydr
oqui
nate
dehy
drat
ase
EUBR
EC_2
854
Er-0
6012
3-15
68_a
t48
324
6-1
.96
0.97
00
00
mol
ecul
arch
a per
one
Dna
JEU
BREC
_287
4Er
-060
123-
1587
_at
831
483
-1.7
20.
991
00
0H
ypot
hetic
al p
rote
inEU
BREC
_287
8Er
-060
123-
1588
_at
1116
580
-1.9
31.
000
00
0H
ypot
hetic
al p
rote
inEU
BREC
_288
0Er
-060
123-
1590
_at
8648
-1.8
00.
980
00
0H
ypot
hetic
al p
rote
inEU
BREC
_288
3Er
-060
123-
1594
_at
7743
-1.8
00.
970
00
0H
ypot
hetic
al p
rote
inEU
BREC
_288
6Er
-060
123-
1597
_at
186
97-1
.91
0.99
00
00
mul
ti ple
suga
rtra
nspo
rtsy
stem
per
mea
se p
rote
inEU
BREC
_288
7Er
-060
123-
1598
_at
703
383
-1.8
41.
000
00
0tw
o-co
mpo
nent
syst
em,r
espo
nse
regu
lato
rYes
NEU
BREC
_288
8Er
-060
123-
1599
_at
608
370
-1.6
40.
990
00
0tw
o-co
mpo
nent
syst
em,s
enso
rhis
tidin
eki
nase
YesM
EUBR
EC_2
889
Er-0
6012
3-16
00_a
t55
131
3-1
.76
1.00
00
00
Hyp
othe
tical
pro
tein
EUBR
EC_2
897
Er-0
6012
3-16
06_a
t81
147
1.82
0.99
33
31
F-t y
peH
+-tra
nspo
rting
ATPa
sebe
tach
ain
EUBR
EC_2
898
Er-0
6012
3-16
07_a
t67
118
1.76
0.97
00
00
Na+
-tran
s por
ting
two-
sect
orAT
Pase
EUBR
EC_2
899
Er-0
6012
3-16
08_a
t83
149
1.79
0.97
12
00
F-t y
peH
+-tra
nspo
rting
ATPa
seal
pha
chai
nEU
BREC
_290
0Er
-060
123-
1609
_at
5712
92.
271.
000
00
0H
ypot
hetic
al p
rote
inEU
BREC
_088
5Er
-060
123-
1635
_at
8113
11.
630.
970
00
0t y
peIr
estri
ctio
nen
zym
e,S
subu
nit
EUBR
EC_0
886
Er-0
6012
3-16
36_a
t12
022
51.
870.
990
00
0t y
peIr
estri
ctio
nen
zym
eEU
BREC
_089
3Er
-060
123-
1643
_at
209
124
-1.6
90.
980
00
0th
iore
doxi
nre
duct
ase
(NAD
PH)
EUBR
EC_0
895
Er-0
6012
3-16
45_a
t31
819
8-1
.60
0.99
00
00
coen
zym
eF4
20hy
drog
enas
eEU
BREC
_090
2Er
-060
123-
1648
_at
128
196
1.53
0.96
00
00
urop
orph
yrin
-III C
-met
hyltr
ansf
eras
e / p
reco
rrin-
2 de
hydr
ogen
ase
/siro
hydr
ochl
orin
ferro
chel
atas
eEU
BREC
_226
7Er
-060
123-
1687
_at
2372
3.15
0.98
00
00
antib
iotic
trans
port
syst
emAT
P-bi
ndin
g pr
otei
nEU
BREC
_226
5Er
-060
123-
1689
_at
5010
22.
040.
960
00
0H
ypot
hetic
al p
rote
inEU
BREC
_226
1Er
-060
123-
1692
_at
1122
1787
1.59
0.99
33
33
Hyp
othe
tical
pro
tein
EUBR
EC_2
257
Er-0
6012
3-16
94_a
t81
147
1.82
0.97
00
00
Hyp
othe
tical
pro
tein
EUBR
EC_2
244
Er-0
6012
3-17
07_a
t32
3621
12-1
.53
0.98
12
00
met
allo
-bet
a-la
ctam
ase
fam
il y p
rote
inEU
BREC
_224
3Er
-060
123-
1708
_at
641
383
-1.6
80.
990
00
0H
ypot
hetic
al p
rote
inEU
BREC
_224
2Er
-060
123-
1709
_at
962
619
-1.5
50.
990
00
0pu
tativ
etw
o-co
mpo
nent
syst
emre
spon
sere
gula
tor
EUBR
EC_2
229
Er-0
6012
3-17
18_a
t84
188
2.23
1.00
32
10
pept
ide
chai
nre
leas
efa
ctor
RF-
3EU
BREC
_222
3Er
-060
123-
1724
_at
5610
11.
800.
983
21
03-
deox
y-7-
phos
phoh
eptu
lona
tesy
ntha
seEU
BREC
_221
9Er
-060
123-
1726
_at
8715
31.
770.
970
00
0rib
osom
alla
r ge
subu
nit p
seud
ourid
ine
synt
hase
FEU
BREC
_221
8Er
-060
123-
1727
_at
105
171
1.63
0.97
01
00
DN
Ali g
ase
(NAD
+)EU
BREC
_314
9Er
-060
123-
1753
_at
209
130
-1.6
10.
980
00
0H
ypot
hetic
al p
rote
inEU
BREC
_315
2Er
-060
123-
1756
_at
167
90-1
.86
0.99
00
00
AbrB
fam
ily tr
ansc
riptio
nal r
egul
ator
, sta
ge V
spo
rula
tion
prot
ein
TEU
BREC
_315
8Er
-060
123-
1762
_at
1359
854
-1.5
90.
992
10
0H
ypot
hetic
al p
rote
inEU
BREC
_316
9Er
-060
123-
1774
_at
410
269
-1.5
20.
980
00
0xa
nthi
nede
h ydr
ogen
ase
acce
ssor
yfa
ctor
EUBR
EC_3
181
Er-0
6012
3-17
83_a
t10
6118
871.
781.
000
00
0H
ypot
hetic
al p
rote
inEU
BREC
_318
4Er
-060
123-
1785
_at
829
1413
1.70
1.00
00
00
Hyp
othe
tical
pro
tein
EUBR
EC_1
197
Er-0
6012
3-17
90_a
t96
058
1-1
.65
0.99
00
00
Hyp
othe
tical
pro
tein
EUBR
EC_1
208
Er-0
6012
3-17
98_a
t53
529
4-1
.82
0.98
00
00
arse
nica
l pum
pm
embr
ane
prot
ein
EUBR
EC_1
213
Er-0
6012
3-18
03_a
t13
6170
1-1
.94
1.00
33
32
5-m
ethy
ltetra
hydr
opte
royl
trigl
utam
ate-
-hom
ocys
tein
em
ethy
ltran
sfer
ase
EUBR
EC_1
227
Er-0
6012
3-18
08_a
t72
427
5-2
.63
1.00
33
33
ferre
doxi
nh y
drog
enas
ela
rge
subu
nit
EUBR
EC_1
229
Er-0
6012
3-18
09_a
t53
732
9-1
.63
0.99
00
00
puta
tive
two-
com
pone
ntsy
stem
resp
onse
regu
lato
rEU
BREC
_124
9Er
-060
123-
1822
_at
269
453
1.68
0.99
11
00
dih y
drof
olat
ere
duct
ase
EUBR
EC_1
250
Er-0
6012
3-18
23_a
t21
735
71.
640.
990
10
0ac
etol
acta
tes y
ntha
sela
rge
subu
nit
EUBR
EC_1
535
Er-0
6012
3-18
27_a
t79
644
0-1
.81
1.00
00
00
Hyp
othe
tical
pro
tein
EUBR
EC_1
529
Er-0
6012
3-18
30_a
t63
141
5-1
.52
0.97
00
00
twitc
hin g
mot
ility
prot
ein
PilT
EUBR
EC_1
519
Er-0
6012
3-18
39_a
t11
318
31.
610.
970
00
0ni
cotin
ate
phos
phor
ibos
yltra
nsfe
rase
EUBR
EC_1
518
Er-0
6012
3-18
40_a
t23
635
91.
520.
983
33
3ph
osph
orib
osyl
form
ylgl
ycin
amid
ine
synt
hase
EUBR
EC_1
509
Er-0
6012
3-18
47_a
t92
178
1.93
0.98
00
00
tRN
A (g
uani
ne-N
1-)-m
ethy
ltran
sfer
ase
EUBR
EC_1
508
Er-0
6012
3-18
49_a
t77
172
2.22
0.97
11
00
16S
rRN
A pr
oces
sing
pro
tein
Rim
M
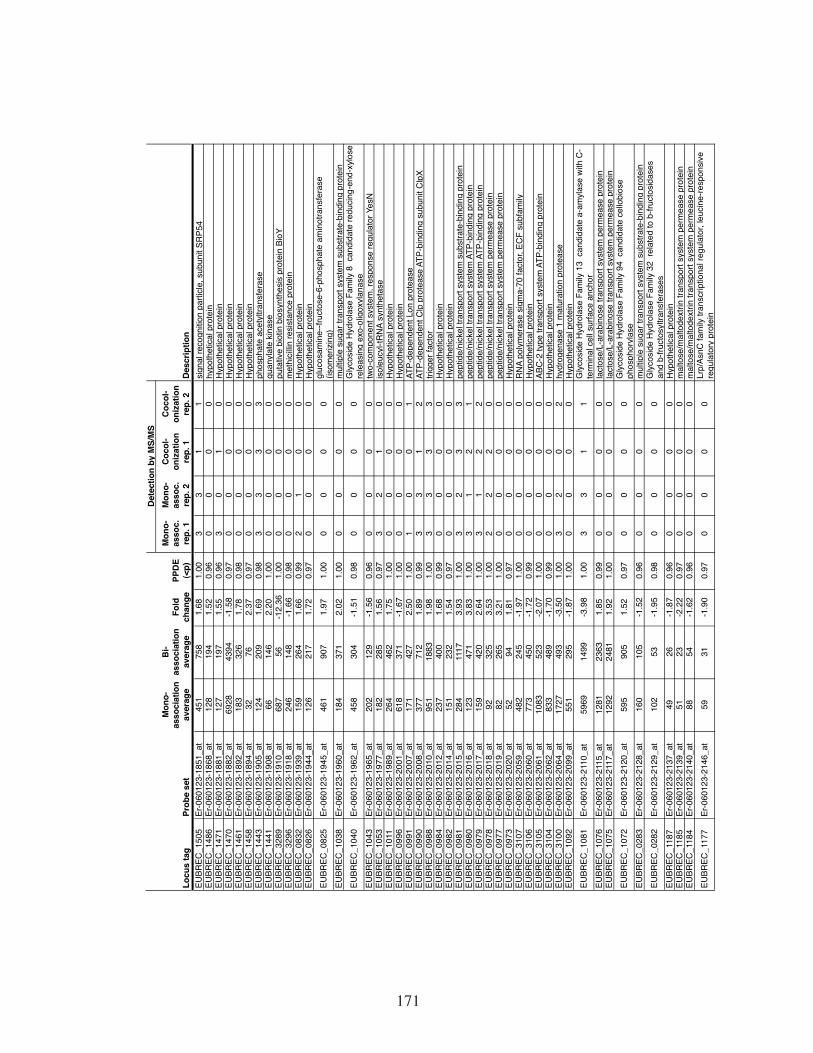
171
Locu
s ta
gPr
obe
set
Mon
o-as
soci
atio
nav
erag
e
Bi-
asso
ciat
ion
aver
age
Fold
chan
gePP
DE
(<p)
Mon
o-as
soc.
rep.
1
Mon
o-as
soc.
rep.
2
Coc
ol-
oniz
atio
nre
p. 1
Coc
ol-
oniz
atio
nre
p. 2
Des
crip
tion
Det
ectio
nby
MS/
MS
EUBR
EC_1
505
Er-0
6012
3-18
51_a
t45
175
81.
681.
003
31
1si
gnal
reco
gniti
on p
artic
le,s
ubun
itSR
P54
EUBR
EC_1
486
Er-0
6012
3-18
68_a
t12
819
41.
520.
960
00
0h y
poth
etic
al p
rote
inEU
BREC
_147
1Er
-060
123-
1881
_at
127
197
1.55
0.96
30
10
Hyp
othe
tical
pro
tein
EUBR
EC_1
470
Er-0
6012
3-18
82_a
t69
2843
94-1
.58
0.97
00
00
Hyp
othe
tical
pro
tein
EUBR
EC_1
461
Er-0
6012
3-18
92_a
t18
332
61.
780.
980
00
0H
ypot
hetic
al p
rote
inEU
BREC
_145
8Er
-060
123-
1894
_at
3276
2.37
0.97
00
00
Hyp
othe
tical
pro
tein
EUBR
EC_1
443
Er-0
6012
3-19
05_a
t12
420
91.
690.
983
33
3ph
osph
ate
acet
yltra
nsfe
rase
EUBR
EC_1
441
Er-0
6012
3-19
08_a
t66
146
2.20
1.00
00
00
guan
ylat
eki
nase
EUBR
EC_3
289
Er-0
6012
3-19
10_a
t68
756
-12.
361.
000
00
0pu
tativ
ebi
otin
bios
ynth
esis
pro
tein
BioY
EUBR
EC_3
296
Er-0
6012
3-19
18_a
t24
614
8-1
.66
0.98
00
00
met
hici
llinre
sist
ance
pro
tein
EUBR
EC_0
832
Er-0
6012
3-19
39_a
t15
926
41.
660.
992
10
0H
ypot
hetic
al p
rote
inEU
BREC
_082
6Er
-060
123-
1944
_at
126
217
1.72
0.97
00
00
Hyp
othe
tical
pro
tein
EUBR
EC_0
825
Er-0
6012
3-19
45_a
t46
190
71.
971.
000
00
0gl
ucos
amin
e--fr
ucto
se-6
-pho
spha
te a
min
otra
nsfe
rase
(is
omer
izin
g)EU
BREC
_103
8Er
-060
123-
1960
_at
184
371
2.02
1.00
00
00
mul
tiple
suga
rtra
nspo
rtsy
stem
subs
trate
-bin
ding
pro
tein
EUBR
EC_1
040
Er-0
6012
3-19
62_a
t45
830
4-1
.51
0.98
00
00
Gly
cosi
de H
ydro
lase
Fam
ily 8
can
dida
te re
duci
ng-e
nd-x
ylos
ere
leas
ing
exo-
olig
oxyl
anas
eEU
BREC
_104
3Er
-060
123-
1965
_at
202
129
-1.5
60.
960
00
0tw
o-co
mpo
nent
syst
em,r
espo
nse
regu
lato
rYes
NEU
BREC
_105
3Er
-060
123-
1977
_at
182
285
1.56
0.97
32
10
isol
euc y
l-tR
NA
synt
heta
seEU
BREC
_101
1Er
-060
123-
1989
_at
264
462
1.75
1.00
00
00
Hyp
othe
tical
pro
tein
EUBR
EC_0
996
Er-0
6012
3-20
01_a
t61
837
1-1
.67
1.00
00
00
Hyp
othe
tical
pro
tein
EUBR
EC_0
991
Er-0
6012
3-20
07_a
t17
142
72.
501.
001
00
1AT
P-de
pend
entL
on p
rote
ase
EUBR
EC_0
990
Er-0
6012
3-20
08_a
t37
771
21.
890.
993
31
2AT
P-de
pend
entC
lp p
rote
ase
ATP-
bind
ing
subu
nitC
lpX
EUBR
EC_0
988
Er-0
6012
3-20
10_a
t95
118
831.
981.
003
33
3tri
gger
fact
orEU
BREC
_098
4Er
-060
123-
2012
_at
237
400
1.68
0.99
00
00
Hyp
othe
tical
pro
tein
EUBR
EC_0
982
Er-0
6012
3-20
14_a
t15
123
21.
540.
970
00
0H
ypot
hetic
al p
rote
inEU
BREC
_098
1Er
-060
123-
2015
_at
284
1117
3.93
1.00
32
33
pept
ide/
nick
eltra
nspo
rtsy
stem
subs
trate
-bin
ding
pro
tein
EUBR
EC_0
980
Er-0
6012
3-20
16_a
t12
347
13.
831.
003
12
1pe
ptid
e/ni
ckel
trans
port
syst
emAT
P-bi
ndin
g pr
otei
nEU
BREC
_097
9Er
-060
123-
2017
_at
159
420
2.64
1.00
31
22
pept
ide/
nick
eltra
nspo
rtsy
stem
ATP-
bind
ing
prot
ein
EUBR
EC_0
978
Er-0
6012
3-20
18_a
t92
325
3.53
1.00
22
20
pept
ide/
nick
eltra
nspo
rtsy
stem
per
mea
se p
rote
inEU
BREC
_097
7Er
-060
123-
2019
_at
8226
53.
211.
000
00
0pe
ptid
e/ni
ckel
trans
port
syst
em p
erm
ease
pro
tein
EUBR
EC_0
973
Er-0
6012
3-20
20_a
t52
941.
810.
970
00
0H
ypot
hetic
al p
rote
inEU
BREC
_310
7Er
-060
123-
2059
_at
482
245
-1.9
71.
000
00
0R
NA
poly
mer
ase
sigm
a-70
fact
or,E
CF
subf
amily
EUBR
EC_3
106
Er-0
6012
3-20
60_a
t77
345
0-1
.72
0.99
00
00
Hyp
othe
tical
pro
tein
EUBR
EC_3
105
Er-0
6012
3-20
61_a
t10
8352
3-2
.07
1.00
00
00
ABC
-2t y
petra
nspo
rtsy
stem
ATP-
bind
ing
prot
ein
EUBR
EC_3
104
Er-0
6012
3-20
62_a
t83
348
9-1
.70
0.99
00
00
Hyp
othe
tical
pro
tein
EUBR
EC_3
100
Er-0
6012
3-20
64_a
t17
2749
3-3
.50
1.00
32
02
h ydr
ogen
ase
1m
atur
atio
n pr
otea
seEU
BREC
_109
2Er
-060
123-
2099
_at
551
295
-1.8
71.
000
00
0H
ypot
hetic
al p
rote
inEU
BREC
_108
1Er
-060
123-
2110
_at
5969
1499
-3.9
81.
003
31
1G
lyco
side
Hyd
rola
se F
amily
13
can
dida
te a
-am
ylas
e w
ith C
-te
rmin
alce
llsu
rface
anch
orEU
BREC
_107
6Er
-060
123-
2115
_at
1281
2363
1.85
0.99
00
00
lact
ose/
L-ar
abin
ose
trans
port
syst
em p
erm
ease
pro
tein
EUBR
EC_1
075
Er-0
6012
3-21
17_a
t12
9224
811.
921.
000
00
0la
ctos
e/L-
arab
inos
etra
nspo
rtsy
stem
per
mea
se p
rote
inEU
BREC
_107
2Er
-060
123-
2120
_at
595
905
1.52
0.97
00
00
Gly
cosi
de H
ydro
lase
Fam
ily 9
4 c
andi
date
cel
lobi
ose
phos
phor
ylas
eEU
BREC
_028
3Er
-060
123-
2128
_at
160
105
-1.5
20.
960
00
0m
ulti p
lesu
gart
rans
port
syst
emsu
bstra
te-b
indi
ng p
rote
inEU
BREC
_028
2Er
-060
123-
2129
_at
102
53-1
.95
0.98
00
00
Gly
cosi
de H
ydro
lase
Fam
ily 3
2 re
late
d to
b-fr
ucto
sida
ses
and
b-fru
ctos
yltra
nsfe
rase
sEU
BREC
_118
7Er
-060
123-
2137
_at
4926
-1.8
70.
960
00
0H
ypot
hetic
al p
rote
inEU
BREC
_118
5Er
-060
123-
2139
_at
5123
-2.2
20.
970
00
0m
alto
se/m
alto
dext
rintra
nspo
rtsy
stem
per
mea
se p
rote
inEU
BREC
_118
4Er
-060
123-
2140
_at
8854
-1.6
20.
960
00
0m
alto
se/m
alto
dext
rintra
nspo
rtsy
stem
per
mea
se p
rote
inEU
BREC
_117
7Er
-060
123-
2146
_at
5931
-1.9
00.
970
00
0Lr
p/As
nC fa
mily
tran
scrip
tiona
l reg
ulat
or, l
euci
ne-re
spon
sive
re
gula
tory
pro
tein
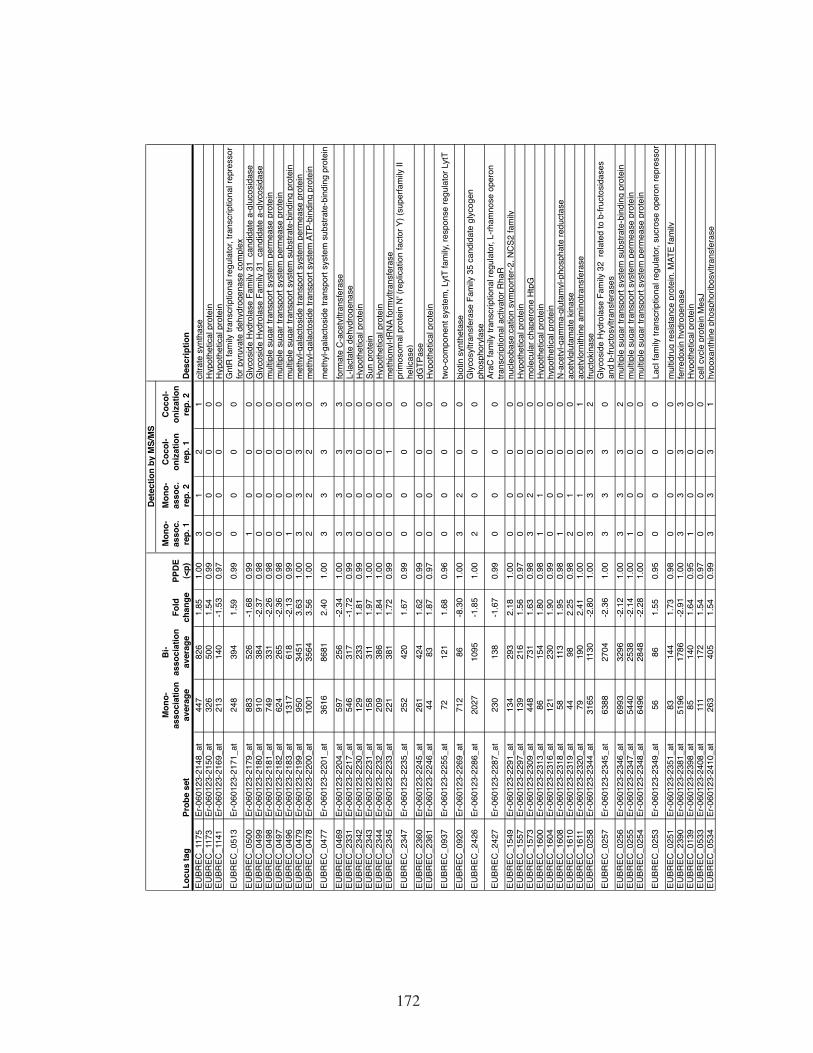
172
Locu
s ta
gPr
obe
set
Mon
o-as
soci
atio
nav
erag
e
Bi-
asso
ciat
ion
aver
age
Fold
chan
gePP
DE
(<p)
Mon
o-as
soc.
rep.
1
Mon
o-as
soc.
rep.
2
Coc
ol-
oniz
atio
nre
p. 1
Coc
ol-
oniz
atio
nre
p. 2
Des
crip
tion
Det
ectio
nby
MS/
MS
EUBR
EC_1
175
Er-0
6012
3-21
48_a
t44
782
61.
851.
003
12
1ci
trate
syn
thas
eEU
BREC
_117
3Er
-060
123-
2150
_at
326
500
1.54
0.99
00
00
Hyp
othe
tical
prot
ein
EUBR
EC_1
141
Er-0
6012
3-21
69_a
t21
314
0-1
.53
0.97
00
00
Hyp
othe
tical
prot
ein
EUBR
EC_0
513
Er-0
6012
3-21
71_a
t24
839
41.
590.
990
00
0G
ntR
fam
ily tr
ansc
riptio
nal r
egul
ator
, tra
nscr
iptio
nal r
epre
ssor
fo
rpyr
uvat
e de
hydr
ogen
ase
com
plex
EUBR
EC_0
500
Er-0
6012
3-21
79_a
t88
352
6-1
.68
0.99
10
00
Gl y
cosi
de H
ydro
lase
Fam
ily 3
1 c
andi
date
a-g
luco
sida
seEU
BREC
_049
9Er
-060
123-
2180
_at
910
384
-2.3
70.
980
00
0G
l yco
side
Hyd
rola
se F
amily
31
can
dida
te a
-gly
cosi
dase
EUBR
EC_0
498
Er-0
6012
3-21
81_a
t74
933
1-2
.26
0.98
00
00
mul
ti ple
sug
ar tr
ansp
ort s
yste
mpe
rmea
sepr
otei
nEU
BREC
_049
7Er
-060
123-
2182
_at
624
265
-2.3
60.
980
00
0m
ulti p
le s
ugar
tran
spor
t sys
tem
perm
ease
prot
ein
EUBR
EC_0
496
Er-0
6012
3-21
83_a
t13
1761
8-2
.13
0.99
10
00
mul
ti ple
sug
ar tr
ansp
ort s
yste
m s
ubst
rate
-bin
ding
prot
ein
EUBR
EC_0
479
Er-0
6012
3-21
99_a
t95
034
513.
631.
003
33
3m
eth y
l-gal
acto
side
tran
spor
t sys
tem
perm
ease
prot
ein
EUBR
EC_0
478
Er-0
6012
3-22
00_a
t10
0135
643.
561.
002
22
0m
eth y
l-gal
acto
side
tran
spor
t sys
tem
ATP
-bin
ding
prot
ein
EUBR
EC_0
477
Er-0
6012
3-22
01_a
t36
1686
812.
401.
003
33
3m
ethy
l-gal
acto
side
tran
spor
t sys
tem
sub
stra
te-b
indi
ng p
rote
inEU
BREC
_046
9Er
-060
123-
2204
_at
597
256
-2.3
41.
003
33
3fo
rmat
e C
-ace
tyltr
ansf
eras
eEU
BREC
_233
1Er
-060
123-
2217
_at
546
317
-1.7
20.
993
03
0L-
lact
ate
deh y
drog
enas
eEU
BREC
_234
2Er
-060
123-
2230
_at
129
233
1.81
0.99
00
00
Hyp
othe
tical
prot
ein
EUBR
EC_2
343
Er-0
6012
3-22
31_a
t15
831
11.
971.
000
00
0Su
npr
otei
nEU
BREC
_234
4Er
-060
123-
2232
_at
209
386
1.84
1.00
00
00
Hyp
othe
tical
prot
ein
EUBR
EC_2
345
Er-0
6012
3-22
33_a
t22
138
11.
720.
990
01
0m
ethi
onyl
-tRN
A fo
rmyl
trans
fera
seEU
BREC
_234
7Er
-060
123-
2235
_at
252
420
1.67
0.99
00
00
prim
osom
al p
rote
in N
' (re
plic
atio
n fa
ctor
Y) (
supe
rfam
ily II
he
licas
e)EU
BREC
_236
0Er
-060
123-
2245
_at
261
424
1.62
0.99
00
00
dGTP
ase
EUBR
EC_2
361
Er-0
6012
3-22
46_a
t44
831.
870.
970
00
0H
ypot
hetic
alpr
otei
nEU
BREC
_093
7Er
-060
123-
2255
_at
7212
11.
680.
960
00
0tw
o-co
mpo
nent
sys
tem
, Lyt
T fa
mily
, res
pons
e re
gula
tor L
ytT
EUBR
EC_0
920
Er-0
6012
3-22
69_a
t71
286
-8.3
01.
003
20
0bi
otin
syn
thet
ase
EUBR
EC_2
426
Er-0
6012
3-22
86_a
t20
2710
95-1
.85
1.00
20
00
Gly
cosy
ltran
sfer
ase
Fam
ily 3
5 ca
ndid
ate
glyc
ogen
ph
osph
oryl
ase
EUBR
EC_2
427
Er-0
6012
3-22
87_a
t23
013
8-1
.67
0.99
00
00
AraC
fam
ily tr
ansc
riptio
nal r
egul
ator
, L-rh
amno
se o
pero
n tra
nscr
iptio
nal a
ctiv
ator
Rha
REU
BREC
_154
9Er
-060
123-
2291
_at
134
293
2.18
1.00
00
00
nucl
eoba
se:c
atio
n s y
mpo
rter-2
, NC
S2 fa
mily
EUBR
EC_1
557
Er-0
6012
3-22
97_a
t13
921
61.
560.
970
00
0H
ypot
hetic
alpr
otei
nEU
BREC
_157
3Er
-060
123-
2309
_at
448
731
1.63
0.98
32
00
mol
ecul
ar c
hape
rone
Htp
GEU
BREC
_160
0Er
-060
123-
2313
_at
8615
41.
800.
981
10
0H
ypot
hetic
alpr
otei
nEU
BREC
_160
4Er
-060
123-
2316
_at
121
230
1.90
0.99
00
00
h ypo
thet
ical
prot
ein
EUBR
EC_1
608
Er-0
6012
3-23
18_a
t58
113
1.95
0.98
10
00
N-a
cet y
l-gam
ma-
glut
amyl
-pho
spha
te re
duct
ase
EUBR
EC_1
610
Er-0
6012
3-23
19_a
t44
982.
250.
982
10
0ac
etyl
glut
amat
e ki
nase
EUBR
EC_1
611
Er-0
6012
3-23
20_a
t79
190
2.41
1.00
01
01
acet
ylor
nith
ine
amin
otra
nsfe
rase
EUBR
EC_0
258
Er-0
6012
3-23
44_a
t31
6511
30-2
.80
1.00
33
32
fruct
okin
ase
EUBR
EC_0
257
Er-0
6012
3-23
45_a
t63
8827
04-2
.36
1.00
33
30
Gly
cosi
de H
ydro
lase
Fam
ily 3
2 re
late
d to
b-fr
ucto
sida
ses
and
b-fru
ctos
yltra
nsfe
rase
sEU
BREC
_025
6Er
-060
123-
2346
_at
6993
3296
-2.1
21.
003
33
2m
ulti p
le s
ugar
tran
spor
t sys
tem
sub
stra
te-b
indi
ngpr
otei
nEU
BREC
_025
5Er
-060
123-
2347
_at
5440
2538
-2.1
41.
001
00
0m
ulti p
le s
ugar
tran
spor
t sys
tem
perm
ease
prot
ein
EUBR
EC_0
254
Er-0
6012
3-23
48_a
t64
9628
48-2
.28
1.00
00
00
mul
ti ple
sug
ar tr
ansp
ort s
yste
mpe
rmea
sepr
otei
nEU
BREC
_025
3Er
-060
123-
2349
_at
5686
1.55
0.95
00
00
LacI
fam
ily tr
ansc
riptio
nal r
egul
ator
, suc
rose
ope
ron
repr
esso
rEU
BREC
_025
1Er
-060
123-
2351
_at
8314
41.
730.
980
00
0m
ultid
rug
resi
stan
ce p
rote
in, M
ATE
fam
ilyEU
BREC
_239
0Er
-060
123-
2381
_at
5196
1786
-2.9
11.
003
33
3fe
rredo
xin
hydr
ogen
ase
EUBR
EC_0
139
Er-0
6012
3-23
98_a
t85
140
1.64
0.95
10
00
Hyp
othe
tical
prot
ein
EUBR
EC_0
533
Er-0
6012
3-24
08_a
t11
117
21.
540.
970
00
0ce
ll c y
cle
prot
ein
Mes
JEU
BREC
_053
4Er
-060
123-
2410
_at
263
405
1.54
0.99
33
31
h ypo
xant
hine
phos
phor
ibos
yltra
nsfe
rase

173
Locu
s ta
gPr
obe
set
Mon
o-as
soci
atio
nav
erag
e
Bi-
asso
ciat
ion
aver
age
Fold
chan
gePP
DE
(<p)
Mon
o-as
soc.
rep.
1
Mon
o-as
soc.
rep.
2
Coc
ol-
oniz
atio
nre
p. 1
Coc
ol-
oniz
atio
nre
p. 2
Des
crip
tion
Det
ectio
nby
MS/
MS
EUBR
EC_0
535
Er-0
6012
3-24
11_a
t37
957
21.
510.
992
20
0m
icro
tubu
le-s
ever
ing
ATPa
seEU
BREC
_054
0Er
-060
123-
2414
_at
7212
4401
-1.6
40.
990
00
0G
lyco
side
Hyd
rola
se F
amily
77
can
dida
te 4
-a-
gluc
anot
rans
fera
seEU
BREC
_054
1Er
-060
123-
2415
_at
4823
2835
-1.7
00.
990
00
0G
lyco
side
Hyd
rola
se F
amily
77
can
dida
te 4
-a-
gluc
anot
rans
fera
seEU
BREC
_245
3Er
-060
123-
2439
_at
304
170
-1.7
90.
990
00
0G
lyco
side
Hyd
rola
se F
amily
42
can
dida
te b
-gal
acto
sida
se
EUBR
EC_3
346
Er-0
6012
3-24
44_a
t49
3626
54-1
.86
1.00
00
00
Hyp
othe
tical
pro
tein
EUBR
EC_3
345
Er-0
6012
3-24
45_a
t11
820
31.
710.
980
00
0l y
sine
deca
rbox
ylas
eEU
BREC
_334
3Er
-060
123-
2447
_at
372
622
1.67
1.00
00
00
sacc
haro
pine
dehy
drog
enas
e (N
AD+,
L-ly
sine
form
ing)
EUBR
EC_3
341
Er-0
6012
3-24
49_a
t81
133
1.65
0.97
00
00
agm
atin
ede
imin
ase
EUBR
EC_0
313
Er-0
6012
3-24
69_a
t38
923
8-1
.64
0.98
00
00
Hyp
othe
tical
pro
tein
EUBR
EC_3
685
Er-0
6012
3-24
78_a
t85
425
5.01
1.00
00
00
mul
tidru
gre
sist
ance
pro
tein
,MAT
Efa
mily
EUBR
EC_3
687
Er-0
6012
3-24
79_a
t18
912
666.
711.
000
00
0G
lyco
side
Hyd
rola
se F
amily
1 c
andi
date
6-P
-b-g
luco
sida
se
EUBR
EC_3
689
Er-0
6012
3-24
80_a
t11
2736
663.
251.
000
00
0PT
Ss y
stem
,cel
lobi
ose-
spec
ific
IICco
mpo
nent
EUBR
EC_0
457
Er-0
6012
3-24
91_a
t24
436
81.
500.
980
00
0H
ypot
hetic
al p
rote
inEU
BREC
_195
7Er
-060
123-
2501
_at
415
628
1.52
0.99
11
00
met
h yle
nete
trahy
drof
olat
ede
hydr
ogen
ase
(NAD
P+)
EUBR
EC_1
953
Er-0
6012
3-25
05_a
t13
1021
311.
630.
993
32
2tra
nsla
tion
initi
atio
nfa
ctor
IF-3
EUBR
EC_0
234
Er-0
6012
3-25
08_a
t22
338
-5.8
61.
000
00
0bi
otin
s ynt
heta
seEU
BREC
_023
5Er
-060
123-
2509
_at
400
37-1
0.75
1.00
02
00
thia
min
ebi
osyn
thes
isTh
iHEU
BREC
_023
6Er
-060
123-
2510
_at
352
58-6
.08
1.00
00
00
GTP
-bin
din g
pro
tein
EUBR
EC_0
237
Er-0
6012
3-25
11_a
t37
112
4-2
.98
1.00
00
00
Hyp
othe
tical
pro
tein
EUBR
EC_0
241
Er-0
6012
3-25
15_a
t12
4276
5-1
.62
0.99
00
00
Mg-
depe
nden
tDN
ase
EUBR
EC_0
292
Er-0
6012
3-25
19_a
t78
147
8-1
.63
0.97
10
00
urid
ine
phos
phor
ylas
eEU
BREC
_029
3Er
-060
123-
2520
_at
640
384
-1.6
70.
980
00
0de
oxyr
ibos
e-ph
osph
ate
aldo
lase
EUBR
EC_1
583
Er-0
6012
3-25
26_a
t10
234
-2.9
91.
000
00
0fe
rrous
iron
trans
port
prot
ein
BEU
BREC
_158
6Er
-060
123-
2527
_at
6823
-2.9
90.
990
00
0H
ypot
hetic
al p
rote
inEU
BREC
_158
7Er
-060
123-
2528
_at
224
72-3
.13
1.00
00
00
Hyp
othe
tical
pro
tein
EUBR
EC_2
197
Er-0
6012
3-25
32_a
t10
022
22.
221.
000
00
0ne
urot
rans
mitt
er:N
a+s y
mpo
rter,
NSS
fam
ilyEU
BREC
_219
2Er
-060
123-
2537
_at
147
422
2.87
1.00
00
00
Hyp
othe
tical
pro
tein
EUBR
EC_3
363
Er-0
6012
3-25
40_a
t10
918
41.
700.
980
00
0H
ypot
hetic
al p
rote
inEU
BREC
_068
2Er
-060
123-
2545
_at
238
377
1.59
0.99
11
00
Hyp
othe
tical
pro
tein
EUBR
EC_0
304
Er-0
6012
3-25
52_a
t17
291
-1.8
90.
960
00
0H
ypot
hetic
al p
rote
inEU
BREC
_331
8Er
-060
123-
2561
_s_a
t15
182
-1.8
40.
990
00
0H
ypot
hetic
al p
rote
inEU
BREC
_357
4Er
-060
123-
2580
_s_a
t12
331
-3.9
41.
000
00
0H
ypot
hetic
al p
rote
inEU
BREC
_357
4Er
-060
123-
2580
_x_a
t14
354
-2.6
41.
000
00
0H
ypot
hetic
al p
rote
inEU
BREC
_357
4Er
-060
123-
2584
_s_a
t78
24-3
.33
1.00
00
00
Hyp
othe
tical
pro
tein
EUBR
EC_2
160
Er-0
6012
3-tR
NA0
9_at
8942
-2.1
00.
990
00
0tR
NA-
Thr-4
EUBR
EC_2
299
Er-0
6012
3-tR
NA1
5_at
479
287
-1.6
70.
960
00
0tR
NA-
Trp
EUBR
EC_0
347
Er-0
6012
3-tR
NA2
6_at
848
315
-2.6
91.
000
00
0tR
NA-
Met
EUBR
EC_0
850
Er-0
6012
3-tR
NA3
0_at
140
58-2
.40
0.98
00
00
tRN
A-G
lu-3
EUBR
EC_2
363
Er-0
6012
3-tR
NA4
4_at
4570
2303
-1.9
80.
980
00
0tR
NA-
Leu
EUBR
EC_2
363
Er-0
6012
3-tR
NA4
4 _x_
4460
2295
-1.9
40.
970
00
0tR
NA-
Leu
EUBR
EC_0
916
Er-0
6012
3-tR
NA4
9_at
558
251
-2.2
21.
000
00
0tR
NA-
His
EUBR
EC_0
916
Er-0
6012
3-tR
NA4
9 _x_
557
213
-2.6
11.
000
00
0tR
NA-
His

174
Table S10.
Please access provided CD for this information.

175
Table S11.
Please access provided CD for this information.

176
Table S12.
Table S12.
E. rectale
Predictedproteins
Observedby
MS/MSa
Total 3627 6801111 25
B. thetaiotaomicronTotal 4778 1687
Withoutannotationb 1527 293
Add'lpredictions 180 10
Add'l w/oannotationb 173 7
Without annotationb
Original
Additionalc

177
Table S13.
Tab
le S
13
.
Locu
s ta
gPr
obe
set
Mon
o-as
soci
atio
nav
erag
e
Bia
ssoc
-ia
tion
aver
age
Fold
chan
geB
aysi
anp-
valu
eC
orre
cted
p-va
lue
Des
crip
tion
BT_0866
BT0866_at
1269
291
-4.4
1.4
E-0
54.4
E-0
2SusD
hom
olo
g
BT_1030
BT1030_at
62
424
6.9
5.0
E-0
43.0
E-0
2co
nse
rved
hyp
oth
etic
al p
rote
in w
ith F
ibro
nec
tin,
type
III-
like
fold
dom
ain
BT_3221
BT3221_at
71
2401
33.9
1.8
E-0
32.7
E-0
7hyp
oth
etic
alpro
tein
BT_3222
BT3222_at
356
14984
42.0
7.0
E-0
34.9
E-0
6hyp
oth
etic
alpro
tein
BT_3223
BT3223_at
209
7538
36.0
4.0
E-0
22.1
E-0
6hyp
oth
etic
alpro
tein
BT_3224
BT3224_at
163
1674
10.3
1.6
E-0
36.6
E-0
4hom
olo
gous
to p
uta
tive
lys
ine
dec
arbox
ylas
eBT_3225
BT3225_at
84
645
7.7
9.4
E-0
42.5
E-0
2co
nse
rved
hyp
oth
etic
alpro
tein

178
Table S14.
Tab
le S
14
.
Pro
be s
et
nam
elo
cus
tag
Mo
no
-ass
oci
ati
on
mean
Bia
sso
c-ia
tio
nm
ean
fold
chan
ge
PP
DE(<
p)
Desc
rip
tio
nBv-
GM
2830_at
N/A
56
224
3.9
70.9
6H
ypoth
etic
al p
rote
inBv-
GM
3615_at
N/A
8123
15.2
71.0
0H
ypoth
etic
al p
rote
inBv-
GM
4084_at
N/A
724
212
-3.4
20.9
7H
ypoth
etic
al p
rote
in
Bv0
039c_
atBVU
_0039
31
271
8.6
30.9
7gly
cosi
de
hyd
rola
se fam
ily 4
3,
candid
ate
bet
a-xy
losi
das
e/al
pha-
L-ar
abin
ofu
ranosi
das
eBv0
041c_
atBVU
_0041
60
388
6.4
70.9
9gly
cosi
de
hyd
rola
sefa
mily
10,
candid
ate
bet
a-xy
lanas
eBv0
157c_
atBVU
_0159
48
513
10.7
41.0
0co
nse
rved
hyp
oth
etic
al p
rote
inBv0
165c_
atBVU
_0167
115
1298
11.2
50.9
9puta
tive
oute
rm
embra
ne
pro
tein
, pro
bab
lyin
volv
edin
nutr
ient
bin
din
gBv0
173_at
BVU
_0175
23
156
6.7
80.9
9puta
tive
acet
ylxy
lan
este
rase
Bv0
347c_
atBVU
_0356
34
285
8.2
60.9
8co
nse
rved
hyp
oth
etic
al p
rote
inBv0
348c_
atBVU
_0357
28
242
8.6
00.9
9gly
cero
lki
nas
e2 (
ATP:
gly
cero
l3-p
hosp
hotr
ansf
eras
e2)
Bv0
349c_
atBVU
_0358
12
134
11.3
31.0
0tr
ansk
etola
se,
C-t
erm
inal
subunit
Bv0
350c_
atBVU
_0359
87
514
5.9
30.9
5tr
ansk
etola
se,
N-t
erm
inal
subunit
Bv0
378_at
BVU
_0388
220
752
3.4
20.9
7puta
tive
anti-s
igm
afa
ctor
Bv0
379_at
BVU
_0389
247
1060
4.2
90.9
5puta
tive
oute
rm
embra
ne
pro
tein
, pro
bab
lyin
volv
edin
nutr
ient
bin
din
gBv0
472c_
atBVU
_0490
203
722
3.5
60.9
8co
nse
rved
hyp
oth
etic
al p
rote
in
Bv0
473c_
atBVU
_0491
141
763
5.4
20.9
9gly
cosi
de
hyd
rola
se fam
ily 3
1,
candid
ate
alpha-
gly
cosi
das
e; r
elat
ed t
o b
eta-
xylo
sidas
esBv0
550_at
BVU
_0568
752
3323
4.4
20.9
5puta
tive
oute
rm
embra
ne
pro
tein
, pro
bab
lyin
volv
edin
nutr
ient
bin
din
gBv0
577_at
BVU
_0595
131
456
3.4
90.9
7rh
amnulo
seki
nas
e/L-
fucu
lose
kinas
eBv0
579_at
BVU
_0597
206
678
3.2
90.9
8L-
rham
nose
/H+
sym
port
er
Bv0
716c_
atBVU
_0736
12445
164
-75.9
21.0
0gly
cosi
de
hyd
rola
se fam
ily 3
6,
candid
ate
alpha-
gly
cosi
das
e; r
elat
ed t
o a
lpha-
gal
acto
sidas
esBv0
916_at
BVU
_0945
3151
824
-3.8
20.9
5puta
tive
anti-s
igm
afa
ctor
Bv0
917_at
BVU
_0946
3941
529
-7.4
51.0
0puta
tive
oute
rm
embra
ne
pro
tein
, pro
bab
lyin
volv
edin
nutr
ient
bin
din
gBv0
918_at
BVU
_0947
3762
592
-6.3
61.0
0puta
tive
oute
rm
embra
ne
pro
tein
, pro
bab
lyin
volv
edin
nutr
ient
bin
din
gBv0
919_at
BVU
_0948
3546
517
-6.8
61.0
0co
nse
rved
hyp
oth
etic
al p
rote
inBv0
920_at
BVU
_0949
2227
450
-4.9
51.0
0co
nse
rved
hyp
oth
etic
al p
rote
inBv0
921_at
BVU
_0950
2438
477
-5.1
11.0
0puta
tive
oxid
ore
duct
ase
(puta
tive
secr
eted
pro
tein
)Bv1
023_at
BVU
_1054
2514
510
-4.9
30.9
9puta
tive
oute
rm
embra
ne
pro
tein
, pro
bab
lyin
volv
edin
nutr
ient
bin
din
gBv1
024_at
BVU
_1055
2107
619
-3.4
00.9
7co
nse
rved
hyp
oth
etic
al p
rote
inBv1
085c_
atBVU
_1116
28
146
5.2
00.9
8poly
sacc
har
ide
lyas
efa
mily
10,
candid
ate
pec
tate
lyas
eBv1
087c_
atBVU
_1118
84
324
3.8
60.9
8hyp
oth
etic
al p
rote
inBv1
088c_
atBVU
_1119
62
256
4.1
40.9
8puta
tive
oute
rm
embra
ne
pro
tein
, pro
bab
lyin
volv
edin
nutr
ient
bin
din
gBv1
089c_
atBVU
_1120
70
482
6.8
60.9
9puta
tive
oute
rm
embra
ne
pro
tein
, pro
bab
lyin
volv
edin
nutr
ient
bin
din
gBv1
722c_
atBVU
_1768
54
356
6.5
90.9
9gly
cosi
de
hyd
rola
sefa
mily
2,
candid
ate
bet
a-gly
cosi
das
eBv1
727c_
atBVU
_1773
181
33
-5.4
70.9
5puta
tive
oute
rm
embra
ne
pro
tein
, pro
bab
lyin
volv
edin
nutr
ient
bin
din
g
Bv1
741_at
BVU
_1787
23
227
9.7
21.0
0gly
cosi
de
hyd
rola
se fam
ily 7
8,
dis
tantly
rela
ted t
o a
lpha-
L-rh
amnosi
das
es
Bv1
805_at
BVU
_1852
8555
180
-47.5
01.0
0puta
tive
oute
rm
embra
ne
pro
tein
, pro
bab
lyin
volv
edin
nutr
ient
bin
din
gBv1
806_at
BVU
_1853
4676
74
-63.2
11.0
0puta
tive
oute
rm
embra
ne
pro
tein
, pro
bab
lyin
volv
edin
nutr
ient
bin
din
g
Bv1
933c_
atBVU
_1983
31
253
8.1
71.0
0gly
cosi
de
hyd
rola
se fam
ily 4
3,
candid
ate
bet
a-xy
losi
das
e/al
pha-
L-ar
abin
ofu
ranosi
das
e

179
Pro
be s
et
nam
elo
cus
tag
Mo
no
-ass
oci
ati
on
mean
Bia
sso
c-ia
tio
nm
ean
fold
chan
ge
PP
DE(<
p)
Desc
rip
tio
n
Bv1
935c_
atBVU
_1985
117
535
4.5
80.9
9gly
cosi
de
hyd
rola
sefa
mily
28,
rela
ted
to p
oly
gal
actu
ronas
esBv1
966_at
BVU
_2021
152
796
5.2
40.9
6co
nse
rved
hyp
oth
etic
al p
rote
inBv2
279_at
BVU
_2338
6204
582
-10.6
60.9
7RN
A p
oly
mer
ase
ECF-
type
sigm
afa
ctor
Bv2
415c_
atBVU
_2476
42
250
6.0
10.9
8co
nse
rved
hyp
oth
etic
al p
rote
inBv2
527c_
atBVU
_2588
395
83
-4.7
70.9
5tw
o-c
om
ponen
tsy
stem
resp
onse
regula
tor
Bv2
528c_
atBVU
_2589
902
158
-5.7
01.0
0puta
tive
two-c
om
ponen
tsy
stem
senso
rki
nas
eBv2
529c_
atBVU
_2590
9481
1321
-7.1
80.9
9co
nse
rved
hyp
oth
etic
al p
rote
inBv2
530c_
atBVU
_2591
10432
1418
-7.3
50.9
8co
nse
rved
hyp
oth
etic
al p
rote
inBv2
531c_
atBVU
_2592
8146
1062
-7.6
70.9
9co
nse
rved
hyp
oth
etic
al p
rote
inBv2
849_at
BVU
_2922
70
254
3.6
40.9
8puta
tive
oute
rm
embra
ne
pro
tein
, pro
bab
lyin
volv
edin
nutr
ient
bin
din
gBv2
851_at
BVU
_2924
20
158
7.9
60.9
9puta
tive
oute
rm
embra
ne
pro
tein
, pro
bab
lyin
volv
edin
nutr
ient
bin
din
gBv2
879_at
BVU
_2952
240
726
3.0
30.9
6puta
tive
epim
eras
e/deh
ydra
tase
Bv3
820c_
atBVU
_3924
991
269
-3.6
80.9
7gly
cosy
ltra
nsf
eras
efa
mily
26,
rela
ted
tobet
a-gly
cosy
ltra
nsf
eras
esBv3
822c_
atBVU
_3926
462
113
-4.1
00.9
7puta
tive
gly
cosy
ltra
nsf
eras
e
180
Chapter 4
Future Directions

181
Chapter 4
As mentioned in Chapter 1, the effects of the gut microbiota on murine adiposity are linked
with changes in host gene expression, including decreased expression of the circulating
inhibitor of lipoprotein lipase, Fiaf [1, 2]. However, the signal(s) or metabolite(s) respon-
sible for these changes remain unknown. The most direct contributions of the microbiota
to energy harvest are the short chain fatty acids (SCFAs) it produces. Studies of germ-free
mice colonized with B. thetaiotaomicron with and without the methanogen and hydrogen-
consumer Methanobrevibacter smithii show a correlation between increased adiposity and
the amount of SCFAs produced [3]. This is only one of many changes in B. thetaiotaomi-
cron’s metabolism induced by the presence of M. smithii, however, and more generally,
methanogen levels have not been correlated with obesity in humans.
The balance between Bacteroidetes and Firmicutes in the gut has been linked with
obesity in mice and humans in both genetic and dietary models, as discussed in the Intro-
duction. Transfer of a gut microbiota from obese donors to germ-free mouse recipients
produces a larger increase in adiposity than the equivalent transfer from lean donors [4,
5]. The simplified, two-component communities characterized in Chapter 3 provide an
opportunity to test whether an increase in the proportion of Firmicutes in a simplified com-
munity might likewise produce an increase in obesity. A simplified community would also
provide a more experimentally tractable model to assess specific bacterial contributions to
host adiposity.
Host adiposity in simplified microbial communities
I observed increased adiposity in mice co-colonized with E. rectale and B. thetaiotao-
micron compared to mice colonized with either species alone or to germ-free controls in
two of three experiments (Figure 1). The inconsistency between the three experiments
182
was not due to measurable differences in feed efficiency (weight gain per food consumed);
however, this parameter is difficult to measure over the short time frame of the experiments
described (data not shown). The observed increases in adiposity were also smaller than
those seen after transplantation of an intact cecal microbiota from conventionally-raised
lean donors.
While increased power (repetition) might show conclusively that the addition of
E. rectale to B. thetaiotaomicron affects adiposity, I believe that it will be more useful to
carefully and incrementally increase the complexity of the community to achieve a more
consistent phenotype. As mentioned in Chapter 3, inoculating B. thetaiotaomicron-colo-
nized mice with the methanogenic archaeon Methanobrevibacter smithii triggered a 100-
fold increase in the colonization level of B. thetaiotaomicron and 19% increase in mouse
adiposity. This was attributed to increased efficiency of fermentation in the presence of
M. smithii due to its consumption of hydrogen, since cecal and serum acetate levels and
cecal formate levels also increased significantly. Rather than consuming hydrogen, E. rec-
tale produces large amounts [6], which explains, at least in part, why B. thetaiotaomicron
does not show a similar syntrophy with E. rectale. An alternative hydrogen-consuming
pathway is the Wood-Ljungdahl pathway, or acetogenesis, which produces acetate from
carbon dioxide and hydrogen or formate. Since acetate is efficiently absorbed by the gut
epithelium and metabolized by liver, muscle and fat cells, introduction of this pathway into
the gut microbial community may result in increased energy harvest, and thus, increased
host adiposity.
Two acetogenic bacteria have been sequenced thus far as part of the Human Gut
Microbiome Initiative (HGMI). One, Bryantella formatexigens, utilizes formate but not
hydrogen, while Ruminococcus hydrogenotrophicus uses primarily hydrogen in the pro-
duction of acetate. While preliminary results indicate no dramatic difference in adiposity
between B. thetaiotaomicron-colonized mice and those co-colonized with B. thetaiotaomi-

183
cron and either acetogen (F. Rey and J. Gordon, unpublished observations), B. thetaiotao-
micron does not produce levels of hydrogen that are as high as E. rectale in vitro [6, 7].
As discussed in Chapter 3, E. rectale consumes acetate during its production of
butyrate. Therefore, the combination of a hydrogen-consuming acetogen such as R. hy-
drogenotrophicus and an acetate-consuming hydrogen producer such as E. rectale in a
two-component simplified microbiota may provide a syntrophic relationship even more
beneficial to host energy harvest than the methanogenic archaeon and B. thetaiotaomicron.
Such an idea has precedence in efforts to improve ruminant feed efficiency through inhi-
bition of methanogenesis [8]. The addition of B. thetaiotaomicron to this two-component
community may create a microbiota that has an even larger increase in its ability to pro-
mote energy harvest, since as described in Chapter 3, E. rectale grows more rapidly in the
presence of B. thetaiotaomicron.
Hydrogen and carbon dioxide are not the only fermentative byproducts whose en-
ergy is lost to the host in these simplified models of the human gut microbiota. Lactate is
produced in large amounts by E. rectale and by B. thetaiotaomicron in vitro, and is pres-
ent in the ceca of E. rectale and B. theta mono-associated as well as co-colonized mice (1
µmol/g dry weight cecal contents in all three conditions; see [3] for methods). Its level is,
on average, higher than that found for butyrate in the ceca of gnotobiotic mice consuming
the polysaccharide-rich diet used in the studies described in Chapter 3 (0.35 µmol butyrate
per gram wet weight in both E. rectale-colonized groups; see Chapter 3). Lactate is not as
efficiently absorbed as butyrate [9, 10], but is only detected at low levels in conventional
mice. This is thought to be because of the presence of bacteria that reduce it to butyrate
[11, 12]. The effect of this conversion may be three-fold: firstly, replacing the supply of
one poorly absorbed nutrient for a preferred one may increase the efficiency of host energy
harvest. Additionally, butyrate induces expression of intestinal SCFA transporters [13].
Finally, butyrate provides more energy to the host than shorter, more oxidized substrates
such as lactate.

184
One lactate-reducing organism, Anaerostipes caccae, has been sequenced as part of
the HGMI, and another, related to E. halii, is slated for sequencing. Comparing the effect
on host energy balance of simplified gut communities both with and without acetogens and
lactate reducers will enable further tests of the hypothesis that SCFAs are a major mecha-
nism by which the microbiota contributes to host adiposity. Bacterial SCFA prodution and
host absorption can be monitored by biochemical methods. In addition, the known genome
sequences of all of these organisms would permit concomitant transcriptional studies to
assess the extent to which acetogenesis and lactate reduction contribute to the metabolism
of the bacterial community in vivo.
Microbial-dependent increases in feed efficiency
In examining the role of the microbiota in energy harvest from these simplified
communities, it will be critical to manipulate and define the dietary polysaccharides that
are resistant to mouse-derived glycoside hydrolases and accessible to the bacteria. The
diets used in the studies described in the Chapter 3 are primarily composed of wheat, corn
and soy; their precise polysaccharide content has not been well characterized either before
or after sterilization prior to consumption by germ-free mice. It will be helpful to use bet-
ter-characterized purified diets, composed of components that the bacteria in the gut micro-
biota can metabolize. A starting point for the design of such diets would be the simplified
diets used in the study of diet-induced obesity discussed in the Introduction [4] (Table 1).
Because the cellulose included in these diets is not accessible to the simplified community,
the amount of microbially-accessible polysaccharides can be increased by replacing cel-
lulose with other, more readily fermented polysaccharides. For example, resistant starches,
inulin and pectins are common food additives with known structures that are not degraded
in the proximal intestine [14] and are fermented by the bacteria studied here (see Chapter
3). Systematically varying the amount of these substrates that is added to purified diets will
allow more decisive tests of the relationship between microbial and host energy harvest

185
and adiposity. Concurrent monitoring of bacterial and host SCFA metabolism both tran-
scriptionally and biochemically, in a manner similar to that described in Chapter 3, would
permit more detailed modeling of the factors that drive that relationship.
Developing a more defined dietary platform for assessment of bacterial contribu-
tions to adiposity faces several hurdles, but the first is that such a diet must be suitable for
coexistence of the members of the simplified microbiota in mice. With this in mind, I have
conducted a proof of concept pilot study to assess the feasibility of this approach. Germ-
free male NMRI mice co-colonized with B. thetaiotaomicron and E. rectale were fed one
of three diets (n=5 mice/treatment group): either a standard, 18% protein irradiated diet
consisting principally of wheat, corn and soy, as in Chapter 3 (3.4 kcal/g), or two puri-
fied formulations, a low fat and a “Western” diet, consisting of corn starch, maltodextrin,
sucrose, shortening and beef tallow that differ primarily in their caloric density and fat
content (Table 1). Mice consumed significantly less of either purified diet than the standard
chow, and significantly less of the high fat Western diet than the low fat diet (Figure 2A).
Fecal levels of each bacterium were monitored 4 weeks after co-colonization, using the
same qPCR assay developed for the studies described in Chapter 3. The results revealed
that all three of these diets support the coexistence of both bacterial strains throughout the
course of the experiment (Figure 2B). The two purified diets, however, produce a higher
ratio of B. thetaiotoaomicron to E. rectale. These diets probably provide less accessible
polysaccharide to the distal gut community, since starch is largely absorbed in the proximal
intestine and neither bacterium can degrade cellulose. Thus, B. thetaiotaomicron’s ability
to ferment host-derived glycans likely favors it.
Differences were also observed in fat pad weights, with increased adiposity occur-
ring in both purified diets (Figure 2C). The similarity in adiposity between mice fed the
two purified diets is surprising, since they differ both in caloric density (Table 1) and in
their ability to produce diet-induced obesity [4]. This similarity suggests that the increased
adiposity produced by the purified diets may be due to increased microbial energy harvest

186
compared to the standard chow. This possibility can be verified by cecal and serum SCFA
measurements as in Chapter 3. Correlating biochemical measurements of SCFA metabo-
lism with bacterial and host transcription will help identify bacterial pathways associated
with increased energy harvest. In addition, careful and incremental manipulation of the
amount of fermentable polysaccharide in the diet and/or the complexity of the community,
as described above, would enable a dissection of the effects of differences in SCFA produc-
tion and community composition on host energy balance.
Microbial affects on the host: beyond energy balance
A number of bacterial metabolites are thought to have profound effects on colonic
and generalized host health. Prominent among these is butyrate. To date, studies that ex-
amine the effects of butyrate on the host have been conducted using several approaches:
(i) in vitro examinations of colonic cell lines; (ii) in vivo administration of probiotic strains
(i.e., live bacteria that produce the proposed beneficial metabolite, e.g., butyrate); (iii) in
vivo administration of prebiotics, i.e., polysaccharides known to stimulate the growth of a
particular butyrate-producing class of bacteria in a microbial community whose complete
composition is unknown; (iv) direct supplementation. For example, in vivo models have
included supplementation of drinking water with butyrate or infusion of butyrate via injec-
tion or enema: unfortunately, such studies preclude studying butyrate utilization long-term
and at physiological levels. Alternatively, some workers have added resistant starches or
inulin, which stimulate butyrate production by a ‘normal’ microbiota. It is impossible from
such experimental designs to determine whether any changes seen in the host or microbial
community reflect direct or indirect effects. However, as described in the Introduction,
these different techniques result in contradictory phenotypes. Resolving the contradictions
requires a more physiological and more easily manipulated model of butyrate production.
The construction of simplified microbial communities, composed of sequenced
members of the human gut microbiota in gnotobiotic mice, provides a means to conduct

187
more direct tests of the effect of this intriguing bacterial metabolite, as well as others. The
phylogeny of butyrate production suggests that it has evolved (or been lost) many times
over the evolution of the Firmicutes (see Introduction Figure 2 and [15, 16]). In the setting
of gnotobiotic mice, this presents the advantage that phenotypically and phylogenetically
similar bacteria can be studied that differ in few known ways other than their production
of butyrate. For instance, the R. obeum-related strains SR1/1 and SR1/5 [17] are 99%
identical to each other based on their 16S rRNA gene sequences, but only the SR1/1 strain
produces butyrate. Similarly, Clostridium nexile and C. sp. A2-232 are 98% identical in
their 16S rRNA sequence, but only sp. 2-232 produces butyrate [17]. Both members of the
latter pair are part of the HGMI. Identifying matched strains such as SR1/1 and SR1/5 for
targeted whole genome sequencing will facilitate more careful study of the evolution of
butyrate production as well as its effect on the host. An experimental paradigm substitut-
ing such matched strains for each other in gnotobiotic mice harboring suitably constructed
simplified models of the human gut microbiota (e.g., adding them alone, or together with
B. thetaiotaomicron and/or R. hydrogenotrophicus), combined with careful transcriptional,
biochemical, calorimetric and proteomic monitoring of both host and microbe, should en-
able dissection of the effects of butyrate from other effects of these organisms on the host.
Butyrate production is not the only example of a trait with highly variable repre-
sentation within the Firmicutes; several other phenotypes of known importance to host
physiology show a similarly ‘scattered phylogeny’. Among these is the Wood-Ljungdahl
pathway of acetogenesis [18]. A similar approach can therefore be used to examine the ef-
fect of acetogenesis upon the microbial community and its host.

188
References
1. Backhed, F., J.K. Manchester, C.F. Semenkovich, and J.I. Gordon, 2007. Mechanisms
underlying the resistance to diet-induced obesity in germ-free mice. Proc Natl Acad
Sci U S A, 104 (3), p. 979-84.
2. Backhed, F., H. Ding, T. Wang, L.V. Hooper, G.Y. Koh, A. Nagy, C.F. Semenkovich,
and J.I. Gordon, 2004. The gut microbiota as an environmental factor that regulates
fat storage. Proc Natl Acad Sci U S A, 101 (44), p. 15718-23.
3. Samuel, B.S. and J.I. Gordon, 2006. A humanized gnotobiotic mouse model of
host-archaeal-bacterial mutualism. Proc Natl Acad Sci U S A, 103 (26), p. 10011-
6.
4. Turnbaugh, P.J., F. Backhed, L. Fulton, and J.I. Gordon, 2008. Diet-induced obesity
is linked to marked but reversible alterations in the mouse distal gut microbiome.
Cell Host Microbe, 3 (4), p. 213-23.
5. Turnbaugh, P.J., R.E. Ley, M.A. Mahowald, V. Magrini, E.R. Mardis, and J.I.
Gordon, 2006. An obesity-associated gut microbiome with increased capacity for
energy harvest. Nature, 444 (7122), p. 1027-31.
6. Duncan, S.H. and H.J. Flint, 2008. Proposal of a neotype strain (A1-86) for
Eubacterium rectale. Request for an Opinion. Int J Syst Evol Microbiol, 58 (Pt 7),
p. 1735-6.
7. McKay, L.F., W.P. Holbrook, and M.A. Eastwood, 1982. Methane and hydrogen
production by human intestinal anaerobic bacteria. Acta Pathol Microbiol Immunol
Scand [B], 90 (3), p. 257-60.
8. Miller, T.L. and M.J. Wolin, 2001. Inhibition of growth of methane-producing
bacteria of the ruminant forestomach by hydroxymethylglutaryl-SCoA reductase
inhibitors. J Dairy Sci, 84 (6), p. 1445-8.

189
9. Ganapathy, V., M. Thangaraju, E. Gopal, P.M. Martin, S. Itagaki, S. Miyauchi, and
P.D. Prasad, 2008. Sodium-coupled monocarboxylate transporters in normal tissues
and in cancer. Aaps J, 10 (1), p. 193-9.
10. Ritzhaupt, A., I.S. Wood, A. Ellis, K.B. Hosie, and S.P. Shirazi-Beechey, 1998.
Identification and characterization of a monocarboxylate transporter (MCT1) in pig
and human colon: its potential to transport L-lactate as well as butyrate. J Physiol,
513 ( Pt 3) p. 719-32.
11. Belenguer, A., S.H. Duncan, A.G. Calder, G. Holtrop, P. Louis, G.E. Lobley, and
H.J. Flint, 2006. Two routes of metabolic cross-feeding between Bifidobacterium
adolescentis and butyrate-producing anaerobes from the human gut. Appl Environ
Microbiol, 72 (5), p. 3593-9.
12. Duncan, S.H., P. Louis, and H.J. Flint, 2004. Lactate-utilizing bacteria, isolated
from human feces, that produce butyrate as a major fermentation product. Appl
Environ Microbiol, 70 (10), p. 5810-7.
13. Cuff, M.A., D.W. Lambert, and S.P. Shirazi-Beechey, 2002. Substrate-induced
regulation of the human colonic monocarboxylate transporter, MCT1. J Physiol,
539 (Pt 2), p. 361-71.
14. Roberfroid, M.B., 1999. Caloric Value of Inulin and Oligofructose. J. Nutrition,
129 (7 (Supplement)), p. 1436S-1437S.
15. Barcenilla, A., S.E. Pryde, J.C. Martin, S.H. Duncan, C.S. Stewart, C. Henderson,
and H.J. Flint, 2000. Phylogenetic relationships of butyrate-producing bacteria
from the human gut. Appl Environ Microbiol, 66 (4), p. 1654-61.
16. Pryde, S.E., S.H. Duncan, G.L. Hold, C.S. Stewart, and H.J. Flint, 2002. The
microbiology of butyrate formation in the human colon. FEMS Microbiol Lett, 217
(2), p. 133-9.

190
17. Louis, P., S.H. Duncan, S.I. McCrae, J. Millar, M.S. Jackson, and H.J. Flint, 2004.
Restricted distribution of the butyrate kinase pathway among butyrate-producing
bacteria from the human colon. J Bacteriol, 186 (7), p. 2099-106.
18. Drake, H.L., K. Küsel, and C. Matthies, Acetogenic Prokaryotes, in Prokaryotes,
M. Dowrkin, S. Falkow, E. Rosenberg, K.H. Schleifer, and E. Stackebrandt, Editors.
2006, Springer: New York. p. 354-420.

191
Figure Legends
Figure 1. Fat pad to body weight ratios for three independent colonization experi-
ments show a trend toward increased adiposity with co-colonization in two out of
three experiments. Each experiment involved 14 d colonizations of 6-10 week old male
germ-free NMRI mice as described in Chapter 3; n=4-5 mice per group per experiment.
Error bars are ± s.e.m.
Figure 2. The impact of purified diets on membership in a simplified model human
gut microbiota. (A) Chow consumption varies proportionally to caloric density: polysac-
charide-rich (3.4 kcal/g), low-fat (3.7 kcal/g, and western (4.7 kcal/g). Both purified diets
showed significantly less chow consumption over the course of the experiment (p<0.001).
(B) The ratio of genome equivalents of B. theta to E. rectale in fecal pellets is higher in
both purified diets, regardless of caloric density or fat content (see Table 1). Fecal pellets
from B. thetaiotaomicron and E. rectale co-colonized mice were assayed for colonization
levels after 6 weeks on the indicated diet as described in Chapter 3. (C) Fat pad weights
eight weeks post-colonization on the purified diets, both low fat and western, compared
with the polysaccharide-rich diet. *: p<0.05, ** p<0.01, *** p< 0.001 using a heterosce-
dastic t-test; error bars are ± standard deviation.

192
Figures
Figure 1.
0.0%
0.2%
0.4%
0.6%
0.8%
1.0%
1.2%
1.4%
1.6%
1.8%
1 2 3
Experiment number
Fat
pad
to
bo
dy
wei
gh
t ra
tio
Germ-freeB. thetaiotaomicronE. rectaleCo-colonization

193
Figure 2.
0.00
0.50
1.00
1.50
2.00
2.50
Polysac-charide rich
Western Low fatDiet
Bt:
Er
rati
o
0.0%
0.5%
1.0%
1.5%
2.0%
2.5%
Polysacchariderich
Western Low fat
Diet
Fat
pad
to
bo
dy
wei
gh
t ra
tio
0
5
10
15
20
25
30
35
40
1 2 3 4
**
**
*****
******
5
Week
Fo
od
co
nsu
mp
tio
n p
er w
eek
(g)
Polysaccharide-richWesternLow fat
A
B
C

194
Table 1.
Composition of a proposed basic diet for examination of microbial community contributions to obesityIngredient Low fat WesternCasein 200 236DL-Methionine 3 3.54Sucrose 182.99 182.62Corn Starch 340 160Maltodextrin 120 120Shortening (Primex) 25 100Beef Tallow 25 100Soybean Oil 5 0Mineral Mix 35 41.3CaHPO4 4 4.72Vitamin Mix 10 11.8Ethoxyquin (antioxidant) 0.01 0.02Cellulose1 50 40Calories (kcal/g) 3.7 4.51 Substituting cellulose for polysaccharides such as pectins, resistant starch and inulin that can be utilized by a gnotobiotic microbial community is suggested in the text.

195
APPENDIX A
Peter J. Turnbaugh, Ruth E. Ley, Michael A. Mahowald, Vincent Magrini, Elaine R. Mardis
and Jeffrey I. Gordon
An obesity-associated gut microbiome with increased capacity for energy harvest
Nature. 2006 Dec 21;444(7122):1027-31.

ARTICLES
An obesity-associated gut microbiomewith increased capacity for energy harvestPeter J. Turnbaugh1, Ruth E. Ley1, Michael A. Mahowald1, Vincent Magrini2, Elaine R. Mardis1,2 & Jeffrey I. Gordon1
The worldwide obesity epidemic is stimulating efforts to identify host and environmental factors that affect energy balance.Comparisons of the distal gut microbiota of genetically obese mice and their lean littermates, as well as those of obese andlean human volunteers have revealed that obesity is associated with changes in the relative abundance of the two dominantbacterial divisions, the Bacteroidetes and the Firmicutes. Here we demonstrate through metagenomic and biochemicalanalyses that these changes affect the metabolic potential of the mouse gut microbiota. Our results indicate that the obesemicrobiome has an increased capacity to harvest energy from the diet. Furthermore, this trait is transmissible: colonization ofgerm-free mice with an ‘obese microbiota’ results in a significantly greater increase in total body fat than colonization with a‘lean microbiota’. These results identify the gut microbiota as an additional contributing factor to the pathophysiology ofobesity.
The human ‘metagenome’ is a composite of Homo sapiens genes andgenes present in the genomes of the trillions of microbes that colonizeour adult bodies. The latter genes are thought to outnumber theformer by several orders of magnitude1. ‘Our’ microbial genomes(the microbiome) encode metabolic capacities that we have nothad to evolve wholly on our own2,3, but remain largely unexplored.These include degradation of otherwise indigestible components ofour diet4, and therefore may have an impact on our energy balance.
Colonization of adult germ-free mice with a distal gut microbialcommunity harvested from conventionally raised mice produces adramatic increase in body fat within 10–14 days, despite an associateddecrease in food consumption5. This change involves several linkedmechanisms: microbial fermentation of dietary polysaccharides thatcannot be digested by the host; subsequent intestinal absorption ofmonosaccharides and short-chain fatty acids; their conversion tomore complex lipids in the liver; and microbial regulation of hostgenes that promote deposition of the lipids in adipocytes5. Thesefindings have led us to propose that the microbiota of obese indivi-duals may be more efficient at extracting energy from a given dietthan the microbiota of lean individuals2,5.
In a previous study, we performed a comparative 16S-rRNA-gene-sequence-based survey of the distal gut microbiota of adult C57BL/6Jmice homozygous for a mutation in the leptin gene (Lepob) thatproduces obesity, as well as the microbiota of their lean (ob/1 and1/1) littermates6. Members of two of the 70 known divisions ofBacteria7,8, the Bacteroidetes and the Firmicutes, consisted of morethan 90% of all phylogenetic types in both groups of mice, just as theydo in humans6,9,10. However, the relative abundance of the Bacter-oidetes in ob/ob mice was lower by 50%, whereas the Firmicutes werehigher by a corresponding degree6. These differences were division-wide, and not attributable to differences in food consumption (arunted ob/ob mouse weighed less than his ob/ob littermates owingto reduced chow consumption, but still exhibited a markedly greaterper cent body fat and ratio of Firmicutes to Bacteroidetes)6.
We have observed analogous differences in the distal gut micro-biota of obese versus lean humans; the relative abundance ofBacteroidetes increases as obese individuals lose weight on either afat- or a carbohydrate-restricted low-calorie diet. Moreover, the
increase in Bacteroidetes was significantly correlated to weight lossbut not to total caloric intake9.
To determine if microbial community gene content correlateswith, and is a potential contributing factor to obesity, we character-ized the distal gut microbiomes of ob/ob, ob/1, and 1/1 littermatesby random shotgun sequencing of their caecal microbial DNA. Micewere used for these comparative metagenomics studies to eliminatemany of the confounding variables (environment, diet and genotype)that would make such a proof of principle experiment more difficultto perform and interpret in humans. The caecum was chosen as thegut habitat for sampling because it is an anatomically distinct struc-ture, located between the distal small intestine and colon, that iscolonized with sufficient quantities of a readily harvested microbiotafor metagenomic analysis. The predicted increased capacity for diet-ary energy harvest by the ob/ob microbiome was subsequently vali-dated using biochemical assays and by transplantation of lean andobese caecal microbiotas into germ-free wild-type mouse recipients.These transplantation experiments illustrate the power of marryingmetagenomics to gnotobiotics to discover how microbial communit-ies encode traits that markedly affect host biology.
Shotgun sequencing of microbiomes
Bulk DNA was prepared from the caecal contents of two ob/ob and1/1 littermate pairs. A lean ob/1 mouse from one of the litters wasalso studied. All caecal microbial community DNA samples wereanalysed using a 3730xl capillary sequencer (10,500 6 431 (s.e.m.)unidirectional reads per data set; 752 6 13.8 (s.e.m.) nucleotides perread; 39.5 Mb from all five plasmid libraries). Material from one ofthe two obese and lean sibling pairs was also analysed using a highlyparallel 454 Life Sciences GS20 pyrosequencer11: three runs for the1/1 mouse (known as lean1), and two runs for its ob/ob littermate(ob1) produced a total of 160 Mb of sequence (345,000 6 23,500(s.e.m.) unidirectional reads per run; 93.1 6 1.56 (s.e.m.) nucleotidesper read) (Supplementary Tables 1–3). Both sequencing platformshave unique advantages and limitations: capillary sequencing allowsmore confident gene calling (Supplementary Fig. 1) but is affected bycloning bias, whereas pyrosequencing can achieve higher sequencecoverage with no cloning bias, but produces shorter reads
1Center for Genome Sciences, and 2Genome Sequencing Center, Washington University, St. Louis, Missouri 63108, USA.
Vol 444 | 21/28 December 2006 | doi:10.1038/nature05414
1027Nature Publishing Group ©2006

(Supplementary Table 2). The three pyrosequencer runs of the lean1caecal microbiome (94.9 Mb) yielded 0.443 coverage (on the basis ofPROmer sequence alignments12) of the 3730xl-derived sequencesobtained from the same sample (8.23 Mb), whereas the two pyrose-quencer runs of the microbiome of its ob/ob littermate (ob1; 65.4 Mb)produced 0.323 coverage of the corresponding 3730xl sequences(8.19 Mb).
Taxonomic analysis of microbiomes
Environmental gene tags (EGTs) are defined as sequencer readsassigned to the NCBI non-redundant, Clusters of OrthologousGroups13 (COG), or Kyoto Encyclopedia of Genes and Genomes14
(KEGG) databases (Fig. 1a; Supplementary Fig. 2; SupplementaryTable 4). Averaging results from all data sets, 94% of the EGTsassigned to the non-redundant database were bacterial, 3.6% wereeukaryotic (0.29% Mus musculus; 0.36% fungal), 1.5% were archaeal(1.4% Euryarcheota; 0.07% Crenarcheota), and 0.61% were viral(0.57% double stranded DNA viruses) (Supplementary Table 5).The relative abundance of the eight bacterial divisions identifiedfrom EGTs and 16S rRNA gene fragments was comparable to ourprevious PCR-derived, 16S-rRNA-gene-sequence-based surveys of
these caecal samples, including the increased ratio of Firmicutes toBacteroidetes in obese versus lean littermates (Supplementary Fig. 2).In addition, comparisons of the lean1 and ob1 reads obtained withthe pyrosequencer against the finished genome of Bacteroides thetaio-taomicron ATCC291481, and a deep draft genome assembly ofEubacterium rectale ATCC33656 (50% of total contig bases presentin contigs $75.9 kb; http://gordonlab.wustl.edu/supplemental/Turnbaugh/obob/) provided independent confirmation of thegreater relative abundance of Firmicutes in the ob/ob microbiota.These organisms were selected for comparison because both are pro-minently represented in the normal human distal gut microbiota10
and species related to B. thetaiotaomicron (Bacteroidetes division)and E. rectale (Firmicutes division) are members of the normalmouse distal gut microbiota6. The ratio of sequences homologousto the E. rectale versus B. thetaiotaomicron genome was 7.3 in the ob1caecal microbiome compared with 1.5 in the lean1 microbiome.
Intriguingly, there were more EGTs that matched Archaea(Euryarchaeota and Crenarchaeota) in the caecal microbiome ofob/ob mice compared with their lean ob/1 and 1/1 littermates(binomial test of pooled obese versus pooled lean capillary-sequen-cing-derived microbiomes, P , 0.001; Supplementary Table 5).
KEGG pathway0.14 2E-14 6E-04 Citrate cycle
0.066 0.011 Pentose/glucuronate interconversions0.382 1 0.994 Galactose metabolism
1 1 Starch/sucrose metabolism0.532 1 0.996 C5-branched dibasic acid metabolism
Energy 0.595 0.005 Reductive carboxylate cycle0.084 8E-04 6E-04 Pyruvate/oxoglutarate oxidoreductases
Lipid 0.878 1 0.994 Glycerolipid metabolism Amino acid 0.022 7E-07 0.01 Phe, Tyr and Trp biosynthesis
Other amino acids 0.225 0.019 β-Ala metabolism Glycan 0.023 7E-12 0.012 Lipopolysaccharide biosynthesis
0.826 1 1 Glycosphingolipid metabolism Transcription 0.975 1 Unclassified transcriptional regulators
Folding/sorting/degradation 0.835 0.957 Type III secretion system Membrane transport 1 1 1 ABC transporters
Cell motility 1 1 Flagellar assembly1 1 Bacterial motility proteins
Cell growth and death 1 1 Sporulation
0
2
4
6
8
10
12
14
16
18a
c
[J] Translation
[K] Transcription
[L] Replication, recombination, repair
[D] Cell cycle control, cell division
[V] Defense mechanisms
[T] Signal transduction
[M] Cell wall/membrane/envelope biogenesis
[N] Cell motility
[U] Intracellular trafficking and secretion
[O] Posttranslational modification
[R] General function prediction only
[S] Function unknown
*
*
*
*
[J] [K] [L] [D] [N][M][T][V] [S][R][O][U]
d
*
*
*
*
*
*
*
**
*
**
b
Ort
ho
log
ou
s g
rou
ps
lean1 capillary sequencer
ob1 capillary sequencer
lean1 pyrosequencer
ob1 pyrosequencer
GS20
pyrosequencer
ob1 lean1
4,500
4,000
3,500
3,000
2,500
2,000
0
ob1
ob2
lean
1
lean
2
lean
3
1 ru
n
2 ru
ns
1 ru
n
2 ru
ns
3 ru
ns All
500
1,000
1,500
2E-08 5E-051 11 1
0.916 0.3071 11 1
0.865 0.5961 1
0.758 0.4340.8944E-06
EnrichedDepleted
ob1
lean1(3730)
ob1
lean1(GS20)
ob2
lean2(3730)
versus versus versus
ob1
lean1(3730)
ob1
lean1(GS20)
ob2
lean2(3730)
versus versus versus
*
*
COG category
Re
lative
ab
un
da
nce
COG category
<0.001<0.01 <0.05 >0.95 >0.99 >0.9990
3730
capillary sequencer
KEGG category Carbohydrate
Figure 1 | Comparison of data sets obtained from the caecal microbiomesof obese and lean littermates. a, Number of observed orthologous groupsin each caecal microbiome. Black indicates the number of observed groups.Grey indicates the number of predicted missed groups. b, Relativeabundance of a subset of COG categories (BLASTX, e-value , 1025) in thelean1 (red) and ob1 (blue) caecal microbiome, characterized by capillary-and pyro-sequencers (squares and triangles, respectively). c, d, A subset ofCOG categories (c) and all KEGG pathways (d) consistently enriched ordepleted in the caecal microbiomes of both obese mice compared with their
lean littermates. Red denotes enrichment and green indicates depletion onthe basis of a cumulative binomial test (brightness indicates the level ofsignificance). Black indicates pathways whose representation is notsignificantly different. Asterisks indicate groups that were consistentlyenriched or depleted between both sibling pairs using a more stringent EGTassignment strategy (e-value , 1028). For additional details seeSupplementary Discussion; Supplementary Figs 5 and 6, and SupplementaryTables 6, 8 and 9.
ARTICLES NATURE | Vol 444 | 21/28 December 2006
1028Nature Publishing Group ©2006

Methanogenic archaea increase the efficiency of bacterial fermenta-tion by removing one of its end products, H2. Our recent studies ofgnotobiotic normal mice colonized with the principal methanogenicarchaeon in the human gut, Methanobrevibacter smithii, and/orB. thetaiotaomicron revealed that co-colonization not only increasesthe efficiency, but also changes the specificity of bacterial polysac-charide fermentation, leading to a significant increase in adipositycompared with mice colonized with either organism alone15.
Comparative metagenomic analysis
Using reciprocal TBLASTX comparisons, we found that theFirmicutes-enriched microbiomes from ob/ob hosts clusteredtogether, as did lean microbiomes with low Firmicutes to Bacter-oidetes ratios (Fig. 2a). Likewise, Principal Component Analysis ofEGT assignments to KEGG pathways revealed a correlation betweenhost genotype and the gene content of the microbiome (Fig. 2b).
Reads were then assigned to COGs and KOs (KEGG orthologyterms) by BLASTX comparisons against the STRING-extendedCOG database13, and the KEGG Genes database14 (version 37). Wetallied the number of EGTs assigned to each COG or KEGG category,and used the cumulative binomial distribution3, and a bootstrapanalysis16,17, to identify functional categories with statistically signifi-cant differences in their representation in both sets of obese and leanlittermates. As noted above, capillary sequencing requires clonedDNA fragments; the pyrosequencer does not, but produces relativelyshort read lengths. These differences are a likely cause of the shift inrelative abundance of several COG categories obtained using the twosequencing methods for the same sample (Fig. 1b). Nonetheless, com-parisons of the caecal microbiomes of lean versus obese littermatessequenced with either method revealed similar differences in theirfunctional profiles (Fig. 1c).
The ob/ob microbiome is enriched for EGTs encoding manyenzymes involved in the initial steps in breaking down otherwiseindigestible dietary polysaccharides, including KEGG pathways forstarch/sucrose metabolism, galactose metabolism and butanoatemetabolism (Fig. 1d; Supplementary Fig. 3 and SupplementaryTable 6). EGTs representing these enzymes were grouped accordingto their functional classifications in the Carbohydrate ActiveEnzymes (CAZy) database (http://afmb.cnrs-mrs.fr/CAZY/). Theob/ob microbiome is enriched (P , 0.05) for eight glycoside hydrolase
families capable of degrading dietary polysaccharides includingstarch (CAZy families 2, 4, 27, 31, 35, 36, 42 and 68, which containa-glucosidases, a-galactosidases and b-galactosidases). Finished gen-ome sequences of prominent human gut Firmicutes have not beenreported. However, our analysis of the draft genome of E. rectale hasrevealed 44 glycoside hydrolases, including a significant enrichmentfor glycoside hydrolases involved in the degradation of dietarystarches (CAZy families 13 and 77, which contain a-amylases andamylomaltases; P , 0.05 on the basis of a binomial test of E. rectaleversus the finished genomes of Bacteroidetes—Bacteroides thetaiotao-micron ATCC29148, B. fragilis NCTC9343, B. vulgatus ATCC8482and B. distasonis ATCC8503).
EGTs encoding proteins that import the products of these glyco-side hydrolases (ABC transporters), metabolize them (for example,a- and b-galactosidases KO7406/7 and KO1190, respectively), andgenerate the major end products of fermentation, butyrate andacetate (pyruvate formate-lyase, KO0656, and other enzymes in theKEGG ‘Butanoate metabolism’ pathway; and formate-tetrahydro-folate ligase, KO1938, the second enzyme in the homoacetogenesispathway for converting CO2 to acetate) are also significantly enrichedin the ob/ob microbiome (binomial comparison of pyrosequencer-derived ob1 and lean1 data sets, P , 0.05) (Fig. 1d; SupplementaryFig. 3 and Supplementary Table 6).
As predicted from our comparative metagenomic analyses, the ob/ob caecum has an increased concentration of the major fermentationend-products butyrate and acetate (Fig. 3a). This observation is alsoconsistent with the fact that many Firmicutes are butyrate produ-cers18–20. Moreover, bomb calorimetry revealed that ob/ob mice havesignificantly less energy remaining in their faeces relative to their leanlittermates (Fig. 3b).
Microbiota transplantation
We performed microbiota transplantation experiments to testdirectly the notion that the ob/ob microbiota has an increased capa-city to harvest energy from the diet and to determine whetherincreased adiposity is a transmissible trait. Adult germ-free C57BL/6J mice were colonized (by gavage) with a microbiota harvested
a b
ob1
ob2
lean1
lean2
PCA1
PC
A2
–0.505 –0.495 –0.485
0.6
0.4
0.2
0
–0.2
–0.4
–0.6
–0.8
ob2 (ob/ob)
ob1 (ob/ob)
lean2 (ob/+)
lean1 (+/+)
Figure 2 | Microbiomes cluster according to host genotype. a, Clustering ofcaecal microbiomes of obese and lean sibling pairs based on reciprocalTBLASTX comparisons. All possible reciprocal TBLASTX comparisons ofmicrobiomes (defined by capillary sequencing) were performed from bothlean and obese sibling pairs. A distance matrix was then created using thecumulative bitscore for each comparison and the cumulative score for eachself–self comparison. Microbiomes were subsequently clustered usingNEIGHBOUR (PHYLIP version 3.64). b, Principal Component Analysis(PCA) of KEGG pathway assignments. A matrix was constructed containingthe number of EGTs assigned to each KEGG pathway in each microbiome(includes KEGG pathways with .0.6% relative abundance in at least twomicrobiomes, and a standard deviation .0.3 across all microbiomes), PCAwas performed using Cluster3.0 (ref. 25), and the results graphed along thefirst two components.
µm
ol p
er
g w
et
wt.
ca
eca
l co
nte
nts
But
yrat
e
Pro
pion
ate
Ace
tate
a cb120
100
80
60
40
20
0
kca
l g
–1
4.0
3.5
3.0
2.5
2.0
60
40
20
0
Incre
ase in
body f
at
(%)
Lean
(+/+, ob/+)
Obese
(ob/ob)
Donor: +/+ ob/obLe
an
Obe
se
Figure 3 | Biochemical analysis and microbiota transplantationexperiments confirm that the ob/ob microbiome has an increased capacityfor dietary energy harvest. a, Gas-chromatography mass-spectrometryquantification of short-chain fatty acids in the caeca of lean (n 5 4) andobese (n 5 5) conventionally raised C57BL/6J mice. b, Bomb calorimetry ofthe faecal gross energy content (kcal g21) of lean (1/1, ob/1; n 5 9) andobese (ob/ob; n 5 13) conventionally raised C57BL/6J mice. c, Colonizationof germ-free wild-type C57BL/6J mice with a caecal microbiota harvestedfrom obese donors (ob/ob; n 5 9 recipients) results in a significantly greaterpercentage increase in total body fat than colonization with a microbiotafrom lean donors (1/1; n 5 10 recipients). Total body fat content wasmeasured before and after a two-week colonization, using dual-energy X-rayabsorptiometry. Mean values 6 s.e.m. are plotted. Asterisks indicatesignificant differences (two-tailed Student’s t-test of all datapoints,*P , 0.05, **P # 0.01, ***P , 0.001).
NATURE | Vol 444 | 21/28 December 2006 ARTICLES
1029Nature Publishing Group ©2006

from the caecum of obese (ob/ob) or lean (1/1) donors (1 donor and4–5 germ-free recipients per treatment group per experiment; twoindependent experiments). 16S-rRNA-gene-sequence-based surveysconfirmed that the ob/ob donor microbiota had a greater relativeabundance of Firmicutes compared with the lean donor microbiota(Supplementary Fig. 4 and Supplementary Table 7). Furthermore,the ob/ob recipient microbiota had a significantly higher relativeabundance of Firmicutes compared with the lean recipient micro-biota (P , 0.05, two-tailed Student’s t-test). UniFrac analysis21 of 16SrRNA gene sequences obtained from the recipients’ caecal microbio-tas revealed that they cluster according to the input donor commun-ity (Supplementary Fig. 4): that is, the initial colonizing communitystructure did not exhibit marked changes by the end of the two-weekexperiment. There was no statistically significant difference in (1)chow consumption over the 14-day period (55.4 6 2.5 g (ob/ob)versus 54.0 6 1.2 g (1/1); caloric density of chow, 3.7 kcal g21),(2) initial body fat (2.7 6 0.2 g for both groups as measured bydual-energy X-ray absorptiometry), or (3) initial weight betweenthe recipients of lean and obese microbiotas. Strikingly, mice colo-nized with an ob/ob microbiota exhibited a significantly greater per-centage increase in body fat over two weeks than mice colonized witha 1/1 microbiota (Fig. 3c; 47 6 8.3 versus 27 6 3.6 percentageincrease or 1.3 6 0.2 versus 0.86 6 0.1 g fat (dual-energy X-rayabsorptiometry): at 9.3 kcal g21 fat, this corresponds to a differenceof 4 kcal or 2% of total calories consumed).
Discussion
The primary cause of obesity in the ob/ob mouse model is increasedfood consumption due to leptin deficiency. We have used this modelto provide direct experimental evidence that at least one type ofobesity-associated gut microbiome has an increased capacity forenergy harvest from the diet. This finding provides support for themore general concept that the gut microbiome should be consideredas a set of genetic factors that, together with host genotype and life-style (energy intake and expenditure), contribute to the patho-physiology of obesity. Yet to be answered are the questions of whatmechanisms are responsible for mediating the linkage between therelative abundance of the Bacteroidetes to Firmicutes divisions andadiposity in both mice and humans, and to what extent is this rela-tionship self-perpetuating?
Energy balance is an equilibrium between the amount of energytaken in as food and the amount expended during resting metabol-ism, as well as the thermic effect of food, physical activity, and loss inthe faeces and urine. The alteration in efficiency of energy harvestfrom the diet produced by changes in gut microbial ecology doesnot have to be great to contribute to obesity, given that small changesin energy balance, over the course of a year, can result in significantchanges in body weight22. We are aware of only one report showingthat obese humans may have an increased capacity to absorb energyfrom their diet: in this case, analysis of four lean and four obeseindividuals given three different diets (high protein/high fat, ‘aver-age’, and high carbohydrate) revealed that on average, the obese indi-viduals lost less energy to stool compared with their lean counterparts.However, the differences did not achieve statistical significance23.
Our study in mice demonstrates the feasibility and utility of apply-ing comparative metagenomics to mouse models of human physio-logic or pathophysiologic states in order to understand the complexinterplay between host genetics, microbial community gene contentand the biological properties of the resulting ‘superorganism’. Assuch, it opens the door for comparable investigations of the interac-tions between humans and their microbial communities, includingwhether there is a core set of genes associated with the microbiomesof obese versus lean individuals; whether these genes are transmittedfrom mothers to their offspring; what genetic or behavioural traits ofthe host can reshape the community24; how the microbiome changesas body mass index changes within an individual; the degree to whichthese changes correlate with energy harvest from their diets; and
whether germ-free mice can be used as a bioassay to compare theenergy harvesting activities encoded in human gut microbiomes. Ourresults indicate that if the gut microbiome of obese humans is com-parable to that of obese mice, then it may be a biomarker, a mediatorand a new therapeutic target for people suffering from this increas-ingly worldwide disease.
METHODSDNA was isolated from the caeca of ob/ob, ob/1 and 1/1 littermates using a
bead beater to mechanically disrupt cells, followed by phenol–chloroform
extraction. DNA was sequenced using 3730xl capillary- and GS20 pyro-sequen-
cers: in the case of the latter, DNA was purified further using the Qiaquick gel
extraction kit (Qiagen).
Individual reads in the resulting 199.8 Mb data set were directly compared
with each other and to reference sequenced gut microbial genomes using
MUMmer12. Taxonomic assignments were made on the basis of BLASTX
searches of the non-redundant database (e-value , 1025) and alignment of
16S gene fragments. Reads were also assigned to EGTs (environmental gene tags)
by BLASTX searches against the non-redundant database, STRING-extended
COG13, and KEGG14 (v37) databases. Microbiomes from each animal were clus-tered according to reciprocal TBLASTX comparisons and their EGT assignments
to KEGG pathways. Statistically enriched or depleted COG and KEGG groups
were identified using bootstrap16,17 and cumulative binomial3 analyses. For the
binomial analysis, the probability of observing ‘n1’ EGT assignments to a given
group in microbiome 1, given ‘N1’ EGT assignments to all groups in microbiome
1, was calculated using the cumulative binomial distribution and an expected
probability equal to ‘n2/N2’ (the number of EGTs assigned to a given group in
microbiome 2 divided by the total number of EGTs assigned to all groups in
microbiome 2). Detailed descriptions of these methods and techniques for (1)
measuring short-chain fatty acids in caecal samples by gas-chromatography
mass-spectrometry, (2) bomb calorimetry of faecal samples, (3) transplanting
the caecal microbiota of C57BL/6J ob/ob or 1/1 donors into 8–9-week-old
germ-free 1/1 C57BL/6J recipients, (4) measuring the total body fat of trans-
plant recipients, before and after colonization, by dual-energy X-ray absorptio-
metry, and (5) performing 16S-rRNA-gene-sequence-based surveys of the input
(donor) and output (recipient) caecal microbiotas are provided in Supple-
mentary Information.
Received 8 October; accepted 7 November 2006.
1. Xu, J. et al. A genomic view of the human–Bacteroides thetaiotaomicron symbiosis.Science 299, 2074–2076 (2003).
2. Backhed, F., Ley, R. E., Sonnenburg, J. L., Peterson, D. A. & Gordon, J. I.Host–bacterial mutualism in the human intestine. Science 307, 1915–1920 (2005).
3. Gill, S. R. et al. Metagenomic analysis of the human distal gut microbiome. Science312, 1355–1359 (2006).
4. Sonnenburg, J. L. et al. Glycan foraging in vivo by an intestine-adapted bacterialsymbiont. Science 307, 1955–1959 (2005).
5. Backhed, F. et al. The gut microbiota as an environmental factor that regulates fatstorage. Proc. Natl Acad. Sci. USA 101, 15718–15723 (2004).
6. Ley, R. E. et al. Obesity alters gut microbial ecology. Proc. Natl Acad. Sci. USA 102,11070–11075 (2005).
7. Ley, R. E. et al. Unexpected diversity and complexity of the Guerrero Negrohypersaline microbial mat. Appl. Environ. Microbiol. 72, 3685–3695 (2006).
8. Ley, R. E., Peterson, D. A. & Gordon, J. I. Ecological and evolutionary forces shapingmicrobial diversity in the human intestine. Cell 124, 837–848 (2006).
9. Ley, R. E., Turnbaugh, P. J., Klein, S. & Gordon, J. I. Human gut microbes associatedwith obesity. Nature doi:10.1038/nature4441023a (this issue).
10. Eckburg, P. B. et al. Diversity of the human intestinal microbial flora. Science 308,1635–1638 (2005).
11. Margulies, M. et al. Genome sequencing in microfabricated high-density picolitrereactors. Nature 437, 376–380 (2005).
12. Kurtz, S. et al. Versatile and open software for comparing large genomes. GenomeBiol. 5, R12 (2004).
13. von Mering, C. et al. STRING: known and predicted protein–protein associations,integrated and transferred across organisms. Nucleic Acids Res. 33, D433–D437(2005).
14. Kanehisa, M., Goto, S., Kawashima, S., Okuno, Y. & Hattori, M. The KEGGresource for deciphering the genome. Nucleic Acids Res. 32, D277–D280 (2004).
15. Samuel, B. S. & Gordon, J. I. A humanized gnotobiotic mouse model of host–archaeal–bacterial mutualism. Proc. Natl Acad. Sci. USA 103, 10011–10016 (2006).
16. DeLong, E. F. et al. Community genomics among stratified microbial assemblagesin the ocean’s interior. Science 311, 496–503 (2006).
17. Rodriguez-Brito, B., Rohwer, F. & Edwards, R. An application of statistics tocomparative metagenomics. BMC Bioinformatics 7, 162 (2006).
18. Duncan, S. H., Hold, G. L., Barcenilla, A., Stewart, C. S. & Flint, H. J. Roseburiaintestinalis sp. nov., a novel saccharolytic, butyrate-producing bacterium fromhuman faeces. Int. J. Syst. Evol. Microbiol. 52, 1615–1620 (2002).
ARTICLES NATURE | Vol 444 | 21/28 December 2006
1030Nature Publishing Group ©2006

19. Barcenilla, A. et al. Phylogenetic relationships of butyrate-producing bacteria fromthe human gut. Appl. Environ. Microbiol. 66, 1654–1661 (2000).
20. Pryde, S. E., Duncan, S. H., Hold, G. L., Stewart, C. S. & Flint, H. J. The microbiologyof butyrate formation in the human colon. FEMS Microbiol. Lett. 217, 133–139(2002).
21. Lozupone, C., Hamady, M. & Knight, R. UniFrac—an online tool for comparingmicrobial community diversity in a phylogenetic context. BMC Bioinformatics 7,371 (2006).
22. Flegal, K. M. & Troiano, R. P. Changes in the distribution of body mass index ofadults and children in the US population. Int. J. Obes. Relat. Metab. Disord. 24,807–818 (2000).
23. Webb, P. & Annis, J. F. Adaptation to overeating in lean and overweight men andwomen. Hum. Nutr. Clin. Nutr. 37, 117–131 (1983).
24. Rawls, J. F., Mahowald, M. A., Ley, R. E. & Gordon, J. I. Reciprocal gut microbiotatransplants from zebrafish and mice to germ-free recipients reveal host habitatselection. Cell 127, 423–433 (2006).
25. de Hoon, M. J., Imoto, S., Nolan, J. & Miyano, S. Open source clustering software.Bioinformatics 20, 1453–1454 (2004).
Supplementary Information is linked to the online version of the paper atwww.nature.com/nature.
Acknowledgements We thank our colleagues B. Samuel, F. Backhed, D. O’Donnell,M. Karlsson, M. Hickenbotham, K. Haub, L. Fulton, J. Crowley, T. Coleman,C. Semenkovich, V. Markowitz and E. Szeto for their assistance. This work wassupported by grants from the NIH and the W.M. Keck Foundation.
Author Information This Whole Genome Shotgun project has beendeposited at DDBJ/EMBL/GenBank under the project accessionAATA00000000–AATF00000000. The version described in this paper is thefirst version, AATA01000000–AATF01000000. All 454 GS20 reads have beendeposited in the NCBI Trace Archive. PCR-derived 16S rRNA gene sequences aredeposited in GenBank under the accession numbers EF95962-100118.Annotated sequences are also available for further analysis in IMG/M(http://img.jgi.doe.gov/m). Reprints and permissions information is available atwww.nature.com/reprints. The authors declare no competing financial interests.Correspondence and requests for materials should be addressed to J.I.G.([email protected]).
NATURE | Vol 444 | 21/28 December 2006 ARTICLES
1031Nature Publishing Group ©2006

SUPPLEMENTARY INFORMATION
doi: 10.1038/nature05414
1www.nature.com/nature
Supplementary Discussion of data presented in Figure 1
Each pyrosequencer run of cecal DNA from lean1 and ob1 littermates yielded
387±95 new groups (s.e.m.) (Fig. 1A). The observed relative abundance of COG
categories was markedly influenced by sequencing platform (Fig. 1B).
As expected, the Firmicutes-enriched, Bacteroidetes-depleted ob/ob microbiome
is depleted for genes involved in the biosynthesis of lipopolysaccharide (a major
component of the outer membrane of Gram-negative bacteria), and enriched for genes
involved in cell motility and sporulation (many Firmicutes are motile and form
endospores) (Fig. 1C and 1D; Supplementary Fig. 6).
EGT assignment notes (Fig. 1D): (i) ‘Type III secretion systems’ are represented
by EGTs involved in flagellar assembly (very few EGTs were assigned specifically to the
secretion apparatus); (ii) ‘Galactose metabolism’ includes glycoside hydrolases [alpha-
glucosidase (KO1187), beta-galactosidase (KO1190), and alpha-galactosidase
(KO7406/7)], and 6-phosphofructokinase (KO0850, catalyzes the rate limiting step in
glycolysis); (iii) ‘Glycerolipid metabolism’ includes glycoside hydrolases [beta-
galactosidase (KO1190) and alpha-galactosidase (KO7406/7)] plus glycerol kinase
(KO0864, involved in degradation of triglycerides and phospholipids); (iv)
‘Glycosphingolipid metabolism’ also includes glycoside hydrolases [beta-galactosidase
(KO1190) and alpha-galactosidase (KO7406/7)]; (v) ‘Reductive carboxylate cycle’ and
‘Pyruvate/oxoglutarate oxidoreductases’ both include genes involved in the citrate cycle
[2-oxoglutarate ferrodoxin oxidoreductase (KO0174/5) and succinate dehydrogenase
www.nature.com/nature 1
2www.nature.com/nature
doi: 10.1038/nature05414 SUPPLEMENTARY INFORMATION
(KO0238/39/40)], (vi) ‘C5-branched dibasic acid metabolism’ includes valine and
isoleucine biosynthesis from pyruvate [i.e. acetolactate synthase (KO1651/2)26,27].
Metabolic capacity is defined based on microbial community gene content.
Transcriptomic, proteomic and/or metabolomic data are necessary to confirm predicted
activites of genes and their products (e.g. see Fig. 3).
www.nature.com/nature 2

2www.nature.com/nature
doi: 10.1038/nature05414 SUPPLEMENTARY INFORMATION
Materials and Methods
Animals – All experiments involving mice were performed using protocols
approved by the Washington University Animal Studies Committee. Once C57BL/6J
ob/ob, ob/+, and +/+ littermates were weaned, they were housed individually in
microisolator cages where they were maintained in a specified pathogen-free state, under
a 12-h light cycle, and fed a standard polysaccharide-rich chow diet (PicoLab, Purina) ad
libitum. Germ-free and colonized animals were maintained in gnotobiotic isolators28,
under a strict 12-h light cycle and fed an autoclaved chow diet (B&K Universal, East
Yorkshire, U.K.) ad libitum. Fecal samples for bomb calorimetry were collected from
mice at 8 or 14 weeks of age, after which time animals were sacrificed.
Community DNA Preparation – The cecal contents used for community DNA
sequencing and gas chromatography-mass spectrometry (GC-MS) were obtained, at eight
weeks of age, from the same animals used for our previous PCR-based 16S rRNA survey
of the gut microbiota6: samples had been stored at -80oC (Supplementary Table 1). An
aliquot (~10mg) of each sample was suspended while frozen in a solution containing 500
µL of extraction buffer [200 mM Tris (pH 8.0), 200 mM NaCl, 20 mM EDTA], 210 µL
of 20% SDS, 500 µL of a mixture of of phenol:chloroform:isoamyl alcohol (25:24:1)],
and 500 µL of a slurry of 0.1-mm-diameter zirconia/silica beads (BioSpec Products,
Bartlesville, OK). Microbial cells were then lysed by mechanical disruption with a bead
beater (BioSpec Products) set on high for 2 min (23oC), followed by extraction with
phenol:chloroform:isoamyl alcohol, and precipitation with isopropanol. In order to
perform pyrosequencing, DNA was purified further using the Qiaquick gel extraction kit
(Qiagen).
www.nature.com/nature 3

2www.nature.com/nature
doi: 10.1038/nature05414 SUPPLEMENTARY INFORMATION
Shotgun sequencing and assembly of cecal microbiomes – DNA samples were
used to construct plasmid libraries for 3730xl capillary-based sequencing.
Pyrosequencing was performed as previously described11. Briefly, samples were
nebulized to 200 nucleotide fragments, ligated to adaptors, fixed to beads, suspended in a
PCR reaction mixture-in-oil emulsion, amplified, and sequenced using a GS20
pyrosequencer (454 Life Sciences, Branford, CT). The Newbler de novo shotgun
sequence assembler (454 Life Sciences) was used to assemble sequences based on
flowgram signal space. This process includes overlap generation, contig layout, and
consensus generation. The resulting GS20 contigs were then broken into linked
sequences to generate pseudo paired-end reads, and aligned with 3730xl reads using
PCAP29.
Sequences were aligned to reference genomes using the PROmer script in
MUMmer12 (version 3.18). Capillary sequencer reads from each microbiome, the finished
genome of the human gut-derived Bacteroides thetaiotaomicron type strain
ATCC291481, and a deep draft genome of the human gut-derived Eubacterium rectale
type strain ATCC33656 (http://gordonlab.wustl.edu/supplemental/Turnbaugh/obob/)
were used as a reference for the pyrosequencer datasets. Coverage was calculated by
dividing the sum of all alignment lengths by the length of the reference genome.
Whole genome sequencing and annotation – A draft assembly of Eubacterium
rectale ATCC33656 was generated from AB36731xl paired end-reads of inserts in whole
genome shotgun plasmid and fosmid libraries, as well as from reads produced by the
GS20 pyrosequencer. Sequences were assembled using Newbler and PCAP (see above)
and ORFs predicted with Glimmer3.0130 (maximum overlap of 100, minimum length of
www.nature.com/nature 4

2www.nature.com/nature
doi: 10.1038/nature05414 SUPPLEMENTARY INFORMATION
110 and a threshold of 30). Each predicted gene sequence was translated, and the
resulting protein sequence assigned to InterPro numbers using InterProScan31 (Release
12.0).
Database search parameters – NCBI BLAST was used to query the non-
redundant database (NR), the STRING-extended COG database (179 microbial genomes,
version 6.3)13, a database constructed from 334 genomes available through KEGG
(version 37)14, and the Ribosomal Database Project database (RDP, version 9.33)32.
Reads with multiple COG/KO hits were counted once for each classification scheme. KO
hits were also categorized into CAZy families (http://afmb.cnrs-mrs.fr/CAZY/). KEGG
pathway maps are available on-line
(http://gordonlab.wustl.edu/supplemental/Turnbaugh/obob/).
NR, COG, and KEGG comparisons were performed using NCBI BLASTX. RDP
comparisons were performed using NCBI BLASTN, and microbiomes were directly
compared using TBLASTX. A cutoff of e-value < 10-5 was used for EGT assignments
and sequence comparisons16 (corresponds to a p-value cutoff of
10-12 against the NR and KEGG databases, and 10-11 against the COG database). Given
this cutoff, we would only expect three false EGT assignments in our combined analyses
due to random chance. We also re-analyzed the data using a more stringent cutoff33 (e-
value < 10-8).
Taxonomic assignments of shotgun 16S rRNA gene fragments – Shotgun
reads containing a 16S rRNA fragment were identified by BLASTX comparison of each
microbiome to the RDP database. 16S rRNA gene fragments were then aligned using the
NASTA multi-aligner34 with a minimum template length of 20 bases and a minimum
www.nature.com/nature 5

2www.nature.com/nature
doi: 10.1038/nature05414 SUPPLEMENTARY INFORMATION
percent identity of 75%. The resulting alignment was then imported into an ARB
neighbor-joining tree and hypervariable regions were masked using the lanemaskPH
filter35. Direct BLAST taxonomic assignments were performed through BLASTX
comparisons of each microbiome and the NR database. Best-BLAST-hits with an e-value
< 10-5 were used to assign each read to a given species.
Estimating the total number of orthologous groups – The total estimated
number of COGs and NOGs (Non-supervised Orthologous Groups) in each sample was
calculated using the lower-limit of the Chao1 95% confidence interval in EstimateS
(Version 7.5, R. K. Colwell, http://purl.oclc.org/estimates), based on the number of EGTs
assigned to each orthologous group. The number of missed groups was calculated by
subtracting the estimated total (Chao1 lower-limit) from the observed number of groups.
Direct comparisons of microbiome sequences – Microbiomes sequenced using
the 3730xl instrument were evaluated by reciprocal pairwise TBLASTX comparisons16.
8,832 reads were used from each microbiome to limit artifacts that arise from different
sized datasets. Each possible pairwise comparison was made by using a BLAST database
constructed from each microbiome. Samples were clustered based on the cumulative
pairwise BLAST score. An estimate of distance was constructed using the D2
normalization and genome conservation approach previously used for genome
clustering36. This method calculates a distance score based on the minimum cumulative
BLAST score (sum of all best-BLAST-hit scores) between two microbiomes and the
weighted average of both self-self comparisons (D2 = -ln(min S1v2, S2v1/average). The
weighted average is calculated using average = squareroot(2) * S1v1 * S2v2 / squareroot
(S1v12 + S2v2
2). The resulting distances were used to create a distance matrix. A tree was
www.nature.com/nature 6

2www.nature.com/nature
doi: 10.1038/nature05414 SUPPLEMENTARY INFORMATION
constructed using NEIGHBOR (PHYLIP version 3.64; kindly provided by J. Felsenstein,
Department of Genome Sciences, University of Washington, Seattle), and was viewed
using Treeview X37.
Clustering of microbiomes based on predicted metabolic function –
Microbiomes were clustered based on the percent representation of EGTs assigned to
each COG, KEGG pathway, and phylotype (genome in NR) using Cluster3.025. Percent
representation was calculated as the number of EGTs assigned to a given group divided
by the number of EGTs assigned to all groups. Single linkage hiearchical clustering via
Pearson’s correlation was performed on each dataset, and the results were visualized by
using the Treeview Java applet38. Principal Component Analysis was also performed
based on the percent representation of EGTs assigned to KEGG pathways (Cluster3.025),
and the data were graphed according to the first two coordinates.
Identification of statistically enriched and depleted metabolic groups – Two
methods were used to determine statistically enriched or depleted metabolic groups: the
cumulative binomial distribution3 and a bootstrap analysis16,17. The cumulative binomial
distribution was used for pairwise comparisons of microbiome COG, KEGG, and
taxonomic assignments. The calculation uses the following inputs: number of successes
for microbiome 1 (number of EGTs assigned to a given group), number of trials for
microbiome 1 (total number of EGTs assigned to all groups), and the expected frequency
(number of successes/number of trials for microbiome 2). The probability of having less
than or equal to the number of observed EGTs in a given group was then calculated using
the cumulative binomial distribution. Depletion was defined as having a probability less
than 0.05, 0.01, or 0.001 assuming p equals the expected frequency and that the expected
www.nature.com/nature 7

2www.nature.com/nature
doi: 10.1038/nature05414 SUPPLEMENTARY INFORMATION
frequency is normally distributed. Enrichment was defined as having a probability of
greater than 0.95, 0.99, or 0.999 given the same assumptions. To minimize false
negatives, no corrections for multiple sampling were made. To limit false positives
resulting from low sampling, only groups with at least one hit in each microbiome were
evaluated.
Xipe17 (Rodriguez-Brito, version 0.2) was employed for bootstrap analyses of
KEGG pathway enrichment and depletion, using the following parameters: 10,000
samples, 10,000 repeats, and three confidence levels (95%, 99%, and 99.9%). Briefly, a
dataset composed of the number of EGTs assigned to each KEGG pathway was sampled
with replacement from each microbiome 10,000 times. The difference between the
number of EGTs per pathway in the first microbiome, and the number of EGTs per
pathway in the second microbiome, was calculated for each group. This process was
repeated 10,000 times and the median difference calculated for each pathway. A
confidence interval was determined by pooling both datasets and comparing 10,000
random samples to 10,000 other random samples. Groups with a larger median difference
between microbiomes than the confidence interval were considered significantly
different.
Biochemical analyses – Short-chain fatty acids (SCFAs) were measured in nine
cecal samples (4 lean, 5 obese) obtained from nine mice that had been used for our
previous 16S rRNA gene sequence-based survey [animals C1, C3, C4, C9, C10, C13,
C15 (lean2), C17, and C22 in ref. 6]. Two aliquots of each sample were evaluated. SCFA
levels were quantified according to previously published protocols15: i.e., double diethyl
ether extraction of deproteinized cecal contents spiked with isotope-labeled internal
www.nature.com/nature 8
2www.nature.com/nature
doi: 10.1038/nature05414 SUPPLEMENTARY INFORMATION
SCFA standards; derivatization of SCFAs with N-tert-butyldimethylsilyl-N-
methyltrifluoracetamide (MTBSTFA); and GC-MS analysis of the resulting TBDMS-
derivatives.
Bomb calorimetry was performed on 44 fecal samples collected from 22 mice (9
lean, 13 obese). Each mouse was transferred to a clean cage for 24 hours, at which point
fecal samples were collected and oven dried at 60oC for 48 hours. Gross energy content
was measured using a semimicro oxygen bomb calorimeter, calorimetric thermometer,
and semimicro oxygen bomb (Models 6725, 6772 and 1109, respectively, from Parr
Instrument Co.). The calorimeter energy equivalent factor was determined using benzoic
acid standards. The mean of each distribution was compared using a two-tailed Student’s
t-Test.
Microbiota transplantation experiments – Germ-free C57BL/6J mice (8-9
weeks old) were colonized with a cecal microbiota obtained from either a lean (+/+) or an
obese (ob/ob) C57BL/6J donor (n=1 donor and 4-5 recipients/treatment
group/experiment; 2 independent experiments). Recipient mice were anesthetized at 0
and 14 days post colonization with an i.p. injection of ketamine (10 mg/kg body weight)
and xylazine (10mg/kg) and total body fat content was measured by dual-energy x-ray
absorptiometry (Lunar PIXImus Mouse, GE Medical Systems) using previously
described protocols39. Donor mice were sacrificed at day 0 and recipient mice after the
final DEXA on day 14.
16S rRNA sequence-based surveys of the cecal microbiotas of
conventionalized mice – Cecal contents were recovered at the time of sacrifice by
manual extrusion and frozen immediately at -80°C. DNA was prepared by bead beating,
www.nature.com/nature 9

2www.nature.com/nature
doi: 10.1038/nature05414 SUPPLEMENTARY INFORMATION
phenol/chloroform extraction, and gel purification (see above). Five replicate PCRs were
performed for each mouse. Each 25 µl reaction contained 50-100 ng of purified DNA
from cecal contents, 10 mM Tris (pH 8.3), 50 mM KCl, 2 mM MgSO4, 0.16 µM dNTPs,
0.4 µM of the bacteria-specific primer 8F (5’-AGAGTTTGATCCTGGCTCAG-3’), 0.4
µM of the universal primer 1391R (5’-GACGGGCGGTGWGTRCA-3’), 0.4 M betaine,
and 3 units of Taq polymerase (Invitrogen). Cycling conditions were 94°C for 2 min,
followed by 35 cycles of 94°C for 1 min, 55°C for 45 sec, and 72°C for 2 min, with a
final extension period of 20 min at 72°C. Replicate PCRs were pooled, concentrated with
Millipore columns (Montage), gel-purified with the Qiaquick kit (Qiagen), cloned into
TOPO TA pCR4.0 (Invitrogen), and transformed into E. coli TOP10 (Invitrogen). For
each mouse, 384 colonies containing cloned amplicons were processed for sequencing.
Plasmid inserts were sequenced bidirectionally using vector-specific primers and the
internal primer 907R (5’-CCGTCAATTCCTTTRAGTTT-3’).
16S rRNA gene sequences were edited and assembled into consensus sequences
using the PHRED and PHRAP software packages within the Xplorseq program40.
Sequences that did not assemble were discarded and bases with PHRED quality scores
<20 were trimmed. Sequences were checked for chimeras using Bellerophon41 and
sequences with greater than 95% identity to both parents were removed (n=535; 13% of
aligned sequences). The final dataset (n=4,157 sequences; for ARB alignment and tree
see http://gordonlab.wustl.edu/supplemental/Turnbaugh/obob/; for sequence designations
see Supplementary Table 7) was aligned using the on-line version of the NAST multi-
aligner34 (minimum alignment length=1250; percent identity >75), hypervariable regions
were masked using the lanemaskPH filter provided with the ARB database35, and the
www.nature.com/nature 10

2www.nature.com/nature
doi: 10.1038/nature05414 SUPPLEMENTARY INFORMATION
aligned sequences were added to the ARB neighbor-joining tree (based on pairwise
distances with the Olsen correction) with the parsimony insertion tool. A phylogenetic
tree containing all 16S rRNA gene sequences was exported from ARB and clustered
using online UniFrac21 without abundance weighting.
www.nature.com/nature 11
2www.nature.com/nature
doi: 10.1038/nature05414 SUPPLEMENTARY INFORMATION
Supplementary Notes
26. Dailey, F. E. & Cronan, J. E., Jr. Acetohydroxy acid synthase I, a required
enzyme for isoleucine and valine biosynthesis in Escherichia coli K-12 during
growth on acetate as the sole carbon source. J. Bacteriol 165, 453-460 (1986).
27. Dailey, F. E., Cronan, J. E., Jr. & Maloy, S. R. Acetohydroxy acid synthase I is
required for isoleucine and valine biosynthesis by Salmonella typhimurium LT2
during growth on acetate or long-chain fatty acids. J. Bacteriol 169, 917-919
(1987).
28. Hooper, L. V. et al. (2002) in Molecular Cellular Microbiology, eds. Sansonetti,
P. & Zychlinsky, A. (Academic San Diego), Vol. 31, pp. 559-589.
29. Huang, X., Wang, J., Aluru, S., Yang, S. P. & Hillier, L. PCAP: a whole-genome
assembly program. Genome Res. 13, 2164-2170 (2003).
30. Delcher, A. L., Harmon, D., Kasif, S., White, O. & Salzberg, S. L. Improved
microbial gene identification with GLIMMER. Nucleic Acids Res. 27, 4636-4641
(1999).
31. Mulder, N. J. et al. InterPro, progress and status in 2005. Nucleic Acids Res. 33,
D201-205 (2005).
32. Cole, J. R. et al. The Ribosomal Database Project (RDP-II): sequences and tools
for high-throughput rRNA analysis. Nucleic Acids Res. 33, D294-296 (2005).
33 . Tringe, S. G. et al. Comparative metagenomics of microbial communities.
Science 308, 554-557 (2005).
www.nature.com/nature 12

2www.nature.com/nature
doi: 10.1038/nature05414 SUPPLEMENTARY INFORMATION
34. DeSantis, T. Z. et al. NAST: a multiple sequence alignment server for
comparative analysis of 16S rRNA genes. Nucleic Acids Res. 34, W394-399
(2006).
35. Ludwig, W. et al. ARB: a software environment for sequence data. Nucleic Acids
Res. 32, 1363-1371 (2004).
36. Kunin, V., Ahren, D., Goldovsky, L., Janssen, P. & Ouzounis, C. A. Measuring
genome conservation across taxa: divided strains and united kingdoms. Nucleic
Acids Res. 33, 616-621 (2005).
37. Page, R. D. TreeView: an application to display phylogenetic trees on personal
computers. Comput. Appl. Biosci. 12, 357-358 (1996).
38. Saldanha, A. J. Java Treeview--extensible visualization of microarray data.
Bioinformatics 20, 3246-3248 (2004).
39. Bernal-Mizrachi, C. et al. Respiratory uncoupling lowers blood pressure through
a leptin-dependent mechanism in genetically obese mice. Arterioscler Thromb
Vasc Biol. 22, 961-968 (2002).
40. Papineau, D., Walker, J. J., Mojzsis, S. J. & Pace, N. R. Appl. Environ. Microbiol.
71, 4822-4832 (2006).
41. Huber, T., Faulkner, G. & Hugenholtz, P. Bellerophon: a program to detect
chimeric sequences in multiple sequence alignments. Bioinformatics 20, 2317-
2319 (2004).
www.nature.com/nature 13

2www.nature.com/nature
doi: 10.1038/nature05414 SUPPLEMENTARY INFORMATION
bk rep stnemngiss
A O
K
e-value
Capillary SequencerPyrosequencer
0.8
0.7
0.6
0.5
0.4
0.1
0.3
0.2
10-3 10-6 10-9 10-12 10-15 10-18 10-21 10-24 10-27 10-300.0
Supplementary Figure 1: The effect of decreasing e-value cut-offs on EGT assignments to
the KEGG database from pyrosequencer and capillary sequencer datasets. Points indicate
the average number of KO assignments per kb of microbiome sequence. Mean values ± s.e.m.
are plotted. The GS20 pyrosequencer and the 3730xl capillary sequencer both resulted in an
average 0.3 KO (KEGG orthology) assignments per kb of sequence at an e-value cutoff <10-5.
However, the number of EGTs present in the pyrosequencer-derived datasets rapidly decays as
the e-value cutoff is decreased, whereas the number of EGTs present in the capillary sequencer
datasets is relatively stable to <10-30.
www.nature.com/nature 14

2www.nature.com/nature
doi: 10.1038/nature05414 SUPPLEMENTARY INFORMATION
0
10
20
30
40
50
60
A.
B.
latoT fo egatnecreP
RN ot dengiss
A sTG
E
setucimriF
setedioretcaB
airetcaboetorP
airetcabonitcA
seteahcoripS
airetcabonayC
atoehcrayruE
airetcabosuF
aozateM/ignuF
Bacterial Divisions ayrakuE
aeahcrA
Capillary (All)PCR (All)Pyrosequencer (lean1, ob1)PCR (lean1, ob1)
secneuqeS
AN
Rr S61 latoT fo egatnecre
P
setucimriF
setedioretcaB
airetcabonitcA
airetcaboetorP
aiborcimocurreV
seteahcoripS
airetcabonayC
7MT
Obese Lean
lean1 (GS20)lean1 (3730)lean2 (3730)lean3 (3730)
ob1 (GS20)
ob1 (3730)
ob2 (3730)
70
60
50
40
30
20
10
Supplementary Figure 2: Taxonomic assignments of EGTs and 16S rRNA gene fragments.
(A) Relative abundance of EGTs (reads assigned to NR, BLASTX with an e-value<10-5) in each
cecal microbiome confirms the presence of the indicated bacterial divisions in addition to
Euryarcheota. Metazoan sequences (including Mus musculus and fungi) are also present at low
abundance. Bacterial divisions with greater than 1% representation in at least three microbiomes
are shown. (B) Alignment of 16S rRNA gene fragments (black) confirms our previous PCR-
derived 16S rRNA gene sequence-based survey6 (white). Comparisons include all microbiomes
sampled with the capillary sequencer (square) and the two microbiomes sampled with the pyro-
sequencer (triangle).www.nature.com/nature 15

2www.nature.com/nature
doi: 10.1038/nature05414 SUPPLEMENTARY INFORMATION
KEGG Category KEGG Pathway
Carbohydrate Metabolism Citrate Cycle Galactose Metabolism
Energy Metabolism Reductive Carboxylate Cycle Lipid Metabolism Glycerolipid Metabolism
Amino Acid Metabolism Phe, Tyr and Trp BiosynthesisGlycan Metabolism Lipopolysaccharide Biosynthesis
Transcription Unclassified Transcriptional Regulators Membrane Transport ABC Transporters
Cell Motility Flagellar Assembly Bacterial Motility Proteins
Cell Growth and Death Sporulation
lean1(3730)
lean1(GS20)
lean2(3730)
vs. vs.vs.
Butanoate MetabolismC5-branched Dibasic Acid Metabolism
<.001 <.01 <.05 0 >.95 >.99 >.999
EnrichedDepleted
ob1 ob1 ob2
Supplementary Figure 3: KEGG pathways that are enriched or depleted in the cecal
microbiomes of both obese versus lean sibling pairs, as indicated by bootstrap analysis of
relative gene content. Pathways that are consistently enriched or depleted in the
pyrosequencer-based comparison of ob1 versus lean1 littermates, and the capillary sequencer-
based comparison of ob2 versus lean2 littermates are shown. Red indicates enrichment and green
indicates depletion (brightness denotes level of significance). Black indicates groups that are not
significantly changed.
www.nature.com/nature 16

2www.nature.com/nature
doi: 10.1038/nature05414 SUPPLEMENTARY INFORMATION
ob/ob recipient 1
ob/ob recipient 5
ob/ob recipient 2
ob/ob recipient 4
ob/ob recipient 3
ob/ob recipient 6
ob/ob donor 1
ob/ob donor 2
ob/ob recipient 7
ob/ob recipient 9
ob/ob recipient 8
lean recipient 1
lean recipient 2
lean recipient 3
lean recipient 5
lean donor 1
lean recipient 4
ob/ob donor
ob/ob recipients
lean recipients
lean donor
Firmicutes Bacteroidetes Other
Supplementary Figure 4: Analyses of microbial communities harvested from obese (ob/ob)
and lean (+/+) C57BL/6J donor mice and colonized gnotobiotic recipients. Online Unifrac
clustering21 of microbial community structure, based on 4,157 16S rRNA gene sequences (see
Supplementary Table 7 for number of sequences per sample; ARB tree available at
http://gordonlab.wustl.edu/supplemental/Turnbaugh/obob/). Nodes denoted by a black square are
robust to sequence number (jackknife values > 0.70, representing the number of times the node
was present when 166 sequences were randomly chosen for each mouse for n=100 replicates).
Pie charts indicate the average relative abundance of Firmicutes (black), Bacteroidetes (white),
and other (grey; includes Verrucomicrobia, Proteobacteria, Actinobacteria, TM7, and Cyanobac-
teria) in the donor and recipient microbial communities.www.nature.com/nature 17

2www.nature.com/nature
doi: 10.1038/nature05414 SUPPLEMENTARY INFORMATION
COG Category
0
2
4
6
8
10
12
14
16
18
ecnadnubA evitale
R yrogetaC
GO
C
[ J ] [K] [L] [D] [N][M][T][V] [S][R][O][U]
lean1 Capillary Sequencerob1 Capillary Sequencerlean2 Capillary Sequencerob2 Capillary Sequencer
Supplementary Figure 5: Relative abundance of COG categories (percentage of total
EGTs assigned to COG using BLASTX and e-value<10-5) in the lean1 (black square), ob1
(white square), lean2 (black triangle), and ob2 (white triangle) cecal microbiomes. Microbi-
omes were characterized by capillary sequencing.
www.nature.com/nature 18

2www.nature.com/nature
doi: 10.1038/nature05414 SUPPLEMENTARY INFORMATION
COG Category COG AnnotationSignal Transduction COG2198 FOG: HPt domain
COG2203 1 FOG: GAF domainCOG2337 1 1 Growth InhibitorCOG0784 1 1 FOG: CheY-like ReceiverCOG0745 1 1 Response Regulators
Cell Motility COG0840 1 1 1 Methyl-accepting Chemotaxis ProteinEnergy Production COG0674 0.019 8E-05 Pyruvate:ferredoxin Oxidoreductase, Alpha Subunit
COG1014 Pyruvate:ferredoxin Oxidoreductase, Gamma SubunitCOG0437 Fe-S-cluster-containing Hydrogenase Components 1COG1013 Pyruvate:ferredoxin Oxidoreductase, Beta SubunitCOG1894 NADH:ubiquinone Oxidoreductase, NADH-binding (51 kD) SubunitCOG1883 Na+-transporting Methylmalonyl-CoA/oxaloacetate Decarboxylase, Beta SubunitCOG1048 Aconitase A
Nucleotide COG0209 Ribonucleotide Reductase, Alpha SubunitCOG2759 Formyltetrahydrofolate Synthetase
Coenzyme COG4206 Outer Membrane Cobalamin Receptor ProteinIon COG1629 Outer Membrane Receptor Proteins
COG1116 ABC-type Nitrate/Sulfonate/Bicarbonate Transport System, ATPase Component
<.001 <.01 <.05 0 >.95 >.99 >.999
Annotation
EnrichedDepleted
ob1
lean1(3730)
ob1
lean1(GS20)
ob2
lean2(3730)
vs. vs.vs.
Supplementary Figure 6: COGs that are enriched or depleted in the cecal microbiomes of
both obese versus lean sibling pairs, as indicated by binomial comparisons of relative gene
content. The COGs shown are enriched or depleted in the pyrosequencer-based comparison of
ob1 versus lean1 littermates and the capillary sequencer-based comparison of ob2 versus lean2
littermates. Red indicates enrichment and green indicates depletion (brightness denotes level of
significance). Black indicates groups that are not significantly changed.
www.nature.com/nature 19

2www.nature.com/nature
doi: 10.1038/nature05414 SUPPLEMENTARY INFORMATION
Supplementary Table 1 – Nomenclature used to designate metagenomic datasets obtained from the cecal microbiota of C57BL/6J ob/ob, ob/+, and +/+ littermates.
Figure label
Metagenome label Litter
16S rRNA survey label1 Tree label1
Host genotype
ob1 PT6 1 C23 M2B-4 ob/ob ob2 PT4 2 C18 M1-2 ob/ob
lean1 PT3 1 C21 M2B-1 +/+ lean2 PT8 2 C15 M1-3 ob/+ lean3 PT2 2 C16 M1-4 +/+
1Samples obtained from our previous 16S rRNA survey (ref. 6).
www.nature.com/nature 20

2www.nature.com/nature
doi: 10.1038/nature05414 SUPPLEMENTARY INFORMATION
Supplementary Table 2 – Sequencing results for each cecal microbiome.
Microbiome Average
read length Number of reads Sequence
lean1 (GS20) 90.9 1,046,611 94,913,476 ob1 (GS20) 96.4 677,384 65,370,448
lean1 (3730xl) 765 10,752 8,227,047 lean2 (3730xl) 782 11,136 8,705,876 lean3 (3730xl) 706 10,752 7,590,528 ob1 (3730xl) 735 11,136 8,185,880 ob2 (3730xl) 771 8,832 6,811,035
TOTAL - 1,776,603 199,804,290 Abbrevations: GS20, pyrosequencer; 3730xl, capillary sequencer
www.nature.com/nature 21
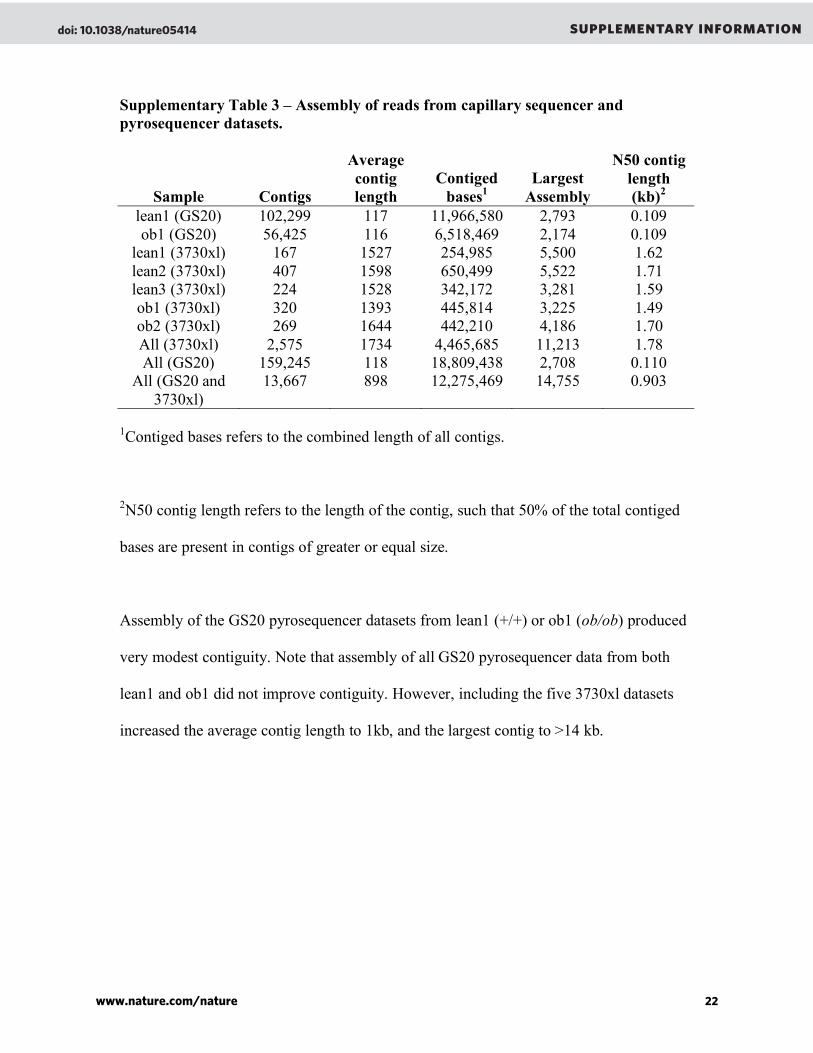
2www.nature.com/nature
doi: 10.1038/nature05414 SUPPLEMENTARY INFORMATION
Supplementary Table 3 – Assembly of reads from capillary sequencer and pyrosequencer datasets.
Sample Contigs
Average contig length
Contiged bases1
Largest Assembly
N50 contig length (kb)2
lean1 (GS20) 102,299 117 11,966,580 2,793 0.109 ob1 (GS20) 56,425 116 6,518,469 2,174 0.109
lean1 (3730xl) 167 1527 254,985 5,500 1.62 lean2 (3730xl) 407 1598 650,499 5,522 1.71 lean3 (3730xl) 224 1528 342,172 3,281 1.59 ob1 (3730xl) 320 1393 445,814 3,225 1.49 ob2 (3730xl) 269 1644 442,210 4,186 1.70 All (3730xl) 2,575 1734 4,465,685 11,213 1.78 All (GS20) 159,245 118 18,809,438 2,708 0.110
All (GS20 and 3730xl)
13,667 898 12,275,469 14,755 0.903
1Contiged bases refers to the combined length of all contigs.
2N50 contig length refers to the length of the contig, such that 50% of the total contiged
bases are present in contigs of greater or equal size.
Assembly of the GS20 pyrosequencer datasets from lean1 (+/+) or ob1 (ob/ob) produced
very modest contiguity. Note that assembly of all GS20 pyrosequencer data from both
lean1 and ob1 did not improve contiguity. However, including the five 3730xl datasets
increased the average contig length to 1kb, and the largest contig to >14 kb.
www.nature.com/nature 22

2www.nature.com/nature
doi: 10.1038/nature05414 SUPPLEMENTARY INFORMATION
Supplementary Table 4 – Number of EGTs assigned to the NR, COG, and/or KEGG databases.
Microbiome Total NR
EGTs Total COG
EGTs Total KO
EGTs Total EGTs
Percent unassigned
lean1 (GS20) 48,625 51,481 28,359 56,599 94.6 ob1 (GS20) 33,360 32,819 18,308 39,058 94.2
lean1 (3730xl) 7,973 7,970 2,810 8,462 21.3 lean2 (3730xl) 7,309 7,687 2,723 8,170 26.6 lean3 (3730xl) 7,042 7,119 2,562 7,616 29.2 ob1 (3730xl) 7,331 7,299 2,639 7,859 29.4 ob2 (3730xl) 6,008 6,016 2,053 6,425 27.3
www.nature.com/nature 23

2www.nature.com/nature
doi: 10.1038/nature05414 SUPPLEMENTARY INFORMATION
Supplementary Table 5 – Percentage of total assigned reads among each taxonomic domain based on BLASTX searches of the NR database with an e-value cutoff<10-5.
Domain lean1 3730xl
lean1 GS20
lean2 3730xl
lean3 3730xl
ob1 3730xl
ob1 GS20
ob2 3730xl
Archaea 1.28 0.658 1.55 1.59 2.07 1.23 2.08 Bacteria 95.8 97.9 90.7 95.1 94.4 93.4 92.9
Eukarya 2.36 1.39 7.36 2.74 2.77 4.15 4.19 (Viruses) 0.527 0.065 0.383 0.611 0.709 1.21 0.782
www.nature.com/nature 24

2www.nature.com/nature
doi: 10.1038/nature05414 SUPPLEMENTARY INFORMATION
Supplementary Table 6 – KEGG pathways enriched in the pooled ob/ob cecal microbiome relative to the pooled lean cecal microbiome (capillary sequencing datasets, ob1+ob2 vs. lean1+lean2+lean3, binomial test, P<0.05).
KEGG Category KEGG Pathway1 Carbohydrate Metabolism Starch and sucrose metabolism Aminosugars metabolism Nucleotide sugars metabolism Amino Acid Metabolism Lysine biosynthesis Metabolism of Other Amino Acids D-Alanine metabolism Glycan Biosynthesis and Metabolism N-Glycan degradation Glycosaminoglycan degradation Glycosphingolipid metabolism Biosynthesis of Polyketides and Nonribosomal Peptides
Polyketide sugar unit biosynthesis
Biosynthesis of vancomycin group antibiotics Transcription Other and unclassified family transcriptional
regulators Folding, Sorting and Degradation Type III secretion system Membrane Transport ABC transporters Folding, Sorting and Degradation Phosphotransferase system (PTS) Signal Transduction Two-component system Cell Motility Bacterial chemotaxis Flagellar assembly Bacterial motility proteins Cell Growth and Death Sporulation
1Only pathways with greater than ten hits in both pooled datasets are shown.
www.nature.com/nature 25
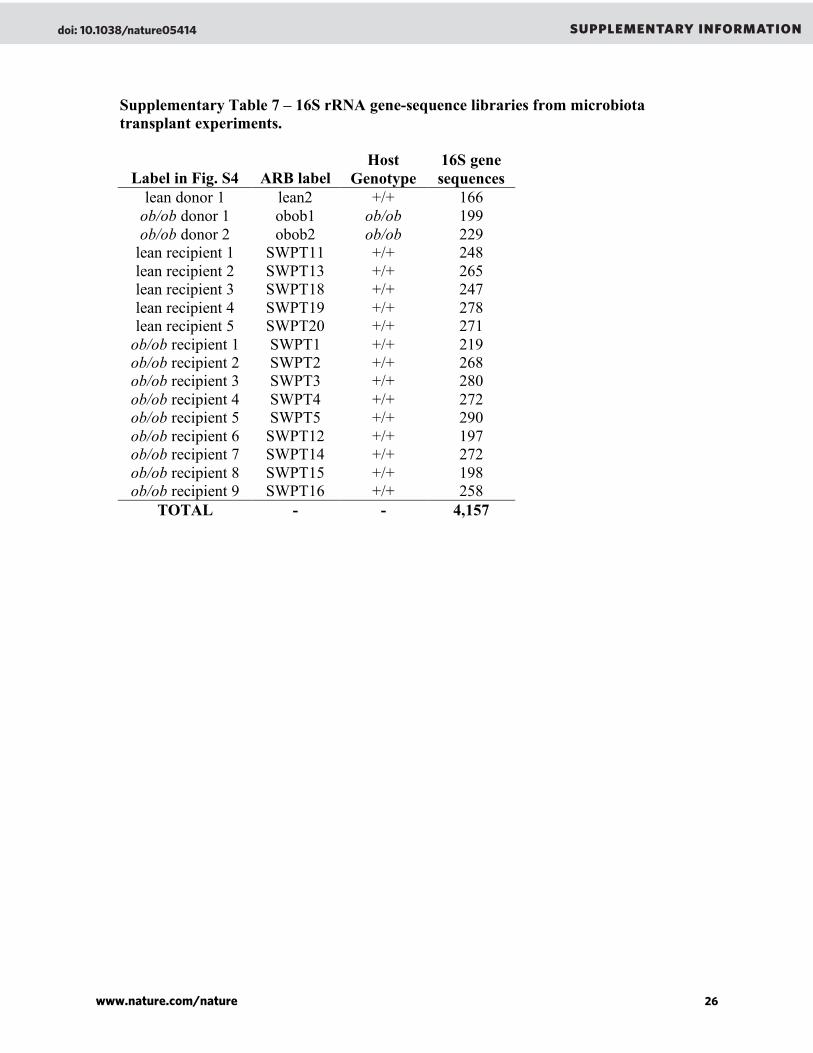
2www.nature.com/nature
doi: 10.1038/nature05414 SUPPLEMENTARY INFORMATION
Supplementary Table 7 – 16S rRNA gene-sequence libraries from microbiota transplant experiments.
Label in Fig. S4 ARB label Host
Genotype 16S gene sequences
lean donor 1 lean2 +/+ 166 ob/ob donor 1 obob1 ob/ob 199 ob/ob donor 2 obob2 ob/ob 229
lean recipient 1 SWPT11 +/+ 248 lean recipient 2 SWPT13 +/+ 265 lean recipient 3 SWPT18 +/+ 247 lean recipient 4 SWPT19 +/+ 278 lean recipient 5 SWPT20 +/+ 271
ob/ob recipient 1 SWPT1 +/+ 219 ob/ob recipient 2 SWPT2 +/+ 268 ob/ob recipient 3 SWPT3 +/+ 280 ob/ob recipient 4 SWPT4 +/+ 272 ob/ob recipient 5 SWPT5 +/+ 290 ob/ob recipient 6 SWPT12 +/+ 197 ob/ob recipient 7 SWPT14 +/+ 272 ob/ob recipient 8 SWPT15 +/+ 198 ob/ob recipient 9 SWPT16 +/+ 258
TOTAL - - 4,157
www.nature.com/nature 26

2www.nature.com/nature
doi: 10.1038/nature05414 SUPPLEMENTARY INFORMATION
Supplementary Table 8 – KEGG pathways depleted in the pooled ob/ ob cecal microbiome relative to the pooled lean cecal microbiome (capillary sequencing datasets, ob1+ob2 vs. lean1+lean2+lean3, binomial test, P<0.05).
KEGG Category KEGG Pathway1 Carbohydrate Metabolism Glycolysis / Gluconeogenesis Citrate cycle (TCA cycle) Pentose phosphate pathway Pentose and glucuronate interconversions Fructose and mannose metabolism Energy Metabolism Carbon fixation Reductive carboxylate cycle (CO2 fixation) Pyruvate/Oxoglutarate oxidoreductases Lipid Metabolism Fatty acid metabolism Nucleotide Metabolism Pyrimidine metabolism Amino Acid Metabolism Glutamate metabolism Glycine, serine and threonine metabolism Cysteine metabolism Arginine and proline metabolism
Phenylalanine, tyrosine and tryptophan biosynthesis
Glycan Biosynthesis and Metabolism Lipopolysaccharide biosynthesis Metabolism of Cofactors and Vitamins Riboflavin metabolism Folate biosynthesis Translation Ribosome Folding, Sorting and Degradation Other ion-coupled transporters 1Only pathways with greater than ten hits in both pooled datasets are shown.
www.nature.com/nature 27

2www.nature.com/nature
doi: 10.1038/nature05414 SUPPLEMENTARY INFORMATION
Supplementary Table 9 – COG categories involved in information storage and cellular processes that are enriched or depleted in the pooled ob/ob cecal microbiome relative to the pooled lean cecal microbiome (capillary sequencing datasets, ob1+ob2 vs. lean1+lean2+lean3, binomial test, P<0.05). ENRICHED [K] Transcription [L] Replication, recombination, repair [Y] Nuclear structure [T] Signal transduction [M] Cell wall/membrane/envelope biogenesis [N] Cell motility DEPLETED [J] Translation [V] Defense mechanisms [O] Posttranslational modification, protein turnover, chaperones
www.nature.com/nature 28

229
APPENDIX B
John F. Rawls, Michael A. Mahowald, Ruth E. Ley and Jeffrey I. Gordon
Reciprocal Gut Microbiota Transplants from Zebrafish and Mice to Germ-free Re-
cipients Reveal Host Habitat Selection
Cell. 2006 Oct 20;127(2):423-33.
For supplemental tables please see enclosed CD.

Reciprocal Gut Microbiota Transplantsfrom Zebrafish and Mice to Germ-freeRecipients Reveal Host Habitat SelectionJohn F. Rawls,1,2 Michael A. Mahowald,1 Ruth E. Ley,1 and Jeffrey I. Gordon1,*1Center for Genome Sciences, Washington University School of Medicine, St. Louis, MO 63108 USA2Present address: Department of Cell and Molecular Physiology, University of North Carolina at Chapel Hill,Chapel Hill, NC 27599 USA.
*Contact: [email protected]
DOI 10.1016/j.cell.2006.08.043
SUMMARY
The gut microbiotas of zebrafish and mice sharesix bacterial divisions, although the specificbacteria within these divisions differ. To testhow factors specific to host gut habitat shapemicrobial community structure, we performedreciprocal transplantations of these microbio-tas into germ-free zebrafish and mouse recipi-ents. The results reveal that communities are as-sembled in predictable ways. The transplantedcommunity resembles its community of originin terms of the lineages present, but the relativeabundance of the lineages changes to resemblethe normal gut microbial community composi-tion of the recipient host. Thus, differences incommunity structure between zebrafish andmice arise in part from distinct selective pres-sures imposed within the gut habitat of eachhost. Nonetheless, vertebrate responses tomicrobial colonization of the gut are ancient:Functional genomic studies disclosed sharedhost responses to their compositionally distinctmicrobial communities and distinct microbialspecies that elicit conserved responses.
INTRODUCTION
Animal evolution has occurred, and is occurring, in a world
dominated by microorganisms. As animals evolved to oc-
cupy different habitats (addresses) and niches (profes-
sions) in our biosphere, they have forged strategic alli-
ances with microorganisms on their body surfaces. The
genomes of microbes within these consortia encode
physiologic traits that are not represented in host ge-
nomes: Microbial-microbial and host-microbial mutualism
endows the resulting ‘‘super-organisms’’ with a fitness ad-
vantage (Ley et al., 2006b). The majority of these microbes
are present in digestive tract communities where, among
other things, they contribute to the harvest of dietary nutri-
ents that would otherwise be inaccessible (Backhed et al.,
2004; Sonnenburg et al., 2005), as well as to the education
of the host’s immune system (Cebra, 1999).
The advent of massively parallel DNA sequencers pro-
vides an opportunity to define the gene content of these
indigenous microbial communities with increased speed
and economy. These ‘‘microbiome’’ sequencing projects
promise to provide a more comprehensive view of the ge-
netic landscape of animal-microbial alliances and testable
hypotheses about the contributions of microbial commu-
nities to animal biology. The results should allow a number
of fundamental questions to be addressed. Is there an
identifiable core microbiota and microbiome associated
with a given host species? How are a microbiota and its
microbiome selected, and how do they evolve within
and between hosts? What are the functional correlates
of diversity in the membership of a microbiota and in the
genetic composition of its microbiome?
Answers to these questions also require model organ-
isms to assess how communities are assembled, to deter-
mine how different members impact community function
and host biology, and to ascertain the extent of redundancy
or modularity within a microbiota. One approach for gener-
ating such models is to use gnotobiotics—the ability to
raise animals under germ-free (GF) conditions—to colonize
them at varying points in their life cycle with a single mi-
crobe or more complex collections, and to then observe
the effects of host habitat on microbial community struc-
ture and function and of the community on the host.
Methods for raising and propagating rodents under GF
conditions have been available for 50 years (see Wost-
mann, 1981), although genomic and allied computational
methods for comprehensively assessing microbial com-
munity composition, gene content, and host-microbial
structure/function relationships have only been deployed
in the last five years (e.g., Hooper and Gordon, 2001; Ley
et al., 2005). Recently, we developed techniques for rearing
the zebrafish (Danio rerio) under GF conditions (Rawls et al.,
2004). In principle, this model organism provides a number
of attractive and distinctive features for analyzing host-
microbial mutualism. Zebrafish remain transparent until
adulthood, creating an opportunity to visualize microbes
Cell 127, 423–433, October 20, 2006 ª2006 Elsevier Inc. 423

in their native gut habitats in real time. A deep draft refer-
ence genome sequence of D. rerio is available (http://
www.sanger.ac.uk/Projects/D_rerio/). In addition, forward
genetic tests and chemical screens can be conducted
(Patton and Zon, 2001; Peterson and Fishman, 2004) to
characterize zebrafish signaling pathways regulated by
microbial consortia and/or their component members.
A preliminary functional genomic study of the effects of
colonizing GF zebrafish with an unfractionated microbiota
harvested from adult conventionally raised (CONV-R) ze-
brafish revealed 59 genes whose responses were similar
to those observed when GF mice were colonized with an
adult mouse gut microbiota (Rawls et al., 2004). These
genes encode products affecting processes ranging from
nutrient metabolism to innate immunity and gut epithelial
cell turnover (Rawls et al., 2004). The experiments did not
distinguish whether the host responses were evolutionarily
conserved and thus present in the last common ancestor
of fish and mammals, or if they had been independently de-
rived in mammals and fish. However, the fact that numerous
homologous genes and shared cellular changes comprised
the ‘‘common’’ response favors the notion of evolutionary
conservationoverconvergence. Itwas alsounclear whether
these common host responses were elicited by the same
or different bacterial signals in each host or by signals
from the whole community versus from specific bacteria.
A recent comprehensive 16S rRNA sequence-based
survey of the adult mouse gut disclosed that, as in humans,
>99% of the bacterial phylogenetic types (phylotypes) be-
long to two divisions—the Firmicutes and Bacteroidetes
(Ley et al., 2005). In contrast, limited surveys of different
fish species indicate that their gut communities are domi-
nated by the Proteobacteria (Cahill, 1990; Huber et al.,
2004; Rawls et al., 2004; Bates et al., 2006; Romero and
Navarrete, 2006). Fish and mammals live in very different
environments, so it is possible that differences in their gut
microbiotas arise from ‘‘legacy effects’’ (e.g., local environ-
mental microbial community composition or inheritance of
a microbiota from a parent). Furthermore, legacy effects
mightcombinewith ‘‘guthabitateffects’’ (e.g.,distinct selec-
tive pressures arising from differences in anatomy, physiol-
ogy, immunologic ‘‘climate,’’ or nutrient milieu) to shape the
different community structures of fish and mammals.
In the present study, we have performed reciprocal mi-
crobiota transplantations in GF zebrafish and mice. We
provide evidence that gut habitat shapes microbial com-
munity structure and that both animal species respond
in remarkably similar ways to components of one an-
other’s microbiota.
RESULTS
Comparison of the Zebrafish and Mouse Gut
Microbiota: Overlapping Bacterial Divisions
but Marked Differences at More Shallow
Phylogenetic Resolution
Our previous survey of the gut microbiota of adult CONV-
R zebrafish was limited to 176 bacterial 16S rRNA gene
sequences (Rawls et al., 2004). Therefore, we performed
a more comprehensive analysis of intestinal contents
pooled from 18 adult male and female C32 zebrafish
(comprised of two independent pools, each containing
material from 9 animals). A total of 1456 bacterial 16S
rRNA sequences formed the final analyzed dataset: 616
from pool 1 and 840 from pool 2 (libraries JFR0503 and
JFR0504, respectively, in Table S1 available with this arti-
cle online). Phylogenetic analysis revealed 198 ‘‘species-
level’’ phylotypes defined by 99% pairwise sequence
identity. These phylotypes represented a total of 11 bacte-
rial divisions and were dominated by the Proteobacteria
(82% ± 22.9% [SD] of all clones averaged across both
libraries) and the Fusobacteria (11% ± 15.2%; Figures 1
and 2). The Firmicutes, Bacteroidetes, Verrucomicrobia,
Actinobacteria,TM7,Planctomycetes, TM6,Nitrospira, and
OP10 divisions were minor components (3.2%–0.6%).
Six of the eleven bacterial divisions found in adult zebra-
fish are also found in mice (Ley et al., 2005); five of these
are also shared by the adult human microbiota (Eckburg
et al., 2005; Figure 1A). However, zebrafish community
members within these shared divisions are distinct from
those in mice and humans at more shallow phylogenetic
resolution (Figures 1B–1D).
The Gut Selects Its Microbial Constituents
The composition of the mouse gut microbiota is affected
by host genotype, as well as by legacy (it is inherited
from the mother; Ley et al., 2005). To determine whether
the observed differences between zebrafish and mouse
microbiotas reflect host genome-encoded variations in
their gut habitats versus differences in the local microbial
consortium available for colonization, we colonized (1)
adult GF mice with an unfractionated gut microbiota har-
vested from CONV-R adult zebrafish (yielding ‘‘Z-mice’’)
and (2) GF zebrafish larvae with a gut microbiota from
CONV-R adult mice (‘‘M-zebrafish’’). By comparing the
composition of the community introduced into the GF
host (‘‘input community’’) with the community that estab-
lished itself in the host (Z-mouse or M-zebrafish ‘‘output
community’’), we sought to determine whether gut micro-
bial ecology is primarily influenced by legacy effects (the
input community structure would persist in the new host)
versus gut habitat effects (the representation changes
when certain taxa are selected).
We introduced the pooled intestinal contents of 18
CONV-R adult zebrafish belonging to the C32 inbred
strain (pools 1 and 2 above) into adult GF mice belonging
to the NMRI inbred strain (n = 6, Table S1, Figure S1). The
resulting Z-mice were housed in gnotobiotic isolators and
sacrificed 14 days after colonization (i.e., after several cy-
cles of replacement of the intestinal epithelium and its
overlying mucus layer). Their cecal contents were har-
vested and provided community DNA for 16S rRNA se-
quence-based enumerations. The cecum was selected
for this analysis because it is a well-defined anatomic
structure located at the junction of the small intestine
and colon, and its luminal contents can be readily and
424 Cell 127, 423–433, October 20, 2006 ª2006 Elsevier Inc.

reliably recovered. It also harbors a very dense microbial
population in CONV-R mice (1011–1012 organisms/ml lu-
minal contents) that has been comprehensively surveyed
(Ley et al., 2005).
In addition to the 1456 16S rRNA sequences represent-
ing 198 phylotypes from the input zebrafish community
(libraries JFR0503 and JFR0504; see above), we obtained
a total of 1836 sequences representing 179 phylotypes
from the Z-mouse cecal community (libraries JFR0507–
12; Figures S1 and S2). Only 12% of the phylotypes found
in the Z-mouse community, representing 39% of all se-
quences, were detected in the input zebrafish community.
The dominant division in the input zebrafish community
(Proteobacteria) persisted but shrank in abundance in
the Z-mouse community (82% ± 22.9% in the input versus
41.7% ± 8.9% in the output; Figure 2). The Z-mouse com-
munity only contained members of the g- and b-Proteo-
bacteria subdivisions, whereas the input zebrafish com-
munity had also included d- and a-Proteobacteria. In
addition, members of the Bacteroidetes detected in the
input zebrafish community were not observed in the
Z-mouse community. The Z-mouse community showed
a striking amplification of the Firmicutes (1% ± 1.1% of
the input, 54.3% ± 6.5% of the Z-mouse output; Figure 2);
this amplification included members of Bacilli as well as
Clostridia classes.
By comparing communities at multiple thresholds for
pairwise percent identity among 16S rRNA gene se-
quences (%ID), we determined that divergence between
the input zebrafish and output Z-mouse communities oc-
curred at 89%ID and higher (Figure 3). This implies that
genera represented within the zebrafish and Z-mouse gut
microbiotas are different but represent the same major lin-
eages. The analysis also demonstrated that the phylotypes
that bloomed in the mouse cecum were minor constituents
of the input zebrafish digestive tract community. Despite
the difference in genus/species representation, the rich-
ness and diversity of the input zebrafish and Z-mouse
gut communities remained similar through the shift in mi-
crobial community composition (Figure S2 and Table S1).
When a similar analysis was applied to the input mouse
and M-mouse communities obtained from a mouse-into-
mouse microbiota transplant experiment (Backhed et al.,
2004), we found that a high degree of similarity was main-
tained at levels as great as 97%ID (Figure 3). Based on
these results, we concluded that (1) the difference in
composition of the input zebrafish and output Z-mouse
communities is not likely to be due to the microbiota trans-
plantation procedure per se and (2) the adult mouse
cecum is able to support a complex foreign microbial
consortium by shaping its composition.
Figure 1. Bacterial Divisions and Their Lineages Detected
in the Zebrafish Digestive Tract, Mouse Cecum, and Human
Colon
(A) Summary of shared and distinct bacterial divisions in the zebrafish,
mouse, and human gut microbiota (data from this study; Rawls et al.,
2004; Ley et al., 2005; Eckburg et al., 2005; Backhed et al., 2005).
Divisions found in the normal gut microbiota of each host are indi-
cated (+). (B–D) Phylogenetic trees constructed from enumeration
studies of the zebrafish digestive tract (B), mouse cecal (C), and
human colonic (D) microbiotas. The zebrafish data are 1456 16S
rRNA gene sequences derived from adult CONV-R C32 fish. The
mouse data are 2196 sequences from adult CONV-R C57Bl/6J mice
and their mothers (Ley et al., 2005). The human dataset contains
2989 bacterial 16S rRNA sequences from colonic mucosal biopsies
and a fecal sample obtained from a healthy adult (Eckburg et al.,
2005). Within a given panel, yellow lines indicate lineages unique to
the host, blue lines indicate lineages that are shared by at least one
other host, while black lines indicate lineages that are absent from
the host. The scale bar indicates 10% pairwise 16S rRNA sequence
divergence.
Cell 127, 423–433, October 20, 2006 ª2006 Elsevier Inc. 425

We performed the reciprocal experiment by colonizing
recently hatched (3 days post-fertilization [dpf]) GF C32
zebrafish with the pooled cecal contents of three CONV-R
adult female mice (libraries JFR0505 and JFR0506 in
Table S1) and conducting surveys of the recipients’ diges-
tive tract communities 3 or 7 days later (libraries JFR0513-
18 in Table S1; Figure S1). As in the previous experiment,
the dominant bacterial division in the input mouse com-
munity (Firmicutes) persisted in the output M-zebrafish
community (87.3% ± 2.2% of input, 64.9% ± 41.7% of
output; Figure 2). However, only members of Bacilli, the
dominant Firmicute class in the zebrafish but not the nor-
mal mouse gut microbiota, were retained; other prominent
members of the Firmicutes found in the input mouse
library (i.e., Clostridia and Mollicutes) were no longer
detected in the M-zebrafish gut. Bacteroidetes (9.8% ±
3.3% of input community) were also undetected. Proteo-
bacteria, a minor member of the input mouse community,
were amplified markedly in the M-zebrafish gut (2.2% ±
0.6% of input, 35.1% ± 41.7% of output; Figure 2).
In addition to their drastic compositional differences, we
also found that the output M-zebrafish community was
less rich and less diverse than the input mouse community
(Table S1 and Figure S2), indicating that only a small subset
of the mouse gut microbial consortium was able to estab-
lish and/or thrive in the larval M-zebrafish gut. In contrast to
the reciprocal zebrafish-into-mouse experiment where the
contents of the adult fish gut were gavaged directly into the
stomachs of recipient GF mice, our mouse-into-zebrafish
gut microbiota transplantation involved introduction of
mouse cecal contents into gnotobiotic zebrafish medium
(GZM) containing 3dpf fish. Therefore, environmental fac-
tors could operate to select a subset of the input mouse
community prior to entry in the recipient fish gut.
Figure 2. Comparison of Input and Output Communitiesfollowing Reciprocal Transplantation of Gut Microbiotas in
Gnotobiotic Zebrafish and Mice
Tree based on pairwise differences between the following bacterial
communities (weighted UniFrac metric, based on a 6379 sequence
tree; Lozupone and Knight, 2005): (1) CONV-R zebrafish digestive tract
microbiota (conventionally raised zebrafish, red); (2) CONV-R mouse
cecal microbiota (conventionally raised mice, yellow); (3) output com-
munity from the cecal contents of ex-GF mice that had been colonized
with a normal zebrafish microbiota (Z-mice, blue); (4) output commu-
nity from the digestive tracts from ex-GF zebrafish that had been col-
onized with a normal mouse microbiota (M-zebrafish, green); and (5)
a control soil community that served as an outgroup (Soil; Axelrood
et al., 2002). The distance p value for this entire UniFrac tree (UniFrac
P, the probability that there are more unique branches than expected
by chance, using 1000 iterations) was found to be <0.001, assigning
high confidence to the overall structure of the UniFrac tree. 16S
rRNA library names are shown next to their respective branch (see
Table S1 for additional details about these libraries). The relative abun-
dance of different bacterial divisions within these different communi-
ties (replicate libraries pooled) is shown in pie charts with dominant
divisions highlighted.
Figure 3. Similarity Indices for Pairwise Comparisons of
Communities Defined as Assemblages of Phylotypes Com-
puted at Levels of %ID Ranging from 86%ID to 100%ID and
Compared at Each %ID Threshold using the Chao-Jaccard
Abundance-Based Similarity Index
Abbreviations: zebrafish into mouse, CONV-R zebrafish compared to
Z-mouse microbiotas; mouse into zebrafish, CONV-R mouse com-
pared to M-zebrafish microbiotas; zebrafish into zebrafish, CONV-R
zebrafish compared to Z-zebrafish microbiotas (data from Rawls
et al., 2004); mouse into mouse, CONV-R mouse compared to M-
mouse microbiotas (data from Backhed et al., 2004). Similarity indices
range from 0 (no overlap in composition) to 1 (identical communities).
426 Cell 127, 423–433, October 20, 2006 ª2006 Elsevier Inc.
The similarities between input mouse and M-zebrafish
communities were high, from 86%ID to 91%ID, above
which the communities diverged in composition (Figure 3),
i.e., different genera were representative of the same
deeper phylogenetic lineages. Indeed, there was no over-
lap between phylotypes with threshold pairwise R99%ID
in the datasets obtained from the input mouse and M-ze-
brafish communities. This was due, in part, to the limited
degree of coverage (73% for the input community accord-
ing to Good’s method; Good, 1953). Phylotypes that were
detected only in the M-zebrafish community were identifi-
able in the input mouse community using PCR and phylo-
type-specific primers (e.g., Staphylococcus; data not
shown). Compared to the reciprocal zebrafish-into-mouse
transplantation experiment, the input mouse and output
M-zebrafish communities diverged at a higher %ID cut-
off (Figure 3), indicating that they were more similar at a
higher taxonomic level than the zebrafish/Z-mouse com-
munities. Part of the drop in similarity could be attributed
to the experimental manipulation since a similar analysis
of a zebrafish-into-zebrafish transplant (Rawls et al.,
2004) revealed a drop in similarity at a comparable %ID
(Figure 3).
The similarity indices described above are derived from
phylotype abundances at different phylotype thresholds
(%IDs). However, an implicit assumption underlying
such an analysis is that all phylotypes are treated equally
regardless of lineage, even though they may represent
similar or very unrelated lineages (Lozupone and Knight,
2005). Another way to compare communities is the Uni-
Frac analysis: In this method, the abundance of each line-
age is weighted, such that the abundance of lineages is
considered as well as which lineages are present (Lozu-
pone and Knight, 2005). The UniFrac approach circum-
vents the problem of having to decide at what %ID level
to define the phylotype units that we call ‘‘different’’ (the
cut-off is likely to vary according to lineage).
UniFrac analysis revealed that replicate Z-mouse data-
sets are most similar to the input zebrafish datasets with
respect to detected lineages (Figure 2). However, the
abundance of the Firmicutes in Z-mice expanded to re-
semble the division’s abundance in CONV-R mice, indi-
cating that the input community, although derived from a
zebrafish, has been shaped to resemble a native mouse
community. Similarly, the M-zebrafish communities are
most similar to the mouse input communities by UniFrac,
but the Proteobacteria in M-zebrafish expanded to re-
semble a CONV-R zebrafish community, indicating that
the input mouse community has been shaped to resemble
a native zebrafish microbiota (Figure 2).
Together, the results from our reciprocal microbiota
transplantation experiments disclose that (1) gut habitat
sculpts community composition in a consistent fashion,
regardless of the input, and (2) stochastic effects are min-
imal (One notable exception was that g-Proteobacteria in
M-zebrafish [Escherichia, Shigella, and Proteus spp.] were
more abundant in one experimental replicate [69.8% ±
20.5%] compared to the other [0.5% ± 0.6%]). The ampli-
fied taxa in both sets of transplantation experiments rep-
resented dominant divisions in the native gut microbiota
of the respective host: Firmicutes in the case of teleostifi-
cation (zebrafish-into-mouse), Proteobacteria in the case
of murinization (mouse-into-zebrafish).
Shared Responses Elicited in Gnotobiotic Mice after
Exposure to a Mouse or Zebrafish Gut Microbiota
from Conventionally Raised Animals
While the studies described above indicated that the com-
position of the gut microbiota is sensitive to host habitat,
we did not know whether the host response was sensitive
to microbial community composition. Therefore, we con-
ducted a GeneChip-based functional genomic analysis
of gene expression in the distal small intestines (ileums)
of mice that had been subjected to zebrafish-into-mouse
(Z-mice) and mouse-into-mouse (M-mice) microbiota
transplantations. All animals (n = 3–5/treatment group)
were sacrificed 14 days after inoculation, RNA was pre-
pared from the ileum of each mouse, and the cRNA target
generated from each RNA sample was hybridized to an
Affymetrix 430 v2 mouse GeneChip. Ingenuity Pathways
Analysis software (IPA; see Supplemental Data) was
then used to compare host responses to these different
microbial communities. IPA software was utilized for
genes that exhibited a R1.5-fold change (increased or
decreased) in their expression compared to GF controls
(false discovery rate <1%).
Despite the different bacterial compositions of the two
input communities, their impact on the mouse was re-
markably similar (Figure 4). The number of IPA-annotated
mouse genes whose expression changed in response to
the two microbiotas was comparable: 500 in response
to the native mouse microbiota (Table S7) and 525 in
response to the zebrafish microbiota (Table S8 and Fig-
ure 4A). Approximately half of the genes (225) were re-
sponsive to both microbial communities (Table S10): 217
(96.4%) were regulated in the same direction. Among
the two sets of responsive genes, there was shared en-
richment of IPA-annotated metabolic pathways involved
in (1) biosynthesis and metabolism of fatty acids (sources
of energy as well as substrates for synthesis of more
complex cellular lipids in an intestinal epithelium that
undergoes continuous and rapid renewal); (2) metabolism
of essential amino acids (valine, isoleucine, and lysine); (3)
metabolism of amino acids that contain the essential trace
element selenium (selenocystine/selenomethioinine) and
are incorporated into the active sites of selenoproteins
such as glutathione peroxidase; (4) metabolism of buty-
rate (a product of polysaccharide fermentation that is
a key energy source for the gut epithelium); and (5) biosyn-
thesis of bile acids needed for absorption of lipids and
other hydrophobic nutrients (Figure 4B and Table S12).
Both communities altered expression of a similar set
of genes involved in insulin-like growth factor-1 (Igf-1),
vascular endothelial growth factor (Vegf), B cell receptor,
and interleukin-6 (Il-6) signaling pathways (Figure 4C
and Table S13). These results are intriguing: Previous
Cell 127, 423–433, October 20, 2006 ª2006 Elsevier Inc. 427

mouse-into-mouse and zebrafish-into-zebrafish trans-
plantations revealed that the microbiota-directed increase
in proliferative activity of gut epithelial lineage progenitors
is a shared host response (Rawls et al., 2004). The under-
lying mechanisms are not known. However, we recently
found that components of Igf-1, Vegf, B cell receptor,
and Il-6 signaling pathways were significantly enriched in
mouse small intestinal epithelial progenitors (Giannakis
et al., 2006). Thus, it is tempting to speculate that these
pathways may be involved in mediating the microbiota’s
effect on mouse intestinal epithelial renewal.
Taken together, these results reveal a commonality in
the transcriptional responses of the mouse to two micro-
bial communities with shared divisions represented by dif-
ferent lineages at a finer phylogenetic resolution (Figure 1).
This common response to a microbiota may reflect as yet
unappreciated shared functional properties expressed by
the two compositionally distinct communities and/or
a core response, evolved by the mouse gut to distinct
microbial communities.
Comparison of Zebrafish Host Responses to
a Zebrafish versus a Mouse Gut Microbiota
Analysis of zebrafish 3 days after colonization with either
a zebrafish or a mouse microbiota at 3dpf also demon-
strated shared features of the host response to both
Figure 4. Identifying a Common Response of the Germ-free Mouse Distal Small Intestine to Colonization with Mouse and Zebra-
fish Gut Microbial Communities
(A) Summary of results of GeneChip analysis of the ileal transcriptome in GF mice versus mice colonized for 14 days with a mouse cecal microbiota
(M-mice versus GF; red lines) or a normal zebrafish digestive tract microbiota (Z-mice versus GF; blue lines). Note that only a subset of all Affymetrix
GeneChip probe sets are annotated by Ingenuity Pathway Analysis (IPA). Supplemental tables containing GeneChip probe set and IPA gene infor-
mation are indicated. IPA reveals metabolic pathways (panel B; Table S12) and molecular functions (panel C; Table S13) that are significantly enriched
(p < 0.05) in the host response to each community. The seven most significant metabolic pathways and the four most significant signaling pathways
from the M-mice versus GF mice comparison (red bars) are shown along with corresponding data from the Z-mice versus GF mice comparison (blue
bars). (Not shown: the 275 IPA-annotated mouse genes regulated by the mouse microbiota but unchanged by the zebrafish digestive tract microbiota
were significantly enriched for components of ERK/MAPK, SAPK/JNK, antigen presentation, and the pentose phosphate pathways [Table S9]. In con-
trast, the 300 IPA-annotated mouse genes regulated by the zebrafish microbiota but unchanged by the mouse microbiota were enriched for com-
ponents of glutamate and arginine/proline metabolism, ketone body synthesis/degradation, plus b-adrenergic signaling pathways [Table S11]).
428 Cell 127, 423–433, October 20, 2006 ª2006 Elsevier Inc.

microbial communities. To quantify these responses, we
selected biomarkers identified from our comparisons of
6dpf GF, CONV-R, and Z-zebrafish (Rawls et al., 2004).
Quantitative real-time RT-PCR (qRT-PCR) of biomarkers
of lipid metabolism, including fasting-induced adipose
factor (fiaf; circulating inhibitor of lipoprotein lipase,
Backhed et al., 2004), carnitine palmitoyltransferase 1a
(cpt1a), and the trifunctional enzyme hydroxyacylCoA
dehydrogenase/3-ketoacylCoA thiolase/enoyl CoA hy-
dratase a (hadha), revealed that the mouse microbiota
was able to largely recapitulate the effect of the zebrafish
microbiota (Figures 5 and S3). In contrast, the zebrafish
microbiota, but not the mouse microbiota, prominently
increased host expression of (1) innate immune response
biomarkers (serum amyloid a [saa], myeloperoxidase
[mpo; Lieschke et al., 2001; Figure 5], and complement
component factor b [bf; Figure S3]) and (2) proliferating
cell nuclear antigen (pcna; biomarker of epithelial cell re-
newal; Figure 5).
Selecting Readily Culturable Microbial Species that
Are Useful Models for Translating Information about
Host-Bacterial Mutualism from Zebrafish to Mice
In order to use gnotobiotic zebrafish as a surrogate for
studying the mechanisms underlying host-microbial mu-
tualism in the mammalian gut, we sought culturable bac-
terial species that were capable of (1) efficiently colonizing
the digestive tracts of GF zebrafish and mice and (2) elic-
iting evolutionarily conserved host responses in both
hosts. Therefore, we performed culture-based bacterial
surveys of the Z-mouse and M-zebrafish output commu-
nities in parallel with our culture-independent 16S rRNA
surveys. 16S rRNA sequence-based analysis of 160 differ-
ent bacterial isolates from the communities of six Z-mice
yielded 47 different phylotypes (defined at 97%ID) repre-
senting four divisions (Proteobacteria, Fusobacteria, Acti-
nobacteria, and Firmicutes). Similarly, an analysis of 303
isolates recovered from the communities of 18 M-zebra-
fish yielded 41 phylotypes representing the Proteobacte-
ria and Firmicutes (Tables S1 and S14).
We selected seven primary isolates from the transplan-
tation experiments representing the Firmicutes (Enteroc-
coccus and Staphylococcus spp.) and the Proteobacteria
(Shewanella, Aeromonas, Citrobacter, Plesiomonas, Es-
cherichia spp.). Three laboratory strains of g-Proteobacte-
ria (Aeromonas hydrophila ATCC35654, Pseudomonas
aeruginosa PAO1, and E. coli MG1655) were used as con-
trols (Table S15). These primary isolates and lab strains
were selected based on the relative abundance of their
phylotypes in our culture-based surveys of input and out-
put communities (Table S14).
3dpf GF zebrafish were exposed to 104 CFU of each pri-
mary isolate or strain per milliliter of gnotobiotic zebrafish
medium (GZM); all reached similar densities in the diges-
tive tract by 6dpf (104–105 CFU/gut). These densities are
similar to those documented in age-matched CONV-R or
Z-zebrafish (Rawls et al., 2004).
An epidermal degeneration phenotype that develops in
fed (but not fasted) GF zebrafish beginning at 9dpf (Rawls
et al., 2004) was ameliorated by colonization with nine of
the ten bacterial strains at 3dpf. The Enterococcus isolate
M2E1F06 was the only tested strain that did not have any
detectable effect (Figure S4). We found that epidermal de-
generation could also be prevented by placing a mesh
bag, containing an autoclaved mixture of activated carbon
and cation exchange resin, into the GZM (Figure S4). This
latter finding suggests that rescue by most of the tested
bacterial strains involves bioremediation of toxic com-
pounds that accumulate when GF zebrafish are exposed
to food. Our subsequent analysis of the impact of the Fir-
micutes (i.e., Enterococcus and Staphylococcus isolates)
on gut gene expression was performed using zebrafish
raised in the presence of activated carbon and resin.
qRT-PCR analysis of biomarkers of lipid metabolism, in-
cluding fiaf, cpt1a, and hadha, revealed that five of the
seven primary isolate strains and all of the type strains
tested were able to at least partially recapitulate the
response obtained after exposure to an unfractionated
zebrafish microbiota. Colonization with T1E1C05 (Shewa-
nella sp.) and P. aeruginosa PAO1 had the largest effects
(Figures 5 and S3). Two biomarkers of innate immune re-
sponses, saa and bf, were also responsive to the majority
of these strains, but the granulocyte-specific marker mpo
was relatively specific for P. aeruginosa PAO1 (Figures 5
and S3). None of the tested individual bacterial strains,
including PAO1, were able to recapitulate the degree of
stimulation of cell division in the intestinal epithelium of
6dpf zebrafish seen in the presence of an unfractionated
zebrafish microbiota harvested from CONV-R donors,
whether judged by qRT-PCR assays of pcna expression
or by immunohistochemical analysis of the incorporation
of BrdU administered 24 hr prior to sacrifice (Figure 5).
We also assessed the host response to colonization
with a consortium consisting of an equal mixture of all
seven primary isolates (n = 2 groups of 20 GF zebrafish
colonized at 3dpf and sacrificed at 6dpf). qRT-PCR indi-
cated that this model microbiota was able to partially reca-
pitulate the nutrient metabolic and innate immune (but not
epithelial proliferative) responses to the normal zebrafish
microbiota. Importantly, the response to the consortium
was a nonadditive representation of the responses to
each component strain, and not equivalent to what was
observed with a complete microbiota from CONV-R
zebrafish (Figures 5 and S3).
qRT-PCR assays established that treatment of 6dpf ze-
brafish larvae with lipopolysaccharide (LPS) purified from
P. aeruginosa was able to partially recapitulate innate im-
mune responses seen with live P. aeruginosa (Figure 5). In
contrast, LPS treatment did not affect expression of bio-
markers of nutrient metabolism (Figure 5). This notion of
distinct bacterial signaling mechanisms for innate immune
and metabolic responses is supported by the observation
that some of the tested isolates (e.g, T1E1C05, a Shewa-
nella sp.) are able to induce robust nutrient metabolic
responses without eliciting innate immune responses
Cell 127, 423–433, October 20, 2006 ª2006 Elsevier Inc. 429

Figure 5. qRT-PCR Assays of the Responses of Germ-free Zebrafish to Colonization with Individual Culturable Members of the
Zebrafish and Mouse Gut Microbiotas
Expression levels of serum amyloid a (saa), myeloperoxidase (mpo), fasting-induced adipose factor (fiaf), carnitine palmitoyltransferase 1a (cpt1a), and
proliferating cell nuclear antigen (pcna) were assessed using RNA extracted from the pooled digestive tracts of 6dpf zebrafish inoculated since 3dpf
with a CONV-R zebrafish microbiota (Z-zebrafish), a CONV-R mouse microbiota (M-zebrafish), a consortium of seven primary isolates (Consortium),
a primary Enterococcus isolate (M2E1F06), a primary Staphylococcus isolate (M2E1A04), a primary Citrobacter isolate (T1E1C07), a primary Aero-
monas isolate (T1E1A06), a primary Plesiomonas isolate (T1N1D03), a primary Shewanella isolate (T1E1C05), a primary Escherichia isolate
(M1N2G03), an Escherichia coli type strain (E. coli MG1655), an Aeromonas hydrophila type strain (A. hydrophila ATCC35654), a Pseudomonas aer-
uginosa type strain (P. aeruginosa PAO1), or 0.1 mg/ml P. aeruginosa LPS (P. aeruginosa LPS). Data from biological duplicate pools (R10 animals per
pool) were normalized to 18S rRNA levels and results expressed as mean fold-difference compared to GF controls ± SEM. S phase cells were
430 Cell 127, 423–433, October 20, 2006 ª2006 Elsevier Inc.

(Figures 5 and S3). Moreover, we found that all three clas-
ses of host response (innate immunity, nutrient metabo-
lism, and cell proliferation) are strongly attenuated in the
absence of an exogenous nutrient supply (See Figure S5).
DISCUSSION
There is considerable interest in how communities assem-
ble at the microbial scale, and how the environment (e.g.,
local chemistry) and legacy effects (e.g., microbes avail-
able to colonize) interact to predict the composition of
a community (Hughes-Martiny et al., 2006). Some host-
associated microorganisms exhibit patterns of genetic dif-
ferentiation that are related to the geographic distribution
of their hosts (Bala et al., 2003; Falush et al., 2003). This
raises the question of how much of the variation is due
to habitat differences that correlate with geographic sep-
aration, versus the legacy of past communities. Our study
directly tests the effect of habitat in assembling a com-
munity: We constrained the legacy effect by presenting
empty GF hosts with a known microbial community so
that observed changes in diversity could be correlated
with factors specific to host gut habitat (e.g., either direct
effects of the niche space or indirect effects on intercom-
munity dynamics).
UniFrac showed the output community of the Z-mouse
to be made up of zebrafish-specific lineages, but the pro-
portional representation of the divisions was more similar
to what is typical of a mouse gut community. Conversely,
the M-zebrafish digestive tract community was ‘‘teleosti-
fied’’ by a change in the proportions of divisions from the
mouse input. Moreover, all ten of the individual cultured
strains introduced into the GF host guts took up residence.
These results show that the host will ‘‘work’’ with what it
gets: We constrained the input by presenting the empty
host with a constrained microbiota, and the resulting com-
munity took on a relative divisional abundance character-
istic of the recipient host’s naturally occurring community.
What determines the host’s relative abundance of divi-
sions? Its reproducibility regardless of the provenance of
the input community underscores the presence of very
powerful organizing principles in community composition
that have yet to be fully explored. A simple interpretation of
these findings is that members of the Firmicutes and Pro-
teobacteria possess division-wide properties that allow
them to succeed in the mouse and zebrafish gut, respec-
tively; thus, even distantly related members within a divi-
sion will respond similarly to habitat effects. If so, the
implication is that there is considerable functional and/or
physiological redundancy within lineages that are se-
lected for in specific host gut habitats. One obvious differ-
ence between the Gram-positive Firmicutes and the
Gram-negative Proteobacteria is their cell wall structure,
which could be a target for selection. Another trait that
may differentiate gut Firmicutes from Proteobacteria is
their oxygen tolerence: The larval and adult zebrafish gut
is predicted to have higher levels of oxygen than the
mouse cecum and might exclude Firmicutes, whose
members are more likely to be strictly anaerobic than
the Proteobacteria. However, generalizations about divi-
sion-level traits are conjecture and almost certainly prone
to exceptions, particularly since they are based on a se-
verely limited knowledge of the genomic features and
phenotypes of gut bacteria. This is highlighted by our
observation that the Firmicutes amplified in the ceca of
Z-mice were only from the classes Bacilli and Clostridia,
while the Proteobacteria amplified in M-zebrafish diges-
tive tracts were only from the g-Proteobacteria class.
The bacteria that establish themselves in a new host do
not necessarily need to be identical by 16S rRNA %ID to
be functionally similar ecotypes and to have similar ge-
nome content. Closely related phylotypes that form polyt-
omies (i.e., star phylogenies) are common in the environ-
ment and in the animal gut (Acinas et al., 2004; Eckburg
et al., 2005; Ley et al., 2006a, 2006b): Whole-genome
comparisons of gut-dwelling Bacteroidetes species
show that their proteomes have similar functional profiles,
although they can differ in 16S rRNA %ID by as much as
12% (Xu et al., 2003; J. Xu, M.A.M, R.E.L., and J.I.G.,
unpublished data).
Curtis and Sloan (2004) state that when a new commu-
nity is formed, it must be initiated by drawing from the
available microbes at random. Two random samples
from a log-normal distribution can have quite different
compositions. Therefore, physically identical habitats (in
this study, genetically identical hosts) will have different
communities if they are formed at random from large
seeding communities and will only be similar if the seeding
community is small enough that the same bacteria arrive
by chance (Curtis and Sloan, 2004). However, the input
communities (mouse and zebrafish) each contained hun-
dreds of species, making it unlikely that the same bacteria
would establish by chance in each recipient GF animal.
In addition to host habitat factors, dynamics within
microbial communities will interact with the host habitat
to shape the final community. The relative abundance of di-
visions can be viewed as a simple emergent property of the
community that belies underlying, highly complex organi-
zational principles. Community-level interactions such as
competition, cooperation, predation, and food web dy-
namics will all interact to shape a community (Ley et al.,
2006b). The host provides the habitat and a basic niche
space that the microbial community expands by its phys-
ical presence and metabolic activities. It is remarkable
that such complex interactions can result in the predict-
able community structure that we observed at the division
quantified in the intestinal epithelium of 6dpf zebrafish colonized since 3dpf with a CONV-R zebrafish microbiota (Z-zebrafish), a consortium of seven
primary isolates (Consortium), or individual species. The percentage of all intestinal epithelial cells in S phase was scored using antibodies directed
against BrdU, following incubation in BrdU for 24 hr prior to sacrifice. Data are expressed as the mean of two independent experiments ± SEM
(n = 9–15 five micron-thick transverse sections scored per animal, R7 animals analyzed per experiment). ***, p < 0.0001; **, p < 0.001; *, p < 0.05.
Cell 127, 423–433, October 20, 2006 ª2006 Elsevier Inc. 431

level. The shared host response to reciprocally trans-
planted zebrafish and mouse gut microbiotas suggests
that this predictability of community composition also ex-
tends to the functions encoded in their microbiomes.
EXPERIMENTAL PROCEDURES
Animal Husbandry
All experiments using zebrafish and mice were performed using
protocols approved by the Washington University Animal Studies
Committee.
Conventionally Raised Animals
CONV-R zebrafish belonging to the C32 inbred strain were maintained
under a 14 hr light cycle and given a diet described in an earlier publi-
cation (Rawls et al., 2004). CONV-R Swiss-Webster mice were pur-
chased from Taconic Labs and fed an irradiated PicoLab chow diet
(Purina) ad libitum. Mice were reared in a specific pathogen-free state,
in a barrier facility, under a 12 hr light cycle.
Germ-free Animals
Zebrafish were derived as GF and reared using established protocols
and diets (Rawls et al., 2004). GF zebrafish were maintained at 28.5�C
in plastic gnotobiotic isolators at an average density of 0.3 individuals/
ml gnotobiotic zebrafish medium (GZM; Rawls et al., 2004). GF mice
belonging to the NMRI inbred strain were housed in plastic gnotobiotic
isolators and fed an autoclaved chow diet (B&K Universal) ad libitum
(Hooper et al., 2002). GF zebrafish and mice were kept under a 12 hr
light cycle and monitored routinely for sterility (Rawls et al., 2004).
Colonization
GF zebrafish were conventionalized at 3dpf with a digestive tract mi-
crobiota harvested from CONV-R C32 donors, using established pro-
tocols (Rawls et al., 2004). To colonize zebrafish with individual bacte-
rial species, or with defined consortia (see below), cultures were added
directly to GZM containing 3dpf GF zebrafish (final density 104 CFU/
ml). Colonization with members of the Firmicutes was coupled with
addition of a cotton mesh bag containing 15 ml of ammonia-removing
resin and activated carbon (AmmoCarb, Aquarium Pharmaceuticals)
per 100 ml GZM at 3dpf.
To colonize zebrafish with a mouse gut microbiota, cecal contents
were pooled from three adult CONV-R Swiss-Webster female mice
under aerobic conditions, diluted 1:1200 in PBS, and added directly
(1:100 dilution) to GZM containing 3dpf GF zebrafish (final density:
102 CFU/ml [aerobic culture]; 103 CFU/ml [anaerobic culture], as de-
fined by incubation on BHI-blood agar for 2 days at 28�C).
GF NMRI mice were colonized at 7–11 weeks of age with a micro-
biota harvested from the cecal contents of adult CONV-R female
Swiss-Webster mice (Backhed et al., 2004). To colonize mice with a ze-
brafish microbiota, the pooled digestive tract contents of 18 CONV-R
adult C32 zebrafish were diluted 1:4 in sterile PBS under aerobic con-
ditions and a 100 ml aliquot was introduced, with a single gavage (5 3
103 CFU/mouse, as defined by anaerobic and aerobic culture on
BHI-blood agar and tryptic soy agar for 2 days at 37�C).
Other Treatments of Zebrafish
GF 3dpf animals were immersed in filter-sterilized GZM containing 0.1
mg/ml LPS purified from Pseudomonas aeruginosa ATCC27316
(Sigma, L8643). Sterility during this treatment was monitored routinely
by culturing the aquaculture medium under a variety of conditions
(Rawls et al., 2004).
To quantify cellular proliferation in the intestinal epithelium, 5dpf
zebrafish were immersed in a solution of 5-bromo-20-deoxyuridine
(BrdU; 160 mg/ml of GZM) and 5-fluoro-20-deoxyuridine (16 mg/ml
GZM) for 24 hr prior to sacrifice. S phase cells were detected and
scored as described (Rawls et al., 2004).
Phylogenetic and Diversity Analyses
Bulk DNA was obtained from the digestive tracts of zebrafish and the
ceca of mice by solvent extraction and mechanical disruption (Ley
et al., 2005; Rawls et al., 2004). The DNA was used in replicate
PCRs using Bacteria-specific 16S rRNA gene primers. Amplicons
from replicate PCRs were pooled and cloned prior to sequencing
(See Supplemental Data).
16S rRNA gene sequences were edited and assembled into consen-
sus sequences using PHRED and PHRAP aided by XplorSeq (Daniel
Frank, University of Colorado, Boulder, personal communication);
bases with a PHRAP quality score of <20 were trimmed. Contiguous
sequences with at least 1000 >Q20 bp were checked for chimeras
and then aligned to the 16S rRNA prokMSA database using
the NAST server (http://greengenes.lbl.gov/cgi-bin/nph-NAST_align.
cgi). The resulting multiple sequence alignments were incorporated
into a curated Arb alignment (Ludwig et al., 2004) available at http://
gordonlab.wustl.edu/supplemental/Rawls/Gut_Micro_Transplant.arb.
Assignment of the majority of sequences to their respective divisions
was based on their position after parsimony insertion to the Arb den-
drogram (omitting hypervariable portions of the 16S rRNA gene using
lanemaskPH provided with the database). Chloroplast sequences
were identified in CONV-R zebrafish libraries and removed (i.e., 8
sequences from library JFR0503 and 59 sequences from library
JFR0504). Sequences that did not fall within described divisions
were characterized as follows. Phylogenetic trees including the novel
sequences and reference taxa were constructed by evolutionary dis-
tance (using PAUP* 4.0 [Swofford, 2003], a neighbor-joining algorithm
with either Kimura two-parameter correction or maximum-likelihood
correction with an empirically determined g distribution model of
site-into-site rate variation and empirically determined base frequen-
cies). Bootstrap resampling was used to test the robustness of inferred
topologies.
Distance matrices generated in Arb (with hypervariable regions
masked, and with Olsen correction [Ley et al., 2006a]) were used to
cluster sequences into operational taxonomic units (OTU’s) by pair-
wise identity (%ID) with a furthest-neighbor algorithm and a precision
of 0.01 implemented in DOTUR (Schloss and Handelsman, 2005). We
use ‘‘phylotype’’ to refer to bins of sequences with R99% pairwise
identity. Collector’s curves, Chao1 diversity estimates, and Simpson’s
diversity index were calculated using DOTUR and Chao-Jaccard
Abundance-based diversity indices using EstimateS 7.5 (Colwell,
2005). The percentage of coverage was calculated by Good’s method
with the equation (1 � [n/N]) 3 100, where n is the number of phylo-
types in a sample represented by one clone (singletons) and N is the
total number of sequences in that sample (Good, 1953).
To cluster the communities from each treatment, we used the Uni-
Frac computational tool (Lozupone and Knight, 2005). To do so, the
masked Arb alignment containing 5527 sequences from this study
plus 852 sequences obtained from soil (Axelrood et al., 2002) was
used to construct a neighbor-joining tree. The neighbor-joining tree
was annotated according to the treatment from which each sequence
was derived, and the fraction of tree branch length unique to any one
treatment in pairwise comparisons (the UniFrac metric) was calcu-
lated. The p value for the tree, reflecting the probability that the there
are more unqiue branch lengths than expected by chance alone,
was calculated by generating 1000 random trees (Lozupone and
Knight, 2005).
Functional Genomics
Analyses of gene expression in the mice and zebrafish using Affymetrix
GeneChips, quantitative real-time RT-PCR, and Ingenuity Pathways
Analysis were performed using methods described in previous publi-
cations (Giannakis et al., 2006; Hooper and Gordon, 2001; Rawls
et al., 2004). For additional details, see Supplemental Data.
Supplemental Data
Supplemental Data include Experimental Procedures, 5 figures, and
16 tables and can be found with this article online at http://www.cell.
com/cgi/content/full/127/2/423/DC1/.
432 Cell 127, 423–433, October 20, 2006 ª2006 Elsevier Inc.

ACKNOWLEDGMENTS
We are grateful to David O’Donnell and Maria Karlsson for assistance
with husbandry of gnotobiotic animals, Sabrina Wagoner and Jill
Manchester for valuable technical help, plus Fredrik Backhed, Peter
Crawford, Marios Giannakis, and Justin Sonnenburg for many helpful
discussions. This work was supported by the Ellison Medical Founda-
tion, the W.M. Keck Foundation, and the NIH (DK30292, DK62675,
DK073695).
Received: May 3, 2006
Revised: June 28, 2006
Accepted: August 25, 2006
Published: October 19, 2006
REFERENCES
Acinas, S.G., Klepac-Ceraj, V., Hunt, D.E., Pharino, C., Ceraj, I., Distel,
D.L., and Polz, M.F. (2004). Fine-scale phylogenetic architecture of
a complex bacterial community. Nature 430, 551–554.
Axelrood, P.E., Chow, M.L., Radomski, C.C., McDermott, J.M., and
Davies, J. (2002). Molecular characterization of bacterial diversity
from British Columbia forest soils subjected to disturbance. Can. J.
Microbiol. 48, 655–674.
Backhed, F., Ding, H., Wang, T., Hooper, L.V., Koh, G.Y., Nagy, A., Se-
menkovich, C.F., and Gordon, J.I. (2004). The gut microbiota as an
environmental factor that regulates fat storage. Proc. Natl. Acad. Sci.
USA 101, 15718–15723.
Backhed, F., Ley, R.E., Sonnenburg, J.L., Peterson, D.A., and Gordon,
J.I. (2005). Host-bacterial mutualism in the human intestine. Science
307, 1915–1920.
Bala, A., Murphy, P., and Giller, K.E. (2003). Distribution and diversity
of rhizobia nodulating agroforestry legumes in soils from three conti-
nents in the tropics. Mol. Ecol. 12, 917–929.
Bates, J.M., Mittge, E., Kuhlman, J., Baden, K.N., Cheesman, S.E., and
Guillemin, K. (2006). Distinct signals from the microbiota promote dif-
ferent aspects of zebrafish gut differentiation. Dev. Biol. 297, 374–386.
Cahill, M.M. (1990). Bacterial flora of fishes: a review. Microb. Ecol. 19,
21–41.
Cebra, J.J. (1999). Influences of microbiota on intestinal immune sys-
tem development. Am. J. Clin. Nutr. 69, 1046S–1051S.
Colwell, R.K. (2005). EstimateS: Statistical estimation of species rich-
ness and shared species from samples (http://purl.oclc.org/estimates.
Curtis, T.P., and Sloan, W.T. (2004). Prokaryotic diversity and its limits:
microbial community structure in nature and implications for microbial
ecology. Curr. Opin. Microbiol. 7, 221–226.
Eckburg, P.B., Bik, E.M., Bernstein, C.N., Purdom, E., Dethlefsen, L.,
Sargent, M., Gill, S.R., Nelson, K.E., and Relman, D.A. (2005). Diversity
of the human intestinal microbial flora. Science 308, 1635–1638.
Falush, D., Wirth, T., Linz, B., Pritchard, J.K., Stephens, M., Kidd, M.,
Blaser, M.J., Graham, D.Y., Vacher, S., Perez-Perez, G.I., et al.
(2003). Traces of human migrations in Helicobacter pylori populations.
Science 299, 1582–1585.
Giannakis, M., Stappenbeck, T.S., Mills, J.C., Leip, D.G., Lovett, M.,
Clifton, S.W., Ippolito, J.E., Glasscock, J.I., Arumugam, M., Brent,
M.R., and Gordon, J.I. (2006). Molecular properties of adult mouse
gastric and intestinal epithelial progenitors in their niches. J. Biol.
Chem. 281, 11292–11300.
Good, I.J. (1953). The population frequencies of species and the esti-
mation of population parameters. Biometrika 40, 237–264.
Hooper, L.V., and Gordon, J.I. (2001). Commensal host-bacterial rela-
tionships in the gut. Science 292, 1115–1118.
Hooper, L.V., Mills, J.C., Roth, K.A., Stappenbeck, T.S., Wong, M.H.,
and Gordon, J.I. (2002). Combining gnotobiotic mouse models with
functional genomics to define the impact of the microflora on host
physiology. Mol. Cell. Microbiol. 31, 559–589.
Huber, I., Spanggaard, B., Appel, K.F., Rossen, L., Nielsen, T., and
Gram, L. (2004). Phylogenetic analysis and in situ identification of the
intestinal microbial community of rainbow trout (Oncorhynchus mykiss,
Walbaum). J. Appl. Microbiol. 96, 117–132.
Hughes-Martiny, J.B., Bohannan, B.J., Brown, J.H., Colwell, R.K.,
Fuhrman, J.A., Green, J.L., Horner-Devine, M.C., Kane, M., Krumins,
J.A., Kuske, C.R., et al. (2006). Microbial biogeography: putting micro-
organisms on the map. Nat. Rev. Microbiol. 4, 102–112.
Ley, R.E., Backhed, F., Turnbaugh, P., Lozupone, C.A., Knight, R.D.,
and Gordon, J.I. (2005). Obesity alters gut microbial ecology. Proc.
Natl. Acad. Sci. USA 102, 11070–11075.
Ley, R.E., Harris, J.K., Wilcox, J., Spear, J.R., Miller, S.R., Bebout,
B.M., Maresca, J.A., Bryant, D.A., Sogin, M., and Pace, N.R. (2006a).
Unexpected diversity and complexity from the Guerrero Negro hyper-
saline microbial mat. Appl. Environ. Microbiol. 72, 3685–3695.
Ley, R.E., Peterson, D.A., and Gordon, J.I. (2006b). Ecological and
evolutionary forces shaping microbial diversity in the human intestine.
Cell 124, 837–848.
Lieschke, G.J., Oates, A.C., Crowhurst, M.O., Ward, A.C., and Layton,
J.E. (2001). Morphologic and functional characterization of granulo-
cytes and macrophages in embryonic and adult zebrafish. Blood 98,
3087–3096.
Lozupone, C., and Knight, R. (2005). UniFrac: a new phylogenetic
method for comparing microbial communities. Appl. Environ. Micro-
biol. 71, 8228–8235.
Ludwig,W.,Strunk, O., Westram, R., Richter, L., Meier, H., Yadhukumar,
Buchner, A., Lai, T., Steppi, S., Jobb, G., et al. (2004). ARB: a software
environment for sequence data. Nucleic Acids Res. 32, 1363–1371.
Patton, E.E., and Zon, L.I. (2001). The art and design of genetic
screens: zebrafish. Nat. Rev. Genet. 2, 956–966.
Peterson, R.T., and Fishman, M.C. (2004). Discovery and use of small
molecules for probing biological processes in zebrafish. Methods Cell
Biol. 76, 569–591.
Rawls, J.F., Samuel, B.S., and Gordon, J.I. (2004). Gnotobiotic zebra-
fish reveal evolutionarily conserved responses to the gut microbiota.
Proc. Natl. Acad. Sci. USA 101, 4596–4601.
Romero, J., and Navarrete, P. (2006). 16S rDNA-based analysis of
dominant bacterial populations associated with early life stages of
coho salmon (Oncorhynchus kisutch). Microb. Ecol. 51, 422–430.
Schloss, P.D., and Handelsman, J. (2005). Introducing DOTUR, a com-
puter program for defining operational taxonomic units and estimating
species richness. Appl. Environ. Microbiol. 71, 1501–1506.
Sonnenburg, J.L., Xu, J., Leip, D.D., Chen, C.H., Westover, B.P.,
Weatherford, J., Buhler, J.D., and Gordon, J.I. (2005). Glycan foraging
in vivo by an intestine-adapted bacterial symbiont. Science 307, 1955–
1959.
Swofford, D.L. (2003). PAUP*, Phylogenetic Analysis Using Parsimony
(*and Other Methods) (http://paup.csit.fsu.edu/) (Sunderland, MA:
Sinauer Associates).
Wostmann, B.S. (1981). The germfree animal in nutritional studies.
Annu. Rev. Nutr. 1, 257–279.
Xu, J., Bjursell, M.K., Himrod, J., Deng, S., Carmichael, L.K., Chiang,
H.C., Hooper, L.V., and Gordon, J.I. (2003). A genomic view of the
human-Bacteroides thetaiotaomicron symbiosis. Science 299, 2074–
2076.
Accession Numbers
16S rRNA sequences have been deposited in GenBank under acces-
sion numbers DQ813844–DQ819377. GeneChip datasets have been
deposited in Gene Expression Omnibus under accession number
GSE5198.
Cell 127, 423–433, October 20, 2006 ª2006 Elsevier Inc. 433

Cell, Volume 127 Supplemental Data
Reciprocal Gut Microbiota Transplants
from Zebrafish and Mice to Germ-free
Recipients Reveal Host Habitat Selection John F. Rawls, Michael A. Mahowald, Ruth E. Ley, and Jeffrey I. Gordon
Supplemental Experimental Procedures
16S rRNA Gene Sequencing Luminal contents from the ceca of CONV-R adult mice and Z-mice, and the intact
digestive tracts of CONV-R adult zebrafish and 6dpf/10dpf M-zebrafish were removed immediately after animals were killed, and homogenized in sterile PBS under aerobic conditions (see Fig. S1, Table S1). An aliquot of each homogenate was used immediately for culture-based enumeration (see below): the remainder was frozen at –80oC until use.
A frozen aliquot of each sample was thawed, centrifuged at 18,000 x g for 30 min at 4oC to pellet material, and the pellet was then pulverized with a sterile pestle in 700µL filter-sterilized extraction buffer [100mM NaCl, 10mM Tris-Cl (pH 8.0), 25mM EDTA (pH 8.0), 0.5% (w/v) SDS, 0.1 mg/mL proteinase K (Sigma)]. Following a 40 min incubation at 37oC for 40 min, 500µL of 0.1mm-diamter zirconia/silica beads (Biospec Products) plus 500µL of a mixture of phenol:chloroform (Ambion) were added to each sample, and the sample was disrupted mechanically for 2 min at 23oC with a bead beater (Mini-Beadbeater, BioSpec Products Inc.; using the instrument’s highest setting). Samples were centrifuged at 18,000 x g at 4oC for 3 min. The aqueous phase was subjected to one additional round of phenol:chlorofom extraction prior to precipitation of DNA with isopropanol. Isolated genomic DNA was further purified over Montage PCR Centrifugal Filters (Millipore). For each sample, three replicate 25µL polymerase chain reactions were performed, each containing 1-200 ng of purified genomic DNA, 20mM Tris-HCl (pH 8.4), 50mM KCl, 300uM MgCl2, 400mM Betaine, 160µM dNTPs, 3 units of Taq DNA polymerase (Invitrogen), and 400nM of universal 16S rRNA primers 27F (5’-AGAGTTTGATCCTGGCTCAG-3’) and 1491R (5’-GGTTACCTTGTTACGACTT-3’). Reactions were incubated initially at 94oC for 10 min, followed by 30 cycles of 94oC for 1 min, 52oC for 1 min, and 72oC for 2 min, and a final extension step at 72oC for 10 min. Replicate reactions were pooled and purified over Montage PCR Centrifugal Filters (Millipore), and pooled PCR products cloned into pCR4-TOPO (TOPO TA Cloning Kit for Sequencing, Invitrogen). DNA extraction of control samples from GF animals did not yield detectable 16S rRNA PCR products or colonies. Clones were sequenced in BigDye Terminator reactions using 16S rRNA primers [27F, 1491R, and 907R (5’-CCGTCAATTCCTTTRAGTTT-3’)]. 16S rRNA sequences derived from these culture-independent surveys were submitted to GenBank under accession numbers DQ813844-DQ819370. Culture-Based Enumerations

To recover culturable bacteria from microbial consortia, homogenates of pooled zebrafish digestive tracts or individual mouse ceca were plated under aerobic conditions in a dilutional series on BHI-blood agar, tryptic soy agar, PEA-blood agar, nutrient agar, marine agar, and cholera agar (Becton Dickinson), and grown at 37oC and/or 28.5oC under aerobic and anaerobic conditions. Colonies were picked in a non-random manner into the corresponding liquid media under aerobic conditions, and grown under the same conditions that led to their initial detection. Liquid cultures were frozen as glycerol stocks in 96-well microtiter plates.
Aliquots (1µL) of these glycerol stocks were used directly as templates for 25µL PCR with the 27F and 1491R primers described above. PCR products were purified over Perfectprep PCR Cleanup 96-well plates (Eppendorf), and partial 16S rRNA sequences were generated using 27F primer. The resulting 16S rRNA sequences with ≥700 Phred >Q20 bp were aligned in Arb and analyzed as described above. These 575 16S rRNA sequences are available on our lab website at http://gordonlab.wustl.edu/supplemental/Rawls/Cultured_Clone_Seqs_FastA.txt. A subset of these cultured clones were subsequently recovered from glycerol stocks and re-sequenced using both 27F and 1491R primers to confirm their identity and to provide more complete sequence coverage (GenBank accession numbers DQ819371-DQ819377). Functional Genomics
To compare gene expression in zebrafish reared under different conditions, two biological duplicate pools of animals from each group were analyzed. For zebrafish reared in gnotobiotic isolators, digestive tracts were removed en bloc under a dissecting microscope and pooled (n= 10-40/pool). For zebrafish reared in tissue culture flasks, intact larvae were pooled (n= 6-17/pool). Each pooled collection was homogenized by repeated passage through a 20-gauge needle, and total RNA was then extracted (TRIzol reagent; Invitrogen).
To compare gene expression in mice reared under different conditions, 3-5 animals were analyzed per treatment group. Immediately after each animal was killed, its small intestine was removed, divided into 16 equal-size segments, and segment 14 (ileal sample) was taken. The segment was homogenized, and RNA was extracted (Rneasy Miniprep Kit; Qiagen).
The quantity and quality of zebrafish and mouse gut RNA were assessed with a NanoDrop ND-1000 Spectrophotometer (NanoDrop Technologies) and Agilent 2100 Bioanalyzer (Agilent Technologies). RNA preparations were then used as templates for generating cDNAs (Superscript II reverse transcriptase; random primers; Invitrogen).
qRT-PCR assays were performed as described (Rawls et al., 2004), except that each 25µL reaction mixture contained cDNA corresponding to 2ng of total RNA from zebrafish digestive tracts, plus 900 nM gene-specific primers (except zebrafish 18S rRNA-specific control primers which were used at 300 nM) (Table S16). Assays were performed in triplicate using Absolute SYBR Green ROX Mix (ABgene) and a MX3000P QPCR Instrument (Stratagene). Data were normalized to 18S rRNA (∆∆CT analysis).
Whole genome transcriptional profiling was performed using Affymetrix GeneChips. cRNA targets were prepared, and hybridized (40 µg/sample) to 430 v2 mouse GeneChips using established protocols (Hooper et al., 2001). CEL files were normalized using RMA (Bolstad, 2004; http://rmaexpress.bmbolstad.com/), and all probesets with an average intensity across all arrays >50 were analyzed using Significance Analysis of Microarrays software (SAM version 2.21; Tusher et al., 2001). For M-mice vs. GF mice and Z-mice vs. GF mice comparisons, a false-discovery rate of <1% and a post-analysis fold-change cut-off of ≥1.5 were used, and all genes with ≥50% present calls (calculated using Affymetrix Microarray Suite 5.0) across all
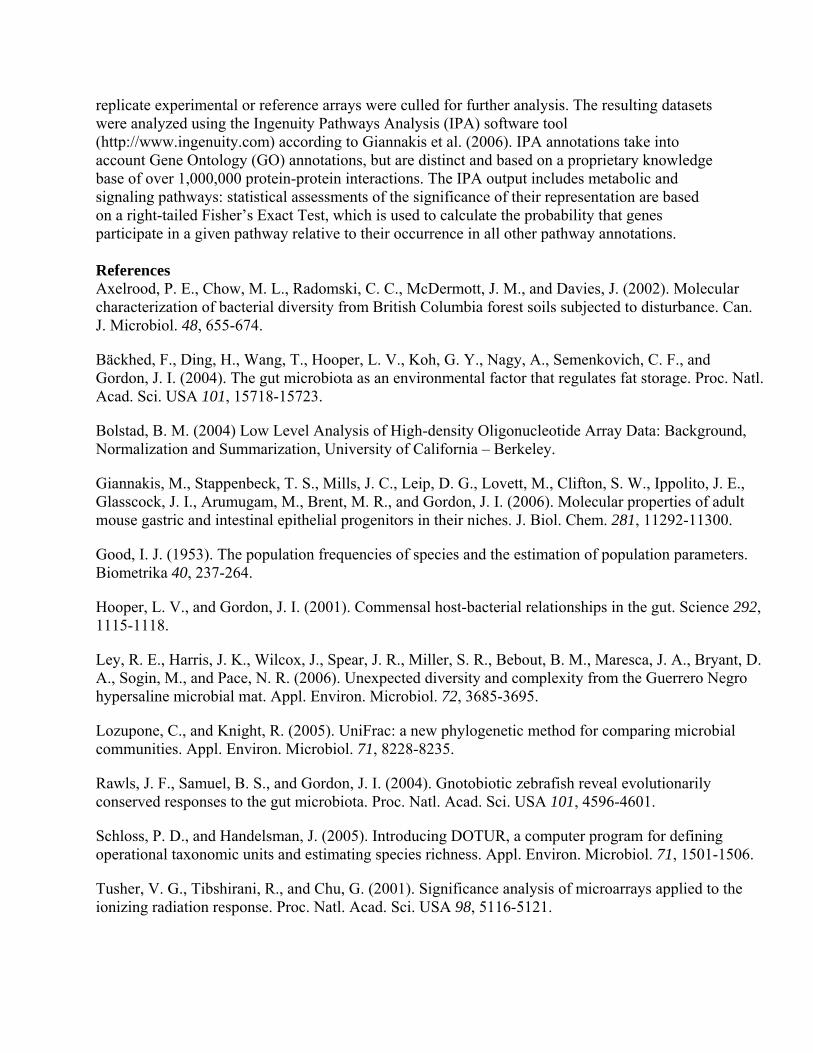
replicate experimental or reference arrays were culled for further analysis. The resulting datasets were analyzed using the Ingenuity Pathways Analysis (IPA) software tool (http://www.ingenuity.com) according to Giannakis et al. (2006). IPA annotations take into account Gene Ontology (GO) annotations, but are distinct and based on a proprietary knowledge base of over 1,000,000 protein-protein interactions. The IPA output includes metabolic and signaling pathways: statistical assessments of the significance of their representation are based on a right-tailed Fisher’s Exact Test, which is used to calculate the probability that genes participate in a given pathway relative to their occurrence in all other pathway annotations. References Axelrood, P. E., Chow, M. L., Radomski, C. C., McDermott, J. M., and Davies, J. (2002). Molecular characterization of bacterial diversity from British Columbia forest soils subjected to disturbance. Can. J. Microbiol. 48, 655-674.
Bäckhed, F., Ding, H., Wang, T., Hooper, L. V., Koh, G. Y., Nagy, A., Semenkovich, C. F., and Gordon, J. I. (2004). The gut microbiota as an environmental factor that regulates fat storage. Proc. Natl. Acad. Sci. USA 101, 15718-15723.
Bolstad, B. M. (2004) Low Level Analysis of High-density Oligonucleotide Array Data: Background, Normalization and Summarization, University of California – Berkeley.
Giannakis, M., Stappenbeck, T. S., Mills, J. C., Leip, D. G., Lovett, M., Clifton, S. W., Ippolito, J. E., Glasscock, J. I., Arumugam, M., Brent, M. R., and Gordon, J. I. (2006). Molecular properties of adult mouse gastric and intestinal epithelial progenitors in their niches. J. Biol. Chem. 281, 11292-11300.
Good, I. J. (1953). The population frequencies of species and the estimation of population parameters. Biometrika 40, 237-264.
Hooper, L. V., and Gordon, J. I. (2001). Commensal host-bacterial relationships in the gut. Science 292, 1115-1118.
Ley, R. E., Harris, J. K., Wilcox, J., Spear, J. R., Miller, S. R., Bebout, B. M., Maresca, J. A., Bryant, D. A., Sogin, M., and Pace, N. R. (2006). Unexpected diversity and complexity from the Guerrero Negro hypersaline microbial mat. Appl. Environ. Microbiol. 72, 3685-3695.
Lozupone, C., and Knight, R. (2005). UniFrac: a new phylogenetic method for comparing microbial communities. Appl. Environ. Microbiol. 71, 8228-8235.
Rawls, J. F., Samuel, B. S., and Gordon, J. I. (2004). Gnotobiotic zebrafish reveal evolutionarily conserved responses to the gut microbiota. Proc. Natl. Acad. Sci. USA 101, 4596-4601.
Schloss, P. D., and Handelsman, J. (2005). Introducing DOTUR, a computer program for defining operational taxonomic units and estimating species richness. Appl. Environ. Microbiol. 71, 1501-1506.
Tusher, V. G., Tibshirani, R., and Chu, G. (2001). Significance analysis of microarrays applied to the ionizing radiation response. Proc. Natl. Acad. Sci. USA 98, 5116-5121.

Figure S1. Flow Chart of Reciprocal Transplantation Experimental Design
The gut microbiota from two independent pools of 9 adult conventionally-raised (CONV-R)
zebrafish were harvested, combined, and used to colonize 6 adult germ-free (GF) mice, yielding
Z-mice. 14 days later, the cecal contents from individual Z-mice were harvested for analysis. The
gut microbiota from 3 adult conventionally-raised mice were harvested and used to colonize 3dpf
germ-free zebrafish, yielding M-zebrafish. 3 or 7 days later, the gut contents from groups of M-
zebrafish were harvested. As indicated, this mouse-into-zebrafish experiment was performed in
duplicate. Culture-independent 16S rRNA libraries generated from these different samples
(Library) are indicated in blue text.

Figure S2. Sample-Based Assessments of Diversity and Coverage in Reciprocal
Transplantation Experiments
The pooled libraries from the intestines of conventionally-raised zebrafish (CONV-R fish;
libraries JFR0503-04), mice colonized with a zebrafish microbiota (Z-mice; libraries JFR0507-
12), conventionally-raised mice (CONV-R mice; JFR0505-06), and zebrafish colonized with a
normal mouse microbiota (M-zebrafish; JFR0513-18) were analyzed using DOTUR (Schloss and
Handelsman, 2005). The phylotype richness for each treatment is expressed as full bias corrected
Chao1 richness estimates (panel A) and abundance-based coverage estimates (ACE; panel C).
The number of observed phylotypes (99%ID) and the number of sequences sampled are shown
as Collector’s curves (panel B) and Rarefaction curves (panel D). The addition of clones along
the X-axis is non-random (ordered by library), producing the variability seen in panels A and C.

Figure S3. qRT-PCR Assays of the Responses of Germ-free Zebrafish to Colonization with
Individual Culturable Members of the Zebrafish and Mouse Gut Microbiota
Expression levels of complement factor b (bf) and hydroxyacylCoA dehydrogenase/3-
ketoacylCoA thiolase/enoyl CoA hydratase (hadha) were assessed using RNA extracted from the
pooled digestive tracts of 6dpf zebrafish inoculated since 3dpf with a CONV-R zebrafish
microbiota (Z-zebrafish), a CONV-R mouse microbiota (M-zebrafish), a consortium of 7
primary isolates (Consortium), a primary Enterococcus isolate (M2E1F06), a primary
Staphylococcus isolate (M2E1A04), a primary Citrobacter isolate (T1E1C07), a primary
Aeromonas isolate (T1E1A06), a primary Plesiomonas isolate (T1N1D03), a primary
Shewanella isolate (T1E1C05), a primary Escherichia isolate (M1N2G03), an Escherichia coli
type strain (MG1655), an Aeromonas hydrophila type strain (A.hydrophila ATCC35654), or a
Pseudomonas aeruginosa type strain (PAO1). Data from biological duplicate pools (≥10 animals

per pool) were normalized to 18S rRNA levels and results are expressed as mean fold-change
compared to GF controls ± SEM. ***, P<0.0001; **, P<0.001; *, P<0.05.

Figure S4. The Epidermal Degeneration Phenotype in Fed GF Zebrafish Is Ameliorated
with Different Treatments
(A) Caudal region of a live 9dpf GF zebrafish, fed since 3dpf, displays loss of the transparency
and integrity of the fin fold epidermis (white arrowheads; Rawls et al., 2004). (B) Age-matched
fed GF zebrafish raised since 3dpf in the presence of activated carbon and ammonia-removing
cation exchange resin (GF+carbon). The result is improved epidermal transparency and integrity
(black arrowheads). GF zebrafish can survive under these conditions beyond 30dpf (data not
shown). (C) 9dpf zebrafish colonized since 3dpf with Pseudomonas aeruginosa PAO1 (P.
aeruginosa PAO1) do not develop the epidermal phenotype, as indicated by the healthy
transparent fin fold epithelium (black arrowheads). (D) In contrast, 9dpf larvae colonized since
3dpf with a primary Enterococcus isolate (M2E1F06) display a phenotype similar to GF controls
(white arrowheads). Scale bar: 500µm.

Figure S5. Zebrafish Host Responses to the Gut Microbiota Are Attenuated in the Absence
of an Exogenous Nutrient Supply
6dpf zebrafish that were either germ-free (GF) or colonized since 3dpf with a CONV-R zebrafish
microbiota (Z-zebrafish) and fed an autoclaved diet beginning at 3dpf (Fed) were compared with
GF and Z-zebrafish siblings deprived of all food (Fasted). Expression levels of myeloperoxidase
(mpo), proliferating cell nuclear antigen (pcna), and fasting-induced adipose factor (fiaf) were
assessed by qRT-PCR using RNA extracted from the pooled digestive tracts of 6dpf zebrafish.
Data from biological duplicate pools (≥10 animals per pool) were normalized to 18S rRNA
levels and the results are expressed as mean fold-change compared to fed GF controls ± SEM.
Note that nutrient (fiaf), innate immune (mpo) and proliferative responses (pcna) to colonization
are markedly attenuated in fasted animals. Similar fiaf results were obtained in fed and fasted
6dpf zebrafish colonized with either P. aeruginosa PAO1 or A. hydrophila ATCC35654 since
3dpf (data not shown). Importantly, fasting did not produce a statistically significant reduction in
gut microbial density in any of the colonization groups (data not shown). The sensitivity of 6dpf
zebrafish to the presence of an exogenous nutrient supply was unanticipated: at this age,
zebrafish have been consuming food for only 1-2 days; moreover, many 6dpf zebrafish have not

completed yolk resorption and, therefore, are presumably still utilizing this endogenous food
source. ***, P<0.0001; **, P<0.001; *, P<0.05.

251
APPENDIX C
John F. Rawls, Michael A. Mahowald, Andrew L. Goodman, Chad M. Trent, and Jeffrey
I. Gordon
In.vivo imaging and genetic analysis link bacterial motility and symbiosis in the ze-
brafish gut
Proc Natl Acad Sci U S A. 2007 May 1;104(18):7622-7.
For supplemental movies please see enclosed CD.

In vivo imaging and genetic analysis link bacterialmotility and symbiosis in the zebrafish gutJohn F. Rawls*†‡, Michael A. Mahowald*, Andrew L. Goodman*, Chad M. Trent†, and Jeffrey I. Gordon*‡
*Center for Genome Sciences, Washington University School of Medicine, St. Louis, MO 63108; and †Department of Cell and Molecular Physiology,University of North Carolina, Chapel Hill, NC 27599
Contributed by Jeffrey I. Gordon, March 14, 2007 (sent for review January 26, 2007)
Complex microbial communities reside within the intestines of hu-mans and other vertebrates. Remarkably little is known about howthese microbial consortia are established in various locations withinthe gut, how members of these consortia behave within their dy-namic ecosystems, or what microbial factors mediate mutually ben-eficial host–microbial interactions. Using a gnotobiotic zebrafish–Pseudomonas aeruginosa model, we show that the transparency ofthis vertebrate species, coupled with methods for raising theseanimals under germ-free conditions can be used to monitor microbialmovement and localization within the intestine in vivo and in realtime. Germ-free zebrafish colonized with isogenic P. aeruginosastrains containing deletions of genes related to motility and patho-genesis revealed that loss of flagellar function results in attenuationof evolutionarily conserved host innate immune responses but notconserved nutrient responses. These results demonstrate the utility ofgnotobiotic zebrafish in defining the behavior and localization ofbacteria within the living vertebrate gut, identifying bacterial genesthat affect these processes, and assessing the impact of these geneson host–microbial interactions.
Danio rerio � establishment of a gut microbiota � flagellar motility �host–microbial symbiosis and mutualism � Pseudomonas aeruginosa
S tarting at birth, we are colonized by communities of micro-organisms that establish residency on our external and
internal surfaces. These resident microbes outnumber our hu-man cells by an order of magnitude, and their aggregate genomes(microbiome) specify important physiologic traits that are notencoded in our own genome (1). The vast majority of thesemicrobes reside in our intestine: most of our 10–100 trilliongut-dwelling microbes belong to the domain Bacteria, althoughmembers of Archaea (Euryachaeota and Crenarchaeota) andEukarya are also represented (2–6). Over the last 50 years,experiments comparing mice and rats raised in the absence ofany microorganisms [germ-free (GF)] to those colonized withmembers of gut microbial communities have revealed that themicrobiota plays an integral role in many aspects of intestinal andextraintestinal host biology, ranging from postnatal developmentof the gut’s blood and lymphatic vascular systems (7, 8) to theproliferative activity of intestinal epithelial cells (9, 10), metab-olism of ingested xenobiotics (1, 11), regulation of energybalance (12–14), maturation of the innate and adaptive immunesystems (15–18), heart size (19), and behavior (e.g., locomotoractivity) (14).
The notion that each of us is a supraorganism, composed ofmicrobial and human parts, focuses attention on the question ofhow our microbial communities are assembled (20). Under-standing the dynamic patterns of microbial entry into andmovement within their gut habitats is critical for decipheringhow different species establish and maintain a presence in theintestinal ecosystem, and how they interact with their host andother microbial community members. Fluorescence in situ hy-bridization and confocal and electron microscopic analyses haveprovided static rather than dynamic views of the positioning ofmicrobial cells within the mammalian intestine, and in vivo
bioluminescence analyses do not permit resolution of individualmicrobial cells.
The zebrafish (Danio rerio) possesses several key attributesthat make it a distinctively powerful model organism for ad-dressing these questions. First, the zebrafish digestive tract isstructurally similar to that of mammals, with proximal-distalspecification of functions and multiple self-renewing epithelialcell lineages (21, 22). Second, comparisons of GF zebrafish andthose colonized with a microbiota harvested from the intestinesof conventionally raised (CONV-R) zebrafish or mice haverevealed a broad range of host processes that are impacted by thegut microbiota and that are conserved between mammals andfish (23–25). Moreover, individual bacterial representatives ofthe zebrafish and mouse gut microbiotas have been identifiedthat can provoke evolutionarily conserved host responses ingnotobiotic zebrafish (23–25). Third, this vertebrate species andits gut are optically transparent from the time of fertilizationthrough the onset of adulthood. This unusual feature provides anopportunity to make real-time in vivo observations of microbial–microbial and microbial–host interactions. Because zebrafishlarvae can be grown in a 96-well plate format, their transparencycould also be used to conduct genetic and chemical screens forhost and/or microbial factors that mediate host–microbial inter-actions. Finally, with the development of methods for rearingzebrafish under GF conditions, reciprocal transplantations ofgut communities from normal mouse and zebrafish donors intoGF zebrafish and mouse recipients have revealed that differ-ences in the normal gut communities of these vertebrates arisein part from distinct selective pressures imposed within theirrespective gut habitats. These experiments also revealed astriking degree of conservation of host responses to the differentmicrobiotas (24).
We have used a simplified system, consisting of GF zebrafishcolonized with the Gram-negative �-proteobacterium Pseudo-monas aeruginosa, to define the mechanisms by which mem-bers of the microbiota elicit these conserved host responses. P.aeruginosa is best known as an opportunistic pathogen. How-ever, it has several characteristics that facilitate its use as amodel mutualist in this system. Pseudomonads are commonmembers of the fish gut microbiota (23–28) as well as the gutmicrobiota of some mammals (e.g., the African zebra andothers; R. E. Ley and J.I.G, unpublished observations) [see
Author contributions: J.F.R., M.A.M., and J.I.G. designed research; J.F.R., M.A.M., and C.M.T.performed research; J.F.R., M.A.M., A.L.G., and J.I.G. analyzed data; and J.F.R., M.A.M.,A.L.G., and J.I.G. wrote the paper.
The authors declare no conflict of interest.
Freely available online through the PNAS open access option.
Abbreviations: GF, germ-free; CONV-R, conventionally raised; dpf, days postfertilization;CONVD, conventionalized; GZM, gnotobiotic zebrafish medium; TEM, transmission elec-tron microscopy; TTSS, Type III secretion system; qRT-PCR, quantitative RT-PCR.
‡To whom correspondence may be addressed. E-mail: [email protected] [email protected].
This article contains supporting information online at www.pnas.org/cgi/content/full/0702386104/DC1.
© 2007 by The National Academy of Sciences of the USA
7622–7627 � PNAS � May 1, 2007 � vol. 104 � no. 18 www.pnas.org�cgi�doi�10.1073�pnas.0702386104

supporting information (SI) Materials and Methods and Fig. 4for a 16S rRNA sequence-based tree of zebrafish Pseudo-monads and their relationship to P. aeruginosa]. AlthoughPseudomonads are rare members of the intestinal microbiotaof healthy humans, their representation is increased in certainpathologic states, notably inf lammatory bowel diseases (29–31). In an initial survey, 10 different bacterial species repre-sentative of the zebrafish or mouse gut microbiota were testedfor their ability to elicit the innate immune and nutrientmetabolic responses produced when a complete microbiota isintroduced into GF zebrafish hosts. In this survey, P. aerugi-nosa was the most potent inducer of these responses (24) (seeSI Fig. 5). Finally, in addition to the large body of knowledgethat exists about P. aeruginosa biology, valuable genetic re-sources are available, including a finished genome sequencefor strain PAO1 (32), deep draft genome assemblies for severalother strains (PA14, C3719, 2192, PA7, and PACS2), andsaturation-level sequenced transposon insertion libraries forstrains PAO1 (33) and PA14 (34).
In the present study, we take advantage of the transparency ofzebrafish and these genetic resources to demonstrate a linkagebetween motility/f lagellar function and regulation of conservedinnate immune responses.
ResultsReal-Time in Vivo Imaging of Microbial Consortia and IndividualBacterial Species in the Transparent Intestine of Gnotobiotic Ze-brafish. As noted above, the transparency of the zebrafishprovides opportunities for exploring the movement as well aslocalization of microbes within their intestinal habitat throughreal-time microscopy of live whole-mount zebrafish. CONV-Rzebrafish typically hatch from the GF environment within their
protective chorions at 3 days postfertilization (dpf). This hatch-ing event coincides with the anterior digestive tract achieving fullpatency (21, 35). Fluorescence in situ hybridization has revealedthat the zebrafish digestive tract is colonized by bacteria as earlyas 4 dpf (25); however, the timing and route of initial coloniza-tion remained unclear.
Therefore, we first colonized GF zebrafish at 3 dpf with anormal zebrafish microbiota harvested from adult CONV-Rzebrafish (a process called conventionalization) and then imagedtheir digestive tracts at different time points. In vivo bright-fieldmicroscopy of the gut microbiota in these conventionalized(CONVD) animals revealed a striking amount of microbialmovement within their intestinal lumen (SI Movies 1 and 2),although the activity of individual microorganisms was difficultto monitor.
Upon exposure to P. aeruginosa, 3-dpf GF zebrafish arecolonized at densities similar to the conventional zebrafish gutmicrobiota (104-105 cfu per gut at 6 dpf; SI Table 1) and elicithost responses that are conserved across vertebrate hosts (seebelow and ref. 24). To facilitate real-time in vivo microscopicobservation of individual microbial cells, we introduced a plas-mid that allows constitutive expression of the gene encodingGFP under the control of the trc promoter (pMF230) (36) intoP. aeruginosa strain PAO1 to create PAO1 pMF230. GF 3-dpfzebrafish exposed to 104 cfu of P. aeruginosa PAO1 pMF230/mlgnotobiotic zebrafish medium (GZM) were initially colonizedwith a small cohort of bacteria that was readily seen as early as3.5 dpf (Fig. 1 A and D and SI Movie 3). Because the anus doesnot achieve patency until �4 dpf (21, 35), our findings establishthat the anterior digestive tract becomes colonized within just afew hours after its lumen first opens.
The size of this monocomponent community increased rapidly
A B C
D E F
Fig. 1. Gut bacteria display diverse behaviors within the intestines of gnotobiotic zebrafish. (A and D) Whole-mount preparation of a live 3.5-dpf zebrafishcolonized since 3 dpf with GFP-expressing P. aeruginosa PAO1 (PAO1 pMF230) demonstrates the transparency of the developing zebrafish intestine. Brightfieldmicroscopy of the anterior intestine (segment 1, A) shows the intestinal lumen (lum) and the adjacent intestinal epithelium (ep). Fluorescence time-lapsemicroscopy of the same field (D) shows the movements of individual bacteria over the course of 10 frames, or 4 sec (D extracted from SI Movie 3). The locationsof individual bacteria in the first (1) and the last (10) frames are numbered accordingly. (B and E) Brightfield (B) and fluorescence time-lapse (E) microscopy ofthe same field from a live 6-dpf zebrafish, colonized since 3 dpf with PAO1 pMF230, shows increasing bacterial density and behavioral complexity in themidintestine (junction of segments 1 and 2) over the course of 10 frames or 2.6 sec (E extracted from SI Movie 4). Note that the intestines shown in D and E bothcontain bacteria that are nonmotile in association with the host epithelium or luminal contents (yellow), whereas other bacteria exhibit high rates of motilityin both ascending (distal to proximal; red tracks) and descending (green tracks) directions. Note that ascending and descending bacteria were tracked for onlythe first several frames because they quickly moved out of the focal plane; the first and last frames over which bacteria were tracked are numbered. (C and F)Brightfield (C) and fluorescence time-lapse (F) microscopy of a live 4.5-dpf zebrafish colonized since 3 dpf with DsRed-expressing E. coli MG1655 (MG1655 pRZT3)showing movement of luminal bacteria (green tracks) in the midintestine (segment 1). Over the course of 14 frames or 14 sec (F extracted from SI Movie 5), somebacteria appear adherent to the epithelium or luminal structures (yellow track), whereas most bacterial motion is synchronous and attributed to intestinalmotility (green tracks). Anterior is to the left, and dorsal is to the top in all images. (Scale bars: 20 �m.)
Rawls et al. PNAS � May 1, 2007 � vol. 104 � no. 18 � 7623
MIC
ROBI
OLO
GY
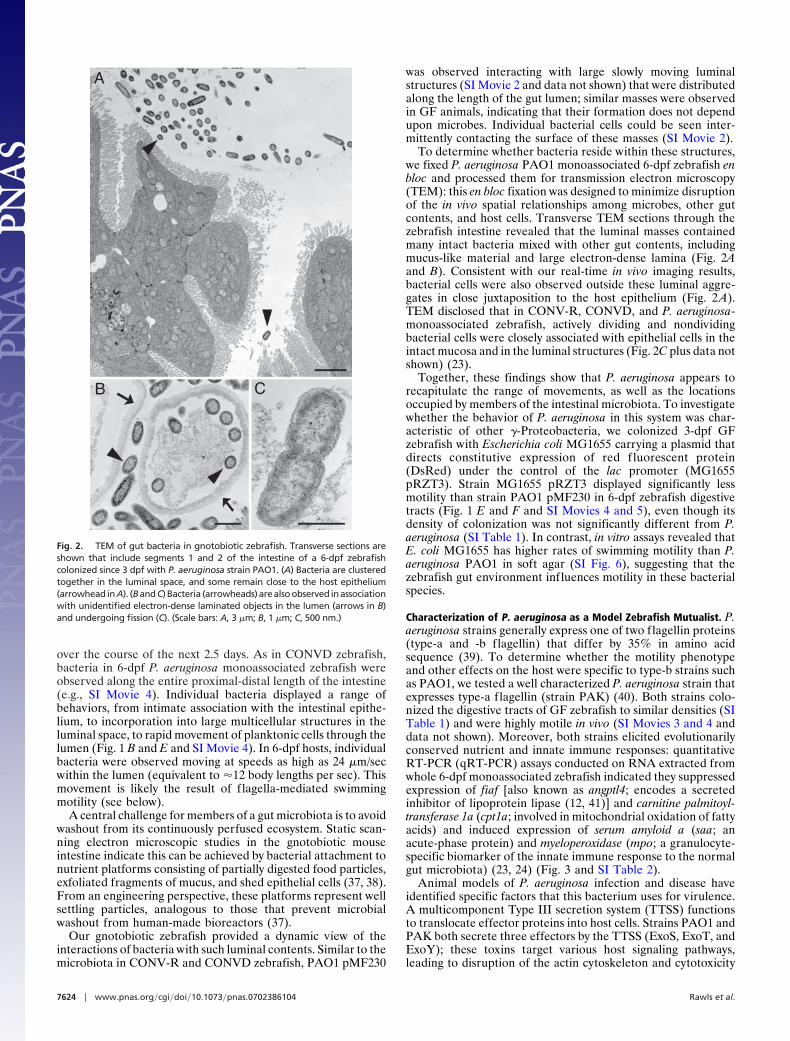
over the course of the next 2.5 days. As in CONVD zebrafish,bacteria in 6-dpf P. aeruginosa monoassociated zebrafish wereobserved along the entire proximal-distal length of the intestine(e.g., SI Movie 4). Individual bacteria displayed a range ofbehaviors, from intimate association with the intestinal epithe-lium, to incorporation into large multicellular structures in theluminal space, to rapid movement of planktonic cells through thelumen (Fig. 1 B and E and SI Movie 4). In 6-dpf hosts, individualbacteria were observed moving at speeds as high as 24 �m/secwithin the lumen (equivalent to �12 body lengths per sec). Thismovement is likely the result of f lagella-mediated swimmingmotility (see below).
A central challenge for members of a gut microbiota is to avoidwashout from its continuously perfused ecosystem. Static scan-ning electron microscopic studies in the gnotobiotic mouseintestine indicate this can be achieved by bacterial attachment tonutrient platforms consisting of partially digested food particles,exfoliated fragments of mucus, and shed epithelial cells (37, 38).From an engineering perspective, these platforms represent wellsettling particles, analogous to those that prevent microbialwashout from human-made bioreactors (37).
Our gnotobiotic zebrafish provided a dynamic view of theinteractions of bacteria with such luminal contents. Similar to themicrobiota in CONV-R and CONVD zebrafish, PAO1 pMF230
was observed interacting with large slowly moving luminalstructures (SI Movie 2 and data not shown) that were distributedalong the length of the gut lumen; similar masses were observedin GF animals, indicating that their formation does not dependupon microbes. Individual bacterial cells could be seen inter-mittently contacting the surface of these masses (SI Movie 2).
To determine whether bacteria reside within these structures,we fixed P. aeruginosa PAO1 monoassociated 6-dpf zebrafish enbloc and processed them for transmission electron microscopy(TEM): this en bloc fixation was designed to minimize disruptionof the in vivo spatial relationships among microbes, other gutcontents, and host cells. Transverse TEM sections through thezebrafish intestine revealed that the luminal masses containedmany intact bacteria mixed with other gut contents, includingmucus-like material and large electron-dense lamina (Fig. 2Aand B). Consistent with our real-time in vivo imaging results,bacterial cells were also observed outside these luminal aggre-gates in close juxtaposition to the host epithelium (Fig. 2A).TEM disclosed that in CONV-R, CONVD, and P. aeruginosa-monoassociated zebrafish, actively dividing and nondividingbacterial cells were closely associated with epithelial cells in theintact mucosa and in the luminal structures (Fig. 2C plus data notshown) (23).
Together, these findings show that P. aeruginosa appears torecapitulate the range of movements, as well as the locationsoccupied by members of the intestinal microbiota. To investigatewhether the behavior of P. aeruginosa in this system was char-acteristic of other �-Proteobacteria, we colonized 3-dpf GFzebrafish with Escherichia coli MG1655 carrying a plasmid thatdirects constitutive expression of red f luorescent protein(DsRed) under the control of the lac promoter (MG1655pRZT3). Strain MG1655 pRZT3 displayed significantly lessmotility than strain PAO1 pMF230 in 6-dpf zebrafish digestivetracts (Fig. 1 E and F and SI Movies 4 and 5), even though itsdensity of colonization was not significantly different from P.aeruginosa (SI Table 1). In contrast, in vitro assays revealed thatE. coli MG1655 has higher rates of swimming motility than P.aeruginosa PAO1 in soft agar (SI Fig. 6), suggesting that thezebrafish gut environment influences motility in these bacterialspecies.
Characterization of P. aeruginosa as a Model Zebrafish Mutualist. P.aeruginosa strains generally express one of two flagellin proteins(type-a and -b flagellin) that differ by 35% in amino acidsequence (39). To determine whether the motility phenotypeand other effects on the host were specific to type-b strains suchas PAO1, we tested a well characterized P. aeruginosa strain thatexpresses type-a flagellin (strain PAK) (40). Both strains colo-nized the digestive tracts of GF zebrafish to similar densities (SITable 1) and were highly motile in vivo (SI Movies 3 and 4 anddata not shown). Moreover, both strains elicited evolutionarilyconserved nutrient and innate immune responses: quantitativeRT-PCR (qRT-PCR) assays conducted on RNA extracted fromwhole 6-dpf monoassociated zebrafish indicated they suppressedexpression of fiaf [also known as angptl4; encodes a secretedinhibitor of lipoprotein lipase (12, 41)] and carnitine palmitoyl-transferase 1a (cpt1a; involved in mitochondrial oxidation of fattyacids) and induced expression of serum amyloid a (saa; anacute-phase protein) and myeloperoxidase (mpo; a granulocyte-specific biomarker of the innate immune response to the normalgut microbiota) (23, 24) (Fig. 3 and SI Table 2).
Animal models of P. aeruginosa infection and disease haveidentified specific factors that this bacterium uses for virulence.A multicomponent Type III secretion system (TTSS) functionsto translocate effector proteins into host cells. Strains PAO1 andPAK both secrete three effectors by the TTSS (ExoS, ExoT, andExoY); these toxins target various host signaling pathways,leading to disruption of the actin cytoskeleton and cytotoxicity
B
A
C
Fig. 2. TEM of gut bacteria in gnotobiotic zebrafish. Transverse sections areshown that include segments 1 and 2 of the intestine of a 6-dpf zebrafishcolonized since 3 dpf with P. aeruginosa strain PAO1. (A) Bacteria are clusteredtogether in the luminal space, and some remain close to the host epithelium(arrowhead inA). (BandC)Bacteria (arrowheads)arealsoobserved inassociationwith unidentified electron-dense laminated objects in the lumen (arrows in B)and undergoing fission (C). (Scale bars: A, 3 �m; B, 1 �m; C, 500 nm.)
7624 � www.pnas.org�cgi�doi�10.1073�pnas.0702386104 Rawls et al.

(42). The TTSS is required for colonization and virulence in arange of mouse models of infection (43–45).
To test whether these gene products play a role in P. aeruginosacolonization of the zebrafish gut, we exposed GF 3-dpf zebrafishto the PAK strain carrying a deletion for the TTSS mastertranscriptional regulator exsA (46). In many of the pathogenesismodels of P. aeruginosa infection, this mutant exhibits decreasedvirulence and colonization (43, 47, 48). In contrast, the wild-typeand exsA mutant strains achieved comparable densities of col-onization within the intestines of 6-dpf zebrafish (SI Table 1),indicating that the TTSS and its secreted toxins are not essentialfor colonization. In addition, qRT-PCR analysis showed that theexsA mutant strain was capable of regulating expression of fiaf,cpt1a, saa, and mpo in a manner that was not significantlydifferent from its wild-type parent strain (Fig. 3).
P. aeruginosa uses the RetS hybrid two-component system tocoordinately activate TTSS expression and repress exopolysac-charide production (49). Similar to exsA mutants, deletion of retSleads to loss of the TTSS. In addition, these mutants overproduceexopolysaccharides implicated in biofilm formation (49). Toascertain whether overproduction of these exopolysaccharidesinfluenced P. aeruginosa–zebrafish interactions, we introducedan isogenic PAK retS mutant strain into 3-dpf GF hosts. As withthe TTSS mutant, neither colonization density nor the responseof host innate immune and nutrient biomarker genes differedbetween the mutant and wild-type strains when measured at 6dpf (Fig. 3 and SI Table 1).
P. aeruginosa utilizes several surface appendages for coloni-zation and virulence, including a single polar flagellum and TypeIV pili. To test the role of bacterial movement on host responses,we examined isogenic PAK strains with loss-of-function muta-tions in fliC and pilA (40, 50). The flagellar apparatus of P.aeruginosa is assembled through an intricate regulatory process,concluding with synthesis and assembly of FliC protein into theflagellar filament (40, 51). Transmembrane ion gradients pro-vide energy for physical rotation of the filament by the flagellar
motor (51). The motor consists of two structures: the rotor (theswitch that determines direction of rotation) and the stator (thestationary component through which the rotor turns). BecauseFliC is the major structural component of the flagellar filament,the fliC mutant fails to assemble an intact f lagellar filament (40,51, 52). The pilA mutant, which is missing the major pilinstructural subunit, does not exhibit pili-dependent twitching orswarming motility (53).
Both mutants achieved a normal density of colonization in thezebrafish gut (SI Table 1). However, the fliC strain did not show thehighly motile phenotype characteristic of wild-type P. aeruginosa inthis habitat or in vitro (SI Fig. 6 and data not shown), suggesting thatswimming motility is a primary method of locomotion in vivo.qRT-PCR assays revealed that, like wild-type P. aeruginosa, the fliCand pilA mutants were able to suppress expression of the nutrientmetabolic biomarkers fiaf and cpt1a in 6-dpf larvae (Fig. 3). Unlikethe wild-type or three other mutant strains, fliC-deficient bacteriafailed to elicit a significant increase in expression of innate immuneresponse biomarkers saa or mpo (reference controls, GF 6-dpfanimals; Fig. 3).
The attenuated host immune responses to fliC mutants couldbe caused by absence of FliC protein, the absence of an intactf lagellar filament, and/or the absence of flagellar function. Tohelp distinguish among these possibilities, we colonized 3-dpfGF zebrafish with a P. aeruginosa PAK strain that carriesdeletions of the motAB and motCD genes (�motABCD), encod-ing the bacterium’s two flagellar stators. PAK motABCD mu-tants assemble an intact f lagellar filament that contains the FliCprotein, but the assembled filament is nonmotile (SI Fig. 6)because of a failure of filament rotation (54, 55). As with the fliCmutant, we found that the motABCD mutant was able to colonize6-dpf zebrafish at densities comparable to the isogenic wild-typestrain (SI Table 1) and to recapitulate its elicited nutrientresponses: thus, f lagellar motility is not required for these hostreactions to colonization (Fig. 3). Also similar to fliC mutants,innate immune responses to motABCD mutants in 6-dpf ze-brafish larvae were significantly attenuated (Fig. 3). Therefore,the ability of P. aeruginosa to evoke these conserved innateimmune responses to a complete gut microbiota is due in part toflagellar function, rather than exclusively to the presence of anintact f lagellar filament and its component proteins such as FliC.
DiscussionFor P. aeruginosa and other bacteria, flagella perform severalnonexclusive functions that can impact bacterial colonization andhost responses in the digestive tract. First, flagella mediate swim-ming motility that can facilitate interactions with and invasion ofhost cells (56), as well as chemotaxis toward preferred habitats andnutrient sources (57) [e.g., studies of V. cholerae mutants indicatebacterial motility and chemotaxis are important virulence deter-minants in the (mouse) intestine (58)]. Second, flagella can act asadhesins that bind bacteria to host epithelial cells independent oftheir role in motility (59, 60). Third, flagella can serve as a secretionapparatus for virulence factors (61, 62), a role that may be playedby P. aeruginosa flagella (63). Finally, flagellin can serve as a majorimmunostimulatory antigen recognized by Toll-like receptor 5(TLR5) homologs in both fish and mammals (64–66). Activation ofmammalian TLR5 triggers NF-�B-dependent proinflammatorysignaling pathways that stimulate production of acute-phase pro-teins and neutrophil chemoattractants (67, 68). P. aeruginosa fla-gella can also bind the glycolipid asialoGM1, leading to TLR2-dependent activation of similar signaling pathways (69). Recentstudies have revealed that flagellin from other bacterial species canalso be detected by TLR5-independent mechanisms (70).
Our observations suggest that flagellar function, including theswimming motility observed by real-time in vivo microscopy, isan important component of host–bacterial interaction in thissystem. We hypothesize that flagella-dependent swimming mo-
0
20
40
60
80
100
120
140
160
saa
***
** *****
mpo fiaf cpt1a
% c
han
ge
of
mR
NA
leve
l rel
ativ
e to
PA
K w
ild-t
ype
PAK wild-typePAK ∆exsAPAK ∆retSPAK ∆pilAPAK ∆fliCPAK ∆motABCD
Fig. 3. The impact of P. aeruginosa flagellar mutants on host responses ingnotobiotic zebrafish. Expression levels of serum amyloid a (saa), myeloperoxi-dase (mpo), fasting-induced adipose factor (fiaf ), and carnitine palmitoyltrans-ferase 1a (cpt1a) were assessed by qRT-PCR by using RNA extracted from whole6-dpf larvae colonized since 3 dpf with P. aeruginosa PAK wild-type strain, PAKexsA deletion mutant (PAK �exsA), PAK retS deletion mutant (PAK �retS), PAKpilA deletion mutant (PAK �pilA), PAK fliC deletion mutant (PAK �fliC), or PAKmotABCD deletion mutant (PAK �motABCD). Data from biological duplicatepools (6–17 animals per pool) were normalized to 18S rRNA levels. NormalizedmRNA levels in colonized fish were referenced against age-matched GF controls(��Ct method), and the results are expressed as mean percent change relative tothe PAK wild-type strain � SEM. ***, P � 0.0001; **, P � 0.001 compared withwild-type, based on a two-tailed Student’s t test.
.
Rawls et al. PNAS � May 1, 2007 � vol. 104 � no. 18 � 7625
MIC
ROBI
OLO
GY

tility promotes physical interaction between P. aeruginosa andthe host epithelium, where the presence of surface-attachedantigens (including the flagellum itself) and other bacterialproducts can be monitored by the host. Although it remainspossible that flagella-dependent immune responses are ulti-mately stimulated by FliC acting as an antigen, the attenuatedimmune response to the flagellated but nonmotile motABCDmutant shows that flagella motor function is required for thisprocess to occur. These observations set the stage for futureexperiments that further dissect how dynamic interactions be-tween P. aeruginosa and the gut epithelium mediate the observedflagellar-motility-dependent host response in zebrafish.
Our results demonstrate the utility of using gnotobiotic ze-brafish for defining and monitoring microbial behavior andlocalization within the living vertebrate gut and for identifyingbacterial genes that affect host–microbial interactions. As such,this genetically pliable host provides an opportunity to explorehow habitat influences the establishment of a microbiota, andhow microbial dynamics in vivo affect host biology. Although P.aeruginosa is often used as a model opportunistic pathogen, ourstudy indicates that it can also serve as a model mutualist,capable of colonizing the gut of gnotobiotic zebrafish andeliciting nutrient metabolic and innate immune responses thathave been conserved during the �400 million years since fish andmammals diverged from their last common ancestor. The com-bined advantages of P. aeruginosa (genome sequence, saturation-level insertion libraries, and genetic tools) and gnotobioticzebrafish (conservation of metabolic and immune responses toa microbiota with mammals, amenability to high-throughputgenetic and chemical screens and the ability to directly observethe gut and its microbial inhabitants in a living vertebrate) offeran opportunity to systematically decipher the foundations ofhost–microbial mutualism in the gut and perhaps to apply thefindings to our own species.
Materials and MethodsAnimal Husbandry. All experiments using zebrafish were per-formed by using protocols approved by the Animal StudiesCommittees of Washington University and the University ofNorth Carolina at Chapel Hill.
Zebrafish gametes were expressed manually from CONV-Radults (C32 inbred strain), fertilized in vitro, and embryosderived as GF according to established protocols (23). GFzebrafish were reared under a 14-h light cycle in sterile ventedtissue culture flasks (Becton Dickinson, Sparks, MD) at anaverage density of 1.3 individuals per milliliter of GZM (GZM
components are defined in ref. 23). Animals were maintained at28.5°C in an air incubator. Fish were fed daily beginning at 3 dpfwith a sterilized solution containing 0.1 mg of ZM000 fish food(ZM Ltd., Winchester, United Kingdom) per milliliter of GZM.A 90% water change was performed before each daily feeding,starting at 3 dpf. GF zebrafish were monitored routinely forsterility by using culture-based methods (23).
Colonization and in Vivo Imaging. At the time of hatching at 3 dpf,we exposed GF zebrafish reared in sterile vented tissue cultureflasks to (i) an unfractionated gut microbiota harvested directlyfrom CONV-R adult C32 donors, (ii) P. aeruginosa PA01containing pMF230 [harbors GFP under the control of a con-stitutive trc promoter (36); supplied by Michael Franklin, Mon-tana State University, Bozeman, MT], (iii) E. coli MG1655containing pRZT3 (DsRed under the control of a constitutivelac promoter; a gift from Wilbert Bitter, Vrije University Med-ical Centre, Vrije, The Netherlands), (iv) wild-type P. aeruginosaPAK or the isogenic �fliC strain carrying pSMC21 [a derivativeof pSMC2 (71), harboring GFP under the control of a consti-tutive lac promoter; provided by Matthew Wolfgang, Universityof North Carolina, Chapel Hill], or (v) isogenic wild-type ormutant P. aeruginosa PAK strains without plasmids (supplied byMatthew Wolfgang and Reuben Ramphal, University of Florida,Gainesville, FL; plus Stephen Lory, Harvard University, Boston,MA). Bacterial strains were grown overnight at 37°C in Luria–Bertani broth before inoculation. Microbes were introduced ata density of 104 cfu/ml GZM. A complete list of bacterial strainsand plasmids used can be found in SI Table 1.
Monoassociated and age-matched CONVD zebrafish wereimaged at various times after exposure to bacteria by using thefollowing protocol. Animals were anesthetized in 0.2 mg/mlTricaine (Sigma, St. Louis, MO), placed on a 40 � 22-mm glasscoverslip, and imbedded in low-melting-point 1% NuSieve GTGagarose (FMC Bioproducts, Philadelphia, PA) containing 0.2mg/ml Tricaine anesthetic. After the agarose quickly solidified,animals were viewed by using an Axiovert 200M invertedfluorescence microscope and Axiovision 4.1 software (Zeiss,Thornwood, NY).
We are grateful to Edward Flynn for zebrafish husbandry; to Jaime Dantand Howard Wynder for help with TEM; to Adam Schreck for videoediting; and to Fredrik Backhed, Eric Martens, Justin Sonnenburg, andMatthew Wolfgang for helpful suggestions. This work was supported inpart by the Ellison Medical Foundation, the W. M. Keck Foundation, andNational Institutes of Health Grants DK30292, DK62675, and DK73695.
1. Gill SR, Pop M, Deboy RT, Eckburg PB, Turnbaugh PJ, Samuel BS, GordonJI, Relman DA, Fraser-Liggett CM, Nelson KE (2006) Science 312:1355–1359.
2. Miller TL, Wolin MJ (1986) Syst Appl Microbiol 7:223–229.3. Rieu-Lesme F, Delbes C, Sollelis L (2005) Curr Microbiol 51:317–321.4. Eckburg PB, Bik EM, Bernstein CN, Purdom E, Dethlefsen L, Sargent M, Gill
SR, Nelson KE, Relman DA (2005) Science 308:1635–1638.5. Fricke WF, Seedorf H, Henne A, Kruer M, Liesegang H, Hedderich R,
Gottschalk G, Thauer RK (2006) J Bacteriol 188:642–658.6. Ley RE, Turnbaugh PJ, Klein S, Gordon JI (2006) Nature 444:1022–1023.7. Stappenbeck TS, Hooper LV, Gordon JI (2002) Proc Natl Acad Sci USA
99:15451–15455.8. Backhed F, Crawford PA, O’Donnell D, Gordon JI (2007) Proc Natl Acad Sci
USA 104:606–611.9. Lesher S, Walburg HE, Jr, Sacher GA, Jr (1964) Nature 202:884–886.
10. Khoury KA, Floch MH, Hersh T (1969) J Exp Med 130:659–670.11. Dumas ME, Barton RH, Toye A, Cloarec O, Blancher C, Rothwell A,
Fearnside J, Tatoud R, Blanc V, Lindon JC, et al. (2006) Proc Natl Acad SciUSA 103:12511–12516.
12. Backhed F, Ding H, Wang T, Hooper LV, Koh GY, Nagy A, Semenkovich CF,Gordon JI (2004) Proc Natl Acad Sci USA 101:15718–15723.
13. Turnbaugh PJ, Ley RE, Mahowald MA, Magrini V, Mardis ER, Gordon JI(2006) Nature 444:1027–1131.
14. Backhed F, Manchester JK, Semenkovich CF, Gordon JI (2007) Proc Natl AcadSci USA 104:979–984.
15. Hooper LV, Stappenbeck TS, Hong CV, Gordon JI (2003) Nat Immunol 4:269–273.16. Macpherson AJ, Uhr T (2004) Science 303:1662–1665.17. Mazmanian SK, Liu CH, Tzianabos AO, Kasper DL (2005) Cell 122:107–118.18. Cash HL, Whitham CV, Behrendt CL, Hooper LV (2006) Science 313:1126–
1130.19. Gordon HA, Wostmann BS, Bruckner-Kardoss E (1963) Proc Soc Exp Biol Med
114:301–304.20. Ley RE, Peterson DA, Gordon JI (2006) Cell 124:837–848.21. Ng AN, de Jong-Curtain TA, Mawdsley DJ, White SJ, Shin J, Appel B, Dong
PD, Stainier DY, Heath JK (2005) Dev Biol 286:114–135.22. Wallace KN, Akhter S, Smith EM, Lorent K, Pack M (2005) Mech Dev
122:157–173.23. Rawls JF, Samuel BS, Gordon JI (2004) Proc Natl Acad Sci USA 101:4596–
4601.24. Rawls JF, Mahowald MA, Ley RE, Gordon JI (2006) Cell 127:423–433.25. Bates JM, Mittge E, Kuhlman J, Baden KN, Cheesman SE, Guillemin K (2006)
Dev Biol 297:374–386.26. Cahill MM (1990) Microb Ecol 19:21–41.27. Huber I, Spanggaard B, Appel KF, Rossen L, Nielsen T, Gram L (2004) J Appl
Microbiol 96:117–132.28. Romero J, Navarrete P (2006) Microb Ecol.29. Graham DY, Yoshimura HH, Estes MK (1983) J Lab Clin Med 101:940–954.30. Wei B, Huang T, Dalwadi H, Sutton CL, Bruckner D, Braun J (2002) Infect
Immun 70:6567–6575.
7626 � www.pnas.org�cgi�doi�10.1073�pnas.0702386104 Rawls et al.

31. Spivak J, Landers CJ, Vasiliauskas EA, Abreu MT, Dubinsky MC, PapadakisKA, Ippoliti A, Targan SR, Fleshner PR (2006) Inflamm Bowel Dis 12:1122–1130.
32. Stover CK, Pham XQ, Erwin AL, Mizoguchi SD, Warrener P, Hickey MJ,Brinkman FS, Hufnagle WO, Kowalik DJ, Lagrou M, et al. (2000) Nature406:959–964.
33. Jacobs MA, Alwood A, Thaipisuttikul I, Spencer D, Haugen E, Ernst S, WillO, Kaul R, Raymond C, Levy R, et al. (2003) Proc Natl Acad Sci USA100:14339–14344.
34. Liberati NT, Urbach JM, Miyata S, Lee DG, Drenkard E, Wu G, VillanuevaJ, Wei T, Ausubel FM (2006) Proc Natl Acad Sci USA 103:2833–2838.
35. Wallace KN, Pack M (2003) Dev Biol 255:12–29.36. Nivens DE, Ohman DE, Williams J, Franklin MJ (2001) J Bacteriol 183:1047–1057.37. Sonnenburg JL, Angenent LT, Gordon JI (2004) Nat Immunol 5:569–573.38. Sonnenburg JL, Xu J, Leip DD, Chen CH, Westover BP, Weatherford J,
Buhler JD, Gordon JI (2005) Science 307:1955–1959.39. Spangenberg C, Heuer T, Burger C, Tummler B (1996) FEBS Lett 396:213–217.40. Dasgupta N, Wolfgang MC, Goodman AL, Arora SK, Jyot J, Lory S, Ramphal
R (2003) Mol Microbiol 50:809–824.41. Sukonina V, Lookene A, Olivecrona T, Olivecrona G (2006) Proc Natl Acad
Sci USA 103:17450–17455.42. Barbieri JT, Sun J (2004) Rev Physiol Biochem Pharmacol 152:79–92.43. Holder IA, Neely AN, Frank DW (2001) Burns 27:129–130.44. Lee VT, Smith RS, Tummler B, Lory S (2005) Infect Immun 73:1695–1705.45. Vance RE, Rietsch A, Mekalanos JJ (2005) Infect Immun 73:1706–1713.46. Wolfgang MC, Lee VT, Gilmore ME, Lory S (2003) Dev Cell 4:253–263.47. Smith RS, Wolfgang MC, Lory S (2004) Infect Immun 72:1677–1684.48. Zolfaghar I, Evans DJ, Ronaghi R, Fleiszig SM (2006) Infect Immun 74:3880–3889.49. Goodman AL, Kulasekara B, Rietsch A, Boyd D, Smith RS, Lory S (2004) Dev
Cell 7:745–754.50. Kagami Y, Ratliff M, Surber M, Martinez A, Nunn DN (1998) Mol Microbiol
27:221–233.
51. Macnab RM (2003) Annu Rev Microbiol 57:77–100.52. Soscia C, Hachani A, Bernadac A, Filloux A, Bleves S (2007) J Bacteriol.53. Strom MS, Lory S (1993) Annu Rev Microbiol 47:565–596.54. Arora SK, Neely AN, Blair B, Lory S, Ramphal R (2005) Infect Immun
73:4395–4398.55. Toutain CM, Zegans ME, O’Toole GA (2005) J Bacteriol 187:771–777.56. O’Neil HS, Marquis H (2006) Infect Immun 74:6675–6681.57. Ottemann KM, Lowenthal AC (2002) Infect Immun 70:1984–1990.58. Butler SM, Camilli A (2004) Proc Natl Acad Sci USA 101:5018–5023.59. Arora SK, Ritchings BW, Almira EC, Lory S, Ramphal R (1998) Infect Immun
66:1000–1007.60. Giron JA, Torres AG, Freer E, Kaper JB (2002) Mol Microbiol 44:361–379.61. Young GM, Schmiel DH, Miller VL (1999) Proc Natl Acad Sci USA 96:6456–
6461.62. Konkel ME, Klena JD, Rivera-Amill V, Monteville MR, Biswas D, Raphael B,
Mickelson J (2004) J Bacteriol 186:3296–3303.63. Fleiszig SM, Arora SK, Van R, Ramphal R (2001) Infect Immun 69:4931–4937.64. Hayashi F, Smith KD, Ozinsky A, Hawn TR, Yi EC, Goodlett DR, Eng JK,
Akira S, Underhill DM, Aderem A (2001) Nature 410:1099–1103.65. Gewirtz AT, Navas TA, Lyons S, Godowski PJ, Madara JL (2001) J Immunol
167:1882–1885.66. Tsujita T, Tsukada H, Nakao M, Oshiumi H, Matsumoto M, Seya T (2004)
J Biol Chem 279:48588–48597.67. Schleimer RP, Sha Q, Vandermeer J, Lane AP, Kim J (2004) Clin Exp All Rev
4:176–182.68. Prince A (2006) Am J Respir Cell Mol Biol 34:548–551.69. Adamo R, Sokol S, Soong G, Gomez MI, Prince A (2004) Am J Respir Cell Mol
Biol 30:627–634.70. Neish AS (2007) Am J Physiol 292:G462–G466.71. Bloemberg GV, O’Toole GA, Lugtenberg BJ, Kolter R (1997) Appl Environ
Microbiol 63:4543–4551.
Rawls et al. PNAS � May 1, 2007 � vol. 104 � no. 18 � 7627
MIC
ROBI
OLO
GY

258
APPENDIX D
Mahowald MA,* Rey FE,* Seedorf H, Turnbaugh PJ, Fulton RS, Wollam A, Shah N, Wang
C, Magrini V, Wilson RK, Cantarel BL, Coutinho PM, Henrissat B, Crock LW, Russell A,
Verberkmoes NC, Hettich RL, Gordon JI
Characterizing a model human gut microbiota composed of members of its two domi-
nant bacterial phyla.
Proc Natl Acad Sci U S A. 2009 Apr 7;106(14):5859-64
For supplemental information please see enclosed CD.

Characterizing a model human gut microbiotacomposed of members of its two dominantbacterial phylaMichael A. Mahowalda,1, Federico E. Reya,1, Henning Seedorfa, Peter J. Turnbaugha, Robert S. Fultonb, Aye Wollamb,Neha Shahb, Chunyan Wangb, Vincent Magrinib, Richard K. Wilsonb, Brandi L. Cantarelc,d, Pedro M. Coutinhoc,Bernard Henrissatc,d, Lara W. Crocka, Alison Russelle, Nathan C. Verberkmoese, Robert L. Hettiche,and Jeffrey I. Gordona,2
aCenter for Genome Sciences and bGenome Sequencing Center, Washington University School of Medicine, St. Louis, MO 63108; cUniversites Aix-Marseille Iand II, Marseille, France and dCentre National de la Recherche Scientifique, Unite Mixte de Recherche 6098, Marseille, France; and eORNL-UTK GenomeScience and Technology Graduate School, Oak Ridge National Laboratory, Oak Ridge, TN 37830
Contributed by Jeffrey I. Gordon, February 12, 2009 (sent for review January 22, 2009)
The adult human distal gut microbial community is typically dom-inated by 2 bacterial phyla (divisions), the Firmicutes and theBacteroidetes. Little is known about the factors that govern theinteractions between their members. Here, we examine the nichesof representatives of both phyla in vivo. Finished genome se-quences were generated from Eubacterium rectale and E. eligens,which belong to Clostridium Cluster XIVa, one of the most commongut Firmicute clades. Comparison of these and 25 other gut Firmi-cutes and Bacteroidetes indicated that the Firmicutes possesssmaller genomes and a disproportionately smaller number ofglycan-degrading enzymes. Germ-free mice were then colonizedwith E. rectale and/or a prominent human gut Bacteroidetes,Bacteroides thetaiotaomicron, followed by whole-genome tran-scriptional profiling, high-resolution proteomic analysis, and bio-chemical assays of microbial–microbial and microbial–host inter-actions. B. thetaiotaomicron adapts to E. rectale by up-regulatingexpression of a variety of polysaccharide utilization loci encodingnumerous glycoside hydrolases, and by signaling the host toproduce mucosal glycans that it, but not E. rectale, can access. E.rectale adapts to B. thetaiotaomicron by decreasing production of itsglycan-degrading enzymes, increasing expression of selected aminoacid and sugar transporters, and facilitating glycolysis by reducinglevels of NADH, in part via generation of butyrate from acetate, whichin turn is used by the gut epithelium. This simplified model of thehuman gut microbiota illustrates niche specialization and functionalredundancy within members of its major bacterial phyla, and theimportance of host glycans as a nutrient foundation that ensuresecosystem stability.
human gut Firmicutes and Bacteroidetes � carbohydrate metabolism �gnotobiotic mice � gut microbiome � nutrient sharing
The adult human gut houses a bacterial community containingtrillions of members comprising thousands of species-level
phylogenetic types (phylotypes). Culture-independent surveys ofthis community have revealed remarkable interpersonal varia-tions in these strain- and species-level phylotypes. Two bacterialphyla, the Firmicutes and the Bacteroidetes, commonly domi-nate this ecosystem (1), as they do in the guts of at least 60mammalian species (2).
Comparative analysis of 5 previously sequenced human gutBacteroidetes revealed that each genome contains a large rep-ertoire of genes involved in acquisition and metabolism ofpolysaccharides. This repertoire includes (i) up to hundreds ofglycoside hydrolases (GHs) and polysaccharide lyases (PLs); (ii)myriad paralogs of SusC and SusD, outer membrane proteinsinvolved in recognition and import of specific carbohydratestructures (3); and (iii) a large array of environmental sensorsand regulators (4). These genes are assembled in similarlyorganized, selectively regulated polysaccharide utilization loci
(PULs) that encode functions necessary to detect, bind, degradeand import carbohydrate species encountered in the gut habitat–either from the diet or from host glycans associated with mucusand the surfaces of epithelial cells (5–7). Studies of gnotobioticmice colonized only with human gut-derived Bacteroides thetaio-taomicron have demonstrated that this organism can vary itspattern of expression of PULs as a function of diet, e.g., duringthe transition from mother’s milk to a polysaccharide-rich chowconsumed when mice are weaned (5), or when adult mice areswitched from a diet rich in plant polysaccharides to a diet devoidof these glycans and replete with simple sugars (under the latterconditions, the organism forages on host glycans) (6, 7).
Our previous functional genomic studies of the responses of B.thetaiotaomicron to cocolonization of the guts of gnotobioticmice with Bifidobacterium longum, an Actinobacterium found inthe intestines of adults and infants, or with Lactobacillus casei, aFirmicute present in a number of fermented diary products, haveshown that B. thetaiotaomicron adapts to the presence of theseother microbes by modifying expression of its PULs in ways thatexpand the breadth of its carbohydrate foraging activities (8).
These observations support the notion that gut microbes maylive at the intersection of 2 forms of selective pressure: bot-tom-up selection, where fierce competition between members ofa community that approaches a population density of1011 to 1012 organisms per milliliter of colonic contents drivesphylotypes to assume distinct functional roles (niches); andtop-down selection, where the host selects for functional redun-dancy to ensure against the failure of bioreactor functions thatcould prove highly deleterious (9, 10).
The gene content, genomic arrangement and functional prop-erties of PULs in sequenced gut Bacteroidetes illustrate thespecialization and functional redundancy within members of thisphylum. They also emphasize how the combined metabolicactivities of members of the microbiota undoubtedly result in
Author contributions: M.A.M., F.E.R., and J.I.G. designed research; M.A.M., F.E.R., H.S.,R.S.F., A.W., N.S., C.W., V.M., R.K.W., B.L.C., L.C., A.R., and N.C.V. performed research;M.A.M., F.E.R., H.S., P.T., R.S.F., A.W., B.L.C., P.M.C., B.H., N.C.V., R.H., and J.I.G. analyzeddata; and M.A.M., F.E.R., R.H., and J.I.G. wrote the paper.
The authors declare no conflict of interest.
Freely available online through the PNAS open access option.
Data deposition: The data reported in this paper have been deposited in the GeneExpression Omnibus (GEO) database, www.ncbi.nlm.nih.gov/geo (accession nos.GSE14686, 14709, 14737). The sequence reported in this paper has been deposited in theGenBank database [accession nos. CP001107 (ATCC 33656, Eubacterium rectale) andCP001104–CP001106 (ATCC 27750, E. eligens)].
1M.A.M. and F.E.R. contributed equally to this work.
2To whom correspondence should be addressed. E-mail: [email protected].
This article contains supporting information online at www.pnas.org/cgi/content/full/0901529106/DCSupplemental.
www.pnas.org�cgi�doi�10.1073�pnas.0901529106 PNAS � April 7, 2009 � vol. 106 � no. 14 � 5859–5864
MIC
ROBI
OLO
GY

interactions that are both very dynamic and overwhelminglycomplex (at least to the human observer), involving multiplepotential pathways for the processing of substrates (including theorder of substrate processing), varying patterns of physicalpartitioning of microbes relative to substrates within the eco-system, plus various schemes for utilization of products ofbacterial metabolism. Such a system likely provides multipleoptions for processing of a given metabolite, and for the types ofbacteria that can be involved in these activities.
All of this means that the task of defining the interactions ofmembers of the human gut microbiota is daunting, as is the taskof identifying general principles that govern the operation of thissystem. In the present study, we have taken a reductionistapproach to begin to define interactions between members of theFirmicutes and the Bacteroidetes that are commonly repre-sented in the human gut microbiota. In the human colon,Clostridium cluster XIVa is 1 of 2 abundantly representedclusters of Firmicutes. Therefore, we have generated the initial2 complete genome sequences for members of the genus Eu-bacterium in Clostridium cluster XIVa (the human gut-derivedE. rectale strain ATCC 33656 and E. eligens strain ATCC 27750)and compared them with the draft sequences of 25 othersequenced human gut bacteria belonging to the Firmicutes andthe Bacteroidetes. The interactions between E. rectale and B.thetaiotaomicron were then characterized by performing whole-genome transcriptional profiling of each species after colonizationof gnotobiotic mice with each organism alone, or in combinationunder 3 dietary conditions. Transcriptional data were verified bymass spectrometry of cecal proteins, plus biochemical assays ofcarbohydrate metabolism. Last, we examined colonization andinteractions between these microbes from a host perspective; to doso, we performed whole-genome transcriptional analysis of colonicRNA prepared from mice that were germ-free or colonized withone or both species. Our results illustrate how members of thedominant gut bacterial phyla are able to adapt their substrateutilization in response to one another and to host dietary changes,and how host physiology can be affected by changes in microbiotacomposition.
Results and DiscussionComparative Genomic Studies of Human Gut-Associated Firmicutesand Bacteroidetes. We produced finished genome sequences forEubacterium rectale, which contains a single 3,449,685-bp chro-mosome encoding 3,627 predicted proteins, and Eubacteriumeligens, which contains a 2,144,190-bp chromosome specifying2,071 predicted proteins, plus 2 plasmids (Table S1). We alsoanalyzed 25 recently sequenced gut genomes, including (i) 9sequenced human gut-derived Bacteroidetes [includes the fin-ished genomes of B. thetaiotaomicron, B. fragilis, B. vulgatus, andParabacteroides distasonis, plus deep draft assemblies of the B.caccae, B. ovatus, B. uniformis, B. stercoris and P. merdaegenomes generated as part of the human gut microbiomeinitiative (HGMI) (http://genome.wustl.edu/hgm/HGM�frontpage.cgi)], and (ii) 16 other human gut Firmicuteswhere deep draft assemblies were available through the HGMI(see Fig. S1 for a phylogenetic tree). We classified the predictedproteins in these 2 genomes using Gene Ontology (GO) termsgenerated via Interproscan, and according to the scheme incor-porated into the Carbohydrate Active Enzymes (CAZy) data-base [www.cazy.org (11)], and then applied a binomial test toidentify functional categories of genes that are either over- orunder-represented between the Firmicutes and Bacteroidetesphyla. This analysis, described in SI Results, Figs. S2 and S3, andTable S2 and Table S3, emphasized among other things that theFirmicutes, including E. rectale and E. eligens, have significantlyfewer polysaccharide-degrading enzymes and more ABC trans-porters and PTS systems than the Bacteroidetes (12). Wesubsequently chose E. rectale and B. thetaiotaomicron as repre-
sentatives of these 2 phyla for further characterization of theirniches in vivo, because of their prominence in culture-independent surveys of the distal human gut microbiota (13, 14),the pattern of representation of carbohydrate active enzymes intheir glycobiomes and E. rectale’s ability to generate butyrate asa major end product of fermentation (15, 16). These choices setthe stage for an ‘‘arranged marriage’’ between a Firmicute anda Bacteroidetes, hosted by formerly germ-free mice.
Functional Genomic Analyses of the Minimal Human Gut Microbiome.Creating a ‘‘minimal human gut microbiota’’ in gnotobiotic mice. Youngadult male germ-free mice belonging to the NMRI inbred strainwere colonized with B. thetaiotaomicron or E. rectale alone(monoassociations) or cocolonized with both species (biassocia-tion). Ten to fourteen days after inoculation by gavage, bothspecies colonized the ceca of recipient mice, fed a standardchow diet rich in complex plant polysaccharides, to high levels(n � 4–5 mice per treatment group in each of 3 independentexperiments; Fig. S4A). Moreover, cecal levels of colonizationfor both organisms were not significantly different betweenmono- and biassociated animals (Fig. S4A).B. thetaiotaomicron’s response to E. rectale. A custom, multispecies,human gut microbiome Affymetrix GeneChip was designed(SI Methods), and used to compare the transcriptional profile ofeach bacterial species when it was the sole inhabitant of thececum, and when it coexisted together with the other species. Asignificant number of B. thetaiotaomicron genes located in PULsexhibited differences in their expression upon E. rectale coloni-zation [55 of 106; P � 10�15 (cumulative hypergeometric test);see SI Methods for the statistical criteria for defining significantlydifferent levels of gene expression]. Of these 55 genes, 51 (93%)were up-regulated (Fig. S4B; see Table S4A for a complete listof differentially regulated B. thetaiotaomicron genes).
As noted in the Introduction, 2 previous studies from our labexamined changes in B. thetaiotaomicron’s transcriptome in thececa of monoassociated gnotobiotic mice when they wereswitched from a diet rich in plant polysaccharides to a glucose-sucrose chow (6), or in suckling mice consuming mother’s milkas they transitioned to a standard chow diet (5). In bothsituations, in the absence of dietary plant polysaccharides, B.thetaiotaomicron adaptively forages on host glycans. The genesup-regulated in B. thetaiotaomicron upon cocolonization with E.rectale have a significant overlap with those noted in these 2previous datasets (P � 10�14, cumulative hypergeometric test;Fig. S4C). In addition, they include several of the genes up-regulated during growth on minimal medium containing porcinemucosal glycans as the sole carbon source (7). For example, incocolonized mice and in vitro, B. thetaiotaomicron up-regulatesseveral genes (BT3787-BT3792; BT3774-BT3777) (Fig. S4D)used in degrading �-mannosidic linkages, a component of hostN-glycans and the diet. (Note that E. rectale is unable to grow indefined medium containing �-mannan or mannose as the solecarbon sources; Table S3). B. thetaiotaomicron also up-regulatesexpression of its starch utilization system (Sus) PUL in thepresence of E. rectale (BT3698–3704) (Fig. S4D). This well-characterized PUL is essential for degradation of starch mole-cules containing �6 glucose units (17).
Thus, it appears that B. thetaiotaomicron adapts to the pres-ence of E. rectale by up-regulating expression of a variety ofPULs so that it can broaden its niche and degrade an increasedvariety of glycan substrates, including those derived from thehost that E. rectale is unable to access. There are a number ofreasons why the capacity to access host glycans likely representsan important trait underpinning microbiota function and stabil-ity: (i) glycans in the mucus gel are abundant and are aconsistently represented source of nutrients; (ii) mucus couldserve as a microhabitat for Bacteroidetes spp. to embed in (andadhere to via SusD paralogs), thereby avoiding washout from the
5860 � www.pnas.org�cgi�doi�10.1073�pnas.0901529106 Mahowald et al.

ecosystem; and (iii) the products of polysaccharide digestion/fermentation generated by Bacteroidetes spp. could be sharedwith other members of the microbiota that are also embedded inmucus (7).E. rectale’s response to B. thetaiotaomicron. E. rectale’s response to B.thetaiotaomicron in the mouse cecum stands in marked contrastto B. thetaiotaomicron’s response to E. rectale. Carbohydratemetabolism genes, particularly GHs, are significantly overrep-resented among the E. rectale genes that are downregulated inthe presence of B. thetaiotaomicron compared with monoasso-ciation; i.e., 12 of E. rectale’s predicted 51 GHs have significantlyreduced expression while only 2 are up-regulated (Fig. S4 E andF; see Table S4B for a complete list of E. rectale genes regulated bythe presence of B. thetaiotaomicron). The 2 up-regulated GH genes(EUBREC�1072, a 6-P-�-glucosidase and EUBREC�3687, a cel-lobiose phosphorylase) are predicted to break down cellobiose.Three simple sugar transport systems with predicted specificity forcellobiose, galactoside, and arabinose/lactose (EUBREC�3689,EUBREC�0479, and EUBREC�1075–6, respectively) are amongthe most strongly up-regulated genes (Fig. S4G and Table S4B).Phosphoenolpyruvate carboxykinase (Pck EUBREC�2002) is alsoinduced with cocolonization (Table S4B, GeneChip data were
verified by qRT-PCR assays in 2 independent experiments involv-ing 3–4 mice per treatment group; Fig. 1B). This enzyme catalyzesan energy conserving reaction that produces oxaloacetate fromphosphoenolpyruvate. In a subsequent transaminase reaction, ox-aloacetate can be converted to aspartate, linking this branching ofthe glycolytic pathway with amino acid biosynthesis (Fig. 1A).
Additional data support the notion that E. rectale is better ableto access nutrients in the presence of B. thetaiotaomicron. Forexample, a number of peptide and amino acid transporters in E.rectale are up-regulated, as are the central carbon and nitrogenregulatory genes CodY (EUBREC�1812), glutamate synthase(EUBREC�1829) and glutamine synthetase (EUBREC�2543)(Fig. 1B and Fig. S4H; note that these genes are also up-regulatedduring growth in tryptone glucose medium; Table S4C).
Changes in E. rectale’s fermentative pathways. E. rectale possessesgenes (EUBEC733–737; EUBEC1017) for the production ofbutyrate that show high similarity to genes from other Clostridia.This pathway involves condensation of 2 molecules of acetylCoAto form butyrate and is accompanied by oxidation of NADH toNAD� (Fig. 1). Transcriptional and high-resolution proteomicanalyses (see below) disclosed that the enzymes involved in
Cat
A
B
Fig. 1. Summary of metabolic responses of E. rectale to B. thetaiotaomicron. (A) Overview of metabolic pathways. (B) GeneChip probeset intensities andqRT-PCR validation assays are shown for a subset of genes. Mean values for triplicate qRT-PCR determinations (n � 4 mice per group) � SD are plotted. Pts,phosphotransferase systems; Gpd, glycerol 3-phosphate dehydrogenase; Pck, phosphoenolpyruvate carboxykinase; Por, pyruvate:ferredoxin oxidoreductase;Hyd, hydrogenase; Rnf, NADH: ferredoxin oxidoreductase complex; Fdred, reduced ferredoxin; Fdox oxidized ferredoxin; Pta, phosphate acetyltransferase; Bcd,butyryl-CoA dehydrogenase; Etf electron transport flavoproteins; Cat, butyryl CoA: acetate CoA transferase; Glt, glutamate synthetase; GlnA, glutaminesynthetase Gln, glutamine; Glu, glutamate; Mct1, monocarboxylate transporter 1.
Mahowald et al. PNAS � April 7, 2009 � vol. 106 � no. 14 � 5861
MIC
ROBI
OLO
GY
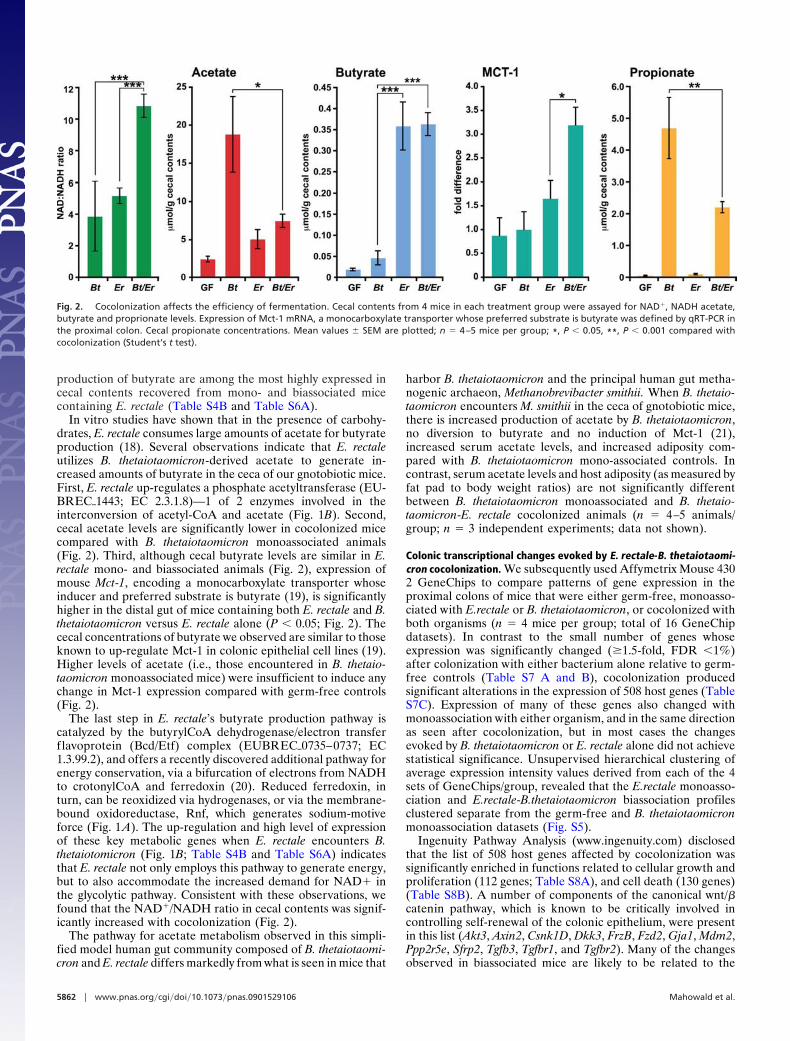
production of butyrate are among the most highly expressed incecal contents recovered from mono- and biassociated micecontaining E. rectale (Table S4B and Table S6A).
In vitro studies have shown that in the presence of carbohy-drates, E. rectale consumes large amounts of acetate for butyrateproduction (18). Several observations indicate that E. rectaleutilizes B. thetaiotaomicron-derived acetate to generate in-creased amounts of butyrate in the ceca of our gnotobiotic mice.First, E. rectale up-regulates a phosphate acetyltransferase (EU-BREC�1443; EC 2.3.1.8)—1 of 2 enzymes involved in theinterconversion of acetyl-CoA and acetate (Fig. 1B). Second,cecal acetate levels are significantly lower in cocolonized micecompared with B. thetaiotaomicron monoassociated animals(Fig. 2). Third, although cecal butyrate levels are similar in E.rectale mono- and biassociated animals (Fig. 2), expression ofmouse Mct-1, encoding a monocarboxylate transporter whoseinducer and preferred substrate is butyrate (19), is significantlyhigher in the distal gut of mice containing both E. rectale and B.thetaiotaomicron versus E. rectale alone (P � 0.05; Fig. 2). Thececal concentrations of butyrate we observed are similar to thoseknown to up-regulate Mct-1 in colonic epithelial cell lines (19).Higher levels of acetate (i.e., those encountered in B. thetaio-taomicron monoassociated mice) were insufficient to induce anychange in Mct-1 expression compared with germ-free controls(Fig. 2).
The last step in E. rectale’s butyrate production pathway iscatalyzed by the butyrylCoA dehydrogenase/electron transferf lavoprotein (Bcd/Etf) complex (EUBREC�0735–0737; EC1.3.99.2), and offers a recently discovered additional pathway forenergy conservation, via a bifurcation of electrons from NADHto crotonylCoA and ferredoxin (20). Reduced ferredoxin, inturn, can be reoxidized via hydrogenases, or via the membrane-bound oxidoreductase, Rnf, which generates sodium-motiveforce (Fig. 1A). The up-regulation and high level of expressionof these key metabolic genes when E. rectale encounters B.thetaiotomicron (Fig. 1B; Table S4B and Table S6A) indicatesthat E. rectale not only employs this pathway to generate energy,but to also accommodate the increased demand for NAD� inthe glycolytic pathway. Consistent with these observations, wefound that the NAD�/NADH ratio in cecal contents was signif-icantly increased with cocolonization (Fig. 2).
The pathway for acetate metabolism observed in this simpli-fied model human gut community composed of B. thetaiotaomi-cron and E. rectale differs markedly from what is seen in mice that
harbor B. thetaiotaomicron and the principal human gut metha-nogenic archaeon, Methanobrevibacter smithii. When B. thetaio-taomicron encounters M. smithii in the ceca of gnotobiotic mice,there is increased production of acetate by B. thetaiotaomicron,no diversion to butyrate and no induction of Mct-1 (21),increased serum acetate levels, and increased adiposity com-pared with B. thetaiotaomicron mono-associated controls. Incontrast, serum acetate levels and host adiposity (as measured byfat pad to body weight ratios) are not significantly differentbetween B. thetaiotaomicron monoassociated and B. thetaio-taomicron-E. rectale cocolonized animals (n � 4–5 animals/group; n � 3 independent experiments; data not shown).
Colonic transcriptional changes evoked by E. rectale-B. thetaiotaomi-cron cocolonization. We subsequently used Affymetrix Mouse 4302 GeneChips to compare patterns of gene expression in theproximal colons of mice that were either germ-free, monoasso-ciated with E.rectale or B. thetaiotaomicron, or cocolonized withboth organisms (n � 4 mice per group; total of 16 GeneChipdatasets). In contrast to the small number of genes whoseexpression was significantly changed (�1.5-fold, FDR �1%)after colonization with either bacterium alone relative to germ-free controls (Table S7 A and B), cocolonization producedsignificant alterations in the expression of 508 host genes (TableS7C). Expression of many of these genes also changed withmonoassociation with either organism, and in the same directionas seen after cocolonization, but in most cases the changesevoked by B. thetaiotaomicron or E. rectale alone did not achievestatistical significance. Unsupervised hierarchical clustering ofaverage expression intensity values derived from each of the 4sets of GeneChips/group, revealed that the E.rectale monoasso-ciation and E.rectale-B.thetaiotaomicron biassociation profilesclustered separate from the germ-free and B. thetaiotaomicronmonoassociation datasets (Fig. S5).
Ingenuity Pathway Analysis (www.ingenuity.com) disclosedthat the list of 508 host genes affected by cocolonization wassignificantly enriched in functions related to cellular growth andproliferation (112 genes; Table S8A), and cell death (130 genes)(Table S8B). A number of components of the canonical wnt/�catenin pathway, which is known to be critically involved incontrolling self-renewal of the colonic epithelium, were presentin this list (Akt3, Axin2, Csnk1D, Dkk3, FrzB, Fzd2, Gja1, Mdm2,Ppp2r5e, Sfrp2, Tgfb3, Tgfbr1, and Tgfbr2). Many of the changesobserved in biassociated mice are likely to be related to the
Fig. 2. Cocolonization affects the efficiency of fermentation. Cecal contents from 4 mice in each treatment group were assayed for NAD�, NADH acetate,butyrate and proprionate levels. Expression of Mct-1 mRNA, a monocarboxylate transporter whose preferred substrate is butyrate was defined by qRT-PCR inthe proximal colon. Cecal propionate concentrations. Mean values � SEM are plotted; n � 4–5 mice per group; *, P � 0.05, **, P � 0.001 compared withcocolonization (Student’s t test).
5862 � www.pnas.org�cgi�doi�10.1073�pnas.0901529106 Mahowald et al.
increased influx of butyrate, generated by E. rectale, into coloniccells (Fig. 1 A). Butyrate, a histone deacetylase inhibitor thatevokes pronounced transcriptional changes in different types ofcultured epithelial cell lines (22–25), is the preferred energysubstrate for colonic enterocytes (26). While transcriptionalchanges caused by butyrate differ depending upon the celllineage, state of cellular differentiation, and cellular energystatus (23, 24, 27, 28), in vitro and in vivo studies have shown thatit affects expression of genes involved in proliferation, differen-tiation and apoptosis (25, 28).
As mentioned above, as part of its adaptation to the presence ofE. rectale, B. thetaiotaomicron up-regulates a number of genesinvolved in the harvest of host glycans. Included among these B.thetaiotaomicron genes are components of a fucose utilizationoperon linked to production of a bacterial signal that inducessynthesis of intestinal mucosal fucosylated glycans, and microbialcatabolism of fucose from O-glycans (29). GeneChip profiling ofcolonic gene expression disclosed that cocolonization results inincreased expression of Fut2 (�-1,2 fucosyltransferase), Fut4 (�-1,3-fucosyltransferase), plus 10 other genes involved in the synthesisof mucosal glycans (glycosphingolipids and O-glycans) (Table S8C).Thus, by increasing host production of glycans, B. thetaiotaomicroncan benefit itself, and through its metabolic products, E. rectale.
E. rectale’s Colonization Levels and Production of Butyrate Are Af-fected by Host Diet. In a final series of experiments, we assessed howE. rectale and B. thetaiotaomicron were affected by changes in hostdiet. Groups of age- and gender-matched cocolonized mice werefed 1 of 3 diets that varied primarily in their carbohydrate and fatcontent: (i) the standard low-fat, plant polysaccharide-rich diet usedfor the experiments described above (abbreviated ‘‘LF/PP’’ forlow-fat/plant polysaccharide), (ii) a high-fat, ‘‘high-sugar’’ Western-type diet (abbreviated HF/HS) that contained sucrose, maltodex-trin, and corn starch, plus complex polysaccharides (primarilycellulose) that were not digestible by B. thetaiotaomicron or E.rectale, and (iii) a control diet that was similar to (ii) except that thefat content was 4-fold lower (‘‘LF/HS’’ for low-fat, high-sugar; n �5 mice per group). Whereas B. thetaiotaomicron’s colonizationlevels were similar in all 3 diets, colonization of E. rectale wassignificantly reduced (5-fold) in mice fed either the LF/HS orHF/HS diets (P � 0.01, heteroscedastic t test).
Whole-genome transcriptional profiling of both bacterial spe-cies showed that relative to the standard polysaccharide-richchow diet (LF/PP), both the Western style HF/HS diet and itsLF/HS control produced a significant up-regulation of B. the-taiotaomicron PULs involved in harvesting and degrading hostpolysaccharides, and a downregulation of several PULs involvedin the degradation of dietary plant polysaccharides (Fig. S6A).E. rectale’s response to the HF/HS and LF/HS diets was todown-regulate several of its GHs and a number of its sugartransporters (Fig. S6B). Moreover, levels of butyrate were 5-foldlower in cocolonized mice fed these compared with the standardchow (LF/PS) diet [0.496 � 0.0051 �mol per gram of wet weightcecal contents; (LF/PP) vs. 0.095 � 0.002 (HF/HS) vs. 0.080 �0.008 (LF/HS) (P � 0.05 ANOVA)].
These dietary manipulations lend further support to the view thatB. thetaiotaomicron with its large repertoire of PUL-associated GHsfunctions in this model 2-member human microbiota to processcomplex dietary plant polysaccharides and to distribute to theproducts of digestion to E. rectale, which, in turn, synthesizesbutyrate. The reduced colonization response of E. rectale to theHF/HS and LF/HS diets can be explained by a number of factors:(i) this Firmicute does not have predicted GHs and PLs that canprocess host glycans (Fig. S3); (ii) it cannot use most of the sugarswe tested that are derived from mucosal polysaccharides (TableS3); and (iii) the host possesses enzymes in its glycobiome that candirectly process the simple sugars present in these 2 diets. Indeed,human subjects that are fed diets deficient in complex polysaccha-
rides harbor lower levels of butyrate-producing gut bacteria, in-cluding members of the E. rectale-containing clade (30). Oursimplified gnotobiotic model of the microbiota underscores thefunctional implications of diet-associated changes in the represen-tation of this clade, not only as they relate to the operations of themicrobiota itself but also potentially as they relate to butyrate-mediated changes in gut epithelial homeostasis.
Proteomic Studies of This Simplified 2-Component Model of theHuman Gut Microbiome. Model communities such as the onedescribed above, constructed in gnotobiotic mice, where micro-biome gene content is precisely known and transcriptional dataare obtained under conditions where potentially confoundinghost variables such as diet and host genotype can be constrained,provide a way to test the efficacy of high-resolution massspectrometric methods for characterizing gut microbial commu-nity proteomes. Therefore, we assayed the proteins present inluminal contents, collected from the ceca of 8 gnotobiotic micefed the standard polysaccharide-rich LF/PP diet (germ-free,monoassociated, and cocolonized; n � 2 mice per treatmentgroup representing 2 independent biological experiments; see SIMethods for additional details).
The measured proteomes had high reproducibility in terms oftotal number of proteins observed and spectra matching to eachspecies. Table S5 and SI Results provide a summary of our analyses,including the percentage of mRNAs called ‘‘Present’’ in theGeneChip datasets for which there was an identified proteinproduct. The most abundant identified products from both mi-crobes included ribosomal proteins, elongation factors, chaperones,and proteins involved in energy metabolism (for a full list ofidentified proteins, see Table S6; note that Table S4 A and B, whichlist differentially expressed genes in monoassociation versus bias-sociation experiments, also indicate whether protein products fromtheir transcripts were identified in these mass spectrometry data-sets). Many conserved hypothetical and pure hypothetical proteinswere identified, as were proteins encoded by 10 genes in B.thetaiotaomicron whose presence had not been predicted in ourinitial annotation of the finished genome (Table S6A). Together,the results provide validation of experimental and computationalprocedures used for proteomic assays of a model gut microbiota,and illustrate some of the benefits in obtaining this type ofinformation.
Prospectus. These studies of a model 2-member human gutmicrobiota created in gnotobiotic mice support a view of theBacteroidetes, whose genomes contain a disproportionatelylarge number of glycan-degrading enzymes compared with se-quenced Firmicutes, as responding to increasing microbial di-versity in the distal intestine by modulating expression of theirvast array of polysaccharide utilization loci. B. thetaiotaomicronadapts to the presence of E. rectale by up-regulating a variety ofloci specific for host-derived mucin glycans that E. rectale isunable to use. E. rectale, which like other Firmicutes has a morespecialized capacity for glycan degradation, broadly downregu-lates its available GHs in the presence of B. thetaiotaomicron,even though it does not grow efficiently in the absence ofcarbohydrates. It also becomes more selective in its harvest ofsugars and its transcriptional profile suggests improved access toother nutrients (e.g., there is a generalized up-regulation ofamino acid biosynthetic genes and a set of nutrient transportersthat can harvest peptides). Thus, this simplified, model microbialcommunity illustrates some of the basic ecologic principles thatlikely shape the operations of the human gut microbiota: nutrientinterchange and the observed reciprocal effects on metabolismof these 2 organisms provide examples of classic syntrophy while‘‘character displacement’’, where cooccurrence drives (niche)divergence, also operates.
We have previously used gnotobiotic mice to show that the
Mahowald et al. PNAS � April 7, 2009 � vol. 106 � no. 14 � 5863
MIC
ROBI
OLO
GY

efficiency of fermentation of dietary polysaccharides to shortchain fatty acids by B. thetaiotaomicron increases in the presenceof M. smithii (21). Cocolonization increases the density ofcolonization of the distal gut by both organisms, increasesproduction of formate and acetate by B. thetaiotaomicron andallows M. smithii to use H2 and formate to produce methane,thereby preventing the build-up of these fermentation end-products (and NADH) in the gut bioreactor, and improving theefficiency of carbohydrate metabolism (21). Removal of H2 bythis methanogenic archaeon allows B. thetaiotaomicron to re-generate NAD�, which can then be used for glycolysis. Thissituation constitutes a mutualism, in which both members showa clear benefit. The present study, characterizing the cocoloni-zation with B. thetaiotaomicron and E. rectale, describes a morenuanced interaction where both species colonize to similar levelsif carbohydrate substrates are readily available. Moreover, cer-tain aspects of bacterial-host mutualism become more apparentwith cocolonization, including increased microbial productionand host transport of butyrate, and increased host productionand microbial consumption of mucosal glycans.
It seems likely that as the complexity of the gut communityincreases, interactions between B. thetaiotaomicron and E. rectalewill either by subsumed or magnified by other ‘‘similar’’ phylo-genetic types (as defined by their 16S rRNA sequence and/or bytheir glycobiomes). Synthesizing model human gut microbiotasof increasing complexity in gnotobiotic mice using sequencedmembers should be very useful for further testing this idea, aswell as a variety of ecologic concepts and principles that mayoperate to influence the assembly and dynamic operations of ourgut microbial communities.
Materials and MethodsGenome Comparisons. All nucleotide sequences from all contigs of completedgenome assemblies containing both capillary sequencing and pyrosequencerdata, produced as part of the HGMI, were downloaded from the WashingtonUniversity Genome Sequencing Center’s website (http://genome.wustl.edu/
pub/organism/Microbes/Human�Gut�Microbiome) on September 27, 2007.The finished genome sequences of B. thetaiotaomicron VPI-5482, Bacteroidesvulgatus ATCC 8482, and B. fragilis NCTC9343 were obtained from GenBank.
For comparison purposes, protein-coding genes were identified in all ge-nomes using YACOP (32). Each proteome was assigned InterPro numbers andGO terms using InterProScan release 16.1. Statistical comparisons betweengenomes were carried out as described in ref. 4, using perl scripts that areavailable upon request from the authors.
GeneChip Analysis. Previously described methods were used to isolate RNAfrom a 100- to 300-mg aliquot of frozen cecal contents, synthesize cDNA, andto biotinylate and hybridize the cDNAs to a custom bacterial GeneChip (21).The only modification was that in RNA isolation protocol, 0.1 mm zirconia/silica beads (Biospec Products) were used for lysis of bacterial cells in a beadbeater (Biospec; 4-min run at highest speed). Genes in a given bacterial speciesthat were differentially expressed in mono- versus biassociation experimentswere identified using CyberT (default parameters) after probe masking andscaling with the MAS5 algorithm (Affymetrix; for details about the methodsused to create the mask, see the Methods section of SI Text).
RNA was purified from proximal colon using Mini RNeasy kit (Qiagen) withon-column DNase digestion. Biotinylated cRNA targets were prepared fromeach sample (n � 4 per treatment group). cRNA was hybridized to AffymetrixMouse Genome Mo430 2 GeneChips, and the resulting datasets analyzedusing Probe Logarithmic Error Intensity Estimate method (PLIER � 16). Fold-changes and p-values were calculated using Cyber-t. Significance was definedby maintaining a FDR �1% using Benjamini–Hochberg correction (33).
Other Methods. Details about bacterial culture, genome sequencing andfinishing, animal husbandry, quantitative PCR assays of the level of coloniza-tion of the ceca of gnotobiotic mice, GeneChip design and masking, plusproteomic and metabolite assays of cecal contents are provided in SI Methods.
ACKNOWLEDGMENTS. We thank Maria Karlsson and David O’Donnell forhelp with gnotobiotic husbandry; Jan Crowley, Janaki Guruge, Jill Manches-ter, and Sabrina Wagoner for technical assistance; Ruth Ley for valuablecomments during the course of this work; and Manesh Shaw for proteomicsdata-mining and computational aspects related to mass spectrometry. Thiswork was supported by National Science Foundation Grant 0333284 andNational Institutes of Health Grants DK30292, DK70977, DK52574, GM07200,and T32-AI07172 and by the Laboratory Directed Research Program of OakRidge National Laboratory.
1. Turnbaugh PJ, et al. (2009) A core gut microbiome in obese and lean twins. Nature457:480–484.
2. Ley RE, et al. (2008) Evolution of mammals and their gut microbes. Science 320:1647–1651.3. Shipman JA, Berleman JE, Salyers AA (2000) Characterization of four outer membrane
proteins involved in binding starch to the cell surface of Bacteroides thetaiotaomicron.J Bacteriol 182:5365–5372.
4. Xu J, et al. (2007) Evolution of symbiotic bacteria in the distal human intestine. PLoSBiol 5:e156.
5. Bjursell MK, Martens EC, Gordon JI (2006) Functional genomic and metabolic studies ofthe adaptations of a prominent adult human gut symbiont, Bacteroides thetaiotaomi-cron, to the suckling period J Biol Chem 281:36269–36279.
6. Sonnenburg JL, et al. (2005) Glycan foraging in vivo by an intestine-adapted bacterialsymbiont. Science 307:1955–1959.
7. Martens EC, Chiang HC, Gordon JI (2008) Mucosal glycan foraging enhances the fitnessand transmission of a saccharolytic human gut symbiont. Cell Host Microbe 4:447–457.
8. Sonnenburg JL, Chen CT, Gordon JI (2006) Genomic and metabolic studies of the impactof probiotics on a model gut symbiont and host. PLoS Biol 4:e413.
9. Lozupone CA, et al. (2008) The convergence of carbohydrate active gene repertoires inhuman gut microbes. Proc Natl Acad Sci USA 105:15076–15081.
10. Ley RE, Peterson DA, Gordon JI (2006) Ecological and evolutionary forces shapingmicrobial diversity in the human intestine. Cell 124:837–848.
11. Cantarel BL, et al. (2009) The Carbohydrate-Active EnZymes database (CAZy): An expertresource for Glycogenomics. Nucleic Acids Res 37:D233–238.
12. Brigham CJ, Malamy MH (2005) Characterization of the RokA and HexA broad-substrate-specificity hexokinases from Bacteroides fragilis and their role in hexose andN-acetylglucosamine utilization. J Bacteriol 187:890–901.
13. Eckburg PB, et al. (2005) Diversity of the human intestinal microbial flora. Science308:1635–1638.
14. Ley RE, Turnbaugh PJ, Klein S, Gordon JI (2006) Microbial ecology: Human gut microbesassociated with obesity. Nature 444:1022–1023.
15. Barcenilla A, et al. (2000) Phylogenetic relationships of butyrate-producing bacteriafrom the human gut. Appl Environ Microbiol 66:1654–1661.
16. Duncan SH, et al. (2008) Human colonic microbiota associated with diet, obesity andweight loss. Int J Obes (London) 32:1720–1724.
17. Koropatkin NM, Martens EC, Gordon JI, Smith TJ (2008) Starch catabolism by a prom-inent human gut symbiont is directed by the recognition of amylose helices. Structure16:1105–1115.
18. Duncan SH, Flint HJ (2008) Proposal of a neotype strain (A1–86) for Eubacteriumrectale. Int J Syst Evol Microbiol 58:1735–1736.
19. Cuff MA, Lambert DW, Shirazi-Beechey SP (2002) Substrate-induced regulation of thehuman colonic monocarboxylate transporter, MCT1. J Physiol 539:361–371.
20. Li F, et al. (2008) Coupled ferredoxin and crotonyl coenzyme A (CoA) reduction withNADH catalyzed by the butyryl-CoA dehydrogenase/Etf complex from Clostridiumkluyveri. J Bacteriol 190:843–850.
21. Samuel BS, Gordon JI (2006) A humanized gnotobiotic mouse model of host-archaeal-bacterial mutualism. Proc Natl Acad Sci USA 103:10011–10016.
22. Candido EP, Reeves R, Davie JR (1978) Sodium butyrate inhibits histone deacetylationin cultured cells. Cell 14:105–113.
23. Tabuchi Y, et al. (2006) Genetic networks responsive to sodium butyrate in colonicepithelial cells. FEBS Lett 580:3035–3041.
24. Joseph J, et al. (2004) Expression profiling of sodium butyrate (NaB)-treated cells:Identification of regulation of genes related to cytokine signaling and cancer metas-tasis by NaB. Oncogene 23:6304–6315.
25. Lecona E, et al. (2008) Upregulation of annexin A1 expression by butyrate in humancolon adenocarcinoma cells: Role of p53, NF-Y, and p38 mitogen-activated proteinkinase. Mol Cell Biol 28:4665–4674.
26. Roediger WE (1982) Utilization of nutrients by isolated epithelial cells of the rat colon.Gastroenterol 83:424–429.
27. Comalada M, et al. (2006) The effects of short-chain fatty acids on colon epithelialproliferation and survival depend on the cellular phenotype. J Cancer Res Clin Oncol132:487–497.
28. Daly K, Shirazi-Beechey SP (2006) Microarray analysis of butyrate regulated genes incolonic epithelial cells. DNA Cell Biol 25:49–62.
29. Hooper LV, Xu J, Falk PG, Midtvedt T, Gordon JI (1999) A molecular sensor that allowsa gut commensal to control its nutrient foundation in a competitive ecosystem. ProcNatl Acad Sci USA 96:9833–9838.
30. Duncan SH, et al. GE (2007) Reduced dietary intake of carbohydrates by obese subjectsresults in decreased concentrations of butyrate and butyrate-producing bacteria infeces. Appl Environ Microbiol 73:1073–1078.
31. Hubbell SP (2006) Neutral theory and the evolution of ecological equivalence. Ecology87:1387–1398.
32. McHardy AC, Goesmann A, Puhler A, Meyer F (2004) Development of joint applicationstrategies for two microbial gene finders. Bioinformatics 20:1622–1631.
33. Benjamini Y, Hochberg Y (1995) Controlling the False Discovery Rate: A Practical andPowerful Approach to Multiple Testing. J R Stat Soc Methodol 57:289–300.
5864 � www.pnas.org�cgi�doi�10.1073�pnas.0901529106 Mahowald et al.