ANNUAL REPORT - Examinations Council of Zambia
68
ANNUAL REPORT 2018
-
Upload
khangminh22 -
Category
Documents
-
view
1 -
download
0
Transcript of ANNUAL REPORT - Examinations Council of Zambia
ANNUALREPORT2018

2018 ANNUAL REPORTExaminations Council of Zambia covering the
Events of the Calendar Year 2018.
©ECZ2018All rights reserved. No reproduction, copy or transmission of this publication may be made without prior written permission
from Examinations Council of Zambia.
4 2018 Annual Report
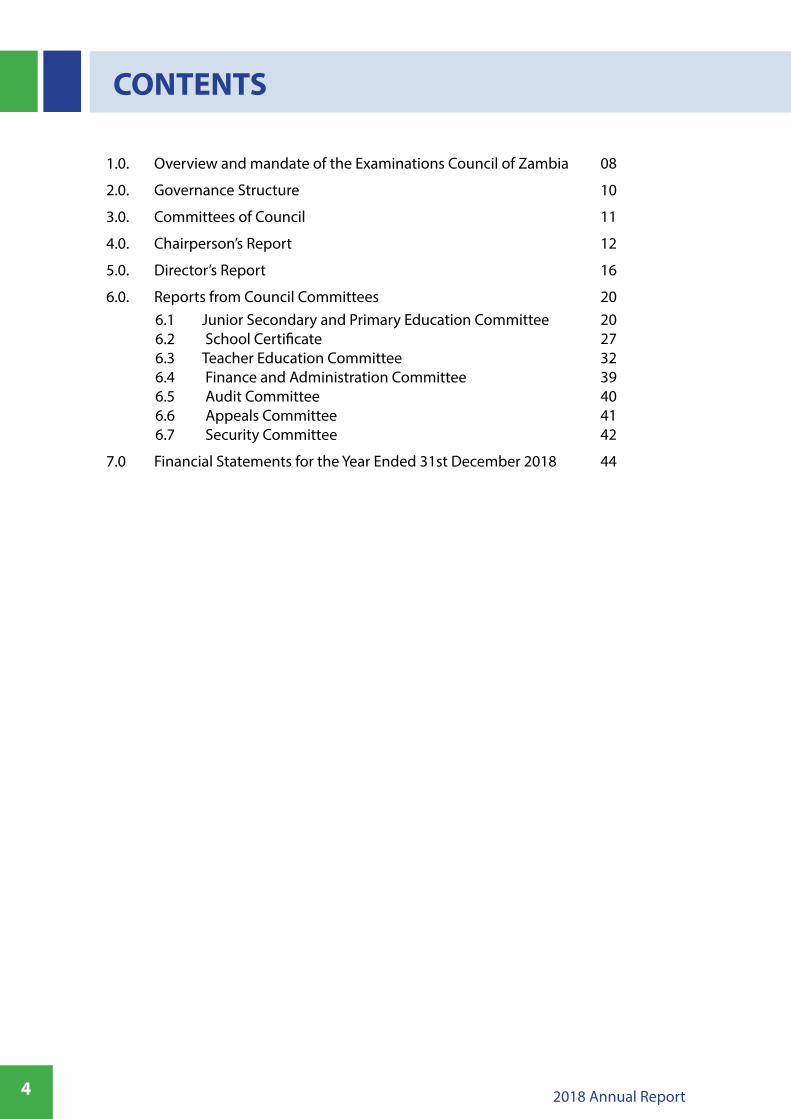
CONTENTS
1.0. Overview and mandate of the Examinations Council of Zambia
2.0. Governance Structure
3.0. Committees of Council
4.0. Chairperson’s Report
5.0. Director’s Report
6.0. Reports from Council Committees6.1 Junior Secondary and Primary Education Committee6.2 School Certificate6.3 Teacher Education Committee6.4 Finance and Administration Committee 6.5 Audit Committee6.6 Appeals Committee6.7 Security Committee
7.0 Financial Statements for the Year Ended 31st December 2018
08
10
11
12
16
2020273239404142
44
52018 Annual Report
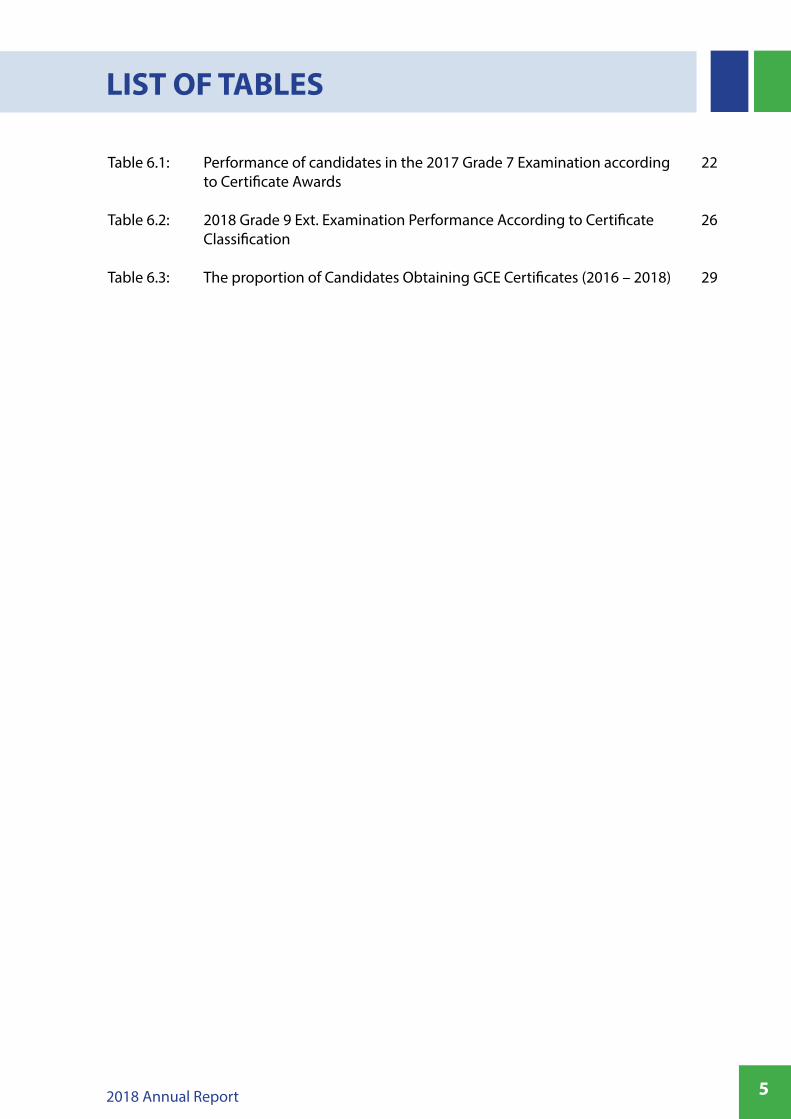
LIST OF TABLES
Table 6.1: Performance of candidates in the 2017 Grade 7 Examination according to Certificate Awards
Table 6.2: 2018 Grade 9 Ext. Examination Performance According to Certificate Classification
Table 6.3: The proportion of Candidates Obtaining GCE Certificates (2016 – 2018)
22
26
29
6 2018 Annual Report
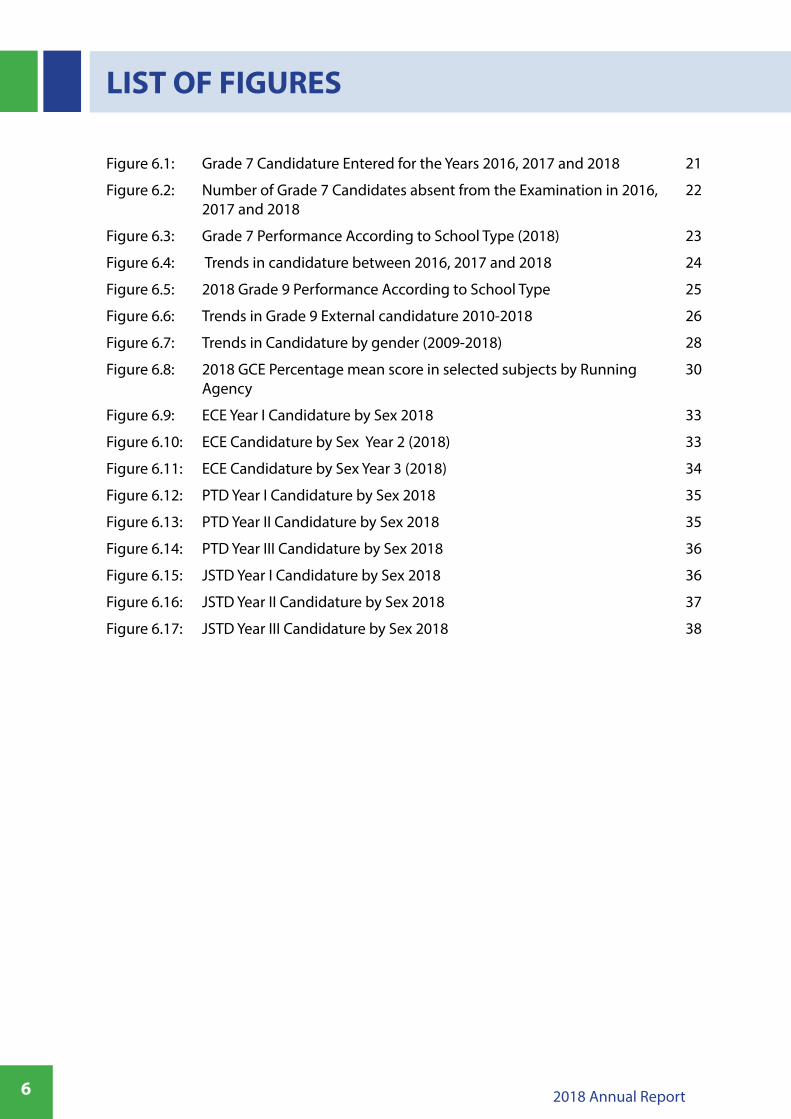
LIST OF FIGURES
Figure 6.1: Grade 7 Candidature Entered for the Years 2016, 2017 and 2018
Figure 6.2: Number of Grade 7 Candidates absent from the Examination in 2016, 2017 and 2018
Figure 6.3: Grade 7 Performance According to School Type (2018)
Figure 6.4: Trends in candidature between 2016, 2017 and 2018
Figure 6.5: 2018 Grade 9 Performance According to School Type
Figure 6.6: Trends in Grade 9 External candidature 2010-2018
Figure 6.7: Trends in Candidature by gender (2009-2018)
Figure 6.8: 2018 GCE Percentage mean score in selected subjects by Running Agency
Figure 6.9: ECE Year I Candidature by Sex 2018
Figure 6.10: ECE Candidature by Sex Year 2 (2018)
Figure 6.11: ECE Candidature by Sex Year 3 (2018)
Figure 6.12: PTD Year I Candidature by Sex 2018
Figure 6.13: PTD Year II Candidature by Sex 2018
Figure 6.14: PTD Year III Candidature by Sex 2018
Figure 6.15: JSTD Year I Candidature by Sex 2018
Figure 6.16: JSTD Year II Candidature by Sex 2018
Figure 6.17: JSTD Year III Candidature by Sex 2018
21
22
23
24
25
26
28
30
33
33
34
35
35
36
36
37
38
72018 Annual Report
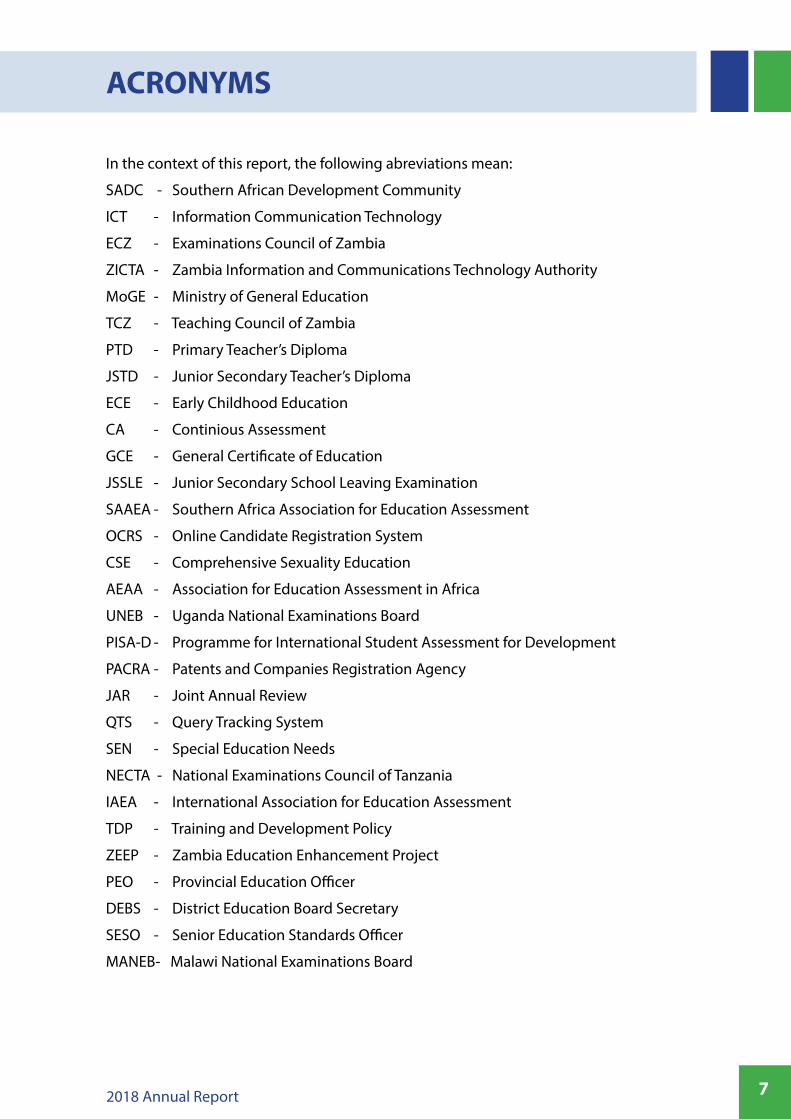
ACRONYMS
In the context of this report, the following abreviations mean:
SADC - Southern African Development Community
ICT - Information Communication Technology
ECZ - Examinations Council of Zambia
ZICTA - Zambia Information and Communications Technology Authority
MoGE - Ministry of General Education
TCZ - Teaching Council of Zambia
PTD - Primary Teacher’s Diploma
JSTD - Junior Secondary Teacher’s Diploma
ECE - Early Childhood Education
CA - Continious Assessment
GCE - General Certificate of Education
JSSLE - Junior Secondary School Leaving Examination
SAAEA - Southern Africa Association for Education Assessment
OCRS - Online Candidate Registration System
CSE - Comprehensive Sexuality Education
AEAA - Association for Education Assessment in Africa
UNEB - Uganda National Examinations Board
PISA-D - Programme for International Student Assessment for Development
PACRA - Patents and Companies Registration Agency
JAR - Joint Annual Review
QTS - Query Tracking System
SEN - Special Education Needs
NECTA - National Examinations Council of Tanzania
IAEA - International Association for Education Assessment
TDP - Training and Development Policy
ZEEP - Zambia Education Enhancement Project
PEO - Provincial Education Officer
DEBS - District Education Board Secretary
SESO - Senior Education Standards Officer
MANEB- Malawi National Examinations Board
8 2018 Annual Report
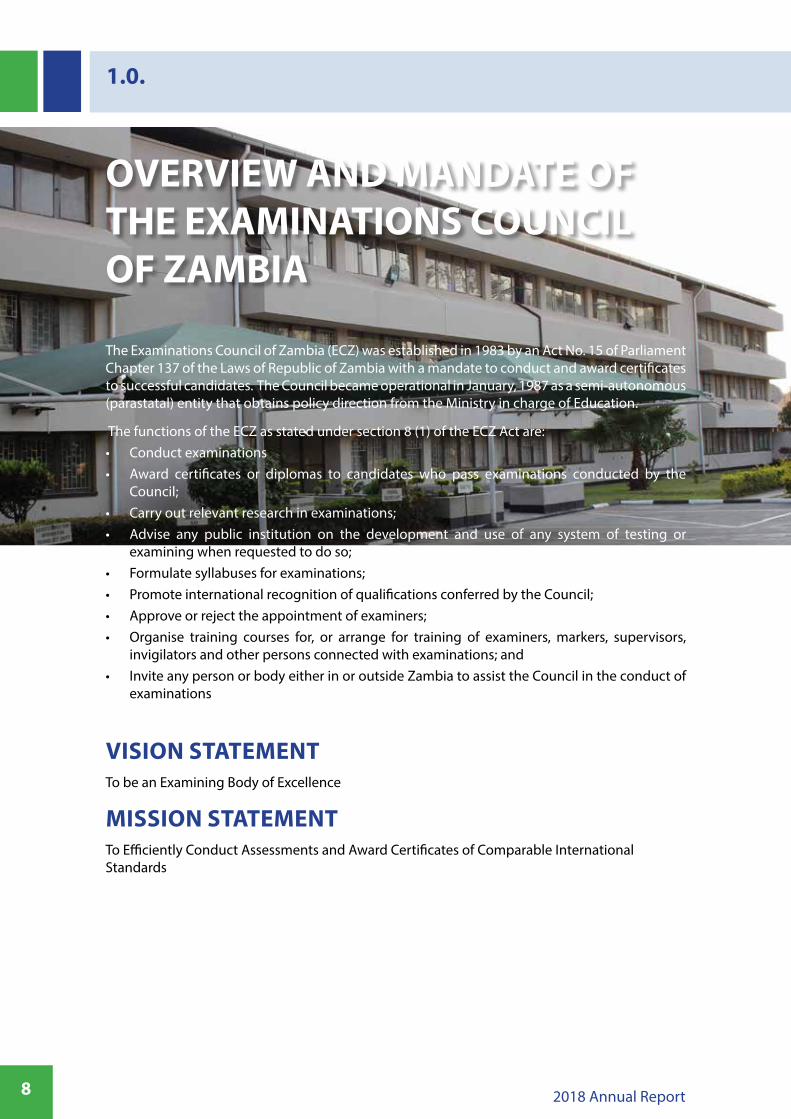
The Examinations Council of Zambia (ECZ) was established in 1983 by an Act No. 15 of Parliament Chapter 137 of the Laws of Republic of Zambia with a mandate to conduct and award certificates to successful candidates. The Council became operational in January, 1987 as a semi-autonomous (parastatal) entity that obtains policy direction from the Ministry in charge of Education.
The functions of the ECZ as stated under section 8 (1) of the ECZ Act are:• Conduct examinations• Award certificates or diplomas to candidates who pass examinations conducted by the
Council;• Carry out relevant research in examinations; • Advise any public institution on the development and use of any system of testing or
examining when requested to do so;• Formulate syllabuses for examinations;• Promote international recognition of qualifications conferred by the Council; • Approve or reject the appointment of examiners;• Organise training courses for, or arrange for training of examiners, markers, supervisors,
invigilators and other persons connected with examinations; and• Invite any person or body either in or outside Zambia to assist the Council in the conduct of
examinations
VISION STATEMENTTo be an Examining Body of Excellence
MISSION STATEMENTTo Efficiently Conduct Assessments and Award Certificates of Comparable International Standards
OVERVIEW AND MANDATE OF THE EXAMINATIONS COUNCIL OF ZAMBIA
1.0.

92018 Annual Report
CORE VALUESThe Council and its employees had a long and continuing tradition of distinguished public service. ECZ employees, as they strived to fulfil the vision, mission and the goals, were guided by eight (8) core principles that support our core values and these are;
CompetenceQuality Human Capital remains our most cherished Asset
AccountabilityWe are accountable to Government, stakeholders and our clients
TransparencyOpenness, mutual trust and respect remain our corporate credo
Team WorkTeam spirit amongst staff and partnership with stakeholders is paramount to our service delivery efficiency.
EfficiencyWe conduct efficient examinations and award certificates of comparable international standards.
ConfidentialityWe abide strictly by our oath of secrecy and corporate code of conduct
IntegrityOur actions, decisions and behaviour reflect the highest ethical and professional standards.
Innovation
Transformations through innovation catalyse our growth strategies.
10 2018 Annual Report
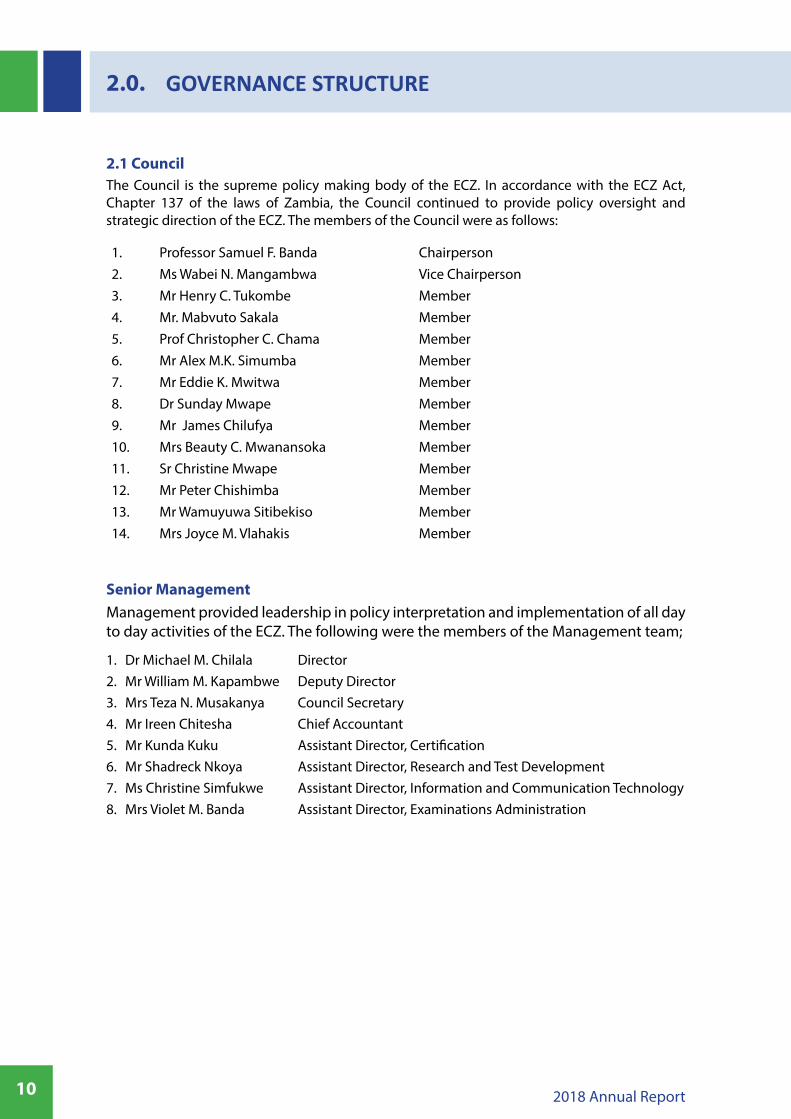
2.1 CouncilThe Council is the supreme policy making body of the ECZ. In accordance with the ECZ Act, Chapter 137 of the laws of Zambia, the Council continued to provide policy oversight and strategic direction of the ECZ. The members of the Council were as follows:
1. Professor Samuel F. Banda Chairperson2. Ms Wabei N. Mangambwa Vice Chairperson3. Mr Henry C. Tukombe Member4. Mr. Mabvuto Sakala Member5. Prof Christopher C. Chama Member6. Mr Alex M.K. Simumba Member7. Mr Eddie K. Mwitwa Member8. Dr Sunday Mwape Member9. Mr James Chilufya Member10. Mrs Beauty C. Mwanansoka Member11. Sr Christine Mwape Member12. Mr Peter Chishimba Member13. Mr Wamuyuwa Sitibekiso Member14. Mrs Joyce M. Vlahakis Member
Senior ManagementManagement provided leadership in policy interpretation and implementation of all day to day activities of the ECZ. The following were the members of the Management team;
1. Dr Michael M. Chilala Director2. Mr William M. Kapambwe Deputy Director3. Mrs Teza N. Musakanya Council Secretary4. Mr Ireen Chitesha Chief Accountant5. Mr Kunda Kuku Assistant Director, Certification6. Mr Shadreck Nkoya Assistant Director, Research and Test Development 7. Ms Christine Simfukwe Assistant Director, Information and Communication Technology 8. Mrs Violet M. Banda Assistant Director, Examinations Administration
GOVERNANCE STRUCTURE2.0.
112018 Annual Report
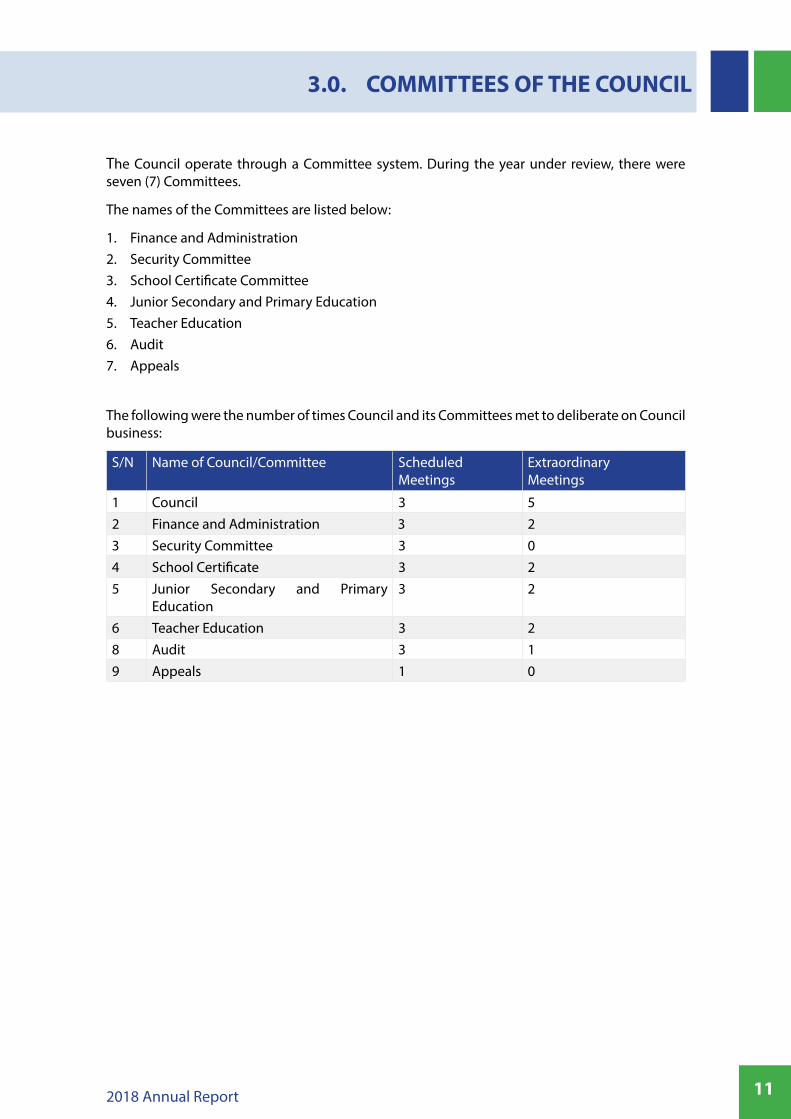
The Council operate through a Committee system. During the year under review, there were seven (7) Committees.
The names of the Committees are listed below:
1. Finance and Administration2. Security Committee 3. School Certificate Committee 4. Junior Secondary and Primary Education 5. Teacher Education 6. Audit 7. Appeals
The following were the number of times Council and its Committees met to deliberate on Council business:
S/N Name of Council/Committee Scheduled Meetings
Extraordinary Meetings
1 Council 3 52 Finance and Administration 3 23 Security Committee 3 04 School Certificate 3 25 Junior Secondary and Primary
Education3 2
6 Teacher Education 3 28 Audit 3 19 Appeals 1 0
COMMITTEES OF THE COUNCIL3.0.
12 2018 Annual Report
4.1 Continued Implementation of the Job Evaluation ReportThe Council continued to implement the job evaluation report through recruitment of staff and implementation of the revised terms and conditions of service for staff. The process was expected to conclude in 2020. The Council approved the re-alignment of the Finance and Accounts Department structure to streamline operations
4.2 Approval of 2018 Examinations Centre StatusA total of 390 applications for examination Centre status were approved. (197 at Grade 7; 188 at Grade 9; 64 at Grade12 and 5 at Teacher education level).
4.3 Position of Assistant Director CertificationThe Council approved the advertisement and subsequent appointment of an Assistant Director for Certification.
4.4 Discontinued ExaminersDue to cases of misconduct during the 2017 Grade 12 marking session, the Council resolved to discontinue some examiners from marking.
4.5 Establishment of a Service Office in MonguThe Council approved and officially launched the opening of the Mongu Service on 3rd October 2018. This was in line with the decentralization policy of Government, aimed at bringing Council services closer to the people.
4.6 Construction of a Setting and Marking CentreThe Council was given land belonging to the Ministry of General Education. The land was surveyed for the purpose to get the title for ECZ. The land was earmarked for the construction of a setting and marking centre. The construction was planned for in 2019. The Council expected to save more than K18 million per year which currently paid to marking centres outside the cost of allowances for markers and setters.
4.0.
On behalf of the Council, I have the honor and privilage to submit the Anual Report for the Examinations Council of Zambia (ECZ) for the Financial Year Ended 31st December 2018.
I note that in this report we have now gone 3 years into our Strategic Plan (2016 to 2020) in achieving set goals and objectives that ensures ECZ becomes an examining body of excellence.
The Examinations Council of Zambia (ECZ) made the following policy related resolutions during the year 2018:
Chairperson’s Report
132018 Annual Report
4.7 Revision of Examinations Regulations The Council ratified the amendments made to the Grade 7, 9 12 and teacher education examinations regulations. The regulations were revised to include guidelines pertaining to electronic or online systems such as online candidate registration system. The subject schemes were also changed based on the revised Curriculum of 2013. The examinations regulations contain guidelines and procedures for the administration of the examination and subsequent award of the qualification at that level.
4.8 Records Management And Disposal PoliciesThe Council ratified Records Management policy and Disposal policy. The policies were developed to ensure smooth operations, efficiency and effectiveness. Council urged management to adhere to the regulations in the polices.
4.9 2018 Teacher Education Graduation Ceremonies The Council began examining teacher education diploma programmes in 2016. The programmes were Early Childhood Education Teacher’s, and Primary Teacher’s Diploma. The Council commenced the examining of Junior Secondary Teacher’s Diploma in 2017. A total of 625 ECE and 3,497 PTD students graduated in 2018. It is hoped that through the systematic annual assessment up to the final of trainer teachers, the Council contributed greatly towards improved teacher training as well as learner performance.
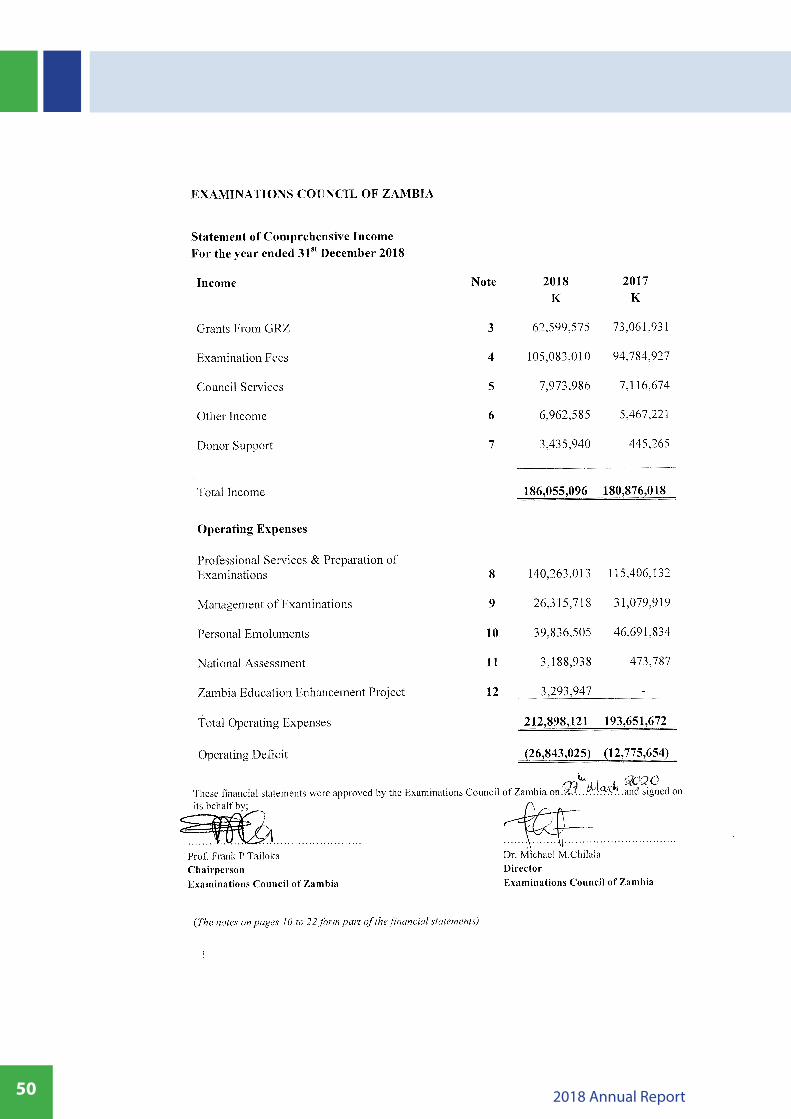
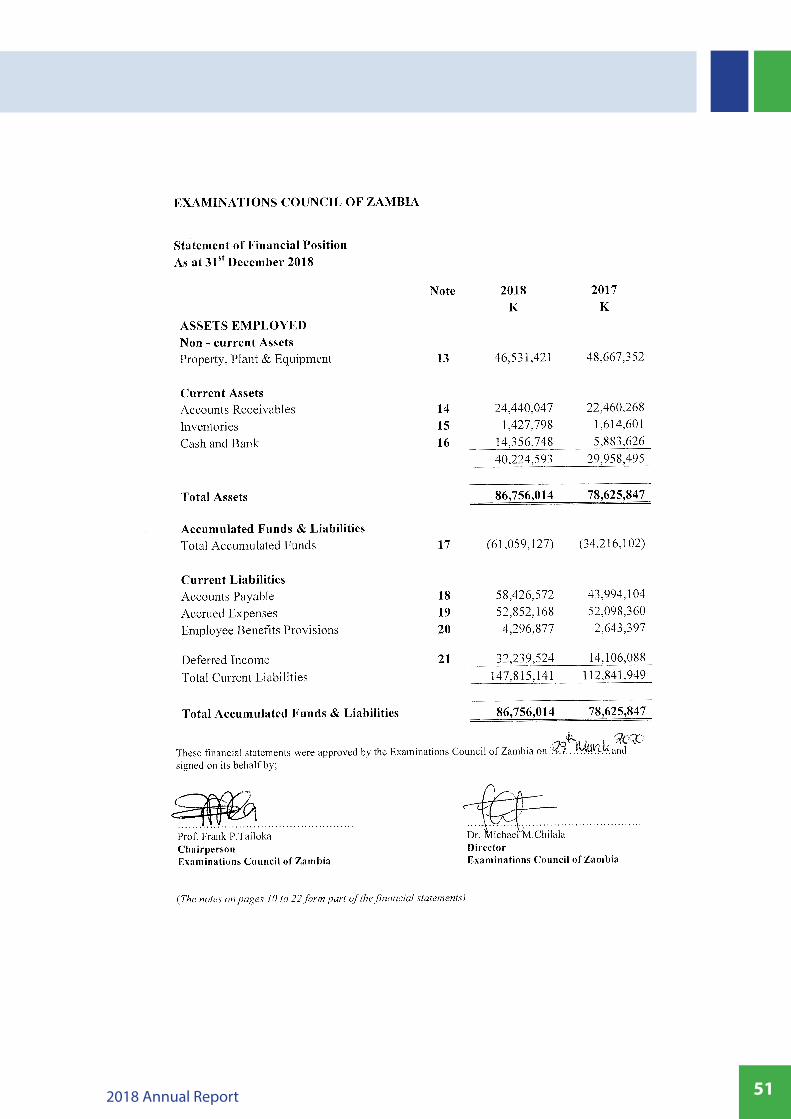
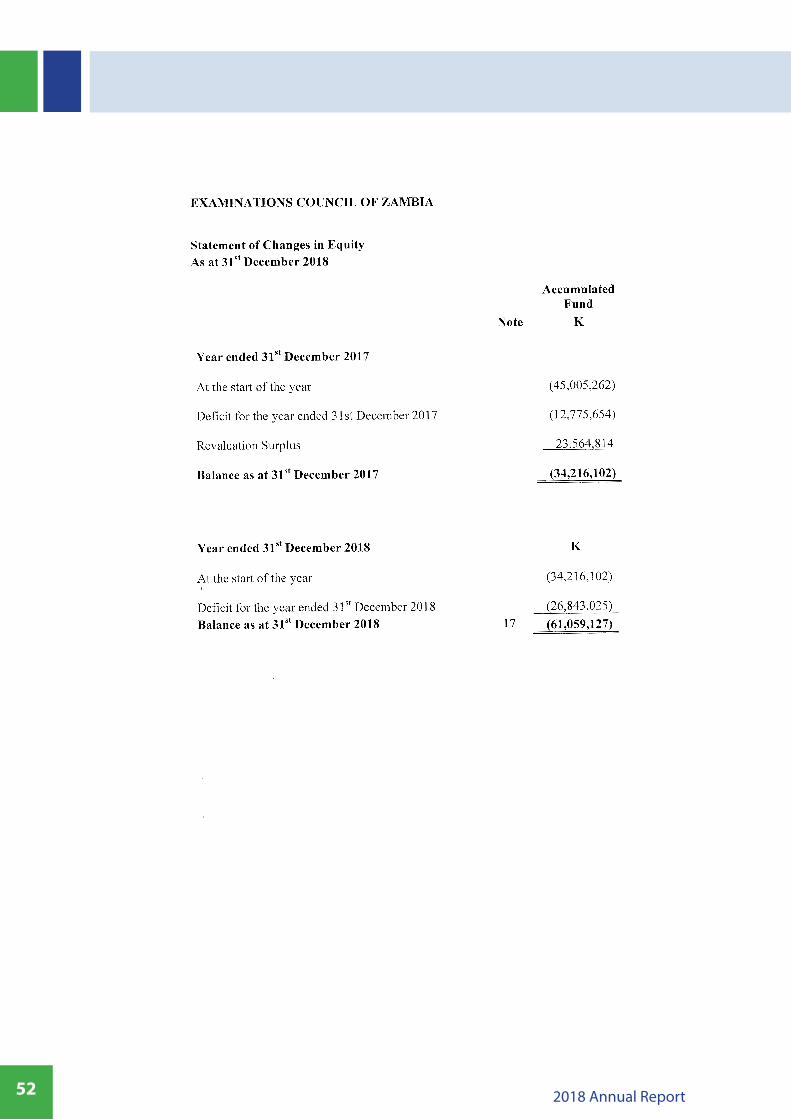
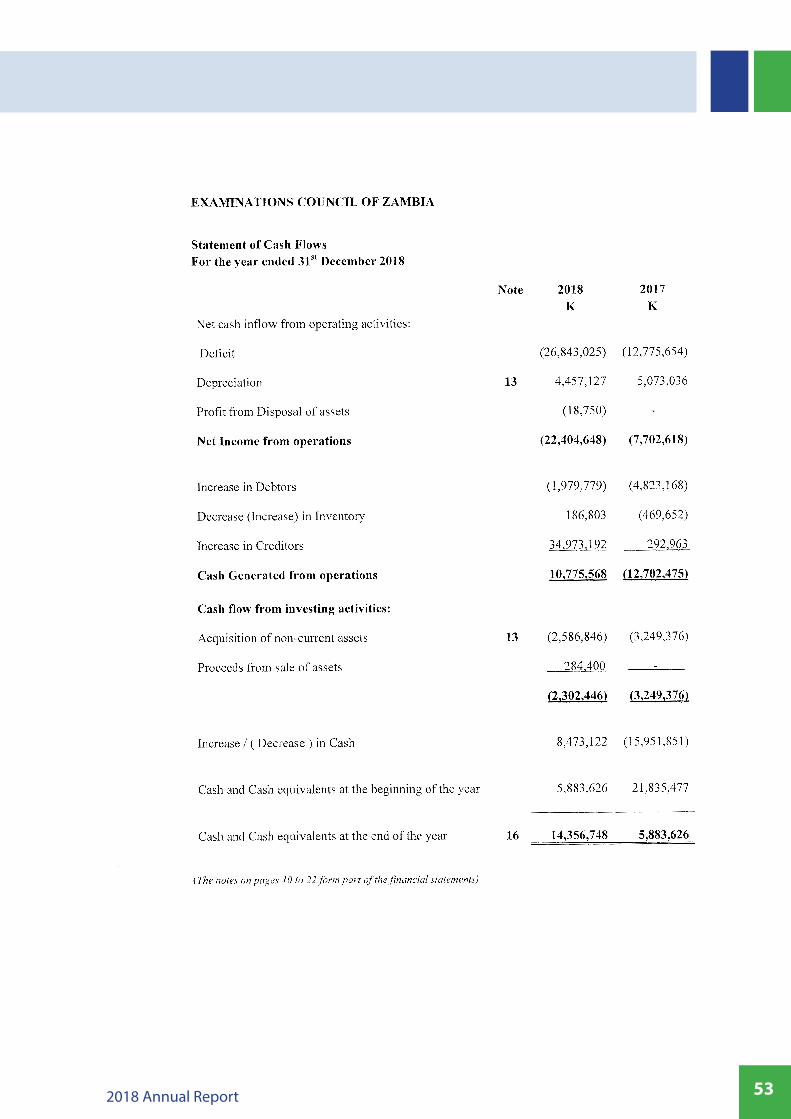
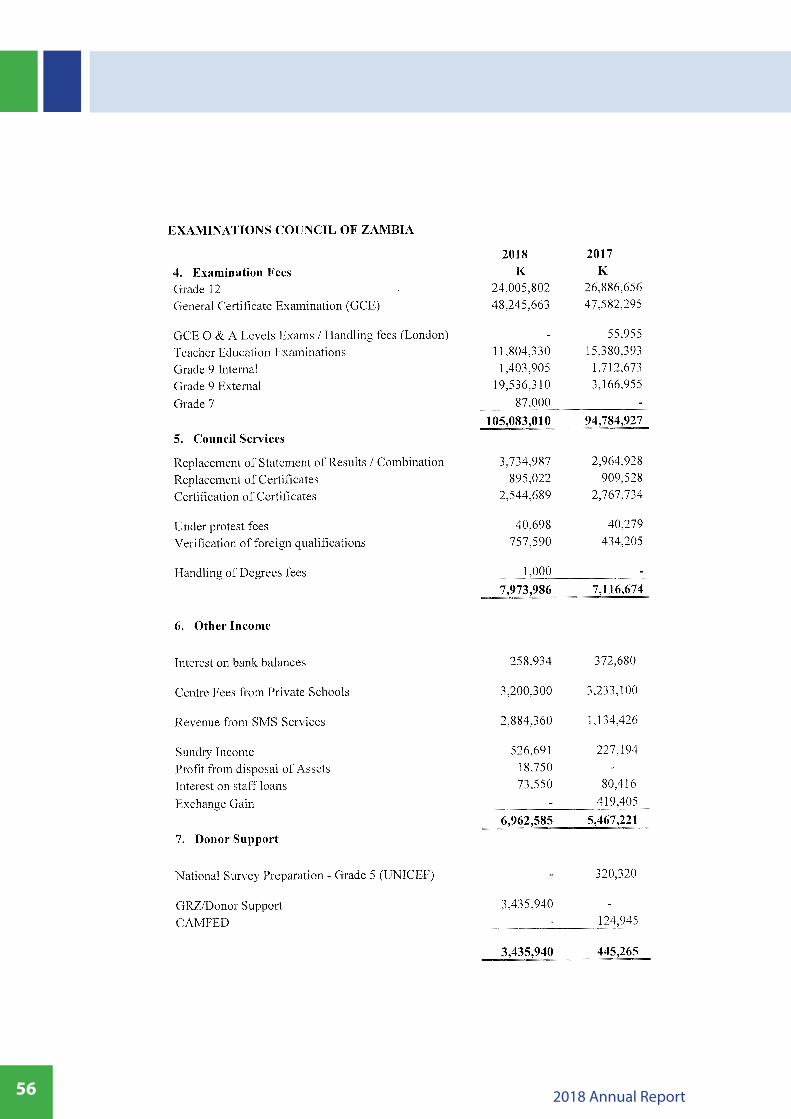
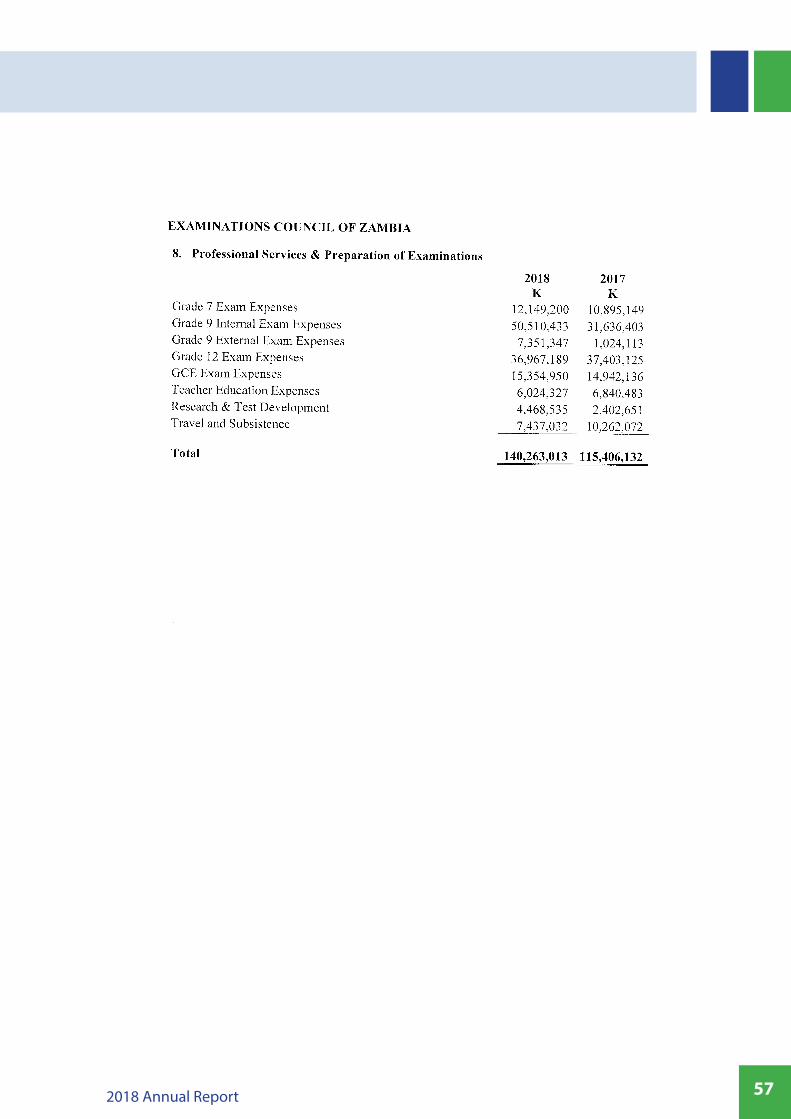
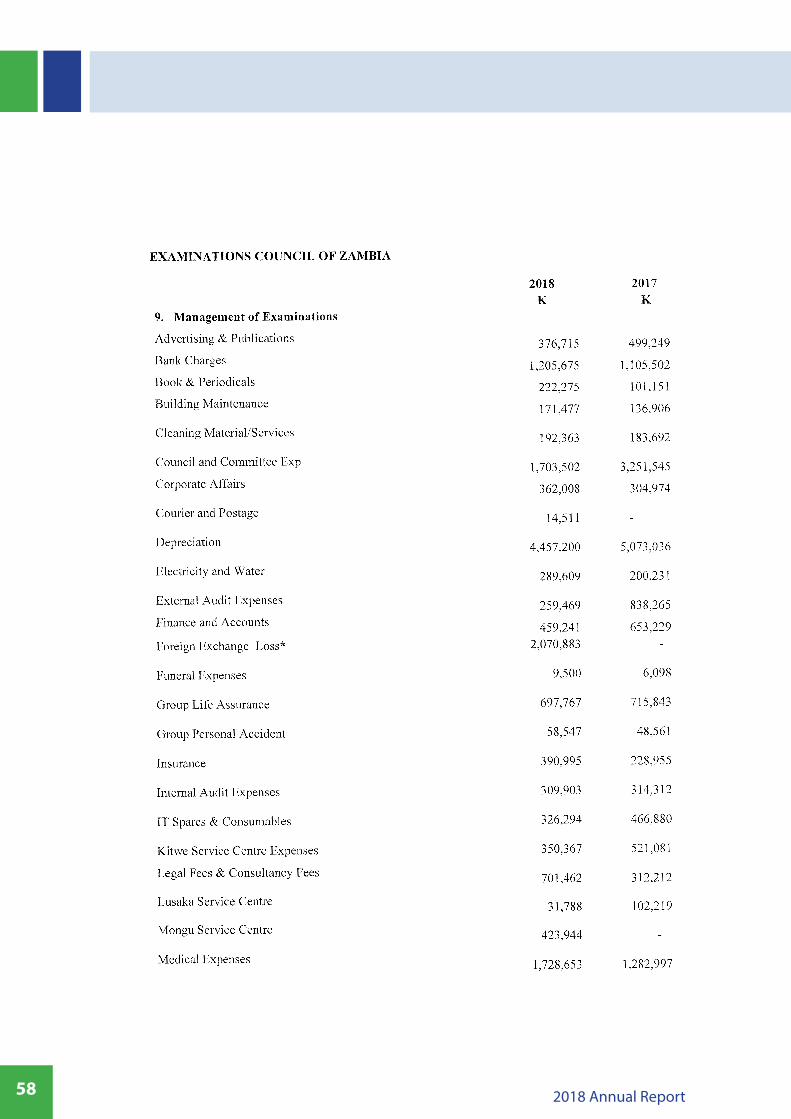
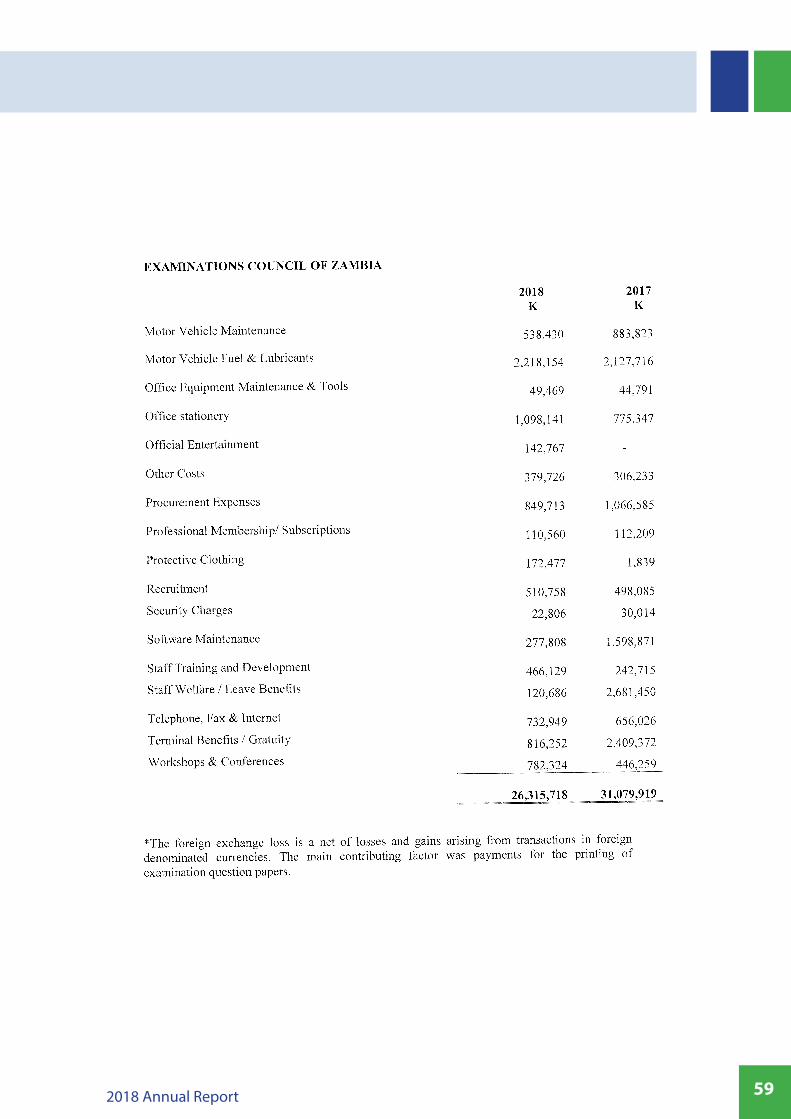
4.10 Financial Performance for the Year ended 31st December 2018 The Examinations Council of Zambia received a total income of K186,055,096.00 against an expenditure of K212,898,121.00. The net assets for the year ending 31st December 2018 were K86,756,014.00 (Refer to the Financial Statements attached for the Year ended 31st December 2018 for details).
4.11 Highlights of the 2018 Examinations The Council successfully conducted examinations at all levels and approved the results for examinations at all the levels. The following were notable highlights relating to examinations in 2018:
Grade 7 Composite ExaminationA total of 443,700 candidates entered for the 2018 Grade 7 Composite Examination compared to 400,802 in 2017. This represented an increase of 10.7 percent over the candidates that entered for the same examination in 2017. Segregating the number of candidates who entered the examination by sex, a total of 219,658 (49.51%) boys and 224,042 (50.49%) girls entered for the examination. Out of the 443,700 who entered for the examination, 388,442 candidates sat the examination, of whom 192,723 (49.61%) were boys while 192,719 (50.39%) were girls. All the 388,331 candidates who sat the 2018 Grade 7 Composite examination were selected to Grade 8, bringing the national progression rate to 100.00 percent from 99.14 percent in 2017.
Junior Secondary School Leaving Examination (External)A total of 61,116 candidates entered the 2018 Grade 9 external examination, of whom 28,551 (46.72%) were male and 32,565 (53.28%) were female. Of the candidates that entered the 2018 Grade 9 external examination, 57,620, (26, 913 males and 30,707 females), sat the examination. There had been a sharp rise in candidature from 12, 498 in 2017 to 61,116 in 2018. Of the candidates who sat the examination, 35,688 or 62 percent passed in one or more subjects. Of the 9,577 candidates who registered for six or more subjects, 1,257 or 13.13 percent obtained full certificates. Further, the proportion of candidates that obtained statements was 59.76 percent while 38.06 percent of the candidates failed the Examination.
14 2018 Annual Report
Junior Secondary School Leaving (Internal) ExaminationA total of 284,523 candidates entered for the 2018 Grade 9 Junior Secondary School Leaving Examination (Internal) compared to 350,246 in 2017. This represented a decrease of 18.76 percent over the candidates that entered for the same examination in 2017. Out of the 284,523 who entered for the examination, 255,449 candidates sat the examination, of whom 127,772 (50.02%) were boys while 127,677 (49.98%) were girls.
General Certificate of Education ExaminationA total of 128,156 candidates registered for the General Certificate of Education(GCE)examination, of whom 42,465 (33.14%) were male and 85,691 (66.86%) were female. The number of candidates registered increased by 4.11 percentage points from the 123,096 in 2017. Out of the 128,156 registered candidates, 119,721 (91.77%) sat the examination, of these 38,704 (32.33%) were male and 81,017 (67.67%) were female. The trend of having more female candidates sitting the examination than male candidates continued in 2018. All provinces recorded over 90 percentage pass rate.
School Certificate ExaminationThe total number of candidates who entered for the 2018 Grade 12 School Certificate Examination was 121,299, of whom 64,202 (52.93%) were boys and 57,097 (47.07%) were girls. Of the 121,299 who entered the examination, 119,383 sat the examination comprising 63,172 boys and 56,211 girls. In addition, the number of schools recording 100 percent passes decreased from seventy-three (73) schools in 2017 to seventy (70) schools in 2018.
Teacher Education Examinations The Examinations Council of Zambia also conducted Teacher Education Examinations at three levels namely Early Childhood Teacher’s Diploma (ECE); Primary Teacher’s Diploma (PTD) and Junior Secondary Teacher’s Diploma (JSTD). Full results highlights are documented under the Teacher Education Committee. The Council approved the results and 2018 marked the first time the Council was graduating students in Early Childhood Education Teacher’s Diploma (ECE) and Primary Teacher’s Diploma (PTD). There were a total of 3,563 students that graduated from the two programmes.
During the year under review, ECZ implemented the planned activities. We are therefore grateful to the Ministry of General Education and various stakeholders for their support and to the members of the Council, Management and staff for their commitment and hard work.
Lastly, the Council submitted the exit report to the Minister of General Education Hon David Mabumba. The report highlighted the Council’s achievement during its tenure in office from 6th October 2015 to 5th October 2018.
Prof. Samuel F. BandaCOUNCIL CHAIRPERSON
152018 Annual Report
16 2018 Annual Report
In line with the Strategic Plan (2016-2020) of the Council, various activities were undertaken during the year under review and these were as follows:
5.1. Thematic Area 1: Enhance Policy and GovernanceThe ICT policy was developed, validated and distributed to all employees at the ECZ headquarters and in all Service Centres. The policy is currently guiding the acquisition, distribution and use of ICTs amongst all employees of the Council.
The ECZ in its quest to be an examining board of excellence undertook a revision of examinations guidelines. These include the procedures and processes in examination administration; Regulations for examinations for Grades 7,9,12 and Teacher Education; Guidelines for administration and management of examinations in Zambia; Standing Instructions in handling cases of malpractice and Guidelines for Centre coordinators at marking centres. The 2018 examinations were conducted using these guidelines.
Examinations review workshop took place in February 2018 as opposed to the month of April as has been the case in the previous years. The review workshop had three categories of participants. The first group of participants comprised Senior Education Standards Officers, Guidance and Counselling Teachers; the second group was mainly for Chief Examiners drawn from the Grade 12 marking panels; College Principals and their internal examiners were in the third group. In attendance also were representatives from the ministry of General Education Headquarters, the Directorate of Curriculum and standards; Dean of Provincial Education Officers (PEOs) and Dean of District Education Board Secretaries (DEBS). It is important to note that it was the first time a review for the conduct of Teacher Education (TED) examination was being done.
The ECZ held its Annual planning retreat from 25th to 28th January 2018 in Siavonga to review progress made regarding the implementation of the strategic plan since its launch in 2016. The review of the Strategic Plan was an opportunity to take a step back, assess, evaluate and realign the vision, goals, priorities and action plan. From this undertaking, it was clear that the ECZ was on course with the implementation of the strategic plan.
5.2. Thematic Area 2: Enhance Operational Efficiency and EffectivenessThe ECZ developed the online query tracking system (OQTS) to reduce congestion, track the status of each query online, and to check how long each query took to be resolved especially in established service centres.
The ECZ reviewed and developed a service charter to enhance service provision to its clients.
The Examinations Council of Zambia (ECZ) held a SEN database validation meeting on 6th April 2018 at Grand Palace Hotel. The meeting was attended by Director Standards and Curriculum;
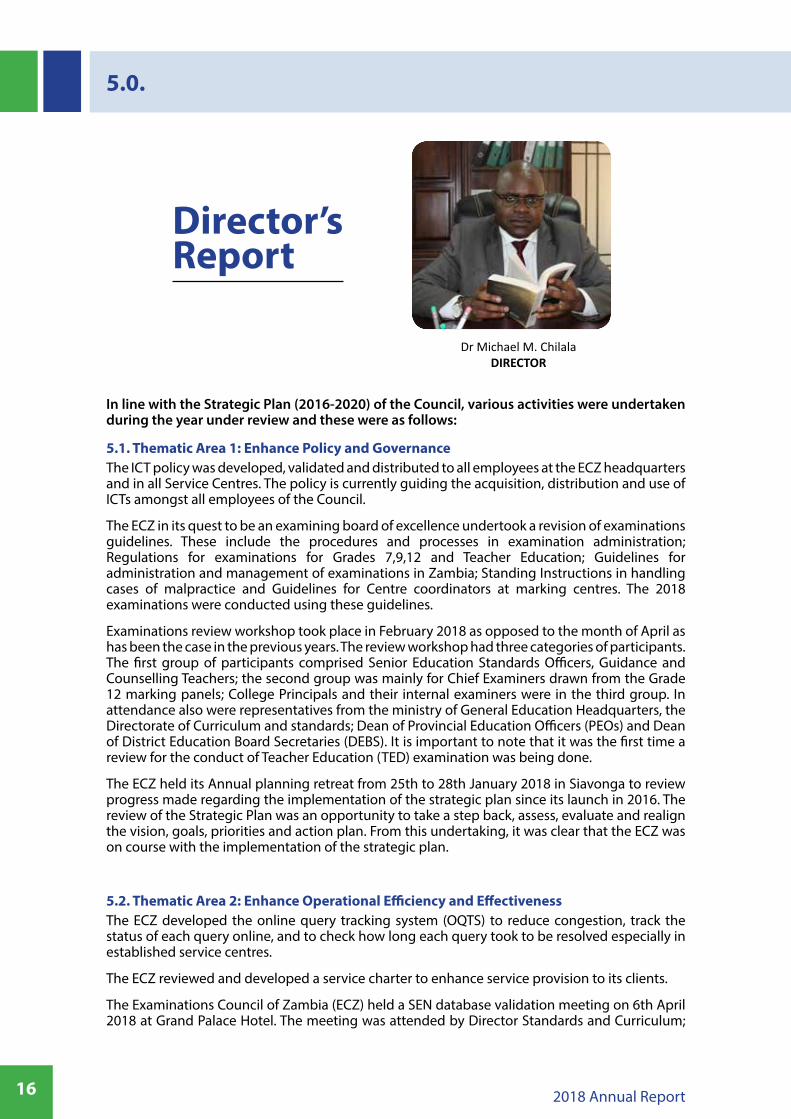
Director’s Report
5.0.
172018 Annual Report
Director ECZ; MOGE officials in charge of children with SEN; ECZ staff (in charge of learners with SEN; Systems Manager and Researchers); Head of Education unit at the Irish Embassy and ten Senior Education Standards Officers (SESOs) in charge of Special Education in Zambia’s ten provinces. The meeting validated the ECZ SEN online database.
The ECZ attended all the annual conferences held under the International Association for Education Assessment (IAEA); The Association for Education Assessment in Africa (AEAA) and the Southern Africa Association for Education Assessment (SAAEA). During the period under review, we ascended to the position of Executive Secretary of AEAA and also continued being the Chair of the SAAEA research forum.
The ECZ conducted benchmarking visits to Tanzania (NECTA) and Malawi (MANEB). These countries were carefully chosen because they had made significant strides in reducing cases of examination malpractices.
The ECZ Participation in Standard Fixing meetings in our sister examinations boards in both East and Southern Africa where we drew lessons to better our general conduct and management of examinations
Hosted officers from sister examining boards (KNEC, NECTA, ECoS, and ECoL) invited to participate in the school certificate standard fixing and awards meeting held at Radisson Blu Hotel. With participation from external moderators and Chief Examiners for each examination paper, it is evident that the ECZ conducted the Awards meeting with high levels of professionalism and credibility.
5.3. Thematic Area 3: Enhance Institutional Capacity of ECZ and Its Staff for Excellent Service Delivery and Customer SatisfactionIn a quest to enhance operational efficiency and effectiveness, the ECZ attended all the annual conferences held under the International Association for Education Assessment (IAEA); The Association for Education Assessment in Africa (AEAA) and the Southern Africa Association for Education Assessment (SAAEA). During the period under review, we ascended to the position of Executive Secretary of AEAA and also continued being the Chair of the SAAEA research forum
Three ECZ Officers participated at the 2018 Cambridge International Study Programme for Development and administration of public examinations in the United Kingdom. The programme focused on two main themes-Test Development, Examinations Administration and processing. It also involved visitation to the Cambridge Examinations Processing Centre. Furthermore, the course was an interactive program which allowed participants to share experiences from the way assessments are conducted in home countries.
The ECZ managed to implement its Training and Development Policy (TDP). The Council sponsored ten (10) members of staff pursuing different relevant programmes through different modes of study. Through training, the Council has built the capacity of its employees for efficient and effective service delivery.
The ECZ yet again played host to an important forum in the Educational assessment sector in the Southern Africa Development Community (SADC) region. The forum was held at Sandy’s Creation from 25th to 29th March 2018. The research forum was attended by 21 officers from seven SAAEA member countries. These deliberated on SAAEA documents which were presented to the SAAEA Executive Committee for adoption during the 12th SAAEA conference in South Africa. ECZ has been chairing the research forum for the past three years.
18 2018 Annual Report
5.4. Thematic Area 4: Strengthen the Conduct of Education and Examination Related Research, Development and InformationThe 2017 Annual Examinations Performance Review meeting did not take off for the year under review. However, all the Examination Performance review reports at grade 7, 9, 12, GCE and Teacher Education were presented and shared during the 2018 Joint Annual Review meeting (JAR) organized by the Ministry of General Education from 31st July to 2nd August, 2018 at Mulungushi International Conference Centre.
Within the period under review, the ECZ attended the SAAEA and AEAA Conference held in South Africa and Lesotho respectively. ECZ was also represented at the IAEA in Oxford, London.
Zambia conducted the second Early Grade Reading and Mathematics National Assessment survey following the baseline survey of 2014. This was the first time that this particular large-scale assessment which uses EGRA and EGMA tools were conducted by ECZ following the handover of the programme by USAID and Research Triangle International (RTI) in 2015.
The ECZ launched PISA-D Report on 11th December 2018 at Pamodzi Hotel in Lusaka. Zambia was among the nine (9) countries in the world and of the two countries in Africa, the other being Senegal, to have participated in the first ever PISA-D. The main survey was conducted in September, 2017. The report revealed that education attainment in Zambia was low compared to other countries. According to the international classification of education, 15-year students needed to be in Grade 9 or Grade 10. Further, the findings showed that about 67 percent of the students that participated in PISA-D in Zambia were in Grade 7 or Grade 8 and only about 43 percent of the leaners were on track or ahead of track in their education. Learners lagged behind because of late entry into school, and mainly because they had repeated a grade or grades.
The ECZ successfully conducted baseline and diagnostic survey for the Zambia Education Enhancement Project (ZEEP). Both reports have since been written and submitted to the World Bank
Panel setting meetings were held during the first and second quarter of 2018. The purpose was to develop examination items at all levels of examinations. However, it must be noted here that during the period when examinations were suspended, some panel setting meetings were held to develop items for the examination papers that were tempered with at grade nine. Proof reading was also done. It is important to indicate that this is an on-going process until when papers are Camera Ready.
Proof reading of grade 7 pre-test items was done in the first week of September for all subject panels at grad 7 level. Panel Chairpersons were invited to proof read the pre-test papers. Pre-testing of grade 7 items was conducted for a period of two weeks. The exercise was also extended to grade 7 pupils at St Jeff College Primary in Johannesburg South Africa for the first time.
Continuous Assessment Moderation for Teacher Education was undertaken in November 2018. The purpose of this activity was to validate Continuous assessment scores which various ECZ affiliate colleges of Education had submitted.
5.5. Thematic Area 5: Advance Infrastructure Development for Quality Service Delivery and Expansion of Service ProvisionDue to increased public demand for information on examinations administration from the ECZ, the Corporate Affairs Office embarked on rebranding and redesigning the existing online feedback platforms to enhance effective internal and external communication. The team retreated at Gonde Lodge in Kabwe from 12th to 16th February 2018. The reviewed platforms were the ECZ website, Facebook page, and Email and toll free line.
The ECZ officially opened the Mongu service centre to the public on 3rd October 2018. The Mongu office would service members of the public from the western parts of Zambia. Along the
192018 Annual Report
same line, Management applied for Land which Mpika District Council was advertising in line with the expansion activities.
ECZ completed the networking of the Mpika and Mongu Service Centres to improve its operations and service delivery.
The ECZ developed the Online Query Tracking System (OQTS) to reduce congestion, track the status of each query online, and to check how long each query took to be resolved especially in established service centres.
During the period under review, the Council requested the Ministry of General Education for land between the ECZ and Millennium Village Complex to construct its own setting and marking Centre. After being granted, the Council moved and secured the land and has since started the procurement processes for a consultant and eventually will obtain a contractor to construct the Centre.
We are grateful to the Council, ECZ Employees and various stakeholders for their support rendered to the ECZ to ensure we deliver on our mandate.
Dr Michael M. ChilalaDIRECTOR
20 2018 Annual Report
Reports From Council Committees
6.0.
6.1. JUNIOR SECONDARY AND PRIMARY EDUCATION COMMITTEEThe Junior Secondary and Primary Education Committee was charged with the responsibility of presiding over the Grade 7 Composite Examination and the Junior Secondary School Leaving (JSSL) Examination for Grade 9 Internal and External candidates.
The Committee comprised eight (8) members and secretary as listed below:
Professor Christopher C. Chama ChairpersonMrs Joyce Vlahakis Vice ChairpersonMr Rodgers S. Zulu MemberMrs Annie P. Bwalya MemberMr Emade Sakala MemberMrs Exilda Gondwe MemberSr. Prisca Phiri MemberMr Ackson Kafwifwi MemberMr Albert S. Siamunako Secretary
Matters Considered and Approved by the Committee6.1.1. Approval of Examination Centre Status
The Committee approved 197 applications for the Grade 7 Examination Centre Status. 22 were rejected at this level. At Grade 9 level, the Committee approved 188 applications for Examination Centre status and rejected 10 applications.
6.1.2. 2017 Grade 9 suspected examination malpractice cases (58)For the 2017 Grade 9 suspected examination malpractice cases, the Committee resolved to:
i. Nullify results for 56 candidates;ii. Release results for 1 candidate.
6.1.3. Amendments of Grade 7 and Grade 9 Examination RegulationsThe Committee approved the amendments of the Grade 7 and 9 examinations regulations. The Committee also approved the 2018 Grade 7 and 9 examination time tables.
6.1.4. The Release of 2018 Grade 7 and 9 ExaminationThe Committee approved the 2018 results as follows:
(a) Grade 7 Composite ExaminationGenerally, the 2018 Grade 7 Composite Examination results showed that the performance of candidates in all subjects was similar to that of 2017. However, there was a slight increase in national mean scores from 608.04 in 2017 to 611.71 in 2018.
212018 Annual Report
In addition, absenteeism increased by 3.4 percentage points with twelve point four five (12.45 %) of learners recorded absent in 2018 from nine point zero five (9.05%) percent in 2017. The rising trend in absenteeism over the three years period from 2016 to 2018 should be a source of concern and calls for quick intervention.
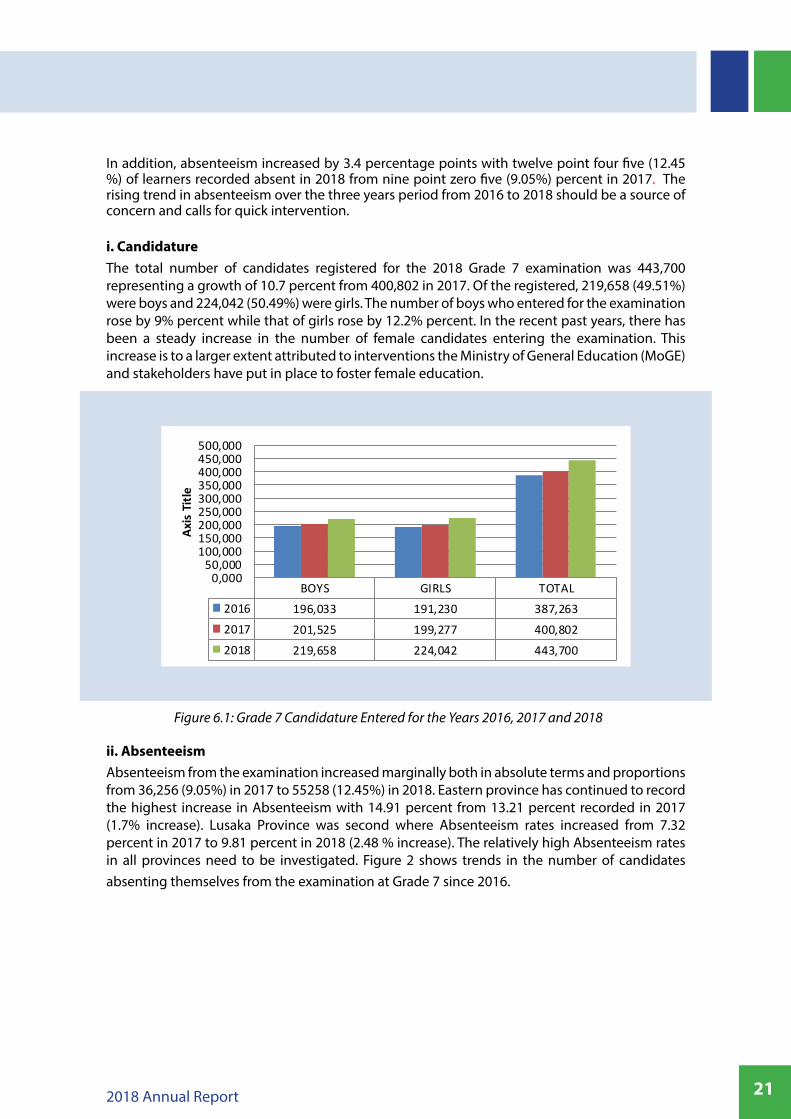
i. CandidatureThe total number of candidates registered for the 2018 Grade 7 examination was 443,700 representing a growth of 10.7 percent from 400,802 in 2017. Of the registered, 219,658 (49.51%) were boys and 224,042 (50.49%) were girls. The number of boys who entered for the examination rose by 9% percent while that of girls rose by 12.2% percent. In the recent past years, there has been a steady increase in the number of female candidates entering the examination. This increase is to a larger extent attributed to interventions the Ministry of General Education (MoGE) and stakeholders have put in place to foster female education.
Figure 6.1: Grade 7 Candidature Entered for the Years 2016, 2017 and 2018
ii. AbsenteeismAbsenteeism from the examination increased marginally both in absolute terms and proportions from 36,256 (9.05%) in 2017 to 55258 (12.45%) in 2018. Eastern province has continued to record the highest increase in Absenteeism with 14.91 percent from 13.21 percent recorded in 2017 (1.7% increase). Lusaka Province was second where Absenteeism rates increased from 7.32 percent in 2017 to 9.81 percent in 2018 (2.48 % increase). The relatively high Absenteeism rates in all provinces need to be investigated. Figure 2 shows trends in the number of candidates absenting themselves from the examination at Grade 7 since 2016.
BOYS GIRLS TOTAL2016 196,033 191,230 387,2632017 201,525 199,277 400,8022018 219,658 224,042 443,700
0,00050,000
100,000150,000200,000250,000300,000350,000400,000450,000500,000
Axis
Title
Chart Title
22 2018 Annual Report
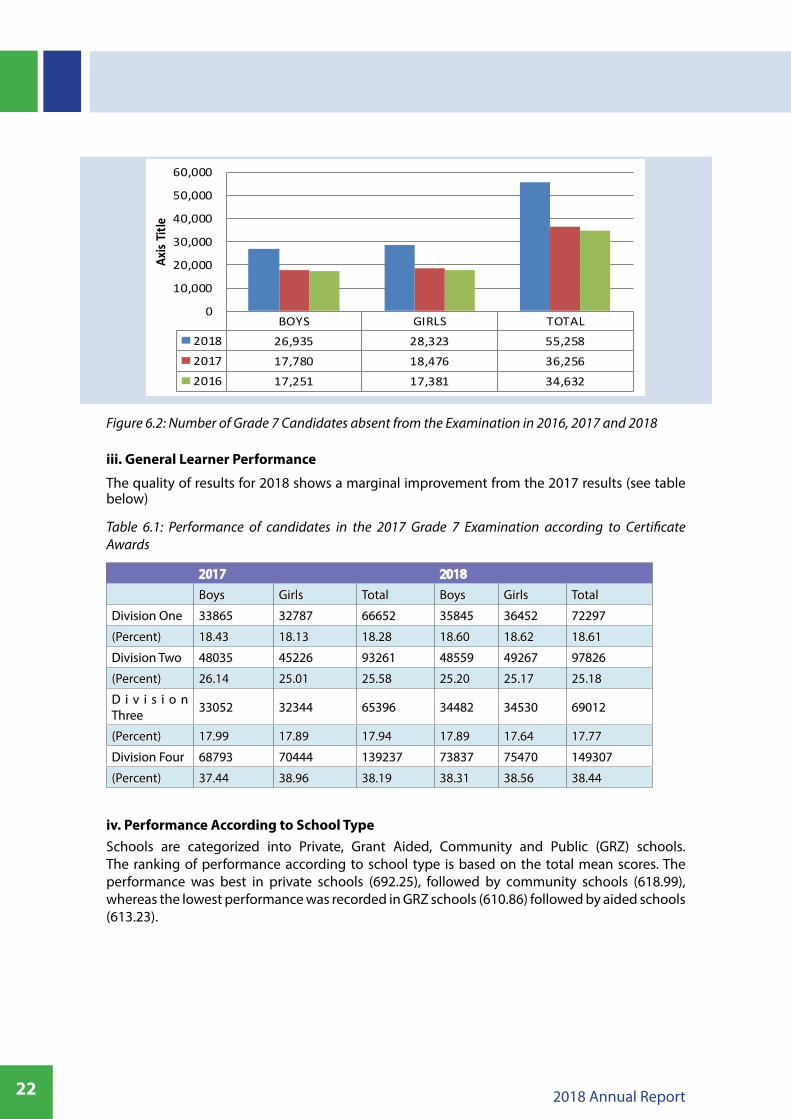
Figure 6.2: Number of Grade 7 Candidates absent from the Examination in 2016, 2017 and 2018
iii. General Learner Performance
The quality of results for 2018 shows a marginal improvement from the 2017 results (see table below)
Table 6.1: Performance of candidates in the 2017 Grade 7 Examination according to Certificate Awards
2017 2018
Boys Girls Total Boys Girls Total
Division One 33865 32787 66652 35845 36452 72297
(Percent) 18.43 18.13 18.28 18.60 18.62 18.61
Division Two 48035 45226 93261 48559 49267 97826
(Percent) 26.14 25.01 25.58 25.20 25.17 25.18
D i v i s i o n Three 33052 32344 65396 34482 34530 69012
(Percent) 17.99 17.89 17.94 17.89 17.64 17.77
Division Four 68793 70444 139237 73837 75470 149307
(Percent) 37.44 38.96 38.19 38.31 38.56 38.44
iv. Performance According to School Type Schools are categorized into Private, Grant Aided, Community and Public (GRZ) schools. The ranking of performance according to school type is based on the total mean scores. The performance was best in private schools (692.25), followed by community schools (618.99), whereas the lowest performance was recorded in GRZ schools (610.86) followed by aided schools (613.23).
BOYS GIRLS TOTAL2018 26,935 28,323 55,2582017 17,780 18,476 36,2562016 17,251 17,381 34,632
50,000
60,000
BOYS GIRLS TOTAL2018 26,935 28,323 55,2582017 17,780 18,476 36,2562016 17,251 17,381 34,632
0
10,000
20,000
30,000
40,000
50,000
60,000Ax
is Tit
leChart Title

232018 Annual Report
Figure 6.3: Grade 7 Performance According to School Type (2018)
v. Grade 8 Progression Rates All the 388,331 candidates who sat the 2018 Grade 7 Composite examination were selected to Grade 8. This represented a national progression rate of 100 percent compared to 99.14 percent in 2017. Of the selected number, 194,107 (100.74%) were boys while 194,224 (99.27%) were girls.
(b). Junior Secondary School Leaving (Grade 9 Internal) ExaminationThe 2018 Grade 9 cohort was the fourth to sit for the examination under the curriculum which saw the introduction of new subject areas such as Computer Studies, Business Studies, Social Studies, Musical Arts Education and Integrated Science.
Generally, the overall performance by certificate classification was better in 2017 than in 2018. There was a reduction in candidates who passed by about 10 percentage points between the two years.
i. Candidature
A total of two hundred fifty-five thousand four hundred and forty-nine (255,449) sat the 2018 examination, representing a decrease of fifty-three thousand one hundred and eleven (53,111) candidates from the three hundred and five thousand, five hundred and sixty (305,560) who sat the 2017 examination. When compared to the total number of candidates who sat in 2017, there is a 17.21 percent decrease in 2018. The decrease can be attributed to, among other factors, the separation of external candidates from internal candidates. (See the figure 6.4 below).
24 2018 Annual Report
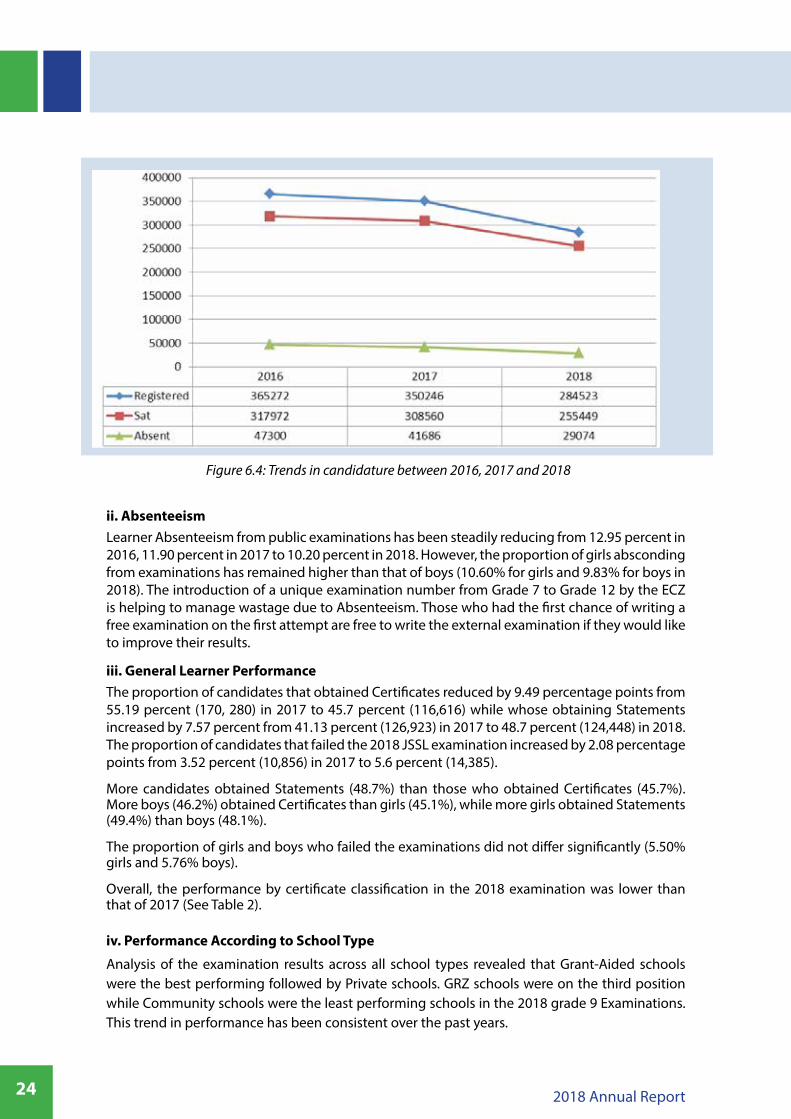
Figure 6.4: Trends in candidature between 2016, 2017 and 2018
ii. AbsenteeismLearner Absenteeism from public examinations has been steadily reducing from 12.95 percent in 2016, 11.90 percent in 2017 to 10.20 percent in 2018. However, the proportion of girls absconding from examinations has remained higher than that of boys (10.60% for girls and 9.83% for boys in 2018). The introduction of a unique examination number from Grade 7 to Grade 12 by the ECZ is helping to manage wastage due to Absenteeism. Those who had the first chance of writing a free examination on the first attempt are free to write the external examination if they would like to improve their results.
iii. General Learner PerformanceThe proportion of candidates that obtained Certificates reduced by 9.49 percentage points from 55.19 percent (170, 280) in 2017 to 45.7 percent (116,616) while whose obtaining Statements increased by 7.57 percent from 41.13 percent (126,923) in 2017 to 48.7 percent (124,448) in 2018. The proportion of candidates that failed the 2018 JSSL examination increased by 2.08 percentage points from 3.52 percent (10,856) in 2017 to 5.6 percent (14,385).
More candidates obtained Statements (48.7%) than those who obtained Certificates (45.7%). More boys (46.2%) obtained Certificates than girls (45.1%), while more girls obtained Statements (49.4%) than boys (48.1%).
The proportion of girls and boys who failed the examinations did not differ significantly (5.50% girls and 5.76% boys).
Overall, the performance by certificate classification in the 2018 examination was lower than that of 2017 (See Table 2).
iv. Performance According to School Type
Analysis of the examination results across all school types revealed that Grant-Aided schools were the best performing followed by Private schools. GRZ schools were on the third position while Community schools were the least performing schools in the 2018 grade 9 Examinations. This trend in performance has been consistent over the past years.
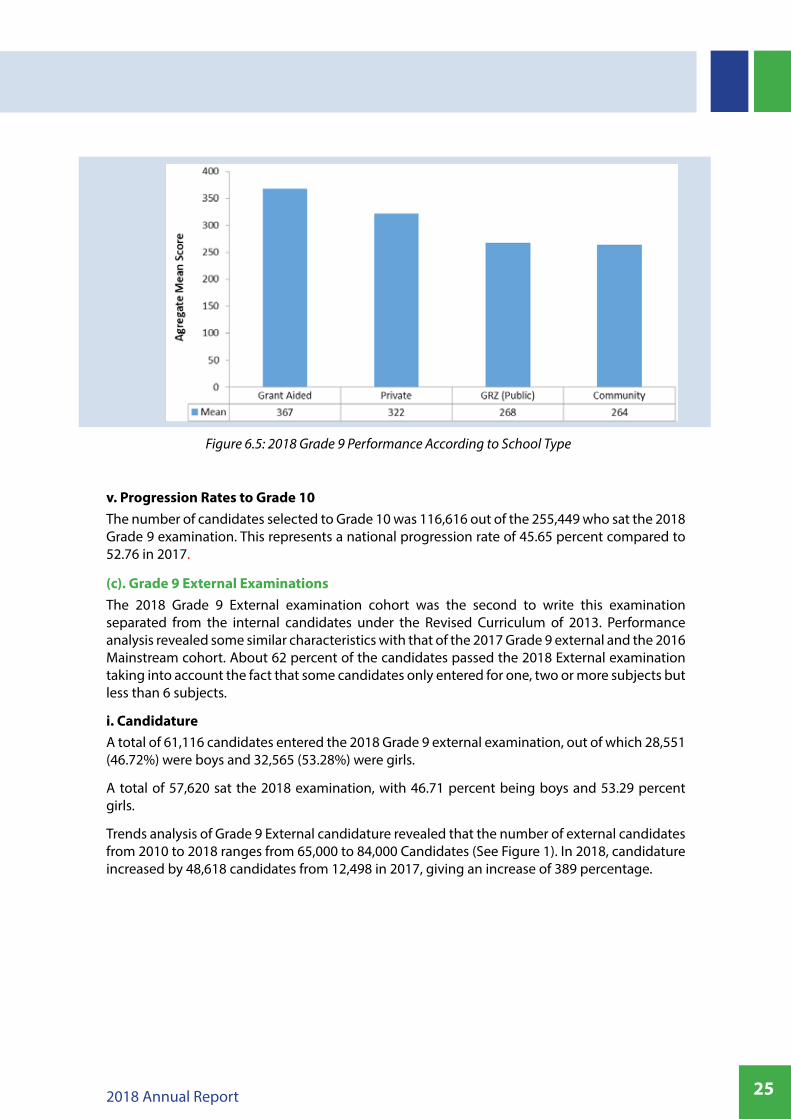
252018 Annual Report
Figure 6.5: 2018 Grade 9 Performance According to School Type
v. Progression Rates to Grade 10 The number of candidates selected to Grade 10 was 116,616 out of the 255,449 who sat the 2018 Grade 9 examination. This represents a national progression rate of 45.65 percent compared to 52.76 in 2017.
(c). Grade 9 External ExaminationsThe 2018 Grade 9 External examination cohort was the second to write this examination separated from the internal candidates under the Revised Curriculum of 2013. Performance analysis revealed some similar characteristics with that of the 2017 Grade 9 external and the 2016 Mainstream cohort. About 62 percent of the candidates passed the 2018 External examination taking into account the fact that some candidates only entered for one, two or more subjects but less than 6 subjects.
i. CandidatureA total of 61,116 candidates entered the 2018 Grade 9 external examination, out of which 28,551 (46.72%) were boys and 32,565 (53.28%) were girls.
A total of 57,620 sat the 2018 examination, with 46.71 percent being boys and 53.29 percent girls.
Trends analysis of Grade 9 External candidature revealed that the number of external candidates from 2010 to 2018 ranges from 65,000 to 84,000 Candidates (See Figure 1). In 2018, candidature increased by 48,618 candidates from 12,498 in 2017, giving an increase of 389 percentage.
26 2018 Annual Report
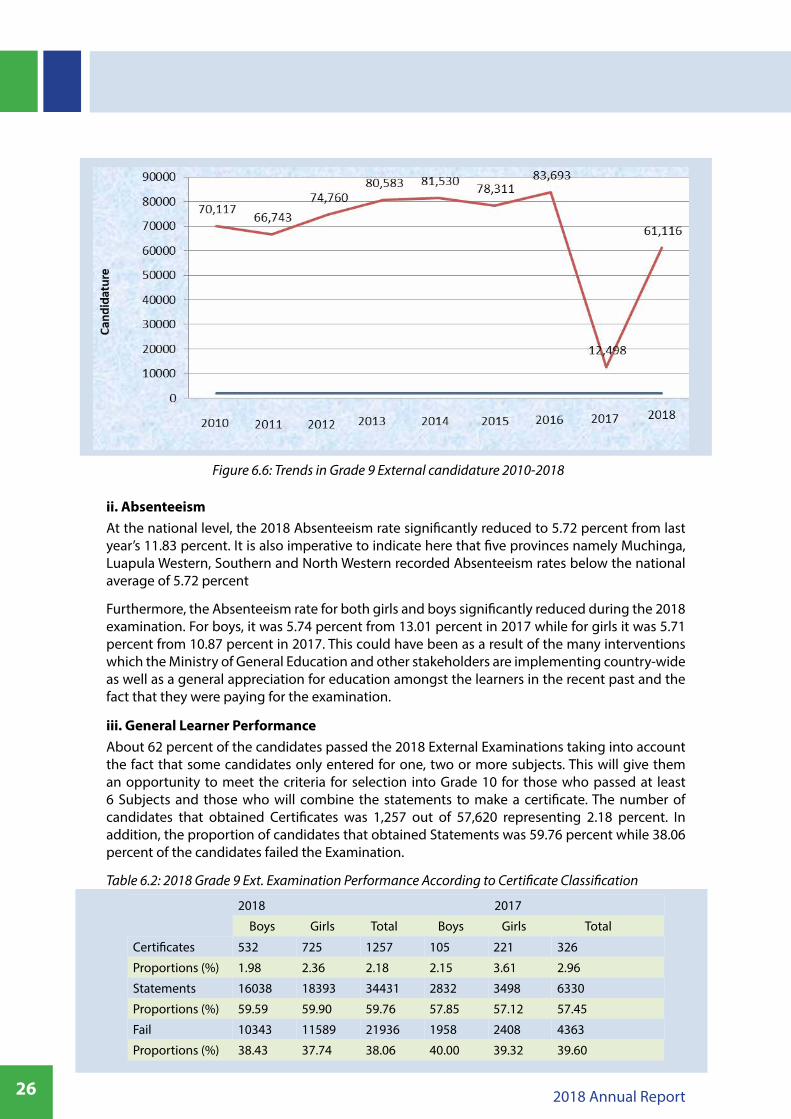
Figure 6.6: Trends in Grade 9 External candidature 2010-2018
ii. AbsenteeismAt the national level, the 2018 Absenteeism rate significantly reduced to 5.72 percent from last year’s 11.83 percent. It is also imperative to indicate here that five provinces namely Muchinga, Luapula Western, Southern and North Western recorded Absenteeism rates below the national average of 5.72 percent
Furthermore, the Absenteeism rate for both girls and boys significantly reduced during the 2018 examination. For boys, it was 5.74 percent from 13.01 percent in 2017 while for girls it was 5.71 percent from 10.87 percent in 2017. This could have been as a result of the many interventions which the Ministry of General Education and other stakeholders are implementing country-wide as well as a general appreciation for education amongst the learners in the recent past and the fact that they were paying for the examination.
iii. General Learner PerformanceAbout 62 percent of the candidates passed the 2018 External Examinations taking into account the fact that some candidates only entered for one, two or more subjects. This will give them an opportunity to meet the criteria for selection into Grade 10 for those who passed at least 6 Subjects and those who will combine the statements to make a certificate. The number of candidates that obtained Certificates was 1,257 out of 57,620 representing 2.18 percent. In addition, the proportion of candidates that obtained Statements was 59.76 percent while 38.06 percent of the candidates failed the Examination.
Table 6.2: 2018 Grade 9 Ext. Examination Performance According to Certificate Classification
2018 2017
Boys Girls Total Boys Girls Total
Certificates 532 725 1257 105 221 326
Proportions (%) 1.98 2.36 2.18 2.15 3.61 2.96
Statements 16038 18393 34431 2832 3498 6330
Proportions (%) 59.59 59.90 59.76 57.85 57.12 57.45
Fail 10343 11589 21936 1958 2408 4363
Proportions (%) 38.43 37.74 38.06 40.00 39.32 39.60
272018 Annual Report
6.2. SCHOOL CERTIFICATE COMMITTEEThe School Certificate Committee presides over the Joint School Certificate and General Certificate of Education (GCE) Examinations on behalf of the Council. The Committee comprised of eight (8) members as listed below:
Mr Henry C. Tukombe ChairpersonMr James Chilufya Vice ChairpersonProf. Jassiel N. Zulu MemberMrs Josephine S. Lungu MemberMr James Chomba MemberCol. Lloyd K. Mwila MemberSr. Theresa Mukuka MemberMr Beard Mwanza MemberMr Benson Banda MemberMr Ian Chirambo Secretary
Matters Considered and Approved by the Committee
6.2.1. Approval of 2018 Examination Centre Status
The Committee approved 64 applications for the 2018 examination Centre status. In the same vein, the Committee resolved that the GCE Centres applying for reinstatement of their examination Centre status needed to submit an application just like Centres applying for the first time.
6.2.2. Unreliable ExaminersArising from the Report citing 7 unreliable examiners during the 2017 Grade 12 marking session, the committee resolved to discontinue the examiners from marking examinations.
6.2.3. The 2017 pending GCE Examination MalpracticesThe Committee resolved to pend two cases of the 2017 GCE Candidates until the scripts were taken for forensic verification. Furthermore, the Committee resolved the 2017 Grade 12 examination malpractice cases.
6.2.4. Amendments to the Grade 12 Examination RegulationsThe Committee considered and approved the amendments to the Grade 12 Examination regulations. In addition, the Committee considered and approved the 2018 Grade 12 and GCE examination time tables.
6.2.5. Approval of 2018 Grade 12 Internal and GCE Examination ResultsThe Committee approved the 2018 examination results as follows:
(a) The School Certificate ExaminationThe 2018 Grade 12 Examination saw a decrease in candidature as well as the proportions of candidates obtaining School Certificates. Although candidature has decreased in 2018, a trends analysis of candidature over the past ten years shows a steady increase. This is an indication that the nation continues making steady progress towards the attainment of the educational goals of access and quality in line with the SDG number 4 and access to secondary level of education. The performance was relatively high among Practical Subjects as compared to other subject groupings.
28 2018 Annual Report
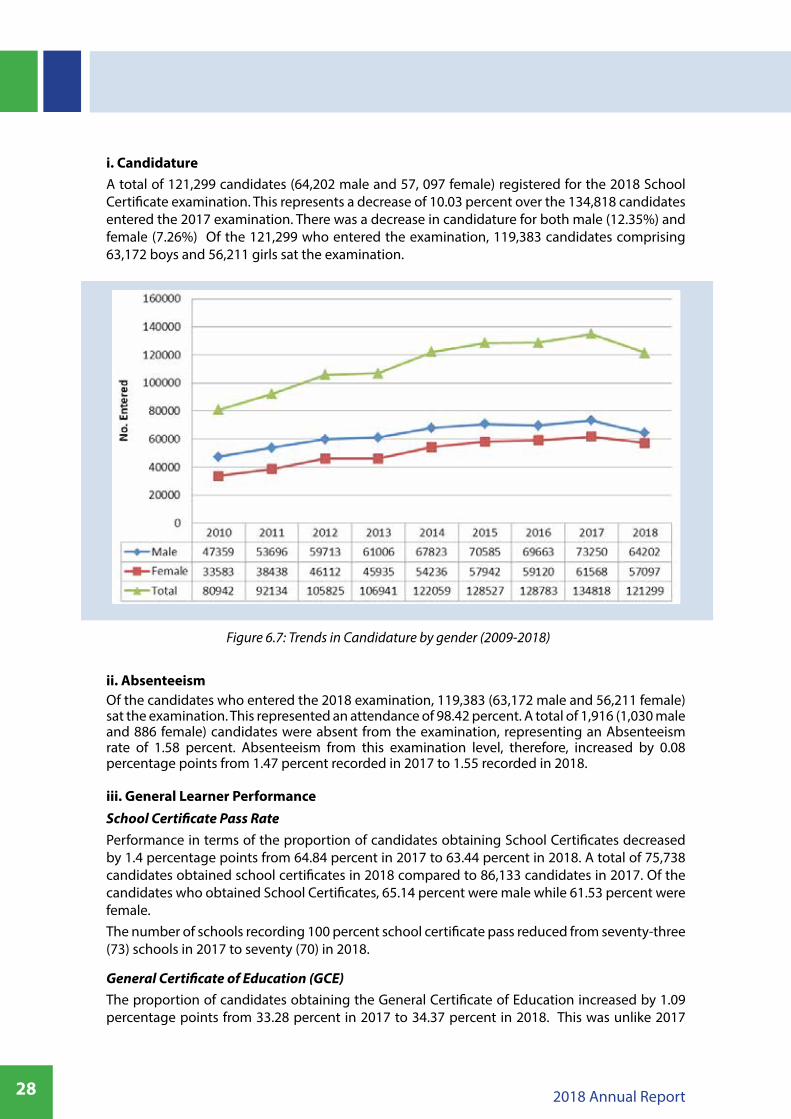
i. CandidatureA total of 121,299 candidates (64,202 male and 57, 097 female) registered for the 2018 School Certificate examination. This represents a decrease of 10.03 percent over the 134,818 candidates entered the 2017 examination. There was a decrease in candidature for both male (12.35%) and female (7.26%) Of the 121,299 who entered the examination, 119,383 candidates comprising 63,172 boys and 56,211 girls sat the examination.
Figure 6.7: Trends in Candidature by gender (2009-2018)
ii. AbsenteeismOf the candidates who entered the 2018 examination, 119,383 (63,172 male and 56,211 female) sat the examination. This represented an attendance of 98.42 percent. A total of 1,916 (1,030 male and 886 female) candidates were absent from the examination, representing an Absenteeism rate of 1.58 percent. Absenteeism from this examination level, therefore, increased by 0.08 percentage points from 1.47 percent recorded in 2017 to 1.55 recorded in 2018.
iii. General Learner Performance School Certificate Pass RatePerformance in terms of the proportion of candidates obtaining School Certificates decreased by 1.4 percentage points from 64.84 percent in 2017 to 63.44 percent in 2018. A total of 75,738 candidates obtained school certificates in 2018 compared to 86,133 candidates in 2017. Of the candidates who obtained School Certificates, 65.14 percent were male while 61.53 percent were female.The number of schools recording 100 percent school certificate pass reduced from seventy-three (73) schools in 2017 to seventy (70) in 2018.
General Certificate of Education (GCE)The proportion of candidates obtaining the General Certificate of Education increased by 1.09 percentage points from 33.28 percent in 2017 to 34.37 percent in 2018. This was unlike 2017
292018 Annual Report
where there was a reduction of 2.42 percentage points from 35.71 percent in 2016 to 33.28 in 2017.
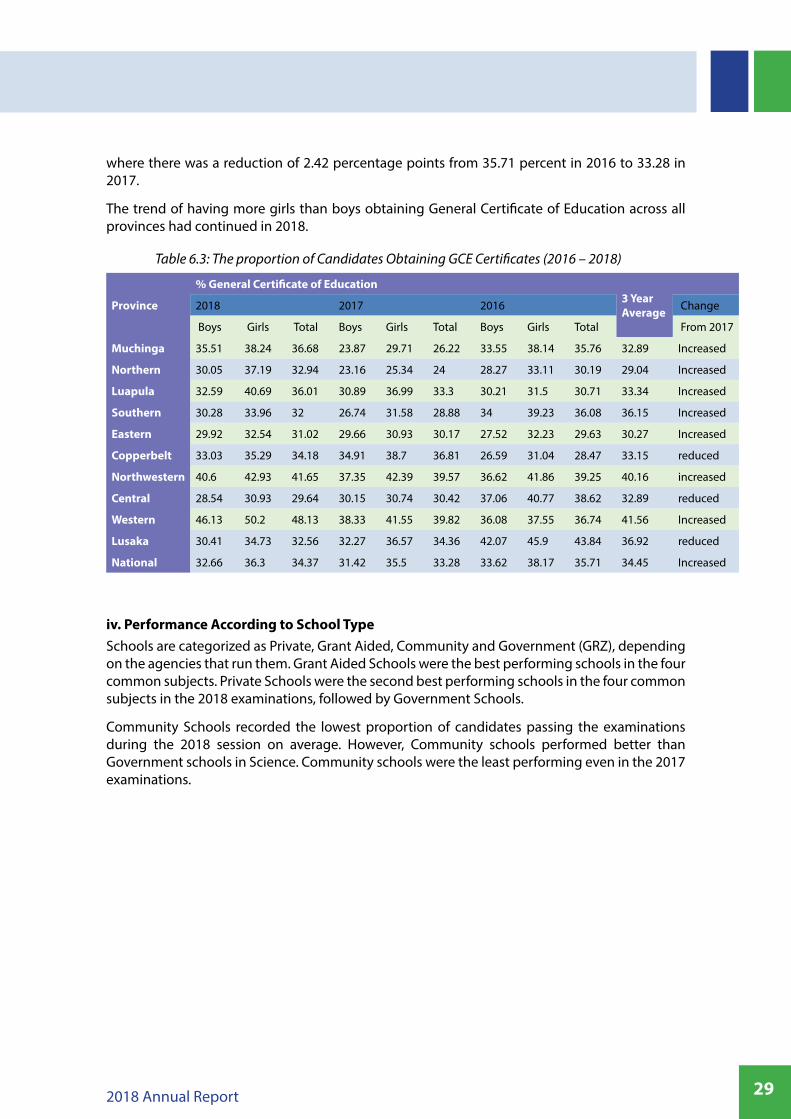
The trend of having more girls than boys obtaining General Certificate of Education across all provinces had continued in 2018.
Table 6.3: The proportion of Candidates Obtaining GCE Certificates (2016 – 2018)
Province
% General Certificate of Education3 Year Average
2018 2017 2016 Change
Boys Girls Total Boys Girls Total Boys Girls Total From 2017
Muchinga 35.51 38.24 36.68 23.87 29.71 26.22 33.55 38.14 35.76 32.89 Increased
Northern 30.05 37.19 32.94 23.16 25.34 24 28.27 33.11 30.19 29.04 Increased
Luapula 32.59 40.69 36.01 30.89 36.99 33.3 30.21 31.5 30.71 33.34 Increased
Southern 30.28 33.96 32 26.74 31.58 28.88 34 39.23 36.08 36.15 Increased
Eastern 29.92 32.54 31.02 29.66 30.93 30.17 27.52 32.23 29.63 30.27 Increased
Copperbelt 33.03 35.29 34.18 34.91 38.7 36.81 26.59 31.04 28.47 33.15 reduced
Northwestern 40.6 42.93 41.65 37.35 42.39 39.57 36.62 41.86 39.25 40.16 increased
Central 28.54 30.93 29.64 30.15 30.74 30.42 37.06 40.77 38.62 32.89 reduced
Western 46.13 50.2 48.13 38.33 41.55 39.82 36.08 37.55 36.74 41.56 Increased
Lusaka 30.41 34.73 32.56 32.27 36.57 34.36 42.07 45.9 43.84 36.92 reduced
National 32.66 36.3 34.37 31.42 35.5 33.28 33.62 38.17 35.71 34.45 Increased
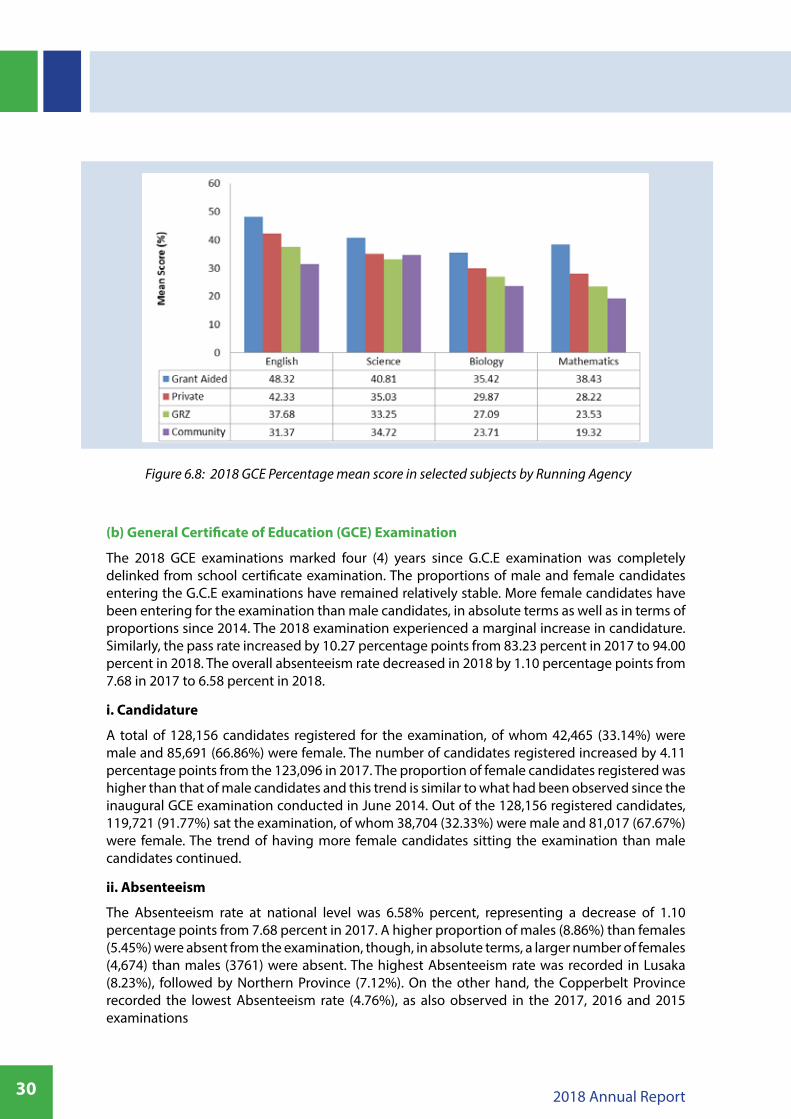
iv. Performance According to School Type Schools are categorized as Private, Grant Aided, Community and Government (GRZ), depending on the agencies that run them. Grant Aided Schools were the best performing schools in the four common subjects. Private Schools were the second best performing schools in the four common subjects in the 2018 examinations, followed by Government Schools.
Community Schools recorded the lowest proportion of candidates passing the examinations during the 2018 session on average. However, Community schools performed better than Government schools in Science. Community schools were the least performing even in the 2017 examinations.
30 2018 Annual Report
Figure 6.8: 2018 GCE Percentage mean score in selected subjects by Running Agency
(b) General Certificate of Education (GCE) Examination
The 2018 GCE examinations marked four (4) years since G.C.E examination was completely delinked from school certificate examination. The proportions of male and female candidates entering the G.C.E examinations have remained relatively stable. More female candidates have been entering for the examination than male candidates, in absolute terms as well as in terms of proportions since 2014. The 2018 examination experienced a marginal increase in candidature. Similarly, the pass rate increased by 10.27 percentage points from 83.23 percent in 2017 to 94.00 percent in 2018. The overall absenteeism rate decreased in 2018 by 1.10 percentage points from 7.68 in 2017 to 6.58 percent in 2018.
i. Candidature
A total of 128,156 candidates registered for the examination, of whom 42,465 (33.14%) were male and 85,691 (66.86%) were female. The number of candidates registered increased by 4.11 percentage points from the 123,096 in 2017. The proportion of female candidates registered was higher than that of male candidates and this trend is similar to what had been observed since the inaugural GCE examination conducted in June 2014. Out of the 128,156 registered candidates, 119,721 (91.77%) sat the examination, of whom 38,704 (32.33%) were male and 81,017 (67.67%) were female. The trend of having more female candidates sitting the examination than male candidates continued.
ii. Absenteeism
The Absenteeism rate at national level was 6.58% percent, representing a decrease of 1.10 percentage points from 7.68 percent in 2017. A higher proportion of males (8.86%) than females (5.45%) were absent from the examination, though, in absolute terms, a larger number of females (4,674) than males (3761) were absent. The highest Absenteeism rate was recorded in Lusaka (8.23%), followed by Northern Province (7.12%). On the other hand, the Copperbelt Province recorded the lowest Absenteeism rate (4.76%), as also observed in the 2017, 2016 and 2015 examinations
312018 Annual Report
iii. General Performance
A General Certificate of Education is awarded to a candidate who obtains GRADE ONE TO EIGHT in at least one subject. A candidate who scores Grade 9 in all subjects will have failed the examination.
The proportion of candidates obtaining GCE Certificates was 94.00 percent, representing an increase of 10.77 percentage points from 83.23 percent in 2017. Within group, comparison indicated that there were more females (94.57%) than male (92.83%) candidates obtaining GCE certificates in the 2018 GCE examination. In 2017, males had obtained more (84.64%) certificates than female (83.94%). All provinces recorded over 90 percentage pass rate. The highest proportion of GCE certificates was from the Copperbelt Province (96.50%) followed by Lusaka Province (94.26%). Copperbelt and Lusaka had the highest proportion of candidates obtaining GCE certificates in the 2017 examination as well. The lowest proportion of GCE certificates was recorded by Western Province (91.21%), followed by Muchinga Province (91.58%).
32 2018 Annual Report
6.3. TEACHER EDUCATION COMMITTEE
The Teacher Education Committee presided over the Teacher Education Examinations of behalf of Council. The Committee comprised the following members:
Mr Peter Chishimba ChairpersonMrs Beauty C. Mwanansoka Vice ChairpersonMr James Chomba Member Mr Bishop F. M. Mwale MemberMrs Cecilia Sakala MemberMr Lazarous B.Y. Kalirani MemberMr Chola Simpasa MemberMr Simon R. Chomba MemberMr Muyangwa Kamutumwa MemberMrs Banji M. Shakubanza Secretary
Matters Considered and Approved by the Committee 6.3.1. Application for Examination Centre StatusThe Committee approved five (5) applications for the examination centre status for Early Childhood Education, Primary Teacher’s Diploma and Junior Secondary Teacher’s Diploma.
6.3.2. Non Remittance of Examination feesThe Committee received and considered a report on the non-remittance of examination fees by some Colleges.
6.3.3. The 2018 Teacher Education Examination TimetableThe Committee considered and approved the 2018 Teacher Education Examination Timetable. In addition, the Committee discussed and made amendments to the draft teacher education examination regulations.
6.3.4. Graduation Ceremonies PreparationsThe Committee was informed that the consultative meeting with college principals on preparations for graduation ceremonies took place. Malcom Moffat was the first to hold its graduation ceremony for Examinations underwritten by ECZ.
6.3.5. Syllabi for ECE and PTDThe Committee received a report on the examination syllabi for ECE and PTD that they were being commercially printed by Book world Africa.
6.3.6. 2018 Teacher Education Candidate registrationThe Committee received a report on Teacher Education Candidate registration which showed a decrease in the number of candidates registered for 2018 especially first years.
6.3.7. Approval of Teacher Education Examinations ResultsThe Committee approved the 2018 Examination results as follows:
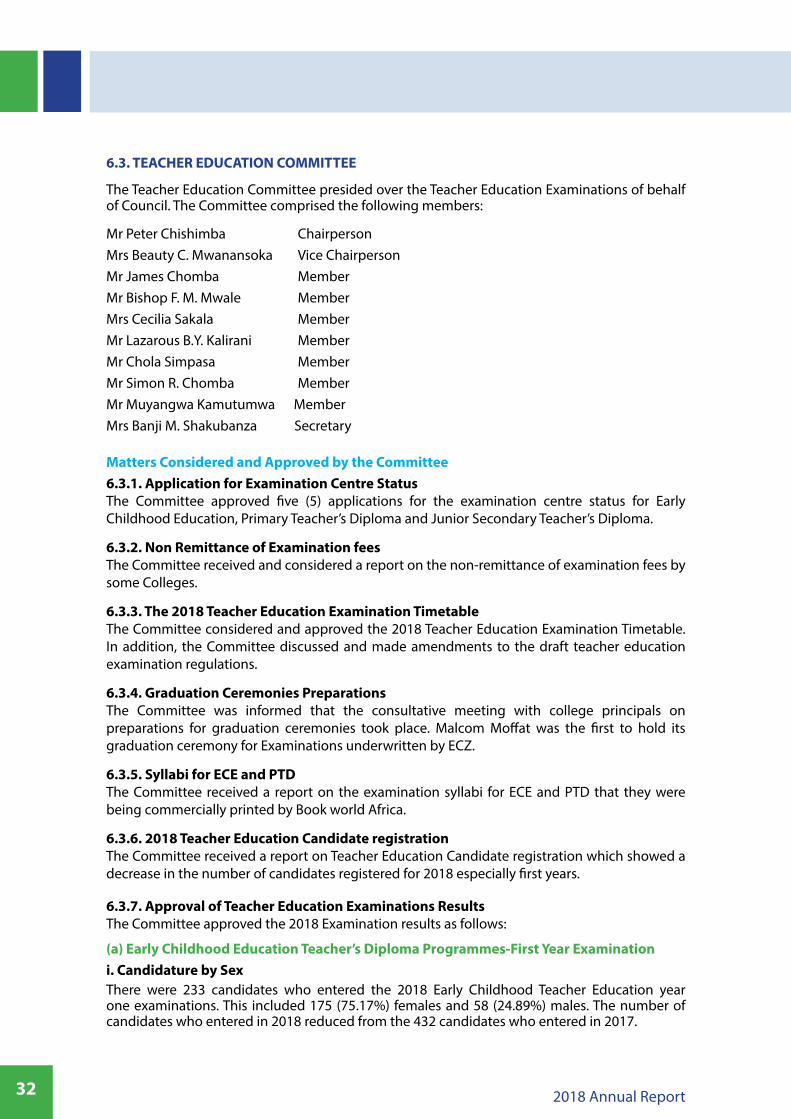
(a) Early Childhood Education Teacher’s Diploma Programmes-First Year Examinationi. Candidature by SexThere were 233 candidates who entered the 2018 Early Childhood Teacher Education year one examinations. This included 175 (75.17%) females and 58 (24.89%) males. The number of candidates who entered in 2018 reduced from the 432 candidates who entered in 2017.
75%
25%
Female
Male
332018 Annual Report
Two hundred and ten (210) candidates (90.13%) from the 233 who entered the Early Childhood Teacher Education year one examination sat the examination. Therefore, the absenteeism rate was at 9.87 percent and comprised of 16 females (9.14% of the females who entered) and 7 males (12.08% of males who entered).
Figure 6.9: ECE Year 1 Candidature by Sex 2018
ii. General PerformanceOf the candidates that sat the 2018 ECE year one diploma examination, 183 (87.14%) obtained clear pass, 25 (11.90%) proceeded, 1 (0.48%) referred and 1 (0.48%) excluded. Similar to 2017, no candidate was recorded under the category of repeating. The proportion of candidates obtaining clear pass increased from 82.82 percent in 2017 to 87.14 percent in 2018.
In terms of performance based on proportions of clear passes obtained, Kasama College of Education and Malcom Moffat College of Education had 100 percent, followed by David Livingstone College of Education (96.67%), and Chipata Colleges of Education (95.45%). On the other hand, Sambizga and Kitwe Colleges of Education had the least proportions at 25.00 percent and 71.43 percent respectively. The overall performance indicated that public colleges did better than private colleges.
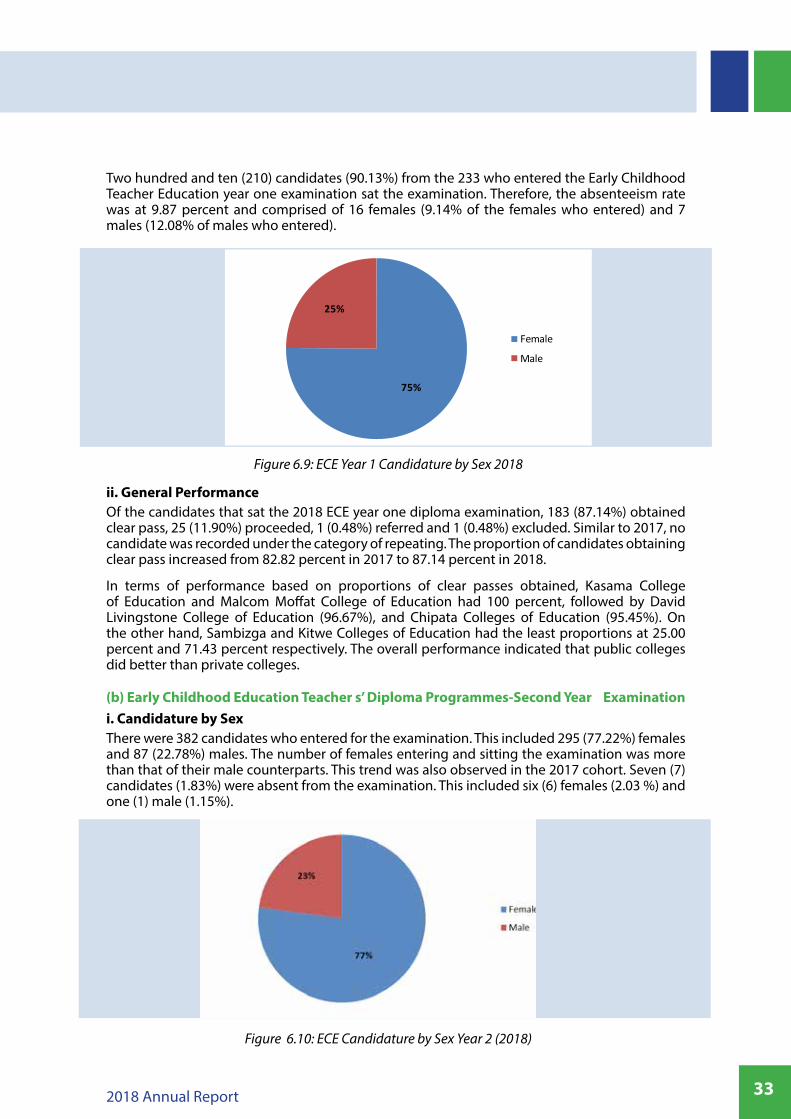
(b) Early Childhood Education Teacher s’ Diploma Programmes-Second Year Examinationi. Candidature by SexThere were 382 candidates who entered for the examination. This included 295 (77.22%) females and 87 (22.78%) males. The number of females entering and sitting the examination was more than that of their male counterparts. This trend was also observed in the 2017 cohort. Seven (7) candidates (1.83%) were absent from the examination. This included six (6) females (2.03 %) and one (1) male (1.15%).
Figure 6.10: ECE Candidature by Sex Year 2 (2018)
34 2018 Annual Report
ii. General PerformanceOf the candidates that sat the 2018 year II ECE diploma examination, 336 (89.60%) obtained clear pass, 33 (8.80%) proceeded, 2 (0.53%) referred, 1 (0.27%) repeated and 3 (0.80%) were excluded from the program.
The proportion of candidates obtaining clear pass in 2018 increased by 2.06 percentage points. Performance by number of clear passes obtained showed that Monze College of Education, Chipata College of Education, Pekanya College of Education, Solwezi College of Education, Mwarona College of Education and Eden Institute all recorded a 100 percent pass.
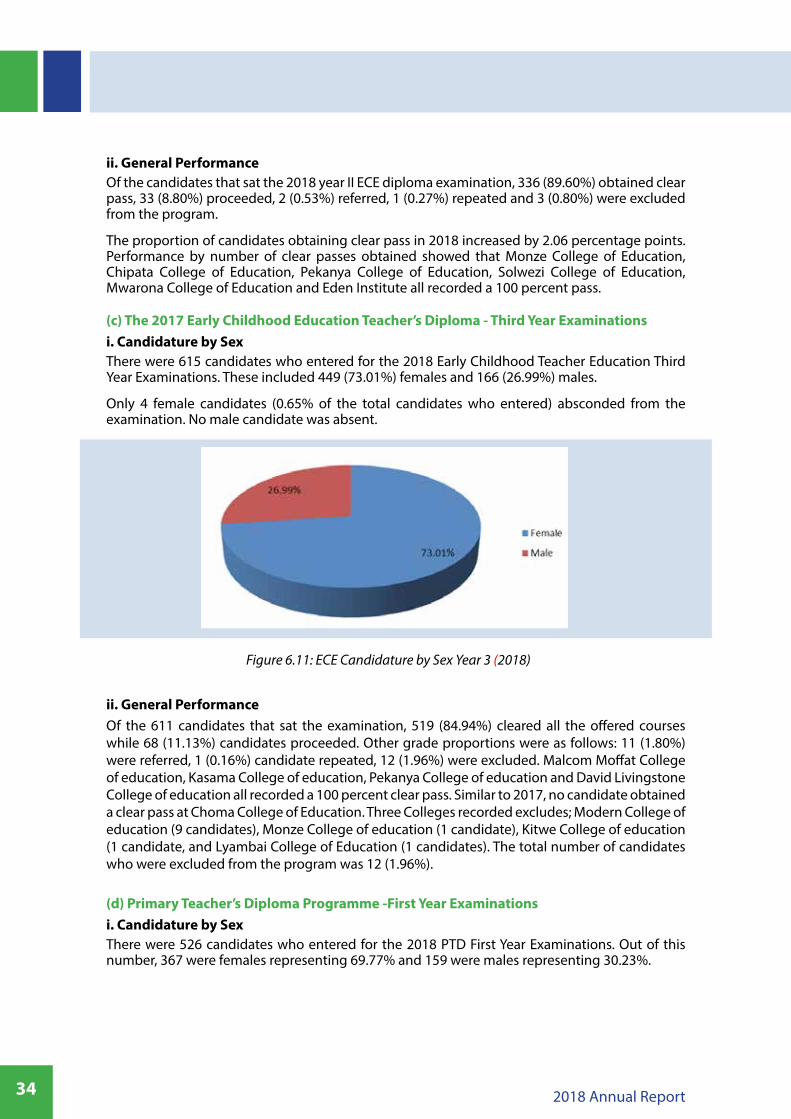
(c) The 2017 Early Childhood Education Teacher’s Diploma - Third Year Examinationsi. Candidature by SexThere were 615 candidates who entered for the 2018 Early Childhood Teacher Education Third Year Examinations. These included 449 (73.01%) females and 166 (26.99%) males.
Only 4 female candidates (0.65% of the total candidates who entered) absconded from the examination. No male candidate was absent.
Figure 6.11: ECE Candidature by Sex Year 3 (2018)
ii. General PerformanceOf the 611 candidates that sat the examination, 519 (84.94%) cleared all the offered courses while 68 (11.13%) candidates proceeded. Other grade proportions were as follows: 11 (1.80%) were referred, 1 (0.16%) candidate repeated, 12 (1.96%) were excluded. Malcom Moffat College of education, Kasama College of education, Pekanya College of education and David Livingstone College of education all recorded a 100 percent clear pass. Similar to 2017, no candidate obtained a clear pass at Choma College of Education. Three Colleges recorded excludes; Modern College of education (9 candidates), Monze College of education (1 candidate), Kitwe College of education (1 candidate, and Lyambai College of Education (1 candidates). The total number of candidates who were excluded from the program was 12 (1.96%).
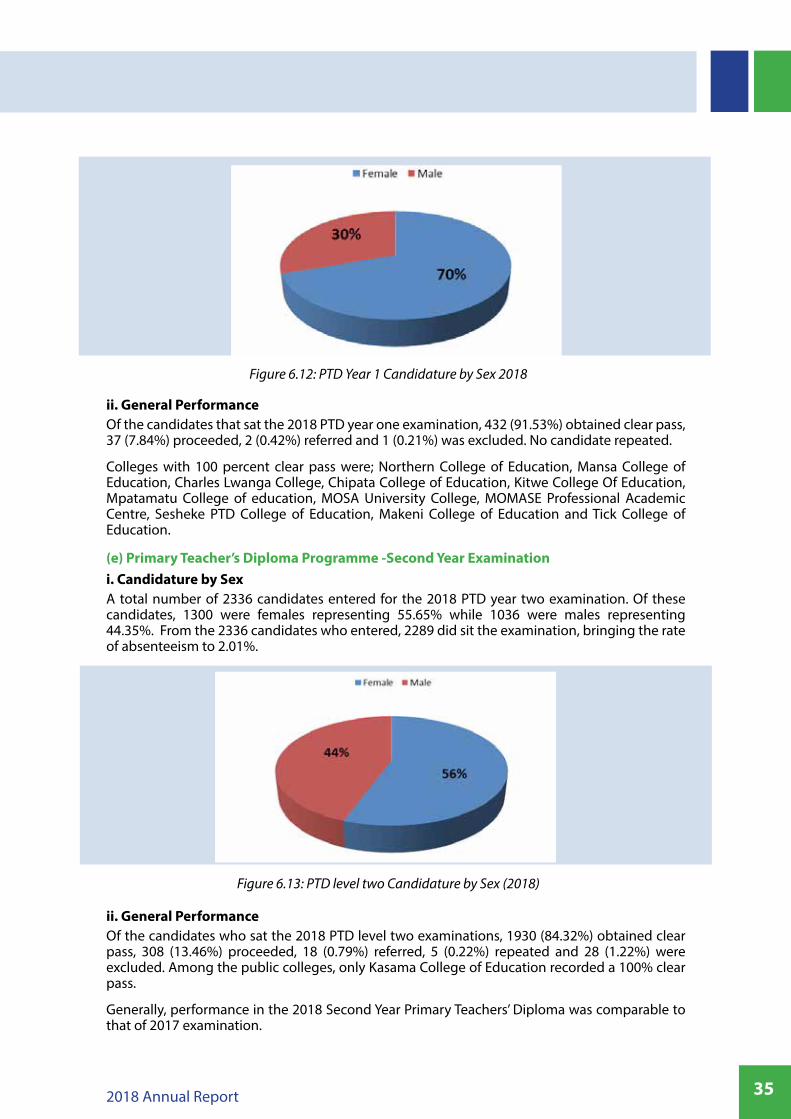
(d) Primary Teacher’s Diploma Programme -First Year Examinationsi. Candidature by SexThere were 526 candidates who entered for the 2018 PTD First Year Examinations. Out of this number, 367 were females representing 69.77% and 159 were males representing 30.23%.
352018 Annual Report
Figure 6.12: PTD Year 1 Candidature by Sex 2018
ii. General PerformanceOf the candidates that sat the 2018 PTD year one examination, 432 (91.53%) obtained clear pass, 37 (7.84%) proceeded, 2 (0.42%) referred and 1 (0.21%) was excluded. No candidate repeated.
Colleges with 100 percent clear pass were; Northern College of Education, Mansa College of Education, Charles Lwanga College, Chipata College of Education, Kitwe College Of Education, Mpatamatu College of education, MOSA University College, MOMASE Professional Academic Centre, Sesheke PTD College of Education, Makeni College of Education and Tick College of Education.
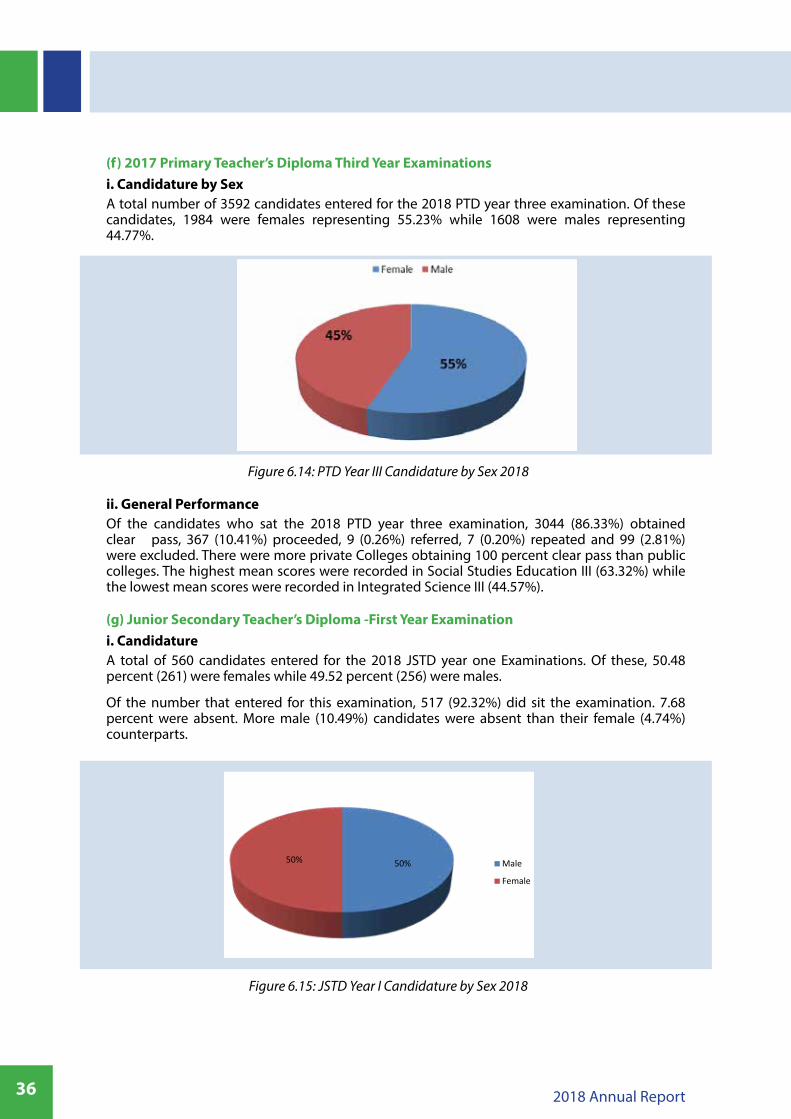
(e) Primary Teacher’s Diploma Programme -Second Year Examinationi. Candidature by SexA total number of 2336 candidates entered for the 2018 PTD year two examination. Of these candidates, 1300 were females representing 55.65% while 1036 were males representing 44.35%. From the 2336 candidates who entered, 2289 did sit the examination, bringing the rate of absenteeism to 2.01%.
Figure 6.13: PTD level two Candidature by Sex (2018)
ii. General PerformanceOf the candidates who sat the 2018 PTD level two examinations, 1930 (84.32%) obtained clear pass, 308 (13.46%) proceeded, 18 (0.79%) referred, 5 (0.22%) repeated and 28 (1.22%) were excluded. Among the public colleges, only Kasama College of Education recorded a 100% clear pass.
Generally, performance in the 2018 Second Year Primary Teachers’ Diploma was comparable to that of 2017 examination.
36 2018 Annual Report
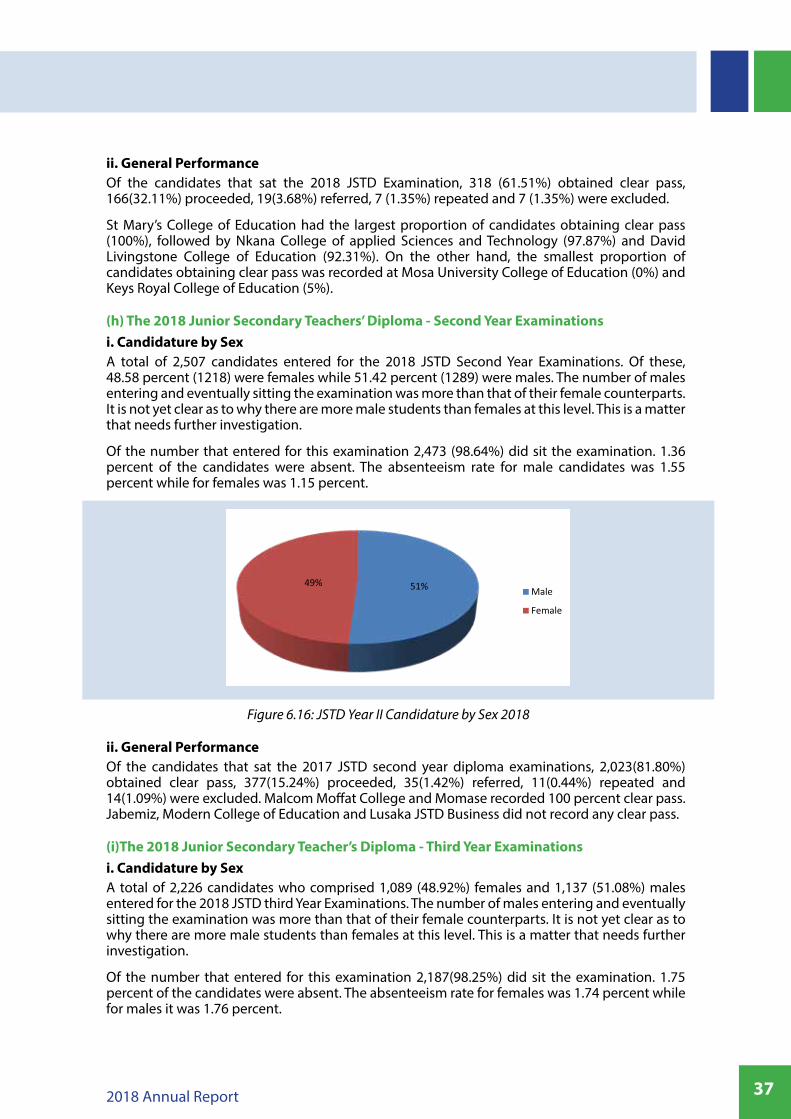
(f) 2017 Primary Teacher’s Diploma Third Year Examinationsi. Candidature by SexA total number of 3592 candidates entered for the 2018 PTD year three examination. Of these candidates, 1984 were females representing 55.23% while 1608 were males representing 44.77%.
Figure 6.14: PTD Year III Candidature by Sex 2018
ii. General PerformanceOf the candidates who sat the 2018 PTD year three examination, 3044 (86.33%) obtained clear pass, 367 (10.41%) proceeded, 9 (0.26%) referred, 7 (0.20%) repeated and 99 (2.81%) were excluded. There were more private Colleges obtaining 100 percent clear pass than public colleges. The highest mean scores were recorded in Social Studies Education III (63.32%) while the lowest mean scores were recorded in Integrated Science III (44.57%).
(g) Junior Secondary Teacher’s Diploma -First Year Examinationi. CandidatureA total of 560 candidates entered for the 2018 JSTD year one Examinations. Of these, 50.48 percent (261) were females while 49.52 percent (256) were males.
Of the number that entered for this examination, 517 (92.32%) did sit the examination. 7.68 percent were absent. More male (10.49%) candidates were absent than their female (4.74%) counterparts.
Figure 6.15: JSTD Year I Candidature by Sex 2018
50%50% Male
Female
372018 Annual Report
ii. General PerformanceOf the candidates that sat the 2018 JSTD Examination, 318 (61.51%) obtained clear pass, 166(32.11%) proceeded, 19(3.68%) referred, 7 (1.35%) repeated and 7 (1.35%) were excluded.
St Mary’s College of Education had the largest proportion of candidates obtaining clear pass (100%), followed by Nkana College of applied Sciences and Technology (97.87%) and David Livingstone College of Education (92.31%). On the other hand, the smallest proportion of candidates obtaining clear pass was recorded at Mosa University College of Education (0%) and Keys Royal College of Education (5%).
(h) The 2018 Junior Secondary Teachers’ Diploma - Second Year Examinationsi. Candidature by SexA total of 2,507 candidates entered for the 2018 JSTD Second Year Examinations. Of these, 48.58 percent (1218) were females while 51.42 percent (1289) were males. The number of males entering and eventually sitting the examination was more than that of their female counterparts. It is not yet clear as to why there are more male students than females at this level. This is a matter that needs further investigation.
Of the number that entered for this examination 2,473 (98.64%) did sit the examination. 1.36 percent of the candidates were absent. The absenteeism rate for male candidates was 1.55 percent while for females was 1.15 percent.
Figure 6.16: JSTD Year II Candidature by Sex 2018
ii. General PerformanceOf the candidates that sat the 2017 JSTD second year diploma examinations, 2,023(81.80%) obtained clear pass, 377(15.24%) proceeded, 35(1.42%) referred, 11(0.44%) repeated and 14(1.09%) were excluded. Malcom Moffat College and Momase recorded 100 percent clear pass. Jabemiz, Modern College of Education and Lusaka JSTD Business did not record any clear pass.
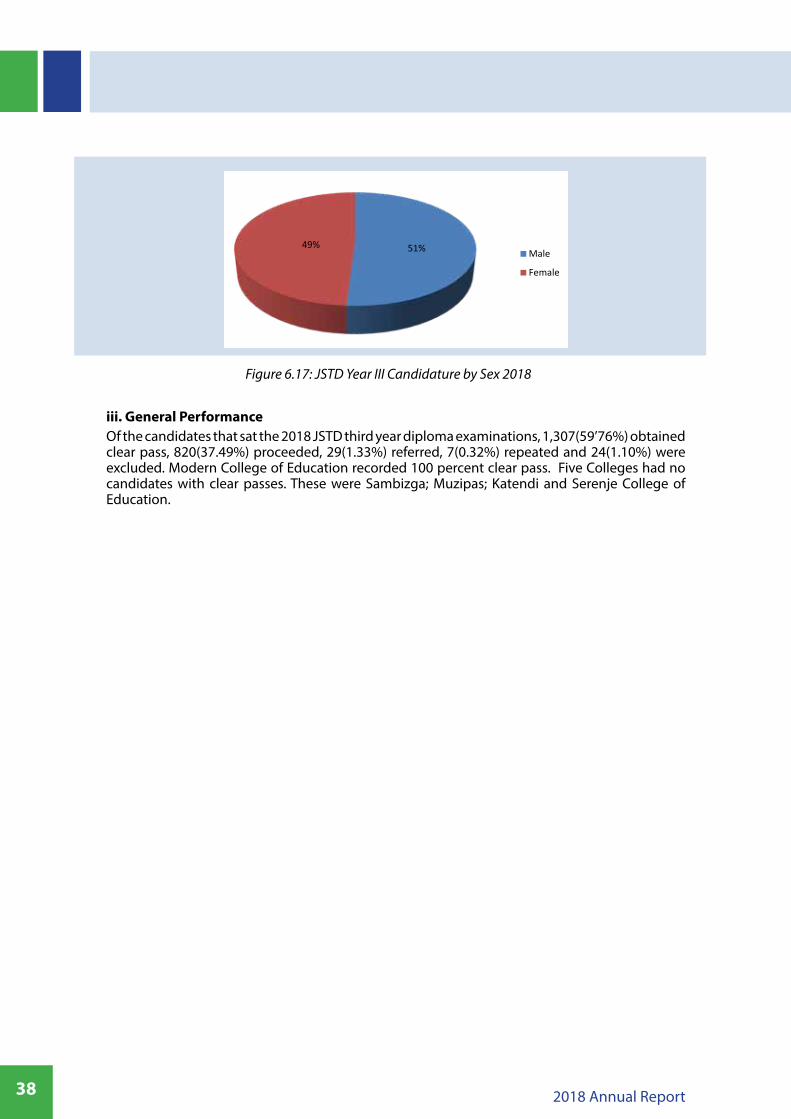
(i)The 2018 Junior Secondary Teacher’s Diploma - Third Year Examinationsi. Candidature by SexA total of 2,226 candidates who comprised 1,089 (48.92%) females and 1,137 (51.08%) males entered for the 2018 JSTD third Year Examinations. The number of males entering and eventually sitting the examination was more than that of their female counterparts. It is not yet clear as to why there are more male students than females at this level. This is a matter that needs further investigation.
Of the number that entered for this examination 2,187(98.25%) did sit the examination. 1.75 percent of the candidates were absent. The absenteeism rate for females was 1.74 percent while for males it was 1.76 percent.
51%49%Male
Female
38 2018 Annual Report
Figure 6.17: JSTD Year III Candidature by Sex 2018
iii. General PerformanceOf the candidates that sat the 2018 JSTD third year diploma examinations, 1,307(59’76%) obtained clear pass, 820(37.49%) proceeded, 29(1.33%) referred, 7(0.32%) repeated and 24(1.10%) were excluded. Modern College of Education recorded 100 percent clear pass. Five Colleges had no candidates with clear passes. These were Sambizga; Muzipas; Katendi and Serenje College of Education.
51%49%Male
Female
392018 Annual Report
6.4. FINANCE AND ADMINISTRATION COMMITTEEThe Finance and Administration Committee was responsible for finance and human resource administration on behalf of the Council. The Committee comprised eight (8) members and a secretary as listed below;
Mr Alex M. Simumba ChairpersonMr Eddie K. Mwitwa Vice ChairpersonMr Jonathan M. Ng’onga Member Mrs Arness T. Siame MemberMrs Alice J. Tembo MemberMrs Elizabeth C. L. Chileshe MemberMr Jeff Mtonga MemberMr Frisco B. Mponela MemberMr Fidelis M. Makala Secretary
6.4.1. Realignment of Structure of the Finance and Accounts DepartmentThe Committee considered the realignment of the Finance and Accounts Department in order to streamline operations and enhance efficiency. The following was resolved and subsequently approved by the Council:
a. Retain one position for Principal Accountantb. Downgrade one position of the Principal Accountant to level of Accountantc. The Two (2) positions at accountant level to be re-designated as Management Accountant
and Financial Accountant respectively.
6.4.2. The Market Value of ECZ Assets, Records Management and Disposal PolicyThe Committee considered and approved the report on the market value of ECZ assets, and recommended for the approval by Council the records management policy and disposal policy. The two policies were expected to provide the guidelines for the management of ECZ Records and Disposal of ECZ assets that meet disposal requirements.
6.4.3. Management’s Accounts for 2018Within the period under review, the Committee considered Management’s Accounts for the fourth quarter of 2017, the first and second quarter of 2018.
6.4.4. Position of Assistant Director Research and Test Development and CertificationWithin the period under review the Committee held internal recruitment activities for the positions of Assistant Director Research and Test Development and Assistant Director Certification. The recommendations for the appointment were approved by Council. The Assistant Director Certification position was among the new positions that were on the newly approved structure after the 2016 Job Evaluation report. The Committee also adopted the amendment made to the terms and conditions of service to include a clause on ‘’retrospective confirmation’’.
6.4.5. 2019 BudgetThe Committee of Council approved the 2019 ECZ Budget. Estimated expenditure was K213,721,255.00 against K216,731,820.00 for 2018.
40 2018 Annual Report
6.5. AUDIT COMMITTEEThe Committee is responsible for ensuring that integrity exists in the utilisation of Council resources and conduct of Council business. The Committee comprised five (5) members and a secretary as listed below:
Ms Wabei N. Mangambwa ChairpersonMr Kelvin Kaluba MemberMs Joyce Phiri Sundano MemberMrs Esther Haamaundu MemberMrs Ngosa Simachela MemberMr Angel M. Kaliminwa Secretary
Matters Considered and Approved by the Committee6.5.1. Internal Audit CharterThe Committee considered and approved the Internal Audit Charter inline with the annual reviews.
6.5.2. Audit Report on the Audit of Fixed AssetsThe Committee directed Management on the need to have ECZ assets properly insured and that all outstanding insurance claims should be settled. In addition, the Committee directed Management on the process they should follow to code ECZ assets.
6.5.3. Audit of Grade 9 Examinations MarkingOn concerns over 2017 Grade 9 examinations report, the Committee directed Management to instruct all panels to conduct coordination meetings at stipulated times.
6.5.4. Lusaka Service Centre Audit ReportOn concerns over the report, the Committee resolved that Management should start sending invoices to all institutions requesting for ECZ services of verification of results.
6.5.5. Compliance Audit ReportThe Committee resolved that Management should always gross up payments and pay all statutory obligations during the time the individuals were being paid.
6.5.6. Audit of ICT SystemsThe Committee was concerned that the ICT Internal Auditor had not yet been recruited; Management indicated that the recruitment process was underway following the resignation of the candidate who had been appointed in the first recruitment process.
6.5.7. Housing Loan SchemeThe Committee asked Management to revise the Housing Loan Schemes policy to ensure that the Certificate of Title are deposited with Council Secretary at the point of sale and only transfers title to the member of staff once full payment is made and insurance cover should be included in the loan amount.
6.5.8. Teacher Education Examination FeesThe Committee directed Management to collect the 2017 teacher education examination fees from all colleges which did not remit the monies.
6.5.9. 2017 Audited Financial Statements The Committee of Council approved the 2017 Audited Financial Statements.
412018 Annual Report
6.6. APPEALS COMMITTEEThe Appeals Committee was responsible for considering of appeals from candidates following the nullification of their results owing to them engaging in examination malpractices. The Committee comprised four (4) members and Secretary as listed below:
Mr Eddie K. Mwitwa ChairpersonSr. Christine Mwape MemberMr Peter Chishimba MemberMrs Beauty C. Mwanansoka MemberMrs Teza N. Musakanya Secretary
6.6.1. 2017 GCE Appeal Cases (Whole Centre)The Committee resolved to uphold the nullification of the 2017 GCE appeal cases because the school did not provide sufficient explanation as to why the hand written answer script for Biology paper 1 was found in a pack with Biology paper 2 scripts.
6.6.2. Appeal by an ExaminerThe Committee resolved that the examiner be assessed based on his current work performance. Thereafter an appraisal report would be tabled before the school certificate committee.
6.6.3. Procedures for Cases of DishonestyThe Committee reviewed the document on procedures for cases of dishonesty and proposed amendments and recommended for Council’s approval.
42 2018 Annual Report
6.7. SECURITY COMMITTEEThe Security Committee is mainly charged with the responsibility of developing and overseeing the implementation of Guidelines for Administration and Management of Examinations in Zambia. The Committee comprised of sixteen (16) members and secretary as listed below:
Dr Sunday Mwape ChairpersonMr Wamuyuwa SitibekisoVice ChairpersonMr James Chomba MemberMr Stephen Chishiko MemberMs Ruth M. Zulu MemberMr Humphrey Simutowe MemberMr Ngosa Kotati MemberDr Allan Lingambe MemberMrs Florence M. Chikalekale MemberMr Paul Ngoma Member Mr Vengi Sinda MemberMrs Jennipher C. Banda MemberMr Felix Z. Ngoma MemberMr Kennedy Mumbi MemberMr Evans Chungu MemberMrs Leah Kasaji MemberMr Moonga Hakalyamba Secretary
Matters Considered and Approved by the Committee6.7.1. Legal Status of Tuition CentresThe Committee requested the Ministry of General Education (MOGE) to engage Patents and Company Registration Agency (PACRA) so that tuition Centres are guided on the complete process of registration that involved registration by MOGE as well.
6.7.2. Fast track ProsecutionThe Committee was informed that the police representatives would consult with the police service on the possibilities of fast track prosecution of examination related cases. This was meant to quicken the process of disposing of examination malpractice cases.
6.7.3. Status of Upgraded Secondary SchoolsThe Committee submitted for the information of the Council a report on the status of upgraded secondary schools which were awarded provisional examination Centre status.
6.7.4. Stakeholder Consultative MeetingThe Committee was informed that MOGE would be calling for a consultative meeting with PEOs and Teacher Unions on the assessment of School Experience for Teacher Education Diploma Candidates.
6.7.5. Bouncing of Money to MarkersThe Committee guided that ECZ could explore other methods such as the use of cards or mobile money.
432018 Annual Report
6.7.6. Training of System AdministratorsThe Committee directed to train system administrators in the provinces on how to transfer marks online before the marking of Grade 9 external and GCE examinations
6.7.7. 2019 Candidate Registration for School ExaminationsThe Committee was informed that the 2019 guidelines and regulations on candidate registration for school examinations were distributed to the examination Centres by 31st July 2018 and that the registration period would run from 1st October 2018 to 31st December 2018 for internal candidates while for Grade 9 external and GCE from 1st October 2018 to 31st January 2019.
6.7.8. Combination of Internal StatementsThe Committee guided thats the ECZ would combine Grade 9 Internal statements to clear the back log to those who wrote the examinations in 2017. After that, no one will be expected to write internal examinations twice as the system would not allow. The submission was resolved by the Council.
6.7.9. Delayed Resolution of GCE Missing ResultsThe Committee instructed the resolving of missing marks at the provincial level since GCE was decentralised. Such a system would expedite the process of resolving marks.
6.7.10. Representation from all Teacher Unions on the Security CommitteeOn concerns that other teacher unions were not members of the Security Committee, union representatives on the Security Committee informed the Committee that they shared the deliberations of the Committee with sister unions. Therefore the current representation was adequate.
Teza N. MusakanyaCOUNCIL SECRETARY
44 2018 Annual Report
Financial Statements
7.0.
452018 Annual Report
46 2018 Annual Report

472018 Annual Report
48 2018 Annual Report
492018 Annual Report
50 2018 Annual Report
512018 Annual Report
52 2018 Annual Report
532018 Annual Report
54 2018 Annual Report
552018 Annual Report
56 2018 Annual Report
572018 Annual Report
58 2018 Annual Report
592018 Annual Report
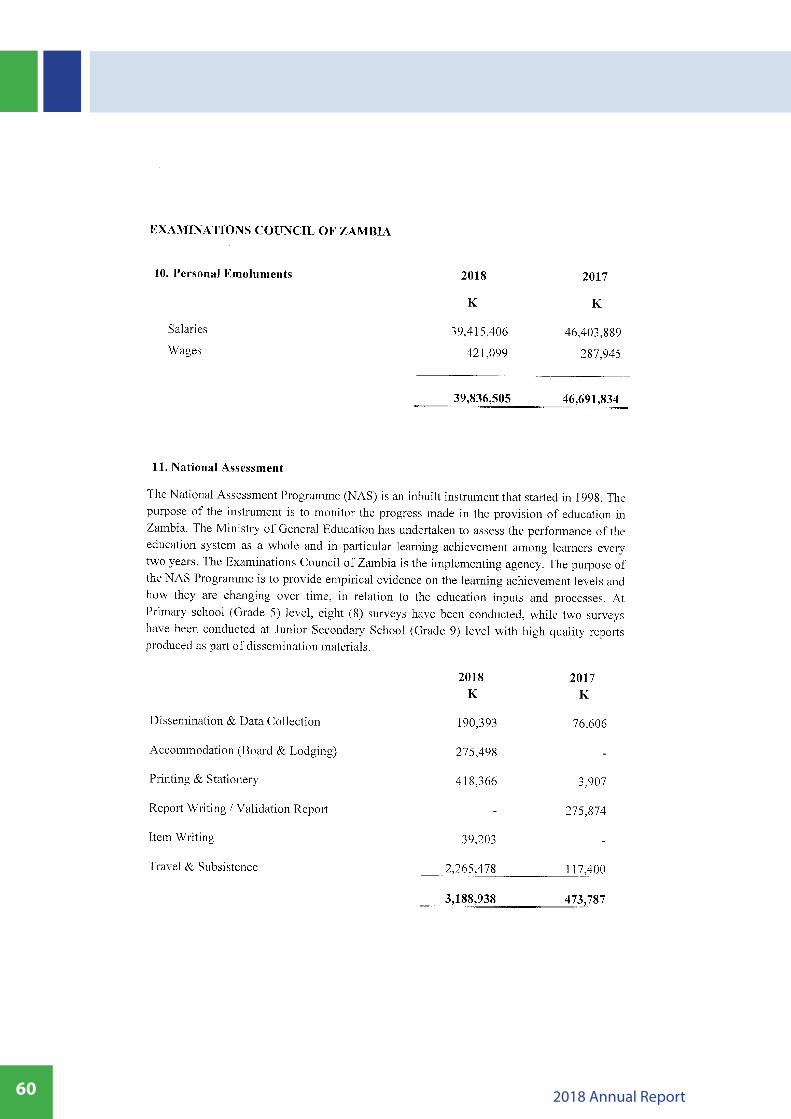
60 2018 Annual Report
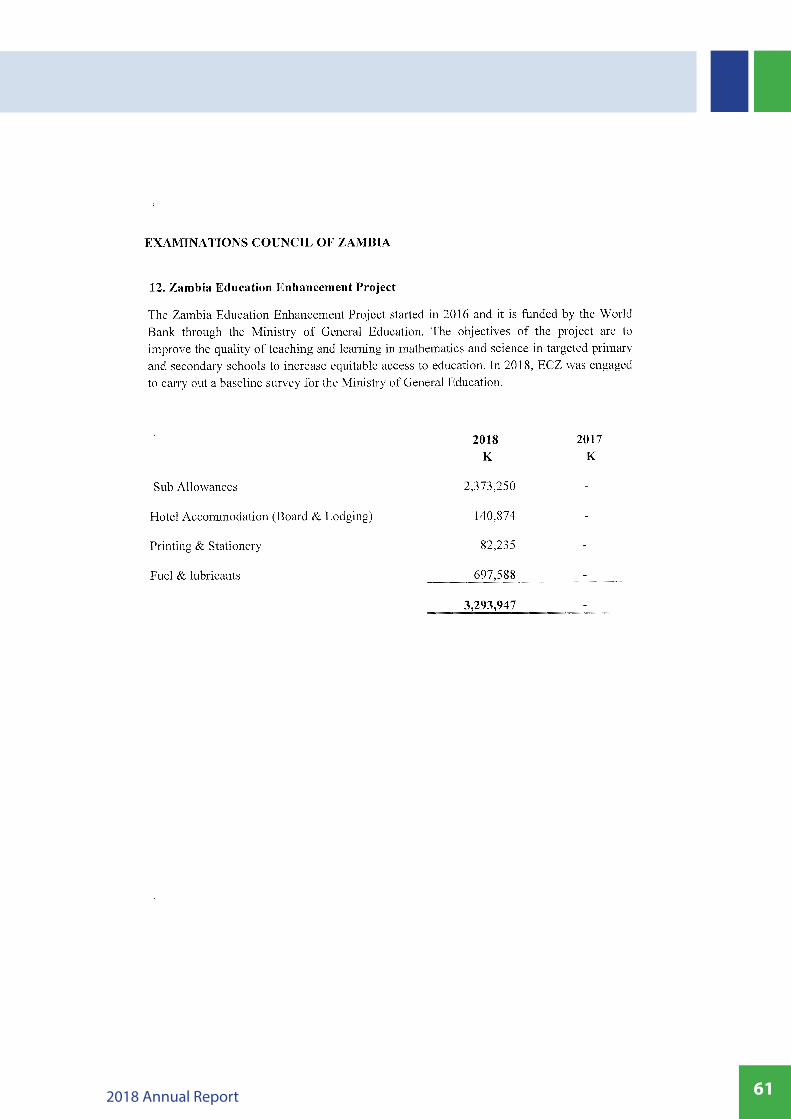
612018 Annual Report
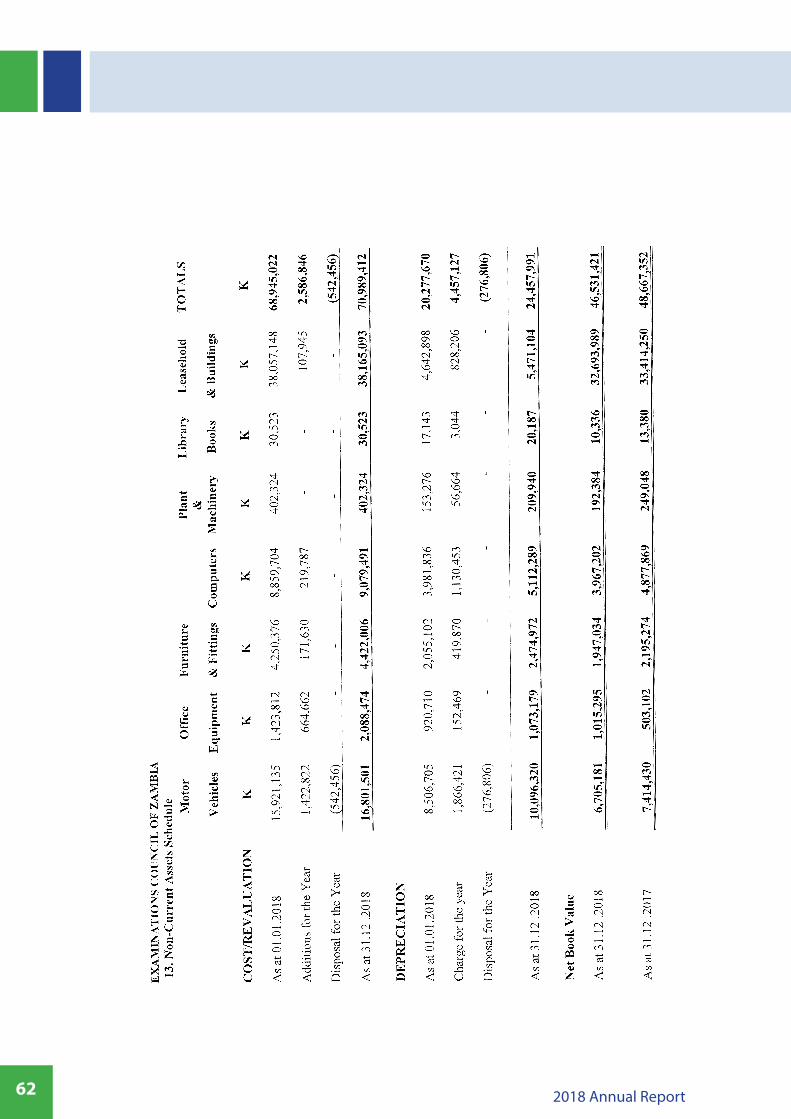
62 2018 Annual Report
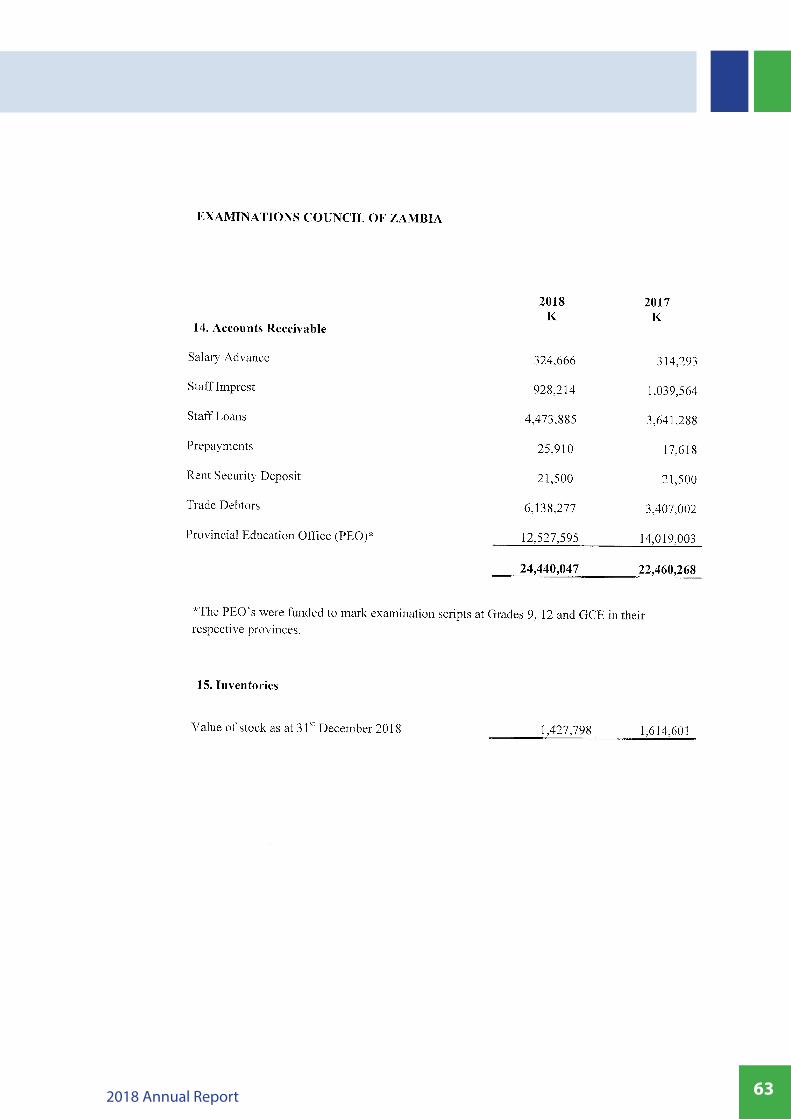
632018 Annual Report
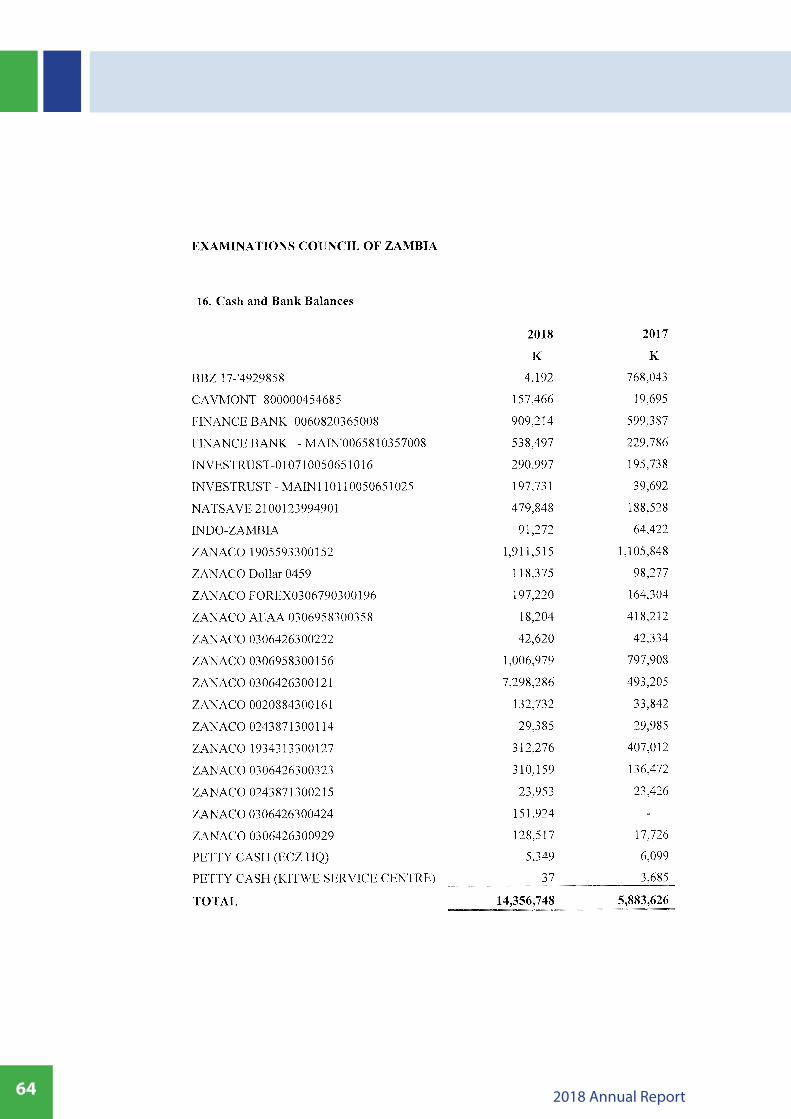
64 2018 Annual Report
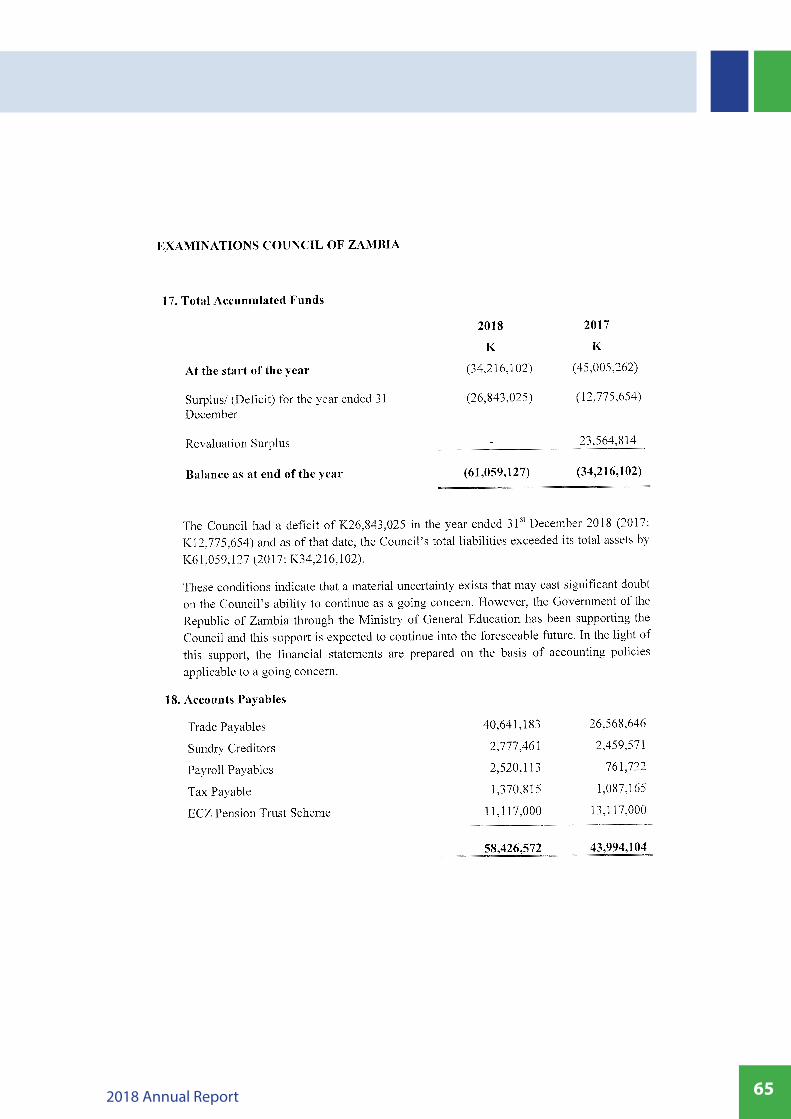
652018 Annual Report
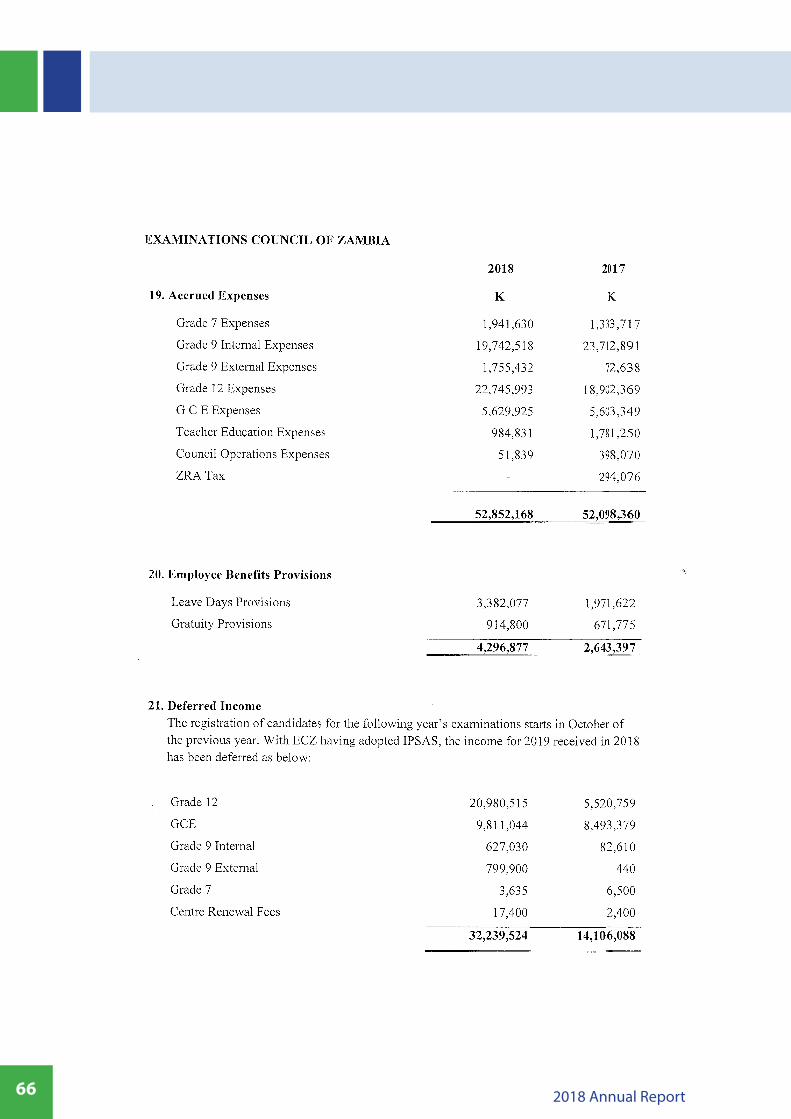
66 2018 Annual Report
672018 Annual Report
Published ByExaminations Council of ZambiaHaile Selassie Avenue, Long Acres
P.O. Box 50432, Lusaka, Zambia.
[email protected]+260 211 252544/ 260 211 252588