
Proteomic and Transcriptomic Analysis of Aspergillus fumigatus on Exposure to Amphotericin B
Mashanov et al. BMC Genomics 2014, 15:357http://www.biomedcentral.com/1471-2164/15/357
RESEARCH ARTICLE Open Access
Transcriptomic changes during regeneration ofthe central nervous system in an echinodermVladimir S Mashanov* †, Olga R Zueva† and José E García-Arrarás
Abstract
Background: Echinoderms are emerging as important models in regenerative biology. Significant amount of dataare available on cellular mechanisms of post-traumatic repair in these animals, whereas studies of gene expression arerare. In this study, we employ high-throughput sequencing to analyze the transcriptome of the normal andregenerating radial nerve cord (a homolog of the chordate neural tube), in the sea cucumber Holothuria glaberrima.
Results: Our de novo assembly yielded 70,173 contigs, of which 24,324 showed significant similarity to knownprotein-coding sequences. Expression profiling revealed large-scale changes in gene expression (4,023 and 3,257up-regulated and down-regulated transcripts, respectively) associated with regeneration. Functional analysis of sets ofdifferentially expressed genes suggested that among the most extensively over-represented pathways were thoseinvolved in the extracellular matrix (ECM) remodeling and ECM-cell interactions, indicating a key role of the ECM inregeneration. We also searched the sea cucumber transcriptome for homologs of factors known to be involved inacquisition and/or control of pluripotency. We identified eleven genes that were expressed both in the normal andregenerating tissues. Of these, only Myc was present at significantly higher levels in regeneration, whereas theexpression of Bmi-1 was significantly reduced. We also sought to get insight into which transcription factors mayoperate at the top of the regulatory hierarchy to control gene expression in regeneration. Our analysis yielded elevenputative transcription factors, which constitute good candidates for further functional studies. The identifiedcandidate transcription factors included not only known regeneration-related genes, but also factors not previouslyimplicated as regulators of post-traumatic tissue regrowth. Functional annotation also suggested that one of thepossible adaptations contributing to fast and efficient neural regeneration in echinoderms may be related tosuppression of excitotoxicity.
Conclusions: Our transcriptomic analysis corroborates existing data on cellular mechanisms implicated inregeneration in sea cucumbers. More importantly, however, it also illuminates new aspects of echinodermregeneration, which have been scarcely studied or overlooked altogether. The most significant outcome of thepresent work is that it lays out a roadmap for future studies of regulatory mechanisms by providing a list of keycandidate genes for functional analysis.
Keywords: Transcriptome, RNA-seq, Gene expression, Regeneration, Echinoderm, Nervous system, Transcriptionfactors, Injury, Extracellular matrix
*Correspondence: [email protected]†Equal contributorsDepartment of Biology, University of Puerto Rico, PO Box 70377, PR00936-8377 San Juan, USA
© 2014 Mashanov et al.; licensee BioMed Central Ltd. This is an Open Access article distributed under the terms of the CreativeCommons Attribution License (http://creativecommons.org/licenses/by/2.0), which permits unrestricted use, distribution, andreproduction in any medium, provided the original work is properly credited. The Creative Commons Public Domain Dedicationwaiver (http://creativecommons.org/publicdomain/zero/1.0/) applies to the data made available in this article, unless otherwisestated.
Mashanov et al. BMC Genomics 2014, 15:357 Page 2 of 21http://www.biomedcentral.com/1471-2164/15/357
BackgroundEchinoderms constitute a phylum of marine invertebratesclosely related to chordates. Their phylogenetic positionas a non-chordate deuterostome phylum combined withthe ability to regenerate various body parts makes thema valuable group, which can give unique insights intofundamental issues of regenerative biology and providenew clues to finding better treatment of human condi-tions. Recent analyses of cellular events underlying post-traumatic regeneration in echinoderms (reviewed in [1,2])identified interesting parallels with corresponding pro-cesses in regeneration-competent vertebrates, pointing toreparative mechanisms that might have been evolutionarypreserved throughout Deuterostomia and could poten-tially be re-activated in poorly regenerating vertebrates.However, the paucity of genomic and transcriptomicinformation has precluded major progress in under-standing key regulators of regeneration at the molecularlevel [3,4].
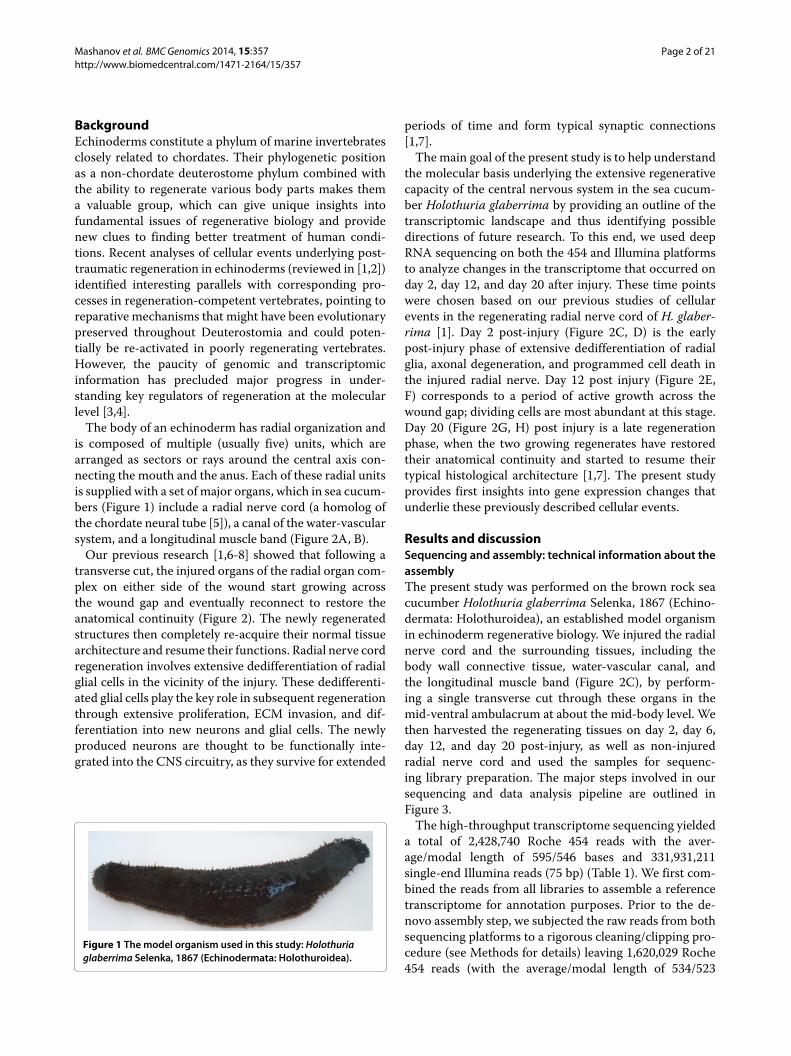
The body of an echinoderm has radial organization andis composed of multiple (usually five) units, which arearranged as sectors or rays around the central axis con-necting the mouth and the anus. Each of these radial unitsis supplied with a set of major organs, which in sea cucum-bers (Figure 1) include a radial nerve cord (a homolog ofthe chordate neural tube [5]), a canal of the water-vascularsystem, and a longitudinal muscle band (Figure 2A, B).
Our previous research [1,6-8] showed that following atransverse cut, the injured organs of the radial organ com-plex on either side of the wound start growing acrossthe wound gap and eventually reconnect to restore theanatomical continuity (Figure 2). The newly regeneratedstructures then completely re-acquire their normal tissuearchitecture and resume their functions. Radial nerve cordregeneration involves extensive dedifferentiation of radialglial cells in the vicinity of the injury. These dedifferenti-ated glial cells play the key role in subsequent regenerationthrough extensive proliferation, ECM invasion, and dif-ferentiation into new neurons and glial cells. The newlyproduced neurons are thought to be functionally inte-grated into the CNS circuitry, as they survive for extended
Figure 1 The model organism used in this study: Holothuriaglaberrima Selenka, 1867 (Echinodermata: Holothuroidea).
periods of time and form typical synaptic connections[1,7].
The main goal of the present study is to help understandthe molecular basis underlying the extensive regenerativecapacity of the central nervous system in the sea cucum-ber Holothuria glaberrima by providing an outline of thetranscriptomic landscape and thus identifying possibledirections of future research. To this end, we used deepRNA sequencing on both the 454 and Illumina platformsto analyze changes in the transcriptome that occurred onday 2, day 12, and day 20 after injury. These time pointswere chosen based on our previous studies of cellularevents in the regenerating radial nerve cord of H. glaber-rima [1]. Day 2 post-injury (Figure 2C, D) is the earlypost-injury phase of extensive dedifferentiation of radialglia, axonal degeneration, and programmed cell death inthe injured radial nerve. Day 12 post injury (Figure 2E,F) corresponds to a period of active growth across thewound gap; dividing cells are most abundant at this stage.Day 20 (Figure 2G, H) post injury is a late regenerationphase, when the two growing regenerates have restoredtheir anatomical continuity and started to resume theirtypical histological architecture [1,7]. The present studyprovides first insights into gene expression changes thatunderlie these previously described cellular events.
Results and discussionSequencing and assembly: technical information about theassemblyThe present study was performed on the brown rock seacucumber Holothuria glaberrima Selenka, 1867 (Echino-dermata: Holothuroidea), an established model organismin echinoderm regenerative biology. We injured the radialnerve cord and the surrounding tissues, including thebody wall connective tissue, water-vascular canal, andthe longitudinal muscle band (Figure 2C), by perform-ing a single transverse cut through these organs in themid-ventral ambulacrum at about the mid-body level. Wethen harvested the regenerating tissues on day 2, day 6,day 12, and day 20 post-injury, as well as non-injuredradial nerve cord and used the samples for sequenc-ing library preparation. The major steps involved in oursequencing and data analysis pipeline are outlined inFigure 3.
The high-throughput transcriptome sequencing yieldeda total of 2,428,740 Roche 454 reads with the aver-age/modal length of 595/546 bases and 331,931,211single-end Illumina reads (75 bp) (Table 1). We first com-bined the reads from all libraries to assemble a referencetranscriptome for annotation purposes. Prior to the de-novo assembly step, we subjected the raw reads from bothsequencing platforms to a rigorous cleaning/clipping pro-cedure (see Methods for details) leaving 1,620,029 Roche454 reads (with the average/modal length of 534/523

Mashanov et al. BMC Genomics 2014, 15:357 Page 3 of 21http://www.biomedcentral.com/1471-2164/15/357
Figure 2 Histological organization of the radial organ complex in non-injured (A, B) and regenerating animals on day 2 (C, D), 12 (E, F),and 20 (G, H) post injury. All micrographs are longitudinal paraffin sections, except for A insert, which is a cross section. All sections were stainedwith Heindenhein’s azan. The right column (B, D, F, H) shows high magnification views of the boxed areas in the corresponding images of the leftcolumn (A, C, E, G, respectively). e, epidermis; hc, hyponeural canal; lm, longitudinal muscle; rnc, radial nerve cord; wvc, water-vascular canal.Arrows show the location of the plane of injury. The arrowhead in F shows the growing tip of the regenerating radial nerve cord.
bases, respectively) and 246,993,807 Illumina reads (withthe average/modal length of 57/61 bases, respectively)for further analysis (Table 1). All cleaned 454 reads wereassembled with MIRA (Figure 3) into 125,828 contigswith the mean length of 676 bp and N50 (i.e., the con-tig length such that 50% of the total assembled sequenceis contained in contigs of this size or longer) of 720 bp(Table 2). Illumina reads were assembled with Velvet and
Oases (Figure 3). De Bruijn graph assemblers, such asVelvet/Oases, are known to be sensitive to the value ofparameter k, which is under the control of the user. Ithas been shown that the use of a single k-mer length mayresult in suboptimal de novo transcriptome assemblies [9].For a given assembly, the best k-mer value depends on thecoverage depth (which is distributed over wide ranges innon-normalized libraries), the sequencing error rate, and

Mashanov et al. BMC Genomics 2014, 15:357 Page 4 of 21http://www.biomedcentral.com/1471-2164/15/357
Figure 3 Summary of major steps involved in library preparation, sequencing, assembly, and annotation workflow.
the complexity of the transcriptome. Changing the k-mervalue in either direction (i.e., increasing or decreasing) isassociated with both pros and cons. Using higher k-mervalues increases specificity and leads to a better assemblyof highly expressed transcripts, whereas lower k-mer val-ues improves sensitivity and allows better reconstructionof weakly expressed transcripts [9,10]. Therefore, sevenseparate assembly runs were performed with differentk-mer length (ranging from 31 to 55). They yieldedbetween 50,903 and 237,177 contigs (assemblies withthe higher k-mer value producing the lower number ofcontigs), with the mean length of 674 – 800 bp, themaximum length of 16,096 – 27,112, and N50 rang-ing between 1,377 and 1,555 (Table 2). Then all MIRAand Velvet contigs were pooled together and used as aninput for the final assembly run with the CAP3 program(Figure 3), which produced 70,173 contigs with dramat-ically improved mean length (1,558 bp) and N50 (2,767bp) and the maximum length of 27,089 bp (Table 2). We
refer to this final set of 70,173 contigs (available in theLabArchives notebook [11]) as a reference library, whichrepresents the transcriptional diversity in the normal andregenerating radial organ complex of the sea cucumber H.glaberrima, and which we used for functional annotationand read mapping (Figure 3). Previously, 53 of these con-tigs were found to correspond to 36 long terminal repeat(LTR) transposons. Homology analysis and expressionpattern of these mobile genetic elements were character-ized in detail elsewhere [12,13] and, therefore, will not becovered in this study.
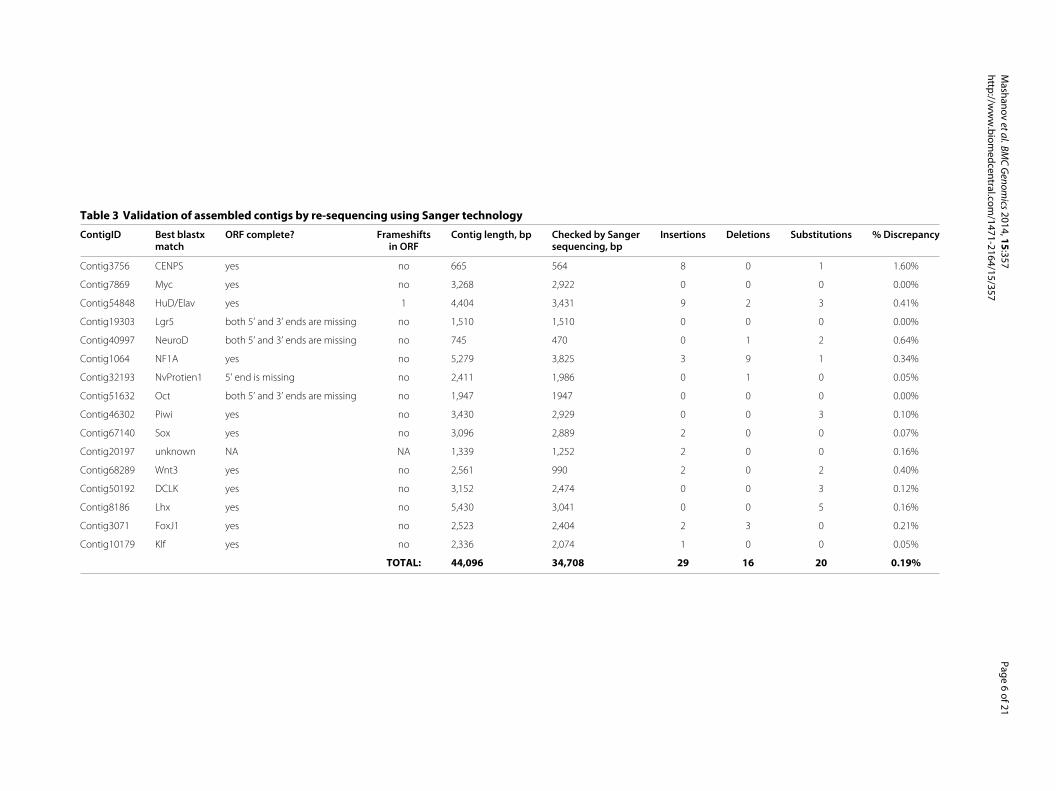
To assess the accuracy of our sequencing and assemblypipeline, we re-sequenced 16 randomly selected con-tigs from the reference library using Sanger technol-ogy (Table 3). In total, 34,708 nt of 44,096 nt (∼79%)were analyzed by re-sequencing. The overall error rate(determined as a percentage of mismatch between Sangersequencing and next-generation RNA-seq) was 0.19%,with insertions, deletions, and substitutions affecting

Mashanov et al. BMC Genomics 2014, 15:357 Page 5 of 21http://www.biomedcentral.com/1471-2164/15/357
Table 1 Summary statistics of sequencing runs and read processing
Total number Total number Mean read Modal (most frequent) Read lengthof reads of bases length read length range
Total Raw 454 reads 2,428,740 1,444,989,971 595 546 49 – 1,201
Total Cleaned 454 reads 1,620,029 864,494,207 534 523 60 – 994
Raw Illimina Norm #1 41,062,198 3,079,664,850 75 75 75
Raw Illimina Norm #2 41,396,915 3,104,768,625 75 75 75
Raw Illimina d2 #1 40,461,887 3,034,641,525 75 75 75
Raw Illimina d2 #2 42,713,246 3,203,493,450 75 75 75
Raw Illimina d12 #1 42,485,405 3,186,405,375 75 75 75
Raw Illimina d12 #2 42,718,652 3,203,898,900 75 75 75
Raw Illimina d20 #1 38,333,067 2,874,980,025 75 75 75
Raw Illimina d20 #2 42,759,841 3,206,988,075 75 75 75
Total Raw Illumina 331,931,211 24,894,840,825 75 75 75
Cleaned Illimina Norm #1 30,668,029 1,760,422,119 57 61 32 – 61
Cleaned Illimina Norm #2 29,685,397 1,717,566,430 58 61 32 – 61
Cleaned Illimina d2 #1 28,982,010 1,648,498,857 57 61 32 – 61
Cleaned Illimina d2 #2 30,382,668 1,721,162,425 57 61 32 – 61
Cleaned Illimina d12 #1 33,755,449 1,947,272,365 58 61 32 – 61
Cleaned Illimina d12 #2 33,893,212 1,956,101,048 58 61 32 – 61
Cleaned Illimina d20 #1 29,670,665 1,697,625,162 57 61 32 – 61
Cleaned Illimina d20 #2 29,956,377 1,693,992,519 57 61 32 – 61
Total Cleaned Illumina 246,993,807 14,142,640,925 57 61 32–61
29 nt, 16 nt, and 20 nt, respectively. Eleven of theresequenced transcripts had a complete open readingframe (ORF), in four contigs both the 5’ and 3’ ends ofthe ORF were incomplete, in one contig, only the 5’ endwas missing, and one contig was likely a non-coding RNA.One of the 14 ORF-containing contigs had a frameshifterror.
In order to determine the proportion of the con-tigs in the reference library, which corresponded toknown proteins, we performed a BLASTX search against
publicly available protein databases. In the first round ofsearch, the sequences were matched against the Swissprotdatabase. The contigs, which did not produce hitspassing the significance threshold corresponding to anE-value < 1e-6 were subsequently subjected to a secondround of BLASTX search against the non-redundant (nr)NCBI protein database with the same threshold. Overall,24,324 (or 33.66%) contigs had significant BLAST hits.The results of the BLAST analysis are listed in Additionalfile 1.
Table 2 Summary statistics for the intermediate and final assembly steps
Total number Total number Mean Length N50of contigs of bases length, nt range, nt
Normalized and non-normalized 454 reads combined 125,828 85,117,028 676 100 – 20,566 720
Velvet (k-mer length=31) 237,177 162,204,944 684 100 – 16,096 1,555
Velvet (k-mer length=37) 188,901 127,287,870 674 100 – 27,112 1,496
Velvet (k-mer length=41) 158,033 111,038,497 703 100 – 27,083 1,554
Velvet (k-mer length=45) 133,348 93,061,666 698 100 – 25,388 1,464
Velvet (k-mer length=51) 87,923 63,748,786 725 100 – 23,585 1,377
Velvet (k-mer length=55) 50,903 40,710,596 800 100 – 23,018 1,386
Reference Assembly (CAP3) 70,173 109,360,184 1,558 100 – 27,089 2,767
Mashanov
etal.BMC
Genom
ics2014,15:357
Page6
of21http
://ww
w.b
iomedcentral.com
/1471-2164/15/357
Table 3 Validation of assembled contigs by re-sequencing using Sanger technology
ContigID Best blastx ORF complete? Frameshifts Contig length, bp Checked by Sanger Insertions Deletions Substitutions % Discrepancymatch in ORF sequencing, bp
Contig3756 CENPS yes no 665 564 8 0 1 1.60%
Contig7869 Myc yes no 3,268 2,922 0 0 0 0.00%
Contig54848 HuD/Elav yes 1 4,404 3,431 9 2 3 0.41%
Contig19303 Lgr5 both 5’ and 3’ ends are missing no 1,510 1,510 0 0 0 0.00%
Contig40997 NeuroD both 5’ and 3’ ends are missing no 745 470 0 1 2 0.64%
Contig1064 NF1A yes no 5,279 3,825 3 9 1 0.34%
Contig32193 NvProtien1 5’ end is missing no 2,411 1,986 0 1 0 0.05%
Contig51632 Oct both 5’ and 3’ ends are missing no 1,947 1947 0 0 0 0.00%
Contig46302 Piwi yes no 3,430 2,929 0 0 3 0.10%
Contig67140 Sox yes no 3,096 2,889 2 0 0 0.07%
Contig20197 unknown NA NA 1,339 1,252 2 0 0 0.16%
Contig68289 Wnt3 yes no 2,561 990 2 0 2 0.40%
Contig50192 DCLK yes no 3,152 2,474 0 0 3 0.12%
Contig8186 Lhx yes no 5,430 3,041 0 0 5 0.16%
Contig3071 FoxJ1 yes no 2,523 2,404 2 3 0 0.21%
Contig10179 Klf yes no 2,336 2,074 1 0 0 0.05%
TOTAL: 44,096 34,708 29 16 20 0.19%
Mashanov et al. BMC Genomics 2014, 15:357 Page 7 of 21http://www.biomedcentral.com/1471-2164/15/357
We also annotated the sea cucumber transcriptome byperforming reciprocal best BLAST hit analysis (with athreshold e-value < 1e-6) versus the NCBI’s collectionof the sea urchin Strongylocentrotus purpuratus predictedprotein sequences [14], the echinoderm species whosegenome has been most thoroughly characterized so far.There were 23,637 one-way BLASTX matches betweenthe H. glaberrima contigs and the S. purpuratus proteinsand 19,869 one-way TBLASTN matches between the seaurchin proteins and the contigs of our transcriptome. Thenumber of reciprocal blast matches (putative orthologoussequences) was 8,577. The results of this analysis are listedin Additional file 2.
We, obviously, do not expect all our 70,173 contigs torepresent individual sea cucumber genes. It is impossibleto give an exact answer on the number of unique genesrepresented by de novo assembled contigs without hav-ing complete genomic information. Thus, we can onlyprovide an educated guess here. The genome of thesea urchin S. purpuratus [15] encodes ∼23,300 genes,of which ∼7,000 are presumed orthologs of mammaliangenes. In the course of our analysis, a similar number(8,522) of unique mouse proteins showed significant sim-ilarity to sequences contained in the assembled transcrip-tome of H. glaberrima. If we assume the same level ofgenomic similarity between mammals and each of the twoechinoderm species, the similar number of “mammaliangenes” observed in the sea urchin genome and the seacucumber transcriptome would imply that (i) sea cucum-bers have roughly the same number of genes as sea urchins(∼23,000), and (ii) most of these genes are representedin our reference library constructed from mRNA samplesfrom non-injured and regenerating animals. If the abovereasoning is correct, there is a ∼ 3× redundancy in ourassembly.
A similar redundancy ratio (∼ 2.4×) can be obtained,if we consider that, when blasted against the referencemouse proteome, 20,619 of 70,173 contigs of the seacucumber reference library matched 8,522 unique mouseproteins. Some of this redundancy is part of the “natural”variation that is expected from differences in mRNAprocessing (such as splicing). In fact, when manuallyinspecting assembled contigs, we saw polymorphic tran-scripts, which were especially common among retroele-ments. Additional variation can be due to the limitationsof the sequencing techniques and/or de novo assemblyprograms.
Differential gene expression in radial organ complexregenerationTo characterize differentially regulated genes involved inregeneration, we mapped the reads from each of the eightIllumina libraries (two biological replicates for each of thefour conditions — non-injured animals and regenerating
organs on days 2, 12 and 20 post-injury) to the con-tigs of the reference library (Figure 3). Gene expressionvalues in each pair of replicates showed high correla-tion (Pearson’s product-moment correlation coefficientr = 0.94 – 0.98, p < 2.2e-16) (Additional file 3). We thenused the DESeq package [16] to identify sets of signifi-cantly up- and down-regulated genes in the regeneratingtissues as compared with the intact animals (Figure 4).Upon imposing a threshold adjusted P value (Padj) of lessthan 0.001 and a threshold fold change of 2, we identifieda total of 4,023 and 3,257 transcripts, which were differen-tially up-regulated and down-regulated, respectively. Thedistribution of unique and overlapping sets of the differ-entially expressed genes at different time points is summa-rized in Figure 4B. Note that the early post-injury phase(day 2) is characterized by the highest values of both thetotal number of differentially expressed transcripts andthe number of unique up-regulated and down-regulatedgenes. On the other hand, in line with the general histolog-ical similarity between the late regenerates and uninjuredradial organs (Figure 2A, B, G, H) [1,7], the samples ana-lyzed on day 20 post-injury showed the lowest number ofdifferentially regulated transcripts.
At all three time points after the injury, the majority(∼63-85%) of the significant differentially expressed con-tigs were up- or down-regulated between 2- and 4-foldrelative to the normal animals (Additional file 4), sug-gesting that relatively small changes in transcript abun-dance of most genes are sufficient for regeneration tooccur. Among the most extreme outliers in our differen-tial expression analyses were sequences that were iden-tified as retrotransposon-derived transcripts. Some ofthem showed an over 50-fold change in expression dur-ing regeneration. This unexpected finding prompted usto undertake a separate study of these mobile geneticelements that has already been published elsewhere [12].
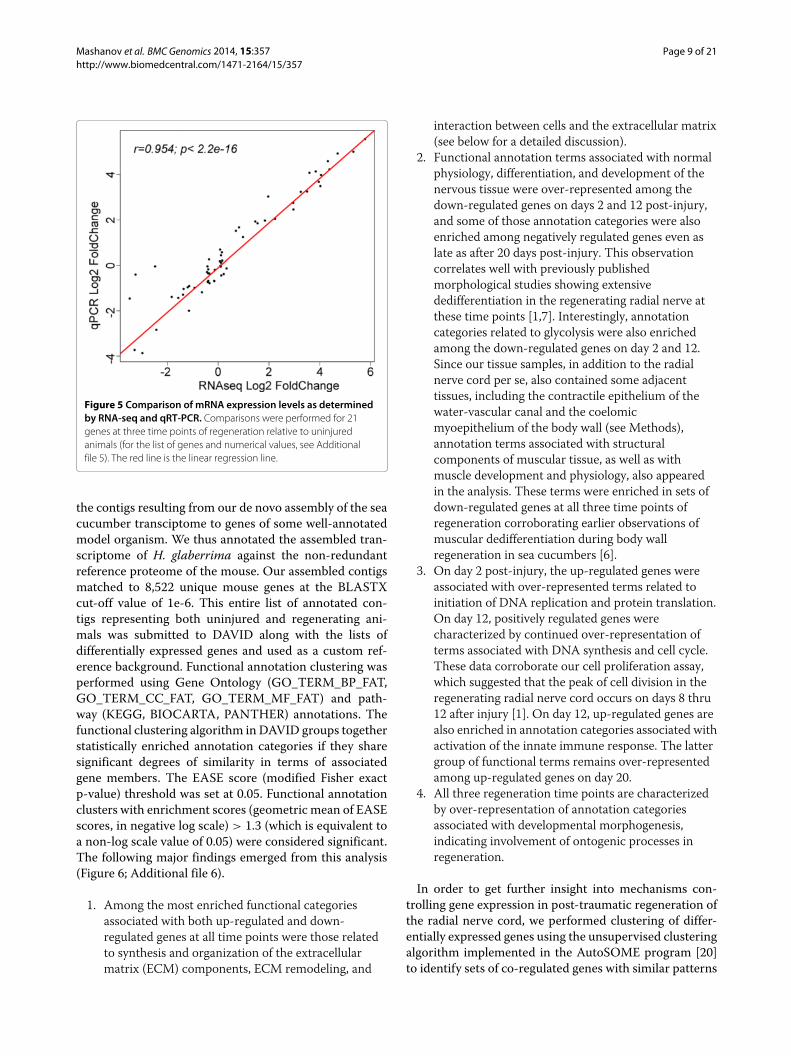
To verify the validity of our approach and the accu-racy of the large-scale digital gene expression assay, weselected 21 genes for analysis by quantitative real-timeRT-PCR (qRT-PCR). This dataset also includes previouslydetermined expression values for three LTR retroelements(Gypsy-1_Hg, Gypsy-2_Hg, and Gypsy-20_Hg) character-ized earlier elsewhere [12]. Our goal was to validatethe sensitivity of the assay at different levels of tran-script abundances. Therefore, we chose not only highlyover-expressed or down-regulated genes, but also geneswith moderate fold change and genes, whose transcriptabundance remained stable throughout the experiment.We found highly significant strong positive correlationbetween the RNA-seq and qRT-PCR data (Pearson’sr=0.954, p<2.2e-16) (Figure 5). The corresponding foldchange ratios (relative to the uninjured animals) for bothquantification techniques are listed in Additional file 5.This correlation analysis suggests that our RNA-seq data

Mashanov et al. BMC Genomics 2014, 15:357 Page 8 of 21http://www.biomedcentral.com/1471-2164/15/357
Figure 4 Differential gene expression analysis of the regenerating radial organ complex. (A) DESeq scatter plots showing comparisons ofgene expression levels between regenerating and uninjured animals. Each dot represents the mean expression level for a given contig. Differentiallyup-regulated contigs (with false discovery rate < 0.001 and a threshold log2 fold change of ±1) are shown in red and differentially down-regulatedcontigs are shown in blue. Numbers above or below the plots refer to the total number or up- or down-regulated contigs, respectively, at a giventime point of regeneration. (B) Venn diagrams showing the numbers of common and distinct differentially up-regulated (top) and down-regulated(bottom) genes at different time points of regeneration.
reliably represent relative changes of mRNA levels in theregenerating tissues.
Functional annotation of differentially expressed genes atdifferent time points of regenerationFrom the biological perspective, it is important toknow which processes predominate or become sup-pressed at different time points during regeneration. Forfunctional annotation, we employed an approach, which
was conceptually similar to that described by Stewartet al. [17] for the analysis of the limb blastema transcrip-tome in axolotl. In order to gain insight into the biologicalmeaning behind the large numbers of differentially reg-ulated transcripts, we analyzed the lists of genes thatshowed significant changes in expression levels (with thecut-off set at ±1 log2 fold change, and Padj < 0.001)with DAVID v6.7 [18,19] to determine enriched functionalcategories. To be able to use this tool, we had to match
Mashanov et al. BMC Genomics 2014, 15:357 Page 9 of 21http://www.biomedcentral.com/1471-2164/15/357
Figure 5 Comparison of mRNA expression levels as determinedby RNA-seq and qRT-PCR. Comparisons were performed for 21genes at three time points of regeneration relative to uninjuredanimals (for the list of genes and numerical values, see Additionalfile 5). The red line is the linear regression line.
the contigs resulting from our de novo assembly of the seacucumber transciptome to genes of some well-annotatedmodel organism. We thus annotated the assembled tran-scriptome of H. glaberrima against the non-redundantreference proteome of the mouse. Our assembled contigsmatched to 8,522 unique mouse genes at the BLASTXcut-off value of 1e-6. This entire list of annotated con-tigs representing both uninjured and regenerating ani-mals was submitted to DAVID along with the lists ofdifferentially expressed genes and used as a custom ref-erence background. Functional annotation clustering wasperformed using Gene Ontology (GO_TERM_BP_FAT,GO_TERM_CC_FAT, GO_TERM_MF_FAT) and path-way (KEGG, BIOCARTA, PANTHER) annotations. Thefunctional clustering algorithm in DAVID groups togetherstatistically enriched annotation categories if they sharesignificant degrees of similarity in terms of associatedgene members. The EASE score (modified Fisher exactp-value) threshold was set at 0.05. Functional annotationclusters with enrichment scores (geometric mean of EASEscores, in negative log scale) > 1.3 (which is equivalent toa non-log scale value of 0.05) were considered significant.The following major findings emerged from this analysis(Figure 6; Additional file 6).
1. Among the most enriched functional categoriesassociated with both up-regulated and down-regulated genes at all time points were those relatedto synthesis and organization of the extracellularmatrix (ECM) components, ECM remodeling, and
interaction between cells and the extracellular matrix(see below for a detailed discussion).
2. Functional annotation terms associated with normalphysiology, differentiation, and development of thenervous tissue were over-represented among thedown-regulated genes on days 2 and 12 post-injury,and some of those annotation categories were alsoenriched among negatively regulated genes even aslate as after 20 days post-injury. This observationcorrelates well with previously publishedmorphological studies showing extensivededifferentiation in the regenerating radial nerve atthese time points [1,7]. Interestingly, annotationcategories related to glycolysis were also enrichedamong the down-regulated genes on day 2 and 12.Since our tissue samples, in addition to the radialnerve cord per se, also contained some adjacenttissues, including the contractile epithelium of thewater-vascular canal and the coelomicmyoepithelium of the body wall (see Methods),annotation terms associated with structuralcomponents of muscular tissue, as well as withmuscle development and physiology, also appearedin the analysis. These terms were enriched in sets ofdown-regulated genes at all three time points ofregeneration corroborating earlier observations ofmuscular dedifferentiation during body wallregeneration in sea cucumbers [6].
3. On day 2 post-injury, the up-regulated genes wereassociated with over-represented terms related toinitiation of DNA replication and protein translation.On day 12, positively regulated genes werecharacterized by continued over-representation ofterms associated with DNA synthesis and cell cycle.These data corroborate our cell proliferation assay,which suggested that the peak of cell division in theregenerating radial nerve cord occurs on days 8 thru12 after injury [1]. On day 12, up-regulated genes arealso enriched in annotation categories associated withactivation of the innate immune response. The lattergroup of functional terms remains over-representedamong up-regulated genes on day 20.
4. All three regeneration time points are characterizedby over-representation of annotation categoriesassociated with developmental morphogenesis,indicating involvement of ontogenic processes inregeneration.
In order to get further insight into mechanisms con-trolling gene expression in post-traumatic regeneration ofthe radial nerve cord, we performed clustering of differ-entially expressed genes using the unsupervised clusteringalgorithm implemented in the AutoSOME program [20]to identify sets of co-regulated genes with similar patterns

Mashanov et al. BMC Genomics 2014, 15:357 Page 10 of 21http://www.biomedcentral.com/1471-2164/15/357
Figure 6 Diagram showing clustering of functional annotation terms associated with differentially expressed genes during the radialorgan complex regeneration. Differentially expressed genes that are up-regulated (right column) or down-regulated (left column) at a given timepoint of regeneration were analyzed for significantly enriched functional annotation terms, which were clustered using DAVID. Functionalannotation clusters with enrichment scores (in negative log scale) > 1.3 are shown. The corresponding detailed data resulting from DAVID outputare listed in Additional file 6).
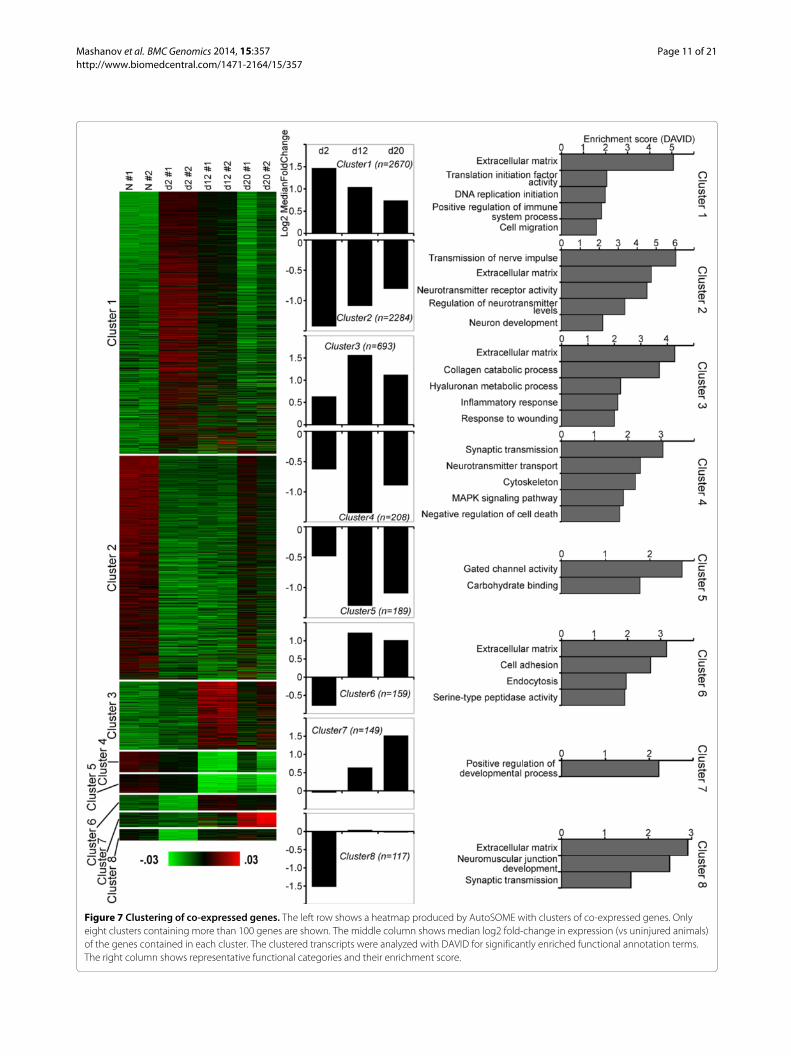
of expression throughout the time course of regeneration.This gene co-expression analysis yielded eight distinctclusters with more than 100 genes in each (Figure 7;Additional file 7). In two of these clusters (clusters 1and 3), the median gene expression in regenerating
animals was consistently higher at all three regener-ation stages when compared with uninjured animals.These genes were enriched in functional annotation termsrelated to the extracellular matrix, initiation of DNA repli-cation and translation, positive regulation of immune
Mashanov et al. BMC Genomics 2014, 15:357 Page 11 of 21http://www.biomedcentral.com/1471-2164/15/357
Figure 7 Clustering of co-expressed genes. The left row shows a heatmap produced by AutoSOME with clusters of co-expressed genes. Onlyeight clusters containing more than 100 genes are shown. The middle column shows median log2 fold-change in expression (vs uninjured animals)of the genes contained in each cluster. The clustered transcripts were analyzed with DAVID for significantly enriched functional annotation terms.The right column shows representative functional categories and their enrichment score.

Mashanov et al. BMC Genomics 2014, 15:357 Page 12 of 21http://www.biomedcentral.com/1471-2164/15/357
response, wound healing, and cell migration. Three otherclusters (clusters 2, 4, 5) contained genes, whose medianexpression at all three time points was lower that in nor-mal animals. Associated enriched functional annotationterms were related to extracellular matrix, transmissionof nerve impulse, regulation of neurotransmitter activ-ity, muscle cell and neuron development, cytoskeleton,MAPK signaling pathway, negative regulation of celldeath, gated channel activity, and carbohydrate binding.Clusters 6 and 7 contained genes, whose expression ini-tially either remained unchanged or somewhat decreasedat the early post-injury stage (day 2), but then was elevatedduring the growth (day 12) and late regeneration (day 20)phases. These genes were associated with positive regula-tion of developmental processes, extracellular matrix, celladhesion, serine peptidase activity, endocytosis. Cluster 8contained genes, which were markedly down-regulated atthe early post-injury stage (day 2), but whose expressionthan returned to the normal levels as regeneration pro-gressed. Enriched functional annotation terms associatedwith this cluster included extracellular matrix, neuromus-cular junction development, and synaptic transmission.
Putative regulation of groups of co-expressed genes bytranscription factors (TFs)We then sought to get insight into which upstreamtranscription factors (TFs) may regulate coordinatedexpression of genes within each of the eight clustersidentified above (Figure 7). Over-representation of tran-scription factor binding sites associated with co-expressedgenes of each cluster was predicted using oPOSSUM
software [21]. We considered only those of the predictedTFs whose significant (p < 0.05) changes in expres-sion level correlated in time (at least at one time point)with changes in the median gene expression within therespective cluster. This analysis yielded 11 TFs, whichputatively regulate regeneration-related genes (Figure 8)and therefore constitute good candidates for further func-tional analysis. It is worth noting that there was someoverlap between the clusters. Thus, CTCF and NfkB1were associated with four and three clusters, respec-tively, and SRF, Fli1, and PLAG1 were associated with twodifferent clusters each. Some of the TFs (for example, SFR,NfkB1) were identified as functioning as both transcrip-tional activators and transcriptional repressors in differentclusters.
Among these predicted 11 TFs, there are genes that havebeen previously implicated in post-traumatic processesand developmental processes in various organisms. Forexample, NfkB1 is known to affect expression of broadrange of downstream genes involved in various biolog-ical processes including immunity, differentiation, andprogrammed cell death. For example, elevated NfkB sig-naling has been previously shown to activate the Wntsignaling pathway and thus induce dedifferentiation ofnonstem cells [22]. Another TF, serum response factor(SRF), was shown to be one of the key genes involved inpost-traumatic regeneration initiation in planarians [23].In gastric ulcer healing, SRF promotes re-epithelializationand muscle regeneration through activation of cellmigration and proliferation [24]. Moreover, SRF isalso implicated in neuronal cell migration and axonal
Figure 8 Putative regulation of co-expressed transcripts by transcription factors (TFs). Co-expressed genes contained in clusters identifiedwith AutoSOME (Figure 7) were analyzed for over-representation of putative TF binding sites using oPOSSUM.
Mashanov et al. BMC Genomics 2014, 15:357 Page 13 of 21http://www.biomedcentral.com/1471-2164/15/357
guidance through regulation of components of the actincytoskeleton [25]. Still another gene, CCAAT/enhancerbinding protein (CEBP) was suggested to be involved inregulation of the innate immune response during tissueinjury repair [26].
Interestingly, the candidate TFs identified in this studyincluded not only previously known regeneration-relatedgenes, but also factors not previously known to act asregulators of post-traumatic tissue regrowth, such as, forexample, liver X receptor, Fli1, PLAG1, Ebf3, Esrrb. Thepotential role of these genes in regeneration deservesfurther attention in future research.
Discussion of selected functional gene groupsThe preceding section provided an overview of unbiasedfunctional characterization of the regeneration-associatedgenes at the global, transcriptome-wide level. Below,we further zoom in on certain groups of differentiallyexpressed genes, which we picked from our databasebased on the results of the above analysis, prior biologicalknowledge, or both.
Cancer-related pathwaysAs revealed by DAVID analysis, the set of differentiallyexpressed genes at the early post-injury stage (day 2)includes many known cancer-related genes (Additionalfile 6). For example, pathway mapping revealed differentialregulation of Wnt receptors (Fzd3 and Fzd4) and ligands(Wnt9, Wnt2, and Wnt6). Another notable observationis down-regulation of survivin (Birc5) (Additional file 8).This gene codes for a multifunctional protein, highlyexpressed in most human cancers, and implicated in bothsuppression of programmed cell death [27] and regulationof cell division [28-30]. We have previously shown that ele-vated expression of survivin in regenerating sea cucumberintestinal tissues correlated with low levels of apoptosis[31]. Reduced expression of this gene in the regeneratingradial nerve cord may thus be at least in part explained asbeing associated with extensive programmed cells deathin the vicinity of the injury [1].
Differential expression of oncogenes early in regener-ation has been also reported for other model systems,including early limb blastema in axolotl [17] and can beexplained by the fact that both regeneration and can-cer progression are developmental processes that share anumber of key mechanisms including cell division, pro-grammed cell death, and differentiation.
ECM-related pathwaysAs mentioned above, among the most significantlyover-represented pathways associated with differentiallyexpressed genes at all three time points of the radial nervecord regeneration were those related to the extracellu-lar matrix (ECM) components and ECM-cell interactions
(see, for example, Additional file 9 showing mapping ofour RNA-seq data to the Focal Adhesion KEGG path-way). One example is significantly reduced expressionof genes coding for basal lamina proteins on day 2(Col4a1, Lama4), but up-regulation of the fibrillar colla-gens Col5a1 and Col11a2. These data correlate well withprevious observations of breakdown of the basal laminaduring the early post-injury phase [7].
Of particular interest is concurrent up-regulationof both matrix metalloproteases (MMPs) and theirinhibitors, TIMPs, in the regenerating radial organ com-plex. By breaking down components of the connectivetissue matrix at the injury site and thus affecting cellmigration and proliferation, epithelialization, differentia-tion, and apoptosis, MMPs are known to facilitate woundhealing and regeneration [32-34]. However, up-regulationof TIMPs is as important for precise regulation of theregenerative processes, as they protect newly synthesizedECM matrix from degradation [32].
Proper interactions between cells and the ECM areessential both for correct tissue organization and signaltransduction. Among the main cell adhesion moleculesmediating these interactions are integrins [35-37]. Inregeneration of the radial nerve in the sea cucumber,integrin beta and integrin alpha-8 are significantly up-regulated (Additional file 9). Integrins affect cytoskele-tal organization through Cdc42, a member of the Rhofamily of small GTPases [38,39]. Expression levels ofthe Cdc42 transcript were consistently highly elevatedin the sea cucumber radial nerve regeneration, suggest-ing a possible involvement of the integrin-Cdc42 path-way in control of ECM-cell interactions in this animalmodel.
Besides integrins, other cell adhesion molecules are alsoup-regulated during the early post-injury phase. Theseinclude selectins (Additional file 6). Interestingly, expres-sion of selectins is known to be induced by NF-kB [40],which was putatively identified as one of the putative keytranscription factors driving differential gene expressionduring the early post-injury stage of neural regenerationin our model (see above).
Pluripotency factorsAs has been documented by morphological studies [1,6,7],regeneration of the radial organs in sea cucumbersinvolves extensive dedifferentiation of specialized cells ofthe adult tissues in the vicinity of the injury. The dedif-ferentiation step endows these cells with increased pro-liferative potential, as well as with the ability to migrateand subsequently re-acquire their initial morphology or,more interestingly, transdifferentiate to other cell types.As this dedifferentiation phase is an indispensable compo-nent of the regenerative response, we asked if it requireselevated expression of factors known to be involved in

Mashanov et al. BMC Genomics 2014, 15:357 Page 14 of 21http://www.biomedcentral.com/1471-2164/15/357
acquisition and/or control of pluripotency. We, therefore,searched our assembled transcriptome for homologs ofthose genes and analyzed their expression values based onour RNA-seq read count data (Figure 9). Out of 15 factorsanalyzed, 11 were found to be expressed in both normaland regenerating tissues. Of those 11 genes, only the Mychomolog was expressed at significantly higher levels inregeneration. Myc genes have a wide variety of functionsaffecting the developmental potential of cells, includingdriving cells into the cell cycle, promoting the open stateof chromatin, and DNA replication. C-Myc is one of theYamanaka factors involved in the production of inducedpluripotent cells [41] from specialized mammalian cells.During this reprogramming procedure, Myc repressesdifferentiation-associated genes [42,43]. The functionalrole of Myc in echinoderm regeneration is a subject ofongoing research in our group.
To our surprise, we also found that expression of theBmi-1 homolog was significantly reduced in the regener-ating tissues on days 2 and 12 post-injury. The remaining9 genes were expressed at the same level both in thenon-injured and regenerating tissues.
A possible explanation that can be proposed toaccount for the observed data is that although the ana-lyzed pluripotency factors do not show any large scaleover-expression in regeneration, most of them are stillexpressed at a certain level both in the normal and regen-erating tissues. Therefore, it may be hypothesized that thisbasal level constitutes sufficient environment for dedif-ferentiation to be triggered by Myc upregulation alone.Interestingly, a similar situation has been reported in non-injured and regenerating tissues of lower vertebrates, suchas Danio rerio and Xenopus, where pluripotency markers
are never shut off completely under normal conditions.Even though the expression level of these genes remainedlargely at the same level after the injury, it was hypothe-sized that this basal expression is neverhteless sufficient tofacilitate regeneration upon damage [46].
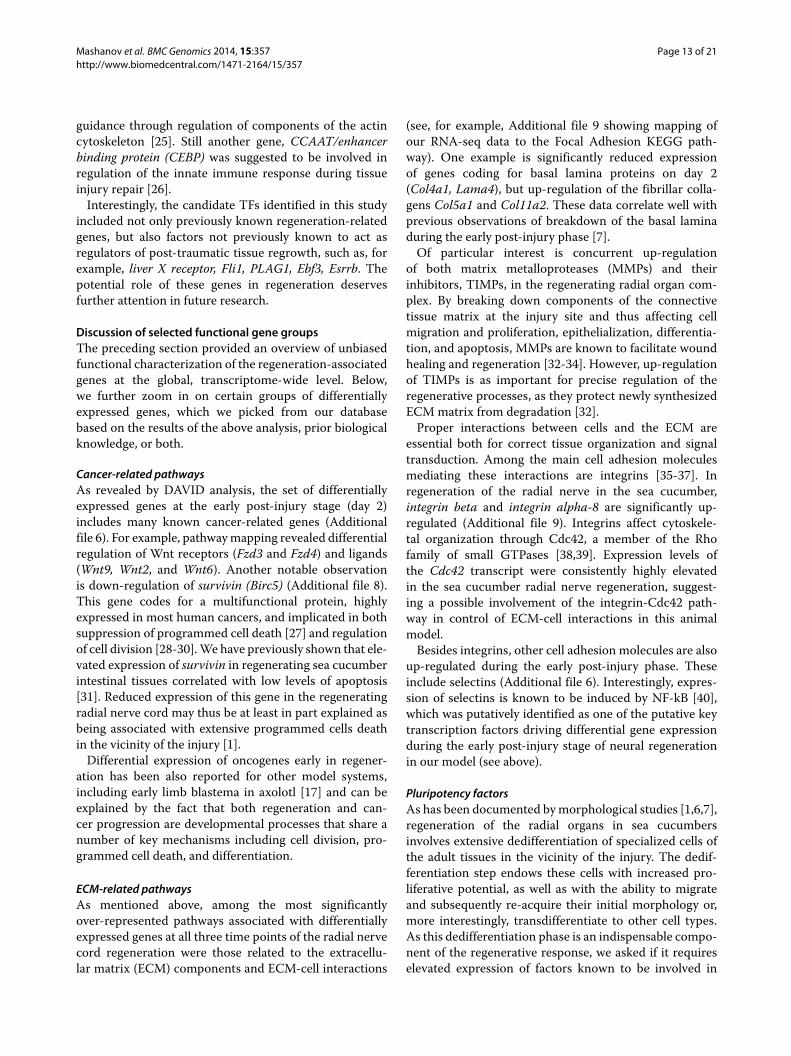
Genes associated with neurogenesisPost-traumatic neurogenesis in the lesioned radial nervecord involves extensive proliferation of radial glialcells, which then act as progenitors generating bothnew glial cells and neurons [1,7]. Surprisingly, ourfunctional analysis of differentially expressed genesdid not yield statistically significant enrichment ofneurogenesis-associated functional categories. The onlyexception was the enrichment of the category “neurondevelopment” in the set of down-regulated genes duringthe growth phase on day 12 post-injury (Additional file 6).We then manually searched our databases for homologsof genes known to be implicated in maintenance of neu-ral stem cells and in specification of the neuronal andglial lineages in other animal models (25 genes in total)(see e.g., [47-56]). The results of this analysis are summa-rized in Figure 10. The most probable explanation whyneurogenesis was not a dominant theme in the func-tional analysis of differentially expressed genes is thatmost of the neurogenesis-related genes, whose homologswere identified in the transcriptome of H. glaberrima,were already expressed in the non-injured radial nervecord. Their expression level showed some fluctuations inthe regenerating tissues, but not above the cut-off thresh-old (twofold change in expression, adjusted p-value <
0.001), with the exception of up-regulated Sox11, Bmp7and down-regulated Prom1, Isl1, and Lhx3.
Figure 9 Expression of pluripotency factors in regeneration of the radial organ complex in the sea cucumber H. glaberrima. Summary of thedigital expression assay and homology search against the UniProt database. Red and blue colors indicate significant (adjusted p < 0.001, more thantwo fold change in expression level) up-regulation or down-regulation, respectively, in the regenerating tissues as opposed to uninjured organs. NS,no significant changes in expression was observed. *Note that the gene designated as Oct1 is included in this list because it is the only Oct homologfound in the H. glaberrima transcriptome. Likewise, Oct1/2 is the only Oct in the sea urchin genome [44]. In mammals, there are a number of otherOct genes that perform various essential roles. One of them, Oct4 was used to induce pluripotency in mammalian somatic cells [41,45].
Mashanov et al. BMC Genomics 2014, 15:357 Page 15 of 21http://www.biomedcentral.com/1471-2164/15/357
Figure 10 Expression of neurogenesis-associated genes in regeneration of the radial organ complex in the sea cucumber H. glaberrima.Summary of the digital expression assay and homology search against the UniProt database. Red and blue colors indicate significant (adjusted p <
0.001, more than two fold change in expression level) up-regulation or down-regulation, respectively, in the regenerating tissues as opposed touninjured organs. NS, no significant changes in expression were observed.
To our surprise, homologs of some of the key mark-ers of vertebrate neural stem cells, including nestin andvimentin, were absent from the sea cucumber transcrip-tome. Likewise, transcripts of some of the important pro-neural factors [55], such as Mash1 and Neurog2 were alsonot detected in either the normal or regenerating animals.This may be due to the fact that the program of post-traumatic neurogenesis in sea cucumbers is not knownand, obviously, may not entirely consist of the mechanismsthat regulate neurogenesis in vertebrates, whose geneswere used as the reference.
Prevention of excitotoxic neuronal cell deathOne of the adaptations that may facilitate neuralregeneration in the sea cucumber H. glaberrima isinhibition of excitotoxicity (Figure 11). In vertebrates,nervous system trauma results in two types of degener-ative processes: the primary damage as the direct resultof the injury, which affects the cells in the immedi-ate vicinity of the trauma, and the secondary degener-ation, which significantly increases the amount of theaffected tissue and is mediated by endogenous mecha-nisms triggered by the initial injury [57,58]. Excitotoxi-city is one of these secondary pathological processes. Itinvolves neuronal death via excessive stimulation by glu-tamate, whose extracellular concentration increases afterCNS injury. Our results suggest that transection of theradial organ complex in the sea cucumber H. glaberrima
results in significant down-regulation of glutamate car-boxypeptidase II (GCPII) in the vicinity of the injury(Figure 11). This enzyme hydrolyzes NAAG (N-acetyl-aspartyl-glutamate) to glutamate and N-acetylaspartate. Itcan be hypothesized that down-regulation of GCPII willeventually result in inhibition of NAAG hydrolysis andaccumulation of intact NAAG, which is known to furtherdecrease the amount of glutamate released from presy-naptic terminals and therefore prevent excitotoxic neu-ronal cell death [59]. Moreover, NAAG has been reportedto stimulate production of important regulators of neu-ron survival, such as TGF-β [59,60]. A sequence stronglyrelated to TGF-β is present in the sea cucumber tran-scriptome. It shows a trend toward up-regulation on day 2and is significantly up-regulated above the cut-off thresh-old on days 12 and 20 (Figure 11). On the other hand,the transcripts coding for another enzyme involved inglutamate production (Abat) and for the glutamate recep-tors (Glur1, Glur4) are also significantly down-regulated.Suppression of pathways leading to induction of excito-toxic neuronal death and concomitant induction of factorsinvolved in neuronal survival can represent one of theadaptations aimed at minimizing the traumatic impactof the neuronal injury and sparing the maximum possi-ble number of neurons, so that less of them will need tobe replenished in the course of subsequent regeneration.A promising further line of research would be to exper-imentally test if changes in the severity of excitotoxicity

Mashanov et al. BMC Genomics 2014, 15:357 Page 16 of 21http://www.biomedcentral.com/1471-2164/15/357
Figure 11 Suppression of excitotoxicity as a possible adaptation contributing to efficient neural regeneration in echinoderms. (A) Therelevant genes in the transcriptome of the sea cucumber H. glaberrima. Their expression levels (relative to the uninjured tissues) and results ofhomology search against the UniProt database. Red and blue colors indicate significant (adjusted p < 0.001, more than two fold change inexpression level) up-regulation or down-regulation, respectively. (B) A diagram illustrating a hypothetical mechanism of excitotoxicity suppressionin the injured radial nerve cord of H. glaberrima. Down-regulation of genes coding for two enzymes, GCPII and Abat, results in decreased glutamateproduction. Decreased activity of GCPII also leads to accumulation of its substrate, NAAG, which further inhibits release of glutamate frompresynaptic terminals, but stimulates production of TGF-beta, which promotes neuronal survival. Down-regulation of ionotropic glutamatereceptors (Glur1, Glur4) reduces the overstimulation of the post-synaptic membrane by glutamate and thus prevents downstream neurotoxiccascades from being triggered.
would actually affect the extent of tissue damage andthe rate of re-connection in the injured radial nervecord.
ConclusionsThis study was conceived as a first stage in exploringmolecular mechanisms behind the observed cellular pro-cesses in echinoderm CNS regeneration. In general, func-tional annotations of the differentially expressed genescorroborate well our previous morphological data, butalso open up potential new avenues for future research. Asmentioned above, our results point out to the importantrole of the ECM remodeling in regeneration of the radialcomplex in the sea cucumber. So far, reorganization ofthe connective tissue in regenerating echinoderms hasreceived little attention. There have been just two exper-imental studies addressing this issue directly and in bothcases they were focused on regeneration of the digestivetube only [33,34].
Another promising line of future research would be toexperimentally test the predictions of this study suggest-ing the existence of mechanisms suppressing excitotox-icity in the injured CNS. If these mechanisms actuallyexist, their understanding will be valuable for devising
new therapies to prevent excitocytotic neuronal deathfollowing, for example, brain and spinal cord injury.
One of the most important outcomes from this study is apredicted list of putative transcription factors, which pre-sumably control differential expression of large groups ofdownstream genes and thus occupy key positions in reg-ulatory networks controlling regeneration. These genesrepresent promising candidates for future functionalanalysis.
Among other interesting findings is that post-traumaticregeneration of the radial nerve cord did not involve large-scale over-expression of pluripotency factors. Many ofthese genes were already expressed in intact tissues, andonly Myc showed up-regulation after injury.
We are well aware of the limitations in our study. Forexample, by design, our functional annotation was depen-dent on matching the sea cucumber contigs against a wellstudied proteome from another organism (in this case,mouse). This approach could have led to many potentiallyrelevant sea cucumber-specific sequences being excludedfrom the analysis. This issue cannot be resolved withoutcarrying out a separate study aimed at characterizationof the ‘new’ or ‘unknown’ sequences, which do not havesignificant homologs in current databases.

Mashanov et al. BMC Genomics 2014, 15:357 Page 17 of 21http://www.biomedcentral.com/1471-2164/15/357
The present paper, like most of other high-throughputstudies of gene expression, uses mRNA abundance lev-els to get insight into how changes in gene expres-sion might affect the phenotype of tissues and cells,although it is largely the quantity of the protein thatdirectly determines the phenotype. However, for thetime being, transcriptomic approaches are justified bythe fact that the current methodologies for direct quan-tification of protein expression are either less reliableor more laborious and expensive than mRNA-basedstudies.
Notwithstanding the limitations, the results and predic-tions reported above are valuable, because they providea number of clearly defined testable hypotheses, whereasthe associated pitfalls and limitations are well known tomany researchers working with ‘non-model’ organismsand are not unresolvable in the future.
MethodsSea cucumber collection, maintenance, and radial nervecord injuryAdult individuals of the brown rock sea cucumberHolothuria glaberrima Selenka, 1867 were collected fromthe intertidal zone of the Atlantic coast of Puerto Rico.The reader is referred to our previous publications fordetailed description of the injury paradigm and surgicalprocedures [1,8,12]. Briefly, the animals were brought tothe laboratory and induced to eviscerate (autotomize theirviscera) by injecting 0.35 M KCl into the coelomic cav-ity. The sea cucumbers needed to be eviscerated, becauseour surgery involved cutting the radial nerve cord fromthe inside of the body. In order to perform the transec-tion we needed to get access to the inner side of thebody wall. We did so by anesthetizing the animals in 0.2%chlorobutanol (Sigma) for 10–30 min and then exposingthe coelomic surface of the body wall through the anusby pushing a glass rod against a radial region of the epi-dermis at the mid-body level. It was only possible afterthe animals have been induced to autotomize the viscera.H. glaberrima does not survive penetrating injuries to thebody wall (when there is a direct communication betweenthe coelom and the environment). Nevertheless, it read-ily regenerates if the injury is made from the coelomicside of the body wall without disrupting the epidermis.We thus cut the radial organs of the mid-ventral radius(including the longitudinal muscle band, water-vascularcanal, the radial nerve cord, and the underlying connec-tive tissue), but not the epidermis, with a sharp razorblade. The operated animals were returned to the aquariaand kept at room temperature in well-aerated seawater,which was changed regularly. All experiments were con-ducted in accordance with the NIH and University ofPuerto Rico guidelines for the care and use of laboratoryanimals.
RNA extraction and library preparationSamples for high-throughput sequencing were preparedas previously described [12]. From each regenerating ani-mal, we excised the region of the injury gap (∼3–4 mmwide) plus ∼3 mm of stump (‘old’) tissue on either sideof the injury plane. The wet weight of an individual tis-sue sample was around 10–15 mg. Tissue samples ofcomparable size and weight were also excised from unin-jured animals. During tissue sampling, every effort wasmade to separate the radial nerve cord from surround-ing tissues. However, isolation of the pure nerve cord bysurgical means turned out to be practically impossible.Therefore, our tissue samples also consistently containedsmall amounts of the surrounding connective tissue, anaccompanying segment of the water-vascular canal anda stretch of the contractile coelomic epithelium of thebody wall because of close anatomical proximity of thesestructures to the radial nerve cord (Figure 2). For the 454platform, we generated three non-normalized librariesrepresenting uninjured animals (38 individuals), days 2and 6 post-injury (63 and 71 animals, respectively), anddays 12 and 20 post-injury (62 and 66 animals, respec-tively). In addition, equal quantities of the above sampleswere combined to prepare a normalized library. The sam-ples extracted from the regenerating animals on day 6post-injury were only used for 454 sequencing to increasetranscript diversity in the final assembled transcriptome,and were not subjected to sequencing on the Illuminaplatform (see below). Total RNA was extracted usingTRI reagent (Sigma), assessed for quality on an Agi-lent 2100 Bioanalyzer with the RNA 6000 Nano chips,and subjected to two rounds of poly(A) selection usingPoly(A)Purist technology (Ambion). Normalization pro-cedure was performed with a TRIMMER kit (Evrogen)following the manufacturer’s protocol. The normalizedcDNA was amplified using Advantage 2 Polymerase Mix(Clontech).
For Illumina sequencing two non-normalized librarieswere prepared for each of the four conditions: (i) unin-jured radial organ complex (total RNA samples werepooled from 4 and 3 animals for the first and secondlibraries, respectively); (ii) day 2 post-injury (20 and 19animals were used); (iii) day 12 post-injury (20 animalswere used for each of the libraries); and (iv) day 20 post-injury (15 animals were used for each of the libraries). Thefinal stages in library preparation and sequencing wereperformed by sequencing service providers at the DNAFacility of the University of Iowa (Genome Sequencer FLXSystem, Roche) and the Genome Sequencing and AnalysisCore Facility of the Duke Institute for Genome Sciencesand Policy (Illumina Genome Analyzer IIx, Illumina). Rawsequencing reads from both the 454 and Illumina plat-forms were deposited at NCBI Sequence Read Archive(SRA) under accession number NCBI:SRA051990 [61].
Mashanov et al. BMC Genomics 2014, 15:357 Page 18 of 21http://www.biomedcentral.com/1471-2164/15/357
De novo assembly pipelineThe first round of filtering/cleaning of 454 reads wasperformed with SeqClean [62] and included removalof synthetic adaptor/primer sequences used in librarypreparation and screening for E. coli contamination(GenBank:U00096). The reads were then processed withthe standalone version of PRINSEQ tool (v 0.14.2)[63] with the following filtering parameters: minimumlength — 60 bases, maximum length — 1100 bases(twice the mean length), maximum allowed percentageof N’s – 1%, minimum mean quality — 17. Also, exactduplicates and reverse complement exact duplicates wereremoved.
Raw Illumina sequencing reads were quality checkedusing the FastQC tool (v 0.9.1) [64] and then trimmedusing FASTX-Toolkit (v 0.0.13) [65] to remove Illuminaadapters, discard bases with quality < 20, and readsshorter than 32 bases.
We applied a complex pipeline to assemble the pooledreads from all libraries into a single reference contig set(Figure 3). First, we used MIRA 3.2.1 [66] to assembleall normalized and non-normalized 454 reads. The Illu-mina reads were assembled with Velvet (v.1.1.03) [10]and Oases (v.0.1.21). Separate assembly runs were per-formed at different kmer lengths (31 to 55). Cleaned454 reads were introduced into each of these runs toimprove the assembly. The contigs longer than 100 bpresulting from the Velvet/Oases assemblies were com-bined together with 454 contigs for the final assembly withCAP3, to produce what we refer to as the reference library.The files containing the contigs, their annotations, andexpression values were parsed and analyzed using customwritten scripts, which are available from the authors byrequest.
Differential gene expression in regenerationFor digital expression assay based on RNA-seq data,we used Bowtie 2 [67] to map Illumina reads to thecontigs of the reference library. The raw read countsfor each of the eight Illumina libraries (four conditions,two biological replicates per condition, see above) wereused as input to the DESeq R package [16] to per-form pairwise differential expression analysis between theintact and regenerating animals. The estimateSizeFactorsfunction of the DESeq package was used to normal-ize gene counts. The resulting P values were adjustedfor multiple testing with Benjamini-Hochberg proce-dure. Genes with an adjusted P value < 0.001 and afold change greater than 2 were considered differentiallyexpressed.
In order to validate the changes in gene expressiondetermined by RNA-seq, we selected 21 genes with dif-ferent levels of transcript abundances for real-time PCRanalysis. Poly(A) RNA was extracted as described above.
PCR primers were designed using Primer Premier 5.0 soft-ware (PREMIER Biosoft International). Their sequencesare shown in Additional file 10. RNA was reverse tran-scribed with random hexamer primers and SuperScriptII reverse transcriptase (Invitrogen). Template cDNA wasdiluted 10-fold or 100-fold and used at 2 μl per 25 μlof PCR reaction with Brilliant SYBR Green Master Mixor Brilliant II SYBR Green Master Mix (Agilent) fol-lowing the manufacturer’s protocol. Real-time PCR reac-tions were run on Mx3005P qPCR System (Stratagene).The reactions were performed on three independentsamples per condition (biological replicates). Each sam-ple was analyzed at least twice, making sure that thedifference between technical replicates was less than 0.5Ct [68]. PCR efficiencies were evaluated by running five10-fold dilutions of the cDNA template in a PCR reac-tion and were considered acceptable if the correspondingslope values determined by the MxPro QPCR software(Strategene) lay between -3.2 and -3.5 and the R2 wasabove 0.98. All expression values were normalized relativeto the ’normalization factor’ calculated with the geNormVisual Basic Application for Microsoft Excel [69] fromthe expression of values of four genes (Rpl18a, Atp6l,Eef2, and Sod), which were identified among the leastchanging transcripts across the experimental conditionsby RNA-seq.
AnnotationThe assembled contigs of the reference library were usedas input for the BLASTX homology search. Initially,the sea cucumber sequences were compared with theSwiss-Prot database with a cut-off significance thresh-old set at 1e-6. Those contigs that lacked matches werethen subjected to a second round of BLASTX searchagainst the larger NCBI non-redundant database. In addi-tion, the sea cucumber transcriptome was also anno-tated versus the NCBI’s collection of the sea urchinpredicted protein sequences [14] by performing recipro-cal best BLAST hit analysis (with a threshold e-value <
1e-6).Functional annotation of differentially expressed genes
was performed with DAVID Gene Ontology web server[18]. In order to be able to use this tool, we matchedall 70,173 contigs of our assembled transcriptome to thenon-redundant reference proteome of the mouse [70],release 2012_05 using BLASTX with the cut-off e-valueof 1e-6. Overall, our assembled contigs showed signifi-cant homology to 8,522 mouse genes. We then submittedthe annotated lists of differentially expressed genes as aninput to DAVID and analyzed them against the back-ground of all annotated genes of our reference library.For pathways of interest, KEGGanim [71] was used togenerate diagrams showing changes in expression levelof individual genes. This approach allows to observe
Mashanov et al. BMC Genomics 2014, 15:357 Page 19 of 21http://www.biomedcentral.com/1471-2164/15/357
expression dynamics in the context of specific pathwayinteractions.
Expression profile clusteringUnsupervised gene expression profile clustering of differ-entially expressed genes (i.e., the genes showing more thantwo-fold change in expression with adjusted P < 0.01) wasperformed using AutoSOME 2.0 software [20]. Prior toclustering, the original count data were subjected to vari-ance stabilization transformation in the DESeq package.The parameters were set as suggested by the authors ofthe program (running mode: precision, number of ensem-ble runs: 500, P-value threshold: 0.05). Unit variance,median centering (rows), and sum squares (both rows andcolumns) normalization procedures were applied. Eightclusters containing more than 100 contigs were visual-ized on a heatmap (Figure 7) and considered for furtheranalysis.
Identification of putative regeneration-associatedtranscription factorsOver-represented transcription factors associated withco-expressed genes were predicted with oPOSSUM v3.0software [21]. Lists of gene identifiers corresponding toeach of the cluster identified by AutoSOME were usedas input. The list of gene identifiers corresponding to theentire reference library was used as the background set.The JASPAR CORE collection was used as a set of tran-scription binding site matrices. The conservation cutoffand the matrix score threshold were left at their defaultvalues of 0.4 and 85%, respectively.
In order to select potentially relevant transcription fac-tors, we followed the suggestions of the software’s authorsand plotted the Z-score against Fisher score for the tran-scription factors associated with the genes in each ofthe cluster. The genes, which showed clear segregationof the scores, were considered for further analysis, ifchanges in their expression were significant (adjustedP < 0.05) at least at one of the three analyzed time points.If the expression level of the putative transcription fac-tor changed in the same direction as the median geneexpression in the gene cluster, this transcription factorwas considered a transcriptional activator. If the change inexpression was in the reverse direction, the transcriptionfactor was considered a transcriptional repressor.
Availability of supporting dataRaw sequencing reads supporting the results of this articleare available in the NCBI SRA repository [61]. The contigsof the reference library, representing the transcriptomicdiversity in the normal and regenerating radial organ com-plex of H. glaberrima are available in the LabArchivesnotebook [11]. Other data sets are included within thearticle and its additional files.
Additional files
Additional file 1: Best BLASTX hits obtained in similarity searchesversus the Swissprot and NCBI non-redundant protein databases.
Additional file 2: Reciprocal best blast hits between the H. glaberrimacontigs and NCBI’s collection of predicted proteins of the sea urchinS. purpuratus. The data are represented in a tabular file with the followingcolumns: H. glaberrima contig ID; S. purpuratus protien ID; E-value (BLASTXsearch: H. glaberrima contigs vs sea urchin proteins); bit score.
Additional file 3: Correlation of gene expression values betweenbiological replicates for each of the four conditions (normal animals,day 2 post-injury, day 12 post-injury, and day 20 post-injury). Eachdot indicates normalized read count returned by the DESeq package. Thestraight red line is a linear regression fit of data points. Pearson’sproduct-moment correlation coefficient is indicated for each comparison.
Additional file 4: Frequency histogram of fold change in expressionlevel of differentially up-regulated (left column) and down-regulated(right column) contigs at three stages of the radial organ complexregeneration. The total number and percentage of contigs showingchanges in expression between 2- and 4-fold relative to the normalanimals are indicated next to each plot.
Additional file 5: Fold change ratios (relative to uninjured animals)for 21 genes as determined by RNA-seq and real-time qRT-PCR.
Additional file 6: Functional annotations of differentially expressedgenes at three time points of radial organ complex regeneration.Differentially expressed contigs were analyzed for significantly enrichedannotation terms, which were clustered using DAVID.
Additional file 7: AutoSOME output. Tabular file containing clusterlabel, cluster confidence and expression level for each data point.
Additional file 8: Differentially expressed cancer-related genes(Pathways in cancer, KEGG) at three time points (days 2, 12, and 20post-injury) of radial complex regeneration in the sea cucumber. Thegene expression data were mapped to KEGG pathways using theKEGGanim web tool.
Additional file 9: Differentially expressed genes of the FocalAdhesion KEGG pathway at three time points (days 2, 12, and 20post-injury) of radial complex regeneration in the sea cucumber. Thegene expression data were mapped to KEGG pathways using theKEGGanim web tool. Each rectangle represents either a single or multiplegenes. When a rectangular node on the graph represents several geneswith significant changes in their expression values, a list of genes isprovided with color coding for up-regulation (red) or down-regulation(blue) relative to the expression levels in intact animals.
Additional file 10: Primers used for quantitative real-time PCR.
AbbreviationsECM: Extracellular matrix; LTR: Long terminal repeat; ORF: Open reading frame;Padj : Adjusted P-value; RNA-seq: Next-generation sequencing of expressedmRNA; TF: Transcription factor.
Competing interestsThe authors declare that they have no competing interests.
Authors’ contributionsVSM, ORZ, and JEGA conceived the study, analyzed the data, and interpretedthe results. VSM and ORZ carried out experimental procedures. VSM draftedthe manuscript. VSM, ORZ, and JEGA finalized the manuscript. All authors readand approved the final version of the manuscript.
AcknowledgementsThe authors acknowledge the assitance of Rey Rosa in animal collection andmaintenance. We also thank Prof. B. Galliot, Prof. L. Moroz, and Prof. H.Ortiz-Zuazaga for stimulating discussions and valuable suggestions. The studywas supported by the NIH (Grants 1SC1GM084770-01, 1R03NS065275-01), theNSF (Grants IOS-0842870 , IOS-1252679), several NSF and NIH equipmentfunds for the Sequencing Genomic Facility (SGF UPRRP) and the University ofPuerto Rico.
Mashanov et al. BMC Genomics 2014, 15:357 Page 20 of 21http://www.biomedcentral.com/1471-2164/15/357
Received: 2 January 2014 Accepted: 6 May 2014Published: 12 May 2014
References
1. Mashanov VS, Zueva OR, García-Arrarás JE: Radial glial cells play a keyrole in echinoderm neural regeneration. BMC Biol 2013, 11:49.[http://www.biomedcentral.com/1741-7007/11/49]
2. Mashanov VS, Zueva O, García-Arrarás JE: Chapter seven -postembryonic organogenesis of the digestive tube: why does itoccur in worms and sea cucumbers but fail in humans? InMechanisms of Regeneration, Volume 108 of Current Topics in DevelopmentalBiology. Galliot, B. San Diego: Academic Press; 2014:185–216. [http://www.sciencedirect.com/science/article/pii/B9780123914989000061]
3. Rojas-Cartagena C, Ortíz-Pineda P, Ramírez-Gómez F, Suárez-Castillo EC,Matos-Cruz V, Rodríguez C, Ortíz-Zuazaga H, García-Arrarás JE: Distinctprofiles of expressed sequence tags during intestinal regenerationin the sea cucumber Holothuria glaberrima. Physiol Genomics 2007,31(2):203–215.
4. Sun L, Chen M, Yang H, Wang T, Liu B, Shu C, Gardiner DM: Large scalegene expression profiling during intestine and body wallregeneration in the sea cucumber Apostichopus japonicus. CompBiochem Physiol Part D Genomics Proteomics 2011, 6(2):195–205.
5. Heinzeller T, Welsch U: The echinoderm nervous system and itsphylogenetic interpretation. In Brain evolution and cognition. Edited byRoth G, Wullimann M. New York: Wiley-Spektrum; 2001:41–75.
6. García-Arrarás JE, Dolmatov IY: Echinoderms: potential model systemsfor studies on muscle regeneration. Curr Pharm Des 2010,16(8):942–955.
7. Mashanov VS, Zueva OR, Heinzeller T: Regeneration of the radial nervecord in a holothurian: a promising new model system for studyingpost-traumatic recovery in the adult nervous system. Tissue Cell 2008,40(5):351–372.
8. Miguel-San Ruiz JE, García-Arrarás JE: Common cellular events occurduring wound healing and organ regeneration in the sea cucumberHolothuria glaberrima. BMC Dev Biol 2007, 7:115.
9. Surget-Groba Y, Montoya-Burgos JI: Optimization of de novotranscriptome assembly from next-generation sequencing data.Genome Res 2010, 20(10):1432–1440.
10. Zerbino DR, Birney E: Velvet: algorithms for de novo short readassembly using de Bruijn graphs. Genome Res 2008, 18(5):821–829.
11. Contigs of the reference library available in the LabArchivesnotebook. [http://dx.doi.org/10.6070/H4PN93J1]
12. Mashanov VS, Zueva OR, García-Arrarás JE: Posttraumatic regenerationinvolves differential expression of long terminal repeat (LTR)retrotransposons. Dev Dyn 2012, 241(10):1625–1636.
13. Mashanov VS, Zueva OR, García-Arrarás JE: Retrotransposons in animalregeneration: overlooked components of the regenerativemachinery? Mob Genet Elem 2012, 2(5):244–247.
14. NCBI collection of predicted proteins of the sea urchinStrongylocentrotus purpuratus. [ftp://ftp.ncbi.nih.gov/genomes/Strongylocentrotus_purpuratus/protein/].
15. Consortium SUGS, Sodergren E, Weinstock GM, Davidson EH, CameronRA, Gibbs RA, Angerer RC, Angerer LM, Arnone MI, Burgess DR, Burke RD,Coffman JA, Dean M, Elphick MR, Ettensohn CA, Foltz KR, Hamdoun A,Hynes RO, Klein WH, Marzluff W, McClay DR, Morris RL, Mushegian A, RastJP, Smith LC, Thorndyke MC, Vacquier VD, Wessel GM, Wray G, Zhang L,et al.: The genome of the sea urchin Strongylocentrotus purpuratus.Science 2006, 314(5801):941–952.
16. Anders S, Huber W: Differential expression analysis for sequencecount data. Genome Biol 2010, 11(10):R106.
17. Stewart R, Rascón CA, Tian S, Nie J, Barry C, Chu LF, Ardalani H, Wagner RJ,Probasco MD, Bolin JM, Leng N, Sengupta S, Volkmer M, Habermann B,Tanaka EM, Thomson JA, Dewey CN: Comparative RNA-seq analysis inthe unsequenced axolotl: the oncogene burst highlights early geneexpression in the blastema. PLoS Comput Biol 2013, 9(3):e1002936.[http://dx.doi.org/10.1371/journal.pcbi.1002936]
18. The Database for Annotation, Visualization and IntegratedDiscovery (DAVID ) v6.7. [http://david.abcc.ncifcrf.gov/]
19. Huang DW, Sherman BT, Lempicki RA: Systematic and integrativeanalysis of large gene lists using DAVID bioinformatics resources.Nat Protoc 2009, 4:44–57. [http://dx.doi.org/10.1038/nprot.2008.211]
20. Newman AM, Cooper JB: AutoSOME: a clustering method foridentifying gene expression modules without prior knowledge ofcluster number. BMC Bioinformatics 2010, 11:117. [http://dx.doi.org/10.1186/1471-2105-11-117]
21. Sui SJH, Fulton DL, Arenillas DJ, Kwon AT, Wasserman WW: oPOSSUM:integrated tools for analysis of regulatory motif over-representation.Nucleic Acids Res 2007, 35(Web Server issue):W245–W252. [http://dx.doi.org/10.1093/nar/gkm427]
22. Schwitalla S, Fingerle AA, Cammareri P, Nebelsiek T, Göktuna SI, ZieglerPK, Canli O, Heijmans J, Huels DJ, Moreaux G, Rupec RA, Gerhard M,Schmid R, Barker N, Clevers H, Lang R, Neumann J, Kirchner T, Taketo MM,van den Brink, GR, Sansom OJ, Arkan MC, Greten FR: Intestinaltumorigenesis initiated by dedifferentiation and acquisition ofstem-cell-like properties. Cell 2013, 152(1-2):25–38. [http://dx.doi.org/10.1016/j.cell.2012.12.012]
23. Wenemoser D, Lapan SW, Wilkinson AW, Bell GW, Reddien PW: Amolecular wound response program associated with regenerationinitiation in planarians. Genes Dev 2012, 26(9):988–1002. [http://dx.doi.org/10.1101/gad.187377.112]
24. Tarnawski AS, Ahluwalia A: Molecular mechanisms of epithelialregeneration and neovascularization during healing of gastric andesophageal ulcers. Curr Med Chem 2012, 19:16–27.
25. Knöll B: Serum response factor mediated gene activity inphysiological and pathological processes of neuronal motility. FrontMol Neurosci 2011, 4:49. [http://dx.doi.org/10.3389/fnmol.2011.00049]
26. Huang GN, Thatcher JE, McAnally J, Kong Y, Qi X, Tan W, DiMaio JM,Amatruda JF, Gerard RD, Hill JA, Bassel-Duby R, Olson EN: C/EBPtranscription factors mediate epicardial activation during heartdevelopment and injury. Science 2012, 338(6114):1599–1603.[http://dx.doi.org/10.1126/science.1229765]
27. Marusawa H, Matsuzawa SI, Welsh K, Zou H, Armstrong R, Tamm I,Reed JC: HBXIP functions as a cofactor of survivin in apoptosissuppression. EMBO J 2003, 22(11):2729–2740. [http://dx.doi.org/10.1093/emboj/cdg263]
28. Xia F, Canovas PM, Guadagno TM, Altieri DC: A survivin-ran complexregulates spindle formation in tumor cells. Mol Cell Biol 2008,28(17):5299–5311. [http://dx.doi.org/10.1128/MCB.02039-07]
29. Ruchaud S, Carmena M, Earnshaw WC: The chromosomal passengercomplex: one for all and all for one. Cell 2007, 131(2):230–231.[http://dx.doi.org/10.1016/j.cell.2007.10.002]
30. Li F, Cheng Q, Ling X, Stablewski A, Tang L, Foster BA, Johnson CS, RustumYM, Porter CW: Generation of a novel transgenic mouse model forbioluminescent monitoring of survivin gene activity in vivo atvarious pathophysiological processes: survivin expression overlapswith stem cell markers. Am J Pathol 2010, 176(4):1629–1638. [http://dx.doi.org/10.2353/ajpath.2010.090414]
31. Mashanov VS, Zueva OR, Rojas-Catagena C, García-Arrarás JE: Visceralregeneration in a sea cucumber involves extensive expression ofsurvivin and mortalin homologs in the mesothelium. BMC Dev Biol2010, 10:117. [http://dx.doi.org/10.1186/1471-213X-10-117]
32. Bellayr IH, Mu X, Li Y: Biochemical insights into the role of matrixmetalloproteinases in regeneration: challenges and recentdevelopments. Future Med Chem 2009, 1(6):1095–1111. [http://dx.doi.org/10.4155/fmc.09.83]
33. Lamash NE, Dolmatov IY: Proteases from the regenerating gut of theholothurian Eupentacta fraudatrix. PLoS One 2013, 8(3):e58433.[http://dx.doi.org/10.1371/journal.pone.0058433]
34. Quiñones JL, Rosa R, Ruiz DL, García-Arrarás JE: Extracellular matrixremodeling and metalloproteinase involvement during intestineregeneration in the sea cucumber Holothuria glaberrima. Dev Biol2002, 250:181–197.
35. Zargham R, Thibault G: Alpha 8 integrin expression is required formaintenance of the smooth muscle cell differentiated phenotype.Cardiovasc Res 2006, 71:170–178. [http://dx.doi.org/10.1016/j.cardiores.2006.03.003]
36. Benoit YD, Lussier C, Ducharme PA, Sivret S, Schnapp LM, Basora N,Beaulieu JF: Integrin alpha8beta1 regulates adhesion, migration andproliferation of human intestinal crypt cells via a predominantRhoA/ROCK-dependent mechanism. Biol Cell 2009, 101(12):695–708.[http://dx.doi.org/10.1042/BC20090060]

Mashanov et al. BMC Genomics 2014, 15:357 Page 21 of 21http://www.biomedcentral.com/1471-2164/15/357
37. Lahlou H, Muller WJ: β1-integrins signaling and mammary tumorprogression in transgenic mouse models: implications for humanbreast cancer. Breast Cancer Res 2011, 13(6):229. [http://dx.doi.org/10.1186/bcr2905]
38. Stengel K, Zheng Y: Cdc42 in oncogenic transformation, invasion, andtumorigenesis. Cell Signal 2011, 23(9):1415–1423. [http://dx.doi.org/10.1016/j.cellsig.2011.04.001]
39. Chen C, Wirth A, Ponimaskin E: Cdc42: an important regulator ofneuronal morphology. Int J Biochem Cell Biol 2012, 44(3):447–451.[http://dx.doi.org/10.1016/j.biocel.2011.11.022]
40. Newton K, Dixit VM: Signaling in innate immunity and inflammation.Cold Spring Harb Perspect Biol 2012, 4(3). [http://dx.doi.org/10.1101/cshperspect.a006049]
41. Takahashi K, Yamanaka S: Induction of pluripotent stem cells frommouse embryonic and adult fibroblast cultures by defined factors.Cell 2006, 126(4):663–676. [http://dx.doi.org/10.1016/j.cell.2006.07.024]
42. Sridharan R, Tchieu J, Mason MJ, Yachechko R, Kuoy E, Horvath S, Zhou Q,Plath K: Role of the murine reprogramming factors in the inductionof pluripotency. Cell 2009, 136(2):364–377. [http://dx.doi.org/10.1016/j.cell.2009.01.001]
43. Wey A, Knoepfler PS: c-myc and N-myc promote active stem cellmetabolism and cycling as architects of the developing brain.Oncotarget 2010, 1(2):120–130.
44. Range R, Lepage T: Maternal Oct1/2 is required for Nodal andVg1/Univin expression during dorsal-ventral axis specification inthe sea urchin embryo. Dev Biol 2011, 357(2):440–449. [http://dx.doi.org/10.1016/j.ydbio.2011.07.005]
45. Tantin D: Oct transcription factors in development and stem cells:insights and mechanisms. Development 2013, 140(14):2857–2866.[http://dx.doi.org/10.1242/dev.095927]
46. Christen B, Robles V, Raya M, Paramonov I, Belmonte JCI: Regenerationand reprogramming compared. BMC Biol 2010, 8:5. [http://dx.doi.org/10.1186/1741-7007-8-5]
47. Beckervordersandforth R, Tripathi P, Ninkovic J, Bayam E, Lepier A,Stempfhuber B, Kirchhoff F, Hirrlinger J, Haslinger A, Lie DC, Beckers J,Yoder B, Irmler M, Götz M: In vivo fate mapping and expressionanalysis reveals molecular hallmarks of prospectively isolated adultneural stem cells. Cell Stem Cell 2010, 7(6):744–758. [http://dx.doi.org/10.1016/j.stem.2010.11.017]
48. Bréjot T, Blanchard S, Hocquemiller M, Haase G, Liu S, Nosjean A, HeardJM, Bohl D: Forced expression of the motor neuron determinant HB9in neural stem cells affects neurogenesis. Exp Neurol 2006,198:167–182. [http://dx.doi.org/10.1016/j.expneurol.2005.11.026]
49. Covey MV, Streb JW, Spektor R, Ballas N: REST regulates the pool size ofthe different neural lineages by restricting the generation ofneurons and oligodendrocytes from neural stem/progenitor cells.Development 2012, 139(16):2878–2890. [http://dx.doi.org/10.1242/dev.074765]
50. Kim EJ, Ables JL, Dickel LK, Eisch AJ, Johnson JE: Ascl1 (Mash1) definescells with long-term neurogenic potential in subgranular andsubventricular zones in adult mouse brain. PLoS One 2011,6(3):e18472. [http://dx.doi.org/10.1371/journal.pone.0018472]
51. Li H, Jin G, Qin J, Yang W, Tian M, Tan X, Zhang X, Shi J, Zou L:Identification of neonatal rat hippocampal radial glia cells in vitro.Neurosci Lett 2011, 490(3):209–214. [http://dx.doi.org/10.1016/j.neulet.2010.12.054]
52. Misra K, Mishra K, Gui H, Matise MP: Prox1 regulates a transitory statefor interneuron neurogenesis in the spinal cord. Dev Dyn 2008,237(2):393–402. [http://dx.doi.org/10.1002/dvdy.21422]
53. Morrens J, Broeck WVD, Kempermann G: Glial cells in adultneurogenesis. Glia 2012, 60(2):159–174. [http://dx.doi.org/10.1002/glia.21247]
54. Park CH, Kang JS, Kim JS, Chung S, Koh JY, Yoon EH, Jo AY, Chang MY, KohHC, Hwang S, Suh-Kim H, Lee YS, Kim KS, Lee SH: Differential actions ofthe proneural genes encoding Mash1 and neurogenins inNurr1-induced dopamine neuron differentiation. J Cell Sci 2006,119(Pt 11):2310–2320. [http://dx.doi.org/10.1242/jcs.02955]
55. Roybon L, Hjalt T, Stott S, Guillemot F, Li JY, Brundin P: Neurogenin2directs granule neuroblast production and amplification whileNeuroD1 specifies neuronal fate during hippocampal neurogenesis.
PLoS One 2009, 4(3):e4779. [http://dx.doi.org/10.1371/journal.pone.0004779]
56. Shu T, Tseng HC, Sapir T, Stern P, Zhou Y, Sanada K, Fischer A, CoquelleFM, Reiner O, Tsai LH: Doublecortin-like kinase controls neurogenesisby regulating mitotic spindles and M phase progression. Neuron2006, 49:25–39. [http://dx.doi.org/10.1016/j.neuron.2005.10.039]
57. Mark LP, Prost RW, Ulmer JL, Smith MM, Daniels DL, Strottmann JM, BrownWD, Hacein-Bey L: Pictorial review of glutamate excitotoxicity:fundamental concepts for neuroimaging. AJNR Am J Neuroradiol 2001,22(10):1813–1824.
58. Weil ZM, Norman GJ, DeVries AC, Nelson RJ: The injured nervoussystem: a Darwinian perspective. Prog Neurobiol 2008, 86:48–59.[http://dx.doi.org/10.1016/j.pneurobio.2008.06.001]
59. Bar̆inka C, Rojas C, Slusher B, Pomper M: Glutamate carboxypeptidase IIin diagnosis and treatment of neurologic disorders and prostatecancer. Curr Med Chem 2012, 19(6):856–870.
60. Krieglstein K, Strelau J, Schober A, Sullivan A, Unsicker K: TGF-beta andthe regulation of neuron survival and death. J Physiol Paris 2002,96(1-2):25–30.
61. Raw sequencing reads supporting the results of this articledeposited with the NCBI SRA repository. [https://www.ncbi.nlm.nih.gov/sra/?term=SRA051990]
62. SeqClean tool. [http://compbio.dfci.harvard.edu/tgi/software/]63. Schmieder R, Edwards R: Quality control and preprocessing of
metagenomic datasets. Bioinformatics 2011, 27(6):863–864.[http://dx.doi.org/10.1093/bioinformatics/btr026]
64. FastQC Tool. [http://www.bioinformatics.babraham.ac.uk/projects/fastqc/]
65. FASTX-Toolkit. [http://hannonlab.cshl.edu/fastx_toolkit/index.html]66. Chevreux B, Pfisterer T, Drescher B, Driesel AJ, Müller WEG, Wetter T, Suhai
S: Using the miraEST assembler for reliable and automated mRNAtranscript assembly and SNP detection in sequenced ESTs. GenomeRes 2004, 14(6):1147–1159. [http://dx.doi.org/10.1101/gr.1917404]
67. Langmead B, Trapnell C, Pop M, Salzberg SL: Ultrafast andmemory-efficient alignment of short DNA sequences to the humangenome. Genome Biol 2009, 10(3):R25. [http://dx.doi.org/10.1186/gb-2009-10-3-r25]
68. Nolan T, Hands RE, Bustin SA: Quantification of mRNA using real-timeRT-PCR. Nat Protoc 2006, 1(3):1559–1582. [http://dx.doi.org/10.1038/nprot.2006.236]
69. Vandesompele J, Preter KD, Pattyn F, Poppe B, Roy NV, Paepe AD,Speleman F: Accurate normalization of real-time quantitative RT-PCRdata by geometric averaging of multiple internal control genes.Genome Biol 2002, 3(7):RESEARCH0034.
70. Mouse reference proteome. [https://www.ebi.ac.uk/reference_proteomes/]
71. Adler P, Reimand J, JÄnes J, Kolde R, Peterson H, Vilo J: KEGGanim:pathway animations for high-throughput data. Bioinformatics 2008,24(4):588–590. [http://dx.doi.org/10.1093/bioinformatics/btm581]
doi:10.1186/1471-2164-15-357Cite this article as: Mashanov et al.: Transcriptomic changes duringregeneration of the central nervous system in an echinoderm. BMCGenomics 2014 15:357.
Copyright © 2022 FDOKUMEN