
Integrative analysis of multimodal traffic data - European ...
22
Lemonde et al. European Transport Research Review (2021) 13:64 https://doi.org/10.1186/s12544-021-00520-3 ORIGINAL PAPER Integrative analysis of multimodal traffic data: addressing open challenges using big data analytics in the city of Lisbon Carlos Lemonde 1 , Elisabete Arsenio 2* and Rui Henriques 3 Abstract Worldwide cities are establishing efforts to collect urban traffic data from various modes and sources. Integrating traf- fic data, together with their situational context, offers more comprehensive views on the ongoing mobility changes and supports enhanced management decisions accordingly. Hence, cities are becoming sensorized and heterogene- ous sources of urban data are being consolidated with the aim of monitoring multimodal traffic patterns, encompass- ing all major transport modes—road, railway, inland waterway—, and active transport modes such as walking and cycling. The research reported in this paper aims at bridging the existing literature gap on the integrative analysis of multimodal traffic data and its situational urban context. The reported work is anchored on the major findings and contributions from the research and innovation project Integrative Learning from Urban Data and Situational Context for City Mobility Optimization (ILU), a multi-disciplinary project on the field of artificial intelligence applied to urban mobil- ity, joining the Lisbon city Council, public carriers, and national research institutes. The manuscript is focused on the context-aware analysis of multimodal traffic data with a focus on public transportation, offering four major contribu- tions. First, it provides a structured view on the scientific and technical challenges and opportunities for data-centric multimodal mobility decisions. Second, rooted on existing literature and empirical evidence, we outline principles for the context-aware discovery of multimodal patterns from heterogeneous sources of urban data. Third, Lisbon is introduced as a case study to show how these principles can be enacted in practice, together with some essential findings. Finally, we instantiate some principles by conducting a spatiotemporal analysis of multimodality indices in the city against available context. Concluding, this work offers a structured view on the opportunities offered by cross-modal and context-enriched analysis of traffic data, motivating the role of Big Data to support more transparent and inclusive mobility planning decisions, promote coordination among public transport operators, and dynamically align transport supply with the emerging urban traffic dynamics. Keywords: Multimodality, Sustainable mobility, Data science, Smart cities, Public transport, Inclusive mobility © The Author(s) 2021. Open Access This article is licensed under a Creative Commons Attribution 4.0 International License, which permits use, sharing, adaptation, distribution and reproduction in any medium or format, as long as you give appropriate credit to the original author(s) and the source, provide a link to the Creative Commons licence, and indicate if changes were made. The images or other third party material in this article are included in the article’s Creative Commons licence, unless indicated otherwise in a credit line to the material. If material is not included in the article’s Creative Commons licence and your intended use is not permitted by statutory regulation or exceeds the permitted use, you will need to obtain permission directly from the copyright holder. To view a copy of this licence, visit http://creativecommons.org/licenses/by/4.0/. 1 Introduction In the last decade, road traffic and mobility needs have increased significantly, especially in urban and metro- politan areas, a result of the socioeconomic growth and recent pandemic pressures [4]. is scenario is further affected by the relevance of pursuing climate objectives to reach carbon neutrality, operationalizing norms of social distancing, and the decentralization of activities and ser- vices to the periphery of urban centers. e heavy use of cars as private transport compromises the sustainability of modern cities [25]. To reach climate goals set by the Paris Agreement, the European Commission has already recognised the importance of multimodal passenger transport to increase the use of public transport, shared mobility options, and active modes of transport such as walking and cycling [10, 27]. Multimodality, the use of Open Access European Transport Research Review *Correspondence: [email protected] 2 Department of Transport, LNEC I.P., Lisbon, Portugal Full list of author information is available at the end of the article
-
Upload
khangminh22 -
Category
Documents
-
view
1 -
download
0
Transcript of Integrative analysis of multimodal traffic data - European ...

Lemonde et al. European Transport Research Review (2021) 13:64 https://doi.org/10.1186/s12544-021-00520-3
ORIGINAL PAPER
Integrative analysis of multimodal traffic data: addressing open challenges using big data analytics in the city of LisbonCarlos Lemonde1, Elisabete Arsenio2* and Rui Henriques3
Abstract
Worldwide cities are establishing efforts to collect urban traffic data from various modes and sources. Integrating traf-fic data, together with their situational context, offers more comprehensive views on the ongoing mobility changes and supports enhanced management decisions accordingly. Hence, cities are becoming sensorized and heterogene-ous sources of urban data are being consolidated with the aim of monitoring multimodal traffic patterns, encompass-ing all major transport modes—road, railway, inland waterway—, and active transport modes such as walking and cycling. The research reported in this paper aims at bridging the existing literature gap on the integrative analysis of multimodal traffic data and its situational urban context. The reported work is anchored on the major findings and contributions from the research and innovation project Integrative Learning from Urban Data and Situational Context for City Mobility Optimization (ILU), a multi-disciplinary project on the field of artificial intelligence applied to urban mobil-ity, joining the Lisbon city Council, public carriers, and national research institutes. The manuscript is focused on the context-aware analysis of multimodal traffic data with a focus on public transportation, offering four major contribu-tions. First, it provides a structured view on the scientific and technical challenges and opportunities for data-centric multimodal mobility decisions. Second, rooted on existing literature and empirical evidence, we outline principles for the context-aware discovery of multimodal patterns from heterogeneous sources of urban data. Third, Lisbon is introduced as a case study to show how these principles can be enacted in practice, together with some essential findings. Finally, we instantiate some principles by conducting a spatiotemporal analysis of multimodality indices in the city against available context. Concluding, this work offers a structured view on the opportunities offered by cross-modal and context-enriched analysis of traffic data, motivating the role of Big Data to support more transparent and inclusive mobility planning decisions, promote coordination among public transport operators, and dynamically align transport supply with the emerging urban traffic dynamics.
Keywords: Multimodality, Sustainable mobility, Data science, Smart cities, Public transport, Inclusive mobility
© The Author(s) 2021. Open Access This article is licensed under a Creative Commons Attribution 4.0 International License, which permits use, sharing, adaptation, distribution and reproduction in any medium or format, as long as you give appropriate credit to the original author(s) and the source, provide a link to the Creative Commons licence, and indicate if changes were made. The images or other third party material in this article are included in the article’s Creative Commons licence, unless indicated otherwise in a credit line to the material. If material is not included in the article’s Creative Commons licence and your intended use is not permitted by statutory regulation or exceeds the permitted use, you will need to obtain permission directly from the copyright holder. To view a copy of this licence, visit http:// creat iveco mmons. org/ licen ses/ by/4. 0/.
1 IntroductionIn the last decade, road traffic and mobility needs have increased significantly, especially in urban and metro-politan areas, a result of the socioeconomic growth and recent pandemic pressures [4]. This scenario is further affected by the relevance of pursuing climate objectives to
reach carbon neutrality, operationalizing norms of social distancing, and the decentralization of activities and ser-vices to the periphery of urban centers. The heavy use of cars as private transport compromises the sustainability of modern cities [25]. To reach climate goals set by the Paris Agreement, the European Commission has already recognised the importance of multimodal passenger transport to increase the use of public transport, shared mobility options, and active modes of transport such as walking and cycling [10, 27]. Multimodality, the use of
Open Access
European TransportResearch Review
*Correspondence: [email protected] Department of Transport, LNEC I.P., Lisbon, PortugalFull list of author information is available at the end of the article
Page 2 of 22Lemonde et al. European Transport Research Review (2021) 13:64
different modes of transport in a single trip, can support the shift to a low carbon economy by taking advantage of the benefits of using different transport modes, such as convenience, safety, speed, cost, and reliability.
Mobility in major European capitals is not yet sustain-able, prompting those capitals to reevaluate their public transport systems to meet societal goals [9]. Lisbon’s City Council is making efforts in collecting heterogeneous urban data for a better understanding of the multimodal mobility patterns [36, 44]. Multimodal mobility pat-terns offer data-centric views of major traffic bottlenecks ensuring:
• the city mobility planning dynamically responds to the ongoing changes in traffic;
• fully transparent decisions to the citizens, enhancing the accountability of authorities;
• supportive and objective coordination among public carriers and authorities involved in urban mobility planning.
In this context, heterogeneous sources of urban data are currently being consolidated in the Intelligent Man-agement Platform of the City of Lisbon (PGIL) to meet various purposes [1]. Still, the potentialities of exploring the multiplicity of available urban data sources in an inte-grative manner for reaching sustainable mobility goals are still largely untapped [11].
This work aims at bridging the existing gap on the integrative analysis of multimodal traffic data and its situational urban context. To this end, we first provide a structured view on its major challenges. Second, rooted on existing literature and ongoing initiatives in major urban centers, we propose principles to address the listed challenges combining advances from urban comput-ing, data science and intelligent transportation systems. Third, Lisbon is introduced as a reference case study to illustrate how the introduced principles can be opera-tionalized in practice. In particular, we show how the city Council and public carriers are tackling the major obsta-cles to context-aware and multimodal mobility decisions. Finally, a spatiotemporal analysis of multimodality indi-ces is conducted for the city of Lisbon using the available urban data, offering an initial practical characterization of cross-modal mobility restrictions and social equity aspects.
The remainder of this paper is organized as follows. Section 2 presents essential background on multimo-dality, and identifies opportunities and major technical obstacles to data-centric multimodal mobility decisions. Section 3 introduces principles for multimodal data analysis, offering guidelines to overcome the highlighted challenges. Section 4 introduces the city of Lisbon as the
case study, instantiating the outlined principles using both qualitative and quantitative analyses. Final remarks are presented in Sect. 5.
2 BackgroundMultimodality can be simultaneously understood as a property of the transport system, as a transport policy strategy and as a dimension of individual travel behav-iour, forming a tridimensional perspective [26]. Within the later dimension, multimodality is commonly defined as the use of more than one transport mode to complete a trip.
This section first recovers essential concepts and lit-erature on multimodal mobility (Sect. 2.1), and intro-duces state-of-the-art multimodality indices (Sect. 2.2) as those provide the basis for our practical study. Finally, in Sect. 2.3, the major challenges to the context-aware and multimodal analysis of big traffic data are enumerated.
2.1 MultimodalityBuehler and Hamre [8] observed that multimodality is a subfield of a larger body of research on intrapersonal variability of travel behaviour, consisting of four dimen-sions: temporal, spatial, purpose and modal. The “modal” dimension describes the variability in the use of means of transport over time. Nobis [46] emphasizes the fact that the general definition of multimodality must be observed along individual trips to ensure its separation from the monomodality concept.
This distinction relates to the chosen time period, the longer the time period is, the higher is the probability that a person uses more than one mode of transport. For instance, Nobis [46] uses in her study a loose definition of multimodality, where any person who uses more than one mode of transport within one week is a multimodal transport user. In contrast, monomodal users tend to exclusively rely on a single mode of transport.
As highlighted by Tsirimpa et al. [64], one of the main goals of multimodal passenger transportation is to increase the use of public transport modes along with sustainable mobility options (i.e. cycling, walking) and emerging transport modes (e.g., shared mobility) such that a modal shift could be promoted and the use of pri-vate vehicles reduced. Zannat et al. [72] conducted a sys-tematic review of research works using big data sources for public transport planning which covers three main areas: trip pattern analysis, modelling and performance analysis. Previous work conducted by Tympakianaki et al. [65] acknowledged the need to use multimodal traf-fic data sources for a more comprehensive analysis of the spatiotemporal impacts of localized disruptions on public transport demand and network performance. In their review work, Zannat et al. [72] concluded that the

Page 3 of 22Lemonde et al. European Transport Research Review (2021) 13:64
emergence of multimodal data is a promising research direction, as these data can be leveraged to optimize a transport network as an integrated system and be used to infer the latent public transport demand that can be attracted from enhanced connectivity between modes (e.g., public transport and shared bicycles).
Comparison of findings about multimodality across studies is challenging given the inherently different transportation systems across geographies, target data sources, temporal frames, and definitions of multimodal-ity. However, some relevant results are common among studies: the percentage of multimodal persons decreases with advancing age [14, 33, 46],car availability is nega-tively correlated with multimodal behaviour, and posi-tively correlated with monomodal driving [19, 33, 46],and having a driver’s license is negatively associated with multimodal users [33, 46]. Multimodality is generally measured by considering the fraction of users that use a given number of travel modes. For example, Nobis [46] shows that car and public transportation users tend to be between 10 and 25 years old, with the largest group con-sisting of people aged 18–25, in Germany. While Buehler and Hamre [8] indicate that 87% of all trips in the United States are made by car and 90% of Americans use auto-mobiles in their commuting trips for work purposes.
In his research work, Reichenbach [50] noted that more research is required to understand how public transport suppliers can assess the dynamics of multimodal behav-iour at the user side and how synergies between modes can be enhanced.
2.2 Indices of multimodalityDespite the relevance of previous findings, most of the existing works neglect the intensity of use per transporta-tion mode. In this context, the spatiotemporal analysis of multimodality indices from traffic records is important to dynamically detect zones with the lack of adequate trans-port supply along specific time periods, as well as urban zones that, despite the presence of different transport modes, are characterized by heightened imbalanced pref-erences towards specific modes of transport.
Diana and Pirra [20] targeted the problem of measuring multimodality at the individual level, by finding a multi-modality index that comprises both descriptive statistics on the number of travel means, and the intensity of use of each mode. One of those measures is the Herfindahl–Hirschman ( HH ) index, a measure of market concentra-tion for determining market competitiveness based on the size of firms in relation to the industry [53]. HH ranges from 0 to 1, from a perfectly competitive market with a high number of small firms to a monopoly. According to Diana and Pirra [20], in the context of transportation, the index approaches zero when a multiple balanced travel
means is observed, whereas the value increases when a small number of modes tends to dominate. The original HH index is extended as follows:
where fi is the intensity of use of ith transport mode, f is the mean value of the intensities of all n modes, and m either corresponds to the total number of modes, n, in the original definition or to the number of modes offer-ing transportation (demand different from zero) in the revised definition [20]. Susilo and Axhausen [58] used HHm to measure the repetitiveness of identical combina-tions of individual’s spatial–activity–travel mode choices within an observed period. In their study, higher index values were associated with periodic behavior and lower index values with less repetitive or variety-seeking behav-ior. In this context, HHm is also suggested to characterize the level of repetition of activity–travel patterns.
A comparable multimodal index is the Gini coefficient [2], which is classically used as a measure of income ine-quality in a population. A Gini coefficient of zero expresses perfect equality, while a value of one expresses maximal inequality. In the context of multimodality, it behaves simi-larly to the previous index. The Gini coefficient is defined as:
where fi is the intensity of use of the ith mode assum-ing that modes are sorted in ascending order accord-ing to a target criterion (e.g., passenger demand), and n is the total number of modes. Tahmasbi et al. [59] used the Gini coefficient to evaluate the distribution of urban public facilities and accessibility level of different groups of people. This work presents a similar methodology (see Sect. 5).
Diana and Mokhtarian [18] reinterpreted the concept of Shannon Entropy [55] by considering a hypothetical mode choice experiment, where the uncertainty of the outcome is proportional to past multimodality behaviors of the trave-ler, i.e.:
When OMPI tends to 0 the individual uses only one mode among those being considered, whereas when OMPI = 1 the individual uses all these modes with the same inten-sity. Diana and Mokhtarian [18] proposed a variant of OMPI that is sensitive to the mean mobility level of
(1)HHm =1
m
[
n∑n
i=1(fi − f )2
(∑n
i=1 fi)2
+ 1
]
,
(2)Gini =2
n
∑ni=1 i × fi∑n
i=1 fi−
n+ 1
n,
(3)OMPI =
n∑
i=1
[
fi∑n
j=1 fjlogn
(∑n
j=1 fj
fi
)]
.

Page 4 of 22Lemonde et al. European Transport Research Review (2021) 13:64
individuals. Let M be the absolute maximum reported frequency of any mode, then:
Diana and Pirra [20] established an analogy between income inequality and multimodality, where individuals and their income respectively map into travel means and their intensities of use. An additional inequality measure, the Dalton Index [17], is proposed:
where ǫ parameter represents the decreasing influence of more intensely used modes to determine the degree of a traveler’s multimodality. In their study, Diana and Pirra [20] showed that there is not an index that outperforms the others, still, some measures give best results in spe-cific cases. For example, if the goal is comparing multi-modal behaviors of different social groups, an index that is not replication invariant is recommended, i.e., HHm , OMPI or OMMI . Otherwise, if the mean intensities of use of the different modes vary across respondents, yet some modes in the set are never used, the application of the DALm index is more appropriate.
2.3 Challenges to multimodal traffic data analysisDespite the relevance of multimodal transportation to promote modal shifts from private vehicles towards public, shared and active transport modes, most urban centers still encounter major obstacles preventing the comprehensive monitoring and analysis of multimodal traffic dynamics. In accordance with these needs, this section groups the ongoing challenges in two major axes: challenges pertaining to the acquisition of consolidation of relevant urban data sources; and challenges pertain-ing to their integrative analysis for descriptive, predictive, and prescriptive ends.
Along the first axis, urban data acquisition and consoli-dation is challenged by three major needs:
• the presence of an integrated automated fare collec-tion system within the public transportation network for tracing the movements of passengers throughout the multiple carriers and modes of transport;
• the relevance of city traffic sensorization initiatives, as well as standardized protocols for urban data acquisition and consolidation. Essential sources of traffic data include road traffic data from stationary and/or mobile devices; individual trip record data in
(4)OMMI =
n∑
i=1
[
fi
nM
[
1+ ln
(
M
fi
)]]
.
(5)DALm = 1−
1
n
∑mi=1
(
f 1−ǫi − 1
)
(
1m
∑mi=1 fi
)1−ǫ
− 1
,
the public transportation system given by smart card validations at stations or public vehicles; or pedes-trian traffic data from privacy-compliant sensor tech-nologies;
• the incorporation of sources of context informa-tion. Traffic dynamics are situated, meaning that these are dependent on a high multiplicity of situ-ational context factors. The presence of large-scale events creates irregular peaks of demand; road traf-fic interdictions condition mobility; weather impacts transportation mode decisions, especially active modes of transport; changes to the city urban plan-ning affect the way traffic is generated and attracted to different parts of the city throughout the day [12, 54]. Important sources of context data with impact on urban traffic include historical and pro-spective public events, ongoing and planned traffic interdictions,weather records and forecasts; geo-graphical distribution of traffic generation-attraction pole; among others.
Along the data analytics axis, the integrative mining of traffic data produced from heterogeneous modes of transportation is challenged by four major factors:
• the inherent spatiotemporal and multimodal nature of traffic data. The rich spatial, calendrical and modal content of traffic data should be properly explored, and the available sources of urban traffic data soundly processed and consolidated [44]. In addition, the sto-chastic nature of traffic, with considerable variability, further challenges the modeling of multimodal traffic dynamics,
• the massive size of traffic data produced by mobile, ticketing and stationary devices. Exemplifying, in Lisbon, over 50 million smart card validations are observed within public carriers per month [4]. Ana-lyzing massive individual traffic data requires the incorporation of strict scalability requirements along the pursued processing and learning algorithms,
• the presence of emerging changes in urban traffic caused by shifting transport preferences, new traf-fic poles, as well as disruptive changes such as those triggered by mobility reforms and pandemics [45]. The value of static studies is thus of limited relevance as their findings can easily become depreciated. Instead, multimodal traffic data analysis should be fully automated and updatable once more recent data becomes available. In this context, there is the need to guarantee that the ongoing mobility changes are reflected in the computational models, as well as the ability to learn from traffic data streams and detect emerging traffic patterns,

Page 5 of 22Lemonde et al. European Transport Research Review (2021) 13:64
• the context-dependent nature of traffic. Despite their well-recognized impact on urban mobility, principles for context-aware traffic data analysis remain largely dispersed [11]. In fact, state-of-the-art contributions for context-aware descriptive and predictive tasks generally fail to model the joint impact that these multiple sources of context exert on urban mobility. In addition, existing works generally fail to separate the important role of both historical and prospective sources of context.
Context-aware multimodal traffic models are essential to aid mobility decisions, including operational, tacti-cal, and strategic planning initiatives. In this context, the actionability and statistical significance of the found mul-timodal associations need to be robustly assessed. Deci-sions grounded on these associations can be linked to reforms in the transportation network, the exploitation of cost synergies, or incentives for eco-friendly transport modes (walking and cycling). As such, and irrespectively of the ends, the impact of mobility decisions should be additionally monitored and assessed to identify necessary revisions to the ongoing mobility reforms and initiatives.
In addition to the above technical challenges, envi-ronmental, social, economic and political dimensions need to be comprehensively accounted in the subsequent decision-making process to guarantee ecological and social equity issues in mobility reforms and, moreover, that these reforms are able to address the true causal fac-tors underlying individual’s preferences and mode choice determinants [31, 48, 57].
Finally, governance principles are necessary to guar-antee an effective multimodal coordination of efforts among the public transport operators, as well as between operators, city Councils and authorities [3, 35]. To this end, multimodal patterns can be seen as an objective and transparent ground to facilitate cross-carrier planning and explore route-and-schedule synergies for the benefit of the citizens.
3 Multimodal big data analysis: principlesMoved by the need to address the set of challenges intro-duced in previous Sect. 2.3, this section proposes a set of principles for the context-aware and multimodal analy-sis of Big Data produced from urban traffic sensoriza-tion initiatives. The identified principles are rooted on well-established contributions in literature and lessons from ongoing urban mobility projects, and are later con-fronted, in Sect. 4, with extensive practical evidence gath-ered at the city of Lisbon. For simplicity, the principles are enumerated in line with the ordering of challenges along Sect. 2.3.
Integrated multimodal fare collection system The inte-gration of Automated Fare Collection (AFC) systems from the different carriers operating on a given urban center provides the possibility to trace cross-carrier and multimodal trips along the public network, revealing bottlenecks such as points with heavy transfer demands [30]. Alternatives based on shared passenger identi-fiers are available [47], yet their use is discouraged as it does not enforce standards on the recording of individ-ual trips, challenging subsequent consolidation, audit-ing and cross-carrier tariffs. Integrative ACF systems or alternative strategies to identify cross-carrier passenger flows offer an essential means to: (1) assess the efficacy of transport mode transfers in urban interfaces; (2) infer multimodal origin–destination (OD) matrices in accord-ance with the complete (instead of partial) commuting travel patterns of individuals; (3) discover multimodal traffic patterns to assess the needs and modal preferences of the citizens; (4) model and understand demand; and (5) support the multimodal planning of routes and sched-ules with the aim of reducing commuting needs and transfer waiting times.
Worldwide, different strategies for integrating AFCs across carriers, with the most common solution being based on unique smart cards validated at the stations, stops or vehicles from a transport network [47, 70]. Trip records generally offer information pertaining to the user’s card, validation time, and associated station, vehicle, and/or route. Tariffs are generally dependent on the used modes, number of transfers, or crossed geog-raphies. In contrast, in distance-based AFCs, the fare is usually calculated based on the total distance within a (multimodal) trip from boarding to alighting. Illustrat-ing, the integrated AFC at Lisbon is an example of the former (Sect. 4.2), while the integrated AFC in Seoul is a distance-based one [30]. Buses and subway trains in Seoul are equipped with smart card readers located at the doors for boarding and alighting, thus offering the possi-bility to record the whole itinerary of each individual trip from the departing location to the destination, including intermediate transfers.
Urban data acquisition and consolidation Heterogene-ous sources of urban traffic data, including those gener-ated by mobile devices, inductive loop counters, and inte-grative AFC systems, provide important complementary views on traffic dynamics. Following the principles ini-tially set forth by Papadias et al. [49], these sources can be consolidated under a multi-dimensional scheme by iden-tifying shared dimensions between sources, including time-and-date dimensions, spatial dimension (whether point, origin–destination, or trajectory information) and, when available, user and carrier dimensions. This

Page 6 of 22Lemonde et al. European Transport Research Review (2021) 13:64
modeling enables a coherent cross-modal navigation throughout the records of specific users, carriers, geogra-phies, and time periods.
Given the massive size of urban data, data extraction facilities should properly index spatial, temporal and modal information for the efficient retrieval of informa-tion [32, 41]. In this context, the target data centric rec-ommendation systems should be equipped with efficient slicing and dicing procedures. Particular attention should be further paid to avoid unnecessary inefficiencies—for example, the characteristics of the stations, users or car-riers should be decoupled from the trip records. In addi-tion, data cleaning procedures should be available to ensure the absence of duplicates and gross errors, and further treat outlier and missing values whenever nec-essary. Finally, updating routines are necessary for the automatic extraction, transformation and loading of the continuously arriving data records into the consolidated database.
Context data incorporation Recent attention has been paid on how to incorporate context to enhance traffic data analysis [11]. Two major principles are suggested for the automated acquisition of situational context. First, social media, public administration repositories, weather portals, online calendars of festivities, cultural agendas, theatre sites, and online news can be periodi-cally explored with the aim of retrieving specific context sources of interest. Wibisono et al. [66], Tempelmeier et al. [61] and Tang et al. [60] gather principles towards this end. Despite the importance of web data mining, the acquisition of situational context data from the web is generally subjected to uncertainties related with data quality and availability. Second, in cities with well-estab-lished efforts towards the gathering and provision of situ-ational context, the acquisition step can be simplified. In this context, periodic routines can be executed to extract context from structured or/and semi-structured sources maintained by the city Councils and other entities [36].
Multimodal traffic data analysis Numerous principles have been suggested in the literature for the integrative analysis of traffic data from heterogeneous modes of transport:
• descriptive analysis: (1) inference of multimodal origin–destination matrices by consolidating trip record data and tracing the complete movements of individual users throughout the public trans-port network [42, 68],(2) mining of actionable traf-fic patterns, including frequent, periodic, emerging and anomalous patterns [37, 39, 71],(3) discovery of
bottlenecks to multimodal mobility (waiting times, number of commutes, walking distances within and outside commutes) from trip record data [42, 51],and (4) modelling traffic expectations by exploring the rich spatiotemporal content of the available traffic data and taking into consideration user-specific com-mutes in interface areas. State-of-the-art principles on spatiotemporal pattern mining, urban data fusion and analytics, and relational data mining can be pur-sued towards these ends [5, 21, 73],
• predictive analysis: traffic forecasting is the predomi-nant prediction task [40]. Following breakthroughs from deep learning along the last decade, we observed a shift from classic statistical approaches towards recurrent neural networks [22] and graph neural networks [69], some sensitive to transfers and other associations between different modes of transport [63], to better support both short-term and long-term forecasts,
• prescriptive analysis: comprises advances on simula-tion, control and optimization to support decisions related with both individual and multimodal plan-ning of the public transportation network (schedule-, vehicle- and route-wise) and urban traffic positive conditioning. Model-based multi-agent reinforce-ment learning [67], hierarchical network agent struc-tures [15] and the use of deep neural networks as the underlying representation of the control problem [24] have been proposed towards these ends.
Emerging traffic changes To account for ongoing urban mobility changes, traffic data analysis should be an auto-mated process taking an arbitrary period of urban traf-fic data as input. In this context, the following principles should be pursued:
• principles from incremental data mining and online learning, including those brought forth by Nalla-peruma et al. [43], should be placed to guarantee the ability to learn from data streams, where new traffic records are continuously arriving. These principles guarantee the updatability of the models in the pres-ence of more recent data without the need to com-pute descriptive and predictive models fully from scratch,
• an additional important principle is the early discov-ery of emerging mobility patterns. Neves et al. [45] introduced principles for the timely discovery of emerging traffic dynamics, generally corresponding to new traffic flows or road/station/vehicle (de)con-gestions, creating the possibility to anticipate poten-tial mobility bottlenecks that are critical knowledge

Page 7 of 22Lemonde et al. European Transport Research Review (2021) 13:64
for tactical and strategic mobility planning. In addi-tion, trends and abrupt changes should be further identified for a proper understanding of non-seasonal changes in the city traffic.
Context‑aware learning Different principles have been placed to incorporate and learn from different sources of context, namely weather records, planned events, and occurrences of potential relevance from social media data [34, 52, 56, 60, 66]. Two major classes of context-sensitive approaches can be identified from the existing litera-ture. First, approaches that aim to describe and predict traffic dynamics by segmenting data in slices according to the available situational context and using only con-text-resembling slices for understanding and forecasting demand [34, 38]. Second, approaches able to embed the context directly in the models by capturing correlations with the context and using these correlations as correc-tion factors to automatically adjust descriptive and pre-dictive models [23, 52].
Assessing multimodal decisions Robust assessments are necessary to guarantee the adequacy of decisions placed from multimodal models of urban traffic. In this context, they should be pursued at three major levels:
1. data analysis level: the aforementioned descrip-tive, predictive and prescriptive multimodal models should be equipped with robust evaluation criteria to assess their proper decision translation. Multimodal traffic associations in descriptive model associations should be subjected to strict actionability and statisti-cal significance testing [44]. In the context of predic-tive models, residual analysis and inference of upper and lower statistical bounds should be pursued using a sound evaluation setting, such as cross-validation schema on a rolling basis [54],
2. decision level: passenger’s modal preferences, recep-tivity for mode-commutes and endurable walking distances should be firstly identified on a user-by-user basis in accordance with historical data [16, 28]. Once these assumptions are defined, the prop-erties of the affected passenger trips can be quanti-fied to estimate the decision’s impact on the mobility dynamics,
3. post-decision level: it is the easiest assessment level since the mobility dynamics before and after a deci-sion can be objectively compared. Illustrating, the new patterns of multimodality can be measured to assess the impact of changes in the public transporta-tion network for specific groups of users or the over-all population in terms of waiting times, number of
commutes, and adherence towards active and public modes of transport [12].
Multimodal planning The data-centric analysis of the traffic demand and public transport supply provides a ground truth for the transparent and objective coordina-tion between carriers. In this context, it is important to satisfy the following principles:
• guarantee the interpretability of the learned models and the traceability of the recommendations [6, 7]. The models should be easily auditable in order to guarantee that there is no preference towards specific carries in detriment of others,
• offer a robust statistical frame. Given the stochastic nature of mobility dynamics, it is essential to assess whether the found patterns of multimodality occur by chance in order to strictly guarantee statistically significant outputs [29]. In this context, statistical tests can be placed to assess the trustworthy degree of decisions, and new heuristics incorporated within the learning process to minimize false positive and false negative discoveries,
• comprehensively compare alternative decisions (e.g., suboptimal routing and scheduling plans) in order to assess complementary scenarios and further validate the quality of the suggested recommendations [3].
4 Results: addressing the challenges in the city of Lisbon
This section introduces Lisbon as our case study to show how ongoing efforts have been established to answer the introduced challenges. Section 4.1 describes the public transportation system of the Lisbon Metropolitan Area. Sections 4.2 and 4.3 describe the undertaken initiatives for exploring opportunties and addressing the major obstacles to the multimodal traffic data analysis.
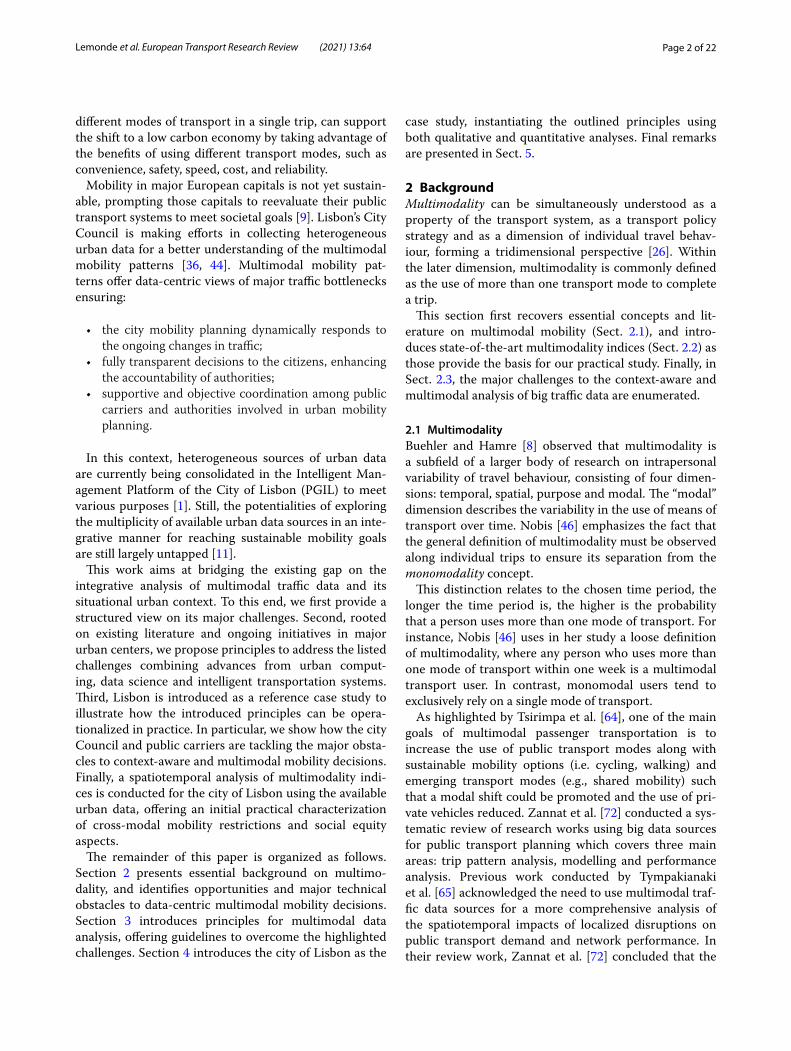
4.1 Lisbon city as our study caseThis work is anchored in the research and innovation project ILU—Integrative Learning from Urban Data and Situational Context for City Mobility Optimiza-tion—, a project that joins the Lisbon city Council and two research institutes, bridging the ongoing research on urban mobility with recent advances from artificial intelligence. The available traffic data comes from vari-ous heterogeneous sources collected for the Lisbon Met-ropolitan Area (LMA). The LMA is an administrative regional division in Portugal that covers the municipal-ity of Lisbon and an additional set of 17 surrounding municipalities (Fig. 1). Although the reported research
Page 8 of 22Lemonde et al. European Transport Research Review (2021) 13:64
is directed towards the municipality of Lisbon, its con-tribution and results can be extended and applied to the nearby municipalities to enable more comprehensive analysis of inter-municipal commuting mobility patterns.
The public transport network in the Lisbon Metropoli-tan Area (LMA) is composed by twelve carriers. Infor-mation pertaining to the network of the largest public carriers is provided in Table 1. Passenger transport run by the mentioned public transport operators are equipped with smart card readers for boarding and, depending on the type of vehicle, alighting.
Amongst the listed public carriers, only two—CAR-RIS (bus and tram operator) and METRO (subway operator)—offer a comprehensive footprint coverage along the city of Lisbon. All remaining carriers operate within the broader metropolitan geographies to offer accesses from nearby municipalities into the Lisbon city, but do not offer city-wide coverage, being limited to specific locations outside the city center (Sete Rios,
Campo Grande, Areeiro, Entrecampos, Oriente, Ben-fica and Santa Apolónia). In this context, our focus is primarily placed on smart card validations at CARRIS and METRO operators, accounting for over 80% of the validations within the city of Lisbon.
In addition to bus, tram and subway modes of trans-port, we further combine validations from the Lisbon’s public bike sharing system (GIRA), corresponding to bike pick-ups and drop-offs. METRO and GIRA validations are performed at stations. In contrast, smart card valida-tions in CARRIS are performed at the entry of buses. As such, we make use of alight stop inference principles pro-posed by Cerqueira et al. [12] to estimate exits.
4.2 Multimodal traffic data analysis in Lisbon4.2.1 Integrated fare collection systemsThe providers of bus, tram, subway, railway and inland waterway modes of transport in the city of Lisbon are currently operating under an integrated fare collection
Fig. 1 Lisbon Metropolitan Area and its municipalities

Page 9 of 22Lemonde et al. European Transport Research Review (2021) 13:64
system, enabled through the VIVA card initiative. The VIVA card initiative, firstly established between the subway operator (METRO) and the major bus opera-tor (CARRIS), was in 2017 extended to further encom-pass railway operator, Comboios de Portugal (CP), and in 2019 extended towards the remaining major carriers operating within (or interfacing with) the city of Lisbon.1 To this end, the early individual ticketing systems were consolidated into a unique ticketing system coordinated by OTLIS, the responsible entity for managing the infor-mation resources shared among carriers. In 2019 multi-modal tariff plans were also released to create incentives towards a multimodal use of the public transportation system.
4.2.2 Urban data acquisition and consolidationAmong the diverse initiatives established by the Lisbon City Council towards sustainable mobility, focal efforts are being placed on the city sensorization, and subse-quent data acquisitions and consolidation [1]. Numerous sources of urban data—covering areas such as mobility, security, decarbonisation, urban planning, local develop-ment and civil protection—are currently being consoli-dated in the Intelligent Management Platform of Lisbon (PGIL).2 In particular, the following sources of traffic data are currently already consolidated:
• road traffic data from three major types of sensors: (1) inductive loop detectors in major road junctions in the city, offering discrete views on traffic flow; (2) mobile devices with global positioning systems (GPS) and active applications such as WAZE3 or TomTom,4
offering aggregated views of traffic congestion along specific road segments (geolocalized speed data); and (3) privacy-compliant cameras in major roads;
• aggregated views of public transport data, including passengers’ card validations and the GPS position-ing of public vehicles. Due to privacy and security aspects, only aggregated views of card validations along the public transport network are maintained by the city Council. The raw trip records are main-tained separately by each operator and consolidated by OTLIS to collect statistics and ensure the sound interoperability of ticketing systems;
• bike sharing data from the Lisbon’s public bike shar-ing system (GIRA), including trip records per user, user feedback on bicycle’s condition, bike charg-ing information, bike malfunction and repair status, among others;
• other sources: emerging modes of transportation, including private scooter traffic data, are being also consolidated. An entry requirement for new pri-vate operators is precisely the full disclosure of trip records.
4.2.3 Context data incorporationThe Lisbon city Council further established protocols to collect diversified sources of situational context informa-tion with potential impact on traffic for guiding mobility decisions. Some of the available sources of context data include:
• public events, including conventions, festivals, con-certs, and sport events. The historic and prospec-tive events are currently sourced from the cultural
Table 1 Public transport operators in the Lisbon Metropolitan Area
Sources: Road operators—IMT (SIGGESC, February 11, 2016); Railway operators—Gismédia (Transporlis) October, 2012
Operators Type Routes (n.°) Stops (n.°) Length (km) Distance average between stops (m)
Carris Bus 77 2.174 796 366
Rodoviária de Lisboa Bus 101 2.238 1.316 588
TST-Transportes Sul do Tejo Bus 193 5.247 3.927 748
CP-Urbanos de Lisboa Rail transport 3 65 179 2.754
Fertagus Rail transport 1 14 54 3.857
Metro-Metropolitano de Lisboa Subway 4 50 43 860
Transtejo & Soflusa Ferry 6 9 37 4.111
1 https:// www. porta lviva. pt/ pt/ homep age/ sobre-a- otlis/ empre sas- adere ntes. aspx.2 https:// lisbo ainte ligen te. cm- lisboa. pt/.
3 https:// www. waze. com/ en- GB/.4 https:// www. tomtom. com/ engb.

Page 10 of 22Lemonde et al. European Transport Research Review (2021) 13:64
city agenda and planned usage of halls, stadiums and open areas;
• urban planning of the city with the localization of traffic generator-attractor poles, including: com-mercial poles (malls, commercial permits, markets, terminals), education facilities (public and private schools, universities, institutes), health-related facili-ties, sport facilities, cultural poles (concert halls, museums, theatres), recreational spaces, parks, or citizen spaces;
• ongoing and planned construction road works (traffic conditioning events) characterized by a set of trajec-tories with (possibly non-convex) interval of obstruc-tion and accompanying details (including the number of affected ways and whether interruption is spas-modic);
• weather record data sourced from three meteorologi-cal stations maintained by Instituto Português do Mar e da Atmosfera (Portuguese weather agency);
• other sources of interest, including details on traffic and transport networks (mostly walking, road and cycling infrastructures), zoning information (includ-ing traffic analysis zones), city occurrences (including road accidents and incidents, medical emergencies, fires and floods, logistical help and falling structures, transport requests, conservation and complaints, and rescue and civil protection), and other calen-dric information with impact on traffic patterns (e.g., bank holidays).
The city Council standardly stores these different con-text data sources using semi-structured data representa-tions (JSON) at the Lisboa Aberta (Open Lisbon) portal. The repositories are periodically updated in order to facilitate administrative tasks, as well as to potentiate complementary strategic and research initiatives.
4.2.4 Multimodal analysis of massive traffic dataMultiple contributions on multimodal traffic data analy-sis have been undertaken in the context of the ILU pro-ject, rooted on the interdisciplinary triaxial lens: data science and statistics—urban mobility planning—arti-ficial intelligence. Cerqueira et al. [13] proposed an approach for inferring dynamic and multimodal origin–destination matrices using bus, tram and subways modes. Approximately 20% of journeys in the Lisbon’s trans-portation network require one or more transfers. The approach supports dynamic OD inference along param-eterizable calendrical rules, spatial criteria. Traffic flows can be further decomposed in accordance with the user profile and the nature of trips. Finally, the target ODs gather several statistics that support traffic flow analysis, helping CARRIS, METRO and the Lisbon city Council to
detect vulnerabilities throughout the transport network, including statistics pertaining to commutation needs, walking distances and trip durations. On the same work, we further proposed alight bus stop inference models in the absence and presence of multimodal views. The gath-ered results show that the multimodal model successfully estimated the exits of 85% of trip segments, + 10 pp than the monomodal counterpart.
On the previous work of Neves et al. [44], we tack-led the problem of mining actionable patterns of road mobility from heterogeneous sources of traffic data. To this end, we proposed the combined use of data trans-formations and pattern-based biclustering searches to comprehensively explore spatiotemporal associations within road traffic data. Results using geolocalized speed data from mobile devices and inductive loop counter data from stationary devices at major arteries in the city of Lisbon confirm the role of the proposed integrative data mining methodology to discover actionable traffic patterns.
These earlier contributions, together with additional predictive approaches for multimodal traffic data analy-sis [54] and online Big Data visualization facilities, are currently integrated within a recommendation system, termed ILU App. The deployment of this set of urban analytics tools within the PGIL managed by the city of Lisbon, is expected to support urban mobility planning giving priority for public transport options and the inte-gration of active travel modes (walking, shared public bicycles) with bus and/or metro/subway. Moreover, the full scalability and online nature of the devised tools can be enriched by targeting other dimensions of the city dynamics in the post-pandemic era.
4.2.5 Emerging traffic changesIn urban mobility, emerging patterns reveal ongoing changes in city traffic dynamics, whose growth along time may indicate the establishment of new congestion trends along roads, stations or routes. Those trends can evolve to create traffic bottlenecks if timely precautions are not taken. As such, the early detection of emerging patterns offers urban planners the opportunity to make the necessary provisions to urban mobility.
In the earlier works of Neves et al. [44], we proposed the E2PAT method to discover emerging patterns from heterogoeneous traffic data sources in linear time. E2PAT combines spatiotemporal data mappings with simple yet effective time series differencing operations to find emerging traffic behaviors. E2PAT further provides sta-tistical guarantees of pattern growth, support and accu-racy, as well as visualization and navigation facilities, to safeguard the soundness and usability of the multi-modal pattern analysis process. An integrative score is

Page 11 of 22Lemonde et al. European Transport Research Review (2021) 13:64
considered to measure the relevance of emerging pat-terns, offering a sound criterion to control the false posi-tive and false negative discovery rates. E2PAT has been both applied to the Lisbon’s road traffic monitoring sys-tem and public transport network. Results confirm their relevance to retrieve all emerging (de)congestions in the road, stations and public vehicles in accordance with flex-ible spatial criteria and calendrical constraints.
4.2.6 Context‑aware learningHistorical and prospective sources of context data are maintained by the Lisbon city Council in semi-structured repositories that can be standardly accessed, facilitat-ing structured retrieval of information in accordance with spatial and temporal criteria of interest [36, 54]. In some of the previous works conducted in the context of the ILU project [11, 36], traffic data has been segmented in accordance with the available situational context—comparable events and calendrical, meteorological and spatial context. In addition, correlations between urban traffic in Lisbon and their situational context have been comprehensively computed with the aim of producing correction factors to automatically adjust descriptive and predictive models [23, 62]. Illustrating, the effect of extreme weather conditions on the public cycling demand demand has been assessed for a superior model-ling of traffic dynamics [11]. In this same work [11], we also show that the available context, whether static or temporal, can be used to augment traffic data. We show that the application of these three groups of context-aware learning principles—context-driven corrections, context-driven data segmentation and context-driven data augmentation—can be pursued irrespectively of the underlying spatiotemporal data structure. In particular, the impact of road interdictions, public events (including sport matches and large-scale concerts), and traffic gen-eration-attraction poles on traffic is quantified.
In an alternative work, Sardinha et al. [54] extended recurrent neural network layering to incorporate both historical and prospective sources of context with the aim of improving traffic forecasts. To this end, a sequential composition of long short term memory (LSTM) com-ponents and/or gated recurrent units (GRU) is proposed, where historical sources of context data are considered at the initial layers and prospective sources of context data at the latter layers. Historical context can be com-bined at the input layer to guide the learning task by rely-ing on masking principles. For instance, calendric masks can mark weekdays or academic periods and breaks, situational masks mark periods where events of inter-est may impact the demand observed at a given geogra-phy, and weather masks are associated with multivariate time series with as many variables as weather attributes
of interests. Prospective context data, such as weather forecasts and planned events, can be complementarily inputted into the last LSTM component to adjust predic-tions. Using public cycling traffic data in Lisbon, we show the role of historic and prospective sources of context to guide predictive tasks.
5 Results: multimodality indices in the city of Lisbon
Section 4 provided a general view on some of the ongoing initiatives and contributions towards multimodal traffic data analysis in the city of Lisbon. This section instanti-ates some of the principles enumerated in Sect. 3 with a specific purpose at hands: performing a spatiotemporal analysis of multimodality indices along the city of Lisbon to assess social equity aspects on the access to different transport modes.
Data. To conduct this study, we primarily rely on trip record data from CARRIS (bus and tram opera-tor), METRO (subway operator) and EMEL/GIRA (bike sharing operator) given their comprehensive footprint coverage along the city. As introduced in Sect. 4.1, addi-tional public carriers operate within the broader Lisbon Metropolitan Area (LMA) to offer accesses from nearby municipalities into the Lisbon city peripheries. Although the inclusion of trip records from these additional carri-ers are not considered in this work, they are relevant to provide a more comprehensive view on multimodality.
Figure 2 identifies the routes of the major public carri-ers in Lisbon. Figure 2A, B provide respectively the routes of CARRIS and METRO carriers. In Fig. 2B, the public bike sharing stations (green) and stationary road sensors (blue) are also displayed. Figure 2C complement this view with the routes of train operators (CP and Fertagus) and inland waterway operators (Transtejo and Soflusa), while Fig. 2D confronts the station footprint of CARRIS (yel-low) against the additional public bus carriers (TST, Rod-Lisboa, Sulfertagus).
For the analysis, we have considered all trip records from October 2019. A total 32.786.326 trips were recorded in the METRO network (65 million smart card validations at entry and exit stations), 11.360.894 trips were recorded at the entry of trams and buses in the CARRIS network, and 146.232 bicycles were picked up at the public GIRA’s bike sharing network during this period.
Figure 3 provides general statistics pertaining to aver-age daily use of each mode during weekdays and week-ends, while Fig. 4 offers a zoom-in on the METRO and CARRIS network to decompose the validations per subway line (Fig. 4A) and per cluster of routes in the bus-tram network (Fig. 4B).

Page 12 of 22Lemonde et al. European Transport Research Review (2021) 13:64
Spatial and temporal criteria. Multimodal pattern analysis can be conducted at different spatial granu-larities. Two major possibilities are considered. First, the user can manually specify the target geographical region of interest using polygon and circular mark-ing facilities. Second, the user can select predefined regions. We provide the following zoning maps for the Lisbon Metropolitan Area:
• Traffic Analysis Zones (TAZ): geographical unit used in transportation planning models to assess socio-economic indicators (Fig. 5a);
• Municipalities: coarsest geographical unit for the city. Currently, this work uses city parishes as the admin-istrative criterion of division (Fig. 5b);
• Sections: finest geographical unit, comprising small districts and neighbourhoods (Fig. 5c);
Under the selected spatial granularity, traffic events, such as smart card validations and individuals’ trajecto-ries, as well as the accompanying situational context data, are then linked to one or more Lisbon’s zones in accord-ance with their spatial extent.
Calendrical constraints—such as day of the week (e.g., Mondays), weekdays, holidays or on/off-academic period calendars—can be placed to segment the avail-able traffic data. The introduced principles for mul-timodal pattern analysis (Sect. 4) can then be applied per calendar or, alternatively, correction factors can be learned from calendrical annotations to guide the
Fig. 2 A Routes of CARRIS (major bus operator) by class: night (cobalt), red, green, blue, yellow, orange, pink buses. B Subway METRO stations and lines (red), GIRA bike stations (green) and road sensors (blue). C Stations and routes of railway and inland waterway operators: CP (orange), Fertagus (blue), Transtejo (dark green) and Soflusa (lime). D Stations of four major bus operators: CARRIS (yellow), RodLisboa (brown), TST (light blue) and Sulfertagus (lime)

Page 13 of 22Lemonde et al. European Transport Research Review (2021) 13:64
Fig. 3 Number of daily trips along subway (METRO), bus-tram (CARRIS), and cycling (GIRA) modes of transport in Lisbon on working days and weekends, October 2019
Fig. 4 Number of daily trips along the four METRO lines (subway) and seven CARRIS clusters of routes (bus-tram) on working days, October 2019
Fig. 5 Zoning: geographical decomposition of the Lisbon city at different granularities

Page 14 of 22Lemonde et al. European Transport Research Review (2021) 13:64
Fig. 6 Cycling-bus-subway quota (modal trip share) across the major traffic analysis zones (TAZ) in Lisbon, October 2019

Page 15 of 22Lemonde et al. European Transport Research Review (2021) 13:64
target tasks. Second, time intervals (e.g., on/off-peak hour intervals) or a fixed time granularity (e.g., 15-min) can be optionally specified to guide traffic data descrip-tors or predictors. For instance, passenger volume series in public transport can be resampled from card validations. In the absence of a minimum time granu-larity, the data analysis can be conducted at the raw event level or under multiple time aggregations.
Once spatiotemporal constraints are fixed, multi-dimensional querying and subsequent data mappings are provided to retrieve the desirable spatiotemporal data structures in accordance with the principles intro-duced along Sect. 4.
Mode distribution. Considering traffic analysis zones (TAZ) as the spatial criteria, Fig. 6 provides a comprehensive view of the quota of the three targeted modes of transport. It shall be noted that not all TAZ are covered by subway or bike stations, hence the pre-dominance of the bus mode (CARRIS) for a significant number of zones. The adherence towards the cycling mode of transport is considerably smaller in magnitude for most of the zones.
To assess how the modes are distributed in specific regions of interest, we consider the Entrecampos urban area. Entrecampos is an interface area that encom-passes all modes of transport and is further charac-terized by the presence of business and cultural traffic generation poles.
Figure 7A, B provide a zoom-in into this area, showing the subway, bus and cycling stations, and further high-lighting some of the commercial, healthcare, educational and cultural poles contained within this area.
In October 2019, we find a total of 19,033 bike pick-ups in this area, 1,786,568 smart card entry validations at the Entrecampos subway station, and 201,441 smart card validations at the bus stops in this area. Figure 7C depicts the hourly volume of check-in validations on Entrecam-pos’ bus stops, while Fig. 7D shows both check-in and check-out card validations for the two subway stations situated in this area under 15-min intervals. Generally, we observe that the amount and pattern of card valida-tions strongly vary across stations.
Multimodality. For detecting vulnerabilities associated with multimodal transportation, two major options are made available. The user can select one of the introduced indices of multimodality and use them to assess them at
the passenger level or, in alternative, at a geographical level by assessing the multimodal offering associated with a given regions.
Considering passenger level views, Fig. 8 provides a comprehensive view on the intensity of subway and bus usage per passenger. Passengers are distributed in accordance with the number of validations in METRO and CARRIS operators throughout October 2019.
Considering geographical level views, Fig. 9 (and the corresponding Table 2 in “Appendix”) presents the spatial distribution of the Herfindahl Hirschman index (Eq. 1) and multimodality Gini index (Eq. 2) for the traffic analy-sis zones (TAZ) of the Lisbon city. To this end, we rely on the volume of passenger entries and exits within the bus, tram, subway and cycling modes of transport along Octo-ber 2019. These state-of-the-art indices of multimodality are selected due to their sensitivity to the intensity of use per mode, bounded score ranges, and inherent simplicity.
Generally, we can observe two major sources of mul-timodal penalties: the presence of many zones with only mode of transport (generally bus on the periphery), as well as the intense preference towards subway trans-port in the center of the city. Despite the concordance of views offered by both indices, the gathered results further underline the presence of some significant differences, highlighting the importance of selecting each multimo-dality index aligned with the end purpose of the study.
Considering the revised HH index sensitive to the absence of traffic generated by modes without stations on a given zone, we can observe that the peripherical zones of the city are not as penalized by this index as they are by the original HH index which is normally used for equity assessment.
Figure 10 (and the corresponding Table 3 in “Appen-dix”) extends the previous analysis for Lisbon municipali-ties, highlighting differences as the coarser zones are now able to encompass new stations and further suggesting the importance of identifying a proper spatial criterion for the analysis of multimodal indices.
Multimodality indices at passenger and geographi-cal levels offer an initial characterization of modal pref-erences when multiple modes are available, mobility restrictions, and social equity aspects. The comprehen-sive analysis of these indices is expected to assist the municipality of Lisbon and comparable cities in mov-ing towards urban mobility plans where active modes
Fig. 7 A Subway stations (red), bus stops (yellow), bike sharing stations (green) and road sensors (blue) in the Entrecampos district. B Cycling roads, green parks, commercial poles (yellow), schools and institutes (light blue), health centres (red) and cultural poles (blue) in the Entrecampos district. C Hourly check-in validations in CARRIS buses at six stops in the Entrecampos area on a typical weekday. D Check-in and check-out validations at METRO stations in Entrecampos on a typical weekday
(See figure on next page.)

Page 16 of 22Lemonde et al. European Transport Research Review (2021) 13:64
smartcardvalid
ations
smartcardvalid
ations
Exits at entrecamposExits at Campo PequenoEntries at EntrecamposEntries at Campo Pequeno
A) B)
C)
D)
Fig. 7 (See legend on previous page.)

Page 17 of 22Lemonde et al. European Transport Research Review (2021) 13:64
of transportations are prioritized. As these indices are grounded on trip record data, they provide an objective means to establish coordination efforts among munici-palities and carriers; and offer the possibility to monitor reforms and continuously align decisions with the ongo-ing city traffic transformations, ensuring that the public transport system responds to emerging multimodal traf-fic vulnerabilities, a growing need given the transforma-tions and changing regulations observed in a pandemic context.
Incorporating situational context. The analysis of multimodality indices is only meaningful in the presence of situational context. In this work, we consider the role of traffic generation poles to this end. Traffic generation
and attraction poles generally refers to commercial areas, employment centres such as business parks and enter-prises, and collective equipment like hospitals, schools and stadiums, that generate or attract a significant volume of vehicle trips, either from contributors, visitors or providers at different times of the days. We currently maintain a com-plete localization of traffic generation poles for the city of Lisbon, as well as major city events (such as large concerts, congresses and soccer matches). Figure 11 provides maps of the city with some poles with impact on the city traffic.
The combined analysis of the computed multimodal-ity indices against the above traffic generation/attraction poles’, as well as station-route maps, is essential to guaran-tee the presence of multiple options of transport in areas
Fig. 8 Number of passengers in accordance with the intensity of usage per subway and bus-tram modes in October 2019. Groups of passengers are defined according to the number of entry smart card validations in METRO and CARRIS networks
Fig. 9 TAZ distribution of multimodality indices of bus-subway-cycling modes of transport in October 2019. A Herfindahl Hirschman index, HHm (1). B Gini index as proposed by (Tahmasbi et al. 2019)

Page 18 of 22Lemonde et al. European Transport Research Review (2021) 13:64
with high density of traffic generation poles. The combined analysis of these poles and individual traffic dynamics offers the unique opportunity to comprehensively model the spatiotemporal distribution of traffic along the city. Complementarily, the surveyed indices can be revised to further measure how the volume of passengers generated and attracted by nearby poles are being currently satisfied by the co-located modes of public transport.
6 ConclusionsThe research work offers a structured view on the oppor-tunities and challenges for the analysis of big traffic data produced from heterogeneous sources and passenger transport modes for supporting a more inclusive mobility planning. A set of guidelines to address existing challenges, while leveraging on opportunities, were sourced from the ongoing advances in the fields of artificial intelligence and
Fig. 10 Distribution of multimodality indices (HH and Gini indices) along Lisbon municipalities considering bus-subway-cycling modes of transport in October 2019. A Herfindahl Hirschman index (1). B Gini index (2)
Fig. 11 A Cycling roads (green), art and cultural poles (red), and tourist attraction poles (yellow). B Major traffic generation poles: commercial (blue), schools and institutes (green) and health centres (red)

Page 19 of 22Lemonde et al. European Transport Research Review (2021) 13:64
data science which were applied to urban mobility through a real-life case study engaging the City of Lisbon and its major public passenger transport operators.
The established initiatives by the Lisbon City Coun-cil towards the consolidation of relevant sources of urban data on its intelligent management platform, together with the integrative fare collection system and entry require-ments for carriers operating in the Lisbon metropolitan area, offers unique opportunities for multimodal pattern analysis and cross-carrier coordination. Still, the inherent nature of multimodal traffic data—heterogeneous, mas-sive in size, rich in spatiotemporal dynamics, subjected to variable aspects, and context-dependent—together with the increasing disruptive changes in urban traffic poses challenges towards the pursue of data-centric multimodal decisions. To tackle these challenges, the outlined work combines a comprehensive set of principles from context-aware, spatiotemporal, distributed and relational data mining. In particular, the spatiotemporal analysis of mul-timodaility indices against available situational context offers an initial simplistic way of detecting urban zones with the lack of adequate transport in specific time peri-ods and imbalanced preferences towards specific modes of transport. This is a relevant first step for the city of
Lisbon to comprehensively diagnose vulnerabilities in the multimodal public transport network and to assess causal factors for the skewed distributions of demand, whether caused by the inadequacy of transport supply at specific time periods, lack of multimodal integration at destination areas, or reveal the domination of another mode of trans-port. Although the work represents a valuable contribution for the city to advance towards sustainable mobility, com-plementary qualitative research is recommended to bet-ter understand the complex interactions between human behaviour, the specific socioeconomic context of individu-als and the range of traffic patterns found in each city area.
The conducted analysis of multimodal aspects pertain-ing to the Lisbon case suggest that decisions grounded in available traffic data provide an objective and transparent means to improve the cross-modal cooperation of public passenger transport operators and explore untapped syner-gies for multimodal and sustainable mobility planning.
AppendixSee Tables 2 and 3.
Table 2 Distribution of multimodality indices (HH and Gini) along Lisbon’s traffic analysis zones (TAZ) considering bus-subway-cycling modes of transport during October 2019
region HH Gini region HH Gini region HH Gini
Belém (Ribeirinha—Belém) 1.00 0.67 Campolide (Campolide) 1.00 0.67 Arroios (Estefânia) 0.95 0.65
Belém (Alto Duque) 1.00 0.67 São Domingos Benfica (Estrada Luz) 0.82 0.60 Arroios (Arroios | Norte) 0.88 0.62
Belém (Belém | Oeste) 1.00 0.67 Carnide (Avenidas Novas) 0.84 0.61 Arroios (Arroios | Sul) 0.73 0.56
Belém (Belém | Este) 1.00 0.67 Carnide (Carnide) 0.64 0.51 Arroios (Anjos) 0.56 0.45
Ajuda (Restelo) 1.00 0.67 Lumiar (Telheiras | Oeste) 0.69 0.54 Santa Maria Maior (Baixa) 0.78 0.58
Alcântara (Santo Amaro | Oeste) 1.00 0.67 Lumiar (Telheiras | Este) 0.83 0.60 Santa Maria Maior (Castelo) 0.55 0.44
Alcântara (Santo Amaro | Sul) 1.00 0.67 Lumiar (Parque Europa) 0.62 0.49 São Vicente de Fora (São Vicente) 0.62 0.49
Alcântara (Santo Amaro | Norte) 1.00 0.67 Lumiar (Lumiar | Oeste) 0.66 0.52 Penha de França (Penha França) 1.00 0.67
Ajuda (Ajuda | Sul) 1.00 0.67 Lumiar (Lumiar | Sul) 1.00 0.67 Penha de França (São João) 1.00 0.67
Ajuda (Ajuda | Oeste) 1.00 0.67 Lumiar (Paço Lumiar) 1.00 0.67 Beato (Madre Deus | Oeste) 1.00 0.67
Ajuda (Ajuda | Norte) 1.00 0.67 Lumiar (Telheiras | Norte) 1.00 0.67 Beato (Picheleira) 1.00 0.67
Estrela (Ribeirinha—Belém) 1.00 0.67 Lumiar (Lumiar | Norte) 1.00 0.67 Beato (Madre Deus | Sul) 1.00 0.67
Estrela (Alcântara) 1.00 0.67 Santa Clara (Ameixoeira | Norte) 0.53 0.42 Beato (Madre Deus | Norte) 1.00 0.67
Estrela (Lapa) 1.00 0.67 Santa Clara (Ameixoeira | Sul) 1.00 0.67 Marvila (Chelas) 1.00 0.67
Estrela (Estrela) 0.99 0.66 Alvalade (Hospital Santa Maria | Oeste)
1.00 0.67 Marvila (Marechal Gomes da Costa) 0.67 0.53
Campo de Ourique (Campo Ourique)
1.00 0.67 Alvalade (Hospital Santa Maria | Este)
0.86 0.61 Marvila (Infante D Henrique—Porto | Este)
1.00 0.67
Campo de Ourique (Amoreiras) 1.00 0.67 Alvalade (Cidade Universitária) 0.88 0.62 Marvila (Infante D Henrique—Porto | Oeste)
1.00 0.67
Misericórdia (São Paulo) 0.66 0.52 Alvalade (Campo Grande) 1.00 0.67 Marvila (Parque Bela Vista) 1.00 0.67
Misericórdia (Bairro Alto) 1.00 0.67 Alvalade (Avenida do Brasil) 0.95 0.65 Marvila (Bairro Armador) 0.71 0.55
Santo António (Amoreiras) 0.82 0.60 Alvalade (Alvalade) 0.66 0.52 Lumiar (Aeroporto) 0.88 0.62

Page 20 of 22Lemonde et al. European Transport Research Review (2021) 13:64
AbbreviationsILU: Integrative Learning from Urban Data and Situational Context for City Mobility Optimization (project); HH: Herfindahl–Hirschman; LMA: Lisbon’s Metropolitan Area; METRO: Metropolitan of Lisbon (subway operator); CARRIS: Companhia Carris de Ferro de Lisboa (Bus and tram operator); CP: Comboios de Portugal (Train operator); OTLIS: Operadores de Transportes da região de Lisboa (Public carriers in Lisbon’s metropolitan area); GPS: Global Positioning System; GIRA: Lisbon’s public bike sharing system; GTFS: General Transit Feed Specifica-tion; OD: Origin–Destination; TAZ: Traffic Analysis Zones.
AcknowledgementsThe authors thank the support of CARRIS, METRO and the Lisbon City Council (Câmara Municipal de Lisboa) and its Gabinete de Mobilidade and Centro de Operações Integrado for the data provision and valuable feedback.
Authors’ contributionsAll authors contributed to research and to writing-up present the article. All authors read and approved the final manuscript.
FundingThis work is further supported by national funds through Fundação para a Ciência e Tecnologia under project ILU – Integrative Learning from Urban Data and Situational Context for City Mobility Optimization (DSAIPA/DS/0111/2018) – and INESC-ID pluriannual (UIDB/50021/2020).
Availability of data and materialsThe traffic data are available for collaborations in the context of the ILU project under non-disclosure agreements (NDAs) with CML, CARRIS and METRO.
Declarations
Competing interestsThe authors declare that they have no competing interests.
Author details1 LNEC I.P. & INESC-ID, Instituto Superior Técnico, University of Lisbon, Lisbon, Portugal. 2 Department of Transport, LNEC I.P., Lisbon, Portugal. 3 INESC-ID, Instituto Superior Técnico, University of Lisbon, Lisbon, Portugal.
Table 3 Distribution of multimodality indices (HH and Gini) along Lisbon parishes considering bus, subway and cycling modes of transport during October 2019
parish HH Gini parish HH Gini parish HH Gini
Santo Antonio 0.59 0.47 Estrela 1.00 0.67 Alcantara 1.00 0.67
Parque das Nacoes 0.75 0.57 Arroios 0.71 0.55 Campo de Ourique 1.00 0.67
Marvila 0.53 0.41 Santa Clara 0.50 0.34 Sao Vicente 0.62 0.49
Ajuda 1.00 0.67 Avenidas Novas 0.87 0.62 Olivais 0.66 0.52
Areeiro 0.52 0.41 Carnide 0.57 0.46 Misericordia 0.63 0.50
Santa Maria Maior 0.73 0.56 S. Domingos Benfica 0.50 0.34 Lumiar 0.70 0.55
Alvalade 0.61 0.49 Beato 0.54 0.43 Penha de Franca 1.00 0.67
Belem 1.00 0.67 Campolide 0.66 0.52 Benfica 0.52 0.39
region HH Gini region HH Gini region HH Gini
Santo António (São Mamede) 0.98 0.66 Alvalade (São João de Brito) 0.96 0.65 Olivais (Logística Aeroportuaria) 1.00 0.67
Santo António (São José) 0.61 0.49 Alvalade (Roma—Areeiro | Este) 0.80 0.59 Olivais (Alfredo Bensaúde) 0.58 0.47
Benfica (Colégio Militar/Luz) 1.00 0.67 Alvalade (Roma—Areeiro | Oeste) 1.00 0.67 Olivais (Encarnação | Oeste) 1.00 0.67
Benfica (Benfica | Sul) 1.00 0.67 Av. Novas (Bairro Santos | Este) 0.94 0.64 Olivais (Relógio) 1.00 0.67
Benfica (Benfica | Norte) 1.00 0.67 Av. Novas (Bairro Santos | Oeste) 1.00 0.67 Olivais (Olivais—Centro) 1.00 0.67
Benfica (Monsanto | Norte) 1.00 0.67 Av. Novas (Campo Pequeno | Oeste) 1.00 0.67 Olivais (Encarnação | Este) 1.00 0.67
São Domingos Benfica 1.00 0.67 Av. Novas (Campo Pequeno | Este) 0.93 0.64 Olivais (Olivais | Norte) 0.75 0.57
São Domingos Benfica (Sete Rios | Norte)
0.52 0.40 Av. Novas (Avenidas Novas | Oeste) 0.96 0.65 Olivais (Olivais | Sul) 0.88 0.63
São Domingos Benfica (Estrada Luz | Este)
0.98 0.66 Av. Novas (Parque Eduardo VII) 0.88 0.62 Olivais (Olivais | Este) 1.00 0.67
São Domingos Benfica (Monsanto | Norte)
1.00 0.67 Av. Novas (Picoas) 0.95 0.65 Parque das Nações (Parque Nações | Sul)
0.83 0.61
São Domingos de Benfica (Sete Rios | Sul)
1.00 0.67 Av. Novas (Avenidas Novas | Este) 0.75 0.57 Parque das Nações (Estação Oriente) 0.81 0.60
Campolide (Bairro Liberdade) 1.00 0.67 Areeiro (Areeiro | Norte) 0.59 0.47 Parque das Nações (Quinta Laran-jeiras)
0.85 0.61
Campolide (Praça Espanha | Sul) 1.00 0.67 Areeiro (Areeiro | Sul) 0.71 0.55 Parque das Nações (Parque Nações | Norte)
0.83 0.61
Campolide (Praça Espanha | Norte) 0.89 0.63 Areeiro (Alto Pina) 0.60 0.48 Parque das Nações (Parque Tejo) 0.91 0.64
Table 2 (continued)

Page 21 of 22Lemonde et al. European Transport Research Review (2021) 13:64
Received: 16 February 2021 Accepted: 11 November 2021
References 1. Albuquerque, V., Oliveira, A., Barbosa, J. L., Rodrigues, R. S., Andrade, F.,
Dias, M. S., & Ferreira, J. C. (2021). Smart cities: Data-driven solutions to understand disruptive problems in transportation—The Lisbon Case Study. Energies, 14(11), 3044.
2. Allison, P. D. (1978). Measures of inequality. American Sociological Review, 43, 865–880.
3. Almasi, M. H., Sadollah, A., Oh, Y., Kim, D. K., & Kang, S. (2018). Optimal coordination strategy for an integrated multimodal transit feeder net-work design considering multiple objectives. Sustainability, 10(3), 734.
4. Aparicio, J. T., Arsenio, E., & Henriques, R. (2021). Understanding the impacts of the COVID-19 pandemic on public transportation travel pat-terns in the City of Lisbon. Sustainability, 13(15), 8342.
5. Atluri, G., Karpatne, A., & Kumar, V. (2018). Spatiotemporal data mining: A survey of problems and methods. ACM Computing Surveys (CSUR), 51(4), 1–41.
6. Barredo-Arrieta, A., Laña, I., & Del Ser, J. (2019). What lies beneath: A note on the explainability of black-box machine learning models for road traffic forecasting. In IEEE intelligent transportation systems confer-ence (ITSC) (pp. 2232–2237).
7. Bendriss, S., & Benabdelhafid, A. (2011). Multimodal transport informa-tion system: Modelling approach for goods traceability. International Journal of Business Information Systems, 7(4), 365–387.
8. Buehler, R., & Hamre, A. (2016). An examination of recent trends in multi-modal travel behavior among american motorists. International Journal of Sustainable Transportation, 10(4), 354–364.
9. Canitez, F. (2019). Pathways to sustainable urban mobility in develop-ing megacities: A socio-technical transition perspective. Technological Forecasting and Social Change, 141, 319–329.
10. Cepeliauskaite, G., Keppner, B., Simkute, Z., Stasiskiene, Z., Leuser, L., Kalnina, I., Kotovica, N., Andiņš, J., & Muiste, M. (2021). Smart-mobility services for climate mitigation in urban areas: Case studies of Baltic Countries and Germany. Sustainability, 13(8), 4127.
11. Cerqueira, S., Arsénio, E., & Henriques, R. (2020). Integrative analysis of traffic and situational context data to support urban mobility planning. In European Transport Conference 2020 (ETC 2020).
12. Cerqueira, S., Arsénio, E., & Henriques, R. (2021) Inference of multimodal and dynamic origin-destination matrices from incomplete smart-card data: A case study in the City of Lisbon. In European Transport Confer-ence 2021 (ETC 2021).
13. Cerqueira, S., Arsenio, E., & Henriques, R. (2021). Inference of dynamic origin-destination matrices with trip and transfer status from individual smart card data. In European Transport Conference 2021 (ETC 2021).
14. Chlond, B. (2012). Making people independent from the car–multi-modality as a strategic concept to reduce co 2-emissions. In Cars and carbon (pp. 269–293). Springer.
15. Choy, M. C., Srinivasan, D., & Cheu, R. L. (2003). Cooperative, hybrid agent architecture for real-time traffic signal control. IEEE Transactions on Systems, Man, and Cybernetics-Part A: Systems and Humans, 33(5), 597–607.
16. Clark, W. A., Huang, Y., & Withers, S. (2003). Does commuting distance matter? Commuting tolerance and residential change. Regional Science and Urban Economics, 33(2), 199–221.
17. Cowell, F. (2011). Measuring inequality. Oxford University Press. 18. Diana, M., & Mokhtarian, P. L. (2007). The individual desire to change a
“modal basket” and its relationship with the actual and perceived use of different transport means. In 11th World congress on transport research.
19. Diana, M., & Mokhtarian, P. L. (2009). Desire to change one’s multimodality and its relationship to the use of different transport means. Transportation Research Part F: Traffic Psychology and Behaviour, 12(2), 107–119.
20. Diana, M., & Pirra, M. (2016). A comparative assessment of synthetic indi-ces to measure multimodality behaviours. Transportmetrica A: Transport Science, 12(9), 771–793.
21. Dzeroski, S. (2009). Relational data mining. In Data mining and knowledge discovery handbook (pp. 887–911). Springer.
22. Fu, R., Zhang, Z., & Li, L. (2016). Using LSTM and GRU neural network methods for traffic flow prediction. In 31st Youth Academic annual confer-ence of Chinese Association of Automation (YAC) (pp. 324–328). IEEE.
23. Gallop, C., Tse, C., & Zhao, J. (2012). A seasonal autoregressive model of Vancouver bicycle traffic using weather variables. In Transportation research board 91st annual meeting, number 12-2119.
24. Genders, W., & Razavi, S. (2016). Using a deep reinforcement learning agent for traffic signal control. arXiv preprint. arXiv: 1611. 01142.
25. Groth, S. (2019). Multimodal divide: Reproduction of transport poverty in smart mobility trends. Transportation Research Part A: Policy and Practice, 125, 56–71.
26. Groth, S., & Kuhnimhof, T. (2021). Multimodality in transportation. In R. Vickerman (Ed.), International encyclopedia of transportation (pp. 118–126). Elsevier.
27. Hackl, R., Raffler, C., Friesenecker, M., Kramar, H., Kalasek, R., Soteropoulos, A., Wolf-Eberl, S., Posch, P., & Tomschy, R. (2019). Promoting active mobil-ity: Evidence-based decision-making using statistical models. Journal of Transport Geography, 80, 102541.
28. Heinen, E., & Bohte, W. (2014). Multimodal commuting to work by public transport and bicycle: Attitudes toward mode choice. Transportation Research Record, 2468(1), 111–122.
29. Henriques, R., & Madeira, S. C. (2018). BSIG: Evaluating the statistical sig-nificance of biclustering solutions. Data Mining and Knowledge Discovery, 32(1), 124–161.
30. Jang, W. (2010). Travel time and transfer analysis using transit smart card data. Transportation Research Record, 2144(1), 142–149.
31. Javaid, A., Creutzig, F., & Bamberg, S. (2020). Determinants of low-carbon transport mode adoption: Systematic review of reviews. Environmental Research Letters, 15(10), 103002.
32. John, A., Sugumaran, M., & Rajesh, R. S. (2016). Indexing and query processing techniques in spatio-temporal data. ICTACT Journal on Soft Computing, 6(3).
33. Kuhnimhof, T., Chlond, B., & Von Der Ruhren, S. (2006). Users of transport modes and multimodal travel behavior: Steps toward understanding travelers’ options and choices. Transportation Research Record, 1985(1), 40–48.
34. Kwoczek, S., Di Martino, S., & Nejdl, W. (2014). Predicting and visualizing traffic congestion in the presence of planned special events. Journal of Visual Languages & Computing, 25(6), 973–980.
35. Lambert, J. H., Joshi, N. N., Peterson, K. D., & Wadie, S. M. (2007). Coordina-tion and diversification of investments in multimodal transportation. Public Works Management & Policy, 11(4), 250–265.
36. Leite, I., Finamore, A., & Henriques, R. (2020). Context-sensitive modeling of public transport data. In Transport Research Arena (TRA2020), Helsinki.
37. Li, L., Jiang, R., He, Z., Chen, X. M., & Zhou, X. (2020). Trajectory data-based traffic flow studies: A revisit. Transportation Research Part C: Emerging Technologies, 114, 225–240.
38. Li, Y., Zheng, Y., Zhang, H., & Chen, L. (2015). Traffic prediction in a bike-sharing system. In Proceedings of the 23rd SIGSPATIAL international confer-ence on advances in geographic information systems, SIGSPATIAL ’15 (pp. 33:1–33:10). ACM.
39. Liao, Y., Gil, J., Pereira, R. H., Yeh, S., & Verendel, V. (2020). Disparities in travel times between car and transit: Spatiotemporal patterns in cities. Scientific Reports, 10(1), 1–12.
40. Luo, X., Li, D., Yang, Y., & Zhang, S. (2019). Spatiotemporal traffic flow pre-diction with KNN and LSTM. Journal of Advanced Transportation. https:// doi. org/ 10. 1155/ 2019/ 41453 53
41. Mamoulis, N., Cao, H., Kollios, G., Hadjieleftheriou, M., Tao, Y., & Cheung, D. W. (2004). Mining, indexing, and querying historical spatiotemporal data. In Proceedings of the tenth ACM SIGKDD international conference on Knowledge discovery and data mining (pp. 236–245).
42. Munizaga, M. A., & Palma, C. (2012). Estimation of a disaggregate multi-modal public transport origin–destination matrix from passive smartcard data from santiago, chile. Transportation Research Part C: Emerging Tech-nologies, 24, 9–18.
43. Nallaperuma, D., Nawaratne, R., Bandaragoda, T., Adikari, A., Nguyen, S., Kempitiya, T., De Silva, D., Alahakoon, D., & Pothuhera, D. (2019). Online incremental machine learning platform for big data-driven smart traffic management. IEEE Transactions on Intelligent Transportation Systems, 20(12), 4679–4690.

Page 22 of 22Lemonde et al. European Transport Research Review (2021) 13:64
44. Neves, F., Finamore, A., Madeira, S., & Henriques, R. (2021). Mining action-able patterns of road mobility from heterogeneous traffic data using biclustering. IEEE Transactions on Intelligent Transportation Systems. https:// doi. org/ 10. 1109/ TITS. 2021. 30572 40
45. Neves, F., Finamore, A., & Henriques, R. (2020). Efficient discovery of emerging patterns in heterogeneous spatiotemporal data from mobile sensors. In 17th EAI International conference on mobile and ubiquitous systems: Computing, networking and services (MobiQuitous).
46. Nobis, C. (2007). Multimodality: Facets and causes of sustainable mobility behavior. Transportation Research Record, 2010(1), 35–44.
47. Olivková, I. (2017). Comparison and evaluation of fare collection tech-nologies in the public transport. Procedia Engineering, 178, 515–525.
48. Pakusch, C., Stevens, G., Boden, A., & Bossauer, P. (2018). Unintended effects of autonomous driving: A study on mobility preferences in the future. Sustainability, 10(7), 2404.
49. Papadias, D., Tao, Y., Kanis, P., & Zhang, J. (2002). Indexing spatio-temporal data warehouses. In Proceedings 18th international conference on data engineering (pp. 166–175). IEEE.
50. Reichenbach, M. (2019). The multimodal transport user: A challenge for public transport? Transportation Research Procedia. https:// doi. org/ 10. 1016/j. trpro. 2019. 09. 059
51. Rempe, F., Huber, G., & Bogenberger, K. (2016). Spatio-temporal conges-tion patterns in urban traffic networks. Transportation Research Procedia, 15, 513–524. International symposium on enhancing highway performance (ISEHP), June 14–16, 2016, Berlin. ISSN 2352-1465.
52. Rodrigues, F., Borysov, S. S., Ribeiro, B., & Pereira, F. C. (2017). A Bayesian additive model for understanding public transport usage in special events. IEEE Transactions on Pattern Analysis and Machine Intelligence, 39(11), 2113–2126.
53. Rosenbluth, G. (1955). Measures of concentration. In Business concentra-tion and price policy (pp. 55–99). Princeton University Press.
54. Sardinha, C., Finamore, A., & Henriques, R. (2021). Context-aware demand prediction in bike sharing systems: Incorporating spatial, meteorological and calendrical context. arXiv: 2105. 01125.
55. Shannon, C. E. (1948). A mathematical theory of communication. Bell System Technical Journal, 27(3), 379–423.
56. Soua, R., Koesdwiady, A. B., & Karray, F. (2016). Big-data-generated traffic flow prediction using deep learning and Dempster-Shafer theory. In International joint conference on neural networks (IJCNN) (pp. 3195–3202).
57. Sovacool, B. K., Kester, J., Noel, L., & de Rubens, G. Z. (2018). The demo-graphics of decarbonizing transport: The influence of gender, education, occupation, age, and household size on electric mobility preferences in the Nordic region. Global Environmental Change, 52, 86–100.
58. Susilo, Y. O., & Axhausen, K. W. (2014). Repetitions in individual daily activ-ity–travel–location patterns: A study using the Herfindahl-Hirschman Index. Transportation, 41(5), 995–1011.
59. Tahmasbi, B., Mansourianfar, M. H., Haghshenas, H., & Kim, I. (2019). Mul-timodal accessibility-based equity assessment of urban public facilities distribution. Sustainable Cities and Society, 49, 101633.
60. Tang, L., Duan, Z., & Zhao, Y. (2019). Toward using social media to support ridesharing services: Challenges and opportunities. Transportation Plan-ning and Technology, 42(4), 355–379.
61. Tempelmeier, N., et al. (2019). Data4urbanmobility: Towards holistic data analytics for mobility applications in urban regions. In Companion Proceedings of The 2019 World Wide Web Conference.
62. Tomaras, D., Boutsis, I., & Kalogeraki, V. (2018). Modeling and predicting bike demand in large city situations. In 2018 IEEE International Conference on Pervasive Computing and Communications (PerCom) (pp. 1–10). IEEE.
63. Toqué, F., Khouadjia, M., Come, E., Trepanier, M., & Oukhellou, L. (2017). Short & long term forecasting of multimodal transport passenger flows with machine learning methods. In IEEE 20th international conference on intelligent transportation systems (ITSC) (pp. 560–566). IEEE.
64. Tsirimpa, A., Polydoropoulou, A., Pagoni, I., & Tsouros, I. (2019). A reward-based instrument for promoting multimodality. Transportation Research Part F: Traffic Psychology and Behaviour, 65, 121–140.
65. Tympakianaki, A., Koutsopoulos, H. N., Jenelius, E., & Cebecauer, M. (2018). Impact analysis of transport network disruptions using multimodal data: A case study for tunnel closures in Stockholm. Case Studies on Transport Policy, 6(2), 179–189.
66. Wibisono, A., Sina, I., Ihsannuddin, M. A., Hafizh, A., Hardjono, B., Nurhadi-yatna, A., Jatmiko, W., et al. (2012) Traffic intelligent system architecture
based on social media information. In International conference on advanced computer science and information systems (ICACSIS) (pp. 25–30). IEEE.
67. Wiering, M., Vreeken, J., Van Veenen, J., & Koopman, A. (2004). Simulation and optimization of traffic in a city. In IEEE intelligent vehicles symposium (pp. 453–458). IEEE.
68. Wong, K.-I., Wong, S. C., Tong, C., Lam, W., Lo, H. K., Yang, H., & Lo, H. (2005). Estimation of origin-destination matrices for a multimodal public transit network. Journal of Advanced Transportation, 39(2), 139–168.
69. Wu, Z., Pan, S., Chen, F., Long, G., Zhang, C., & Philip, S. Y. (2020). A com-prehensive survey on graph neural networks. IEEE Transactions on Neural Networks and Learning Systems, 32, 4–24.
70. Yahya, S., & Noor, N. M. (2008). Strategic planning of an integrated smart card fare collection system–challenges and solutions. In 11th IEEE interna-tional conference on computational science and engineering-workshops (pp. 31–36). IEEE.
71. Yang, J., Zhang, X., Qiao, Y., Fadlullah, Z., & Kato, N. (2015). Global and indi-vidual mobility pattern discovery based on hotspots. In IEEE international conference on communications (ICC) (pp. 5577–5582). IEEE.
72. Zannat, K., & Choudhury, C. F. (2019). Emerging big data sources for public transport planning: A systematic review on current state of art and future research directions. Journal of the Indian Institute of Science, 99(4), 601–619.
73. Zheng, Y., Capra, L., Wolfson, O., & Yang, H. (2014). Urban computing: Con-cepts, methodologies, and applications. ACM Transactions on Intelligent Systems and Technology (TIST), 5(3), 1–55.
Publisher’s NoteSpringer Nature remains neutral with regard to jurisdictional claims in pub-lished maps and institutional affiliations.