Direct identification of chlamydiae from clinical samples using a DNA microarray assay—A...
10
Molecular and Cellular Probes 22 (2008) 55–64 Direct identification of chlamydiae from clinical samples using a DNA microarray assay—A validation study Nicole Borel a,1 , Evelyne Kempf a,1 , Helmut Hotzel b , Evelyn Schubert c , Paul Torgerson d , Peter Slickers e , Ralf Ehricht e , Taurai Tasara f , Andreas Pospischil a , Konrad Sachse c, a Institute of Veterinary Pathology, University of Zurich, Switzerland b Institute of Bacterial Infections and Zoonoses, Jena, Germany c Institute of Molecular Pathogenesis, Friedrich-Loeffler-Institut (Federal Research Institute for Animal Health), Naumburger Str. 96a, 07743 Jena, Germany d Institute of Parasitology, University of Zurich, Switzerland e Clondiag Chip Technologies GmbH, Jena, Germany f Institute for Food Safety and Hygiene, Vetsuisse Faculty, University of Zurich, Switzerland Received 29 January 2007; accepted 21 June 2007 Available online 28 June 2007 Abstract While DNA microarrays have become a widely accepted tool for mRNA expression monitoring, their use in rapid diagnosis of bacterial and viral pathogens is only emerging. So far, insufficient sensitivity and high costs have been the major limiting factors preventing more widespread use of microarray platforms in direct testing of clinical samples. In the present study, a total of 339 samples, among them 293 clinical specimens from animals and humans, were examined by the ArrayTube TM (AT) DNA microarray assay to detect chlamydial DNA and identify the species of Chlamydia and Chlamydophila involved. Samples included nasal and conjunctival swabs, formalin-fixed, paraffin-embedded and fresh organ tissue, milk, feces and cell culture. Notably, the AT test was shown to detect mixed infections in clinical samples. The calculated median sensitivity of 0.81 over the entire panel of clinical samples was comparable to conventional 16S PCR, but slightly lower than real-time PCR and other PCR assays. However, when a panel of long-time stored swab samples was excluded from the calculation, the sensitivity was clearly higher (0.87) and equivalent to that of real-time PCR. Altogether, the data demonstrate the suitability of this DNA microarray assay for routine diagnosis. r 2007 Elsevier Ltd. All rights reserved. Keywords: Chlamydia spp.; Chlamydophila spp.; Species identification; Clinical samples; Routine diagnosis; DNA microarray testing 1. Introduction Although gene expression monitoring remains the predominant area of DNA microarray use [1], diagnostic applications have been on the increase for several years. The highly parallel approach of this technology provides a diagnostic potential surpassing that of currently used PCR methods because precise sequence information on a variety of genomic loci can be obtained simultaneously, whereas even in multiplex PCR only a few target regions can be examined in a single assay. Furthermore, detection of subtle differences among microbial species, subspecies or strains, such as single-nucleotide polymorphisms and other minute sequence variations, is problematic, if not impos- sible, with existing amplification assays. So far, DNA microarray assays have been used to identify and genotype bacteria and viruses from culture. Recent applications include detection of antibiotic resis- tance genes in gram-positive bacteria [2,3], toxin typing of Clostridium perfringens [4], species differentiation among mixed bacterial communities [5], as well as identification of chlamydial species [6], respiratory pathogens [7] and viruses [8]. Inadequate sensitivity of detection and high costs have been the major factors limiting more widespread use of microarray platforms in direct testing of clinical samples. ARTICLE IN PRESS www.elsevier.com/locate/ymcpr 0890-8508/$ - see front matter r 2007 Elsevier Ltd. All rights reserved. doi:10.1016/j.mcp.2007.06.003 Corresponding author. Tel.: +49 3641 8040; fax: +49 3641 804228. E-mail address: konrad.sachse@fli.bund.de (K. Sachse). 1 These authors equally contributed to this study.
-
Upload
independent -
Category
Documents
-
view
1 -
download
0
Transcript of Direct identification of chlamydiae from clinical samples using a DNA microarray assay—A...
ARTICLE IN PRESS
0890-8508/$ - se
doi:10.1016/j.m
�CorrespondE-mail addr
1These autho
Molecular and Cellular Probes 22 (2008) 55–64
www.elsevier.com/locate/ymcpr
Direct identification of chlamydiae from clinical samples using a DNAmicroarray assay—A validation study
Nicole Borela,1, Evelyne Kempfa,1, Helmut Hotzelb, Evelyn Schubertc, Paul Torgersond,Peter Slickerse, Ralf Ehrichte, Taurai Tasaraf, Andreas Pospischila, Konrad Sachsec,�
aInstitute of Veterinary Pathology, University of Zurich, SwitzerlandbInstitute of Bacterial Infections and Zoonoses, Jena, Germany
cInstitute of Molecular Pathogenesis, Friedrich-Loeffler-Institut (Federal Research Institute for Animal Health), Naumburger Str. 96a, 07743 Jena, GermanydInstitute of Parasitology, University of Zurich, Switzerland
eClondiag Chip Technologies GmbH, Jena, GermanyfInstitute for Food Safety and Hygiene, Vetsuisse Faculty, University of Zurich, Switzerland
Received 29 January 2007; accepted 21 June 2007
Available online 28 June 2007
Abstract
While DNA microarrays have become a widely accepted tool for mRNA expression monitoring, their use in rapid diagnosis of
bacterial and viral pathogens is only emerging. So far, insufficient sensitivity and high costs have been the major limiting factors
preventing more widespread use of microarray platforms in direct testing of clinical samples. In the present study, a total of 339 samples,
among them 293 clinical specimens from animals and humans, were examined by the ArrayTubeTM (AT) DNA microarray assay to
detect chlamydial DNA and identify the species of Chlamydia and Chlamydophila involved. Samples included nasal and conjunctival
swabs, formalin-fixed, paraffin-embedded and fresh organ tissue, milk, feces and cell culture. Notably, the AT test was shown to detect
mixed infections in clinical samples. The calculated median sensitivity of 0.81 over the entire panel of clinical samples was comparable to
conventional 16S PCR, but slightly lower than real-time PCR and other PCR assays. However, when a panel of long-time stored swab
samples was excluded from the calculation, the sensitivity was clearly higher (0.87) and equivalent to that of real-time PCR. Altogether,
the data demonstrate the suitability of this DNA microarray assay for routine diagnosis.
r 2007 Elsevier Ltd. All rights reserved.
Keywords: Chlamydia spp.; Chlamydophila spp.; Species identification; Clinical samples; Routine diagnosis; DNA microarray testing
1. Introduction
Although gene expression monitoring remains thepredominant area of DNA microarray use [1], diagnosticapplications have been on the increase for several years.The highly parallel approach of this technology provides adiagnostic potential surpassing that of currently used PCRmethods because precise sequence information on a varietyof genomic loci can be obtained simultaneously, whereaseven in multiplex PCR only a few target regions can beexamined in a single assay. Furthermore, detection of
e front matter r 2007 Elsevier Ltd. All rights reserved.
cp.2007.06.003
ing author. Tel.: +493641 8040; fax: +49 3641 804228.
ess: [email protected] (K. Sachse).
rs equally contributed to this study.
subtle differences among microbial species, subspecies orstrains, such as single-nucleotide polymorphisms and otherminute sequence variations, is problematic, if not impos-sible, with existing amplification assays.So far, DNA microarray assays have been used to
identify and genotype bacteria and viruses from culture.Recent applications include detection of antibiotic resis-tance genes in gram-positive bacteria [2,3], toxin typing ofClostridium perfringens [4], species differentiation amongmixed bacterial communities [5], as well as identificationof chlamydial species [6], respiratory pathogens [7] andviruses [8].Inadequate sensitivity of detection and high costs have
been the major factors limiting more widespread use ofmicroarray platforms in direct testing of clinical samples.
ARTICLE IN PRESSN. Borel et al. / Molecular and Cellular Probes 22 (2008) 55–6456
The ArrayTubeTM (AT) system represents a less expensiveplatform involving chips of 2.4� 2.4mm active area size,which are assembled to the bottom of 1.5-ml plastic micro-reaction tubes. Due to this unique geometry, all steps of thehybridization reaction can be conducted in the AT vesselwithout the need for a separate hybridization chamber orother additional laboratory equipment. As visualization ofspecific duplexes is achieved by enzyme-catalyzed precipi-tation rather than fluorescence, a simple transmissionreader can be used to measure signal intensities. Thisrenders the system particularly user friendly and economic-al. Furthermore, a recent study revealed that specifichybridization patterns can be obtained from a single PCR-amplifiable target copy [9]. This high sensitivity, combinedwith the high specificity of the microarray technology,appeared to be promising for use in diagnosis andprompted us to conduct a validation study on clinicalsamples from cases of chlamydial infection.
The agents of the genera Chlamydia (C.) and Chlamy-
dophila (Cp.) are associated with a large variety ofdiseases, such as human urogenital disease and trachoma(C. trachomatis), pneumonia and cardiovascular disease(Cp. pneumoniae), as well as psittacosis in birds (Cp. psittaci),abortion in sheep, goats and cows (Cp. abortus), respiratoryand intestinal infection in cattle (Cp. pecorum) and swine(C. suis), as well as infections of reptiles and amphibians(Cp. pneumoniae). Three of the agents, Cp. psittaci, Cp.
abortus and Cp. felis, are also known for their zoonoticpotential causing severe pneumonia (psittacosis), abortion inpregnant women or keratoconjunctivitis in humans, respec-tively. The question whether other chlamydiae are alsoinvolved in animal-to-man transmission is being addressed bycurrent research. The broad host range of some chlamydialspecies usually requires more than one test to identify allpossible species involved, particularly in veterinary medicine.
In this paper, we present the data of DNA microarraytesting of 282 animal and 11 human samples and comparethem to the findings of real-time PCR, conventional PCRassays, immunohistochemistry, DNA sequencing and cellculture. The sample matrixes examined included nasal,conjunctival and cloacal swabs, formalin-fixed and paraf-fin-embedded organ tissues and cell pellets, bronchoalveo-lar lavage, milk, and feces.
A Bayesian approach was utilized in defining the AT testsensitivity as there is no available gold standard to comparethe new diagnostic test. A variety of PCR tests were utilizedon the same tissue samples with a proportion also havingimmunohistochemistry to detect chlamydial antigens.
2. Materials and methods
2.1. Clinical samples
The following panels of samples were examined:biological fluids and feces from zoonotic outbreaks ofchlamydioses in birds and guinea pigs [10] (n ¼ 39);formalin-fixed and paraffin-embedded tissues from cases
of abortion (n ¼ 27; details in Refs. [11–13]); tissues(n ¼ 68) from diseased frogs [14], snakes [15], birds, andpiglets [16]; bovine milk samples (n ¼ 21); conjunctivaland nasal swabs from calves (n ¼ 59) and sheep (n ¼ 22,Ref. [17]).For specificity testing, 8 samples of cultured chlamydiae
from feces of infected poultry flocks (non-permanentcultures) and cell cultures of 18 chlamydial isolates frombirds, cattle and swine in buffalo green monkey (BGM)cells were also included in this study. Furthermore, a panelof 31 samples of formalin-fixed and paraffin-embedded cellpellets was examined (Vero, Caco-2, HEp-2 cells infectedwith different chlamydial strains, monoinfections, doubleand mixed infections). Finally, 46 samples of chromosomalDNA from 42 different bacterial species and Candida spp.were used as negative controls in specificity testing(Supplement 1).
2.2. Cell culture of chlamydial isolates
Chlamydiae were cultured in BGM cells using apreviously described protocol [18].
2.3. DNA extraction
Preparation of bacterial DNA from swabs and bronch-oalveolar lavage was described previously [19]. Briefly,nasal and conjunctival swabs were soaked in 500 ml lysisbuffer [100mM Tris-base, pH 8.5, 0.05% (v/v) Tween 20]placed into a 2-ml SafeLock tube (Eppendorf, Cologne,Germany) and vortexed for 1min. Having centrifuged allthe liquid out of the cotton swab (12,000g, 1min), thecomplete lysis buffer extract was centrifuged at 12,000g for15min. The pellet was resuspended in 50 ml lysis buffer andincubated at 60 1C for 2 h after addition of 20 ml proteinaseK (10mg/ml). Finally, proteinase K was inactivated byheating at 97 1C for 15min and cell debris was removed bycentrifugation at 12,000g for 5min. One microliter of thesupernatant was used as template in biotinylation PCRprior to AT hybridization.From formalin-fixed and paraffin-embedded material,
sections of 30–60 mm were cut from each paraffin block andplaced into a sterile microcentrifuge tube. Paraffin wasremoved by extraction with 1.2ml of xylene. Aftercentrifugation at 13,000g for 5min, residual xylene wasremoved by two-fold extraction with 1.2ml ethanol.Samples were centrifuged (13,000g, 5min), and ethanolwas carefully removed. DNA for PCR analysis wasextracted from the tissue pellet using the DNeasy TissueKit (Qiagen, Hilden, Germany).Milk and feces samples were extracted using the
QIAamp DNA Stool Mini Kit (QIAGEN) according tothe instructions of the manufacturer.DNA from cell culture and from (non-chlamydial)
bacterial cultures was prepared using the High Pure PCRTemplate Preparation Kit (Roche Diagnostics, Mannheim,Germany).
ARTICLE IN PRESSN. Borel et al. / Molecular and Cellular Probes 22 (2008) 55–64 57
2.4. Description of the DNA microarray
Design and print pattern of the microarray version usedhere were described previously [9]. Briefly, the chip carried28 probes for species identification (four probes each forC. trachomatis, Cp. pneumoniae and Cp. psittaci, threeprobes for C. muridarum, Cp. pecorum, Cp. caviae andC. suis, two probes for Cp. abortus and Cp. felis), 3 genus-specific probes (two for Chlamydophila and one forChlamydia), 5 probes for the closest relatives, i.e., Simkania
negevensis and Waddlia chondrophila, as well as 4 positivecontrols (consensus probes), and 1 internal staining control(biotin marker).
2.5. AT assay
2.5.1. Biotinylation PCR
Sample DNA was amplified and biotin labeled for theAT microarray assay in 40 cycles of 94 1C/30 s, 55 1C/30 s,and 72 1C/30 s, using primers U23F-19 (50-ATT GAMAGG CGA WGA AGG A-30) and 23R-22 (50-biotin-GCYTAC TAA GAT GTT TCA GTT C-30). Each reaction mixcontained 1 ml DNA template, 0.2 ml (1U) Taq DNAPolymerase (Fermentas, St. Leon-Rot, Germany), 2 ml10� Taq Buffer with KCl (Fermentas), 1 ml MgCl2(25mM), 2 ml dNTP mix (1mM each, from Roth,Karlsruhe, Germany), 1 ml of each primer (0.5 mM), and12.8 ml deionized water.
2.5.2. Hybridization
The AT vessel was conditioned by washing twice with500 ml of Hybridization buffer 1 (Clondiag Chip Technol-ogies, Jena, Germany) at 30 1C for 5min. All incubationswere carried out upon slight shaking (550 rpm) on aheatable horizontal tube shaker (Thermomixer comfort,Eppendorf). For denaturation, 1 ml of the biotinylated PCRproduct was diluted with 99 ml hybridization buffer in aseparate tube, heated at 95 1C for 5min and put on ice.After transfer into the AT, hybridization was allowed toproceed at 58 1C for 60min. The supernatant was thendiscarded, and the tube was washed with 500 ml 2xSSC/0.01% Triton X-100 (401C, 5min), 500 ml 2xSSC (301C,5min) and 500 ml 0.2� SSC (20 1C, 5min). Vacant bindingsites of the microarray were blocked by incubation with a2% solution of Blocking Reagent (Roche) in hybridizationbuffer at 30 1C for 15min. Subsequently, the AT wasincubated with 100 ml of a 1:10,000 dilution of streptavi-dine-conjugated horseradish peroxidase (AT Staining Kit,Clondiag) followed by three-step washing as above.Finally, 100 ml of the peroxidase substrate (AT StainingKit), a 3,3,05,50-tetramethyl benzidine derivative, wereadded and measurement of the hybridization signal wasstarted.
2.5.3. Measurement and data processing
Hybridization signals were measured at 25 1C using theATR-01 array tube reader (Clondiag) and recording the
final image after 10min of continuous precipitation. Signalintensity data with local background correction wereobtained for each spot of each picture using the Iconoclustsoftware, version 2.3 (Clondiag). Background-correctedsignal intensities were given as:
NI ¼ 1�M=BG,
with NI being normalized intensity, M average (mean) spotintensity, and BG local background intensity. Spotintensities were measured as light transmission, withM values ranging from 1 for complete transmission(background, weak spots) to 0 for complete absorption(dark spots). Thus, normalized signal intensities rangebetween 0 and 1.
2.5.4. Criteria for assignment of hybridization patterns
The species identity of a test sample was derived from thespecificity of the probe showing the most intense hybridi-zation signal on the processed array, provided that all otherprobes of the same chlamydial species were among the 10most intense signals, and signal intensities of the genus-specific probes (Chlamydia vs. Chlamydophila) were in linewith this assignment.A sample was considered ‘‘chlamydia-negative’’ when all
signal intensities except the internal staining control (biotinmarker) were below NI ¼ 0.07.
2.6. Real-time PCR
A Chlamydiaceae family-specific assay targeting the 23SrRNA gene [9] was conducted in 96-well microtiter plateson a Mx 3000 thermal cycler (Stratagene, La Jolla, CA)using primers Ch23S-F (50-CTG AAA CCA GTA GCTTAT AAG CGG T-30), Ch23S-R (50-ACC TCG CCG TTTAAC TTA ACT CC-30), and probe Ch23S-p (FAM-CTCATC ATG CAA AAG GCA CGC CG-TAMRA). Eachreaction mix contained 1 ml sample DNA template, 12.5 mlqPCR Mastermix Plus (Eurogentec, Seraing, Belgium),4.5 ml of each primer and 1 ml of the probe (of 5 mMsolutions), and 1.5 ml deionized water. The temperature–time profile was 95 1C 10min, 45 cycles of 95 1C 15 s, 60 1C60 s. The samples were examined at least in duplicate.
2.7. 16S PCR-RFLP
This two-step test was used to confirm the speciesidentity of chlamydiae from cell culture according to theprotocol of Everett and Andersen [20].
2.8. Nested ompA PCR
This additional confirmatory test for chlamydial speciesidentification from tissue samples was done as describedpreviously [19].
ARTICLE IN PRESSN. Borel et al. / Molecular and Cellular Probes 22 (2008) 55–6458
2.9. 16S PCR
This test used primer pair 16S-IGF (50-GAT GAG GCATGC AAG TCG AAC G-30) and 16S-IGR (50-CCA GTGTTG GCG GTC AAT CTC TC-30) (modified acc. to [21])to amplify a 278-bp product of the 16S rRNA gene specificfor the order Chlamydiales. One microliter of extractedDNA was added to a PCR mix containing 3.5mM MgCl2,0.2mM dNTPs, 1 mM of each primer (Microsynth,Balgach, Switzerland), 5 ml of 10� reaction buffer, 2Uof AmpliTaq Gold DNA polymerase (Applied Biosystems,Darmstadt, Germany) and water to make a final volume of50 ml. Amplification was performed in 45 cycles with initialdenaturation (95 1C, 15min), followed by denaturation at94 1C for 30 s, annealing at 51 1C for 30 s, and extension at72 1C for 45 s.
2.10. IGS-S PCR
Primers cIGS-1f (50-CAA GGT GAGGCT GAT GAC-30)and cIGS-2r (50-TCG CCT KTC AAT GCC AAG-30)(Microsynth) are located in the intergenic spacer region ofthe rRNA operon of Chlamydiales and define an ampliconof approximately 350 bp length. PCR was performed in50-ml reaction volume containing 1 ml of DNA template,0.25 mM of forward primer (cIGS-1f), 0.5 mM reverseprimer (cIGS-2r), 0.4mM dNTPs, 3.5mM MgCl2, 5 ml of10x reaction buffer, 2.5 of AmpliTaq Gold DNA poly-merase and water to make a final volume of 50 ml. Thetemperature-time profile was as in 16S PCR, except thatthe annealing temperature was 48 1C, and a final extensionat 72 1C for 10min was added.
2.11. IGS-L PCR
This assay involves primer pair cIGS-1f and IGS-1r(50-AGTGGT CTC CCCAGA TTC-30) to amplify a 750-bpsegment of the intergenic spacer as described previously[10]. The reaction mix contained 1.5mM MgCl2,0.0625mM of each dNTP, 0.25 mM of each primer, 5 mlof 10� reaction buffer, 2.5U of AmpliTaq Gold DNApolymerase and water to make a final volume of 50 ml.Amplification was conducted with initial denaturation(94 1C, 10min), followed by 40 cycles of denaturation at94 1C for 30 s, annealing at 54 1C for 30 s and extension at72 1C for 45 s.
2.12. Immunohistochemistry for chlamydiae
Paraffin sections were examined for the presence ofchlamydial antigen using a Chlamydiaceae family-specificmouse monoclonal antibody (Ab) directed against thechlamydial lipopolysaccharide (LPS; Clone ACI-P, Pro-gen, Heidelberg, Germany). Detection was performed withthe Detection Kit (Dako ChemMateTM, Glostrup, Den-mark) according to the manufacturer’s instructions.Briefly, paraffin sections were deparaffinated in xylene
and rehydrated through graded ethanol to water. Antigendemasking was performed by 10-min enzyme digestion(Pronase, Dako). To inhibit the endogenous peroxidaseactivity, slides were immersed in peroxidase-blockingsolution at room temperature (RT) for 5min and incubatedwith the primary antibody diluted in Ab diluent withbackground-reducing components for 60min. The sectionswere incubated at RT for 30min with the link-Ab,developed in 3-amino, 9-ethyl-carbazole (AEC) substratesolution for 10min, and counterstained with hematoxylin.A negative control of each section was performed using
the Ab diluent instead of the primary Ab. Intestinal tissuefrom gnotobiotic piglets experimentally infected withporcine Chlamydia suis strain S45 was used as positivecontrol [22].
2.13. Statistical calculations
Bayesian techniques (Markov Chain—Monte Carlo)were used to estimate the diagnostic parameters of eachprocedure. These techniques have been known for sometime and can be exploited to estimate the diagnosticperformance of tests and the underlying true prevalence ofinfection providing certain conditions are met. Theseinclude the numbers of tests required on a population ofunknown prevalence in the absence of prior informationand is reviewed by Brunscum et al. [23]. In total, resultsfrom 293 clinical samples were included in the analysis,among them 40 samples from experimentally infectedanimals and cell culture. The latter were assumed to havea different probability of infection than the other samples.Likewise, because different DNA extraction techniqueswere used, the results were calculated using differentprobabilities of infection (or effectively of successfulDNA extraction) for the different techniques. For eachsample, the true infection status was not observed, but aseries of binary test results. Likewise, the true sensitivity ofeach test was unknown. For 73 samples, 4 tests wereundertaken, 39 samples had 3 tests, 141 samples had 2tests, whilst 40 samples had only the array test, but weretaken from animals experimentally infected or from tissuecultures and hence had different probabilities of infectioncompared to the other groups. The specificity of each of theDNA tests was assumed to be 1. Consequently, the modelwas identifiable even with the possibility of multiplecovariances between test sensitivities [24]. The sensitivityand specificity of the immunohistochemistry samples werealso unknown. Additional parameters were introduced tomodel covariance of test sensitivities. In the Bayesiananalysis, prior knowledge of parameters must be given. Inthe case where there is no prior knowledge available thiscan be given as uniform or non-informative distributions.In the case of the unknown sensitivities, for example, this iseasily achieved by using the beta distribution with a and bparameters of 1 and 1, respectively. Likewise for theunknown covariance of the sensitivities between tests,priors of a distribution were used with upper and lower
ARTICLE IN PRESSN. Borel et al. / Molecular and Cellular Probes 22 (2008) 55–64 59
limits estimated from the possible range [25]. Because eachtissue sample had a varying number of tests done on them,a macro written in Excel was used to implement theMarkov chain [26]. The chain was burnt in using 1000iterations and then run for a further 10,000 iterations tosample the posterior distribution. Covariances betweentests were examined in a pairwise fashion and if the upper(for negative covariance) 95% posterior probability dis-tribution or lower (for positive covariance) included 0, thecovariances were eliminated from the model. Likewise,three-way covariances were examined for various combi-nations of tests. The final model included significantcovariance estimates of test sensitivities and was used tocalculate the probability distribution of all tests used on thetissues.
3. Results
A total of 339 samples were included in the study.Clinical samples (n ¼ 293) were examined by both the ATassay and either at least one reference test for chlamydiae,or were from experimentally infected animals. Chlamydia-
ceae-specific real-time PCR targeting the 23S rRNA genewas chosen as the reference test for swabs, milk, feces andbiological fluids. Due to the wide variety of samplematrixes among the present panel of specimens, 16SPCR, IGS-S and IGS-L PCRs, nested ompA PCR andpartial ompA gene sequencing, as well as immunohisto-chemistry were conducted as additional confirmatory teststo verify the accuracy of the microarray findings in selectedcases, particularly in the subset of formalin-fixed, paraffin-embedded, and fresh tissue samples (n ¼ 95). The AT testwas also used to establish the species identity of chlamydiaefrom cell culture (n ¼ 57). Finally, 46 non-chlamydialmicrobial strains were tested to check the specificity of theAT assay. No evidence of lack of specificity was detectedfor the AT assay and hence justified a specificity of 1 in thelatent class models.
3.1. Samples from outbreaks of chlamydioses
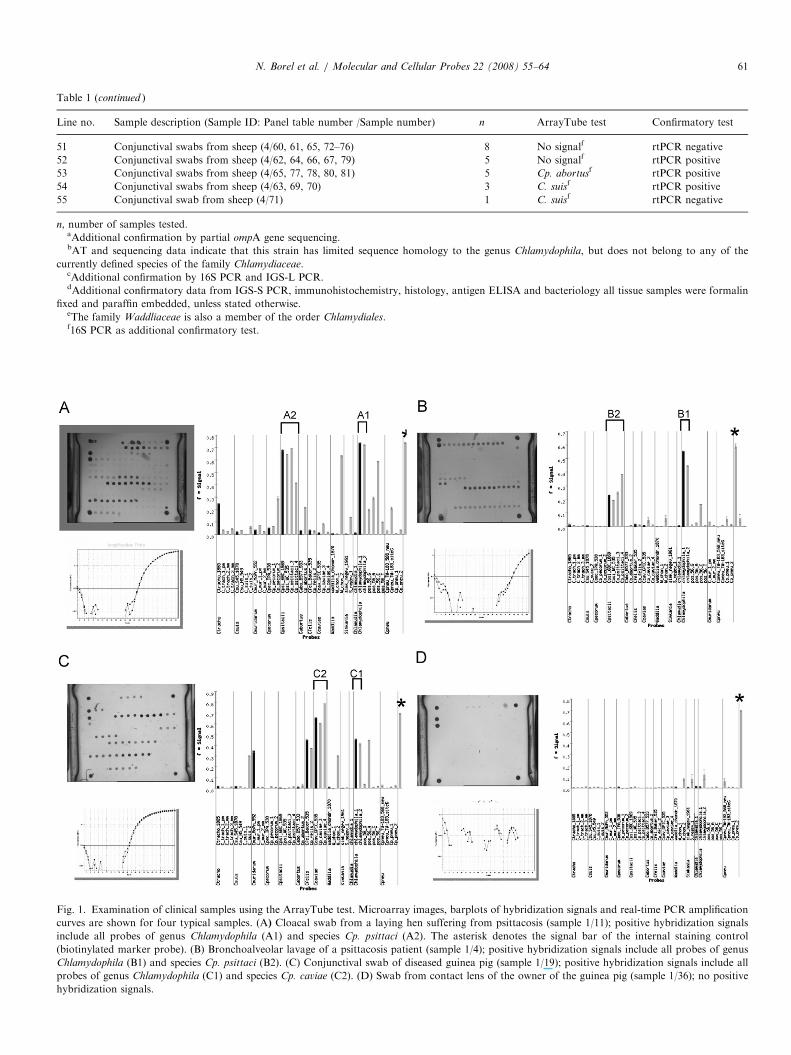
Lines 1–14 of Table 1 show the test results of 39 samples,among them 10 from humans. DNA microarray testingrevealed the presence of Cp. psittaci in 6 samples frominfected poultry flocks and a severely diseased contactperson (Patient K), all of them related to an outbreak ofavian chlamydiosis in central Germany in 2005. As anexample, the test results of a cloacal swab from an infectedlaying hen are illustrated in Fig. 1A. Samples from twoother patients, one of them also ill and Cp. psittaci positive(Patient R, see Fig. 1B), were sent in as suspected cases ofpsittacosis from different outbreaks. Interestingly, sample1/13, a cloacal swab from a symptomless chicken, testedclearly positive in real-time PCR, but yielded an atypicalhybridization pattern consisting only of the genus-specificChlamydophila probes, but no species-specific signals.Sequencing of the ompA gene revealed 88% similarity to
its closest relative, an unspecified avian strain of Chlamy-
dophila, but no homology to any of the currently definedspecies of Chlamydiaceae (data not shown).Furthermore, Cp. caviae was identified in 8 samples from
an infected guinea pig flock in Switzerland in 2004. Anexample is shown in Fig. 1(C). Examination by real-timePCR and AT assay of swabs from conjunctiva and contactlenses of the owner of this flock, who reported clinicalsymptoms of ocular surface disease such as conjunctivitisand keratitis, as well as from healthy guinea pigs living inclose contact with infected animals, failed to confirm thepresence of Chlamydiaceae spp. (Fig. 1D). However,further testing of the sample by 16S PCR indicated thepresence of Parachlamydia acantamoebae. The significanceof this finding is yet unclear, and further investigation isneeded [10]. Comparison of the microarray results withreal-time PCR (Table 1) shows 18 concordant positive and20 concordant negative findings, and one discrepant result(sample ]18; 1/39 ¼ 2.6%).
3.2. Formalin-fixed and paraffin-embedded organ tissue
A total of 95 samples of this category were examined.The results of those 57 samples that previously testedpositive in 16S PCR and/or other tests are given in Table 1,lines 15–34. Six different species were identified, i.e.Cp. abortus in tissue from sheep, cattle and a human case,Cp. psittaci in birds, cattle and swine, Cp. pneumoniae infrogs and snakes, as well as Cp. pecorum, C. trachomatis
and C. suis in experimentally infected gnotobiotic piglets.While the findings of the microarray and the confirmatoryassay were identical in 44 cases, the AT assay failed toproduce a measurable hybridization pattern in 9 instances(9.5%). Two PCR-negative samples tested positive on themicroarray. In those two cases with discrepant results(samples 2a/31 and 42) the AT results appear moreplausible than 16S PCR in view of the known hostspecificities of Cp. pneumoniae and Cp. psittaci. Addition-ally, 38 tissue samples found to be chlamydia negative in16S PCR and other tests also proved negative in the ATassay (Table 1, line 35).
3.3. Milk samples
A panel of 21 milk samples from three dairy herdsreportedly having problems with milk quality (elevatedsomatic cell counts) and repeated abortions was examined(Table 1, lines 36–41). Twelve samples that tested positivein real-time PCR were also found positive with themicroarray assay, and 5 were negative in both assays,whereas 3 (14.3%) real-time PCR-positives did not react inthe microarray assay and one sample (4.8%) was onlypositive in the latter. The most frequently detected specieswas Cp. abortus (n ¼ 9), and two samples were found tocontain both Cp. abortus and Cp. psittaci.
ARTICLE IN PRESS
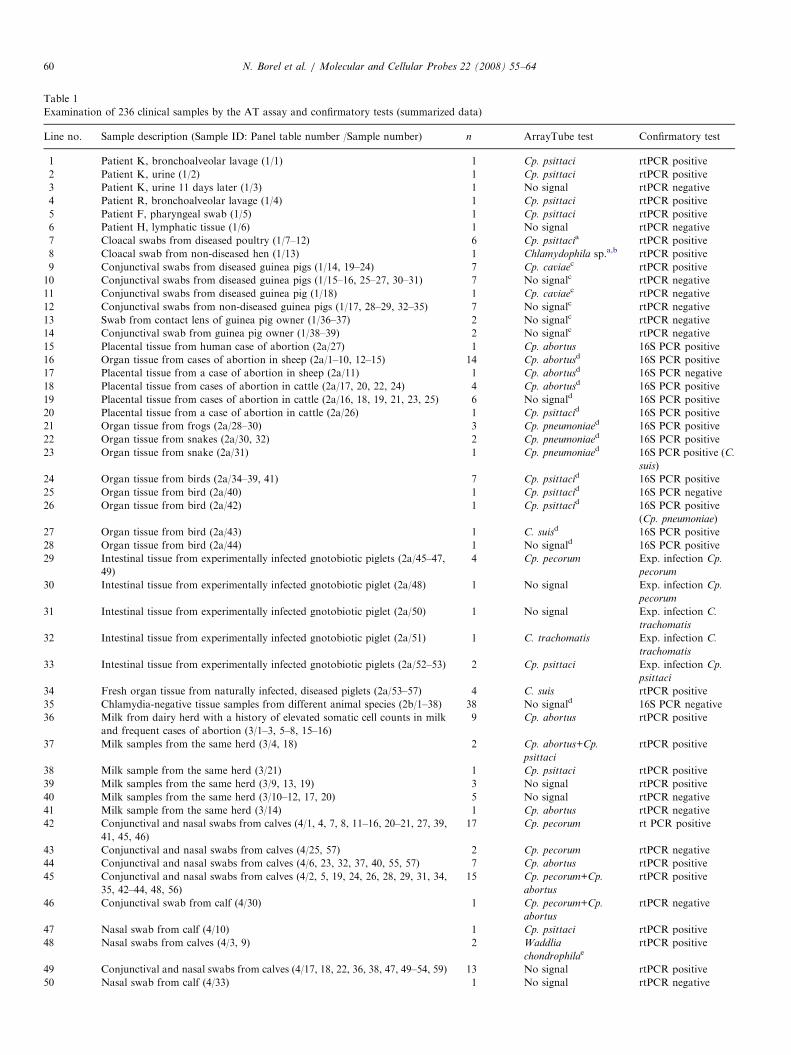
Table 1
Examination of 236 clinical samples by the AT assay and confirmatory tests (summarized data)
Line no. Sample description (Sample ID: Panel table number /Sample number) n ArrayTube test Confirmatory test
1 Patient K, bronchoalveolar lavage (1/1) 1 Cp. psittaci rtPCR positive
2 Patient K, urine (1/2) 1 Cp. psittaci rtPCR positive
3 Patient K, urine 11 days later (1/3) 1 No signal rtPCR negative
4 Patient R, bronchoalveolar lavage (1/4) 1 Cp. psittaci rtPCR positive
5 Patient F, pharyngeal swab (1/5) 1 Cp. psittaci rtPCR positive
6 Patient H, lymphatic tissue (1/6) 1 No signal rtPCR negative
7 Cloacal swabs from diseased poultry (1/7–12) 6 Cp. psittacia rtPCR positive
8 Cloacal swab from non-diseased hen (1/13) 1 Chlamydophila sp.a,b rtPCR positive
9 Conjunctival swabs from diseased guinea pigs (1/14, 19–24) 7 Cp. caviaec rtPCR positive
10 Conjunctival swabs from diseased guinea pigs (1/15–16, 25–27, 30–31) 7 No signalc rtPCR negative
11 Conjunctival swabs from diseased guinea pig (1/18) 1 Cp. caviaec rtPCR negative
12 Conjunctival swabs from non-diseased guinea pigs (1/17, 28–29, 32–35) 7 No signalc rtPCR negative
13 Swab from contact lens of guinea pig owner (1/36–37) 2 No signalc rtPCR negative
14 Conjunctival swab from guinea pig owner (1/38–39) 2 No signalc rtPCR negative
15 Placental tissue from human case of abortion (2a/27) 1 Cp. abortus 16S PCR positive
16 Organ tissue from cases of abortion in sheep (2a/1–10, 12–15) 14 Cp. abortusd 16S PCR positive
17 Placental tissue from a case of abortion in sheep (2a/11) 1 Cp. abortusd 16S PCR negative
18 Placental tissue from cases of abortion in cattle (2a/17, 20, 22, 24) 4 Cp. abortusd 16S PCR positive
19 Placental tissue from cases of abortion in cattle (2a/16, 18, 19, 21, 23, 25) 6 No signald 16S PCR positive
20 Placental tissue from a case of abortion in cattle (2a/26) 1 Cp. psittacid 16S PCR positive
21 Organ tissue from frogs (2a/28–30) 3 Cp. pneumoniaed 16S PCR positive
22 Organ tissue from snakes (2a/30, 32) 2 Cp. pneumoniaed 16S PCR positive
23 Organ tissue from snake (2a/31) 1 Cp. pneumoniaed 16S PCR positive (C.
suis)
24 Organ tissue from birds (2a/34–39, 41) 7 Cp. psittacid 16S PCR positive
25 Organ tissue from bird (2a/40) 1 Cp. psittacid 16S PCR negative
26 Organ tissue from bird (2a/42) 1 Cp. psittacid 16S PCR positive
(Cp. pneumoniae)
27 Organ tissue from bird (2a/43) 1 C. suisd 16S PCR positive
28 Organ tissue from bird (2a/44) 1 No signald 16S PCR positive
29 Intestinal tissue from experimentally infected gnotobiotic piglets (2a/45–47,
49)
4 Cp. pecorum Exp. infection Cp.
pecorum
30 Intestinal tissue from experimentally infected gnotobiotic piglet (2a/48) 1 No signal Exp. infection Cp.
pecorum
31 Intestinal tissue from experimentally infected gnotobiotic piglet (2a/50) 1 No signal Exp. infection C.
trachomatis
32 Intestinal tissue from experimentally infected gnotobiotic piglet (2a/51) 1 C. trachomatis Exp. infection C.
trachomatis
33 Intestinal tissue from experimentally infected gnotobiotic piglets (2a/52–53) 2 Cp. psittaci Exp. infection Cp.
psittaci
34 Fresh organ tissue from naturally infected, diseased piglets (2a/53–57) 4 C. suis rtPCR positive
35 Chlamydia-negative tissue samples from different animal species (2b/1–38) 38 No signald 16S PCR negative
36 Milk from dairy herd with a history of elevated somatic cell counts in milk
and frequent cases of abortion (3/1–3, 5–8, 15–16)
9 Cp. abortus rtPCR positive
37 Milk samples from the same herd (3/4, 18) 2 Cp. abortus+Cp.
psittaci
rtPCR positive
38 Milk sample from the same herd (3/21) 1 Cp. psittaci rtPCR positive
39 Milk samples from the same herd (3/9, 13, 19) 3 No signal rtPCR positive
40 Milk samples from the same herd (3/10–12, 17, 20) 5 No signal rtPCR negative
41 Milk sample from the same herd (3/14) 1 Cp. abortus rtPCR negative
42 Conjunctival and nasal swabs from calves (4/1, 4, 7, 8, 11–16, 20–21, 27, 39,
41, 45, 46)
17 Cp. pecorum rt PCR positive
43 Conjunctival and nasal swabs from calves (4/25, 57) 2 Cp. pecorum rtPCR negative
44 Conjunctival and nasal swabs from calves (4/6, 23, 32, 37, 40, 55, 57) 7 Cp. abortus rtPCR positive
45 Conjunctival and nasal swabs from calves (4/2, 5, 19, 24, 26, 28, 29, 31, 34,
35, 42–44, 48, 56)
15 Cp. pecorum+Cp.
abortus
rtPCR positive
46 Conjunctival swab from calf (4/30) 1 Cp. pecorum+Cp.
abortus
rtPCR negative
47 Nasal swab from calf (4/10) 1 Cp. psittaci rtPCR positive
48 Nasal swabs from calves (4/3, 9) 2 Waddlia
chondrophilaertPCR positive
49 Conjunctival and nasal swabs from calves (4/17, 18, 22, 36, 38, 47, 49–54, 59) 13 No signal rtPCR positive
50 Nasal swab from calf (4/33) 1 No signal rtPCR negative
N. Borel et al. / Molecular and Cellular Probes 22 (2008) 55–6460
ARTICLE IN PRESS
Table 1 (continued )
Line no. Sample description (Sample ID: Panel table number /Sample number) n ArrayTube test Confirmatory test
51 Conjunctival swabs from sheep (4/60, 61, 65, 72–76) 8 No signalf rtPCR negative
52 Conjunctival swabs from sheep (4/62, 64, 66, 67, 79) 5 No signalf rtPCR positive
53 Conjunctival swabs from sheep (4/65, 77, 78, 80, 81) 5 Cp. abortusf rtPCR positive
54 Conjunctival swabs from sheep (4/63, 69, 70) 3 C. suisf rtPCR positive
55 Conjunctival swab from sheep (4/71) 1 C. suisf rtPCR negative
n, number of samples tested.aAdditional confirmation by partial ompA gene sequencing.bAT and sequencing data indicate that this strain has limited sequence homology to the genus Chlamydophila, but does not belong to any of the
currently defined species of the family Chlamydiaceae.cAdditional confirmation by 16S PCR and IGS-L PCR.dAdditional confirmatory data from IGS-S PCR, immunohistochemistry, histology, antigen ELISA and bacteriology all tissue samples were formalin
fixed and paraffin embedded, unless stated otherwise.eThe family Waddliaceae is also a member of the order Chlamydiales.f16S PCR as additional confirmatory test.
Fig. 1. Examination of clinical samples using the ArrayTube test. Microarray images, barplots of hybridization signals and real-time PCR amplification
curves are shown for four typical samples. (A) Cloacal swab from a laying hen suffering from psittacosis (sample 1/11); positive hybridization signals
include all probes of genus Chlamydophila (A1) and species Cp. psittaci (A2). The asterisk denotes the signal bar of the internal staining control
(biotinylated marker probe). (B) Bronchoalveolar lavage of a psittacosis patient (sample 1/4); positive hybridization signals include all probes of genus
Chlamydophila (B1) and species Cp. psittaci (B2). (C) Conjunctival swab of diseased guinea pig (sample 1/19); positive hybridization signals include all
probes of genus Chlamydophila (C1) and species Cp. caviae (C2). (D) Swab from contact lens of the owner of the guinea pig (sample 1/36); no positive
hybridization signals.
N. Borel et al. / Molecular and Cellular Probes 22 (2008) 55–64 61
ARTICLE IN PRESS
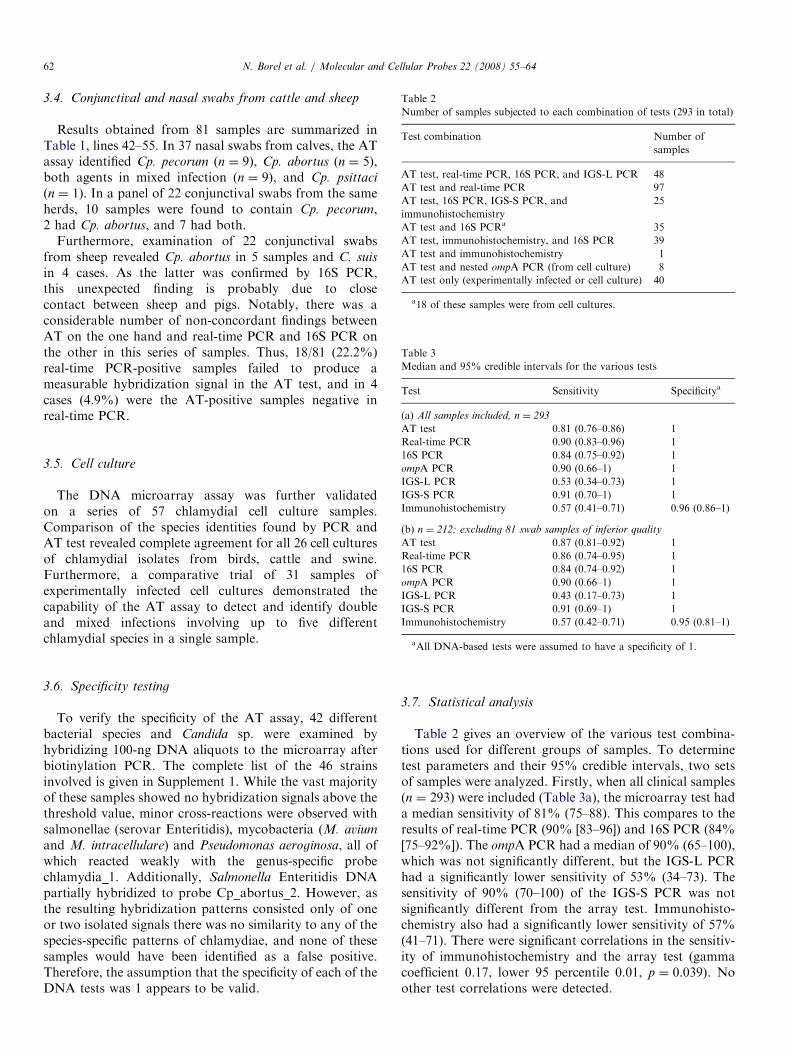
Table 2
Number of samples subjected to each combination of tests (293 in total)
Test combination Number of
samples
AT test, real-time PCR, 16S PCR, and IGS-L PCR 48
AT test and real-time PCR 97
AT test, 16S PCR, IGS-S PCR, and
immunohistochemistry
25
AT test and 16S PCRa 35
AT test, immunohistochemistry, and 16S PCR 39
AT test and immunohistochemistry 1
AT test and nested ompA PCR (from cell culture) 8
AT test only (experimentally infected or cell culture) 40
a18 of these samples were from cell cultures.
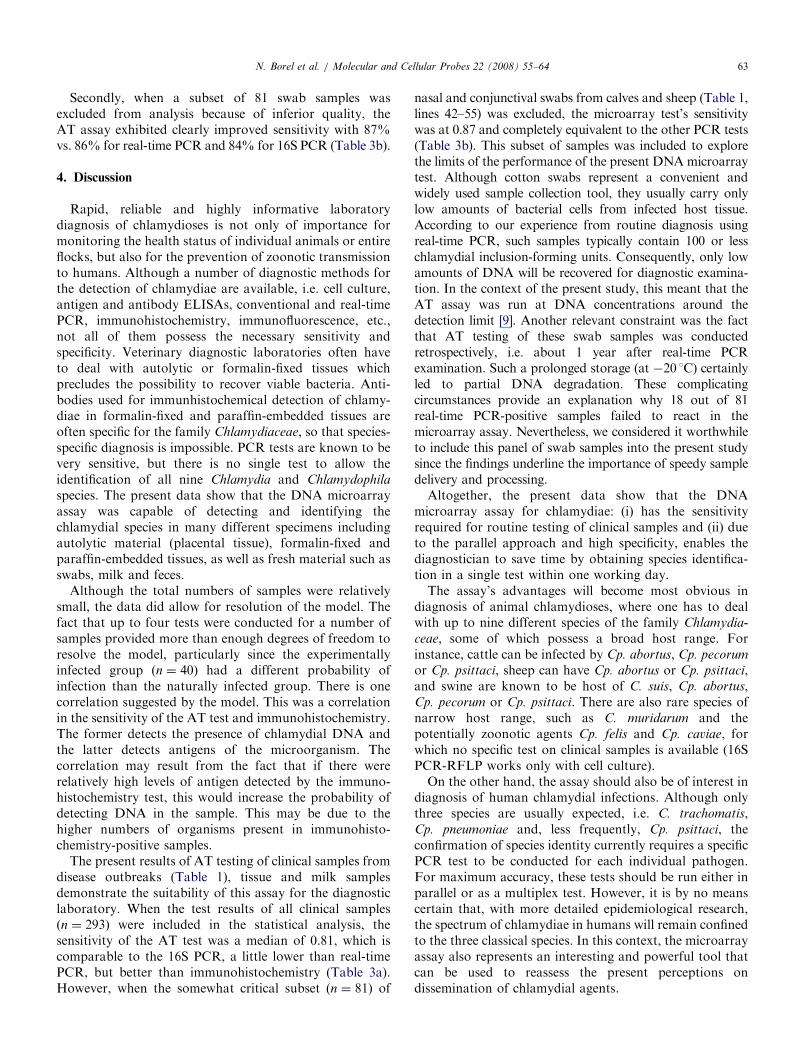
Table 3
Median and 95% credible intervals for the various tests
Test Sensitivity Specificitya
(a) All samples included, n ¼ 293
N. Borel et al. / Molecular and Cellular Probes 22 (2008) 55–6462
3.4. Conjunctival and nasal swabs from cattle and sheep
Results obtained from 81 samples are summarized inTable 1, lines 42–55. In 37 nasal swabs from calves, the ATassay identified Cp. pecorum (n ¼ 9), Cp. abortus (n ¼ 5),both agents in mixed infection (n ¼ 9), and Cp. psittaci
(n ¼ 1). In a panel of 22 conjunctival swabs from the sameherds, 10 samples were found to contain Cp. pecorum,2 had Cp. abortus, and 7 had both.
Furthermore, examination of 22 conjunctival swabsfrom sheep revealed Cp. abortus in 5 samples and C. suis
in 4 cases. As the latter was confirmed by 16S PCR,this unexpected finding is probably due to closecontact between sheep and pigs. Notably, there was aconsiderable number of non-concordant findings betweenAT on the one hand and real-time PCR and 16S PCR onthe other in this series of samples. Thus, 18/81 (22.2%)real-time PCR-positive samples failed to produce ameasurable hybridization signal in the AT test, and in 4cases (4.9%) were the AT-positive samples negative inreal-time PCR.
AT test 0.81 (0.76–0.86) 1
Real-time PCR 0.90 (0.83–0.96) 1
16S PCR 0.84 (0.75–0.92) 1
ompA PCR 0.90 (0.66–1) 1
IGS-L PCR 0.53 (0.34–0.73) 1
IGS-S PCR 0.91 (0.70–1) 1
Immunohistochemistry 0.57 (0.41–0.71) 0.96 (0.86–1)
(b) n ¼ 212; excluding 81 swab samples of inferior quality
AT test 0.87 (0.81–0.92) 1
Real-time PCR 0.86 (0.74–0.95) 1
16S PCR 0.84 (0.74–0.92) 1
ompA PCR 0.90 (0.66–1) 1
IGS-L PCR 0.43 (0.17–0.73) 1
IGS-S PCR 0.91 (0.69–1) 1
Immunohistochemistry 0.57 (0.42–0.71) 0.95 (0.81–1)
a
3.5. Cell culture
The DNA microarray assay was further validatedon a series of 57 chlamydial cell culture samples.Comparison of the species identities found by PCR andAT test revealed complete agreement for all 26 cell culturesof chlamydial isolates from birds, cattle and swine.Furthermore, a comparative trial of 31 samples ofexperimentally infected cell cultures demonstrated thecapability of the AT assay to detect and identify doubleand mixed infections involving up to five differentchlamydial species in a single sample.
All DNA-based tests were assumed to have a specificity of 1.
3.6. Specificity testing
To verify the specificity of the AT assay, 42 differentbacterial species and Candida sp. were examined byhybridizing 100-ng DNA aliquots to the microarray afterbiotinylation PCR. The complete list of the 46 strainsinvolved is given in Supplement 1. While the vast majorityof these samples showed no hybridization signals above thethreshold value, minor cross-reactions were observed withsalmonellae (serovar Enteritidis), mycobacteria (M. avium
and M. intracellulare) and Pseudomonas aeroginosa, all ofwhich reacted weakly with the genus-specific probechlamydia_1. Additionally, Salmonella Enteritidis DNApartially hybridized to probe Cp_abortus_2. However, asthe resulting hybridization patterns consisted only of oneor two isolated signals there was no similarity to any of thespecies-specific patterns of chlamydiae, and none of thesesamples would have been identified as a false positive.Therefore, the assumption that the specificity of each of theDNA tests was 1 appears to be valid.
3.7. Statistical analysis
Table 2 gives an overview of the various test combina-tions used for different groups of samples. To determinetest parameters and their 95% credible intervals, two setsof samples were analyzed. Firstly, when all clinical samples(n ¼ 293) were included (Table 3a), the microarray test hada median sensitivity of 81% (75–88). This compares to theresults of real-time PCR (90% [83–96]) and 16S PCR (84%[75–92%]). The ompA PCR had a median of 90% (65–100),which was not significantly different, but the IGS-L PCRhad a significantly lower sensitivity of 53% (34–73). Thesensitivity of 90% (70–100) of the IGS-S PCR was notsignificantly different from the array test. Immunohisto-chemistry also had a significantly lower sensitivity of 57%(41–71). There were significant correlations in the sensitiv-ity of immunohistochemistry and the array test (gammacoefficient 0.17, lower 95 percentile 0.01, p ¼ 0.039). Noother test correlations were detected.
ARTICLE IN PRESSN. Borel et al. / Molecular and Cellular Probes 22 (2008) 55–64 63
Secondly, when a subset of 81 swab samples wasexcluded from analysis because of inferior quality, theAT assay exhibited clearly improved sensitivity with 87%vs. 86% for real-time PCR and 84% for 16S PCR (Table 3b).
4. Discussion
Rapid, reliable and highly informative laboratorydiagnosis of chlamydioses is not only of importance formonitoring the health status of individual animals or entireflocks, but also for the prevention of zoonotic transmissionto humans. Although a number of diagnostic methods forthe detection of chlamydiae are available, i.e. cell culture,antigen and antibody ELISAs, conventional and real-timePCR, immunohistochemistry, immunofluorescence, etc.,not all of them possess the necessary sensitivity andspecificity. Veterinary diagnostic laboratories often haveto deal with autolytic or formalin-fixed tissues whichprecludes the possibility to recover viable bacteria. Anti-bodies used for immunhistochemical detection of chlamy-diae in formalin-fixed and paraffin-embedded tissues areoften specific for the family Chlamydiaceae, so that species-specific diagnosis is impossible. PCR tests are known to bevery sensitive, but there is no single test to allow theidentification of all nine Chlamydia and Chlamydophila
species. The present data show that the DNA microarrayassay was capable of detecting and identifying thechlamydial species in many different specimens includingautolytic material (placental tissue), formalin-fixed andparaffin-embedded tissues, as well as fresh material such asswabs, milk and feces.
Although the total numbers of samples were relativelysmall, the data did allow for resolution of the model. Thefact that up to four tests were conducted for a number ofsamples provided more than enough degrees of freedom toresolve the model, particularly since the experimentallyinfected group (n ¼ 40) had a different probability ofinfection than the naturally infected group. There is onecorrelation suggested by the model. This was a correlationin the sensitivity of the AT test and immunohistochemistry.The former detects the presence of chlamydial DNA andthe latter detects antigens of the microorganism. Thecorrelation may result from the fact that if there wererelatively high levels of antigen detected by the immuno-histochemistry test, this would increase the probability ofdetecting DNA in the sample. This may be due to thehigher numbers of organisms present in immunohisto-chemistry-positive samples.
The present results of AT testing of clinical samples fromdisease outbreaks (Table 1), tissue and milk samplesdemonstrate the suitability of this assay for the diagnosticlaboratory. When the test results of all clinical samples(n ¼ 293) were included in the statistical analysis, thesensitivity of the AT test was a median of 0.81, which iscomparable to the 16S PCR, a little lower than real-timePCR, but better than immunohistochemistry (Table 3a).However, when the somewhat critical subset (n ¼ 81) of
nasal and conjunctival swabs from calves and sheep (Table 1,lines 42–55) was excluded, the microarray test’s sensitivitywas at 0.87 and completely equivalent to the other PCR tests(Table 3b). This subset of samples was included to explorethe limits of the performance of the present DNAmicroarraytest. Although cotton swabs represent a convenient andwidely used sample collection tool, they usually carry onlylow amounts of bacterial cells from infected host tissue.According to our experience from routine diagnosis usingreal-time PCR, such samples typically contain 100 or lesschlamydial inclusion-forming units. Consequently, only lowamounts of DNA will be recovered for diagnostic examina-tion. In the context of the present study, this meant that theAT assay was run at DNA concentrations around thedetection limit [9]. Another relevant constraint was the factthat AT testing of these swab samples was conductedretrospectively, i.e. about 1 year after real-time PCRexamination. Such a prolonged storage (at �20 1C) certainlyled to partial DNA degradation. These complicatingcircumstances provide an explanation why 18 out of 81real-time PCR-positive samples failed to react in themicroarray assay. Nevertheless, we considered it worthwhileto include this panel of swab samples into the present studysince the findings underline the importance of speedy sampledelivery and processing.Altogether, the present data show that the DNA
microarray assay for chlamydiae: (i) has the sensitivityrequired for routine testing of clinical samples and (ii) dueto the parallel approach and high specificity, enables thediagnostician to save time by obtaining species identifica-tion in a single test within one working day.The assay’s advantages will become most obvious in
diagnosis of animal chlamydioses, where one has to dealwith up to nine different species of the family Chlamydia-
ceae, some of which possess a broad host range. Forinstance, cattle can be infected by Cp. abortus, Cp. pecorum
or Cp. psittaci, sheep can have Cp. abortus or Cp. psittaci,and swine are known to be host of C. suis, Cp. abortus,Cp. pecorum or Cp. psittaci. There are also rare species ofnarrow host range, such as C. muridarum and thepotentially zoonotic agents Cp. felis and Cp. caviae, forwhich no specific test on clinical samples is available (16SPCR-RFLP works only with cell culture).On the other hand, the assay should also be of interest in
diagnosis of human chlamydial infections. Although onlythree species are usually expected, i.e. C. trachomatis,Cp. pneumoniae and, less frequently, Cp. psittaci, theconfirmation of species identity currently requires a specificPCR test to be conducted for each individual pathogen.For maximum accuracy, these tests should be run either inparallel or as a multiplex test. However, it is by no meanscertain that, with more detailed epidemiological research,the spectrum of chlamydiae in humans will remain confinedto the three classical species. In this context, the microarrayassay also represents an interesting and powerful tool thatcan be used to reassess the present perceptions ondissemination of chlamydial agents.
ARTICLE IN PRESSN. Borel et al. / Molecular and Cellular Probes 22 (2008) 55–6464
Acknowledgments
The authors thank Christine Grajetzki, Roseline Weilen-mann, Elke Muller, Carmen Kaiser, Simone Bettermann,and Sabine Scharf for excellent technical assistance. Thestudy is an integral part of the European COST Action 855‘‘Animal Chlamydioses and the Zoonotic Implications’’.
Appendix A. Supplementary material
Supplement 1. Examination of microorganisms otherthan Chlamydiaceae (specificity controls).
Supplementary data associated with this article can befound in the online version at doi:10.1016/j.mcp.2007.06.003.
References
[1] Hegde P, Qi R, Abernathy K, Rasooly A, Chizhikov V. A concise
guide to cDNA microarray analysis. Biotechniques 2000;29:
548–56.
[2] Perreten V, Vorlet-Fawer L, Slickers P, Ehricht R, Kuhnert P, Frey J.
Microarray-based detection of 90 antibiotic resistance genes of gram-
positive bacteria. J Clin Microbiol 2005;43:2291–302.
[3] Monecke S, Ehricht R. Rapid genotyping of methicillin-resistant
Staphylococcus aureus (MRSA) isolates using miniaturised oligonu-
cleotide arrays. Clin Microbiol Infect 2005;11:825–33.
[4] Al-Khaldi SF, Myers KM, Rasooly A, Chizhikov V. Genotyping of
Clostridium perfringens toxins using multiple oligonucleotide micro-
array hybridisation. Mol Cell Probes 2004;18:359–67.
[5] Kim BC, Park JH, Gu MB. Development of a DNA microarray chip
for the identification of sludge bacteria using an unsequenced random
genomic DNA hybridization method. Environ Sci Technol 2004;
38:6767–74.
[6] Sachse K, Hotzel H, Slickers P, Ellinger T, Ehricht R. DNA
microarray-based detection and identification of Chlamydia and
Chlamydophila spp. Mol Cell Probes 2005;19:41–50.
[7] Roth SB, Jalava J, Ruuskanen O, Ruohola A, Nikkari S. Use of an
oligonucleotide array for laboratory diagnosis of bacteria responsible
for acute upper respiratory infections. J Clin Microbiol 2004;42:
4268–74.
[8] Conejero-Goldberg C, Wang E, Yi C, Goldberg TE, Jones-Brando L,
Marincola FM, et al. Infectious pathogen detection arrays: viral
detection in cell lines and postmortem brain tissue. Biotechniques
2005;39:741–51.
[9] Ehricht R, Slickers P, Goellner S, Hotzel H, Sachse K. Optimized
DNA microarray assay allows detection and genotyping of single
PCR-amplifiable target copies. Mol Cell Probes 2006;20:60–3.
[10] Lutz-Wohlgroth L, Becker A, Brugnera E, Huat ZL, Zimmermann
D, Grimm F, et al. Chlamydiales in guinea-pigs and their zoonotic
potential. J Vet Med A Physiol Pathol Clin Med 2006;53:185–93.
[11] Chanton-Greutmann H, Thoma R, Corboz L, Borel N, Pospischil A.
Abortion in small ruminants in Switzerland: investigations during
two lambing seasons (1996–98) with special regard to chlamydiae.
Schweiz Arch Tierheilk 2002;144:483–92.
[12] Borel N, Thoma R, Spaeni P, Weilenmann R, Teankum K, Brugnera
E, et al. Chlamydia-related abortions in cattle from Graubunden,
Switzerland. Vet Pathol 2006;43:702–8.
[13] Pospischil A, Thoma R, Hilbe M, Grest P, Gebbers JO. Abortion in
woman caused by caprine Chlamydophila abortus (Chlamydia psittaci
serovar 1). Swiss Med Wkly 2002;132:64–6.
[14] Blumer C, Zimmermann R, Weilenmann R, Vaughan L, Pospischil
A. Chlamydia species as possible cause of mass deaths of free-ranging
amphibians and frogs in Switzerland. In: Proceedings of the 3rd
workshop of COST 855 on diagnosis and pathogenesis of animal
chlamydioses, Siena, Italy, 2005. p. 43
[15] Soldati G, Lu ZH, Vaughan L, Polkinghorne A, Zimmermann DR,
Huder JB, et al. Detection of mycobacteria and chlamydiae in
granulomatous inflammation of reptiles: a retrospective study.
Vet Pathol 2004;41:388–97.
[16] Guscetti F, Schiller I, Sydler T, Corboz L, Pospischil A. Experimental
Chlamydia psittaci serotype 1 enteric infection in gnotobiotic piglets:
histopathological, immunohistochemical and microbiological find-
ings. Vet Microbiol 1998;62:251–63.
[17] Becker A, Wohlgroth L, Vaughan L, Brugnera E, Kaps S, Spiess B, et
al. Chlamydial conjunctivitis in domesticated animals: preliminary
results in guinea pigs, pigs and sheep. In: Proceedings of the fifth
meeting of the European Society for Chlamydia Research, Budapest,
Hungary, 2004. p. 317
[18] Sachse K, Grossmann E, Jager C, Diller R, Hotzel H. Detection of
Chlamydia suis from clinical specimens: comparison of PCR, antigen
ELISA, and culture. J Microbiol Methods 2003;54:233–8.
[19] Sachse K, Hotzel H. Detection and differentiation of chlamydiae by
nested PCR. Methods Mol Biol 2003;216:123–36.
[20] Everett KDE, Andersen AA. Identification of nine species of the
Chlamydiaceae using PCR-RFLP. Int J Syst Bacteriol 1999;49(Pt
2):803–13.
[21] Everett KDE, Bush RM, Andersen AA. Emended description of the
order Chlamydiales, proposal of Parachlamydiaceae fam. nov. and
Simkaniaceae fam. nov., each contaning on monotypic genus, revised
taxonomy of the family Chlamydiaceae, including a new genus and
five new species, and standards for the identification of organisms. Int
J Syst Bacteriol 1999;49:415–40.
[22] Guscetti F, Hoop R, Schiller I, Corboz L, Sydler T, Pospischil A.
Experimental enteric infection of gnotobiotic piglets with a Chlamy-
dia psittaci strain of avian origin. J Vet Med B Infect Dis Vet Public
Health 2000;47:561–72.
[23] Brunscum AJ, Gardner IA, Johnson WO. Estimation of diagnostic-
test sensitivity and specificity through Bayesian modeling. Prev Vet
Med 2005;68:145–63.
[24] Dendukuri N, Joseph L. Bayesian approaches to modeling the
conditional dependence between multiple diagnostic tests. Biometrics
2001;57:158–67.
[25] Gardner IA, Stryhn H, Lind P, Collins MT. Conditional dependence
between tests affects the diagnosis and surveillance of animal diseases.
Prev Vet Med 2000;45:107–22.
[26] Rapsch C, Schweizer G, Grimm F, Kohler L, Bauer C, Deplazes P,
et al. Estimating the true prevalence of Fasciola hepatica in cattle
slaughtered in Switzerland in the absence of an absolute diagnostic
test. Int J Parasitol 2006;36:1153–8.