Automatic summarisation and annotation of microarray data
10
1 23 Soft Computing A Fusion of Foundations, Methodologies and Applications ISSN 1432-7643 Volume 15 Number 8 Soft Comput (2011) 15:1505-1512 DOI 10.1007/ s00500-010-0600-4 Automatic summarisation and annotation of microarray data Pietro H. Guzzi, Maria Teresa Di Martino, Giuseppe Tradigo, Pierangelo Veltri, Pierfrancesco Tassone, Pierosandro Tagliaferri, et al.
Transcript of Automatic summarisation and annotation of microarray data

1 23
Soft ComputingA Fusion of Foundations,Methodologies and Applications ISSN 1432-7643Volume 15Number 8 Soft Comput (2011)15:1505-1512DOI 10.1007/s00500-010-0600-4
Automatic summarisation and annotationof microarray data
Pietro H. Guzzi, Maria Teresa DiMartino, Giuseppe Tradigo, PierangeloVeltri, Pierfrancesco Tassone,Pierosandro Tagliaferri, et al.

1 23
Your article is protected by copyright and
all rights are held exclusively by Springer-
Verlag. This e-offprint is for personal use only
and shall not be self-archived in electronic
repositories. If you wish to self-archive your
work, please use the accepted author’s
version for posting to your own website or
your institution’s repository. You may further
deposit the accepted author’s version on a
funder’s repository at a funder’s request,
provided it is not made publicly available until
12 months after publication.

FOCUS
Automatic summarisation and annotation of microarray data
Pietro H. Guzzi • Maria Teresa Di Martino • Giuseppe Tradigo •
Pierangelo Veltri • Pierfrancesco Tassone • Pierosandro Tagliaferri •
Mario Cannataro
Published online: 26 March 2010
� Springer-Verlag 2010
Abstract The study of biological processes within cells is
based on the measurement of the activity of different mol-
ecules, in particular genes and proteins whose activities are
strictly related. The activity of genes is measured through a
systematic investigation carried out by microarrays. Such
technology enables the investigation of all the genes of an
organism in a single experiment, encoding meaningful
biological information. Nevertheless, the preprocessing of
raw microarray data needs automatic tools that standardise
such phase in order to: (a) avoiding errors in analysis pha-
ses, and (b) making comparable the results of different
laboratories. The preprocessing problem is as much relevant
as considering results obtained from analysis platforms of
different vendors. Nevertheless, there is currently a lack of
tools that allow to manage and preprocess multivendor
dataset. This paper presents a software platform (called
GSAT, General-purpose Summarisation and Annotation
Tool) able to manage and preprocess microarray data. The
GSAT allows the summarisation, normalisation and anno-
tation of multivendor microarray data, using web services
technology. First experiments and results on Affymetrix
data samples are also discussed. GSAT is available online at
http://bioingegneria.unicz.it/m-cs as a standalone applica-
tion or as a plugin of the TMEV microarray data analysis
platform.
Keywords Microarray � Genomics � DNA microarray �Summarisation � Normalisation � Annotation
1 Introduction
Biological processes within cells are carried out by genes
and proteins. Genes are related to proteins through the
central dogma of molecular biology that states that genes
encode the formation of proteins. One of the main func-
tions of genes is to regulate the formation of proteins
through the transcription process which produces RNA.
Studying RNA allows to discover meaningful information
about proteins and genes. Using microarray technology, it
is possible to study genes (and consequently their potential
protein transcriptions) in a single experiment (Quacken-
bush 2001).
For processing and studying DNA microarrays, there
exist many different technologies produced by different
vendors as well as algorithms and tools for managing and
analysing obtained data. The scenario is characterised by
heterogeneity of data, formats, and analysis workflows
(Brazma et al. 2001). Results obtained from different lab-
oratories are consequently not directly comparable. Main
P. H. Guzzi (&) � G. Tradigo � P. Veltri � M. Cannataro
Bioinformatics Laboratory, Department of Experimental
Medicine and Clinic, University Magna Graecia,
88100 Catanzaro, Italy
e-mail: [email protected]
G. Tradigo
e-mail: [email protected]
P. Veltri
e-mail: [email protected]
M. Cannataro
e-mail: [email protected]
M. T. Di Martino � P. Tassone � P. Tagliaferri
Medical Oncology Unit, T. Campanella Cancer Center,
University Magna Graecia, 88100 Catanzaro, Italy
e-mail: [email protected]
P. Tassone
e-mail: [email protected]
P. Tagliaferri
e-mail: [email protected]
123
Soft Comput (2011) 15:1505–1512
DOI 10.1007/s00500-010-0600-4
Author's personal copy

microarray vendors are Affymetrix1 and Illumina2 (Kuhn
et al. 2004).
Let us consider the whole process of analysis through
microarray platforms. The RNA of a sample is extracted
and then is inserted onto a chip that contains a set of probes
to bind the RNA. Probes are constituted of oligonucleotides
or complementary DNA (c-DNA). A light source is used to
bleach the fluorescent markers and the resulting image is
recorded. After the image registration, a preprocessing
phase is needed to remove the noise, recognise the position
of different probes and to identify corresponding genes.
Main differences among vendors platform are: (a) the
fabrication steps, i.e. how probes are attached to the sub-
strate, (b) the number of different probes used for each
gene, e.g. a constant or a variable number for each gene,
and (c) how the probes are designed, e.g. the number and
the choice of nucleotides (Michael et al. 2005).
A typical workflow for analysing microarray data is
structured on three main phases (Hibbs et al. 2005;
Rubinstein et al. 2003): (a) preprocessing, that comprises
summarisation and normalisation, (b) annotation, (c) sta-
tistical-data mining analysis, and (d) biological interpreta-
tion, as depicted in Fig. 1.
Raw data generated from microarray platforms, e.g.
Affymetrix Cel Files or Illumina Tagged Images, need to
be preprocessed. The first step in preprocessing, known as
summarisation, aims to recognise the position of different
genes in raw images, associating different regions of pixels
to the unique gene that generated them as depicted in
Fig. 2. Normalisation aims to correct the variation of gene
expression in the same array due to experimental bias.
Filtering reduces the number of investigated genes on the
basis of biological considerations, e.g. genes of known
functions, or considering statistical criteria (e.g. associated
p-value). Finally, the annotation process associates each
gene to a set of functional information, such as biological
processes that are related to gene, and a set of cross ref-
erence database identifiers.
Statistical and data mining analysis phases aim to
identify biological meaningful genes, e.g. by finding dif-
ferentially expressed genes among two groups of patients
on the basis of their expression values. All extracted
genes are finally related to the biological processes in
which they are involved, e.g. a set of genes that are over-
expressed may be related to the insurgence of a disease.
Although this workflow is universally adopted, the
methods and the software tools used in preprocessing
phase are often different. The large number of fabrication
approaches, chip type, and preprocessing methods, have
to be considered when approaching to the comparison of
results. Differences in preprocessing, i.e. the use of dif-
ferent algorithms, or the use of different parameters, can
cause the selection of different genes and so the induction
of possibly wrong conclusions. To the best of our
knowledge, existing software tools generally allow only
the preprocessing of binary data of a single vendor
microarray, e.g. Affymetrix or Illumina. For instance,
Affymetrix Power Tools (APT) (Welle et al. 2002) is
used for Affymetrix data, while lumi (Du et al. 2008) may
be used for Illumina data. Only the Bioconductor3
framework includes packages for the preprocessing of
both Illumina and Affymetrix arrays such as IlluminaGUI
(Eggle and Schultze 2007) for the former and OneChan-
nelGUI (Sanges et al. 2007) for the latter. Nevertheless, a
Bioconductor single package performing preprocessing
for both vendors does not exist.
From this scenario, in order to enable the sharing and the
cross-comparison of microarray results from different plat-
forms and laboratories, we propose a general purpose soft-
ware platform for preprocessing raw microarray data. We
present General-purpose Summarisation and Annotation
Fig. 1 Workflow of microarray
data analysis
Fig. 2 Summarisation of binary files
1 http://www.affymetrix.com.2 http://www.illumina.com. 3 http://www.bioconductor.org.
1506 P. H. Guzzi et al.
123
Author's personal copy
Tool (GSAT) and show that it is able to preprocess multi-
vendor microarray data, simplifiyng the execution of sum-
marisation, normalisation, and annotation tasks. The main
advantage of GSAT is to allow the use of a single platform to
preprocess multivendor datasets.
GSAT is based on web services technology: the core
service of the system is in charge of tracing the last version
of preprocessing libraries released by microarrays vendors,
allowing a transparent access to the right and most updated
versions of preprocessing libraries. It also includes a client
module that implements the preprocessing methods by
wrapping multivendor preprocessing tools. A system pro-
totype and its application to preprocess Affymetrix binary
(CEL) files is presented. The GSAT implementation for
Affymetrix platform comprises three main modules: (a) a
wrapper of the APT, (b) a library manager that is able to
find the needed libraries to realise summarisation and
normalisation, and (c) an annotation manager that is able to
find the needed annotations libraries, i.e. the information
about genes to realise annotation. The system presented
here extends l� CS an early prototype presented in
Cannataro et al. (2008a, b). Major enhancements are the
management of multivendor arrays and the use of the web
services technology.
The rest of the paper is structured as follows. Section 2
discusses related work, Sect. 3 presents the main contri-
bution of this work, Sect. 4 presents a case study discussing
the preprocessing of Affymetrix data using GSAT. Finally,
Sect. 5 concludes the paper and outlines future work.
2 Related work
The preprocessing of microarray data can be structured as a
pipeline of sequential steps, as data feeds along next steps,
it becomes more and more refined. The goals of such
pipeline are: (a) to identify and remove the noise and
artefacts dues to the experimental procedure, (b) to extract
the real value of expression for each gene, (c) to match
each probe with the corresponding nucleotide sequence,
and (d) to enrich such information using functional anno-
tations. Each step can be performed using different algo-
rithms that are designed for each chip of different
platforms. Usually, software tools are designed ad hoc for a
vendor and they do not allow the preprocessing in an
general way. Thus, here we categorise existing algorithms
and tools on the basis of the related chip considering, in
particular Illumina and Affymetrix expression data since
their diffusion.
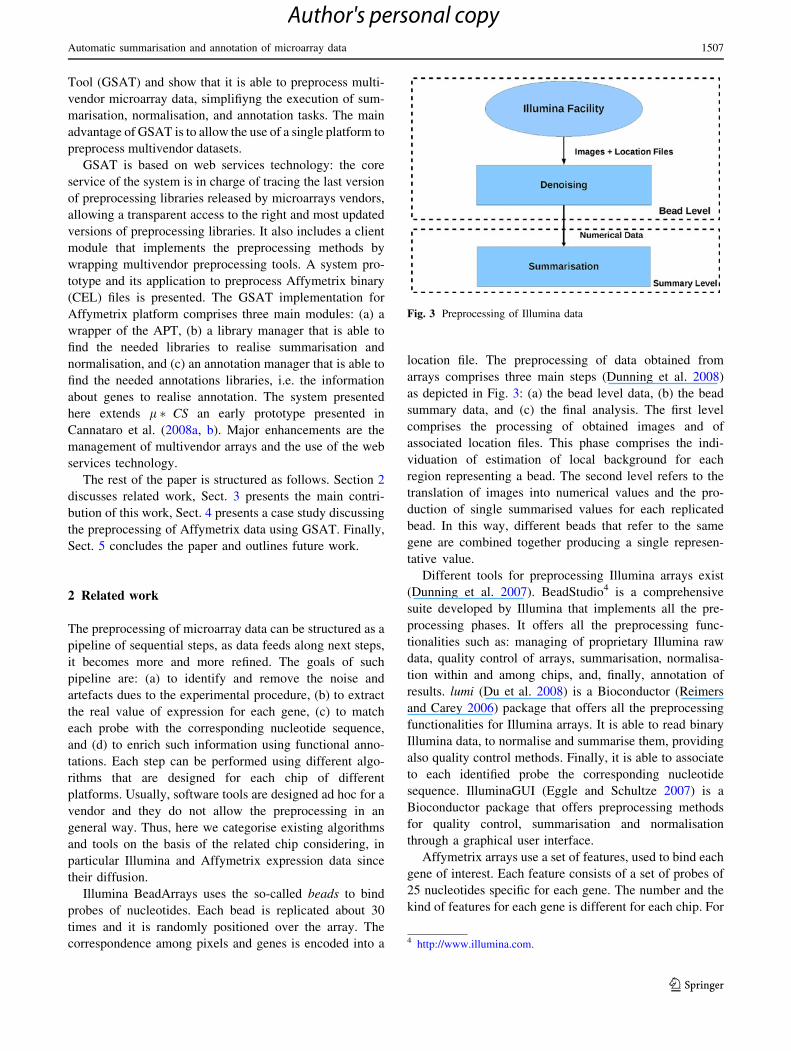
Illumina BeadArrays uses the so-called beads to bind
probes of nucleotides. Each bead is replicated about 30
times and it is randomly positioned over the array. The
correspondence among pixels and genes is encoded into a
location file. The preprocessing of data obtained from
arrays comprises three main steps (Dunning et al. 2008)
as depicted in Fig. 3: (a) the bead level data, (b) the bead
summary data, and (c) the final analysis. The first level
comprises the processing of obtained images and of
associated location files. This phase comprises the indi-
viduation of estimation of local background for each
region representing a bead. The second level refers to the
translation of images into numerical values and the pro-
duction of single summarised values for each replicated
bead. In this way, different beads that refer to the same
gene are combined together producing a single represen-
tative value.
Different tools for preprocessing Illumina arrays exist
(Dunning et al. 2007). BeadStudio4 is a comprehensive
suite developed by Illumina that implements all the pre-
processing phases. It offers all the preprocessing func-
tionalities such as: managing of proprietary Illumina raw
data, quality control of arrays, summarisation, normalisa-
tion within and among chips, and, finally, annotation of
results. lumi (Du et al. 2008) is a Bioconductor (Reimers
and Carey 2006) package that offers all the preprocessing
functionalities for Illumina arrays. It is able to read binary
Illumina data, to normalise and summarise them, providing
also quality control methods. Finally, it is able to associate
to each identified probe the corresponding nucleotide
sequence. IlluminaGUI (Eggle and Schultze 2007) is a
Bioconductor package that offers preprocessing methods
for quality control, summarisation and normalisation
through a graphical user interface.
Affymetrix arrays use a set of features, used to bind each
gene of interest. Each feature consists of a set of probes of
25 nucleotides specific for each gene. The number and the
kind of features for each gene is different for each chip. For
Fig. 3 Preprocessing of Illumina data
4 http://www.illumina.com.
Automatic summarisation and annotation of microarray data 1507
123
Author's personal copy

instance, the HGU133plus (Affymetrix 2001) array uses 22
features, referred as probeset for each gene, that are
organised as 11 pairs. Each pair is constituted by a perfect
match (PM) and a mis-match (MM) that differ by a single
nucleotide. The first one is used to bind the gene, while the
second one is used to measure the background. The
redundancy of pairs is used to measure the data quality.
The recent HumanGene array (HuGe1.0ST) uses only PM
probes to bind genes. Each gene is bound by approximately
26 probes, referred to as transcript cluster, spreads across
the full length of the gene. Recently developed exon arrays,
e.g. Human Exon for human, are used to bind directly
exons, i.e. the coding regions of genes. They have probe-
sets placed against each exon along the length of the gene.
Similar to HumanGene they have no paired MM spots.
Preprocessing of Affymetrix arrays can be structured as:
(a) background correction and quality control, (b) nor-
malisation, (c) summarisation, and (d) annotation, as
depicted in Fig. 4.
Background correction aims to identify the background
noise and to remove it (Arteaga-Salas et al. 2008; Rocke
and Durbin 2001; Tu et al. 2002).
Normalisation consists of reducing the bias among
chips and within different regions of the same chip (Fujita
et al. 2006; Irizarry et al. 2003a), aiming at removing
non-biological variability within a dataset. Both biological
and technical variations introduce artefacts and variability
into the system. Common causes of such variability are:
variable loading of DNA onto arrays, mixing of DNA
across different areas of the array, variability in the
effectiveness of the labelling reactions among different
arrays. All the algorithms for normalisation share the
same principle: the differences of data points among
sample are a few number, so the majority of points should
have the same values. Algorithms for normalisation of
microarrays can be divided into two major classes: (a)
within-array normalisation algorithms, that seek to
remove variability within a single array, and (b) between-
array normalisation algorithms, that seek to remove var-
iability among a set of arrays.
Summarisation combines multiple preprocessed probe
intensities to a single expression value. All arrays employ
more than one probe for each genes as introduced before.
Summarisation takes into account all of the probes for the
same genes and averages them by enhancing the signal-to-
noise ratio. All of these algorithms are based on several
assumptions on the data distribution and they require a set of
specific libraries in order to correctly access binary data. The
robust multi-array average (RMA) algorithm (Harbron et al.
2007; Irizarry et al. 2003b) is a summarisation method that is
applicable to all the Affymetrix arrays. It is based on a global
mathematical model that considers expression values and
probe affinities. This model is based on the consideration that
the value of intensity for a match is affected by three causes.
A first one, due to the chip, takes into account the amount of
material that binds the chip, i.e. an higher amount of bio-
logical sample produces an higher level of intensity. A sec-
ond one measures the affinity, i.e the ability of the probe to
bind the RNA. Finally, a third one estimates the measure-
ment error. In this way for each probeset, RMA calculates the
summarised values by observing the pattern of values in all
the arrays through a process of model fitting. The Probe
Logarithmic Intensity Error (PLIER) algorithm (http://
www.affymetrix.com/support/technical/technotes/plier_
technote.pdf) is based on a probe affinity parameter, which
represents the strength of a signal produced at a specific
concentration for a given probe. The probe affinities are
calculated using data across arrays. The error model
employed by PLIER assumes that the error is proportional to
the observed intensity, rather than to the background-sub-
tracted intensity. Other summarisation methods take into
account specific properties of chips, such as the summari-
sation proposed in Li and Hung Wong (2001) or in Kapur
et al. (2008).
A process known as annotation associates to each probe
its known annotations such as Gene Symbol or Gene
Ontology (Harris et al. 2004) by matching probes to public
databases or knowledge bases. Often annotation files are
provided by the chip manufacturer and contain different
levels of annotation, e.g. database identifier, description of
molecular function, associated protein domains.
There exist different tools (either commercial and free)
for preprocessing Affymetrix files. The APT (Welle et al.
2002) are a set of tools implementing low level algorithms
for working with Affymetrix GeneChip arrays. They are
able to read a set of CEL files and produce a data matrix. In
order to perform the normalisation and the summarisation,
APT tools need: (a) a set of binary CEL files, (b) a model
algorithm, e.g. PLIER, and (c) the correct libraries that
enable the correct interpretation of the images.
RMA Express5 is a tool that performs the summarisation
but it presents four main drawbacks: (a) it does not provide
the automatic updating of the needed libraries, (b) it
implements only the RMA algorithm, (c) it does not pro-
vide annotation, and (d) it is available only for windows
operating systems. The Automated Microarray Pipeline
(AMP)6, is a web application developed as a part of the
Fig. 4 Preprocessing of Affymetrix data
5 http://rmaexpress.bmbolstad.com/.6 http://compbio.dfci.harvard.edu/amp/.
1508 P. H. Guzzi et al.
123
Author's personal copy

TM4 suite. It provides the normalisation of Affymetrix data
but it requires the upload of CEL files to the web server and
it supports only version 3 of Affymetrix CEL files. One-
ChannelGUI (Sanges et al. 2007) is an extension of the
affylmGUI package providing a graphical interface for
Bioconductor libraries. Embedded libraries provide quality
control, noise removal, feature selection and statistical
analysis features for single channel microarrays.
TM4 (Saeed et al. 2003) is a comprehensive software
suite consisting of four main applications. A Microarray
Data Manager (MADAM) stores and retrieves data from a
database. Spotfinder, an image quantification tool able to
read colour array images, remove noise and extract rele-
vant features. Microarray Data Analysis System (MIDAS)
is able to read gene data performing several analyses. In
particular, it implements normalisation, gene filtering, gene
grouping and data mining. A main drawback of this tool is
that it is not able to execute the first preprocessing phase,
i.e. the summarisation, and it needs a preliminary trans-
formation phase. When using Affymetrix array, this phase
can be performed using the APT whose results need to be
loaded into TM4 in a manual way.
The preprocessing tools described so far can be grouped
on the basis of the vendor of the managed array as reported
in Table 1. As discussed, although the importance of the
preprocessing of microarray data and the need for a stan-
dardisation and comparison of methods, there exists a lack
of tools that are able to preprocess different multivendor
microarray data.
3 GSAT
GSAT is a framework to automatically preprocess micro-
array data. Figure 5 depicts the context where GSAT is
located. Laboratories use different instruments to analyse
samples obtaining raw microarray data that have different
syntax and format, e.g. CEL files for Affymetrix and TIFF
(Tagged Image File Format) for Illumina. Those files need
to be preprocessed in order to reduce the noise, extract
information about genes, and normalise the obtained
expression values. Such process requires the use of dif-
ferent tools and algorithms. The use of such tools requires
both biological and bioinformatics expertise.
GSAT sits in the middle between microarray facilities
and statistical and data mining software tools, so its main
functional requirements are:
– interfacing with multi-vendor microarray facilities,
– storing and managing libraries for processing and
annotating raw binary data,
– interfacing with off-the-shelf microarray data analysis
tools, such as TM4.
GSAT provides the following functions: (a) Microarray
Data Acquisition, i.e. reading and managing binary data
produced by different instruments; (b) Microarray Data
Preprocessing, i.e. offering main algorithms for summari-
sation, denoising and normalisation; (c) Microarray Data
Annotation, i.e. annotating the obtained gene expression
values with functional annotation about genes.
3.1 Architecture
GSAT is based on a distributed architecture whose main
modules are a web server and a downloadable client as
depicted in Fig. 6. The GSAT web server contains a web
service that performs the update of two reference dat-
abases: (a) a library references db that stores references
(i.e. URLs) to the libraries needed to preprocess binary
files, e.g. CDF (Chip Definition File) files for Affymetrix;
(b) an annotation library db that stores references (i.e.
URLs) to annotation libraries needed to annotate genes
found in the samples. The web service module periodically
Table 1 Software tools for preprocessing of microarray data
Tool Vendor Functionalities
lumi Illumina Preprocessing
BeadStudio Illumina Preprocessing
IlluminaGui Illumina Preprocessing and analysis
OneChannelGui Affymetrix Preprocessing and analysis
APT Affymetrix Preprocessing
RMAExpress Affymetrix Preprocessing
TM4 Affymetrix Analysis
AMP Affymetrix Preprocessing
Fig. 5 Analysis of microarray data
Automatic summarisation and annotation of microarray data 1509
123
Author's personal copy

verifies the availability of updates to those libraries by
connecting to different repositories maintained by the
microarray vendors. The web server also contains a web
portal that presents information about the GSAT architec-
ture and allows to download it.
The GSAT client offers the preprocessing functionalities
by wrapping existing preprocessing tools. The Prepro-
cessing Wrapper receives the job requests from the GSAT
client, manages them and then invokes the needed pre-
processing tool, e.g. APT tool for Affymetrix binary files.
An instance of the correct preprocessing tool is invoked
whenever summarisation requests are received. After the
job completion, the wrapper reads the output files, orga-
nises them in a table data structure, and stores them on the
file system or transparently sends them to the application
that is using the GSAT client. For instance, we are cur-
rently integrating the GSAT client as a plugin into the TM4
platform.
While the GSAT server stores pointers to the updated
versions of all the preprocessing libraries made available
by the supported microarray vendors, the GSAT client
downloads and stores only the needed libraries. In par-
ticular (see bottom part of Fig. 6), the LibraryDB stores
all the needed libraries to parse binary files while the
AnnotationDB stores the annotation files. It keeps trace
of installed libraries in a local archive encoded in XML.
Currently, we designed the whole architecture of the
GSAT tool and we tested a first prototype able to pre-
process Affymetrix files. The realised tool receives a set
of binary files as input, summarises them, i.e. converts
them into a matrix, and extends the generated data with
annotations. It is based on a wrapper of APT accessible
trough a GUI. An instance of APT is invoked whenever
summarisation requests are received. An ad-hoc module
on the GSAT client periodically verifies the availability
of updates by connecting to the Updater web service
hosted on the GSAT server. It updates the databases
whenever a request for the installation of new libraries is
received or a new version of installed libraries is
available. An ad-hoc registry encoded in XML keeps
trace of new versions for both LibraryDB and Anno-
tationDB databases, as depicted in Fig. 7 for Affymetrix
Chips.
The current version of GSAT is currently under testing
in a joint collaboration between the Bioinformatics Labo-
ratory of University of Catanzaro and the Tommaso
Campanella Cancer Center (Di Martino et al. 2009).
4 Case study: preprocessing Affymetrix data
This section shows the functionalities of GSAT through a
case study on Affymetrix binary files. The preprocessing of
two datasets both available for download on the Affymetrix
web site, a Human Gene 1.0 dataset, Dataset1 hereafter,
and a Human133Plus2 dataset, Dataset2 hereafter, is
presented.
Dataset1 contains various mixture levels of two tissues:
brain and heart from human samples. We selected ten
Fig. 6 The architecture of GSAT
Fig. 7 Fragment of GSAT
archive
1510 P. H. Guzzi et al.
123
Author's personal copy

arrays from these to perform our study. Dataset2 is a subset
of the Latin Square dataset developed by Affymetrix.7
The GSAT client initially checks for locally installed
libraries, and asks to the user to select the appropriate ones
for chips. In this case the user selects those for Affymetrix
HumanGene1.0st and HGU133plus array. Figure 8a and b
shows, respectively, the selection of libraries for HGU133
and HumanGene. The client queries the GSAT server for
those libraries and receives the references to the updated
libraries so he/she can download and install them.
Each preprocessing step has different options, among
those the type of algorithm used and its own parameters. At
this step the researcher has to select the preferred algorithm
and its parameters. For instance, considering the sum-
marisation algorithm, he/she can choose to employ the
RMA or the PLIER algorithm and related parameters.
GSAT then reads the binary files and invokes the APT
executable using the user’s specified parameters. Figure 9
shows the GSAT client interface for the selection of
analysis parameters.
When summarisation and annotation are completed,
GSAT writes the results file for subsequent analysis. File is
structured as a table whose attribute columns contain: (a)
the probeset identifier, (b) the identifier of each sample, (c)
the name of the sequence, e.g. the gene name, (d) the strand
of DNA, (e) the position of start and stop coding region, (f)
the total number of probes, (g) the cross reference to pro-
tein and RNA databases, and (h) the Gene Ontology
annotation. Table 2 depicts a fragment of the generated file
for human gene array showing only a subset of columns.
5 Conclusion
The study of gene expression data is nowadays an impor-
tant research strategy in biology and medicine. Microarray
technology enables the investigation of such reality and
uses chips that are able to scan the whole genome. The
correct interpretation of those data relies on a preliminary
preprocessing phase that takes as input binary raw data and
produces as output data for statistical and data mining
analysis. Nevertheless, there exist many preprocessing
methods that can be used, so preprocessed data are not
easily comparable. In this paper we proposed GSAT, a
software platform that simplifies the preprocessing of
multi-vendor binary data. GSAT is based on two main
modules: a web portal that stores references of all the
preprocessing and annotation libraries maintaining them
updated, and a client able to preprocess data. In this way,
through GSAT, users can directly manage binary data
without worrying about locating and invoking the proper
preprocessing tools and chip-specific libraries. Actually,
there exists a first prototype of such system that is able to
preprocess Affymetrix data. Future work will regard the
complete implementation of the system for supporting
Fig. 8 Selection of libraries
Fig. 9 Selection of analysis parameters
Table 2 Example of GSAT generated file
Probesetid Sample 1 […] Sample N Gene Name Swissprot GO
7896736 3.45 […] 7.98 ENST00000359325 …7896817 7.91 […] 9.10 ISG15 GO:0032020
7 http://www.affymetrix.com/support/technical/sample_data/
datasets.affx.
Automatic summarisation and annotation of microarray data 1511
123
Author's personal copy

other microarray formats and the parallel implementation
of preprocessing and annotation modules.
Acknowledgments Authors are grateful to Andrea Greco for his
work on prototype implementation.
References
Affymetrix. Affymetrix Power Tools (APT). http://www.affymetrix.
com
Affymetrix Array design for the GeneChip human genome 133 Set
(2001) Affymetrix Technote
Arteaga-Salas JM, Zuzan H, Langdon WB, Upton GJG, Harrison AP
(2008) An overview of image-processing methods for Affyme-
trix GeneChips. Briefings Bioinf 9(1):25–33. doi:10.1093/bib/
bbm055
Brazma A et al (2001) Minimum information about a microarray
experiment (miame)-toward standards for microarray data. Nat
Genet 29(4):365–371 (December 2001)
Cannataro M, Di Martino MT, Guzzi PH, Tagliaferri P, Tassone P,
Tradigo G, Veltri P (2008a) An extension of the TIGR M4 suite
to preprocess and visualize affymetrix binary files. In: Proceed-
ings of computational intelligence methods for bioinformatics
and biostatistics, 5th international meeting, CIBB 2008, Vietri
sul Mare, Italy. Springer (3–4 October 2008 )
Cannataro M, Di Martino MT, Guzzi PH, Tassone P, Tagliaferri P,
Tradigo G, Veltri P (2008b) A tool for managing affymetrix
binary files through the tigr TM4 suite. Accepted poster in
international meeting of the Microarray and Gene Expression
Data Society. Riva del Garda, Italy (1–4 September)
Di Martino MT, Guzzi PH, Ventura M, Pietragalla, A, Neri P, Bulotta
A, Calimeri T, Barbieri V, Caraglia M, Veltri P, Cannataro M,
Tassone P, Tagliaferri P (2008) Whole gene expression profiling
shows a differential transcriptional response to cisplatinum in
brca-1 defective versus brca1-reconstituted breast cancer cells.
Ann Oncol 19:ix103–ix111. doi:10.1093/annonc/mdn618
Di Martino MT, Ventura M, Guzzi PH, Pietragalla A, Neri P, Bulotta
A, Calimeri T, Barbieri V, Caraglia M, Veltri P, Cannataro M,
Tassone P, Tagliaferri P (2009) Differential transcriptional
response to cisplatinum in BRCA1-defective versus BRCA1-
reconstituted breast cancer cells by microarrays. Cancer Res
69:5062
Du P, Kibbe WA, Lin SM (2008) lumi: a pipeline for processing
Illumina microarray. Bioinformatics 24(13):1547–1548. doi:
10.1093/bioinformatics/btn224
Dunning MJ, Smith ML, Ritchie ME, Tavare S (2007) beadarray: R
classes and methods for Illumina bead-based data. Bioinformat-
ics 23(16):2183–2184. doi:10.1093/bioinformatics/btm311
Dunning MJ, Barbosa-Morais A, Lynch A, Tavare A, Ritchie A
(2008) Statistical issues in the analysis of Illumina data. BMC
Bioinf 1:85
Eggle D, Schultze J (2007) IlluminaGUI: Graphical User Interface for
analyzing gene expression data generated on the Illumina platform.
Bioinformatics 23(11):1431–1433. doi:10.1093/bioinformatics/
btm101
Fujita A, Sato JR, Rodrigues LO, Ferreira CE, Sogayar MC (2006)
Evaluating different methods of microarray data normalization.
BMC Bioinf 7:469 (October 2006)
Guide to probe logarithmic intensity error (plier) estimation. http://
www.affymetrix.com/support/technical/technotes/plier_technote.pdf
Harbron C, Chang KM, South MC (2007) Refplus: an r package
extending the rma algorithm. Bioinformatics 23(18):2493–2494.
doi:10.1093/bioinformatics/btm357
Harris MA, Clark J, Ireland A, Lomax J, Ashburner M, Foulger R,
Eilbeck K, Lewis S, Marshall B, Mungall C, Richter J, Rubin
GM, Blake JA, Bult C, Dolan M, Drabkin H, Eppig JT, Hill DP,
Ni L, Ringwald M, Balakrishnan R, Cherry JM, Christie KR,
Costanzo MC, Dwight SS, Engel S, Fisk DG, Hirschman JE,
Hong EL, Nash RS, Sethuraman A, Theesfeld CL, Botstein D,
Dolinski K, Feierbach B, Berardini T, Mundodi S, Rhee SY,
Apweiler R, Barrell D, Camon E, Dimmer E, Lee V, Chisholm
R, Gaudet P, Kibbe W, Kishore R, Schwarz EM, Sternberg P,
Gwinn M, Hannick L, Wortman J, Berriman M, Wood V,
Tonellato P, Jaiswal P, Seigfried T, White R (2004) The gene
ontology (go) database and informatics resource. Nucleic Acids
Res Nucleic Acids Res 32(Database issue):258–261 (January
2004)
Hibbs MA, Dirksen NC, Li K, Troyanskaya OG (2005) Visualization
methods for statistical analysis of microarray clusters. BMC
Bioinf 6
Irizarry RA, Bolstad BM, Collin F, Cope LM, Hobbs B, Speed TP
(2003a) Summaries of affymetrix genechip probe level data.
Nucleic Acids Res 31(4) (February 2003)
Irizarry RA, Hobbs B, Collin F, Beazer-Barclay YD, Antonellis KJ,
Scherf U, Terence P (2003b) Speed. Exploration, normalization,
and summaries of high density oligonucleotide array probe level
data. Biostatistics 4(2):249–264
Kapur K, Jiang H, Xing Y, Wong WH (2008) Cross-hybridization
modeling on affymetrix exon arrays. Bioinformatics
24(24):2887–2893. doi:10.1093/bioinformatics/btn571
Kuhn K, Baker SC, Chudin E, Lieu MH, Oeser S, Bennett H, Rigault
P, Barker D, McDaniel TK, Chee MS (2004) A novel, high-
performance random array platform for quantitative gene
expression profiling. Genome Res 14(11):2347–2356
Li C, Hung Wong W (2001) Model-based analysis of oligonucleotide
arrays: model validation, design issues and standard error
application. Genome Biol 2(8)
Michael B, Freudenberg J, Thompson S, Aronow B, Pavlidis P (2005)
Experimental comparison and cross-validation of the Affymetrix
and Illumina gene expression analysis platforms Nucl Acids Res
33:18
Quackenbush J (2001) Computational genetics: computational anal-
ysis of microarray data. Nat Rev Genet 2:418–427. doi:
10.1038/35076576
Reimers M, Carey VJ (2006) Bioconductor: an open source frame-
work for bioinformatics and computational biology. Methods
Enzymol 411:119–134
Rocke D, Durbin B (2001) A model for measurement error for gene
expression arrays. J Comput Biol 8(6):557–569
Rubinstein BIP, McAuliffe J, Cawley S, Palaniswami M, Ramamo-
hanarao K, Speed TP (2003) Machine learning in low-level
microarray analysis. SIGKDD Explor Newsl 5(2):130–139
Saeed AI, Sharov V, White J, Li J, Liang W, Bhagabati N, Braisted J,
Klapa M, Currier T, Thiagarajan M, Sturn A, Snuffin M,
Rezantsev A, Popov D, Ryltsov A, Kostukovich E, Borisovsky I,
Liu Z, Vinsavich A, Trush V, Quackenbush J (2003) Tm4: a free,
open-source system for microarray data management and
analysis. Biotechniques 34(2):374–378
Sanges R, Cordero F, Calogero RA (2007) onechannelgui: a graphical
interface to bioconductor tools, designed for life scientists who
are not familiar with r language. Bioinformatics 23(24):3406–
3408. doi:10.1093/bioinformatics/btm469
Tu Y, Stolovitzky G, Klein U (2002) Quantitative noise analysis forgene expression microarray experiments. Proc Natl Acad Sci
99(22):14031–14036
Welle S, Brooks AI, Thornton CA (2002) Computational method for
reducing variance with affymetrix microarrays. BMC Bioinf 3
(August 2002)
1512 P. H. Guzzi et al.
123
Author's personal copy