DS2® Automated Enzyme-Linked Immunosorbent Assay ...
304
DS2 ® Automated Enzyme-Linked Immunosorbent Assay (ELISA) System Operator Manual
-
Upload
khangminh22 -
Category
Documents
-
view
0 -
download
0
Transcript of DS2® Automated Enzyme-Linked Immunosorbent Assay ...

DS2® Automated Enzyme-Linked Immunosorbent Assay (ELISA)
System
Operator Manual

Technical Support
Part No. 91000200. ii © 2019 DYNEX Technologies Inc.
Revision History
Manual Revision Revision Date
16 2019-04-10
Manufacturer and European Authorized Representative
DYNEX Technologies Inc. 14340 Sullyfield Circle Chantilly, Virginia 20151 USA
UK REP
DYNEX Technologies Inc. Carmichael House The Green Inkberrow Worcestershire WR7 4DZ, UK
EC REP
Acorn Regulatory Consultancy Services Limited Knockmorris, Cahir, Co. Tipperary, E21 R766 Ireland
Copyright Copyright © 2019 DYNEX Technologies Inc. All rights reserved. This material may not be reproduced or copied, in whole or in part, without the written permission of DYNEX Technologies Inc.
DYNEX reserves the right to make technical improvements to this equipment and documentation without prior notice as part of a continuous program of product development. This manual supersedes all previous editions.
DS2® and DS-Matrix® are registered Trademarks of DYNEX Technologies Inc.
Technical Support Contact DYNEX for technical support: Telephone: +1 (800) 288-2354 option #4 for USA and Canada
+44 (0) 1903 267555 for European Union (EU) Fax: +1 (703) 803-1441 for US and Canada
+44 (0) 1903 267722 for EU E-mail: [email protected]
At the end of life for the DS2 instrument, contact DYNEX technical support to arrange for disposal.
All claims made in this manual have been made by DYNEX acting as the responsible body for DYNEX branded products.

Table of Contents
© 2019 DYNEX Technologies Inc. iii Part No. 91000200
Table of Contents
Chapter 1: Safety Information ...................................................................................... 1 1.1 Intended Use ................................................................................................... 1 1.2 Use of the Operator Manual ............................................................................ 1 1.3 Text Conventions Used in this Manual ............................................................. 2 1.4 Symbols Used in this Manual .......................................................................... 3 1.5 Labels on the Instrument ................................................................................. 3
1.5.1 Instrument Serial Number Label ............................................................... 3 1.5.2 Warning Labels ........................................................................................ 4 1.5.3 Instrument Disposal Label ........................................................................ 4
1.6 General Precautions ........................................................................................ 5 1.7 Safety Precautions .......................................................................................... 6
1.7.1 Biohazard Precautions ............................................................................. 6 1.7.2 Electrical Power Precautions.................................................................... 7 1.7.3 Laser Scanner Precautions ...................................................................... 7 1.7.4 Instrument Movement Precautions ........................................................... 7
Chapter 2: Overview ..................................................................................................... 9 2.1 Assays ........................................................................................................... 10 2.2 Principles of Operation .................................................................................. 10
2.2.1 Samples ................................................................................................. 10 2.2.2 Assay Test Kit ........................................................................................ 10 2.2.3 Reagents ............................................................................................... 10 2.2.4 Calibrators and/or Controls .................................................................... 10 2.2.5 Pipetting ................................................................................................. 11 2.2.6 Washing ................................................................................................. 12 2.2.7 Reading of Optical Density ..................................................................... 12 2.2.8 Scheduling and Execution of a Worklist ................................................. 12
2.3 Materials Provided ......................................................................................... 13 2.3.1 Materials Required but Not Provided ...................................................... 14 2.3.2 Consumables and Other Accessories .................................................... 14
2.4 Specifications ................................................................................................ 14 2.4.1 Instrument Dimensions .......................................................................... 14 2.4.2 Power Requirements ............................................................................. 15 2.4.3 Reader Specifications ............................................................................ 15 2.4.4 Washer Specifications............................................................................ 15 2.4.5 Incubator Specifications ......................................................................... 15 2.4.6 Instrument Capacity ............................................................................... 16 2.4.7 Sample Pipetting Specifications ............................................................. 16 2.4.8 Reagent Pipetting Specifications ............................................................ 16 2.4.9 Process Security .................................................................................... 16 2.4.10 Sample Pipetting Specifications ........................................................... 17

Table of Contents
Part No. 91000200 iv © 2019 DYNEX Technologies Inc.
2.4.11 Assays ................................................................................................. 17 2.4.12 Environmental ...................................................................................... 18 2.4.13 LIMS Connection .................................................................................. 18 2.4.14 Regulatory Compliance ........................................................................ 18
Chapter 3: Installation ................................................................................................. 19 3.1 Handling or Shipping the Instrument .............................................................. 19 3.2 Placement of the Instrument .......................................................................... 19
3.2.1 Operating Environment .......................................................................... 20 3.2.2 Storage Environment.............................................................................. 20
3.3 Connect a PC to the Instrument ..................................................................... 20 3.3.1 PC Requirements – Windows 7 .............................................................. 21 3.3.2 PC Requirements – Windows 10 (Professional Version) ........................ 21 3.3.3 Connect the PC to DS2 .......................................................................... 22
3.4 Connect the Instrument to a Power Source.................................................... 23 3.5 Install DS-Matrix Software ............................................................................. 23
3.5.1 DS-Matrix Shortcut Icon on Desktop ...................................................... 24 3.5.2 Unlock Licensed Software Features ....................................................... 25
3.6 Install LIS-Link Application ............................................................................. 26 Chapter 4: System Components ................................................................................ 27
4.1 System Cover ................................................................................................ 27 4.2 Workspace Area Components ....................................................................... 27
4.2.1 Pipette Module ....................................................................................... 28 4.2.2 Wash Module ......................................................................................... 29 4.2.3 Wash Module Operations ....................................................................... 30 4.2.4 Purge Tray ............................................................................................. 32 4.2.5 Plate Drives ............................................................................................ 32 4.2.6 Barcode Scanner ................................................................................... 33 4.2.7 Incubator and Reader Module ................................................................ 34 4.2.8 Plates ..................................................................................................... 34 4.2.9 Sample Tubes ........................................................................................ 35 4.2.10 Sample Racks ...................................................................................... 36 4.2.11 Sample Tips ......................................................................................... 36 4.2.12 Deep Well Dilution Strips ...................................................................... 37 4.2.13 Reagent Tips ........................................................................................ 38 4.2.14 Reagents, Calibrators and Controls ...................................................... 38
4.3 Fluidic Area Components ............................................................................... 39 4.3.1 Fluidic Area Door ................................................................................... 39 4.3.2 Wash Buffer Container ........................................................................... 40 4.3.3 Tip Waste Container .............................................................................. 40 4.3.4 Liquid Waste Container .......................................................................... 40 4.3.5 Cleaning Fluid ........................................................................................ 41 4.3.6 Optional External Waste Trap ................................................................ 41
4.4 Controls, Indicators and Electrical Connectors ............................................... 42

Table of Contents
© 2019 DYNEX Technologies Inc. v Part No. 91000200
4.4.1 Power Button and Indicator Light ........................................................... 42 4.4.2 Power Connector ................................................................................... 42 4.4.3 USB Port ................................................................................................ 42
Chapter 5: Software Description ................................................................................ 43 5.1 DS-Matrix Software ....................................................................................... 43 5.2 File Types ...................................................................................................... 45 5.3 DS-Matrix Main Screen ................................................................................. 46
5.3.1 Menu Bar ............................................................................................... 46 5.3.2 Timeline View ........................................................................................ 48 5.3.3 Timeline Toolbar .................................................................................... 49 5.3.4 Assay Reports ....................................................................................... 50 5.3.5 Consumables Status .............................................................................. 51
5.4 Worklist Editor ............................................................................................... 53 5.4.1 Starting the Worklist Editor ..................................................................... 53 5.4.2 Worklist Editor Menu Bar ....................................................................... 54 5.4.3 Add Assay Shortcut Buttons to the Worklist Editor ................................. 55
5.5 Assay Editor .................................................................................................. 56 5.5.1 Start the Assay Editor ............................................................................ 56
5.6 Database Maintenance .................................................................................. 57 5.6.1 Displaying a List of Items in the Database.............................................. 57 5.6.2 Deleting an Item from the Database ....................................................... 58 5.6.3 Copying an Item to the Database ........................................................... 58 5.6.4 Edit an Item in the Database .................................................................. 58 5.6.5 Create a New Item in the Database ....................................................... 59
5.7 Configure the System .................................................................................... 60 5.7.1 Specify How Samples and Other Fluids Are Pipetted ............................. 60 5.7.2 Specifying Miscellaneous Operations ..................................................... 63 5.7.3 Specifying Optical Density Limits ........................................................... 64 5.7.4 Entering Laboratory Name and Information ............................................ 65 5.7.5 Specifying Use of Barcode Check Digits and/or Leading Zeros .............. 66 5.7.6 Specifying Creation and Saving of Self-Test Reports ............................. 67 5.7.7 Configure Database Backup .................................................................. 69 5.7.8 Establish LIS Connection ....................................................................... 71
5.8 Establish an E-mail Connection ..................................................................... 73 5.8.1 Specify Automatic E-mail Notification of System Errors .......................... 73 5.8.2 Manually Send an E-mail Message ........................................................ 74
5.9 Enter the Wavelengths of Installed Filters ...................................................... 75 5.10 Import or Export Files .................................................................................. 76
5.10.1 Export an Assay File ............................................................................ 76 5.10.2 Export a Result Data File or the ESP Database ................................... 77 5.10.3 Import an Assay File ............................................................................ 78 5.10.4 Import a Result Data File ..................................................................... 78
5.11 Reset Autorecovery ..................................................................................... 79

Table of Contents
Part No. 91000200 vi © 2019 DYNEX Technologies Inc.
5.12 Error Detection and Error Recovery ............................................................. 80 5.12.1 Recover from an Error .......................................................................... 80 5.12.2 Specify Automatic Recovery from an Error ........................................... 80
5.13 DS2 Toolbox Software ................................................................................. 81 Chapter 6: Assay Editor .............................................................................................. 83
6.1 Start Assay Editor .......................................................................................... 84 6.1.1 Assay Editor Window ............................................................................. 84 6.1.2 File Menu ............................................................................................... 85 6.1.3 Operations Toolbar ................................................................................ 90 6.1.4 Protocol Panel ........................................................................................ 92 6.1.5 Assay Summary ..................................................................................... 93 6.1.6 Animate Button....................................................................................... 94 6.1.7 Trash Can Icon....................................................................................... 95
6.2 Import an Assay ............................................................................................. 95 6.3 Create or Update Assay Information .............................................................. 95 6.4 Define the Well Template ............................................................................... 96
6.4.1 Assign Well Types .................................................................................. 96 6.4.2 Customize Well Types ............................................................................ 98
6.5 Specify a Dispensing Operation ................................................................... 100 6.6 Specify a Pipetting Operation ...................................................................... 101
6.6.1 Pipetting of Undiluted Standards, Controls or Specimens .................... 101 6.6.2 Diluting and then Pipetting Standards, Controls or Specimens ............. 103
6.7 Specify a Verification Operation ................................................................... 109 6.8 Specify an Incubation Operation .................................................................. 112 6.9 Specify a Washing Operation....................................................................... 113 6.10 Specify a Reading Operation ..................................................................... 117
6.10.1 Selection of Wavelength(s) for an Assay ............................................ 119 6.10.2 Use of Blank Wells ............................................................................. 120
6.11 Specify Quality Control Operation .............................................................. 120 6.11.1 Examples of Typical QC Equations .................................................... 122
6.12 Specify Ratio Operation ............................................................................. 123 6.12.1 Specify Results Flagging Conditions .................................................. 124 6.12.2 Report the Results of Ratio Calculations ............................................ 125
6.13 Specify a Threshold Operation ................................................................... 126 6.13.1 Example of a Typical Threshold Equation .......................................... 128
6.14 Specifying a Curve Fit Operation ............................................................... 128 6.14.1 Specify Concentrations of the Standards............................................ 129 6.14.2 Automatic Entry Concentrations of Remaining Standards .................. 130 6.14.3 Specifying the Curve Fitting Equation ................................................. 131 6.14.4 Specifying Graphing Options .............................................................. 134 6.14.5 Specifying Results Flagging Conditions ............................................. 135
6.15 Specifying a Spreadsheet Operation .......................................................... 136 6.15.1 Entering Spreadsheet Calculations Manually ..................................... 136

Table of Contents
© 2019 DYNEX Technologies Inc. vii Part No. 91000200
6.15.2 Entering Calculations by Using an Automatic Difference Mode .......... 137 6.15.3 Specify Results Flagging Conditions .................................................. 138
6.16 Specify the Report Format ......................................................................... 139 6.16.1 Specify Report Layout ........................................................................ 140 6.16.2 Specify Report Format ....................................................................... 141 6.16.3 Background Read Mode Raw Data Report Format ............................ 143 6.16.4 Multi Read Mode Report Format ........................................................ 143 6.16.5 Specify Content of the Report Header and Footer .............................. 143 6.16.6 Specify Results Exporting Options ..................................................... 144
Chapter 7: Operation ................................................................................................ 147 7.1 Workflow ..................................................................................................... 147 7.2 Power the System On .................................................................................. 148 7.3 Performing Daily Maintenance ..................................................................... 150 7.4 Empty the Liquid Waste and Tip Waste Containers ..................................... 150
7.4.1 Empty the Liquid Waste Container ....................................................... 150 7.4.2 Empty the Tip Waste Container ........................................................... 151
7.5 Load Wash Buffers and Cleaning Fluid ........................................................ 151 7.5.1 When to Load Wash Buffers and Cleaning Fluid .................................. 151 7.5.2 Load Wash Buffers and Cleaning Fluid ................................................ 151
7.6 Load Samples ............................................................................................. 152 7.7 Worklist Editor ............................................................................................. 153
7.7.1 Creating a Worklist ............................................................................... 153 7.7.2 Create a Worklist Using LIS-Link ......................................................... 160 7.7.3 Specify Dilution Ratios at Runtime ....................................................... 164 7.7.4 Complete the Worklist and Displaying the Timeline .............................. 165
7.8 Load Remaining Materials and Starting the Run .......................................... 166 7.8.1 Load Samples ...................................................................................... 166 7.8.2 Load Controls, Calibrators and Reagents............................................. 167 7.8.3 Load Plates .......................................................................................... 168 7.8.4 Load Sample Tips, Reagent Tips and Deep Well Strips ....................... 168 7.8.5 Check Cleaning Fluid, Wash Buffer and Waste Containers .................. 169
7.9 Monitor Status of the Run, Consumables and Plate(s) ................................ 169 7.10 Clot Detection During a Run ...................................................................... 171 7.11 Continuous Loading ................................................................................... 171 7.12 Reviewing Results ..................................................................................... 173 7.13 Pause, Abort a Plate or Abort the Worklist ................................................. 174
7.13.1 Pause and Resume Operation of the Instrument................................ 174 7.13.2 Abort a Plate or the Worklist............................................................... 174
7.14 Shut Down the System .............................................................................. 175 Chapter 8: Quality Control ........................................................................................ 177
8.1 Quality Control Procedures Performed Automatically .................................. 177 8.1.1 Self-Testing During Start-up ................................................................. 177 8.1.2 Use of ESP .......................................................................................... 177

Table of Contents
Part No. 91000200 viii © 2019 DYNEX Technologies Inc.
8.1.3 Automatic Testing of Calibrators and/or Controls ................................. 177 8.1.4 Quality Control Equations ..................................................................... 178 8.1.5 Well Fill Verification .............................................................................. 178 8.1.6 Levy-Jennings Plots ............................................................................. 178 8.1.7 Error Detection and Recovery .............................................................. 178
8.2 Quality Control Procedures Performed by the Operator ............................... 178 8.2.1 Testing of Controls ............................................................................... 178 8.2.2 Periodic Verification of the Washer ....................................................... 178
Chapter 9: Reports .................................................................................................... 179 9.1 Assay Reports ............................................................................................. 179 9.2 Other Reports .............................................................................................. 179 9.3 View Report Window ................................................................................... 180 9.4 Retrieving Assay Reports ............................................................................ 181
9.4.1 Displaying the Report for the Current Plate .......................................... 181 9.4.2 Displaying the Report for a Recently Tested Plate ............................... 181 9.4.3 Displaying Reports for Other Plates ..................................................... 181
9.5 Content of Assay Reports ............................................................................ 182 9.5.1 Reporting of Raw Data QC Equations .................................................. 183 9.5.2 Reporting of Raw Data ......................................................................... 183 9.5.3 Reporting of Test Result QC Equations ................................................ 184 9.5.4 Reporting of Test Results ..................................................................... 184 9.5.5 Rounding of Test Results ..................................................................... 185 9.5.6 Scientific Notation Error ........................................................................ 185
9.6 Removing One or More Outliers .................................................................. 186 9.7 Recalculate Results Using a Different Calculation ....................................... 186 9.8 Saving a Standard Curve for Use as a Stored Curve ................................... 187 9.9 Event Logs................................................................................................... 188
9.9.1 Viewing the Event Log for the Current Session .................................... 188 9.9.2 Searching the Event Log for a Phrase .................................................. 189 9.9.3 Viewing an Event Log from a Previous Session ................................... 189
9.10 Creating Levey-Jennings Plots .................................................................. 189 9.10.1 Running the Levey-Jennings Analysis ................................................ 190
9.11 Print Reports .............................................................................................. 191 9.12 Create a PDF Version of an Assay Report or Self-Test Report .................. 191 9.13 Create a Copy of an Assay Report or a Self-Test Report ........................... 192 9.14 Exporting a Report ..................................................................................... 192
Chapter 10: Maintenance .......................................................................................... 193 10.1 General Cleaning and Decontamination .................................................... 193
10.1.1 Check Areas Adjacent to the Instrument ............................................ 194 10.1.2 Clean External Surfaces of the Instrument ......................................... 194 10.1.3 Decontaminate the Instrument ........................................................... 194 10.1.4 Decontaminate the Wash Head .......................................................... 194
10.2 Scheduled Maintenance ............................................................................ 195

Table of Contents
© 2019 DYNEX Technologies Inc. ix Part No. 91000200
10.2.1 Daily Maintenance ............................................................................. 195 10.2.2 Weekly Maintenance .......................................................................... 196 10.2.3 Six-Month Maintenance ..................................................................... 196 10.2.4 Annual Maintenance .......................................................................... 196 10.2.5 Replacement of the Tubing Lines ....................................................... 197 10.2.6 Cleaning the Wash Head Assembly ................................................... 200 10.2.7 Replacing Wavelength Filters ............................................................. 201
10.3 Store the Instrument .................................................................................. 202 10.4 Return Items to the Factory ....................................................................... 202
Chapter 11: Warranty ................................................................................................ 205 11.1 Warranty and Special Provisions ............................................................... 205
Chapter 12: Troubleshooting ................................................................................... 207 12.1 Assay and Database Errors ....................................................................... 207 12.2 Cleaning and Decontamination .................................................................. 207 12.3 Disposable Tip Loading ............................................................................. 207 12.4 Environmental ........................................................................................... 207 12.5 Human Factors .......................................................................................... 208 12.6 Inputs and Outputs .................................................................................... 210 12.7 Installing the Instrument ............................................................................. 210 12.8 Plate Washing Errors ................................................................................. 210 12.9 Pipetting and Liquid Level Detection Errors ............................................... 213 12.10 Plate Carrier Errors .................................................................................. 214 12.11 Processing the Kit .................................................................................... 214 12.12 Reader Errors .......................................................................................... 214 12.13 Running an Assay ................................................................................... 216 12.14 Sample IDs .............................................................................................. 216 12.15 Sample Pipetting ..................................................................................... 216 12.16 Sample Tips Error .................................................................................... 216 12.17 Software .................................................................................................. 217 12.18 Transport ................................................................................................. 217 12.19 Unpacking the Instrument ........................................................................ 217 12.20 Usability ................................................................................................... 217 12.21 User Accesses Windows Home Screen ................................................... 218 12.22 User Interface .......................................................................................... 218 12.23 Vacuum Sensor Errors ............................................................................ 218 12.24 Wash Head Assembly Errors ................................................................... 218 12.25 Washing .................................................................................................. 219 12.26 Files Used for Troubleshooting ................................................................ 219
12.26.1 Self-Test Report Files ...................................................................... 219 12.26.2 DS-Matrix Assay Files ...................................................................... 220 12.26.3 DS-Matrix Report Files ..................................................................... 220 12.26.4 DS-Matrix Database Files ................................................................ 220 12.26.5 Event Logs ....................................................................................... 222

Table of Contents
Part No. 91000200 x © 2019 DYNEX Technologies Inc.
12.26.6 Debug Log Files ............................................................................... 225 Chapter 13: Create Database Records ..................................................................... 227
13.1 Create a Database Record for a New Fluid ................................................ 227 13.2 Create a Database Record for a New Tube ............................................... 228
13.2.1 Create the Database Record .............................................................. 228 13.3 Create a Database Record for a New Plate ............................................... 230 13.4 Perform an ESP Calibration ....................................................................... 234 13.5 Creating a Stored Curve Fit Assay ............................................................. 236
13.5.1 Creating a New Stored Curve Fit Assay ............................................. 236 13.5.2 Editing a Curve Fit Assay to Create a New Stored Fit Assay .............. 238
13.6 Importing a Standard Curve for a Stored Fit Assay .................................... 238 13.6.1 Creating and Running a Worklist with a Stored Fit Assay ................... 238
13.7 Components of an Equation....................................................................... 239 13.7.1 Assay Results, Arithmetic Operators, Brackets and Numbers ............ 239 13.7.2 Functions ........................................................................................... 240
Chapter 14: Multiple Tubes per Sample Feature ..................................................... 243 14.1 Creating a Spreadsheet Assay with Multiple Tubes per Sample ................ 243 14.2 Creating a Worklist with Multiple Tubes per Sample .................................. 247 14.3 Reporting of Multiple Tubes per Sample Results ....................................... 248 14.4 Sending Multiple Tubes per Sample Results to the LIS.............................. 248
Chapter 15: Arm Calibration Procedure .................................................................. 249 15.1 Arm Calibration Instructions ....................................................................... 249 15.2 How the Calibration Screen Works ............................................................ 251
15.2.1 Consumable Rack Positions............................................................... 252 15.2.2 Reader Cover Positions ..................................................................... 253 15.2.3 Sample Tip Rack Positions ................................................................ 254 15.2.4 Reagent Tip Rack Positions ............................................................... 255 15.2.5 Barcode Reader Positions .................................................................. 256 15.2.6 Tip Waste Hole Position ..................................................................... 258 15.2.7 Washer Pickup Positions .................................................................... 259 15.2.8 Washer with Microtiter Plate Positions ............................................... 261 15.2.9 Install the Pipette Calibration Tool ...................................................... 263 15.2.10 Plate Carrier Positions ...................................................................... 265 15.2.11 Sample Rack Positions .................................................................... 266 15.2.12 Reagents Rack Positions ................................................................. 267 15.2.13 Control Rack Positions ..................................................................... 268
Appendix A: Acronyms ............................................................................................. 273 Appendix B: OD Calculation for Multiple Read Operation Assays ........................ 277 Appendix C: Packing and Unpacking Instructions ................................................. 281

Chapter 1: Safety Information
© 2019 DYNEX Technologies Inc. 1 Part No. 91000200
Chapter 1: Safety Information This chapter describes the text conventions and symbols that are used in this manual. It provides important safety information that must be read and understood before operating the DS2 instrument:
Safety icons and messages that are in this manual Warning labels that are on the DS2 instrument Safety precautions that must be followed when operating the DS2 instrument Instructions for disposal of the instrument.
1.1 Intended Use DS2 is an analyzer with open functionality for processing chemical assays.
It is the customer’s sole responsibility to determine the DS2 system’s suitability for a particular application, including any clinical application.
DYNEX makes no representations, warranties or performance claims with respect to the performance of DS2 for any specific application, including clinical application or for the use of the DS2 system with any reagents, assays or other products.
The customer is responsible for validating the system for its intended use.
1.2 Use of the Operator Manual Before using the DS2 instrument, it is essential that the contents of this Operator Manual and any labels on the instrument or its packaging are read and understood by the operator.
Always keep this Operator Manual near the instrument for easy access to operating instructions and safety information.

Chapter 1: Safety Information
Part No. 91000200 2 © 2019 DYNEX Technologies Inc.
1.3 Text Conventions Used in this Manual To convey information readily and consistently, certain text conventions are used throughout this manual (Table 1).
Table 1: Text Conventions Used in this Manual
Text Convention Purpose
Numbered Lists
Numbered procedures that should be implemented in order during an operation:
1. Open the fluidics compartment door. 2. Remove the liquid waste container.
Bold Type
Designating a term that is being described or navigation path:
Single - using one test wavelength
Dual - using one reference wavelength and one test wavelength
C:\Program Files\DYNEX Technologies\DS-Matrix
Designating the name of an operation button:
Click Save to save the information that was entered.
Italics
Designating another Chapter of this manual that should be consulted or designating the name of a screen:
Refer to the Installation Chapter for additional information.
Designating the name of a screen or a field on a screen:
The sample tubes on that rack are shown on the Confirm Scan screen.
If the Wash Buffer List is blank, sufficient wash buffers to perform the worklist are already loaded.
Screenshots
Screen representations shown in this publication are for illustrative purposes only. The screens are not necessarily exact representations of the latest software release.
DYNEX Used to represent DYNEX Technologies Inc.

Chapter 1: Safety Information
© 2019 DYNEX Technologies Inc. 3 Part No. 91000200
1.4 Symbols Used in this Manual Certain symbol ls are used in this manual to provide a ready visual reference. These symbols are as follows:
Table 2: Symbols Used in the Manual Symbol Description
Warning: Indicates a potential hazardous situation which if not avoided can result in death or serious personal injury.
Warning: Indicates a potential hazardous situation which if not avoided can result in death or serious personal injury due to exposure to biohazardous material.
Caution: Indicates a possible hazardous situation which if not avoided can result in minor or moderate personal injury.
Information: Indicates a possible hazardous situation which if not avoided can result in damage to the system.
Note: Provides background or incidental information concerning the current topic or procedure.
Complies with relevant EU directives regarding safety, health and environmental protection.
1.5 Labels on the Instrument
1.5.1 Instrument Serial Number Label Symbols that are included on the serial number label are described in Table 3.
Table 3: Symbols on Serial Number Labels Symbol Description
Manufacturer of the instrument.
Complies with relevant EU directives regarding safety, health and environmental protection.
In-Vitro Diagnostic.
Australian Electromagnetic Compatibility (EMC) Regulatory compliance mark.
Product has been independently tested by Intertek and meets the applicable published standard in USA and Canada.

Chapter 1: Safety Information
Part No. 91000200 4 © 2019 DYNEX Technologies Inc.
1.5.2 Warning Labels The DS2 instrument has labels attached that provide information and/or warn the user of a hazard. Potential personal injury to the operator can result if instructions on warning labels are not followed.
Warning labels that are on the instrument are listed below. Familiarize yourself with each label and what it means.
Table 4: Warning Labels and Descriptions Label Description
Laser radiation: Do not stare into the beam.
Warning: Biohazard.
Warning: Hot surface.
Warning: Indicates a potential hazard, obstacle or condition requiring special attention
Warning: Risk of electric shock.
Warning: Risk of piercing from pipette tip
1.5.3 Instrument Disposal Label A label adjacent to the serial number label provides information regarding disposal of the instrument (Table 5).
Table 5: Instrument Disposal Symbol and Description
Symbol Description
Do not dispose of the instrument. Contact DYNEX for disposal instructions.

Chapter 1: Safety Information
© 2019 DYNEX Technologies Inc. 5 Part No. 91000200
1.6 General Precautions The following general precautions will aid in the safe and efficient use of the DS2 instrument.
The instrument must be positioned so that it can be readily disconnected from the power supply.
Ethyl alcohol, 70% isopropyl alcohol or laboratory disinfectants containing quaternary ammonium sulfates are approved for use to clean and disinfect the DS2 instrument.
Important: Do not use cleaning agents or decontaminating agents that could cause a hazard as a result of reaction with parts of the equipment or with the material contained in it. Contact your DYNEX representative if there is any doubt about the compatibility of a cleaning or disinfecting agent with the DS2 instrument.
All parts, accessories and consumables for the DS2 instrument are required to be supplied only by DYNEX or its approved partners. The use of non-approved parts will affect the instrument warranty and will adversely affect performance.
This equipment has been designed and tested International Special Committee on Radio Interference (CISPR) 11 Class A. Use of the equipment in a domestic environment may cause radio interference and measures to mitigate the interference may be required.
Appropriate precautions must be taken when working with biohazardous material. Technicians must be trained in the safe handling and cleanup of potential blood borne pathogens. Universal precautions, appropriate hygiene and decontamination of surfaces are recommended.
Do not touch the instrument work area while the cover for the DS2 instrument is open unless the instrument instructs you to input materials or to intervene.
Attend to error messages when the system prompts and stops. These messages indicate a need for user action.
When loading sample tubes into a sample rack, press the tubes down into the sample rack to prevent the pipette module from being obstructed.
Periodic backup of assay and data files is recommended. The files should either be copied to a flash drive for transfer to storage or archived on a secure server.
The DS2 instrument is designed to scan sample tube barcode labels in accordance with Clinical and Laboratory Standards Institute (CLSI) AUTO 12-A, which specifies the quality, position and orientation of the barcode labels.
Important: Use of high-quality barcode labels is critical for obtaining consistent results when scanning. The use of non-standard barcodes or barcodes with poor print quality must be avoided.
Barcode labels must be applied vertically on the sample tubes. Sample tubes must be placed in the sample rack so that the barcode label faces out of the opening in the sample rack. Refer to Chapter 4.2.9 for additional information.
Appropriate personal safety precautions must be made when opening and closing the doors to the system cover. When a door is opened and the run has started, do not encroach upon the work area unless prompted by the software for user input of materials or manual intervention.

Chapter 1: Safety Information
Part No. 91000200 6 © 2019 DYNEX Technologies Inc.
Use of this instrument in a dry environment (especially if synthetic materials such as synthetic clothing or carpets, etc. are present) may cause damaging static discharges that may cause erroneous results.
It is the user's responsibility to ensure that a compatible electromagnetic environment for the equipment can be maintained in order that the device will perform as intended. The electromagnetic environment should be evaluated prior to operation of the DS2 instrument.
Do not use this instrument in close proximity to sources of strong electromagnetic radiation (e.g., unshielded intentional Radio Frequency [RF] sources) as these may interfere with proper operation.
If the DS2 instrument is used in an unspecified manner, the protection provided by the equipment may be impaired.
1.7 Safety Precautions The following safety precautions must be followed when using the DS2 instrument.
1.7.1 Biohazard Precautions Table 6: Biohazard Precautions
Icon Description
Warning: If biological specimens are being tested, the specimens and used sample tips are potentially infectious. Use universal precautions in the handling of specimens and used sample tips in accordance with local regulations.
Warning: If biological specimens are being tested, the liquid waste is potentially infectious. Use universal precautions in the handling of liquid waste in accordance with local regulations.
Warning: While the DS2 alone does not present a biohazard, biological samples that are used and all parts and consumables in contact with the samples must be considered biohazardous.
Appropriate precautions must be taken when working with biohazards. Technicians must be trained in the safe handling and clean-up of potential blood borne pathogens. Universal precautions, appropriate hygiene and decontamination of surfaces are recommended.
Warning: Never remove the cap of the liquid waste container cap while the container is in the instrument. Always remove the container first, stand it upright on the bench with the cap pointed up, then remove the cap.

Chapter 1: Safety Information
© 2019 DYNEX Technologies Inc. 7 Part No. 91000200
1.7.2 Electrical Power Precautions
Icon Description
Warning: DS2 must be connected to a properly grounded electrical outlet. Obtain assistance from a qualified electrician to verify that your electrical outlet is properly grounded.
Warning: Always disconnect the power to the DS2 instrument before performing maintenance.
Caution: Power is on to the system whenever the blue indicator on the power switch is illuminated.
Caution: Only the power cord supplied with the DS2 instrument can be used.
1.7.3 Laser Scanner Precautions
Icon Description
Warning: Class 2 Laser International Electro technical Commission (IEC)/EN 60825-1:2016 Do not stare into the beam Maximum output 1.0 mill watt (mW) Wavelength 650 nanometers (nm)
Caution: The DS2 contains a barcode scanner, which is a source of radiation. Do not tamper with the barcode scanner. Only DYNEX-trained personnel are permitted to remove the barcode scanner.
A warning label is attached to the system in the vicinity of the barcode scanner to alert you of the barcode scanner beam.
1.7.4 Instrument Movement Precautions Warning: Be cognizant of placing your hand into the area of the moving pipettor. The instrument should be run with the cover closed.
Periodically inspect the retaining springs in each sample rack to ensure that samples tubes are properly aligned. Replace the springs if needed.
Check the gas spring by closing the cover of the instrument and then lifting the cover approximately eight inches. If the cover stays open or closes slowly, the gas spring is acceptable. If the cover falls down rapidly, the gas spring must be replaced.
Place the sample racks securely into the system. Push the rack firmly towards the back of the system so that the rack clicks in place.

Chapter 1: Safety Information
Part No. 91000200 8 © 2019 DYNEX Technologies Inc.
This page intentionally left blank.

Chapter 2: Overview
© 2019 DYNEX Technologies Inc. 9 Part No. 91000200
Chapter 2: Overview The DS2 Enzyme-Linked Immunosorbent Assay (ELISA) processing system is an open system for performing a broad range of automated ELISA assays.
To run an assay, the operator performs the following:
Loads the samples Creates a worklist indicating the assay(s) to be run on each sample Verifies that a sufficient quantity of consumables Reagents and wash fluid are loaded Loads the plate(s) Starts the run.
Additional worklists can be prepared and started during operation, allowing continuous operation.
The DS2 instrument is intended to be used for automating assay steps. This open system is designed to be used in clinical, research, veterinary and life science laboratories.
Figure 1: DS2 Instrument

Chapter 2: Overview
Part No. 91000200 10 © 2019 DYNEX Technologies Inc.
2.1 Assays Each operation that is performed for an assay is specified in an assay file that is loaded on the DS2 instrument PC. Assay files can be composed using the Assay Editor included with DS-Matrix software that is provided with the DS2 instrument. An assay file can be created to either match the package insert from a test kit manufacturer or to support a user-defined assay.
Each assay file is specific for a particular test and controls pipetting of samples, dispensing of reagents, incubation of the plate, washing of wells and reading of wells as well as calculation, exporting and reporting of results.
Important: Validation studies must be performed by your facility to assure proper performance of an assay.
2.2 Principles of Operation
2.2.1 Samples Patient samples are prepared for analysis by the operator and then placed in typical laboratory sample tubes. Up to 100 patient samples can be physically loaded on the instrument at one time. Sample identifications can be automatically read from a barcode label on each sample tube, manually entered by the operator or automatically assigned by the software.
If more than 100 samples are to be tested, subsequent worklists can be created and the samples and other material can be continuously loaded when prompted while the first worklist is still being run.
2.2.2 Assay Test Kit Assay test kits to run the assay are not provided by DYNEX.
2.2.3 Reagents Test reagents need to be transferred by the operator into either 25 milliliters (mL) reagent tubes or 15 mL reagent tubes.
Each filled reagent tube is then loaded by the operator into the position specified by the system after the worklist is scheduled.
Up to eight 25 mL reagent tubes and ten 15 mL reagent tubes can be loaded at one time.
Important: The fluids - reagents, calibrators and controls - that are used in an assay are specified by the user during assay definition (Chapter 6.5). Before a fluid can be specified for an assay, a record for that fluid must exist in the database.
2.2.4 Calibrators and/or Controls Calibrators and/or controls are transferred by the operator into 2 mL control vials. Each filled control vial is then loaded by the operator into the position specified by the system after the worklist is scheduled. Up to 24 control vials can be loaded at one time.

Chapter 2: Overview
© 2019 DYNEX Technologies Inc. 11 Part No. 91000200
2.2.5 Pipetting Pipetting module use disposable sample tips to pipette from (10 to 250 microliter [µL]) of a sample, standard or control into a single well. For fluid aspiration it always loads the tip with extra fluid, then returns some to the fluid source. This is to prevent dripping. The return volume is 50 uL.
Note: The sample tips (part number [PN] 65910) and reagent tips (PN 65920) are defined as accessories as only the DYNEX tips have been found to meet the stated precision and accuracy specifications. Use of unauthorized third-party pipette tips will affect the performance of the DS2 system. The DYNEX tips are CE Marked.
Note: For the multi-shot upper limit of 100 µL, if you subtract the 50 µL return volume you get the 250 µL single shot limit shown below.
For multi-shot you aspirate a large volume then dispense smaller volumes into multiple fluid destinations.
Dispense 1 = 250 – 100 = 150. Dispense 2 = 150 – 100 = 50. Have to reload after dispense 2.
When it dispenses it never fully drains the tip, there is a bit extra left in the tip that gets returned to the fluid source.
Alternately, up to 300 µL of a sample, standard or control can be aspirated and smaller equal-volume aliquots then dispensed into each of several replicate wells using the multi-shot mode (Chapter 6.6).
Pipetting module use disposable reagent tips to pipette from 20 to 1000 µL of reagents.
Caution: The use of micro sample tubes placed inside of sample tubes to reduce sample volume is not supported by DYNEX. This practice will potentially lead to erroneous results
2.2.5.1 Incubation The DS2 instrument can incubate plates at ambient temperature (the instrument will maintain at < 4° Celsius [C] above room temperature) or at elevated temperatures up to 40° C.
Important: If needed, the instrument can incubate plates at temperatures up to 40° C, but at reduced accuracy and precision of incubation temperature.
Incubation can be specified for times ranging from one minute to just under 24 hours (23 hours, 59 minutes and 59 seconds), with or without shaking. The incubation time, incubation temperature, shake duration and shake intensity are specified in the parameters in the assay file.
A blank can be specified to normalize the transmission to 100%, transmission. corresponding to an OD of zero. The blank can be an empty well. The blank can be an empty well; air is used for 100% transmission readings. If more than one blank wells are specified, the average optical density of the blank wells is subtracted from each of the other wells on the plate.

Chapter 2: Overview
Part No. 91000200 12 © 2019 DYNEX Technologies Inc.
Readings can be obtained at a single wavelength (the primary test wavelength at or near the maximum absorbance of the reaction product) or at two wavelengths if a reference wavelength outside the maximum absorbance band is also specified in the assay file. If readings are made at two wavelengths, the difference between the two readings is used since this can be done to reduce the impact of artifacts in the plates as light tends to scatter equally regardless to wavelength.
The time when wells are read, the wavelength(s) used, identify blank wells and use of shaking are specified in the assay file (Chapter 6.10).
2.2.6 Washing All eight wells in a single column of a test plate are washed simultaneously by a multi-pin wash head (Chapter 4.2.2). A dispensing pump and pinch valves control delivery of wash solution to the wash head. Either a single wash solution or two different wash solutions can be loaded into the two two-liter wash bottles in the lower compartment of the instrument. After wash fluid is dispensed into the wells, the wash head aspirates fluid from the wells by means of a vacuum pump connected to the liquid waste container. The wash head permanently aspirates when the vacuum pump is turned on and aspiration of the wells is performed by the head being placed within or above the wells
One of three sweep modes (none, sweep and super sweep) can be specified for aspirating fluid from the wells during washing.
The wash solutions and volumes that are dispensed, number of wash cycles and sweep mode are specified in the assay file.
2.2.7 Reading of Optical Density The reader module contains a lamp and up to six wavelength filters. Light from the lamp passes through an optical wavelength filter and is then directed to the well by optical fibers. A detector senses the transmission of light through the well and the light transmitted through the well/sample is read. These values are converted to Optical Density (OD) by the system software.
All twelve wells in a single row on a plate are read simultaneously.
2.2.8 Scheduling and Execution of a Worklist A worklist consists of the samples and the tests that are to be performed on the samples. The system automatically performs the operations that are needed for executing the worklist in the manner and order specified for each operation in the assay file.
A worklist can be created manually or by the Laboratory Information System (LIS) for your facility. Optional LIS-Link software must be installed and configured in order to use the LIS to create worklists.
Before executing the worklist, the system software analyzes the worklist and parameters that are specified in the assay files and then develops a schedule for assay operations that results in maximum system efficiency and throughput. The instrument will direct the user to place all the needed reagents and consumable on the instrument. When scheduling of the worklist is completed, the schedule of assay operations is displayed with a timeline depiction and execution of the worklist commences.

Chapter 2: Overview
© 2019 DYNEX Technologies Inc. 13 Part No. 91000200
The DS2 instrument allows for continuous sample loading and analysis, replacement of reagents and consumables and the disposal of waste materials. When needed, the system will prompt the operator to perform an operation such as replenishing a consumable or emptying the waste container.
2.3 Materials Provided The following materials are provided with the DS2 instrument.
Table 7: Materials Provided with the DS2 Instrument Item Quantity DYNEX PN
8-Way Wash Head Assembly 1 13500100 Calibration Collar 1 DS2FIX029 Calibration Too 1 DS2FIX017 CD containing DS2 Operator Manual 1 92000040 Cleaning Wire, 0.018" (dispense) 2 352101800 Cleaning Wire, 0.040" (aspirate) 2 352104000 Compact Disk (CD) Containing DS-Matrix Software Setup 1 62800-115$$ Control Vials (Pack of 33) 1 65940 Customer Installation Report 1 N/A Declaration of Conformity 1 N/A Deep Well Strips (sample pack: 12 strips) (Standard for PN 62910: 250 strips)
1 62910 (partial)
Dongle, Sentinel HL MAX Micro Driverless 1 509000250 DS2 Automated Instrument 1 13500010 DS2 Calibration Plate 1 DSFIX044 DS2 Operator Manual 1 91000200 DS2 Toolbox CD 1 62820-03$$ Elbow Fitting 1 43000491 Hex key, 2 mm 1 42000810 Hex Key, 2.5 mm 1 42000070 Hex Key, 4 mm 1 42000830 Instrument Configuration Report Check List 1 N/A Liquid Waste Container 1 13500430 O-ring Lubricant, Silicone, ½ ounce (oz.) package 1 47000030 Power Cord (dependent upon order request configuration)
1 N/A
Purge Tray, Wash Calibration 5 394000100 Purge Tray, Wash Head 1 24900081 Reagent Rack 2 24900065 Reagent Tips (one rack of 108) (Standard for Part No.65921: Four Racks)
1 65921 or 65920 (partial)*
Reagent Tubes, 15 mL (pack of 10) 1 62930 Reagent Tubes, 25 mL (pack of 10) 1 62920 Sample Rack 5 13500501 Sample Tips (four racks of 108) 1 65910 Tip Waste Container 1 13500770 Transit Bracket 1 22500810 Tubing, 3 mm x 5 mm 1 meter 816400700 Universal Serial Bus (USB) cable 2 50600167 Warranty Card 1 N/A Wash Buffer Container 2 13500560
* These PNs have equivalent function. Either may be used and packed at the discretion of DYNEX. $$ The numbers after the hyphen may change depending on the current version

Chapter 2: Overview
Part No. 91000200 14 © 2019 DYNEX Technologies Inc.
2.3.1 Materials Required but Not Provided The following materials are required but are not provided with the DS2 instrument.
Assay kits Detergent 70% alcohol and a detergent bottle Keyboard Monitor Mouse Personal Computer (PC) Plate test strip holder Printer Sample tubes and sample tube labels Wash head cleaning fluid container.
Important: A UPS is not required for operation of the system. The use of a UPS is recommended. It can be purchased from DYNEX.
2.3.2 Consumables and Other Accessories
DYNEX certified consumables are specially designed and produced for DYNEX instruments, ensuring proper fit with superior accuracy, performance and continued warranty compliance. Consumables and Other Accessories
Consumables Quantity PN Deep Well Dilution Strips 250/box 62910 Reagent tubes, 25 mL 10/pack 62920 Reagent tubes, 25 mL 24/pack 65950 Reagent tubes, 15 mL 10/pack 62930 Reagent tips 432/box 65920 Sample tips 432/box 65910 Control vials with caps 33/pack 65940
2.4 Specifications Specifications are listed below for the DS2 instrument are listed below:
2.4.1 Instrument Dimensions Dimension Metric Imperial
Width 540 mm 21.3 inches (in) Depth 680 mm 26.8 in
Height – cover closed 660 mm 26.0 in
Height – cover open 1100 mm 43.3 in Weight 48 kilograms (kg) 106.0 pounds (lbs) Shipping Weight 78 kg 170 lbs Noise 77.6 dBA

Chapter 2: Overview
© 2019 DYNEX Technologies Inc. 15 Part No. 91000200
2.4.2 Power Requirements Unit Voltage
Voltage 100-240 volt (V) auto -switching Frequency 50/60 hertz (Hz) Power Consumption ≤ 360 Volt-Ampere (VA)
2.4.3 Reader Specifications Type of Measurement Measurement
Dynamic Range 0.10 to 3.00 OD
Spectral Range 405 nm to 690 nm Based on filters installed
Precision <1% Coefficient of Variation (CV) (<2.00 OD) <2% CV (2.00-3.00 OD)
Accuracy ± 0.005 OD or 2.5% (whichever is greatest) Read Time <30 second (sec) (single wavelength)
2.4.4 Washer Specifications Type Measurement
Manifold Configuration 8-way Dispense Volume Range 50 to 1000 µL Wash Buffers capacity 2 x 2 liters (L) Input connector for external clean fluid bottle provided
Clean fluid bottle (any size) must be provided
Waste Container capacity 1 x 1.5 L Residual Wash Volume <3 µL with super sweep
2.4.5 Incubator Specifications Component Measurement
Temperature Range Ambient plus 4° C up to 40° C Temperature Accuracy ± 1° C at 37° C
Shaking Independent linear motion 14-20 Hz periodic or continuous

Chapter 2: Overview
Part No. 91000200 16 © 2019 DYNEX Technologies Inc.
2.4.6 Instrument Capacity Specifications Amount
Assays/Run 12
Controls and/or Standards 24 x 2 mL tubes (when using the DYNEX workspace)
Dilution Deep Wells 96 Plates 2 Reagent Tips 20
Reagents 10 x 15 mL tubes and 8 x 25 mL tubes (when using the DYNEX workspace)
Sample Tips 216
Sample Tube Dimensions 10 to 16 mm external diameter 40 to 100 mm height
Sample Tubes 100 (5 racks of 20)
2.4.7 Sample Pipetting Specifications Pipetting Specifications Measurement
Sample Tip Size 300 µL Single-shot Sample Pipetting Volume 10 to 250 µL
Single-shot Dispense Precision <3% Coefficient of Variation (CV) (10 to 250 µL)
2.4.8 Reagent Pipetting Specifications Unit Measurement
Reagent Tip Size 1300 µL Reagent Pipetting Volume 20 to 1000 µL
Single Shot Dispense Precision <3% CV (20 to 1000 µL)
2.4.9 Process Security
Item Option Liquid-level sensing Yes (reagents, controls and samples) Level-sensor system Pressure differential Clot detection Yes Dispense-anomaly detection Yes Tip detection Yes Well-fill verification Yes Alarms Yes

Chapter 2: Overview
© 2019 DYNEX Technologies Inc. 17 Part No. 91000200
2.4.10 Sample Pipetting Specifications
Specification Amount Type Disposable tips (2 types) Sample tip range Tip type 300 µL (10-250 µL dispense range) Reagent tip range Tip type 12000 µL (20-1000 µL dispense range) Maximum dilution 1:39600 Serial dilutions Yes Replicates Up to 96 samples (standards and controls)
Precision, sample tip <3%CV at any operating volume above 10 µL (single shot mode)
Precision, reagent tip <3%CV at any operating volume above 20 µL (single shot mode)
Note: Typical pipetting time is an average. For any given system the result may vary, either shorter or longer than 15 minutes.
2.4.11 Assays
Specification Type
Additional Data Analysis
Curve fit Quality Control (QC) equations Ratio Spreadsheet Threshold
Blanking
Air o Individual o Paired o Average wells
Whole plate or last plate o Row o Column
Each well on the plate Flexible Template Up to eight different well types
Standard Curves
Akima Cubic Linear Polygon Quadratic Quartic Sigmoid Spline
Wavelength Modes Single Dual

Chapter 2: Overview
Part No. 91000200 18 © 2019 DYNEX Technologies Inc.
2.4.12 Environmental
Type Ranges
Operating Range
17° C to 27° C 63˚ F to 81˚ F 15% to 85% relative humidity (non-condensing) 0 to 2000 meters Altitude 0 to 1.24 miles Altitude
2.4.13 LIMS Connection
Item Options
Baud Rate 19200 Character format
Character Format 7 data bits 1 stop bit No parity
Ports USB
2.4.14 Regulatory Compliance Refer to the Declaration of Conformity for a list of regulatory documentation.

Chapter 3: Installation
© 2019 DYNEX Technologies Inc. 19 Part No. 91000200
Chapter 3: Installation The DYNEX DS2 instrument will be installed by DYNEX factory trained and authorized technicians. The instrument will then be tested to verify the installation and ensure that the instrument is operating properly.
Caution: The DYNEX DS2 instrument must be connected to a properly grounded electrical outlet. Obtain assistance from a qualified electrician to verify that your electrical outlet is properly grounded.
Do NOT use this device in close proximity to sources of strong electromagnetic radiation (e.g. unshielded intentional RF sources), as these can interfere with proper operation.”
Note: Depending upon local electrical codes and electrical service quality, an optional uninterruptible power supply (UPS) may be required in your laboratory. The use of a UPS is optional but strongly recommended. A UPS can be purchased either from DYNEX or an electronics supply house.
3.1 Handling or Shipping the Instrument
While DS2 alone does not present a biohazard, biological samples that are used and all parts and consumables in contact with the samples must be considered biohazardous.
Appropriate precautions must be taken when working with biohazards. Technicians must be trained in the safe handling and clean-up of potential blood borne pathogens. Universal precautions, appropriate hygiene and decontamination of surfaces are required.
If the instrument must be shipped, contact DYNEX Technical Support.
Figure 2: Biohazard Symbol
3.2 Placement of the Instrument The DS2 instrument must be positioned on a sturdy and level laboratory bench that is not subjected to movement or vibration. The instrument must be located so that it can be readily disconnected from the power supply.
Important: Do not locate the instrument where it may be subjected to direct sunlight or strong internal lighting, as this may interfere with tip sensing and barcode reading while the cover is open during loading of consumables and samples.

Chapter 3: Installation
Part No. 91000200 20 © 2019 DYNEX Technologies Inc.
The DS2 instrument requires bench space that is approximately:
54 centimeters (cm) (21.3 in) wide 75 cm (29.5 in) deep 110 cm (43.3 in) high.
There must be at least 25 cm (9.75 in) clearance at the rear of the instrument.
The bench must be able to support the weight of the instrument (48 kg, 106 lbs) plus accessories and other materials. Additional bench space may be needed at the rear of the instrument for the wash head cleaning fluid container (provided by your facility) and the optional external waste container.
Caution: The DS2 instrument is heavy. Two people are needed when lifting the DS2 instrument.
Additional bench space is needed next to the DS2 instrument for the PC, monitor, keyboard, mouse and printer that will be connected to the instrument:
54 cm (21.3 in) wide 75 cm (29.5 in) deep 110 cm (43.3 in) high.
3.2.1 Operating Environment DS2 can be operated at temperatures ranging from 17° C to 27° C (63° F to 81° F), relative humidity of 15 to 85% (non-condensing) and at an altitude of less than 2000 meters (6,500 feet [ft]).
Important: If possible, avoid locating the DS2 instrument in a dry environment where synthetic materials such as synthetic clothing or carpets
may cause damaging static discharges that may cause erroneous results.
3.2.2 Storage Environment If DS2 will not be used for an extended period of time, it can be stored at:
Temperatures ranging from -10° C to 70° C (14°F to 158°F) Relative humidity of 5 to 95% (non-condensing) Altitude of less than 10000 meters (32,800 ft).
3.3 Connect a PC to the Instrument The user interface to the DS2 instrument is provided by DYNEX DS-Matrix software running on a PC.
The PC and its keyboard, mouse, monitor and printer are not provided. They must be obtained and connected to the instrument at your facility.

Chapter 3: Installation
© 2019 DYNEX Technologies Inc. 21 Part No. 91000200
3.3.1 PC Requirements – Windows 7 Minimum PC requirements:
Intel® Core™/Core2 0153/Pentium®/Celeron® family (or compatible processor) recommended
1.8 gigahertz (GHz) minimum processor clock speed required (2 GHz or higher processor clock speed recommended)
10 gigabyte (GB) or larger hard drive with at least 100 megabyte (MB) of free space Microsoft® Windows® 7 Professional operating system (OS) (32- or 64-bit) Super Video Graphics Array (SVGA) compatible display adapter (card or built into
motherboard) with 24-bit (true-color setting) or more colors at 1024 x 768 or more resolution
o Display properties should be set to a desktop area of at least 600 x 800 pixels and a color palette of at least 256 colors
Microsoft Windows compatible sound card 4 GB of Random Access Memory (RAM) One unused USB port
o Connecting the PC to the to the DS2 instrument One unused RS232 serial port
o Required for connecting the computer to the DS2 instrument Mouse or other pointing device supported by Windows Microsoft Windows compatible Compact Disk-Read Only Memory (CD-ROM) or
Digital Video Disk (DVD) drive Microsoft Windows compatible printer
o Color recommended Network/Local Area Network (LAN) connection, 10/100 network interface (optional). Serial port, optional for LIS interfacing.
3.3.2 PC Requirements – Windows 10 (Professional Version) Minimum PC requirements:
1 GHz or faster processor or system-on-a-chip (SoC)10 GB hard disk with at least 100 MB of free space
16 GB for 32-bit OS or 20 GB for 64-bit OS hard drive disk space 2 GB for 32-bit or 4 GB for 64-bit RAM Printer that is supported by Microsoft Windows can be used Compatible sound card DirectX 9 or later with Windows Display Driver Model (WDDM) 10 driver graphics
card o Display properties should be set to a desktop area of at least 600 x 800 pixels
and a color palette of at least 256 colors RS-232 serial port or a USB RS-232 adapter cable
o Required, for connection to LIS-Link

Chapter 3: Installation
Part No. 91000200 22 © 2019 DYNEX Technologies Inc.
Microsoft Windows 10 (32-bit or 64-bit) OS Mouse or other pointing device supported by Microsoft Windows One unused USB port
o Required for connecting the PC to the DS2 instrument.
Note: Windows XP is no longer a supported OS platform for DS-Matrix (1.40 or greater).
3.3.3 Connect the PC to DS2 DS2 is connected to the PC by means of a USB cable. Ensure that the following items are ready to be attached to the DYNEX DS2 instrument:
PC Keyboard Monitor Mouse Printer Printer cables.
1. Use one of the USB cables provided with the instrument to plug into the USB port at the rear of the instrument and the other end into the PC USB port.
Important: Use one of the two USB cables that were provided with the DS2 instrument. Use of a different USB cable is not supported
2. Connect the PC, monitor and printer to a suitable power source, using the power cords (and any power adaptors) that were provided with the equipment.
Important: Refer to the instructions accompanying the PC, monitor and printer for instructions and precautions regarding the power source for these devices.
Figure 3: Location of the USB Port and Power Connector
USB port
Power connector

Chapter 3: Installation
© 2019 DYNEX Technologies Inc. 23 Part No. 91000200
3.4 Connect the Instrument to a Power Source Caution: Only the supplied power cord can be used with DS2.
Warning: DS2 must be connected to a properly grounded electrical outlet. Obtain assistance from a qualified electrician to verify that your electrical outlet is properly grounded.
Note: Depending upon local electrical codes and electrical service quality, an optional UPS may be required in your laboratory. The use of a UPS is optional but strongly recommended. A UPS can be purchased either from DYNEX or an electronics supply house.
1. Verify that the PC has been connected to DS2 as described on Chapter 3.3.3.
2. Using the power cord provided with DS2.
3. Plug the power cord into the power connector at the rear of the instrument.
4. Connect the other end of the power cord to the laboratory electrical supply outlet or UPS.
3.5 Install DS-Matrix Software If a previous version of DS-Matrix software has been installed and an upgrade is desired, uninstall the previous version using the Windows control panel before installing the later version.
Caution: DYNEX recommends using the latest version of the DYNEX DS-Matrix software
Caution: DYNEX recommends. Software updates are made to correct software bugs and to introduce new features.
Note: Refer to the Technical Bulletins and Software Release notes related to the installation procedures for the software.
1. Ensure the user has Administrative privileges to the PC.
2. Load the DS-Matrix software installation CD into the CD-ROM drive connected to the instrument.
3. The InstallShield® Wizard for DS-Matrix starts automatically.
Note: If the InstallShield® Wizard does not start automatically, navigate to and double-click the DS-Matrix **** Setup.exe file on the CD. The actual filename includes characters showing the software revision.
4. Before the InstallShield Wizard window is displayed, virus protection software on the system may display one or messages that request for verification that DS-Matrix **** Setup.exe should be run.

Chapter 3: Installation
Part No. 91000200 24 © 2019 DYNEX Technologies Inc.
Figure 4: DS-Matrix InstallShield Wizard
5. Click .
6. Follow the instructions on the InstallShield Wizard window to install the DYNEX DS-Matrix software.
7. A message is displayed when the installation is done.
8. Click Finish and remove the installation CD from the CD-ROM drive.
Important: Do NOT modify the software. Modifying the software can affect the performance of the instrument and potentially produce incorrect results or
cause damage to the instrument preventing it from being used.
3.5.1 DS-Matrix Shortcut Icon on Desktop
A shortcut icon, , for starting DS-Matrix should have been automatically created and placed on the desktop during installation of the software. If the shortcut icon is not present, follow the instructions listed below for Windows 32-bit.
1. Open Microsoft Windows Explorer.
2. Navigate to C:\Program Files\DYNEX Technologies\DS-Matrix.
3. Right-click on DS-Matrixapp.exe to display the drop-down menu.

Chapter 3: Installation
© 2019 DYNEX Technologies Inc. 25 Part No. 91000200
Figure 5: Create Shortcut
4. Click Create shortcut.
5. is placed on the Windows desktop.
3.5.2 Unlock Licensed Software Features
Based on agreements with some partners and to ensure features are used correctly, several features are available only when accompanied by a software license. DYNEX distributes software licenses via a dongle (a small USB device) that needs to be connected to the PC.
Figure 6: Physical Dongle
When DS2 is purchased, the DS-Matrix software is accompanied with a dongle that contains the license that enables the functionality to handle multi-tube assays with Boolean operations.
If you are going to be running an assay that requires this feature, connect the dongle to an unused USB port on the PC running DS-Matrix software. The indicator light on the dongle will illuminate when recognized.
The dongle provided with the instrument is updatable, as new features are rolled out that you wish to take advantage of. Contact your DYNEX representative or DYNEX Technical Support to arrange for the purchase of the license. Currently a dongle is required if software is to be used

Chapter 3: Installation
Part No. 91000200 26 © 2019 DYNEX Technologies Inc.
for multi-tube sample handling and analysis as well as the plural read functionality in DS-Matrix software.
Note: Ensure the dongle with the newest version of the software is used. The current version is 1.40.
3.6 Install LIS-Link Application
The DYNEX LIS-Link application is an optional software package that can be installed on the DS2 PC. LIS-Link allows DS2 to communicate with the LIS to download pending test orders and to upload completed assay results.
Using LIS-Link, DS2 can send queries, consisting of barcode-scanned or manually entered sample IDs (or a query all) to LIS. DS2 accepts test orders from the LIS for the specific samples and properly checks which samples are to be run when the user enters those orders in the DS2 worklist. Upon completion of the actual testing, the results are paired with the correct patient orders and put in a holding queue for user confirmation and subsequent transmission to the LIS.
The customer's Information Technology (IT) personnel are responsible for setting up the bidirectional LIS-Link interface via a RS-232 serial connection. Details for setting the configuration are in the LIS-Link Operator Manual. DYNEX Technical Support can also be of assistance in this aspect of the configuration.
Note: LIS-Link 2.00 or higher is required to transmit standards and controls. DS-Matrix works with LIS-Link 1.08 and earlier, but standards and controls will not be transmitted.
Once the LIS-Link interface is successfully configured, use the DS-Matrix application LIS Tab to configure options for transmitting result data to the LIS.

Chapter 4: System Components
© 2019 DYNEX Technologies Inc. 27 Part No. 91000200
Chapter 4: System Components This chapter describes the principal hardware assemblies and consumables of the DS2 system. Components located in the workspace area, the fluids and waste area and the rear and sides of the instrument are described.
A PC equipped with Microsoft Windows 7 or Windows 10 operating system is required and not provided but can be ordered separately. Requirements for the PC and instructions for connecting the PC are described in Sections 3.3.1 and 3.3.2.
Figure 7: Parts of the DS2 System
4.1 System Cover The system cover encloses the workspace and pipette module. To open the cover, lift the handle until the cover is in the upright position, where it will remain until it is closed. To close the cover, push down on the handle until the cover is fully closed. The system covers rests on the cover stop when it is fully closed.
4.2 Workspace Area Components Components that are located in the workspace area of the DS2 instrument are shown in Figure 8 and are described in the following sections.
System Cover
Workspace Area
Cover Stop
Power Button Fluidics
Area Cover

Chapter 4: System Components
Part No. 91000200 28 © 2019 DYNEX Technologies Inc.
Figure 8: Hardware Assemblies and Consumables in the Workspace Area
4.2.1 Pipette Module The pipette module pipettes samples, controls and the calibrator into plate wells or dilution strip wells using disposable sample tips and dispenses reagents into plate wells or dilution strip wells using disposable reagent tips. The pipette module also washes the plate wells by connecting to the wash module (Chapter 4.2.2) and positioning the wash head during the washing process.
The pipette module performs level sensing and blocked tip sensing and tests to ensure that a disposable tip is present during aspiration and dispense operations. The sample tips are stored on two sample tip racks (Chapter 4.2.11) and the reagent tips are stored on a single reagent tip rack (Chapter 4.2.13).
The pipette module also opens and closes the sliding door of the plate loading and processing area when needed.
The pipette module is mounted on the X-drive and Y-drive, enabling it to travel back-and-forth and side-to -side to access the samples, controls, calibrator, reagents, plate wells, consumables and the wash module. The pipettor is mounted on the Z-drive, enabling it to travel up and down during dispensing and aspiration.
Controls and Calibrators
Sample Tips
Barcode Scanner
Sample Racks
Pipette Module
Wash Head
Plates
Reagent Containers
Dilution Strips
Reagent Tips Incubator and Reader
(Not Visible)

Chapter 4: System Components
© 2019 DYNEX Technologies Inc. 29 Part No. 91000200
Figure 9: Pipette Module
4.2.2 Wash Module The wash module (Figure 10) is designed to wash all eight wells of a single plate column or strip at one time.
The wash head contains a sufficient number of wash pin pairs to match the number of wells in a plate column. Each pair of wash pins consists of a short pin to dispense fluid and a long pin to aspirate fluid. The aspiration pin and the dispense pin for each well are closely spaced so that fluid can be aspirated and dispensed at the same time.
The pipette module verifies that the wash head is properly secured during the washing process.
During a wash sequence, the wash head is lowered until the aspiration pins are at specified distance from the bottom of the well. The well contents are then either immediately aspirated or, if a bottom wash is being performed, wash fluid is dispensed and then aspirated.
Upon completion of the wash sequence, the wash head is raised and moved to the next location to perform the next wash sequence.
Z-Drive
Pipettor
X-Drive
Y-Drive
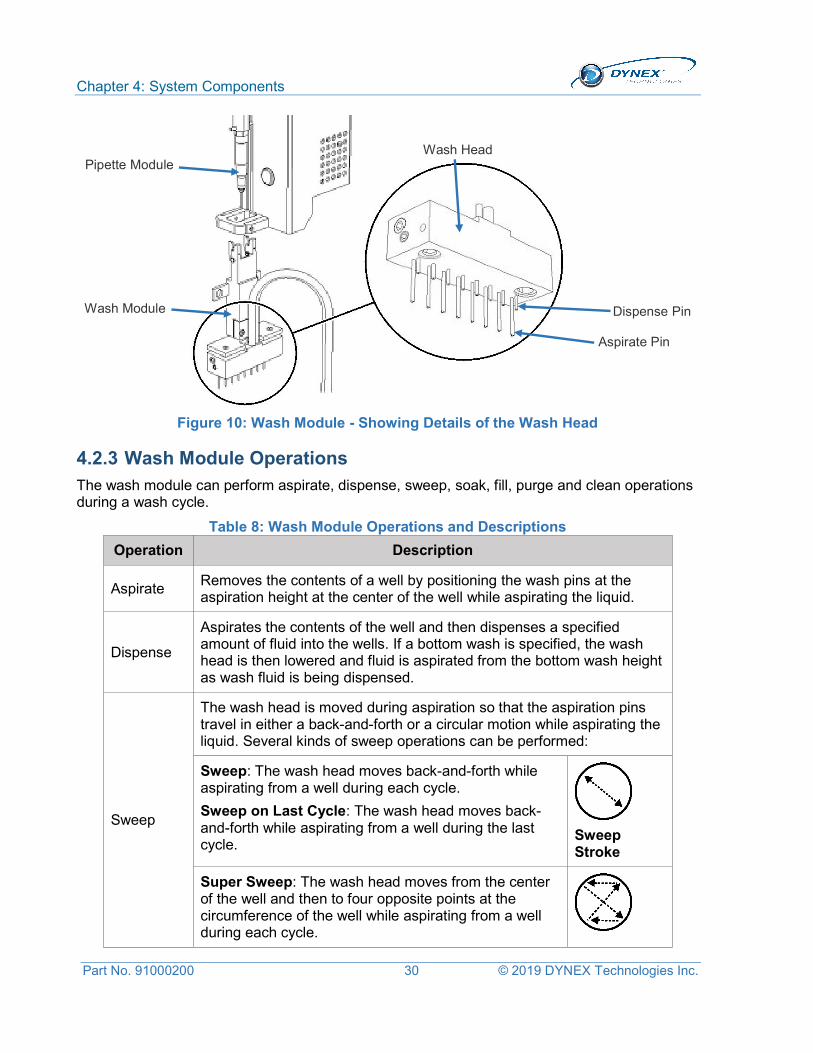
Chapter 4: System Components
Part No. 91000200 30 © 2019 DYNEX Technologies Inc.
Figure 10: Wash Module - Showing Details of the Wash Head
4.2.3 Wash Module Operations The wash module can perform aspirate, dispense, sweep, soak, fill, purge and clean operations during a wash cycle.
Table 8: Wash Module Operations and Descriptions
Operation Description
Aspirate Removes the contents of a well by positioning the wash pins at the aspiration height at the center of the well while aspirating the liquid.
Dispense
Aspirates the contents of the well and then dispenses a specified amount of fluid into the wells. If a bottom wash is specified, the wash head is then lowered and fluid is aspirated from the bottom wash height as wash fluid is being dispensed.
Sweep
The wash head is moved during aspiration so that the aspiration pins travel in either a back-and-forth or a circular motion while aspirating the liquid. Several kinds of sweep operations can be performed:
Sweep: The wash head moves back-and-forth while aspirating from a well during each cycle.
Sweep on Last Cycle: The wash head moves back-and-forth while aspirating from a well during the last cycle.
Sweep Stroke
Super Sweep: The wash head moves from the center of the well and then to four opposite points at the circumference of the well while aspirating from a well during each cycle.
Wash Head Pipette Module
Wash Module Dispense Pin
Aspirate Pin

Chapter 4: System Components
© 2019 DYNEX Technologies Inc. 31 Part No. 91000200
Operation Description
Super Sweep on Last Cycle: The wash head moves from the center of the well and then to four opposite points around the circumference of the well while aspirating from a well.
Super Sweep Stroke
Soak
Contents of the wells remain undisturbed for a specified number of seconds after dispensing wash buffer. Fluid is aspirated when the soak cycle is completed. Several kinds of soak operations can be performed:
Soak at End of Cycle: A soak is performed at the end of each cycle.
Synchronized Soak: (Only when washing stripwise) Soaks each strip for the length of time that it takes to finish pipetting into the strip, which synchronizes start of washing for each strip with the time it takes to finish pipetting for that strip.
Fill A specified volume of wash buffer is dispensed into each well.
Purge Dispenses wash buffer while the wash head is positioned over the purge tray, to remove any air bubbles in the tubing lines and fill the lines with the wash buffer.
Clean Dispenses cleaning fluid while the wash head is positioned over the purge tray, to remove wash buffer from the tubing lines and prevent crystallization.
The height of the wash pins relative to the top and/or bottom of the plate wells during each of the various washing operations, the distances that the aspiration pins move during a sweep operation and the dimensions of the plates that are being used are also specified in the assay file.
Note: Specifications in an assay file include the name of the plate, plate properties (plate dimensions, number of rows and number of columns), well properties (well dimensions, shape of bottom and useable volume), and wash properties (dispense height and aspiration height, top well height, sweep distance and sweep height).

Chapter 4: System Components
Part No. 91000200 32 © 2019 DYNEX Technologies Inc.
Four different types of wash cycles can be specified in the assay file.
Table 9: Types of Wash Cycles and Descriptions
Wash Cycle Description
Standard Wash Liquid is aspirated from the well, then fluid is dispensed into the well from the dispense height (usually above the well) specified in the assay file.
Bottom Wash
Liquid is aspirated from the well, then fluid is dispensed into the well from the bottom wash height (usually within the well) specified in the assay file. Since fluid is dispensed closer to the bottom of the well, the wash is more vigorous. Then fluid is dispensed into the well from the dispense height (usually above the well) specified in the assay file.
Wash Fill Fluid is dispensed into the well from the dispense height (usually above the well) specified in the assay file.
Wash Aspirate Liquid is aspirated from the well.
Three washing options can be specified.
Table 10: Washer Options and Descriptions
Option Description
Final Cycle Liquid is aspirated from the well using the sweep mode during the final wash step. This is used to remove as much liquid as possible from the well.
Constant Timing
Each step during plate washing is scheduled as though twelve test strips are being processed on the plate, even though fewer test strips are being processed. This results in a constant soaking time for each strip regardless of the number of test strips in a worklist and may improve reproducibility of an assay.
Auto Wash A specified volume of cleaning fluid is dispensed while the wash head is positioned over the purge tray, to remove wash buffer from the tubing lines and prevent clogs in the wash pins.
4.2.4 Purge Tray The purge tray is located below the resting position of the wash head. Cleaning fluid is dispensed into the purge tray from the wash head whenever a clean operation is specified.
4.2.5 Plate Drives An upper plate drive and a lower plate drive each transfer a single plate between the plate loading and processing area, ambient temperature incubator module, elevated temperature incubator module and reader module.
During loading of plates, the sliding cover of the plate loading and processing area is automatically opened by the pipette module. If two plates are being loaded, the upper plate drive retracts into the ambient temperature incubator and allows the lower plate to be placed

Chapter 4: System Components
© 2019 DYNEX Technologies Inc. 33 Part No. 91000200
into position by the operator. The upper plate drive then returns and allows the upper plate to be placed into position.
Positioning of the upper and lower plates during subsequent sample and reagent dispensing operations and during subsequent wash operations is controlled by the plate drives, so that pipette tips and wash pins are correctly positioned in the wells during sample and reagent dispensing and wash operations.
Figure 11: Plate Drives
4.2.6 Barcode Scanner The barcode scanner reads the barcode labels on each sample tube when the operator slides each sample rack into the instrument when prompted by the software. The barcode scanner is an IEC60825-1:201 4 Class 2 Laser Product that complies with 21 Code of Federal Regulation (CFR) 1040.10 and 1040.11 except for deviations pursuant to Laser Notice 50 dated 7-26-01.
Table 11: Labels on the Instrument
Symbol Description
Manufacturer of the instrument.
Complies with relevant EU directives regarding safety, health and environmental protection.
In-Vitro Diagnostic.
Australian Electromagnetic Compatibility (EMC) Regulatory compliance mark.
Product has been independently tested by Intertek and meets the applicable published standard in USA and Canada.
Lower Plate Drive
Sliding Cover
Upper Plate Drive

Chapter 4: System Components
Part No. 91000200 34 © 2019 DYNEX Technologies Inc.
Caution: The barcode scanner has a maximum radiated output of 1.0 milliwatt. Do not stare into the beam of the barcode scanner.
A warning label is attached to the system in the vicinity of the barcode scanner to alert you of the barcode scanner beam.
4.2.7 Incubator and Reader Module The incubator module is located behind the plate drives and can incubate two plates. During incubation, a sliding cover is automatically closed to ensure maintenance of any temperature ranging from ambient plus 4° C to 40° C. The plates can be shaken during incubation. Incubation temperature, shake intensity (either low or high) and shake duration are specified in the assay file.
Plates are automatically transferred to the reader module when OD readings must be obtained for each well. A shake function is also available during the read step. After the OD readings are obtained, calculations are applied and results are reported.
Interchangeable optical filters in the reader module allow your facility to run tests at wavelengths ranging from 405 to 690 nm.
OD readings on a plate can be performed in one of three modes:
Single Wavelength Mode: All plate wells are read at a single wavelength and reported as OD.
Dual Wavelength Mode: All plate wells are read at a test wavelength and again at a reference wavelength. The difference between these two readings for each well is reported as OD.
Blank Mode: One or more wells containing reagents but no sample (blank wells) and all of the remaining plate wells (test wells) are read at the same wavelength. The difference between the reading for each test well and the blank well (or the average reading if more than one blank was included in the worklist) is reported as OD.
Note: The mode for performing optical density readings and wavelength(s) at which readings are obtained are specified in the assay file.
Four optical filters (405, 450, 490 and 620 nm) are typically installed on the DS2 instrument. Two (maximum of six filters can be fitted) additional filter position is available for your facility to install another optical filter (Chapter 10.2.7).
4.2.8 Plates Plates are prepared by the user. Each plate consists of either a 96-well microplate with eight rows of twelve wells or a plate frame into which up to twelve eight-well test strips are inserted.

Chapter 4: System Components
© 2019 DYNEX Technologies Inc. 35 Part No. 91000200
Figure 12: Example of a Plate Frame and Twelve Test Strips
4.2.9 Sample Tubes The DS2 instrument can process up to 100 samples in a run. The samples must be prepared for analysis and placed in appropriate sample tubes.
Important: Sample tubes must be within the following dimensions:
External diameter: 10 to 16 mm
Height: 40 to 100 mm.
Sample identifications can be automatically read from a barcode label on each sample tube or manually entered by the operator.
Important: The DS2 instrument is designed to scan sample tube barcode labels in accordance with CLSI AUTO 2-A2 (Laboratory Automation: Bar Codes for Specimen Container Identification; Approved Standard - Second Edition, which specifies the quality, position and orientation of the barcode labels).
Use of high-quality barcode labels is critical for obtaining consistent results when scanning. The use of non-standard barcodes or barcodes with poor print quality must be avoided. Barcode labels must be applied vertically on the sample tubes. Sample tubes must be placed in the sample rack so that the barcode label faces out of the opening in the sample rack.
The following symbologies are supported:
Codabar Code 39 Code 93 Code 128 Interleaved 2 of 5 International Air Transport Association (IATA) UPC (Universal Product Code)/European Article Numbering (EAN)/Japanese Article
Numbering (JAN).
Since large dot spacing when using an inkjet label maker may increase the number of blank scans, test the labels before using them in an assay. Print quality is very important to reliable scans.
Plate Frame
Test Strip

Chapter 4: System Components
Part No. 91000200 36 © 2019 DYNEX Technologies Inc.
Ensure that the barcode density selected is between 5.0 mil (0.005 in) and 13.0 mil (0.013 in). The print density of the barcodes must be between 5.0 mil (0.005 in) and 7.0 mil (0.007 in).
Verify that the quiet zones are at least 5 mm from the actual barcode to the end of the label.
Do not use sample tube barcodes that are over 85 mm long, including the quiet zone at each end of the barcode. This length may vary, depending upon the code type and barcode density.
Test new batches of labels before routinely using them, to ensure that they can be reliably scanned.
Check that the digits, letters and other characters are correct for the barcode symbology that is being used. Use the correct number of data digits for a specific barcode symbology.
Ensure that the barcode scanner module window is clear, clean and not scratched.
4.2.10 Sample Racks
Sample tubes are inserted into a sample rack which is then loaded onto the DS2 instrument for testing. Each sample rack can hold up to twenty sample tubes. Five sample racks, which are provided, can be loaded at one time.
Important: When inserting sample tubes into a sample rack, press each tube all the way down into the sample rack to prevent interference with the pipetting module during sample aspiration.
If sample barcode labels are used, the barcode labels are read when the operator slides each sample into the instrument when prompted by the software.
Figure 13: Sample Rack
4.2.11 Sample Tips Sample tips are used for pipetting samples and controls. They are automatically ejected into the tip waste container (Chapter 4.3.3) after they have been used. Sample tips are provided in disposable racks containing 108 sample tips.
Sample tips are blue in color.
Sample tips are loaded by placing a full rack of sample tips in each of the two sample tip holders on the instrument. The sample tip racks can be loaded in either orientation.
The instrument tracks the sample tips as they are used, maintaining a database of unused sample tips and their location. Therefore, a rack containing unused sample tips can be left in

Chapter 4: System Components
© 2019 DYNEX Technologies Inc. 37 Part No. 91000200
place for a following run as long as the DS2 instrument is not shut down by the operator between the runs.
Important: Use only DYNEX-certified sample tips. These tips are produced to a specific DYNEX design and are classified as accessories. The use of imitation tips may lead to performance issues. Load only full racks of sample tips.
Figure 14: Sample Tip Rack with 108 Sample Tips
Figure 15: Sample Tip
4.2.12 Deep Well Dilution Strips Deep well dilution strips are provided in cartons containing 250 dilution strips. Each dilution strip contains eight deep wells that are used for diluting samples before they are dispensed into wells on the plate.
Deep well dilution strips are loaded by placing an individual dilution strip in each empty slot of the dilution strip holder on the instrument. The dilution strips can be loaded in either orientation.
Figure 16: Deep Well Dilution Strip
Sample tips (blue tips)
Disposable sample tip rack

Chapter 4: System Components
Part No. 91000200 38 © 2019 DYNEX Technologies Inc.
4.2.13 Reagent Tips Reagent tips are used for pipetting reagents from the reagent tubes. The reagent tips are contained in the reagent tip holder on the instrument, which holds 20 reagent tips. Reagent tips are white in color.
Reagent tips are loaded by placing an individual reagent tip in each empty position of the reagent tip holder on the instrument.
Important: The reagent tip holder must be completely filled with reagent tips before starting a run. Use only DYNEX-certified reagent tips.
Figure 17: Reagent Tip Rack with 108 Reagent Tips
4.2.14 Reagents, Calibrators and Controls The reagents, calibrators and controls that are used for running a test are defined and provided by the user. These may include the following:
Calibrator Conjugate Negative Control Positive Control Sample Diluent.
The reagents that are needed for running a test are contained in reagent tubes. Each reagent can be placed in either a 25 mL reagent tube or a 15 mL reagent tube. Up to eight 25 mL reagent tubes and ten 15 mL reagent tubes can be loaded on the system.
The calibrators and/or controls that are needed for running a test are contained in control vials that hold 2 mL. There are 24 locations for calibrators and/or controls.
The reagent tubes and control vials are loaded on two reagent racks. Each of these tubes must be loaded in the rack position specified by the Loading Wizard when the assay is run (Chapter 7.8.2).
Reagent Tips (white tips)

Chapter 4: System Components
© 2019 DYNEX Technologies Inc. 39 Part No. 91000200
Important: The fluids (reagents, calibrators and controls) that are used in an assay are specified by the user during assay definition (Chapter 6.5). Before a fluid can be specified for an assay, a record for that fluid must exist in the database (Chapter 13.1).
Figure 18: Reagent Tubes and Control Tubes on the Two Reagent Racks
4.3 Fluidic Area Components Components that are located in the fluidic area of the DS2 instrument are shown in Figure 19 and are described in the following sections.
Figure 19: Components in the Fluidic Area
4.3.1 Fluidic Area Door The fluidic area door is hinged at the bottom and secured at the top by two retainers. Open the door by pulling the top towards you. Close the door by pushing the top of the door into the retainers until it snaps shut.
Quick Connect Fitting
Wash Buffer Container A
Wash Buffer Container B
Liquid Waste Container
Level Sensor Connector
Fluidic Area Door
Tip Waste Container
Reagent Tips
Reagent Rack
Control Vials
25 mL Reagent Tubes
15 mL Reagent Tubes

Chapter 4: System Components
Part No. 91000200 40 © 2019 DYNEX Technologies Inc.
4.3.2 Wash Buffer Container Each wash buffer container contains up to two liters of wash buffer. Dispensing of wash buffer is controlled by an in-line pump, a bottle selection valve above each wash buffer bottle and a dispense valve located near the wash head. The specified wash buffer is dispensed into wells whenever a Dispense or Fill operation is specified in the wash proto col.
Each wash buffer container must contain at least 500 mL of wash buffer in order to be used. Level sensors alert the operator if wash buffer must be replenished when the level dips below 300 mL. Empty, rinse and replenish wash buffer using the filler cap at the rear of the container.
Note: Formulation of each wash buffer, the location (Wash Buffer Container A or Wash Buffer Container B) of each wash buffer and the dispense, fill and/or purge operations are defined during assay definition.
Quick-connect fittings and level sensor connectors allow easy removal of the wash buffer containers. Disconnect a wash line by pressing on the metal tab of the quick connect fitting and gently pulling up on the wash line to remove it. Disconnect a level sensor connector by pulling it out of the connector socket.
4.3.3 Tip Waste Container After a sample tip or reagent tip has been used, the pipette module moves to the tip waste chute and ejects the used tip. The tip waste chute directs the used tip into the waste container.
Dispose of used tips according to procedures for your facility.
Warning: If biological specimens are being tested, the specimens and used sample tips are potentially infectious. Use universal precautions in the handling of specimens and used sample tips in accordance with local regulations.
4.3.4 Liquid Waste Container Fluid removed during washing is collected in the liquid waste container. The liquid waste container holds up to 1.5 liters of waste. A level sensor alerts the operator when the liquid waste container is full.
Two quick connect fittings connect the liquid waste line and the vacuum line to the liquid waste container. Disconnect each quick connect fitting by pressing on the metal tab of the fitting and gently pulling on the line. Disconnect the level sensor connector by pulling it out of the connector socket.
When emptying the liquid waste container, be sure to place the container in an upright position with the front of the container and waste cap elevated before removing the waste cap.
Dispose of liquid waste according to procedures for your facility.
Warning: If biological specimens are being tested, the liquid waste is potentially infectious. Use universal precautions in the handling of liquid waste in accordance with local regulations.
Be sure that the waste cap is securely tightened when replacing the liquid waste container. Otherwise, a vacuum leak can cause the software to create a vacuum error condition.

Chapter 4: System Components
© 2019 DYNEX Technologies Inc. 41 Part No. 91000200
4.3.5 Cleaning Fluid After plate washing is completed, the wash head can be cleaned by dispensing cleaning fluid from the wash head while the wash head is positioned over the purge tray (a clean operation, described in Chapter 4.2.4) to remove wash buffer from the tubing lines and prevent crystallization.
Distilled or deionized water is typically used for cleaning fluid and it is contained in a user-supplied bottle. A level sensor is not used with the cleaning fluid container.
A quick connect fitting supplies the cleaning fluid to the instrument. Place the free end of the wash head cleaning line into a filled bottle of cleaning fluid and then connect the other end with the quick-connect fitting to the connector located on the lower right side of the instrument.
Figure 20: Cleaning Fluid Line Connector
4.3.6 Optional External Waste Trap The optional external waste trap (PN 13002610) must be used with assays which have foamy wash buffer so that foam which would otherwise enter the DS2 pump is collected in the external waste trap. The fluids that are used are:
Wash buffer Cleaning fluid.
Important: Failure to use the external waste trap with certain assays may void the warranty/service contract coverage for the DS2 pump.
Figure 21: External Waste Trap
Cleaning Fluid Connector

Chapter 4: System Components
Part No. 91000200 42 © 2019 DYNEX Technologies Inc.
4.4 Controls, Indicators and Electrical Connectors
4.4.1 Power Button and Indicator Light Press the power button (Figure 22) to provide power to the system.
An indicator light above the power button is illuminated whenever the system power is ON.
Figure 22: Location of the Power Button and Indicator Light
4.4.2 Power Connector The power supply cord for the instrument is connected to the rear of the instrument (Figure 23).
Warning: The DS2 instrument must be connected to a properly grounded electrical outlet. Obtain assistance from a qualified electrician to verify that your electrical outlet is properly grounded.
A warning label is attached to the system in the vicinity of the power connector.
Note: Depending upon local electrical codes and electrical service quality, an optional uninterruptible power supply (UPS) may be required in your laboratory. The use of a UPS is optional but strongly recommended. A UPS can be purchased from an electronics supply house.
4.4.3 USB Port
A USB port is located at the rear of the instrument (Figure 23).
Figure 23: Location of the USB Port and Power Connector
USB Port
Power Connector
Indicator light
Power button

Chapter 5: Software Description
© 2019 DYNEX Technologies Inc. 43 Part No. 91000200
Chapter 5: Software Description DS-Matrix software provides the user interface, motion control, test processing and results analysis software for the system. DS-Matrix software also allows you to tailor the DS2 instrument configuration and the consumables according to your needs. Finally, DS-Matrix software allows you to modify or create an assay by defining each part of the assay, including pipetting of samples and reagents, reading of optical density, calculation of results, performing quality control checks and formatting of the results report.
5.1 DS-Matrix Software
The DS-Matrix software shortcut is displayed on the Microsoft Windows desktop or on the
taskbar .
1. Click to start DS-Matrix. The Run Mode dialog box is displayed for selecting the software language and run mode.
Figure 24: Run Mode Dialog Box
2. Power on the instrument (Chapter 7.2).
3. Click run mode.
Normal Mode to operate the instrument. Simulation Mode to run the software without operating the instrument.
4. If needed, select a different language from the Language drop-down menu. English (United States) is the default language.

Chapter 5: Software Description
Part No. 91000200 44 © 2019 DYNEX Technologies Inc.
Figure 25: Language Drop-Down Menu
Important: The Configuration panel shows the system driver and workspace version that will be loaded.
1. After selection of language and run mode, click to proceed.
a. If Normal Mode was selected for the run mode, the instrument will initialize, perform self-testing and display the self-test report (Chapter 5.1 step 5). Close the self-test report to display the DS-Matrix software main screen (Figure 26).
b. If Simulation Mode was selected for the run mode, the DS-Matrix software main screen (Figure 26) is displayed without initializing the instrument.
Important: Ensure that all racks are properly seated and that the lids are removed from all tubes, plates and sample tip racks before initializing the instrument.

Chapter 5: Software Description
© 2019 DYNEX Technologies Inc. 45 Part No. 91000200
Figure 26: DS-Matrix Software Main Screen
5.2 File Types The DS-Matrix software uses many different file types. When troubleshooting an issue, depending on the issue, DYNEX may ask for different file types
The main file types used by DS-Matrix software are listed Table 12.
Table 12: DS-Matrix Software File Types, Descriptions and Extensions File Type Description Extension
Self-test report files
Self-test report files contain information about the instrument serial number, the software version in use on the system and the firmware version currently loaded on the system
Assay
DS-Matrix Assay files are stored in an .xml file format. These files can only be opened with DS-Matrix software and contain the assay program as well as all the consumables in the assay program (custom plate types, fluids, etc.) To access an .xml file to send via e-mail, export the assay from the DS-Matrix software using Tools Import Export
. xml
Report
DS-Matrix report files are stored in an. xdb file format. For patient privacy reasons, .xdb files are encrypted and can only be opened with DS-Matrix software. .xdb files contain the plate report, as well as any assay files used to generate the plate report. To access an .xdb file to send via e-mail, export the assay from the DS-Matrix application using Tools Import/Export.
.xdb
Timelines and toolbar
Assay reports and consumable
status button
Menu bar
Incubator temperature

Chapter 5: Software Description
Part No. 91000200 46 © 2019 DYNEX Technologies Inc.
File Type Description Extension
Database
The DS-Matrix mdb and DS-Matrix_log.ldf files are commonly called “the database files”. These files contain all the information and settings for the DS-Matrix software.
DS-Matrix. mdbfiles and DS-Matrix_log.ldf files
Logs Event logs contain a detailed log of all actions being performed by DS2 in a text description.
.xml
Debug log files
The debug log provides supplemental information to the event log. While the event log contains a text description of the actions performed by the instrument, the debug log contains the commands being sent to cause each of the actions recorded in the event log to occur. If there is a suspected hardware problem, the debug log can provide information as to what commands are being sent to the DS2 during the run to generate the error message.
.xml
5.3 DS-Matrix Main Screen
5.3.1 Menu Bar The menu bar on the DS-Matrix main screen contains all of the commands that are needed to customize the DS2, modify or create an assay, assay samples and manage results.
Figure 27: Menu Bar
5.3.1.1 File Menu
Table 13: File Menu Commands and Purposes
Command Purpose
Worklist Editor Start Worklist Editor, which allows the operator to modify an existing worklist or create a new worklist (Chapter 5.4).
Assay Editor Start the DYNEX Assay Editor, which allows the operator to create or modify an assay (Chapter 5.5).
Recent Assays Display a listing of assays, which allows the operator to review or modify an assay (Chapter 6.1.2.6).
Recent Worklists Open a saved worklist or the worklist for a batch of samples that has already been assayed.

Chapter 5: Software Description
© 2019 DYNEX Technologies Inc. 47 Part No. 91000200
Command Purpose
Exit Display the Exit DS-Matrix dialog box, which allows the operator to close DS-Matrix software and abort any assays that may be in progress (Chapter 6.1.2.7).
5.3.1.2 Reports Menu Command Purpose
Well Fill Verification Report Display the results of the well fill verification operation for an assay.
View All Reports Display the Select History Report dialog box, which allows the operator to select and display the report from any assay that has been run on the instrument.
5.3.1.3 Consumables Menu Command Purpose
Reset Consumable (Fluids) Status
Reset the Neat Fluids and Washer Fluids tabs on the Consumables Status window.
Reset Consumable (Tips) Status
Update the Tips Status panel on the Consumables Status window.
5.3.1.4 Tools Menu Command Purpose
Database Maintenance Display the Database Maintenance dialog box, which allows the operator to create, update or delete a record for a sample tube, consumable, fluid or barcode format (Chapter 5.6).
System Configuration Display the System Configuration dialog box, which allows the operator to customize how the DS2 instrument is used at your facility (Chapter 5.7).
User Notification Display the Email Setup dialog box, which configures the software to automatically send a message to a specified e-mail address when a system error occurs (Chapter 5.8).
Absorbance Filter Display the Define Absorbance Filter dialog box, which allows the operator to enter the wavelengths of absorbance filters installed in the instrument (Chapter 5.9).
Import/Export Import or export assay files, optical density data and the Electronic Signature Pipetting (ESP) database (Chapter 5.10).

Chapter 5: Software Description
Part No. 91000200 48 © 2019 DYNEX Technologies Inc.
Command Purpose
Reset Autorecovery Discontinues a specific user-selected corrective action that is automatically executed for a particular error (Chapter 5.10.4.1).
View Event Log Retrieve and review an event log (Chapter 9.9).
Levey-Jennings Perform a Levey-Jennings analysis on a specified set of data (Chapter 9.10).
ESP Calibration Perform an ESP calibration for a specified fluid (Chapter 13.4).
Fluid Level Tracking Run fluid level tracking for a new fluid (Chapter 13.1). This must be done before the new fluid can be used in an assay.
5.3.1.5 Instrument Menu
Command Purpose
Eject Plate Manually send the Command to eject the plate(s) from the plate drive.
Incubate Plate Transfer the plate(s) from the plate drive to the incubator.
5.3.1.6 About Menu
Command Purpose
About Display the version of installed DS-Matrix software.
5.3.2 Timeline View After a worklist has been created and at least one assay is assigned, operation icons are displayed to create timelines that show each task that the operator must perform and each operation the instrument will perform for the worklist. The scheduled starting time is also shown for the worklist.
Note: Timelines are not displayed until a worklist has been created.
The timelines provide a visual display of all of the activities that are scheduled for a worklist over a specified time interval, activities and operations that have been completed and the remaining time for completing the worklist.
Separate timelines are shown for operator tasks (loading samples and loading consumables) and instrument operations. The timeline for operator tasks is shown below the timeline for instrument operations.

Chapter 5: Software Description
© 2019 DYNEX Technologies Inc. 49 Part No. 91000200
Note: Use the , and tools to compress or expand the time scale.
Figure 28: Timeline View Screen
The icon for each operator task or instrument operation is color-coded so that it can be readily identified on a timeline.
Table 14: Operator Tasks
Icon/Bar Description Icon/Bar Description
Load samples
Incubate
Load consumables
Wash
Pipette samples
Read
Dispense reagents
Note: If the time scale is compressed, the symbol on an operation icon may no longer be displayed. However, the icon can still be identified by its color.
5.3.3 Timeline Toolbar The timeline toolbar contains tools for changing the timeline view, stopping and re-starting operation of the instrument, accepting a worklist to begin testing, adding or changing a worklist and changing the assay or sample batch.
Figure 29: Timeline Toolbar
Note: Tools that cannot be enabled at a particular time are grayed-out on the timeline. If a tool is selected, that tool will flash.
For example: If nothing is “running” the timeline cannot be stopped not paused.
Scheduled starting time for
the worklist
Timeline tools
Operator tasks
assay operations Time of day
Incubator temperature

Chapter 5: Software Description
Part No. 91000200 50 © 2019 DYNEX Technologies Inc.
Table 15: Tools and Purposes Tool Name Purpose
Full Size Reposition the timelines and adjust the time scale so that the timelines occupy the entire timeline panel.
Zoom out Compress the time scale.
Zoom in Expand the time scale.
Pause
Pause operation of the instrument when it can be safely stopped (Chapter 7.13).
Stop
Pause operation of the instrument when it can be safely stopped, then enable you to abort the plate or worklist (Chapter 7.13).
Resume
Resume operation of the instrument after it has been paused (Chapter 7.13).
Skip
Speed up the worklist by skipping a wait time that is allotted in the schedule but not needed.
Edit
Change the sample batch that is being tested and/or the assay that is being run on a scheduled plate.
Add Add a second plate or worklist to the timeline.
Fit Next
Change the scheduling of the second plate or second worklist that was added to the timeline (Chapter 7.8.3).
Accept
Accept the worklist, complete the loading process and begin assaying samples (Chapter 7.8.1).
5.3.4 Assay Reports After testing of a plate is completed, assay reports can be reviewed, printed, saved and exported.
at the bottom of the DS-Matrix main screen displays the assay report for the most recently tested plate or for a plate selected from the adjacent listing of recently tested plates.
at the bottom of the listing of recently tested plates allows you to query for assay reports by date range.
Refer to Chapter 9: for procedures to locate test results, the types of reports that can be obtained and procedures for saving, printing and exporting results.

Chapter 5: Software Description
© 2019 DYNEX Technologies Inc. 51 Part No. 91000200
5.3.5 Consumables Status
When a worklist is running, at the bottom of the DS-Matrix main screen displays a dialog box showing the status of all consumables that are needed for the worklist.
Note: In this manual, the term consumables refer to sample pipette tips, reagent pipette tips, plates and all fluids except samples.
Figure 30: Consumable Status
5.3.5.1 Reviewing Status of Fluids
The fluid name, fluid type, location (rack, compartment), current and required volume and loading time for each reagent, diluent, calibrator or control in a worklist are shown on the Neat Fluids tab. The lot number and remaining use time are also shown if the lot number and expiration date are entered by the operator at runtime.
Note: The name, type, location and volume for each fluid used in an assay are specified in the database (Chapter 5.6). The lot number and expiration date for a fluid are entered by the operator if Request kit lot data at runtime is enabled for the assay that is being run (Chapter 7.9).
Status of each fluid Status of each plate
Status of sample tips and reagent tips

Chapter 5: Software Description
Part No. 91000200 52 © 2019 DYNEX Technologies Inc.
Figure 31: Neat Fluids Tab
Click or to scroll through the status of each fluid used in the worklist.
5.3.5.2 Reviewing Status of Wash Buffers The name, type, location, current and required volume and loading time for each wash buffer in a worklist are shown on the Washer Fluids tab. The lot number and remaining use time are also shown if the lot number and expiration date are entered by the operator at runtime.
Figure 32: Washer Fluids Tab

Chapter 5: Software Description
© 2019 DYNEX Technologies Inc. 53 Part No. 91000200
Note: The name, type, location and volume for each fluid used in an assay are specified in the database (Chapter 7.9). The lot number and expiration date for a fluid are entered by the operator if Request kit lot data at runtime is enabled for the assay that is being run (Figure 77).
Click or to scroll through the status of each wash buffer used in the worklist.
5.4 Worklist Editor The Worklist Editor is used to create a new worklist or edit an existing worklist. The worklist contains the Sample IDs of the samples that will be run and the assay(s) that will be run on each sample.
5.4.1 Starting the Worklist Editor 1. Click File Worklist Editor.
2. The Sample Batch dialog box is displayed for selecting a sample batch that will be included in the worklist.
Figure 33: Sample Batch Dialog Box
3. Specify how the samples for the worklist are assigned choices (Figure 147).
4. Click to display the Worklist Editor window.
Figure 34: Worklist Editor Screen

Chapter 5: Software Description
Part No. 91000200 54 © 2019 DYNEX Technologies Inc.
Note: Refer to Chapter 7.7 for details on assigning samples to the worklist and assigning one or more assays to each sample.
5.4.2 Worklist Editor Menu Bar The menu bar on the Worklist Editor window contains a File menu and an Edit menu.
5.4.2.1 File Menu The file menu lists the commands for Worklist Editor.
Table 16: File Menu Commands and Purpose Command Purpose
Open Worklist Display a listing of all worklists from which a worklist can be selected and displayed.
Save Worklist Save the worklist that is currently displayed.
Delete Worklist Delete the worklist that is currently displayed.
Recent Worklists Display a dialog box from which a recent worklist can be selected and displayed.
Close Worklist Editor Close the Worklist Editor window.
5.4.2.2 Edit Menu The edit menu allows for adding or deleting shortcut buttons for the assays. It also contains the print worklist command.
Table 17: Edit Menu Command and Purpose
Command Purpose
Add Quick Start…
Create a shortcut button for a commonly used assay.
Delete Quick Start…
Delete an existing shortcut button.
Print Worklist Print the selected worklist.

Chapter 5: Software Description
© 2019 DYNEX Technologies Inc. 55 Part No. 91000200
5.4.3 Add Assay Shortcut Buttons to the Worklist Editor Shortcut buttons for commonly used assays may be created and placed on the Worklist Editor window to simplify the start-up process.
Figure 35: Routine Worklist
1. Create a routine worklist and assign the assays for the worklist (Figure 147).
2. Click File Save Worklist.
3. Enter a name for the worklist in the Name box.
Figure 36: Save Worklist Pop-Up
4. Click .
5. Click Edit Add Quick Start.
Short-cut buttons

Chapter 5: Software Description
Part No. 91000200 56 © 2019 DYNEX Technologies Inc.
Figure 37: Add Quick Start Pop-Up
6. In the Button Text field of the Add Quick Start dialog box, enter the label that will be displayed on the shortcut button.
7. Click .
8. The shortcut button is displayed at the top of the Worklist Editor window and at the top of the DS-Matrix main screen.
5.5 Assay Editor Assay Editor is used to create or edit an assay.
5.5.1 Start the Assay Editor 1. Click File Assay Editor.
2. The Assay Editor window is displayed. Here an assay can be created, edited or deleted.
Figure 38: Assay Editor
Note: Refer to Chapter 5.5 for a description of the Assay Editor components and procedures for creating or editing an assay.

Chapter 5: Software Description
© 2019 DYNEX Technologies Inc. 57 Part No. 91000200
5.6 Database Maintenance DS-Matrix contains a database that includes a detailed definition of each sample tube, consumable (plates, dilution strips, racks, sample tips and reagent tips), fluid (reagents, standards, controls and wash buffers) and barcode format that can be used on that instrument.
A record must exist for an item in the database before that item can be used when creating an assay.
Note: Records for items that are provided or recommended by DYNEX are included in the database when the instrument is shipped to your facility. These records are identified by the word DYNEX in the name and cannot be edited or deleted from the database.
5.6.1 Displaying a List of Items in the Database 1. Click Database Maintenance… on the tools menu to display the Database
Maintenance dialog box.
Figure 39: Database Maintenance
2. Click type of item from the drop-down list in the Database Type field to display the existing items of that type.
Table 18: Database Types Database Type Description
Bottle Type Reagent containers, sample tubes, control tubes and deep well strips
Plate Type Plates
Neat Fluid Reagents
Washer Fluid Wash buffers
Tip Type Sample pipetting tips and reagent pipetting tips
Rack Type Racks which are used for loading samples, controls, pipette tips, plates and reagents onto the instrument
Existing items of that type
Type of item

Chapter 5: Software Description
Part No. 91000200 58 © 2019 DYNEX Technologies Inc.
Barcode Scripts Barcode reading formats that can be used on the instrument
5.6.2 Deleting an Item from the Database 1. Display the Database Maintenance dialog box (Chapter 5.6).
2. Click item to be deleted.
3. Click . The record for that item is deleted from the database.
Note: Items with DYNEX in their name cannot be deleted.
4. Click to close the Database Maintenance dialog box.
5.6.3 Copying an Item to the Database 1. Display the Database Maintenance dialog box (Figure 39).
2. Click item to be copied and then select . A record for the copied item (named Copy of…) is added to the database.
3. Click to close the Database Maintenance dialog box.
5.6.4 Edit an Item in the Database 1. Display the Database Maintenance dialog box (Chapter 5.6).
2. Click item to be edited and then click . A dialog box is displayed with the information for the selected item.
Figure 40: Database Maintenance Screen
Note: Items with DYNEX in their name cannot be edited.

Chapter 5: Software Description
© 2019 DYNEX Technologies Inc. 59 Part No. 91000200
3. The dialog box shown is for defining a sample tube or reagent tube. Dialog boxes for other items will have different fields.
4. Edit the information as needed.
5. Click . The record for the item is updated.
6. Click to close the Database Maintenance dialog box.
5.6.5 Create a New Item in the Database 1. Display the Database Maintenance dialog box (Figure 39).
2. Click . A dialog box is displayed for naming the item.
Figure 41: Enter Name Dialog Box
3. Enter a name for the new item and click . A dialog box is displayed for defining the new item.
Figure 42: New Item Dialog Box
Important: A new bottle definition must be calibrated before it will be included in the listing of bottles. Newly defined and calibrated bottles should be tested and validated before incorporating them into assays.
4. Edit the information as needed.
5. Click . A record is created for the new item.
6. Click to close the Database Maintenance dialog box.

Chapter 5: Software Description
Part No. 91000200 60 © 2019 DYNEX Technologies Inc.
5.7 Configure the System The DS2 is a flexible and open system that can be used for virtually any ELISA application from clinical diagnostics such as auto immune and infectious disease to food safety and drugs of abuse testing.
Configuration of the system can be changed in order to tailor how the DS2 instrument is used at your facility. Parameters for configuring the system are accessed from the tools menu on the DS2 DS-Matrix™ main screen.
The selected settings apply to the system, not to any particular assay worklist. Changes that can be made to the system configuration to suit the needs of your facility are summarized below:
Specify how samples and reagents are pipetted (Chapter 5.7.1). Specify miscellaneous operations (Chapter 5.7.2). Specify limits for reporting optical density (Chapter 5.7.3). Enter the laboratory name and contact information that will be displayed on reports
(Chapter 5.7.4). Specify how barcode labels are read (Chapter 5.7.5). Specify how results of self-testing are reported (Chapter 5.7.6). Specify frequency of database backup and the location of backup files (Chapter 5.7.7.1). Establish a connection to the LIS (Chapter 5.7.8). Set up an e-mail connection so that DS-Matrix software automatically sends a message
to a specified e-mail address whenever a system error occurs (Chapter 5.8). Install an additional absorbance filter and enter the wavelength of each absorbance filter
that is installed (Chapter 10.2.7).
5.7.1 Specify How Samples and Other Fluids Are Pipetted Important: Validation studies to assure proper assay performance must be performed after changing the manner in which samples and other fluids are pipetted, since this may affect assay performance.
1. Click System Configuration on the tools menu to display the Fluids tab of the System Configuration window.

Chapter 5: Software Description
© 2019 DYNEX Technologies Inc. 61 Part No. 91000200
Figure 43: System Configuration Screen
2. The Containers panel specifies the type of deep well strip and sample tube that are used. Do not change these unless instructed to do so by DYNEX.
3. The Pipette Options panel specifies how samples are pipetted.
4. In the Sample Aspirate Profile and the Sample Dispense Profile fields, select a profile from the drop-down list. The profiles define the rate from 1 (slowest) to 5 (fastest) at which samples are aspirated and dispensed. Pipetting accuracy may decrease at higher speeds for small sample volumes or viscous samples.
5. Click the radio button for how the samples and controls will be pipetted when more than one assay is run on a plate.
Table 19: Types of Pipettes and Descriptions Type of Pipette Description
Serial Pipette (default)
Samples or controls are pipetted individually into each well, starting at well A1 and proceeding to the next well in the pipetting order specified for the assay.
Parallel Pipette, across assays only
Each sample or control is pipetted into all wells on a plate in which that sample or control will be assayed before the next sample or control is pipetted.
Parallel Pipette, across plates and assays Each sample or control is pipetted into all wells on both plates in which that sample or control will be assayed before the next one is pipetted.
6. The ESP panel allows you to create an ESP calibration profile for each fluid that is used and to define the score which is valid for all ESP calibration profiles.
Note: ESP is a sophisticated DYNEX algorithm for detecting anomalies in pressure and pipetting rate resulting from the presence of particulate matter, clots, foam or bubbles during aspiration of samples.

Chapter 5: Software Description
Part No. 91000200 62 © 2019 DYNEX Technologies Inc.
7. Place a checkmark in the Save all ESP parameters box to create an ESP calibration profile for each fluid.
Note: This option allows users with engineering capabilities to monitor fluid aspirations and dispenses for uniformity. Statistics that are obtained can only be viewed in engineering mode.
8. Enter the score (from 1 to 100) that must be achieved during ESP calibration in order for the calibration to pass.
Note: The ESP score is also used in engineering mode. Ramp times, pipetting speeds and pressures are all taken into account when calculating the ESP score.
9. In the Mix Volume field, specify the volume of diluent (in microliters) that will be dispensed into a deep well strip and mixed with the sample during sample dilution.
Note: This setting specifies the volume of diluent that is dispensed for all assays. The volume can be decreased to avoid bubbles when diluting small volumes of samples.
10. In the Acceptable error for fluid volume levels field, specify the maximum percentage of error that is acceptable when calibrating a new bottle.
For example: A value of 5 in this field indicates that the measured volume must be within ± 5% of the expected volume during calibration of a new bottle.
11. Place a checkmark in each of the following boxes to enable the corresponding feature:
Table 20: Features and Descriptions
Feature Description
Clot Detection When enabled, the operator is alerted if a sample cannot be aspirated due to presence of a clot or other obstruction.
Note: Clot detection alerts the operator if a sample cannot be aspirated. It
will not detect subtle fluid aspiration changes.
Track Fluids
When enabled, the operator cannot load a fluid in a location where another fluid was previously loaded, causing each fluid location to be dedicated to a specific fluid. If this option is disabled, a different fluid can be loaded in a location once the required volume for the fluid reaches Zero (0) microliters.
Share Fluids Across Worklists
When enabled, fluids used in a preceding worklist can be used for the current worklist and the operator will be prompted to add fluid to the bottle in its current location when needed. If this option is disabled, new bottles of fluids must be loaded for a

Chapter 5: Software Description
© 2019 DYNEX Technologies Inc. 63 Part No. 91000200
Feature Description
worklist and the operator will not be prompted to add fluid to a bottle in its current location.
Dynamic Fluid Tracking for Controls, Standards and Samples
When enabled, the system checks the level of each control, standard or sample once during execution of a worklist, to reduce the incidence of false level detection when pipetting bubbly liquids. If this option is disabled, the system checks the level of each control, standard or sample each time a new pipette tip is used.
Note: Select all the three of these if running continuous loading, many
plates that use the same fluids.
Do not select this if loading many assays that use different fluids is continuous.
12. Click to save the settings.
5.7.2 Specifying Miscellaneous Operations 1. Click System Configuration on the tools menu to display the System Configuration
window (Figure 44), then click Operations tab.
Figure 44: System Configuration – Operations Tab
a. Duration Learn: Place a checkmark in the Duration Learn box to collect timing information during individual runs in order to obtain accurate timing estimates for scheduling each step in new assays.

Chapter 5: Software Description
Part No. 91000200 64 © 2019 DYNEX Technologies Inc.
Note: Duration Learn should only be enabled after assays are in their final configuration.
b. Auto Template Reduction: Place a checkmark in the Auto Template Reduction box to move controls or calibrators that are shown in the last wells of the plate on the assay template to instead be pipetted into wells that immediately follow the last sample.
c. Enable Boolean Function Assays: Place a checkmark in the Enable Boolean Function Assays box to enable the spreadsheet functionality that is required in order to perform data reduction for certain unique assays.
Note: Contact DYNEX Technical Support for more information regarding Enable Boolean Function Assays.
d. Debug Log: Place a checkmark in the Debug Log box and enter a name for the Debug Log to enable information capture in case of a malfunction. Include the serial number of the instrument in the name for the Debug Log.
Note: The Debug Log is composed of machine level commands between the PC and instrument that can be used to diagnose some problems. DYNEX recommends that this feature is enabled so that better technical assistance can be provided.
2. Click to save the settings.
5.7.3 Specifying Optical Density Limits 1. Select System Configuration on the tools menu to display the System
Configuration window (Figure 45).
Figure 45: System Configuration – Data Read Limits Tab

Chapter 5: Software Description
© 2019 DYNEX Technologies Inc. 65 Part No. 91000200
Note: The maximum OD for the DS2 is 3.00.
2. Click Data Read Limits tab.
3. In the OVER/UNDER Range = field, enter the maximum OD that will be numerically reported. If the measured OD for a sample is above this value, a result will not be reported for the sample and OVER will be displayed as the OD result for the sample.
4. Place a checkmark in the OVER/UNDER Conversion field to display something other than OVER when OD values are out of range.
Note: Numerical values may be needed if a QC equation that is used for verifying results includes a measured OD value.
For example: PC>0.8 will fail if the OD is reported as OVER but will pass if the OD is reported as 9.999.
5. In the OVER Value = field, enter the numerical absorbance value that will be displayed when optical density values are high out of range.
6. In the UNDER Value = field, enter the numerical absorbance value that will be displayed when optical density values are low out of range.
7. Click to save the settings.
5.7.4 Entering Laboratory Name and Information The laboratory name and information will be automatically included in each assay report if the assay specifies that the report contains this information.
Note: Refer to Chapter 6.16 for instructions on configuring an assay so that laboratory information is included in the results report.
1. Select System Configuration on the tools menu to display the System Configuration window (Chapter 5.7).

Chapter 5: Software Description
Part No. 91000200 66 © 2019 DYNEX Technologies Inc.
Figure 46: System Configuration – Laboratory Tab
2. Click Laboratory tab.
3. Enter the laboratory name, department, address, phone number and fax number as needed.
4. Click to save the settings.
5.7.5 Specifying Use of Barcode Check Digits and/or Leading Zeros The barcode scanner on the DS2 instrument can read six different barcode symbologies (Chapter 4.2.9) when scanning sample barcodes.
If use of a check digit is enabled for a symbology, the last numerical digit of the barcode is used to verify that the rest of the barcode is correct and will not appear as part of the sample ID. If “use check digit” is disabled, the last numerical digit will be part of the sample ID.
Use of a leading zero can also be enabled for UPCA and UPCE symbologies. If use of a leading zero is enabled, the first numeric digit in the barcode will appear as part of the sample ID, even if the numeric digit is a zero (0).
1. Select System Configuration on the tools menu to display the System Configuration screen (Figure 47).
2. Click Barcode Options tab.

Chapter 5: Software Description
© 2019 DYNEX Technologies Inc. 67 Part No. 91000200
Figure 47: Barcode Options Tab
3. Use Check Digit: Place a checkmark in the Use Check Digit field in the panel for a symbology to enable the use of a check digit.
Note: If use of a check digit is enabled for Codabar or IATA symbologies the calculation that was used to create the check digit must be selected from the drop-down menu.
Table 21: Barcode Symbologies Codabar IATA
modulo 10 Coupon + Form + Serial
modulo 16 Form + Serial
modulo 7 All data
4. Use Leading Zero: Place a checkmark in the Use Leading Zero field in the panel for UPCA or UPCE symbologies to enable the use of leading zeros.
5. Click to save the settings.
5.7.6 Specifying Creation and Saving of Self-Test Reports 1. Click System Configuration on the tools menu to display the System Configuration
screen (Figure 48).
2. Click Self-Test Report Options tab.

Chapter 5: Software Description
Part No. 91000200 68 © 2019 DYNEX Technologies Inc.
Figure 48: System Configuration – Self Test Report Options Tab
3. Place a checkmark in the Generate self-test report field if a self-test report is to be created and displayed during start-up of the system.
Note: DYNEX recommends you enable the Generate self-test report option as a way to record daily activity.
4. Place a checkmark in the Automatically save self-test report field to enable saving of each self-test report.
5. If saving of self-test reports is enabled, the format in which the reports are saved and the location where the reports are saved must be specified.
6. In the File format panel, click the radio button for the format in which the reports are saved:
PDF: Each self-test report is saved as a PDF. Excel: Each self-test report is saved as a Microsoft Excel® file.
7. In the Save directory field, click and navigate to the folder where the reports are to be saved.
Note: DYNEX recommends that the default location for where the reports are to be saved should not be changed.
8. Click to save the settings.

Chapter 5: Software Description
© 2019 DYNEX Technologies Inc. 69 Part No. 91000200
5.7.7 Configure Database Backup
5.7.7.1 Backup Frequency and Location of Backup Files 1. Click System Configuration on the tools menu to display the System Configuration
window (Figure 43).
2. Click Database Backup Options tab.
Figure 49: System Configuration – Database Backup Options
3. In the Backup Frequency field, click frequency of database backup from the drop-down list:
Disabled Daily Bi Daily Weekly Bi-Weekly Monthly Bi Monthly.
4. In the Backup Location field, click and navigate to the folder where the backup files are to be saved.

Chapter 5: Software Description
Part No. 91000200 70 © 2019 DYNEX Technologies Inc.
Figure 50: Example of Folder Listing
Note: DYNEX recommends that you do not change the default location (C:\Program Files\DYNEX Technologies\DS-Matrix\DatabaseBackup) for the backup files.
5. In the Backup Start fields, click date and time when the first backup is to be performed.
6. The date and time that the most recent backup was performed is shown in the Last Backup field. The date and time for the next backup is shown in the Next Backup field. If a backup has not been performed, never is shown in the field.
7. Click to save the settings.
5.7.7.2 Restoring a Database File 1. Select System Configuration on the tools menu to display the System
Configuration window (Figure 43).
2. Click Database Backup Options tab.
3. In the Restore panel, click button and navigate to the folder where the backup files are stored.
4. Click the database file that is to be restored.
5. Click to overwrite the current database with the selected database backup file.

Chapter 5: Software Description
© 2019 DYNEX Technologies Inc. 71 Part No. 91000200
Important: Any information in the current database will be overwritten. Any changes that were made since the time that the selected database backup file was made will be lost.
6. Click to cancel display of the System Configuration screen.
5.7.7.3 Deleting Unnecessary Database Backup Files Every six months, database backup files that will not be needed should be deleted from the folder where backup files are stored, to help prevent hard drive performance issues.
Typically, all of the backup database files except one or two early clean database backups and several of the most recent database backups should be deleted.
To delete the unnecessary backup files, open Windows Explorer and navigate to C:\Program Files\DYNEX Technologies\DS-Matrix\DatabaseBackup (or the folder specified by your facility) and delete the files.
5.7.8 Establish LIS Connection LIS-Link provides a data communication interface between the DS2 instrument and a laboratory host PC system. LIS-Link allows the instrument to communicate with the laboratory host PC to download pending test orders and to upload completed assay results.
Note: LIS-Link is not a standard option included with an instrument purchase. To receive the software, LIS-Link must be purchased as a separate line item in a quote or order.
Note: The DS2 PC must be connected to LIS. LIS-Link software must be installed before LIS options can be specified.
1. Click System Configuration from the tools menu to display the System Configuration window (Figure 43).
2. Click LIS Options tab.

Chapter 5: Software Description
Part No. 91000200 72 © 2019 DYNEX Technologies Inc.
Figure 51: LIS Options Tab
3. Place a checkmark in the Enable LIS Support box to enable use of LIS-Link software with DS-Matrix software.
4. The LIS Service Information panel will populate with the version, installation directory and data directory when connectivity is made with When connectivity is made with the LIS-LINK software.
5. Place a checkmark in the When reprocessing plate data files output file to LIS as well field to transmit the new report to the LIS if results in a report are reprocessed.
6. Place a checkmark in the Always warn before outputting to LIS before reprocessing field to warn the operator before transmitting the new report to the LIS if results in a report are reprocessed.
7. Place a checkmark in the Replace OD Results to enable specifying what values are transmitted to the LIS when the OD result is reported as a text string Over, Under, and Invalid (*****) and not a numerical OD value.
Note: If Replace OD Results is enabled, enter the values that will replace the reported results for Over, Under or Invalid (*****) wells.
8. In the Over Value field, enter the value that will be transmitted to the LIS to replace a result reported as OVER.
9. In the Under Value field, enter the value that will be transmitted to the LIS to replace a result reported as UNDER.
10. In the Invalid Value field, enter the value that will be transmitted to the LIS to replace a result reported as Invalid (*****).
11. Click to save the settings.

Chapter 5: Software Description
© 2019 DYNEX Technologies Inc. 73 Part No. 91000200
Figure 52: Save Settings
5.8 Establish an E-mail Connection DS-Matrix software can automatically send a message to a specified e-mail address whenever a system error occurs.
Note: The DS2 PC must be connected to the Network and an e-mail server (the SMTP server) must be available.
5.8.1 Specify Automatic E-mail Notification of System Errors 1. Select User Notification from the tools menu to display the Setup tab of the Email
Setup dialog box.
Figure 53: E-mail Setup

Chapter 5: Software Description
Part No. 91000200 74 © 2019 DYNEX Technologies Inc.
2. In the To field, enter the e-mail address to which error messages should be sent.
3. In the From field, enter the e-mail address of the sender.
4. In the SMTP Server field, enter the name of the SMTP server for the sender’s E-mail address.
For example: smtp.gmail.com or mail.bellsouth.net.
5. Click to save the information.
6. Click to send a test e-mail.
7. Click at the top right-hand side of the dialog box to close the Email Setup dialog box.
5.8.2 Manually Send an E-mail Message 1. Click User Notification from the tools menu to display the Setup tab of the Email
Setup dialog box.
2. Click Manual tab.
Figure 54: Manual Email Setup
3. In the To field, enter the e-mail address to which the message will be sent.
4. In the From field, enter your e-mail address.
5. Enter the subject and message test as needed.
6. Click to send the e-mail.
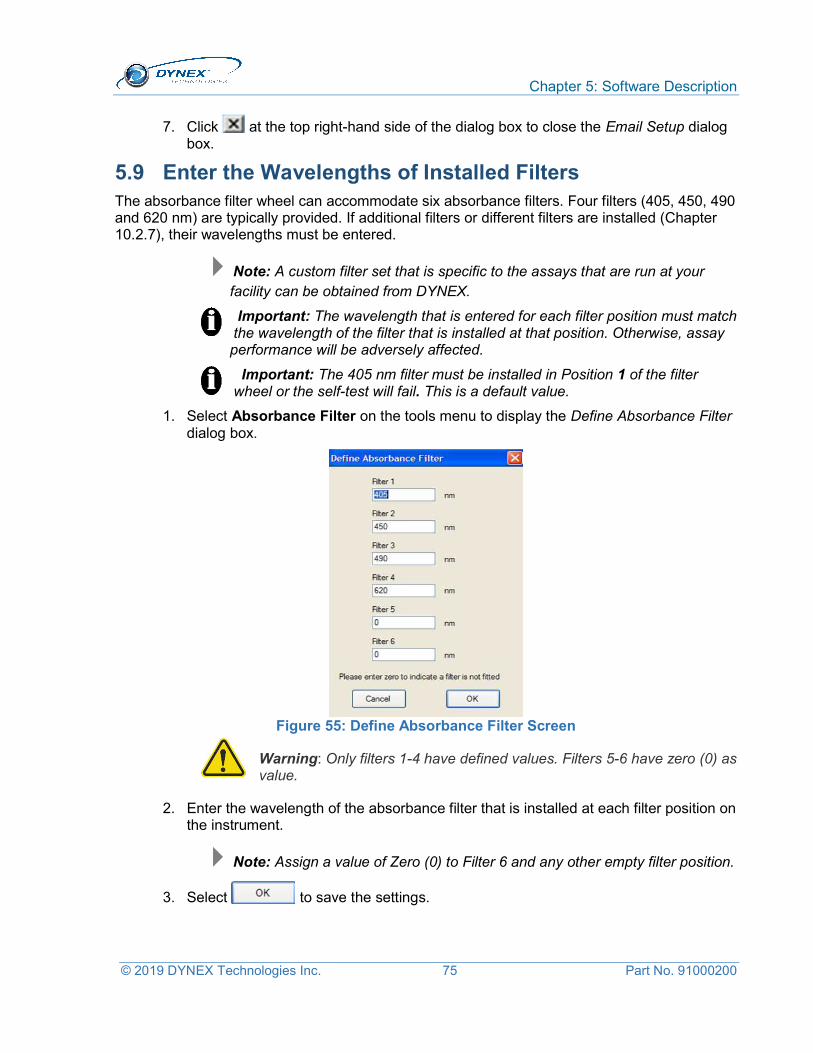
Chapter 5: Software Description
© 2019 DYNEX Technologies Inc. 75 Part No. 91000200
7. Click at the top right-hand side of the dialog box to close the Email Setup dialog box.
5.9 Enter the Wavelengths of Installed Filters The absorbance filter wheel can accommodate six absorbance filters. Four filters (405, 450, 490 and 620 nm) are typically provided. If additional filters or different filters are installed (Chapter 10.2.7), their wavelengths must be entered.
Note: A custom filter set that is specific to the assays that are run at your facility can be obtained from DYNEX.
Important: The wavelength that is entered for each filter position must match the wavelength of the filter that is installed at that position. Otherwise, assay performance will be adversely affected.
Important: The 405 nm filter must be installed in Position 1 of the filter wheel or the self-test will fail. This is a default value.
1. Select Absorbance Filter on the tools menu to display the Define Absorbance Filter dialog box.
Figure 55: Define Absorbance Filter Screen
Warning: Only filters 1-4 have defined values. Filters 5-6 have zero (0) as value.
2. Enter the wavelength of the absorbance filter that is installed at each filter position on the instrument.
Note: Assign a value of Zero (0) to Filter 6 and any other empty filter position.
3. Select to save the settings.

Chapter 5: Software Description
Part No. 91000200 76 © 2019 DYNEX Technologies Inc.
Note: A reader module self-test will be automatically run when the settings are saved.
5.10 Import or Export Files Assay files can be imported from another DS2 instrument or exported for use in another DS2 instrument. Raw data (optical density) results or the ESP database can be imported from another DS2 instrument or exported for use in another DS2 instrument or in a spreadsheet program such as Microsoft Excel®.
Note: DS-Matrix assay files can only be used on another DS2 instrument and cannot be opened as a document or spreadsheet.
Important: Data files may be exported and imported to another DS2 instrument. The database can NOT be exported to another DS2 instrument.
5.10.1 Export an Assay File 1. Select Import/Export from the tools menu to display the Import/Export dialog box.
Figure 56: Import/Export Screen
Note: Assays will not run on an instrument that does not have nm filters installed.
2. Click Export radio button at the top of the dialog box.
3. In the Subject(s) panel, place a checkmark in the Assay box. Assay files on the system are listed adjacent to the Assay box.

Chapter 5: Software Description
© 2019 DYNEX Technologies Inc. 77 Part No. 91000200
4. If needed, click radio button in the adjacent Filter panel that corresponds to the manner in which the assay files should be filtered.
Name: Assay files will be listed in the alphabetical order of their name.
Category: Only assay files for the category selected from the adjacent drop-down list will be listed.
Last Edited Date: Only assay files that were edited after the date selected from the adjacent drop-down list will be listed.
5. From the filtered listing of assay files, click assay file(s) that will be exported.
6. Click and navigate to the location to where the assay file will be exported.
7. Click File Name field at the bottom of the dialog box and enter a name for the assay file that is being exported.
Note: An .xml extension will be added to the assay file name when it is exported.
8. Click to export the file to the designated location.
5.10.2 Export a Result Data File or the ESP Database 1. Select Import/Export on the tools menu to display the Import/Export dialog box
(Chapter 5.10).
2. Click Export radio button at the top of the dialog box.
3. In the Subject(s) panel, place a checkmark in the boxes corresponding to the type of data file that is to be exported.
OD Values in XDB File: Raw data file with a .xdb extension. The file can only be opened and used on another DS2 instrument.
OD Values in CSV File: Raw data file in comma separated values format with a .csv extension. The file can be opened and used on any spreadsheet program such as Microsoft Excel®. Well locations will be in the first column and optical densities will be in the second column.
ESP Data: ESP database.
4. If result data files were selected, names of all of the result data files on the system are listed adjacent to the checkbox. If the ESP database was selected, the filename is not shown.
5. If result data files were selected, click radio button in the adjacent Filter panel corresponding to how the result data files should be filtered.
Plate: Result data files will be listed in the alphabetical order of their plate name. Run Date: Only result data files for assays that were run on the date selected
from the adjacent drop-down list will be listed.
6. Click file that will be exported from the filtered listing of files.

Chapter 5: Software Description
Part No. 91000200 78 © 2019 DYNEX Technologies Inc.
7. Click and navigate to the location to where the raw data file(s) or the ESP database will be exported.
8. Click File Name field at the bottom of the dialog box and enter a name for the raw data file or ESP database that is being exported.
9. Click to export the file to the designated location.
5.10.3 Import an Assay File 1. Select Import/Export on the tools menu to display the Import/Export
dialog box (Chapter 5.10.1).
2. Click Import radio button at the top of the dialog box.
3. Click and navigate to the location from where the assay file will be imported. Names of assay files at that location are listed.
Note: Only files with .xml extension can be imported for assays.
4. Click File Name field at the bottom of the dialog box and enter a name for the assay file that is being imported.
5. Click to import the file.
5.10.4 Import a Result Data File 1. Click Tools Import/Export to display the Import/Export
dialog box (Chapter 5.10.2).
2. Click Import radio button at the top of the dialog box.
3. Click and navigate to the location from where the result data file or ESP database will be imported. Names of files at that location are listed adjacent to the Plate box.
Note: Only files with a .xdb extension can be imported for plates.
4. Click the File Name field and enter a name for the raw data file or ESP database that is being imported.
5. Click to import the file.
5.10.4.1 Import an ESP Database
Important: Data files may be exported and imported to another DS2 instrument. The ESP database can NOT be exported to another DS2
instrument.

Chapter 5: Software Description
© 2019 DYNEX Technologies Inc. 79 Part No. 91000200
5.11 Reset Autorecovery The Autorecovery function automatically performs the corrective action that was previously performed by the operator when a specific error occurs. This is enable at the time of system recovery.
The Reset Autorecovery command deletes the user-selected corrective action for a particular error. The next time that error occurs, the instrument does not automatically perform that corrective action but instead prompts the operator to select a corrective action.
1. Select Reset Autorecovery… from the tools menu to display the Reset Autorecovery dialog box.
Figure 57: Reset Autorecovery Screen
2. Place a checkmark next to the automatic recovery action that is to be deleted.
3. Click to delete that automatic recovery action.
4. Click to close the Reset Autorecovery dialog box.
Important: Use the Reset Autorecovery and Autorecovery functions with caution:

Chapter 5: Software Description
Part No. 91000200 80 © 2019 DYNEX Technologies Inc.
5.12 Error Detection and Error Recovery
If an error occurs during operation of the DS2 instrument, an audible alarm sounds (if enabled) and the Error Recovery screen is displayed, indicating the error that has occurred and options for recovering from the error.
Figure 58: Error Recovery Screen
5.12.1 Recover from an Error Review the description of the error that has occurred.
1. Click drop-down arrow and select an error recovery option.
Figure 59: Error Recovery Option Drop-Down
2. Click to execute the selected recovery option.
5.12.2 Specify Automatic Recovery from an Error
Important: DYNEX does not recommend enabling autorecovery.
1. Review the description of the error that has occurred.
2. Place a checkmark in the Autorecovery checkbox.
3. Click drop-down arrow and select an error recovery option.
4. Click to execute the selected recovery option. The specified option will be automatically executed whenever an error with the same numerical code occurs again.
Error recovery options
Description of the error

Chapter 5: Software Description
© 2019 DYNEX Technologies Inc. 81 Part No. 91000200
5.13 DS2 Toolbox Software
DS2 Toolbox software is provided for use in setting up and troubleshooting the DS2 instrument. Installation and use of DS2 Toolbox software should only be performed by a specially trained technician.
Note: An instruction manual for use of DS2 Toolbox software is included in the DS2 Toolbox CD.
There is a potential conflict when using the DS2 Toolbox Software on a PC with a Windows version that is not the ‘English’ version. Depending on the WIN version language, the decimal symbol (.) could be set to a comma symbol (,). This difference will lead to problems running the ‘Arm Calibration’ or ‘Plate Verification’ and cause incorrect software interpretation of values causing calibration issues and failed verification plate readings.
To prevent conflicts when using the DS2 Toolbox Software, the Regional Settings for the PC must be set to ‘English (United States)’. Refer to DYNEX Technical Bulletin 236 for additional information.

Chapter 5: Software Description
Part No. 91000200 82 © 2019 DYNEX Technologies Inc.
This page left intentionally blank.

Chapter 6: Assay Editor
© 2019 DYNEX Technologies Inc. 83 Part No. 91000200
Chapter 6: Assay Editor The Assay Editor enables laboratory personnel to prepare user-defined assays for use on the DS2 system.
Caution: Validation studies must be performed by your facility to assure proper performance of assays before the assays can be used for testing samples.
The validation studies must include validation of results transmittal to your laboratory information management systems (LIS/LIMS). Failure to do this can lead to reporting of incorrect test results.
After a user-defined assay has been created, it is used by the instrument to control pipetting of samples, dispensing of reagents, incubation and washing of wells, reading of the plate and calculation, exporting and reporting of results.
The process for creating an assay with the Assay Editor is summarized below.
Figure 60: Creating an Assay Using the Assay Editor

Chapter 6: Assay Editor
Part No. 91000200 84 © 2019 DYNEX Technologies Inc.
6.1 Start Assay Editor To start Assay Editor, perform the following:
1. Click File Assay Editor to display the Assay Editor window (Figure 62).
Figure 61: Assay Editor Window
6.1.1 Assay Editor Window
The Assay Editor window contains: File menu Operation toolbar Animate button Trash can icon Protocol panel Configuration panel Assay summary.

Chapter 6: Assay Editor
© 2019 DYNEX Technologies Inc. 85 Part No. 91000200
Figure 62: Assay Editor Window
6.1.2 File Menu
The File menu contains the following commands:
Table 22: File Menu Commands Command Description
New Creates a new assay. Open Opens and modifies an existing assay Delete Deletes an existing assay Save Saves the assay with the existing filename Save As Saves the assay with a new filename Print Description Text Prints the assay test description
Recent Assays Displays a listing of assays, which allows the operator to review or modify an assay.
Exit Closes the Assay Editor.
6.1.2.1 Create a New Assay
1. Click File New.
2. Enter information for the new assay and specify each operation for the assay as outlined in the following sections.
3. When all of the operations in an assay have been programmed, select Save from the Assay Editor File menu. The Save Assay dialog box is displayed.
File MenuOperation Toolbar
Protocol Panel
Configurationpanel
Assay summary
Trash Can icon Animate button

Chapter 6: Assay Editor
Part No. 91000200 86 © 2019 DYNEX Technologies Inc.
Figure 63: Save Assay Screen
4. Type a name for the assay (required).
5. Type or select from the drop-down menu a category for the assay.
Note: Assays can be grouped into categories for ease of retrieval. Use of assay categories is optional.
6. Click to save the assay.
6.1.2.2 Open an Existing Assay
1. Click File Open.
2. The Open Assay dialog box is displayed.
Figure 64: Open Assay Dialog Box
3. Use the drop-down arrow to click assay that is to be modified.
4. Click to open the assay.
5. Update information and operations for the assay.

Chapter 6: Assay Editor
© 2019 DYNEX Technologies Inc. 87 Part No. 91000200
6.1.2.3 Delete an Existing Assay
1. Click File Delete.
2. The Open Assay dialog box is displayed.
Figure 65: Delete Assay Dialog Box
3. Click to delete the assay.
4. The assay is deleted.
6.1.2.4 Save and Save As
Save As is a command that causes a copy of the current document.
Save is a command that stores the data back to the file and folder it originally came from.
1. Click File Save or Click File Save As.
Note: If all the needed information is not filled in, an error message pop-up is
displayed. Click . Enter the needed information and try to save again.
Figure 66: Assay Editor Error Message Pop-Up
2. When all information is entered, the following pop-up dialog box is displayed if it is a new file. If it is an existing file, this box is not displayed, the file is saved to the existing location.

Chapter 6: Assay Editor
Part No. 91000200 88 © 2019 DYNEX Technologies Inc.
Figure 67: Save Assay As Pop-Up Dialog Box
3. Enter the name and category by entering the information or using the drop-down list.
4. Click to save the file.
6.1.2.5 Print Description Text
To print the description text of an existing assay, perform the following steps:
1. Click File Print Description Text.
2. The following is an example of what is displayed.
Figure 68: Print Description Example
Table 23 lists the commands and a description for the print description screen.

Chapter 6: Assay Editor
© 2019 DYNEX Technologies Inc. 89 Part No. 91000200
Table 23: Print Description Text Screen Commands Command Description
Print Lists all printers attached to the instrument.
Zoom To cause text or other graphics in a window or frame to appear larger on the screen.
Font Change font, font style and size of the characters.
PageUp and PageDn To cause text or other graphics in a window or frame to appear larger or smaller on the screen.
Page Setup To change the set of specific parameters involving the display and layout of a printed page.
Outlier Removal Display a dialog box for removing one or more outliers.
Recalculate Date Displays the option to recalculate the current data with a different assay file with different calculation settings.
Save As Command in the File menu that causes a copy of the current document. Save is a command that stores the data back to the file and folder it originally came from.
Save Concentration Curve Display a dialog box for saving a curve fit calibration curve for use with other runs with that assay (Figure 166).
6.1.2.6 Recent Assays
To view the recent assays, perform the following steps:
1. Click File Recent Assays.
2. A list of recent assays is displayed.
6.1.2.7 Exit
To exit Assay Editor, perform the following steps:
1. Click File Exit.
2. If the assay has not been saved the following pop-up message is displayed:
Figure 69: Exit Assay Editor Message
3. Click to save the assay. If the assay has not been currently save the following pop-up message is displayed.

Chapter 6: Assay Editor
Part No. 91000200 90 © 2019 DYNEX Technologies Inc.
Figure 70: Save Assay As Dialog Box
4. Enter the name and category by selecting from the drop-down box or entering the information in each field box.
5. Click .
6. If the correct information is not entered, the following pop-up is displayed:
Figure 71: Assay Editor Save Pop-Up Message
7. Click and enter the needed information.
8. The assay is saved.
6.1.3 Operations Toolbar
The Operations toolbar contains icons for all of the additional operations that can be included in an assay.
Figure 72: Operations Toolbar
Table 24 describes the operation icons and purpose.
Table 24: Operations Icons and Purpose Operation Label Purpose
Dispensing
Specify the wells into which reagents are dispensed and the fluids and volumes that are dispensed into each well (Chapter 6.5).

Chapter 6: Assay Editor
© 2019 DYNEX Technologies Inc. 91 Part No. 91000200
Operation Label Purpose
Pipetting
Specify the wells into which samples, controls and standards are pipetted, the fluid and volume pipetted into each well and the Protocol for executing dilutions (Chapter 6.6).
Verification
Verify the presence of strips and addition of fluid to wells by reading the plate following pipetting of samples and/or dispensing of reagent (Chapter 6.7).
Incubation
Specify the temperature, presence of shaking, starting time and duration of an incubation (Chapter 6.8).
Washing
Specify the timing, mode and number of wash cycles and use of dispense, fill, soak, aspirate, purge and clean (Chapter 6.9).
Reading
Specify the wavelength(s), use of blanking, use of shaking and duration of shaking during reading (Chapter 6.10).
Quality Control
Specify quality control equations to verify the raw data or processed results to ensure that an assay is valid and that the data generated can be accepted (Chapter 6.11).
Ratio Operation
Specify equations for converting results and for verifying the converted results, result flagging criteria and formatting of converted results in the report (Chapter 6.12).
Threshold Calculation
Specify equations for defining up to six qualitative levels, equations for validating the qualitative results and formatting of qualitative results in the report (Chapter 6.13).
Curve Fit Calculation
Specify units, concentrations, use of variable standard multiplier and use of normalization for defining the standards. Specify fit type calculation option, axes, sigmoid parameters, graphs and results flagging (Chapter 6.14).
Spreadsheet Calculation
Specify the equation, results calculation method, result flagging criteria and formatting of results in the report (Chapter 6.15).
Report Format
Specify the information that will be reported and the order in which it will be reported, information that will be included in the header and footer, the manner in which results are calculated and reported and whether and how results are exported (Chapter 6.16).
6.1.3.1 Adding an Operation to an Assay
Note: The assay information and a password must be entered into the Assay Information dialog box and saved (Figure 77) before an operation can be added and configured for an assay.
Click and drag an icon for an operation from the Operation toolbar to the Protocol panel to add the operation to an assay.

Chapter 6: Assay Editor
Part No. 91000200 92 © 2019 DYNEX Technologies Inc.
For example: If the first step in an assay is to dispense a reagent into a specified
number of wells, drag from the Operation panel to the position on the Protocol panel where the operation is to be executed.
Figure 73: Adding an Operation to an Assay
Note: At least one additional operation must be added to the default operations in the Protocol panel.
6.1.4 Protocol Panel
The Protocol panel contains icons for each operation that is specified to occur in the assay, in the order that each operation is performed. Three operations MUST be included in every assay and are already present in the Protocol panel.
Table 25: Protocol Icons and Purpose
Icon Purpose
Assay Information: Specify the title and author of the assay, a password for changing the assay and whether the operator is prompted to enter lot information at runtime (Chapter 6.2).
Template: Specify the well types on the plate, the number of replicates that are tested for each sample and whether wells will be processed by column or by row (Chapter 6.4).
Report Layout: Specify how information will be reported, information in the header and footer, the manner in which results are calculated and reported and whether and how results are exported (Chapter 6.16).
6.1.4.1 Change the Order of Operations
Icons for the operations that are to be performed in an assay are shown in the Protocol panel in the order that each operation is to be performed.
To change the order of operations in the Protocol pane, click icon for an operation that is to be performed before or after a different operation and drag it to its new location.

Chapter 6: Assay Editor
© 2019 DYNEX Technologies Inc. 93 Part No. 91000200
6.1.4.2 Configure an Operation
Click an icon in the Protocol panel for an operation that is to be configured. The form(s) for configuring that operation are displayed in the Configuration panel.
For example: Click to display a diagram for specifying the wells into which reagent is to be dispensed and the reagent and volume that are to be dispensed into each of the specified wells.
Note: Detailed instructions for configuring each operation are provided in this chapter.
6.1.5 Assay Summary
The assay summary provides a summarized description of each operation that has been configured for the assay. If needed, use the scroll bar to move through each step. The operation that is currently being configured is shown in blue.
Note: Operations that have been added to the assay but have not yet been configured are listed without information.
Figure 74: Assay Summary

Chapter 6: Assay Editor
Part No. 91000200 94 © 2019 DYNEX Technologies Inc.
6.1.6 Animate Button
1. displays the Assay Simulation screen (Figure 75).
Figure 75: Assay Simulation Screen
2. Click to run the simulator.
Note: If the Number of Samples is equal to zero, the play button will be
greyed out until selected.
3. The Assay Simulator screen is displayed and allows for visualization of each step as the assay proceeds.
Figure 76: Assay Simulator

Chapter 6: Assay Editor
© 2019 DYNEX Technologies Inc. 95 Part No. 91000200
6.1.7 Trash Can Icon
Click to delete operations from the protocol panel.
6.2 Import an Assay
Note: DS2 assays do NOT use an .asy extension.
The assay files are typically small files and can easily be sent as an email attachment.
After importing an assay into DS-Matrix, a screen may be displayed upon first use of the assay. This means that the assay file was created elsewhere and uses a consumable or item that already exists in the instrument’s database.
6.3 Create or Update Assay Information
1. Click to display the Assay Properties form in the Configuration panel.
Figure 77: Assay Properties Form
2. Enter (or modify) the title of the assay in the Title field.
3. Enter your name in the Author field.
4. Enter (or modify) the password in the Password field (optional).
Note: The password must be entered when the saved assay is subsequently opened in the Assay Editor for updating or reviewing.

Chapter 6: Assay Editor
Part No. 91000200 96 © 2019 DYNEX Technologies Inc.
5. If entry of lot and expiration information for all consumables and fluids each time the assay is run, ensure a checkmark is placed in the Request kit lot data at run time checkbox.
6. If the assay requires two repeated plate readings, select the Use multiple read operations checkbox.
7. Select the operation mode:
Background Read Mode – the read operations can be separated by dispense, incubation, or wash operations as needed. The raw data supplied to data reduction is the second measurement minus the first measurement. Refer to Appendix B for more details.
Multi Read Mode – a special purpose read mode where the read operations are consecutive (not separated) and data reduction is not performed. The measured OD is exported for use in an external software package.
8. Click to save the assay information, to automatically assign a unique Assay ID and to display the title and author in the assay summary.
Note: A different Assay ID is assigned to an assay each time it is updated. The Assay ID is a part of the test record for each test that is performed on the DS2 instrument, enabling traceability of the assay version.
Note: Multiple Read Operations assays are new in DS-Matrix version 1.40. A multiple read assay will not work in DS-Matrix 1.35 or earlier.
6.4 Define the Well Template The well template is used to specify the orientation of the worklist progression, the number of replicates that are tested for each sample and the well type in each position on the plate.
6.4.1 Assign Well Types
1. Select to display the Well Template form in the Configuration panel.
Figure 78: Assigning Well Types

Chapter 6: Assay Editor
© 2019 DYNEX Technologies Inc. 97 Part No. 91000200
2. Click to clear the well type labels that are currently displayed for each well on the plate diagram.
3. Use the up arrow or down arrow in the Replicates panel to specify the number of replicates that will be tested for each sample in the worklist.
4. Click by Column or by Row radio button in the Replicates panel to specify whether replicates will be pipetted and processed by column or by row.
by row by column
Figure 79: Replicates Panel
5. To define the wells, select Well Type then click the well location. In the Well Type panel, click icon for the type of sample that will be pipetted and tested first (in well A1) on the plate.
6. Then click wells on the plate diagram into which that sample type will be pipetted.
Figure 80: Well Type Panel
Table 26 describes the sample types and descriptions.
Table 26: Sample Types and Descriptions
Icon Sample Type Description
Empty Removes the current well type label.
Test Designates a test sample.
Standard Designates a standard.
Control Designates a control.

Chapter 6: Assay Editor
Part No. 91000200 98 © 2019 DYNEX Technologies Inc.
Icon Sample Type Description
Negative Control. Designates a negative control.
Positive Control Designates a positive control.
Blank Designates a blank well.
Cut-off Control Designates a cut-off control.
Positive Reference Designates a positive reference.
Serum Control Designates a serum control.
Antigen Control Designates an antigen control.
Negative Designates a negative reference sample.
Hemolyzed Sample Designates a hemolyzed sample.
Note: All sample types except Empty, Test, Standard, Control and Blank are user-defined and can be changed as needed.
7. Repeat Step 5 to populate the remainder of the plate with the well types that are to be tested.
Note: If needed, select and then select one or more wells to remove the current well type label from the selected wells.
8. Click to remove the well type label from all of the wells.
9. In the Microplate field, click type of microplate that will be used for the assay from the drop-down list.
Note: A record for a microplate type must exist in the database in order for that type to be included in the drop-down list.
10. Click to save the template information and display the information in the assay summary.
6.4.2 Customize Well Types
1. Click operation icon to display the Well Template form in the Configuration panel.
2. In the Well Type panel, click icon for the type of sample that is to be changed.

Chapter 6: Assay Editor
© 2019 DYNEX Technologies Inc. 99 Part No. 91000200
Note: Any sample type except Empty, Test, Standard, Control and Blank can be changed.
3. Click to display the Define Well Type dialog box for the selected sample type.
Figure 81: Define Well Type Dialog Box
4. In the Well Label field, enter the label (up to three alphabetic characters) for the new well type.
5. Click and select from the drop-down list of colors.
6. In the Well Description field, enter a short description of the new well type.
7. Click . The new well is displayed in the Well Type panel and is available for use on the well template.

Chapter 6: Assay Editor
Part No. 91000200 100 © 2019 DYNEX Technologies Inc.
6.5 Specify a Dispensing Operation The dispensing operation is used to pipette reagents (reagent blanks, conjugate, substrate, etc.) to the microplate using a reagent tip. Fluids defined as standards, controls and specimens cannot be transferred to the plate using a dispense operation.
1. Drag from the Operation panel to the position on the Protocol panel where the operation should be executed. The Dispensing form is displayed in the Configuration panel.
Figure 82: Dispensing Form
2. If needed, click to clear existing checkmarks from any wells on the plate diagram.
Note: changes to when all of the checkmarks are cleared.
3. Click wells that a reagent will be dispensed into by one of the following methods:
Select wells individually Select and drag the mouse cursor over a series of wells
Click .
4. A checkmark is placed on each well that is selected for dispensing the reagent into.
Figure 83: Checkmarks for Selected Dispensing Reagent
5. In the Fluid panel, select from the drop-down list the fluid that will be pipetted into each selected well.

Chapter 6: Assay Editor
© 2019 DYNEX Technologies Inc. 101 Part No. 91000200
For example: TMB A
Note: If needed, click to create a record for a new fluid in the database (Chapter 13.1). A record for a fluid must exist in the database in order for that fluid to be included in the drop-down list.
6. In the Volume field, enter the volume of that fluid that is to be dispensed into each selected well.
7. Optional: In the Well Dispense Delay (0 - 10) field, click length of time (from 0. 1 to 10.0 seconds) that the instrument will wait before dispensing fluid into the next well on the plate. This feature can be used to synchronize dispense timings for reagents in order to reduce assay drift.
8. Click to save the dispense operation and display the information in the assay summary.
6.6 Specify a Pipetting Operation The pipetting operation is used to pipette samples (standards, controls or test specimens) to wells in the plate. The pipetting operation can also include a dilution of one or more of the standards or controls or each of the specimens.
6.6.1 Pipetting of Undiluted Standards, Controls or Specimens
1. Drag the operation icon from the Operation panel to the position on the Protocol panel where the operation should be executed. The Pipetting form is displayed in the Configuration panel.
Figure 84: Pipetting Form
2. Select and click up to 3 times the wells (A1 and A2 in the example) which will contain the standard, control or test specimens for testing.

Chapter 6: Assay Editor
Part No. 91000200 102 © 2019 DYNEX Technologies Inc.
a. Click the selected wells once if either standards, controls or specimens will be pipetted into those wells after they have been diluted in deep well strips. The border will be red.
Figure 85: Red Border – Dilution in Deep Wells
b. Click the selected wells twice if diluent will be dispensed into those wells before the standards, controls or specimens are pipetted into those wells. The border will be green.
Figure 86: Green Border – Dilution in Microplate
c. Click the selected wells three times if standards, controls or specimens will be dispensed into those wells without a dilution. There will be no border.
Figure 87: No Border – No Dilution
3. Specify the samples (Standards, Controls, Specimens) that will be pipetted into the selected well(s), the volume that will be pipetted and the manner in which those samples will be pipetted.
4. In the Neat field of the Well Options panel, use the drop-down list to specify whether a specific standard, a specific control or test specimens will be pipetted into the well(s).
Note: If needed, click to create a record for a new standard or control in the database (Chapter 13.1). A record for a standard or control must exist in the database in order for it to be included in the drop-down list.
5. Optional: click the ESP profile for that fluid type to specify that pipetting of the standard or control will be monitored with ESP.
Note: An ESP calibration (Chapter 13.4) must be performed for that fluid type and saved in order for ESP monitoring to be available for that fluid type in the drop-down list.
6. In the Neat Volume field, enter the volume of the standard or control that will be pipetted into the selected wells.
7. Place a checkmark in the Multi-shot allowed checkbox if a single aspiration of the standard or control will be dispensed into multiple wells for replicates.
8. Place a checkmark in the Use new tip checkbox if a new tip must be used for each aspiration and dispense into multiple wells for replicates.

Chapter 6: Assay Editor
© 2019 DYNEX Technologies Inc. 103 Part No. 91000200
Note: If multi-shot allowed nor use new tip are enabled, the same tip will be used for each aspiration and dispense into multiple wells for replicates.
9. Repeat Steps 2 and 3 for the wells into which each standard, control and specimen will be pipetted.
10. Click to display a dialog box showing the order in which the standards, controls and samples will be pipetted.
11. If needed, enter the Max post pipette time field the number of minutes that can elapse between completion of pipetting and the next scheduled operation.
Note: This feature is useful when pipetting two plates, to prevent one plate from being inactive for an extended period of time while operations are performed on the other plate.
12. Click to save the pipetting operation and display the information in the assay summary.
6.6.2 Diluting and then Pipetting Standards, Controls or Specimens The manner in which standards, controls or specimens are diluted depends on the dilution that will be made. Dilution ratios that do not exceed 1:29 (one part of sample plus 29 parts of diluent) can be either be made in the microplate or in deep well strips, while dilution ratios that exceed 1:29 must be made in deep well strips.
Table 27: Dilutions Methods and Ratios
Dilution Method Allowable Range of Dilution Ratios
Single-Stage Dilution in Microplate Wells
Dilution ratios ranging from 12.5:1 (For example: 125 µL of sample is added to 10 µL of diluent) to 1:29 (For example: 10 µL of sample is added to 290 µL of diluent).
Single-Stage Dilution in Deep Wells
Dilution ratios ranging from 12.5:1 (For example: 125 µL of sample is added to 10 µL of diluent) to 1:199 (For example: 10 µL of sample is added to 1,990 µL of diluent).
Two-Stage Dilution in Deep Wells
Dilution ratios ranging from 156:1 to 1:39,601 (For example: 10 µL of sample is added to 1,990 µL of diluent in the first stage, from which a second dilution of 10 µL of diluted sample plus 1,990 µL of diluent is then made).
1. Drag from the Operation panel to the position on the Protocol panel where the operation should be executed. The Pipetting form is displayed in the Configuration panel.

Chapter 6: Assay Editor
Part No. 91000200 104 © 2019 DYNEX Technologies Inc.
Figure 88: Pipetting Form in the Configuration Panel
2. Single-click (for performing the dilution in deep wells) or double-click (for performing the dilution in the selected microplate wells) the well(s) (A1 and A2 in the example) which will contain the diluted sample for testing.
3. Red or green borders around the selected wells indicate that a dilution will be performed (Chapter 6.6.1) and the Deep Well Dilution Options panel replaces the Well Options panel. Target Volume is shown when the borders are red.
Figure 89: Plate Options Panel

Chapter 6: Assay Editor
© 2019 DYNEX Technologies Inc. 105 Part No. 91000200
4. In the Neat field of the Definition tab, use the drop-down list to specify whether a specific standard, a specific control or test specimens will be diluted and then tested in the selected well(s).
Note: If needed, click to create a record for a new standard or control in the database (Chapter 13.1). A record for a standard or control must exist in the database in order for it to be included in the drop-down list.
Optional: Click ESP profile for the standard or control to specify that pipetting of the standard or control will be monitored with ESP.
Note: An ESP calibration must be performed for that standard or control and saved in order for ESP monitoring to be available for that material in the drop-down list (Chapter 13.4).
5. In the Diluent field of the Initial Dilution tab, use the drop-down list to specify which diluent will be used:
Sample Diluent Fluid Sample Reagent Fluid.
Figure 90: Initial Dilution Tab
Note: All dilutions are made by dispensing diluent into a microplate well or deep well and then pipetting the standard, control or test specimens into the diluent.
6. In the Neat Volume field of the Initial Dilution tab, enter the volume of the standard, control or test specimen that will be pipetted into the specified diluent.

Chapter 6: Assay Editor
Part No. 91000200 106 © 2019 DYNEX Technologies Inc.
7. Click radio button in the Initial Dilution tab that corresponds to the dilution ratio. The fields that are displayed and the procedure for specifying the dilution ratio depend upon the radio button selection.
Table 28: Procedure to Specify Dilutions Ratio
Radio Button Procedure to Specify the Dilution Ratio
1 in … Enter the total number of parts (i.e.,1 in … 1 in 200 for 200 final volume) for the dilution.
1 to … Enter the number of parts (i.e., 1 to …. 1 to 199 for the 200 volume) of diluent that are used.
Diluent Volume Enter the volume (in µL) of diluent that will be dispensed into a microplate well or deep well.
8. Place a checkmark in the Two Stage Dilution checkbox if a two-stage dilution will be used. A Secondary Dilution tab will be displayed adjacent to the Initial Dilution tab.
Figure 91: Two Stage Dilution
9. Repeat Steps 6 and 7 on the Secondary Dilution tab to specify the manner in which the second stage of the dilution will be performed.
10. Place a checkmark in the Allow sample dilutions to be changed at run time checkbox to enable the operator to specify different dilutions when creating a worklist. The Normalization checkbox should also be checked in the Curve Fit operation (Chapter 6.14) to ensure results are calculated correctly.
11. In the Let deep wells stand before pipetting field, use the up and down arrows to enter the length of time (from 0.01 to 60.00 minutes) that diluted standards, controls

Chapter 6: Assay Editor
© 2019 DYNEX Technologies Inc. 107 Part No. 91000200
or specimens can remain in deep wells before they must be pipetted into microplate wells.
12. In the Optimizations tab of the Deep Well Dilution Options panel, place checkmarks in the checkboxes for each feature that is to be enabled. Refer to Figure 92.
Figure 92: Deep Well Dilution Options
Table 29 describes the optimizations tab selections.
Table 29: Optimizations Tab Selections
Selection Description of the Feature
Use new tip for dispense of sample A new sample tip will be used to pipette each well.
Multi-shot for dispense of sample
The same sample tip will be used for replicates. If sample for more than one replicate can be aspirated at one time, the required volume will be aspirated and then pipetted into well.
Share dilution wells for microplate replicates (volumes will be scaled)
Only one dilution will be made for an individual sample. The dilution will be used for all the replicates that assay in the worklist
Share dilution wells across multiple assays (volumes will be scaled)
Only one dilution will be made for an individual sample. The dilution will be used for all the replicates for all the assays in the worklist for which that diluent is used.
Force level detect before transfer (uses new tip)
Liquid level sensing is performed on each deep well prior to pipetting the sample to the plate.
Note: The bottom three options are only used when dilutions are made in deep well.
Important: Force level detect before transfer increases the time for pipetting from the deep well to the plate. DYNEX does not recommend this feature
because bubbles generated during dilution may cause inaccurate level detection.
13. In the Pipette/Mixing tab of the Deep Well Dilution Options panel, use the up and down arrows to enter the speed profile (from 1 to 4) that will be used during the dispense cycle while mixing.

Chapter 6: Assay Editor
Part No. 91000200 108 © 2019 DYNEX Technologies Inc.
Note: The speed profile defines the rate from 1 (slowest) to 4 (fastest) at which fluid is dispensed.
Figure 93: Pipette/Mixing Tab
14. In the Pipette/Mixing tab of the Deep Well Dilution Options panel, use the up and down arrows to enter the number of aspiration and dispensing cycles (from 1 to 9) that will be used to mix the diluted sample.
15. Click to save the pipetting operation and displays the information in the assay summary.
Figure 94: Example of Assay Summary

Chapter 6: Assay Editor
© 2019 DYNEX Technologies Inc. 109 Part No. 91000200
6.7 Specify a Verification Operation A verification operation is used to verify proper pipetting of fluids into specified wells by measuring their optical density.
Note: A colored solution must be in the wells when the verification is performed.
1. Drag from the Operation panel to the position on the Protocol panel where the operation should be executed. The Verification form is displayed in the Configuration panel.
Figure 95: Verification Form Displayed in Configuration Panel
2. Select a group number (Group 1 in the example) from the Group Information panel that will be assigned to the first group of wells that will be selected for verification.
Figure 96: Group Information Panel

Chapter 6: Assay Editor
Part No. 91000200 110 © 2019 DYNEX Technologies Inc.
3. Click wells that will give a similar OD reading for the first group by one of the following methods:
Click in each well individually; a yellow checkmark is placed in the selected well and the group number.
Click in a well and then drag the mouse over a series of wells;
By selecting the button.
4. A checkmark and the group number is placed on each selected well.
Figure 97: Select Wells
5. Use the Test drop-down list in the Filters panel to specify the test wavelength at which the plate will be read. The choices are:
405 450 490 620.
6. If needed, use the drop-down list in the Filters panel to specify the reference wavelength at which the plate will be read.
Note: If None is selected as the reference wavelength, the plate will be read with the test wavelength only.
If a reference wavelength is selected, the plate will be read at both the test and reference wavelengths and the result will be the difference between the two, which can reduce errors caused by dirt and scratches on the bottom of the wells. A reference wavelength is generally not needed.

Chapter 6: Assay Editor
© 2019 DYNEX Technologies Inc. 111 Part No. 91000200
A checkmark and the test group number is displayed for each well while information for that group is being entered.
Only the test group number is displayed for configured wells when configuration information for another test group is being displayed.
Figure 98: Reference Wavelength Selected
7. The selected wells can be verified either by determining that the optical density of each well is within a specified range (an O.D. Test) or within a specified percentage of the mean optical density for the selected wells (a Median Test):
To specify an O.D. Test, click in the Enabled box in the O.D. Test panel, click in the High checkbox, then enter the highest optical density and the lowest optical density (if needed) allowed for each well. Or, leave the High checkbox blank and then enter the lowest optical density allowed for each well.
Click in the Increment checkbox if the previous well fill verification results should be subtracted from the active set before performing the test.
To specify a Median Test, click the Enabled checkbox in the Median Test panel and enter the percentages that the optical density for each well are allowed to be above and below the mean optical density for the wells that were selected.
8. In the Options panel, place a checkmark next to blank on A1 to subtract the well A1 optical density from the optical density for all of the other wells when performing the verification.
9. In the Options panel, enter the time (up to 9 seconds) the plate will be shaken.
10. Repeat steps 2 through 8 for any other groups of wells that will be verified.
11. Click to save the verification operation and display the information in the assay summary.

Chapter 6: Assay Editor
Part No. 91000200 112 © 2019 DYNEX Technologies Inc.
Note: An operator should be present during well fill verification since an alert message is displayed and operation stops if verification fails.
6.8 Specify an Incubation Operation An Incubation operation specifies a temperature and duration for plate incubation during an assay and allows for shaking of the plate during incubation.
Note: Plates are incubated outside of the incubation chamber for incubation at ambient temperature. Plates are incubated inside of the incubation chamber for heated incubations.
1. Drag from the Operation panel to the position on the Protocol panel where the operation should be executed. The Incubation form is displayed in the Configuration panel.
Figure 99: Incubation Form in the Configuration Panel
2. In the Temperature panel, click radio button corresponding to the temperature at which the plate will be incubated.
3. If the Custom Temperature button is selected, type the temperature that will be used or use the up and down arrows to click temperature.
Important: Ambient temperature is no more than 4° C above room temperature plus. This is the coolest incubation temperature that can be used.
Maximum recommended incubation temperature is 40° C. If needed, the instrument can incubate plates at temperatures up to 40° C, but at reduced accuracy and precision of incubation temperature.
4. In the Duration pane, use the up and down arrows in the Duration, Shortest and Longest fields to click minimum and maximum times for incubating plate wells. Incubations can last up to 23 hours, 59 minutes, 59 seconds.

Chapter 6: Assay Editor
© 2019 DYNEX Technologies Inc. 113 Part No. 91000200
Note: The shortest duration time is the time that incubation must proceed for each well. The longest duration time is the maximum allowable incubation time for any well. Increasing the maximum incubation time allows more wells to be processed at one time.
5. Also in the Duration pane, place a checkmark in the Start from first transfer to plate checkbox to begin the start of incubation when fluid is transferred by the first pipetting or dispensing operation before the incubation. This can minimize drift due to variable time delay when pipetting.
6. In the Shake panel, click radio button for the shake setting (Do not shake, Initial shake or Shake for entire duration) and (for Initial shake) enter the number of seconds for which the plate will be shaken.
Note: Start from first transfer to plate can only be enabled for ambient temperature incubation and when no operations are programmed to occur after the first pipetting or dispensing operation.
For example: a dispensing operation cannot be programmed to occur after a pipetting operation if Start from first transfer to plate is to be enabled.
Table 30: Shake Settings and Descriptions Shake Setting Description
Do not shake Incubation is performed without shaking the plate.
Initial shake The plate is shaken for the specified number of seconds immediately after it is placed in the incubator.
Shake for entire duration The plate is shaken continuously while it is in the incubator.
7. In the Shake Settings pane, click shake speed (Low, Medium or High) that will be used.
Table 31: Shake Intensities and Descriptions Shake Intensity Description
Low Shake the plate at 14 Hz (approximately 840 revolutions per minute [RPM]) with an amplitude of 1.5 mm.
Medium Shake the plate at 17 Hz (approximately 1,020 RPM) with amplitude of 1.5 mm.
High Shake the plate at 20 Hz (approximately 1,200 RPM) with amplitude of 1.0 mm.
8. Click to save the incubation operation and display the information in the assay summary.
6.9 Specify a Washing Operation
1. Drag from the Operation panel to the position on the Protocol panel where the operation should be executed. The Washing form is displayed in the Configuration panel.

Chapter 6: Assay Editor
Part No. 91000200 114 © 2019 DYNEX Technologies Inc.
Figure 100: Washing Form in the Configuration Panel
2. In the Cycles panel, use the up and down arrows to identify the wash cycle (from 1 to 9) that is being programmed.
Note: The plate frame must contain whole strips in order for a wash operation to be performed. Dummy wells may be used to fill in empty spaces to create a whole strip.
3. In the Mode field of the Cycles panel, click wash mode (Platewise or Stripwise) that will be used.
Table 32: Modes and Descriptions Mode Description
Platewise The first programmed wash cycle (dispense wash fluid and aspirate) is performed on each strip on the plate before the next wash cycle is performed.
Stripwise All of the programmed wash cycles are performed on the first strip before the wash cycles are repeated on the next strip.
4. Place a checkmark in the Constant Timing checkbox in the Cycles panel to specify that the same amount of time is taken to wash an entire plate, regardless of the number of strips that are to be washed.
Note: If Constant Timing is enabled, the wash head pauses for the length of time it would take to wash any unused strips before beginning the next wash cycle.
5. Place a checkmark in the Do Final Aspirate checkbox in the Cycles panel to specify that the contents of each well are aspirated after completing the programmed wash cycles so that all wells are empty.
6. In the Sweep Mode field of the Cycles panel, click sweep mode that will be used to completely empty the wells of droplets of wash buffer before the next operation is performed.

Chapter 6: Assay Editor
© 2019 DYNEX Technologies Inc. 115 Part No. 91000200
Figure 101: Sweep Mode Cycles
Table 33: Sweep Mode Descriptions Sweep Mode Description
None The wash pins are lowered to the center of the wells and the wells are then aspirated without a sweep during every wash cycle, including the final aspiration cycle. This mode should be used for plates with U-bottom or V-bottom wells.
Sweep The wash pins are lowered to the center of the wells and the wells are then aspirated while using a left-to -right sweep.
Sweep only on last cycle
The wash pins are lowered to the center of the wells and the wells are then aspirated without a sweep during every wash cycle except the final wash cycle and the final aspiration cycle, in which the Sweep mode is used.
Super sweep The wash pins are lowered to the center of the wells and the wells are then aspirated while using a five-point sweep consisting of a center position and four points around the outer circumference of the well.
Super sweep only on last cycle
The wash pins are lowered to the center of the wells and the wells are then aspirated without a sweep during every wash cycle except the final wash cycle and the final aspiration cycle, in which the Super sweep mode is used.
Note: Select No Sweep and disable bottom washing whenever a C-bottom, U-bottom or V-bottom plate is used.
Sweep should be used carefully to avoid scratching the bottom of the microwells. Super Sweep has to be flat bottom plate.
7. In the Purge washer with field of the Purge and Clean panel, use the drop-down list to specify the wash buffer that will be used for purging the wash lines. Then, enter the volume of wash buffer that will be used for purging the wash lines.
Note: Purging pumps a specified volume of wash buffer through the tubing lines at the outset of a washing operation, flushing any bubbles or other material from the wash line.
Note: If needed, click to create a record for a wash buffer in the database (Chapter 13.1). A record for a wash buffer must exist in the database in order for it to be included in the drop-down list.

Chapter 6: Assay Editor
Part No. 91000200 116 © 2019 DYNEX Technologies Inc.
8. In the Clean washer with field of the Purge and Clean panel, use the drop-down list to specify the fluid that will be used for cleaning the tubing lines. Then, enter the volume of fluid that will be used for cleaning the wash lines.
Note: Cleaning is performed using fluid from the external cleaning fluid container at the rear of the DS2 (Figure 23) to clean the tubing lines following the last wash cycle. A cleaning step should be programmed after each wash operation in the assay.
The cleaning fluid must be added to the washer fluid database with the load position specified as the "clean line" in order for the cleaning fluid to be included in the drop down list.
9. In the Soak between cycles for field of the Soak panel, enter the delay time (in seconds) between successive wash cycles.
10. Place a checkmark in the Synchronize soak delay from transfer timings checkbox in the Cycles panel to synchronize the soak time for a strip based on the time it takes to transfer samples to the microplate.
Note: This feature can minimize drift caused by differences in incubation times between strips by synchronizing the soak time for each strip.
For example: if pipetting takes fifteen minutes and plate washing only takes three minutes, the first strip will be incubated for the correct time while subsequent strips will be incubated for a shorter period of time if this feature is not enabled.
This feature is only available when washing in strip-wise mode. A Reagent/Sample pipetting operation must precede the washing operation in order for this feature to be enabled.
Sample pipetting takes 15 minutes
Incubation takes 30 minutes
Washing takes 15 minutes
Synchronizing is most important following sample pipetting.
11. In the Dispense panel, use the drop-down list to specify the wash buffer that will be used. Then, enter the volume of wash buffer that will be dispensed into each well.
12. To specify a bottom wash, use the up and down arrows in the Bottom Wash field of the Dispense panel to specify the number of bottom wash cycles (from 1 to 5) that will be performed. Then, enter the volume of wash buffer (from 0 to 1000 µL, in 10 µL increments) that will be dispensed into each well.
Note: Bottom wash provides an aggressive wash in either the plate mode or the strip mode. Bottom wash dispenses fast bursts of buffer into the wells while aspirating at the same time, saving time and wash buffer if used instead of an additional wash cycle.

Chapter 6: Assay Editor
© 2019 DYNEX Technologies Inc. 117 Part No. 91000200
If the number of bottom wash cycles is set to zero (0), a bottom wash will not be performed.
13. Specify a fill, use the up and down arrows in the Fill panel to specify the volume of wash buffer (up to 1000 µL) that will be dispensed into each well. Then, use the drop-down list to specify the wash buffer that will be used.
Note: Fill can be used to provide a long soak time by specifying a Fill followed by an incubation operation for the soak time needed and then another wash operation.
Fill can also be used for well fill verification to test the washer dispense accuracy.
Fill may be used when washing in either the plate mode or the strip mode. The Dispense and Bottom Wash options must be set to zero in order to specify a Fill. If the volume of wash buffer is set to zero, a fill will not be performed.
14. Place a checkmark in the Aspirate checkbox in the Aspirate panel if wells only need to be emptied of fluid and do not need washing.
Note: The Aspirate checkbox does need not to be checked if wells are being washed normally.
15. Click to save the washing operation and display the information in the assay summary.
6.10 Specify a Reading Operation Plates can be read at one wavelength (the primary test wavelength) or at two wavelengths (primary test and primary reference wavelengths).
Note: The plate will be read at two wavelengths whenever a primary reference wavelength filter is specified and the result will be the difference between the two wavelengths. This can reduce errors caused by dirt and scratches on the bottom of the wells since these artifacts tend to scatter radiation equally, regardless of wavelength.
1. Drag from the Operation panel to the position on the Protocol panel where the operation will be executed.
Figure 102: Protocol Pane
2. The Reading form is displayed in the Configuration panel.

Chapter 6: Assay Editor
Part No. 91000200 118 © 2019 DYNEX Technologies Inc.
Figure 103: Reading Form in the Configuration Panel
3. In the Primary Test Filter field of the Wavelength pane, use the drop-down list to specify the primary wavelength at which the plate should be read.
Figure 104: Define Absorbance Filter Screen
4. In the Primary Reference Filter field of the Wavelength pane, use the drop-down list to click reference wavelength at which the plate will be read.
Figure 105: Primary Reference Filter Drop-Down
Note: If None is selected as the primary reference filter, the plate will be read at the test wavelength only.
5. In the Shake Time field, enter the shake time in seconds (from 0 to 99 seconds, by typing or by using the up and down arrows).
Note: Shaking is performed before the plate is read, to remove air bubbles from the sample and create an even meniscus.
If shake time is set to zero (0), a shake will not be performed.
6. Click to save the reading operation and display the information in the assay summary.

Chapter 6: Assay Editor
© 2019 DYNEX Technologies Inc. 119 Part No. 91000200
Figure 106: Assay Summary Example
6.10.1 Selection of Wavelength(s) for an Assay The wavelengths used for an assay depend on the reaction products that are being detected. The following general rules should be followed:
Test wavelength, , should be at or near the maximum absorbance of the reaction product.
Reference wavelength, ,should lie outside the absorbance band of the reaction.
Figure 107: Wavelengths for an Assay

Chapter 6: Assay Editor
Part No. 91000200 120 © 2019 DYNEX Technologies Inc.
6.10.2 Use of Blank Wells If no blank wells are specified in the template (Chapter 6.4.1), air is used for the 100% transmission readings. Alternately, one or more blank wells subtracted from every other well, can be specified in the template for measuring 100% transmission.
If more than one well is selected to be a blank in the template, the average optical density of the blank wells is subtracted from each of the other wells on the plate.
6.11 Specify Quality Control Operation Quality Control (QC) operations execute user-defined QC equations that specify criteria for raw data and/or results of a curve fit, threshold, ratio or spreadsheet operation to validate the data and ensure that the results are valid. If the criteria that are contained in a QC equation are not met, the data can either be restricted from being used in subsequent operations or the data can be used normally and the results report will contain a message regarding the QC test that failed. QC equations can be applied to any well type that is defined in the template.
There can be more than one QC operation in an assay, since each QC operation only applies to the data reduction operation that immediately precedes the QC operation.
For example: If the package insert for an assay specifies that raw optical densities must not exceed a specified value and that calculated results for the positive control must be within a specified range, two QC operations are required.
QC equations will be performed in the order they appear in the list. Therefore, any QC equation that depends on another QC equation must be below that equation on the list.
1. Drag the operation icon from the Operation panel to the position on the Protocol panel where the operation should be executed. The Quality Control form is displayed in the Configuration panel.
Figure 108: Quality Control Form in the Configuration Panel
2. In the Equation field, enter the QC equation by typing all numbers, arithmetic operators, brackets and well values and entering other functions by double-Clicking them in the Functions panel.

Chapter 6: Assay Editor
© 2019 DYNEX Technologies Inc. 121 Part No. 91000200
Note: Obtain the well symbols from the plate template (Chapter 6.4.1). Refer to Chapter 13.7.1 for a detailed description of all numbers, arithmetic operators, brackets, well values and functions that can be entered.
3. In the Fail Message field, type the message that will be displayed in the results report whenever criteria specified in the QC equation are not met.
Note: If the Fail Message field is left blank, a message will not be displayed.
4. Select to add the equation to the list of quality control acceptance criteria displayed below the buttons.
5. Select to clear the Equation and Fail Message fields so that another QC equation can be entered and added.
Note: Select a QC equation and select to remove a QC equation from the list of QC criteria.
Select a QC equation and select to display the QC equation and its failure message in the Equation and Fail Message fields so they can then be edited.
Select a QC equation and select or to change the order in which the QC equation will be performed.
6. Repeat steps 2 through 5 to specify additional QC equations.
Table 34: Options and Descriptions Option Description
Full QC report Specifies that all QC equations and their results are included in the results report. If left unchecked, only QC equations with failing results are included.
Suppress results if QC fails
Specifies that all of the results are suppressed if QC criteria are not met. This feature may be important when automatically exporting data.
Lot specific checking of control values
Specifies that expected values for a specific lot number of controls are used in the QC equations. Request kit lot data at runtime must be enabled in order to use this feature.
Important: If Suppress Results if QC Fails is enabled, no patient data will appear on the report printout from DS-Matrix software, but data from failed runs will still export to LIS-Link software. These patients must be deleted from LIS-Link database to avoid transmitting data from failed runs to the LIS.
7. In the Options panel, place a checkmark in the checkbox for each option.
8. If the QC operation follows a threshold or curve fit operation, enter values as needed in the Pos/Neg, Curve Fit and Auto Outlier Removal panels.

Chapter 6: Assay Editor
Part No. 91000200 122 © 2019 DYNEX Technologies Inc.
Note: Refer to Chapter 6.13 for entering information for a threshold operation and for entering information for a curve fit operation.
9. Click to save the QC operation and display the information in the assay summary.
Note: Equations are checked when the operation is saved. If any of the equations are invalid, an error message describing the invalid equation(s) is displayed. If this occurs, check the spelling and order of equation components first.
6.11.1 Examples of Typical QC Equations Examples of typical QC equations are shown below for a plate template that includes four negative controls (NC) and three positive controls (PC):
If any NC OD must be rejected if it is lower than the mean OD of all the NCs or more than 25% higher, enter:
o If you have NC1, NC2 or NC3 enter:
0.75*NC.i<=NC<=1.25*NC.i
o If you have NC1.1, NC1.2 or NC1.3 enter:
0.75*NC1.i<=NC<=1.25*NC1.i
If one of 3 the NC optical density values fails the first QC equation the test must be rejected, enter:
valid(NC)>=3
valid(NC1)>=3
If the average optical density of the NCs must be more than 0.5, enter:
NC>0.5
If the average OD of the PCs must be more than 20% of the average optical density of the NCs, enter:
PC>0.2*NC
If the average NC OD must be less than half of the average PC optical density, enter:
NC<PC/2
If the CV% of the NC ODs must be less than 15%, enter:
CV(NC)*100<15.

Chapter 6: Assay Editor
© 2019 DYNEX Technologies Inc. 123 Part No. 91000200
6.12 Specify Ratio Operation A ratio operation converts raw data by means of one or more mathematical equations. Ratio calculations are frequently used in competitive inhibition assays or when detecting an increase of an Analyte over a normal baseline value and often express sample results as a ratio of a control value. Ratio operations can also be used to multiply optical densities by a correction factor or to perform any calculation which is required for further data processing.
Every value on the plate is fed into the equation(s) and the resulting values are reported and passed on to subsequent operations.
1. Drag to the position on the Protocol panel where the operation should be executed. The Equation tab of the Ratio form is displayed.
Figure 109: Equation Tab of the Ratio Form
2. In the Equation field, enter the ratio equation by typing all numbers, arithmetic operators, brackets and well values and entering other functions by double-Clicking them in the Functions panel.
Note: Obtain the well symbols from the plate template (Chapter 6.4.1). Refer to Chapter 13.7.1 for a detailed description of all numbers, arithmetic operators, brackets, well values and functions that can be entered.
3. In the Units field, type the units (For example: mg/dL, up to eight characters) that will be displayed after the numerical value in the results report.
4. If needed, click Result Flagging tab (refer to Chapter 6.12.1) to specify a phrase that either replaces a numerical result or is displayed next to the result whenever the numerical result meets specified criteria.
5. Click to save the ratio operation and display the information in the assay summary.

Chapter 6: Assay Editor
Part No. 91000200 124 © 2019 DYNEX Technologies Inc.
6.12.1 Specify Results Flagging Conditions Result flagging either replaces a numerical result with a phrase or displays a phrase adjacent to the result whenever the numerical result meets specified criteria.
For example: A phrase such as <20 mg/dL can be displayed instead of the actual numeric value or a phrase such as Low Abnormal can be displayed adjacent to the actual numeric value whenever a test result is less than 20 milligrams per deciliter (mg/dL).
1. Display the Result Flagging tab of the Ratio form.
Figure 110: Result Flagging Tab of Ratio Form
2. Enter the criteria for a results flag in the Condition field by typing all numbers, arithmetic operators, brackets and well values and entering all functions by double-Clicking them in the Functions pane.
Note: Obtain the well symbols from the plate template (Chapter 6.4.1). Refer to Chapter 13.7.1 for a detailed description of all numbers, arithmetic operators, brackets, well values and functions that can be entered.
3. Enter the phrase that will either accompany or replace the flagged result in either the Result field or the Flag field.
Note: Enter the phrase in the Result field if the phrase will be displayed instead of the result. Enter the phrase in the Flag field if the phrase will be displayed adjacent to the result.
4. Click to add the equation to the list of result flagging equations displayed in the Sample Checks field.

Chapter 6: Assay Editor
© 2019 DYNEX Technologies Inc. 125 Part No. 91000200
5. Click to clear the Condition and Result or Flag fields so that another result flag can be entered and added.
Note: Select a result flag and click to remove a result flag from the list of result flags.
Select a result flag to display the result flag equation and the phrase that will either accompany or replace the flagged result so they can then be edited.
Select a result flag and click or to change the order in which the result flag will be performed.
6. Repeat steps 2 through 5 to specify additional result flags.
7. Click to save the results flags and display the information in the assay summary.
6.12.2 Report the Results of Ratio Calculations Click Ratio in the Report Type panel of the Report Formats tab when specifying report formats (Chapter 6.16) to have ratio information included on the report in either a DS-Matrix or table format.
6.12.2.1 Examples of Typical Ratio Equations
Examples of typical ratio equations are shown below for a plate template that includes four negative controls (NC) and three positive controls (PC):
To convert all sample ODs to a ratio of the sample OD vs. the average OD of the PC replicates.
For example: Sample/PC
To convert all sample ODs into larger numbers than the OD values.
For example: Enter an equation such as: sample/0.25
To replace all values on the plate with the result of Test Well 1 divided by the result of the positive control.
For example: Enter: T1/PC
Figure 111: Equation Tab

Chapter 6: Assay Editor
Part No. 91000200 126 © 2019 DYNEX Technologies Inc.
To multiply all values on the plate by a numerical correction factor X that is entered when creating the worklist.
For example: Enter - Sample*VariableX
Note: When equations using VariableX or Custom Variable are entered, the user will be prompted at the beginning of the load wizard to enter the value for the variable.
6.13 Specify a Threshold Operation Threshold calculations are used to convert raw data or calculated results into an expression that describes the result as positive, negative or other user-defined expression.
The Threshold data representations are raw OD data converted to symbols denoting positive and/or negative results which fall above or below a preset threshold. These are often used to differentiate clinical degrees of positive values. In order to use this operation, Threshold equations need to be entered to define the Threshold limits.
A negative OD limit is set using the “–” data label and a positive limit set using the “+” data label. These positive and negative limits are required to use the limits function. Three additional positive results levels (++, +++, and ++++) are also optionally available.
Threshold OD limits may be entered directly into the equation textbox as absolute numbers. A result that falls above or below the OD limit will be recorded as positive (+) or negative (-) symbol instead of the actual OD reading.
If the – value is lower than or equal to the + value, then ODs below the –value are negative and ODs above the + value are positive.
If the – value is higher than the + value, then ODs below the + value are positive and ODs above the – value are negative.
Alternatively, conditions may be introduced into the limits equations.
For example: Test sample OD readings may be compared to control OD readings or the average of a number of samples to determine if they are a positive or negative result.
DS DS-Matrix leaves a grey zone when different values are programmed for the – and + equations with a gap in between. The default grey label can be changed.
The user can change threshold labels to any descriptive words or numbers.
1. Drag the operation icon from the Operation panel to the position on the Protocol panel where the operation should be executed.
Figure 112: Threshold Operation Icon Moved to Protocol Pane

Chapter 6: Assay Editor
© 2019 DYNEX Technologies Inc. 127 Part No. 91000200
2. The Threshold form is displayed.
Figure 113: Threshold Form in the Configuration Panel
3. In the Equation field for the negative sample (adjacent to the – label), enter the absolute value (For example: optical density or concentration) that corresponds to the cutoff point for a negative sample.
4. Alternatively, enter a function by double-Clicking on the function in the Functions panel or type an arithmetic operator.
For example: A result may be compared to the results for a control or to the average results of a number of samples to determine if it is positive or negative.
Note: If values (such as concentrations) are from another operation
For example: Curve fitting must be positioned on the Protocol panel before the Threshold operation.
If the cutoff point for a negative sample is equal to or lower than the cutoff point for a positive sample, results below the cutoff point for a negative sample are negative and results above it are positive.
If the cutoff point for a negative sample is equal to or higher than the cutoff point for a positive sample, results below the negative sample cutoff point are positive and results above it are negative.
5. If needed, replace the – label for negative samples with a new label by typing the new label in the Label field for that level.
6. Repeat Steps 3 and 4 for each remaining level that will be specified.

Chapter 6: Assay Editor
Part No. 91000200 128 © 2019 DYNEX Technologies Inc.
7. Click to save the Threshold operation and display the information in the assay summary.
Note: Equations are checked when the operation is saved. If any of the equations are invalid, an error message describing the invalid equation(s) is displayed. If this occurs, check the spelling and order of equation components first.
6.13.1 Example of a Typical Threshold Equation An example of a typical threshold equation is shown below for a plate template that includes a positive control (PC).
Samples with an optical density that is equal to or higher than twice the optical density obtained for the positive control will have a result of +++.
PC*1.5 for limit level +++
Figure 114: Typical Threshold Equation
6.14 Specifying a Curve Fit Operation The Curve Fit operation uses optical density measurements from standards of known concentrations to construct a standard curve, where optical density is plotted on the y-axis and concentration is plotted on the x-axis. Concentrations of test samples are then determined from the concentration that matches their optical density on the standard curve.
Standards of increasing concentrations must be included in the assay template when a curve fit operation is included in the assay. The standards that are used to create the standard curve and the calculations that are used to determine Analyte concentrations are specified in the Curve Fit operation.

Chapter 6: Assay Editor
© 2019 DYNEX Technologies Inc. 129 Part No. 91000200
Only one Curve Fit operation can be included in an assay. If results of an assay must be analyzed using a different Curve Fit operation, create a second assay that includes the second Curve Fit operation and recalculate the data (Chapter 6.14.3) using the new assay.
1. Drag to the position on the Protocol panel where the operation will be executed. The Standards tab and the template for the assay are displayed in the Configuration panel.
Note: The concentration currently entered for each standard is displayed adjacent to the icon for each standard on the template.
Figure 115: Standards Tab in the Configuration Panel
6.14.1 Specify Concentrations of the Standards 1. Click the Now radio button from the Concentration Entry panel if standards will
remain the same whenever the assay is run.
Note: If information on the Standards tab is entered at run time, results cannot be recalculated.
- or -
Click if information must be entered on the Standards tab at run time because the concentrations of the standards may change from lot to lot.
2. Click well (or one of the wells) for the first standard (S1 in the example) on the template for the assay. The concentration that is currently entered for that standard is displayed in the text box next to the Now radio button.
Note: A standard with a concentration of zero (0) cannot be used if a log/log curve fitting calculation will be performed.

Chapter 6: Assay Editor
Part No. 91000200 130 © 2019 DYNEX Technologies Inc.
3. Type the concentration value for the standard in the text box.
4. Click No Factor radio button in the Automatic Entry panel to manually enter concentrations of the remaining standards. Then repeat Steps 2 and 3 for each of the remaining standards.
- or -
Click Additive or Multiplier radio to automatically calculate and enter concentrations of the remaining standards (see below).
5. Click the Normalization checkbox to adjust concentrations of standards to compensate for changes in dilution ratios that are made at run time.
6. Click the Variable Standard Multiplier for standards entry. Both the Multiplier button and the Variable Standard Multiplier box must be checked.
Note: A variable standard multiplier is a multiplication factor which is applied to all the Standard samples when the curve fit data is calculated at runtime.
7. Type the units for the standards in . Units can be entered as mg/ml, ug/ml, etc.
Note: The first standard concentration must be greater than zero.
Linear scaling can be zero
Log standard cannot be zero
8. Click on the first set of standard wells to enter the first concentration. Enter the multiplier needed in the Multiplier box, click on the second set of Standards wells. Enter a different third multiplier, click on the Standard wells, and so on.
For example: If the first concentration is one, the first multiplier is two, then the first standard will have a concentration of one and the second a concentration of two. If a multiplier of four is then entered the third standards will have a concentration of eight.
6.14.2 Automatic Entry Concentrations of Remaining Standards To save time, concentrations of the remaining standards can be automatically calculated and entered after the concentration of the first standard is entered.
1. To increment the concentration of successive standards by a specified value:
o Click Additive radio button in the Automatic Entry panel.
o Type a value in the adjacent text box.
o Click well (or one of the wells) for each successive standard to increment its concentration by that value.
For example: If concentration of S1 (in the example) is 1 and an additive factor of 2 is entered, 3 will be automatically entered for S2 and 5 will be automatically entered for S3 when they are selected in that order.
2. To multiply the concentration each successive standard by a specified value:

Chapter 6: Assay Editor
© 2019 DYNEX Technologies Inc. 131 Part No. 91000200
o Click the Multiplier radio button in the Automatic Entry panel.
o Type a value in the adjacent text box.
o click well (or one of the wells) for each successive standard to multiply its concentration by the specified factor.
For example: If concentration of S1 (in the example) is 2 and a Multiplier factor of 4 is entered, 8 will be automatically entered for S2 and 32 will be automatically entered for S3 when they are selected in that order.
The concentration of the first standard must be greater than zero (0) when a Multiplier factor is used.
3. To multiply the concentration each successive standard by a different value:
o click the Multiplier radio button in the Automatic Entry panel.
o Place a checkmark in the Variable Standard Multiplier checkbox.
o Type a value in the text box next to the Multiplier radio button.
o click well (or one of the wells) for the next standard to multiply its concentration by the specified factor.
For example: If the concentration of S1 (in the example) is 1 and the Multiplier factor of 2 is entered for S2, 2 will be automatically entered for S2. If the Multiplier factor of 4 is entered for S3, 8 will be automatically entered for S3.
The concentration of the first standard must be greater than zero (0) when a Multiplier factor is used.
a. Repeat step d for each of the remaining standards.
b. Click to save the information that was entered for the standards and display the information in the assay summary.
6.14.3 Specifying the Curve Fitting Equation 1. Click Fit Type tab to display the curve fit types and their options.

Chapter 6: Assay Editor
Part No. 91000200 132 © 2019 DYNEX Technologies Inc.
Figure 116: Fit Type Tab
2. In the Fit Type panel, click curve fitting equation that will be used to construct the standard curve.
Table 35: Fit Types and Descriptions
Fit Type Description
Akima A smooth curve which approximates a manually drawn curve is fitted to the data points. At least three standards are required.
Cubic A cubic polynomial regression is performed. At least four standards are required.
Cubic Spline A curved line is fitted through all of the data points. This is not a best fit algorithm since it assumes that the data set is perfect. At least three standards are required.
Linear A linear regression is performed and a straight line is optimally fitted to the data points. At least one standard is required.
Log/Logit An S-shaped curve fit with fixed parameters is fitted to the data points. At least four standards are required.
Polygon A point-to -point straight line fit is performed. At least three standards are required.
Quadratic A quadratic polynomial regression is performed. At least three standards are required.

Chapter 6: Assay Editor
© 2019 DYNEX Technologies Inc. 133 Part No. 91000200
Fit Type Description
Quartic A quartic polynomial regression is performed. At least five standards are required.
Sigmoid An S-shaped curve fit with four definable parameters is fitted to the data points. At least four standards are required.
Stored Curve Newly generated data are fitted to a standard curve that was previously created and stored. This option is only available for selection if a standard curve has been saved for use as a stored curve.
3. In the Calculation Options panel, place a checkmark in the Average the Standard Replicates checkbox to use the mean of the standard replicates for generating the standard curve rather than individual replicate points to make the standard curve easier to interpret.
4. In the Calculation Options panel, place a checkmark in the Extrapolate the Data checkbox to extrapolate the standard curve beyond the highest and lowest standards.
Note: Generally accepted analytical chemistry practice indicates that standard values should always cover the entire range of expected sample optical densities. Extrapolation is not recommended for this reason, but it may be used if specified in the reagent kit package insert. Extrapolation should not be used with a sigmoidal fit.
5. In the Axes panel, click the scaling option that will be used for the axes on the standard curve.
Note: Scaling options that are not compatible with the chosen curve fit type will be disabled.
For example: If a Sigmoid fit type is being used, none of the axes selections will be enabled but the Sigmoid Parameters options (see below) will be active.
Table 36: Sigmoid Parameters Options
Scaling Option Scale for X-Axis Scale for Y-Axis
Lin/Lin Linear Linear
Log/Log Logarithmic Logarithmic
Log/Lin Logarithmic Linear
Auto Selected automatically Selected automatically
6. If Sigmoid is selected for the curve fit type, the Sigmoid Parameters panel is enabled. Place a checkmark next to any of the four numerical parameters that should be defined and type the corresponding numerical parameter in the adjacent field. Then, in the Max Iterations field, enter (by typing or by using the up and down arrows) the maximum number of times (from 1 to 29,999) construction of a satisfactory standard curve should be attempted before the operation is halted.

Chapter 6: Assay Editor
Part No. 91000200 134 © 2019 DYNEX Technologies Inc.
Note: A value of 20 maximum iterations is suitable for most applications. If no options are selected in the Sigmoid Parameters panel, the software will automatically set the A parameter to the lowest standard concentration and the D parameter to the highest standard concentration and will then define the other standard points to obtain an S-shaped curve.
7. Click to save the curve fitting equation and display the information in the assay summary.
6.14.4 Specifying Graphing Options 1. Click the Graph tab to display the graphing options.
Figure 117: Graph Tab Screen
2. Place a checkmark next to the Produce Graph field to specify that the standard curve and results will be plotted on a graph.
3. In the Title field of the Graph Parameters panel, type the title for the graph.
4. Click next to the Combine with other graphs checkbox to specify that graph of the standard curve and results will be included in the results report.
5. In the Horizontal Axes and Vertical Axes panels, specify the label and scale for each axis.
6. In the Title field for each axis, type the label for that axis.

Chapter 6: Assay Editor
© 2019 DYNEX Technologies Inc. 135 Part No. 91000200
7. Click radio button next to the Auto Scaling field if the scale for that axis is to be automatically determined.
8. Click radio button next to the Manual Scaling field and then enter the minimum and maximum values and the number of tick marks if the scale for that axis is to be user-defined.
9. Click to save the graphing options and display the information in the assay summary.
6.14.5 Specifying Results Flagging Conditions 1. Click Results Flagging tab to display the results flagging options.
Figure 118: Results Flagging Tab
2. Enter the criteria for a results flag in the Condition field by typing all numbers, arithmetic operators, brackets and well values and entering all functions by double-clicking them in the Functions pane.
Note: Obtain the well symbols from the plate template (Chapter 6.4.1). Refer to Chapter 13.7.1 for a detailed description of all numbers, arithmetic operators, brackets, well values and functions that can be entered.
3. Enter the phrase that will either accompany or replace the flagged result in either the Result field or the Flag field.
Note: Enter the phrase in the Result field if the phrase will be displayed instead of the result. Enter the phrase in the Flag field if the phrase will be displayed adjacent to the result.
4. Click to add the equation to the list of result flagging equations displayed in the Sample Checks field.
5. Click to clear the Condition and Result or Flag fields so that another result flag can be entered and added.
Note: Select a result flag and click to remove a result flag from the list of result flags.
Select a result flag to display the result flag equation and the phrase that will either accompany or replace the flagged result so they can then be edited.

Chapter 6: Assay Editor
Part No. 91000200 136 © 2019 DYNEX Technologies Inc.
Select a result flag and click or to change the order in which the result flag will be performed.
6. Repeat steps 2 through 5 to specify additional result flags.
7. Click to save the results flags and display the information in the assay summary.
6.15 Specifying a Spreadsheet Operation The Spreadsheet operation calculates results by adding or subtracting either raw data values or calculated results from different wells and then presents the results in a table or DS-Matrix.
The calculation for each well can be entered in two ways:
Calculations can be manually entered for each well by selecting the well and then typing the calculation for that well.
For example: B2-C2 will subtract the well C2 result from the well B2 result.
A pre-programmed subtraction pattern (an Automatic Difference Mode) can be selected for application to the entire spreadsheet.
1. Drag the operation icon from the Operation panel to the position on the Protocol panel where the operation should be executed. The Spreadsheet tab and a plate diagram are displayed in the Configuration panel.
Figure 119: Spreadsheet Tab in the Configuration Panel
Note: The Boolean Function Assay checkbox should only be used for certain assays. Contact DYNEX for more information.
6.15.1 Entering Spreadsheet Calculations Manually 1. Select a well for which a calculation will be entered. The position of the well is
displayed next to the field for entering the equation.

Chapter 6: Assay Editor
© 2019 DYNEX Technologies Inc. 137 Part No. 91000200
2. Type the equation (For example: A1-B1) for that well in the field for entering the equation. The equation is displayed in the field and in the corresponding well.
3. Repeat Steps 1 and 2 for each well for which an equation is to be entered.
4. Use the buttons in the Edit panel to expedite the entry of calculations.
Table 37: Tools and Descriptions Tool Description
Removes a calculation from a well and saves the calculation to the clipboard so that it can be pasted in other selected wells.
Copies a calculation from a well and saves the calculation to the clipboard so that it can be pasted in other selected wells.
Places a copy of the calculation that is on the clipboard in the selected well.
Deletes the calculation from the selected well.
Cancels the previous step.
Deletes all calculations from the plate diagram.
5. Click to save the calculations and display the information in the assay summary.
6.15.2 Entering Calculations by Using an Automatic Difference Mode
1. Click to display the Automatic Difference Mode dialog box.
Figure 120: Automatic Difference Mode
2. Click radio button for the mode that will be used to enter the corresponding equation (For example: Rows A – B) in each well.

Chapter 6: Assay Editor
Part No. 91000200 138 © 2019 DYNEX Technologies Inc.
Figure 121: Well Spreadsheet
Note: The equations that are pre-programmed are described below.
Table 38: Pre-Programmed Equations
Mode Calculations Performed
Rows A-B A-B, C-D, E-F, G-H
Rows B-A B-A, D-C, F-E, H-G
Rows B-C* B-C, D-E,F-G
Rows C-B* C-B, E-D, G-F
Columns 1-2 1-2, 3-4, 5-6, 7-8, 9-10, 11-12
Columns 2-1 2-1, 4-3, 6-5, 8-7, 10-9, 12-11
Columns 2-3* 2-3, 4-5, 6-7, 8-9, 10-11
Columns 3-2* 3-2, 5-4, 7-6, 9-8, 11-10
Halves 1-7 A1-A7. . . . . . . . . . . . H6-H12
Halves 7-1 A7-A1. . . . . . . . . . . . H12-H6
Halves 2-7* B2-B7. . . . . . . . . . . . G6-G11
Halves 7-2* B7-B2. . . . . . . . . . . . G11-G6
Halves A-E A1-E1. . . . . . . . . . . . D12-H12
Halves E-A E1-A1. . . . . . . . . . . . H12-D12
Halves B-E* B2-E2. . . . . . . . . . . . . B11-E11
Halves E-B* E2-B2. . . . . . . . . . . . . E11-B11
Note: These options ignore columns 1 and 12 and rows A and H.
3. Click to save the calculations and display the information in the assay summary.
6.15.3 Specify Results Flagging Conditions 1. Click Results Flagging tab to display the results flagging options.

Chapter 6: Assay Editor
© 2019 DYNEX Technologies Inc. 139 Part No. 91000200
2. Enter the criteria for a results flag in the Condition field by typing all numbers, arithmetic operators, brackets and well values and entering all functions by double-clicking them in the Functions pane.
Note: Obtain the well symbols from the plate template (Chapter 6.4.1). Refer to Chapter 13.7.1 for a detailed description of all numbers, arithmetic operators, brackets, well values and functions that can be entered.
3. Enter the phrase that will either accompany or replace the flagged result in either the Result field or the Flag field.
Note: Enter the phrase in the Result field if the phrase will be displayed instead of the result. Enter the phrase in the Flag field if the phrase will be displayed adjacent to the result.
4. Click to add the equation to the list of result flagging equations displayed in the Sample Checks field.
5. Click to clear the Condition and Result or Flag fields so that another result flag can be entered and added.
Note: Select a result flag and click to remove a result flag from the list of result flags.
Select a result flag to display the result flag equation and the phrase that will either accompany or replace the flagged result so they can then be edited.
Select a result flag and click or to change the order in which the result flag will be performed.
6. Repeat steps 2 through 5 to specify additional result flags.
7. Click to save the results flags and display the information in the assay summary.
6.16 Specify the Report Format The Report Format specifies the information that will be reported and the order in which it will be reported, information that will be included in the header and footer, the manner in which results are calculated and reported and whether and how results are exported.
Important: The Report Format must be the last operation that is configured when programming an assay. If the Report Format is configured before all the data reduction operations have been specified for an assay, the report will be incomplete.
1. Click . The Report Layout tab is displayed in the Configuration panel. All of the information that can be included in the report is listed on the left, while information that will be included in the report is listed on the right.

Chapter 6: Assay Editor
Part No. 91000200 140 © 2019 DYNEX Technologies Inc.
Note: All of the information is initially listed in both panels, indicating that all of the information will be included in the report.
Figure 122: Report Layout Screen
6.16.1 Specify Report Layout 1. Specify the information included in the report and the order in which it will be shown
by selecting an item in either the right or left panel and then selecting the appropriate button.
Note: DYNEX recommends that Laboratory Information, Header Information, Data DS-Matrix and the final data reduction step in the assay are included as a minimum. If data is blanked, raw (unblanked) data and/or blank mode should also be included in the report. If a curve fit is used, always include a curve fit so that the curve fit graph will be displayed. Other items are optional.
a. Select an item and click to add that item to the bottom of the list on the right.
b. Select an item and click to add that item directly above a highlighted item in the list on the right.
c. Click to add all of the items listed on the left to the list on the right. Items that were already listed on the right will be duplicated.
d. Click to save the report layout and display the information in the assay summary.

Chapter 6: Assay Editor
© 2019 DYNEX Technologies Inc. 141 Part No. 91000200
6.16.2 Specify Report Format
1. Click Report Formats tab to display the report format options.
Figure 123: Report Formats Tab
2. In the Format Type panel, click the radio button for the data to be included in the report.
Important: A radio button must be selected for the data set (For example: Ratio) that is to be included in the assay report. If the radio button is not selected for a data set, the operation heading will appear on the report but no data will be included, even if that operation was selected on the Report Layout tab.
3. If the results are to be reported in a matrix grid format, place a checkmark next to the Create Matrix field and then proceed to step 5.
Note: The matrix grid format displays the result of each well in the same position on an 8x12 grid as it’s corresponding sample on the plate.
4. If the results are to be reported in a tabular format, place a checkmark next to the Create Table field. Then place a checkmark in each checkbox in the Table Options panel to specify the data that will be included in the table.
5. Select or to either place a checkmark in each checkbox or to remove the checkmark from each checkbox.
6. In the Result Order panel, specify the well types for which results will be reported and the order in which the results will be listed. All of the well types are listed on the left, while the well types for which results will be included in the report are listed on the right.
Select a well type on the left and click to add that well type to the list on the right.

Chapter 6: Assay Editor
Part No. 91000200 142 © 2019 DYNEX Technologies Inc.
Select a well type on the right and click to remove that well type from the list on the right.
Click to add all of the well types to the list on the right.
Click to remove all well types from the list on the right.
7. Select a well type on the right and click up or down arrow to move the well type up or down in the list.
8. If average results of replicate determinations are to be reported, place a checkmark next to the Average the replicates field in the Numeric Options panel and specify how the averages are calculated.
9. In the Numeric Options panel, type the number of decimal places to which the average results will be rounded.
10. In the Mean panel, click radio button corresponding to whether an arithmetic mean or geometric mean will be calculated and reported.
The arithmetic mean is calculated using addition, subtraction, multiplication and division.
The geometric mean is the antilog of the mean of the logarithms of replicates. Reporting the geometric mean is useful when there is imprecision built into the result data.
11. Click to save the report format and display the information in the assay summary.
a. Select an item and click to remove that item from the list.
b. Select an item and click or to reposition on the list.
c. Click to remove all items from the list.

Chapter 6: Assay Editor
© 2019 DYNEX Technologies Inc. 143 Part No. 91000200
6.16.3 Background Read Mode Raw Data Report Format
Figure 124: Background Read Mode Report Format
The Background Read Mode modifies the Raw Data report format (Chapter 6.12). The Replicate Value checkbox is disabled and a Raw Data options box is presented. The Raw Data options are:
Combined – the table column shows second OD measurement – first OD measurement. This is the raw data supplied to the data reduction operations. See Appendix B
Read Operation 1 – the OD measured by the first read operation. The OD is dependent on the selected filter frequencies. See Chapter 6.10
Read Operation 2 - the OD measured by the second read operation. The OD is dependent on the selected filter frequencies. See Chapter 6.10
Background Read Mode Ratio, Threshold, Curve Fit, and Spreadsheet Report Formatting works the same as single read operation assays. See section 6.16.2
6.16.4 Multi Read Mode Report Format
Note: Multi Read Mode does not do data reduction; the read mode disables all Report Format options.
6.16.5 Specify Content of the Report Header and Footer 1. Click Header Footer tab to display the header and footer options.

Chapter 6: Assay Editor
Part No. 91000200 144 © 2019 DYNEX Technologies Inc.
Figure 125: Header Footer Tab
2. In the Header Options and Footer Options sections, place a checkmark next to each item that should be included in the header and footer.
3. Click to save the options and display the information in the assay summary.
6.16.6 Specify Results Exporting Options
1. Click Output to File tab to display the Output to File form.
Figure 126: Output to File Tab
2. Click the Enabled checkbox if results will be exported for use with software such as external spreadsheets.
3. In the Separator panel, select the radio button that corresponds to the character that will be used for separating data elements.

Chapter 6: Assay Editor
© 2019 DYNEX Technologies Inc. 145 Part No. 91000200
Note: Information can be separated for export by means of a tab, comma, space or semi-colon separator.
DYNEX recommends using a comma as a separator.
The selected data will automatically export as a Comma Separated Value (CSV) file every time the assay is run.
4. In the Select Data to Export panel, place a checkmark in the checkbox corresponding to data to be exported.
Note: Well Status is a new option Select Data Type to Export. It is a code number indicating the well status.
0 = Valid (no error) 1= ESP failure 2 = Well Fill Verify failure 3 = Manually pipetted 4 = Skipped.
For Background Read Mode there are changes to the Selectable Data Type to Export list. Raw Data is disabled and the new Raw Data option box is visible. Combined is ReadOp2 – ReadOp1.
For Multi Read Mode only numeric data is formatted to the German standard. This is required by the external software that consumes the exported data.
5. In the Output File Name panel, type the filename and click to navigate to the folder where the result files are to be saved.
Figure 127: Example of Folder for Results Files

Chapter 6: Assay Editor
Part No. 91000200 146 © 2019 DYNEX Technologies Inc.
Note: Results are saved in the following format:
Field Example Sample IDs B1.1 Position A1 Well Label LPC O.D. Results 1.042 Curve Fit Results 250 Ratio Results 500 Spreadsheet Results 250.000 Threshold Results S1 Figure 128: DS-Matrix Format
6. Click to save the results exporting options and display the information in the assay summary.

Chapter 7: Operation
© 2019 DYNEX Technologies Inc. 147 Part No. 91000200
Chapter 7: Operation 7.1 Workflow DS2 operation workflow is summarized in Figure 129.
Power on and self-test
Perform daily maintenance
Empty liquid waste and tip waste
Load wash buffers and cleaning fluid
Create worklist
Load samples
Load controls and reagents
Load plates
Load consumables
Start the run
Review results and print
Figure 129: Workflow for Operating DS2

Chapter 7: Operation
Part No. 91000200 148 © 2019 DYNEX Technologies Inc.
7.2 Power the System On 1. If they are not already on, turn the power on for the PC, monitor and printer.
2. If the DS2 instrument is to be initialized and operated, press the DS2 instrument power to provide power to the instrument.
Figure 130: DS2 Instrument
Caution: Before pressing on the power button for the DS2 instrument, check the workspace area to be sure that all racks are properly seated and that the lids are removed from all tubes, plates and sample tip racks.
Caution: Power to DS2 is on when the indicator light is illuminated.
3. Click to start the DS-Matrix software. The Run Mode dialog box is displayed for selecting the software language and run mode.
Figure 131: Run Mode Screen
4. Select a language from the Language drop-down menu. Default is English (United States).
Indicator light
Power button

Chapter 7: Operation
© 2019 DYNEX Technologies Inc. 149 Part No. 91000200
5. Select the run mode.
Normal Mode - the instrument will initialize, perform self-testing and display the self-test report (if reporting of self-test results is enabled as described in Chapter 5.7.6). Close the self-test report to display the DS-Matrix main screen (Figure 133).
Figure 132: Self-Test Results Screen
Important: Be sure all racks are properly seated and lids are removed from all tubes, plates and sample tip racks before initializing the instrument. The instrument cannot be operated until the instrument is initialized and the self-test is successfully completed.
If one or more self-tests do not pass, an error message is displayed and an alarm sounds. The error message informs you of the component(s) that failed the self-test and the steps that must be taken to resolve the problem. Refer to the Troubleshooting chapter for information on resolving the problem. If the problem persists, contact DYNEX Technical Support for assistance.
Simulation Mode - the DS-Matrix main screen is displayed without initializing the instrument.

Chapter 7: Operation
Part No. 91000200 150 © 2019 DYNEX Technologies Inc.
Figure 133: DS-Matrix Software Main Screen
7.3 Performing Daily Maintenance Routine maintenance must be performed each day before using the system for routine testing. Refer to Chapter 10.2.1.
7.4 Empty the Liquid Waste and Tip Waste Containers Before using the system each day, verify that the liquid waste container and the tip waste container are empty.
Warning: While the DS2 system alone does not present a biohazard, all parts and consumables in contact with samples must be considered biohazardous if biological samples are being tested.
Appropriate precautions must be taken when working with biohazards. Technicians must be trained in the safe handling and cleanup of potential blood borne pathogens. Universal precautions, appropriate hygiene and decontamination of surfaces are required.
7.4.1 Empty the Liquid Waste Container 1. Open the fluidics compartment door (Chapter 4.3.1). Remove the liquid waste
container from the instrument.
Note: Two quick-connect fittings connect the liquid waste and vacuum lines to
the liquid waste container (Chapter 4.3.1). Disconnect each fitting by pressing on the metal tab of the quick-connect fitting and gently pulling on the line to remove it. Disconnect the level sensor by removing the plug from the connector.
Chapter 7: Operation
© 2019 DYNEX Technologies Inc. 151 Part No. 91000200
Warning: Never remove the cap of the liquid waste container cap while the container is on the instrument. Always remove the container first, stand it upright on the bench with the cap pointed up, then remove the cap.
2. Empty the liquid waste container by removing the waste cap at the front of the container. Dispose of the liquid waste in accordance with local regulations.
3. Replace and tighten the waste cap.
Note: Be sure that the waste cap is securely tightened. A vacuum leak will occur if the cap is not properly tightened and will cause the software to report a vacuum error condition.
4. Place the waste container on the system and reconnect the quick-connect fittings and the level sensor.
7.4.2 Empty the Tip Waste Container 1. Open the fluidics compartment door (Chapter 4.3.1).
2. Remove the tip waste container from the instrument.
3. Empty the tip waste container. Dispose of the tip waste in accordance with local regulations.
4. Rinse the waste container with deionized or distilled water. Discard the rinse water.
5. Place the tip waste container back on the system.
Note: If tip waste container is not put back in properly there is the possibility that the tip will not eject properly and could get stuck in the tip waste. The instrument will not be able to process correctly.
7.5 Load Wash Buffers and Cleaning Fluid The wash buffer(s) that must be loaded depend upon the worklist that is being run and the assay (or assays) for the worklist. Cleaning fluid (typically deionized or distilled water) is used for cleaning the wash pins.
7.5.1 When to Load Wash Buffers and Cleaning Fluid Wash buffers and cleaning fluid can either be loaded before starting the worklist or when prompted by the instrument after starting the worklist.
Click button at the bottom of the DS-Matrix main screen to display a dialog box showing the status of wash buffers and cleaning fluid.
7.5.2 Load Wash Buffers and Cleaning Fluid 1. Open the fluidics compartment door (Chapter 4.3.1).
2. If a fluid is being loaded before starting the worklist, disconnect an available container and remove it from the system.

Chapter 7: Operation
Part No. 91000200 152 © 2019 DYNEX Technologies Inc.
3. If a fluid is being loaded after starting the worklist, disconnect the specified container when prompted by the instrument and remove it from the system.
Note: Disconnect the wash line by pressing on the metal tab of the quick-connect fitting and pulling gently on the wash line. Disconnect the level sensor by removing the plug from the connector.
4. Remove the cap of the container, discard any remaining fluid and rinse the container with deionized or distilled water.
5. Obtain the wash buffer, wash buffer concentrate or cleaning fluid that will be used.
Note: The wash buffer or wash buffer concentrate may either be prepared by your facility or included in a test kit provided by a DYNEX reagent manufacturing partner.
6. If needed, reconstitute the wash buffer according to procedures utilized by your facility or directions included in the package insert accompanying the test kit.
7. Fill the container with the wash buffer or cleaning fluid.
8. Replace the top cap and place the filled and capped container back in the fluidics compartment.
9. Reconnect the quick-connect fitting and the level sensor.
10. Repeat steps 2 through 8 for each fluid that will be loaded.
11. Close the fluidics compartment door.
7.6 Load Samples Samples must be prepared for analysis, contained in appropriate sample tubes and placed in a sample rack before they can be loaded for testing.
Important: Samples containing clots are not suitable for automated processing. Do not attempt to run samples that contain clots.
If Sample IDs will be read or verified from sample tube barcode labels, all of the required sample racks should be loaded on the instrument before they are scanned since each sample rack must be pulled out and then pushed back into the instrument by the operator in order to read the barcode labels.
Note. Refer to Chapter 4.2.9 for sample tube requirements and instructions for use of barcode labels and for inserting sample tubes into a sample rack.
If sample tubes are barcode labeled, the sample tubes must be placed in the sample rack so that the barcode label faces out of the opening in the sample rack.
1. Obtain the sample racks containing the sample tubes that are to be tested.
2. Uncap the sample tubes, if needed.
3. Slide the first sample rack onto the first sample loading channel.
4. Slide the remaining samples rack onto the sample loading channels.
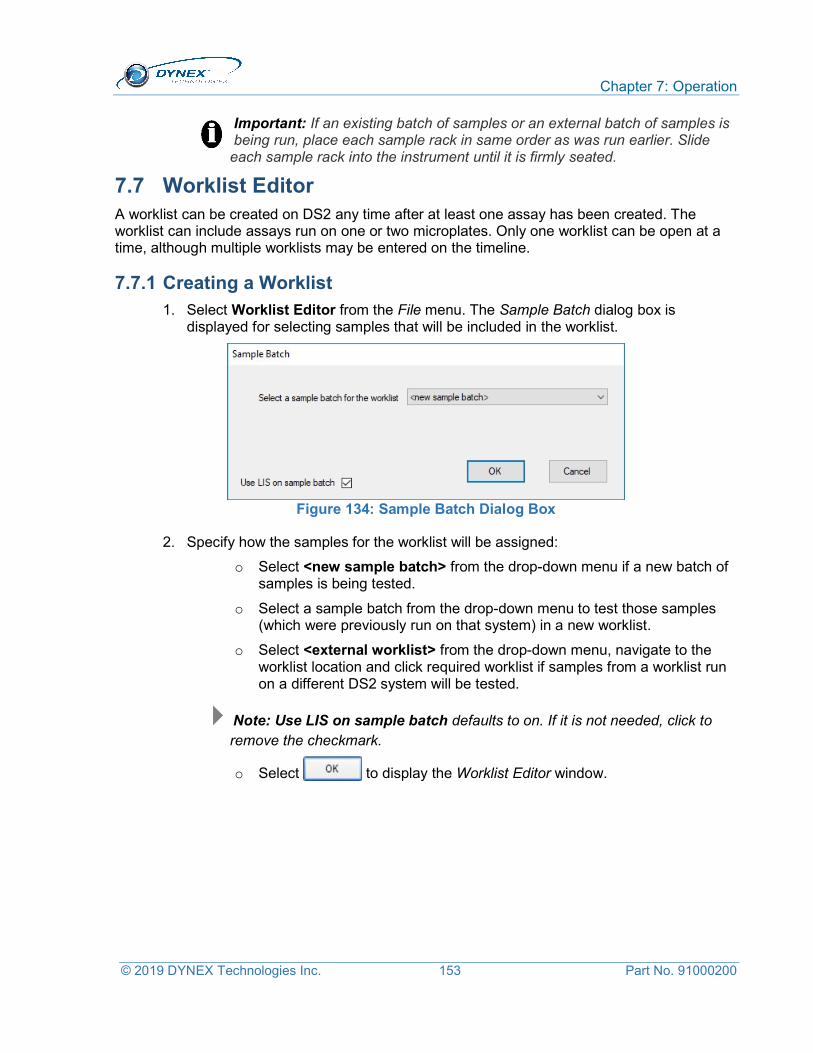
Chapter 7: Operation
© 2019 DYNEX Technologies Inc. 153 Part No. 91000200
Important: If an existing batch of samples or an external batch of samples is being run, place each sample rack in same order as was run earlier. Slide each sample rack into the instrument until it is firmly seated.
7.7 Worklist Editor A worklist can be created on DS2 any time after at least one assay has been created. The worklist can include assays run on one or two microplates. Only one worklist can be open at a time, although multiple worklists may be entered on the timeline.
7.7.1 Creating a Worklist 1. Select Worklist Editor from the File menu. The Sample Batch dialog box is
displayed for selecting samples that will be included in the worklist.
Figure 134: Sample Batch Dialog Box
2. Specify how the samples for the worklist will be assigned:
o Select <new sample batch> from the drop-down menu if a new batch of samples is being tested.
o Select a sample batch from the drop-down menu to test those samples (which were previously run on that system) in a new worklist.
o Select <external worklist> from the drop-down menu, navigate to the worklist location and click required worklist if samples from a worklist run on a different DS2 system will be tested.
Note: Use LIS on sample batch defaults to on. If it is not needed, click to remove the checkmark.
o Select to display the Worklist Editor window.

Chapter 7: Operation
Part No. 91000200 154 © 2019 DYNEX Technologies Inc.
Figure 135: Worklist Editor Window
7.7.1.1 Assign Samples to the Worklist
The procedure for assigning samples depends upon whether a new batch, an existing batch or an external batch of samples will be tested.
Note: A new batch of samples is a batch of samples that has not been previously tested on the DS2 system that you are currently using.
An existing batch of samples is a batch of samples from a worklist that was previously run on the DS2 system that you are currently using.
An external batch is a plate where sample were pipetted manually outside the DS2.
7.7.1.1.1 Assign a New Batch of Samples 1. Display the Worklist Editor window after selecting <new sample batch> in the
Sample Batch dialog box (Figure 148).
2. Enter a name (For example: B32-) for the batch in the Sample Batch Id field of the Worklist Editor window.
3. Enter the number of samples in the batch, either by selecting the number from the drop-down list in the Number of Samples field or by selecting the icon corresponding to the last sample on the last rack that will be loaded.
4. Enter Sample IDs by automatic assignment, by reading the sample tube barcode labels or by entering them manually (Chapter 7.7.1.1.4).
5. Click to display the window for assigning assays.

Chapter 7: Operation
© 2019 DYNEX Technologies Inc. 155 Part No. 91000200
Figure 136: Window for Assigning Assays
7.7.1.1.2 Assign an Existing Batch of Samples
Note: It is convenient to use an existing batch of samples if assays are being run on a batch of samples that was previously tested on DS2 that you are currently using.
1. Display the Worklist Editor window after selecting the existing batch of samples in the Sample Batch dialog box (Figure 148).
2. Enter the Sample IDs by automatic assignment, by reading the sample tube barcode labels or by entering them manually (Chapter 7.7.1.1.4).
3. Click to display the window for assigning assays.
7.7.1.1.3 Assign an External Batch of Samples 1. Display the Worklist Editor window after selecting after selecting <external worklist>
in the Sample Batch dialog box (Figure 147).
2. Navigate to the external worklist file location.
3. Select the desired file.
4. Click .
7.7.1.1.4 Enter Sample IDs Sample IDs can be automatically assigned, read from sample tube barcode labels or entered manually.
1. If Sample IDs are to be automatically assigned, click Auto Assign radio button in the Assign Sample IDs panel and specify a phrase that will precede each automatically assigned Sample ID.
Last sample on the last rack

Chapter 7: Operation
Part No. 91000200 156 © 2019 DYNEX Technologies Inc.
a. Place a checkmark in the Use Pattern checkbox and type a text phrase to precede each Sample ID with the entered phrase. If Use Pattern is not checked, Sample IDs will consist of the Sample Batch Id plus a sequential number starting with 1.
For example: If the sample batch named B32- is being run, sample IDs will be automatically assigned as B32-1, B32-2, B32-3, etc. if Use Pattern is not checked. Use a hyphen or other character at the end of the Sample Batch Id if Sample IDs will be automatically assigned and Use Pattern is not checked. This will separate the automatically assigned number from the Sample Batch Id. Otherwise, if a sample batch named B32 is being run, sample IDs will be automatically assigned as B321, B322, etc.
b. Click to automatically assign the Sample IDs.
2. If Sample IDs are to be read from sample tube barcode labels, click Scan Bar Codes radio button in the Assign Sample IDs panel.
a. The Verify Bar Codes checkbox is checked by default. When the Verify Bar Codes checkbox is enabled, test sample tube barcode labels will be read twice to ensure accurate scanning and positioning.
Important: Sample tubes must not be moved between the first scan and the second scan. If sample tubes are moved from one location to another between the first barcode scan and the verification scan, one or more patient results will be linked to the wrong sample ID.
b. Click button. A message to load the samples is displayed.
c. Click to acknowledge the message and activate the barcode scanner.
Note: Refer to Chapter 7.7.1.2 for instructions on scanning sample barcode labels.
3. If Sample IDs are to be manually entered, type the Sample ID in the text box adjacent to the icon for each sample. If the Sample IDs contain alphabetic characters, each alphabetic character must be capitalized.
Note. Manually entered sample IDs are green crosshatched. If the sample ID is duplicated they are orange.
Important: Use the CAPS lock key on the keyboard when manually entering Sample IDs that contain alphabetic characters. The letters must be capitalized.

Chapter 7: Operation
© 2019 DYNEX Technologies Inc. 157 Part No. 91000200
If a Sample ID contains manually entered alphabetic characters with both upper and lower case and the assay includes a dilution step, the system will crash and must be restarted.
7.7.1.2 Scan Sample Barcode Labels
1. Click Scan Bar Codes radio button in the Assign Sample IDs panel and specify whether the sample barcodes will be verified.
2. Click .
3. A message to load the samples is displayed.
4. Click to activate the barcode scanner.
Important: Sample racks should be loaded before selecting on the message since only 30 seconds are allowed for reading each sample rack before the scanner will time out.
5. Pull out the first sample rack and slowly push it back in. The scanner will read the bar code label on each sample tube.
Note. The sample tube icon will be green and the barcode information will be displayed for each sample tube that was successfully scanned.
If a sample tube was not scanned successfully, the sample tube icon will be red and the barcode information will not be displayed for that sample.
If two or more sample tubes have duplicate Sample IDs, a warning message is displayed. Respond No to the auto correction request and manually enter a unique suffix to each duplicate Sample ID.
Important: Do not use Auto Correction for duplicate sample IDs unless an assay with a Boolean function is being run.
6. If one or more sample tubes were not scanned successfully, rescan the rack by pulling it out and then slowly pushing it back in. If any sample tubes still cannot be scanned (i.e., if the field is blank), enter the Sample ID for each of these tubes manually.

Chapter 7: Operation
Part No. 91000200 158 © 2019 DYNEX Technologies Inc.
Note: The sample ID tube icon is green.
7.7.1.3 Assign Assays to Each Sample in the Worklist
1. Display the Worklist Editor window after selecting the existing batch of samples from the Sample Batch dialog box (Figure 33).
2. Click to display the window for assigning assays. The first sample rack, indicated by a red arrow, will be selected by default.
Figure 137: Worklist Editor Window
3. Select an assay from the list of assays. If needed, use the drop-down arrow to select an assay category.
4. Click (or double-click the selected assay) to add the selected assay to the worklist. A vertical panel of checkboxes is displayed for the selected assay.
Figure 138: Worklist Editor Window with Selected Assays
Selected rack
List of assays
Selected rack
Added assay
Drop-down menu
Vertical panel of check boxes

Chapter 7: Operation
© 2019 DYNEX Technologies Inc. 159 Part No. 91000200
5. Remove the checkmark from the checkbox for each sample on the selected rack for which the assay should not be run.
Note: Select any sample in a rack to select that rack.
6. Alternately, click drop-down arrow beneath the name of the assay on the vertical panel to display choices for assigning the assay to one or more racks of the loaded samples.
Table 39: Drop-down Selections Selection Description
Drop-down selection
Add the assay to all samples in the selected rack
Add the assay to all samples in all racks
Remove the assay from all samples in the selected rack
Remove the assay from all samples in all racks
7. Click (or double-click the selected assay) to add another assay to the worklist.
8. Another vertical panel of checkboxes is displayed for the newly selected assay. The vertical panel for the new assay is horizontally separated by default from the vertical panel for the first assay, indicating that each assay will be run on a separate plate.
Figure 139: Worklist Editor Screen
9. To run both assays on the same plate, right-click the vertical panel for the new assay and click button that is displayed.
10. The vertical panel for the new assay is no longer separated from the vertical panel for the first assay, indicating that the two assays will be run on the same plate.
Note: Up to twelve assays can be run on one plate if each assay has the same number of operations and the same incubation, reading, washing and shaking specifications.
11. Repeat steps 3 through 7 to assign the remaining assays.
Added Assay

Chapter 7: Operation
Part No. 91000200 160 © 2019 DYNEX Technologies Inc.
7.7.2 Create a Worklist Using LIS-Link
LIS-Link helps to ensure that the instrument is communicating with LIS over the network in order to determine which tests should be run with which samples. When creating a worklist and samples fail to scan, LIS will not recognize them.
When running a multi-tube assay (i.e., QFT) and all the samples have not been ordered through LIS-Link, in order to ensure the run is completed successfully, all tubes for each sample must be selected otherwise the system will register that the correct number of samples were scanned but not that the correct number were selected for the run.
1. Open DS-Matrix, click File and click .
2. Ensure that both Use LIS on sample batch box is checked and that <new sample batch> is selected.
3. Once the samples have been scanned, manually input the samples that failed and select the appropriate number tubes from the Tubes per Sample menu.
Note: Boolean functionality must be enabled in the software for this option.
Note: The dongle for multi-tube functionality must be connected to the computer.

Chapter 7: Operation
© 2019 DYNEX Technologies Inc. 161 Part No. 91000200
4. A warning message is displayed when duplicate sample IDs are found and it will give
each tube a unique identifier. Click to proceed.
5. Wait for the LIMS Wait Message window to close.

Chapter 7: Operation
Part No. 91000200 162 © 2019 DYNEX Technologies Inc.
6. Select the name of the assay that is to be run from the Assay list on the right and
click .
7. For samples not recognized by LIS, manually click on the boxes next to the sample names to ensure a checkmark is in all boxes pertaining to all samples to run on that assay plate.

Chapter 7: Operation
© 2019 DYNEX Technologies Inc. 163 Part No. 91000200
Note: Manually clicking the boxes allows the assay to be run on those samples, but it will not transmit the results to LIS. It will most likely cause the entire plate of sample results to fail to transmit and either stay in LIS-Link or generate an XML choke file causing an RPC Server Error.
8. If other racks are selected, ensure that there is a checkmark in all four boxes pertaining to all samples for those assays as well.

Chapter 7: Operation
Part No. 91000200 164 © 2019 DYNEX Technologies Inc.
9. Click when it is complete, then load the consumables and let the test run to completion.
7.7.3 Specify Dilution Ratios at Runtime If Allow sample dilutions to be changed at run time is enabled for a pipetting operation (Chapter 6.6.2), the dilution ratio for individual samples can be specified when creating the worklist.
Note. When dilution changes at runtime are enabled for an assay, a dilution button is displayed adjacent to the checkbox for each sample.
1. Click dilution button for the first sample to display the Set Dilution dialog box.
Figure 140: Set Dilution Dialog Box
2. The Original panel shows the dilution that is currently specified for the sample.
Table 40: Dilution Specifications Field Procedure to Specify the Dilution Ratio
1 in … Enter the total number of parts (i.e., 1 in 200) for the dilution.
1 to … Enter the number of parts (i.e., 199) of diluent that are used.
Diluent Volume Enter the volume (in µL) of diluent that will be dispensed into a microplate well or deep well.
3. Type the updated dilution specifications in the Modified panel of the Set Dilution dialog box.
4. Click . The dilution button for that sample turns green.
Note: Click to remove the dilution updates that were made and revert to dilutions programmed in the assay.
5. Repeat Steps 1 to 3 for each sample requiring a dilution change.
Dilution button for the corresponding sample

Chapter 7: Operation
© 2019 DYNEX Technologies Inc. 165 Part No. 91000200
7.7.4 Complete the Worklist and Displaying the Timeline After a worklist has been created and at least one assay is assigned, the worklist can be finalized and the timeline displayed.
The timeline contains operation icons that show each task that the operator must perform and each operation the instrument will perform for the worklist. The scheduled starting time is also shown for the worklist.
1. Click button on the Worklist Editor window to display the timeline. Separate timelines are shown for operator tasks (loading samples and loading consumables) and instrument operations. The timeline for operator tasks is shown below the timeline for instrument operations.
Note: Use the , and tools to compress or expand the time scale. Refer to Chapter 5.3.3 for use of the other timeline tools.
Figure 141: Timeline View Screen
2. The icon for each operator task or instrument operation is color-coded so that it can be readily identified on a timeline.
Table 41: Timeline Icons and Descriptions Icon Description Icon Description
Load samples
Incubate
Load consumables
Wash
Pipette samples
Read
Dispense reagents
Note: If the time scale is compressed, the symbol on an operation icon may no longer be displayed. However, the icon can still be identified by its color.
Incubator temperature
Scheduled starting time
for the worklist
Timeline tools
Time of day assay operations
Operator tasks

Chapter 7: Operation
Part No. 91000200 166 © 2019 DYNEX Technologies Inc.
7.8 Load Remaining Materials and Starting the Run
7.8.1 Load Samples
1. Click button on the timeline toolbar to activate the timeline, start the loading wizard and display the Load Samples window.
Important: The timeline is inactive until the button is selected on the timeline toolbar.
Do not activate the timeline until Sample IDs have been confirmed and all assays have been assigned. The worklist cannot be modified once the timeline is activated.
Figure 142: Load Samples Screen
2. If samples have not yet been loaded, load the samples (Chapter 7.6).
Note: Sample IDs should not be edited, entered or changed at this point. The loading wizard screens are only for showing the positions on the instrument where samples and consumables are to be placed.
3. Click when the samples are loaded. The Load Consumables window (Figure 143) is displayed.

Chapter 7: Operation
© 2019 DYNEX Technologies Inc. 167 Part No. 91000200
7.8.2 Load Controls, Calibrators and Reagents 1. Select one of the controls, calibrators and reagents listed on the Load Consumables
window.
2. Follow the instructions on the loading wizard screen for loading the selected control, calibrator or reagent.
Note: Load each control, calibrator and reagent in the rack location specified on the screen.
The controls, calibrators and reagents that must be loaded for an assay are specified during creation of the assay (Chapter 7.8.2).
Important: Use the specified size of container for each control, calibrator and reagent. Fill each tube with 10 to 20% more fluid than instructed, to allow room for error.
Do not use a medium reagent tube when instructed to use a large tube. Geometry of the tubes is different and using the wrong tube prevents the system from accurately tracking fluid usage.
Figure 143: Load Consumables Screen
3. Click when the selected control, calibrator or reagent has been loaded.
4. Repeat steps 1 through 3 for each control, calibrator or reagent that is listed.
5. When is selected after loading the last control, calibrator or reagent, the Load Plates window is displayed.

Chapter 7: Operation
Part No. 91000200 168 © 2019 DYNEX Technologies Inc.
7.8.3 Load Plates 1. Select one of the plates (or the only plate) listed on the Load Plates window.
2. Type a unique plate identifier in the Plate ID field.
Note: Plate IDs must not exceed 50 characters. Do not use slashes, periods or other punctuation in the plate ID.
3. The plate identifier will assist the user to identify which report they wish to view upon assay completion.
4. Follow the instructions on the loading wizard screen for loading the plate.
Note: Ensure the plate is seated securely in the plate carrier and that all strips in the plate are pushed down and oriented correctly.
5. Click when the plate has been loaded.
6. Repeat Steps 1 through 4 for the second plate, if used.
7. When is selected after loading the last (or only) plate, additional windows are displayed for loading sample tips, reagent tips and deep well strips (if needed).
7.8.4 Load Sample Tips, Reagent Tips and Deep Well Strips 1. Select one of the items listed on the loading wizard screen.
2. Follow the instructions on the loading wizard screen for loading the selected item.
Note: Load each item in the location specified on the screen.
3. Click after loading the item.
4. Repeat steps 1 through 3 for the remaining items.
5. When is selected after loading the last item, additional windows are displayed for checking the cleaning fluid, wash buffer and the waste containers.

Chapter 7: Operation
© 2019 DYNEX Technologies Inc. 169 Part No. 91000200
7.8.5 Check Cleaning Fluid, Wash Buffer and Waste Containers 1. Select one of the items listed on the loading wizard screen.
2. Follow the instructions on the loading wizard screen for checking (and/or loading) loading the selected item.
Note: Load each item in the location specified on the screen.
3. Click after checking or loading the item.
4. Repeat Steps 1 through 3 for the remaining items.
5. When is selected after checking or loading the last item, the run starts.
7.9 Monitor Status of the Run, Consumables and Plate(s) After all of the samples, consumables, plates and other items have been loaded and acknowledged, the run starts automatically and the timeline is displayed.
Note: In this manual, the term consumables refer to sample pipette tips, reagent pipette tips, plates and all fluids except samples.
The timeline displays the current time and the time interval during which each operation will be executed for the worklist.
Figure 144: Timeline Screen
Current time
Timeline tools
Operator tasks Assay operations
Time of day
Incubator temperature

Chapter 7: Operation
Part No. 91000200 170 © 2019 DYNEX Technologies Inc.
1. Click to display a window showing the status of all consumables and the plate(s) for the worklist.
Figure 145: Consumables Status Screen
2. The name, type, location, current and required volume and loading time for each reagent, diluent, calibrator or control in the worklist are shown on the Neat Fluids tab.
Figure 146: Neat Fluids Tab
3. The lot number and remaining use time are also shown if the lot number and expiration date are entered by the operator at runtime.
Status of each fluid Status of each plate
Status of sample tips and reagent tips

Chapter 7: Operation
© 2019 DYNEX Technologies Inc. 171 Part No. 91000200
4. Click or to scroll through the status of each fluid used in the worklist.
5. The name, type, location, current and required volume and loading time for each wash buffer in the worklist are shown on the Washer Fluids tab. The lot number and remaining use time are also shown if the lot number and expiration date are entered by the operator at runtime.
Note: The name, type, location and volume for each fluid used in an assay are specified in the database (Chapter 5.6). The lot number and expiration date for a fluid are entered by the operator if Request kit lot data at runtime is enabled for the assay that is being run (Figure 77).
6. Click or to scroll through the status of each wash buffer used in the worklist.
7.10 Clot Detection During a Run Samples containing clots are not suitable for automated processing. If a clot is detected during pipetting of samples, an error message is displayed and the operator is provided with choices for recovery.
If the retry with a new tip option is selected for recovery when a clot is detected, level detection is not repeated on that sample. Therefore, the operator must not attempt to remove the clot or do anything that will alter the liquid level in the sample, to avoid insufficient sample transfer due to a reduced liquid level.
Important: Once any fluid requested has been loaded on to the system, it is important that no additional fluid is added or fluid is removed from any vessels
unless the operator is instructed by the controlling software.
7.11 Continuous Loading After an initial worklist has been created and processing of the worklist has begun, an additional worklist can be created.
Important: Do not create an additional worklist until processing of the initial worklist has reached the incubation stage.
1. Select Worklist Editor from the File menu. The Sample Batch dialog box is displayed for selecting samples that will be included in the new worklist.
Figure 147: Sample Box Dialog Box
2. Specify how the samples for the new worklist will be assigned:
Select <new sample batch> from the drop-down menu if a new batch of samples is being tested.
Select a sample batch from the drop-down menu to test those samples (which were previously run on that system) in a new worklist.

Chapter 7: Operation
Part No. 91000200 172 © 2019 DYNEX Technologies Inc.
Click <external worklist> from the drop-down menu.
3. Click . The Worklist Editor window is displayed over the Timeline.
4. Assign samples to the new worklist as outlined in Chapter 7.7.1.1.1.
5. Load the samples (and read their barcodes, if needed) for the new worklist when indicated on the Timeline.
Important: If barcode labels will be read on the sample tubes for the new worklist, the sample barcodes cannot be read until the time that is shown on the Timeline for reading these barcodes.
Sample racks must be prepared, loaded on the instrument when prompted and in place for the barcode reader to be activated.
The operator must be present at the DS2 instrument before the scheduled time for barcode scanning since the system will time out if the first sample rack is not scanned within 30 seconds of the prompt. Subsequent racks must be scanned every 30 seconds.
Figure 148:Timeline for Reading Barcodes
6. Once the barcodes are scanned or Sample IDs are manually entered successfully, add the desired assays to the worklist (Chapter 7.7.1.3).
7. Click on the Worklist Editor window to add the second worklist to the timeline.
Figure 149: Second Worklist to Timeline
1. Click on the timeline toolbar to activate the second worklist on the timeline.
- or -
2. Click on the timeline toolbar to display alternate timelines for selection.
Important: All reagents and consumables must be ready to load on the DS2 instrument before the indicated time. Approximately three minutes is allocated for loading reagents and consumables. If this period is exceeded, timing for both worklists may be affected.
Current time Consumables must be loaded
Operator must be present Current time

Chapter 7: Operation
© 2019 DYNEX Technologies Inc. 173 Part No. 91000200
7.12 Reviewing Results
displays the assay report for the most recently tested plate or for a plate selected from the adjacent listing of recently tested plates.
Figure 150: View Report Screen
Assay reports can be reviewed, printed, saved and exported. Refer to Chapter 9: for procedures to locate test results, the types of reports that can be obtained and procedures for saving, printing and exporting results.
allows a query for assay reports by date range.

Chapter 7: Operation
Part No. 91000200 174 © 2019 DYNEX Technologies Inc.
7.13 Pause, Abort a Plate or Abort the Worklist
7.13.1 Pause and Resume Operation of the Instrument A run can be paused at any time. The run can then be either resumed or the run can be aborted.
1. Click on the toolbar. Operation of the instrument pauses when it arrives at a state where the operations can be safely stopped.
2. To resume operation of the instrument, click on the toolbar.
7.13.2 Abort a Plate or the Worklist
1. Click on the toolbar. The Abort Plate(s) dialog box is displayed.
Figure 151: Abort Plate(s) Dialog Box
2. Click Abort Entire Worklist to abort the worklist. Or, click Abort Plate button and click plate(s) to be aborted to abort the plate(s).
3. Click . A confirmation prompt is displayed.
4. Acknowledge the prompt to abort the plate(s) or worklist.
Note: The system may not stop immediately. Plates may continue the operational sequence but no additional samples will be pipetted.

Chapter 7: Operation
© 2019 DYNEX Technologies Inc. 175 Part No. 91000200
7.14 Shut Down the System The system can be shut down at the end of a session or any other time when worklists are not in progress.
1. Click Exit from the File menu. The Exit DS-Matrix dialog box is displayed.
Figure 152: Exit DS-Matrix Dialog Box
2. Click . Operation of the instrument stops when it arrives at a state where the operations can be safely halted.
Note: The system may not stop immediately since some operations may need to arrive at a state where the system can be safely stopped. Plates may continue through the operational sequence but no additional samples will be pipetted.
3. Press the power button to shut down the instrument.

Chapter 7: Operation
Part No. 91000200 176 © 2019 DYNEX Technologies Inc.
This page intentionally left blank.

Chapter 8: Quality Control
© 2019 DYNEX Technologies Inc. 177 Part No. 91000200
Chapter 8: Quality Control Multiple layers of quality control are automatically performed whenever the DS2 instrument is started and operated:
Self-testing during start-up.
Use of ESP during pipetting.
Testing of calibrators and/or controls if they are included in the assay.
Quality control equations that are included in the assay to automatically verify that a result is either within specified limits and can be reported or is outside of specified limits and will not be reported and/or will be flagged.
Well filling verification, if included in the assay.
Levey-Jennings plots, if included in the report.
Error detection and recovery during operation.
Additional quality control procedures, including user-defined controls in each worklist and verification of washing consistency, can be periodically performed by the operator.
8.1 Quality Control Procedures Performed Automatically
8.1.1 Self-Testing During Start-up Proper operation of various instrument components is checked each time the instrument is started. Upon completion of the self-test, the results are displayed for review by the operator if enabled during instrument configuration.
Results of all instrument self-tests must be passed in order for the instrument to be operated to perform tests. Results from each self-test are saved and can be retrieved at a later date for review, printing and/or exporting.
8.1.2 Use of ESP ESP is a sophisticated technique used by the DS2 instrument for detection of gross pipetting errors often caused by the presence of particulate matter, clots, foam or bubbles in the sample.
Use of ESP requires collecting pipetting pressure profiles from a specified number of acceptable sample transfers for a fluid with a specified pipetting profile and volume. These profiles are then stored in a database and are used as a comparison against each pipetting profile observed during routine pipetting of that fluid to detect and report an episode of insufficient sample transfer.
8.1.3 Automatic Testing of Calibrators and/or Controls Calibrators and controls can be included in an assay template so that the instrument will automatically test these in every worklist. The calibrators and controls are loaded in the same area as the reagents for the assay.

Chapter 8: Quality Control
Part No. 91000200 178 © 2019 DYNEX Technologies Inc.
8.1.4 Quality Control Equations The manner in which results of an assay are read, analyzed and reported is specified in the assay file. These specifications in the assay file allow the assay creator to include one or more quality control equations to verify that a result is either within specified limits and can be reported or is outside of specified limits and will not be reported and/or will be flagged.
8.1.5 Well Fill Verification A well fill verification can be included in an assay to verify that the proper volume of reagents has been dispensed. The well fill verification is performed by measuring the optical density of the contents of each designated well and then comparing the measured optical densities with expected values.
8.1.6 Levy-Jennings Plots Levey-Jennings plots of control values can be included in an assay report to provide an indication of trends or shifts in an assay.
8.1.7 Error Detection and Recovery An audible alarm sounds and the Error Recovery screen is displayed if an error occurs during operation of the DS2 instrument (Chapter 5.12). The error message screen indicates the error that has occurred and displays choices and instructions for resolving the error.
8.2 Quality Control Procedures Performed by the Operator
8.2.1 Testing of Controls
An assay can include one or more standards as well as negative, positive, cut off, reference, serum and antigen controls.
The results for the standards and controls are included in the reports for the run. If these results are not within specified limits, the test can be rejected.
8.2.2 Periodic Verification of the Washer
DYNEX recommends creating an assay to verify the washer is working correctly prior to running any assays. This assay should be run at the beginning of each shift (Chapter 10.2).
DYNEX also recommends creating an assay to flush the wash head with distilled/deionized water as part of the daily shut down procedure (Chapter 7.14).

Chapter 9: Reports
© 2019 DYNEX Technologies Inc. 179 Part No. 91000200
Chapter 9: Reports 9.1 Assay Reports Results from a worklist are contained in an assay report. Assay reports from all worklists are calculated as needed from the worklist plate-well measured OD values and the assay definition used by the worklist. To display an assay report for a given worklist, select the worklist in the Recent Tests window or from the Select History Report dialog.
Assay reports typically contain the following information:
Name of the test and the date and time the test was run.
Samples, calibrator and controls that were tested and their location on the plate.
Results obtained on each sample, calibrator and control.
Results (Passed or Failed) of the QC testing that was performed.
Result flag to indicate if the sample ID was manually entered or if the test result was out of range.
Note: The data included in an assay report and the way it is formatted are specified when configuring the assay (Chapter 6.16).
9.2 Other Reports Two additional reports are also prepared by DS2:
Self-test reports from each instrument start-up are created and saved if these features are enabled during system configuration (Chapter 5.7.6). The self-test report is displayed on start-up and can be printed at that time. After that, the self-test report can be retrieved from the specified location.
Event logs listing daily details of operator login and system operation. These reports are automatically saved and can be retrieved (Figure 170) for review and/or printing.

Chapter 9: Reports
Part No. 91000200 180 © 2019 DYNEX Technologies Inc.
9.3 View Report Window Assay reports are displayed in the View Report window.
Figure 153: View Report Screen
Commands on the View Report window are described in Table 42.
Table 42: View Report Commands and Description Command Description
Print Print the report that is currently being displayed (Chapter 9.11).
Zoom Expand or contract the report display using the drop-down list of options adjacent to the Zoom command.
Font Compose the report using a different font or font size.
PageUp Display the previous page of the report.
PageDown Display the next page of the report.
Page Setup Display a dialog box for formatting the report.
Outlier Removal Display a dialog box for removing one or more outliers (Chapter 9.6).
New Assay Recalculate the results using a different curve fit, threshold levels or ratio equation (Figure 165).
Save As Save a report under a new file name.
Save Concentration Curve
Display a dialog box for saving a curve fit calibration curve for use with other runs with that assay (Figure 166).

Chapter 9: Reports
© 2019 DYNEX Technologies Inc. 181 Part No. 91000200
9.4 Retrieving Assay Reports
9.4.1 Displaying the Report for the Current Plate
1. Click . The results report for the plate that was just tested is displayed in the View Report window.
9.4.2 Displaying the Report for a Recently Tested Plate
1. Select a plate from the Recent Tests panel and click (or double-click the plate). The results report for the selected plate is displayed in the Report Viewer window.
Figure 154: Recent Tests Panel
9.4.3 Displaying Reports for Other Plates
1. Click to display the Select History Report dialog box.
Figure 155: Select History Report Dialog Box
2. If needed, place a checkmark in the Show All checkbox to display a listing of reports for all plates that have been tested.
- or -
3. Enter a date range in the from and to fields.
4. Click to display a listing of reports for plates tested during the date range.
5. Click the report that is to be displayed.
6. Click . The selected results report is displayed in the Report Viewer window.
Recently tested plates

Chapter 9: Reports
Part No. 91000200 182 © 2019 DYNEX Technologies Inc.
9.5 Content of Assay Reports The data that will be included in an assay report and the way it is formatted in the report are specified when the data operations for an assay are configured. Refer to Chapter 6.16 for additional information.
Information about the assay, the reagents that were used, reader wavelengths and other information is shown in the header of each report.
Figure 156: Assay Report Content

Chapter 9: Reports
© 2019 DYNEX Technologies Inc. 183 Part No. 91000200
9.5.1 Reporting of Raw Data QC Equations Raw Data QC equations specified for the reading operation are reported as shown in Figure 157.
Figure 157: Raw QC Equations Report
9.5.2 Reporting of Raw Data Sample IDs and raw data that are included in a report can be organized in a DS-Matrix format and/or in a table format.
An example of Sample IDs and raw data reported in DS-Matrix format is shown in Figure 158.
Figure 158: Raw Unblanked Results
An example of Sample IDs and raw data from that same worklist reported in table format is shown in Figure 159.
Figure 159: Sample IDs and Raw Data Report

Chapter 9: Reports
Part No. 91000200 184 © 2019 DYNEX Technologies Inc.
9.5.3 Reporting of Test Result QC Equations QC equations are reported as shown in Figure 160.
Figure 160: Threshold QC Equations Report
9.5.4 Reporting of Test Results Test results can be organized in a DS-Matrix format and/or in a table format.
An example of Sample IDs and threshold test results reported in DS-Matrix format is shown in Figure 161.
Figure 161: Threshold Results Report
An example of Sample IDs and threshold test results from that same worklist reported in table format is in Figure 162.
Figure 162: Example of Sample IDs and Threshold Test Results

Chapter 9: Reports
© 2019 DYNEX Technologies Inc. 185 Part No. 91000200
9.5.5 Rounding of Test Results Numerical data used to perform calculations may be slightly different than the corresponding numerical data displayed on the report, due to rounding of the results that are displayed.
In addition, there can appear to be a discrepancy between the data values displayed and the final result designation when the results are near the cut-off point when using threshold and Boolean function operations. In these instances, the final result displayed in the threshold or Boolean function are correct but the numerical data or manually calculated data seem discordant due to rounding of the displayed data.
If needed, additional information is provided in DYNEX Technical Bulletin 201.
9.5.6 Scientific Notation Error Occasionally, when the software is processing very small numbers, those numbers are converted into scientific notation which the software cannot process further when performing subsequent data calculations. If this occurs, an error message is displayed when attempting to open the report.
Figure 163: Error Message Pop-Up Box
This message indicates that there is an error in the data reduction performed during results reporting. Data from this report should not be used to report patient results.

Chapter 9: Reports
Part No. 91000200 186 © 2019 DYNEX Technologies Inc.
9.6 Removing One or More Outliers Removing outliers is especially useful to redraw curve fits if one standard replicate or an entire point has an OD that is too high or too low.
1. Display the assay report for which one or more outliers are to be removed.
2. Click Outlier Removal on the View Report window. The Outlier Removal dialog box is displayed.
Figure 164: Outer Removal Dialog Box
1. Select a well that is to be removed from the analysis and then place a checkmark in its checkbox.
2. Repeat step 3 for any other wells that are to be removed from the analysis.
3. Click to recalculate the data.
Note: When removing outliers, ensure that enough valid data points remain to redraw the curve.
If needed, click Save As Command on the View Report window to save the new report with a new name.
9.7 Recalculate Results Using a Different Calculation Results can be recalculated using a different curve fit, threshold levels or ratio equation.
1. Display the assay report for which the results are to be recalculated.
2. Click New Assay Command on the View Report window. The Select New Assay dialog box is displayed:

Chapter 9: Reports
© 2019 DYNEX Technologies Inc. 187 Part No. 91000200
Figure 165:Select New Assay Dialog Box
3. Click new assay that is to be used for recalculating the results.
4. Click to recalculate and display a new report with the updated results.
Note: A warning that results may have been reproduced using different settings to the original assay is included in the new report.
5. Click Save As command on the View Report window to save the new report with a new name, if needed.
9.8 Saving a Standard Curve for Use as a Stored Curve In order to re-use a standard curve for subsequent assays, the subsequent assays must be run on the same DS2 instrument on which the standard curve was obtained. In addition, it may be necessary to create a new standard curve with every new lot of reagents.
1. Display the assay report for which the results are to be recalculated.
2. Click Save Concentration Curve on the View Report window. The Save Stored Curve Data dialog box is displayed.

Chapter 9: Reports
Part No. 91000200 188 © 2019 DYNEX Technologies Inc.
Figure 166: Save Stored Curve Data Dialog Box
Note: The name of the assay for which the report is being displayed is displayed in the Stored Curve Name field. This field can be edited tore-name the stored curve (see the following step).
The Data about the curve panel is read-only and shows the fit type that was used and the concentration and optical density of each standard used to generate the standard curve.
3. Type a new name in the Stored Curve Name field, if needed.
4. In the Kit Lot Number field, type the lot number or other identifier for the reagents that were used to obtain the standard curve.
5. Click to store the standard curve under the name entered in Step 3.
9.9 Event Logs The Event Log lists every action that DS2 performs during an assay. A new Event Log is created each time the software is started.
9.9.1 Viewing the Event Log for the Current Session 1. Click View Event Log on the tools menu to display the Event Log window.

Chapter 9: Reports
© 2019 DYNEX Technologies Inc. 189 Part No. 91000200
Figure 167: Event Log Dialog Box
9.9.2 Searching the Event Log for a Phrase 1. Enter the phrase (For example: error) in the text box at the top of the screen.
Figure 168: Search Box
2. Click Find to display the first entry containing that phrase.
3. Click to display each subsequent entry containing that phrase.
9.9.3 Viewing an Event Log from a Previous Session 1. Click to display a calendar.
2. Click date for the session to display a listing of sessions (if there were more than one) on that date.
3. Click session for the Event Log.
4. Click to display the Event Log for that session.
9.10 Creating Levey-Jennings Plots Levy-Jennings charts consist of plotted results from a sample over time to provide a visual indication of whether there are trends in an assay result over time and whether the values that are obtained are within a range of expected results. Typically, a sample with a known value (For example: a control) is used.
Levey-Jennings charts of either raw optical density values or calculated results (concentrations or ratios) can be displayed on the DS2 instrument for specified wells on an assay plate. Westgard Rules may also be applied.

Chapter 9: Reports
Part No. 91000200 190 © 2019 DYNEX Technologies Inc.
9.10.1 Running the Levey-Jennings Analysis
1. Select Levey-Jennings on the tools menu to display the Levey-Jennings dialog box.
Figure 169: Levey-Jennings Dialog Box
2. In the Assays: field, click assay for which the Levey-Jennings analysis is to be performed.
3. In the Time Range panel, click radio button corresponding to the time range over which the assay will be analysed.
Note: Select All to display data for every run of that assay stored in the plate database. Otherwise, select a time frame of one week, one month or one year to analyze data generated within that time period. Alternately, a starting date and all data generated from that point in time can be analyzed or a number of the most recent data sets (1,2,3,4…) can be selected.
4. Click in the Time Range panel. Plates that were run for the specified assay during the specified time period are displayed:
Figure 170: Time Range Panel
5. In the Select Plates panel, place a checkmark next to each plate that should be included in the Levey-Jennings analysis. Each plate will represent a single time point on the plot.
Note: Be sure that all plates were tested with the current version of the assay since a new assay version is created whenever an assay is saved. If a plate tested with a prior assay version is selected, the Levey-Jennings program will not analyse the data.

Chapter 9: Reports
© 2019 DYNEX Technologies Inc. 191 Part No. 91000200
6. In the Select Wells panel, place a checkmark next to each well type (usually a control) that should be included in the Levey-Jennings analysis.
7. Place a checkmark next to Average Replicates if the average of replicate values is to be plotted rather than the individual values.
8. In the Statistics panel, click radio button corresponding to the data that should be plotted.
Note: Click Plate Data radio button if optical density values are to be plotted. Click Data Reduction radio button if results calculated from a Curve Fit, Threshold or Ratio operation are to be plotted.
9. In the Quality Control panel, place a checkmark next to each quality control limit that should be met for the analysis to pass.
10. Click from the Statistics panel to run the Levey-Jennings analysis and display the Levey-Jennings plot.
Figure 171: Levey-Jennings Plot
11. Click to display a printable version of the results and graph with header information.
12. Click in the Statistics panel to save the data.
13. Click in the Statistics panel to retrieve saved data and re-analyse.
Note: Data must be saved before it can be loaded. Otherwise, a message will appear that no results are available.
14. Click in the Statistics panel to close the Levey-Jennings dialog box.
9.11 Print Reports Click Print at the top of the View Report window to create a printed copy of the results report on the specified printer.
Alternately, use a networked printer to navigate to and print the report.
9.12 Create a PDF Version of an Assay Report or Self-Test Report To create a PDF copy of the report, perform the following steps:

Chapter 9: Reports
Part No. 91000200 192 © 2019 DYNEX Technologies Inc.
1. Click File Print.
2. Click on a PDF format printer, such as Microsoft Print to PDF or Adobe Print.
3. Click .
4. Select the location of where the file is to be saved.
Figure 172: Save Assay as a PDF
9.13 Create a Copy of an Assay Report or a Self-Test Report Click Save As to create a new copy of the plate assay in the database using the newly entered name as the title. The database reopens the new database record in the plate report viewer.
9.14 Exporting a Report Reports that are created by DS2 can be exported for review, printing and/or further analysis on a PC. Reports are saved in a local folder created by the user. Reports can be retrieved, viewed, printed and exported from this folder.

Chapter 10: Maintenance
© 2019 DYNEX Technologies Inc. 193 Part No. 91000200
Chapter 10: Maintenance Periodic maintenance procedures must be performed on the DS2 instrument. These procedures include:
General cleaning and decontamination Daily maintenance Weekly maintenance Six-month maintenance Annual maintenance As-needed maintenance.
Warning: Always disconnect the power cord from the DS2 instrument and disconnect the USB cables before performing maintenance procedures.
10.1 General Cleaning and Decontamination DS2 is constructed from materials that resist chemical attack. However, spills should be cleaned as soon as possible.
If you need to decontaminate the instrument, external surfaces of the instrument should be cleaned before the instrument is decontaminated.
Warning: While the DS2 instrument alone does not present a biohazard, the samples that are used and all parts and consumables in contact with the samples must be considered biohazardous and/or toxic. Always wear protective gloves and suitable eye protection when handling potentially infectious substances.
Important: Ethyl alcohol, 70% isopropyl alcohol or laboratory disinfectants containing quaternary ammonium sulfates are approved for use to clean and disinfect the DS2 instrument. Do not use bleach and do not use cleaning agents or decontaminating agents that could cause a hazard as a result of reaction with parts of the equipment or with material contained in it.
Do not allow excess liquid to drip into the interior of the instrument. Do not use sprays except where advised.

Chapter 10: Maintenance
Part No. 91000200 194 © 2019 DYNEX Technologies Inc.
10.1.1 Check Areas Adjacent to the Instrument Areas immediately around the instrument should be free of any materials or objects that may interfere with airflow.
10.1.2 Clean External Surfaces of the Instrument Clean external surfaces of the instrument, waste containers, wash buffer containers and tubing lines with a cloth moistened with mild laboratory detergent. If needed, dilute the laboratory detergent according to the manufacturer's instructions before using.
Note: If there is doubt about the compatibility of cleaning agents with parts of the DS2 system, contact your DYNEX representative.
10.1.3 Decontaminate the Instrument 1. Clean external surfaces of the instrument, waste containers, wash buffer containers
and tubing lines with a cloth moistened with mild laboratory detergent.
Important: Do not use bleach, as it attacks materials chemically and will shorten the useful life of many components.
2. Wipe external surfaces of the instrument, waste containers, wash buffer containers and tubing lines with a cloth moistened with a 70% (v/v) solution of alcohol.
3. Rinse the waste containers with 70% alcohol. Then rinse the waste containers with deionized water to remove the alcohol.
4. Remove racks and soak them in disinfectant solution for at least 30 minutes or for the time recommended by the manufacturer of the disinfectant. Rinse racks thoroughly with distilled or deionized water and dry thoroughly replacing.
5. Run 70% alcohol through all of the tubing lines.
6. Then run deionized water through the tubing lines to remove the alcohol.
Important: Residual alcohol may affect the results of assays. Remove residual alcohol from surfaces with a cloth moistened with deionized water.
10.1.4 Decontaminate the Wash Head 1. Remove the wash head assembly from the instrument, remove the buffer and waste
tubing from the wash head.
2. Using 4 mm (PN 42000830) and 2 mm (PN 42000810) hex wrenches, remove the four set screws from the sides of the wash head manifold.
3. Immerse the head and the set screws in a disinfectant solution. The wash head should be left standing upright in the solution and should only be submerged in disinfectant up to the gap where the springs are located. Follow the manufacturer’s directions for the disinfectant to determine concentration and contact time for disinfection.
4. Using the cleaning wires, carefully clean the aspirate and dispense needles.
5. Use a mild detergent and a low lint cloth to clean the whole head and remove any build up on the tips.

Chapter 10: Maintenance
© 2019 DYNEX Technologies Inc. 195 Part No. 91000200
6. Flush the head and the four screws with water to remove all traces of detergent and disinfectant.
7. Allow the wash head and screws to dry.
8. Reinsert the screws and tighten them until they are snug, but do not over-tighten or the plastic material of the wash head will crack.
9. Run a test wash with deionized water to ensure all disinfectant has been removed from the wash head and to confirm the wash head does not leak.
Note: The smaller of the two screws may leak wash buffer. If there is leaking at the smaller screw, tighten it 1/8th of a turn and test it again. Repeat until there is no longer any leakage. The larger of the screws should never leak.
10.2 Scheduled Maintenance
10.2.1 Daily Maintenance The following maintenance procedures must be performed on a daily basis:
1. Empty and clean the liquid waste container (Chapter 7.4.1).
2. Empty and clean the tip waste container (Chapter 7.4.2).
Warning: While the DS2 system does not present a biohazard, if biological samples are being tested the samples and all parts and consumables in contact with the samples must be considered as biohazards.
Always wear protective gloves when handling potentially hazardous substances.
Note: The waste tip container and the liquid waste container may be
disinfected with 70% ethanol.
Important: Residual alcohol fumes may affect the results of assays. If containers are rinsed with alcohol, they must be thoroughly rinsed with deionized water before replacing.
Remove residual alcohol from surfaces with a cloth moistened with deionized water.
3. Fill the wash buffer and wash head cleaning fluid containers (Chapter 7.5).
4. Wipe external surfaces of the instrument, waste containers, wash buffer containers and tubing lines with a cloth moistened with a 70% (v/v) solution of alcohol. Pay special attention to the pipette spigot, the tip sensor area, the wash head sensor and the wash head assembly.
5. Clean the pipette spigot using a non-fibrous to well moistened with 70% alcohol.
6. After performing steps 4 and 5, remove any residual alcohol with a cloth dampened with distilled water.

Chapter 10: Maintenance
Part No. 91000200 196 © 2019 DYNEX Technologies Inc.
7. Run 70% alcohol through all of the tubing lines.
8. Run deionized water through the tubing lines to remove the alcohol.
10.2.2 Weekly Maintenance The following maintenance procedure must be performed on a weekly basis:
1. Empty the wash buffer containers and rinse them several times with deionized water.
10.2.3 Six-Month Maintenance 1. Clean surfaces of dust, debris and spillage.
2. With a moist cloth, wipe the sample tray guides.
3. Clean interior workspace with a moist cloth and mild detergent. Wipe dry.
4. Perform an alcohol/disinfectant wash:
a. Fill the wash buffer bottles with 70% alcohol or disinfectant.
b. Rinse the wash buffer bottles thoroughly with distilled water.
c. Fill the wash buffer bottles with distilled water.
d. Run several wash assays using fluid from each buffer bottle until alcohol/disinfectant is removed from the tubing lines.
5. Check the gas spring by closing the cover of the instrument and then lifting the cover approximately eight inches. If the cover stays open or closes slowly, the gas spring is acceptable. If the cover falls down rapidly, the gas spring must be replaced.
10.2.4 Annual Maintenance Preventive maintenance is performed on the DS2 instrument by DYNEX on an annual basis. The annual preventive maintenance visit includes the following:
1. System self-test.
2. Check that all tests pass.
3. Clean all exterior surfaces, including the wash head.
4. Replace tubing set including filter and verify bottles.
Note: The dispense tubing and aspiration tubing may need to be replaced more frequently than once every year, depending upon the frequency of use and the severity of operating conditions.
5. Replace lamp (once per year).
6. Replace reader fan filter and clean optics.
7. Inspect bottle fitting O-rings and spigot.
8. Run washer verification (dispense calibration, residual volume).
9. Absorbance Reader (AM Module) verification using verification tools.

Chapter 10: Maintenance
© 2019 DYNEX Technologies Inc. 197 Part No. 91000200
10. Reader filters inspected and cleaned.
11. Inspect spring clips on plate carriers and replace as needed.
12. Workspace calibration tests performed.
13. Incubator check.
14. Pipette check.
15. Decontaminating the Tubing Lines
Silicone tubing is used for buffer and waste liquid. Routine preventive maintenance procedures call for the replacement of the complete tubing sets at regular intervals. Discarded tubing sets should be decontaminated by autoclaving.
In some cases, there may be visible signs of biofilm build-up in visible buffer tubing lines. Usually this is in the form of pigmented spots of material inside of the lines. If needed, the lines can be cleaned with 70% alcohol or mild laboratory detergent (with or without disinfectant). The tubing lines must be rinsed with copious amounts of water to ensure any cleaning liquid is removed from the lines since if cleaning fluid remains in the lines, assay results may be affected.
Note: Do NOT use bleach to clean the tubing lines.
10.2.5 Replacement of the Tubing Lines
Note: This MUST only be done by a specially trained technician.
1. Open the DS2 fluidic area cover (Figure 19).
2. Disconnect and remove the two wash buffer containers, the liquid waste container and the tip waste container (Figure 173).
3. Disconnect the twin bore wash head tube from the wash head manifold.
4. Unscrew the black thumb nut that secures the wash head manifold to the analytical area platform.
Note: The black manifold thumb nut is located beneath the analytical area platform of the instrument.

Chapter 10: Maintenance
Part No. 91000200 198 © 2019 DYNEX Technologies Inc.
Figure 173: Disconnecting the Wash Head Aspirate and Dispense Tubes
5. Disconnect the wash manifold aspirate and dispense tubes from the wash head manifold (Figure 173).
Figure 174: Disconnecting the Tubes from the Wash Head Manifold
6. Remove the wash manifold dispense tube from the pinch valve and then disconnect it from the pump outlet.
7. Disconnect the wash manifold aspirate tube from the waste fitting.
8. Disconnect the tubing to wash buffer containers A and B from the fittings for these containers.
9. Gently pull the 90° fitting out of the grommet and disconnect the wash head cleaning tube.
10. Remove the tubes and the inline wash buffer filter from the pinch valves and then disconnect them from the pump inlet.
Wash Head Manifold
Wash Manifold Aspirate and Dispense Tubes
Pump Outlet
Pinch Valve
Waste Fitting
Wash Head Manifold and Thumb Screw
Twin Bore Wash Head Tube

Chapter 10: Maintenance
© 2019 DYNEX Technologies Inc. 199 Part No. 91000200
Figure 175: Disconnect Wash Head Manifold Aspirate and Dispense Tubes
11. Insert the replacement tubing for the pump valve assembly in reverse of the order in which the tubing was removed (steps 4 through 10).
12. Lift the wash head off its cradle, remove the old twin bore tube from the wash head and replace it with a new twin bore wash head tube.
13. Holding the wash head upright (Figure 176), connect the free end of the new twin bore wash head tube to the wash head manifold.
Figure 176: Connecting the Twin Bore Wash Head Tubing
14. Rotate the wash head 90 degrees clockwise, then place it back onto the cradle.
15. Remove and replace the tubing on the two wash buffer containers and on the liquid waste container (Figure 177).
16. Connect the two wash buffer containers and the liquid waste container to the instrument. Place the tip waste container in its proper location.
Important: Ensure that the twin bore wash head tube is not kinked or twisted in a way that will prevent flow of fluid to or from the wash head.
Wash Head Position
Pump Inlet and Inline Wash Buffer Filter
Tubing to Wash Buffer Containers
A and B
Fittings
Wash Head Cleaning Tube 90° Fitting

Chapter 10: Maintenance
Part No. 91000200 200 © 2019 DYNEX Technologies Inc.
Figure 177: Replacing Wash Buffer and Liquid Waste Tubing
10.2.6 Cleaning the Wash Head Assembly 1. Grasp the wash head assembly and lift it up from the cradle.
2. Move the wash head assembly and tubing clear of the instrument. If necessary, remove the twin bore wash head tubing (Chapter 15 and 10.2.5).
3. Pass a cleaning wire through the inside of each aspirate pin and dispense pin on the wash head.
4. Clean the dispense pins (shorter and narrower diameter) using the 0.018 mm cleaning wire (PN 352101800).
5. Clean the aspiration pins (longer and large diameter) using the 0.040 mm cleaning wire (PN 352104000).
6. Using 4 mm (PN 42000830) and 2 mm (PN 42000810) hex wrenches, remove the four set screws from the sides of the wash head manifold.
7. If necessary, the wash head may be soaked in disinfectant solution or 70% alcohol.
8. Ensuring that the wash head is standing upright in a container, fill the container with disinfectant solution up to the gap on the wash head where the springs are located.
9. Soak the wash head for several hours or overnight.
10. Rinse the wash head thoroughly with deionized water to remove all traces of disinfectant solution.
11. Replace the screws, being careful not to over-tighten the screws. Over-tightening the screws may crack the wash head.
12. If the twin bore wash head tubing was removed, replace it, ensuring the tubing is not kinked.
13. Rinse the wash head thoroughly with deionized water to remove all traces of disinfectant solution.
14. Position the wash head assembly back in the cradle.
15. Purge the wash head thoroughly with deionized water to remove all traces of disinfectant solution.
Important: It is recommended that a cleaning with deionized water is programmed to be performed at the end of every wash operation.

Chapter 10: Maintenance
© 2019 DYNEX Technologies Inc. 201 Part No. 91000200
10.2.7 Replacing Wavelength Filters The lamp and wavelength filters are located in the reader module.
Caution: The optics assembly may be hot. Allow at least five minutes for the instrument to cool after turning off the system before opening the optics assembly. Be careful when removing the filter access panel, as there is a possibility that the bulb may have broken.
1. Remove the filter access panel from the rear of the instrument by unscrewing the two screws (one at the top and one at the bottom of the filter access panel).
Figure 178: Filter Panel at the Rear of the Instrument.
2. The filters are mounted on the filter wheel as shown in Figure 179.
Figure 179: Removing or Inserting a Filter in the Filter Wheel
3. Locate the filter that is to be removed and/or replaced.
4. Firmly grasp the exterior filter housing with a pair of needle nose pliers and pull the filter out of the spring-loaded slot.
5. If the filter is being replaced with a new filter, grasp the exterior filter housing of the new filter with a pair of needle nose pliers and push the filter into the spring-loaded slot.
Filter
Filter access panel

Chapter 10: Maintenance
Part No. 91000200 202 © 2019 DYNEX Technologies Inc.
Important: The bottom groove of the filter must be firmly seated in the filter wheel. If the groove is aligned with the springs on the filter wheel, the filter has been installed incorrectly and will cause invalid instrument performance.
The 405 nm absorbance filter must be installed in Position 1 on the filter wheel. Otherwise, the instrument will fail self-testing on start-up.
6. Replace the filter access panel.
7. If a filter has been replaced with another filter of the same wavelength, no further action is required.
8. If a filter of a different wavelength has been installed, if a filter has been removed or if the order of filters has been changed you must update the wavelengths assigned to the positions.
9. Enter the new filter positions in the Define Absorbance Filter dialog box (Figure 55).
10.3 Store the Instrument Perform the following if the instrument will not be used for a period of time:
1. Flush the system with de-ionized water so that buffers and/or reagents are not deposited on the wash head or other components of the system.
2. Remove the dispense tubing from the pinch valves to prevent permanent compression of the tubing.
3. Use the wires supplied with the system to remove particulate matter from the dispense or aspiration wash head tubes if they become clogged.
10.4 Return Items to the Factory If the DS2 instrument or one of its components is returned to DYNEX, the instrument or component must be decontaminated (Chapter 15) before it is shipped. A decontamination certificate must be submitted with the unit.
A completed Equipment in Transit form must also be included in any shipment of returned items to DYNEX. Obtain a Return Authorization Number (RA#) from DYNEX before shipping the instrument or component and include the RA# on the form. For international shipments, contact your DYNEX representative.
Important: Complete this form for each product/instrument that is being returned and attach it to the product prior to it being shipped. If your
instrument contains a hard drive please retain back-up copies of all or any stored files and remove any personal information to comply with HIPPA regulations. The Return Authorization (RA) for your product/instrument is listed below.
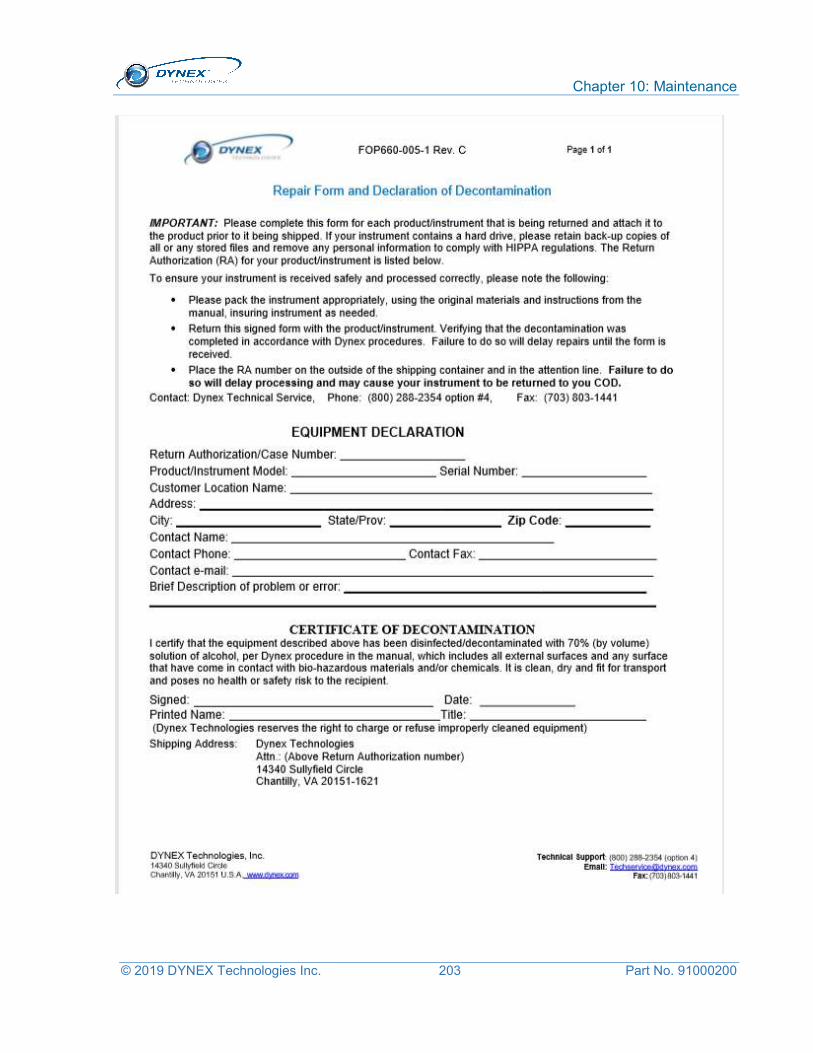
Chapter 10: Maintenance
© 2019 DYNEX Technologies Inc. 203 Part No. 91000200

Chapter 10: Maintenance
© 2019 DYNEX Technologies Inc. 204 Part No. 91000200
This page intentionally left blank.

Chapter 11: Warranty
© 2019 DYNEX Technologies Inc. 205 Part No. 91000200
Chapter 11: Warranty 11.1 Warranty and Special Provisions DYNEX TECHNOLOGIES products are fully guaranteed for one year against defects in parts, materials, and workmanship. Defective parts and materials will be replaced or, at the discretion of DYNEX TECHNOLOGIES, repaired at no charge for a period of one year and labor required for such replacement or repair will be provided at no charge for a period of one year, provided that the products are utilized and maintained in accordance with the instructions in the applicable operating and servicing manual, and provided further that the products have not, as determined solely by DYNEX TECHNOLOGIES, been subject to misuse or abuse by the Customer or other parties unrelated to DYNEX TECHNOLOGIES. DYNEX TECHNOLOGIES makes no warranty, expressed or implied, as to the fitness of any product for any particular purposes other than those purposes described in the applicable operating and servicing manual, nor does DYNEX TECHNOLOGIES make any other warranty, whether expressed or implied, including merchantability, other than those appearing on the face hereof. Where DYNEX TECHNOLOGIES guarantees any product, whether under this Warranty or as a matter of law, and there is a breach of such guarantee, the Customer's only and exclusive remedy shall be the replacement or repair of defective parts and materials, as described above. This shall be the limit of DYNEX TECHNOLOGIES liability. Furthermore, DYNEX TECHNOLOGIES shall not be liable for incidental or consequential damages. Failure of the Customer to notify DYNEX TECHNOLOGIES of a claimed defect by registered mail within thirty days of the discovery thereof shall constitute a waiver of any claim for breach of warranty.
When a product is required by DYNEX TECHNOLOGIES to be installed by a DYNEX TECHNOLOGIES engineer or technician, the period of this Warranty shall begin on the date of such installation, provided that any use of the product prior to such installation shall, at the sole election of DYNEX TECHNOLOGIES, void this Warranty. When installation by DYNEX TECHNOLOGIES personnel is not required, the period of this Warranty shall begin on the date of shipment from DYNEX TECHNOLOGIES. The period of this Warranty shall begin as described above whether or not the product has been installed or shipped pursuant to a purchase order, and any trail period shall be deducted from the Warranty period that would otherwise apply under a subsequent placed purchase order for that product.
Limitation of Liability. Notwithstanding anything to the contrary contained herein, the liability of SELLER (whether by reason of breach of warranty, breach of contract, tort, or otherwise), including without limitation under any indemnification provision contained herein, shall be limited to replacement of goods returned to DYNEX TECHNOLOGIES which are shown to DYNEX TECHNOLOGIES ’s reasonable satisfaction to have been nonconforming or to refund the purchase price, or, if not paid, to a credit amount of the purchase price therefore.
THE FOREGOING WARRANTIES ARE EXCLUSIVE AND ARE GIVEN AND ACCEPTED IN LIEU OF ANY AND ALL OTHER WARRANTIES, EXPRESS OR IMPLIED, INCLUDING WITHOUT LIMITATION, THE IMPLIED WARRANTY OF MECHANTABILITY AND THE IMPLIED WARRANTY OF FITNESS FOR A PARTICULAR PURPOSE. NEITHER PARTY SHALL BE LIABLE TO THE OTHER FOR ANY INCIDENTAL, INDIRECT, SPECIAL, OR CONSEQUENTIAL DAMAGES.

Chapter 11: Warranty
Part No. 91000200 206 © 2019 DYNEX Technologies Inc.
This page intentionally left blank.

Chapter 12: Troubleshooting
© 2019 DYNEX Technologies Inc. 207 Part No. 91000200
Chapter 12: Troubleshooting This chapter lists errors that may occur during operation of the DS2 instrument and provides recommended actions for resolving the problems.
12.1 Assay and Database Errors Symptom Possible Causes Resolution
The assay has the same error message at the same point in the assay every time it is run.
The assay file or the database is corrupted.
Restore an old database (Chapter 5.7.7.2).
Rewrite the assay (Chapter 6.3).
12.2 Cleaning and Decontamination Symptom Possible Causes Resolution
The assay has the same error message at the same point in the assay every time it is run.
DS2 required earlier repairs.
Refer to Chapter 10.1. DS2 is worn or corroded which is preventing it from working.
12.3 Disposable Tip Loading Symptom Possible Causes Resolution
User unable to process samples.
Not enough tips loaded in the instrument.
Tip usage tracking, prompts at beginning of run to load sufficient tips.
Instrument runs out of tips.
Tip detect triggers an error if no tip detected, prompts user to load more tips.
Refer to Chapter 14.
12.4 Environmental Symptom Possible Causes Resolution
The instrument is damaged while being stored.
A combination of heat, humidity and pressure during storage affects the instrument hardware.
Environmental testing for storage conditions.
Storage conditions specifications in user manual.

Chapter 12: Troubleshooting
Part No. 91000200 208 © 2019 DYNEX Technologies Inc.
Symptom Possible Causes Resolution
The instrument does not perform as expected.
The temperature, humidity or pressure affects the performance of the instrument.
1. Environmental testing for normal use.
2. Refer to Chapter 2.4.12.
12.5 Human Factors Symptom Possible Causes Resolution
User is injured by the moving arm.
The instrument is carrying out automated tasks and also asking the user to load or unload the instrument.
Instrument to meet the safety standards EN 61010-1, EN 61010-2-101, C22.2#61010-1. Collision detection on arm drives, stop on collision, generate and display error, prevent the system from running until error is resolved. No automatic arm operations to be carried out when user is requested to load or unload the system. Training to ensure the user knows when the arm will or will not be moving.
Bad results reported.
There is no indication to the user which way to load the plate and it was loaded wrong way.
Create software load wizard.
Tips get stuck in the tip waste container when ejecting. The instrument is unable to carry on processing worklist.
The tip waste container was loaded incorrectly into the instrument. This causes the tips not to fall into the rest position. Consequently, causing a stack-up of the tips and stopping the pipette from functioning correctly.
Provide user instructions on proper placement of the tip waste container.
User is injured. The cover support mechanism failed.
Inspection and testing of support gas spring as part of maintenance schedule. Train user to report if cover support is degrading.

Chapter 12: Troubleshooting
© 2019 DYNEX Technologies Inc. 209 Part No. 91000200
Symptom Possible Causes Resolution
Bad results. DS-Matrix does not know where the samples are loaded.
Rack detection switches on each lane. Logic to check correct switch is triggered during loading. If incorrect produce and display error, prevent the system from running until error is resolved. UI to display which lane to load rack into.
Sample ID barcode scanner.
Bad results.
User does not realize the rack should not be removed once loaded and is in use or to be used.
Rack detection switches on each lane, mechanism to keep racks in place and switches depressed. Monitoring of rack switches, if switch opens after rack is loaded and the rack is being used or due to be used produce and display error, prevent the system running until error is resolved
Train user not to remove racks after loading.
Fluid spills out exposing the user to bio-hazard.
User is unaware the waste bottle cap is below the level of the fluid.
Warning label on the front of the waste bottle to stand bottle up before removing cap. Train user on how to remove the waste bottle cap.
User is exposed to bio-hazardous material.
User is unaware that the tip waste container contains bio-hazardous material.
Biohazard label on the front of the tip waste container. Train user on the handling of the tip waste container..
Wrong results produced. User mixes up which bottle plugs into which interconnect.
Bottle connections above bottle mitigation.
Bottle and connections are labeled.
User exposed to bio-hazard. User is not able to grip plate securely while wearing laboratory gloves.
Plate carriers to allow user to grip the plate securely while using laboratory gloves.
Train user how to remove plates from the plate carriers.
User cannot access the power switch.
The instrument continues on and gets damaged.
Power switch in a prominent position at the front of the instrument. Train user how to power the unit on and off.
Refer to Chapter 7.2.

Chapter 12: Troubleshooting
Part No. 91000200 210 © 2019 DYNEX Technologies Inc.
Symptom Possible Causes Resolution
All in process work and results are lost.
User inadvertently turns the instrument power off.
Recess the power button.
User cannot tell if the unit is powered up or not.
Power on light associated with power to show state of power to the unit.
Bad results. Wash head dispense and/or aspirate pins had become blocked.
Provide wash head cleaning wires in order to clean a head with blocked tubes.
Train user how to clean wash heads if they become blocked. Provide start of day assay to check wash head.
12.6 Inputs and Outputs Symptom Possible Causes Resolution
The method for inputting and outputting information is difficult to use.
The user inputs incorrect information, makes mistakes, takes longer than desired.
Provide touchscreen interface for inputting and outputting information.
12.7 Installing the Instrument Symptom Possible Causes Resolution
Instrument does not function correctly.
Instrument installer unaware of how to place the instrument on the bench.
Installation test routine carried out by installer to verify correct functionality of instrument. Adjustable feet to allow instrument stabilization.
12.8 Plate Washing Errors Symptom Possible Causes Resolution
System is not dispensing any fluid during purge and wash.
The dispense tubing is not in place correctly.
Remove the tip waste bucket. The dispense tubing is the thin
tubing furthest to the left.
Confirm the tubing is fully inside the pinch valve.
System tubing is sealed in the pinch valve.
Remove the tubing from all pinch valves.
Roll the tubing to confirm the inner surfaces are moving freely.
Insert it back into the pinch valve.
Wash buffer bottle quick release valves are not snapped in place.
Remove the quick release fitting from the quick release valve.

Chapter 12: Troubleshooting
© 2019 DYNEX Technologies Inc. 211 Part No. 91000200
Symptom Possible Causes Resolution
Reinsert the fitting into the valve, ensure a clicking noise is heard to indicate the fitting is securely connected.
Pump is not primed. Run a start of day dispense routine to draw fluid into the tubing.
There is a clog in the wash head manifold.
Using 4 mm (PN 42000830) and 2 mm (PN 42000810) hex wrenches, remove the 4 set screws from the sides of the wash head manifold.
Soak the wash head standing upright in 70% alcohol with liquid filled up to the spring gap in the wash head.
Rinse the wash head and run test washes to ensure the problem is resolved.
Pump is not functioning properly. Contact DYNEX TechService@DYNEX. com 800-288-2354
System is not dispensing wash fluid or not dispensing sufficient wash fluid to row “x”.
The dispense pin corresponding to row “x” is clogged.
Clean the dispense pin (shorter and narrower diameter) in row “x” using the 0.018 mm cleaning wire. Cleaning Wire PN 352101800
There is a clog in the wash head manifold.
Using 4 mm (PN 42000830) and 2 mm (PN 42000810) hex wrenches, remove the four set screws from the sides of the wash head manifold.
Soak the wash head standing upright in 70% alcohol with liquid filled up to the spring gap in the wash head.
Rinse the wash head and run test washes to ensure the problem is resolved.
Refer to Chapter 10.1.4 Decontaminate the Wash Head.
Wash buffer is not dispensed to the first few
The wash head has not been purged or has not been purged sufficiently.
Ensure all wash steps have a purge programmed.

Chapter 12: Troubleshooting
Part No. 91000200 212 © 2019 DYNEX Technologies Inc.
Symptom Possible Causes Resolution
columns during the first wash of the plate.
Ensure the purge volume is at least 3000ul.
Fluid remains in the plate after washing and aspiration.
The wash head aspiration pin(s) are clogged.
Clean the aspiration pins using the 0.040 mm cleaning wire (PN 352104000).
The plate definition is incorrect.
Open the plate definition for the plate in use. Use the “show” buttons to test that all the plate parameters are programmed correctly, paying particular attention to the aspirate height, the sweep height and the sweep stroke.
The sweep mode selected may be insufficient.
If no sweep mode is selected in the wash step, try sweep or super sweep mode for improved aspiration.
The system is out of calibration. Refer to Chapter 15.2.8.
Fluid is left in the plate after aspiration in row “x”.
The aspirate pin corresponding to row “x” is clogged.
Clean the aspiration pins (Figure 10) using the 0.040 mm cleaning wire (PN 352104000).
Wash fluid is overflowing from the plate.
The aspirate pins are clogged.
The wash head manifold is clogged.
Using 4 mm (PN 42000830) and 2 mm (PN 42000810) hex wrenches, remove the 4 set screws from the sides of the wash head manifold.
Soak the wash head standing upright in 70% alcohol with liquid filled up to the spring gap in the wash head.
Rinse the wash head and run test washes to ensure the problem is resolved.
Refer to Chapter 10.2.6.
The plate definition is incorrect. Review the plate definition and ensure all the wash settings are correct (especially aspirate height).

Chapter 12: Troubleshooting
© 2019 DYNEX Technologies Inc. 213 Part No. 91000200
12.9 Pipetting and Liquid Level Detection Errors Symptom Possible Causes Resolution
System is blowing bubbles in the sample tip prior to aspirating the sample and may or may not receive a clot detection error.
The tube in the system configuration does not match the sample tube in use.
Confirm tubes in use match tube selected in system configuration.
The sample tube positions are not in calibration.
Refer to Chapter 14:.
System is not pipetting controls correctly.
There are bubbles in the control tube.
Double check control tubes as large bubbles may form across the tube diameter and interfere with the liquid level sensing mechanism.
System control tube locations are out of calibration.
Refer to Chapter 14:.
System is not pipetting reagents correctly.
An incorrect tube is being used.
Confirm tubes and bottles in use match tube selected in system configuration.
Too many bubbles in the reagent.
Large bubbles will be detected during liquid level sensing.
Ensure fluids have no bubbles when loading.
System reagent tube locations are out of calibration.
Refer to Chapter 14:.
No fluid pipetted to the plate, leading to incorrect results.
Tip did not get picked up because the user did not load the rack of tips.
Tip detect sensor on pipette.
Check for tip presence directly after tip pickup
If no tip is detected, produce and display error
Prevent the system from running until the error has been resolved.

Chapter 12: Troubleshooting
Part No. 91000200 214 © 2019 DYNEX Technologies Inc.
12.10 Plate Carrier Errors Symptom Possible Causes Resolution
The plate carrier has become stuck inside the DS2 reader/incubator.
The plate was not inserted into the plate carrier properly.
Remove the plate from the instrument and confirm the plate is in the carrier correctly. If you cannot remove the plate from the instrument, contact DYNEX: TechService@DYNEX. com 800-288-2354
The plate strips were not pressed all the way down in the plate frame.
Remove the plate from the instrument and plate carrier, confirm all strips are pressed completely into the frame. If you cannot remove the plate from the instrument, contact DYNEX: TechService@DYNEX. com 800-288-2354
12.11 Processing the Kit Symptom Possible Causes Resolution
No fluid pipetted to the plate and productivity lost.
User forgets to remove the bottle caps; pipette tip cannot get into the bottle.
Encoder feedback on pipette Z to detect an obstruction such as a bottle cap.
Produce and display an error if pipette Z hits an obstruction, prevent the assay from running until the error has been resolved.
User has forgotten to load the bottle.
Limits on level detect range by bottle type, give up if fluid not found in range, produce and display error, prevent the system from running until error has been resolved.
12.12 Reader Errors Symptom Possible Causes Resolution
Prior to reading the plate, an error appears stating that the system failed the sanity check.
The filter wheel or lamp is dusty.
Remove the cover from the filter wheel compartment, blow compressed air into the reader optics area. Refer to Replacing Wavelength Filters in Chapter 10.
The 405nm filter is dirty.
Remove the cover from the filter wheel compartment. Remove the 405 filter and clean it with lens paper.

Chapter 12: Troubleshooting
© 2019 DYNEX Technologies Inc. 215 Part No. 91000200
Symptom Possible Causes Resolution
Reinsert the filter into the filter wheel.
The 405nm filter is degraded.
Request a replacement 405nm filter (filter PN 41500405).
The lamp is misaligned or the reader is not functioning properly.
Contact DYNEX: TechService@DYNEX. com 800-288-2354
Prior to reading the plate, a Channel Variation Error is received.
Reader optics are dusty. Open the reader door and blow compressed air into the reader area.
Fluid has spilled on the reader optics or the reader optics are dirty.
Contact DYNEX: TechService@DYNEX. com 800-288-2354
The system fails self-test at the reader module. Refer to Chapter 10.2.7 Replacing Wavelength Filters.
The filter wheel or lamp is dusty.
Remove the cover from the filter wheel and blow compressed air into the reader optics area.
The 405nm filter is dirty.
Remove the cover from the filter wheel compartment. Remove the 405 filter and clean it with lens paper. Reinsert the filter into the filter wheel.
The 405nm filter is degraded.
Request a replacement 405nm filter(filter PN 41500405).
The lamp is burned out.
Look at the back of the instrument during the self-test. You should be able to see light coming from the filter wheel area. If you do not see any light, the lamp is likely burnt out. Contact DYNEX: TechService@DYNEX. com 800-288-2354
The lamp is misaligned or the reader is not functioning.
Contact DYNEX: TechService@DYNEX. com 800-288-2354
User unable to report results. User has not loaded the plate correctly into the plate loader.
Train user on correct loading up plates, checking strip fitment.

Chapter 12: Troubleshooting
Part No. 91000200 216 © 2019 DYNEX Technologies Inc.
12.13 Running an Assay Symptom Possible Causes Resolution
Lost productivity. Power is cut from the instrument.
Use a UPS.
12.14 Sample IDs Symptom Possible Causes Resolution
Sample IDs get mixed up. No sample ID on sample tube
1. Sample ID barcodes on sample tubes. 2. Scan sample tubes when loading on to instrument. 3. Software to flag locations where no barcode is detected.
Sample ID barcodes unable to be read.
Barcode label badly printed, printing too dense, printing too small.
Barcode scanner specifications to meet requirements of CLSI-LIS7-A Vol.23 No. 13 Formerly ASTM E1466-92(1999).
12.15 Sample Pipetting Symptom Possible Causes Resolution
Bad sample results. Sample too viscous with high degree of particulate matter.
Refer to Chapter 5.7.1.
Provide ESP functionality.
12.16 Sample Tips Error Symptom Possible Causes Resolution
Tips are being picked up, but the system is not detecting that a tip was picked up.
Tip sensor is dirty. Clean the tip sensor area (where the red laser is) thoroughly with an alcohol wipe.
Not using DYNEX tips.
Ensure that DYNEX brand tips are being used:
Sample tips PN 65910
Reagent tips PN 65920.
System is dropping tips in transit.
Tip pick-up collar on pipette spigot is dirty.
Clean the tip pick-up collar thoroughly with an alcohol wipe.
The pick-up location is out of alignment.
Re-boot the system to re-establish home position.
Refer to Chapter 15.2.6.

Chapter 12: Troubleshooting
© 2019 DYNEX Technologies Inc. 217 Part No. 91000200
Symptom Possible Causes Resolution
System is not picking up tips.
Tip pick-up collar on pipette spigot is dirty.
Clean the tip pick-up collar thoroughly with an alcohol wipe.
The pick-up location is out of alignment.
Reboot the system to re-establish home position.
Tip pick-up location is out of calibration.
Refer to Chapter 15.2.7.
12.17 Software Symptom Possible Causes Resolution
User takes no action on lost productivity.
The user was unaware that an error was being displayed.
Provide the hardware for audio feedback to the user.
Provide audio feedback to the user when there is user interaction required.
12.18 Transport Symptom Possible Causes Resolution
Damage delays the installation of the instrument in a new location.
The original packaging was unable to protect the instrument when being reused.
Packaging design and construction such that it can be reused once.
Refer to Appendix B.
12.19 Unpacking the Instrument Symptom Possible Causes Resolution
Instrument damaged during unpacking or parts are missing.
Instrument is not unpacked properly.
Uncrating instructions on the outside of crate. Unpacking instructions directly inside of packaging accessible to the user prior to unpacking instrument. Lifting procedure and markings in accordance with EN 61010-1 3rd edition.
Instrument installer unaware of unpacking procedure.
12.20 Usability Symptom Possible Causes Resolution
Bad results. The user is not using the system in a laboratory environment.
Documentation to state that the system must only be used in a laboratory environment. Refer to Chapter 2.4.12.

Chapter 12: Troubleshooting
Part No. 91000200 218 © 2019 DYNEX Technologies Inc.
12.21 User Accesses Windows Home Screen Symptom Possible Causes Resolution
The user is not aware that changing the software can affect the performance.
User modifies the software and affects the instrument performance producing incorrect results.
Refer to Chapter 3.5. User modifies the software and causes damage to the instrument preventing it from being used.
12.22 User Interface Symptom Possible Causes Resolution
Bad results. The user does not remember how to run the instrument.
Intuitive UI with minimal options to guide the user through the process steps and make it memorable.
12.23 Vacuum Sensor Errors Symptom Possible Causes Resolution
The system gives a vacuum sensor error during self-test or prior to washing a plate.
Waste bottle cap is not on tight enough.
Make sure the cap is tight, without over tightening.
Bottle cap is degraded.
Place a layer of Parafilm® over the bottle opening and replace the cap. If this resolves the issue you should replace the cap. Waste Bottle cap 4600040
Waste bottle or cap is cracked or broken.
Inspect the waste bottle cap for cracks. Replace the cap and/or bottle if you notice damage. Waste Bottle cap 4600040 Waste Bottle 13500430
Faulty vacuum pump or holes/cracks in the system tubing.
Contact DYNEX: TechService@DYNEX. com 800-288-2354
12.24 Wash Head Assembly Errors Symptom Possible Causes Resolution
The wash head is not being picked up and/or released successfully.
The wash head pick-up location is out of alignment.
Re-boot the system to reestablish home position.
The wash head pick-up location is out of calibration.
Refer to Chapter 15.2.7.

Chapter 12: Troubleshooting
© 2019 DYNEX Technologies Inc. 219 Part No. 91000200
Symptom Possible Causes Resolution
The support posts on the wash head park are not aligned properly.
Contact DYNEX: TechService@DYNEX. com 800-288-2354
The wash head is being picked up, but the system does not detect that the wash head was picked up.
Wash head magnet and/or sensor is dirty.
Clean the wash head sensor area (black dot in the metal ring on the pipette) and the magnet on the right side of the wash head with an alcohol wipe.
Wash head sensor is out of calibration.
Refer to Chapter 15.2.7.
12.25 Washing Possible Causes Symptom Resolution
Unwashed wells give incorrect results.
Insufficient amount of wash buffer for the test.
Level switch in wash buffer bottles.
Produce and display error if wash bottle level switch triggers, prevent instrument running until error has been resolved.
User exposed to a significant amount of bio-hazardous fluid.
Waste bottle overflows due to being too full.
Level switch in waste bottle detects when fluid has reached the full level. Produce and display error if waste bottle level switch triggers, prevent instrument running until error has been resolved..
Test wells in lower plate contaminated leading to wrong results.
User removes upper plate during wash cycle, washer dispenses fluid over lower plate.
Software to move and ensure lower plate is not under the upper plate when washing.
Wash fluid is spilled into the area under the plate, fluid affects the module reliability.
User removes the plate during the wash cycle and wash fluid is dispensed into the module.
Fluid spill catchment in the washing area to channel the fluid into the tip waste container and prevent sensitive areas getting wet.
12.26 Files Used for Troubleshooting The DS-Matrix software uses many different file types. When troubleshooting an issue, depending on the issue, DYNEX may ask for different file types. When emailing files, it is best to zip them. Some file types can be considered SPAM or potential viruses by some e-mail systems and they will not be delivered in a timely fashion
12.26.1 Self-Test Report Files Self-test report files are useful because they contain information about the instrument serial number, the software version in use on the system and the firmware version currently loaded on the system. If the system is failing self-test, the error messages will appear on the self-test report. Self-test reports are automatically saved as a PDF file and are located at C:\Program Files\DYNEX Technologies\Self-Test Reports.

Chapter 12: Troubleshooting
Part No. 91000200 220 © 2019 DYNEX Technologies Inc.
12.26.2 DS-Matrix Assay Files DS-Matrix Assay files are stored in an .xml file format. These files can only be opened with DS-Matrix software and contain the assay program as well as all the consumables in the assay program (custom plate types, fluids, etc.). To access an .xml file in order to it send via e-mail, simply export the assay from the DS-Matrix software using Tools Import/Export.
12.26.3 DS-Matrix Report Files DS-Matrix Report files are stored in an .xdb file format. These files can only be opened with DS-Matrix software and they contain the plate report, as well as any assay files used to generate the plate report. If multiple assays are run on the plate, then all assay files will be stored in the .xdb file. We will request this file if there is a question regarding data output. Since both the assay file and plate report file are imported with the .xdb file, the assay as well as the data output can be seen. To access an .xdb file to i send via e-mail, export the assay from the DS-Matrix software.
1. Click Tools Import/Export.
Figure 180: Import Export Dialog Screen
12.26.4 DS-Matrix Database Files The DS-Matrix.mdb and DS-Matrix_log.ldf. These files contain all the information and settings for the DS-Matrix software installed on the PC the files are copied from (including assays and report files, but not including event logs and debug logs). By copying these files and replacing the database files on another PC, the DYNEX Technical Support team is able to view the software as the customer is viewing the software, with all the same settings. Sometimes, just getting the assay file is not enough to duplicate a problem seen with a particular assay.

Chapter 12: Troubleshooting
© 2019 DYNEX Technologies Inc. 221 Part No. 91000200
Sometimes some setting in the database may be causing the problem and only running the assay in the database from the customer’s PC can identify the source of the problem.
To access these files, stop the Structured Query Language (SQL) server and locate the files.
1. It is necessary to turn off the SQL Server before the files are copied.
2. From the DS-Matrix application main screen locate the green arrow in the lower right corner along the task bar.
3. Double-click the icon to open the SQL Server Service Manager window.
Figure 181: SQL Server Service Manager
4. Click . A warning window is displayed, asking if you are sure you want to stop SQL Server.
5. Click Yes. Several seconds later will change to , indicating that SQL has stopped.
6. Click on each file specified above and copy/paste to the desktop or any directory.
7. The files are typically located in the following folders:
C:\ProgramFiles\CommonFiles\DYNEXTechnologies\Databases\ MSSQL$DYNEXLOCAL\Data\DS-Matrix.mdf.
C:\ProgramFiles\CommonFiles\DYNEXTechnologies\Databases\ MSSQL$DYNEXLOCAL\Data\DS-Matrix_log.ldf.
8. When finished, click on Start/Continue in the SQL Server Service Manager to reconnect the SQL server to the database files. It will take several seconds to reconnect.
9. The PC may be restarted. When Windows starts up, SQL is set to start automatically.

Chapter 12: Troubleshooting
Part No. 91000200 222 © 2019 DYNEX Technologies Inc.
12.26.5 Event Logs Event logs contain a detailed log of all actions being performed by the DS2 in a text description. Every time the software is opened, a new event log file is generated.
The event log provides text information that is useful to know the exact error message text, the sequence of events before an error occurred, to see what time errors occurred so that they can be located easily in the debug log and to recreate run-time scenarios when attempting to duplicate problems.
The Event Logs can be accessed two ways:
1. Open the DS-Matrix Software.
2. Go to the tools menu.
Figure 182: Tools Menu
3. Click View Event Log.

Chapter 12: Troubleshooting
© 2019 DYNEX Technologies Inc. 223 Part No. 91000200
Figure 183: View Event Log
4. The current event log will display.
a. To see previous event logs, click .
Figure 184: Event Logs Screen
b. Click desired date by clicking the date on the calendar.
c. Click desired event log and click .
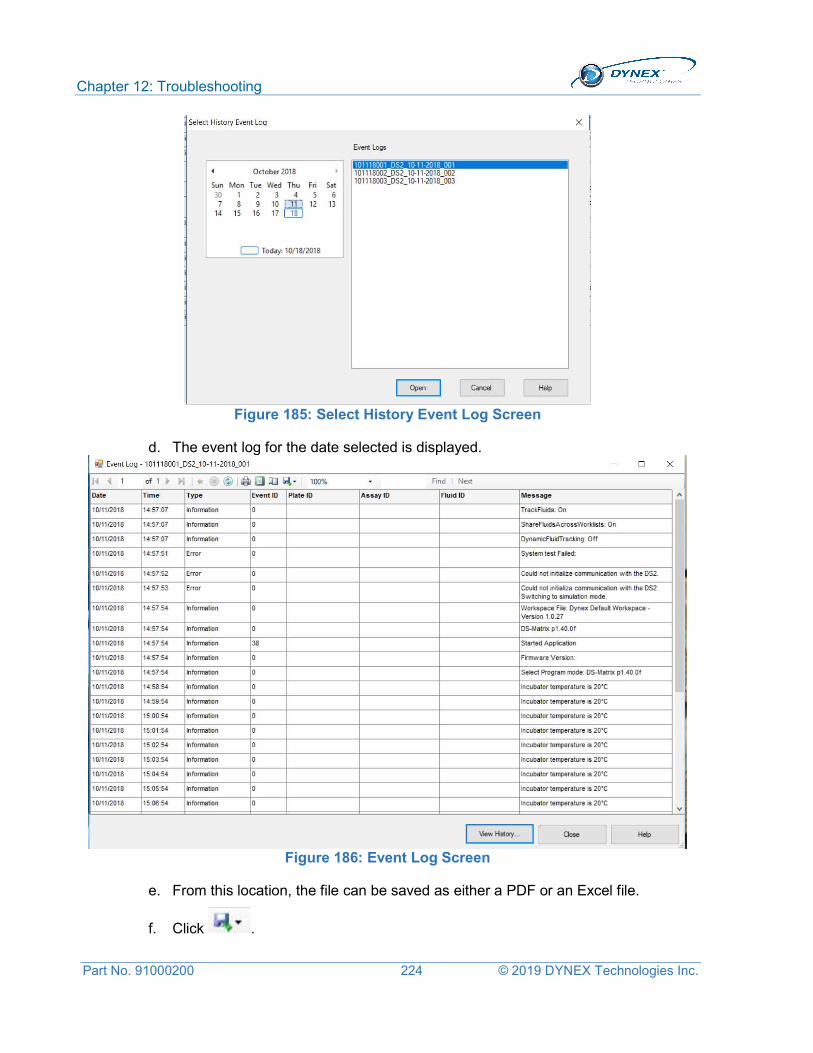
Chapter 12: Troubleshooting
Part No. 91000200 224 © 2019 DYNEX Technologies Inc.
Figure 185: Select History Event Log Screen
d. The event log for the date selected is displayed.
Figure 186: Event Log Screen
e. From this location, the file can be saved as either a PDF or an Excel file.
f. Click .

Chapter 12: Troubleshooting
© 2019 DYNEX Technologies Inc. 225 Part No. 91000200
g. A drop-down list is displayed. Click application (Excel, PDF or Word) to save the file.
Figure 187: Drop-Down List
Note: Excel is the best option as the PDF makes awkward page breaks that makes the information difficult to interpret quickly.
5. The Save As screen is displayed.
Figure 188: Save As Screen
6. Go to C:\Program Files\DYNEX Technologies\DS-Matrix\XML logs. All of the event logs are stored in this folder. The files are named after the date on which they are created and appended with a number indicating the software session.
Note: The event log from the first time the software is opened on September 26, 2018 would be “092618001_DS2_09-26-2018_001”. The second time it is opened the file would be “092618001_DS2_09-26-2018_002”.
12.26.6 Debug Log Files The debug log provides supplemental information to the event log. While the event log contains a text description of the actions performed by the instrument, the debug log contains the commands being sent to cause each of the actions recorded in the event log to happen. If there is a suspected hardware problem, the debug log can provide information as to what commands are being sent to the DS2 during the run to generate the error message. The debug log provides

Chapter 12: Troubleshooting
Part No. 91000200 226 © 2019 DYNEX Technologies Inc.
more detailed information, the behind the scenes dialog between the DS-Matrix Software and the DS2.
Every time a software session is started, a new debug log file is generated. Unlike the Event logs, only the current working debug log and one backup copy of the previous debug log are stored, therefore the debug log must be copied soon after the error occurs. If the software is closed, but not reopened, the information will be in the current debug log. If the software is closed and reopened once, the information will be in the backup debug log file. If the software is closed and opened twice following an error, the desired information will no longer be contained in either debug log file.
The debug log does not continuously update. The debug log is written to every few minutes. Therefore, when an error occurs, it is best not to close the software right away, but to give the system a few minutes to write out to the debug log, so the Commands surrounding the error message can be captured. Prior to closing the software and saving the debug log, the customer can check the time stamp on the last event entered in the debug log to ensure the appropriate information is captured. In the event of a software crash, the debug log will not contain the desired information.
To access the debug log:
1. Go to C:\Program Files\DYNEX Technologies\DS-Matrix\XML logs.
2. Click Tools System Configuration Operations.
3. Click the debug log checkbox.
Figure 189: Debug Log Checkbox
Note: It is recommended that the default debug log name be changed to include the instrument serial number.

Chapter 13: Create Database Records
© 2019 DYNEX Technologies Inc. 227 Part No. 91000200
Chapter 13: Create Database Records
13.1 Create a Database Record for a New Fluid 1. Click Database Maintenance… on the tools menu to display the Database
Maintenance dialog box.
2. Click on . A dialog box is displayed for naming the item.
Important: The fluid name assigned to cleaning fluid must be identical for all assays. Otherwise, an error message is displayed when the system attempts to use cleaning fluid with a different name and the plate must be aborted. Refer to DYNEX Technical Bulletin 142 for details.
Note: Consumable names for the same assay should have a similar beginning so that they are easier to locate when writing assays.
3. Enter a name for the new fluid and Click . A dialog box is displayed for defining the new fluid.
4. Figure 190: Neat Fluid Maintenance Screen
5. In the Fluid Settings panel, use the drop-down arrows to specify the type of fluid and bottle.
6. In the Pipette Profiles panel, use the drop-down arrows to specify the pipetting profiles (Chapter 5.7.1) that will be used for aspiration and dispensing of the fluid.
7. In the Load Settings panel, use the drop-down arrows to specify the reagent rack or control tube compartment in which the fluid will be loaded.
Note: Place a checkmark next to Let me specify where to load this fluid if the loading location will be at a fixed position.
8. Click to save the record.

Chapter 13: Create Database Records
Part No. 91000200 228 © 2019 DYNEX Technologies Inc.
13.2 Create a Database Record for a New Tube
13.2.1 Create the Database Record
1. Click Tools Database Maintenance… to display the Database Maintenance dialog box.
2. Click to display a dialog box for naming the tube.
Figure 191: Enter Name Dialog Box
3. Enter a name for the new tube and click .
4. The Bottle dialog box is displayed for defining the new tube.
Figure 192: Bottle Dialog Box

Chapter 13: Create Database Records
© 2019 DYNEX Technologies Inc. 229 Part No. 91000200
5. In the Description field, enter a short description for the new bottle.
6. In the Type field, use the drop-down arrow to specify the type of bottle.
Figure 193: Type Drop-Down List
7. In the Properties panel, enter the dimensions for the tube. Use a micrometer (preferred) or ruler to measure the tube dimensions.
Figure 194: Tube Dimensions
8. In the Properties panel, enter the maximum usable volume of the tube.
Note: The higher the maximum useable volume, the greater the dead volume is dependent upon the bottom shape of the tube.
9. In the Properties panel, use the drop-down arrows to designate the shape of the tube bottom.
10. Click to save the record.
Important: Fluid Level Tracking (Chapter 13.1) must be run with the new tube before it will be included in the drop-down list of consumables that are available for an assay.
11. Click to close the Database Maintenance dialog box.
Tip submersion
Internal diameter
Outside bottom thickness
Height Inside bottom height
External diameter

Chapter 13: Create Database Records
Part No. 91000200 230 © 2019 DYNEX Technologies Inc.
13.3 Create a Database Record for a New Plate 1. Click Tools Database Maintenance… to display the Database Maintenance dialog
box.
2. Click Plate Type from the Database Type drop-down menu.
Figure 195: Database Type Drop-Down Menu
3. Click to display a dialog box for naming the plate.

Chapter 13: Create Database Records
© 2019 DYNEX Technologies Inc. 231 Part No. 91000200
Figure 196: Database Maintenance Screen
4. A dialog box is displayed for defining the new plate.
Figure 197: Enter Name Plate Dialog Box
5. Enter a name for the new plate.
6. Click .
7. In the Plate Properties panel, select Microtiter from the Type drop-down menu.

Chapter 13: Create Database Records
Part No. 91000200 232 © 2019 DYNEX Technologies Inc.
Figure 198: Create a New Database Record for a New Plate
8. Enter the number of rows and number of columns.
Figure 199: Standard Grid – 12 Columns by 8 Rows
9. In the Well Properties panel, enter:
Height Internal diameter Bottom diameter Maximum Usable Volume
Note: The maximum usable volume is the volume of fluid that can safely be dispensed to the well without causing the well to overflow.
Outside bottom thickness Bottom shape
o Flat

Chapter 13: Create Database Records
© 2019 DYNEX Technologies Inc. 233 Part No. 91000200
o V o U
Inside bottom height of the tube.
Note: Use a micrometer (preferred) or ruler to measure the tube dimensions.
Figure 200: Well Properties
10. In the Washer Properties panel, enter:
Dispense height Aspiration height Bottom wash height
Top well height Sweep height Sweep stroke.
11. Insert a plate into the lower plate carrier.
12. Click for each height to place the aspiration pins at the currently entered height.
Table 43: Washer Properties Height Position of the Aspiration Pins (long pins)
Dispense Approximately one millimeter above the top of the well.
Aspirate Just above the bottom of the well (not touching).
Bottom Wash At the center of the well.
Top Well Exactly at the top of the well.
Sweep One or two millimeters above the aspirate height. If well bottoms are scratched when washing, increase height.
13. In the Washer Properties panel, enter the sweep stroke (the distance the aspirate pins move from the center of the well when operating in sweep mode or super sweep mode. Optimize the aspiration without scraping the sides of the wells.
14. Click to save the record.
Tip Submersion
Internal Diameter
Outside Bottom Thickness
Height
External Diameter
Inside Bottom Thickness

Chapter 13: Create Database Records
Part No. 91000200 234 © 2019 DYNEX Technologies Inc.
13.4 Perform an ESP Calibration ESP is a sophisticated technique used by the DS2 instrument for detection of gross pipetting errors often caused by the presence of particulate matter, clots, foam or bubbles in the sample.
Use of ESP requires collecting pipetting pressure profiles from a specified number of acceptable sample transfers for a fluid with a specified pipetting profile and volume. These profiles are then stored in a database and are used as a comparison against each pipetting profile observed during routine pipetting of that fluid to detect and report an episode of insufficient sample transfer.
1. Click Tools ESP Calibration to display the ESP Calibration dialog box.
Figure 201: ESP Calibration
2. In the Fluid Name field, enter the type of fluid for which the ESP profiles are being prepared.
For example: aqueous.
3. Enter the volume that is being pipetted (in microliters) and the aspiration and dispensing pipetting profiles.

Chapter 13: Create Database Records
© 2019 DYNEX Technologies Inc. 235 Part No. 91000200
Note: The volume and pipetting profiles should be those that are used when pipetting that type of fluid in an assay.
4. In the Number of Transfers field, click the drop-down arrows for the number of times the calibration is to be performed for that fluid.
5. Click the radio buttons designating the source (where the fluid will be pipetted from) and destination (where the fluid will be pipetted to) for the pipetting operation.
6. Click .
7. Follow the instructions that are displayed on the screen to prepare the system.
8. Click button. The instrument runs the transfer cycle for the first time and then displays the results.
Figure 202: Aspirate Pressures
9. Examine the aspirate and dispense profiles to verify that they are relatively smooth (Figure 202) without unexpected sharp peaks or dips.
10. Click if the profiles are satisfactory. The profiles will be included in the database record.
- or -
Click if the profiles are not satisfactory. The profiles will be deleted.
- or -
Click . After the instrument repeats the transfer cycle and displays the results, repeat step 9.
11. Repeat step 10 until all of the transfer cycles have been completed.
Note: Select All or a specific transfer cycle in the View panel to view data for either all transfers or a specific transfer. Place checkmarks in the checkboxes for Min, Max and/or Mean to display the corresponding data.

Chapter 13: Create Database Records
Part No. 91000200 236 © 2019 DYNEX Technologies Inc.
12. Click to save the calibration results to the database for subsequent use.
- or -
13. Click to close the dialog box without saving the data.
13.5 Creating a Stored Curve Fit Assay A stored curve fitting assay is a separate curve fitting assay that uses a calibration curve that was previously obtained with a curve fitting assay and saved. The stored curve must have been obtained on the same instrument and preferably with the same lots of reagents.
13.5.1 Creating a New Stored Curve Fit Assay
1. Create the assay as outlined in Chapter 13.5, but do NOT include any standards in the template.
2. When it is time to configure the curve fitting calculations, drag from the Operation panel to the position on the Protocol panel where the operation will be executed. The Standards tab and the template for the assay are displayed in the Configuration panel.
Figure 203: Configuration Panel
3. Click Fit Type tab to display the curve fit types and their options.

Chapter 13: Create Database Records
© 2019 DYNEX Technologies Inc. 237 Part No. 91000200
Figure 204: Fit Type Tab
4. In the Fit Type panel, click Stored Curve for constructing the standard curve. A dialog box is displayed for selecting the standard curve if more than one has been stored.
Figure 205: Stored Curve
5. Click stored standard curve and click . Information for the selected stored curve is displayed in the Fit Type tab.
Figure 206: Fit Type Tab
6. Review the information for the stored curve to be sure that the correct standard curve has been selected. If needed, repeat steps 4 and 5 to select a different standard curve.
7. Click to validate the stored curve information.
8. Click Save from the Assay Editor File menu.

Chapter 13: Create Database Records
Part No. 91000200 238 © 2019 DYNEX Technologies Inc.
13.5.2 Editing a Curve Fit Assay to Create a New Stored Fit Assay
1. Open the curve fit assay that will be edited and save it under a new name.
2. Navigate to the template for the assay. Delete all of the standards and relocate the remaining wells as needed.
3. Delete the pipetting operation for the assay.
Important: Do not attempt to edit the pipetting operation, since the template has been changed. DYNEX recommends to review the configuration of the dispense operation and Well Fill Verify operation.
4. Create and configure a new pipetting operation for the assay (Chapter 6.6).
5. Perform steps 3 through 8 of Chapter 13.5.1.
13.6 Importing a Standard Curve for a Stored Fit Assay Standard curves obtained on a different DS2 instrument cannot be used for a stored fit assay. However, a curve fit assay can be imported and the standard curve that is obtained when running the assay can be saved for use on that instrument.
Important: A warning message is displayed when importing a curve fit assay that uses a stored curve. The message notifies the operator that a new stored curve must be created before the assay can be used. If an imported stored curve fit assay is run without generating a new stored curve fit, an error message is displayed and the worklist must be aborted.
13.6.1 Creating and Running a Worklist with a Stored Fit Assay
1. Create the worklist in the same manner as for other assays (Chapter 7.7).
2. After the plate(s) have been loaded and the button is selected on the Load Plates window, the Select Stored Curve Fit Data dialog box is displayed.

Chapter 13: Create Database Records
© 2019 DYNEX Technologies Inc. 239 Part No. 91000200
Figure 207: Select Stored Curve Fit Data
3. Verify that the selected stored curve is the one that should be used. If not, click appropriate standard curve from the listing of available standard curves.
4. Select to confirm the standard curve selection and continue with the run.
Note: Click to return to the Load Plates window and abort the worklist.
13.7 Components of an Equation Equations can contain any number of characters. The equation must contain only the components that are described in the two tables in the following sections.
Conditional equations must contain a space after If and before and after else and Then. Spaces must not be included in any other QC equations.
For example: If PC<0.2 Then NC>0.5 else NC>0.
13.7.1 Assay Results, Arithmetic Operators, Brackets and Numbers Results from an assay, arithmetic operators, brackets and numbers can be included in an equation by entering them as described in the following table.
Most recent stored curve
All available stored curves
Selected stored curve

Chapter 13: Create Database Records
Part No. 91000200 240 © 2019 DYNEX Technologies Inc.
Table 44: Assay Results, Arithmetic Operators, Brackets and Numbers Component Description Example
Assay Result
Result from a single well.
The well type label, followed by the sequential number for that well type and the replicate.
T2. 1
Mean result from all replicates of a sample.
The well type label, followed by the sequential number for that well type.
T2
Mean result from all samples and all replicates of a well type.
The well type label. T
Arithmetic Operators
Sum + T+2
Difference - T-2
Quotient / T/2
Product * T*2
Power of ** T**2
Brackets (Up to 6 levels) () (NC1. 1-NC1.2)<0. 1
Numbers 0 through 9 T+2
13.7.2 Functions All the other equation components that can be included in an equation are displayed in the Functions pane. They can be entered either by double-clicking them in the Functions panel or by typing.
Not all the functions described below are available for all data operations.
Table 45: Functions, Descriptions and Examples
Function Description Example
= Assign the following value to the well, sample or well type that precedes the symbol.
NC1=0
== The preceding value must be equal to the following value. NC1. 1==2.950
< The preceding value must be less than the following value. NC2. 1<3.800
<= The preceding value must be less than or equal to the following value.
NC2. 1<=3.800
>= The preceding value must be greater than or equal to the following value.
NC2. 1>=2.950
> The preceding value must be greater than the following value. NC2. 1>2.950
i Each sample of the preceding well type must meet the following criteria.
NCi>2.950

Chapter 13: Create Database Records
© 2019 DYNEX Technologies Inc. 241 Part No. 91000200
Function Description Example
Valid The number of results that are valid for the following well type (in brackets) must meet the criteria shown.
Valid(PC)>=3
Median The median result for the following sample (if more than one replicate) or well type, designated in brackets.
Median(PC)
Verify
The specified number of values for the following sample (if more than one replicate) or well type must be within specified limits. The expression takes the form Verify (sample or well type, limit, mode), where limit is a number, percentage or standard deviation and mode is either 0 (mean of all values), 1 (mean of every other sample or well type) or 2 (mean of all values).
Verify(T,10%,2)>3
If Conditional expression for the following well, sample or well type. If PC<0.2 Then
NC>0.5 Else NC>0. 1
Then The condition that follows must be met for the test to pass.
Else The condition that follows will allow the test to pass when the Then condition fails.
MAX The highest value on the plate (if no well type follows) or for the designated well type (in brackets).
MAX(PC)
MIN The lowest value on the plate (if no well type follows) or for the designated well type (in brackets).
MIN(PC)
SD Standard deviation for the following sample (if more than one replicate) or well type, designated in brackets.
SD(PC)
CV Coefficient of variation for the following sample (if more than one replicate) or well type, designated in brackets.
CV(PC)
Log Base 10 logarithm of the following assay result. Log(PC)
Alog Inverse base 10 logarithm of the following assay result. Alog(PC)
Ln Natural Logarithm of the following assay result. Ln(PC)
Exp Inverse natural Logarithm of the following assay result. Exp(PC)
Sample The result of each well on the plate, regardless of well type. Sample*1.05
Result The calculated value of a sample instead of the absorbance values that were obtained.
Result(Sample)
Custom Variables
Up to nine lot-specific custom variables can be included. These will be included with the other functions on the Functions pane.

Chapter 13: Create Database Records
© 2019 DYNEX Technologies Inc. 242 Part No. 91000200
This page intentionally left blank.

Chapter 14: Multiple Tubes per Sample Feature
243 Part No. 91000200
Chapter 14: Multiple Tubes per Sample Feature
The Multiple Tubes per Sample feature is an optional user configurable generic version of the existing spreadsheet Boolean Function feature.
Note: The multiple tubes per sample feature requires the use of a software licensing in the form of a physical dongle that is available from DYNEX Technologies.
The Multiple Tubes per Sample feature allows the assay programmer to:
Specify the number of tubes that are assigned to one specimen.
Specify equations for each tube that define how the specimen result is calculated. For example: TubeA = Tube A, TubeBfinal = TubeBraw - TubeA.
Specify True/False evaluation equations (For example: Tube A <= 8.0), where each equation depends on the result of the previous True/False evaluation equation.
is included on the Assay Editor Spreadsheet tab when the Multiple Tubes per Sample feature is enabled.
Figure 208: Assay Editor Spreadsheet Tab
14.1 Creating a Spreadsheet Assay with Multiple Tubes per Sample
1. Click on the Assay Editor Spreadsheet tab. The Multiple Tubes per Specimen dialog box is displayed.

Chapter 14: Multiple Tubes per Sample Feature
Part No. 91000200 244 © 2019 DYNEX Technologies Inc.
Figure 209: Multiple Sample Tubes per Specimen
2. In the Tube Definitions panel, enter the name and equation for each tube.
3. Enter the name of the first tube in the Tube Name field and its equation in the Tube Equation Definition field.
Note: The name of the tube and the equation for that tube are typically found in the assay package insert.
If needed, click to clear entries that are currently displayed in the Tube Name and Tube Equation fields.
4. Click in the Tube Definitions panel. The name of the tube and the equation for that tube are displayed in the first row of the Tube Definitions table. The tube name will also appear in the report.
5. Repeat steps for each tube.
6. If needed, information that is currently displayed in the Tube Definitions table can be edited.
7. In the Tube Definitions table, select a tube for which the entries are to be edited. The current entries for that tube are displayed in the Tube Name and Tube Equation fields.

Chapter 14: Multiple Tubes per Sample Feature
© 2019 DYNEX Technologies Inc. 245 Part No. 91000200
8. Type the new entries in the Tube Name and Tube Equation fields.
9. Repeat steps for each tube that needs to be edited.
10. An example of tube definitions for a multi-tube sample is shown in Figure 210.
Figure 210: Multi-Tube Sample
Note: The optical density (or data derived from the optical density) is defined by the Tube Equation Definition and is calculated by the spreadsheet operation (For example: TB2 = TB2-Nil).
11. In the Result and/or Flag Equations panel, enter the Boolean (true/false) equation(s) that will be used to determine the result.
Note: Each result should eventually resolve to an output string (POSITIVE, NEGATIVE or INDETERMINATE). Several equations may be needed to calculate the final result.
12. Type the name of the first condition in the Condition field, the equation that defines the condition to be true in the True field and the equation that defines the condition to be false in the False field.
Note: The condition is an equation that defines whether the answer is true or false. The Condition text box requires an equation symbol (<, <=, ==, !=, >=, >) between the first and second tube equation definitions as shown below. White space is allowed in the condition text box.
Figure 211: Condition Text Box
13. If needed, click to clear the entries from the Condition the, True and False fields.
14. Click in the Result and/or Flag Equations panel. The condition and equations are displayed in the Result and/or Flag Equations table.
Note:
Delete the selected tube from the table.
Delete all of the tubes from the table.
Move the selected tubes up or down in the table.

Chapter 14: Multiple Tubes per Sample Feature
Part No. 91000200 246 © 2019 DYNEX Technologies Inc.
Figure 212: Results and/or Flog Equations Panel
Note: The equation either defines the final result or the next equation must be evaluated. If either the True Result/Flag field or the False Result/Flag field does not contain the word Line it is the final result and sample evaluation is complete. If the word Line is found, execution will continue at that grid line. The word Line is not case-sensitive but a space must be entered between the word Line and a numeral.
If needed, click to clear the entries from the Condition, True and False fields.
15. Repeat for each condition.
16. Information that is currently displayed in the Result and/or Flag Equations table can be edited.
17. In the Result and/or Flag Equations table, select a line number for which the entries are to be edited. The current entries for that tube are displayed in the Condition, True and False fields.
18. Type the new entries in the Condition, True and False fields.
19. Repeat for each condition that needs to be edited.
20. An example of equations for a multi-tube sample assay is shown in Figure 213.
Figure 213: Example Equation for a Multi-Tube Sample Assay
Note: The process for each sample always begins with Line 1. In the above example, if Nil <= 8.0 is True, the software performs the equation in Line 2.
If Nil <= 8.0 is False, the result is INDETERMINATE and evaluation for that sample is complete.
Lines 2 and 3 compare TB* to 0.35. In Line 2, if TB1 >= 0.35 the software compares TB* to Nil (Line 4). Otherwise, the software compares TB2 to 0.35 as outlined in Line 3. If TB2 >= 0.35, the software compares TB* to Nil (Line 4). Otherwise, the software evaluates the data in Line 6 and measures the Mitogen level.

Chapter 14: Multiple Tubes per Sample Feature
© 2019 DYNEX Technologies Inc. 247 Part No. 91000200
21. Click after all of the tube definitions and assay equations have been entered.
22. The Assay Editor Spreadsheet tab updates its cell definitions to match the tube definitions defined in the Multiple Tubes per Specimen dialog box.
14.2 Creating a Worklist with Multiple Tubes per Sample There may be three or four tubes per sample when using the multiple tubes per sample feature. The sample tubes must be loaded into sample racks in the expected consecutive order.
Table 46: Worklist with Multiple Tubes per Sample
Primary Sample Tube Location of the Tube on the Sample Rack
Amy
A Position 1
B Position 2
C Position 3
Bob
A Position 4
B Position 5
C Position 6
Cindy
A Position 7
B Position 8
C Position 9
Important: Sample tubes must be loaded in continuous blocks of multiple tubes with no spaces between each primary sample.
5. After the sample tubes have been loaded into the sample racks in the correct order, scan the sample tube barcode labels.
6. If each tube for a patient has the same Sample ID, a warning message is displayed to indicate that the duplicate Sample IDs will be automatically corrected. The first sample ID in the series will remain unchanged and subsequent tubes will be appended with a unique suffix.
Figure 214: Warning – Duplicate Sample IDs Detected
7. Click .

Chapter 14: Multiple Tubes per Sample Feature
Part No. 91000200 248 © 2019 DYNEX Technologies Inc.
Important: Do not use Auto Correction for duplicate sample IDs unless an assay with a Boolean function is being run.
Note: When running the multi-tube assay and all the samples have not been ordered though LIS-Link, in order to ensure the run is completed successfully all multi-tubes for each sample must be selected due to the fact that the system will register that the correct amount of samples were scanned but not that the correct amount were selected for the run.
4. The window for assigning assays is displayed. The first sample rack, indicated by a red arrow, will be selected by default. The Sample IDs for that rack are shown on the screen.
Figure 215: Worklist Editor
5. Click to continue execution of the worklist.
Note: Multiple Tubes per Sample assays follow the same sequence of events when executing the worklist as single tube/sample assay programming. There is no difference in scheduling, fluid transfer, incubation or washing operations.
14.3 Reporting of Multiple Tubes per Sample Results The Spreadsheet Results report includes a Multitube Boolean Function Results table that is sized to the tube/sample count specified by the assay program. The table includes columns for Sample ID, each tube defined by the user and each compound tube.
For example: TB1-Nil, TB2-Nil, Mitogen-Nil and the result.
The column headings are derived from the assay tube definition created by the user in the Spreadsheet operation.
14.4 Sending Multiple Tubes per Sample Results to the LIS DS2 1.40 or greater requires LIS-Link 2.40 or greater in order to send multiple tubes/sample results to the LIS program.

Chapter 15: Arm Calibration Procedure
249 Part No. 91000200
Chapter 15: Arm Calibration Procedure
The Arm Calibration Tool is only available if the DS2 Toolbox plug-in software has been installed. Arm Calibration should ONLY be performed by a trained technician.
15.1 Arm Calibration Instructions 1. Prior to beginning the arm calibration, read through the precautions listed
below.Once DS2 is successfully connected to the arm calibration software, begin by saving the arm calibration values out to a file.
Note: Read all message boxes carefully and perform required actions when prompted.
Important: If using a Windows language version other than United States English, note that the decimal separator must be set to “decimal” and not “comma”.
2. When moving the pipette, make sure to grasp the metal pipette spigot, do not use the tubing coming out of the pipette to move the pipette or you will risk damage to the pipette module.
Figure 216: DS2 Toolbox Icon
Note: Make sure the DS-Matrix is closed and then double click the DS2 Toolbox to open it.
3. After the DS2 Toolbox is opened. The toolbar is grayed out until initialization is completed.
4. The Save Arm Calibration Values window is displayed.
Figure 217: Save Arm Calibration Values

Chapter 15: Arm Calibration Procedure
Part No. 91000200 250 © 2019 DYNEX Technologies Inc.
5. The default file name is auto -populated it the File Name: field, it will begin with DS2CalibrationValues. Make sure to append this file name with the date (Figure 217) so that the file is easily identifiable and will not overwrite. If you are saving the values multiple times in one day, make sure to append with the date and a unique identifier (a, b, etc.).
6. Click . Once the arm calibration values are saved, click Exit. A file with the values is now saved to C:\Program Files\DYNEX Technologies\DS-Matrix\DS2 Toolbox.
7. Save the values.
8. Begin the arm calibration procedure.
9. Click on Arm tools.
10. Calibrate arm.
Figure 218: Calibration Screen
11. Click to begin calibration.
Note: Only calibrate positions that require calibration. It is not necessary to calibrate positions that do not require calibration.

Chapter 15: Arm Calibration Procedure
© 2019 DYNEX Technologies Inc. 251 Part No. 91000200
Figure 219: Pipette Spigot
12. Ensure there is nothing attached to the pipette spigot.
13. Click .
15.2 How the Calibration Screen Works The left side of the window is used to capture the coordinates of the locations. The right side of the window is used to specify and display the physical position on the instrument where the spigot must be located to capture the coordinate in question. Using the pipette spigot, with or without the pipette calibration tool attached, as the locating device and always grasping the metal part of the spigot, move it to the locations specified and labeled on the left side of the window.
1. Click associated with that location on the left side of the window.
2. Click to move to the next screen. If at any time you wish to return to a previous screen use the “Back” to find the screen and calibration point you wish tore-do.
3. Click to end your calibration session, it is recommended that you page
through all the screens before clicking until you are familiar with which locations you wish to calibrate to resolve the issue you are experiencing.
For each calibration group it has been indicated what symptoms are likely resolved by performing the calibration.

Chapter 15: Arm Calibration Procedure
Part No. 91000200 252 © 2019 DYNEX Technologies Inc.
Figure 220: Sample Tip Rack Positions
15.2.1 Consumable Rack Positions Calibrate this position if you suspect there are issues pipetting from the deep wells (tip is not centered, pipette does not seem to be finding fluid level accurately) or the incubator door is not completely opening or closing. Calibrating this position calibrates several positions on the instrument platform.
To calibrate this position, follow the instructions on the screen and click for each of the two calibration positions. Once the X, Y and Z values for all positions are populated with
values, click to calibrate other positions or to finish the calibration.

Chapter 15: Arm Calibration Procedure
© 2019 DYNEX Technologies Inc. 253 Part No. 91000200
Figure 221: Consumables Rack Positions
15.2.2 Reader Cover Positions
Calibrate this position if the reader cover is not being opened or closed properly.
To calibrate this position, follow the instructions on the screen and click for each of the two calibration positions. Once the X, Y and Z values for all positions are populated with
values, click to calibrate another position or click to finish calibration and save the values to the DS2.
Figure 222: Reader Cover Positions

Chapter 15: Arm Calibration Procedure
Part No. 91000200 254 © 2019 DYNEX Technologies Inc.
15.2.3 Sample Tip Rack Positions Calibrate this position if:
Sample tips (blue) are not being picked up (spigot is banging between tips) Tips are falling off in transit Pipetting issues are suspected.
Figure 223: Technical Tip for Sample Tip Rack Positions
a. The pipette tip must be put on very, tightly when performing this calibration. Failure to put the tip on tightly will result in incorrect calibration and could result in improper pipetting and tips falling off in transit.
b. Confirm the tip containers are placed securely and properly on the deck.
c. Leaving the tip in the rack, bring the spigot over to the tip rack.
d. Push the spigot into the tip until it cannot go further, then lift the tip up and bring it down firmly in the rack several times to ensure the tip is firmly attached to the spigot.
e. Leave the same tip on for all six calibration points. Ensure the location in the rack is empty prior to moving the spigot with tip to the location.
f. The pipette tip must be put on very, tightly when performing this calibration. Failure to put the tip on tightly will result in incorrect calibration and could result in improper pipetting and tips falling off in transit.
g. Confirm the tip containers are placed securely and properly on the deck.
Note: The X bottom position is not the corner hole, but diagonal from the corner hole.
1. Follow the instructions on the screen.
2. Click for each of the three calibration positions in rack one and each of the three calibration positions in rack two.
3. Once the X, Y and Z values for all positions are populated with values:
a. Click to calibrate another position.
- or -
b. Click to finish the calibration.

Chapter 15: Arm Calibration Procedure
© 2019 DYNEX Technologies Inc. 255 Part No. 91000200
Figure 224: Sample Tip Rack Positions
15.2.4 Reagent Tip Rack Positions Calibrate this position if the reagent tips (white) are not being picked up (spigot is banging between tips), if tips are falling off in transit or if pipetting issues are suspected.
Table 47: Technical Tip for Reagent Tip Rack Positions
a. The pipette tip must be put on very tightly when performing this calibration. Failure to put the tip on tightly will result in incorrect calibration and could result in improper pipetting and tips falling off in transit.
b. Confirm the reagent racks are properly positioned prior to calibrating
c. Leaving the tip in the rack, bring the spigot over to the tip rack.
d. Push the spigot into the tip until it cannot go further, then lift the tip up and bring it down firmly in the rack several times to ensure the tip is firmly attached to the spigot.
e. Leave the same tip on for all six calibration points. Ensure the location in the rack is empty prior to moving the spigot with tip to the location.

Chapter 15: Arm Calibration Procedure
Part No. 91000200 256 © 2019 DYNEX Technologies Inc.
1. Follow the instructions on the screen and click for each of the three calibration positions in rack one and each of the three calibration positions in rack two.
2. Once the X, Y and Z values for all positions are populated with values:
a. Click to calibrate another position
- or -
b. Click to finish the calibration.
Figure 225: Reagent Tip Rack Positions
15.2.5 Barcode Reader Positions Calibrate this position if barcode scanner is working (there is a red light), but it not reading barcodes or if the barcode scanner is not Clicking back into place once barcode scanning is complete or if the spigot is not engaging the barcode scanner to scan barcodes.
Table 48: Technical Tip for Barcode Reader Positions
a. Make sure the barcode scanner is all the way over to the left of the instrument and you can hear it “click” into place. If the scanner is not in all the way to the left, it will not be positioned properly for the calibration and the calibration points will be incorrect.
b. Do not push the spigot so far down in the spigot hole that it is difficult to remove. See below for pictures that show the correct positioning of the spigot for this calibration
c. Look at the spigot and note that there is a slight color change in the metal. This is where the spigot begins to taper from straight to angled (Picture 1).
d.
Insert the spigot in the hole on the barcode scanner until you can barely see where the color change takes place (Picture 2). If you have difficulties seeing the color change on the spigot, insert the spigot into the barcode scanner hole all the way and then lift up 1-2 mm. The spigot should not be tight in the hole.

Chapter 15: Arm Calibration Procedure
© 2019 DYNEX Technologies Inc. 257 Part No. 91000200
Picture 1 Picture 2
Figure 226: Angle Change on the Spigot
1. Once the spigot is correctly positioned correctly in the barcode hole, click
. Once the X, Y and Z are populated with values, click to
calibrate another position or click to finish the calibration.
Figure 227: Barcode Reader Position
Color change/angle on spigot (spigot is NOT correctly positioned in the barcode scanner hole).
Spigot correctly positioned in barcode scanner hole, color change barely visible, but spigot is not tight in the hole.
Angle change on spigot

Chapter 15: Arm Calibration Procedure
Part No. 91000200 258 © 2019 DYNEX Technologies Inc.
15.2.6 Tip Waste Hole Position Calibrate this position if the tips are not being ejected off the spigot or if the tips are banging into the instrument deck instead of being ejected.
Table 49: Technical Tip Waste Hole Position
a. For this position, a reagent tip is placed on the spigot to help with correct positioning only. It does not need to be on tightly.
b. Make sure to center the spigot from both the front and the side of the instrument, also ensuring the spigot is pushed down until it stops.
Figure 228: Spigot, Pins and Metal Ring
1. To calibrate this position:
Read instructions on the screen. Review technical tips (Chapter 15.2.11).
2. Click .
When the spigot is centered from the side, the reagent tip will line up exactly with the 20th position label on the sample rack. None of the 20th position label should be visible when properly centered.
Centering from the front view must be done by eye. Make sure the spigot is pushed all the way down so the pins encounter the metal ring.
Pins
Metal Ring

Chapter 15: Arm Calibration Procedure
© 2019 DYNEX Technologies Inc. 259 Part No. 91000200
Figure 229: Tip Waste Hold Position
3. Once X, Y and Z are populated with values, click .
15.2.7 Washer Pickup Positions 1. Calibrate this position if the wash head is not being picked up successfully or is not
being released successfully.
2. Make sure the wash head is positioned correctly on the support posts prior to calibrating this position. Incorrect positioning of the wash head will cause incorrect
calibration. If this position does not require calibration, click .
3. Incorrect wash head positioning on the support posts. The wash head is covering the end of the post and the wash head is crooked.
Figure 230: Technical Tip Washer Pickup Positions
4. Correct wash head positioning on the support posts. The head of the post is visible past the wash head.
5. To calibrate this position, make sure the wash head is seated correctly (Figure 230).

Chapter 15: Arm Calibration Procedure
Part No. 91000200 260 © 2019 DYNEX Technologies Inc.
6. Follow the instructions on the screen and click .
7. Once the X, Y and Z values for all positions are populated with values, click
.
Figure 231: Washer Pickup Position
8. When this screen appears, the DS2 is halfway through the calibration wizard.
9. To save any new calibration points or to continue the wizard to the desired
calibration screen, click .
Figure 232: Save Values
10. Engage the wash head when instructed to do so.
11. Click .
Figure 233: Engage Wash Head

Chapter 15: Arm Calibration Procedure
© 2019 DYNEX Technologies Inc. 261 Part No. 91000200
15.2.8 Washer with Microtiter Plate Positions
Calibrate this position if the wash head pins are not centered, if the wash head is scratching the bottom of the plate during aspiration, if wash solution is dispensing outside of the plate, if incomplete aspiration is occurring or if results indicate a washing issue.
Note: The spring gap must be kept open when calibrating the wash head positions in the plate.
Note: Ensure when putting the sample tips between the gap that they do not come in contact with the spring to avoid damage to the springs.
1. Put sample tips in the spring gap to keep the gap from closing (Figure 234). This will allow the aspiration pins to come in contact with the plate bottom, without compressing the spring.
Figure 234: Sample Tips Placement
Note: The plate carriers will move if you apply to much force while performing the calibration. Be gentle when inserting the aspiration pins into the white well inserts in the plate, taking care not to move the plate carrier around. If the plate carrier is moved, calibration values will be incorrect.
2. Prior to clicking , ensure that the plate is in the plate carrier
corresponding to the that is clicked.
For example: When clicking for Upper Plate Datum, make sure the plate is actually in the upper plate carrier.
3. To calibrate this position, use the DS2 Calibration plate.
4. Follow the instructions on the screen and the Technical Tips above when calibrating.

Chapter 15: Arm Calibration Procedure
Part No. 91000200 262 © 2019 DYNEX Technologies Inc.
5. Click for the Datum and Y Right positions in the upper plate carrier.
6. Remove the DS2 Calibration plate from the plate carrier and make sure the wash head and pipette are off to the side.
7. Click .
8. Insert the DS2 Calibration Plate when prompted, taking care not to move the plate carrier.
9. Click prior to putting the wash head in the plate to avoid damaging the instrument.
10. Click for the Datum and Y Right positions in the lower plate carrier.
11. Once the X, Y and Z values for all positions are populated with values, click
.
Figure 235: Washer with Microtiter Plate Positions
To park the wash head:
1. Move the wash head back over and place it on the support posts.
2. Remove the spigot from the wash head by pulling upwards until the pins on the spigot come out of the clamps on the wash head.
3. Once the spigot is removed from the wash head, ensure the wash head is still correctly positioned on the support posts, so there are not wash head pick-up issues later on.
4. Reference a previous picture of correct wash head placement on the support posts.

Chapter 15: Arm Calibration Procedure
© 2019 DYNEX Technologies Inc. 263 Part No. 91000200
15.2.9 Install the Pipette Calibration Tool
Figure 236: DS2 Arm Calibration Screen
1. To install the pipette calibration tool, remove the wash head.
2. Then mount the calibration tool onto the pipette. The flat edges of the tool should be to the sides and the back and the rounded side should be towards the front.
3. Gently tighten the set screws with the 2 mm hex wrench. Refer to the pictures below for correct calibration tool positioning.
Figure 237: Pipette Calibration Tool Position
4. Click once the wash head is removed.

Chapter 15: Arm Calibration Procedure
Part No. 91000200 264 © 2019 DYNEX Technologies Inc.
Figure 238: Calibration Too
5. Click once the pipette calibration tool is correctly installed.
Figure 239: DS2 Arm Tools Lib
Side view of correctly positioned calibration tool.
Front view of correctly positioned calibration tool.
Flat side
Rounded side
Flat sides to the side.
Rounded side to the front
Allen screw to the right side of the tool.
No spaces between the lip on the spigot and the calibration

Chapter 15: Arm Calibration Procedure
© 2019 DYNEX Technologies Inc. 265 Part No. 91000200
15.2.10 Plate Carrier Positions Calibrate this position if the sample/reagent tip is not centered in the well, if fluid is being dispensed outside the well, if the tip is dragging across the top of the well as it dispenses reagent, if the air gap pulled up between wells is not clean (fluid is pulled up instead of air).
Table 50: Technical Tip for Plate Carrier Positions
a. The plate carriers will move if you apply tool much force while performing the calibration.
b. Be gentle when inserting the calibration tool into the wells in the DS2 calibration plate, taking care not to move the plate carrier around.
c. Make sure the calibration tool is in contact with the bottom of the well for each of the calibration positions.
d. Prior to clicking , ensure that the plate is in the plate carrier corresponding to the values you are clicking.
To calibrate this position, use the DS2 calibration plate.
1. Remove the DS2 calibration plate from the instrument.
2. Click .
3. Insert the plate in the upper plate carrier.
4. Click .
5. Follow the instructions on the screen and the Technical Tips when calibrating.
6. Click for the Datum, Y Right and X Bottom positions in the upper plate carrier.
7. Remove the DS2 Calibration plate from the upper plate carrier.
8. Click at the bottom of the screen.
9. Insert the DS2 Calibration Plate, taking care not to move the plate carrier.
10. Click prior to putting the calibration tool in the plate to avoid damaging the instrument.
11. Click for the Datum, Y Right and X Bottom positions in the lower plate carrier.
12. Once the X, Y and Z values for all positions are populated with values, click
.

Chapter 15: Arm Calibration Procedure
Part No. 91000200 266 © 2019 DYNEX Technologies Inc.
Figure 240: Plate Carrier Positions
15.2.11 Sample Rack Positions Calibrate this position if you suspect the system is not tracking fluid correctly in the sample tubes.
Table 51: Technical Tips Sample Rack Positions
Note: Make sure the calibration tool is touching the bottom of the rack. The lip of the tool can
catch on the sample holder and feel like it is down all the way, when actually it is not.
Make sure the sample racks are pushed in all the way. If the racks are not positioned correctly, the calibration points will be incorrect. The racks should not move/tilt to the left or right when inserting the too.
a. Follow the instructions on the screen and the Technical Tips when calibrating.
b. Click for the Datum, Y Right and X Bottom positions.
c. Once the X, Y and Z values for all positions are populated with values, click .

Chapter 15: Arm Calibration Procedure
© 2019 DYNEX Technologies Inc. 267 Part No. 91000200
Figure 241: Sample Pack Positions
15.2.12 Reagents Rack Positions Calibrate this position if you suspect the system is not tracking fluid correctly in the reagent tubes. The PN for the DS2 calibration collar is DS2FIX029.
Table 52: Technical Tip for Reagents Rack Positions a. This calibration uses the calibration collar. Make sure the calibration collar is inserted and
pushed down as far as it will go into the correct reagent tube position. b. Make sure the calibration tool is touching the bottom of the rack. c. Make sure the reagent racks are pushed in all the way. If the racks are not positioned
correctly, the calibration points will be incorrect. The racks should not move/tilt to the left or right when inserting the too.
1. Follow the instructions on the screen and the technical tips when calibrating.
2. Click for the Datum, Y Right and X Bottom positions.
3. Once the X, Y and Z values for all 3 positions are populated with values, click
.

Chapter 15: Arm Calibration Procedure
Part No. 91000200 268 © 2019 DYNEX Technologies Inc.
Figure 242: Reagents Rack Positions
15.2.13 Control Rack Positions Calibrate this position if it is suspected that the system is not tracking fluid correctly in the control tubes or if the sample tip is not centered in the control tube.
Table 53: Technical Tips for Control Rack Positions a. Make sure the calibration tool is touching the bottom of the rack.
b. Make sure the reagent racks are pushed in all the way. If the racks are not positioned correctly, the calibration points will be incorrect. The racks should not move/tilt to the left or right when inserting the too.
1. Follow the instructions on the screen and the technical tips when calibrating.
2. Click for the Datum, Y right and X bottom positions for rack 1 and rack 2.
3. Once the X, Y and Z values for all 6 positions are populated with values, click
.

Chapter 15: Arm Calibration Procedure
© 2019 DYNEX Technologies Inc. 269 Part No. 91000200
Figure 243: Control Rack Positions
4. Arm calibration wizard is now complete.
Figure 244: Arm Calibration Wizard Completed
5. Remove the Calibration tool using the 2 mm hex wrench. Click when done.
Figure 245: Remove Calibration Tool Pop-Up Window
6. The wash head detect routine calibrates the wash head magnet and sensor
positions. Click to perform the wash head detect routine.

Chapter 15: Arm Calibration Procedure
Part No. 91000200 270 © 2019 DYNEX Technologies Inc.
Figure 246: Perform Wash Head Detect Routine Pop-Up Window
Figure 247: Arm Calibration Wizard Complete
7. Depending on the version of the DS2 toolbox you are running, you may or may not see the following screen after performing the wash head detect routine (Toolbox 1.03 will show this screen).
Figure 248: DS2 Workspace Validation

Chapter 15: Arm Calibration Procedure
© 2019 DYNEX Technologies Inc. 271 Part No. 91000200
8. If this screen is displayed, click .
9. If the result is Pass the calibration is complete.
10. If it the workspace validation fails, click to view the report and repeat the arm calibration for any positions detailed in the report.
Note: This workspace validation is only checking for impossible values (like negative numbers); it is not checking that the values are correct or within average expected ranges. If you calibrated the upper plate instead of the lower plate, this validation will pass, but your values for those calibration points will still be incorrect.
11. Once calibration is complete, save the arm calibration values again following the instructions at the beginning of the calibration procedure.
Note: Use a unique identifier for the file name such as the date so the file will not be overwritten.
12. After the arm calibration values have been saved, exit DS2 Toolbox.
13. Open DS-Matrix and run the assay from the list of assays named “Installation Assay”. Choose to run 2 or 3 samples and when the system requests fluids, simply load bottles containing water.
14. Load the plate used for start-up when the software asks for a plate to be loaded on the system. This assay will check the movement of the arm following the calibration. Pay special attention to any positions calibrated while the assay is running to confirm the problem requiring calibration has been resolved.

Chapter 15: Arm Calibration Procedure
Part No. 91000200 272 © 2019 DYNEX Technologies Inc.
This page intentionally left blank.

Appendix A: Acronyms
Part No. 91000200 273 © 2019 DYNEX Technologies Inc.
Appendix A: Acronyms Acronym Definition
µL Microliter
AC Antigen Control
AE Assay Editor
C Celsius
C Control
CAN Canada
CD Compact Disk
CD-ROM Compact Disk Read Only Memory
CFR Code of Federal Regulations
CISPR International Special Committee on Radio Interference
CLSI Clinical and Laboratory Standards Institute
cm Centimeters
CO Cut-off Control
CSV Comma-Separated Values
CV Co-efficient of Variability
dBA A-weighted decibels
DVD Digital Video Disk
EAN European Article Numbering
EC European Community
ELISA Enzyme-Linked Immunosorbent Assay
EMC Electromagnetic Compatibility
EN English
ESP Electronic Signature Pipetting
ETL Edison Testing Laboratories
F Fahrenheit
FCC Federal Communications Commission
GB Gigabyte
GHz Gigahertz
HIPPA Health Insurance Portability and Accountability Act
HS Haemolyzed Sample
Hz Hertz
IATA International Air Transport Association
ICES Interference-Causing Equipment Standard
IEC International Electro technical Commission
in Inches

Appendix A: Acronyms
Part No. 91000200 274 © 2019 DYNEX Technologies Inc.
Acronym Definition
Inc. Incorporated
IVD In-Vitro Diagnostic
JAN Japanese Article Numbering
kg Kilograms
L Liter
LAN Local Area Network
lbs Pounds
LIMS Laboratory Information Management System
LIS Laboratory Information System
MAX Maximum
MB Megabyte
MIN Minimum
mL Milliliters
mm Millimeter
MSSQL Microsoft Structured Query Language
mW Milliwatt
N Negative
NC Negative Control
nm Nanometers
OD Optical Density
OS Operating System
oz. Ounce
PC Personal Computer
PC Positive Control
PDF Portable Document Format
PR Positive Reference
QFT QuantiFERON
RA Return Authorization
RAM Random Access Memory
RF Radio Frequency
ROM Read Only Memory
RPM Revolutions per Minute
RS-232 Recommended Standard 232
SC Serum Control
sec Second
SMTP Simple Mail Transfer Protocol
SoC System-on-a-Chip
SQL Structured Query Language

Appendix A: Acronyms
© 2019 DYNEX Technologies Inc. 275 Part No. 91000200
Acronym Definition
T Test
UK United Kingdom
UL Underwriters Laboratories
UPC Universal Product Code
UPS Uninterruptible Power Supply
USA United States of America
USB Universal Serial Bus
V Volt
VA Volt-Ampere WDDM Windows Display Driver Model
WEEE Waste Electrical And Electronic Equipment
WIN Windows

Appendix A: Acronyms
Part No. 91000200 276 © 2019 DYNEX Technologies Inc.
This page intentionally left blank.

Appendix B: OD Calculation for Multiple Read Operation Assays
© 2019 DYNEX Technologies Inc. 277 Part No. 91000200
Appendix B: OD Calculation for Multiple Read Operation Assays
This describes how DS2-Matrix calculates raw data OD and how DS2-Matrix uses the calculated raw data OD. The goal is to define how raw data OD is calculated and used in the multiple read operation environment.
B.1 Definitions
Term Description
Optical Density
OD is the data value derived from the absorbance measured by the absorbance reader.
Filter Filter is a selectable light screen between the white (all frequencies) light bulb and the plate. The filter only passes light at a specific frequency.
Test Filter Test Filter is mandatory. It is the Filter value used to measure the absorbance.
Reference Filter
Reference Filter is optional. If defined it is the Filter value used to measure the absorbance. The well OD is a combination of the OD measured at the two filter frequencies.
Test OD Test OD is the absorbance measured for light at the Test Filter frequency. This measured absorbance is converted to OD.
Reference OD Reference OD is the absorbance measured for light at the Reference Filter frequency. This measured absorbance is converted to OD. If a reference filter is undefined then reference OD defaults to 0.0.
Blank Value Blank Value is an optional feature. It is OD measured at a specific well. This well is bare plastic (or possibly a non-reactive well coating). Fluid is not dispensed to the blank well. Blank Value is subtracted from the other measured OD values – the idea is to subtract out background noise from the measured results. If Blank Value is not selected then the Blank Value is defaulted to 0.0.
Well OD Well OD is the combination of Test OD, Reference OD, and Blank Value that describes the well measurement. Data reduction uses Well OD as the input OD measurement.
Nomenclature Subscripts identify the various flavors of OD and Filter. ODw = the raw data OD measured for this well. W indicates well. ODt = the test OD, as described above. T indicates Test. ODr = the reference OD, as described above. R indicates Reference.
If there are multiple read operations, then we need to indicate to which read operation the OD belongs. A subscript number will be used identify the read operation. For instance:
OD1w = the raw data OD measured for this well by read operation 1. W indicates well, 1 indicates read operation 1. ODcw = a combined raw data OD for the well, where ODcw = OD2w – OD1w. C indicates Combined. Blank2 = plate blank value measured by read operation 2.
If there is not a subscript number the assumption is the assay is a single read operation assay.

Appendix B: OD Calculation for Multiple Read Operation Assays
Part No. 91000200 278 © 2019 DYNEX Technologies Inc.
B.2 OD Calculations There are three different variants of raw data OD:
• UnblankedValue • PeakReadResult • Value.
1. UnblankedValue = ODt – ODr.
This is mainly used as a component of other OD types.
Specific program uses are:
• Raw data OD for CSV data files (single read operation assays only). • Plate blank value calculation.
o If this is a blank well then the well UnblankedValue is added to the plate blank value.
o Once the plate has been scanned the mean plate blank value is calculated.
o Mean value is used for all blank dependent raw data OD values.
• Plate Report o Blank mode section.
• Reporting o Raw Data grid cell data value.
2. PeakReadResult = ODt – ODr – Blank.
This is used to decide if the well is OVER or UNDER.
Specific program uses of OVER/UNDER are:
• Calculating well statistics (i.e., Mean, SD, CV) o Do not include well if well is OVER/UNDER.
• Calculating replicate well Mean value o Do not include well if well is OVER/UNDER.
• Outlier Removal • Stored Curve data formatting • Reporting
o Various ApplyOverUnderTest functions. • LIS-Link data export
o ShouldReplaceWellResults function.
3. Value = PeakReadResult, then if PeakReadResult is > MaximumOD or PeakReadResult < MinimumOD, return replacement value
- or -
NaN (Not a Number = invalid number), depending on system configuration.
This is the standard raw data OD value, used by:
• Data reduction input raw data

Appendix B: OD Calculation for Multiple Read Operation Assays
© 2019 DYNEX Technologies Inc. 279 Part No. 91000200
• Outlier Removal dialog • Stored Curve data formatting • Levey-Jennings dialog and calculations • Reporting – various ApplyOverUnderTest functions.
B.3 Multiple Read Operation Considerations • IsOVER • IsUNDER • IsUnblankedValueOVER • IsUnblankedValueUNDER • IsOutsideAcceptableODRange.
All of these should return TRUE (well is not usable) if any of the well OD are out of range, even if the other(s) well ODs are valid. The thinking here is the well data has to be valid at all filter frequencies for the well to be usable.
For example: If OVER returns true if OD1w < Max (is OK) but OD2w > Max (bad).
Blank Value
The blank value should be filter frequency dependent. The thinking is measured absorbance depends on the filter frequency. Blank is subtracted from the well OD; therefore, the subtracted blank should use the same filter frequency as the well OD.
For example:
OD1w = OD1t – OD1r – Blank1 OD2w = OD2t – OD2r – Blank2 ODcw = OD2w – OD1w = (OD2t – OD2r – Blank2) - (OD1t – OD1r – Blank1)

Appendix B: OD Calculation for Multiple Read Operation Assays
Part No. 91000200 280 © 2019 DYNEX Technologies Inc.
This page intentionally left blank.

Appendix C: Packing and Unpacking Instructions
© 2019 DYNEX Technologies Inc. 281 Part No. 91000200
Appendix C: Packing and Unpacking Instructions
1. Uncrate the DS2 instrument, computer and accessories.
2. Check the crate for physical damage. If damaged, take pictures and report it to the shipper.
3. Place the pallet and tray parts of the Packaging Assembly (26000310) on the ground.
4. Raise the flaps of the tray.
Note: Ensure that the short flaps are raised first followed by the long flaps.
5. Staple the long flaps all the way through to the short flaps in four places in the orientation shown using heavy-duty staples for double-wall corrugated.
Note: Ensure to staple only on the long side of the Tray in four places as shown in the following image.
Tray Part of 26000310
Pallet Part of 26000310

Appendix C: Packing and Unpacking Instructions
Part No. 91000200 282 © 2019 DYNEX Technologies Inc.
6. Remove the tear out sections on two Corner A and two Corner B pieces from the Packaging Assembly.
Note: The following images are examples of corner pieces with the tear out sections left in and removed.
7. Connect all four corner pieces by inserting the pad from the packaging assembly into the slots of the corners pieces.
Tear Out Section Left In
Tear Out Section Removed

Appendix C: Packing and Unpacking Instructions
© 2019 DYNEX Technologies Inc. 283 Part No. 91000200
8. Place the accessories pack (13500591) in the pallet/tray assembly and next to corner A and corner B as shown below.
Pad Part of 26000310
Corner A (tear out removed) Part of 26000310
Corner B (tear out removed) Part of 26000310
Corner B (tear out removed) Part of 26000310
Corner A (tear out removed) Part of 26000310

Appendix C: Packing and Unpacking Instructions
Part No. 91000200 284 © 2019 DYNEX Technologies Inc.
9. Spread open a large plastic bag in the location shown to receive the unit.
Note: Ensure that there is a gap inside of the tray to receive the carton in a later step.
Accessories Pack 13500591
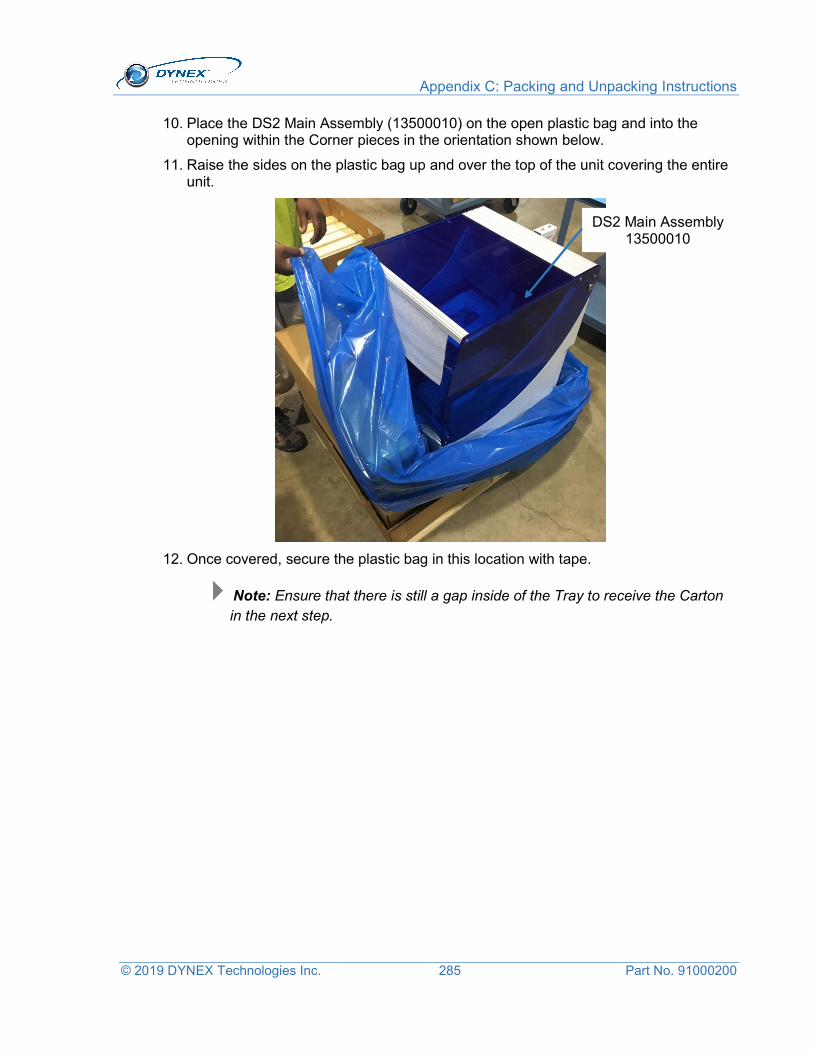
Appendix C: Packing and Unpacking Instructions
© 2019 DYNEX Technologies Inc. 285 Part No. 91000200
10. Place the DS2 Main Assembly (13500010) on the open plastic bag and into the opening within the Corner pieces in the orientation shown below.
11. Raise the sides on the plastic bag up and over the top of the unit covering the entire unit.
12. Once covered, secure the plastic bag in this location with tape.
Note: Ensure that there is still a gap inside of the Tray to receive the Carton in the next step.
DS2 Main Assembly 13500010

Appendix C: Packing and Unpacking Instructions
Part No. 91000200 286 © 2019 DYNEX Technologies Inc.
13. Lower the closed (not sealed) carton from the packaging assembly onto the unit and into the tray.
Carton Part of 26000310
Secure bag here

Appendix C: Packing and Unpacking Instructions
© 2019 DYNEX Technologies Inc. 287 Part No. 91000200
14. Align the eight cutouts with each other.
Note: The following images are examples of aligned and misaligned cutouts.
15. Install the eight Clips from the Packaging Assembly through the eight cutouts in the carton and tray.
Aligned Cutouts
Misaligned Cutouts

Appendix C: Packing and Unpacking Instructions
Part No. 91000200 288 © 2019 DYNEX Technologies Inc.
16. Open the four carton flaps.
17. Insert the four supports from the packaging assembly into the corner slots of the bottom corner pieces.
Note: Ensure that the supports are placed into the corner slots in the corner sections.

Appendix C: Packing and Unpacking Instructions
© 2019 DYNEX Technologies Inc. 289 Part No. 91000200
18. Locate a set of corner A and B pieces (with tear-out section left in) at the back of the unit.
Note: The back of the unit is the side furthest away from the accessory pack while the front of the unit is the side closest to the accessory.
19. Locate another set of corner A and B pieces (with tear-out section removed) at the front of the unit.
Support placed into corner slot

Appendix C: Packing and Unpacking Instructions
Part No. 91000200 290 © 2019 DYNEX Technologies Inc.
20. Fold the Spacer from the Packaging Assembly in the configuration shown.
21. Insert the Spacer into the cavity above the Accessories Pack.
22. Seal the top of the Carton.
Corner A (tear out left in)
Part of 26000310
Corner B (tear out left In)
Part of 26000310
Corner B (tear out removed)
Corner A (tear out removed)
Spacer Part of 26000310
On Top of the Accessories Pack

Appendix C: Packing and Unpacking Instructions
© 2019 DYNEX Technologies Inc. 291 Part No. 91000200
Note: Do not cover up the carton shipping symbols (not shown).
23. For a standard DS2 system (62000), perform the following:
a. Locate one Unpacking Instructions (990025090) on the top of the Carton.
b. Locate two DS2 shipping labels on the carton (one on top and one on a short side).
c. Locate the GS1 shipping container label directly below the shipping label on the side of carton, as shown in the following image.
Note: The GS1 Shipping Container Label is included with the Shipping Labels and Unpacking Instructions from Consolidation.
24. Locate Multiple Symbol Crate Labels (99002880) as shown in the following image (4sides).

Appendix C: Packing and Unpacking Instructions
Part No. 91000200 292 © 2019 DYNEX Technologies Inc.
For a Meril DS2 (62001), perform the following:
Locate one Meril Unpacking Instructions (99002730) on the top of the carton.
Locate two Meril DS2 shipping labels on the carton (one on top and one on a short side).
Locate the Meril GS1 shipping container label directly below the shipping label on the top of carton.
Cover the Dynex logo using brown tape or a similar method on both long sides of the carton.
For a QIAGEN DS2 (62042), perform the following:
1. Perform step 4.20 for a standard DS2 system.
2. Pack extra power cords into the QIAGEN Power Cord Box (2600080) and seal.
3. Pack the full power cord box, the QIAGEN Installation Consumables Kit (13002570), the PC (53000141), and Printer (11200) inside of the QIAGEN Ancillary Box (2600070).
4. Place the ancillary box on top of the DS2 Crate.
Note: When full, the box requires 2 people to lift.
Shipping Labels
Unpacking instructions 99002590
Multiple symbol crate label (4 sides) 99002880
GS1 shipping container label (provided with the shipping labels from consolidation)

Appendix C: Packing and Unpacking Instructions
© 2019 DYNEX Technologies Inc. 293 Part No. 91000200
Unpacking Instructions (For Meril Only) 99002730
Cover the Dynex Logo (2 places) (For Meril Only)
GS1 Shipping Container label (Provided with the shipping labels from consolidation)
Multiple Symbol Crate Label (4 sides) 99002880
Shipping Labels

Appendix C: Packing and Unpacking Instructions
Part No. 91000200 294 © 2019 DYNEX Technologies Inc.
If the instrument is an AESKU SQII (62041), perform the following:
1. Place the SQII shipping carton serial label (99002890) as shown below.
For SQII only SQII Shipping Carton Serial Label (1 Place) 99002890
Multiple Symbol Crate Label (4 Sides) 99002880
GS1 Shipping Container label (provided with the shipping labels from Consolidation)