Assay of Beta-Lactam Pharmaceuticals by Redox Titration
34
Lab on Paper: Assay of Beta-Lactam Pharmaceuticals by Redox Titration Journal: Analytical Methods Manuscript ID AY-ART-07-2019-001547.R1 Article Type: Paper Date Submitted by the Author: 30-Aug-2019 Complete List of Authors: Myers, Nicholas; University of Notre Dame, Chemistry and Biochemistry; United States Pharmacopeia Maina, Mercy; Moi Teaching and Referral Hospital, Pharmacy Were, Phelix; AMPATH Kenya, Academic Model Providing Access to Healthcare Karwa, Rakhi; Moi Teaching and Referral Hospital, Pharmacy; AMPATH Kenya, Academic Model Providing Access to Healthcare; Purdue University College of Pharmacy Nursing and Health Sciences, Purdue Kenya Partnership; Moi University College of Health Sciences Pastakia, Sonak; Moi Teaching and Referral Hospital, Pharmacy; Purdue University College of Pharmacy Nursing and Health Sciences, Purdue Kenya Partnership; AMPATH Kenya, Academic Model Providing Access to Healthcare; Moi University College of Health Sciences Sharp, Jalen; San Francisco State University Luther, Jamie; University of Notre Dame, Chemistry and Biochemistry Cooper, Adam; University of California San Diego, Chemistry and Biochemistry Bliese, Sarah; University of Notre Dame, Department of Chemistry and Biochemistry Oberhof, Nils; University of Notre Dame, Chemistry and Biochemistry Aldulaimi, Doaa; University of Notre Dame, Chemistry and Biochemistry Lieberman, Marya; University of Notre Dame, Chemistry and Biochemistry Analytical Methods
-
Upload
khangminh22 -
Category
Documents
-
view
2 -
download
0
Transcript of Assay of Beta-Lactam Pharmaceuticals by Redox Titration

Lab on Paper: Assay of Beta-Lactam Pharmaceuticals by Redox Titration
Journal: Analytical Methods
Manuscript ID AY-ART-07-2019-001547.R1
Article Type: Paper
Date Submitted by the Author: 30-Aug-2019
Complete List of Authors: Myers, Nicholas; University of Notre Dame, Chemistry and Biochemistry; United States PharmacopeiaMaina, Mercy; Moi Teaching and Referral Hospital, PharmacyWere, Phelix; AMPATH Kenya, Academic Model Providing Access to HealthcareKarwa, Rakhi; Moi Teaching and Referral Hospital, Pharmacy; AMPATH Kenya, Academic Model Providing Access to Healthcare; Purdue University College of Pharmacy Nursing and Health Sciences, Purdue Kenya Partnership; Moi University College of Health SciencesPastakia, Sonak; Moi Teaching and Referral Hospital, Pharmacy; Purdue University College of Pharmacy Nursing and Health Sciences, Purdue Kenya Partnership; AMPATH Kenya, Academic Model Providing Access to Healthcare; Moi University College of Health SciencesSharp, Jalen; San Francisco State UniversityLuther, Jamie; University of Notre Dame, Chemistry and BiochemistryCooper, Adam; University of California San Diego, Chemistry and BiochemistryBliese, Sarah; University of Notre Dame, Department of Chemistry and BiochemistryOberhof, Nils; University of Notre Dame, Chemistry and BiochemistryAldulaimi, Doaa; University of Notre Dame, Chemistry and BiochemistryLieberman, Marya; University of Notre Dame, Chemistry and Biochemistry
Analytical Methods
1
Lab on Paper: Assay of Beta-Lactam Pharmaceuticals by Redox Titration
Authors: Nicholas M. Myers,a,g Mercy W. Maina,b Phelix Makoto Were,b Rakhi Karwa,
b,c, d, e Sonak D Pastakia, b,c,d,e Jalen C. Sharp,a,f, Jamie L. Luther,a Adam Cooper,a,h Sarah
Bliese,a Nils Oberhof,a Doaa Aldulaimi,a Marya Liebermana*
a Department of Chemistry and Biochemistry; University of Notre Dame; Notre Dame, IN 46556, USA
b Moi Teaching and Referral Hospital, Department of Pharmacy, Eldoret, Kenyac Purdue University College of Pharmacy, Purdue Kenya Partnership, Eldoret,Kenya 30100dAcademic Model Providing Access To Healthcare (AMPATH), Eldoret, Kenya; eCollege of Health Sciences, School of Medicine, Moi University, Eldoret, Kenya; f Department of Equity and Social Justice; San Francisco State University; San Francisco, CA 94312, USA
gUnited States Pharmacopeial Convention; Rockville, MD 20852, USA [email protected] 301-692-3582
h Department of Chemistry and Biochemistry, University of California San Diego, La Jolla, CA 92093, USA*(574) 631-4665; [email protected]
Page 1 of 33 Analytical Methods
123456789101112131415161718192021222324252627282930313233343536373839404142434445464748495051525354555657585960
2
ABSTRACT
Field tests to detect substandard antibiotics are sorely needed in many low and
middle-income countries (LMICs). We created a field screening test for amoxicillin
capsules and ampicillin tablets based on USP method <425>. To measure the amount of
antibiotic, the user dissolves the contents of the capsule in water, carries out a simple
chemical degradation, and adds drops of the sample to a paper test card. The test card
performs a titration and displays a series of blue dots for visual comparison to standard
images.
Pharmaceutical samples were collected in western Kenya and analyzed using a
blinded methodology to validate the test card’s quantitative performance against HPLC
assay. Within the quantification range of the test card, the absolute assay error for dosage
forms was 4.4% for amoxicillin and 5.3% for ampicillin, and inter-operator precision was
2%. Users correctly categorized 94% of amoxicillin (n=84) and 88% of ampicillin (n=56)
samples as either containing less than or greater than 90% of the expected amount of
antibiotic, which is the lower regulatory limit. The test card detected several lot numbers
of a substandard amoxicillin product, confirmed by HPLC analysis to contain only 40-
60% of the stated amoxicillin content. IR, PXRD, and gravimetric analysis revealed that
talc made up the remainder of the adulterated medications.
Page 2 of 33Analytical Methods
123456789101112131415161718192021222324252627282930313233343536373839404142434445464748495051525354555657585960

3
BACKGROUND
The quality of beta-lactam antibiotics is a matter of life or death, so detecting bad
quality products in low- and middle-income countries (LMICs) is an important analytical
goal. Pneumonia kills more than 20,000 children under age 5 every year in Kenya.1,2
National medical guidelines recommend that children with community-acquired
pneumonia receive amoxicillin, an inexpensive beta-lactam antibiotic.2 The World Health
Organization (WHO) reports that 10% of the antibiotics in low and middle-income
countries (LMICs) are substandard or falsified (SF), and SF amoxicillin is estimated to
kill 72,000 children per year in sub-Saharan Africa.3
Medicines must meet quality criteria enforced by drug regulatory agencies
(DRAs). These quality standards cover a range of properties that relate to the efficacy of
the product, ranging from the weight and purity of the ingredients to the tablet color,
uniformity, and dissolution rate. One critical standard is the active pharmaceutical
ingredient (API) content, because if the medicine does not contain the correct amount of
the antibiotic, the concentration in the patient's blood will not reach the therapeutically
effective level, which can contribute to development of resistant pathogens. For
amoxicillin and ampicillin, the API content of a dosage form must assay between 90%
and 110 or 120% of the quantity stated on the package.4,5 Boehle et al.6 developed a
paper-based enzyme competition assay that responds to multiple beta lactam-containing
penicillin and cephalosporin antibiotics. This device has the potential to identify
products that are severely underdosed (<70% API content), but it is yet not accurate
enough to identify products that fail to meet pharmacopoeia standards.
Page 3 of 33 Analytical Methods
123456789101112131415161718192021222324252627282930313233343536373839404142434445464748495051525354555657585960

4
The United States Pharmacopeia (USP) contains a method, <425> “Iodometric
assay-antibiotics,” that quantifies fourteen beta-lactam antibiotics by a back-titration
(Figure 1).7 The beta-lactam antibiotic is degraded in base for 15 minutes to generate
redox active species. The complete degradation pathways are complex,8 so only one
product is shown in Figure 1 to simplify the explanation of the assay. The solution is
acidified, and an accurately known excess of triiodide is added to oxidize the degradation
products. The solution reacts for another 15 minutes, and whatever triiodide remains is
back-titrated with thiosulfate using starch as an endpoint indicator.
NO
R SH
COOH
R1. NaOHR3. excess I3
-Oxidized Products +I- + remaining I3
-
HN
O
RSH
COONa
NaO R2. H+
R4. I3- + Na2S2O3 I- + Na2S4O6
R5. I3- + starch blue complex
Figure 1. Back-titration of beta-lactam antibiotics. R1. The antibiotic is degraded with base to produce redox active species, reaction time = 15 min. R2. The solution is acidified. R3. A known excess of triiodide is added, reaction time = 15 min. R4. The remaining triiodide is quantified via iodometric titration. R5. The starch indicator will be colored blue if the oxidizing capacity of the triiodide exceeds the reducing capacity of the thiosulfate. If not, the indicator will be colorless.
We previously reported a test card that performs an iodometric titration for analysis of
iodized salt, and demonstrated it could quantify pure amoxicillin through the back-
titration method.9 Here, we apply this method to dosage forms of amoxicillin and
ampicillin, and assess the accuracy of the card through a blinded validation study using
samples collected from the Kenyan marketplace in 2012-2014.
Page 4 of 33Analytical Methods
123456789101112131415161718192021222324252627282930313233343536373839404142434445464748495051525354555657585960
5
Page 5 of 33 Analytical Methods
123456789101112131415161718192021222324252627282930313233343536373839404142434445464748495051525354555657585960
6
EXPERIMENTAL
Pharmaceutical sample collection in Kenya
Overview
Ethical clearance for the study was obtained from the Moi University/Moi Teaching and
Referral Hospital Institutional Research and Ethics Committee (IREC # 2012/45) and
from the University of Notre Dame (IRB #14-04-1763 and 15-05-2542). Ethical issues
considered included the use of deception (covert shoppers), privacy of drug vendors, and
arrangements for reporting suspicious samples to the Kenyan Pharmacy and Poisons
Board, which is the drug regulatory agency in Kenya, and the WHO Rapid Alert system,
which tracks global pharmaceutical quality problems.
The pharmacovigilance department at Moi Teaching and Referral Hospital in Eldoret,
Kenya trained secret shoppers to collect medicines from the marketplaces of 21 nearby
towns: Busia, Port Victoria, Ugunja, Kakamega, Malaba, Webuye, Sio, Nangili,
Matunda, Moi’s Bridge, Kitale, Kisumu, Bungoma, Luanda, Nakuru, Nairobi, Mombasa,
Kapsabet, Mosoriot, Turbo and Kipkaren River. These sites were selected based on the
recommendation of the Kenyan Pharmacy and Poisons Board as sites with a higher
potential for substandard medications. Details of how the secret shoppers were trained
and how pharmacies and medicines were selected are in the Electronic Supporting
Information (S6).
Sample storage
Page 6 of 33Analytical Methods
123456789101112131415161718192021222324252627282930313233343536373839404142434445464748495051525354555657585960

7
Samples were assigned unique codes, and each sample’s API, dosage, manufacturer,
distributor, expiry date, batch number, and type of packaging along with the
presence/absence of an insert was recorded in an Excel spreadsheet. They were stored at
Moi Teaching and Referral Hospital (MTRH) at ambient temperature away from sunlight
and water. The samples were shipped by air to the University of Notre Dame (UND) and
then refrigerated at 4 °C until they were analyzed.
Materials. Chemicals used included soluble starch (J.T. Baker), p-toluenesulfonic acid
(Alfa Aesar), potassium iodide (Amresco), cadmium chloride (Acros), anhydrous sodium
thiosulfate (J.T. Baker), secondary standard of potassium iodate, 100.2% (J.T. Baker),
primary standard of amoxicillin trihydrate (USP), secondary standard of amoxicillin
trihydrate (Sigma Aldrich), primary standard of ampicillin (USP), secondary standard of
ampicillin (Sigma Aldrich), standardized 0.005 M iodine solution (Alfa Aesar),
hydrochloric acid (Fisher), and sodium hydroxide (Fisher). The PADs were fabricated
using Ahlstrom 319 paper (8.5 x 11” sheets custom ordered via Midland Scientific,
Chicago, IL), and were printed on a ColorQube 8570N wax printer (Xerox). Solutions of
1.0 M NaOH and 1.2 M HCl were stored in polyethylene bottles, and 0.0050 M triiodide
was stored in glass vials with Teflon® caps. All amoxicillin concentrations are reported
as anhydrous amoxicillin.
Fabrication of test card. The test card was created by printing solid wax ink onto
Ahlstrom 319 paper using a Xerox ColorQube printer; details and the Adobe Illustrator
print files are available.9 The cards were baked at 100°C for 14 minutes. The seal was
tested on a small number of the cards by placing water into a zone, waiting 30 seconds,
and seeing if water leaked into an adjacent zone. If it did, then the batch of cards was
Page 7 of 33 Analytical Methods
123456789101112131415161718192021222324252627282930313233343536373839404142434445464748495051525354555657585960

8
baked for 3 more minutes, retested, and repeated until the seal was good. The reagents
listed in Table S3 were deposited with a multichannel automatic pipette into the locations
specified in Figure S1.
Stock solution preparation for test card and HPLC analysis. Standard solutions were
prepared using deionized water and primary or secondary reference materials traceable to
USP standards. For the internal validation study, samples were weighed on an Explorer
semi-micro balance, model OHAUS EX125D, which has a 12 mg minimum weight as
defined by USP <41>. At least 25 mg of each sample was taken for assay. A nominal 2.0
mg/mL stock of amoxicillin or ampicillin was prepared in deionized water. An aliquot of
the stock was used to create a 1.00 mg/mL solution for the test card analysis. A separate
aliquot was taken from the stock to create a 0.5 mg/mL solution for HPLC analysis. This
was done so capsule-to-capsule heterogeneity could not cause different measurements
between the methods. For the standards used to generate the paradigmatic test card
images used to analyze the other samples, the concentration of amoxicillin or ampicillin
in the reference solutions varied from 0.80 to 1.10 mg/mL in 0.05 mg/mL increments.
Mocked-up amoxicillin samples. The contents of 20 capsules of one lot of an
amoxicillin dosage form (Caremox-500 lot 160927, labeled as containing 500 mg
anhydrous amoxicillin as amoxicillin trihydrate) were mixed in a 50 mL Falcon tube and
vortexed for 4 minutes. The total mass of the powder was corrected for the weight of
powder retained in the capsules (about 2% retained). The retained powder was
determined by weighing the gel capsule shells before and after blowing all the powder
out with compressed air. The actual content of amoxicillin in this lot number was assayed
by HPLC as 85 ± 1%. Accurately massed portions of the dosage form and talc or starch
Page 8 of 33Analytical Methods
123456789101112131415161718192021222324252627282930313233343536373839404142434445464748495051525354555657585960
9
were placed into a Falcon tube or a glass vial and mixed for 4 minutes using a vortexer
and inverting the container regularly. The chemist who diluted the samples blinded them
and did not perform any of the test card or HPLC analysis.
HPLC system suitability. Identical HPLC systems are installed in the UND lab and in
the MTRH lab and the two labs can communicate via videoconferencing software.
Samples were analyzed using a Waters 2695 HPLC with a Waters 2487 absorbance
detector set at 220 nm. The detector is monitored by an SRI model 333 A to D converter
(SRI Instruments, Torrance, CA, USA), connected to a laptop computer running
PeakSimple (SRI Instruments, Torrance, CA, USA). Peak integration data from
PeakSimple is manually transcribed into an Excel template,10 which performs the
necessary standardization, calibration checks, and concentration calculations.
A complete system suitability assessment according to USP <621> was performed. The
assay met USP standards for peak metrics, linearity, precision, accuracy, resolution, and
recovery of the beta lactam antibiotic from a matrix of degraded capsule contents. Before
each batch of unknowns was analyzed, five replicate injections of the reference standard
were run. If these replicates produced less than a 2% relative standard deviation for
reproducibility, the unknowns were run. A calibration check sample (prepared each day
from a secondary standard of amoxicillin or ampicillin) was run after every 5 unknowns,
and the 5 runs were rejected if the integrated intensity of the calibration check peak fell
outside the 2% RSD range established at the start of the run. Due to the small number of
capsules available in each sample for assay and the need to retain capsules for analysis by
the national drug regulatory agency, single-capsule or single-tablet analysis was
performed (most pharmacopeia procedures call for homogenizing the contents of 10 or
Page 9 of 33 Analytical Methods
123456789101112131415161718192021222324252627282930313233343536373839404142434445464748495051525354555657585960

10
more capsules for assay). The standard operating procedure for any capsule that failed to
meet USP standards (90%-120% API content) was to analyze the original capsule again
and two additional capsules taken from the same package. Samples that failed these tests
were reported to the Kenyan Pharmacy and Poisons board.
Preparation of samples for aPAD and HPLC analysis. For capsules, the powder was
massed by difference using an airstream to blow out the capsules until no residual powder
could be seen. Tablets were weighed and then ground to powder in a mortar. samples
were weighed on an Explorer semi-micro balance, model OHAUS EX125D, which has a
12 mg minimum weight as defined by USP <41>. At least 25 mg of each sample was
taken for assay and diluted to nominal 1.00 mg API/mL in deionized water for analysis
on the test card or diluted to 0.5 mg API/mL in deionized water for HPLC analysis,
which was conducted on the same day. The column used was a Symmetry C18 5µm, 4.6
x 100 mm column. The 18 l of sample was injected via autoinjector. The details of the
HPLC conditions used for each antibiotic are shown in supporting information, section
S3.
Analysis of samples on aPAD: The rate of oxidation of the amoxicillin degradation
products by triiodide was found to be temperature-dependent (supporting information,
section S8). Temperatures of 15˚C or below give incomplete reaction after 15 min
reaction time, leading to an underestimate of more than 5% in the antibiotic content in
100% API content samples, while temperatures of 30˚C or above yield an overestimate of
more than 5% in the antibiotic content. The following steps were performed in a
scintillation vial at lab room temperatures of 20-25˚C: to 4.0 mL of the nominal 1.0
Page 10 of 33Analytical Methods
123456789101112131415161718192021222324252627282930313233343536373839404142434445464748495051525354555657585960

11
mg/mL sample solution, 2.0 mL of 1.0 M NaOH was added, shaken, and allowed to react
for 15 minutes. Then 2.0 mL of 1.2 M HCl and 10.00 mL of 0.0050 M triiodide was
added, swirled to mix, and allowed to react for an additional 15 minutes, during which
time the dark yellow color from the triiodide faded. 125 µL of the pale yellow test
solution was pipetted onto each of the twelve squares of the test card (in the lab at
MTRH, a disposable 1 mL plastic pipet was used to place 4 drops of the sample on each
sample loading area). Using the pipet tip, the solution meniscus was drawn across all 5
subsections of the square to cover it completely. The card was left on a flat surface and
gently moved back and forth about 1 cm at a rate of 2 Hz for 3 minutes to help mix the
contents of each square. Then, a picture of the paper test card was taken in a lightbox and
the image was read by visual comparison to standard images. The sample preparation
procedure allows the units to be converted directly from “mg/mL” to “% of labeled
amount” (e.g., if a sample matches the 0.90 mg/mL standard image, the sample contains
90% of the labeled antibiotic amount).
Internal validation. Analyst 1 prepared the stock samples for analysis on both HPLC
and the test card. Analyst 1 performed only the HPLC analysis and kept the results a
secret from Analyst 2. Analyst 2 performed the test card analysis and reported the results
to Analyst 3, after which time Analyst 1 unblinded the HPLC results.
Powder X-ray diffraction of insoluble material isolated from amoxicillin capsule. A
white powder was recovered from one of the suspect samples by extensive washing of the
powder on a Hirsch funnel (water, 1 M NaOH, 0.5 M HCl, methanol, acetonitrile,
acetone, toluene, 1-propanol, and hexane). After the hexane wash, the powder was dried
in a 100˚C oven for 1 hour and then used for XRD and IR. Data were recorded as a
Page 11 of 33 Analytical Methods
123456789101112131415161718192021222324252627282930313233343536373839404142434445464748495051525354555657585960
12
series of 360 degree phi rotation photos at 250 K using monochromated Cu radiation with
an APEX-II area detector operating in 1Kx1K mode at 15 cm specimen to detector
distance, yielding an effective scan resolution of 0.01 deg. Data to 30 degree in 2-theta
were recorded for 60 seconds per rotation frame and from 30 to 80 degree at 120 seconds
per frame. The images were composited and intensities integrated from the composite
image using the APEX-3 suite of software.
IR of insoluble material isolated from amoxicillin capsule. IR was obtained by
spreading the sample on an ATR plate. 16 scans at 4 cm-1 resolution were acquired and
the air background was subtracted. The baseline was corrected using a linear fit; the data
are unsmoothed.
RESULTS
Preliminary examination of Kenyan beta-lactam pharmaceuticals. None of the
published studies about amoxicillin and ampicillin quality (listed in Table S1) reported
the actual API contents of their samples11,12,13,14,15,16,17,18,19 and this information was
needed to develop the proper quantitative analysis range for the paper test card. In 2013-
2014, secret shoppers collected patient dosage units of amoxicillin,
amoxicillin/clavulanate combination capsules, and ampicillin in western Kenya (see
“Pharmaceutical sample collection in Kenya” in the Methods section). Of 189 samples
analyzed by HPLC, 46 (24%) samples failed the USP standard for API content. Of the
failing samples, 32 (70%) contained 80.0-89.9% of the labeled API (Table 1), 13 (28%)
contained <80% API content, and only one sample (2%) tested above 120% API content.
Based on these results, the test card analysis was tuned to detect substandard products,
Page 12 of 33Analytical Methods
123456789101112131415161718192021222324252627282930313233343536373839404142434445464748495051525354555657585960
13
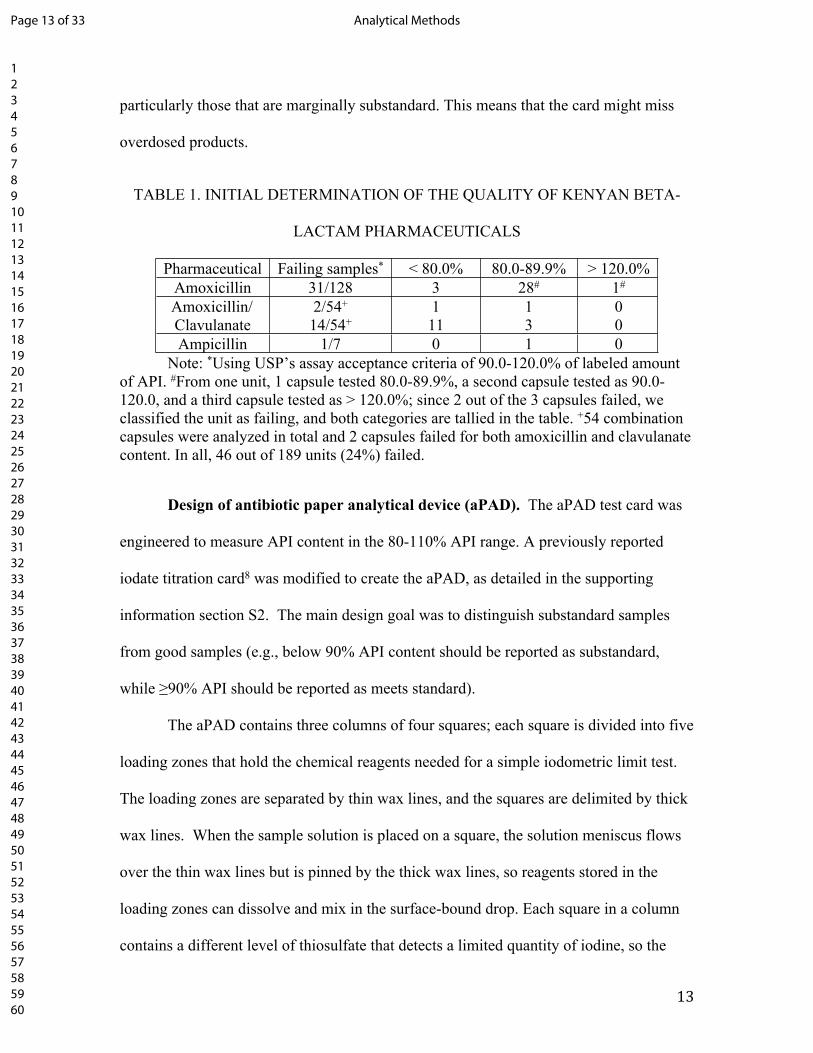
particularly those that are marginally substandard. This means that the card might miss
overdosed products.
TABLE 1. INITIAL DETERMINATION OF THE QUALITY OF KENYAN BETA-
LACTAM PHARMACEUTICALS
Pharmaceutical Failing samples* < 80.0% 80.0-89.9% > 120.0%Amoxicillin 31/128 3 28# 1#
Amoxicillin/Clavulanate
2/54+
14/54+111
13
00
Ampicillin 1/7 0 1 0Note: *Using USP’s assay acceptance criteria of 90.0-120.0% of labeled amount
of API. #From one unit, 1 capsule tested 80.0-89.9%, a second capsule tested as 90.0-120.0, and a third capsule tested as > 120.0%; since 2 out of the 3 capsules failed, we classified the unit as failing, and both categories are tallied in the table. +54 combination capsules were analyzed in total and 2 capsules failed for both amoxicillin and clavulanate content. In all, 46 out of 189 units (24%) failed.
Design of antibiotic paper analytical device (aPAD). The aPAD test card was
engineered to measure API content in the 80-110% API range. A previously reported
iodate titration card8 was modified to create the aPAD, as detailed in the supporting
information section S2. The main design goal was to distinguish substandard samples
from good samples (e.g., below 90% API content should be reported as substandard,
while ≥90% API should be reported as meets standard).
The aPAD contains three columns of four squares; each square is divided into five
loading zones that hold the chemical reagents needed for a simple iodometric limit test.
The loading zones are separated by thin wax lines, and the squares are delimited by thick
wax lines. When the sample solution is placed on a square, the solution meniscus flows
over the thin wax lines but is pinned by the thick wax lines, so reagents stored in the
loading zones can dissolve and mix in the surface-bound drop. Each square in a column
contains a different level of thiosulfate that detects a limited quantity of iodine, so the
Page 13 of 33 Analytical Methods
123456789101112131415161718192021222324252627282930313233343536373839404142434445464748495051525354555657585960

14
column of squares performs a titration and the entire card does the titration in triplicate.
A user prepares the sample as detailed in the methods section, applies 125 μL of the
solution to each square of the test card, and then picks the standard image (shown in
Figure 2 and Figure 3) that best matches the test card’s response. The remaining features
printed onto the test card are a QR code and fiducial marks, which enable automated
image analysis if a picture of the card is taken with a cell phone.
Calibration of the test card. The aPAD was calibrated using amoxicillin trihydrate and
ampicillin. Standard images are shown in Figure 2 and Figure 3. The calibration ranges
expressed in mg/mL are slightly different for the two antibiotics because they have
different formula weights.
≤ 0.85 0.90 0.95
1.00 1.05 ≥ 1.10
Figure 2. Amoxicillin standard images. Units are mg anhydrous amoxicillin per mL water.
Page 14 of 33Analytical Methods
123456789101112131415161718192021222324252627282930313233343536373839404142434445464748495051525354555657585960
15
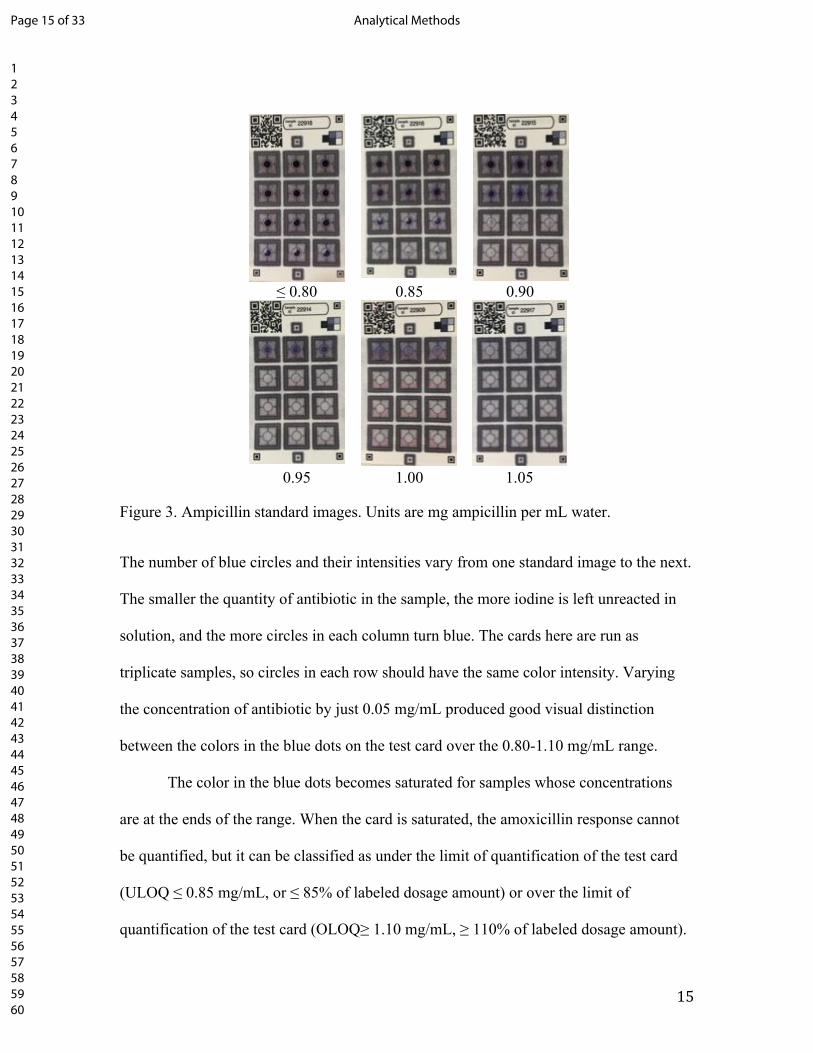
≤ 0.80 0.85 0.90
0.95 1.00 1.05
Figure 3. Ampicillin standard images. Units are mg ampicillin per mL water.
The number of blue circles and their intensities vary from one standard image to the next.
The smaller the quantity of antibiotic in the sample, the more iodine is left unreacted in
solution, and the more circles in each column turn blue. The cards here are run as
triplicate samples, so circles in each row should have the same color intensity. Varying
the concentration of antibiotic by just 0.05 mg/mL produced good visual distinction
between the colors in the blue dots on the test card over the 0.80-1.10 mg/mL range.
The color in the blue dots becomes saturated for samples whose concentrations
are at the ends of the range. When the card is saturated, the amoxicillin response cannot
be quantified, but it can be classified as under the limit of quantification of the test card
(ULOQ ≤ 0.85 mg/mL, or ≤ 85% of labeled dosage amount) or over the limit of
quantification of the test card (OLOQ≥ 1.10 mg/mL, ≥ 110% of labeled dosage amount).
Page 15 of 33 Analytical Methods
123456789101112131415161718192021222324252627282930313233343536373839404142434445464748495051525354555657585960
16
A similar scheme is applied to the ampicillin response to classify it as under limit of
quantification (ULOQ ≤ 0.80 mg/mL, ≤ 80% of labeled dosage amount) or over limit of
quantification (OLOQ ≥ 1.05 mg/mL, ≥ 105% of labeled dosage amount). Any sample
that is ≤ 85% of the labeled dosage amount is classified as substandard; this includes all
of the ULOQ amoxicillin samples plus those reading 0.85 mg/mL, and all of the ULOQ
ampicillin samples plus those reading 0.80 mg/mL or 0.85 mg/mL. This test card design
is not sensitive for detection of overdosed products, but in our experience, these make up
a very small fraction of the bad quality products found in the market.
Variation of visual analysis. Since reading the test cards by visual analysis is subjective,
we measured the variation that arises when different operators read the test cards (Table
2). This study was conducted on the first 22 images collected during the validation study.
The true values were blinded, and the operators read the test cards independently. At the
start of the study, each analyst had a different level of experience with the aPAD. Analyst
1 developed the technology, analyst 2 was an experienced reader, and analyst 3 was
newly trained. Of the 22 images, 8 corresponded to under limit samples, and all analysts
correctly evaluated these cards. The remaining 14 images fell into the quantitative range
of the aPAD. All three analysts achieved absolute errors of 2-3%. The standard deviation
of the 3 reads for each test card was calculated, and then all 14 standard deviations were
averaged to determine the inter-reading precision of 0.6%. All analysts achieved similar
errors in reading the test card, which means the newly trained user could interpret the test
card nearly as well as the expert readers.
Page 16 of 33Analytical Methods
123456789101112131415161718192021222324252627282930313233343536373839404142434445464748495051525354555657585960
17
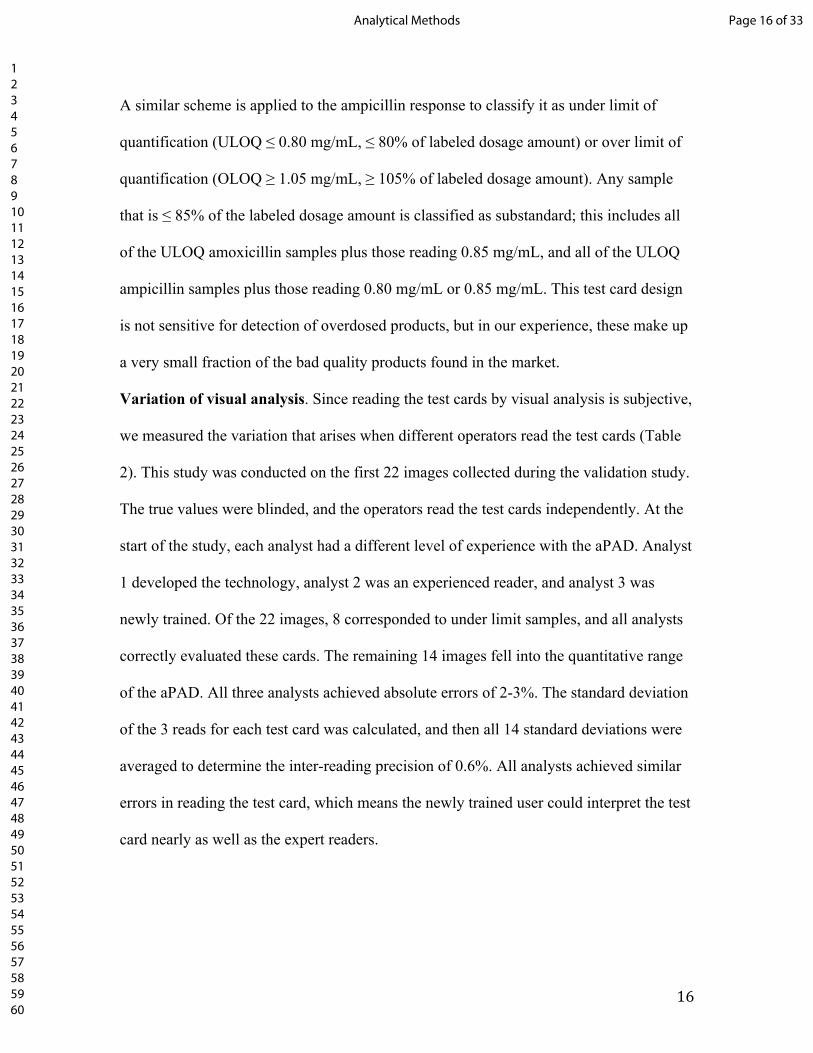
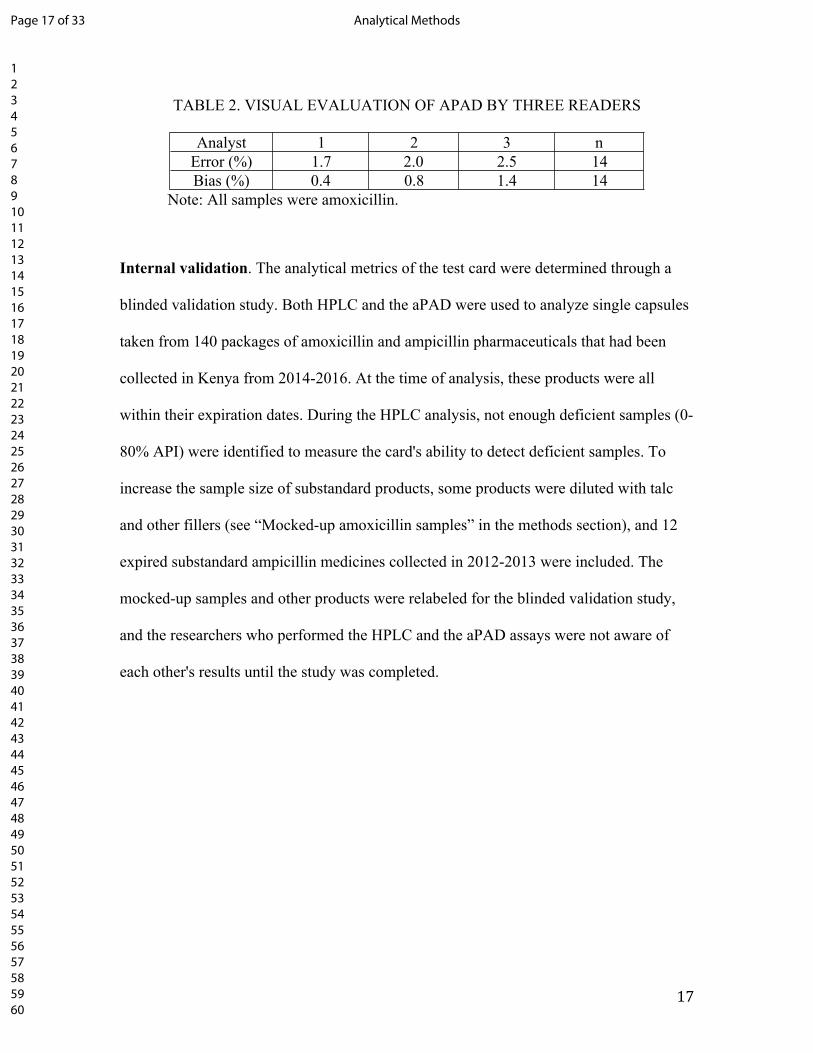
TABLE 2. VISUAL EVALUATION OF APAD BY THREE READERS
Analyst 1 2 3 nError (%) 1.7 2.0 2.5 14Bias (%) 0.4 0.8 1.4 14
Note: All samples were amoxicillin.
Internal validation. The analytical metrics of the test card were determined through a
blinded validation study. Both HPLC and the aPAD were used to analyze single capsules
taken from 140 packages of amoxicillin and ampicillin pharmaceuticals that had been
collected in Kenya from 2014-2016. At the time of analysis, these products were all
within their expiration dates. During the HPLC analysis, not enough deficient samples (0-
80% API) were identified to measure the card's ability to detect deficient samples. To
increase the sample size of substandard products, some products were diluted with talc
and other fillers (see “Mocked-up amoxicillin samples” in the methods section), and 12
expired substandard ampicillin medicines collected in 2012-2013 were included. The
mocked-up samples and other products were relabeled for the blinded validation study,
and the researchers who performed the HPLC and the aPAD assays were not aware of
each other's results until the study was completed.
Page 17 of 33 Analytical Methods
123456789101112131415161718192021222324252627282930313233343536373839404142434445464748495051525354555657585960

18
III
IVIII
Page 18 of 33Analytical Methods
123456789101112131415161718192021222324252627282930313233343536373839404142434445464748495051525354555657585960
19
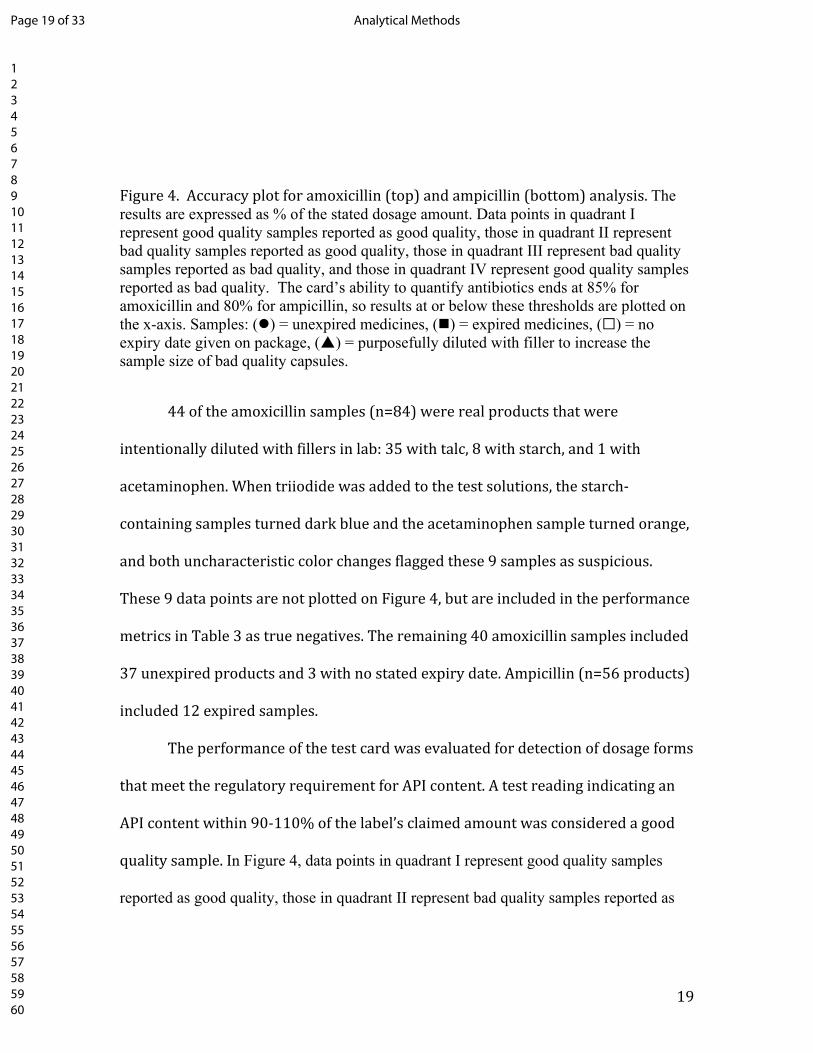
Figure 4. Accuracy plot for amoxicillin (top) and ampicillin (bottom) analysis. The results are expressed as % of the stated dosage amount. Data points in quadrant I represent good quality samples reported as good quality, those in quadrant II represent bad quality samples reported as good quality, those in quadrant III represent bad quality samples reported as bad quality, and those in quadrant IV represent good quality samples reported as bad quality. The card’s ability to quantify antibiotics ends at 85% for amoxicillin and 80% for ampicillin, so results at or below these thresholds are plotted on the x-axis. Samples: () = unexpired medicines, () = expired medicines, (☐) = no expiry date given on package, () = purposefully diluted with filler to increase the sample size of bad quality capsules.
44 of the amoxicillin samples (n=84) were real products that were
intentionally diluted with fillers in lab: 35 with talc, 8 with starch, and 1 with
acetaminophen. When triiodide was added to the test solutions, the starch-
containing samples turned dark blue and the acetaminophen sample turned orange,
and both uncharacteristic color changes flagged these 9 samples as suspicious.
These 9 data points are not plotted on Figure 4, but are included in the performance
metrics in Table 3 as true negatives. The remaining 40 amoxicillin samples included
37 unexpired products and 3 with no stated expiry date. Ampicillin (n=56 products)
included 12 expired samples.
The performance of the test card was evaluated for detection of dosage forms
that meet the regulatory requirement for API content. A test reading indicating an
API content within 90-110% of the label’s claimed amount was considered a good
quality sample. In Figure 4, data points in quadrant I represent good quality samples
reported as good quality, those in quadrant II represent bad quality samples reported as
Page 19 of 33 Analytical Methods
123456789101112131415161718192021222324252627282930313233343536373839404142434445464748495051525354555657585960
20
good quality, those in quadrant III represent bad quality samples reported as bad quality,
and those in quadrant IV represent good quality samples reported as bad quality.
Categorical analysis. To see if the test card can be used as a tool that rates the
medicine as “good” or “bad” quality, the visual reads were grouped using the USP’s
90.0% assay requirement as a limit. A “good quality” response was assigned the positive
condition for the metrics in Table 3. The aPAD predicted the correct quality status for
128/140 (91%) of the ampicillin and amoxicillin samples. Based on these
categorization results, 68 of the 79 bad quality samples (86%) would be detected as low
quality by the test card and sent to a certified lab for additional testing, and only 1 of the
61 good quality samples (1.6%) would be sent for testing. Cohen’s Kappa value is 0.83
±0.05, meaning the aPAD and HPLC methods agree very well even when accounting
for chance agreement. The test card predicted that 11 samples met the quality
standard when in fact they did not (false positive rate = 11/79 = 14%), although it
should be noted that these false positives were almost all marginal fails; only one of
the 11 false positives had an API content below 80%. The test card predicted one
sample to be substandard that actually met the API standard although again, it
should be noted that this was a marginal pass at 91% API content. The analytical
metrics for the two antibiotics are shown separately in Table 3.
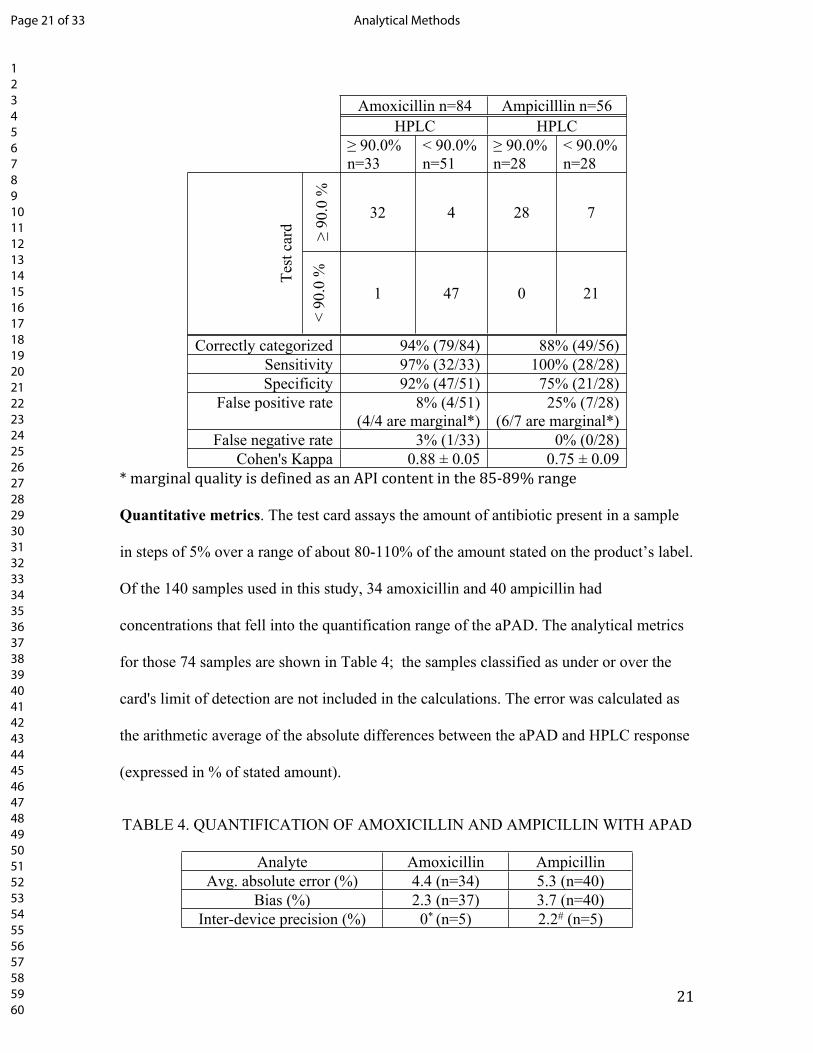
TABLE 3. THE TEST CARD’S PERFORMANCE FOR CATEGORIZING THE QUALITY OF
ANTIBIOTIC SAMPLES
Page 20 of 33Analytical Methods
123456789101112131415161718192021222324252627282930313233343536373839404142434445464748495051525354555657585960
21
Amoxicillin n=84 Ampicilllin n=56HPLC HPLC
≥ 90.0%n=33
< 90.0%n=51
≥ 90.0%n=28
< 90.0%n=28
≥ 90
.0 %
32 4 28 7
Test
car
d
< 90
.0 %
1 47 0 21
Correctly categorized 94% (79/84) 88% (49/56)Sensitivity 97% (32/33) 100% (28/28)Specificity 92% (47/51) 75% (21/28)
False positive rate 8% (4/51)(4/4 are marginal*)
25% (7/28)(6/7 are marginal*)
False negative rate 3% (1/33) 0% (0/28)Cohen's Kappa 0.88 ± 0.05 0.75 ± 0.09
* marginal quality is defined as an API content in the 85-89% range
Quantitative metrics. The test card assays the amount of antibiotic present in a sample
in steps of 5% over a range of about 80-110% of the amount stated on the product’s label.
Of the 140 samples used in this study, 34 amoxicillin and 40 ampicillin had
concentrations that fell into the quantification range of the aPAD. The analytical metrics
for those 74 samples are shown in Table 4; the samples classified as under or over the
card's limit of detection are not included in the calculations. The error was calculated as
the arithmetic average of the absolute differences between the aPAD and HPLC response
(expressed in % of stated amount).
TABLE 4. QUANTIFICATION OF AMOXICILLIN AND AMPICILLIN WITH APAD
Analyte Amoxicillin AmpicillinAvg. absolute error (%) 4.4 (n=34) 5.3 (n=40)
Bias (%) 2.3 (n=37) 3.7 (n=40)Inter-device precision (%) 0* (n=5) 2.2# (n=5)
Page 21 of 33 Analytical Methods
123456789101112131415161718192021222324252627282930313233343536373839404142434445464748495051525354555657585960

22
Note: The units are expressed as % of amount found by HPLC. The error was calculated as the arithmetic average of the absolute differences between the aPAD and HPLC response (expressed in % of stated amount).*One sample with a true value of 100.6% was run 5 times and all test cards were interpreted as 100%. #One sample with a true value of 94.2% was run 5 times and the test cards were read as 95%, 95%, 95%, 95%, and 90%.
Characterizing bad quality products found during validation. During the validation
study, the test card identified several packages of substandard amoxicillin capsules. The
stated brand and manufacturer on the packaging of most of these samples was Caremox-
500, manufactured by Shandong Shenglu Co., Ltd, with batch numbers 140604, 150601,
and 150602. Repeated attempts to contact the manufacturer were unsuccessful, so we
could not verify whether the product was authentic. HPLC analysis found that multiple
capsules taken from these packages contained only 40-60% of the stated amoxicillin
content. The product was reported immediately to the Kenyan drug regulatory authorities
and the WHO RapidAlert system.
The samples prepared for HPLC analysis were very cloudy, in contrast to other
brands of amoxicillin that gave solutions of low turbidity. This suggests adulteration with
a filler. The identity of the filler might link this product to other products made by the
same entity (which might not be the stated manufacturer) so we decided to characterize it
further. An insoluble material was recovered by filtration and extensively washed with
water, 1 M NaOH, 0.5 M HCl, methanol, acetonitrile, acetone, toluene, 1-propanol, and
hexane. The lack of solubility of the material suggested it might be a polymer or an
inorganic mineral. Infrared spectroscopy (IR) in the 4000-500 cm-1 range revealed no
bands consistent with organic functional groups (see Figure S2) but was consistent with a
layered magnesium silicate mineral, such as talc. A reference spectrum of talc is shown in
Figure S3. A powder x-ray diffraction (PXRD) pattern was recorded on a representative
Page 22 of 33Analytical Methods
123456789101112131415161718192021222324252627282930313233343536373839404142434445464748495051525354555657585960

23
specimen taken from the unknown powder (Figure S4). Computer fitting of the
diffraction peaks to common talc phases showed the material to be 86% triclinic talc and
14% monoclinic talc. Other common insoluble minerals (SiO2, TiO2 or CaCO3) do not
match the observed diffraction peaks. Gravimetric analysis showed that talc comprised
45% of the capsule contents by mass; the levels of talc are so high that the correct amount
of amoxicillin could never have been placed into the capsules. The real manufacturer of
the product is not confirmed, but regardless of who actually manufactured this
amoxicillin product, it was falsified.
DISCUSSION
New tools are needed to keep substandard antibiotics from reaching patients,
especially in developing countries. There are many studies that show problems with the
quality of beta-lactam antibiotics in LMICs, but insufficient sampling techniques and
sizes hinder tracking of regional prevalence rates. A breakdown for studies that used
HPLC to assay the API content of amoxicillin and ampicillin is listed in Table S1. The
prevalence of bad quality products reported in these peer-reviewed studies ranges from 0-
83% for amoxicillin, and from 15-100% for ampicillin. However, the data sets available
in USP’s Medicines Quality Database20 (Table S2) show that 0-13% of the amoxicillin
samples and 0-4% of the ampicillin samples failed to meet the relevant pharmacopeia
standards.
The large discrepancies among the prevalence rates found by different
investigators indicates that the sample pool of ampicillin and amoxicillin products is
heterogeneous in quality and that current sampling sizes (716 samples collected over 15
Page 23 of 33 Analytical Methods
123456789101112131415161718192021222324252627282930313233343536373839404142434445464748495051525354555657585960

24
years and about 20 countries for the studies considered here) are too small to adequately
capture prevalence rates of low quality products. One contributor to sample heterogeneity
is the large number of brands found in many markets. While most manufacturers are
diligent in applying good manufacturing practices, quality control, and quality assurance,
other manufacturers lack resources to assure quality. They may cut corners to save
money, or purposefully manufacture falsified products. Product quality from a
manufacturer can vary over time if they change suppliers or alter manufacturing
processes. Finally, even if a product meets all quality standards at time of production, it
may degrade in quality after sale due to bad distribution or storage practices, which are
not under the manufacturer’s control. To put a positive spin on this picture, small
increases in capacity for post-market testing could have a large impact in identifying low
quality products for further regulatory attention. The question then becomes how to free
up analytical and regulatory resources in order to conduct such testing.
The aPAD could reduce the cost of detecting substandard ampicillin and
amoxicillin by a factor of 7. The “gold standard” HPLC assay used for post-market
testing of beta lactam antibiotics is expensive and time consuming. A majority of
instrument and analyst time is spent preparing and testing good quality samples in order
to find the bad quality ones. Removing the good quality samples from the HPLC queue
would free up HPLC capacity and allow a concomitant increase in the scale of sample
collection. A meta-review of over 100 studies of pharmaceutical quality estimated that
10% of medicines sold in LMICs are substandard or falsified.3 Based on this estimate, in
a sample of 100 beta lactam products, on average, 10 would be of low quality. If the cost
Page 24 of 33Analytical Methods
123456789101112131415161718192021222324252627282930313233343536373839404142434445464748495051525354555657585960
25
of running an HPLC assay is $250, then the cost per detection of one bad quality product
is $2,500. Based on the accuracy of the aPAD in our validation study, screening the 100
products with the aPAD at a cost of $3 per sample would result in flagging 8 out of 10
bad quality products and 2 out of 90 good quality products for further testing. These 10
products would be sent to the lab for confirmatory assay, which would still cost $2,500.
Including the cost of aPAD screening, eight bad quality products would be detected at a
total cost of $2,800, or $350 per detection of each bad quality product. In addition, the
HPLC would not be tied up with analysis of 90 good quality samples.
The aPAD is suitable for field use. The aPAD requires quantitative sample preparation
followed by degradation and analysis on the test card, which would be easy to perform in
a central drug lab. In a field setting, the glassware and equipment that would be available
in the analytical lab are often absent. We investigated two ways the assay can be
performed without use of volumetric glassware or an analytical balance. Either the
capsule’s contents can be emptied into a liter bottle and 1 mL of water added per mg of
antibiotic stated on the label (i.e., a 500 mg capsule diluted with 500 mL water), or a
portable milligram balance and an automatic pipet can be used. A sufficiently accurate
milligram balance to mass 250 mg and 500 mg antibiotic capsules for the aPAD field
screening assay (Figures S2 and S3) costs about $20 USD. An automatic pipet costs
about $200 USD, but as an alternative, the milligram balance can be used to mass the
solutions. The reagents needed to degrade and acidify the sample (1 M NaOH, 0.0050 M
triiodide, and 1.2 M HCl) can be prepared in a lab and added by weighing aliquots on the
portable milligram balance or measuring them out with a volumetric pipet or automatic
pipet. The back-titration part of the analysis is done using the aPAD card, so the user
Page 25 of 33 Analytical Methods
123456789101112131415161718192021222324252627282930313233343536373839404142434445464748495051525354555657585960
26
does not need to prepare and standardize solutions or have access to titration equipment.8
The reaction rate between the base-degraded amoxicillin and tri-iodide is temperature
dependent, and we found that reaction temperatures between 20-25˚C give the most
reliable PAD readings. For most accurate results, a user who has access to reference
amoxicillin and ampicillin can generate a new set of standards to account for minor
variations in temperature or triiodide concentration. The next best option is to perform the
assay at 20-25C and compare the test card response to the standard images we provided,
which were generated at 21˚C. The cost of materials for the entire aPAD analysis is about
$0.18 USD (Table S4). Starting with capsules of ampicillin or amoxicillin, one analyst
can prepare and analyze about 6 samples per hour using the aPAD.
In a small field study, the aPAD was tested at the Moi Teaching and Referral
Hospital in Eldoret, Kenya using 8 samples of 500 mg amoxicillin capsules purchased in
Kenya. Solutions with nominal 1.00 mg/mL concentrations of amoxicillin were prepared
by emptying the contents of a single capsule (and then dropping both halves of the
capsule into the water to dissolve any residual amoxicillin) in 500 mL of distilled water.
Reagents for the aPAD procedure were massed on a Gemini 20 balance. The nominal
1.00 mg/mL solutions were analyzed on site by HPLC to determine the true amoxicillin
content of the capsule. The results are shown in Figure S4. All samples analyzed were in
the 95% - 110% API range, and the aPAD and the HPLC results had a 1.1% error and a
-0.3% bias. This data illustrates the practicality of conducting the aPAD test accurately in
a low resource setting.
Limitation 1: Access to confirmatory testing and other analytical resources is
necessary to follow up on suspicious products. National drug regulatory agencies have
Page 26 of 33Analytical Methods
123456789101112131415161718192021222324252627282930313233343536373839404142434445464748495051525354555657585960

27
defined procedures for quarantining or recalling products. These actions can have serious
economic and legal consequences for the manufacturer, impose a burden on distributors
and retailers throughout the supply chain, and can reduce access to essential medications
for patients. Initiating regulatory actions requires strong evidence of bad product quality,
normally based on compendial HPLC methods carried out in a certified pharmaceutical
analysis lab. The aPAD would not qualify as a compendial method unless it underwent
careful study by the relevant pharmacopeia organizations. Thus, it can be used as a
screening test but any samples flagged as substandard must undergo confirmatory assay
in an accredited pharmaceutical analysis lab. In addition, finding that a medicine is
substandard leaves some important questions open about why the medicine is
substandard – whether it has degraded, was negligently manufactured, or has been
deliberately adulterated. The answers to these questions, which are usually not provided
by the compendial HPLC assay, may affect the regulatory response. For example,
degradation could focus attention on packaging, distribution, or storage practices, while
adulteration might result in legal actions against a manufacturer. Data from a wide range
of analytical methods, ranging from simple gravimetric analysis to LC-MS or X-ray
crystallography, can shed light on how a poor quality product came to be poor quality,
and help to prevent repetition of the problem. Thus, the aPAD should be seen as the
initial step in a coordinated process that is integrated with existing regulatory and
analytical capacity, rather than a stand-alone solution.
Limitation 2: The aPAD is limited to certain medications. USP <425> has been
validated for 14 beta lactam antibiotics. We have shown that both ampicillin and
Page 27 of 33 Analytical Methods
123456789101112131415161718192021222324252627282930313233343536373839404142434445464748495051525354555657585960
28
amoxicillin assays can be translated to the aPAD card, and we anticipate that the other 12
antibiotics in USP<425> will also work on the card.
The USP method is only validated for monotherapies, but combination capsules
are commonly used to treat resistant bacterial infections. For example, potassium
clavulanate inhibits bacterial beta-lactamase enzymes, and is commonly used as a minor
API in combination with amoxicillin. Clavulanate lacks the thioether group found in
ampicillin and amoxicillin; under base hydrolysis conditions, the thioether is believed to
degrade to a thiol; the thiol undergoes a 6 electron oxidation to a sulfoxide by triiodide in
USP<425>. The reaction stoichiometry was determined by glassware titration following
the USP <425> method (Table S5). After 15 minutes, one mole of degraded amoxicillin
reacts with 5.7 ± 0.2 moles of triiodide, one mole of degraded ampicillin reacts with 5.7 ±
0.7 moles of triiodide, and one mole of degraded clavulanic acid reacts with 0.3 ± 0.2
mole of triiodide. Thus, USP <425> is not effective for detection of clavulanic acid, and
the aPAD is not expected to give accurate detection of clavulanate in combination
amoxicillin/clavulanate products.
Elevated temperatures encountered during shipping and storage may degrade
medications. The test card and iodometric titration fail to accurately quantify amoxicillin
samples that have been exposed to 85°C for 2 days (Table S6 and Table S7) suggesting
the heat and base degradation pathways are different. The titration methods may also fail
to accurately analyze substandard amoxicillin samples if they have been exposed to
temperatures commonly found in the supply chain (~40°C) for long periods of time.
Page 28 of 33Analytical Methods
123456789101112131415161718192021222324252627282930313233343536373839404142434445464748495051525354555657585960

29
Limitation 3: The aPAD cannot detect some API substitutions: Of the studies listed in
Table S1, only Yong performed additional testing on bad quality samples to determine
the remainder of a capsule’s contents. Among 20 bad quality samples, only one API
substitution was identified − an ampicillin sample that contained amoxicillin.21 Although
the aPAD cannot detect substitution of amoxicillin for ampicillin because both have
similar redox activity in the assay, Weaver et. al. designed a qualitative antibiotic test
card that can do so with greater than 95% accuracy.22 The other substitutions investigated
in our validation (e.g., addition of starch or acetaminophen as fillers) gave unusual color
results both on Weaver's card and during the aPAD sample preparation at the stage where
iodine solution was added. In combination, Weaver's qualitative test card and the
quantitative aPAD form a testing system that can detect both API substitution and
substandard API content.
CONCLUSION
The analytical tools for measuring API content of amoxicillin and ampicillin in low
resource settings are very limited.23 In order to find bad quality samples, drug regulatory
agencies currently must spend most of their scarce HPLC capacity testing samples that
meet regulatory API content standards. Using the aPAD as a tool to screen out most of
the good medications could focus HPLC resources on a subset of samples that are more
likely to be bad quality. Because the aPAD has a high accuracy rate and is inexpensive,
the cost for a combined aPAD/HPLC testing regimen would be about 7 times lower than
using HPLC alone. During the validation study, the aPAD detected a brand of amoxicillin
Page 29 of 33 Analytical Methods
123456789101112131415161718192021222324252627282930313233343536373839404142434445464748495051525354555657585960

30
capsules adulterated 1:1 with talc, demonstrating its ability to flag a truly falsified
medication collected from the marketplace.
CONFLICTS OF INTEREST
There are no conflicts of interest to declare.
ACKNOWLEDGMENTS
The United States Pharmacopeial Convention (USP) supported NM through a graduate
research fellowship in 2014-2015. The views expressed here are those of the authors, not
the views of USP. Support for AC was provided by NSF REU Grant 1359342,
Analytical Chemistry for the Developing World. NO was supported by the German
Academic Exchange service ( ISAP Grant 57407165) as part of the bilateral student
exchange program between the universities of Heidelberg and Notre Dame. We
acknowledge the Eck Masters in Global Health program for funding for JS. Collection
and analysis of the pharmaceutical samples was funded by the USAID DIV program
(grant #50709) and the Bill & Melinda Gates Foundation (GCE #01818000148). This
effort was supported in part by the Lilly Endowment through the Medication Safety
Program managed by Purdue University College of Pharmacy. Karibou sana to the secret
shoppers who bought the pharmaceutical samples in Kenya.
1 R. E. Black, S. Cousens, H. L. Johnson, J. E. Lawn, I. Rudan, D. G. Bassani, P. Iha, H. Campbell, C. F. Walker, R. Cibulski, T. Eisele, L. Liu and C. Mathers, Lancet, 2010, 375, 1969-87.2 The GARP-Kenya National Working Group. Situation analysis: Antibiotic Use and Resistance in Kenya, 2011. https://www.cddep.org/wp-content/uploads/2017/06/kenya_full_report_web_15.pdf (accessed June 10, 2019).
Page 30 of 33Analytical Methods
123456789101112131415161718192021222324252627282930313233343536373839404142434445464748495051525354555657585960
31
3 A study on the public health and socioeconomic impact of substandard and falsified medical products. Geneva: World Health Organization; 2017. License: CC BY-NC-SA 3.0 IGO4 2016 United States Pharmacopeia- National Formulary [USP 39 NF 34]. Volume 1. Rockville, MD: United States Pharmacopeia Convention, Inc; 2015. Amoxicillin and Clavulanate Potassium Tablets.5 2016 United States Pharmacopeia- National Formulary [USP 39 NF 34]. Volume 1. Rockville, MD: United States Pharmacopeia Convention, Inc; 2015. Ampicillin Capsules.6 K. E. Boehle, C. S. Carrell, J. Caraway, and C. S. Henry, ACS Sensors, 2019, 3, 1299-13077 2016 United States Pharmacopeia- National Formulary [USP 39 NF 34]. Volume 1. Rockville, MD: United States Pharmacopeia Convention, Inc; 2015. <425> iodometric assay - antibiotics.8 V. A, Robinson-Fuentes, T. M. Jefferies and S. K. Branch, J. Pharm. Pharmacol., 1997, 49, 843–851.9 N. M. Myers, E. N. Kernisan and M. Lieberman, Anal. Chem., 2015, 87, 3764.10 Distributed Pharmaceutical Analysis Lab, Registered 5 April 2019, Available via OSF: https://osf.io/4u3ze11 I. Fadeyi, M. Lalani, N. Mailk, N; A. Van Wyk and H. Kaur, Am. J. Trop. Med. Hyg., 2015, 92, 87–94.12 Y. L. Yong, A. Plancjon, Y. H. Lau, D. M. Hostetler, F. M. Fernandez, M. D. Green, S. Sounvoravong, S. Nara, M. Boravann, T. Dumrong, N. Bangsawan, M. Y. Low, C.-C. Lim, R. L. C. Ai and P. N. Newton, Am. J. Trop. Med. Hyg., 2015, 92, 105–112.13 M. W. Hetzel, M. Page-Sharp, N. Bala, J. Pulford, I. Betuela, T. M. E. Davis and E. K. Lavu, PLoS One 2014, 9, e96810.14 F. Baratta, A. Germano and P. Brusa, Pharmacology, 2012, 53, 173–184.15 U. Hadi, P. Van Den Broek, E. P. Kolopaking, N. Zairina, W. Gardjito and I. C. Gyssens, BMC Infect. Dis., 2010, 10, 1–10.16 S. Kyriacos, M. Mroueh, R. P. Chahine and O. Khouzam, J. Clin. Pharm. Ther. 2008, 33, 375–379.17 P. C. Kayumba, P. G. Risha, D. Shewiyo, A. Msami, G. Masuki, D. Ameye, G. Vergote, J. D. Ntawukuliryayo, J. P. Remon and C. Vervaet, J. Clin. Pharm. Ther. 2004, 29, 331–338.18 R. B. Taylor, O. Shakoor, R. H. Behrens, M. Everard, A. S. Low, J. Wangboonskul, R. G. Reid, J. A. Kolawole, Lancet, 2001, 357, 1933.19 Wondemagegnehu, E. Counterfeit and Substandard Drugs in Myanmar and Viet Nam, 1999. http://apps.who.int/medicinedocs/pdf/s2276e/s2276e.pdf (accessed June 19, 2019).20 Medicines Quality Database. United States Pharmacopeial Convention. http://www.usp.org/global-public-health/medicines-quality-database (accessed June 19, 2019)21 Y. L. Yong, A. Plancjon, Y. H. Lau, D. M. Hostetler, F. M. Fernandez, M. D. Green, S. Sounvoravong, S. Nara, M. Boravann, T. Dumrong, N. Bangsawan, M. Y. Low, C.-C. Lim, R. L. C. Ai and P. N. Newton, Am. J. Trop. Med. Hyg., 2015, 92, 105–112.22 A. Weaver, H. Reiser, T. L. O. Barstis, M. Benvenuti, D. Ghosh, M. Hunckler, B. Joy, L. Koenig, K. Raddell and M. Lieberman, Anal. Chem., 2013, 85, 6453–6460.
Page 31 of 33 Analytical Methods
123456789101112131415161718192021222324252627282930313233343536373839404142434445464748495051525354555657585960

32
23 Kovacs S, Hawes SE, Maley SN, et al. Technologies for detecting falsified and substandard drugs in low and middle-income countries. 2014. PloS One 9: e90601.
Page 32 of 33Analytical Methods
123456789101112131415161718192021222324252627282930313233343536373839404142434445464748495051525354555657585960

A paper analytical device can detect substandard ampicillin or amoxicillin capsules in low-resource settings.
1057x793mm (72 x 72 DPI)
Page 33 of 33 Analytical Methods
123456789101112131415161718192021222324252627282930313233343536373839404142434445464748495051525354555657585960