Biological Assay Package - PLA 3.0
396
Reference Guide Biological Assay Package Version: 26 July 19, 2019 STEGMANN SYSTEMS GmbH | Raiffeisenstr. 2 | 63110 Rodgau, Germany Fon: +49 6106 77010-0 | Fax: +49 6106 77010-190 | [email protected] www.stegmannsystems.com | www.bioassay.de | www.aps-info.de
-
Upload
khangminh22 -
Category
Documents
-
view
0 -
download
0
Transcript of Biological Assay Package - PLA 3.0

Reference Guide
Biological Assay PackageVersion: 26
July 19, 2019
STEGMANN SYSTEMS GmbH | Raiffeisenstr. 2 | 63110 Rodgau, Germany Fon: +49 6106 77010-0 | Fax: +49 6106 77010-190 | [email protected] www.stegmannsystems.com | www.bioassay.de | www.aps-info.de

Contents1 Introduction.................................................................................................................................................................... 5
1.1 Updating the Biological Assay Package................................................................................................... 6
1.2 Using this Reference guide............................................................................................................................6
1.3 Navigating the Element reference.............................................................................................................. 6
2 Quantitative response assays.................................................................................................................................. 8
2.1 Assay elements................................................................................................................................................... 9
2.2 Calculation.......................................................................................................................................................... 10
2.2.1 Regression analysis...............................................................................................................................12
2.2.2 Analysis of variance (ANOVA).......................................................................................................... 13
2.2.3 Potency calculation...............................................................................................................................14
2.2.4 Test system...............................................................................................................................................16
2.2.4.1 Equivalence tests (test of similarity)............................................................................... 17
2.2.4.2 Point estimate tests...............................................................................................................18
2.2.4.3 F-tests..........................................................................................................................................18
2.2.4.4 Additional tests....................................................................................................................... 18
2.2.5 Configuration optimization............................................................................................................... 19
2.3 Concepts for efficient setup........................................................................................................................20
2.3.1 Preparation schemes............................................................................................................................20
2.3.2 Data selection schemes......................................................................................................................21
2.3.3 Suitability tests....................................................................................................................................... 22
2.3.4 Observation group ID......................................................................................................................... 22
2.4 Data aggregation.............................................................................................................................................23
2.5 Literature............................................................................................................................................................. 24
2.6 Reports................................................................................................................................................................. 25
3 Dichotomous assay................................................................................................................................................... 26
3.1 Assay elements.................................................................................................................................................26
3.2 Calculation.......................................................................................................................................................... 27
3.2.1 Regression analysis...............................................................................................................................28
3.2.2 Potency calculation...............................................................................................................................28
3.2.3 Test system...............................................................................................................................................30
3.2.3.1 Chi-square tests......................................................................................................................31
3.2.3.2 Additional tests....................................................................................................................... 31
3.3 Concepts for efficient setup........................................................................................................................32
Reference Guide | Biological Assay Package Version 26 | DP002© 2019 Stegmann Systems GmbH, Rodgau, Germany 2

3.3.1 Preparation schemes............................................................................................................................32
3.3.2 Suitability tests....................................................................................................................................... 33
3.3.3 Observation group ID......................................................................................................................... 33
3.4 Literature............................................................................................................................................................. 34
4 Combination of assay results................................................................................................................................35
4.1 Combination groups...................................................................................................................................... 37
4.2 Test system.........................................................................................................................................................38
4.3 Data aggregation.............................................................................................................................................38
4.4 Literature............................................................................................................................................................. 38
5 Equivalence margin development.......................................................................................................................39
5.1 Literature............................................................................................................................................................. 39
6 Basic bioassay protocol...........................................................................................................................................40
6.1 General workflow.............................................................................................................................................40
6.2 Templates............................................................................................................................................................ 41
6.3 Execution modes..............................................................................................................................................41
6.3.1 Assay replicate mode.......................................................................................................................... 42
6.3.2 Assay element mode........................................................................................................................... 42
6.4 Combination calculations.............................................................................................................................44
6.4.1 Specify a combination calculation................................................................................................. 44
7 Control chart................................................................................................................................................................46
7.1 Templates............................................................................................................................................................ 46
7.2 User-defined control charts........................................................................................................................ 47
7.3 Concepts..............................................................................................................................................................47
7.4 Data aggregation.............................................................................................................................................47
8 Test system definition.............................................................................................................................................. 49
9 Common features...................................................................................................................................................... 50
9.1 Document Name, Identification, and Date........................................................................................... 50
9.2 Documentation section.................................................................................................................................50
9.3 Data table........................................................................................................................................................... 51
9.4 Data aggregation.............................................................................................................................................57
9.5 Graphical representation.............................................................................................................................. 57
9.6 Comment section............................................................................................................................................ 58
9.7 Digest of document properties for data aggregation......................................................................59
10 Document element reference.............................................................................................................................77
10.1 Quantitative response assay.....................................................................................................................77
3

10.1.1 Document outline...............................................................................................................................77
10.1.2 Document structure...........................................................................................................................78
10.2 Dichotomous assay...................................................................................................................................... 96
10.2.1 Document outline...............................................................................................................................96
10.2.2 Document structure...........................................................................................................................96
10.3 Combination of assay results................................................................................................................ 102
10.3.1 Document outline............................................................................................................................ 102
10.3.2 Document structure........................................................................................................................ 103
10.4 Equivalence margin development....................................................................................................... 106
10.4.1 Document outline............................................................................................................................ 106
10.4.2 Document structure........................................................................................................................ 107
10.5 Basic bioassay protocol............................................................................................................................121
10.5.1 Document outline............................................................................................................................ 121
10.5.2 Document structure........................................................................................................................ 121
10.6 Control chart.................................................................................................................................................126
10.6.1 Document outline............................................................................................................................ 126
10.6.2 Document structure........................................................................................................................ 126
10.7 Test system definition...............................................................................................................................127
10.7.1 Document outline............................................................................................................................ 127
10.7.2 Document structure........................................................................................................................ 127
10.8 Element reference.......................................................................................................................................139
4

Reference Guide | Biological Assay Package Version 26
1 IntroductionThe Biological Assay Package for the PLA 3.0.4 platform organizes data, processes, and resultsinto documents. It supersedes the biological assay features of the PLA 2.x system.
The Biological Assay Package provides various document types that broadly correspond to thefollowing three functional areas:
• Assay documents
• Advanced calculations
• Supporting documents
Each document type is designed to support you in the completion of a specific task, such as astatistical calculation or the documentation of an assay.
We support the following assay document types:
Note: Additional document types may be available in your database.
Quantitative response assay (QRA)
Covers all biological assay types that are based on quantitative response, that is,parallel-line, parallel logistic (full curve fits), and slope ratio assays.
Dichotomous assay (DTA)
Calculates the potency of test samples based on binary input values such as thefraction of specimen that exhibits one of two possible responses. Dichotomous assays arealso referred to as binary or quantal response assays.
We support the following advanced calculation document types:
Combination of assay results (COA)
Provides a range of methods to combine the results of independent assays.
Equivalence margin development (EMD)
Exploits data of existing assays to calculate candidates for equivalence margins. Youcan then leverage candidates in the test systems of Quantitative response assays.
We support the following supporting document types:
Basic bioassay protocol (BBP)
Provides a general workflow and specifies processes to produce reportable valuesfrom independent assays.
5

Control chart (CC)
Provides trending for various parameters.
Test system definition (TSD)
Provides a collection of suitability tests and corresponding margins for Quantitativeresponse assays.
1.1 Updating the Biological Assay PackageFuture updates of the Biological Assay Package may not require updates of the PLA 3.0.4platform and may occur more frequently.
We recommend to periodically check https://www.bioassay.de for updates and fixes.
1.2 Using this Reference guideThis Reference guide covers all document types provided by the Biological Assay Package. It isintended for users and functional administrators of PLA.
The Reference guide consists of two major parts, a descriptive and a reference part. Thedescriptive part explains major features of the Biological Assay Package and its document typesand guides you to more detailed information on particular document elements provided in thereference part.
Outline of descriptive part: Major features of the Biological Assay Package and itsdocument types
• Sections named after document types: Describe major features of each document type.
• Common features section: Compares features common to several document types.
• Digest of document properties for data aggregation: Lists all properties available for dataaggregation.
Outline of reference part: Document element reference
• Subsections named after document types: Provide document outlines and structures for eachdocument type. Use the Document structures to navigate the Element reference.
• Element reference subsection: Holds information on individual elements for all documenttypes.
1.3 Navigating the Element reference
Use the following finding aids to access reference information on particular elements:
• Hyperlinks provided in the descriptive part of this Reference guide
6

Reference Guide | Biological Assay Package Version 26
• Document outlines and structures provided in the Document element reference section of thisReference guide
• Search features of your web browser or PDF reader
ExampleThe following example explains how you use the Document structures provided in this guide tonavigate the Element reference.
To access detailed information on equivalence tests for quantitative response assays:
1. Navigate to the Document structure of quantitative response assays: Document elementreference > Quantitative response assay > Document structure
2. Find the equivalence test, such as Difference of parameter estimates, in the Documentstructure: Analysis > Suitability tests > Assay suitability tests > Equivalence tests: Differenceof parameter estimates
3. Click the link to display the element reference.
4. Return to the Document structure to find detailed information on other elements.
Note: The Document structures provided in this Reference guide mimic the layout ofdocuments displayed in the Content editor of PLA. Elements are listed in the same hierarchicalorder. The Element reference of this guide is not arranged in this order.
7

2 Quantitative response assaysQuantitative response assays allow you to calculate relative potencies of Test samples comparedto a Standard sample.
You can also determine absolute potencies based on several types of calculations if you provideinformation on the stock solutions or raw materials.
Quantitative response assays are dilution assays that require at least one Standard sample(reference) and one Test or Control sample to calculate potency. They usually involve a rangeof assay elements with data measured at different dilutions (or concentrations) of the activeingredient. The formula used to calculate relative potencies depends on the assay type.
We currently support the following Quantitative response assay types:
• Parallel-line assay
• Parallel logistic assay (full curve fit)
• Slope ratio assay
Note: Dichotomous assays (binary assays, quantal response assays) are also available in theBiological assay package. We have implemented them as a separate document type because thenature of their response values differs. While quantitative response is measured on a continuousscale provided, for example, by light absorbance or fluorescence, dichotomous response ismeasured as all or none (responded versus did not respond).
Parallel-line assayCalculates relative potencies based on the linear portion of dose-response curves.
The dose axis is logarithmic. Relative potencies correspond to shifts of the curves alongthe dose axis. This assay type supports selection and automatic optimization of the linearportion of the curve (configuration optimization).
Figure 1: Parallel-line assay
Parallel logistic assay (full curve fit)Uses the entire sigmoidal curve to represent dose-response correlations and calculaterelative potencies.
8

Reference Guide | Biological Assay Package Version 26
This assay type is most commonly used with the 4-parameter logistic fit function. Its fourparameters describe a symmetric sigmoidal curve with the upper asymptote given by theA parameter and the lower asymptote by the D parameter.
Variants are the 5-parameter fit function, which adds an asymmetry parameter (G), and the3-parameter fit function, which is structurally identical to the 4-parameter logistic fit butkeeps either the lower or upper asymptote at a fixed value or at the mean of a control line.
Figure 2: Parallel logistic assay (full curve fit)
Slope ratio assayUses an untransformed dose axis.
This assay type calculates potencies from the ratio of the slopes of the linear regressions. Itis normally used with very small doses.
Figure 3: Slope ratio assay
2.1 Assay elementsAssay elements are the building blocks of an assay.
Quantitative response assay documents contain four types of assay elements: The Standardsample, Test samples, Control samples, and Control lines.
9

Assay document
Standard sample
1 (required) 0..n (optional)
0..n (optional) 0..n (optional)
Test sample(s)
Control sample(s) Control line(s)
Figure 4: Assay element types
Standard sampleProvides the reference standard of the assay document. You calculate relative potencies incomparison to this assay element. A Standard sample consists of a series of measurementsat various dilutions (or concentrations).
Note: Every assay document must have exactly one Standard sample element.
Test sampleProvides the data to be evaluated by the assay document. You calculate the relativepotencies of these assay elements. A Test sample consists of a series of measurements atvarious dilutions (or concentrations).
Note: The Test sample element is optional. But every assay document must have atleast one Test or Control sample. You can add as many Test samples as you like.
Control sampleProvides the basis of assay acceptance tests. Control samples are Test samples that are'well known'. A Control sample consists of a series of measurements at various dilutions(or concentrations).
Note: The Control sample element is optional. But every assay document must haveat least one Control or Test sample. You can add as many Control samples as you like.
Control lineProvides an undiluted control value which is usually displayed as a line in an assay chart.Use Control lines for response adjustment, such as blank deduction, positive control, andnegative control, or as basis for restricting an asymptote in full curve fits (3-parameter fits).
Note: The Control line element is optional. You can add as many Control lines as youlike.
2.2 CalculationCalculations of assay documents consist of several steps that are described below.
10

Reference Guide | Biological Assay Package Version 26
Assay definition Assay document with results
Response adjustment
Data transformation
Outlier detection
Regression analysis
Analysis of variance
Potency calculation
Test system
Optional step
Figure 5: Common steps in Quantitative response assay calculations
Note: You can run the calculation once you have completely set up the assay document.Results of the calculation are added to the assay document.
1. Response adjustment (optional step): Subtracts a specified value from the response values.You can either manually enter a value or derive it from the mean of a control line you select.
2. Data transformation (optional step): Addresses issues related to heteroscedasticity. If yourresponse data is not homoscedastic and follows a trend, you have the following Responsetransformation options available: Logarithmic, Square, Square root.
3. Outlier detection (optional step): Supports replicate-based outlier detection (Dixon, Grubbs,and Standard deviation tests) and model-based outlier detection (Studentized residuals test).Statistical outliers are flagged and excluded from further analysis. You can execute outliertests iteratively and adjust their sensitivity.
Tip: A range of suitability tests is available to ensure results are valid.
4. Regression analysis: Runs two regressions using a full and a restricted model. Please consultthe Regression analysis section for help.
5. Analysis of variance: Use ANOVA to determine sources of variation in statistical models.ANOVA has several methods to estimate variance in the data. Please consult the Analysis ofvariance (ANOVA) section for help.
11

6. Potency calculation: The primary goal of Quantitative response assays is to calculate relativepotencies of Test samples compared to a Standard sample. Please consult the Potencycalculation section for help.
7. Test system: Assays are based on curve similarity. This provides the opportunity to check thevalidity of calculations every time they are performed. Please consult the Test system sectionfor help.
2.2.1 Regression analysisRegression analysis runs two regressions using a full and a restricted model.
Full regression modelFinds the best fit for the system. Regression parameters are defined separately for theStandard and each Test sample.
Restricted regression modelFocuses the regression on relative potency. The restricted model approximates theStandard sample and Test samples together. Only the regression parameter used todetermine relative potency is assumed to differ. Other regression parameters are assumedto be equal in the Standard and Test samples.
Note: The difference between full and restricted model is used to analyze the suitability of asystem in suitability testing (see last step of calculation).
Regression models
We currently support the following regression models:
• Parallel-line assay (linear parallel-line)
• 4-parameter logistic fit
• 5-parameter logistic fit
• 3-parameter logistic fit (fixed upper asymptote)
• 3-parameter logistic fit (fixed lower asymptote)
• Slope ratio assay
Table 1. Examples of restricted regression models
Regression model Number ofparameters
Parameters equal inStandard and Testsamples
Differentiatingparameters
Parallel-line assaywith one Testsample
3 slope y-intercept of theStandard sample, y-intercept of the Testsample
12

Reference Guide | Biological Assay Package Version 26
Parallel-line assaywith three Testsamples
5 slope y-intercept of theStandard sample, 3y-intercepts of the 3Test samples
4-parameter logisticfit with one Testsample
5 upper asymptote,lower asymptote,slope
inflection point ofthe Standard sample,inflection point of theTest sample
4-parameter logisticfit with three Testsamples
7 upper asymptote,lower asymptote,slope
inflection point of theStandard sample, 3inflection points ofthe 3 Test samples
Simultaneous regressionQuantitative response assays normally perform all assay regressions one by one, that is, allregression is done in pairs. In the case of simultaneous regression, all regressions are performedtogether in a single model.
Tip: This type of assay allows you to address incomplete data in individual assay elements.
Note: If you use simultaneous regression with the configuration optimizer, you create a verylarge number of configurations. Your system may not be able to calculate all configurations in atimely manner.
Include control lineYou can include Control lines in regression models for 4-parameter logistic fit and slope ratio.
Note: If you include control lines, an additional semi-restricted regression is performed. Thisadds an additional term to the analysis of variance.
2.2.2 Analysis of variance (ANOVA)Use Analysis of variance (ANOVA) to determine sources of variation in statistical models.
ANOVA has several methods to estimate variance in the data. It then tests to what extent theresults agree. ANOVA decomposes the total error as follows.
Pure-error ANOVA
Pure-error ANOVA decomposes:
• total error into pure error and treatment error
• treatment error into preparation, non-parallelism, regression, and lack-of-fit error
13

Total error
Pure error
Treatment error
Preparation error
Non-parallelism error
Regression error
Lack-of-fit error
Figure 6: Pure-error ANOVA
Residual-error ANOVA
Residual-error ANOVA decomposes:
• total error into residual error and model error
• residual error into pure error and lack-of-fit error
• model error into preparation, non-parallelism, and regression error
Total error
Residual error
Model error
Pure error
Lack-of-fit error
Preparation error
Non-parallelism error
Regression error
Figure 7: Residual-error ANOVA
2.2.3 Potency calculationThe primary goal of Quantitative response assays is to calculate relative potencies of Testsamples compared to a Standard sample. You can also determine absolute potencies if youprovide information on stock solutions or raw materials. In this case, assays still calculate relativepotencies first and then perform calculations to determine absolute potencies.
14
Reference Guide | Biological Assay Package Version 26
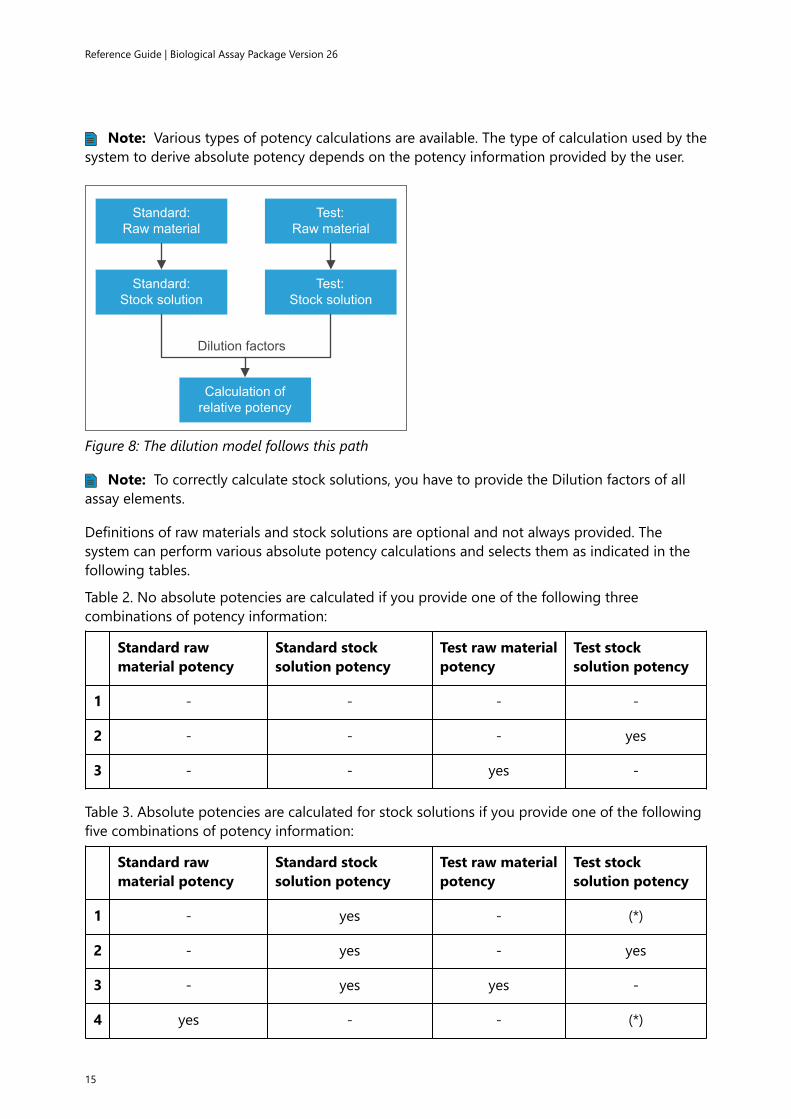
Note: Various types of potency calculations are available. The type of calculation used by thesystem to derive absolute potency depends on the potency information provided by the user.
Standard:Raw material
Standard:Stock solution
Test:Raw material
Test:Stock solution
Calculation of relative potency
Dilution factors
Figure 8: The dilution model follows this path
Note: To correctly calculate stock solutions, you have to provide the Dilution factors of allassay elements.
Definitions of raw materials and stock solutions are optional and not always provided. Thesystem can perform various absolute potency calculations and selects them as indicated in thefollowing tables.
Table 2. No absolute potencies are calculated if you provide one of the following threecombinations of potency information:
Standard rawmaterial potency
Standard stocksolution potency
Test raw materialpotency
Test stocksolution potency
1 - - - -
2 - - - yes
3 - - yes -
Table 3. Absolute potencies are calculated for stock solutions if you provide one of the followingfive combinations of potency information:
Standard rawmaterial potency
Standard stocksolution potency
Test raw materialpotency
Test stocksolution potency
1 - yes - (*)
2 - yes - yes
3 - yes yes -
4 yes - - (*)
15

5 yes - - yes
* If you provide potency information on the raw material or stock solution of the Standardsample and do not provide any potency information on the raw material or stock solution of theTest sample, the stock solution potency of the Test sample is assumed to be 1.
Table 4. Absolute potencies are calculated for raw materials if you provide the followingcombination of potency information:
Standard rawmaterial potency
Standard stocksolution potency
Test raw materialpotency
Test stocksolution potency
1 yes - yes -
2.2.4 Test systemAssays are based on curve similarity. This provides the opportunity to check the validity ofcalculations every time they are performed.
We recommend to have at least the following tests to ascertain valid results:
• one parallelism test or
• one test for each parameter of the standard curve and one test for each parameter assumedto be similar in the restricted regression model comparing the parameter of standard sampleand test sample
Test system logic
The test system allows you to set up sophisticated tests. The following three properties arerelevant to the test system logic:
• Test level (assay or sample)
• Severity level of the test
• Scope of the test
Test level (assay or sample)The test system distinguishes between Assay suitability tests and Sample suitability tests:
• Assay suitability test: If the test fails, all Test samples of the assay fail.
• Sample suitability test: If the test fails, only the related Test sample fails.
Tip: Set up Assay suitability tests for (well-known) Control samples. If these tests fail, theresults for all Test samples in the assays fail.
Severity level of the test
Table 5. Assays provide three severity level options. The highest severity level among failed testsdetermines how assay results are handled:
Highest severity level among failed tests Impact on assay results
16
Reference Guide | Biological Assay Package Version 26
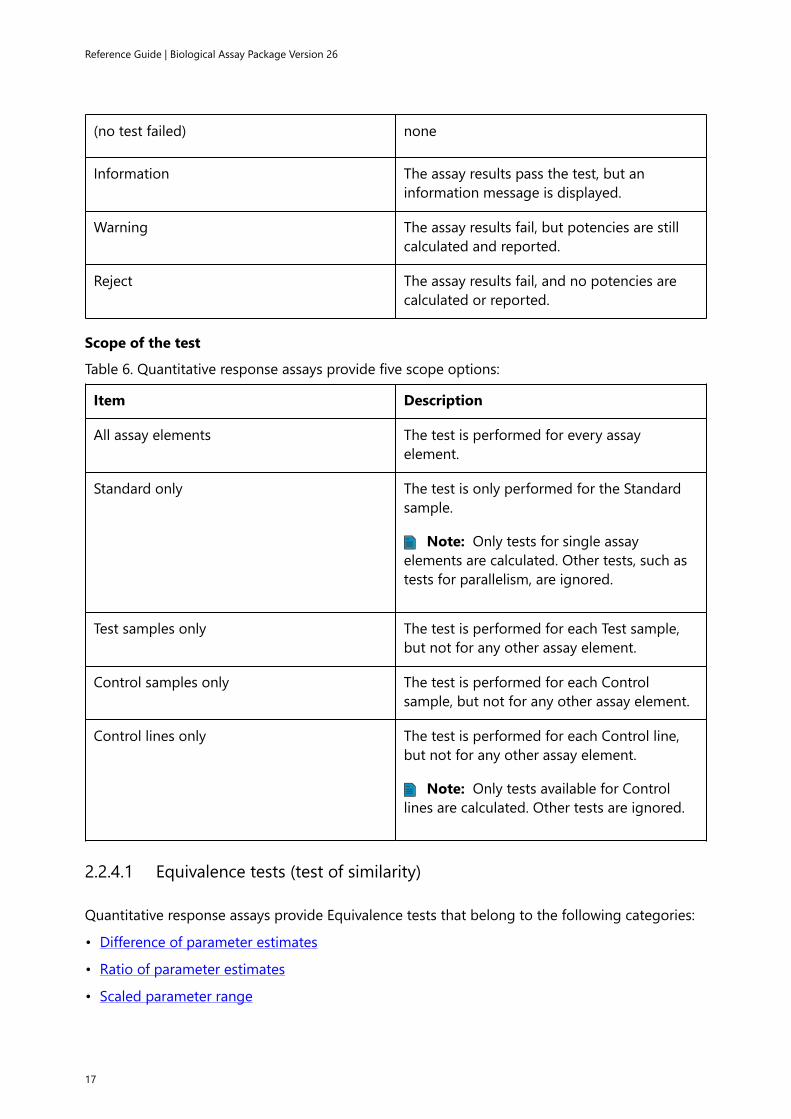
(no test failed) none
Information The assay results pass the test, but aninformation message is displayed.
Warning The assay results fail, but potencies are stillcalculated and reported.
Reject The assay results fail, and no potencies arecalculated or reported.
Scope of the test
Table 6. Quantitative response assays provide five scope options:
Item Description
All assay elements The test is performed for every assayelement.
Standard only The test is only performed for the Standardsample.
Note: Only tests for single assayelements are calculated. Other tests, such astests for parallelism, are ignored.
Test samples only The test is performed for each Test sample,but not for any other assay element.
Control samples only The test is performed for each Controlsample, but not for any other assay element.
Control lines only The test is performed for each Control line,but not for any other assay element.
Note: Only tests available for Controllines are calculated. Other tests are ignored.
2.2.4.1 Equivalence tests (test of similarity)
Quantitative response assays provide Equivalence tests that belong to the following categories:
• Difference of parameter estimates
• Ratio of parameter estimates
• Scaled parameter range
17

• Single-parameter estimates
2.2.4.2 Point estimate tests
Quantitative response assays provide Point estimate tests that belong to the followingcategories:
• Difference of parameter estimates
• Ratio of parameter estimates
• Single-parameter estimates
2.2.4.3 F-tests
Quantitative response assays provide various F-tests:
• Significance of regression
• Significance of non-parallelism
• Significance of non-linearity (lack of fit)
• Significance of non-similarity (only used for slope ratio model)
• Significance of the slope
• Significance of square coefficient
Custom F-tests:
• Significance of square coefficient (assay scope)
• Significance of the difference of the quadratic full vs. restricted (assay scope)
• Significance of preparation (used for linear parallel-line model, 4-parameter model withoutblank inclusion, and 5-parameter model)
Please consult the F-test (hypothesis test) section in the Element Reference for help on thevarious tests.
2.2.4.4 Additional testsQuantitative response assays provide a range of additional tests.
• Normalized difference of asymptotes
• Sum-of-squares regression
• Sum-of-squares non-parallelism
• Sum-of-squares non-linearity
• Ratio sum-of-squares non-linearity to sum-of-squares regression
• Potency value
• Potency confidence interval
18

Reference Guide | Biological Assay Package Version 26
• Log potency range
• Potency of intermediate dilution
• Potency confidence interval (%)
• Potency range (%)
• Maximal number of outliers
• Maximal sequence step CV (%)
• Minimal R²
• Relative LOF error (%)
• Response value range
• Weight (W)
2.2.5 Configuration optimizationThe configuration optimizer allows you to automatically detect the linear portion of dose-response curves.
Optimization on: Calculates all possible configurations of dilution steps as defined in theoptimization settings.
Important: If you turn on configuration optimization, but do not set it up properly, youmay create a very large number of configurations. Your system may not be able to calculate allconfigurations in a timely manner.
Note: Range optimization is only performed with the linear parallel-line model.
Note: If your optimization settings cause no configurations to remain for testing, the assayis calculated with deactivated range optimizer. A warning message is displayed in the calculationdialog and added to the report.
Parameters
Tip: You can set the parameters separately for each assay element.
Table 7. The following parameters define how configuration optimization is performed:
Parameter Description
Configuration optimizerallocation range
• Maximum range: Finds the maximum range where allsuitability tests are passed.
• Best range: Finds the best range for regression using Rsquared.
Range full/Range partialoptions
• Range full: Considers all points.
• Range partial: Only considers a subset of the points.
19

Identical range • false: Considers all configurations.
• true: Only considers configurations whose Standard andTest samples have identical step numbers.
Identical treatment number(identical effective step count)
• false: Considers all configurations.
• true: Only considers configurations with identicaltreatment numbers.
50 percent response • Ignore 50 percent response: Considers all configurations.
• Include 50 percent response: Only considersconfigurations that include the 50-percent value.
Number of steps • Minimal number of steps: Considers configurationswhose Step count is not less than the number you enter.
• Exact number of steps: Considers configurations whoseStep count is equal to the number you enter.
Important: The settings available for configuration optimization in PLA 3.0 differ from thosein PLA 2.x. To use some property combinations available in PLA 2.1, you have to split assays intoseveral assay documents in PLA 3.0.
2.3 Concepts for efficient setup
The structure of assays is based on the following concepts that allow you to set up assaydocuments more efficiently.
• Preparation schemes
• Data selection schemes
• Suitability tests
• Observation group ID
2.3.1 Preparation schemes
For most assays, you prepare all or at least some assay elements in the same way. The Stepcount (number of dilution steps), Replicate count, and other properties are identical. Preparationschemes allow you to define preparations once and assign them to as many assay elements asyou like. You do not have to enter redundant information.
Note: Each assay element must have a Preparation scheme assigned. And each assaydocument must contain at least one Preparation scheme.
20

Reference Guide | Biological Assay Package Version 26
ExampleIn a 3-by-3 parallel-line assay, all assay elements have 3 dose steps and 3 replicates. Youtherefore add a Preparation scheme to the assay, give it a meaningful name, such as '3x3preparation scheme', and enter the values you need for Step count, Replicate count, Dilutionfactors, and so on. Once you have completed the Preparation scheme, you navigate to thePreparation scheme entry of each assay element and select the '3x3 preparation scheme' optionfrom the drop-down list.
Properties
Table 8. Preparation schemes have the following properties:
Item Description
Name Enter a name for the preparation scheme.
Step count Enter a number.
Replicate count Enter a number.
Absolute potency Select one of the following options:
• Not defined
• Defined by stock solution
• Defined by raw material
Dilution factors Add a Dilution factor element to the assay,and then enter a value for the dilution factor.
Dose sequence Select one of the following options:
• n-fold geometrical sequence (default):Enter values for First dose and Base.
• Linear sequence (mostly for slope ratioassays): Enter values for First dose andDelta.
• Defined sequence: Add a Dose valueelement, and then enter a value.
2.3.2 Data selection schemesData selection schemes define which data are considered in the analysis.
You can select, for example, which data points or dilution steps are included. The default Dataselection scheme simply selects all data points.
Note: Each assay element must have a Data selection scheme assigned. And each assaydocument must contain at least one Data selection scheme.
21

Properties
Table 9. Data selection schemes have the following properties:
Item Description
Name Enter a name for the preparation scheme.
Outlier detection Select one of the following options:
• No outlier detection
• Dixon test
• Grubbs test
• (Externally) studentized residuals
• Standard deviation test
Range selection Select one of the following options:
• Range full (default)
• Range partial
Configuration optimization Select one of the following options:
• Optimization off (default)
• Optimization on
See also the Configuration optimizationsection.
2.3.3 Suitability tests
We recommend to set up suitability tests for every assay. See the Test system section for moreinformation on how to add tests to your assays.
Note: If you do not add any tests, you can still calculate relative potencies, but you cannotcheck their validity.
Tip: Instead of adding tests to your assay documents, you can set up separate Test systemdefinition documents and use Test system references to link them to your assays.
2.3.4 Observation group IDThe Observation group IDs provide the link between assay elements and observation data.
22

Reference Guide | Biological Assay Package Version 26
Each assay element has an Observation group ID assigned. In the Observations editor,Observation group IDs serve as references to assay elements.
This concept allows you to change how positions are assigned on plates, for example. You simplyedit the Observation group IDs of assay elements.
2.4 Data aggregationYou can use Quantitative response assay documents as source documents for data aggregationby referencing them, for example, in a Control chart document.
The data values that can be aggregated into the target document (in the example above, theControl chart document) are provided through the Digest. You can think of the Digest as a list ofall the document properties that can be used for data aggregation.
The following figure shows the basic process:
23

Measurement documentsBiological assay documents
Digest
Quantitative response assay
documents
Control chart document
datavalues
data aggregation filters
documentproperties
documentproperties
Figure 9: Role of the Digest in the data aggregation process
The Digest is built up from document properties of Biological assay and Measurementdocuments. Each time you save such a document or import a document package, the relateddata values are updated.
The data aggregation logic is set up in the target document. Data aggregation filters use thekeys of document properties to retrieve data values and documents that match the filter criteria.
A list of all document properties and their keys for data aggregation is provided in the Digest ofdocument properties for data aggregation section.
2.5 Literature• Council of Europe. European pharmacopoeia 6.0. Chapter 5.3: Statistical analysis of results of
biological assays and tests. Strasbourg: 2008.
• Dixon, Wilfrid J. 1953. 'Processing data for outliers.' Biometrics 9 (1): 74-89.
• Finney, David J. 1978. Statistical method in biological assay, 3rd edition. London: Charles Griffinand Company Ltd.
• Grubbs, Frank E. 1969. 'Procedures for detecting outlying observations in samples.'Technometrics 11 (1): 1-21.
• Rorabacher, David B. 1991. 'Statistical treatment for rejection of deviant values: Critical valuesof Dixon's "Q" parameter and related subrange ratios at the 95% confidence level.' AnalyticalChemistry 63 (2): 139–146.
24

Reference Guide | Biological Assay Package Version 26
• United States Pharmacopeial Convention. United States Pharmacopeia. Rockville (MD): 2012.
◦ Design and analysis of biological assays. USP 35 <111>: 106-117.
◦ Design and development of biological assays. USP 35 (1st supplement) <1032>: 5160-5174.
◦ Biological assay validation. USP 35 (1st supplement) <1033>: 5174-5185.
◦ Analysis of biological assays. USP 35 (1st supplement) <1034>: 5186-5195.
◦ Appendix: Glossary. USP 35 (1st supplement): 5195-5200.
2.6 ReportsDocument type-specific reports describe the content and the results of an executed calculation.
Compact reportProvides observation tables, suitability tests, and potency results for all assay elements.
Detailed reportProvides all information required to fully document your assays.
Detailed report (compact test output)Provides all information of the Detailed report but uses test result formatting of theCompact report. Improves presentation of data produced by Equivalence margindevelopment documents that have many tests.
Advanced detailed reportProvides all information of the Detailed report plus details on the configurationoptimization process.
25

3 Dichotomous assayDichotomous assays allow you to calculate relative potencies of Test samples compared to aStandard sample.
You can also determine absolute potencies based on several types of calculations if you provideinformation on the stock solutions or raw materials.
Dichotomous assays are dilution assays that require at least one Standard sample (reference)and one Test or Control sample to calculate potency. They usually involve a range of assayelements with data measured at different dilutions (or concentrations) of the active ingredient.You can use the Logit or Probit method to calculate relative potencies.
Dichotomous assays analyze data you collect in binary form: Of a total number of specimen (n),a measurable number of specimen (m) shows a specified response while the rest does not showthis response. You provide both n and m for analysis.
3.1 Assay elementsAssay elements are the building blocks of an assay.
Dichotomous assay documents contain three types of assay elements: The Standard sample, Testsamples, and Control samples.
Assay document
Standard sample
1 (required) 0..n (optional)
0..n (optional)
Test sample(s)
Control sample(s)
Figure 10: Assay element types
Standard sampleProvides the reference standard of the assay document. You calculate relative potencies incomparison to this assay element. A Standard sample consists of a series of measurementsat various dilutions (or concentrations).
Note: Every assay document must have exactly one Standard sample element.
Test sampleProvides the data to be evaluated by the assay document. You calculate the relativepotencies of these assay elements. A Test sample consists of a series of measurements atvarious dilutions (or concentrations).
26

Reference Guide | Biological Assay Package Version 26
Note: The Test sample element is optional. But every assay document must have atleast one Test or Control sample. You can add as many Test samples as you like.
Control sampleProvides the basis of assay acceptance tests. Control samples are Test samples that are'well known'. A Control sample consists of a series of measurements at various dilutions(or concentrations).
Note: The Control sample element is optional. But every assay document must haveat least one Control or Test sample. You can add as many Control samples as you like.
3.2 CalculationCalculations of assay documents consist of several steps that are described below.
Assay definition Assay document with results
Data transformation
Regression analysis
Analysis of variance
Potency calculation
Test system
Figure 11: Common steps in Dichotomous assay calculations
Note: You can run the calculation once you have completely set up the assay document.Results of the calculation are added to the assay document.
1. Data transformation: Provides logarithmic transformation of the dose.
2. Regression analysis: Runs two regressions using a full and a restricted model. Please consultthe Regression analysis section for help.
3. Analysis of variance: Use ANOVA to determine sources of variation in statistical models.ANOVA has several methods to estimate variance in the data.
4. Potency calculation: The primary goal of Dichotomous assays is to calculate relative potenciesof Test samples compared to a Standard sample. Please consult the Potency calculationsection for help.
27

5. Test system: Assays are based on curve similarity. This provides the opportunity to check thevalidity of calculations every time they are performed. Please consult the Test system sectionfor help.
3.2.1 Regression analysisRegression analysis runs two regressions using a full and a restricted model.
Full regression modelFinds the best fit for the system. Regression parameters are defined separately for theStandard and each Test sample.
Restricted regression modelFocuses the regression on relative potency. The restricted model approximates theStandard sample and Test samples together. Only the regression parameter used todetermine relative potency is assumed to differ. Other regression parameters are assumedto be equal in the Standard and Test samples.
Note: The difference between full and restricted model is used to analyze the suitability of asystem in suitability testing (see last step of calculation).
Regression models
We currently support the following regression models:
• Probit analysis
• Logit analysis
Simultaneous regressionDichotomous assays normally perform all assay regressions one by one, that is, all regression isdone in pairs. In the case of simultaneous regression, all regressions are performed together in asingle model.
Tip: This type of assay allows you to address incomplete data in individual assay elements.
3.2.2 Potency calculationThe primary goal of Dichotomous assays is to calculate relative potencies of Test samplescompared to a Standard sample. You can also determine absolute potencies if you provideinformation on stock solutions or raw materials. In this case, assays still calculate relativepotencies first and then perform calculations to determine absolute potencies.
Note: Various types of potency calculations are available. The type of calculation used by thesystem to derive absolute potency depends on the potency information provided by the user.
28

Reference Guide | Biological Assay Package Version 26
Standard:Raw material
Standard:Stock solution
Test:Raw material
Test:Stock solution
Calculation of relative potency
Dilution factors
Figure 12: The dilution model follows this path
Note: To correctly calculate stock solutions, you have to provide the Dilution factors of allassay elements.
Definitions of raw materials and stock solutions are optional and not always provided. Thesystem can perform various absolute potency calculations and selects them as indicated in thefollowing tables.
Table 10. No absolute potencies are calculated if you provide one of the following threecombinations of potency information:
Standard rawmaterial potency
Standard stocksolution potency
Test raw materialpotency
Test stocksolution potency
1 - - - -
2 - - - yes
3 - - yes -
Table 11. Absolute potencies are calculated for stock solutions if you provide one of thefollowing five combinations of potency information:
Standard rawmaterial potency
Standard stocksolution potency
Test raw materialpotency
Test stocksolution potency
1 - yes - (*)
2 - yes - yes
3 - yes yes -
4 yes - - (*)
5 yes - - yes
29

* If you provide potency information on the raw material or stock solution of the Standardsample and do not provide any potency information on the raw material or stock solution of theTest sample, the stock solution potency of the Test sample is assumed to be 1.
Table 12. Absolute potencies are calculated for raw materials if you provide the followingcombination of potency information:
Standard rawmaterial potency
Standard stocksolution potency
Test raw materialpotency
Test stocksolution potency
1 yes - yes -
3.2.3 Test systemAssays are based on curve similarity. This provides the opportunity to check the validity ofcalculations every time they are performed.
We recommend to have at least the following tests to ascertain valid results:
• one parallelism test or
• one test for each parameter of the standard curve and one test for each parameter assumedto be similar in the restricted regression model comparing the parameter of standard sampleand test sample
Test system logic
The test system allows you to set up sophisticated tests. The following three properties arerelevant to the test system logic:
• Test level (assay or sample)
• Severity level of the test
• Scope of the test
Test level (assay or sample)The test system distinguishes between Assay suitability tests and Sample suitability tests:
• Assay suitability test: If the test fails, all Test samples of the assay fail.
• Sample suitability test: If the test fails, only the related Test sample fails.
Tip: Set up Assay suitability tests for (well-known) Control samples. If these tests fail, theresults for all Test samples in the assays fail.
Severity level of the test
Table 13. Assays provide three severity level options. The highest severity level among failedtests determines how assay results are handled:
Highest severity level among failed tests Impact on assay results
(no test failed) none
30

Reference Guide | Biological Assay Package Version 26
Information The assay results pass the test, but aninformation message is displayed.
Warning The assay results fail, but potencies are stillcalculated and reported.
Reject The assay results fail, and no potencies arecalculated or reported.
Scope of the test
Table 14. Dichotomous assays provide four scope options:
Item Description
All assay elements The test is performed for every assayelement.
Standard only The test is only performed for the Standardsample.
Note: Only tests for single assayelements are calculated. Other tests, such astests for parallelism, are ignored.
Test samples only The test is performed for each Test sample,but not for any other assay element.
Control samples only The test is performed for each Controlsample, but not for any other assay element.
3.2.3.1 Chi-square tests
Dichotomous assays provide various Chi-square tests:
• Significance of non-parallelism
• Significance of non-linearity (lack of fit)
• Significance of square coefficient
• Significance of non-linearity (lack of fit) for a single assay element
• Significance of square coefficient for a single assay element
Please consult the Chi-square test / Z-test (hypothesis test) section in the Element Reference forhelp on the various tests.
3.2.3.2 Additional testsDichotomous assays provide a range of additional tests.
31

• Relative potency value
• Relative potency confidence interval
• Relative potency range (%)
• Weight (W)
3.3 Concepts for efficient setup
The structure of assays is based on the following concepts that allow you to set up assaydocuments more efficiently.
• Preparation schemes
• Suitability tests
• Observation group ID
3.3.1 Preparation schemes
For most assays, you prepare all or at least some assay elements in the same way. The Stepcount (number of dilution steps), Replicate count, and other properties are identical. Preparationschemes allow you to define preparations once and assign them to as many assay elements asyou like. You do not have to enter redundant information.
Note: Each assay element must have a Preparation scheme assigned. And each assaydocument must contain at least one Preparation scheme.
ExampleAssume that you want to develop an assay whose assay elements have 3 dose steps and 3replicates. You therefore add a Preparation scheme to the assay, give it a meaningful name, suchas '3x3 preparation scheme', and enter the values you need for Step count, Replicate count,Dilution factors, and so on. Once you have completed the Preparation scheme, you navigate tothe Preparation scheme entry of each assay element and select the '3x3 preparation scheme'option from the drop-down list.
Properties
Table 15. Preparation schemes have the following properties:
Item Description
Name Enter a name for the preparation scheme.
Step count Enter a number.
Replicate count Enter a number.
32

Reference Guide | Biological Assay Package Version 26
Absolute potency Select one of the following options:
• Not defined
• Defined by stock solution
• Defined by raw material
Dilution factors Add a Dilution factor element to the assay,and then enter a value for the dilution factor.
Dose sequence Select one of the following options:
• n-fold geometrical sequence (default):Enter values for First dose and Base.
• Linear sequence (mostly for slope ratioassays): Enter values for First dose andDelta.
• Defined sequence: Add a Dose valueelement, and then enter a value.
3.3.2 Suitability tests
We recommend to set up suitability tests for every assay. See the Test system section for moreinformation on how to add tests to your assays.
Note: If you do not add any tests, you can still calculate relative potencies, but you cannotcheck their validity.
3.3.3 Observation group IDThe Observation group IDs provide the link between assay elements and observation data.
Each assay element has an Observation group ID assigned. In the Observations editor,Observation group IDs serve as references to assay elements.
33

This concept allows you to change how positions are assigned on plates, for example. You simplyedit the Observation group IDs of assay elements.
3.4 Literature• Council of Europe. European pharmacopoeia 6.0. Chapter 5.3: Statistical analysis of results of
biological assays and tests. Strasbourg: 2008.
• Finney, David J. 1978. Statistical method in biological assay, 3rd edition. London: Charles Griffinand Company Ltd.
• United States Pharmacopeial Convention. United States Pharmacopeia. Rockville (MD): 2012.
◦ Design and analysis of biological assays. USP 35 <111>: 106-117.
◦ Design and development of biological assays. USP 35 (1st supplement) <1032>: 5160-5174.
◦ Biological assay validation. USP 35 (1st supplement) <1033>: 5174-5185.
◦ Analysis of biological assays. USP 35 (1st supplement) <1034>: 5186-5195.
◦ Appendix: Glossary. USP 35 (1st supplement): 5195-5200.
34

Reference Guide | Biological Assay Package Version 26
4 Combination of assay resultsThe Combination of assay results document type allows you to perform combinationcalculations for independent assay runs, thus obtaining reportable values for the potency.
Use combination calculations to improve the precision of the result, and to account for variationssuch as variability in cells or different operators. You can set up combination calculations forQuantitative response assays and Dichotomous assays.
Note: Depending on your configuration, the calculation combines relative potencies and/orabsolute potencies of Test samples.
The combination calculation method determines the weighting of the results from theindependent assay runs during the calculation process. We currently support the followingcombination calculation methods:
• Unweighted: The calculation is done without any weighting.
• Homogeneously weighted: The calculation is done using homogeneous weighting.
• Heterogeneously weighted: The calculation is done using heterogeneous weighting.
• Weighted by homogeneity: The system decides which method to use, based on the result ofthe Chi-square test on homogeneity.
Unweighted combination calculationIt is assumed that the assay results to be combined are independent, coming from acommon normal distribution, and are using the same design and laboratory procedures.
This method accounts for inter-assay variability, but does not account for intra-assayvariability, like the width of the confidence interval. All potency estimates are given equalweight.
Relative potency
Assay 3
Combinedrelative potency
Assay 2
Assay 1 x
x
x
Figure 13: Unweighted calculation combination method
35

Homogeneously weighted combination calculationIt is assumed that the assay results to be combined are independent, and homogeneousregarding the potency being estimated. Differences between the individual results shouldbe consistent with their standard errors.
This method accounts for intra-assay variability. The weight is calculated based on thewidth of the confidence interval. This method does not account for inter-assay variability.
Relative potency
Assay 3
Combinedrelative potency
Assay 2
Assay 1
x
x
Figure 14: Homogeneously weighted calculation combination method
Heterogeneously weighted combination calculationIt is assumed that the assay results to be combined are independent but heterogeneoussuch that there is significant variability due to different laboratory procedures.
This method accounts for inter-assay and intra-assay variability.
Relative potency
Assay 3
Combinedrelative potency
Assay 2
Assay 1
Figure 15: Heterogeneously weighted calculation combination method
For heterogeneously weighted combinations, we support three different types:
• Heterogeneously weighted according to European Pharmacopoeia
36

Reference Guide | Biological Assay Package Version 26
• Heterogeneously weighted according to US Pharmacopeia <111>
• Heterogeneously weighted according to US Pharmacopeia <1034>
4.1 Combination groupsYou can set up independent assay documents with several Test samples and assign each Testsample to a combination group. The combination group marks the Test sample for inclusion in acombination calculation.
In the Combination of assay results document, Test samples with identical group assignment arecombined and you receive combinations for all the Test samples of the different groups in onesingle combination calculation.
Example: Use groups A and B to combine the Test samples A and B of three independentQuantitative response assays in one single combination calculation.
Assay document 3Assay document 1 Assay document 2
Group A
Group B
Combined results of group A
Combined results of group B
Quantitative response assays Combination of assay results 1-3
Test sample A Test sample A Test sample A
Test sample B Test sample B Test sample B
Figure 16: Combination groups combining test samples of independent assays
When referencing the assay documents that contain the Test samples in a Combination ofassay results document, every line in the References editor shows the corresponding groupassignment.
The following image shows the References editor of a Combination of assay results document.The referenced Quantitative response assay documents contain Test samples that have beenassigned to two different combination groups, one group for product A, another group forproduct B.
With the default setup of data aggregation, the group assignment is aggregated directly fromthe combination group assignment in the Quantitative response assay documents.
Tip: Combination groups are also displayed in the Combination of assay results report.You can enter additional details for a group, for example the substance name or batch, in theCombination of assay results document. These details are also displayed in the report.
37

4.2 Test system
Set up the test system to check the validity of the calculation results:
• To perform a test on the combined relative/absolute potency value: Add the Test on potencyvalue element and specify an upper and a lower margin for the relative potency.
• To perform a test on the percentual potency confidence interval: Add the Test on potencyconfidence interval (%) element and specify an upper and a lower margin for the relativepotency confidence interval.
• To perform a test on the percentual relative or absolute potency range: Add the Test onpotency range (%) element and specify an upper margin for the combined relative potencyrange.
4.3 Data aggregationThe Combination of assay results document type allows you to aggregate the data ofindependent assay runs into one combination calculation.
You can set up combination calculations for Quantitative response assays and Dichotomousassays. To determine the source documents as well as the data values that are to be aggregatedfrom these documents, we recommend to set up data aggregation filters. Without filters, anydocument in the database can be used as source document which can lead to unwanted results.
4.4 Literature• Council of Europe. European pharmacopoeia 6.0. Chapter 5.3: Statistical analysis of results of
biological assays and tests. Strasbourg: 2008.
• United States Pharmacopeial Convention. United States Pharmacopeia. Rockville (MD): 2012.
◦ Design and analysis of biological assays. USP 35 <111>: 106-117.
◦ Analysis of biological assays. USP 35 (1st supplement) <1034>: 5186-5195.
38

Reference Guide | Biological Assay Package Version 26
5 Equivalence margin developmentEquivalence margin development documents allow you to utilize data of previous quantitativeresponse assays to develop and verify test systems that can be exported and applied in newassay development.
You select acceptable assays from your historic data and define the tests you require for margindevelopment and verification. The calculation process determines up to 30 equivalence marginsand provides information on their quality.
The References editor displays the data aggregated from previous assay documents and allowsyou to select individual assays for inclusion as development or verification assays. You can alsomark individual assays for exclusion as technical outliers. Confidence level and tolerance levelsettings allow you to fine-tune the calculation process.
5.1 Literature• Callahan, Janice D. and Nancy C. Sajjadi. 2003. 'Testing the null hypothesis for a specified
difference: The right way to test for parallelism.' BioProcessing Journal 2 (2): 71-78.
• Hauck, Walter W., Robert C. Capen, Janice D. Callahan, James E. De Muth, Henry Hsu, DavidLansky, Nancy C. Sajjadi, Sally S. Seaver, Robert R. Singer, and Doris Weisman. 2005. 'Assessingparallelism prior to determining relative potency.' PDA Journal of Pharmaceutical Science andTechnology 59 (2): 127-137.
• United States Pharmacopeial Convention. United States Pharmacopeia. Rockville (MD): 2012.
◦ Design and development of biological assays. USP 35 (1st supplement) <1032>: 5160-5174.
◦ Analysis of biological assays. USP 35 (1st supplement) <1034>: 5186-5195.
39

6 Basic bioassay protocolThe Basic bioassay protocol document type provides a general workflow to produce reportablevalues from Quantitative response assays.
It links independent Quantitative response assays to Combination of assay results calculations.
Quantitative response assays
Assaydocument 3
Basic bioassay protocol
Assaydocument 2
Assaydocument 1
Combination of assay results
Assaydocument 2
Assaydocument 1
Assaydocument 4
references
references
Figure 17: Assay documents referenced by a Basic bioassay protocol document
The Basic bioassay protocol document type provides the following major features:
• Choose between two convenient execution modes that allow you to:
◦ Integrate quantitative assays and combination calculations in a consistent workflow toproduce reportable values (Assay replicate mode)
◦ Control individual assay elements where required (Assay element mode)
• Report on several products (Test samples) in a single assay (for example: Standard sample,Product 1, and Product 2).
• Use a separate template for each assay replicate where required.
• Perform multiple combination calculations for a single product or the whole system.
• Increase the number of assay replicates after initial execution to exclude and compensate forbad samples.
6.1 General workflowThe general workflow of Basic bioassay protocols covers a typical analytical flow to producereportable values.
The workflow consists of four steps:
Set upprotocol
Generatedocuments
Completeassays
Calculatereportable values
40
Reference Guide | Biological Assay Package Version 26
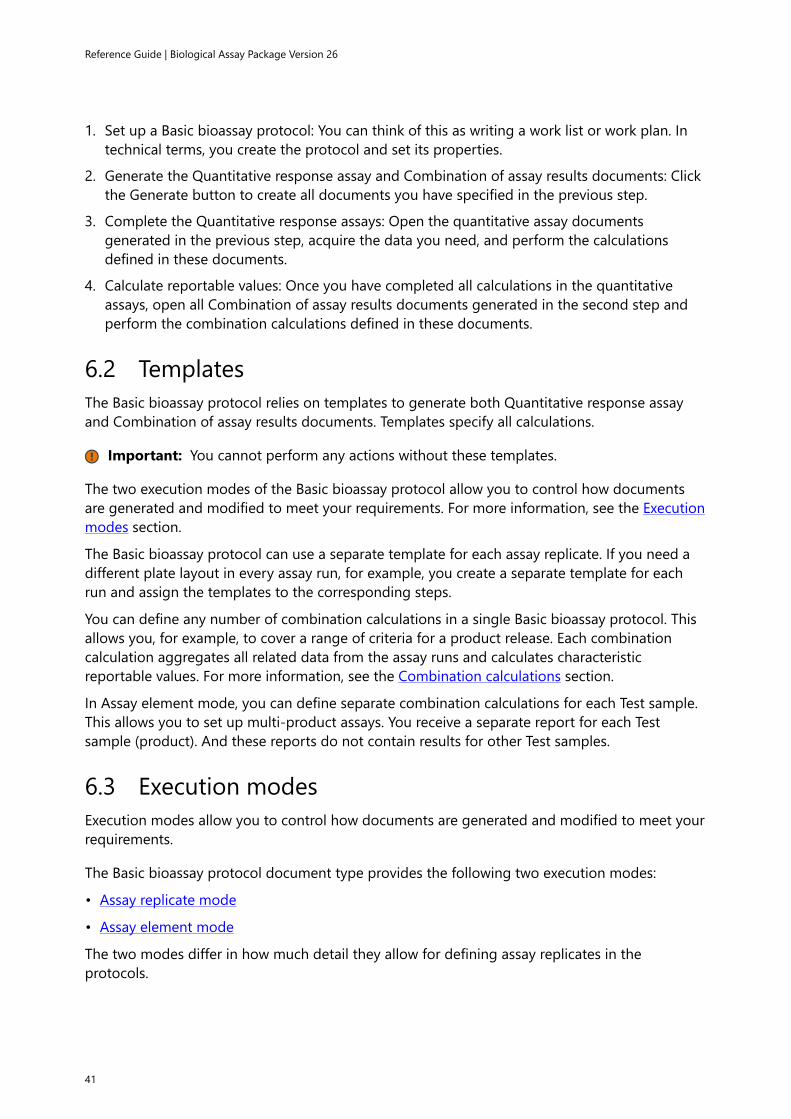
1. Set up a Basic bioassay protocol: You can think of this as writing a work list or work plan. Intechnical terms, you create the protocol and set its properties.
2. Generate the Quantitative response assay and Combination of assay results documents: Clickthe Generate button to create all documents you have specified in the previous step.
3. Complete the Quantitative response assays: Open the quantitative assay documentsgenerated in the previous step, acquire the data you need, and perform the calculationsdefined in these documents.
4. Calculate reportable values: Once you have completed all calculations in the quantitativeassays, open all Combination of assay results documents generated in the second step andperform the combination calculations defined in these documents.
6.2 TemplatesThe Basic bioassay protocol relies on templates to generate both Quantitative response assayand Combination of assay results documents. Templates specify all calculations.
Important: You cannot perform any actions without these templates.
The two execution modes of the Basic bioassay protocol allow you to control how documentsare generated and modified to meet your requirements. For more information, see the Executionmodes section.
The Basic bioassay protocol can use a separate template for each assay replicate. If you need adifferent plate layout in every assay run, for example, you create a separate template for eachrun and assign the templates to the corresponding steps.
You can define any number of combination calculations in a single Basic bioassay protocol. Thisallows you, for example, to cover a range of criteria for a product release. Each combinationcalculation aggregates all related data from the assay runs and calculates characteristicreportable values. For more information, see the Combination calculations section.
In Assay element mode, you can define separate combination calculations for each Test sample.This allows you to set up multi-product assays. You receive a separate report for each Testsample (product). And these reports do not contain results for other Test samples.
6.3 Execution modesExecution modes allow you to control how documents are generated and modified to meet yourrequirements.
The Basic bioassay protocol document type provides the following two execution modes:
• Assay replicate mode
• Assay element mode
The two modes differ in how much detail they allow for defining assay replicates in theprotocols.
41

6.3.1 Assay replicate modeAssay replicate mode provides less detail for defining and generating assay replicates than Assayelement mode.
Table 16. In Assay replicate mode, the protocol document allows you to set the followingproperties:
Property Description
Number of replicates Set the number of assay replicates to be produced.
Tip: Increase the number when an assay replicate has failed. Ifyou generate assay replicates, increase the Number of replicates,and generate again, only the difference between the previous andcurrent Number of replicates is generated.
Combination calculation Run combination calculations that include all Test samples.
Assay replicate Select separate templates for each assay run (for each replicate).
6.3.2 Assay element modeAssay element mode provides more detail for defining and generating assay replicates thanAssay replicate mode. You can set additional properties that control individual assay elements(Standard sample and Test samples).
Table 17. In Assay element mode, the protocol document allows you to set the followingproperties:
Property Description
Name The name of the Standard sample or Test sample.
Observation group ID Keep track of the Observation group IDs in your quantitative assaytemplates. If you use a template with a plate layout, the protocolhas the same Observation group IDs assigned to the samples(assay elements) as the template. This allows you to vary platelayouts between samples.Example: UnK1 of the screenshot has Observation group ID '2'assigned in all assay replicates.
Group Assign a Group name on the Test sample level. The Test sample isadded to a group that is included in a combination calculation.
42

Reference Guide | Biological Assay Package Version 26
Absolute potency Use an additional option (Defined by template) that allows you todraw the specification from the quantitative assay template.
Dilution factors Use an additional option (Defined by template) that allows you todraw the specification from the quantitative assay template.
Number of replicates Set the Number of replicates on the Test sample level. In Assayelement mode, you set the Number of replicates on the Testsample level. If you have two test samples, UNK1 and UNK2, andset the Number of replicates for UNK1 to '2' and for UNK2 to '3',the protocol generates 3 independent assay replicates. Replicate1 and 2 contain both UNK1 and UNK2. Replicate 3 only containsUNK2.
Tip: Increase the number when an assay replicate has failed. Ifyou generate assay replicates, increase the Number of replicates,and generate again, only the difference between the previous andcurrent Number of replicates is generated.
Note: You can also change the assay documents yougenerated to exclude Test samples from reporting. In the assaydocuments, set the Exclude from analysis property of Test samplesyou want to exclude to 'true'.
Combination calculation(sample only)
Add combination calculations on the Test sample level. Only theTest sample (rather than all samples of the protocol) is included inthe combination calculation.
Control sample Add Control samples to your Basic bioassay protocol.
Control line Add Control lines to your Basic bioassay protocol.
43

6.4 Combination calculationsThe Basic bioassay protocol requests the combination calculations you need from Combinationof assay results templates.
In the protocol, you can add combination calculations on the protocol level or on the Testsample level.
• On protocol level, the Combination calculations you define aggregate the potency data of allTest samples as they occur in the (calculated) assay replicates generated by the Basic bioassayprotocol.
• On Test sample level, the Combination calculations you define just aggregate the potencydata of this particular Test sample as they occur in the (calculated) assay replicates generatedby the Basic bioassay protocol.
6.4.1 Specify a combination calculation
When you specify the template for a combination calculation in the Combination calculationtemplates section of the protocol, a name is automatically assigned to each templateConfiguration. You can change the default name (Configuration-1).
To specify a combination calculation:
1. Add a Combination calculation element on the protocol level or on the Test sample level.
◦ Elements that you add under Combination calculation are added on protocol level.
◦ Elements that you add under Combination calculation (sample only) are added on theTest sample level.
44
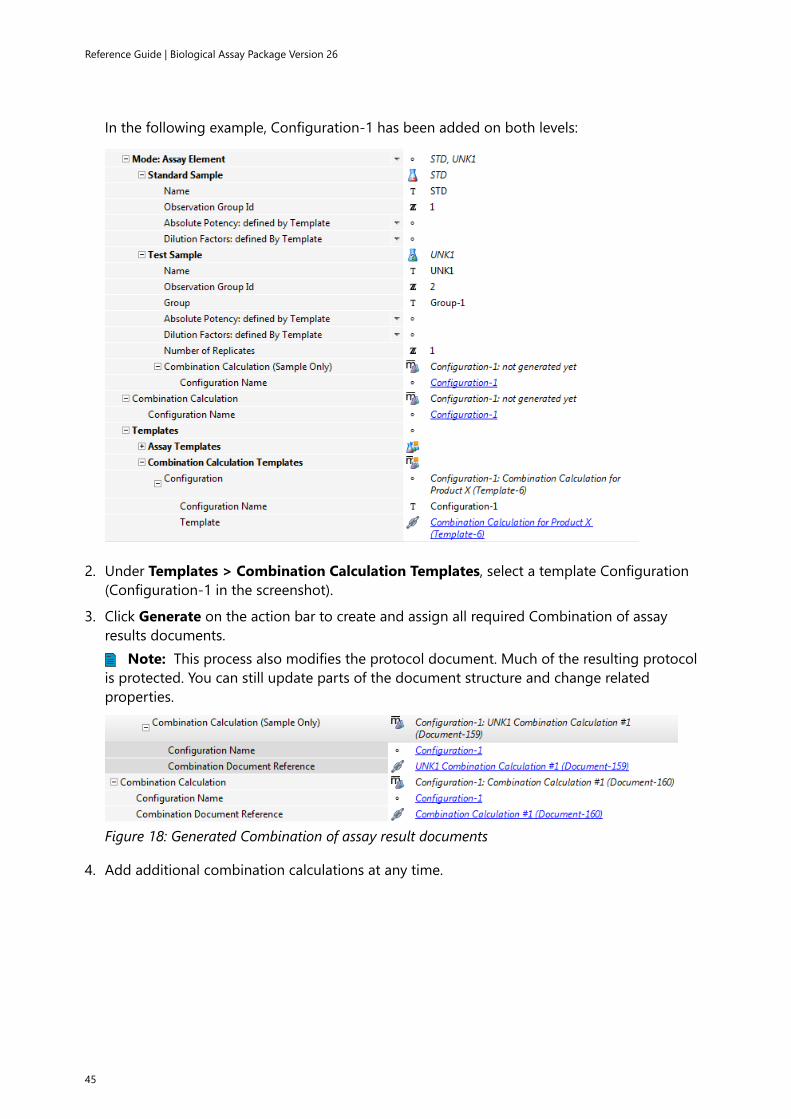
Reference Guide | Biological Assay Package Version 26
In the following example, Configuration-1 has been added on both levels:
2. Under Templates > Combination Calculation Templates, select a template Configuration(Configuration-1 in the screenshot).
3. Click Generate on the action bar to create and assign all required Combination of assayresults documents.
Note: This process also modifies the protocol document. Much of the resulting protocolis protected. You can still update parts of the document structure and change relatedproperties.
Figure 18: Generated Combination of assay result documents
4. Add additional combination calculations at any time.
45

7 Control chartThe Control chart document type provides trending for various parameters. Several parameterscan be trended at once and multiple limits can be set for the trending.
Control charts aggregate several aspects of a biological assay into one chart. They can plot datafrom different document types, such as Quantitative response assays or Combination of assayresults.
You can define several charts within the same Control chart document. Each chart is based onthe same observation data but can be configured to plot different parameters. For example, youcan set up control charts for specific projects or folders, or to plot the data of documents withsuccessfully tested Standard samples.
The following figure shows a control chart with a complex control limit setup:
Figure 19: Control chart example
7.1 TemplatesControl chart templates provide the configuration options that you require to create Controlchart documents.
If you use Control chart templates, you only have to add the references to the documents fromwhich you want to aggregate data, and refresh the chart to view the results.
The PLA demo database contains the following predefined templates:
• Potency ratio and confidence limits for test samples
• Regression parameters 4PL (A, D, B and C)
• Regression parameters 5PL (A, D, B, C and G)
46

Reference Guide | Biological Assay Package Version 26
If you have the required permissions, you can modify these templates or create new ones.
7.2 User-defined control chartsIf you do not want to use one of the provided Control chart templates, you can manually set upa user-defined Control chart document.
To manually set up a Control chart document:
Createdocument
Set upcharts
Configure data table columns
1. Create a Control chart document: Create a new document using the Control chart documenttype.
Tip: You can also create a document from a template, open the new document withelevated privileges, and modify the settings as required.
2. Set up the charts: For each chart that should be generated, define the chart-related optionssuch as control limits and markers.
3. Configure the columns of the data table: Add the document references and configure thelogic according to which the observation data should be retrieved from the referenceddocuments.
7.3 Concepts
Control limitsControl limits define a range of acceptable values. Usually, a control limit contains anupper and a lower value, but you can also define only one of these values. Any valuedisplayed in the control chart that lies outside this acceptable range is printed in a table oflimit violations in the report.
Graphics settingsConfigure the layout of each resulting control chart, as required. For example, configurethe names of the x- and y-axis, and if a legend should be displayed.
MarkersMarkers indicate events that occurred during the process, such as a changed referencestandard, or a switch to another batch of plates. In the resulting control chart, markers areadded as vertical lines.
Please consult the Document structure section in the Element reference for help on all theavailable elements.
7.4 Data aggregationThe Control chart document type allows you to aggregate several aspects of a biological assayinto one chart.
47

You can aggregate data from different document types, such as Quantitative response assays orCombination of assay results. To determine the source documents as well as the data values thatare to be aggregated from these documents, we recommend to set up data aggregation filters.Without filters, any document in the database can be used as source document which can leadto unwanted results.
48

Reference Guide | Biological Assay Package Version 26
8 Test system definitionUse the Test system definition document type to define a collection of Suitability tests andcorresponding margins for Quantitative response assays.
You can reference this Test system definition document from Quantitative response assays.When you calculate an assay that references this document, the test(s) specified in thisdocument are applied to the assay. For detailed description of how to set up a test system, seethe Test system description of the Quantitative response assay document type.
49

9 Common featuresThe following features are shared by several document types.
• Document Name, Identification, and Date
• Documentation section including Assay purpose, User instructions, Substance, Operators,Reagents, Equipment, User variables, and Data sources
• Data table
• Data aggregation
• Graphical representation
• Comment sections
9.1 Document Name, Identification, and DateThe Name element is available for all document types.
Table 18. The following table indicates the availability of elements by document type:
QRA DTA COA EMD BBP CC TSD
Name yes yes yes yes yes yes yes
Identification yes yes - yes - - yes
Date yes yes yes yes - yes yes
9.2 Documentation sectionThe Documentation section is available for all document types except Equivalence margindevelopment, Control chart, and Test system definition.
Table 19. The following table indicates the availability of elements by document type:
QRA DTA COA BBP
Assay purpose yes yes yes -
User instructions yes yes yes yes
Substance: Substance name or Substance reference,Substance identification, Substance batch/lot number,Substance sub-batch/sub-lot number, Substance variant,Substance class, Substance description
yes yes yes yes
Operator: Operator name or Operator reference, Role yes yes yes justone
50

Reference Guide | Biological Assay Package Version 26
Reagent: Reagent name or Reagent reference, Reagentidentification, Reagent batch/lot number, Reagent sub-batch/sub-lot number, Reagent variant, Reagent class, Reagentdescription, Amount
yes yes - -
Equipment: Equipment name or Equipment reference yes yes yes -
User variable: Key, Value yes yes yes -
Data source: File name, Import time stamp, Import moduleidentification, Import comment
yes yes - -
9.3 Data tableOur flexible document types allow you to adjust data tables to your needs. Configure howobservation data is displayed and aggregated.
The functionality of data tables varies between document types. The following data tables areavailable in the Biological assay package:
• Quantitative response assay and Dichotomous assay: Observation data
• Combination of assay results: Potency data
• Equivalence margin development and Control chart: Data table
• Basic bioassay protocol: Reportable values
Note: The Test system definition document type does not provide a data table.
The location of data tables within the document structure depends on the document type. Forquick access in the Content editor, find the data table icon in the Outline pane:
Figure 20: Data table elements of a Quantitative response assay displayed in the Content editor
51

Figure 21: Data table elements of a Basic bioassay protocol displayed in the Content editor
The Content editor provides a wide range of options to configure data tables. You can view datatables in the Observations and References editors.
Table 20. The following table indicates the availability of elements by document type:
QRA DTA COA EMD BBP CC
Observation source: User input, Import,Aggregation
yes yes yes yes Aggregationonly
yes
Row order: Direction (Ascending,Descending), Column key
yes yes yes yes yes yes
If you select the User input option or the Import option, the Observation editor becomesavailable. If you select the Aggregation option, the References editor becomes available.
The rows of data tables represent individual observations. A minimum set of required datacolumns is provided by the default configuration of each document type. The Content editorallows you to add any number of optional data columns or factors.
Table 21. The following table lists data table columns available for the Quantitative responseassay and Dichotomous assay document types:
Item QRA DTA
Column: Observation group yes yes
Column: Sequence step [DTA: Step] yes yes
Column: Response value yes -
Column: Response (affected) - yes
Column: Response (tested) - yes
Required
Column: Technical outlier flag yes yes
Optional Column: Document reference yes -
52

Reference Guide | Biological Assay Package Version 26
Column: Section [Assay element] yes -
Column: Boolean yes yes
Column: Date yes yes
Column: Date/time [DTA: Date time] yes yes
Column: Floating-point number yes yes
Column: Integer yes yes
Column: Memo (multiline text) yes yes
Column: Single-line text [QRA: Text, DTA: String] yes yes
Column: Time yes yes
Every column element available in the QRA and DTA document types except Documentreference and Section [Assay element] can have the following subelements:
• Name
• Column key
• Property scope (Document, Section [Assay element])
• Property key
• Section key [Assay element key]
Table 22. Several column elements can have additional subelements:
Column: Observation group • Maximal group number
Column: Position factor • Number of positions• Map index to characters
Column: Documentreference
• See table below.
Column: Section [Assayelement]
• Property filter with Property key and Term• BUT NOT: Property scope, Property key, Section key [Assay
element key]
Table 23. The following table indicates the availability of Document reference subelements bydocument type:
QRA DTA COA EMD BBP CC
Name yes - yes yes yes yes
53

Column key yes - yes yes yes yes
Edit mode (Select, Create) yes - yes yes yes yes
Update mode (Auto all, Auto data, Manual all,Manual data)
yes - yes yes yes yes
Document type [NOT BBP] yes - yes yes - yes
Template key yes - yes yes yes yes
Folder key yes - yes yes yes yes
Allow subfolder (true, false) yes - yes yes yes yes
Generator key [NOT BBP] yes - yes yes - yes
Document mode (All, Documents only, Templatesonly, OQ definitions only, OQ tests only, PQdefinitions only, PQ tests only)
yes - yes yes yes yes
Document property filter: Property key, Term yes - yes yes yes yes
Section property filter: Property key, Section key[Assay element key], Term
yes - yes yes yes yes
54

Table 24. The following table lists data table columns available for the Combination of assay results, Equivalence margin development, Basicbioassay protocol, and Control chart document types:
COA EMD BBP CC
Required • Column: Documentreference
• Column: Section [Assayelement]
• Column: Group• Column: Relative potency• Column: Relative potency
lower limit• Column: Relative potency
upper limit• Column: Potency• Column: Potency unit• Column: Potency lower
limit• Column: Potency upper
limit• Column: Model• Column: Degrees of
freedom• Column: Potency
confidence level• Column: Assay test state• Column: Exclude from
calculation
• Column: Documentreference
• Column: Assay element[Section]
• Column: Developmentassay
• Column: Verificationassay
• Column: Scientificallyacceptable
• Column: Exclude assay
• Document reference• Group• Selected method• Absolute potency• Absolute potency unit• Absolute potency lower
confidence limit• Absolute potency upper
confidence limit• Absolute potency status• Relative potency• Relative potency lower
confidence limit• Relative potency upper
confidence limit• Relative potency status
• Column: Document reference• Column: Section [Assay element]• Column: Exclude from analysis• Column: Date/time• Column: Floating-point number
Reference G
uide | 9 - Com
mon features | 9.3 - D
ata table | 55
55

Optional • None • None • None • Column: Floating-point number• Column: Single-line text [QRA:
Text, DTA: String]
Reference G
uide | 9 - Com
mon features | 9.3 - D
ata table | 56
56
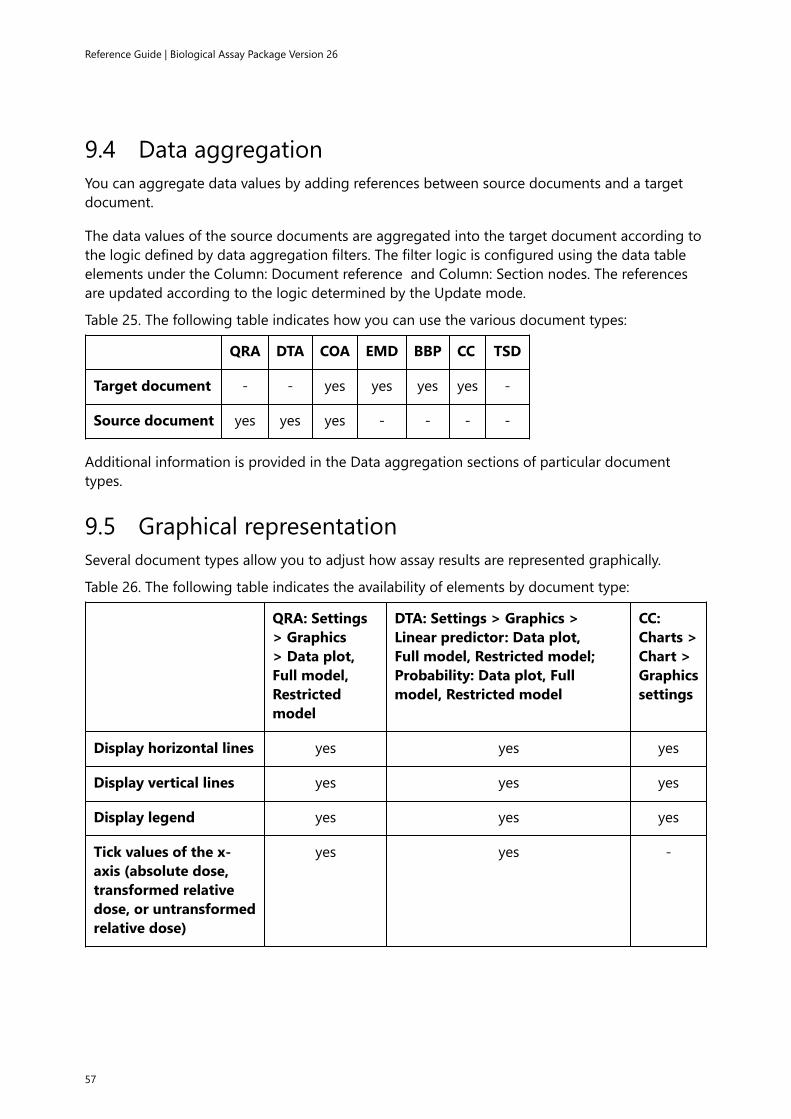
Reference Guide | Biological Assay Package Version 26
9.4 Data aggregationYou can aggregate data values by adding references between source documents and a targetdocument.
The data values of the source documents are aggregated into the target document according tothe logic defined by data aggregation filters. The filter logic is configured using the data tableelements under the Column: Document reference and Column: Section nodes. The referencesare updated according to the logic determined by the Update mode.
Table 25. The following table indicates how you can use the various document types:
QRA DTA COA EMD BBP CC TSD
Target document - - yes yes yes yes -
Source document yes yes yes - - - -
Additional information is provided in the Data aggregation sections of particular documenttypes.
9.5 Graphical representationSeveral document types allow you to adjust how assay results are represented graphically.
Table 26. The following table indicates the availability of elements by document type:
QRA: Settings> Graphics> Data plot,Full model,Restrictedmodel
DTA: Settings > Graphics >Linear predictor: Data plot,Full model, Restricted model;Probability: Data plot, Fullmodel, Restricted model
CC:Charts >Chart >Graphicssettings
Display horizontal lines yes yes yes
Display vertical lines yes yes yes
Display legend yes yes yes
Tick values of the x-axis (absolute dose,transformed relativedose, or untransformedrelative dose)
yes yes -
57

Tick values of the y-axis (transformedresponse oruntransformedresponse)
yes - -
Label of the x-axis yes yes yes
Label of the y-axis yes yes yes
Label of the responseunit
yes yes yes
Connect points by line - - yes
9.6 Comment sectionThe Comment section is available for all document types. You can add any number of Commentsections to your documents.
The following elements are available in the Comment section:
• Subject
• Text
• Linked document (Config)
• Date
• Author
The configuration options (Config element) of the Linked document are similar to the Documentreference:
• Edit mode (Select, Create)
• Update mode (Auto, Manual)
• Document type
• Template key
• Folder key
• Allow subfolder (true, false)
• Generator key
• Document mode (All, Documents only, Templates only, OQ definitions only, OQ tests only, PQdefinitions only, PQ tests only)
• Document property filter: Property key, Term
• Section property filter: Property key, Section key [Assay element key], Term
• Document property import: Property key, Field
58

Reference Guide | Biological Assay Package Version 26
• Section property import: Property key, Section key [Assay element key], Field
9.7 Digest of document properties for data aggregation
59

Table 27. The following table indicates the property keys available for data aggregation:
Label Description Key
General: Document Title {String} Title of the Document. http://purl.org/dc/terms/title
Analyte Document Key {String} Document key of the referenced analytedocument.
http://stegmannsystems.com/bioassay/protocol/analyte
Operator Document Key {String} Document key of the referenced operatordocument.
http://stegmannsystems.com/bioassay/protocol/operator
Analyte Document Title {String} Title of the referenced analyte document. http://stegmannsystems.com/bioassay/protocol/analyteTitle
Operator Document Title {String} Title of the referenced operator document. http://stegmannsystems.com/bioassay/protocol/operatorTitle
Control Line Minimum {Numeric} The minimum of the observed control linevalues.
http://stegmannsystems.com/bioassay/ControlLineMinimum
Control Line Maximum {Numeric} The maximum of the observed control linevalues.
http://stegmannsystems.com/bioassay/ControlLineMaximum
Control Line Coefficient of Variation {Numeric} The coefficient of variation of the control linevalues.
http://stegmannsystems.com/bioassay/ControlLineCoefficientOfVariation
Unrestricted Regression: EC50 (absolute) ofTest & Control {Numeric}
The absolute EC50 value for the test or controlsample including the backfit calculation if rawmaterial, stock solution or dilution factorsare given. The calculation is based on theunrestricted fit.
http://stegmannsystems.com/bioassay/UnrestrictedRegressionAbsoluteEc50TestControl
Reference G
uide | 9 - Com
mon features | 9.7 - D
igest of document properties for data aggregation | 60
60

Unrestricted Regression: EC50 (absolute) ofStandard {Numeric}
The absolute EC50 value for the standardsample including the backfit calculation if rawmaterial, stock solution or dilution factorsare given. The calculation is based on theunrestricted fit.
http://stegmannsystems.com/bioassay/UnrestrictedRegressionAbsoluteEc50Standard
Unrestricted Regression: EC50 {Numeric} The EC50 value derived from the unrestrictedfit. Raw material, stock solution or dilutionfactors are not included.
http://stegmannsystems.com/bioassay/UnrestrictedRegressionEc50
ANOVA: Degrees of Freedom Model {Numeric} The number of degrees of freedom of themodel term.
http://stegmannsystems.com/bioassay/anova_model_df
ANOVA: Sum of Squares Model {Numeric} The sum of squares of the model term. http://stegmannsystems.com/bioassay/anova_model_ss
ANOVA: Mean Square Model {Numeric} The mean square error of the model term. http://stegmannsystems.com/bioassay/anova_model_meansq
ANOVA: F-Ratio Model {Numeric} The F-ratio of the model term. http://stegmannsystems.com/bioassay/anova_model_fratio
ANOVA: Probability Model {Numeric} The probability of the model term. http://stegmannsystems.com/bioassay/anova_model_prob
ANOVA: Degrees of Freedom Treatment{Numeric}
The number of degrees of freedom of thetreatment term.
http://stegmannsystems.com/bioassay/anova_treat_df
ANOVA: Sum of Squares Treatment {Numeric} The sum of squares of the treatment term. http://stegmannsystems.com/bioassay/anova_treat_ss
Reference G
uide | 9 - Com
mon features | 9.7 - D
igest of document properties for data aggregation | 61
61

ANOVA: Mean Square Treatment {Numeric} The mean square error of the treatment term. http://stegmannsystems.com/bioassay/anova_treat_meansq
ANOVA: F-Ratio Treatment {Numeric} The F-ratio of the treatment term. http://stegmannsystems.com/bioassay/anova_treat_fratio
ANOVA: Probability Treatment {Numeric} The probability of the treatment term. http://stegmannsystems.com/bioassay/anova_treat_prob
ANOVA: Degrees of Freedom Preparation{Numeric}
The number of degrees of freedom of thepreparation term.
http://stegmannsystems.com/bioassay/anova_prep_df
ANOVA: Sum of Squares Preparation{Numeric}
The sum of squares of the preparation term. http://stegmannsystems.com/bioassay/anova_prep_ss
ANOVA: Mean Square Preparation {Numeric} The mean square error of the preparationterm.
http://stegmannsystems.com/bioassay/anova_prep_meansq
ANOVA: F-Ratio Preparation {Numeric} The F-ratio of the preparation term. http://stegmannsystems.com/bioassay/anova_prep_fratio
ANOVA: Probability Preparation {Numeric} The probability of the preparation term. http://stegmannsystems.com/bioassay/anova_prep_prob
ANOVA: Degrees of Freedom Regression{Numeric}
The number of degrees of freedom of theregression term.
http://stegmannsystems.com/bioassay/anova_reg_df
ANOVA: Sum of Squares Regression {Numeric} The sum of squares of the regression term. http://stegmannsystems.com/bioassay/anova_reg_ss
ANOVA: Mean Square Regression {Numeric} The mean square error of the regression term. http://stegmannsystems.com/bioassay/anova_reg_meansq
Reference G
uide | 9 - Com
mon features | 9.7 - D
igest of document properties for data aggregation | 62
62

ANOVA: F-Ratio Regression {Numeric} The F-ratio of the regression term. http://stegmannsystems.com/bioassay/anova_reg_fratio
ANOVA: Probability Regression {Numeric} The probability of the regression term. http://stegmannsystems.com/bioassay/anova_reg_prob
ANOVA: Degrees of Freedom Non-Parallelism{Numeric}
The number of degrees of freedom of thenon-parallelism term.
http://stegmannsystems.com/bioassay/anova_np_df
ANOVA: Sum of Squares Non-Parallelism{Numeric}
The sum of squares of the non-parallelismterm.
http://stegmannsystems.com/bioassay/anova_np_ss
ANOVA: Mean Square Non-Parallelism{Numeric}
The mean square error of the non-parallelismterm.
http://stegmannsystems.com/bioassay/anova_np_meansq
ANOVA: F-Ratio Non-Parallelism {Numeric} The F-ratio of the non-parallelism term. http://stegmannsystems.com/bioassay/anova_np_fratio
ANOVA: Probability Non-Parallelism {Numeric} The probability of the non-parallelism term. http://stegmannsystems.com/bioassay/anova_np_prob
ANOVA: Degrees of Freedom Residual Error{Numeric}
The number of degrees of freedom of theresidual error term.
http://stegmannsystems.com/bioassay/anova_reserror_df
ANOVA: Sum of Squares Residual Error{Numeric}
The sum of squares of the residual error term. http://stegmannsystems.com/bioassay/anova_reserror_ss
ANOVA: Mean Square Residual Error{Numeric}
The mean square error of the residual errorterm.
http://stegmannsystems.com/bioassay/anova_reserror_meansq
ANOVA: F-Ratio Residual Error {Numeric} The F-ratio of the residual error term. http://stegmannsystems.com/bioassay/anova_reserror_fratio
Reference G
uide | 9 - Com
mon features | 9.7 - D
igest of document properties for data aggregation | 63
63

ANOVA: Probability Residual Error {Numeric} The probability of the residual error term. http://stegmannsystems.com/bioassay/anova_reserror_prob
ANOVA: Degrees of Freedom Non-Linearity{Numeric}
The number of degrees of freedom of thenon-linearity term (lack of fit).
http://stegmannsystems.com/bioassay/anova_lof_df
ANOVA: Sum of Squares Non-Linearity{Numeric}
The sum of squares of the non-linearity term(lack of fit).
http://stegmannsystems.com/bioassay/anova_lof_ss
ANOVA: Mean Square Non-Linearity{Numeric}
The mean square error of the non-linearityterm (lack of fit).
http://stegmannsystems.com/bioassay/anova_lof_meansq
ANOVA: F-Ratio Non-Linearity {Numeric} The F-ratio of the non-linearity term (lack offit).
http://stegmannsystems.com/bioassay/anova_lof_fratio
ANOVA: Probability Non-Linearity {Numeric} The probability of the non-linearity term (lackof fit).
http://stegmannsystems.com/bioassay/anova_lof_prob
ANOVA: Degrees of Freedom Pure Error{Numeric}
The number of degrees of freedom of thepure error term.
http://stegmannsystems.com/bioassay/anova_pureerror_df
ANOVA: Sum of Squares Pure Error {Numeric} The sum of squares of the pure error term. http://stegmannsystems.com/bioassay/anova_pureerror_ss
ANOVA: Mean Square Pure Error {Numeric} The mean square error of the pure error term. http://stegmannsystems.com/bioassay/anova_pureerror_meansq
ANOVA: Degrees of Freedom Total {Numeric} The number of degrees of freedom of thetotal term.
http://stegmannsystems.com/bioassay/anova_total_df
ANOVA: Sum of Squares Total {Numeric} The sum of squares of the total term. http://stegmannsystems.com/bioassay/anova_total_ss
Reference G
uide | 9 - Com
mon features | 9.7 - D
igest of document properties for data aggregation | 64
64

ANOVA: Mean Square Total {Numeric} The mean square error of the total term. http://stegmannsystems.com/bioassay/anova_total_meansq
[EMD] ANOVA: Sum of Squares Non-Parallelism {Numeric}
The sum of squares of the non-parallelismterm from the ANOVA table.
http://www.stegmannsystems.com/bioassay/emd_ss_np
[EMD] Unrestricted Regression: Covariance A/D of Test Sample {Numeric}
The covariance of upper and lower asymptotefor the test or control sample of theunrestricted regression fit.
http://www.stegmannsystems.com/bioassay/emd_tst_a_d_cov
Restricted Regression: Parameter A-D{Numeric}
The difference of the estimated upper andestimated lower asymptote (fold difference) ofthe restricted regression fit.
http://stegmannsystems.com/bioassay/RestrictedRegressionParameterAMinusD
Restricted Regression: Parameter A/D{Numeric}
The ratio of the estimated upper andestimated lower asymptote (fold ratio) of therestricted regression fit.
http://stegmannsystems.com/bioassay/RestrictedRegressionParameterADividedByD
Unrestricted Regression: Parameter A-D{Numeric}
The difference of the estimated upper andestimated lower asymptote (fold difference) ofthe unrestricted regression fit.
http://stegmannsystems.com/bioassay/UnrestrictedRegressionParameterAMinusD
Unrestricted Regression: Parameter A/D{Numeric}
The ratio of the estimated upper andestimated lower asymptote (fold ratio) of theunrestricted regression fit.
http://stegmannsystems.com/bioassay/UnrestrictedRegressionParameterADividedByD
Unrestricted Regression: Parameter A{Numeric}
The estimated A parameter of the unrestrictedregression fit.
http://stegmannsystems.com/bioassay/UnrestrictedRegressionParameterA
Unrestricted Regression: Parameter B{Numeric}
The estimated B parameter of the unrestrictedregression fit.
http://stegmannsystems.com/bioassay/UnrestrictedRegressionParameterB
Reference G
uide | 9 - Com
mon features | 9.7 - D
igest of document properties for data aggregation | 65
65

Unrestricted Regression: Parameter C{Numeric}
The estimated C parameter of the unrestrictedregression fit.
http://stegmannsystems.com/bioassay/UnrestrictedRegressionParameterC
Unrestricted Regression: Parameter C (antilog){Numeric}
The antilog of the estimated C parameter ofthe unrestricted regression fit.
http://stegmannsystems.com/bioassay/UnrestrictedRegressionParameterCAntilog
Unrestricted Regression: Parameter D{Numeric}
The estimated D parameter of the unrestrictedregression fit.
http://stegmannsystems.com/bioassay/UnrestrictedRegressionParameterD
Unrestricted Regression: Parameter G{Numeric}
The estimated G parameter of the unrestrictedregression fit.
http://stegmannsystems.com/bioassay/UnrestrictedRegressionParameterG
Unrestricted Regression: Intercept {Numeric} The estimated intercept of the unrestrictedregression fit.
http://stegmannsystems.com/bioassay/UnrestrictedRegressionIntercept
Unrestricted Regression: Slope {Numeric} The estimated slope parameter of theunrestricted regression fit.
http://stegmannsystems.com/bioassay/UnrestrictedRegressionSlope
Restricted Regression: Parameter A {Numeric} The estimated A parameter of the restrictedregression fit.
http://stegmannsystems.com/bioassay/RestrictedRegressionParameterA
Restricted Regression: Parameter B {Numeric} The estimated B parameter of the restrictedregression fit.
http://stegmannsystems.com/bioassay/RestrictedRegressionParameterB
Restricted Regression: Parameter C of Test &Control {Numeric}
The estimated C parameter of the restrictedregression fit.
http://stegmannsystems.com/bioassay/RestrictedRegressionParameterCTestControl
Restricted Regression: Parameter C (antilog) ofTest & Control {Numeric}
The antilog of the estimated C parameter ofthe restricted regression fit.
http://stegmannsystems.com/bioassay/RestrictedRegressionParameterCAntilogTestControl
Restricted Regression: Parameter C ofStandard {Numeric}
The estimated C parameter of the standardsample of the restricted regression fit.
http://stegmannsystems.com/bioassay/RestrictedRegressionParameterCStandard
Reference G
uide | 9 - Com
mon features | 9.7 - D
igest of document properties for data aggregation | 66
66

Restricted Regression: Parameter C (antilog) ofStandard {Numeric}
The antilog of the estimated C parameterof the standard sample of the restrictedregression fit.
http://stegmannsystems.com/bioassay/RestrictedRegressionParameterCAntilogStandard
Restricted Regression: Parameter D {Numeric} The estimated D parameter of the restrictedregression fit.
http://stegmannsystems.com/bioassay/RestrictedRegressionParameterD
Restricted Regression: Parameter G {Numeric} The estimated G parameter of the restrictedregression fit.
http://stegmannsystems.com/bioassay/RestrictedRegressionParameterG
Restricted Regression: Parameter R {Numeric} The estimated R parameter (log relativepotency) of the restricted regression fit.
http://stegmannsystems.com/bioassay/RestrictedRegressionParameterR
Restricted Regression: Intercept {Numeric} The estimated intercept of the restrictedregression fit.
http://stegmannsystems.com/bioassay/RestrictedRegressionIntercept
Restricted Regression: Slope {Numeric} The estimated slope of the restrictedregression fit.
http://stegmannsystems.com/bioassay/RestrictedRegressionSlope
Potency: Potency Unit {String} The unit of the abolute potency. http://stegmannsystems.com/edp/document/property/qra/potencyunit
Control Line Mean {Numeric} Mean of the control line response values. Themean is calculated for the untransformedresponse. Values marked as technical outlierdo not enter the calculation.
http://stegmannsystems.com/bioassay/ControlLineMean
Reference G
uide | 9 - Com
mon features | 9.7 - D
igest of document properties for data aggregation | 67
67

Control Line Standard Error {Numeric} Empirical standard deviation of the controlline response values. The standard deviationis calculated for the untransformed response.Values marked as technical outlier do notenter the calculation.
http://stegmannsystems.com/bioassay/ControlLineStandardError
General: Date {DateTime} Date http://stegmannsystems.com/bioassay/date
General: Task Execution Status {String} Status of the document. http://www.stegmannsystems.com/bioassay/status
General: Assay Element Type {String} Type of the assay element (Standard, Test orControl).
http://www.stegmannsystems.com/bioassay/elementtype
Potency: Relative Potency {Numeric} Relative potency value. http://www.stegmannsystems.com/bioassay/relativepotency
Potency: Relative Potency - Lower ConfidenceLimit {Numeric}
Lower confidence limit of the relative potency. http://www.stegmannsystems.com/bioassay/relativepotency_lowerlimit
Potency: Relative Potency - Upper ConfidenceLimit {Numeric}
Upper confidence limit of the relative potency. http://www.stegmannsystems.com/bioassay/relativepotency_upperlimit
Potency: Absolute Potency {Numeric} Absolute potency value. http://www.stegmannsystems.com/bioassay/absolutepotency
Potency: Absolute Potency - Lower ConfidenceLimit {Numeric}
Lower confidence limit of the absolutepotency.
http://www.stegmannsystems.com/bioassay/absolutepotency_lowerlimit
Potency: Absolute Potency - UpperConfidence Limit {Numeric}
Upper confidence limit of the absolutepotency.
http://www.stegmannsystems.com/bioassay/absolutepotency_upperlimit
Reference G
uide | 9 - Com
mon features | 9.7 - D
igest of document properties for data aggregation | 68
68

Potency: Weight {Numeric} Potency weight, which is used in a weightedcombination of independent assays.
http://stegmannsystems.com/bioassay/PotencyWeight
[EMD|COA] ANOVA: Degrees of Freedom(Pure Error|Residual Error) {Numeric}
The degrees of freedom used for thecalculation of the potency confidence interval.This depends on the chosen ANOVA model.
http://www.stegmannsystems.com/bioassay/coa_df
Overall Test Result {String} The assay's overall test result. http://www.stegmannsystems.com/bioassay/testresult
Regression Model {String} The regression model used for analyzing theassay.
http://www.stegmannsystems.com/bioassay/coa_model
[COA] General: Group ID {String} The group ID determining which elementswill be combined in the same combination ofindependent assay calculation.
http://www.stegmannsystems.com/bioassay/coa_group
[COA] Potency: Confidence Level {Numeric} The confidence level of the calculated potencyconfidence intervals.
http://www.stegmannsystems.com/bioassay/coa_confidence_level
[EMD] Unrestricted Regression: Parameter A ofTest Sample {Numeric}
The estimated parameter value of the upperasymptote of the test sample.
http://www.stegmannsystems.com/bioassay/emd_tst_a
[EMD] Unrestricted Regression: StandardDeviation Parameter A of Test Sample{Numeric}
The estimated standard deviation of the upperasymptote of the test sample.
http://www.stegmannsystems.com/bioassay/emd_tst_a_se
[EMD] Unrestricted Regression: Parameter A ofStandard {Numeric}
The estimated parameter value of the upperasymptote of the standard sample.
http://www.stegmannsystems.com/bioassay/emd_std_a
[EMD] Unrestricted Regression: StandardDeviation Parameter A of Standard {Numeric}
The estimated standard deviation of the upperasymptote of the standard sample.
http://www.stegmannsystems.com/bioassay/emd_std_a_se
Reference G
uide | 9 - Com
mon features | 9.7 - D
igest of document properties for data aggregation | 69
69

[EMD] Unrestricted Regression: Parameter B ofTest Sample {Numeric}
The estimated B parameter of the test sample. http://www.stegmannsystems.com/bioassay/emd_tst_b
[EMD] Unrestricted Regression: StandardDeviation Parameter B of Test Sample{Numeric}
The estimated standard deviation of the Bparameter of the test sample.
http://www.stegmannsystems.com/bioassay/emd_tst_b_se
[EMD] Unrestricted Regression: Parameter B ofStandard {Numeric}
The estimated B parameter of the slope of thestandard sample.
http://www.stegmannsystems.com/bioassay/emd_std_b
[EMD] Unrestricted Regression: StandardDeviation Parameter C of Standard {Numeric}
The estimated standard deviation of the Cparameter of the standard sample.
http://www.stegmannsystems.com/bioassay/emd_std_b_se
[EMD] Unrestricted Regression: Parameter C ofTest Sample {Numeric}
The estimated C parameter of the test sample.In case of a 4-parameter-logistic fit this is thelog inflection point.
http://www.stegmannsystems.com/bioassay/emd_tst_c
[EMD] Unrestricted Regression: StandardDeviation Parameter C of Test Sample{Numeric}
The estimated standard deviation of the Cparameter of the test sample.
http://www.stegmannsystems.com/bioassay/emd_tst_c_se
[EMD] Unrestricted Regression: Parameter C ofStandard {Numeric}
The estimated C parameter of the standardsample. In case of a 4-parameter-logistic fitthis is the log inflection point.
http://www.stegmannsystems.com/bioassay/emd_std_c
[EMD] Unrestricted Regression: StandardDeviation Parameter C of Standard {Numeric}
The estimated standard deviation of the CParameter of the standard sample.
http://www.stegmannsystems.com/bioassay/emd_std_c_se
[EMD] Unrestricted Regression: Parameter D ofTest Sample {Numeric}
The estimated parameter value of the lowerasymptote of the test sample.
http://www.stegmannsystems.com/bioassay/emd_tst_d
Reference G
uide | 9 - Com
mon features | 9.7 - D
igest of document properties for data aggregation | 70
70

[EMD] Unrestricted Regression: StandardDeviation Parameter D of Test Sample{Numeric}
The estimated standard deviation of the lowerasymptote of the test sample.
http://www.stegmannsystems.com/bioassay/emd_tst_d_se
[EMD] Unrestricted Regression: Parameter D ofStandard {Numeric}
The estimated parameter value of the lowerasymptote of the standard sample.
http://www.stegmannsystems.com/bioassay/emd_std_d
[EMD] Unrestricted Regression: StandardDeviation Parameter D of Standard {Numeric}
The estimated standard deviation of the lowerasymptote of the standard sample.
http://www.stegmannsystems.com/bioassay/emd_std_d_se
[EMD] Unrestricted Regression: Parameter G ofTest Sample {Numeric}
The estimated parameter value of theasymmetry parameter of the test sample.
http://www.stegmannsystems.com/bioassay/emd_tst_g
[EMD] Unrestricted Regression: StandardDeviation Parameter G of Test Sample{Numeric}
The estimated standard deviation value of theasymmetry parameter of the test sample.
http://www.stegmannsystems.com/bioassay/emd_tst_g_se
[EMD] Unrestricted Regression: Parameter G ofStandard {Numeric}
The estimated parameter value of theasymmetry parameter of the standard sample.
http://www.stegmannsystems.com/bioassay/emd_std_g
[EMD] Unrestricted Regression: StandardDeviation Parameter G of Standard {Numeric}
The estimated standard deviation value of theasymmetry parameter of the standard sample.
http://www.stegmannsystems.com/bioassay/emd_std_g_se
[EMD] Unrestricted Regression: Slope of TestSample {Numeric}
The estimated parameter value of the slope ofthe test sample.
http://www.stegmannsystems.com/bioassay/emd_tst_m
[EMD] Unrestricted Regression: StandardDeviation Slope of Test Sample {Numeric}
The estimated standard deviation of the slopeof the test sample.
http://www.stegmannsystems.com/bioassay/emd_tst_m_se
[EMD] Unrestricted Regression: Slope ofStandard {Numeric}
The estimated parameter value of the slope ofthe standard sample.
http://www.stegmannsystems.com/bioassay/emd_std_m
Reference G
uide | 9 - Com
mon features | 9.7 - D
igest of document properties for data aggregation | 71
71
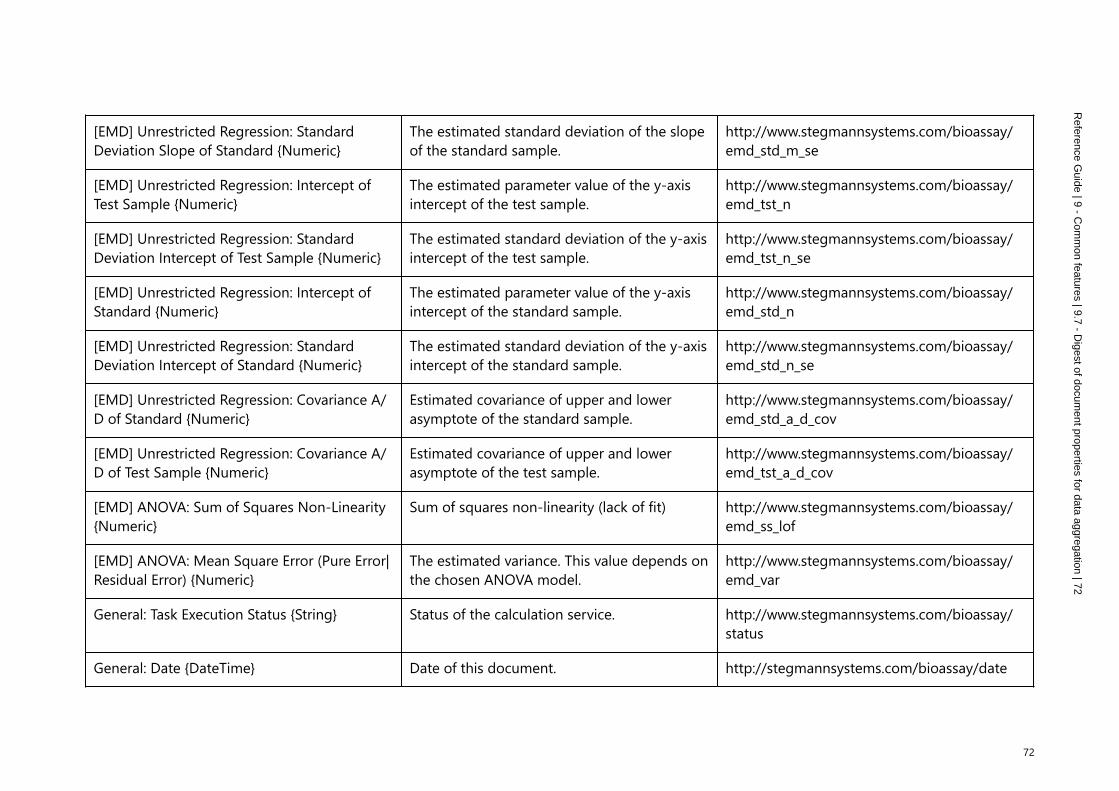
[EMD] Unrestricted Regression: StandardDeviation Slope of Standard {Numeric}
The estimated standard deviation of the slopeof the standard sample.
http://www.stegmannsystems.com/bioassay/emd_std_m_se
[EMD] Unrestricted Regression: Intercept ofTest Sample {Numeric}
The estimated parameter value of the y-axisintercept of the test sample.
http://www.stegmannsystems.com/bioassay/emd_tst_n
[EMD] Unrestricted Regression: StandardDeviation Intercept of Test Sample {Numeric}
The estimated standard deviation of the y-axisintercept of the test sample.
http://www.stegmannsystems.com/bioassay/emd_tst_n_se
[EMD] Unrestricted Regression: Intercept ofStandard {Numeric}
The estimated parameter value of the y-axisintercept of the standard sample.
http://www.stegmannsystems.com/bioassay/emd_std_n
[EMD] Unrestricted Regression: StandardDeviation Intercept of Standard {Numeric}
The estimated standard deviation of the y-axisintercept of the standard sample.
http://www.stegmannsystems.com/bioassay/emd_std_n_se
[EMD] Unrestricted Regression: Covariance A/D of Standard {Numeric}
Estimated covariance of upper and lowerasymptote of the standard sample.
http://www.stegmannsystems.com/bioassay/emd_std_a_d_cov
[EMD] Unrestricted Regression: Covariance A/D of Test Sample {Numeric}
Estimated covariance of upper and lowerasymptote of the test sample.
http://www.stegmannsystems.com/bioassay/emd_tst_a_d_cov
[EMD] ANOVA: Sum of Squares Non-Linearity{Numeric}
Sum of squares non-linearity (lack of fit) http://www.stegmannsystems.com/bioassay/emd_ss_lof
[EMD] ANOVA: Mean Square Error (Pure Error|Residual Error) {Numeric}
The estimated variance. This value depends onthe chosen ANOVA model.
http://www.stegmannsystems.com/bioassay/emd_var
General: Task Execution Status {String} Status of the calculation service. http://www.stegmannsystems.com/bioassay/status
General: Date {DateTime} Date of this document. http://stegmannsystems.com/bioassay/date
Reference G
uide | 9 - Com
mon features | 9.7 - D
igest of document properties for data aggregation | 72
72

Potency: Combined Absolute Potency{Numeric}
Absolute potency of the calculation method,defined in the combination calculationdocument.
http://stegmannsystems.com/edp/document/property/coa/absolute_potency
Potency: Combined Absolute Potency Unit{String}
Unit of the absolute potency of the calculationmethod.
http://stegmannsystems.com/edp/document/property/coa/absolute_potency_unit
Potency: Combined Absolute Potency - LowerConfidence Limit {Numeric}
Lower confidence limit of the absolutepotency of the calculation method.
http://stegmannsystems.com/edp/document/property/coa/absolute_potency_lower_confidence_limit
Potency: Combined Absolute Potency - UpperConfidence Limit {Numeric}
Upper confidence limit of the absolutepotency of the calculation method.
http://stegmannsystems.com/edp/document/property/coa/absolute_potency_upper_confidence_limit
Potency: Combined Absolute Potency - OverallTest State {String}
Overall test state of the absolute potencycalculation.
http://stegmannsystems.com/edp/document/property/coa/absolute_potency_status
Potency: Combined Relative Potency{Numeric}
Relative potency of the calculation method,defined in the combination calculationdocument.
http://stegmannsystems.com/edp/document/property/coa/relative_potency
Potency: Combined Relative Potency - LowerConfidence Limit {Numeric}
Lower confidence limit of the relative potencyof the calculation method.
http://stegmannsystems.com/edp/document/property/coa/relative_potency_lower_confidence_limit
Potency: Combined Relative Potency - UpperConfidence Limit {Numeric}
Upper confidence limit of the relative potencyof the calculation method.
http://stegmannsystems.com/edp/document/property/coa/relative_potency_upper_confidence_limit
Reference G
uide | 9 - Com
mon features | 9.7 - D
igest of document properties for data aggregation | 73
73

Potency: Combined Relative Potency - OverallTest State {String}
Overall test state of the relative potencycalculation.
http://stegmannsystems.com/edp/document/property/coa/relative_potency_status
Potency: Method for Combined Potency{String}
Chosen method for the combinationcalculation.
http://www.stegmannsystems.com/bioassay/coa/method
Potency: Unweighted Combined RelativePotency {Numeric}
[Deprecated] Relative Potency value in case ofthe unweighted combination calculation.
http://stegmannsystems.com/bioassay/UnweightedCombinedRelativePotency
Potency: Unweighted Combined RelativePotency - Lower Confidence Limit {Numeric}
[Deprecated] Lower Confidence Limit ofthe relative potency for the unweightedcombination calculation.
http://stegmannsystems.com/bioassay/UnweightedCombinedRelativePotencyLowerConfidenceLimit
Potency: Unweighted Combined RelativePotency - Upper Confidence Limit {Numeric}
[Deprecated] Upper confidence limit ofthe relative potency for the unweightedcombination calculation..
http://stegmannsystems.com/bioassay/UnweightedCombinedRelativePotencyUpperConfidenceLimit
Potency: Combined Relative Potency{Numeric}
[Deprecated] Relative potency value for thecombination calculation.
http://stegmannsystems.com/bioassay/CombinedRelativePotency
Potency: Combined Relative Potency - LowerConfidence Limit {Numeric}
[Deprecated] Lower confidence limit of therelative potency.
http://stegmannsystems.com/bioassay/CombinedRelativePotencyLowerConfidenceLimit
Potency: Combined Relative Potency - UpperConfidence Limit {Numeric}
[Deprecated] Upper confidence limit of therelative potency.
http://stegmannsystems.com/bioassay/CombinedRelativePotencyUpperConfidenceLimit
Overall Test Result {String} [Deprecated] Overall state of the calculatedtests.
http://stegmannsystems.com/bioassay/OverallTestResult
General: Assay Element Type {String} Type of the assay element (Standard, Test orControl).
http://www.stegmannsystems.com/bioassay/elementtype
Reference G
uide | 9 - Com
mon features | 9.7 - D
igest of document properties for data aggregation | 74
74

[EMD|COA] ANOVA: Degrees of Freedom(Pure Error|Residual Error) {Numeric}
The degrees of freedom used for thecalculation of the potency confidence interval.This depends on the chosen ANOVA model.
http://www.stegmannsystems.com/bioassay/coa_df
Potency: Potency Unit {String} The unit of the absolute potency. http://stegmannsystems.com/bioassay/PotencyUnit
[EMD] Pure Error {Numeric} http://stegmannsystems.com/bioassay/emd_pure_error
[EMD] Residual Error {Numeric} http://stegmannsystems.com/bioassay/emd_residual_error
[EMD] ANOVA: Sum of Squares Non-Linearity(Standard Sample) {Numeric}
Sum of squares non-linearity (lack of fit) of thestandard sample.
http://stegmannsystems.com/bioassay/emd_ss_lof_std
[EMD] ANOVA: Sum of Squares Non-Linearity(Test/Control Sample) {Numeric}
Sum of squares non-linearity (lack of fit) of thetest/control sample.
http://stegmannsystems.com/bioassay/emd_ss_lof_tst
[EMD] ANOVA: Sum of Squares Regression{Numeric}
Sum of squares regression. http://stegmannsystems.com/bioassay/emd_ss_reg
[EMD] Technical: Dilution String (StandardSample) {String}
Technical String containing informationregarding the dilution settings of the standardsample.
http://www.stegmannsystems.com/bioassay/emd_std_dilutiondefinition
[EMD] Technical: Dilution String (Test/ControlSample) {String}
Technical String containing informationregarding the dilution settings of the test/control sample.
http://www.stegmannsystems.com/bioassay/emd_tst_dilutiondefinition
[EMD] Logarithm Base {String} Logarithm base used for dose or responsetransformation.
http://www.stegmannsystems.com/bioassay/logtype
Reference G
uide | 9 - Com
mon features | 9.7 - D
igest of document properties for data aggregation | 75
75

Substance name http://www.stegmannsystems.com/substance/name
Reference G
uide | 9 - Com
mon features | 9.7 - D
igest of document properties for data aggregation | 76
76

Reference Guide | Biological Assay Package Version 26
10 Document element referenceThis part of the Reference guide contains the document element reference.
Use the following document outlines and structures as finding aids to access information onparticular document elements:
• Quantitative response assay
◦ Document outline
◦ Document structure
• Dichotomous assay
◦ Document outline
◦ Document structure
• Combination of assay results
◦ Document outline
◦ Document structure
• Equivalence margin development
◦ Document outline
◦ Document structure
• Basic bioassay protocol
◦ Document outline
◦ Document structure
• Control chart
◦ Document outline
◦ Document structure
10.1 Quantitative response assay
10.1.1 Document outlineThe structure of Quantitative response assay documents is hierarchical. The Quantitativeresponse assay top level has two sections, Setup and Analysis. The following outline shows thefirst and second level of the hierarchical document structure:
• Setup: Contains all properties related to observation data and measurement such as dilutionsteps and response values.
77

◦ Assay elements: Provides a container for all assay elements. Every assay element is listed onthe third level of the hierarchical document structure.
◦ Preparation schemes: Provides a container for all preparation schemes.
◦ Observation data: Defines the data table.
• Analysis: Defines how assays perform the statistical analysis.
◦ Analytical model: Defines the regression model and analytical properties.
◦ Data selection schemes: Provides a container for all data selection schemes.
◦ Suitability tests: Provides a container for all suitability tests.
10.1.2 Document structureQuantitative response assay.... Name.... Identification.... Date.... Documentation........ Assay purpose........ User instructions........ Choice............ Substance name............ Substance reference........ Substance identification........ Substance batch/lot number........ Substance sub-batch/sub-lot number........ Substance variant........ Substance class........ Substance description........ Operator............ Choice................ Operator name................ Operator reference.................... Config........................ Update mode............ Role........ Reagent............ Choice................ Reagent name................ Reagent reference............ Reagent identification............ Reagent batch/lot number............ Reagent sub-batch/sub-lot number............ Reagent variant............ Reagent class............ Reagent description
78

Reference Guide | Biological Assay Package Version 26
............ Amount
........ Equipment
............ Choice
................ Equipment name
................ Equipment reference
.................... Config
........................ Update mode
........ User variable
............ Key
............ Value
........ Data source
............ File name
............ Import time stamp
............ Import module identification
............ Import comment
.... Setup
........ Assay elements
............ Standard sample
................ Name
................ Observation group ID
................ Preparation scheme
................ Data selection scheme
................ Display color
................ User variable
.................... Key
.................... Value
................ Choice
.................... Substance name
.................... Substance reference
................ Substance identification
................ Substance batch/lot number
................ Substance sub-batch/sub-lot number
................ Substance variant
................ Substance class
................ Substance description
............ Test sample (unknown)
................ Name
................ Observation group ID
................ Preparation scheme
................ Data selection scheme
................ Display color
................ User variable
.................... Key
.................... Value
................ Group
................ Choice
.................... Substance name
.................... Substance reference
79
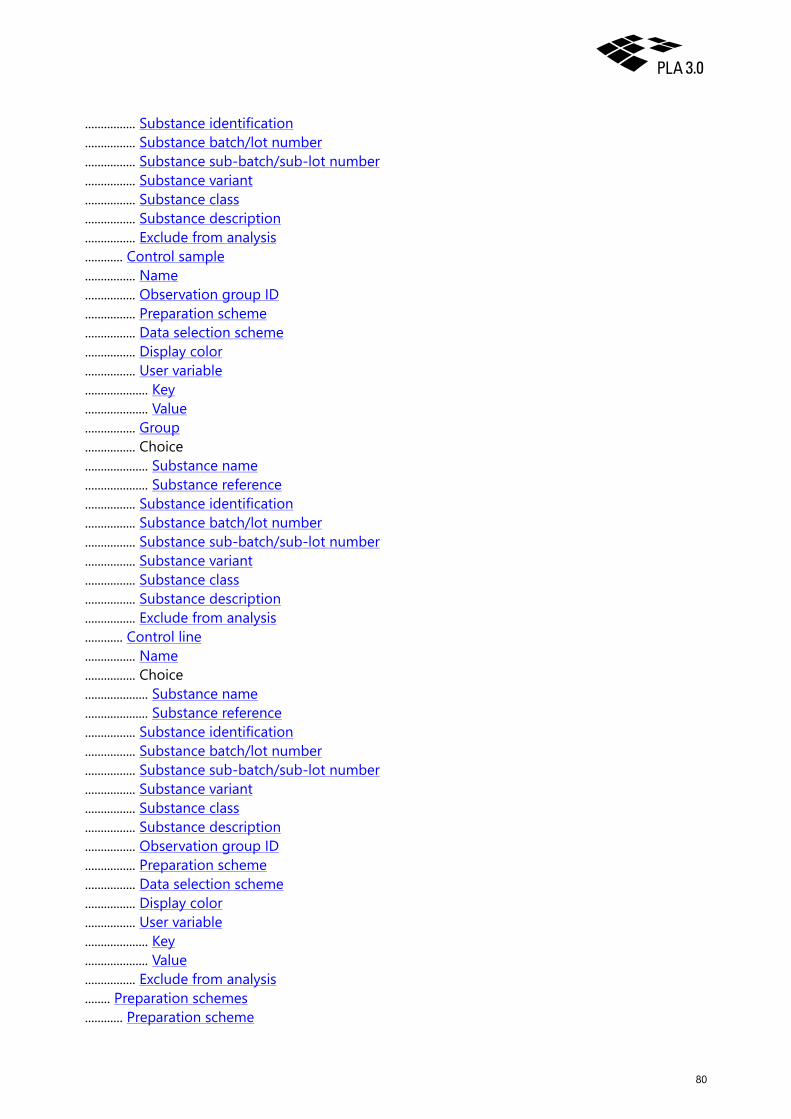
................ Substance identification
................ Substance batch/lot number
................ Substance sub-batch/sub-lot number
................ Substance variant
................ Substance class
................ Substance description
................ Exclude from analysis
............ Control sample
................ Name
................ Observation group ID
................ Preparation scheme
................ Data selection scheme
................ Display color
................ User variable
.................... Key
.................... Value
................ Group
................ Choice
.................... Substance name
.................... Substance reference
................ Substance identification
................ Substance batch/lot number
................ Substance sub-batch/sub-lot number
................ Substance variant
................ Substance class
................ Substance description
................ Exclude from analysis
............ Control line
................ Name
................ Choice
.................... Substance name
.................... Substance reference
................ Substance identification
................ Substance batch/lot number
................ Substance sub-batch/sub-lot number
................ Substance variant
................ Substance class
................ Substance description
................ Observation group ID
................ Preparation scheme
................ Data selection scheme
................ Display color
................ User variable
.................... Key
.................... Value
................ Exclude from analysis
........ Preparation schemes
............ Preparation scheme
80
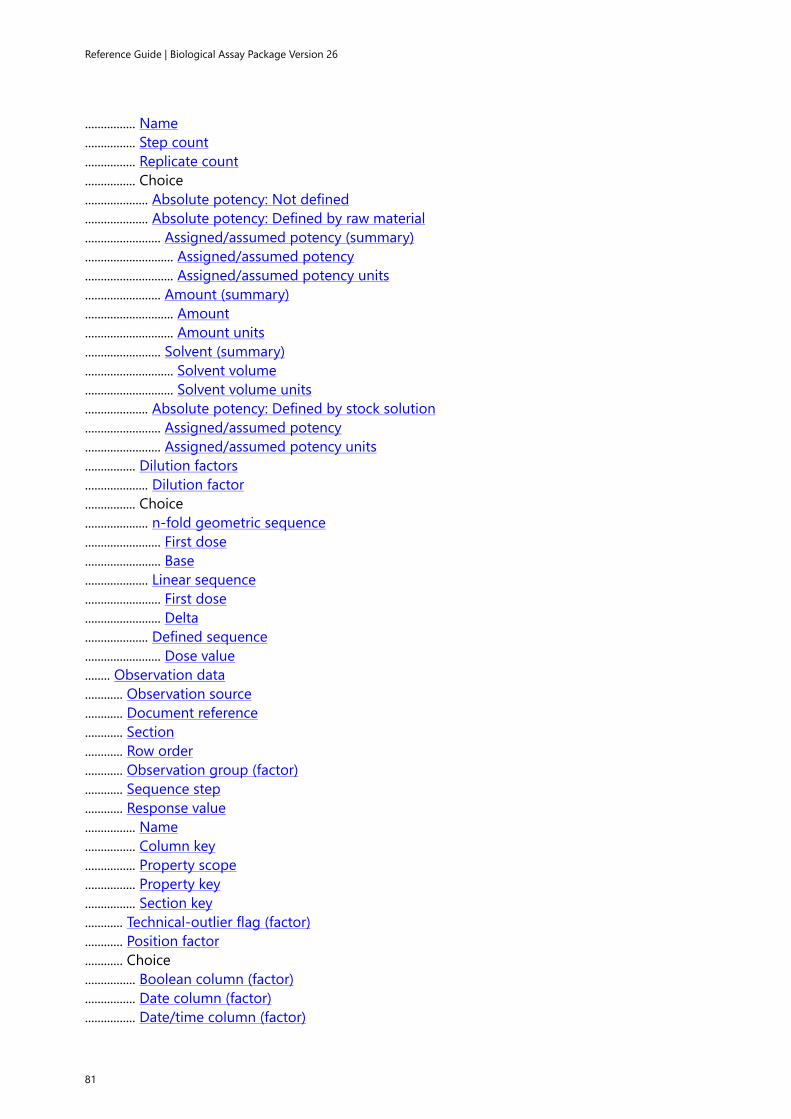
Reference Guide | Biological Assay Package Version 26
................ Name
................ Step count
................ Replicate count
................ Choice
.................... Absolute potency: Not defined
.................... Absolute potency: Defined by raw material
........................ Assigned/assumed potency (summary)
............................ Assigned/assumed potency
............................ Assigned/assumed potency units
........................ Amount (summary)
............................ Amount
............................ Amount units
........................ Solvent (summary)
............................ Solvent volume
............................ Solvent volume units
.................... Absolute potency: Defined by stock solution
........................ Assigned/assumed potency
........................ Assigned/assumed potency units
................ Dilution factors
.................... Dilution factor
................ Choice
.................... n-fold geometric sequence
........................ First dose
........................ Base
.................... Linear sequence
........................ First dose
........................ Delta
.................... Defined sequence
........................ Dose value
........ Observation data
............ Observation source
............ Document reference
............ Section
............ Row order
............ Observation group (factor)
............ Sequence step
............ Response value
................ Name
................ Column key
................ Property scope
................ Property key
................ Section key
............ Technical-outlier flag (factor)
............ Position factor
............ Choice
................ Boolean column (factor)
................ Date column (factor)
................ Date/time column (factor)
81

................ Floating-point number column (factor)
................ Integer column (factor)
................ Memo column (factor)
................ Text column (factor)
................ Time column (factor)
.... Analysis
........ Analytical model
............ Choice
................ No response adjustment
................ Response adjustment by control line
................ Response adjustment by fixed value
............ Response value upper limit
............ Response value lower limit
............ Response transformation
............ Choice
................ Model: Linear parallel-line
................ Model: 4-parameter logistic fit
.................... Include control line
................ Model: 5-parameter logistic fit
................ Model: 3-parameter logistic fit with fixed lower asymptote
.................... Choice
........................ Asymptote fixed by control line
........................ Asymptote fixed by value
................ Model: 3-parameter logistic fit with fixed upper asymptote
.................... Choice
........................ Asymptote fixed by control line
........................ Asymptote fixed by value
................ Model: Slope ratio
.................... Include control line
............ Simultaneous regression
............ Potency estimation confidence level
............ Calculate mean potency estimate of test samples
............ Advanced settings
................ ANOVA model
................ ANOVA with additional factors
................ Logarithm base
................ Invert potency
................ Replace outliers
................ Report excluded/invalid elements
................ Potency confidence interval calculation method
................ Coefficient of determination
........ Data selection schemes
............ Configuration optimizer allocation range
............ Quality weight
............ Data selection scheme
................ Name
................ Choice
.................... No outlier detection
82

Reference Guide | Biological Assay Package Version 26
.................... Dixon test
........................ Alpha
........................ Recursive
.................... Grubbs test
........................ Alpha
........................ Recursive
.................... (Externally) studentized residuals
........................ Alpha
........................ Recursive
.................... Standard deviation test
........................ n Sigma
................ Choice
.................... Range full
.................... Range partial
........................ Step start
........................ Step stop
................ Choice
.................... Optimization off
.................... Optimization on
........................ Identical range
........................ Identical treatment number
........................ Choice
............................ Ignore 50-percent response
............................ Include 50-percent response
................................ Use response transformation
................................ Estimation by
........................ Choice
............................ Minimal number of steps
............................ Exact number of steps
........ Suitability tests
............ Test exception handling
............ Test system reference
............ Assay suitability tests
................ Choice
.................... F-test (hypothesis test)
........................ Test name
........................ Conditional evaluation
............................ Test reference
............................ Evaluation condition
........................ Type of F-test
........................ Choice
............................ Confidence level
............................ p
........................ Scope of the test
........................ Severity level of the test
........................ Rounding
.................... Equivalence tests: Parameter estimate
........................ Test name
83

........................ Conditional evaluation
............................ Test reference
............................ Evaluation condition
........................ Parameter
........................ Upper margin
........................ Lower margin
........................ Confidence level
........................ Scope of the test
........................ Severity level of the test
........................ Rounding
.................... Equivalence tests: Difference of parameter estimates
........................ Test name
........................ Conditional evaluation
............................ Test reference
............................ Evaluation condition
........................ Parameter
........................ Upper margin
........................ Lower margin
........................ Confidence level
........................ Scope of the test
........................ Severity level of the test
........................ Rounding
.................... Equivalence tests: Ratio of parameter estimates
........................ Test name
........................ Conditional evaluation
............................ Test reference
............................ Evaluation condition
........................ Parameter
........................ Upper margin
........................ Lower margin
........................ Confidence level
........................ Scope of the test
........................ Severity level of the test
........................ Rounding
.................... Equivalence tests: Scaled parameter range
........................ Test name
........................ Conditional evaluation
............................ Test reference
............................ Evaluation condition
........................ Parameter
........................ Upper margin
........................ Lower margin
........................ Scaling parameter
........................ Confidence level
........................ Scope of the test
........................ Severity level of the test
........................ Rounding
.................... Point estimate tests: Parameter estimate
84

Reference Guide | Biological Assay Package Version 26
........................ Parameter
........................ Test name
........................ Conditional evaluation
............................ Test reference
............................ Evaluation condition
........................ Upper margin
........................ Lower margin
........................ Scope of the test
........................ Severity level of the test
........................ Rounding
.................... Point estimate tests: Difference of parameter estimates
........................ Parameter
........................ Test name
........................ Conditional evaluation
............................ Test reference
............................ Evaluation condition
........................ Upper margin
........................ Lower margin
........................ Scope of the test
........................ Severity level of the test
........................ Rounding
.................... Point estimate tests: Ratio of parameter estimates
........................ Parameter
........................ Test name
........................ Conditional evaluation
............................ Test reference
............................ Evaluation condition
........................ Upper margin
........................ Lower margin
........................ Scope of the test
........................ Severity level of the test
........................ Rounding
.................... Test: Normalized difference of asymptotes
........................ Parameter
........................ Test name
........................ Conditional evaluation
............................ Test reference
............................ Evaluation condition
........................ Upper margin
........................ Lower margin
........................ Scope of the test
........................ Severity level of the test
........................ Rounding
.................... Test: Sum-of-squares regression
........................ Test name
........................ Conditional evaluation
............................ Test reference
............................ Evaluation condition
85

........................ Upper margin
........................ Lower margin
........................ Scope of the test
........................ Severity level of the test
........................ Rounding
.................... Test: Sum-of-squares non-parallelism
........................ Test name
........................ Conditional evaluation
............................ Test reference
............................ Evaluation condition
........................ Upper margin
........................ Lower margin
........................ Scope of the test
........................ Severity level of the test
........................ Rounding
.................... Test: Sum-of-squares non-linearity
........................ Test name
........................ Conditional evaluation
............................ Test reference
............................ Evaluation condition
........................ Upper margin
........................ Lower margin
........................ Scope of the test
........................ Severity level of the test
........................ Extent of the test
........................ Rounding
.................... Test: Ratio of sum-of-squares non-linearity to sum-of-squares regression
........................ Test name
........................ Conditional evaluation
............................ Test reference
............................ Evaluation condition
........................ Upper margin
........................ Lower margin
........................ Scope of the test
........................ Severity level of the test
........................ Rounding
.................... Test: Potency value
........................ Test name
........................ Conditional evaluation
............................ Test reference
............................ Evaluation condition
........................ Upper margin
........................ Lower margin
........................ Scope of the test
........................ Severity level of the test
........................ Potency type
........................ Rounding
.................... Test: Potency confidence interval
86

Reference Guide | Biological Assay Package Version 26
........................ Test name
........................ Conditional evaluation
............................ Test reference
............................ Evaluation condition
........................ Upper margin
........................ Lower margin
........................ Scope of the test
........................ Severity level of the test
........................ Potency type
........................ Rounding
.................... Test: Log potency range
........................ Test name
........................ Conditional evaluation
............................ Test reference
............................ Evaluation condition
........................ Upper margin
........................ Lower margin
........................ Scope of the test
........................ Severity level of the test
........................ Rounding
.................... Test: Potency of intermediate dilution
........................ Test name
........................ Conditional evaluation
............................ Test reference
............................ Evaluation condition
........................ Upper margin
........................ Lower margin
........................ No. of dilution factor
........................ Scope of the test
........................ Severity level of the test
........................ Rounding
.................... Test: Potency confidence interval (%)
........................ Test name
........................ Conditional evaluation
............................ Test reference
............................ Evaluation condition
........................ Upper margin
........................ Lower margin
........................ Scope of the test
........................ Severity level of the test
........................ Rounding
.................... Test: Potency range (%)
........................ Test name
........................ Conditional evaluation
............................ Test reference
............................ Evaluation condition
........................ Upper margin
........................ Scope of the test
87

........................ Severity level of the test
........................ Rounding
.................... Test: Maximal number of outliers
........................ Test name
........................ Conditional evaluation
............................ Test reference
............................ Evaluation condition
........................ Upper margin
........................ Scope of the test
........................ Severity level of the test
........................ Extent of the test
.................... Test: Maximal sequence step CV (%)
........................ Test name
........................ Conditional evaluation
............................ Test reference
............................ Evaluation condition
........................ Upper margin
........................ Lower margin
........................ Scope of the test
........................ Severity level of the test
........................ Rounding
.................... Test: Minimal R²
........................ Test name
........................ Conditional evaluation
............................ Test reference
............................ Evaluation condition
........................ Lower margin
........................ Scope of the test
........................ Severity level of the test
........................ Extent of the test
........................ Rounding
.................... Test: Relative LOF error (%)
........................ Test name
........................ Conditional evaluation
............................ Test reference
............................ Evaluation condition
........................ Upper margin
........................ Scope of the test
........................ Severity level of the test
........................ Rounding
.................... Test: Response value range
........................ Test name
........................ Conditional evaluation
............................ Test reference
............................ Evaluation condition
........................ Upper margin
........................ Lower margin
........................ Choice
88

Reference Guide | Biological Assay Package Version 26
............................ Scope of the test
............................ Scope of the test
........................ Severity level of the test
........................ Rounding
.................... Test: Weight (W)
........................ Test name
........................ Conditional evaluation
............................ Test reference
............................ Evaluation condition
........................ Lower margin
........................ Scope of the test
........................ Severity level of the test
........................ Rounding
............ Sample suitability tests
................ Choice
.................... F-test (hypothesis test)
........................ Test name
........................ Conditional evaluation
............................ Test reference
............................ Evaluation condition
........................ Type of F-test
........................ Choice
............................ Confidence level
............................ p
........................ Scope of the test
........................ Severity level of the test
........................ Rounding
.................... Equivalence tests: Parameter estimate
........................ Test name
........................ Conditional evaluation
............................ Test reference
............................ Evaluation condition
........................ Parameter
........................ Upper margin
........................ Lower margin
........................ Confidence level
........................ Scope of the test
........................ Severity level of the test
........................ Rounding
.................... Equivalence tests: Difference of parameter estimates
........................ Test name
........................ Conditional evaluation
............................ Test reference
............................ Evaluation condition
........................ Parameter
........................ Upper margin
........................ Lower margin
........................ Confidence level
89

........................ Scope of the test
........................ Severity level of the test
........................ Rounding
.................... Equivalence tests: Ratio of parameter estimates
........................ Test name
........................ Conditional evaluation
............................ Test reference
............................ Evaluation condition
........................ Parameter
........................ Upper margin
........................ Lower margin
........................ Confidence level
........................ Scope of the test
........................ Severity level of the test
........................ Rounding
.................... Equivalence tests: Scaled parameter range
........................ Test name
........................ Conditional evaluation
............................ Test reference
............................ Evaluation condition
........................ Parameter
........................ Upper margin
........................ Lower margin
........................ Scaling parameter
........................ Confidence level
........................ Scope of the test
........................ Severity level of the test
........................ Rounding
.................... Point estimate tests: Parameter estimate
........................ Parameter
........................ Test name
........................ Conditional evaluation
............................ Test reference
............................ Evaluation condition
........................ Upper margin
........................ Lower margin
........................ Scope of the test
........................ Severity level of the test
........................ Rounding
.................... Point estimate tests: Difference of parameter estimates
........................ Parameter
........................ Test name
........................ Conditional evaluation
............................ Test reference
............................ Evaluation condition
........................ Upper margin
........................ Lower margin
........................ Scope of the test
90

Reference Guide | Biological Assay Package Version 26
........................ Severity level of the test
........................ Rounding
.................... Point estimate tests: Ratio of parameter estimates
........................ Parameter
........................ Test name
........................ Conditional evaluation
............................ Test reference
............................ Evaluation condition
........................ Upper margin
........................ Lower margin
........................ Scope of the test
........................ Severity level of the test
........................ Rounding
.................... Test: Normalized difference of asymptotes
........................ Parameter
........................ Test name
........................ Conditional evaluation
............................ Test reference
............................ Evaluation condition
........................ Upper margin
........................ Lower margin
........................ Scope of the test
........................ Severity level of the test
........................ Rounding
.................... Test: Sum-of-squares regression
........................ Test name
........................ Conditional evaluation
............................ Test reference
............................ Evaluation condition
........................ Upper margin
........................ Lower margin
........................ Scope of the test
........................ Severity level of the test
........................ Rounding
.................... Test: Sum-of-squares non-parallelism
........................ Test name
........................ Conditional evaluation
............................ Test reference
............................ Evaluation condition
........................ Upper margin
........................ Lower margin
........................ Scope of the test
........................ Severity level of the test
........................ Rounding
.................... Test: Sum-of-squares non-linearity
........................ Test name
........................ Conditional evaluation
............................ Test reference
91

............................ Evaluation condition
........................ Upper margin
........................ Lower margin
........................ Scope of the test
........................ Severity level of the test
........................ Extent of the test
........................ Rounding
.................... Test: Ratio of sum-of-squares non-linearity to sum-of-squares regression
........................ Test name
........................ Conditional evaluation
............................ Test reference
............................ Evaluation condition
........................ Upper margin
........................ Lower margin
........................ Scope of the test
........................ Severity level of the test
........................ Rounding
.................... Test: Potency value
........................ Test name
........................ Conditional evaluation
............................ Test reference
............................ Evaluation condition
........................ Upper margin
........................ Lower margin
........................ Scope of the test
........................ Severity level of the test
........................ Potency type
........................ Rounding
.................... Test: Potency confidence interval
........................ Test name
........................ Conditional evaluation
............................ Test reference
............................ Evaluation condition
........................ Upper margin
........................ Lower margin
........................ Scope of the test
........................ Severity level of the test
........................ Potency type
........................ Rounding
.................... Test: Log potency range
........................ Test name
........................ Conditional evaluation
............................ Test reference
............................ Evaluation condition
........................ Upper margin
........................ Lower margin
........................ Scope of the test
........................ Severity level of the test
92

Reference Guide | Biological Assay Package Version 26
........................ Rounding
.................... Test: Potency of intermediate dilution
........................ Test name
........................ Conditional evaluation
............................ Test reference
............................ Evaluation condition
........................ Upper margin
........................ Lower margin
........................ No. of dilution factor
........................ Scope of the test
........................ Severity level of the test
........................ Rounding
.................... Test: Potency confidence interval (%)
........................ Test name
........................ Conditional evaluation
............................ Test reference
............................ Evaluation condition
........................ Upper margin
........................ Lower margin
........................ Scope of the test
........................ Severity level of the test
........................ Rounding
.................... Test: Potency range (%)
........................ Test name
........................ Conditional evaluation
............................ Test reference
............................ Evaluation condition
........................ Upper margin
........................ Scope of the test
........................ Severity level of the test
........................ Rounding
.................... Test: Maximal number of outliers
........................ Test name
........................ Conditional evaluation
............................ Test reference
............................ Evaluation condition
........................ Upper margin
........................ Scope of the test
........................ Severity level of the test
........................ Extent of the test
.................... Test: Maximal sequence step CV (%)
........................ Test name
........................ Conditional evaluation
............................ Test reference
............................ Evaluation condition
........................ Upper margin
........................ Lower margin
........................ Scope of the test
93

........................ Severity level of the test
........................ Rounding
.................... Test: Minimal R²
........................ Test name
........................ Conditional evaluation
............................ Test reference
............................ Evaluation condition
........................ Lower margin
........................ Scope of the test
........................ Severity level of the test
........................ Extent of the test
........................ Rounding
.................... Test: Relative LOF error (%)
........................ Test name
........................ Conditional evaluation
............................ Test reference
............................ Evaluation condition
........................ Upper margin
........................ Scope of the test
........................ Severity level of the test
........................ Rounding
.................... Test: Response value range
........................ Test name
........................ Conditional evaluation
............................ Test reference
............................ Evaluation condition
........................ Upper margin
........................ Lower margin
........................ Choice
............................ Scope of the test
............................ Scope of the test
........................ Severity level of the test
........................ Rounding
.................... Test: Weight (W)
........................ Test name
........................ Conditional evaluation
............................ Test reference
............................ Evaluation condition
........................ Lower margin
........................ Scope of the test
........................ Severity level of the test
........................ Rounding
............ Document suitability tests
................ Signature state
.................... Number of signatures
.................... Meaning
.................... Scope of the test
.................... Severity level of the test
94

Reference Guide | Biological Assay Package Version 26
................ Test on user variable
.................... Key
.................... Value
.................... Severity level of the test
.... Settings
........ Graphics
............ Data plot
................ Display horizontal lines
................ Display vertical lines
................ Display legend
................ Tick values of the x-axis
................ Tick values of the y-axis
................ Label of the x-axis
................ Label of the y-axis
................ Label of the response unit
............ Full model
................ Display horizontal lines
................ Display vertical lines
................ Display legend
................ Tick values of the x-axis
................ Tick values of the y-axis
................ Label of the x-axis
................ Label of the y-axis
................ Label of the response unit
............ Restricted model
................ Display horizontal lines
................ Display vertical lines
................ Display legend
................ Tick values of the x-axis
................ Tick values of the y-axis
................ Label of the x-axis
................ Label of the y-axis
................ Label of the response unit
.... Comment
........ Subject
........ Text
........ Linked document
........ Date
........ Author
95

10.2 Dichotomous assay
10.2.1 Document outlineThe structure of Dichotomous assay documents is hierarchical. The Dichotomous assay (Quantalresponse assay) top level has two sections, Setup and Analysis. The following outline shows thefirst and second level of the hierarchical document structure:
• Setup: Contains all properties related to observation data and measurement such as dilutionsteps and response values.
◦ Assay elements: Provides a container for all assay elements. Every assay element is listed onthe third level of the hierarchical document structure.
◦ Preparation schemes: Provides a container for all preparation schemes.
◦ Observation data: Defines the data table.
• Analysis: Defines how assays perform the statistical analysis.
◦ Analytical model: Defines the regression model and analytical properties.
◦ Suitability tests: Provides a container for all suitability tests.
10.2.2 Document structureDichotomous assay (quantal response assay).... Name.... Identification.... Date.... Documentation........ Assay purpose........ User instructions........ Choice............ Substance name............ Substance reference........ Substance identification........ Substance batch/lot number........ Substance sub-batch/sub-lot number........ Substance variant........ Substance class........ Substance description........ Operator............ Choice................ Operator name................ Operator reference............ Role........ Reagent............ Choice
96

Reference Guide | Biological Assay Package Version 26
................ Reagent name
................ Reagent reference
............ Reagent identification
............ Reagent batch/lot number
............ Reagent sub-batch/sub-lot number
............ Reagent variant
............ Reagent class
............ Reagent description
............ Amount
........ Equipment
............ Choice
................ Equipment name
................ Equipment reference
........ User variable
............ Key
............ Value
........ Data source
............ File name
............ Import time stamp
............ Import module identification
............ Import comment
.... Setup
........ Assay elements
............ Standard sample
................ Name
................ Choice
.................... Substance name
.................... Substance reference
................ Substance identification
................ Substance batch/lot number
................ Substance sub-batch/sub-lot number
................ Substance variant
................ Substance class
................ Substance description
................ Observation group ID
................ Preparation scheme
................ Display color
................ User variable
.................... Key
.................... Value
............ Test sample (unknown)
................ Name
................ Choice
.................... Substance name
.................... Substance reference
................ Substance identification
................ Substance batch/lot number
................ Substance sub-batch/sub-lot number
97

................ Substance variant
................ Substance class
................ Substance description
................ Observation group ID
................ Preparation scheme
................ Display color
................ User variable
.................... Key
.................... Value
................ Group
................ Exclude from analysis
............ Control sample
................ Name
................ Choice
.................... Substance name
.................... Substance reference
................ Substance identification
................ Substance batch/lot number
................ Substance sub-batch/sub-lot number
................ Substance variant
................ Substance class
................ Substance description
................ Observation group ID
................ Preparation scheme
................ Display color
................ User variable
.................... Key
.................... Value
................ Exclude from analysis
........ Preparation schemes
............ Preparation scheme
................ Name
................ Step count
................ Replicate count
................ Choice
.................... Absolute potency: Not defined
.................... Absolute potency: Defined by raw material
........................ Assigned/assumed potency (summary)
............................ Assigned/assumed potency
............................ Assigned/assumed potency units
........................ Amount (summary)
............................ Amount
............................ Amount units
........................ Solvent (summary)
............................ Solvent volume
............................ Solvent volume units
.................... Absolute potency: Defined by stock solution
........................ Assigned/assumed potency
98

Reference Guide | Biological Assay Package Version 26
........................ Assigned/assumed potency units
................ Dilution factors
.................... Dilution factor
................ Choice
.................... n-fold geometric sequence
........................ First dose
........................ Base
.................... Linear sequence
........................ First dose
........................ Delta
.................... Defined sequence
........................ Dose value
........ Observation data
............ Observation source
............ Row order
............ Observation group (factor)
............ Sequence step
............ Response (affected)
................ Name
................ Column key
................ Property scope
................ Property key
................ Section key
............ Response (tested)
................ Name
................ Column key
................ Property scope
................ Property key
................ Section key
............ Technical-outlier flag (factor)
............ Choice
................ Boolean column (factor)
................ Date column (factor)
................ Date/time column (factor)
................ Floating-point number column (factor)
................ Integer column (factor)
................ Memo column (factor)
................ Text column (factor)
................ Time column (factor)
.... Analysis
........ Analytical model
............ Choice
................ Model: Probit
................ Model: Logit
............ Simultaneous regression
............ Potency estimation confidence level
............ Advanced settings
................ Logarithm base
99

................ Invert potency
................ Theoretical variance
................ Calculate mean potency estimate of test samples
........ Suitability tests
............ Assay suitability tests
................ Chi-square test / Z-test (hypothesis test)
.................... Type of Chi-square test / Z-test
.................... Choice
........................ Confidence level
........................ p
.................... Scope of the test
.................... Severity level of the test
.................... Rounding
................ Test: Relative-potency value
.................... Upper margin
.................... Lower margin
.................... Scope of the test
.................... Severity level of the test
.................... Rounding
................ Test: Relative-potency confidence interval
.................... Upper margin
.................... Lower margin
.................... Scope of the test
.................... Severity level of the test
.................... Rounding
................ Test: Relative-potency range (%)
.................... Upper margin
.................... Scope of the test
.................... Severity level of the test
.................... Rounding
................ Test: Weight (W)
.................... Lower margin
.................... Scope of the test
.................... Severity level of the test
.................... Rounding
............ Sample suitability tests
................ Chi-square test / Z-test (hypothesis test)
.................... Type of Chi-square test / Z-test
.................... Choice
........................ Confidence level
........................ p
.................... Scope of the test
.................... Severity level of the test
.................... Rounding
................ Test: Relative-potency value
.................... Upper margin
.................... Lower margin
.................... Scope of the test
100
Reference Guide | Biological Assay Package Version 26
.................... Severity level of the test
.................... Rounding
................ Test: Relative-potency confidence interval
.................... Upper margin
.................... Lower margin
.................... Scope of the test
.................... Severity level of the test
.................... Rounding
................ Test: Relative-potency range (%)
.................... Upper margin
.................... Scope of the test
.................... Severity level of the test
.................... Rounding
................ Test: Weight (W)
.................... Lower margin
.................... Scope of the test
.................... Severity level of the test
.................... Rounding
............ Document suitability tests
................ Signature state
.................... Number of signatures
.................... Meaning
.................... Scope of the test
.................... Severity level of the test
................ Test on user variable
.................... Key
.................... Value
.................... Severity level of the test
.... Settings
........ Graphics
............ Linear predictor: Data plot
................ Display horizontal lines
................ Display vertical lines
................ Display legend
................ Tick values of the x-axis
................ Label of the x-axis
................ Label of the y-axis
................ Label of the response unit
............ Linear predictor: Full model
................ Display horizontal lines
................ Display vertical lines
................ Display legend
................ Tick values of the x-axis
................ Label of the x-axis
................ Label of the y-axis
................ Label of the response unit
............ Linear predictor: Restricted model
................ Display horizontal lines
101

................ Display vertical lines
................ Display legend
................ Tick values of the x-axis
................ Label of the x-axis
................ Label of the y-axis
................ Label of the response unit
............ Probability: Data plot
................ Display horizontal lines
................ Display vertical lines
................ Display legend
................ Tick values of the x-axis
................ Label of the x-axis
................ Label of the y-axis
................ Label of the response unit
............ Probability: Full model
................ Display horizontal lines
................ Display vertical lines
................ Display legend
................ Tick values of the x-axis
................ Label of the x-axis
................ Label of the y-axis
................ Label of the response unit
............ Probability: Restricted model
................ Display horizontal lines
................ Display vertical lines
................ Display legend
................ Tick values of the x-axis
................ Label of the x-axis
................ Label of the y-axis
................ Label of the response unit
.... Comment
........ Subject
........ Text
........ Linked document
........ Date
........ Author
10.3 Combination of assay results
10.3.1 Document outlineThe structure of Combination of assay result documents is hierarchical. The Combination ofindependent assay results top level has the following sections:
102

Reference Guide | Biological Assay Package Version 26
• Group information: Allows you to add groups. A group usually corresponds to a reportablevalue. You can use groups to add information with which to identify the substance to thereport.
• Potency data: Allows you to adjust the dataset structure used to summarize Reportable valuesgenerated by Combination of assay results document.
• Tests: Allows you to add various tests to check the validity of the calculation results.
10.3.2 Document structureCombination of independent assay results.... Name.... Date.... Documentation........ Assay purpose........ User instructions........ Choice............ Substance name............ Substance reference........ Substance identification........ Substance batch/lot number........ Substance sub-batch/sub-lot number........ Substance variant........ Substance class........ Substance description........ Operator............ Choice................ Operator name................ Operator reference............ Role........ Equipment............ Choice................ Equipment name................ Equipment reference........ User variable............ Key............ Value.... Group information........ Group............ Name............ Choice................ Substance name................ Substance reference............ Substance identification............ Substance batch/lot number............ Substance sub-batch/sub-lot number
103

............ Substance variant
............ Substance class
............ Substance description
.... Potency data
........ Observation source
........ Row order
........ Document reference
............ Name
............ Column key
............ Edit mode
............ Update mode
............ Document type
............ Template key
............ Folder key
............ Allow subfolders
............ Generator key
............ Document mode
............ Document property filter
............ Section property filter
........ Section
............ Name
............ Column key
............ Property filter
................ Property key
................ Term
........ Group
............ Name
........ Relative potency
............ Name
............ Column key
........ Relative potency lower confidence limit
............ Name
........ Relative potency upper confidence limit
............ Name
........ Absolute potency
............ Name
........ Absolute potency unit
............ Name
........ Absolute potency lower confidence limit
............ Name
........ Absolute potency upper confidence limit
............ Name
........ Column: Model
............ Name
........ Column: Degrees of freedom
............ Name
........ Column: Potency confidence level
............ Name
104

Reference Guide | Biological Assay Package Version 26
........ Column: Assay test state
............ Name
........ Column: Exclude from calculation
.... Potency type
.... Weighting
.... Weighting type
.... Chi-square significance
.... Report homogeneity test
.... Logarithm type
.... Tests
........ Test on potency value
............ Upper margin
............ Lower margin
............ Severity level of the test
............ Scope of the test
............ Rounding
........ Test on potency confidence interval (%)
............ Upper margin
............ Lower margin
............ Severity level of the test
............ Scope of the test
............ Rounding
........ Chi-square homogeneity test
............ Choice
................ Confidence level
................ p
............ Severity level of the test
............ Scope of the test
............ Rounding
........ Test on potency confidence interval
............ Upper margin
............ Lower margin
............ Severity level of the test
............ Scope of the test
............ Rounding
........ Test on potency coefficient of variation (%)
............ Upper margin
............ Severity level of the test
............ Scope of the test
............ Rounding
........ Test on potency range (%)
............ Upper margin
............ Severity level of the test
............ Scope of the test
............ Rounding
........ Test on (log) potency range
............ Upper margin
............ Severity level of the test
105
............ Scope of the test
............ Rounding
........ Test on (log) potency confidence interval length
............ Upper margin
............ Severity level of the test
............ Scope of the test
............ Rounding
........ Test on number of valid assays
............ Upper margin
............ Lower margin
............ Severity level of the test
............ Scope of the test
........ Test on maximal number of failed assays
............ Upper margin
............ Severity level of the test
............ Scope of the test
........ Test on sum of weights
............ Upper margin
............ Lower margin
............ Severity level of the test
............ Scope of the test
............ Rounding
........ Test on mean of CV (%)
............ Upper margin
............ Lower margin
............ Severity level of the test
............ Scope of the test
............ Rounding
........ Signature state
............ Number of signatures
............ Meaning
............ Scope of the test
............ Severity level of the test
.... Comment
........ Subject
........ Text
........ Linked document
........ Date
........ Author
10.4 Equivalence margin development
10.4.1 Document outlineThe structure of Equivalence margin development documents is hierarchical. The Equivalencemargin development for biological assays top level has the following sections:
106

Reference Guide | Biological Assay Package Version 26
• Settings: Allows you to select the calculation you require and set the confidence and tolerancelevels.
• Data table: Allows you to adjust the dataset structure used to calculate the margins.
• Margin development: Allows you to select the test you require to calculate margins.
• Test strategies: Allows you to define the test strategies you require for verification.
• Visualization: Allows you to set the parameters you require for simulation.
10.4.2 Document structureEquivalence margin development for biological assays.... Name.... Identification.... Date.... Settings........ Margin development........ Test strategy verification........ Test strategy visualization........ Confidence level........ Tolerance level.... Data table........ Observation source........ Row order........ Document reference........ Section............ Name............ Column key............ Property filter................ Property key................ Term........ Development assay............ Name........ Verification assay............ Name........ Scientifically acceptable............ Name........ Exclude assay.... Margin development........ Margin symmetry assumption........ Equivalence tests: Parameter estimate............ Upper asymptote (A) (nonlinear models)............ B parameter (nonlinear models)............ C parameter (nonlinear models)............ Lower asymptote (D) (nonlinear models)............ Asymmetry parameter (G) (nonlinear models)
107

............ Slope (linear models)
............ Intercept (linear models)
............ Difference of asymptotes (A - D) (nonlinear models)
............ Ratio of asymptotes (A / D) (nonlinear models)
........ Equivalence tests: Difference of parameter estimates
............ Upper asymptote (A) (nonlinear models)
............ B parameter (nonlinear models)
............ C parameter (nonlinear models)
............ Lower asymptote (D) (nonlinear models)
............ Asymmetry parameter (G) (nonlinear models)
............ Slope (linear models)
............ Intercept (linear models)
............ Difference of asymptotes (A - D) (nonlinear models)
........ Equivalence tests: Ratio of parameter estimates
............ Upper asymptote (A) (nonlinear models)
............ B parameter (nonlinear models)
............ C parameter (nonlinear models)
............ Lower asymptote (D) (nonlinear models)
............ Asymmetry parameter (G) (nonlinear models)
............ Slope (linear models)
............ Intercept (linear models)
............ Difference of asymptotes (A - D) (nonlinear models)
........ Equivalence tests: Scaled parameter range
............ Upper asymptote (A) (nonlinear models)
............ B parameter (nonlinear models)
............ C parameter (nonlinear models)
............ Lower asymptote (D) (nonlinear models)
............ Asymmetry parameter (G) (nonlinear models)
............ Slope (linear models)
............ Intercept (linear models)
............ Difference of asymptotes (A - D) (nonlinear models, Standard only)
........ Point estimate tests: Parameter estimate
............ Upper asymptote (A) (nonlinear models)
............ B parameter (nonlinear models)
............ C parameter (nonlinear models)
............ Lower asymptote (D) (nonlinear models)
............ Asymmetry parameter (G) (nonlinear models)
............ Slope (linear models)
............ Intercept (linear models)
............ Slope (nonlinear models)
............ Difference of asymptotes (A - D) (nonlinear models)
............ Ratio of asymptotes (A / D) (nonlinear models)
........ Point estimate tests: Difference of parameter estimates
............ Upper asymptote (A) (nonlinear models)
............ B parameter (nonlinear models)
............ C parameter (nonlinear models)
............ Lower asymptote (D) (nonlinear models)
............ Asymmetry parameter (G) (nonlinear models)
108

Reference Guide | Biological Assay Package Version 26
............ Slope (linear models)
............ Intercept (linear models)
............ Difference of asymptotes (A - D) (nonlinear models)
........ Point estimate tests: Ratio of parameter estimates
............ Upper asymptote (A) (nonlinear models)
............ B parameter (nonlinear models)
............ C parameter (nonlinear models)
............ Lower asymptote (D) (nonlinear models)
............ Asymmetry parameter (G) (nonlinear models)
............ Slope (linear models)
............ Intercept (linear models)
............ Difference of asymptotes (A - D) (nonlinear models)
........ Tests: Normalized difference of asymptotes
............ Test: Normalized difference of Upper asymptotes
............ Test: Normalized difference of Lower asymptotes
........ Additional tests
............ Test: Sum-of-squares regression
............ Test: Sum-of-squares non-parallelism
............ Test: Sum-of-squares non-linearity
................ Test: Sum-of-squares non-linearity
................ Test: Sum-of-squares non-linearity (Standard only)
................ Test: Sum-of-squares non-linearity (Test/Control)
............ Test: Ratio of sum-of-squares non-linearity to sum-of-squares regression
............ Test: Residual error
............ Test: Pure error
.... Test strategies
........ Strategy
............ Name
............ Equivalence tests: Parameter estimate
................ Upper asymptote (A) (nonlinear models)
.................... Choice
........................ Upper margin (calculated value)
........................ Upper margin (manual input)
.................... Choice
........................ Lower margin (calculated value)
........................ Lower margin (manual input)
.................... Scope of the test
................ B parameter (nonlinear models)
.................... Choice
........................ Upper margin (calculated value)
........................ Upper margin (manual input)
.................... Choice
........................ Lower margin (calculated value)
........................ Lower margin (manual input)
.................... Scope of the test
................ C parameter (nonlinear models)
.................... Choice
........................ Upper margin (calculated value)
109

........................ Upper margin (manual input)
.................... Choice
........................ Lower margin (calculated value)
........................ Lower margin (manual input)
.................... Scope of the test
................ Lower asymptote (D) (nonlinear models)
.................... Choice
........................ Upper margin (calculated value)
........................ Upper margin (manual input)
.................... Choice
........................ Lower margin (calculated value)
........................ Lower margin (manual input)
.................... Scope of the test
................ Asymmetry parameter (G) (nonlinear models)
.................... Choice
........................ Upper margin (calculated value)
........................ Upper margin (manual input)
.................... Choice
........................ Lower margin (calculated value)
........................ Lower margin (manual input)
.................... Scope of the test
................ Slope (linear models)
.................... Choice
........................ Upper margin (calculated value)
........................ Upper margin (manual input)
.................... Choice
........................ Lower margin (calculated value)
........................ Lower margin (manual input)
.................... Scope of the test
................ Intercept (linear models)
.................... Choice
........................ Upper margin (calculated value)
........................ Upper margin (manual input)
.................... Choice
........................ Lower margin (calculated value)
........................ Lower margin (manual input)
.................... Scope of the test
................ Difference of asymptotes (A - D) (nonlinear models)
.................... Choice
........................ Upper margin (calculated value)
........................ Upper margin (manual input)
.................... Choice
........................ Lower margin (calculated value)
........................ Lower margin (manual input)
.................... Scope of the test
................ Ratio of asymptotes (A / D) (nonlinear models)
.................... Choice
........................ Upper margin (calculated value)
110

Reference Guide | Biological Assay Package Version 26
........................ Upper margin (manual input)
.................... Choice
........................ Lower margin (calculated value)
........................ Lower margin (manual input)
.................... Scope of the test
............ Equivalence tests: Difference of parameter estimates
................ Upper asymptote (A) (nonlinear models)
.................... Choice
........................ Upper margin (calculated value)
........................ Upper margin (manual input)
.................... Choice
........................ Lower margin (calculated value)
........................ Lower margin (manual input)
................ B parameter (nonlinear models)
.................... Choice
........................ Upper margin (calculated value)
........................ Upper margin (manual input)
.................... Choice
........................ Lower margin (calculated value)
........................ Lower margin (manual input)
................ C parameter (nonlinear models)
.................... Choice
........................ Upper margin (calculated value)
........................ Upper margin (manual input)
.................... Choice
........................ Lower margin (calculated value)
........................ Lower margin (manual input)
................ Lower asymptote (D) (nonlinear models)
.................... Choice
........................ Upper margin (calculated value)
........................ Upper margin (manual input)
.................... Choice
........................ Lower margin (calculated value)
........................ Lower margin (manual input)
................ Asymmetry parameter (G) (nonlinear models)
.................... Choice
........................ Upper margin (calculated value)
........................ Upper margin (manual input)
.................... Choice
........................ Lower margin (calculated value)
........................ Lower margin (manual input)
................ Slope (linear models)
.................... Choice
........................ Upper margin (calculated value)
........................ Upper margin (manual input)
.................... Choice
........................ Lower margin (calculated value)
........................ Lower margin (manual input)
111
................ Intercept (linear models)
.................... Choice
........................ Upper margin (calculated value)
........................ Upper margin (manual input)
.................... Choice
........................ Lower margin (calculated value)
........................ Lower margin (manual input)
................ Difference of asymptotes (A - D) (nonlinear models)
.................... Choice
........................ Upper margin (calculated value)
........................ Upper margin (manual input)
.................... Choice
........................ Lower margin (calculated value)
........................ Lower margin (manual input)
............ Equivalence tests: Ratio of parameter estimates
................ Upper asymptote (A) (nonlinear models)
.................... Choice
........................ Upper margin (calculated value)
........................ Upper margin (manual input)
.................... Choice
........................ Lower margin (calculated value)
........................ Lower margin (manual input)
................ B parameter (nonlinear models)
.................... Choice
........................ Upper margin (calculated value)
........................ Upper margin (manual input)
.................... Choice
........................ Lower margin (calculated value)
........................ Lower margin (manual input)
................ C parameter (nonlinear models)
.................... Choice
........................ Upper margin (calculated value)
........................ Upper margin (manual input)
.................... Choice
........................ Lower margin (calculated value)
........................ Lower margin (manual input)
................ Lower asymptote (D) (nonlinear models)
.................... Choice
........................ Upper margin (calculated value)
........................ Upper margin (manual input)
.................... Choice
........................ Lower margin (calculated value)
........................ Lower margin (manual input)
................ Asymmetry parameter (G) (nonlinear models)
.................... Choice
........................ Upper margin (calculated value)
........................ Upper margin (manual input)
.................... Choice
112

Reference Guide | Biological Assay Package Version 26
........................ Lower margin (calculated value)
........................ Lower margin (manual input)
................ Slope (linear models)
.................... Choice
........................ Upper margin (calculated value)
........................ Upper margin (manual input)
.................... Choice
........................ Lower margin (calculated value)
........................ Lower margin (manual input)
................ Intercept (linear models)
.................... Choice
........................ Upper margin (calculated value)
........................ Upper margin (manual input)
.................... Choice
........................ Lower margin (calculated value)
........................ Lower margin (manual input)
................ Difference of asymptotes (A - D) (nonlinear models)
.................... Choice
........................ Upper margin (calculated value)
........................ Upper margin (manual input)
.................... Choice
........................ Lower margin (calculated value)
........................ Lower margin (manual input)
............ Equivalence tests: Scaled parameter range
................ Upper asymptote (A) (nonlinear models)
.................... Choice
........................ Upper margin (calculated value)
........................ Upper margin (manual input)
.................... Choice
........................ Lower margin (calculated value)
........................ Lower margin (manual input)
.................... Choice
........................ Reference mean (calculated value)
........................ Reference mean (manual input)
................ B parameter (nonlinear models)
.................... Choice
........................ Upper margin (calculated value)
........................ Upper margin (manual input)
.................... Choice
........................ Lower margin (calculated value)
........................ Lower margin (manual input)
.................... Choice
........................ Reference mean (calculated value)
........................ Reference mean (manual input)
................ C parameter (nonlinear models)
.................... Choice
........................ Upper margin (calculated value)
........................ Upper margin (manual input)
113

.................... Choice
........................ Lower margin (calculated value)
........................ Lower margin (manual input)
.................... Choice
........................ Reference mean (calculated value)
........................ Reference mean (manual input)
................ Lower asymptote (D) (nonlinear models)
.................... Choice
........................ Upper margin (calculated value)
........................ Upper margin (manual input)
.................... Choice
........................ Lower margin (calculated value)
........................ Lower margin (manual input)
.................... Choice
........................ Reference mean (calculated value)
........................ Reference mean (manual input)
................ Asymmetry parameter (G) (nonlinear models)
.................... Choice
........................ Upper margin (calculated value)
........................ Upper margin (manual input)
.................... Choice
........................ Lower margin (calculated value)
........................ Lower margin (manual input)
.................... Choice
........................ Reference mean (calculated value)
........................ Reference mean (manual input)
................ Slope (linear models)
.................... Choice
........................ Upper margin (calculated value)
........................ Upper margin (manual input)
.................... Choice
........................ Lower margin (calculated value)
........................ Lower margin (manual input)
.................... Choice
........................ Reference mean (calculated value)
........................ Reference mean (manual input)
................ Intercept (linear models)
.................... Choice
........................ Upper margin (calculated value)
........................ Upper margin (manual input)
.................... Choice
........................ Lower margin (calculated value)
........................ Lower margin (manual input)
.................... Choice
........................ Reference mean (calculated value)
........................ Reference mean (manual input)
................ Difference of asymptotes (A - D) (nonlinear models, Standard only)
.................... Choice
114

Reference Guide | Biological Assay Package Version 26
........................ Upper margin (calculated value)
........................ Upper margin (manual input)
.................... Choice
........................ Lower margin (calculated value)
........................ Lower margin (manual input)
.................... Choice
........................ Reference mean (calculated value)
........................ Reference mean (manual input)
.................... Scope of the test
............ Point estimate tests: Parameter estimate
................ Upper asymptote (A) (nonlinear models)
.................... Choice
........................ Upper margin (calculated value)
........................ Upper margin (manual input)
.................... Choice
........................ Lower margin (calculated value)
........................ Lower margin (manual input)
.................... Scope of the test
................ B parameter (nonlinear models)
.................... Choice
........................ Upper margin (calculated value)
........................ Upper margin (manual input)
.................... Choice
........................ Lower margin (calculated value)
........................ Lower margin (manual input)
.................... Scope of the test
................ C parameter (nonlinear models)
.................... Choice
........................ Upper margin (calculated value)
........................ Upper margin (manual input)
.................... Choice
........................ Lower margin (calculated value)
........................ Lower margin (manual input)
.................... Scope of the test
................ Lower asymptote (D) (nonlinear models)
.................... Choice
........................ Upper margin (calculated value)
........................ Upper margin (manual input)
.................... Choice
........................ Lower margin (calculated value)
........................ Lower margin (manual input)
.................... Scope of the test
................ Asymmetry parameter (G) (nonlinear models)
.................... Choice
........................ Upper margin (calculated value)
........................ Upper margin (manual input)
.................... Choice
........................ Lower margin (calculated value)
115

........................ Lower margin (manual input)
.................... Scope of the test
................ Slope (linear models)
.................... Choice
........................ Upper margin (calculated value)
........................ Upper margin (manual input)
.................... Choice
........................ Lower margin (calculated value)
........................ Lower margin (manual input)
.................... Scope of the test
................ Intercept (linear models)
.................... Choice
........................ Upper margin (calculated value)
........................ Upper margin (manual input)
.................... Choice
........................ Lower margin (calculated value)
........................ Lower margin (manual input)
.................... Scope of the test
................ Slope (nonlinear models)
.................... Choice
........................ Upper margin (calculated value)
........................ Upper margin (manual input)
.................... Choice
........................ Lower margin (calculated value)
........................ Lower margin (manual input)
.................... Scope of the test
................ Difference of asymptotes (A - D) (nonlinear models)
.................... Choice
........................ Upper margin (calculated value)
........................ Upper margin (manual input)
.................... Choice
........................ Lower margin (calculated value)
........................ Lower margin (manual input)
.................... Scope of the test
................ Ratio of asymptotes (A / D) (nonlinear models)
.................... Choice
........................ Upper margin (calculated value)
........................ Upper margin (manual input)
.................... Choice
........................ Lower margin (calculated value)
........................ Lower margin (manual input)
.................... Scope of the test
............ Point estimate tests: Difference of parameter estimates
................ Upper asymptote (A) (nonlinear models)
.................... Choice
........................ Upper margin (calculated value)
........................ Upper margin (manual input)
.................... Choice
116

Reference Guide | Biological Assay Package Version 26
........................ Lower margin (calculated value)
........................ Lower margin (manual input)
................ B parameter (nonlinear models)
.................... Choice
........................ Upper margin (calculated value)
........................ Upper margin (manual input)
.................... Choice
........................ Lower margin (calculated value)
........................ Lower margin (manual input)
................ C parameter (nonlinear models)
.................... Choice
........................ Upper margin (calculated value)
........................ Upper margin (manual input)
.................... Choice
........................ Lower margin (calculated value)
........................ Lower margin (manual input)
................ Lower asymptote (D) (nonlinear models)
.................... Choice
........................ Upper margin (calculated value)
........................ Upper margin (manual input)
.................... Choice
........................ Lower margin (calculated value)
........................ Lower margin (manual input)
................ Asymmetry parameter (G) (nonlinear models)
.................... Choice
........................ Upper margin (calculated value)
........................ Upper margin (manual input)
.................... Choice
........................ Lower margin (calculated value)
........................ Lower margin (manual input)
................ Slope (linear models)
.................... Choice
........................ Upper margin (calculated value)
........................ Upper margin (manual input)
.................... Choice
........................ Lower margin (calculated value)
........................ Lower margin (manual input)
................ Intercept (linear models)
.................... Choice
........................ Upper margin (calculated value)
........................ Upper margin (manual input)
.................... Choice
........................ Lower margin (calculated value)
........................ Lower margin (manual input)
................ Difference of asymptotes (A - D) (nonlinear models)
.................... Choice
........................ Upper margin (calculated value)
........................ Upper margin (manual input)
117

.................... Choice
........................ Lower margin (calculated value)
........................ Lower margin (manual input)
............ Point estimate tests: Ratio of parameter estimates
................ Upper asymptote (A) (nonlinear models)
.................... Choice
........................ Upper margin (calculated value)
........................ Upper margin (manual input)
.................... Choice
........................ Lower margin (calculated value)
........................ Lower margin (manual input)
................ B parameter (nonlinear models)
.................... Choice
........................ Upper margin (calculated value)
........................ Upper margin (manual input)
.................... Choice
........................ Lower margin (calculated value)
........................ Lower margin (manual input)
................ C parameter (nonlinear models)
.................... Choice
........................ Upper margin (calculated value)
........................ Upper margin (manual input)
.................... Choice
........................ Lower margin (calculated value)
........................ Lower margin (manual input)
................ Lower asymptote (D) (nonlinear models)
.................... Choice
........................ Upper margin (calculated value)
........................ Upper margin (manual input)
.................... Choice
........................ Lower margin (calculated value)
........................ Lower margin (manual input)
................ Asymmetry parameter (G) (nonlinear models)
.................... Choice
........................ Upper margin (calculated value)
........................ Upper margin (manual input)
.................... Choice
........................ Lower margin (calculated value)
........................ Lower margin (manual input)
................ Slope (linear models)
.................... Choice
........................ Upper margin (calculated value)
........................ Upper margin (manual input)
.................... Choice
........................ Lower margin (calculated value)
........................ Lower margin (manual input)
................ Intercept (linear models)
.................... Choice
118

Reference Guide | Biological Assay Package Version 26
........................ Upper margin (calculated value)
........................ Upper margin (manual input)
.................... Choice
........................ Lower margin (calculated value)
........................ Lower margin (manual input)
................ Difference of asymptotes (A - D) (nonlinear models)
.................... Choice
........................ Upper margin (calculated value)
........................ Upper margin (manual input)
.................... Choice
........................ Lower margin (calculated value)
........................ Lower margin (manual input)
............ Tests: Normalized difference of asymptotes
................ Test: Normalized difference of Upper asymptotes
.................... Choice
........................ Upper margin (calculated value)
........................ Upper margin (manual input)
.................... Choice
........................ Lower margin (calculated value)
........................ Lower margin (manual input)
................ Test: Normalized difference of Lower asymptotes
.................... Choice
........................ Upper margin (calculated value)
........................ Upper margin (manual input)
.................... Choice
........................ Lower margin (calculated value)
........................ Lower margin (manual input)
............ Additional tests
................ Test: Sum-of-squares regression
.................... Choice
........................ Upper margin (calculated value)
........................ Upper margin (manual input)
.................... Choice
........................ Lower margin (calculated value)
........................ Lower margin (manual input)
................ Test: Sum-of-squares non-parallelism
.................... Choice
........................ Upper margin (calculated value)
........................ Upper margin (manual input)
................ Test: Sum-of-squares non-linearity
.................... Test: Sum-of-squares non-linearity
........................ Choice
............................ Upper margin (calculated value)
............................ Upper margin (manual input)
.................... Test: Sum-of-squares non-linearity (Standard only)
........................ Choice
............................ Upper margin (calculated value)
............................ Upper margin (manual input)
119

.................... Test: Sum-of-squares non-linearity (Test/Control)
........................ Choice
............................ Upper margin (calculated value)
............................ Upper margin (manual input)
................ Test: Ratio of sum-of-squares non-linearity to sum-of-squares regression
.................... Choice
........................ Upper margin (calculated value)
........................ Upper margin (manual input)
.................... Choice
........................ Lower margin (calculated value)
........................ Lower margin (manual input)
................ Test: Residual error
.................... Choice
........................ Upper margin (calculated value)
........................ Upper margin (manual input)
.................... Choice
........................ Lower margin (calculated value)
........................ Lower margin (manual input)
................ Test: Pure error
.................... Choice
........................ Upper margin (calculated value)
........................ Upper margin (manual input)
.................... Choice
........................ Lower margin (calculated value)
........................ Lower margin (manual input)
.... Visualization
........ Max simulations
........ Max configurations
........ Model
........ Logarithm base
........ Degrees of freedom
........ Transformed dose range
............ Transformed dose minimum
............ Transformed dose maximum
........ Response range
............ Response minimum
............ Response maximum
........ Simulation space
............ Upper asymptote (A) (nonlinear models)
................ Standard error
............ B parameter (nonlinear models)
................ Standard error
............ C parameter (nonlinear models)
................ Standard error
............ Lower asymptote (D) (nonlinear models)
................ Standard error
............ Asymmetry parameter (G) (nonlinear models)
................ Standard error
120

Reference Guide | Biological Assay Package Version 26
............ Intercept (linear models)
................ Standard error
............ Slope (linear models)
................ Standard error
............ Covariances
................ Cov(A,D) standard sample
................ cov(A,D) test/control sample
.... Comment
........ Subject
........ Text
........ Linked document
........ Date
........ Author
10.5 Basic bioassay protocol
10.5.1 Document outlineThe structure of Basic bioassay protocol documents is hierarchical. The Basic bioassay protocoltop level has the following sections:
• Mode selection: Allows you to select one of the supported protocol modes, Assay replicate orAssay element.
• Combination calculation: Define a Combination calculation to aggregate the potency dataof all Test sample as they occur in the (calculated) assay replicates that are generated by theprotocol.
• Templates: Allows you to specify the templates you need to generate assay replicates andcombination calculations.
• Reportable values: Allows you to adjust the dataset structure used to summarize Reportablevalues generated by the Combination of assay results documents.
10.5.2 Document structureBasic bioassay protocol.... Name.... Documentation........ User instructions........ Choice............ Substance name............ Substance reference........ Substance identification........ Substance batch/lot number........ Substance sub-batch/sub-lot number
121

........ Substance variant
........ Substance class
........ Substance description
........ Operator
............ Choice
................ Operator name
................ Operator reference
............ Role
.... Choice
........ Mode: Assay replicate
............ Number of replicates
........ Mode: Assay element
............ Standard sample
................ Name
................ Observation group ID
................ Choice
.................... Substance name
.................... Substance reference
................ Substance identification
................ Substance batch/lot number
................ Substance sub-batch/sub-lot number
................ Substance variant
................ Substance class
................ Substance description
................ Choice
.................... Absolute potency: Defined by template
.................... Absolute potency: Not defined
.................... Absolute potency: Defined by raw material
........................ Assigned/assumed potency (summary)
............................ Assigned/assumed potency
............................ Assigned/assumed potency units
........................ Amount (summary)
............................ Amount
............................ Amount units
........................ Solvent (summary)
............................ Solvent volume
............................ Solvent volume units
.................... Absolute potency: Defined by stock solution
........................ Assigned/assumed potency
........................ Assigned/assumed potency units
................ Choice
.................... Dilution factors: Defined by template
.................... Dilution factors: Manual input
........................ Dilution factor
............ Test sample (unknown)
................ Name
................ Observation group ID
................ Group
122

Reference Guide | Biological Assay Package Version 26
................ Choice
.................... Substance name
.................... Substance reference
................ Substance identification
................ Substance batch/lot number
................ Substance sub-batch/sub-lot number
................ Substance variant
................ Substance class
................ Substance description
................ Choice
.................... Absolute potency: Defined by template
.................... Absolute potency: Not defined
.................... Absolute potency: Defined by raw material
........................ Assigned/assumed potency (summary)
............................ Assigned/assumed potency
............................ Assigned/assumed potency units
........................ Amount (summary)
............................ Amount
............................ Amount units
........................ Solvent (summary)
............................ Solvent volume
............................ Solvent volume units
.................... Absolute potency: Defined by stock solution
........................ Assigned/assumed potency
........................ Assigned/assumed potency units
................ Choice
.................... Dilution factors: Defined by template
.................... Dilution factors: Manual input
........................ Dilution factor
................ Number of replicates
................ Combination calculation (sample only)
.................... Configuration name
.................... Document name
.................... Combination document reference
............ Control sample
................ Name
................ Observation group ID
................ Choice
.................... Substance name
.................... Substance reference
................ Substance identification
................ Substance batch/lot number
................ Substance sub-batch/sub-lot number
................ Substance variant
................ Substance class
................ Substance description
................ Choice
.................... Absolute potency: Defined by template
123

.................... Absolute potency: Not defined
.................... Absolute potency: Defined by raw material
........................ Assigned/assumed potency (summary)
............................ Assigned/assumed potency
............................ Assigned/assumed potency units
........................ Amount (summary)
............................ Amount
............................ Amount units
........................ Solvent (summary)
............................ Solvent volume
............................ Solvent volume units
.................... Absolute potency: Defined by stock solution
........................ Assigned/assumed potency
........................ Assigned/assumed potency units
................ Choice
.................... Dilution factors: Defined by template
.................... Dilution factors: Manual input
........................ Dilution factor
................ Number of replicates
............ Control line
................ Name
................ Observation group ID
................ Choice
.................... Substance name
.................... Substance reference
................ Substance identification
................ Substance batch/lot number
................ Substance sub-batch/sub-lot number
................ Substance variant
................ Substance class
................ Substance description
.... Assay replicate
........ Assay replicate document
.... Combination calculation
........ Configuration name
........ Document name
........ Combination document reference
.... Templates
........ Assay templates
............ Template selection strategy
............ Protect observation group ID
............ Assay template
................ Template
................ Valid for replicate
........ Combination calculation templates
............ Configuration
................ Configuration name
................ Template
124

Reference Guide | Biological Assay Package Version 26
.................... Config
........................ Document type
........................ Document property filter
........................ Section property filter
.... Reportable values
........ Observation source
........ Row order
........ Document reference
............ Name
............ Column key
............ Edit mode
............ Update mode
............ Template key
............ Folder key
............ Allow subfolders
............ Document mode
............ Document property filter
............ Section property filter
........ Group
............ Name
............ Column key
............ Property filter
........ Selected method
............ Name
........ Absolute potency
............ Name
........ Absolute potency unit
............ Name
........ Absolute potency lower confidence limit
............ Name
........ Absolute potency upper confidence limit
............ Name
........ Absolute potency status
............ Name
........ Relative potency
............ Name
........ Relative potency lower confidence limit
............ Name
........ Relative potency upper confidence limit
............ Name
........ Relative potency status
............ Name
.... Comment
........ Subject
........ Text
........ Linked document
........ Date
........ Author
125

10.6 Control chart
10.6.1 Document outlineThe structure of Control chart documents is hierarchical. The Control chart top level has thefollowing sections:
• Charts: Allows you to add charts to the document. You have to add at least one chart.
• Data table: Allows you to adjust the dataset structure used to generate the charts.
10.6.2 Document structureControl chart.... Name.... Date.... Charts........ Chart............ Name............ Control limit definition................ Name................ Upper control limit................ Lower control limit................ Start time................ End time................ Display color................ Severity level of the control limit................ Control limit comment............ Graphics settings................ Display horizontal lines................ Display vertical lines................ Display legend................ Label of the x-axis................ Label of the y-axis................ Label of the response unit................ Connect points by line............ Marker definition................ Name................ Marker comment................ Marker time................ Display color.... Data table........ Observation source........ Row order............ Direction
126

Reference Guide | Biological Assay Package Version 26
............ Column key
........ Document reference
........ Section
........ Exclude from analysis
........ Date/time column (factor)
............ Name
............ Column key
............ Property scope
............ Property key
............ Section key
........ Floating-point number column (factor)
............ Chart
............ Display color
........ Single-line text
............ Display color
.... Comment
........ Subject
........ Text
........ Linked document
........ Date
........ Author
10.7 Test system definition
10.7.1 Document outlineThe structure of Test system definition documents is hierarchical. The Test system forQuantitative response assay top level has one section, Suitability tests. The following outlineshows the first and second level of the hierarchical document structure:
• Suitability tests: Provides a container for all suitability tests.
◦ Assay suitability tests: Allows you to add the Assay suitability tests you require.
◦ Sample suitability tests: Allows you to add the Sample suitability tests you require.
◦ Document suitability tests: Allows you to add the Document suitability tests you require.
10.7.2 Document structureTest system for quantitative response assay.... Name.... Identification.... Date.... Source.... Creation time.... Suitability tests........ Assay suitability tests
127

............ Choice
................ F-test (hypothesis test)
.................... Test name
.................... Conditional evaluation
........................ Test reference
........................ Evaluation condition
.................... Type of F-test
.................... Choice
........................ Confidence level
........................ p
.................... Scope of the test
.................... Severity level of the test
.................... Rounding
................ Equivalence tests: Parameter estimate
.................... Test name
.................... Conditional evaluation
........................ Test reference
........................ Evaluation condition
.................... Parameter
.................... Upper margin
.................... Lower margin
.................... Confidence level
.................... Scope of the test
.................... Severity level of the test
.................... Rounding
................ Equivalence tests: Difference of parameter estimates
.................... Test name
.................... Conditional evaluation
........................ Test reference
........................ Evaluation condition
.................... Parameter
.................... Upper margin
.................... Lower margin
.................... Confidence level
.................... Scope of the test
.................... Severity level of the test
.................... Rounding
................ Equivalence tests: Ratio of parameter estimates
.................... Test name
.................... Conditional evaluation
........................ Test reference
........................ Evaluation condition
.................... Parameter
.................... Upper margin
.................... Lower margin
.................... Confidence level
.................... Scope of the test
.................... Severity level of the test
128

Reference Guide | Biological Assay Package Version 26
.................... Rounding
................ Equivalence tests: Scaled parameter range
.................... Test name
.................... Conditional evaluation
........................ Test reference
........................ Evaluation condition
.................... Parameter
.................... Upper margin
.................... Lower margin
.................... Scaling parameter
.................... Confidence level
.................... Scope of the test
.................... Severity level of the test
.................... Rounding
................ Point estimate tests: Parameter estimate
.................... Parameter
.................... Test name
.................... Conditional evaluation
........................ Test reference
........................ Evaluation condition
.................... Upper margin
.................... Lower margin
.................... Scope of the test
.................... Severity level of the test
.................... Rounding
................ Point estimate tests: Difference of parameter estimates
.................... Parameter
.................... Test name
.................... Conditional evaluation
........................ Test reference
........................ Evaluation condition
.................... Upper margin
.................... Lower margin
.................... Scope of the test
.................... Severity level of the test
.................... Rounding
................ Point estimate tests: Ratio of parameter estimates
.................... Parameter
.................... Test name
.................... Conditional evaluation
........................ Test reference
........................ Evaluation condition
.................... Upper margin
.................... Lower margin
.................... Scope of the test
.................... Severity level of the test
.................... Rounding
................ Test: Normalized difference of asymptotes
129

.................... Parameter
.................... Test name
.................... Conditional evaluation
........................ Test reference
........................ Evaluation condition
.................... Upper margin
.................... Lower margin
.................... Scope of the test
.................... Severity level of the test
.................... Rounding
................ Test: Sum-of-squares regression
.................... Test name
.................... Conditional evaluation
........................ Test reference
........................ Evaluation condition
.................... Upper margin
.................... Lower margin
.................... Scope of the test
.................... Severity level of the test
.................... Rounding
................ Test: Sum-of-squares non-parallelism
.................... Test name
.................... Conditional evaluation
........................ Test reference
........................ Evaluation condition
.................... Upper margin
.................... Lower margin
.................... Scope of the test
.................... Severity level of the test
.................... Rounding
................ Test: Sum-of-squares non-linearity
.................... Test name
.................... Conditional evaluation
........................ Test reference
........................ Evaluation condition
.................... Upper margin
.................... Lower margin
.................... Scope of the test
.................... Severity level of the test
.................... Extent of the test
.................... Rounding
................ Test: Ratio of sum-of-squares non-linearity to sum-of-squares regression
.................... Test name
.................... Conditional evaluation
........................ Test reference
........................ Evaluation condition
.................... Upper margin
.................... Lower margin
130

Reference Guide | Biological Assay Package Version 26
.................... Scope of the test
.................... Severity level of the test
.................... Rounding
................ Test: Potency value
.................... Test name
.................... Conditional evaluation
........................ Test reference
........................ Evaluation condition
.................... Upper margin
.................... Lower margin
.................... Scope of the test
.................... Severity level of the test
.................... Potency type
.................... Rounding
................ Test: Potency confidence interval
.................... Test name
.................... Conditional evaluation
........................ Test reference
........................ Evaluation condition
.................... Upper margin
.................... Lower margin
.................... Scope of the test
.................... Severity level of the test
.................... Potency type
.................... Rounding
................ Test: Log potency range
.................... Test name
.................... Conditional evaluation
........................ Test reference
........................ Evaluation condition
.................... Upper margin
.................... Lower margin
.................... Scope of the test
.................... Severity level of the test
.................... Rounding
................ Test: Potency of intermediate dilution
.................... Test name
.................... Conditional evaluation
........................ Test reference
........................ Evaluation condition
.................... Upper margin
.................... Lower margin
.................... No. of dilution factor
.................... Scope of the test
.................... Severity level of the test
.................... Rounding
................ Test: Potency confidence interval (%)
.................... Test name
131

.................... Conditional evaluation
........................ Test reference
........................ Evaluation condition
.................... Upper margin
.................... Lower margin
.................... Scope of the test
.................... Severity level of the test
.................... Rounding
................ Test: Potency range (%)
.................... Test name
.................... Conditional evaluation
........................ Test reference
........................ Evaluation condition
.................... Upper margin
.................... Scope of the test
.................... Severity level of the test
.................... Rounding
................ Test: Maximal number of outliers
.................... Test name
.................... Conditional evaluation
........................ Test reference
........................ Evaluation condition
.................... Upper margin
.................... Scope of the test
.................... Severity level of the test
.................... Extent of the test
................ Test: Maximal sequence step CV (%)
.................... Test name
.................... Conditional evaluation
........................ Test reference
........................ Evaluation condition
.................... Upper margin
.................... Lower margin
.................... Scope of the test
.................... Severity level of the test
.................... Rounding
................ Test: Minimal R²
.................... Test name
.................... Conditional evaluation
........................ Test reference
........................ Evaluation condition
.................... Lower margin
.................... Scope of the test
.................... Severity level of the test
.................... Extent of the test
.................... Rounding
................ Test: Relative LOF error (%)
.................... Test name
132

Reference Guide | Biological Assay Package Version 26
.................... Conditional evaluation
........................ Test reference
........................ Evaluation condition
.................... Upper margin
.................... Scope of the test
.................... Severity level of the test
.................... Rounding
................ Test: Response value range
.................... Test name
.................... Conditional evaluation
........................ Test reference
........................ Evaluation condition
.................... Upper margin
.................... Lower margin
.................... Choice
........................ Scope of the test
........................ Scope of the test
.................... Severity level of the test
.................... Rounding
................ Test: Weight (W)
.................... Test name
.................... Conditional evaluation
........................ Test reference
........................ Evaluation condition
.................... Lower margin
.................... Scope of the test
.................... Severity level of the test
.................... Rounding
........ Sample suitability tests
............ Choice
................ F-test (hypothesis test)
.................... Test name
.................... Conditional evaluation
........................ Test reference
........................ Evaluation condition
.................... Type of F-test
.................... Choice
........................ Confidence level
........................ p
.................... Scope of the test
.................... Severity level of the test
.................... Rounding
................ Equivalence tests: Parameter estimate
.................... Test name
.................... Conditional evaluation
........................ Test reference
........................ Evaluation condition
.................... Parameter
133

.................... Upper margin
.................... Lower margin
.................... Confidence level
.................... Scope of the test
.................... Severity level of the test
.................... Rounding
................ Equivalence tests: Difference of parameter estimates
.................... Test name
.................... Conditional evaluation
........................ Test reference
........................ Evaluation condition
.................... Parameter
.................... Upper margin
.................... Lower margin
.................... Confidence level
.................... Scope of the test
.................... Severity level of the test
.................... Rounding
................ Equivalence tests: Ratio of parameter estimates
.................... Test name
.................... Conditional evaluation
........................ Test reference
........................ Evaluation condition
.................... Parameter
.................... Upper margin
.................... Lower margin
.................... Confidence level
.................... Scope of the test
.................... Severity level of the test
.................... Rounding
................ Equivalence tests: Scaled parameter range
.................... Test name
.................... Conditional evaluation
........................ Test reference
........................ Evaluation condition
.................... Parameter
.................... Upper margin
.................... Lower margin
.................... Scaling parameter
.................... Confidence level
.................... Scope of the test
.................... Severity level of the test
.................... Rounding
................ Point estimate tests: Parameter estimate
.................... Parameter
.................... Test name
.................... Conditional evaluation
........................ Test reference
134

Reference Guide | Biological Assay Package Version 26
........................ Evaluation condition
.................... Upper margin
.................... Lower margin
.................... Scope of the test
.................... Severity level of the test
.................... Rounding
................ Point estimate tests: Difference of parameter estimates
.................... Parameter
.................... Test name
.................... Conditional evaluation
........................ Test reference
........................ Evaluation condition
.................... Upper margin
.................... Lower margin
.................... Scope of the test
.................... Severity level of the test
.................... Rounding
................ Point estimate tests: Ratio of parameter estimates
.................... Parameter
.................... Test name
.................... Conditional evaluation
........................ Test reference
........................ Evaluation condition
.................... Upper margin
.................... Lower margin
.................... Scope of the test
.................... Severity level of the test
.................... Rounding
................ Test: Normalized difference of asymptotes
.................... Parameter
.................... Test name
.................... Conditional evaluation
........................ Test reference
........................ Evaluation condition
.................... Upper margin
.................... Lower margin
.................... Scope of the test
.................... Severity level of the test
.................... Rounding
................ Test: Sum-of-squares regression
.................... Test name
.................... Conditional evaluation
........................ Test reference
........................ Evaluation condition
.................... Upper margin
.................... Lower margin
.................... Scope of the test
.................... Severity level of the test
135

.................... Rounding
................ Test: Sum-of-squares non-parallelism
.................... Test name
.................... Conditional evaluation
........................ Test reference
........................ Evaluation condition
.................... Upper margin
.................... Lower margin
.................... Scope of the test
.................... Severity level of the test
.................... Rounding
................ Test: Sum-of-squares non-linearity
.................... Test name
.................... Conditional evaluation
........................ Test reference
........................ Evaluation condition
.................... Upper margin
.................... Lower margin
.................... Scope of the test
.................... Severity level of the test
.................... Extent of the test
.................... Rounding
................ Test: Ratio of sum-of-squares non-linearity to sum-of-squares regression
.................... Test name
.................... Conditional evaluation
........................ Test reference
........................ Evaluation condition
.................... Upper margin
.................... Lower margin
.................... Scope of the test
.................... Severity level of the test
.................... Rounding
................ Test: Potency value
.................... Test name
.................... Conditional evaluation
........................ Test reference
........................ Evaluation condition
.................... Upper margin
.................... Lower margin
.................... Scope of the test
.................... Severity level of the test
.................... Potency type
.................... Rounding
................ Test: Potency confidence interval
.................... Test name
.................... Conditional evaluation
........................ Test reference
........................ Evaluation condition
136

Reference Guide | Biological Assay Package Version 26
.................... Upper margin
.................... Lower margin
.................... Scope of the test
.................... Severity level of the test
.................... Potency type
.................... Rounding
................ Test: Log potency range
.................... Test name
.................... Conditional evaluation
........................ Test reference
........................ Evaluation condition
.................... Upper margin
.................... Lower margin
.................... Scope of the test
.................... Severity level of the test
.................... Rounding
................ Test: Potency of intermediate dilution
.................... Test name
.................... Conditional evaluation
........................ Test reference
........................ Evaluation condition
.................... Upper margin
.................... Lower margin
.................... No. of dilution factor
.................... Scope of the test
.................... Severity level of the test
.................... Rounding
................ Test: Potency confidence interval (%)
.................... Test name
.................... Conditional evaluation
........................ Test reference
........................ Evaluation condition
.................... Upper margin
.................... Lower margin
.................... Scope of the test
.................... Severity level of the test
.................... Rounding
................ Test: Potency range (%)
.................... Test name
.................... Conditional evaluation
........................ Test reference
........................ Evaluation condition
.................... Upper margin
.................... Scope of the test
.................... Severity level of the test
.................... Rounding
................ Test: Maximal number of outliers
.................... Test name
137

.................... Conditional evaluation
........................ Test reference
........................ Evaluation condition
.................... Upper margin
.................... Scope of the test
.................... Severity level of the test
.................... Extent of the test
................ Test: Maximal sequence step CV (%)
.................... Test name
.................... Conditional evaluation
........................ Test reference
........................ Evaluation condition
.................... Upper margin
.................... Lower margin
.................... Scope of the test
.................... Severity level of the test
.................... Rounding
................ Test: Minimal R²
.................... Test name
.................... Conditional evaluation
........................ Test reference
........................ Evaluation condition
.................... Lower margin
.................... Scope of the test
.................... Severity level of the test
.................... Extent of the test
.................... Rounding
................ Test: Relative LOF error (%)
.................... Test name
.................... Conditional evaluation
........................ Test reference
........................ Evaluation condition
.................... Upper margin
.................... Scope of the test
.................... Severity level of the test
.................... Rounding
................ Test: Response value range
.................... Test name
.................... Conditional evaluation
........................ Test reference
........................ Evaluation condition
.................... Upper margin
.................... Lower margin
.................... Choice
........................ Scope of the test
........................ Scope of the test
.................... Severity level of the test
.................... Rounding
138

Reference Guide | Biological Assay Package Version 26
................ Test: Weight (W)
.................... Test name
.................... Conditional evaluation
........................ Test reference
........................ Evaluation condition
.................... Lower margin
.................... Scope of the test
.................... Severity level of the test
.................... Rounding
........ Document suitability tests
............ Signature state
................ Number of signatures
................ Meaning
................ Scope of the test
................ Severity level of the test
............ Test on user variable
................ Key
................ Value
................ Severity level of the test
.... Comment
........ Subject
........ Text
........ Linked document
........ Date
........ Author
10.8 Element referenceThis subsection holds the reference information for the document elements.
Use the following finding aids to access reference information on particular elements:
• Hyperlinks in the descriptive part of this Reference guide
• Document outlines and structures provided in this section of the Reference guide
• Search features of your web browser or PDF reader
10.8.1 Additional tests
This element has the following attributes:
Data type Multiplicity Usage Default value
L_AdditionalTests 0...1 optional none
Context:/Equivalence Margin Development for Biological Assays/Margin Development/
139

/Equivalence Margin Development for Biological Assays/Test Strategies/Strategy/
10.8.2 Test: Weight (W)Add one or several tests for the weight.
Note: Note: To pass the test, the potency weight has to be greater than or equal to theLower margin set in the test definition.
Note: Note: The weight is defined in the European Pharmacopoeia 6.0, Chapter 5.3,Equation 6.2.1.-1.
Tip: Tip: Select the Assay suitability or Sample suitability section prior to adding tests. Toadd an assay suitability test, select the Assay suitability tests element or one of its childrenprior to adding the test from the Context list. To add a sample suitability test, select the Samplesuitability tests element or one of its children.
This element has the following attributes:
Data type Multiplicity Usage Default value
xs:empty 0...unbounded optional none
Context:/Dichotomous Assay (Quantal Response Assay)/Analysis/Suitability Tests/Assay Suitability Tests/
/Dichotomous Assay (Quantal Response Assay)/Analysis/Suitability Tests/Sample Suitability Tests/
10.8.3 Test: Relative-potency confidence intervalAdd one or several tests for the relative-potency confidence interval to your assay.
Note: Note: To pass the test, the lower confidence limit of the relative potency has to begreater than or equal to the Lower margin set in the test definition, and the upper confidencelimit of the relative potency has to be less than or equal to the Upper margin.
Tip: Tip: Select the Assay suitability or Sample suitability section prior to adding tests. Toadd an assay suitability test, select the Assay suitability tests element or one of its childrenprior to adding the test from the Context list. To add a sample suitability test, select the Samplesuitability tests element or one of its children.
This element has the following attributes:
Data type Multiplicity Usage Default value
xs:empty 0...unbounded optional none
Context:/Dichotomous Assay (Quantal Response Assay)/Analysis/Suitability Tests/Assay Suitability Tests/
140

Reference Guide | Biological Assay Package Version 26
/Dichotomous Assay (Quantal Response Assay)/Analysis/Suitability Tests/Sample Suitability Tests/
10.8.4 Test: Relative-potency range (%)Add one or several tests for the relative-potency range to your assay.
Note: Note: To pass the test, the percentual relative-potency range has to be less than orequal to the Upper margin set in the test definition.
Tip: Tip: Select the Assay suitability or Sample suitability section prior to adding tests. Toadd an assay suitability test, select the Assay suitability tests element or one of its childrenprior to adding the test from the Context list. To add a sample suitability test, select the Samplesuitability tests element or one of its children.
This element has the following attributes:
Data type Multiplicity Usage Default value
xs:empty 0...unbounded optional none
Context:/Dichotomous Assay (Quantal Response Assay)/Analysis/Suitability Tests/Assay Suitability Tests/
/Dichotomous Assay (Quantal Response Assay)/Analysis/Suitability Tests/Sample Suitability Tests/
10.8.5 Test: Relative-potency valueAdd one or several tests for the relative-potency value to your assay.
Note: Note: To pass the test, the relative-potency value has to be greater than or equal tothe Lower margin set in the test definition and less than or equal to the Upper margin.
Tip: Tip: Select the Assay suitability or Sample suitability section prior to adding tests. Toadd an assay suitability test, select the Assay suitability tests element or one of its childrenprior to adding the test from the Context list. To add a sample suitability test, select the Samplesuitability tests element or one of its children.
This element has the following attributes:
Data type Multiplicity Usage Default value
xs:empty 0...unbounded optional none
Context:/Dichotomous Assay (Quantal Response Assay)/Analysis/Suitability Tests/Assay Suitability Tests/
/Dichotomous Assay (Quantal Response Assay)/Analysis/Suitability Tests/Sample Suitability Tests/
141

10.8.6 Advanced settingsThis section provides additional settings for assay calculation.
This element has the following attributes:
Data type Multiplicity Usage Default value
xs:empty 1...1 required none
Context:/Dichotomous Assay (Quantal Response Assay)/Analysis/Analytical Model/
/Quantitative Response Assay/Analysis/Analytical Model/
10.8.7 Allow subfoldersNote: Note: The Allow subfolder setting only applies if you also specify a folder in the Folder
key element.
Select the True option from the drop-down list to require referenced documents be elements ofthe specified folder or one of its subfolders. Otherwise, subfolders are excluded.
This element has the following attributes:
Data type Multiplicity Usage Default value
xs:boolean 0...1 optional none
Context:/Basic Bioassay Protocol/Reportable Values/Document Reference/
/Combination of Independent Assay Results/Potency Data/Column: Document Reference/
10.8.8 Allow subfoldersCurrently, no information available.
This element has the following attributes:
Data type Multiplicity Usage Default value
xs:boolean 0...1 optional none
Context:
142

Reference Guide | Biological Assay Package Version 26
10.8.9 AlphaSelect the alpha value you require for this test (alpha = 1 - significance level of the test).
Note: Note: Higher values of alpha make the test less sensitive.
This element has the following attributes:
Data type Multiplicity Usage Default value
T_Alpha 1...1 required none
Context:/Quantitative Response Assay/Analysis/Data Selection Schemes/Data Selection Scheme/choice/Dixon Test/
/Quantitative Response Assay/Analysis/Data Selection Schemes/Data Selection Scheme/choice/(Externally) Studentized Residuals/
10.8.10 Amount (summary)Expand the node to add or view information.
This element has the following attributes:
Data type Multiplicity Usage Default value
xs:empty 1...1 required none
Context:/Basic Bioassay Protocol/choice/Mode: Assay Element/Standard Sample/choice/Absolute Potency: defined by Raw Material/
/Basic Bioassay Protocol/choice/Mode: Assay Element/Test Sample/choice/Absolute Potency: defined by Raw Material/
/Basic Bioassay Protocol/choice/Mode: Assay Element/Control Sample/choice/Absolute Potency: defined by Raw Material/
/Dichotomous Assay (Quantal Response Assay)/Setup/PreparationSchemes/Preparation Scheme/choice/Absolute Potency: definedby Raw Material/
/Quantitative Response Assay/Setup/Preparation Schemes/Preparation Scheme/choice/Absolute Potency: defined by Raw Material/
10.8.11 Amount unitsEnter the unit for Amount to be used in reporting.
This element has the following attributes:
Data type Multiplicity Usage Default value
xs:string 1...1 required none
Context:/Basic Bioassay Protocol/choice/Mode: Assay Element/Standard Sample/choice/Absolute Potency: defined by Raw Material/Amount(Summary)/
143

/Basic Bioassay Protocol/choice/Mode: Assay Element/Test Sample/choice/Absolute Potency: defined by Raw Material/Amount(Summary)/
/Basic Bioassay Protocol/choice/Mode: Assay Element/Control Sample/choice/Absolute Potency: defined by Raw Material/Amount(Summary)/
/Dichotomous Assay (Quantal Response Assay)/Setup/PreparationSchemes/Preparation Scheme/choice/Absolute Potency: definedby Raw Material/Amount (Summary)/
/Quantitative Response Assay/Setup/Preparation Schemes/Preparation Scheme/choice/Absolute Potency: defined by Raw Material/Amount (Summary)/
10.8.12 AnalysisThis section allows you to specify the Analytical model (regression), Data selection schemes(configuration optimization, outlier detection), and Suitability tests (statistical tests) to be used incalculations. Expand the node to add or view information.
This element has the following attributes:
Data type Multiplicity Usage Default value
xs:empty 1...1 required none
Context:/Quantitative Response Assay/
10.8.13 AnalysisThis section allows you to specify the Analytical model (regression) and Suitability tests(statistical tests) to be used in calculations.
Expand the node to add or view information.
This element has the following attributes:
Data type Multiplicity Usage Default value
xs:empty 1...1 required none
Context:/Dichotomous Assay (Quantal Response Assay)/
10.8.14 Analytical modelThis section allows you to specify the analytical model to be used for all assay elements.
This element has the following attributes:
Data type Multiplicity Usage Default value
xs:empty 1...1 required none
144

Reference Guide | Biological Assay Package Version 26
Context:/Dichotomous Assay (Quantal Response Assay)/Analysis/
/Quantitative Response Assay/Analysis/
10.8.15 ANOVA with additional factorsSelect the 'true' option from the drop-down list to have the position factors considered in theANOVA calculation (if position factors are defined).
This element has the following attributes:
Data type Multiplicity Usage Default value
xs:boolean 1...1 required none
Context:/Quantitative Response Assay/Analysis/Analytical Model/Advanced Settings/
10.8.16 ANOVA modelSpecifies which ANOVA model is to be used.
Note: Note: The ANOVA model options affect calculation of the parameter standard errorsand the error term used in the test on regression, linearity, and parallelism.
The following options are available: Pure-error ANOVA and Residual-error ANOVA.
This element has the following attributes:
Data type Multiplicity Usage Default value
T_AnovaType 1...1 required none
Context:/Quantitative Response Assay/Analysis/Analytical Model/Advanced Settings/
10.8.17 Assay replicate documentProvides a link to the Quantitative response assay document you generated. Shift-click the linkto open the document.
This element has the following attributes:
Data type Multiplicity Usage Default value
DocumentReference.QuantitativeResponseAssay 0...1 optional none
145

Context:/Basic Bioassay Protocol/Assay Replicate/
10.8.18 Assay elementsThis section allows you to define all assay elements. Expand the node to add or viewinformation.
Quantitative response assay documents contain four types of assay elements: The Standardsample, Test samples, Control samples, and Control lines. Standard, Test, and Control samplesare diluted samples. Control lines may be positive, negative, or blank Control lines that are notdiluted.
Add one or several of the following assay elements from the context menu or Creatableelements pane:
• Test samples: To determine their relative potencies.
• Control samples: To define additional acceptance criteria.
• Control lines: To add positive or negative controls.
This element has the following attributes:
Data type Multiplicity Usage Default value
xs:empty 1...1 required none
Context:/Quantitative Response Assay/Setup/
10.8.19 Assay elementsThis section allows you to define all assay elements. Expand the node to add or viewinformation.
Dichotomous assay documents contain three types of assay elements: The Standard sample, Testsamples, and Control samples. Standard, Test, and Control samples are diluted samples.
Add one or several of the following assay elements from the context menu or Creatableelements pane:
• Test samples: To determine their relative potencies.
• Control samples: To define additional acceptance criteria.
This element has the following attributes:
Data type Multiplicity Usage Default value
xs:empty 1...1 required none
146

Reference Guide | Biological Assay Package Version 26
Context:/Dichotomous Assay (Quantal Response Assay)/Setup/
10.8.20 Number of replicatesEnter the number of replicates to be generated for this assay element.
This element has the following attributes:
Data type Multiplicity Usage Default value
PositiveInteger0 1...1 required none
Context:/Basic Bioassay Protocol/choice/Mode: Assay Element/Test Sample/
/Basic Bioassay Protocol/choice/Mode: Assay Element/Control Sample/
10.8.21 Assay purposeEnter text that describes the purpose of this assay. Provide the analyte (target of the assay), forexample, and its unique identification.
Tip: Tip: You can enter multiline text.
This element has the following attributes:
Data type Multiplicity Usage Default value
xs:string 0...1 optional none
Context:/Combination of Independent Assay Results/Documentation/
/Quantitative Response Assay/Documentation/
10.8.22 Assay purposeEnter text that describes the purpose of this assay. Provide the analyte (target of the assay), forexample, and its unique identification.
Tip: Tip: You can enter multiline text.
This element has the following attributes:
Data type Multiplicity Usage Default value
xs:string 0...1 optional none
147

Context:/Dichotomous Assay (Quantal Response Assay)/Documentation/
10.8.23 Assay replicateProvides information on an assay replicate you generated.
This element has the following attributes:
Data type Multiplicity Usage Default value
xs:empty 0...unbounded optional none
Context:/Basic Bioassay Protocol/
10.8.24 Assay suitability testsAdd the Assay suitability tests you require.
Important: Important: The results of Assay suitability tests affect the whole assay documentrather than just individual Standard-vs-Test sample comparisons.
Note: Note: With simultaneous regression (formerly called multiplex assay), there is nodifference in how Assay suitability tests and Sample suitability tests are evaluated.
This element has the following attributes:
Data type Multiplicity Usage Default value
T_SuitabilityTests 1...1 required none
Context:/Dichotomous Assay (Quantal Response Assay)/Analysis/Suitability Tests/
/Quantitative Response Assay/Analysis/Suitability Tests/
/Test System for Quantitative Response Assay/Suitability Tests/
10.8.25 Assay templatesSpecify the templates you need to generate Quantitative response assay documents.
This element has the following attributes:
Data type Multiplicity Usage Default value
xs:empty 1...1 required none
148

Reference Guide | Biological Assay Package Version 26
Context:/Basic Bioassay Protocol/Templates/
10.8.26 TemplateSelect a Quantitative response assay template.
Note: Note: If you define more than one Quantitative response assay template, all but onetemplates need the Valid for replicate restriction.
This element has the following attributes:
Data type Multiplicity Usage Default value
TemplateReference.QuantitativeResponseAssay 1...1 required none
Context:/Basic Bioassay Protocol/Templates/Assay Templates/Assay Template/
10.8.27 Assay templateSpecify a template you need to generate Quantitative response assay documents.
Tip: Tip: Add a Valid for replicate element to restrict use of the template. This elementallows you to enter an assay replicate number. The template is then only used to generate thisparticular replicate.
This element has the following attributes:
Data type Multiplicity Usage Default value
xs:empty 0...unbounded required none
Context:/Basic Bioassay Protocol/Templates/Assay Templates/
10.8.28 Column: Assay test stateExpand the node to add or view information.
This element has the following attributes:
Data type Multiplicity Usage Default value
T_AssayTestStateFactor 1...1 required none
Context:
149

/Combination of Independent Assay Results/Potency Data/
10.8.29 Assigned/assumed potencyEnter the Assigned potency (for a Standard sample) or Assumed potency (for a Test sample).
This element has the following attributes:
Data type Multiplicity Usage Default value
T_PositiveDouble 1...1 required none
Context:/Basic Bioassay Protocol/choice/Mode: Assay Element/Standard Sample/choice/Absolute Potency: defined by Raw Material/Assigned/Assumed Potency (Summary)/
/Basic Bioassay Protocol/choice/Mode: Assay Element/Test Sample/choice/Absolute Potency: defined by Raw Material/Assigned/Assumed Potency (Summary)/
/Basic Bioassay Protocol/choice/Mode: Assay Element/Control Sample/choice/Absolute Potency: defined by Raw Material/Assigned/Assumed Potency (Summary)/
/Basic Bioassay Protocol/choice/Mode: Assay Element/Standard Sample/choice/Absolute Potency: defined by Stock Solution/
/Basic Bioassay Protocol/choice/Mode: Assay Element/Test Sample/choice/Absolute Potency: defined by Stock Solution/
/Basic Bioassay Protocol/choice/Mode: Assay Element/Control Sample/choice/Absolute Potency: defined by Stock Solution/
/Dichotomous Assay (Quantal Response Assay)/Setup/PreparationSchemes/Preparation Scheme/choice/Absolute Potency: definedby Raw Material/Assigned/Assumed Potency (Summary)/
/Dichotomous Assay (Quantal Response Assay)/Setup/PreparationSchemes/Preparation Scheme/choice/Absolute Potency: definedby Stock Solution/
/Quantitative Response Assay/Setup/Preparation Schemes/Preparation Scheme/choice/Absolute Potency: defined by Raw Material/Assigned/Assumed Potency (Summary)/
/Quantitative Response Assay/Setup/Preparation Schemes/Preparation Scheme/choice/Absolute Potency: defined by Stock Solution/
10.8.30 Assigned/assumed potency (summary)Expand the node to add or view information.
This element has the following attributes:
Data type Multiplicity Usage Default value
xs:empty 1...1 required none
Context:/Basic Bioassay Protocol/choice/Mode: Assay Element/Standard Sample/choice/Absolute Potency: defined by Raw Material/
/Basic Bioassay Protocol/choice/Mode: Assay Element/Test Sample/choice/Absolute Potency: defined by Raw Material/
/Basic Bioassay Protocol/choice/Mode: Assay Element/Control Sample/choice/Absolute Potency: defined by Raw Material/
/Dichotomous Assay (Quantal Response Assay)/Setup/PreparationSchemes/Preparation Scheme/choice/Absolute Potency: definedby Raw Material/
/Quantitative Response Assay/Setup/Preparation Schemes/Preparation Scheme/choice/Absolute Potency: defined by Raw Material/
150
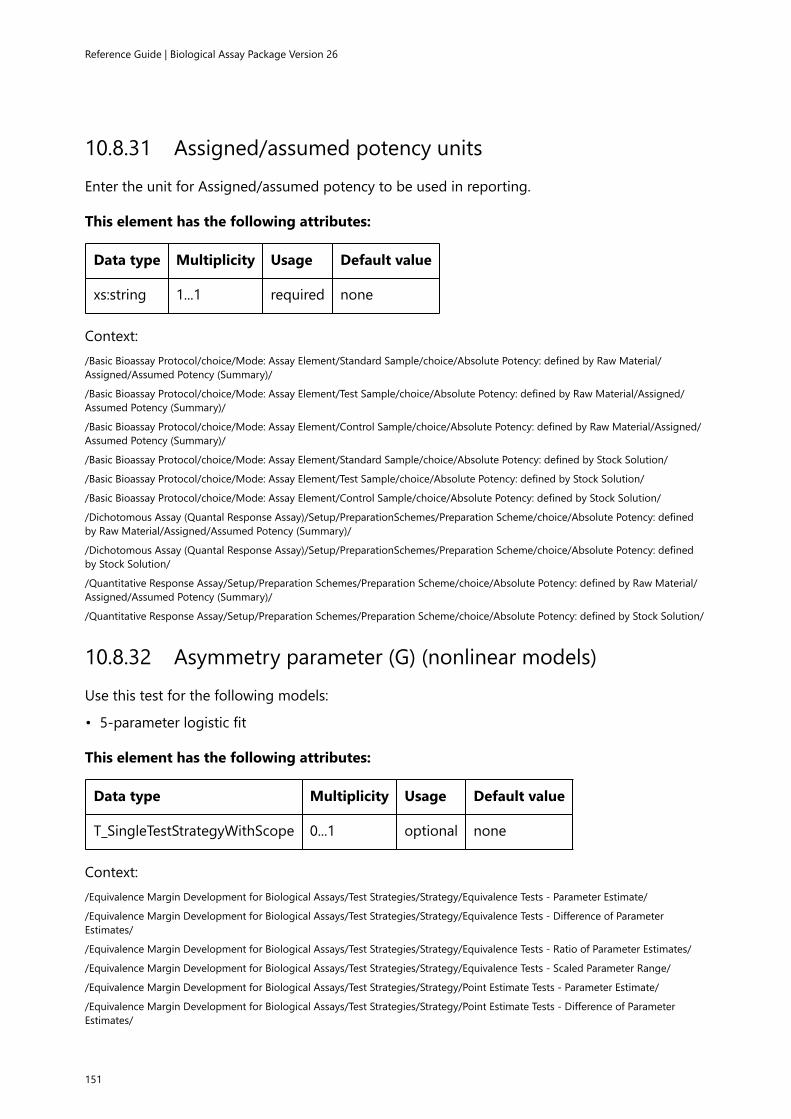
Reference Guide | Biological Assay Package Version 26
10.8.31 Assigned/assumed potency unitsEnter the unit for Assigned/assumed potency to be used in reporting.
This element has the following attributes:
Data type Multiplicity Usage Default value
xs:string 1...1 required none
Context:/Basic Bioassay Protocol/choice/Mode: Assay Element/Standard Sample/choice/Absolute Potency: defined by Raw Material/Assigned/Assumed Potency (Summary)/
/Basic Bioassay Protocol/choice/Mode: Assay Element/Test Sample/choice/Absolute Potency: defined by Raw Material/Assigned/Assumed Potency (Summary)/
/Basic Bioassay Protocol/choice/Mode: Assay Element/Control Sample/choice/Absolute Potency: defined by Raw Material/Assigned/Assumed Potency (Summary)/
/Basic Bioassay Protocol/choice/Mode: Assay Element/Standard Sample/choice/Absolute Potency: defined by Stock Solution/
/Basic Bioassay Protocol/choice/Mode: Assay Element/Test Sample/choice/Absolute Potency: defined by Stock Solution/
/Basic Bioassay Protocol/choice/Mode: Assay Element/Control Sample/choice/Absolute Potency: defined by Stock Solution/
/Dichotomous Assay (Quantal Response Assay)/Setup/PreparationSchemes/Preparation Scheme/choice/Absolute Potency: definedby Raw Material/Assigned/Assumed Potency (Summary)/
/Dichotomous Assay (Quantal Response Assay)/Setup/PreparationSchemes/Preparation Scheme/choice/Absolute Potency: definedby Stock Solution/
/Quantitative Response Assay/Setup/Preparation Schemes/Preparation Scheme/choice/Absolute Potency: defined by Raw Material/Assigned/Assumed Potency (Summary)/
/Quantitative Response Assay/Setup/Preparation Schemes/Preparation Scheme/choice/Absolute Potency: defined by Stock Solution/
10.8.32 Asymmetry parameter (G) (nonlinear models)Use this test for the following models:
• 5-parameter logistic fit
This element has the following attributes:
Data type Multiplicity Usage Default value
T_SingleTestStrategyWithScope 0...1 optional none
Context:/Equivalence Margin Development for Biological Assays/Test Strategies/Strategy/Equivalence Tests - Parameter Estimate/
/Equivalence Margin Development for Biological Assays/Test Strategies/Strategy/Equivalence Tests - Difference of ParameterEstimates/
/Equivalence Margin Development for Biological Assays/Test Strategies/Strategy/Equivalence Tests - Ratio of Parameter Estimates/
/Equivalence Margin Development for Biological Assays/Test Strategies/Strategy/Equivalence Tests - Scaled Parameter Range/
/Equivalence Margin Development for Biological Assays/Test Strategies/Strategy/Point Estimate Tests - Parameter Estimate/
/Equivalence Margin Development for Biological Assays/Test Strategies/Strategy/Point Estimate Tests - Difference of ParameterEstimates/
151

/Equivalence Margin Development for Biological Assays/Test Strategies/Strategy/Point Estimate Tests - Ratio of Parameter Estimates/
/Equivalence Margin Development for Biological Assays/Margin Development/Equivalence Tests - Parameter Estimate/
/Equivalence Margin Development for Biological Assays/Margin Development/Equivalence Tests - Difference of Parameter Estimates/
/Equivalence Margin Development for Biological Assays/Margin Development/Equivalence Tests - Ratio of Parameter Estimates/
/Equivalence Margin Development for Biological Assays/Margin Development/Equivalence Tests - Scaled Parameter Range/
/Equivalence Margin Development for Biological Assays/Margin Development/Point Estimate Tests - Parameter Estimate/
/Equivalence Margin Development for Biological Assays/Margin Development/Point Estimate Tests - Difference of ParameterEstimates/
/Equivalence Margin Development for Biological Assays/Margin Development/Point Estimate Tests - Ratio of Parameter Estimates/
/Equivalence Margin Development for Biological Assays/Visualization/Simulation Space/
10.8.33 Asymptote fixed by control lineSpecifies the Control line to be used to fix the asymptote. Select a Control line from the Valuedrop-down list.
Note: Note: The mean of the response values of the Control line is used as value of the fixedasymptote.
This element has the following attributes:
Data type Multiplicity Usage Default value
xs:string 1...1 required none
Context:/Quantitative Response Assay/Analysis/Analytical Model/choice/Model: 3 Parameter Logistic Fit with fixed lower asymptote/choice/
/Quantitative Response Assay/Analysis/Analytical Model/choice/Model: 3 Parameter Logistic Fit with fixed upper asymptote/choice/
10.8.34 Asymptote fixed by valueEnter the number to be used as value of the fixed asymptote.
This element has the following attributes:
Data type Multiplicity Usage Default value
xs:double 1...1 required none
Context:/Quantitative Response Assay/Analysis/Analytical Model/choice/Model: 3 Parameter Logistic Fit with fixed lower asymptote/choice/
/Quantitative Response Assay/Analysis/Analytical Model/choice/Model: 3 Parameter Logistic Fit with fixed upper asymptote/choice/
10.8.35 AuthorAutomatically inserts the user name of the current user when the Author element is created. Youcan enter a different name.
152

Reference Guide | Biological Assay Package Version 26
This element has the following attributes:
Data type Multiplicity Usage Default value
xs:token 1...1 required none
Context:/Basic Bioassay Protocol/Comment/
/Combination of Independent Assay Results/Comment/
/Control Chart/Comment/
/Dichotomous Assay (Quantal Response Assay)/Comment/
/Equivalence Margin Development for Biological Assays/Comment/
/Quantitative Response Assay/Comment/
/Test System for Quantitative Response Assay/Comment/
10.8.36 BaseEnter a number to specify the Base of this sequence.
Note: Note: The number you enter must be a positive decimal.
The dose value for step number 'j' of an n-fold sequence is given by:
.
This element has the following attributes:
Data type Multiplicity Usage Default value
T_PositiveDouble 1...1 required none
Context:/Dichotomous Assay (Quantal Response Assay)/Setup/PreparationSchemes/Preparation Scheme/choice/N-Fold GeometricalSequence/
/Quantitative Response Assay/Setup/Preparation Schemes/Preparation Scheme/choice/N-Fold Geometrical Sequence/
10.8.37 Basic bioassay protocolThe Basic bioassay protocol document type allows you to calculate reportable potency valuesfrom assay replicates (independent biological assays).
This element has the following attributes:
Data type Multiplicity Usage Default value
xs:empty 1...1 optional none
153

Context:Top level
10.8.38 Boolean column (factor)Define a column that allows you to associate each observation with a logical/ Boolean value.
This element has the following attributes:
Data type Multiplicity Usage Default value
ds:T_BooleanColumn 0...unbounded required none
Context:/Dichotomous Assay (Quantal Response Assay)/Setup/Observation Data/choice/
/Quantitative Response Assay/Setup/Observation Data/choice/
10.8.39 B parameter (nonlinear models)Use this test for the following models:
• 4-parameter logistic fit
• 4-parameter logistic fit with included blanks
• 5-parameter logistic fit
This element has the following attributes:
Data type Multiplicity Usage Default value
T_SingleTestStrategyWithScope 0...1 optional none
Context:/Equivalence Margin Development for Biological Assays/Test Strategies/Strategy/Equivalence Tests - Parameter Estimate/
/Equivalence Margin Development for Biological Assays/Test Strategies/Strategy/Equivalence Tests - Difference of ParameterEstimates/
/Equivalence Margin Development for Biological Assays/Test Strategies/Strategy/Equivalence Tests - Ratio of Parameter Estimates/
/Equivalence Margin Development for Biological Assays/Test Strategies/Strategy/Equivalence Tests - Scaled Parameter Range/
/Equivalence Margin Development for Biological Assays/Test Strategies/Strategy/Point Estimate Tests - Parameter Estimate/
/Equivalence Margin Development for Biological Assays/Test Strategies/Strategy/Point Estimate Tests - Difference of ParameterEstimates/
/Equivalence Margin Development for Biological Assays/Test Strategies/Strategy/Point Estimate Tests - Ratio of Parameter Estimates/
/Equivalence Margin Development for Biological Assays/Margin Development/Equivalence Tests - Parameter Estimate/
/Equivalence Margin Development for Biological Assays/Margin Development/Equivalence Tests - Difference of Parameter Estimates/
/Equivalence Margin Development for Biological Assays/Margin Development/Equivalence Tests - Ratio of Parameter Estimates/
/Equivalence Margin Development for Biological Assays/Margin Development/Equivalence Tests - Scaled Parameter Range/
/Equivalence Margin Development for Biological Assays/Margin Development/Point Estimate Tests - Parameter Estimate/
154

Reference Guide | Biological Assay Package Version 26
/Equivalence Margin Development for Biological Assays/Margin Development/Point Estimate Tests - Difference of ParameterEstimates/
/Equivalence Margin Development for Biological Assays/Margin Development/Point Estimate Tests - Ratio of Parameter Estimates/
/Equivalence Margin Development for Biological Assays/Visualization/Simulation Space/
10.8.40 Calculate mean potency estimate of test samplesSelect the 'true' option from the drop-down list to have the mean of the potency estimatesreported.
This element has the following attributes:
Data type Multiplicity Usage Default value
xs:boolean 1...1 required none
Context:/Dichotomous Assay (Quantal Response Assay)/Analysis/Analytical Model/Advanced Settings/
/Quantitative Response Assay/Analysis/Analytical Model/
10.8.41 Control chartControl charts can be used to plot data from the data table, and to analyze the trending of thisdata over a certain time period.
Expand the node to add or view information.
Tip: Tip: You can add several Comment elements. And to each Comment element, you canadd a Subject element, Text elements, and Linked document elements.
This element has the following attributes:
Data type Multiplicity Usage Default value
xs:empty 1...1 required none
Context:Top level
10.8.42 ChartsThis section allows you to add charts to the document. You have to add at least one chart.
This element has the following attributes:
Data type Multiplicity Usage Default value
xs:empty 1...1 required none
155

Context:/Control Chart/
10.8.43 NameEnter a name for the chart. The chart name is used to link a chart to a Floating-point numbercolumn.
Note: Note: We recommend to use unique names. But this is not required.
This element has the following attributes:
Data type Multiplicity Usage Default value
xs:token 1...1 required none
Context:/Control Chart/Charts/Chart/
10.8.44 ChartSelect the chart that should plot the values of the parameter that is assigned to the Floating-point number column.
This element has the following attributes:
Data type Multiplicity Usage Default value
xs:string 1...1 required none
Context:/Control Chart/Data Table/Column: Floating Point Number/
10.8.45 ChartThis section allows you to configure chart-specific settings.
This element has the following attributes:
Data type Multiplicity Usage Default value
xs:empty 1...unbounded required none
Context:/Control Chart/Charts/
156

Reference Guide | Biological Assay Package Version 26
10.8.46 Chi-square homogeneity testAdd one or several Chi-square tests of homogeneity. Expand the node to add or viewinformation.
This element has the following attributes:
Data type Multiplicity Usage Default value
xs:empty 0...unbounded optional none
Context:/Combination of Independent Assay Results/Tests/
10.8.47 Chi-square significanceSelect the significance level of the Chi-square test of homogeneity.
This element has the following attributes:
Data type Multiplicity Usage Default value
T_ConfidenceLevel80Included 1...1 required none
Context:/Combination of Independent Assay Results/
10.8.48 Combination of independent assay resultsThe Combination of assay results document type allows you to perform combinationcalculations for independent assay runs, thus obtaining reportable values for the potency.
Note: Note: With document aggregation, you can only use Test samples as data source.
We support the following combination calculation methods:
• Unweighted calculation
• Weighted calculation (by homogeneity)
• Homogeneously weighted calculation
• Heterogeneously weighted calculation according to European Pharmacopoeia Chapter 5.3, USPharmacopoeia <111> (semi-weighted), and US Pharmacopoeia <1034>
Note: Note: Please consult the corresponding USP and EP chapters for a detaileddescription of the different methods.
157

This element has the following attributes:
Data type Multiplicity Usage Default value
xs:empty 1...1 optional none
Context:Top level
10.8.49 Coefficient of determinationSelects the method to be used to calculate the Coefficient of determination, which is also knownas R² value. The following options are available from the drop-down list:
• Default method: Uses the intercept-free model in assays based on linear regression models,and the mean-adjusted model in assays based on nonlinear regression models.
Note: Note: Assays based on the restricted regression model of the Slope ratio are anexception where also the mean-adjusted model is used by default.
• Mean-adjusted model: Calculates the Coefficient of determination based on the followingequation:
• Intercept-free model: Calculates the Coefficient of determination based on the followingequation:
This element has the following attributes:
Data type Multiplicity Usage Default value
T_CoefficientOfDetermination 0...1 optional none
Context:/Quantitative Response Assay/Analysis/Analytical Model/Advanced Settings/
158
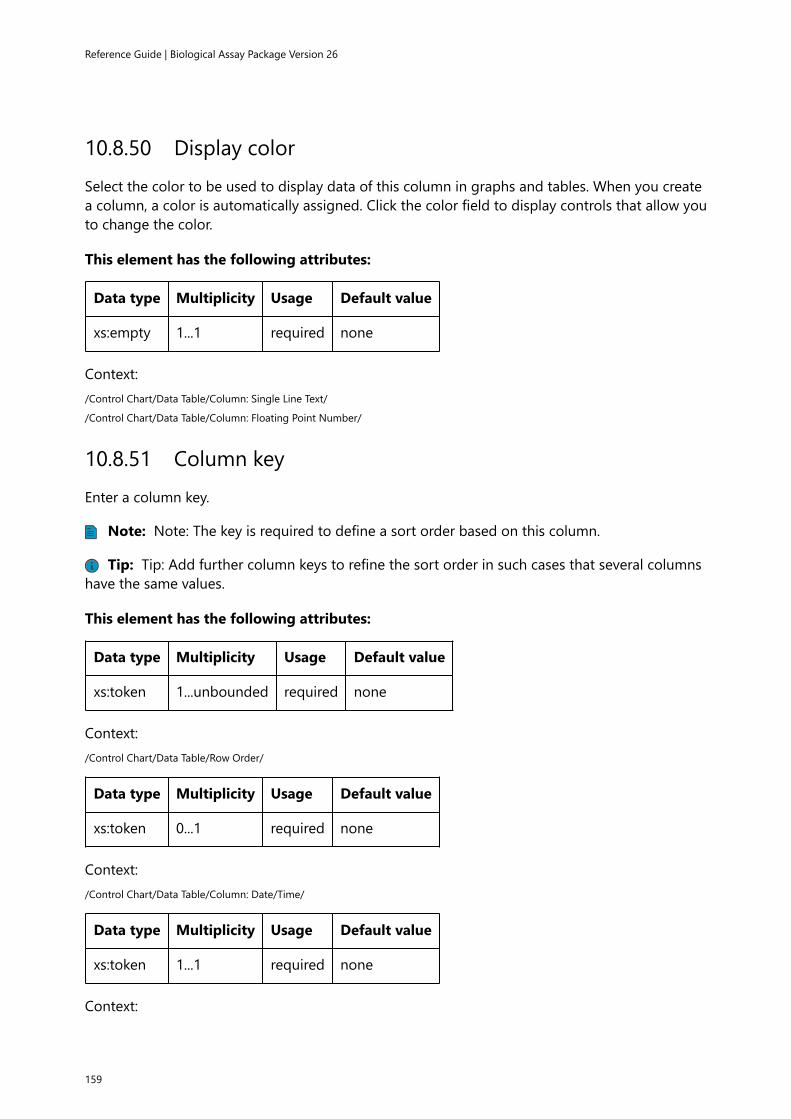
Reference Guide | Biological Assay Package Version 26
10.8.50 Display colorSelect the color to be used to display data of this column in graphs and tables. When you createa column, a color is automatically assigned. Click the color field to display controls that allow youto change the color.
This element has the following attributes:
Data type Multiplicity Usage Default value
xs:empty 1...1 required none
Context:/Control Chart/Data Table/Column: Single Line Text/
/Control Chart/Data Table/Column: Floating Point Number/
10.8.51 Column keyEnter a column key.
Note: Note: The key is required to define a sort order based on this column.
Tip: Tip: Add further column keys to refine the sort order in such cases that several columnshave the same values.
This element has the following attributes:
Data type Multiplicity Usage Default value
xs:token 1...unbounded required none
Context:/Control Chart/Data Table/Row Order/
Data type Multiplicity Usage Default value
xs:token 0...1 required none
Context:/Control Chart/Data Table/Column: Date/Time/
Data type Multiplicity Usage Default value
xs:token 1...1 required none
Context:
159

/Dichotomous Assay (Quantal Response Assay)/Setup/Observation Data/Column: Response (Affected)/
/Dichotomous Assay (Quantal Response Assay)/Setup/Observation Data/Column: Response (Tested)/
/Quantitative Response Assay/Setup/Observation Data/Column: Response Value/
10.8.52 Column keyCurrently, no information available.
This element has the following attributes:
Data type Multiplicity Usage Default value
xs:token 0...1 optional none
Context:/Combination of Independent Assay Results/Potency Data/Column: Relative Potency/
Data type Multiplicity Usage Default value
xs:token 1...1 required none
Context:
10.8.53 Column keyDisplays the Column key.
Note: Note: The key is required to define a sort order based on this column.
Note: Note: You cannot change the key of this column.
This element has the following attributes:
Data type Multiplicity Usage Default value
xs:token 1...1 required none
Context:/Basic Bioassay Protocol/Reportable Values/Document Reference/
/Basic Bioassay Protocol/Reportable Values/Group/
/Combination of Independent Assay Results/Potency Data/Column: Section/
/Combination of Independent Assay Results/Potency Data/Column: Document Reference/
10.8.54 NameEnter a name for this column.
160

Reference Guide | Biological Assay Package Version 26
This element has the following attributes:
Data type Multiplicity Usage Default value
xs:string 0...1 required none
Context:/Basic Bioassay Protocol/Reportable Values/Document Reference/
/Basic Bioassay Protocol/Reportable Values/Group/
/Combination of Independent Assay Results/Potency Data/Column: Section/
/Combination of Independent Assay Results/Potency Data/Column: Document Reference/
/Equivalence Margin Development for Biological Assays/Datatable/Column: Assay Element/
Data type Multiplicity Usage Default value
xs:string 1...1 required none
Context:/Basic Bioassay Protocol/Reportable Values/Absolute Potency Lower Confidence Limit/
/Basic Bioassay Protocol/Reportable Values/Absolute Potency/
/Basic Bioassay Protocol/Reportable Values/Absolute Potency Upper Confidence Limit/
/Basic Bioassay Protocol/Reportable Values/Absolute Potency Unit/
/Basic Bioassay Protocol/Reportable Values/Selected Method/
/Basic Bioassay Protocol/Reportable Values/Absolute Potency Status/
/Basic Bioassay Protocol/Reportable Values/Relative Potency Status/
/Basic Bioassay Protocol/Reportable Values/Relative Potency Lower Confidence Limit/
/Basic Bioassay Protocol/Reportable Values/Relative Potency/
/Basic Bioassay Protocol/Reportable Values/Relative Potency Upper Confidence Limit/
/Combination of Independent Assay Results/Potency Data/Column: Potency/
/Combination of Independent Assay Results/Potency Data/Column: Potency Lower Limit/
/Combination of Independent Assay Results/Potency Data/Column: Potency Upper Limit/
/Combination of Independent Assay Results/Potency Data/Column: Relative Potency/
/Combination of Independent Assay Results/Potency Data/Column: Relative Potency Lower Limit/
/Combination of Independent Assay Results/Potency Data/Column: Relative Potency Upper Limit/
/Combination of Independent Assay Results/Potency Data/Column: Model/
/Combination of Independent Assay Results/Potency Data/Column: Potency Unit/
/Combination of Independent Assay Results/Potency Data/Column: Group/
/Combination of Independent Assay Results/Potency Data/Column: Degrees of Freedom/
/Combination of Independent Assay Results/Potency Data/Column: Potency Confidence Level/
/Combination of Independent Assay Results/Potency Data/Column: Assay Test State/
/Control Chart/Data Table/Column: Date/Time/
/Dichotomous Assay (Quantal Response Assay)/Setup/Observation Data/Column: Response (Affected)/
/Dichotomous Assay (Quantal Response Assay)/Setup/Observation Data/Column: Response (Tested)/
/Equivalence Margin Development for Biological Assays/Datatable/Column: Development Assay/
/Equivalence Margin Development for Biological Assays/Datatable/Column: Verification Assay/
/Equivalence Margin Development for Biological Assays/Datatable/Column: Scientifically Acceptable/
161

10.8.55 Configuration nameEnter a name for the Configuration.
This element has the following attributes:
Data type Multiplicity Usage Default value
xs:token 1...1 optional none
Context:/Basic Bioassay Protocol/Templates/Combination Calculation Templates/Configuration/
10.8.56 Configuration nameSelect a configuration for this combination calculation from the drop-down list.
This element has the following attributes:
Data type Multiplicity Usage Default value
xs:token 0...1 optional none
Context:/Basic Bioassay Protocol/choice/Mode: Assay Element/Test Sample/Combination Calculation (Sample Only)/
/Basic Bioassay Protocol/Combination Calculation/
10.8.57 Document nameEnter a name for the Combination of assay results document to be generated. The name youenter overrides the default naming for the Combination of assay results document.
This element has the following attributes:
Data type Multiplicity Usage Default value
xs:token 0...1 optional none
Context:/Basic Bioassay Protocol/choice/Mode: Assay Element/Test Sample/Combination Calculation (Sample Only)/
/Basic Bioassay Protocol/Combination Calculation/
162

Reference Guide | Biological Assay Package Version 26
10.8.58 Combination document referenceProvides a link to the Combination of assay results document you generated. Shift-click the linkto open the document.
This element has the following attributes:
Data type Multiplicity Usage Default value
DocumentReference.CombinationOfAssayResults 0...1 optional none
Context:/Basic Bioassay Protocol/choice/Mode: Assay Element/Test Sample/Combination Calculation (Sample Only)/
/Basic Bioassay Protocol/Combination Calculation/
10.8.59 Combination calculationDefine a Combination calculation based on the specified Configuration.
Note: Note: The Combination calculations you define here aggregate the potency data of allTest samples as they occur in the (calculated) assay replicates generated by this Basic bioassayprotocol.
This element has the following attributes:
Data type Multiplicity Usage Default value
xs:empty 0...unbounded optional none
Context:/Basic Bioassay Protocol/
10.8.60 Combination calculation templatesSpecify the templates you need to generate Combination of assay results documents.
Tip: Tip: Add Configuration elements to specify more templates. You can specify onetemplate per Configuration.
This element has the following attributes:
Data type Multiplicity Usage Default value
xs:empty 1...1 required none
Context:
163

/Basic Bioassay Protocol/Templates/
10.8.61 ConfigurationSpecify a template you need to generate Combination of assay results documents.
This element has the following attributes:
Data type Multiplicity Usage Default value
xs:empty 0...unbounded optional none
Context:/Basic Bioassay Protocol/Templates/Combination Calculation Templates/
10.8.62 TemplateSelect a Combination of assay results template for this Configuration.
This element has the following attributes:
Data type Multiplicity Usage Default value
TemplateReference.CombinationOfAssayResults 1...1 required none
Context:/Basic Bioassay Protocol/Templates/Combination Calculation Templates/Configuration/
10.8.63 DateAutomatically inserts the current date and time when the Date element is created. You can entera different date and time.
This element has the following attributes:
Data type Multiplicity Usage Default value
xs:dateTime 1...1 required none
Context:/Basic Bioassay Protocol/Comment/
/Combination of Independent Assay Results/Comment/
/Control Chart/Comment/
/Dichotomous Assay (Quantal Response Assay)/Comment/
/Equivalence Margin Development for Biological Assays/Comment/
/Quantitative Response Assay/Comment/
164

Reference Guide | Biological Assay Package Version 26
/Test System for Quantitative Response Assay/Comment/
10.8.64 CommentEnter a comment or add a reference to a comment document.
Tip: Tip: You can add several Comment elements. And to each Comment element, you canadd a Subject element, Text elements, and Linked document elements.
This element has the following attributes:
Data type Multiplicity Usage Default value
T_Comment 0...unbounded optional none
Context:/Basic Bioassay Protocol/
/Combination of Independent Assay Results/
/Control Chart/
/Dichotomous Assay (Quantal Response Assay)/
/Equivalence Margin Development for Biological Assays/
/Quantitative Response Assay/
/Test System for Quantitative Response Assay/
10.8.65 Conditional evaluationMake the execution of this test dependent on the results of another test.
This element has the following attributes:
Data type Multiplicity Usage Default value
xs:empty 0...1 optional none
Context:/Quantitative Response Assay/Analysis/Suitability Tests/Assay Suitability Tests/choice/F-Test (Hypothesis Test)/
/Quantitative Response Assay/Analysis/Suitability Tests/Assay Suitability Tests/choice/Equivalence Test (Parameter Estimate)/
/Quantitative Response Assay/Analysis/Suitability Tests/Assay Suitability Tests/choice/Equivalence Test (Difference of ParameterEstimates)/
/Quantitative Response Assay/Analysis/Suitability Tests/Assay Suitability Tests/choice/Equivalence Test (Ratio of ParameterEstimates)/
/Quantitative Response Assay/Analysis/Suitability Tests/Assay Suitability Tests/choice/Equivalence Test (Scaled Parameter Range)/
/Quantitative Response Assay/Analysis/Suitability Tests/Assay Suitability Tests/choice/Point estimate tests: Parameter estimate/
/Quantitative Response Assay/Analysis/Suitability Tests/Assay Suitability Tests/choice/Point estimate tests: Difference of parameterestimates/
/Quantitative Response Assay/Analysis/Suitability Tests/Assay Suitability Tests/choice/Point estimate tests: Ratio of parameterestimates/
/Quantitative Response Assay/Analysis/Suitability Tests/Assay Suitability Tests/choice/Test: Normalized difference of asymptotes/
165

/Quantitative Response Assay/Analysis/Suitability Tests/Assay Suitability Tests/choice/Test: Sum of Squares Regression/
/Quantitative Response Assay/Analysis/Suitability Tests/Assay Suitability Tests/choice/Test: Sum of Squares Non-Parallelism/
/Quantitative Response Assay/Analysis/Suitability Tests/Assay Suitability Tests/choice/Test: Sum of Squares Non-Linearity/
/Quantitative Response Assay/Analysis/Suitability Tests/Assay Suitability Tests/choice/Test: Ratio sum-of-squares non-linearity tosum-of-squares regression/
/Quantitative Response Assay/Analysis/Suitability Tests/Assay Suitability Tests/choice/Test: Potency Value/
/Quantitative Response Assay/Analysis/Suitability Tests/Assay Suitability Tests/choice/Test: Potency Confidence Interval/
/Quantitative Response Assay/Analysis/Suitability Tests/Assay Suitability Tests/choice/Test: Log potency range/
/Quantitative Response Assay/Analysis/Suitability Tests/Assay Suitability Tests/choice/Test: Potency of Intermediate Dilution/
/Quantitative Response Assay/Analysis/Suitability Tests/Assay Suitability Tests/choice/Test: Potency Confidence Interval (%)/
/Quantitative Response Assay/Analysis/Suitability Tests/Assay Suitability Tests/choice/Test: Potency Range (%)/
/Quantitative Response Assay/Analysis/Suitability Tests/Assay Suitability Tests/choice/Test: Maximal Number of Outliers/
/Quantitative Response Assay/Analysis/Suitability Tests/Assay Suitability Tests/choice/Test: Maximal Sequence Step CV (%)/
/Quantitative Response Assay/Analysis/Suitability Tests/Assay Suitability Tests/choice/Test: Minimal R²/
/Quantitative Response Assay/Analysis/Suitability Tests/Assay Suitability Tests/choice/Test: Relative LOF Error (%)/
/Quantitative Response Assay/Analysis/Suitability Tests/Assay Suitability Tests/choice/Test: Response Value Range/
/Quantitative Response Assay/Analysis/Suitability Tests/Assay Suitability Tests/choice/Test: Weight W/
/Quantitative Response Assay/Analysis/Suitability Tests/Sample Suitability Tests/choice/F-Test (Hypothesis Test)/
/Quantitative Response Assay/Analysis/Suitability Tests/Sample Suitability Tests/choice/Equivalence Test (Parameter Estimate)/
/Quantitative Response Assay/Analysis/Suitability Tests/Sample Suitability Tests/choice/Equivalence Test (Difference of ParameterEstimates)/
/Quantitative Response Assay/Analysis/Suitability Tests/Sample Suitability Tests/choice/Equivalence Test (Ratio of ParameterEstimates)/
/Quantitative Response Assay/Analysis/Suitability Tests/Sample Suitability Tests/choice/Equivalence Test (Scaled Parameter Range)/
/Quantitative Response Assay/Analysis/Suitability Tests/Sample Suitability Tests/choice/Point estimate tests: Parameter estimate/
/Quantitative Response Assay/Analysis/Suitability Tests/Sample Suitability Tests/choice/Point estimate tests: Difference of parameterestimates/
/Quantitative Response Assay/Analysis/Suitability Tests/Sample Suitability Tests/choice/Point estimate tests: Ratio of parameterestimates/
/Quantitative Response Assay/Analysis/Suitability Tests/Sample Suitability Tests/choice/Test: Normalized difference of asymptotes/
/Quantitative Response Assay/Analysis/Suitability Tests/Sample Suitability Tests/choice/Test: Sum of Squares Regression/
/Quantitative Response Assay/Analysis/Suitability Tests/Sample Suitability Tests/choice/Test: Sum of Squares Non-Parallelism/
/Quantitative Response Assay/Analysis/Suitability Tests/Sample Suitability Tests/choice/Test: Sum of Squares Non-Linearity/
/Quantitative Response Assay/Analysis/Suitability Tests/Sample Suitability Tests/choice/Test: Ratio sum-of-squares non-linearity tosum-of-squares regression/
/Quantitative Response Assay/Analysis/Suitability Tests/Sample Suitability Tests/choice/Test: Potency Value/
/Quantitative Response Assay/Analysis/Suitability Tests/Sample Suitability Tests/choice/Test: Potency Confidence Interval/
/Quantitative Response Assay/Analysis/Suitability Tests/Sample Suitability Tests/choice/Test: Log potency range/
/Quantitative Response Assay/Analysis/Suitability Tests/Sample Suitability Tests/choice/Test: Potency of Intermediate Dilution/
/Quantitative Response Assay/Analysis/Suitability Tests/Sample Suitability Tests/choice/Test: Potency Confidence Interval (%)/
/Quantitative Response Assay/Analysis/Suitability Tests/Sample Suitability Tests/choice/Test: Potency Range (%)/
/Quantitative Response Assay/Analysis/Suitability Tests/Sample Suitability Tests/choice/Test: Maximal Number of Outliers/
/Quantitative Response Assay/Analysis/Suitability Tests/Sample Suitability Tests/choice/Test: Maximal Sequence Step CV (%)/
/Quantitative Response Assay/Analysis/Suitability Tests/Sample Suitability Tests/choice/Test: Minimal R²/
/Quantitative Response Assay/Analysis/Suitability Tests/Sample Suitability Tests/choice/Test: Relative LOF Error (%)/
/Quantitative Response Assay/Analysis/Suitability Tests/Sample Suitability Tests/choice/Test: Response Value Range/
/Quantitative Response Assay/Analysis/Suitability Tests/Sample Suitability Tests/choice/Test: Weight W/
/Test System for Quantitative Response Assay/Suitability Tests/Assay Suitability Tests/choice/F-Test (Hypothesis Test)/
/Test System for Quantitative Response Assay/Suitability Tests/Assay Suitability Tests/choice/Equivalence Test (Parameter Estimate)/
166

Reference Guide | Biological Assay Package Version 26
/Test System for Quantitative Response Assay/Suitability Tests/Assay Suitability Tests/choice/Equivalence Test (Difference ofParameter Estimates)/
/Test System for Quantitative Response Assay/Suitability Tests/Assay Suitability Tests/choice/Equivalence Test (Ratio of ParameterEstimates)/
/Test System for Quantitative Response Assay/Suitability Tests/Assay Suitability Tests/choice/Equivalence Test (Scaled ParameterRange)/
/Test System for Quantitative Response Assay/Suitability Tests/Assay Suitability Tests/choice/Point estimate tests: Parameter estimate/
/Test System for Quantitative Response Assay/Suitability Tests/Assay Suitability Tests/choice/Point estimate tests: Difference ofparameter estimates/
/Test System for Quantitative Response Assay/Suitability Tests/Assay Suitability Tests/choice/Point estimate tests: Ratio of parameterestimates/
/Test System for Quantitative Response Assay/Suitability Tests/Assay Suitability Tests/choice/Test: Normalized difference ofasymptotes/
/Test System for Quantitative Response Assay/Suitability Tests/Assay Suitability Tests/choice/Test: Sum of Squares Regression/
/Test System for Quantitative Response Assay/Suitability Tests/Assay Suitability Tests/choice/Test: Sum of Squares Non-Parallelism/
/Test System for Quantitative Response Assay/Suitability Tests/Assay Suitability Tests/choice/Test: Sum of Squares Non-Linearity/
/Test System for Quantitative Response Assay/Suitability Tests/Assay Suitability Tests/choice/Test: Ratio sum-of-squares non-linearityto sum-of-squares regression/
/Test System for Quantitative Response Assay/Suitability Tests/Assay Suitability Tests/choice/Test: Potency Value/
/Test System for Quantitative Response Assay/Suitability Tests/Assay Suitability Tests/choice/Test: Potency Confidence Interval/
/Test System for Quantitative Response Assay/Suitability Tests/Assay Suitability Tests/choice/Test: Log potency range/
/Test System for Quantitative Response Assay/Suitability Tests/Assay Suitability Tests/choice/Test: Potency of Intermediate Dilution/
/Test System for Quantitative Response Assay/Suitability Tests/Assay Suitability Tests/choice/Test: Potency Confidence Interval (%)/
/Test System for Quantitative Response Assay/Suitability Tests/Assay Suitability Tests/choice/Test: Potency Range (%)/
/Test System for Quantitative Response Assay/Suitability Tests/Assay Suitability Tests/choice/Test: Maximal Number of Outliers/
/Test System for Quantitative Response Assay/Suitability Tests/Assay Suitability Tests/choice/Test: Maximal Sequence Step CV (%)/
/Test System for Quantitative Response Assay/Suitability Tests/Assay Suitability Tests/choice/Test: Minimal R²/
/Test System for Quantitative Response Assay/Suitability Tests/Assay Suitability Tests/choice/Test: Relative LOF Error (%)/
/Test System for Quantitative Response Assay/Suitability Tests/Assay Suitability Tests/choice/Test: Response Value Range/
/Test System for Quantitative Response Assay/Suitability Tests/Assay Suitability Tests/choice/Test: Weight W/
/Test System for Quantitative Response Assay/Suitability Tests/Sample Suitability Tests/choice/F-Test (Hypothesis Test)/
/Test System for Quantitative Response Assay/Suitability Tests/Sample Suitability Tests/choice/Equivalence Test (Parameter Estimate)/
/Test System for Quantitative Response Assay/Suitability Tests/Sample Suitability Tests/choice/Equivalence Test (Difference ofParameter Estimates)/
/Test System for Quantitative Response Assay/Suitability Tests/Sample Suitability Tests/choice/Equivalence Test (Ratio of ParameterEstimates)/
/Test System for Quantitative Response Assay/Suitability Tests/Sample Suitability Tests/choice/Equivalence Test (Scaled ParameterRange)/
/Test System for Quantitative Response Assay/Suitability Tests/Sample Suitability Tests/choice/Point estimate tests: Parameterestimate/
/Test System for Quantitative Response Assay/Suitability Tests/Sample Suitability Tests/choice/Point estimate tests: Difference ofparameter estimates/
/Test System for Quantitative Response Assay/Suitability Tests/Sample Suitability Tests/choice/Point estimate tests: Ratio ofparameter estimates/
/Test System for Quantitative Response Assay/Suitability Tests/Sample Suitability Tests/choice/Test: Normalized difference ofasymptotes/
/Test System for Quantitative Response Assay/Suitability Tests/Sample Suitability Tests/choice/Test: Sum of Squares Regression/
/Test System for Quantitative Response Assay/Suitability Tests/Sample Suitability Tests/choice/Test: Sum of Squares Non-Parallelism/
/Test System for Quantitative Response Assay/Suitability Tests/Sample Suitability Tests/choice/Test: Sum of Squares Non-Linearity/
/Test System for Quantitative Response Assay/Suitability Tests/Sample Suitability Tests/choice/Test: Ratio sum-of-squares non-linearity to sum-of-squares regression/
/Test System for Quantitative Response Assay/Suitability Tests/Sample Suitability Tests/choice/Test: Potency Value/
167

/Test System for Quantitative Response Assay/Suitability Tests/Sample Suitability Tests/choice/Test: Potency Confidence Interval/
/Test System for Quantitative Response Assay/Suitability Tests/Sample Suitability Tests/choice/Test: Log potency range/
/Test System for Quantitative Response Assay/Suitability Tests/Sample Suitability Tests/choice/Test: Potency of Intermediate Dilution/
/Test System for Quantitative Response Assay/Suitability Tests/Sample Suitability Tests/choice/Test: Potency Confidence Interval (%)/
/Test System for Quantitative Response Assay/Suitability Tests/Sample Suitability Tests/choice/Test: Potency Range (%)/
/Test System for Quantitative Response Assay/Suitability Tests/Sample Suitability Tests/choice/Test: Maximal Number of Outliers/
/Test System for Quantitative Response Assay/Suitability Tests/Sample Suitability Tests/choice/Test: Maximal Sequence Step CV (%)/
/Test System for Quantitative Response Assay/Suitability Tests/Sample Suitability Tests/choice/Test: Minimal R²/
/Test System for Quantitative Response Assay/Suitability Tests/Sample Suitability Tests/choice/Test: Relative LOF Error (%)/
/Test System for Quantitative Response Assay/Suitability Tests/Sample Suitability Tests/choice/Test: Response Value Range/
/Test System for Quantitative Response Assay/Suitability Tests/Sample Suitability Tests/choice/Test: Weight W/
10.8.66 Confidence levelApplies to margin development with tests that use confidence intervals. Select the Confidencelevel for which margins are to be calculated. A common value is 90%.
Note: Note: A higher Confidence level produces broader confidence intervals, which resultsin a greater equivalence range (distance between equivalence margins).
Note: Note: This setting has no effect if you work with tests without confidence intervalssuch as point estimate tests.
This element has the following attributes:
Data type Multiplicity Usage Default value
T_ConfidenceLevel 1...1 required none
Context:/Equivalence Margin Development for Biological Assays/Settings/
10.8.67 Confidence levelSelect the Confidence level of the test. A common value is 95%.
This element has the following attributes:
Data type Multiplicity Usage Default value
T_ConfidenceLevel 1...1 required none
Context:/Quantitative Response Assay/Analysis/Suitability Tests/Assay Suitability Tests/choice/Equivalence Test (Parameter Estimate)/
/Quantitative Response Assay/Analysis/Suitability Tests/Assay Suitability Tests/choice/Equivalence Test (Difference of ParameterEstimates)/
/Quantitative Response Assay/Analysis/Suitability Tests/Assay Suitability Tests/choice/Equivalence Test (Ratio of ParameterEstimates)/
168

Reference Guide | Biological Assay Package Version 26
/Quantitative Response Assay/Analysis/Suitability Tests/Assay Suitability Tests/choice/Equivalence Test (Scaled Parameter Range)/
/Quantitative Response Assay/Analysis/Suitability Tests/Sample Suitability Tests/choice/Equivalence Test (Parameter Estimate)/
/Quantitative Response Assay/Analysis/Suitability Tests/Sample Suitability Tests/choice/Equivalence Test (Difference of ParameterEstimates)/
/Quantitative Response Assay/Analysis/Suitability Tests/Sample Suitability Tests/choice/Equivalence Test (Ratio of ParameterEstimates)/
/Quantitative Response Assay/Analysis/Suitability Tests/Sample Suitability Tests/choice/Equivalence Test (Scaled Parameter Range)/
/Test System for Quantitative Response Assay/Suitability Tests/Assay Suitability Tests/choice/Equivalence Test (Parameter Estimate)/
/Test System for Quantitative Response Assay/Suitability Tests/Assay Suitability Tests/choice/Equivalence Test (Difference ofParameter Estimates)/
/Test System for Quantitative Response Assay/Suitability Tests/Assay Suitability Tests/choice/Equivalence Test (Ratio of ParameterEstimates)/
/Test System for Quantitative Response Assay/Suitability Tests/Assay Suitability Tests/choice/Equivalence Test (Scaled ParameterRange)/
/Test System for Quantitative Response Assay/Suitability Tests/Sample Suitability Tests/choice/Equivalence Test (Parameter Estimate)/
/Test System for Quantitative Response Assay/Suitability Tests/Sample Suitability Tests/choice/Equivalence Test (Difference ofParameter Estimates)/
/Test System for Quantitative Response Assay/Suitability Tests/Sample Suitability Tests/choice/Equivalence Test (Ratio of ParameterEstimates)/
/Test System for Quantitative Response Assay/Suitability Tests/Sample Suitability Tests/choice/Equivalence Test (Scaled ParameterRange)/
Data type Multiplicity Usage Default value
T_ConfidenceLevel 0...1 required none
Context:/Dichotomous Assay (Quantal Response Assay)/Analysis/Suitability Tests/Assay Suitability Tests/Chi-Square-Test / Z-Test (HypothesisTest)/choice/
/Dichotomous Assay (Quantal Response Assay)/Analysis/Suitability Tests/Sample Suitability Tests/Chi-Square-Test / Z-Test(Hypothesis Test)/choice/
/Quantitative Response Assay/Analysis/Suitability Tests/Assay Suitability Tests/choice/F-Test (Hypothesis Test)/choice/
/Quantitative Response Assay/Analysis/Suitability Tests/Sample Suitability Tests/choice/F-Test (Hypothesis Test)/choice/
/Test System for Quantitative Response Assay/Suitability Tests/Assay Suitability Tests/choice/F-Test (Hypothesis Test)/choice/
/Test System for Quantitative Response Assay/Suitability Tests/Sample Suitability Tests/choice/F-Test (Hypothesis Test)/choice/
10.8.68 Configuration optimizer allocation rangeSelect an option from the drop-down list. Use the Maximum range option to have the rangeoptimizer find good configurations with preference to large ranges. Otherwise, use the Bestranges option.
This element has the following attributes:
Data type Multiplicity Usage Default value
T_ConfigurationOptimizerAllocationStrategy 0...1 optional none
Context:
169

/Quantitative Response Assay/Analysis/Data Selection Schemes/
10.8.69 Connect points by lineSelect how you want to draw data points. The following options are available from the drop-down list:
• Select the 'true' option to draw lines to connect data points.
• Select the 'false' option to draw circles to mark data points.
Note: Note: If you select the 'false' option and the number of references is greater than orequal to 500, lines rather than circles are drawn to ensure legibility.
This element has the following attributes:
Data type Multiplicity Usage Default value
xs:boolean 0...1 required none
Context:/Control Chart/Charts/Chart/Graphics Settings/
10.8.70 Use response transformationIf you set Use response transformation to 'true', the transformed response values are used toestimate the 50-percent response. And for the selected range, the following applies:
The minimal transformed response of the selected range is less than or equal to the 50-percentresponse based on the transformed response values, and the maximal transformed response ofthe selected range is greater than or equal to the 50-percent response based on the transformedresponse values.
If you set Use response transformation to 'false', the original scale is used to estimate the 50-percent response. And for the selected range, the following applies:
The minimal response of the selected range is less than or equal to the 50-percent response, andthe maximal response of the selected range is greater than or equal to the 50-percent response.Here, 'response' refers to response values of the original scale.
This element has the following attributes:
Data type Multiplicity Usage Default value
xs:boolean 1...1 required none
Context:/Quantitative Response Assay/Analysis/Data Selection Schemes/Data Selection Scheme/choice/Optimization On/choice/Include 50Percent Response/
170

Reference Guide | Biological Assay Package Version 26
10.8.71 Control limit commentEnter a comment for this control limit.
This element has the following attributes:
Data type Multiplicity Usage Default value
xs:string 0...1 optional none
Context:/Control Chart/Charts/Chart/Control Limit Definition/
10.8.72 Display colorSelect the color to be used to display data of this control limit in the chart. When you create acontrol limit, a color is automatically assigned. Click the color field to display controls that allowyou to change the color.
This element has the following attributes:
Data type Multiplicity Usage Default value
xs:empty 1...1 required none
Context:/Control Chart/Charts/Chart/Control Limit Definition/
10.8.73 End timeAutomatically inserts the current date and time when the End time element is created. You canenter a different date and time.
This element has the following attributes:
Data type Multiplicity Usage Default value
xs:dateTime 0...1 optional none
Context:/Control Chart/Charts/Chart/Control Limit Definition/
171
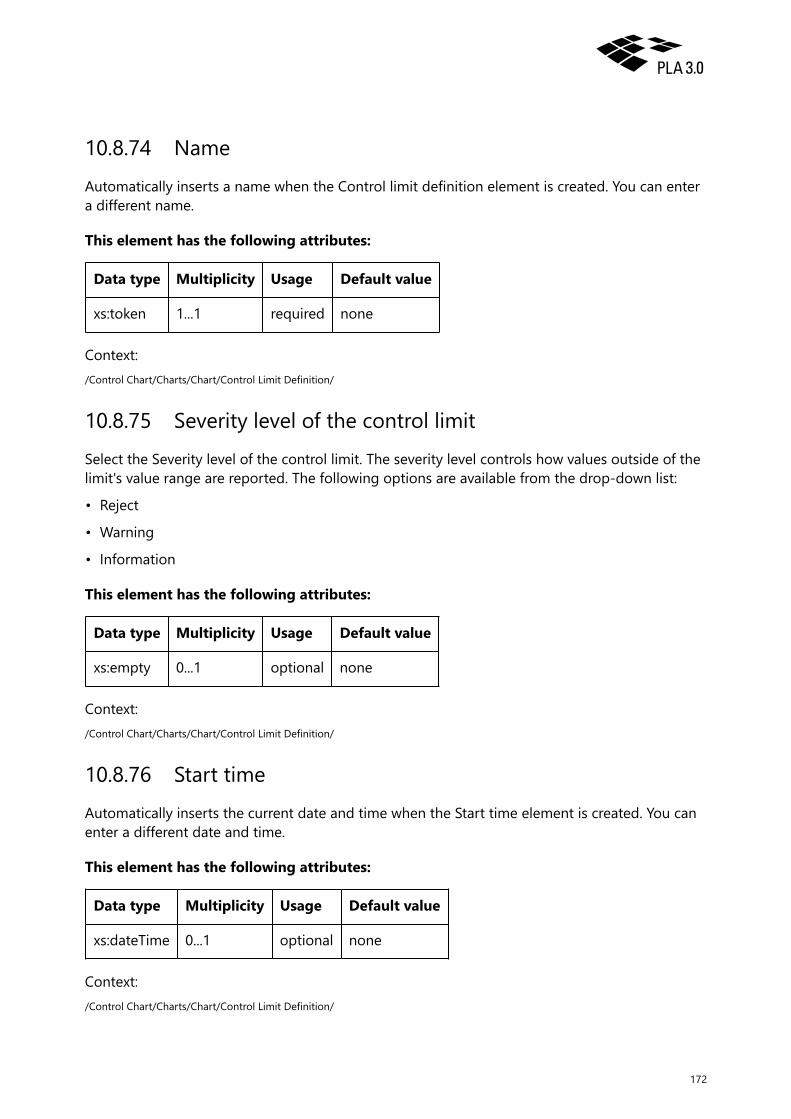
10.8.74 NameAutomatically inserts a name when the Control limit definition element is created. You can entera different name.
This element has the following attributes:
Data type Multiplicity Usage Default value
xs:token 1...1 required none
Context:/Control Chart/Charts/Chart/Control Limit Definition/
10.8.75 Severity level of the control limitSelect the Severity level of the control limit. The severity level controls how values outside of thelimit's value range are reported. The following options are available from the drop-down list:
• Reject
• Warning
• Information
This element has the following attributes:
Data type Multiplicity Usage Default value
xs:empty 0...1 optional none
Context:/Control Chart/Charts/Chart/Control Limit Definition/
10.8.76 Start timeAutomatically inserts the current date and time when the Start time element is created. You canenter a different date and time.
This element has the following attributes:
Data type Multiplicity Usage Default value
xs:dateTime 0...1 optional none
Context:/Control Chart/Charts/Chart/Control Limit Definition/
172

Reference Guide | Biological Assay Package Version 26
10.8.77 Control limit definitionThis section allows you to configure a set of control limits for this chart.
This element has the following attributes:
Data type Multiplicity Usage Default value
T_ControlLimitDefinition 0...unbounded required none
Context:/Control Chart/Charts/Chart/
10.8.78 NameEnter a name for the Control line.
Examples:
'Positive control', 'Negative control', 'Blank'
Note: Note: This name is also displayed in the Observation group ID column of theObservations editor. The name is used to report test results, data values, and estimates related tothis Control line.
Tip: Tip: We recommend to use assay element names that are unique within the assaydocument. But this is not required. Assay elements are internally identified by their uniqueObservation group ID.
This element has the following attributes:
Data type Multiplicity Usage Default value
xs:token 1...1 required none
Context:/Basic Bioassay Protocol/choice/Mode: Assay Element/Control Line/
/Quantitative Response Assay/Setup/Assay Elements/Control Line/
10.8.79 Control lineThis section allows you to provide information on a Control line. Control lines refine thecharacteristics of assays.
Expand the node to add or view information.
Tip: Tip: Use Control lines for response adjustment or enhanced model building.
173

Note: Note: Unlike Control samples, Control lines do not have a dilution or dose.
This element has the following attributes:
Data type Multiplicity Usage Default value
T_AE_ControlLine 0...unbounded optional none
Context:/Basic Bioassay Protocol/choice/Mode: Assay Element/
/Quantitative Response Assay/Setup/Assay Elements/
10.8.80 NameEnter a name for the Control sample.
Examples:
'Assay control', 'Control 3', 'Ctr'
Note: Note: This name is also displayed in the Observation group ID column of theObservations editor. The name is used to report test results, data values, and estimates related tothis Control sample.
Tip: Tip: We recommend to use assay element names that are unique within the assaydocument. But this is not required. Assay elements are internally identified by their uniqueObservation group ID.
This element has the following attributes:
Data type Multiplicity Usage Default value
xs:token 1...1 required none
Context:/Basic Bioassay Protocol/choice/Mode: Assay Element/Control Sample/
/Dichotomous Assay (Quantal Response Assay)/Setup/Assay Elements/Control Sample/
/Quantitative Response Assay/Setup/Assay Elements/Control Sample/
10.8.81 Control sampleThis section allows you to provide information on a Control sample. The potency of Controlsamples is calculated in the same way as the potency of Test samples.
Expand the node to add or view information.
To provide information on the substance: Add the elements you need, such as Substance nameor Substance reference, from the Creatable elements pane.
174

Reference Guide | Biological Assay Package Version 26
Tip: Tip: Use Control samples to set up specific suitability tests for the assay.
Note: Note: Control samples are not included in Combination of assay results calculations.
This element has the following attributes:
Data type Multiplicity Usage Default value
T_AE_Control 0...unbounded optional none
Context:/Basic Bioassay Protocol/choice/Mode: Assay Element/
/Dichotomous Assay (Quantal Response Assay)/Setup/Assay Elements/
/Quantitative Response Assay/Setup/Assay Elements/
10.8.82 CovariancesCurrently, no information available.
This element has the following attributes:
Data type Multiplicity Usage Default value
xs:empty 0...1 optional none
Context:/Equivalence Margin Development for Biological Assays/Visualization/Simulation Space/
10.8.83 Cov(A,D) standard sampleEnter a decimal number to be used as covariance of the upper asymptote and the lowerasymptote of the standard sample. Simulation uses it for testing sampled parameterconfigurations. If you do not enter a value, 0 is used as default.
This element has the following attributes:
Data type Multiplicity Usage Default value
xs:double 0...1 optional none
Context:/Equivalence Margin Development for Biological Assays/Visualization/Simulation Space/Covariances/
175

10.8.84 cov(A,D) test/control sampleEnter a decimal number to be used as covariance of the upper asymptote and the lowerasymptote of the Test/ Control sample. Simulation uses it for testing sampled parameterconfigurations. If you do not enter a value, 0 is used as default.
This element has the following attributes:
Data type Multiplicity Usage Default value
xs:double 0...1 optional none
Context:/Equivalence Margin Development for Biological Assays/Visualization/Simulation Space/Covariances/
10.8.85 Creation timeCurrently, no information available.
This element has the following attributes:
Data type Multiplicity Usage Default value
xs:dateTime 0...1 required none
Context:/Test System for Quantitative Response Assay/
10.8.86 Data plotChange settings to adjust display of data plots to your requirements.
This element has the following attributes:
Data type Multiplicity Usage Default value
xs:empty 0...1 optional none
Context:/Quantitative Response Assay/Settings/Graphics/
10.8.87 Data selection schemesThis section allows you to define multiple data selection schemes for this assay. Data selectionschemes contain settings on outlier detection, range optimization, and range selection.
176

Reference Guide | Biological Assay Package Version 26
Note: Note: Every assay element must reference a data selection scheme defined in thissection.
Expand the node to add or view information.
Tip: Tip: Add one or several Data selection schemes from the context menu or Creatableelements pane.
This element has the following attributes:
Data type Multiplicity Usage Default value
xs:empty 1...1 required none
Context:/Quantitative Response Assay/Analysis/
10.8.88 NameEnter a name for the Data selection scheme.
Note: Note: We recommend to use unique names. But this is not required.
This element has the following attributes:
Data type Multiplicity Usage Default value
xs:token 1...1 required none
Context:/Quantitative Response Assay/Analysis/Data Selection Schemes/Data Selection Scheme/
10.8.89 Data selection schemeAssign a Data selection scheme to this assay element. Data selection schemes define rangeselection settings (including configuration optimizer) and outlier detection methods of assayelements.
This element has the following attributes:
Data type Multiplicity Usage Default value
xs:string 1...1 required none
Context:/Quantitative Response Assay/Setup/Assay Elements/Standard Sample/
/Quantitative Response Assay/Setup/Assay Elements/Test Sample/
177

/Quantitative Response Assay/Setup/Assay Elements/Control Sample/
/Quantitative Response Assay/Setup/Assay Elements/Control Line/
10.8.90 Data selection schemeThis section allows you to define a Data selection scheme. Data selection schemes containsettings on outlier detection, range optimization, and range selection. Expand the node to addor view information.
Note: Note: In every assay element, you must reference exactly one Data selection scheme.
Tip: Tip: You can reference any Data selection scheme from more than one assay element.
This element has the following attributes:
Data type Multiplicity Usage Default value
xs:empty 1...unbounded required none
Context:/Quantitative Response Assay/Analysis/Data Selection Schemes/
10.8.91 Data sourceThis section provides information on imported data. Expand the node to add or viewinformation.
Note: Note: Import information provided in this section was supplied by the import module.
This element has the following attributes:
Data type Multiplicity Usage Default value
xs:empty 0...unbounded optional none
Context:/Dichotomous Assay (Quantal Response Assay)/Documentation/
/Quantitative Response Assay/Documentation/
10.8.92 Data tableThis section allows you to adjust the dataset structure used to calculate the margins. Expand thenode to add or view information.
Note: Note: Much of the dataset structure is set automatically and not visible in the Contenteditor.
178

Reference Guide | Biological Assay Package Version 26
Tip: Tip: View the data table in the References editor.
This element has the following attributes:
Data type Multiplicity Usage Default value
xs:empty 1...1 required none
Context:/Equivalence Margin Development for Biological Assays/
10.8.93 Data tableThis section allows you to adjust the dataset structure.
This element has the following attributes:
Data type Multiplicity Usage Default value
xs:empty 1...1 required none
Context:/Control Chart/
10.8.94 Date column (factor)Define a column that allows you to associate each observation with a date.
This element has the following attributes:
Data type Multiplicity Usage Default value
ds:T_DateColumn 0...unbounded required none
Context:/Dichotomous Assay (Quantal Response Assay)/Setup/Observation Data/choice/
/Quantitative Response Assay/Setup/Observation Data/choice/
10.8.95 Date/time column (factor)Define a column that allows you to associate each observation with a date and time. Expand thenode to add or view information.
This element has the following attributes:
Data type Multiplicity Usage Default value
179

T_RestrictedDateTimeColumn 1...1 required none
Context:/Control Chart/Data Table/
Data type Multiplicity Usage Default value
ds:T_DateTimeColumn 0...unbounded required none
Context:/Dichotomous Assay (Quantal Response Assay)/Setup/Observation Data/choice/
/Quantitative Response Assay/Setup/Observation Data/choice/
10.8.96 Absolute potency: Defined by templateSelect this option if you want to use the assay template settings to define absolute potency.
Note: Note: If you do not use the Defined by template option, the settings provided in theBasic bioassay protocol are used for absolute potency in the generated assay replicates.
This element has the following attributes:
Data type Multiplicity Usage Default value
T_Empty 1...1 required none
Context:/Basic Bioassay Protocol/choice/Mode: Assay Element/Standard Sample/choice/
/Basic Bioassay Protocol/choice/Mode: Assay Element/Test Sample/choice/
/Basic Bioassay Protocol/choice/Mode: Assay Element/Control Sample/choice/
10.8.97 Defined sequenceAllows you to define a sequence by specifying each Dose value individually.
Tip: Tip: Select a different sequence type from the drop-down list if you require.
This element has the following attributes:
Data type Multiplicity Usage Default value
T_SequenceDefined 1...1 required none
Context:/Dichotomous Assay (Quantal Response Assay)/Setup/PreparationSchemes/Preparation Scheme/choice/
/Quantitative Response Assay/Setup/Preparation Schemes/Preparation Scheme/choice/
180

Reference Guide | Biological Assay Package Version 26
10.8.98 Column: Degrees of freedomExpand the node to add or view information.
This element has the following attributes:
Data type Multiplicity Usage Default value
T_dfFactor 1...1 required none
Context:/Combination of Independent Assay Results/Potency Data/
10.8.99 DeltaEnter a number to specify the difference between the dose values of this sequence.
Note: Note: The number you enter must be a non-negative decimal.
The dose value for step number 'j' of a linear sequence is given by:
.
This element has the following attributes:
Data type Multiplicity Usage Default value
xs:double 1...1 required none
Context:/Dichotomous Assay (Quantal Response Assay)/Setup/PreparationSchemes/Preparation Scheme/choice/Linear Sequence/
/Quantitative Response Assay/Setup/Preparation Schemes/Preparation Scheme/choice/Linear Sequence/
10.8.100 Development assayMarks dataset rows as development assays. Rows marked as development assays (value set to'true') are used to derive margins.
This element has the following attributes:
Data type Multiplicity Usage Default value
T_DevelopmentData 1...1 required none
Context:
181

/Equivalence Margin Development for Biological Assays/Datatable/
10.8.101 Difference of asymptotes (A - D) (nonlinear models,Standard only)Use this test for the following models:
• 4-parameter logistic fit
• 4-parameter logistic fit with included blanks
• 5-parameter logistic fit
This element has the following attributes:
Data type Multiplicity Usage Default value
T_SingleTestStrategyWithScalingFactorAndScope 0...1 optional none
Context:/Equivalence Margin Development for Biological Assays/Test Strategies/Strategy/Equivalence Tests - Scaled Parameter Range/
/Equivalence Margin Development for Biological Assays/Margin Development/Equivalence Tests - Scaled Parameter Range/
10.8.102 Difference of asymptotes (A - D) (nonlinear models)Use this test for the following models:
• 4-parameter logistic fit
• 4-parameter logistic fit with included blanks
• 5-parameter logistic fit
This element has the following attributes:
Data type Multiplicity Usage Default value
T_SingleTestStrategyWithScope 0...1 optional none
Context:/Equivalence Margin Development for Biological Assays/Test Strategies/Strategy/Equivalence Tests - Parameter Estimate/
/Equivalence Margin Development for Biological Assays/Test Strategies/Strategy/Equivalence Tests - Difference of ParameterEstimates/
/Equivalence Margin Development for Biological Assays/Test Strategies/Strategy/Equivalence Tests - Ratio of Parameter Estimates/
/Equivalence Margin Development for Biological Assays/Test Strategies/Strategy/Point Estimate Tests - Parameter Estimate/
/Equivalence Margin Development for Biological Assays/Test Strategies/Strategy/Point Estimate Tests - Difference of ParameterEstimates/
/Equivalence Margin Development for Biological Assays/Test Strategies/Strategy/Point Estimate Tests - Ratio of Parameter Estimates/
/Equivalence Margin Development for Biological Assays/Margin Development/Equivalence Tests - Parameter Estimate/
/Equivalence Margin Development for Biological Assays/Margin Development/Equivalence Tests - Difference of Parameter Estimates/
/Equivalence Margin Development for Biological Assays/Margin Development/Equivalence Tests - Ratio of Parameter Estimates/
182

Reference Guide | Biological Assay Package Version 26
/Equivalence Margin Development for Biological Assays/Margin Development/Point Estimate Tests - Parameter Estimate/
/Equivalence Margin Development for Biological Assays/Margin Development/Point Estimate Tests - Difference of ParameterEstimates/
/Equivalence Margin Development for Biological Assays/Margin Development/Point Estimate Tests - Ratio of Parameter Estimates/
10.8.103 Dilution factorEnter a single dilution factor. The calculation uses the reciprocal value (1 / Dilution factor).
This element has the following attributes:
Data type Multiplicity Usage Default value
T_PositiveDouble 0...unbounded optional none
Context:/Basic Bioassay Protocol/choice/Mode: Assay Element/Standard Sample/choice/Dilution Factors: Manual Input/
/Basic Bioassay Protocol/choice/Mode: Assay Element/Test Sample/choice/Dilution Factors: Manual Input/
/Basic Bioassay Protocol/choice/Mode: Assay Element/Control Sample/choice/Dilution Factors: Manual Input/
/Dichotomous Assay (Quantal Response Assay)/Setup/PreparationSchemes/Preparation Scheme/Dilution Factors/
/Quantitative Response Assay/Setup/Preparation Schemes/Preparation Scheme/Dilution Factors/
10.8.104 Dilution factors: Defined by templateSelect this option if you want to use the assay template settings to define the dilution factors.
Note: Note: If you do not use the Defined by template option, the settings provided in theBasic bioassay protocol are used for the dilution factors in the generated assay replicates.
This element has the following attributes:
Data type Multiplicity Usage Default value
T_Empty 1...1 required none
Context:/Basic Bioassay Protocol/choice/Mode: Assay Element/Standard Sample/choice/
/Basic Bioassay Protocol/choice/Mode: Assay Element/Test Sample/choice/
/Basic Bioassay Protocol/choice/Mode: Assay Element/Control Sample/choice/
10.8.105 Dilution factors: Manual inputSelect this option if you want to provide dilution factors directly.
To add a Dilution factor: Double-click Dilution factor in the Creatable elements pane.
Note: Note: When the assays are analyzed, a final dilution factor is calculated by multiplyingall dilution factors entered here.
183

Note: Note: Dilution factors are considered after relative potency is calculated. They do notenter the calculation for model fit.
This element has the following attributes:
Data type Multiplicity Usage Default value
xs:empty 1...1 required none
Context:/Basic Bioassay Protocol/choice/Mode: Assay Element/Standard Sample/choice/
/Basic Bioassay Protocol/choice/Mode: Assay Element/Test Sample/choice/
/Basic Bioassay Protocol/choice/Mode: Assay Element/Control Sample/choice/
10.8.106 Dilution factorsSelect this option if you want to provide dilution factors directly.
To add a Dilution factor: Double-click Dilution factor in the Creatable elements pane.
Note: Note: When the assays are analyzed, a final dilution factor is calculated by multiplyingall dilution factors entered here.
Note: Note: Dilution factors are considered after relative potency is calculated. They do notenter the calculation for model fit.
This element has the following attributes:
Data type Multiplicity Usage Default value
xs:empty 1...1 required none
Context:/Dichotomous Assay (Quantal Response Assay)/Setup/PreparationSchemes/Preparation Scheme/
/Quantitative Response Assay/Setup/Preparation Schemes/Preparation Scheme/
10.8.107 DirectionSelect the sort order you want to apply to the data rows.
This element has the following attributes:
Data type Multiplicity Usage Default value
ds:T_SortDirection 1...1 required none
Context:
184

Reference Guide | Biological Assay Package Version 26
/Control Chart/Data Table/Row Order/
10.8.108 Display colorSelect the color to be used to display data of this assay element in graphs and tables.
When you create an assay element, a color is automatically assigned. Click the color field todisplay controls that allow you to change the color.
This element has the following attributes:
Data type Multiplicity Usage Default value
xs:string 1...1 required none
Context:/Dichotomous Assay (Quantal Response Assay)/Setup/Assay Elements/Standard Sample/
/Dichotomous Assay (Quantal Response Assay)/Setup/Assay Elements/Test Sample/
/Dichotomous Assay (Quantal Response Assay)/Setup/Assay Elements/Control Sample/
/Quantitative Response Assay/Setup/Assay Elements/Standard Sample/
/Quantitative Response Assay/Setup/Assay Elements/Test Sample/
/Quantitative Response Assay/Setup/Assay Elements/Control Sample/
/Quantitative Response Assay/Setup/Assay Elements/Control Line/
10.8.109 Dixon testProvides a statistical test for the detection of data outliers based on: Dixon, Wilfrid J. 1953.'Processing data for outliers.' Biometrics 9 (1): 74-89.
The test is based on replicates. Sensitivity is defined by the respective alpha value.
Note: Note: Our Dixon test implements corrections concerning the calculation of criticalvalues based on Rorabacher.* Yet, for reasons of compatibility, we use the alpha level provided inthe original Dixon paper where the test is defined as one-sided test. The significance level of thecorresponding two-sided test is alpha/2.
The Dixon test is also described in the United States Pharmacopeia: USP 28 NF 23 (2005), p.2521.
* Rorabacher, David B. 1991. 'Statistical treatment for rejection of deviant values: Critical valuesof Dixon's "Q" parameter and related subrange ratios at the 95% confidence level.' AnalyticalChemistry 63 (2): 139–146.
This element has the following attributes:
Data type Multiplicity Usage Default value
xs:empty 1...1 none
185

Context:/Quantitative Response Assay/Analysis/Data Selection Schemes/Data Selection Scheme/choice/
10.8.110 DocumentationThis section allows you to provide information on operators and analyte. Add the elements youneed from the Creatable elements pane.
This element has the following attributes:
Data type Multiplicity Usage Default value
xs:empty 1...1 optional none
Context:/Basic Bioassay Protocol/
10.8.111 DocumentationThis section allows you to provide information on operators, analyte, and equipment. Expand thenode to add or view information.
This element has the following attributes:
Data type Multiplicity Usage Default value
T_Documentation 0...1 optional none
Context:/Combination of Independent Assay Results/
10.8.112 DocumentationThis section allows you to provide information on operators, analyte, reagents, and equipment.Expand the node to add or view information.
This element has the following attributes:
Data type Multiplicity Usage Default value
T_Documentation 0...1 optional none
Context:/Dichotomous Assay (Quantal Response Assay)/
/Quantitative Response Assay/
186

Reference Guide | Biological Assay Package Version 26
10.8.113 DateAutomatically inserts the current date and time when the document is created. You can enter adifferent date and time.
Tip: Tip: Use the date for sorting in aggregation documents.
This element has the following attributes:
Data type Multiplicity Usage Default value
xs:dateTime 0...1 required none
Context:/Combination of Independent Assay Results/
Data type Multiplicity Usage Default value
xs:dateTime 1...1 required none
Context:/Control Chart/
/Dichotomous Assay (Quantal Response Assay)/
/Equivalence Margin Development for Biological Assays/
/Quantitative Response Assay/
/Test System for Quantitative Response Assay/
10.8.114 Document modeSelect a Document mode from the drop-down list to require referenced documents match thismode.
This element has the following attributes:
Data type Multiplicity Usage Default value
ds:T_DocumentMode 0...1 optional none
Context:/Basic Bioassay Protocol/Reportable Values/Document Reference/
/Combination of Independent Assay Results/Potency Data/Column: Document Reference/
10.8.115 Document modeCurrently, no information available.
187

This element has the following attributes:
Data type Multiplicity Usage Default value
dr:T_DocumentMode 1...1 required none
Context:
Data type Multiplicity Usage Default value
dr:T_DocumentMode 0...1 optional none
Context:
10.8.116 NameEnter a name for this document.
Note: Note: Documents are usually identified by name. We therefore recommend to useunique document names. But this is not required.
This element has the following attributes:
Data type Multiplicity Usage Default value
xs:token 1...1 required none
Context:/Basic Bioassay Protocol/
/Combination of Independent Assay Results/
/Control Chart/
/Dichotomous Assay (Quantal Response Assay)/
/Equivalence Margin Development for Biological Assays/
/Quantitative Response Assay/
/Test System for Quantitative Response Assay/
10.8.117 Document property filterCurrently, no information available.
This element has the following attributes:
Data type Multiplicity Usage Default value
dr:T_DocumentPropertyFilterForDocuments 0...unbounded optional none
188

Reference Guide | Biological Assay Package Version 26
Context:/Basic Bioassay Protocol/Templates/Combination Calculation Templates/Configuration/Template/Config/
10.8.118 Document property filterDefine a filter based on a document property to require referenced documents match thisproperty.
This element has the following attributes:
Data type Multiplicity Usage Default value
ds:T_DocumentPropertyFilterForDocuments 0...unbounded optional none
Context:/Basic Bioassay Protocol/Reportable Values/Document Reference/
/Combination of Independent Assay Results/Potency Data/Column: Document Reference/
10.8.119 Document property importCurrently, no information available.
This element has the following attributes:
Data type Multiplicity Usage Default value
dr:T_DocumentPropertyImport 0...unbounded optional none
Context:
10.8.120 Document referenceConfigure the document reference column.
This element has the following attributes:
Data type Multiplicity Usage Default value
DatasetColumn.Reference 1...1 optional none
Context:/Basic Bioassay Protocol/Reportable Values/
/Combination of Independent Assay Results/Potency Data/
/Control Chart/Data Table/
/Equivalence Margin Development for Biological Assays/Datatable/
Data type Multiplicity Usage Default value
189

ds:T_ReferenceColumn 0...1 required none
Context:/Quantitative Response Assay/Setup/Observation Data/
10.8.121 Document suitability testsAdd the Document suitability tests you require.
Important: Important: The results of Document suitability tests affect the whole assaydocument.
This element has the following attributes:
Data type Multiplicity Usage Default value
T_DocumentSuitabilityTests 0...1 optional none
Context:/Dichotomous Assay (Quantal Response Assay)/Analysis/Suitability Tests/
/Quantitative Response Assay/Analysis/Suitability Tests/
/Test System for Quantitative Response Assay/Suitability Tests/
10.8.122 Document typeSelect the document type of the document to be referenced.
This element has the following attributes:
Data type Multiplicity Usage Default value
xs:token 0...1 optional none
Context:/Combination of Independent Assay Results/Potency Data/Column: Document Reference/
10.8.123 Document typeCurrently, no information available.
This element has the following attributes:
Data type Multiplicity Usage Default value
xs:token 1...1 required none
190

Reference Guide | Biological Assay Package Version 26
Context:/Basic Bioassay Protocol/Templates/Combination Calculation Templates/Configuration/Template/Config/
Data type Multiplicity Usage Default value
xs:token 0...1 optional none
Context:
10.8.124 Transformed dose maximumEnter a decimal number to be used as greatest value of the x-axis in simulation plots.
This element has the following attributes:
Data type Multiplicity Usage Default value
xs:double 0...1 optional none
Context:/Equivalence Margin Development for Biological Assays/Visualization/Transformed Dose Range/
10.8.125 Transformed dose minimumEnter a decimal number to be used as least value of the x-axis in simulation plots.
This element has the following attributes:
Data type Multiplicity Usage Default value
xs:double 0...1 optional none
Context:/Equivalence Margin Development for Biological Assays/Visualization/Transformed Dose Range/
10.8.126 Transformed dose rangeDefines the least and greatest value of the x-axis used for simulation plots.
Note: Note: These values only apply if no assays are referenced. Otherwise, the values of thereferenced assays are used.
Note: Note: If the Model selected for visualization is 'Slope ratio', the values are consideredabsolute dose values. For all other models, the values are considered log dose values.
191

This element has the following attributes:
Data type Multiplicity Usage Default value
xs:empty 0...1 optional none
Context:/Equivalence Margin Development for Biological Assays/Visualization/
10.8.127 Dose valueEnter a number to set a Dose value for the Defined sequence.
Tip: Tip: Add additional Dose value elements as you require.
Note: Note: The Dose values you enter are internally associated with consecutivelynumbered dose steps starting with '1'.
This element has the following attributes:
Data type Multiplicity Usage Default value
T_NonNegativeDouble 1...unbounded required none
Context:/Dichotomous Assay (Quantal Response Assay)/Setup/PreparationSchemes/Preparation Scheme/choice/Defined Sequence/
/Quantitative Response Assay/Setup/Preparation Schemes/Preparation Scheme/choice/Defined Sequence/
10.8.128 Dichotomous assay (quantal response assay)Dichotomous assays are dilution assays based on a dichotomous response. Unlike quantitativeresponse, dichotomous response is measured on a discrete scale.
Navigate through the properties to select or enter settings you require for this Dichotomousassay:
1. Expand the node to add or view information. The second level of the document structuredisplays the Name and Date of the document. It also provides access to the Documentation,Setup, and Analysis sections.
2. Double-click the Identification element in the Creatable elements pane to add it to thedocument.
Note: Note: To delete an element from the document, right-click the element in thedocument structure and select the Delete element option from the pop-up menu.
3. Double-click the Comment or Settings element in the Creatable elements pane to add aComment or Settings section to the document.
192
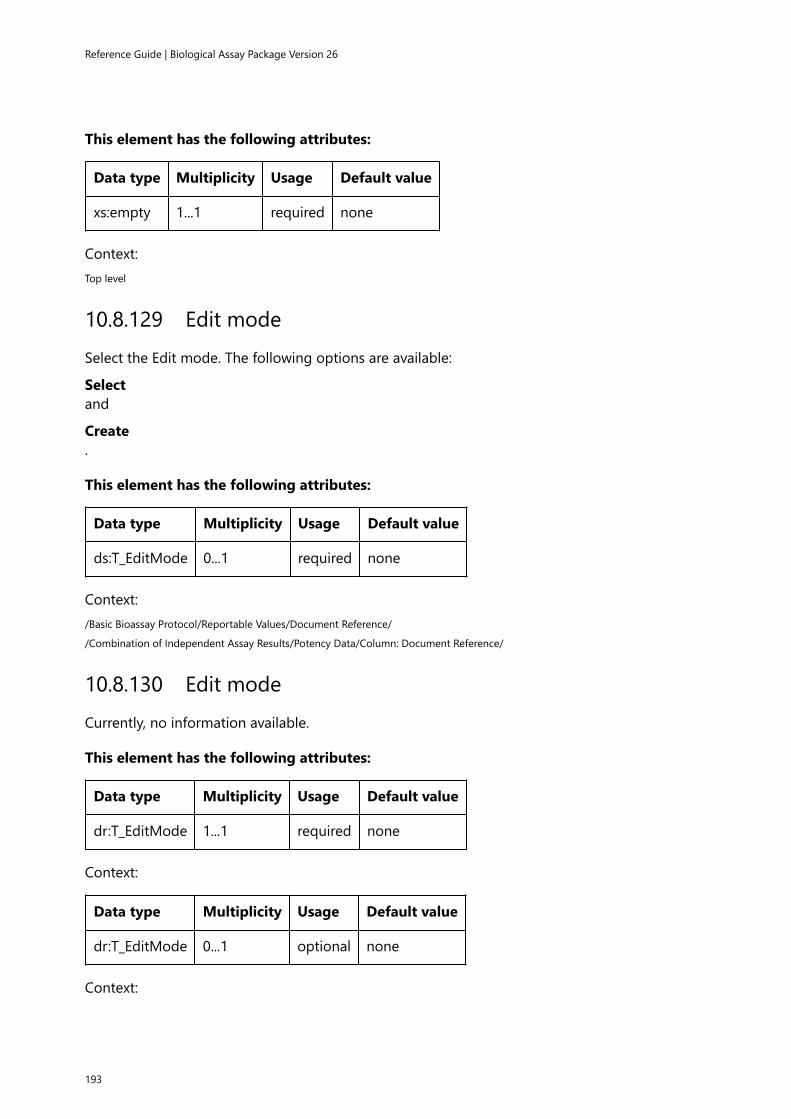
Reference Guide | Biological Assay Package Version 26
This element has the following attributes:
Data type Multiplicity Usage Default value
xs:empty 1...1 required none
Context:Top level
10.8.129 Edit modeSelect the Edit mode. The following options are available:
Selectand
Create.
This element has the following attributes:
Data type Multiplicity Usage Default value
ds:T_EditMode 0...1 required none
Context:/Basic Bioassay Protocol/Reportable Values/Document Reference/
/Combination of Independent Assay Results/Potency Data/Column: Document Reference/
10.8.130 Edit modeCurrently, no information available.
This element has the following attributes:
Data type Multiplicity Usage Default value
dr:T_EditMode 1...1 required none
Context:
Data type Multiplicity Usage Default value
dr:T_EditMode 0...1 optional none
Context:
193

10.8.131 Equivalence margin development for biological assaysEquivalence margin development utilizes data of existing assays to develop and verify testsystems that can be exported and applied in new assay development. Visualization is alsoavailable for existing test systems.
Navigate through the properties to select or enter settings you require:
1. Expand the node to add or view information. The second level of the document structuredisplays the Name and Date of the document. It also provides access to the Settings, Datatable,Margin development, Test strategies (verification), and Visualization sections.
2. Double-click the Identification element in the Creatable elements pane to add it to thedocument.
Note: Note: To delete an element from the document, right-click the element in thedocument structure and select the Delete element option from the pop-up menu.
3. Double-click the Comment element in the Creatable elements pane to add a Commentsection to the document.
This element has the following attributes:
Data type Multiplicity Usage Default value
xs:empty 1...1 optional none
Context:Top level
10.8.132 Equipment nameEnter the name of the equipment.
Tip: Tip: You can enter a reference to an equipment document instead. Select the Equipmentreference option from the drop-down list.
This element has the following attributes:
Data type Multiplicity Usage Default value
xs:token 1...1 required none
Context:/Combination of Independent Assay Results/Documentation/Equipment/choice/
/Dichotomous Assay (Quantal Response Assay)/Documentation/Equipment/choice/
/Quantitative Response Assay/Documentation/Equipment/choice/
194

Reference Guide | Biological Assay Package Version 26
10.8.133 Equipment referenceSelect an equipment document.
Tip: Tip: You can enter an equipment name instead. Select the Equipment name option fromthe drop-down list.
This element has the following attributes:
Data type Multiplicity Usage Default value
T_EquipmentReference 1...1 required none
Context:/Combination of Independent Assay Results/Documentation/Equipment/choice/
/Dichotomous Assay (Quantal Response Assay)/Documentation/Equipment/choice/
/Quantitative Response Assay/Documentation/Equipment/choice/
10.8.134 EquipmentThis section allows you to document the equipment used to perform this assay. Expand the nodeto add or view information.
This element has the following attributes:
Data type Multiplicity Usage Default value
xs:empty 0...unbounded optional none
Context:/Combination of Independent Assay Results/Documentation/
/Dichotomous Assay (Quantal Response Assay)/Documentation/
/Quantitative Response Assay/Documentation/
10.8.135 Equivalence tests: Difference of parameter estimates
This element has the following attributes:
Data type Multiplicity Usage Default value
L_EquivalenceTestsDifferenceOfParameterEstimates 0...1 optional none
Context:/Equivalence Margin Development for Biological Assays/Margin Development/
/Equivalence Margin Development for Biological Assays/Test Strategies/Strategy/
195

10.8.136 Equivalence tests: Difference of parameter estimatesAdd one or several equivalence tests for the difference of the Test or Control sample parameterminus the Standard sample parameter to your assay.
Tip: Tip: Select the Assay suitability or Sample suitability section prior to adding tests. Toadd an assay suitability test, select the Assay suitability tests element or one of its childrenprior to adding the test from the Context list. To add a sample suitability test, select the Samplesuitability tests element or one of its children.
Important: Important: Test definitions are ignored without notification if the Parameter youselect results in invalid test definitions (for example, if a test cannot be performed for the modelyou use).
The following table lists all available tests and indicates which models and assay elements theysupport:
Equivalencetest on thedifference
of the:
Linearparallel-linemodel
4-parameterlogisticmodel
5-parameterlogisticmodel
3-parameterlogistic modelwith fixedlower or upperasymptote
Sloperatiomodel
Assayelements
Upperasymptotes
(A)(nonlinearmodels)
no yes yes with fixed Lowerasymptote
no Test,Control
B parameters(nonlinearmodels)
no yes yes yes no Test,Control
Lowerasymptotes
(D)(nonlinearmodels)
no yes yes with fixed Upperasymptote
no Test,Control
Asymmetryparameters
(G)(nonlinearmodels)
no no yes no no Test,Control
Intercepts(linear
models)
no no no no yes Test,Control
196
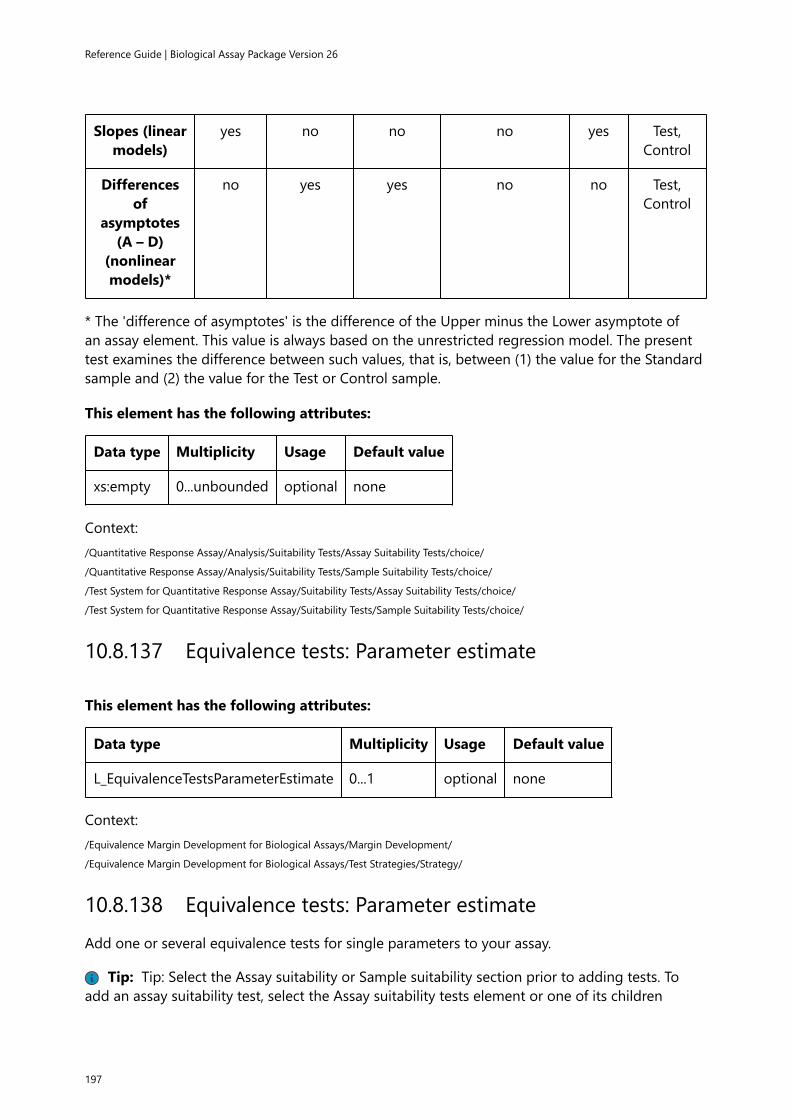
Reference Guide | Biological Assay Package Version 26
Slopes (linearmodels)
yes no no no yes Test,Control
Differencesof
asymptotes(A – D)
(nonlinearmodels)*
no yes yes no no Test,Control
* The 'difference of asymptotes' is the difference of the Upper minus the Lower asymptote ofan assay element. This value is always based on the unrestricted regression model. The presenttest examines the difference between such values, that is, between (1) the value for the Standardsample and (2) the value for the Test or Control sample.
This element has the following attributes:
Data type Multiplicity Usage Default value
xs:empty 0...unbounded optional none
Context:/Quantitative Response Assay/Analysis/Suitability Tests/Assay Suitability Tests/choice/
/Quantitative Response Assay/Analysis/Suitability Tests/Sample Suitability Tests/choice/
/Test System for Quantitative Response Assay/Suitability Tests/Assay Suitability Tests/choice/
/Test System for Quantitative Response Assay/Suitability Tests/Sample Suitability Tests/choice/
10.8.137 Equivalence tests: Parameter estimate
This element has the following attributes:
Data type Multiplicity Usage Default value
L_EquivalenceTestsParameterEstimate 0...1 optional none
Context:/Equivalence Margin Development for Biological Assays/Margin Development/
/Equivalence Margin Development for Biological Assays/Test Strategies/Strategy/
10.8.138 Equivalence tests: Parameter estimateAdd one or several equivalence tests for single parameters to your assay.
Tip: Tip: Select the Assay suitability or Sample suitability section prior to adding tests. Toadd an assay suitability test, select the Assay suitability tests element or one of its children
197

prior to adding the test from the Context list. To add a sample suitability test, select the Samplesuitability tests element or one of its children.
Important: Important: Test definitions are ignored without notification if the Parameter youselect results in invalid test definitions (for example, if a test cannot be performed for the modelyou use).
The following table lists all available tests and indicates which models and assay elements theysupport:
Equivalencetest on the:
Linearparallel-linemodel
4-parameterlogisticmodel
5-parameterlogisticmodel
3-parameterlogistic modelwith fixedlower or upperasymptote
Sloperatiomodel
Assayelements
Upperasymptote
(A)(nonlinearmodels)
no yes yes with fixed Lowerasymptote
no Standard,Test,
Control
B parameter(nonlinearmodels)
no yes yes yes no Standard,Test,
Control
C parameter(nonlinearmodels)
no yes yes yes no Standard,Test,
Control
Lowerasymptote
(D)(nonlinearmodels)
no yes yes with fixed Upperasymptote
no Standard,Test,
Control
Asymmetryparameter
(G)(nonlinearmodels)
no no yes no no Standard,Test,
Control
Intercept(linear
models)
yes no no no yes Standard,Test,
Control
Slope (linearmodels)
yes no no no yes Standard,Test,
Control
198

Reference Guide | Biological Assay Package Version 26
Difference ofasymptotes
(A - D)(nonlinearmodels)
no yes yes no no Standard,Test,
Control
Ratio ofasymptotes
(A / D)(nonlinearmodels)
no yes yes no no Standard,Test,
Control
This element has the following attributes:
Data type Multiplicity Usage Default value
xs:empty 0...unbounded optional none
Context:/Quantitative Response Assay/Analysis/Suitability Tests/Assay Suitability Tests/choice/
/Quantitative Response Assay/Analysis/Suitability Tests/Sample Suitability Tests/choice/
/Test System for Quantitative Response Assay/Suitability Tests/Assay Suitability Tests/choice/
/Test System for Quantitative Response Assay/Suitability Tests/Sample Suitability Tests/choice/
10.8.139 Equivalence tests: Ratio of parameter estimates
This element has the following attributes:
Data type Multiplicity Usage Default value
L_EquivalenceTestsRatioOfParameterEstimates 0...1 optional none
Context:/Equivalence Margin Development for Biological Assays/Margin Development/
/Equivalence Margin Development for Biological Assays/Test Strategies/Strategy/
10.8.140 Equivalence tests: Ratio of parameter estimatesAdd one or several equivalence tests for the ratio of the Test or Control sample parameter overthe Standard sample parameter to your assay.
Tip: Tip: Select the Assay suitability or Sample suitability section prior to adding tests. Toadd an assay suitability test, select the Assay suitability tests element or one of its childrenprior to adding the test from the Context list. To add a sample suitability test, select the Samplesuitability tests element or one of its children.
199

Important: Important: Test definitions are ignored without notification if the Parameter youselect results in invalid test definitions (for example, if a test cannot be performed for the modelyou use).
The following table lists all available tests and indicates which models and assay elements theysupport:
Equivalencetest on theratio of the:
Linearparallel-linemodel
4-parameterlogisticmodel
5-parameterlogisticmodel
3-parameterlogistic modelwith fixedlower or upperasymptote
Sloperatiomodel
Assayelements
Upperasymptotes
(A)(nonlinearmodels)
no yes yes with fixed Lowerasymptote
no Test,Control
B parameters(nonlinearmodels)
no yes yes yes no Test,Control
Lowerasymptotes
(D)(nonlinearmodels)
no yes yes with fixed Upperasymptote
no Test,Control
Asymmetryparameters
(G)(nonlinearmodels)
no no yes no no Test,Control
Intercepts(linear
models)
no no no no yes Test,Control
Slopes (linearmodels)
yes no no no yes Test,Control
Differencesof
asymptotes(A – D)
(nonlinearmodels)*
no yes yes no no Test,Control
200

Reference Guide | Biological Assay Package Version 26
* The 'difference of asymptotes' is the difference of the Upper minus the Lower asymptote of anassay element. This value is always based on the unrestricted regression model. The present testexamines the ratio of such values, that is, of (1) the value for the Test or Control sample to (2) thevalue for the Standard sample.
This element has the following attributes:
Data type Multiplicity Usage Default value
xs:empty 0...unbounded optional none
Context:/Quantitative Response Assay/Analysis/Suitability Tests/Assay Suitability Tests/choice/
/Quantitative Response Assay/Analysis/Suitability Tests/Sample Suitability Tests/choice/
/Test System for Quantitative Response Assay/Suitability Tests/Assay Suitability Tests/choice/
/Test System for Quantitative Response Assay/Suitability Tests/Sample Suitability Tests/choice/
10.8.141 Equivalence tests: Scaled parameter range
This element has the following attributes:
Data type Multiplicity Usage Default value
L_EquivalenceTestsScaledParameterRange 0...1 optional none
Context:/Equivalence Margin Development for Biological Assays/Margin Development/
/Equivalence Margin Development for Biological Assays/Test Strategies/Strategy/
10.8.142 Equivalence tests: Scaled parameter rangeAdd one or several equivalence tests for the scaled range of the Test or Control sampleparameter to the Standard sample parameter (divided by the scaling parameter) to your assay.
Tip: Tip: Select the Assay suitability or Sample suitability section prior to adding tests. Toadd an assay suitability test, select the Assay suitability tests element or one of its childrenprior to adding the test from the Context list. To add a sample suitability test, select the Samplesuitability tests element or one of its children.
Important: Important: Test definitions are ignored without notification if the Parameter youselect results in invalid test definitions (for example, if a test cannot be performed for the modelyou use).
The following table lists all available tests and indicates which models and assay elements theysupport:
201

Equivalencetest on
the scaledrange of the:
Linearparallel-linemodel
4-parameterlogisticmodel
5-parameterlogisticmodel
3-parameterlogisticmodel withfixed loweror upperasymptote
Sloperatiomodel
Assayelements
Upperasymptote
(A) (nonlinearmodels)
no yes yes with fixedLower
asymptote
no Test,Control
B parameter(nonlinearmodels)
no yes yes yes no Test,Control
Lowerasymptote
(D) (nonlinearmodels)
no yes yes with fixedUpper
asymptote
no Test,Control
Asymmetryparameter
(G) (nonlinearmodels)
no no yes no no Test,Control
Intercept(linear models)
no no no no yes Test,Control
Slope (linearmodels)
yes no no no yes Test,Control
Difference ofasymptotes (A– D) (nonlinear
models,Standard only)
no yes yes no no Test,Control
This element has the following attributes:
Data type Multiplicity Usage Default value
xs:empty 0...unbounded optional none
Context:/Quantitative Response Assay/Analysis/Suitability Tests/Assay Suitability Tests/choice/
/Quantitative Response Assay/Analysis/Suitability Tests/Sample Suitability Tests/choice/
/Test System for Quantitative Response Assay/Suitability Tests/Assay Suitability Tests/choice/
202

Reference Guide | Biological Assay Package Version 26
/Test System for Quantitative Response Assay/Suitability Tests/Sample Suitability Tests/choice/
10.8.143 Estimation bySelect how you want to estimate the 50-percent response. The following options are available:
Arithmetic meanand
Mean of max/min treatment mean.
This element has the following attributes:
Data type Multiplicity Usage Default value
T_EstimationType 1...1 required none
Context:/Quantitative Response Assay/Analysis/Data Selection Schemes/Data Selection Scheme/choice/Optimization On/choice/Include 50Percent Response/
10.8.144 Evaluation conditionSelect one of the following Evaluation conditions from the drop-down list:
• Referenced test passed: This test is to be executed if your data passes the referenced test.Otherwise, the result of this test is set to 'NC' (not calculated).
• Referenced test failed: This test is to be executed if your data fails the referenced test.Otherwise, the result of this test is set to 'NC' (not calculated).
This element has the following attributes:
Data type Multiplicity Usage Default value
xs:empty 1...1 optional none
Context:/Quantitative Response Assay/Analysis/Suitability Tests/Assay Suitability Tests/choice/F-Test (Hypothesis Test)/ConditionalEvaluation/
/Quantitative Response Assay/Analysis/Suitability Tests/Assay Suitability Tests/choice/Equivalence Test (Parameter Estimate)/Conditional Evaluation/
/Quantitative Response Assay/Analysis/Suitability Tests/Assay Suitability Tests/choice/Equivalence Test (Difference of ParameterEstimates)/Conditional Evaluation/
/Quantitative Response Assay/Analysis/Suitability Tests/Assay Suitability Tests/choice/Equivalence Test (Ratio of ParameterEstimates)/Conditional Evaluation/
/Quantitative Response Assay/Analysis/Suitability Tests/Assay Suitability Tests/choice/Equivalence Test (Scaled Parameter Range)/Conditional Evaluation/
/Quantitative Response Assay/Analysis/Suitability Tests/Assay Suitability Tests/choice/Point estimate tests: Parameter estimate/Conditional Evaluation/
203

/Quantitative Response Assay/Analysis/Suitability Tests/Assay Suitability Tests/choice/Point estimate tests: Difference of parameterestimates/Conditional Evaluation/
/Quantitative Response Assay/Analysis/Suitability Tests/Assay Suitability Tests/choice/Point estimate tests: Ratio of parameterestimates/Conditional Evaluation/
/Quantitative Response Assay/Analysis/Suitability Tests/Assay Suitability Tests/choice/Test: Normalized difference of asymptotes/Conditional Evaluation/
/Quantitative Response Assay/Analysis/Suitability Tests/Assay Suitability Tests/choice/Test: Sum of Squares Regression/ConditionalEvaluation/
/Quantitative Response Assay/Analysis/Suitability Tests/Assay Suitability Tests/choice/Test: Sum of Squares Non-Parallelism/Conditional Evaluation/
/Quantitative Response Assay/Analysis/Suitability Tests/Assay Suitability Tests/choice/Test: Sum of Squares Non-Linearity/ConditionalEvaluation/
/Quantitative Response Assay/Analysis/Suitability Tests/Assay Suitability Tests/choice/Test: Ratio sum-of-squares non-linearity tosum-of-squares regression/Conditional Evaluation/
/Quantitative Response Assay/Analysis/Suitability Tests/Assay Suitability Tests/choice/Test: Potency Value/Conditional Evaluation/
/Quantitative Response Assay/Analysis/Suitability Tests/Assay Suitability Tests/choice/Test: Potency Confidence Interval/ConditionalEvaluation/
/Quantitative Response Assay/Analysis/Suitability Tests/Assay Suitability Tests/choice/Test: Log potency range/ConditionalEvaluation/
/Quantitative Response Assay/Analysis/Suitability Tests/Assay Suitability Tests/choice/Test: Potency of Intermediate Dilution/Conditional Evaluation/
/Quantitative Response Assay/Analysis/Suitability Tests/Assay Suitability Tests/choice/Test: Potency Confidence Interval (%)/Conditional Evaluation/
/Quantitative Response Assay/Analysis/Suitability Tests/Assay Suitability Tests/choice/Test: Potency Range (%)/ConditionalEvaluation/
/Quantitative Response Assay/Analysis/Suitability Tests/Assay Suitability Tests/choice/Test: Maximal Number of Outliers/ConditionalEvaluation/
/Quantitative Response Assay/Analysis/Suitability Tests/Assay Suitability Tests/choice/Test: Maximal Sequence Step CV (%)/Conditional Evaluation/
/Quantitative Response Assay/Analysis/Suitability Tests/Assay Suitability Tests/choice/Test: Minimal R²/Conditional Evaluation/
/Quantitative Response Assay/Analysis/Suitability Tests/Assay Suitability Tests/choice/Test: Relative LOF Error (%)/ConditionalEvaluation/
/Quantitative Response Assay/Analysis/Suitability Tests/Assay Suitability Tests/choice/Test: Response Value Range/ConditionalEvaluation/
/Quantitative Response Assay/Analysis/Suitability Tests/Assay Suitability Tests/choice/Test: Weight W/Conditional Evaluation/
/Quantitative Response Assay/Analysis/Suitability Tests/Sample Suitability Tests/choice/F-Test (Hypothesis Test)/ConditionalEvaluation/
/Quantitative Response Assay/Analysis/Suitability Tests/Sample Suitability Tests/choice/Equivalence Test (Parameter Estimate)/Conditional Evaluation/
/Quantitative Response Assay/Analysis/Suitability Tests/Sample Suitability Tests/choice/Equivalence Test (Difference of ParameterEstimates)/Conditional Evaluation/
/Quantitative Response Assay/Analysis/Suitability Tests/Sample Suitability Tests/choice/Equivalence Test (Ratio of ParameterEstimates)/Conditional Evaluation/
/Quantitative Response Assay/Analysis/Suitability Tests/Sample Suitability Tests/choice/Equivalence Test (Scaled Parameter Range)/Conditional Evaluation/
/Quantitative Response Assay/Analysis/Suitability Tests/Sample Suitability Tests/choice/Point estimate tests: Parameter estimate/Conditional Evaluation/
/Quantitative Response Assay/Analysis/Suitability Tests/Sample Suitability Tests/choice/Point estimate tests: Difference of parameterestimates/Conditional Evaluation/
/Quantitative Response Assay/Analysis/Suitability Tests/Sample Suitability Tests/choice/Point estimate tests: Ratio of parameterestimates/Conditional Evaluation/
/Quantitative Response Assay/Analysis/Suitability Tests/Sample Suitability Tests/choice/Test: Normalized difference of asymptotes/Conditional Evaluation/
/Quantitative Response Assay/Analysis/Suitability Tests/Sample Suitability Tests/choice/Test: Sum of Squares Regression/ConditionalEvaluation/
204

Reference Guide | Biological Assay Package Version 26
/Quantitative Response Assay/Analysis/Suitability Tests/Sample Suitability Tests/choice/Test: Sum of Squares Non-Parallelism/Conditional Evaluation/
/Quantitative Response Assay/Analysis/Suitability Tests/Sample Suitability Tests/choice/Test: Sum of Squares Non-Linearity/Conditional Evaluation/
/Quantitative Response Assay/Analysis/Suitability Tests/Sample Suitability Tests/choice/Test: Ratio sum-of-squares non-linearity tosum-of-squares regression/Conditional Evaluation/
/Quantitative Response Assay/Analysis/Suitability Tests/Sample Suitability Tests/choice/Test: Potency Value/Conditional Evaluation/
/Quantitative Response Assay/Analysis/Suitability Tests/Sample Suitability Tests/choice/Test: Potency Confidence Interval/ConditionalEvaluation/
/Quantitative Response Assay/Analysis/Suitability Tests/Sample Suitability Tests/choice/Test: Log potency range/ConditionalEvaluation/
/Quantitative Response Assay/Analysis/Suitability Tests/Sample Suitability Tests/choice/Test: Potency of Intermediate Dilution/Conditional Evaluation/
/Quantitative Response Assay/Analysis/Suitability Tests/Sample Suitability Tests/choice/Test: Potency Confidence Interval (%)/Conditional Evaluation/
/Quantitative Response Assay/Analysis/Suitability Tests/Sample Suitability Tests/choice/Test: Potency Range (%)/ConditionalEvaluation/
/Quantitative Response Assay/Analysis/Suitability Tests/Sample Suitability Tests/choice/Test: Maximal Number of Outliers/ConditionalEvaluation/
/Quantitative Response Assay/Analysis/Suitability Tests/Sample Suitability Tests/choice/Test: Maximal Sequence Step CV (%)/Conditional Evaluation/
/Quantitative Response Assay/Analysis/Suitability Tests/Sample Suitability Tests/choice/Test: Minimal R²/Conditional Evaluation/
/Quantitative Response Assay/Analysis/Suitability Tests/Sample Suitability Tests/choice/Test: Relative LOF Error (%)/ConditionalEvaluation/
/Quantitative Response Assay/Analysis/Suitability Tests/Sample Suitability Tests/choice/Test: Response Value Range/ConditionalEvaluation/
/Quantitative Response Assay/Analysis/Suitability Tests/Sample Suitability Tests/choice/Test: Weight W/Conditional Evaluation/
/Test System for Quantitative Response Assay/Suitability Tests/Assay Suitability Tests/choice/F-Test (Hypothesis Test)/ConditionalEvaluation/
/Test System for Quantitative Response Assay/Suitability Tests/Assay Suitability Tests/choice/Equivalence Test (Parameter Estimate)/Conditional Evaluation/
/Test System for Quantitative Response Assay/Suitability Tests/Assay Suitability Tests/choice/Equivalence Test (Difference ofParameter Estimates)/Conditional Evaluation/
/Test System for Quantitative Response Assay/Suitability Tests/Assay Suitability Tests/choice/Equivalence Test (Ratio of ParameterEstimates)/Conditional Evaluation/
/Test System for Quantitative Response Assay/Suitability Tests/Assay Suitability Tests/choice/Equivalence Test (Scaled ParameterRange)/Conditional Evaluation/
/Test System for Quantitative Response Assay/Suitability Tests/Assay Suitability Tests/choice/Point estimate tests: Parameter estimate/Conditional Evaluation/
/Test System for Quantitative Response Assay/Suitability Tests/Assay Suitability Tests/choice/Point estimate tests: Difference ofparameter estimates/Conditional Evaluation/
/Test System for Quantitative Response Assay/Suitability Tests/Assay Suitability Tests/choice/Point estimate tests: Ratio of parameterestimates/Conditional Evaluation/
/Test System for Quantitative Response Assay/Suitability Tests/Assay Suitability Tests/choice/Test: Normalized difference ofasymptotes/Conditional Evaluation/
/Test System for Quantitative Response Assay/Suitability Tests/Assay Suitability Tests/choice/Test: Sum of Squares Regression/Conditional Evaluation/
/Test System for Quantitative Response Assay/Suitability Tests/Assay Suitability Tests/choice/Test: Sum of Squares Non-Parallelism/Conditional Evaluation/
/Test System for Quantitative Response Assay/Suitability Tests/Assay Suitability Tests/choice/Test: Sum of Squares Non-Linearity/Conditional Evaluation/
/Test System for Quantitative Response Assay/Suitability Tests/Assay Suitability Tests/choice/Test: Ratio sum-of-squares non-linearityto sum-of-squares regression/Conditional Evaluation/
/Test System for Quantitative Response Assay/Suitability Tests/Assay Suitability Tests/choice/Test: Potency Value/ConditionalEvaluation/
205

/Test System for Quantitative Response Assay/Suitability Tests/Assay Suitability Tests/choice/Test: Potency Confidence Interval/Conditional Evaluation/
/Test System for Quantitative Response Assay/Suitability Tests/Assay Suitability Tests/choice/Test: Log potency range/ConditionalEvaluation/
/Test System for Quantitative Response Assay/Suitability Tests/Assay Suitability Tests/choice/Test: Potency of Intermediate Dilution/Conditional Evaluation/
/Test System for Quantitative Response Assay/Suitability Tests/Assay Suitability Tests/choice/Test: Potency Confidence Interval (%)/Conditional Evaluation/
/Test System for Quantitative Response Assay/Suitability Tests/Assay Suitability Tests/choice/Test: Potency Range (%)/ConditionalEvaluation/
/Test System for Quantitative Response Assay/Suitability Tests/Assay Suitability Tests/choice/Test: Maximal Number of Outliers/Conditional Evaluation/
/Test System for Quantitative Response Assay/Suitability Tests/Assay Suitability Tests/choice/Test: Maximal Sequence Step CV (%)/Conditional Evaluation/
/Test System for Quantitative Response Assay/Suitability Tests/Assay Suitability Tests/choice/Test: Minimal R²/Conditional Evaluation/
/Test System for Quantitative Response Assay/Suitability Tests/Assay Suitability Tests/choice/Test: Relative LOF Error (%)/ConditionalEvaluation/
/Test System for Quantitative Response Assay/Suitability Tests/Assay Suitability Tests/choice/Test: Response Value Range/ConditionalEvaluation/
/Test System for Quantitative Response Assay/Suitability Tests/Assay Suitability Tests/choice/Test: Weight W/Conditional Evaluation/
/Test System for Quantitative Response Assay/Suitability Tests/Sample Suitability Tests/choice/F-Test (Hypothesis Test)/ConditionalEvaluation/
/Test System for Quantitative Response Assay/Suitability Tests/Sample Suitability Tests/choice/Equivalence Test (Parameter Estimate)/Conditional Evaluation/
/Test System for Quantitative Response Assay/Suitability Tests/Sample Suitability Tests/choice/Equivalence Test (Difference ofParameter Estimates)/Conditional Evaluation/
/Test System for Quantitative Response Assay/Suitability Tests/Sample Suitability Tests/choice/Equivalence Test (Ratio of ParameterEstimates)/Conditional Evaluation/
/Test System for Quantitative Response Assay/Suitability Tests/Sample Suitability Tests/choice/Equivalence Test (Scaled ParameterRange)/Conditional Evaluation/
/Test System for Quantitative Response Assay/Suitability Tests/Sample Suitability Tests/choice/Point estimate tests: Parameterestimate/Conditional Evaluation/
/Test System for Quantitative Response Assay/Suitability Tests/Sample Suitability Tests/choice/Point estimate tests: Difference ofparameter estimates/Conditional Evaluation/
/Test System for Quantitative Response Assay/Suitability Tests/Sample Suitability Tests/choice/Point estimate tests: Ratio ofparameter estimates/Conditional Evaluation/
/Test System for Quantitative Response Assay/Suitability Tests/Sample Suitability Tests/choice/Test: Normalized difference ofasymptotes/Conditional Evaluation/
/Test System for Quantitative Response Assay/Suitability Tests/Sample Suitability Tests/choice/Test: Sum of Squares Regression/Conditional Evaluation/
/Test System for Quantitative Response Assay/Suitability Tests/Sample Suitability Tests/choice/Test: Sum of Squares Non-Parallelism/Conditional Evaluation/
/Test System for Quantitative Response Assay/Suitability Tests/Sample Suitability Tests/choice/Test: Sum of Squares Non-Linearity/Conditional Evaluation/
/Test System for Quantitative Response Assay/Suitability Tests/Sample Suitability Tests/choice/Test: Ratio sum-of-squares non-linearity to sum-of-squares regression/Conditional Evaluation/
/Test System for Quantitative Response Assay/Suitability Tests/Sample Suitability Tests/choice/Test: Potency Value/ConditionalEvaluation/
/Test System for Quantitative Response Assay/Suitability Tests/Sample Suitability Tests/choice/Test: Potency Confidence Interval/Conditional Evaluation/
/Test System for Quantitative Response Assay/Suitability Tests/Sample Suitability Tests/choice/Test: Log potency range/ConditionalEvaluation/
/Test System for Quantitative Response Assay/Suitability Tests/Sample Suitability Tests/choice/Test: Potency of Intermediate Dilution/Conditional Evaluation/
206

Reference Guide | Biological Assay Package Version 26
/Test System for Quantitative Response Assay/Suitability Tests/Sample Suitability Tests/choice/Test: Potency Confidence Interval (%)/Conditional Evaluation/
/Test System for Quantitative Response Assay/Suitability Tests/Sample Suitability Tests/choice/Test: Potency Range (%)/ConditionalEvaluation/
/Test System for Quantitative Response Assay/Suitability Tests/Sample Suitability Tests/choice/Test: Maximal Number of Outliers/Conditional Evaluation/
/Test System for Quantitative Response Assay/Suitability Tests/Sample Suitability Tests/choice/Test: Maximal Sequence Step CV (%)/Conditional Evaluation/
/Test System for Quantitative Response Assay/Suitability Tests/Sample Suitability Tests/choice/Test: Minimal R²/ConditionalEvaluation/
/Test System for Quantitative Response Assay/Suitability Tests/Sample Suitability Tests/choice/Test: Relative LOF Error (%)/ConditionalEvaluation/
/Test System for Quantitative Response Assay/Suitability Tests/Sample Suitability Tests/choice/Test: Response Value Range/Conditional Evaluation/
/Test System for Quantitative Response Assay/Suitability Tests/Sample Suitability Tests/choice/Test: Weight W/Conditional Evaluation/
10.8.145 CommentEnter a comment or add a reference to a comment document.
This element has the following attributes:
Data type Multiplicity Usage Default value
xs:string 0...1 optional none
Context:
10.8.146 DateAutomatically inserts the current date and time when the Date element is created. You can entera different date and time.
This element has the following attributes:
Data type Multiplicity Usage Default value
xs:dateTime 1...1 required none
Context:
10.8.147 DateCurrently, no information available.
This element has the following attributes:
Data type Multiplicity Usage Default value
207

xs:dateTime 1...1 required none
Context:
10.8.148 Type of Chi-square test / Z-testCurrently, no information available.
This element has the following attributes:
Data type Multiplicity Usage Default value
xs:string 1...1 required none
Context:
10.8.149 Exact number of stepsEnter a number to evaluate configurations that have exactly this number of steps.
Tip: Tip: Select the Minimal number of steps option from the drop-down list if you require.
This element has the following attributes:
Data type Multiplicity Usage Default value
xs:positiveInteger 1...1 required none
Context:/Quantitative Response Assay/Analysis/Data Selection Schemes/Data Selection Scheme/choice/Optimization On/choice/
10.8.150 Exclude assayMarks dataset rows to be excluded from calculating margins.
This element has the following attributes:
Data type Multiplicity Usage Default value
ds:T_TechnicalOutlierColumn 1...1 required none
Context:/Equivalence Margin Development for Biological Assays/Datatable/
208

Reference Guide | Biological Assay Package Version 26
10.8.151 Exclude from analysisSelect the 'true' option from the drop-down list to exclude this assay element from analysis. Orselect 'false' to include it.
Note: Note: If you exclude an assay element from analysis, the related assay, data, andsettings (such as test definitions for the assay element) are completely ignored. But the reportstates that the assay element is excluded from analysis.
This element has the following attributes:
Data type Multiplicity Usage Default value
xs:boolean 1...1 required none
Context:/Dichotomous Assay (Quantal Response Assay)/Setup/Assay Elements/Control Sample/
/Dichotomous Assay (Quantal Response Assay)/Setup/Assay Elements/Test Sample/
/Quantitative Response Assay/Setup/Assay Elements/Control Line/
/Quantitative Response Assay/Setup/Assay Elements/Control Sample/
/Quantitative Response Assay/Setup/Assay Elements/Test Sample/
10.8.152 Exclude from analysisConfigure the technical outlier column. Expand the node to add or view information.
This element has the following attributes:
Data type Multiplicity Usage Default value
ds:T_TechnicalOutlierColumn 1...1 required none
Context:/Control Chart/Data Table/
10.8.153 Column: Exclude from calculationExpand the node to add or view information.
This element has the following attributes:
Data type Multiplicity Usage Default value
ds:T_TechnicalOutlierColumn 1...1 required none
Context:
209

/Combination of Independent Assay Results/Potency Data/
10.8.154 Extent of the testSelect the Extent of the test. The following options are available from the drop-down list:
• Assay element: Runs the test on the data of individual assay elements.
• Assay: Runs the test on the data of the whole assay.
• Sequence step: Runs the test on the data of individual sequence steps in the assay.
Please consult the help pages on particular tests for additional information.
This element has the following attributes:
Data type Multiplicity Usage Default value
T_Extent 1...1 required none
Context:/Quantitative Response Assay/Analysis/Suitability Tests/Assay Suitability Tests/choice/Test: Maximal Number of Outliers/
/Quantitative Response Assay/Analysis/Suitability Tests/Sample Suitability Tests/choice/Test: Maximal Number of Outliers/
/Test System for Quantitative Response Assay/Suitability Tests/Assay Suitability Tests/choice/Test: Maximal Number of Outliers/
/Test System for Quantitative Response Assay/Suitability Tests/Sample Suitability Tests/choice/Test: Maximal Number of Outliers/
10.8.155 Extent of the testSelect the Extent of the test. The following options are available from the drop-down list:
• Assay element: Runs the test on the data of individual assay elements.
• Assay: Runs the test on the data of the whole assay.
Please consult the help pages on particular tests for additional information.
This element has the following attributes:
Data type Multiplicity Usage Default value
T_ExtentWithoutSequenceStep 1...1 required none
Context:/Quantitative Response Assay/Analysis/Suitability Tests/Assay Suitability Tests/choice/Test: Sum of Squares Non-Linearity/
/Quantitative Response Assay/Analysis/Suitability Tests/Sample Suitability Tests/choice/Test: Sum of Squares Non-Linearity/
/Test System for Quantitative Response Assay/Suitability Tests/Assay Suitability Tests/choice/Test: Sum of Squares Non-Linearity/
/Test System for Quantitative Response Assay/Suitability Tests/Sample Suitability Tests/choice/Test: Sum of Squares Non-Linearity/
/Quantitative Response Assay/Analysis/Suitability Tests/Assay Suitability Tests/choice/Test: Minimal R²/
/Quantitative Response Assay/Analysis/Suitability Tests/Sample Suitability Tests/choice/Test: Minimal R²/
/Test System for Quantitative Response Assay/Suitability Tests/Assay Suitability Tests/choice/Test: Minimal R²/
/Test System for Quantitative Response Assay/Suitability Tests/Sample Suitability Tests/choice/Test: Minimal R²/
210

Reference Guide | Biological Assay Package Version 26
10.8.156 File nameAutomatically inserts the file name of the data source when you import data.
This element has the following attributes:
Data type Multiplicity Usage Default value
xs:token 0...1 optional none
Context:/Dichotomous Assay (Quantal Response Assay)/Documentation/Data Source/
/Quantitative Response Assay/Documentation/Data Source/
10.8.157 First doseEnter a number to specify the First dose of this sequence.
Note: Note: The number you enter must be a non-negative decimal.
The dose value for step number 'j' of an n-fold sequence is given by:
.
This element has the following attributes:
Data type Multiplicity Usage Default value
T_PositiveDouble 1...1 required none
Context:/Dichotomous Assay (Quantal Response Assay)/Setup/PreparationSchemes/Preparation Scheme/choice/N-Fold GeometricalSequence/
/Quantitative Response Assay/Setup/Preparation Schemes/Preparation Scheme/choice/N-Fold Geometrical Sequence/
10.8.158 First doseEnter a number to specify the First dose of this sequence.
Note: Note: The number you enter must be a non-negative decimal.
The dose value for step number 'j' of a linear sequence is given by:
.
211

This element has the following attributes:
Data type Multiplicity Usage Default value
T_PositiveDouble 1...1 required none
Context:/Dichotomous Assay (Quantal Response Assay)/Setup/PreparationSchemes/Preparation Scheme/choice/Linear Sequence/
/Quantitative Response Assay/Setup/Preparation Schemes/Preparation Scheme/choice/Linear Sequence/
10.8.159 Floating-point number column (factor)Define a column that allows you to associate each observation with a value of double-precisionfloating-point number format. Expand the node to add or view information.
This element has the following attributes:
Data type Multiplicity Usage Default value
T_ControlChartDoubleColumn 0...unbounded optional none
Context:/Control Chart/Data Table/
/Dichotomous Assay (Quantal Response Assay)/Setup/Observation Data/choice/
/Quantitative Response Assay/Setup/Observation Data/choice/
10.8.160 Folder keySelect a folder to require referenced documents be elements of this folder.
Tip: Tip: Add an Allow subfolder element and select the True option from its drop-downlist to require referenced documents be elements of the specified folder or one of its subfolders.
This element has the following attributes:
Data type Multiplicity Usage Default value
xs:token 0...1 optional none
Context:/Basic Bioassay Protocol/Reportable Values/Document Reference/
/Combination of Independent Assay Results/Potency Data/Column: Document Reference/
10.8.161 Folder keyCurrently, no information available.
212

Reference Guide | Biological Assay Package Version 26
This element has the following attributes:
Data type Multiplicity Usage Default value
xs:token 0...1 optional none
Context:
10.8.162 Full modelChange settings to adjust display of full models to your requirements.
This element has the following attributes:
Data type Multiplicity Usage Default value
xs:empty 0...1 optional none
Context:/Quantitative Response Assay/Settings/Graphics/
10.8.163 F-test (hypothesis test)Add one or several F-tests to your assay.
Important: Important: Test definitions are ignored without notification if the Type of testyou select results in invalid test definitions (for example, if a test cannot be performed for themodel you use).
The following table lists all F-tests we recommend for new assay development and indicateswhich models they support:
F-tests on thesignificance of:
Support the following models: Scope of thetest1
• regression
• non-parallelism
• non-linearity (lack offit)
• Linear parallel-line
• 4-parameter logistic
• 5-parameter logistic
• 3-parameter logistic with fixed lower or upperasymptote
Group 1
• non-similarity • Slope ratio Group 1
213
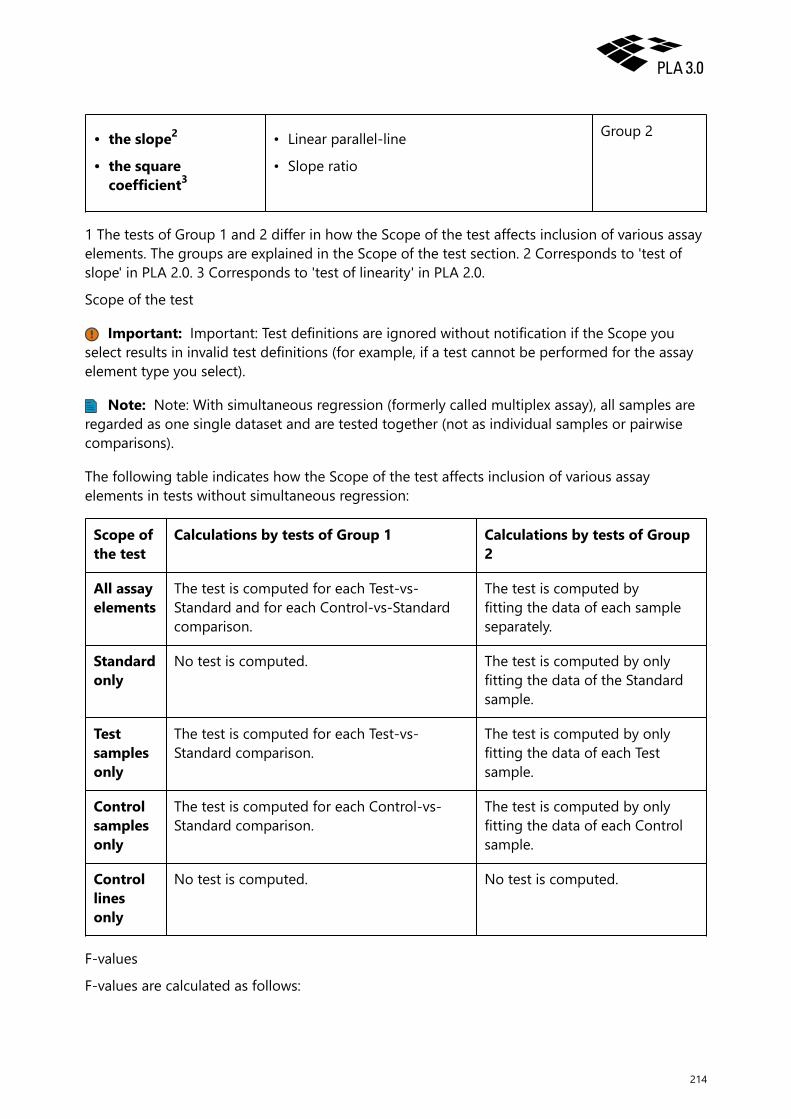
• the slope2
• the squarecoefficient3
• Linear parallel-line
• Slope ratio
Group 2
1 The tests of Group 1 and 2 differ in how the Scope of the test affects inclusion of various assayelements. The groups are explained in the Scope of the test section. 2 Corresponds to 'test ofslope' in PLA 2.0. 3 Corresponds to 'test of linearity' in PLA 2.0.
Scope of the test
Important: Important: Test definitions are ignored without notification if the Scope youselect results in invalid test definitions (for example, if a test cannot be performed for the assayelement type you select).
Note: Note: With simultaneous regression (formerly called multiplex assay), all samples areregarded as one single dataset and are tested together (not as individual samples or pairwisecomparisons).
The following table indicates how the Scope of the test affects inclusion of various assayelements in tests without simultaneous regression:
Scope ofthe test
Calculations by tests of Group 1 Calculations by tests of Group2
All assayelements
The test is computed for each Test-vs-Standard and for each Control-vs-Standardcomparison.
The test is computed byfitting the data of each sampleseparately.
Standardonly
No test is computed. The test is computed by onlyfitting the data of the Standardsample.
Testsamplesonly
The test is computed for each Test-vs-Standard comparison.
The test is computed by onlyfitting the data of each Testsample.
Controlsamplesonly
The test is computed for each Control-vs-Standard comparison.
The test is computed by onlyfitting the data of each Controlsample.
Controllinesonly
No test is computed. No test is computed.
F-values
F-values are calculated as follows:
214

Reference Guide | Biological Assay Package Version 26
F-test on the significance of regression Tests for the significance of the regression term. TheF-value is calculated as follows: If Pure-error ANOVA is selected: F = MSRegression / MSPureError.If Residual-error ANOVA is selected: F = MSRegression / MSResidualError. Where: MS is the meansquared error. The test is passed if F ≥ Fcritical.
F-test on the significance of non-parallelism Tests for the significance of the non-parallelismterm. The F-value is calculated as follows: If Pure-error ANOVA is selected: F = MSNon-Parallelism/ MSPureError. If Residual-error ANOVA is selected: F = MSNon-Parallelism / MSResidualError.Where: MS is the mean squared error. The test is passed if F ≤ Fcritical.
F-test on the significance of non-linearity (lack of fit) Tests for the significance of the non-linearity term. The F-value is calculated as follows: For both ANOVA methods: F = MSNon-Linearity / MSPureError. Where: MS is the mean squared error. The test is passed if F ≤ Fcritical.
F-test on the significance of non-similarity Tests for the significance of the non-similarity termof the Slope ratio model. The F-value is calculated as follows: If Pure-error ANOVA is selected:F = MSNon-Similarity / MSPureError. If Residual-error ANOVA is selected: F = MSNon-Similarity /MSResidualError. Where: MS is the mean squared error. The test is passed if F ≤ Fcritical.
F-test on the significance of the slope Note: This test corresponds to the 'test of slope' in PLA2.0. The F-value is calculated as follows:
Where: flin is the fit for one assay element of a linear model. The test is passed if F ≥ Fcritical.
F-test on the significance of the square coefficient Note: This test corresponds to the 'test oflinearity' in PLA 2.0. The F-value is calculated as follows:
Where: flin is the fit for one assay element of a linear model, and fquadr is the fit for one assayelement of a quadratic model. The test is passed if F ≤ Fcritical.
Custom F-tests
We do not recommend the following F-tests for new assay development. They are not standardtests and were introduced to replace outdated custom software:
F-tests on the significance of: Support the followingmodels:
Scope ofthe test1
• the square coefficient (assay scope)
• the difference of the quadratic full vs.restricted (assay scope)
• Linear parallel-line
• Slope ratio
Group 1
215
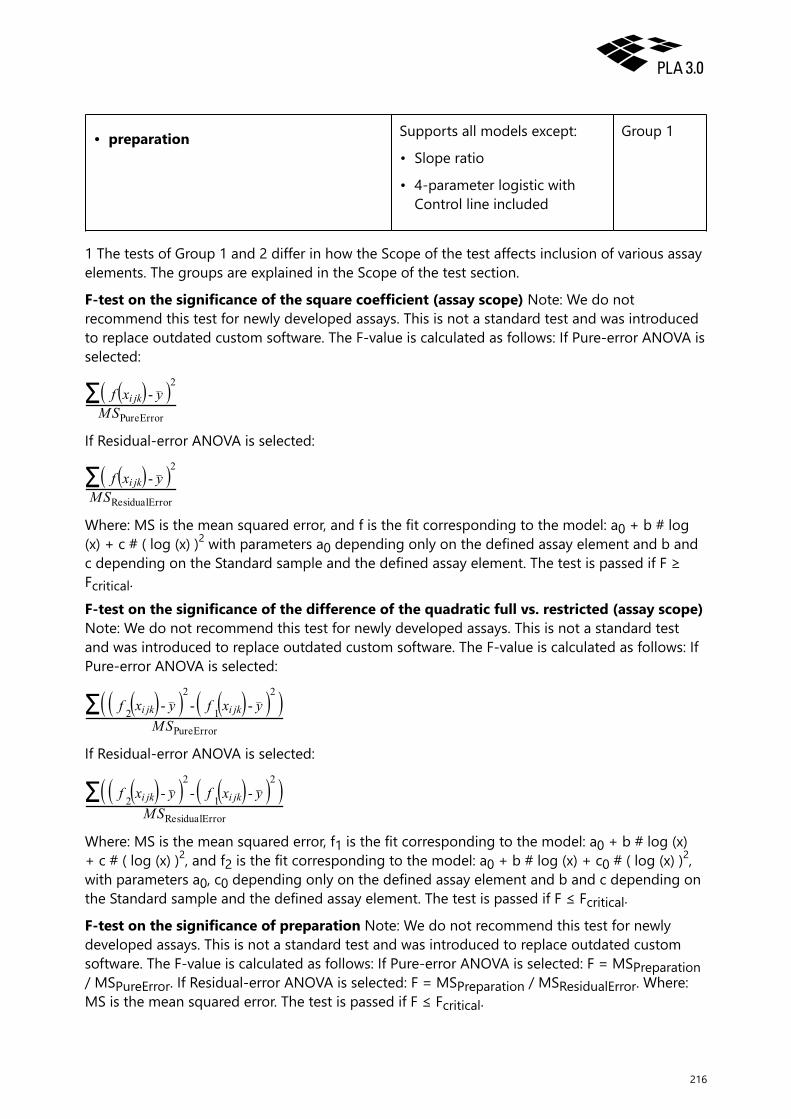
• preparation Supports all models except:
• Slope ratio
• 4-parameter logistic withControl line included
Group 1
1 The tests of Group 1 and 2 differ in how the Scope of the test affects inclusion of various assayelements. The groups are explained in the Scope of the test section.
F-test on the significance of the square coefficient (assay scope) Note: We do notrecommend this test for newly developed assays. This is not a standard test and was introducedto replace outdated custom software. The F-value is calculated as follows: If Pure-error ANOVA isselected:
If Residual-error ANOVA is selected:
Where: MS is the mean squared error, and f is the fit corresponding to the model: a0 + b # log(x) + c # ( log (x) )2 with parameters a0 depending only on the defined assay element and b andc depending on the Standard sample and the defined assay element. The test is passed if F ≥Fcritical.
F-test on the significance of the difference of the quadratic full vs. restricted (assay scope)Note: We do not recommend this test for newly developed assays. This is not a standard testand was introduced to replace outdated custom software. The F-value is calculated as follows: IfPure-error ANOVA is selected:
If Residual-error ANOVA is selected:
Where: MS is the mean squared error, f1 is the fit corresponding to the model: a0 + b # log (x)+ c # ( log (x) )2, and f2 is the fit corresponding to the model: a0 + b # log (x) + c0 # ( log (x) )2,with parameters a0, c0 depending only on the defined assay element and b and c depending onthe Standard sample and the defined assay element. The test is passed if F ≤ Fcritical.
F-test on the significance of preparation Note: We do not recommend this test for newlydeveloped assays. This is not a standard test and was introduced to replace outdated customsoftware. The F-value is calculated as follows: If Pure-error ANOVA is selected: F = MSPreparation/ MSPureError. If Residual-error ANOVA is selected: F = MSPreparation / MSResidualError. Where:MS is the mean squared error. The test is passed if F ≤ Fcritical.
216

Reference Guide | Biological Assay Package Version 26
This element has the following attributes:
Data type Multiplicity Usage Default value
xs:empty 0...unbounded optional none
Context:/Quantitative Response Assay/Analysis/Suitability Tests/Assay Suitability Tests/choice/
/Quantitative Response Assay/Analysis/Suitability Tests/Sample Suitability Tests/choice/
/Test System for Quantitative Response Assay/Suitability Tests/Assay Suitability Tests/choice/
/Test System for Quantitative Response Assay/Suitability Tests/Sample Suitability Tests/choice/
10.8.164 Type of F-testSelect the F-test Type you want to use from the drop-down list.
Please consult the help page on the F-test (hypothesis test) for additional information.
This element has the following attributes:
Data type Multiplicity Usage Default value
T_FTests 1...1 required none
Context:/Quantitative Response Assay/Analysis/Suitability Tests/Assay Suitability Tests/choice/F-Test (Hypothesis Test)/
/Quantitative Response Assay/Analysis/Suitability Tests/Sample Suitability Tests/choice/F-Test (Hypothesis Test)/
/Test System for Quantitative Response Assay/Suitability Tests/Assay Suitability Tests/choice/F-Test (Hypothesis Test)/
/Test System for Quantitative Response Assay/Suitability Tests/Sample Suitability Tests/choice/F-Test (Hypothesis Test)/
10.8.165 Generator keyEnter a document key to require referenced documents be generated by a document thatmatches the key.
This element has the following attributes:
Data type Multiplicity Usage Default value
xs:token 0...1 optional none
Context:/Combination of Independent Assay Results/Potency Data/Column: Document Reference/
217

10.8.166 Generator keyCurrently, no information available.
This element has the following attributes:
Data type Multiplicity Usage Default value
xs:token 0...1 optional none
Context:
10.8.167 Graphics settingsThis section allows you to define how graphs are displayed.
This element has the following attributes:
Data type Multiplicity Usage Default value
xs:empty 0...1 required none
Context:/Control Chart/Charts/Chart/
10.8.168 GraphicsThis section allows you to define how graphs are displayed. Add elements to change the settingsfor Data plot, Full model, and Restricted model.
This element has the following attributes:
Data type Multiplicity Usage Default value
xs:empty 1...1 required none
Context:/Dichotomous Assay (Quantal Response Assay)/Settings/
/Quantitative Response Assay/Settings/
10.8.169 GroupEnter a group name to mark the Test sample for inclusion in a combination calculation.
Note: Note: The group does not affect assay calculations.
218

Reference Guide | Biological Assay Package Version 26
Note: Note: The group only affects combination documents if they reference assaydocuments that have the group. In this case, all accessible Test samples of the group areincluded in the combination calculations.
Note: Note: Assay results used in combination calculations are assumed to be independent.
This element has the following attributes:
Data type Multiplicity Usage Default value
xs:token 0...1 optional none
Context:/Basic Bioassay Protocol/choice/Mode: Assay Element/Test Sample/
/Dichotomous Assay (Quantal Response Assay)/Setup/Assay Elements/Test Sample/
/Quantitative Response Assay/Setup/Assay Elements/Control Sample/
/Quantitative Response Assay/Setup/Assay Elements/Test Sample/
10.8.170 GroupThis column provides information on the groups intended for combination calculations.
This element has the following attributes:
Data type Multiplicity Usage Default value
DatasetColumn.ReferenceSection 1...1 optional none
Context:/Basic Bioassay Protocol/Reportable Values/
/Combination of Independent Assay Results/Potency Data/
10.8.171 Group informationThis section allows you to add groups. A group usually corresponds to a reportable value. Usegroups to add information with which to identify the substance to the report.
Note: Note: The group does not affect assay calculations. The actual assignment of Testsamples to groups is done in the assay document.
This element has the following attributes:
Data type Multiplicity Usage Default value
xs:empty 1...1 optional none
Context:
219

/Combination of Independent Assay Results/
10.8.172 NameEnter a name for the group.
Note: Note: With document aggregation, the name needs to match the name of the groupthat is assigned to the Test sample in the referenced assay document.
This element has the following attributes:
Data type Multiplicity Usage Default value
xs:token 1...1 optional none
Context:/Combination of Independent Assay Results/Group Information/Group/
10.8.173 GroupThis section allows you to define the details of a group. This information is printed in the reportand shown on the dashboard.
This element has the following attributes:
Data type Multiplicity Usage Default value
xs:empty 0...unbounded optional none
Context:/Combination of Independent Assay Results/Group Information/
10.8.174 Grubbs testProvides a statistical test for the detection of data outliers based on: Grubbs, Frank E. 1969.'Procedures for detecting outlying observations in samples.' Technometrics 11 (1): 1-21.
The test is based on replicates. Sensitivity is defined by the respective alpha value.
This element has the following attributes:
Data type Multiplicity Usage Default value
xs:empty 1...1 none
Context:/Quantitative Response Assay/Analysis/Data Selection Schemes/Data Selection Scheme/choice/
220

Reference Guide | Biological Assay Package Version 26
10.8.175 Display horizontal linesSelect the 'true' option from the drop-down list to add horizontal grid lines to your plots.
This element has the following attributes:
Data type Multiplicity Usage Default value
xs:boolean 0...1 required none
Context:/Control Chart/Charts/Chart/Graphics Settings/
/Dichotomous Assay (Quantal Response Assay)/Settings/Graphics/Linear Predictor: Data Plot/
/Dichotomous Assay (Quantal Response Assay)/Settings/Graphics/Linear Predictor: Full Model/
/Dichotomous Assay (Quantal Response Assay)/Settings/Graphics/Linear Predictor: Restricted Model/
/Dichotomous Assay (Quantal Response Assay)/Settings/Graphics/Probability: Data Plot/
/Dichotomous Assay (Quantal Response Assay)/Settings/Graphics/Probability: Full Model/
/Dichotomous Assay (Quantal Response Assay)/Settings/Graphics/Probability: Restricted Model/
/Quantitative Response Assay/Settings/Graphics/Data Plot/
/Quantitative Response Assay/Settings/Graphics/Full Model/
/Quantitative Response Assay/Settings/Graphics/Restricted Model/
10.8.176 Identical rangeSet Identical range to 'true' if you only want to include configurations that have the same stepnumbers.
Note: Note: If you do not use simultaneous regression, this condition applies to individualStandard-vs-Test sample or Standard-vs-Control sample pairs. With simultaneous regression, thiscondition applies to all assay elements except Control lines.
This element has the following attributes:
Data type Multiplicity Usage Default value
xs:boolean 1...1 required none
Context:/Quantitative Response Assay/Analysis/Data Selection Schemes/Data Selection Scheme/choice/Optimization On/
10.8.177 Identical treatment numberSet Identical treatment number to 'true' if you only want to include configurations whose Testsample has the same number of treatments (steps) as the Standard sample.
221

Note: Note: This condition is ignored if Identical range is set to 'true'. Identical range impliesIdentical treatment number.
This element has the following attributes:
Data type Multiplicity Usage Default value
xs:boolean 1...1 required none
Context:/Quantitative Response Assay/Analysis/Data Selection Schemes/Data Selection Scheme/choice/Optimization On/
10.8.178 IdentificationEnter a string to identify this document by this string rather than its name.
Note: Note: We recommend to use unique identification strings. But this is not required.
This element has the following attributes:
Data type Multiplicity Usage Default value
xs:token 0...1 optional none
Context:/Dichotomous Assay (Quantal Response Assay)/
/Equivalence Margin Development for Biological Assays/
/Quantitative Response Assay/
/Test System for Quantitative Response Assay/
10.8.179 Ignore 50-percent responsePerforms range optimization without regard to the 50-percent response.
Note: Note: This control allows you to specify whether the selected range is to contain the50-percent response, which is the mean of the minimal step mean and the maximal step meanwhere the step means are arithmetic means of the response values in single dose sequencesteps.
Tip: Tip: Select the Include 50-percent response option from the drop-down list if theselected range is to contain the 50-percent response. With this option, additional properties areavailable.
This element has the following attributes:
Data type Multiplicity Usage Default value
222

Reference Guide | Biological Assay Package Version 26
T_Empty 1...1 required none
Context:/Quantitative Response Assay/Analysis/Data Selection Schemes/Data Selection Scheme/choice/Optimization On/choice/
10.8.180 Import commentEnter text to provide additional information on the data import.
Tip: Tip: You can enter multiline text.
This element has the following attributes:
Data type Multiplicity Usage Default value
xs:string 0...1 optional none
Context:/Dichotomous Assay (Quantal Response Assay)/Documentation/Data Source/
/Quantitative Response Assay/Documentation/Data Source/
10.8.181 Import module identificationAutomatically inserts information that allows you to identify the import module used to importdata.
This element has the following attributes:
Data type Multiplicity Usage Default value
xs:token 0...1 optional none
Context:/Dichotomous Assay (Quantal Response Assay)/Documentation/Data Source/
/Quantitative Response Assay/Documentation/Data Source/
10.8.182 Import time stampAutomatically inserts the current date and time when you import data.
This element has the following attributes:
Data type Multiplicity Usage Default value
xs:dateTime 0...1 optional none
223

Context:/Dichotomous Assay (Quantal Response Assay)/Documentation/Data Source/
/Quantitative Response Assay/Documentation/Data Source/
10.8.183 Include 50-percent responsePerforms range optimization in relation to the 50-percent response. The minimal response of theselected range is to be less than or equal to the 50-percent response, and the maximal responseof the selected range is to be greater than or equal to the 50-percent response.
Note: Note: This control allows you to specify whether the selected range is to contain the50-percent response, which is the mean of the minimal step mean and the maximal step meanwhere the step means are arithmetic means of the response values in single dose sequencesteps.
This element has the following attributes:
Data type Multiplicity Usage Default value
T_Include50PercentResponse 1...1 required none
Context:/Quantitative Response Assay/Analysis/Data Selection Schemes/Data Selection Scheme/choice/Optimization On/choice/
10.8.184 Include control lineSpecifies a Control line to be used in the model fit. Select a Control line from the drop-down list.
Note: Note: The Control line provides additional data, for example, to estimate the upper orlower asymptote in 4-parameter logistic fits or the intercept in slope ratio models.
This element has the following attributes:
Data type Multiplicity Usage Default value
xs:string 0...1 optional none
Context:/Quantitative Response Assay/Analysis/Analytical Model/choice/Model: 4 Parameter Logistic Fit/
/Quantitative Response Assay/Analysis/Analytical Model/choice/Model: Slope Ratio/
10.8.185 C parameter (nonlinear models)Use this test for the following models:
• 4-parameter logistic fit
• 4-parameter logistic fit with included blanks
224

Reference Guide | Biological Assay Package Version 26
• 5-parameter logistic fit
This element has the following attributes:
Data type Multiplicity Usage Default value
T_SingleTestStrategyWithScope 0...1 optional none
Context:/Equivalence Margin Development for Biological Assays/Test Strategies/Strategy/Equivalence Tests - Parameter Estimate/
/Equivalence Margin Development for Biological Assays/Test Strategies/Strategy/Equivalence Tests - Difference of ParameterEstimates/
/Equivalence Margin Development for Biological Assays/Test Strategies/Strategy/Equivalence Tests - Ratio of Parameter Estimates/
/Equivalence Margin Development for Biological Assays/Test Strategies/Strategy/Equivalence Tests - Scaled Parameter Range/
/Equivalence Margin Development for Biological Assays/Test Strategies/Strategy/Point Estimate Tests - Parameter Estimate/
/Equivalence Margin Development for Biological Assays/Test Strategies/Strategy/Point Estimate Tests - Difference of ParameterEstimates/
/Equivalence Margin Development for Biological Assays/Test Strategies/Strategy/Point Estimate Tests - Ratio of Parameter Estimates/
/Equivalence Margin Development for Biological Assays/Margin Development/Equivalence Tests - Parameter Estimate/
/Equivalence Margin Development for Biological Assays/Margin Development/Equivalence Tests - Difference of Parameter Estimates/
/Equivalence Margin Development for Biological Assays/Margin Development/Equivalence Tests - Ratio of Parameter Estimates/
/Equivalence Margin Development for Biological Assays/Margin Development/Equivalence Tests - Scaled Parameter Range/
/Equivalence Margin Development for Biological Assays/Margin Development/Point Estimate Tests - Parameter Estimate/
/Equivalence Margin Development for Biological Assays/Margin Development/Point Estimate Tests - Difference of ParameterEstimates/
/Equivalence Margin Development for Biological Assays/Margin Development/Point Estimate Tests - Ratio of Parameter Estimates/
/Equivalence Margin Development for Biological Assays/Visualization/Simulation Space/
10.8.186 Integer column (factor)Define a column that allows you to associate each observation with a value of integer numberformat.
This element has the following attributes:
Data type Multiplicity Usage Default value
ds:T_IntegerColumn 0...unbounded required none
Context:/Dichotomous Assay (Quantal Response Assay)/Setup/Observation Data/choice/
/Quantitative Response Assay/Setup/Observation Data/choice/
10.8.187 Invert potencySelect the 'true' option from the drop-down list to have the potency ratio inverted.
225

This element has the following attributes:
Data type Multiplicity Usage Default value
xs:boolean 1...1 required none
Context:/Dichotomous Assay (Quantal Response Assay)/Analysis/Analytical Model/Advanced Settings/
/Quantitative Response Assay/Analysis/Analytical Model/Advanced Settings/
10.8.188 KeyCurrently, no information available.
This element has the following attributes:
Data type Multiplicity Usage Default value
xs:string 1...1 required none
Context:
10.8.189 Label of the x-axisEnter a name for the x-axis.
This element has the following attributes:
Data type Multiplicity Usage Default value
xs:token 0...1 required none
Context:/Control Chart/Charts/Chart/Graphics Settings/
/Dichotomous Assay (Quantal Response Assay)/Settings/Graphics/Linear Predictor: Data Plot/
/Dichotomous Assay (Quantal Response Assay)/Settings/Graphics/Linear Predictor: Full Model/
/Dichotomous Assay (Quantal Response Assay)/Settings/Graphics/Linear Predictor: Restricted Model/
/Dichotomous Assay (Quantal Response Assay)/Settings/Graphics/Probability: Data Plot/
/Dichotomous Assay (Quantal Response Assay)/Settings/Graphics/Probability: Full Model/
/Dichotomous Assay (Quantal Response Assay)/Settings/Graphics/Probability: Restricted Model/
/Quantitative Response Assay/Settings/Graphics/Data Plot/
/Quantitative Response Assay/Settings/Graphics/Full Model/
/Quantitative Response Assay/Settings/Graphics/Restricted Model/
226

Reference Guide | Biological Assay Package Version 26
10.8.190 Label of the y-axisEnter a name for the y-axis.
This element has the following attributes:
Data type Multiplicity Usage Default value
xs:token 0...1 required none
Context:/Control Chart/Charts/Chart/Graphics Settings/
/Dichotomous Assay (Quantal Response Assay)/Settings/Graphics/Linear Predictor: Data Plot/
/Dichotomous Assay (Quantal Response Assay)/Settings/Graphics/Linear Predictor: Full Model/
/Dichotomous Assay (Quantal Response Assay)/Settings/Graphics/Linear Predictor: Restricted Model/
/Dichotomous Assay (Quantal Response Assay)/Settings/Graphics/Probability: Data Plot/
/Dichotomous Assay (Quantal Response Assay)/Settings/Graphics/Probability: Full Model/
/Dichotomous Assay (Quantal Response Assay)/Settings/Graphics/Probability: Restricted Model/
/Quantitative Response Assay/Settings/Graphics/Data Plot/
/Quantitative Response Assay/Settings/Graphics/Full Model/
/Quantitative Response Assay/Settings/Graphics/Restricted Model/
10.8.191 Display legendSelect the 'true' option from the drop-down list to add a legend to your plots.
This element has the following attributes:
Data type Multiplicity Usage Default value
xs:boolean 0...1 required none
Context:/Control Chart/Charts/Chart/Graphics Settings/
/Dichotomous Assay (Quantal Response Assay)/Settings/Graphics/Linear Predictor: Data Plot/
/Dichotomous Assay (Quantal Response Assay)/Settings/Graphics/Linear Predictor: Full Model/
/Dichotomous Assay (Quantal Response Assay)/Settings/Graphics/Linear Predictor: Restricted Model/
/Dichotomous Assay (Quantal Response Assay)/Settings/Graphics/Probability: Data Plot/
/Dichotomous Assay (Quantal Response Assay)/Settings/Graphics/Probability: Full Model/
/Dichotomous Assay (Quantal Response Assay)/Settings/Graphics/Probability: Restricted Model/
/Quantitative Response Assay/Settings/Graphics/Data Plot/
/Quantitative Response Assay/Settings/Graphics/Full Model/
/Quantitative Response Assay/Settings/Graphics/Restricted Model/
227

10.8.192 Linear sequenceAllows you to define a linear sequence, that is, each term after the first is found by adding afixed number to the previous.
The dose value for step number 'j' of a linear sequence is given by:
Tip: Tip: Select a different sequence type from the drop-down list if you require.
This element has the following attributes:
Data type Multiplicity Usage Default value
T_SequenceEquidistant 1...1 required none
Context:/Dichotomous Assay (Quantal Response Assay)/Setup/PreparationSchemes/Preparation Scheme/choice/
10.8.193 Linear sequenceAllows you to define a linear sequence, that is, each term after the first is found by adding afixed number to the previous.
The dose value for step number 'j' of a linear sequence is given by:
Tip: Tip: Select a different sequence type from the drop-down list if you require.
This element has the following attributes:
Data type Multiplicity Usage Default value
T_SequenceEquidistant 1...1 required none
Context:/Quantitative Response Assay/Setup/Preparation Schemes/Preparation Scheme/choice/
10.8.194 Linked documentSelect a document.
This element has the following attributes:
Data type Multiplicity Usage Default value
dr:T_DocumentReference 0...unbounded optional none
228

Reference Guide | Biological Assay Package Version 26
Context:
10.8.195 ConfigConfigure the document reference. Expand the node to add or view information.
Add elements to change the document selection and generation process. You can restrictthe selected document to a particular folder, for example. Consult the manual for additionalinformation.
The following child elements are available:
• Update mode
• Template key
• Folder key
• Allow subfolders
• Generator key
• Document mode
This element has the following attributes:
Data type Multiplicity Usage Default value
T_OperatorConfig 1...1 required none
Context:/Quantitative Response Assay/Documentation/Operator/choice/Operator Reference/
/Quantitative Response Assay/Documentation/Equipment/choice/Equipment Reference/
10.8.196 Linked documentSelect a comment document.
This element has the following attributes:
Data type Multiplicity Usage Default value
dr:T_DocumentReference 0...unbounded optional none
Context:/Basic Bioassay Protocol/Comment/
/Combination of Independent Assay Results/Comment/
/Control Chart/Comment/
/Dichotomous Assay (Quantal Response Assay)/Comment/
/Equivalence Margin Development for Biological Assays/Comment/
/Quantitative Response Assay/Comment/
229

/Test System for Quantitative Response Assay/Comment/
10.8.197 Model: LogitUses the Logit regression model to estimate relative potency.
Select a different model from the drop-down list if you require.
The model is defined by the following equation:
This element has the following attributes:
Data type Multiplicity Usage Default value
T_Empty 1...1 required none
Context:/Dichotomous Assay (Quantal Response Assay)/Analysis/Analytical Model/choice/
10.8.198 Logarithm baseSpecifies the logarithm base to be used for dose or response transformation. The followingoptions are available from the drop-down list:
• Binary logarithm (base 2)
• Natural logarithm (base e)
• Decimal logarithm (base 10)
This element has the following attributes:
Data type Multiplicity Usage Default value
T_LogType 1...1 required none
Context:/Dichotomous Assay (Quantal Response Assay)/Analysis/Analytical Model/Advanced Settings/
/Quantitative Response Assay/Analysis/Analytical Model/Advanced Settings/
10.8.199 Logarithm typeSelect the logarithm type, also referred to as the logarithm base.
This element has the following attributes:
Data type Multiplicity Usage Default value
230

Reference Guide | Biological Assay Package Version 26
T_LogarithmType 1...1 required none
Context:/Combination of Independent Assay Results/
10.8.200 Lower asymptote (D) (nonlinear models)Use this test for the following models:
• 4-parameter logistic fit
• 4-parameter logistic fit with included blanks
• 5-parameter logistic fit
This element has the following attributes:
Data type Multiplicity Usage Default value
T_SingleTestStrategyWithScope 0...1 optional none
Context:/Equivalence Margin Development for Biological Assays/Test Strategies/Strategy/Equivalence Tests - Parameter Estimate/
/Equivalence Margin Development for Biological Assays/Test Strategies/Strategy/Equivalence Tests - Difference of ParameterEstimates/
/Equivalence Margin Development for Biological Assays/Test Strategies/Strategy/Equivalence Tests - Ratio of Parameter Estimates/
/Equivalence Margin Development for Biological Assays/Test Strategies/Strategy/Equivalence Tests - Scaled Parameter Range/
/Equivalence Margin Development for Biological Assays/Test Strategies/Strategy/Point Estimate Tests - Parameter Estimate/
/Equivalence Margin Development for Biological Assays/Test Strategies/Strategy/Point Estimate Tests - Difference of ParameterEstimates/
/Equivalence Margin Development for Biological Assays/Test Strategies/Strategy/Point Estimate Tests - Ratio of Parameter Estimates/
/Equivalence Margin Development for Biological Assays/Margin Development/Equivalence Tests - Parameter Estimate/
/Equivalence Margin Development for Biological Assays/Margin Development/Equivalence Tests - Difference of Parameter Estimates/
/Equivalence Margin Development for Biological Assays/Margin Development/Equivalence Tests - Ratio of Parameter Estimates/
/Equivalence Margin Development for Biological Assays/Margin Development/Equivalence Tests - Scaled Parameter Range/
/Equivalence Margin Development for Biological Assays/Margin Development/Point Estimate Tests - Parameter Estimate/
/Equivalence Margin Development for Biological Assays/Margin Development/Point Estimate Tests - Difference of ParameterEstimates/
/Equivalence Margin Development for Biological Assays/Margin Development/Point Estimate Tests - Ratio of Parameter Estimates/
/Equivalence Margin Development for Biological Assays/Visualization/Simulation Space/
10.8.201 Lower control limitEnter the Lower control limit of the chart. Usually, control limits contain an upper and a lowerlimit. But you can also define only one of these values.
This element has the following attributes:
Data type Multiplicity Usage Default value
231
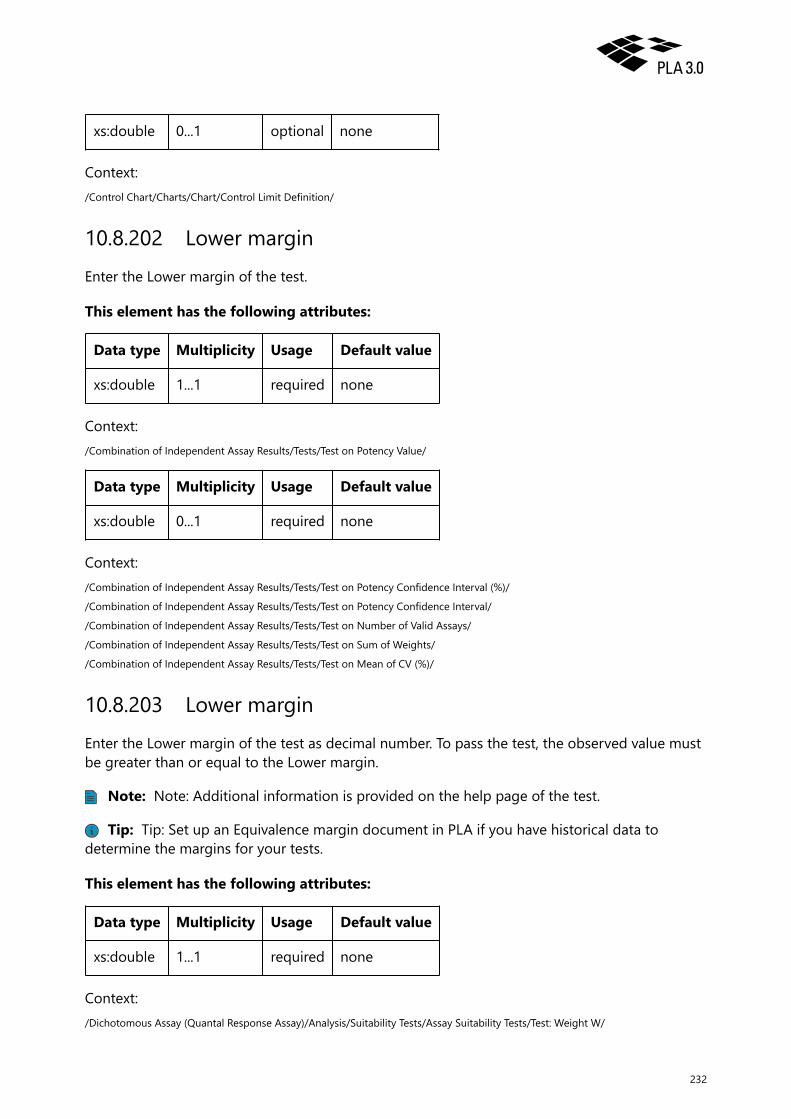
xs:double 0...1 optional none
Context:/Control Chart/Charts/Chart/Control Limit Definition/
10.8.202 Lower marginEnter the Lower margin of the test.
This element has the following attributes:
Data type Multiplicity Usage Default value
xs:double 1...1 required none
Context:/Combination of Independent Assay Results/Tests/Test on Potency Value/
Data type Multiplicity Usage Default value
xs:double 0...1 required none
Context:/Combination of Independent Assay Results/Tests/Test on Potency Confidence Interval (%)/
/Combination of Independent Assay Results/Tests/Test on Potency Confidence Interval/
/Combination of Independent Assay Results/Tests/Test on Number of Valid Assays/
/Combination of Independent Assay Results/Tests/Test on Sum of Weights/
/Combination of Independent Assay Results/Tests/Test on Mean of CV (%)/
10.8.203 Lower marginEnter the Lower margin of the test as decimal number. To pass the test, the observed value mustbe greater than or equal to the Lower margin.
Note: Note: Additional information is provided on the help page of the test.
Tip: Tip: Set up an Equivalence margin document in PLA if you have historical data todetermine the margins for your tests.
This element has the following attributes:
Data type Multiplicity Usage Default value
xs:double 1...1 required none
Context:/Dichotomous Assay (Quantal Response Assay)/Analysis/Suitability Tests/Assay Suitability Tests/Test: Weight W/
232

Reference Guide | Biological Assay Package Version 26
/Dichotomous Assay (Quantal Response Assay)/Analysis/Suitability Tests/Sample Suitability Tests/Test: Weight W/
/Quantitative Response Assay/Analysis/Suitability Tests/Assay Suitability Tests/choice/Test: Minimal R²/
/Quantitative Response Assay/Analysis/Suitability Tests/Sample Suitability Tests/choice/Test: Minimal R²/
/Test System for Quantitative Response Assay/Suitability Tests/Assay Suitability Tests/choice/Test: Minimal R²/
/Test System for Quantitative Response Assay/Suitability Tests/Sample Suitability Tests/choice/Test: Minimal R²/
/Quantitative Response Assay/Analysis/Suitability Tests/Assay Suitability Tests/choice/Test: Weight W/
/Quantitative Response Assay/Analysis/Suitability Tests/Sample Suitability Tests/choice/Test: Weight W/
/Test System for Quantitative Response Assay/Suitability Tests/Assay Suitability Tests/choice/Test: Weight W/
/Test System for Quantitative Response Assay/Suitability Tests/Sample Suitability Tests/choice/Test: Weight W/
10.8.204 Lower marginEnter the Lower margin of the test as decimal number. The Lower margin must be less than orequal to the Upper margin of the test.
Note: Note: Additional information is provided on the help page of the test.
Tip: Tip: Set up an Equivalence margin document in PLA if you have historical data todetermine the margins for your tests.
This element has the following attributes:
Data type Multiplicity Usage Default value
xs:double 1...1 required none
Context:/Dichotomous Assay (Quantal Response Assay)/Analysis/Suitability Tests/Assay Suitability Tests/Test: Relative Potency Value/
/Dichotomous Assay (Quantal Response Assay)/Analysis/Suitability Tests/Assay Suitability Tests/Test: Relative Potency ConfidenceInterval/
/Dichotomous Assay (Quantal Response Assay)/Analysis/Suitability Tests/Sample Suitability Tests/Test: Relative Potency Value/
/Dichotomous Assay (Quantal Response Assay)/Analysis/Suitability Tests/Sample Suitability Tests/Test: Relative Potency ConfidenceInterval/
Data type Multiplicity Usage Default value
xs:double 0...1 required 0
Context:/Quantitative Response Assay/Analysis/Suitability Tests/Assay Suitability Tests/choice/Equivalence Test (Parameter Estimate)/
/Quantitative Response Assay/Analysis/Suitability Tests/Assay Suitability Tests/choice/Equivalence Test (Difference of ParameterEstimates)/
/Quantitative Response Assay/Analysis/Suitability Tests/Assay Suitability Tests/choice/Equivalence Test (Ratio of ParameterEstimates)/
/Quantitative Response Assay/Analysis/Suitability Tests/Assay Suitability Tests/choice/Point estimate tests: Parameter estimate/
/Quantitative Response Assay/Analysis/Suitability Tests/Assay Suitability Tests/choice/Point estimate tests: Difference of parameterestimates/
/Quantitative Response Assay/Analysis/Suitability Tests/Assay Suitability Tests/choice/Point estimate tests: Ratio of parameterestimates/
233

/Quantitative Response Assay/Analysis/Suitability Tests/Assay Suitability Tests/choice/Test: Normalized difference of asymptotes/
/Quantitative Response Assay/Analysis/Suitability Tests/Assay Suitability Tests/choice/Test: Sum of Squares Regression/
/Quantitative Response Assay/Analysis/Suitability Tests/Assay Suitability Tests/choice/Test: Sum of Squares Non-Parallelism/
/Quantitative Response Assay/Analysis/Suitability Tests/Assay Suitability Tests/choice/Test: Sum of Squares Non-Linearity/
/Quantitative Response Assay/Analysis/Suitability Tests/Assay Suitability Tests/choice/Test: Potency Value/
/Quantitative Response Assay/Analysis/Suitability Tests/Assay Suitability Tests/choice/Test: Potency Confidence Interval/
/Quantitative Response Assay/Analysis/Suitability Tests/Assay Suitability Tests/choice/Test: Log potency range/
/Quantitative Response Assay/Analysis/Suitability Tests/Assay Suitability Tests/choice/Test: Potency of Intermediate Dilution/
/Quantitative Response Assay/Analysis/Suitability Tests/Assay Suitability Tests/choice/Test: Potency Confidence Interval (%)/
/Quantitative Response Assay/Analysis/Suitability Tests/Assay Suitability Tests/choice/Test: Response Value Range/
/Quantitative Response Assay/Analysis/Suitability Tests/Sample Suitability Tests/choice/Equivalence Test (Parameter Estimate)/
/Quantitative Response Assay/Analysis/Suitability Tests/Sample Suitability Tests/choice/Equivalence Test (Difference of ParameterEstimates)/
/Quantitative Response Assay/Analysis/Suitability Tests/Sample Suitability Tests/choice/Equivalence Test (Ratio of ParameterEstimates)/
/Quantitative Response Assay/Analysis/Suitability Tests/Sample Suitability Tests/choice/Point estimate tests: Parameter estimate/
/Quantitative Response Assay/Analysis/Suitability Tests/Sample Suitability Tests/choice/Point estimate tests: Difference of parameterestimates/
/Quantitative Response Assay/Analysis/Suitability Tests/Sample Suitability Tests/choice/Point estimate tests: Ratio of parameterestimates/
/Quantitative Response Assay/Analysis/Suitability Tests/Sample Suitability Tests/choice/Test: Normalized difference of asymptotes/
/Quantitative Response Assay/Analysis/Suitability Tests/Sample Suitability Tests/choice/Test: Sum of Squares Regression/
/Quantitative Response Assay/Analysis/Suitability Tests/Sample Suitability Tests/choice/Test: Sum of Squares Non-Parallelism/
/Quantitative Response Assay/Analysis/Suitability Tests/Sample Suitability Tests/choice/Test: Sum of Squares Non-Linearity/
/Quantitative Response Assay/Analysis/Suitability Tests/Sample Suitability Tests/choice/Test: Potency Value/
/Quantitative Response Assay/Analysis/Suitability Tests/Sample Suitability Tests/choice/Test: Potency Confidence Interval/
/Quantitative Response Assay/Analysis/Suitability Tests/Sample Suitability Tests/choice/Test: Log potency range/
/Quantitative Response Assay/Analysis/Suitability Tests/Sample Suitability Tests/choice/Test: Potency of Intermediate Dilution/
/Quantitative Response Assay/Analysis/Suitability Tests/Sample Suitability Tests/choice/Test: Potency Confidence Interval (%)/
/Quantitative Response Assay/Analysis/Suitability Tests/Sample Suitability Tests/choice/Test: Response Value Range/
/Test System for Quantitative Response Assay/Suitability Tests/Assay Suitability Tests/choice/Equivalence Test (Parameter Estimate)/
/Test System for Quantitative Response Assay/Suitability Tests/Assay Suitability Tests/choice/Equivalence Test (Difference ofParameter Estimates)/
/Test System for Quantitative Response Assay/Suitability Tests/Assay Suitability Tests/choice/Equivalence Test (Ratio of ParameterEstimates)/
/Test System for Quantitative Response Assay/Suitability Tests/Assay Suitability Tests/choice/Point estimate tests: Parameter estimate/
/Test System for Quantitative Response Assay/Suitability Tests/Assay Suitability Tests/choice/Point estimate tests: Difference ofparameter estimates/
/Test System for Quantitative Response Assay/Suitability Tests/Assay Suitability Tests/choice/Point estimate tests: Ratio of parameterestimates/
/Test System for Quantitative Response Assay/Suitability Tests/Assay Suitability Tests/choice/Test: Normalized difference ofasymptotes/
/Test System for Quantitative Response Assay/Suitability Tests/Assay Suitability Tests/choice/Test: Sum of Squares Regression/
/Test System for Quantitative Response Assay/Suitability Tests/Assay Suitability Tests/choice/Test: Sum of Squares Non-Parallelism/
/Test System for Quantitative Response Assay/Suitability Tests/Assay Suitability Tests/choice/Test: Sum of Squares Non-Linearity/
/Test System for Quantitative Response Assay/Suitability Tests/Assay Suitability Tests/choice/Test: Potency Value/
/Test System for Quantitative Response Assay/Suitability Tests/Assay Suitability Tests/choice/Test: Potency Confidence Interval/
/Test System for Quantitative Response Assay/Suitability Tests/Assay Suitability Tests/choice/Test: Log potency range/
/Test System for Quantitative Response Assay/Suitability Tests/Assay Suitability Tests/choice/Test: Potency of Intermediate Dilution/
/Test System for Quantitative Response Assay/Suitability Tests/Assay Suitability Tests/choice/Test: Potency Confidence Interval (%)/
234

Reference Guide | Biological Assay Package Version 26
/Test System for Quantitative Response Assay/Suitability Tests/Assay Suitability Tests/choice/Test: Response Value Range/
/Test System for Quantitative Response Assay/Suitability Tests/Sample Suitability Tests/choice/Equivalence Test (Parameter Estimate)/
/Test System for Quantitative Response Assay/Suitability Tests/Sample Suitability Tests/choice/Equivalence Test (Difference ofParameter Estimates)/
/Test System for Quantitative Response Assay/Suitability Tests/Sample Suitability Tests/choice/Equivalence Test (Ratio of ParameterEstimates)/
/Test System for Quantitative Response Assay/Suitability Tests/Sample Suitability Tests/choice/Point estimate tests: Parameterestimate/
/Test System for Quantitative Response Assay/Suitability Tests/Sample Suitability Tests/choice/Point estimate tests: Difference ofparameter estimates/
/Test System for Quantitative Response Assay/Suitability Tests/Sample Suitability Tests/choice/Point estimate tests: Ratio ofparameter estimates/
/Test System for Quantitative Response Assay/Suitability Tests/Sample Suitability Tests/choice/Test: Normalized difference ofasymptotes/
/Test System for Quantitative Response Assay/Suitability Tests/Sample Suitability Tests/choice/Test: Sum of Squares Regression/
/Test System for Quantitative Response Assay/Suitability Tests/Sample Suitability Tests/choice/Test: Sum of Squares Non-Parallelism/
/Test System for Quantitative Response Assay/Suitability Tests/Sample Suitability Tests/choice/Test: Sum of Squares Non-Linearity/
/Test System for Quantitative Response Assay/Suitability Tests/Sample Suitability Tests/choice/Test: Potency Value/
/Test System for Quantitative Response Assay/Suitability Tests/Sample Suitability Tests/choice/Test: Potency Confidence Interval/
/Test System for Quantitative Response Assay/Suitability Tests/Sample Suitability Tests/choice/Test: Log potency range/
/Test System for Quantitative Response Assay/Suitability Tests/Sample Suitability Tests/choice/Test: Potency of Intermediate Dilution/
/Test System for Quantitative Response Assay/Suitability Tests/Sample Suitability Tests/choice/Test: Potency Confidence Interval (%)/
/Test System for Quantitative Response Assay/Suitability Tests/Sample Suitability Tests/choice/Test: Response Value Range/
10.8.205 Lower marginEnter the Lower margin of the test as decimal number. The Lower margin must be less than orequal to the Upper margin of the test.
Note: Note: Additional information is provided on the help page of the test.
Tip: Tip: Set up an Equivalence margin document in PLA if you have historical data todetermine the margins for your tests.
This element has the following attributes:
Data type Multiplicity Usage Default value
xs:double 0...1 required none
Context:/Quantitative Response Assay/Analysis/Suitability Tests/Assay Suitability Tests/choice/Test: Maximal Sequence Step CV (%)/
/Quantitative Response Assay/Analysis/Suitability Tests/Sample Suitability Tests/choice/Test: Maximal Sequence Step CV (%)/
/Test System for Quantitative Response Assay/Suitability Tests/Assay Suitability Tests/choice/Test: Maximal Sequence Step CV (%)/
/Test System for Quantitative Response Assay/Suitability Tests/Sample Suitability Tests/choice/Test: Maximal Sequence Step CV (%)/
235

10.8.206 Lower marginEnter the Lower margin of the test as decimal number. The Lower margin must be less than orequal to the Upper margin of the test.
Note: Note: Additional information is provided on the help page of the test.
Tip: Tip: Set up an Equivalence margin document in PLA if you have historical data todetermine the margins for your tests.
This element has the following attributes:
Data type Multiplicity Usage Default value
xs:double 0...1 required none
Context:/Quantitative Response Assay/Analysis/Suitability Tests/Assay Suitability Tests/choice/Test: Ratio sum-of-squares non-linearity tosum-of-squares regression/
/Quantitative Response Assay/Analysis/Suitability Tests/Sample Suitability Tests/choice/Test: Ratio sum-of-squares non-linearity tosum-of-squares regression/
/Test System for Quantitative Response Assay/Suitability Tests/Assay Suitability Tests/choice/Test: Ratio sum-of-squares non-linearityto sum-of-squares regression/
/Test System for Quantitative Response Assay/Suitability Tests/Sample Suitability Tests/choice/Test: Ratio sum-of-squares non-linearity to sum-of-squares regression/
10.8.207 Lower marginEnter the Lower margin of the test as decimal number. The Lower margin must be less than orequal to the Upper margin of the test.
Note: Note: Additional information is provided on the help page of the test.
Tip: Tip: Set up an Equivalence margin document in PLA if you have historical data todetermine the margins for your tests.
This element has the following attributes:
Data type Multiplicity Usage Default value
xs:double 0...1 required none
Context:/Quantitative Response Assay/Analysis/Suitability Tests/Assay Suitability Tests/choice/Equivalence Test (Scaled Parameter Range)/
/Quantitative Response Assay/Analysis/Suitability Tests/Sample Suitability Tests/choice/Equivalence Test (Scaled Parameter Range)/
/Test System for Quantitative Response Assay/Suitability Tests/Assay Suitability Tests/choice/Equivalence Test (Scaled ParameterRange)/
236

Reference Guide | Biological Assay Package Version 26
/Test System for Quantitative Response Assay/Suitability Tests/Sample Suitability Tests/choice/Equivalence Test (Scaled ParameterRange)/
10.8.208 Lower margin (calculated value)Select how you want to define the Lower margin of the test. The following options are availablefrom the drop-down list:
• Calculated value: Selects the corresponding Lower margin from the margins you developed.
• Manual input: Allows you to enter a decimal number to set the Lower margin manually.
This element has the following attributes:
Data type Multiplicity Usage Default value
T_Empty 0...1 required none
Context:/Equivalence Margin Development for Biological Assays/Test Strategies/Strategy/Equivalence Tests - Difference of ParameterEstimates/A Upper Asymptote (Nonlinear Models)/choice/
/Equivalence Margin Development for Biological Assays/Test Strategies/Strategy/Equivalence Tests - Difference of ParameterEstimates/B Parameter (Nonlinear Models)/choice/
/Equivalence Margin Development for Biological Assays/Test Strategies/Strategy/Equivalence Tests - Difference of ParameterEstimates/C Parameter (Nonlinear Models)/choice/
/Equivalence Margin Development for Biological Assays/Test Strategies/Strategy/Equivalence Tests - Difference of ParameterEstimates/D Lower Asymptote (Nonlinear Models)/choice/
/Equivalence Margin Development for Biological Assays/Test Strategies/Strategy/Equivalence Tests - Difference of ParameterEstimates/G Asymmetry Parameter (Nonlinear Models)/choice/
/Equivalence Margin Development for Biological Assays/Test Strategies/Strategy/Equivalence Tests - Difference of ParameterEstimates/Slope (Linear Models)/choice/
/Equivalence Margin Development for Biological Assays/Test Strategies/Strategy/Equivalence Tests - Difference of ParameterEstimates/Intercept (Linear Models)/choice/
/Equivalence Margin Development for Biological Assays/Test Strategies/Strategy/Equivalence Tests - Difference of ParameterEstimates/A-D Difference of Asymptotes (Nonlinear Models)/choice/
/Equivalence Margin Development for Biological Assays/Test Strategies/Strategy/Equivalence Tests - Ratio of Parameter Estimates/AUpper Asymptote (Nonlinear Models)/choice/
/Equivalence Margin Development for Biological Assays/Test Strategies/Strategy/Equivalence Tests - Ratio of Parameter Estimates/BParameter (Nonlinear Models)/choice/
/Equivalence Margin Development for Biological Assays/Test Strategies/Strategy/Equivalence Tests - Ratio of Parameter Estimates/CParameter (Nonlinear Models)/choice/
/Equivalence Margin Development for Biological Assays/Test Strategies/Strategy/Equivalence Tests - Ratio of Parameter Estimates/DLower Asymptote (Nonlinear Models)/choice/
/Equivalence Margin Development for Biological Assays/Test Strategies/Strategy/Equivalence Tests - Ratio of Parameter Estimates/GAsymmetry Parameter (Nonlinear Models)/choice/
/Equivalence Margin Development for Biological Assays/Test Strategies/Strategy/Equivalence Tests - Ratio of Parameter Estimates/Slope (Linear Models)/choice/
/Equivalence Margin Development for Biological Assays/Test Strategies/Strategy/Equivalence Tests - Ratio of Parameter Estimates/Intercept (Linear Models)/choice/
/Equivalence Margin Development for Biological Assays/Test Strategies/Strategy/Equivalence Tests - Ratio of Parameter Estimates/A-D Difference of Asymptotes (Nonlinear Models)/choice/
/Equivalence Margin Development for Biological Assays/Test Strategies/Strategy/Point Estimate Tests - Difference of ParameterEstimates/A Upper Asymptote (Nonlinear Models)/choice/
237

/Equivalence Margin Development for Biological Assays/Test Strategies/Strategy/Point Estimate Tests - Difference of ParameterEstimates/B Parameter (Nonlinear Models)/choice/
/Equivalence Margin Development for Biological Assays/Test Strategies/Strategy/Point Estimate Tests - Difference of ParameterEstimates/C Parameter (Nonlinear Models)/choice/
/Equivalence Margin Development for Biological Assays/Test Strategies/Strategy/Point Estimate Tests - Difference of ParameterEstimates/D Lower Asymptote (Nonlinear Models)/choice/
/Equivalence Margin Development for Biological Assays/Test Strategies/Strategy/Point Estimate Tests - Difference of ParameterEstimates/G Asymmetry Parameter (Nonlinear Models)/choice/
/Equivalence Margin Development for Biological Assays/Test Strategies/Strategy/Point Estimate Tests - Difference of ParameterEstimates/Slope (Linear Models)/choice/
/Equivalence Margin Development for Biological Assays/Test Strategies/Strategy/Point Estimate Tests - Difference of ParameterEstimates/Intercept (Linear Models)/choice/
/Equivalence Margin Development for Biological Assays/Test Strategies/Strategy/Point Estimate Tests - Difference of ParameterEstimates/A-D Difference of Asymptotes (Nonlinear Models)/choice/
/Equivalence Margin Development for Biological Assays/Test Strategies/Strategy/Point Estimate Tests - Ratio of Parameter Estimates/A Upper Asymptote (Nonlinear Models)/choice/
/Equivalence Margin Development for Biological Assays/Test Strategies/Strategy/Point Estimate Tests - Ratio of Parameter Estimates/B Parameter (Nonlinear Models)/choice/
/Equivalence Margin Development for Biological Assays/Test Strategies/Strategy/Point Estimate Tests - Ratio of Parameter Estimates/C Parameter (Nonlinear Models)/choice/
/Equivalence Margin Development for Biological Assays/Test Strategies/Strategy/Point Estimate Tests - Ratio of Parameter Estimates/D Lower Asymptote (Nonlinear Models)/choice/
/Equivalence Margin Development for Biological Assays/Test Strategies/Strategy/Point Estimate Tests - Ratio of Parameter Estimates/G Asymmetry Parameter (Nonlinear Models)/choice/
/Equivalence Margin Development for Biological Assays/Test Strategies/Strategy/Point Estimate Tests - Ratio of Parameter Estimates/Slope (Linear Models)/choice/
/Equivalence Margin Development for Biological Assays/Test Strategies/Strategy/Point Estimate Tests - Ratio of Parameter Estimates/Intercept (Linear Models)/choice/
/Equivalence Margin Development for Biological Assays/Test Strategies/Strategy/Point Estimate Tests - Ratio of Parameter Estimates/A-D Difference of Asymptotes (Nonlinear Models)/choice/
/Equivalence Margin Development for Biological Assays/Test Strategies/Strategy/Tests: Normalized difference of asymptotes/Test -Normalized difference of upper asymptotes/choice/
/Equivalence Margin Development for Biological Assays/Test Strategies/Strategy/Tests: Normalized difference of asymptotes/Test -Normalized difference of lower asymptotes/choice/
/Equivalence Margin Development for Biological Assays/Test Strategies/Strategy/Additional Tests/Test - Sum of Squares Regression/choice/
/Equivalence Margin Development for Biological Assays/Test Strategies/Strategy/Additional Tests/Test - Ratio sum of squares non-linearity to sum of squares regression/choice/
/Equivalence Margin Development for Biological Assays/Test Strategies/Strategy/Additional Tests/Test - Residual Error/choice/
/Equivalence Margin Development for Biological Assays/Test Strategies/Strategy/Additional Tests/Test - Pure Error/choice/
/Equivalence Margin Development for Biological Assays/Test Strategies/Strategy/Equivalence Tests - Parameter Estimate/A UpperAsymptote (Nonlinear Models)/choice/
/Equivalence Margin Development for Biological Assays/Test Strategies/Strategy/Equivalence Tests - Parameter Estimate/B Parameter(Nonlinear Models)/choice/
/Equivalence Margin Development for Biological Assays/Test Strategies/Strategy/Equivalence Tests - Parameter Estimate/C Parameter(Nonlinear Models)/choice/
/Equivalence Margin Development for Biological Assays/Test Strategies/Strategy/Equivalence Tests - Parameter Estimate/D LowerAsymptote (Nonlinear Models)/choice/
/Equivalence Margin Development for Biological Assays/Test Strategies/Strategy/Equivalence Tests - Parameter Estimate/GAsymmetry Parameter (Nonlinear Models)/choice/
/Equivalence Margin Development for Biological Assays/Test Strategies/Strategy/Equivalence Tests - Parameter Estimate/Slope(Linear Models)/choice/
/Equivalence Margin Development for Biological Assays/Test Strategies/Strategy/Equivalence Tests - Parameter Estimate/Intercept(Linear Models)/choice/
238

Reference Guide | Biological Assay Package Version 26
/Equivalence Margin Development for Biological Assays/Test Strategies/Strategy/Equivalence Tests - Parameter Estimate/A-DDifference of Asymptotes (Nonlinear Models)/choice/
/Equivalence Margin Development for Biological Assays/Test Strategies/Strategy/Equivalence Tests - Parameter Estimate/A/D Ratio ofAsymptotes (Nonlinear Models)/choice/
/Equivalence Margin Development for Biological Assays/Test Strategies/Strategy/Point Estimate Tests - Parameter Estimate/A UpperAsymptote (Nonlinear Models)/choice/
/Equivalence Margin Development for Biological Assays/Test Strategies/Strategy/Point Estimate Tests - Parameter Estimate/BParameter (Nonlinear Models)/choice/
/Equivalence Margin Development for Biological Assays/Test Strategies/Strategy/Point Estimate Tests - Parameter Estimate/CParameter (Nonlinear Models)/choice/
/Equivalence Margin Development for Biological Assays/Test Strategies/Strategy/Point Estimate Tests - Parameter Estimate/D LowerAsymptote (Nonlinear Models)/choice/
/Equivalence Margin Development for Biological Assays/Test Strategies/Strategy/Point Estimate Tests - Parameter Estimate/GAsymmetry Parameter (Nonlinear Models)/choice/
/Equivalence Margin Development for Biological Assays/Test Strategies/Strategy/Point Estimate Tests - Parameter Estimate/Slope(Linear Models)/choice/
/Equivalence Margin Development for Biological Assays/Test Strategies/Strategy/Point Estimate Tests - Parameter Estimate/Intercept(Linear Models)/choice/
/Equivalence Margin Development for Biological Assays/Test Strategies/Strategy/Point Estimate Tests - Parameter Estimate/Slope(Nonlinear Models)/choice/
/Equivalence Margin Development for Biological Assays/Test Strategies/Strategy/Point Estimate Tests - Parameter Estimate/A-DDifference of Asymptotes (Nonlinear Models)/choice/
/Equivalence Margin Development for Biological Assays/Test Strategies/Strategy/Point Estimate Tests - Parameter Estimate/A/D Ratioof Asymptotes (Nonlinear Models)/choice/
/Equivalence Margin Development for Biological Assays/Test Strategies/Strategy/Equivalence Tests - Scaled Parameter Range/AUpper Asymptote (Nonlinear Models)/choice/
/Equivalence Margin Development for Biological Assays/Test Strategies/Strategy/Equivalence Tests - Scaled Parameter Range/BParameter (Nonlinear Models)/choice/
/Equivalence Margin Development for Biological Assays/Test Strategies/Strategy/Equivalence Tests - Scaled Parameter Range/CParameter (Nonlinear Models)/choice/
/Equivalence Margin Development for Biological Assays/Test Strategies/Strategy/Equivalence Tests - Scaled Parameter Range/DLower Asymptote (Nonlinear Models)/choice/
/Equivalence Margin Development for Biological Assays/Test Strategies/Strategy/Equivalence Tests - Scaled Parameter Range/GAsymmetry Parameter (Nonlinear Models)/choice/
/Equivalence Margin Development for Biological Assays/Test Strategies/Strategy/Equivalence Tests - Scaled Parameter Range/Slope(Linear Models)/choice/
/Equivalence Margin Development for Biological Assays/Test Strategies/Strategy/Equivalence Tests - Scaled Parameter Range/Intercept (Linear Models)/choice/
/Equivalence Margin Development for Biological Assays/Test Strategies/Strategy/Equivalence Tests - Scaled Parameter Range/A-DDifference of Asymptotes (Nonlinear Models, Standard only)/choice/
10.8.209 Lower margin (manual input)Select how you want to define the Lower margin of the test. The following options are availablefrom the drop-down list:
• Calculated value: Selects the corresponding Lower margin from the margins you developed.
• Manual input: Allows you to enter a decimal number to set the Lower margin manually.
This element has the following attributes:
Data type Multiplicity Usage Default value
239

xs:double 0...1 required none
Context:/Equivalence Margin Development for Biological Assays/Test Strategies/Strategy/Equivalence Tests - Difference of ParameterEstimates/A Upper Asymptote (Nonlinear Models)/choice/
/Equivalence Margin Development for Biological Assays/Test Strategies/Strategy/Equivalence Tests - Difference of ParameterEstimates/B Parameter (Nonlinear Models)/choice/
/Equivalence Margin Development for Biological Assays/Test Strategies/Strategy/Equivalence Tests - Difference of ParameterEstimates/C Parameter (Nonlinear Models)/choice/
/Equivalence Margin Development for Biological Assays/Test Strategies/Strategy/Equivalence Tests - Difference of ParameterEstimates/D Lower Asymptote (Nonlinear Models)/choice/
/Equivalence Margin Development for Biological Assays/Test Strategies/Strategy/Equivalence Tests - Difference of ParameterEstimates/G Asymmetry Parameter (Nonlinear Models)/choice/
/Equivalence Margin Development for Biological Assays/Test Strategies/Strategy/Equivalence Tests - Difference of ParameterEstimates/Slope (Linear Models)/choice/
/Equivalence Margin Development for Biological Assays/Test Strategies/Strategy/Equivalence Tests - Difference of ParameterEstimates/Intercept (Linear Models)/choice/
/Equivalence Margin Development for Biological Assays/Test Strategies/Strategy/Equivalence Tests - Difference of ParameterEstimates/A-D Difference of Asymptotes (Nonlinear Models)/choice/
/Equivalence Margin Development for Biological Assays/Test Strategies/Strategy/Equivalence Tests - Ratio of Parameter Estimates/AUpper Asymptote (Nonlinear Models)/choice/
/Equivalence Margin Development for Biological Assays/Test Strategies/Strategy/Equivalence Tests - Ratio of Parameter Estimates/BParameter (Nonlinear Models)/choice/
/Equivalence Margin Development for Biological Assays/Test Strategies/Strategy/Equivalence Tests - Ratio of Parameter Estimates/CParameter (Nonlinear Models)/choice/
/Equivalence Margin Development for Biological Assays/Test Strategies/Strategy/Equivalence Tests - Ratio of Parameter Estimates/DLower Asymptote (Nonlinear Models)/choice/
/Equivalence Margin Development for Biological Assays/Test Strategies/Strategy/Equivalence Tests - Ratio of Parameter Estimates/GAsymmetry Parameter (Nonlinear Models)/choice/
/Equivalence Margin Development for Biological Assays/Test Strategies/Strategy/Equivalence Tests - Ratio of Parameter Estimates/Slope (Linear Models)/choice/
/Equivalence Margin Development for Biological Assays/Test Strategies/Strategy/Equivalence Tests - Ratio of Parameter Estimates/Intercept (Linear Models)/choice/
/Equivalence Margin Development for Biological Assays/Test Strategies/Strategy/Equivalence Tests - Ratio of Parameter Estimates/A-D Difference of Asymptotes (Nonlinear Models)/choice/
/Equivalence Margin Development for Biological Assays/Test Strategies/Strategy/Point Estimate Tests - Difference of ParameterEstimates/A Upper Asymptote (Nonlinear Models)/choice/
/Equivalence Margin Development for Biological Assays/Test Strategies/Strategy/Point Estimate Tests - Difference of ParameterEstimates/B Parameter (Nonlinear Models)/choice/
/Equivalence Margin Development for Biological Assays/Test Strategies/Strategy/Point Estimate Tests - Difference of ParameterEstimates/C Parameter (Nonlinear Models)/choice/
/Equivalence Margin Development for Biological Assays/Test Strategies/Strategy/Point Estimate Tests - Difference of ParameterEstimates/D Lower Asymptote (Nonlinear Models)/choice/
/Equivalence Margin Development for Biological Assays/Test Strategies/Strategy/Point Estimate Tests - Difference of ParameterEstimates/G Asymmetry Parameter (Nonlinear Models)/choice/
/Equivalence Margin Development for Biological Assays/Test Strategies/Strategy/Point Estimate Tests - Difference of ParameterEstimates/Slope (Linear Models)/choice/
/Equivalence Margin Development for Biological Assays/Test Strategies/Strategy/Point Estimate Tests - Difference of ParameterEstimates/Intercept (Linear Models)/choice/
/Equivalence Margin Development for Biological Assays/Test Strategies/Strategy/Point Estimate Tests - Difference of ParameterEstimates/A-D Difference of Asymptotes (Nonlinear Models)/choice/
/Equivalence Margin Development for Biological Assays/Test Strategies/Strategy/Point Estimate Tests - Ratio of Parameter Estimates/A Upper Asymptote (Nonlinear Models)/choice/
240

Reference Guide | Biological Assay Package Version 26
/Equivalence Margin Development for Biological Assays/Test Strategies/Strategy/Point Estimate Tests - Ratio of Parameter Estimates/B Parameter (Nonlinear Models)/choice/
/Equivalence Margin Development for Biological Assays/Test Strategies/Strategy/Point Estimate Tests - Ratio of Parameter Estimates/C Parameter (Nonlinear Models)/choice/
/Equivalence Margin Development for Biological Assays/Test Strategies/Strategy/Point Estimate Tests - Ratio of Parameter Estimates/D Lower Asymptote (Nonlinear Models)/choice/
/Equivalence Margin Development for Biological Assays/Test Strategies/Strategy/Point Estimate Tests - Ratio of Parameter Estimates/G Asymmetry Parameter (Nonlinear Models)/choice/
/Equivalence Margin Development for Biological Assays/Test Strategies/Strategy/Point Estimate Tests - Ratio of Parameter Estimates/Slope (Linear Models)/choice/
/Equivalence Margin Development for Biological Assays/Test Strategies/Strategy/Point Estimate Tests - Ratio of Parameter Estimates/Intercept (Linear Models)/choice/
/Equivalence Margin Development for Biological Assays/Test Strategies/Strategy/Point Estimate Tests - Ratio of Parameter Estimates/A-D Difference of Asymptotes (Nonlinear Models)/choice/
/Equivalence Margin Development for Biological Assays/Test Strategies/Strategy/Tests: Normalized difference of asymptotes/Test -Normalized difference of upper asymptotes/choice/
/Equivalence Margin Development for Biological Assays/Test Strategies/Strategy/Tests: Normalized difference of asymptotes/Test -Normalized difference of lower asymptotes/choice/
/Equivalence Margin Development for Biological Assays/Test Strategies/Strategy/Additional Tests/Test - Sum of Squares Regression/choice/
/Equivalence Margin Development for Biological Assays/Test Strategies/Strategy/Additional Tests/Test - Ratio sum of squares non-linearity to sum of squares regression/choice/
/Equivalence Margin Development for Biological Assays/Test Strategies/Strategy/Additional Tests/Test - Residual Error/choice/
/Equivalence Margin Development for Biological Assays/Test Strategies/Strategy/Additional Tests/Test - Pure Error/choice/
/Equivalence Margin Development for Biological Assays/Test Strategies/Strategy/Equivalence Tests - Parameter Estimate/A UpperAsymptote (Nonlinear Models)/choice/
/Equivalence Margin Development for Biological Assays/Test Strategies/Strategy/Equivalence Tests - Parameter Estimate/B Parameter(Nonlinear Models)/choice/
/Equivalence Margin Development for Biological Assays/Test Strategies/Strategy/Equivalence Tests - Parameter Estimate/C Parameter(Nonlinear Models)/choice/
/Equivalence Margin Development for Biological Assays/Test Strategies/Strategy/Equivalence Tests - Parameter Estimate/D LowerAsymptote (Nonlinear Models)/choice/
/Equivalence Margin Development for Biological Assays/Test Strategies/Strategy/Equivalence Tests - Parameter Estimate/GAsymmetry Parameter (Nonlinear Models)/choice/
/Equivalence Margin Development for Biological Assays/Test Strategies/Strategy/Equivalence Tests - Parameter Estimate/Slope(Linear Models)/choice/
/Equivalence Margin Development for Biological Assays/Test Strategies/Strategy/Equivalence Tests - Parameter Estimate/Intercept(Linear Models)/choice/
/Equivalence Margin Development for Biological Assays/Test Strategies/Strategy/Equivalence Tests - Parameter Estimate/A-DDifference of Asymptotes (Nonlinear Models)/choice/
/Equivalence Margin Development for Biological Assays/Test Strategies/Strategy/Equivalence Tests - Parameter Estimate/A/D Ratio ofAsymptotes (Nonlinear Models)/choice/
/Equivalence Margin Development for Biological Assays/Test Strategies/Strategy/Point Estimate Tests - Parameter Estimate/A UpperAsymptote (Nonlinear Models)/choice/
/Equivalence Margin Development for Biological Assays/Test Strategies/Strategy/Point Estimate Tests - Parameter Estimate/BParameter (Nonlinear Models)/choice/
/Equivalence Margin Development for Biological Assays/Test Strategies/Strategy/Point Estimate Tests - Parameter Estimate/CParameter (Nonlinear Models)/choice/
/Equivalence Margin Development for Biological Assays/Test Strategies/Strategy/Point Estimate Tests - Parameter Estimate/D LowerAsymptote (Nonlinear Models)/choice/
/Equivalence Margin Development for Biological Assays/Test Strategies/Strategy/Point Estimate Tests - Parameter Estimate/GAsymmetry Parameter (Nonlinear Models)/choice/
/Equivalence Margin Development for Biological Assays/Test Strategies/Strategy/Point Estimate Tests - Parameter Estimate/Slope(Linear Models)/choice/
241

/Equivalence Margin Development for Biological Assays/Test Strategies/Strategy/Point Estimate Tests - Parameter Estimate/Intercept(Linear Models)/choice/
/Equivalence Margin Development for Biological Assays/Test Strategies/Strategy/Point Estimate Tests - Parameter Estimate/Slope(Nonlinear Models)/choice/
/Equivalence Margin Development for Biological Assays/Test Strategies/Strategy/Point Estimate Tests - Parameter Estimate/A-DDifference of Asymptotes (Nonlinear Models)/choice/
/Equivalence Margin Development for Biological Assays/Test Strategies/Strategy/Point Estimate Tests - Parameter Estimate/A/D Ratioof Asymptotes (Nonlinear Models)/choice/
/Equivalence Margin Development for Biological Assays/Test Strategies/Strategy/Equivalence Tests - Scaled Parameter Range/AUpper Asymptote (Nonlinear Models)/choice/
/Equivalence Margin Development for Biological Assays/Test Strategies/Strategy/Equivalence Tests - Scaled Parameter Range/BParameter (Nonlinear Models)/choice/
/Equivalence Margin Development for Biological Assays/Test Strategies/Strategy/Equivalence Tests - Scaled Parameter Range/CParameter (Nonlinear Models)/choice/
/Equivalence Margin Development for Biological Assays/Test Strategies/Strategy/Equivalence Tests - Scaled Parameter Range/DLower Asymptote (Nonlinear Models)/choice/
/Equivalence Margin Development for Biological Assays/Test Strategies/Strategy/Equivalence Tests - Scaled Parameter Range/GAsymmetry Parameter (Nonlinear Models)/choice/
/Equivalence Margin Development for Biological Assays/Test Strategies/Strategy/Equivalence Tests - Scaled Parameter Range/Slope(Linear Models)/choice/
/Equivalence Margin Development for Biological Assays/Test Strategies/Strategy/Equivalence Tests - Scaled Parameter Range/Intercept (Linear Models)/choice/
/Equivalence Margin Development for Biological Assays/Test Strategies/Strategy/Equivalence Tests - Scaled Parameter Range/A-DDifference of Asymptotes (Nonlinear Models, Standard only)/choice/
10.8.210 Linear predictor: Data plotChange settings to adjust display of data plots for the linear predictor.
This element has the following attributes:
Data type Multiplicity Usage Default value
xs:empty 0...1 optional none
Context:/Dichotomous Assay (Quantal Response Assay)/Settings/Graphics/
10.8.211 Linear predictor: Full modelChange settings to adjust display of full models for the linear predictor.
This element has the following attributes:
Data type Multiplicity Usage Default value
xs:empty 0...1 optional none
Context:/Dichotomous Assay (Quantal Response Assay)/Settings/Graphics/
242

Reference Guide | Biological Assay Package Version 26
10.8.212 Linear predictor: Restricted modelChange settings to adjust display of restricted models for the linear predictor.
This element has the following attributes:
Data type Multiplicity Usage Default value
xs:empty 0...1 optional none
Context:/Dichotomous Assay (Quantal Response Assay)/Settings/Graphics/
10.8.213 Margin developmentSelect the 'yes' option from the drop-down list to use the development assays to developmargins.
This element has the following attributes:
Data type Multiplicity Usage Default value
T_BinaryType 1...1 required none
Context:/Equivalence Margin Development for Biological Assays/Settings/
10.8.214 Margin developmentThis section allows you to select the tests for which you want to develop margins. Expand thenode to add or view information.
Note: Note: Tests you remove from the Margin development section also becomeunavailable for Test strategies and Visualization.
This element has the following attributes:
Data type Multiplicity Usage Default value
T_MarginDevelopment 1...1 required none
Context:/Equivalence Margin Development for Biological Assays/
243

10.8.215 Margin symmetry assumptionSelect the 'yes' option from the drop-down list if you always want to use the assumption ofsymmetry around 0 when you calculate margins for tests of the group 'Equivalence tests:Difference of parameter estimates'.
Note: Note: The 'yes' setting results in a greater equivalence range (distance betweenequivalence margins).
This element has the following attributes:
Data type Multiplicity Usage Default value
T_BinaryType 1...1 required none
Context:/Equivalence Margin Development for Biological Assays/Margin Development/
10.8.216 Marker commentEnter a comment for this marker.
This element has the following attributes:
Data type Multiplicity Usage Default value
xs:token 0...1 required none
Context:/Control Chart/Charts/Chart/Marker Definition/
10.8.217 Display colorSelect the color to be used to display data of this marker in the chart. When you create a marker,a color is automatically assigned. Click the color field to display controls that allow you tochange the color.
This element has the following attributes:
Data type Multiplicity Usage Default value
xs:empty 0...1 optional none
Context:/Control Chart/Charts/Chart/Marker Definition/
244

Reference Guide | Biological Assay Package Version 26
10.8.218 NameAutomatically inserts a name when the Marker definition element is created. You can enter adifferent name.
This element has the following attributes:
Data type Multiplicity Usage Default value
xs:token 1...1 required none
Context:/Control Chart/Charts/Chart/Marker Definition/
10.8.219 Marker definitionThis section allows you to define a marker. In the resulting control chart, markers are added asvertical lines.
This element has the following attributes:
Data type Multiplicity Usage Default value
T_MarkerDefinition 0...unbounded required none
Context:/Control Chart/Charts/Chart/
10.8.220 Marker timeAutomatically inserts the current date and time when the Marker element is created. You canenter a different date and time.
If the marker's date and time matches one of the data points, the marker is added to the chart atthis data point. Otherwise, the marker is added between data points.
This element has the following attributes:
Data type Multiplicity Usage Default value
xs:dateTime 1...1 required none
Context:/Control Chart/Charts/Chart/Marker Definition/
245

10.8.221 Max configurationsModel parameters are simulated and tested until one of the following occurs:
• The number of valid configurations found reaches the number set in Max configurations.
• The number of simulations performed reaches the number set in Max simulations.
This element has the following attributes:
Data type Multiplicity Usage Default value
xs:positiveInteger 1...1 required none
Context:/Equivalence Margin Development for Biological Assays/Visualization/
10.8.222 Max simulationsModel parameters are simulated and tested until one of the following occurs:
• The number of valid configurations found reaches the number set in Max configurations.
• The number of simulations performed reaches the number set in Max simulations.
This element has the following attributes:
Data type Multiplicity Usage Default value
xs:positiveInteger 1...1 required none
Context:/Equivalence Margin Development for Biological Assays/Visualization/
10.8.223 Memo column (factor)Define a column that allows you to associate each observation with a multiline text.
This element has the following attributes:
Data type Multiplicity Usage Default value
ds:T_MemoColumn 0...unbounded required none
Context:/Dichotomous Assay (Quantal Response Assay)/Setup/Observation Data/choice/
/Quantitative Response Assay/Setup/Observation Data/choice/
246

Reference Guide | Biological Assay Package Version 26
10.8.224 Minimal number of stepsEnter a number to evaluate configurations that have at least this number of steps.
Tip: Tip: Select the Exact number of steps option from the drop-down list if you require.
This element has the following attributes:
Data type Multiplicity Usage Default value
xs:positiveInteger 1...1 required none
Context:/Quantitative Response Assay/Analysis/Data Selection Schemes/Data Selection Scheme/choice/Optimization On/choice/
10.8.225 Model: 3-parameter logistic fit with fixed lowerasymptoteUses the 3-parameter logistic-fit regression model with fixed lower asymptote to estimaterelative potency. Select a different model from the drop-down list if you require.
The model is defined by the following equation:
This element has the following attributes:
Data type Multiplicity Usage Default value
xs:empty 1...1 required none
Context:/Quantitative Response Assay/Analysis/Analytical Model/choice/
10.8.226 Model: 3-parameter logistic fit with fixed upperasymptoteUses the 3-parameter logistic-fit regression model with fixed upper asymptote to estimaterelative potency. Select a different model from the drop-down list if you require.
The model is defined by the following equation:
247

This element has the following attributes:
Data type Multiplicity Usage Default value
xs:empty 1...1 required none
Context:/Quantitative Response Assay/Analysis/Analytical Model/choice/
10.8.227 Model: 4-parameter logistic fitUses the 4-parameter logistic-fit regression model to estimate relative potency. Select a differentmodel from the drop-down list if you require.
Tip: Tip: Use the Include control line option from the context menu or Creatable elementspane to add a previously defined Control line to your regression model. The values of theControl line are then used to calculate the upper or lower margin.
The model is defined by the following equation:
This element has the following attributes:
Data type Multiplicity Usage Default value
xs:empty 1...1 required none
Context:/Quantitative Response Assay/Analysis/Analytical Model/choice/
10.8.228 Model: 5-parameter logistic fitUses the 5-parameter logistic-fit regression model to estimate relative potency. Select a differentmodel from the drop-down list if you require.
The model is defined by the following equation:
This element has the following attributes:
Data type Multiplicity Usage Default value
T_Empty 1...1 required none
248

Reference Guide | Biological Assay Package Version 26
Context:/Quantitative Response Assay/Analysis/Analytical Model/choice/
10.8.229 Column: ModelExpand the node to add or view information.
This element has the following attributes:
Data type Multiplicity Usage Default value
T_Model 1...1 required none
Context:/Combination of Independent Assay Results/Potency Data/
10.8.230 Model: Linear parallel-lineUses the Linear parallel-line regression model to estimate relative potency. Select a differentmodel from the drop-down list if you require.
The model is defined by the following equation:
This element has the following attributes:
Data type Multiplicity Usage Default value
T_Empty 1...1 required none
Context:/Quantitative Response Assay/Analysis/Analytical Model/choice/
10.8.231 No outlier detectionPerforms No outlier detection for assay elements that reference this Data selection scheme.Select a different option from the drop-down list if you require outlier detection.
This element has the following attributes:
Data type Multiplicity Usage Default value
T_Empty 1...1 required none
Context:/Quantitative Response Assay/Analysis/Data Selection Schemes/Data Selection Scheme/choice/
249

10.8.232 Absolute potency: Not definedThis option does not define an absolute dose for the assay element.
Note: Note: No calculation for absolute potency is performed with this option.
Tip: Tip: Select a different option from the drop-down list if you want to define absolutepotency.
This element has the following attributes:
Data type Multiplicity Usage Default value
T_Empty 1...1 required none
Context:/Basic Bioassay Protocol/choice/Mode: Assay Element/Standard Sample/choice/
/Basic Bioassay Protocol/choice/Mode: Assay Element/Test Sample/choice/
/Basic Bioassay Protocol/choice/Mode: Assay Element/Control Sample/choice/
/Dichotomous Assay (Quantal Response Assay)/Setup/PreparationSchemes/Preparation Scheme/choice/
/Quantitative Response Assay/Setup/Preparation Schemes/Preparation Scheme/choice/
10.8.233 Number of replicatesEnter the number of Quantitative response assays to be generated.
Note: Note: If you generate assay replicates, increase the Number of replicates, andgenerate again, only the difference between the previous and current Number of replicates isgenerated.
This element has the following attributes:
Data type Multiplicity Usage Default value
PositiveInteger0 1...1 required none
Context:/Basic Bioassay Protocol/choice/Mode: Assay Replicate/
10.8.234 Number of signaturesEnter a number to specify how many signatures this document requires.
This element has the following attributes:
Data type Multiplicity Usage Default value
250

Reference Guide | Biological Assay Package Version 26
xs:double 0...1 optional none
Context:/Combination of Independent Assay Results/Tests/Signature State/
/Dichotomous Assay (Quantal Response Assay)/Analysis/Suitability Tests/Document Suitability Tests/Signature State/
/Quantitative Response Assay/Analysis/Suitability Tests/Document Suitability Tests/Signature State/
/Test System for Quantitative Response Assay/Suitability Tests/Document Suitability Tests/Signature State/
10.8.235 n-fold geometric sequenceAllows you to define an n-fold sequence (or geometric sequence), that is, each term after thefirst is found by multiplying the previous by a fixed number.
The dose value for step number 'j' of an n-fold sequence is given by:
.
Tip: Tip: Select a different sequence type from the drop-down list if you require.
Example:
= First dose = First dose / Base = First dose / Base^2 = First dose / Base^n
1 2 1.0 0.5 0.25 0.125
8 2 8.0 4.0 2.0 1.0
1 0.5 1.0 2.0 4.0 8.0
5 3 5.0 1.67 0.56 0.19
This element has the following attributes:
Data type Multiplicity Usage Default value
T_SequenceNFold 1...1 required none
Context:/Dichotomous Assay (Quantal Response Assay)/Setup/PreparationSchemes/Preparation Scheme/choice/
/Quantitative Response Assay/Setup/Preparation Schemes/Preparation Scheme/choice/
10.8.236 n SigmaEnter the factor to be multiplied with the standard deviation.
251

This element has the following attributes:
Data type Multiplicity Usage Default value
T_PositiveDouble 1...1 required none
Context:/Quantitative Response Assay/Analysis/Data Selection Schemes/Data Selection Scheme/choice/Standard Deviation Test/
10.8.237 Observation dataThis section allows you to modify the data table that displays observation data in theObservations editor.
This element has the following attributes:
Data type Multiplicity Usage Default value
xs:empty 1...1 required none
Context:/Dichotomous Assay (Quantal Response Assay)/Setup/
/Quantitative Response Assay/Setup/
10.8.238 Observation group (factor)Links individual observations (measurements) to their assay elements. All observations of agroup belong to the same assay element.
Note: Note: The Maximal group number limits the number of observation groups (assayelements) for which the Observations editor can display data. If your assay document has moreassay elements, you require more observation groups and must change the Maximal groupnumber accordingly.
This element has the following attributes:
Data type Multiplicity Usage Default value
ds:T_ObservationGroupColumn 1...1 required none
Context:/Dichotomous Assay (Quantal Response Assay)/Setup/Observation Data/
/Quantitative Response Assay/Setup/Observation Data/
252

Reference Guide | Biological Assay Package Version 26
10.8.239 Observation group IDDisplays the Observation group ID.
Note: Note: Observation group IDs are natural numbers (zero not included).
When you create an assay element, a unique Observation group ID is automatically assigned.Since Observation group IDs are required to be unique within assays, we do not recommend tochange them manually.
Important: Important: If you manually change the Observation group ID in the definition ofan assay element, this does not change the Observation group IDs of observations that may beassigned to this assay element.
Tip: Tip: The Observation group ID is displayed in square brackets in the Observation groupcolumn of the Observations editor.
This element has the following attributes:
Data type Multiplicity Usage Default value
xs:positiveInteger 1...1 required none
Context:/Dichotomous Assay (Quantal Response Assay)/Setup/Assay Elements/Standard Sample/
/Dichotomous Assay (Quantal Response Assay)/Setup/Assay Elements/Test Sample/
/Dichotomous Assay (Quantal Response Assay)/Setup/Assay Elements/Control Sample/
/Quantitative Response Assay/Setup/Assay Elements/Standard Sample/
/Quantitative Response Assay/Setup/Assay Elements/Test Sample/
/Quantitative Response Assay/Setup/Assay Elements/Control Sample/
/Quantitative Response Assay/Setup/Assay Elements/Control Line/
10.8.240 Observation group IDEnter the ID that signifies the Observation group you need to connect this assay element to theproper data.
Note: Note: Observation group IDs are natural numbers (zero not included).
Important: Important: The Observation group ID you enter here must match theObservation group ID that occurs in the template you apply to generate the assay replicate.
This element has the following attributes:
Data type Multiplicity Usage Default value
xs:positiveInteger 1...1 required none
253

Context:/Basic Bioassay Protocol/choice/Mode: Assay Element/Standard Sample/
/Basic Bioassay Protocol/choice/Mode: Assay Element/Test Sample/
/Basic Bioassay Protocol/choice/Mode: Assay Element/Control Sample/
/Basic Bioassay Protocol/choice/Mode: Assay Element/Control Line/
10.8.241 Observation sourceSelect how you want to obtain observation data.
The following options are available:
User input: Enter data manually.
Aggregation: Specify document references to aggregate data from documents.
Import: Import data.
This element has the following attributes:
Data type Multiplicity Usage Default value
ds:T_RowSource 1...1 required none
Context:/Basic Bioassay Protocol/Reportable Values/
/Equivalence Margin Development for Biological Assays/Datatable/
10.8.242 Observation sourceSelect how you want to obtain observation data. The following options are available:
• User input: Enter data manually.
• Aggregation: Specify document references to aggregate data from documents.
• Import: Not supported.
This element has the following attributes:
Data type Multiplicity Usage Default value
ds:T_RowSource 1...1 required none
Context:/Combination of Independent Assay Results/Potency Data/
/Control Chart/Data Table/
/Dichotomous Assay (Quantal Response Assay)/Setup/Observation Data/
/Quantitative Response Assay/Setup/Observation Data/
254

Reference Guide | Biological Assay Package Version 26
10.8.243 Operator nameEnter the name of the operator.
Tip: Tip: You can enter a reference to an operator document instead. Select the Operatorreference option from the drop-down list.
This element has the following attributes:
Data type Multiplicity Usage Default value
xs:token 1...1 required none
Context:/Basic Bioassay Protocol/Documentation/Operator/choice/
/Combination of Independent Assay Results/Documentation/Operator/choice/
/Dichotomous Assay (Quantal Response Assay)/Documentation/Operator/choice/
/Quantitative Response Assay/Documentation/Operator/choice/
10.8.244 Operator referenceSelect an operator document.
Tip: Tip: You can enter an operator name instead. Select the Operator name option from thedrop-down list.
This element has the following attributes:
Data type Multiplicity Usage Default value
T_OperatorRefernce 1...1 required none
Context:/Basic Bioassay Protocol/Documentation/Operator/choice/
/Combination of Independent Assay Results/Documentation/Operator/choice/
/Dichotomous Assay (Quantal Response Assay)/Documentation/Operator/choice/
/Quantitative Response Assay/Documentation/Operator/choice/
10.8.245 OperatorThis section allows you to provide information on an operator. Expand the node to add or viewinformation.
To add an Operator name or reference: Select the required option from the drop-down list, andenter the name or reference.
255

To assign a role to the operator: Add the Role element from the Creatable elements pane, andenter the required role.
This element has the following attributes:
Data type Multiplicity Usage Default value
xs:empty 0...1 optional none
Context:/Basic Bioassay Protocol/Documentation/
Data type Multiplicity Usage Default value
xs:empty 0...unbounded optional none
Context:/Combination of Independent Assay Results/Documentation/
/Dichotomous Assay (Quantal Response Assay)/Documentation/
/Quantitative Response Assay/Documentation/
10.8.246 Optimization offDoes not use the configuration optimizer to analyze assay elements that reference this Dataselection scheme.
Select the Optimization on option from the drop-down list if you want to use the configurationoptimizer.
Note: Note: If you combine range optimization with simultaneous regression, you create avery large number of configurations. Your system may not be able to calculate all configurationsin a timely manner.
This element has the following attributes:
Data type Multiplicity Usage Default value
T_Empty 1...1 required none
Context:/Quantitative Response Assay/Analysis/Data Selection Schemes/Data Selection Scheme/choice/
10.8.247 Optimization onUses the configuration optimizer to analyze assay elements that reference this Data selectionscheme. Expand the node to add or view information.
Note: Note: Range optimization is only supported for the linear parallel-line model.
256

Reference Guide | Biological Assay Package Version 26
Select the Optimization off option from the drop-down list if you do not want to use theconfiguration optimizer.
Note: Note: If you combine range optimization with simultaneous regression, you create avery large number of configurations. Your system may not be able to calculate all configurationsin a timely manner.
This element has the following attributes:
Data type Multiplicity Usage Default value
xs:empty 1...1 required none
Context:/Quantitative Response Assay/Analysis/Data Selection Schemes/Data Selection Scheme/choice/
10.8.248 Point estimate tests: Ratio of parameter estimatesAdd one or several tests for the ratio of the Test or Control sample parameter over the Standardsample parameter to your assay.
Note: Note: To pass the test, the ratio of the Test or Control sample parameter to theStandard sample parameter has to be greater than the Lower margin and less than the Uppermargin.
Tip: Tip: Select the Assay suitability or Sample suitability section prior to adding tests. Toadd an assay suitability test, select the Assay suitability tests element or one of its childrenprior to adding the test from the Context list. To add a sample suitability test, select the Samplesuitability tests element or one of its children.
Important: Important: Test definitions are ignored without notification if the Parameter youselect results in invalid test definitions (for example, if a test cannot be performed for the modelyou use).
The following table lists all available tests and indicates which models and assay elements theysupport:
Pointestimate
test on theratio of the:
Linearparallel-linemodel
4-parameterlogisticmodel
5-parameterlogisticmodel
3-parameterlogistic modelwith fixedlower or upperasymptote
Sloperatiomodel
Assayelements
Upperasymptotes
(A)(nonlinearmodels)
no yes yes with fixed Lowerasymptote
no Test,Control
257

B parameters(nonlinearmodels)
no yes yes yes no Test,Control
C parameters(nonlinearmodels)
no yes yes yes no Test,Control
Lowerasymptotes
(D)(nonlinearmodels)
no yes yes with fixed Upperasymptote
no Test,Control
Asymmetryparameters
(G)(nonlinearmodels)
no no yes no no Test,Control
Intercepts(linear
models)
yes no no no yes Test,Cotnrol
Slopes(linear
models)
yes no no no yes Test,Control
Differencesof
asymptotes(A – D)
(nonlinearmodels)
no yes yes yes no Test,Control
Scope of the test
Important: Important: Test definitions are ignored without notification if the Scope youselect results in invalid test definitions (for example, if a test cannot be performed for the assayelement type you select).
The following table indicates how the Scope of the test affects inclusion of various assayelements in tests:
Scope of the test Calculations by the test
All assay elements Runs the test for every assay element except Control lines.
Standard only Runs the test for the Standard sample.
258

Reference Guide | Biological Assay Package Version 26
Test samples only Runs the test for every Test sample.
Control samples only Runs the test for every Control sample.
Control lines only No test is run.
This element has the following attributes:
Data type Multiplicity Usage Default value
xs:empty 0...unbounded optional none
Context:/Quantitative Response Assay/Analysis/Suitability Tests/Assay Suitability Tests/choice/
/Quantitative Response Assay/Analysis/Suitability Tests/Sample Suitability Tests/choice/
/Test System for Quantitative Response Assay/Suitability Tests/Assay Suitability Tests/choice/
/Test System for Quantitative Response Assay/Suitability Tests/Sample Suitability Tests/choice/
10.8.249 Point estimate tests: Difference of parameter estimates
This element has the following attributes:
Data type Multiplicity Usage Defaultvalue
L_PointEstimateTestsDifferenceOfParameterEstimates 0...1 optional none
Context:/Equivalence Margin Development for Biological Assays/Margin Development/
/Equivalence Margin Development for Biological Assays/Test Strategies/Strategy/
10.8.250 Point estimate tests: Difference of parameter estimatesAdd one or several tests for the difference of the Test or Control sample parameter minus theStandard sample parameter to your assay.
Note: Note: To pass the test, the difference between the Standard sample parameter andthe Test or Control sample parameter has to be greater than or equal to the Lower margin andless than or equal to the Upper margin.
Tip: Tip: Select the Assay suitability or Sample suitability section prior to adding tests. Toadd an assay suitability test, select the Assay suitability tests element or one of its childrenprior to adding the test from the Context list. To add a sample suitability test, select the Samplesuitability tests element or one of its children.
259

Important: Important: Test definitions are ignored without notification if the Parameter youselect results in invalid test definitions (for example, if a test cannot be performed for the modelyou use).
The following table lists all available tests and indicates which models and assay elements theysupport:
Pointestimate
test on thedifference
of the:
Linearparallel-linemodel
4-parameterlogisticmodel
5-parameterlogisticmodel
3-parameterlogistic modelwith fixedlower or upperasymptote
Sloperatiomodel
Assayelements
Upperasymptotes
(A)(nonlinearmodels)
no yes yes with fixed Lowerasymptote
no Test,Control
B parameters(nonlinearmodels)
no yes yes yes no Test,Control
C parameters(nonlinearmodels)
no yes yes yes no Test,Control
Lowerasymptotes
(D)(nonlinearmodels)
no yes yes with fixed Upperasymptote
no Test,Control
Asymmetryparameters
(G)(nonlinearmodels)
no no yes no no Test,Control
Intercepts(linear
models)
yes no no no yes Test,Cotnrol
Slopes(linear
models)
yes no no no yes Test,Control
260

Reference Guide | Biological Assay Package Version 26
Differencesof
asymptotes(A – D)
(nonlinearmodels)
no yes yes yes no Test,Control
Scope of the test
Important: Important: Test definitions are ignored without notification if the Scope youselect results in invalid test definitions (for example, if a test cannot be performed for the assayelement type you select).
The following table indicates how the Scope of the test affects inclusion of various assayelements in tests:
Scope of the test Calculations by the test
All assay elements Runs the test for every assay element except Control lines.
Standard only Runs the test for the Standard sample.
Test samples only Runs the test for every Test sample.
Control samples only Runs the test for every Control sample.
Control lines only No test is run.
This element has the following attributes:
Data type Multiplicity Usage Default value
xs:empty 0...unbounded optional none
Context:/Quantitative Response Assay/Analysis/Suitability Tests/Assay Suitability Tests/choice/
/Quantitative Response Assay/Analysis/Suitability Tests/Sample Suitability Tests/choice/
/Test System for Quantitative Response Assay/Suitability Tests/Assay Suitability Tests/choice/
/Test System for Quantitative Response Assay/Suitability Tests/Sample Suitability Tests/choice/
10.8.251 Point estimate tests: Parameter estimate
This element has the following attributes:
Data type Multiplicity Usage Default value
L_PointEstimateTestsParameterEstimate 0...1 optional none
261

Context:/Equivalence Margin Development for Biological Assays/Margin Development/
/Equivalence Margin Development for Biological Assays/Test Strategies/Strategy/
10.8.252 Point estimate tests: Parameter estimateAdd one or several tests for single parameters to your assay.
Note: Note: To pass the test, the Parameter has to be between the Lower and Upper margin.
Tip: Tip: Select the Assay suitability or Sample suitability section prior to adding tests. Toadd an assay suitability test, select the Assay suitability tests element or one of its childrenprior to adding the test from the Context list. To add a sample suitability test, select the Samplesuitability tests element or one of its children.
Important: Important: Test definitions are ignored without notification if the Parameter youselect results in invalid test definitions (for example, if a test cannot be performed for the modelyou use).
The following table lists all available tests and indicates which models and assay elements theysupport:
Pointestimate
test on the:
Linearparallel-linemodel
4-parameterlogisticmodel
5-parameterlogisticmodel
3-parameterlogistic modelwith fixedlower or upperasymptote
Sloperatiomodel
Assayelements
Upperasymptote
(A)(nonlinearmodels)
no yes yes with fixed Lowerasymptote
no Standard,Test,
Control
B parameter(nonlinearmodels)
no yes yes yes yes Standard,Test,
Control
C parameter(nonlinearmodels)
no yes yes yes no Standard,Test,
Control
Lowerasymptote
(D)(nonlinearmodels)
no yes yes with fixed Upperasymptote
no Standard,Test,
Control
262

Reference Guide | Biological Assay Package Version 26
Asymmetryparameter
(G)(nonlinearmodels)
no no yes no no Standard,Test,
Control
Intercept(linear
models)
yes no no no yes Standard,Test,
Control
Slope (linearmodels)
yes no no no yes Standard,Test,
Control
Slope(nonlinearmodels)
no yes yes with fixed Upperasymptote
no Standard,Test,
Control
Difference ofasymptotes
(A – D)(nonlinearmodels)
no yes yes no no Standard,Test,
Control
Ratio ofasymptotes
(A / D)(nonlinearmodels)
no yes yes no no Standard,Test,
Control
Pure erroryes yes yes yes yes Standard,
Test,Control
Residualerror
yes yes yes yes yes Standard,Test,
Control
Scope of the test
Important: Important: Test definitions are ignored without notification if the Scope youselect results in invalid test definitions (for example, if a test cannot be performed for the assayelement type you select).
The following table indicates how the Scope of the test affects inclusion of various assayelements in tests:
Scope of the test Calculations by the test
263

All assay elements Runs the test for every assay element except Control lines.
Standard only Runs the test for the Standard sample.
Test samples only Runs the test for every Test sample.
Control samples only Runs the test for every Control sample.
Control lines only No test is run.
This element has the following attributes:
Data type Multiplicity Usage Default value
xs:empty 0...unbounded optional none
Context:/Quantitative Response Assay/Analysis/Suitability Tests/Assay Suitability Tests/choice/
/Quantitative Response Assay/Analysis/Suitability Tests/Sample Suitability Tests/choice/
/Test System for Quantitative Response Assay/Suitability Tests/Assay Suitability Tests/choice/
/Test System for Quantitative Response Assay/Suitability Tests/Sample Suitability Tests/choice/
10.8.253 Point estimate tests: Ratio of parameter estimates
This element has the following attributes:
Data type Multiplicity Usage Default value
L_PointEstimateTestsRatioOfParameterEstimates 0...1 optional none
Context:/Equivalence Margin Development for Biological Assays/Margin Development/
/Equivalence Margin Development for Biological Assays/Test Strategies/Strategy/
10.8.254 Position factorLists for each observation the microplate column in which the observation occurred.
This element has the following attributes:
Data type Multiplicity Usage Default value
ds:T_PositionColumn 0...3 optional none
Context:/Quantitative Response Assay/Setup/Observation Data/
264

Reference Guide | Biological Assay Package Version 26
10.8.255 Absolute potencyThis column displays the combined potency.
This element has the following attributes:
Data type Multiplicity Usage Default value
DatasetColumn.ResultPotencyMean 1...1 optional none
Context:/Basic Bioassay Protocol/Reportable Values/
/Combination of Independent Assay Results/Potency Data/
10.8.256 Potency confidence interval calculation methodDefines how the potency confidence interval is calculated. The following options are availablefrom the drop-down list:
• Based on ANOVA error: Adjusts potency confidence intervals by (1) the pure error for Pure-error ANOVA and (2) the residual error (of the full model) for Residual-error ANOVA.
• Based on error of restricted model: Adjusts potency confidence intervals by the residual errorof the restricted fit.
Note: Note: With linear parallel-line assays, the error based on the ANOVA model iscommonly used, and this is the default in previous PLA versions. With nonlinear models, therestricted-model error is more common. Yet, if the Residual-error ANOVA option is selected,previous PLA versions also use the restricted-model error to evaluate linear models. Otherwise,they use the error based on the ANOVA model.
This element has the following attributes:
Data type Multiplicity Usage Default value
T_PotencyConfidenceIntervalCalculationMethod 1...1 required none
Context:/Quantitative Response Assay/Analysis/Analytical Model/Advanced Settings/
10.8.257 Column: Potency confidence levelExpand the node to add or view information.
This element has the following attributes:
Data type Multiplicity Usage Default value
265

T_PotencyConfidenceLevelFactor 1...1 required none
Context:/Combination of Independent Assay Results/Potency Data/
10.8.258 Potency dataThis section allows you to adjust the dataset structure used to summarize Reportable valuesgenerated by Combination of assay results documents.
Note: Note: Much of the data table is populated from assay documents. These data may notbe visible in the Content editor.
Expand the node to add or view information.
This element has the following attributes:
Data type Multiplicity Usage Default value
xs:empty 1...1 required none
Context:/Combination of Independent Assay Results/
10.8.259 Absolute potency: Defined by raw materialSelect this option if you want to start from a raw material to calculate the absolute potency. Youspecify the absolute potency per amount unit, the amount used for the preparation, and thevolume of the solvent.
Expand the node to add or view information.
Note: Note: Specify the absolute potency per amount unit to get correct results.
Tip: Tip: Select a different option from the drop-down list if you want to define absolutepotency by stock solution or if you do not want to define it.
This element has the following attributes:
Data type Multiplicity Usage Default value
xs:empty 1...1 required none
Context:/Basic Bioassay Protocol/choice/Mode: Assay Element/Standard Sample/choice/
266

Reference Guide | Biological Assay Package Version 26
/Basic Bioassay Protocol/choice/Mode: Assay Element/Test Sample/choice/
/Basic Bioassay Protocol/choice/Mode: Assay Element/Control Sample/choice/
/Dichotomous Assay (Quantal Response Assay)/Setup/PreparationSchemes/Preparation Scheme/choice/
/Quantitative Response Assay/Setup/Preparation Schemes/Preparation Scheme/choice/
10.8.260 Absolute potency: Defined by stock solutionSelect this option if you want to provide the absolute potency directly.
Expand the node to add or view information.
Note: Note: A calculation for absolute potency is performed with this option.
Tip: Tip: Select a different option from the drop-down list if you want to define absolutepotency by raw material or if you do not want to define it.
This element has the following attributes:
Data type Multiplicity Usage Default value
xs:empty 1...1 required none
Context:/Basic Bioassay Protocol/choice/Mode: Assay Element/Standard Sample/choice/
/Basic Bioassay Protocol/choice/Mode: Assay Element/Test Sample/choice/
/Basic Bioassay Protocol/choice/Mode: Assay Element/Control Sample/choice/
/Dichotomous Assay (Quantal Response Assay)/Setup/PreparationSchemes/Preparation Scheme/choice/
/Quantitative Response Assay/Setup/Preparation Schemes/Preparation Scheme/choice/
10.8.261 Potency estimation confidence levelSelect the confidence level of the potency confidence interval. A common value is 95%.
This element has the following attributes:
Data type Multiplicity Usage Default value
T_ConfidenceLevel 1...1 required none
Context:/Dichotomous Assay (Quantal Response Assay)/Analysis/Analytical Model/
/Quantitative Response Assay/Analysis/Analytical Model/
10.8.262 Absolute potency lower confidence limitThis column displays the lower confidence limit of the potency.
267

This element has the following attributes:
Data type Multiplicity Usage Default value
DatasetColumn.PotencyLowerLimit 1...1 optional none
Context:/Basic Bioassay Protocol/Reportable Values/
/Combination of Independent Assay Results/Potency Data/
10.8.263 Absolute potency statusThis column indicates the test status of the combined absolute potency.
This element has the following attributes:
Data type Multiplicity Usage Default value
DatasetColumn.PotencyStatus 1...1 none
Context:/Basic Bioassay Protocol/Reportable Values/
10.8.264 Potency typeSelect a Potency type from the drop-down list: Relative potency, Raw material potency, or Stocksolution potency. The test uses the Potency type you select.
Note: Note: The Potency type you select for the test needs to match the potencies definedin the Preparation schemes. If the assay does not calculate potencies of the selected type, thetest returns an 'NC' (not calculated).
This element has the following attributes:
Data type Multiplicity Usage Default value
T_TestParameterPotencyType 0...1 optional none
Context:/Quantitative Response Assay/Analysis/Suitability Tests/Assay Suitability Tests/choice/Test: Potency Value/
/Quantitative Response Assay/Analysis/Suitability Tests/Assay Suitability Tests/choice/Test: Potency Confidence Interval/
/Quantitative Response Assay/Analysis/Suitability Tests/Sample Suitability Tests/choice/Test: Potency Value/
/Quantitative Response Assay/Analysis/Suitability Tests/Sample Suitability Tests/choice/Test: Potency Confidence Interval/
/Test System for Quantitative Response Assay/Suitability Tests/Assay Suitability Tests/choice/Test: Potency Value/
/Test System for Quantitative Response Assay/Suitability Tests/Assay Suitability Tests/choice/Test: Potency Confidence Interval/
/Test System for Quantitative Response Assay/Suitability Tests/Sample Suitability Tests/choice/Test: Potency Value/
268

Reference Guide | Biological Assay Package Version 26
/Test System for Quantitative Response Assay/Suitability Tests/Sample Suitability Tests/choice/Test: Potency Confidence Interval/
10.8.265 Potency typeSelect a potency type from the drop-down list: Absolute potency, Relative potency, Relative andabsolute potency.
This element has the following attributes:
Data type Multiplicity Usage Default value
xs:empty 1...1 required none
Context:/Combination of Independent Assay Results/
10.8.266 Absolute potency unitThis column indicates the potency unit.
This element has the following attributes:
Data type Multiplicity Usage Default value
DatasetColumn.PotencyUnit 1...1 optional none
Context:/Basic Bioassay Protocol/Reportable Values/
/Combination of Independent Assay Results/Potency Data/
10.8.267 Absolute potency upper confidence limitThis column displays the upper confidence limit of the potency.
This element has the following attributes:
Data type Multiplicity Usage Default value
DatasetColumn.PotencyUpperLimit 1...1 optional none
Context:/Basic Bioassay Protocol/Reportable Values/
/Combination of Independent Assay Results/Potency Data/
269
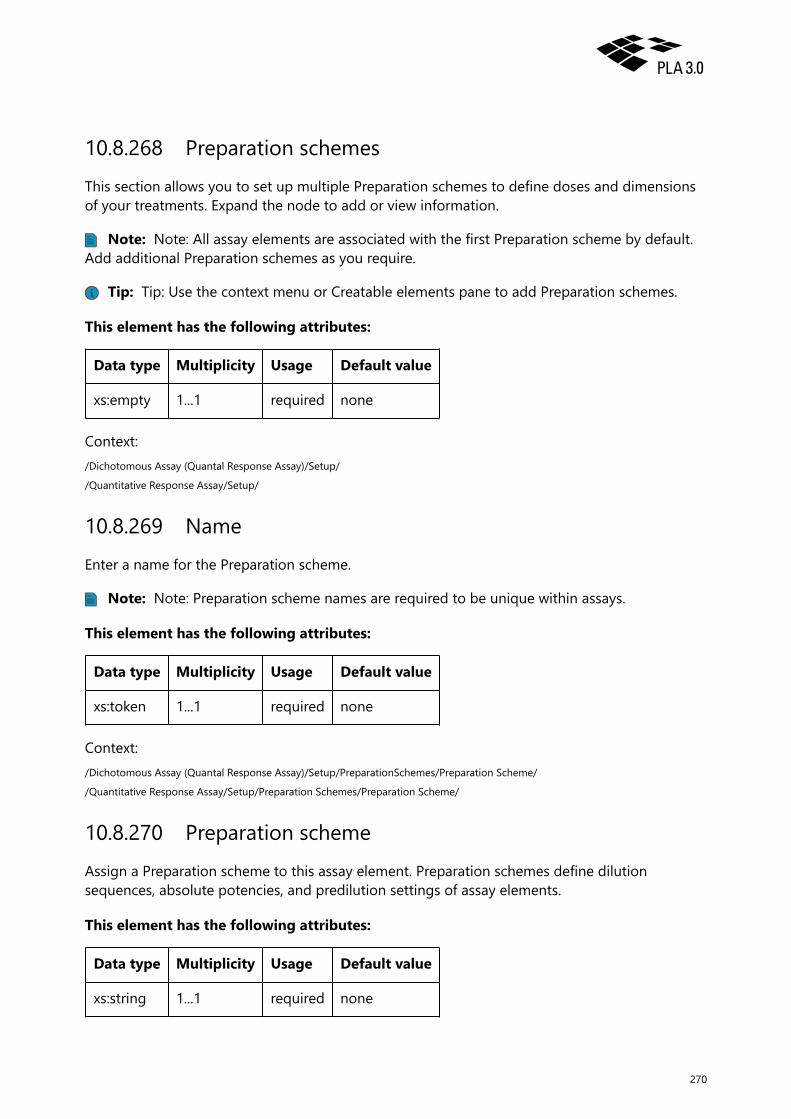
10.8.268 Preparation schemesThis section allows you to set up multiple Preparation schemes to define doses and dimensionsof your treatments. Expand the node to add or view information.
Note: Note: All assay elements are associated with the first Preparation scheme by default.Add additional Preparation schemes as you require.
Tip: Tip: Use the context menu or Creatable elements pane to add Preparation schemes.
This element has the following attributes:
Data type Multiplicity Usage Default value
xs:empty 1...1 required none
Context:/Dichotomous Assay (Quantal Response Assay)/Setup/
/Quantitative Response Assay/Setup/
10.8.269 NameEnter a name for the Preparation scheme.
Note: Note: Preparation scheme names are required to be unique within assays.
This element has the following attributes:
Data type Multiplicity Usage Default value
xs:token 1...1 required none
Context:/Dichotomous Assay (Quantal Response Assay)/Setup/PreparationSchemes/Preparation Scheme/
/Quantitative Response Assay/Setup/Preparation Schemes/Preparation Scheme/
10.8.270 Preparation schemeAssign a Preparation scheme to this assay element. Preparation schemes define dilutionsequences, absolute potencies, and predilution settings of assay elements.
This element has the following attributes:
Data type Multiplicity Usage Default value
xs:string 1...1 required none
270

Reference Guide | Biological Assay Package Version 26
Context:/Dichotomous Assay (Quantal Response Assay)/Setup/Assay Elements/Standard Sample/
/Dichotomous Assay (Quantal Response Assay)/Setup/Assay Elements/Test Sample/
/Dichotomous Assay (Quantal Response Assay)/Setup/Assay Elements/Control Sample/
/Quantitative Response Assay/Setup/Assay Elements/Standard Sample/
/Quantitative Response Assay/Setup/Assay Elements/Test Sample/
/Quantitative Response Assay/Setup/Assay Elements/Control Sample/
/Quantitative Response Assay/Setup/Assay Elements/Control Line/
10.8.271 Preparation schemeThis section allows you to define a Preparation scheme. Preparation schemes contain settingson dose sequence, absolute potency, and dilution factors. Expand the node to add or viewinformation.
Note: Note: In every assay element, you must reference exactly one Preparation scheme.
Tip: Tip: You can reference any Preparation scheme from more than one assay element.
This element has the following attributes:
Data type Multiplicity Usage Default value
xs:empty 1...unbounded required none
Context:/Dichotomous Assay (Quantal Response Assay)/Setup/PreparationSchemes/
/Quantitative Response Assay/Setup/Preparation Schemes/
10.8.272 No. of dilution factorEnter the (pre)dilution step for which the intermediate predilution is to be calculated.
• Let d_1, d_2, …, d_n be the (pre)dilution factors defined for a Test/Control sample, let i be the(pre)dilution step, and let P be the stock solution potency. The predilution potency for thisTest/Control sample is then p_t = P/(d_1*…*d_i).
• Let d_1, d_2, …, d_n be the (pre)dilution factors defined for the Standard sample, let i be the(pre)dilution step, and let P be the assigned potency. The predilution potency for the Testsample is then p_s = P/(d_1*…*d_i).
This element has the following attributes:
Data type Multiplicity Usage Default value
xs:nonNegativeInteger 1...1 required none
Context:/Quantitative Response Assay/Analysis/Suitability Tests/Assay Suitability Tests/choice/Test: Potency of Intermediate Dilution/
271

/Quantitative Response Assay/Analysis/Suitability Tests/Sample Suitability Tests/choice/Test: Potency of Intermediate Dilution/
/Test System for Quantitative Response Assay/Suitability Tests/Assay Suitability Tests/choice/Test: Potency of Intermediate Dilution/
/Test System for Quantitative Response Assay/Suitability Tests/Sample Suitability Tests/choice/Test: Potency of Intermediate Dilution/
10.8.273 Model: ProbitUses the Probit regression model to estimate relative potency.
Select a different model from the drop-down list if you require.
The model is defined by the following equation:
This element has the following attributes:
Data type Multiplicity Usage Default value
T_Empty 1...1 required none
Context:/Dichotomous Assay (Quantal Response Assay)/Analysis/Analytical Model/choice/
10.8.274 Probability: Data plotChange settings to adjust display of data plots for the probability fit.
This element has the following attributes:
Data type Multiplicity Usage Default value
xs:empty 0...1 optional none
Context:/Dichotomous Assay (Quantal Response Assay)/Settings/Graphics/
10.8.275 Probability: Full modelChange settings to adjust display of full models for the probability fit.
This element has the following attributes:
Data type Multiplicity Usage Default value
xs:empty 0...1 optional none
Context:/Dichotomous Assay (Quantal Response Assay)/Settings/Graphics/
272

Reference Guide | Biological Assay Package Version 26
10.8.276 Probability: Restricted modelChange settings to adjust display of restricted models for the probability fit.
This element has the following attributes:
Data type Multiplicity Usage Default value
xs:empty 0...1 optional none
Context:/Dichotomous Assay (Quantal Response Assay)/Settings/Graphics/
10.8.277 PropertiesCurrently, no information available.
This element has the following attributes:
Data type Multiplicity Usage Default value
xs:empty 1...1 required none
Context:
10.8.278 Property filterDefine a section property filter to be used for data aggregation.
This element has the following attributes:
Data type Multiplicity Usage Default value
ds:T_PropertyFilterForSections 0...1 required none
Context:/Basic Bioassay Protocol/Reportable Values/Group/
Data type Multiplicity Usage Default value
T_COAPropertyFilterForSections 1...unbounded required none
Context:/Combination of Independent Assay Results/Potency Data/Column: Section/
Data type Multiplicity Usage Default value
273

T_EMDPropertyFilterForSections 0...unbounded required none
Context:/Equivalence Margin Development for Biological Assays/Datatable/Column: Assay Element/
10.8.279 Property keySelect a Property key to identify the data to be aggregated.
Note: Note: The key only applies to document aggregation.
Note: Note: In the References editor, the Section column does not display the type of theassay element but instead the name that was assigned to the element.
This element has the following attributes:
Data type Multiplicity Usage Default value
xs:token 1...1 required none
Context:/Combination of Independent Assay Results/Potency Data/Column: Section/Property Filter/
Data type Multiplicity Usage Default value
xs:token 0...1 optional none
Context:/Control Chart/Data Table/Column: Date/Time/
/Dichotomous Assay (Quantal Response Assay)/Setup/Observation Data/Column: Response (Affected)/
/Dichotomous Assay (Quantal Response Assay)/Setup/Observation Data/Column: Response (Tested)/
/Quantitative Response Assay/Setup/Observation Data/Column: Response Value/
10.8.280 Property keyCurrently, no information available.
This element has the following attributes:
Data type Multiplicity Usage Default value
xs:token 1...1 required none
Context:/Equivalence Margin Development for Biological Assays/Datatable/Column: Assay Element/Property Filter/
274

Reference Guide | Biological Assay Package Version 26
10.8.281 PropertyCurrently, no information available.
This element has the following attributes:
Data type Multiplicity Usage Default value
xs:empty 1...unbounded required none
Context:
Data type Multiplicity Usage Default value
xs:empty 1...1 required none
Context:
10.8.282 Property scopeSelect a Property scope from the drop-down list.
Note: Note: The property scope only applies to document aggregation.
The following options are available to specify the source of the aggregated property:
Documentand
Section.
This element has the following attributes:
Data type Multiplicity Usage Default value
ds:T_PropertyScope 0...1 optional none
Context:/Control Chart/Data Table/Column: Date/Time/
/Dichotomous Assay (Quantal Response Assay)/Setup/Observation Data/Column: Response (Affected)/
/Dichotomous Assay (Quantal Response Assay)/Setup/Observation Data/Column: Response (Tested)/
/Quantitative Response Assay/Setup/Observation Data/Column: Response Value/
275

10.8.283 Protect observation group IDSelect how you want to protect Observation group IDs in the Quantitative response assays yougenerate. The following options are available:
'Always': In the Quantitative response assay documents you generate, Observation group IDs arealways protected.
'Defined by template': In the Quantitative response assay documents you generate, Observationgroup IDs are only protected if this is defined in the templates you use to generate thedocuments.
This element has the following attributes:
Data type Multiplicity Usage Default value
ObservationGroupIdProtectionMode 0...1 optional none
Context:/Basic Bioassay Protocol/Templates/Assay Templates/
10.8.284 Mode: Assay elementThe Basic bioassay protocol supports two protocol modes, that is, Assay replicate and Assayelement.
Use the Assay element mode to define assay elements (Standard sample, Test samples, Controlsamples, and Control lines) in the Basic bioassay protocol.
Use the Assay replicate mode to generate assay replicate documents based on Quantitativeresponse assay templates.
Tip: Tip: You can specify several Quantitative response assay templates to generate a rangeof assay replicate documents.
Note: Note: Combination of assay results calculations aggregate all Test sample data thatresult from calculating the assay replicate documents generated by the Basic bioassay protocol.
This element has the following attributes:
Data type Multiplicity Usage Default value
xs:empty 1...1 required none
Context:/Basic Bioassay Protocol/choice/
276

Reference Guide | Biological Assay Package Version 26
10.8.285 Mode: Assay replicateThe Basic bioassay protocol supports two protocol modes, that is, Assay replicate and Assayelement. Use the Assay replicate mode to generate assay replicate documents based onQuantitative response assay templates.
Tip: Tip: You can specify several Quantitative response assay templates to generate a rangeof assay replicate documents.
Note: Note: Combination of assay results calculations aggregate all Test sample data thatresult from calculating the assay replicate documents generated by the Basic bioassay protocol.
Use the Assay element mode to define assay elements (Standard sample, Test samples, Controlsamples, and Control lines) in the Basic bioassay protocol.
This element has the following attributes:
Data type Multiplicity Usage Default value
xs:empty 1...1 required none
Context:/Basic Bioassay Protocol/choice/
10.8.286 pEnter the significance level (alpha) for the p-value of the test. A common value is 0.05.
Note: Note: The test evaluation is based on comparing p-values, which are calculated froma test statistic, to the significance level you enter. This is equivalent to comparing test statistics tocritical values.
This element has the following attributes:
Data type Multiplicity Usage Default value
xs:double 1...1 required none
Context:/Combination of Independent Assay Results/Tests/Chi² Homogeneity Test/choice/
/Dichotomous Assay (Quantal Response Assay)/Analysis/Suitability Tests/Assay Suitability Tests/Chi-Square-Test / Z-Test (HypothesisTest)/choice/
/Dichotomous Assay (Quantal Response Assay)/Analysis/Suitability Tests/Sample Suitability Tests/Chi-Square-Test / Z-Test(Hypothesis Test)/choice/
/Quantitative Response Assay/Analysis/Suitability Tests/Assay Suitability Tests/choice/F-Test (Hypothesis Test)/choice/
/Quantitative Response Assay/Analysis/Suitability Tests/Sample Suitability Tests/choice/F-Test (Hypothesis Test)/choice/
/Test System for Quantitative Response Assay/Suitability Tests/Assay Suitability Tests/choice/F-Test (Hypothesis Test)/choice/
277

/Test System for Quantitative Response Assay/Suitability Tests/Sample Suitability Tests/choice/F-Test (Hypothesis Test)/choice/
10.8.287 Quantitative response assayQuantitative response assays are dilution assays based on a quantitative response. Unlikedichotomous response, quantitative response is measured on a continuous scale. Parallel-lineassays and slope ratio assays among others are Quantitative response assays.
Navigate through the properties to select or enter settings you require for this Quantitativeresponse assay:
1. Expand the node to add or view information. The second level of the document structuredisplays the Name and Date of the document. It also provides access to the Documentation,Setup, and Analysis sections.
2. Double-click the Identification element in the Creatable elements pane to add it to thedocument.
Note: Note: To delete an element from the document, right-click the element in thedocument structure and select the Delete element option from the pop-up menu.
3. Double-click the Comment or Settings element in the Creatable elements pane to add aComment or Settings section to the document.
This element has the following attributes:
Data type Multiplicity Usage Default value
xs:empty 1...1 none
Context:Top level
10.8.288 Quality weightSelect the Quality weight you want to use for range optimization.
Note: Note: The Quality weight is used during range selection. It only affects the calculationif the 'Optimization on' option is set in the current Data selection scheme.
The following options are available from the drop-down list:
• Coefficient of determination
• F-ratio regression
• Slope
Note: Note: The behavior of Quality weight also depends on which option you select for theConfiguration optimizer allocation range.
278

Reference Guide | Biological Assay Package Version 26
If you select Best range: The configuration optimizer first finds all configurations with minimalseverity index. Of these, the configuration with optimal Quality weight is determined.
If you select Maximum range: The configuration optimizer first finds all configurations withminimal severity index. It then selects the configurations with maximal number of treatments. Ofthese, the configuration with optimal Quality weight is determined.
Coefficient of determination
The range optimizer selects ranges with higher R² value.
Important: Important: The Coefficient of determination is the default Quality weight optionof PLA. If you consider using one of the other options, you must confirm suitability of yourmethod for you assay.
F-ratio regression
The range optimizer selects ranges with higher F-ratio regression.
Note: Note: With the F-ratio regression option, you must select the Residual-error ANOVAoption for ANOVA model. If you use the Pure Error ANOVA option, the calculation is abortedwith an error message. If F-ratio regression cannot be calculated, the value is set to '0'.
Slope
The range optimizer selects ranges with greater absolute value of the Slope of the restrictedregression model.
This element has the following attributes:
Data type Multiplicity Usage Default value
T_QualityWeight 0...1 optional none
Context:/Quantitative Response Assay/Analysis/Data Selection Schemes/
10.8.289 Range fullUses the full dose range for potency calculation. Select the Range partial option from the drop-down list if you do not want to use the full range.
This element has the following attributes:
Data type Multiplicity Usage Default value
T_Empty 1...1 required none
Context:/Quantitative Response Assay/Analysis/Data Selection Schemes/Data Selection Scheme/choice/
279

10.8.290 Range partialUses a partial dose range for potency calculation that begins at Step start and ends at Step stop.Select the Range full option from the drop-down list if you do not want to use a partial range.
This element has the following attributes:
Data type Multiplicity Usage Default value
xs:empty 1...1 required none
Context:/Quantitative Response Assay/Analysis/Data Selection Schemes/Data Selection Scheme/choice/
10.8.291 Ratio of asymptotes (A / D) (nonlinear models)Use this test for the following models:
• 4-parameter logistic fit
• 4-parameter logistic fit with included blanks
• 5-parameter logistic fit
This element has the following attributes:
Data type Multiplicity Usage Default value
T_SingleTestStrategyWithScope 0...1 optional none
Context:/Equivalence Margin Development for Biological Assays/Test Strategies/Strategy/Equivalence Tests - Parameter Estimate/
/Equivalence Margin Development for Biological Assays/Test Strategies/Strategy/Point Estimate Tests - Parameter Estimate/
/Equivalence Margin Development for Biological Assays/Margin Development/Equivalence Tests - Parameter Estimate/
/Equivalence Margin Development for Biological Assays/Margin Development/Point Estimate Tests - Parameter Estimate/
10.8.292 Reagent classEnter the class of the reagent such as the drug class.
This element has the following attributes:
Data type Multiplicity Usage Default value
xs:token 0...1 optional none
Context:/Dichotomous Assay (Quantal Response Assay)/Documentation/Reagent/
280

Reference Guide | Biological Assay Package Version 26
/Quantitative Response Assay/Documentation/Reagent/
10.8.293 Reagent descriptionEnter a description of the reagent.
Tip: Tip: You can enter multiline text.
This element has the following attributes:
Data type Multiplicity Usage Default value
xs:string 0...1 optional none
Context:/Dichotomous Assay (Quantal Response Assay)/Documentation/Reagent/
/Quantitative Response Assay/Documentation/Reagent/
10.8.294 Reagent identificationEnter information to identify the reagent.
This element has the following attributes:
Data type Multiplicity Usage Default value
xs:token 0...1 optional none
Context:/Dichotomous Assay (Quantal Response Assay)/Documentation/Reagent/
/Quantitative Response Assay/Documentation/Reagent/
10.8.295 Reagent batch/lot numberEnter the reagent batch or lot number, a combination of numbers, letters, and/or symbols. Itidentifies a batch (or lot), which allows you to infer the production and distribution history.
This element has the following attributes:
Data type Multiplicity Usage Default value
xs:token 0...1 optional none
Context:/Dichotomous Assay (Quantal Response Assay)/Documentation/Reagent/
/Quantitative Response Assay/Documentation/Reagent/
281

10.8.296 Reagent nameEnter a name for the reagent.
Tip: Tip: You can enter a reference to a reagent document instead. Select the Reagentreference option from the drop-down list.
This element has the following attributes:
Data type Multiplicity Usage Default value
xs:token 0...1 required none
Context:/Dichotomous Assay (Quantal Response Assay)/Documentation/Reagent/choice/
/Quantitative Response Assay/Documentation/Reagent/choice/
10.8.297 Reagent referenceSelect a reagent document.
Tip: Tip: You can enter a reagent name instead. Select the Reagent name option from thedrop-down list.
This element has the following attributes:
Data type Multiplicity Usage Default value
DocumentReference.Reagent 0...1 required none
Context:/Dichotomous Assay (Quantal Response Assay)/Documentation/Reagent/choice/
/Quantitative Response Assay/Documentation/Reagent/choice/
10.8.298 Reagent sub-batch/sub-lot numberEnter the reagent sub-batch or sub-lot number, a combination of numbers, letters, and/orsymbols. It identifies a sub-batch (or sub-lot), which allows you to infer the production anddistribution history.
This element has the following attributes:
Data type Multiplicity Usage Default value
xs:token 0...1 optional none
282

Reference Guide | Biological Assay Package Version 26
Context:/Dichotomous Assay (Quantal Response Assay)/Documentation/Reagent/
/Quantitative Response Assay/Documentation/Reagent/
10.8.299 ReagentThis section allows you to provide information on a reagent. Expand the node to add or viewinformation.
This element has the following attributes:
Data type Multiplicity Usage Default value
xs:empty 0...unbounded optional none
Context:/Dichotomous Assay (Quantal Response Assay)/Documentation/
/Quantitative Response Assay/Documentation/
10.8.300 Reagent variantEnter the variant of the reagent.
This element has the following attributes:
Data type Multiplicity Usage Default value
xs:token 0...1 optional none
Context:/Dichotomous Assay (Quantal Response Assay)/Documentation/Reagent/
/Quantitative Response Assay/Documentation/Reagent/
10.8.301 RecursiveSet Recursive to 'true' if you want to repeat the test (with previously found outliers excluded) aslong as outliers are detected and the number of values is greater than or equal to 3.
This element has the following attributes:
Data type Multiplicity Usage Default value
xs:boolean 1...1 required none
Context:/Quantitative Response Assay/Analysis/Data Selection Schemes/Data Selection Scheme/choice/Dixon Test/
283

/Quantitative Response Assay/Analysis/Data Selection Schemes/Data Selection Scheme/choice/(Externally) Studentized Residuals/
10.8.302 Reference mean (calculated value)Select how you want to define the Reference mean of the parameter.
Note: Note: The Reference mean is used as scaling parameter in the test.
The following options are available from the drop-down list:
• Calculated value: Selects the corresponding mean from your development assays.
• Manual input: Allows you to enter a decimal number to set the Reference mean manually.
This element has the following attributes:
Data type Multiplicity Usage Default value
T_Empty 0...1 required none
Context:/Equivalence Margin Development for Biological Assays/Test Strategies/Strategy/Equivalence Tests - Scaled Parameter Range/AUpper Asymptote (Nonlinear Models)/choice/
/Equivalence Margin Development for Biological Assays/Test Strategies/Strategy/Equivalence Tests - Scaled Parameter Range/BParameter (Nonlinear Models)/choice/
/Equivalence Margin Development for Biological Assays/Test Strategies/Strategy/Equivalence Tests - Scaled Parameter Range/CParameter (Nonlinear Models)/choice/
/Equivalence Margin Development for Biological Assays/Test Strategies/Strategy/Equivalence Tests - Scaled Parameter Range/DLower Asymptote (Nonlinear Models)/choice/
/Equivalence Margin Development for Biological Assays/Test Strategies/Strategy/Equivalence Tests - Scaled Parameter Range/GAsymmetry Parameter (Nonlinear Models)/choice/
/Equivalence Margin Development for Biological Assays/Test Strategies/Strategy/Equivalence Tests - Scaled Parameter Range/Slope(Linear Models)/choice/
/Equivalence Margin Development for Biological Assays/Test Strategies/Strategy/Equivalence Tests - Scaled Parameter Range/Intercept (Linear Models)/choice/
/Equivalence Margin Development for Biological Assays/Test Strategies/Strategy/Equivalence Tests - Scaled Parameter Range/A-DDifference of Asymptotes (Nonlinear Models, Standard only)/choice/
10.8.303 Reference mean (manual input)Select how you want to define the Reference mean of the parameter.
Note: Note: The Reference mean is used as scaling parameter in the test.
The following options are available from the drop-down list:
• Calculated value: Selects the corresponding mean from your development assays.
• Manual input: Allows you to enter a decimal number to set the Reference mean manually.
This element has the following attributes:
Data type Multiplicity Usage Default value
284

Reference Guide | Biological Assay Package Version 26
xs:double 0...1 required none
Context:/Equivalence Margin Development for Biological Assays/Test Strategies/Strategy/Equivalence Tests - Scaled Parameter Range/AUpper Asymptote (Nonlinear Models)/choice/
/Equivalence Margin Development for Biological Assays/Test Strategies/Strategy/Equivalence Tests - Scaled Parameter Range/BParameter (Nonlinear Models)/choice/
/Equivalence Margin Development for Biological Assays/Test Strategies/Strategy/Equivalence Tests - Scaled Parameter Range/CParameter (Nonlinear Models)/choice/
/Equivalence Margin Development for Biological Assays/Test Strategies/Strategy/Equivalence Tests - Scaled Parameter Range/DLower Asymptote (Nonlinear Models)/choice/
/Equivalence Margin Development for Biological Assays/Test Strategies/Strategy/Equivalence Tests - Scaled Parameter Range/GAsymmetry Parameter (Nonlinear Models)/choice/
/Equivalence Margin Development for Biological Assays/Test Strategies/Strategy/Equivalence Tests - Scaled Parameter Range/Slope(Linear Models)/choice/
/Equivalence Margin Development for Biological Assays/Test Strategies/Strategy/Equivalence Tests - Scaled Parameter Range/Intercept (Linear Models)/choice/
/Equivalence Margin Development for Biological Assays/Test Strategies/Strategy/Equivalence Tests - Scaled Parameter Range/A-DDifference of Asymptotes (Nonlinear Models, Standard only)/choice/
10.8.304 Relative potencyThis column displays the combined relative potency.
This element has the following attributes:
Data type Multiplicity Usage Default value
DatasetColumn.RelativePotency 1...1 optional none
Context:/Basic Bioassay Protocol/Reportable Values/
/Combination of Independent Assay Results/Potency Data/
10.8.305 Relative potency lower confidence limitThis column displays the lower confidence limit of the combined relative potency.
This element has the following attributes:
Data type Multiplicity Usage Default value
DatasetColumn.RelativePotencyLowerLimit 1...1 optional none
Context:/Basic Bioassay Protocol/Reportable Values/
/Combination of Independent Assay Results/Potency Data/
285

10.8.306 Relative potency statusThis column indicates the test status of the combined relative potency.
This element has the following attributes:
Data type Multiplicity Usage Default value
DatasetColumn.RelativePotencyStatus 1...1 none
Context:/Basic Bioassay Protocol/Reportable Values/
10.8.307 Relative potency upper confidence limitThis column displays the upper confidence limit of the combined relative potency.
This element has the following attributes:
Data type Multiplicity Usage Default value
DatasetColumn.RelativePotencyUpperLimit 1...1 optional none
Context:/Basic Bioassay Protocol/Reportable Values/
/Combination of Independent Assay Results/Potency Data/
10.8.308 Replace outliersSelect the 'true' option from the drop-down list to have the outlier response values replaced bythe arithmetic mean of the non-outlier responses of the corresponding step and assay element.
Note: Note: Do not use this option if you want to consider position effects in the ANOVA.
Note: Note: We do not recommend to use outlier replacement in new assays. Its purpose isto evaluate legacy assays.
This element has the following attributes:
Data type Multiplicity Usage Default value
xs:boolean 0...1 optional none
Context:/Quantitative Response Assay/Analysis/Analytical Model/Advanced Settings/
286

Reference Guide | Biological Assay Package Version 26
10.8.309 Replicate countEnter a number to specify how many replicates this assay element requires for each dose step.
This element has the following attributes:
Data type Multiplicity Usage Default value
xs:positiveInteger 1...1 required none
Context:/Dichotomous Assay (Quantal Response Assay)/Setup/PreparationSchemes/Preparation Scheme/
/Quantitative Response Assay/Setup/Preparation Schemes/Preparation Scheme/
10.8.310 Reportable valuesThis section allows you to adjust the dataset structure used to summarize Reportable valuesgenerated by Combination of assay results documents.
This element has the following attributes:
Data type Multiplicity Usage Default value
xs:empty 1...1 required none
Context:/Basic Bioassay Protocol/
10.8.311 Report excluded/invalid elementsSelect the 'true' option from the drop-down list to have invalid and excluded assay elementsreported and made available for use in subsequent documents (such as Combination of assayresults documents).
This element has the following attributes:
Data type Multiplicity Usage Default value
xs:boolean 0...1 optional none
Context:/Quantitative Response Assay/Analysis/Analytical Model/Advanced Settings/
287

10.8.312 Report homogeneity testSelect the 'false' option from the drop-down list to exclude the results from the homogeneitytest from the report.
This element has the following attributes:
Data type Multiplicity Usage Default value
xs:boolean 1...1 required none
Context:/Combination of Independent Assay Results/
10.8.313 Response adjustment by control lineUses a Control line to adjust response values.
Tip: Tip: Select a different option from the drop-down list if you want to adjust responses bya fixed value or if you do not want to adjust them.
Select the Control line you want to use from the Value drop-down list.
Note: Note: The mean response of the Control line you select is subtracted from everyresponse value (except the referenced Control line).
Note: Note: If you also define a Response transformation, it is applied after responseadjustment.
This element has the following attributes:
Data type Multiplicity Usage Default value
xs:string 1...1 required none
Context:/Quantitative Response Assay/Analysis/Analytical Model/choice/
10.8.314 Response adjustment by fixed valueUses a fixed value to adjust response values.
Tip: Tip: Select a different option from the drop-down list if you want to adjust responses bya Control line or if you do not want to adjust them.
Enter a number to specify the fixed value you want to use.
288

Reference Guide | Biological Assay Package Version 26
Note: Note: The fixed value you enter is subtracted from every response value.
Note: Note: If you also define a Response transformation, it is applied after responseadjustment.
This element has the following attributes:
Data type Multiplicity Usage Default value
xs:double 1...1 required none
Context:/Quantitative Response Assay/Analysis/Analytical Model/choice/
10.8.315 No response adjustmentPerforms analysis without response adjustment.
Tip: Tip: Select a different option from the drop-down list if you want to use responseadjustment.
This element has the following attributes:
Data type Multiplicity Usage Default value
T_Empty 1...1 required none
Context:/Quantitative Response Assay/Analysis/Analytical Model/choice/
10.8.316 Response (affected)Displays the number of affected responses.
This element has the following attributes:
Data type Multiplicity Usage Default value
T_ResponseAffectedFactor 1...1 required none
Context:/Dichotomous Assay (Quantal Response Assay)/Setup/Observation Data/
10.8.317 NameEnter a name for this column.
289

This element has the following attributes:
Data type Multiplicity Usage Default value
xs:string 1...1 required none
Context:/Quantitative Response Assay/Setup/Observation Data/Column: Response Value/
10.8.318 Response valueDisplays the observed response value.
Note: Note: Use a data acquisition module to populate this column automatically.
This element has the following attributes:
Data type Multiplicity Usage Default value
T_ResponseFactor 1...1 required none
Context:/Quantitative Response Assay/Setup/Observation Data/
10.8.319 Response maximumEnter a decimal number to be used as greatest value of the y-axis in simulation plots.
This element has the following attributes:
Data type Multiplicity Usage Default value
xs:double 0...1 optional none
Context:/Equivalence Margin Development for Biological Assays/Visualization/Response Range/
10.8.320 Response minimumEnter a decimal number to be used as least value of the y-axis in simulation plots.
This element has the following attributes:
Data type Multiplicity Usage Default value
xs:double 0...1 optional none
290

Reference Guide | Biological Assay Package Version 26
Context:/Equivalence Margin Development for Biological Assays/Visualization/Response Range/
10.8.321 Response rangeDefines the least and greatest value of the y-axis used for simulation plots.
Note: Note: These values only apply if no assays are referenced. Otherwise, the values of thereferenced assays are used.
This element has the following attributes:
Data type Multiplicity Usage Default value
xs:empty 0...1 optional none
Context:/Equivalence Margin Development for Biological Assays/Visualization/
10.8.322 Response (tested)Displays the total number of tested responses.
This element has the following attributes:
Data type Multiplicity Usage Default value
T_ResponseTestedFactor 1...1 required none
Context:/Dichotomous Assay (Quantal Response Assay)/Setup/Observation Data/
10.8.323 Response transformationSelect an option from the drop-down list if you want to use Response transformation. Thefollowing options are available:
• no response transformation
• logarithmic response transformation
• square response transformation
• square root response transformation
This element has the following attributes:
Data type Multiplicity Usage Default value
291

T_ResponseTransformation 1...1 required none
Context:/Quantitative Response Assay/Analysis/Analytical Model/
10.8.324 Label of the response unitEnter a unit for the y-axis.
This element has the following attributes:
Data type Multiplicity Usage Default value
xs:token 0...1 required none
Context:/Control Chart/Charts/Chart/Graphics Settings/
/Dichotomous Assay (Quantal Response Assay)/Settings/Graphics/Linear Predictor: Data Plot/
/Dichotomous Assay (Quantal Response Assay)/Settings/Graphics/Linear Predictor: Full Model/
/Dichotomous Assay (Quantal Response Assay)/Settings/Graphics/Linear Predictor: Restricted Model/
/Dichotomous Assay (Quantal Response Assay)/Settings/Graphics/Probability: Data Plot/
/Dichotomous Assay (Quantal Response Assay)/Settings/Graphics/Probability: Full Model/
/Dichotomous Assay (Quantal Response Assay)/Settings/Graphics/Probability: Restricted Model/
/Quantitative Response Assay/Settings/Graphics/Data Plot/
/Quantitative Response Assay/Settings/Graphics/Full Model/
/Quantitative Response Assay/Settings/Graphics/Restricted Model/
10.8.325 Response value lower limitEnter a number to specify the lower limit you want to use.
Note: Note: Response values that are less than the lower limit you enter are treated astechnical outliers and therefore excluded from analysis. Response values that are equal to thelimit are included.
Note: Note: Set the limit to 0 if you want to maintain backward compatibility with PLA 1.xand 2.0. This is not required for PLA 2.1.
This element has the following attributes:
Data type Multiplicity Usage Default value
xs:double 0...1 none
Context:/Quantitative Response Assay/Analysis/Analytical Model/
292

Reference Guide | Biological Assay Package Version 26
10.8.326 Response value upper limitEnter a number to specify the upper limit you want to use.
Note: Note: Response values that are greater than the upper limit you enter are treated astechnical outliers and therefore excluded from analysis. Response values that are equal to thelimit are included.
This element has the following attributes:
Data type Multiplicity Usage Default value
xs:double 0...1 none
Context:/Quantitative Response Assay/Analysis/Analytical Model/
10.8.327 Restricted modelChange settings to adjust display of restricted models to your requirements.
This element has the following attributes:
Data type Multiplicity Usage Default value
xs:empty 0...1 optional none
Context:/Quantitative Response Assay/Settings/Graphics/
10.8.328 RoleEnter the role of the operator.
This element has the following attributes:
Data type Multiplicity Usage Default value
xs:token 0...1 optional none
Context:/Basic Bioassay Protocol/Documentation/Operator/
/Combination of Independent Assay Results/Documentation/Operator/
/Dichotomous Assay (Quantal Response Assay)/Documentation/Operator/
/Quantitative Response Assay/Documentation/Operator/
293

10.8.329 RoundingApply a Rounding setting to have the test round values prior to evaluation.
Note: Note: Rounded values are compared to the full-precision margins, critical values, or p-values used in the test.
The following options are available:
• No rounding
• x decimal places (where x is an integer from 0 to 10)
Note: Note: The rounding method 'half away from zero' is used.
Rounding examples for the '0 decimal places' option:
Test result Observedvalue
Lowermargin
Uppermargin
Roundedvalue
Passed because0.0 ≤ 1.0 ≤ 1.0
0.5113 0.0 1.0 1.0
Passed because-1.0 ≤ -1.0 ≤ 0.0
-0.5113 -1.0 0.0 -1.0
Failed because 1.0 ≥ 0.6 0.5113 0.0 0.6 1.0
Note: Note: You may need this feature to follow protocol procedures or companyregulations. We do not recommend to use rounding for test evaluation.
This element has the following attributes:
Data type Multiplicity Usage Default value
xs:empty 0...1 optional none
Context:/Quantitative Response Assay/Analysis/Suitability Tests/Assay Suitability Tests/choice/F-Test (Hypothesis Test)/
/Quantitative Response Assay/Analysis/Suitability Tests/Assay Suitability Tests/choice/Equivalence Test (Parameter Estimate)/
/Quantitative Response Assay/Analysis/Suitability Tests/Assay Suitability Tests/choice/Equivalence Test (Difference of ParameterEstimates)/
/Quantitative Response Assay/Analysis/Suitability Tests/Assay Suitability Tests/choice/Equivalence Test (Ratio of ParameterEstimates)/
/Quantitative Response Assay/Analysis/Suitability Tests/Assay Suitability Tests/choice/Equivalence Test (Scaled Parameter Range)/
/Quantitative Response Assay/Analysis/Suitability Tests/Assay Suitability Tests/choice/Point estimate tests: Parameter estimate/
/Quantitative Response Assay/Analysis/Suitability Tests/Assay Suitability Tests/choice/Point estimate tests: Difference of parameterestimates/
/Quantitative Response Assay/Analysis/Suitability Tests/Assay Suitability Tests/choice/Point estimate tests: Ratio of parameterestimates/
294
Reference Guide | Biological Assay Package Version 26
/Quantitative Response Assay/Analysis/Suitability Tests/Assay Suitability Tests/choice/Test: Normalized difference of asymptotes/
/Quantitative Response Assay/Analysis/Suitability Tests/Assay Suitability Tests/choice/Test: Sum of Squares Regression/
/Quantitative Response Assay/Analysis/Suitability Tests/Assay Suitability Tests/choice/Test: Sum of Squares Non-Parallelism/
/Quantitative Response Assay/Analysis/Suitability Tests/Assay Suitability Tests/choice/Test: Sum of Squares Non-Linearity/
/Quantitative Response Assay/Analysis/Suitability Tests/Assay Suitability Tests/choice/Test: Ratio sum-of-squares non-linearity tosum-of-squares regression/
/Quantitative Response Assay/Analysis/Suitability Tests/Assay Suitability Tests/choice/Test: Potency Value/
/Quantitative Response Assay/Analysis/Suitability Tests/Assay Suitability Tests/choice/Test: Potency Confidence Interval/
/Quantitative Response Assay/Analysis/Suitability Tests/Assay Suitability Tests/choice/Test: Log potency range/
/Quantitative Response Assay/Analysis/Suitability Tests/Assay Suitability Tests/choice/Test: Potency of Intermediate Dilution/
/Quantitative Response Assay/Analysis/Suitability Tests/Assay Suitability Tests/choice/Test: Potency Confidence Interval (%)/
/Quantitative Response Assay/Analysis/Suitability Tests/Assay Suitability Tests/choice/Test: Potency Range (%)/
/Quantitative Response Assay/Analysis/Suitability Tests/Assay Suitability Tests/choice/Test: Maximal Sequence Step CV (%)/
/Quantitative Response Assay/Analysis/Suitability Tests/Assay Suitability Tests/choice/Test: Minimal R²/
/Quantitative Response Assay/Analysis/Suitability Tests/Assay Suitability Tests/choice/Test: Relative LOF Error (%)/
/Quantitative Response Assay/Analysis/Suitability Tests/Assay Suitability Tests/choice/Test: Response Value Range/
/Quantitative Response Assay/Analysis/Suitability Tests/Assay Suitability Tests/choice/Test: Weight W/
/Quantitative Response Assay/Analysis/Suitability Tests/Sample Suitability Tests/choice/F-Test (Hypothesis Test)/
/Quantitative Response Assay/Analysis/Suitability Tests/Sample Suitability Tests/choice/Equivalence Test (Parameter Estimate)/
/Quantitative Response Assay/Analysis/Suitability Tests/Sample Suitability Tests/choice/Equivalence Test (Difference of ParameterEstimates)/
/Quantitative Response Assay/Analysis/Suitability Tests/Sample Suitability Tests/choice/Equivalence Test (Ratio of ParameterEstimates)/
/Quantitative Response Assay/Analysis/Suitability Tests/Sample Suitability Tests/choice/Equivalence Test (Scaled Parameter Range)/
/Quantitative Response Assay/Analysis/Suitability Tests/Sample Suitability Tests/choice/Point estimate tests: Parameter estimate/
/Quantitative Response Assay/Analysis/Suitability Tests/Sample Suitability Tests/choice/Point estimate tests: Difference of parameterestimates/
/Quantitative Response Assay/Analysis/Suitability Tests/Sample Suitability Tests/choice/Point estimate tests: Ratio of parameterestimates/
/Quantitative Response Assay/Analysis/Suitability Tests/Sample Suitability Tests/choice/Test: Normalized difference of asymptotes/
/Quantitative Response Assay/Analysis/Suitability Tests/Sample Suitability Tests/choice/Test: Sum of Squares Regression/
/Quantitative Response Assay/Analysis/Suitability Tests/Sample Suitability Tests/choice/Test: Sum of Squares Non-Parallelism/
/Quantitative Response Assay/Analysis/Suitability Tests/Sample Suitability Tests/choice/Test: Sum of Squares Non-Linearity/
/Quantitative Response Assay/Analysis/Suitability Tests/Sample Suitability Tests/choice/Test: Ratio sum-of-squares non-linearity tosum-of-squares regression/
/Quantitative Response Assay/Analysis/Suitability Tests/Sample Suitability Tests/choice/Test: Potency Value/
/Quantitative Response Assay/Analysis/Suitability Tests/Sample Suitability Tests/choice/Test: Potency Confidence Interval/
/Quantitative Response Assay/Analysis/Suitability Tests/Sample Suitability Tests/choice/Test: Log potency range/
/Quantitative Response Assay/Analysis/Suitability Tests/Sample Suitability Tests/choice/Test: Potency of Intermediate Dilution/
/Quantitative Response Assay/Analysis/Suitability Tests/Sample Suitability Tests/choice/Test: Potency Confidence Interval (%)/
/Quantitative Response Assay/Analysis/Suitability Tests/Sample Suitability Tests/choice/Test: Potency Range (%)/
/Quantitative Response Assay/Analysis/Suitability Tests/Sample Suitability Tests/choice/Test: Maximal Sequence Step CV (%)/
/Quantitative Response Assay/Analysis/Suitability Tests/Sample Suitability Tests/choice/Test: Minimal R²/
/Quantitative Response Assay/Analysis/Suitability Tests/Sample Suitability Tests/choice/Test: Relative LOF Error (%)/
/Quantitative Response Assay/Analysis/Suitability Tests/Sample Suitability Tests/choice/Test: Response Value Range/
/Quantitative Response Assay/Analysis/Suitability Tests/Sample Suitability Tests/choice/Test: Weight W/
/Test System for Quantitative Response Assay/Suitability Tests/Assay Suitability Tests/choice/F-Test (Hypothesis Test)/
/Test System for Quantitative Response Assay/Suitability Tests/Assay Suitability Tests/choice/Equivalence Test (Parameter Estimate)/
295

/Test System for Quantitative Response Assay/Suitability Tests/Assay Suitability Tests/choice/Equivalence Test (Difference ofParameter Estimates)/
/Test System for Quantitative Response Assay/Suitability Tests/Assay Suitability Tests/choice/Equivalence Test (Ratio of ParameterEstimates)/
/Test System for Quantitative Response Assay/Suitability Tests/Assay Suitability Tests/choice/Equivalence Test (Scaled ParameterRange)/
/Test System for Quantitative Response Assay/Suitability Tests/Assay Suitability Tests/choice/Point estimate tests: Parameter estimate/
/Test System for Quantitative Response Assay/Suitability Tests/Assay Suitability Tests/choice/Point estimate tests: Difference ofparameter estimates/
/Test System for Quantitative Response Assay/Suitability Tests/Assay Suitability Tests/choice/Point estimate tests: Ratio of parameterestimates/
/Test System for Quantitative Response Assay/Suitability Tests/Assay Suitability Tests/choice/Test: Normalized difference ofasymptotes/
/Test System for Quantitative Response Assay/Suitability Tests/Assay Suitability Tests/choice/Test: Sum of Squares Regression/
/Test System for Quantitative Response Assay/Suitability Tests/Assay Suitability Tests/choice/Test: Sum of Squares Non-Parallelism/
/Test System for Quantitative Response Assay/Suitability Tests/Assay Suitability Tests/choice/Test: Sum of Squares Non-Linearity/
/Test System for Quantitative Response Assay/Suitability Tests/Assay Suitability Tests/choice/Test: Ratio sum-of-squares non-linearityto sum-of-squares regression/
/Test System for Quantitative Response Assay/Suitability Tests/Assay Suitability Tests/choice/Test: Potency Value/
/Test System for Quantitative Response Assay/Suitability Tests/Assay Suitability Tests/choice/Test: Potency Confidence Interval/
/Test System for Quantitative Response Assay/Suitability Tests/Assay Suitability Tests/choice/Test: Log potency range/
/Test System for Quantitative Response Assay/Suitability Tests/Assay Suitability Tests/choice/Test: Potency of Intermediate Dilution/
/Test System for Quantitative Response Assay/Suitability Tests/Assay Suitability Tests/choice/Test: Potency Confidence Interval (%)/
/Test System for Quantitative Response Assay/Suitability Tests/Assay Suitability Tests/choice/Test: Potency Range (%)/
/Test System for Quantitative Response Assay/Suitability Tests/Assay Suitability Tests/choice/Test: Maximal Sequence Step CV (%)/
/Test System for Quantitative Response Assay/Suitability Tests/Assay Suitability Tests/choice/Test: Minimal R²/
/Test System for Quantitative Response Assay/Suitability Tests/Assay Suitability Tests/choice/Test: Relative LOF Error (%)/
/Test System for Quantitative Response Assay/Suitability Tests/Assay Suitability Tests/choice/Test: Response Value Range/
/Test System for Quantitative Response Assay/Suitability Tests/Assay Suitability Tests/choice/Test: Weight W/
/Test System for Quantitative Response Assay/Suitability Tests/Sample Suitability Tests/choice/F-Test (Hypothesis Test)/
/Test System for Quantitative Response Assay/Suitability Tests/Sample Suitability Tests/choice/Equivalence Test (Parameter Estimate)/
/Test System for Quantitative Response Assay/Suitability Tests/Sample Suitability Tests/choice/Equivalence Test (Difference ofParameter Estimates)/
/Test System for Quantitative Response Assay/Suitability Tests/Sample Suitability Tests/choice/Equivalence Test (Ratio of ParameterEstimates)/
/Test System for Quantitative Response Assay/Suitability Tests/Sample Suitability Tests/choice/Equivalence Test (Scaled ParameterRange)/
/Test System for Quantitative Response Assay/Suitability Tests/Sample Suitability Tests/choice/Point estimate tests: Parameterestimate/
/Test System for Quantitative Response Assay/Suitability Tests/Sample Suitability Tests/choice/Point estimate tests: Difference ofparameter estimates/
/Test System for Quantitative Response Assay/Suitability Tests/Sample Suitability Tests/choice/Point estimate tests: Ratio ofparameter estimates/
/Test System for Quantitative Response Assay/Suitability Tests/Sample Suitability Tests/choice/Test: Normalized difference ofasymptotes/
/Test System for Quantitative Response Assay/Suitability Tests/Sample Suitability Tests/choice/Test: Sum of Squares Regression/
/Test System for Quantitative Response Assay/Suitability Tests/Sample Suitability Tests/choice/Test: Sum of Squares Non-Parallelism/
/Test System for Quantitative Response Assay/Suitability Tests/Sample Suitability Tests/choice/Test: Sum of Squares Non-Linearity/
/Test System for Quantitative Response Assay/Suitability Tests/Sample Suitability Tests/choice/Test: Ratio sum-of-squares non-linearity to sum-of-squares regression/
/Test System for Quantitative Response Assay/Suitability Tests/Sample Suitability Tests/choice/Test: Potency Value/
/Test System for Quantitative Response Assay/Suitability Tests/Sample Suitability Tests/choice/Test: Potency Confidence Interval/
296

Reference Guide | Biological Assay Package Version 26
/Test System for Quantitative Response Assay/Suitability Tests/Sample Suitability Tests/choice/Test: Log potency range/
/Test System for Quantitative Response Assay/Suitability Tests/Sample Suitability Tests/choice/Test: Potency of Intermediate Dilution/
/Test System for Quantitative Response Assay/Suitability Tests/Sample Suitability Tests/choice/Test: Potency Confidence Interval (%)/
/Test System for Quantitative Response Assay/Suitability Tests/Sample Suitability Tests/choice/Test: Potency Range (%)/
/Test System for Quantitative Response Assay/Suitability Tests/Sample Suitability Tests/choice/Test: Maximal Sequence Step CV (%)/
/Test System for Quantitative Response Assay/Suitability Tests/Sample Suitability Tests/choice/Test: Minimal R²/
/Test System for Quantitative Response Assay/Suitability Tests/Sample Suitability Tests/choice/Test: Relative LOF Error (%)/
/Test System for Quantitative Response Assay/Suitability Tests/Sample Suitability Tests/choice/Test: Response Value Range/
/Test System for Quantitative Response Assay/Suitability Tests/Sample Suitability Tests/choice/Test: Weight W/
10.8.330 RoundingApply a Rounding setting to have the test round values prior to evaluation.
Note: Note: Rounded values are compared to the full-precision margins, critical values, or p-values used in the test.
The following options are available:
• No rounding
• x decimal places (where x is an integer from 0 to 10)
Note: Note: The rounding method 'half away from zero' is used.
Note: Note: You may need this option to follow protocol procedures or companyregulations. We do not recommend to use rounding for test evaluation.
This element has the following attributes:
Data type Multiplicity Usage Default value
xs:empty 0...1 optional none
Context:/Combination of Independent Assay Results/Tests/Test on Potency Value/
/Combination of Independent Assay Results/Tests/Test on Potency Confidence Interval (%)/
/Combination of Independent Assay Results/Tests/Chi² Homogeneity Test/
/Combination of Independent Assay Results/Tests/Test on Potency Confidence Interval/
/Combination of Independent Assay Results/Tests/Test on Potency Coefficient of Variation (%)/
/Combination of Independent Assay Results/Tests/Test on Potency Range (%)/
/Combination of Independent Assay Results/Tests/Test on (Log) Potency Range/
/Combination of Independent Assay Results/Tests/Test on (Log) Potency Confidence Interval Length/
/Combination of Independent Assay Results/Tests/Test on Sum of Weights/
/Combination of Independent Assay Results/Tests/Test on Mean of CV (%)/
/Dichotomous Assay (Quantal Response Assay)/Analysis/Suitability Tests/Assay Suitability Tests/Chi-Square-Test / Z-Test (HypothesisTest)/
/Dichotomous Assay (Quantal Response Assay)/Analysis/Suitability Tests/Assay Suitability Tests/Test: Relative Potency Value/
/Dichotomous Assay (Quantal Response Assay)/Analysis/Suitability Tests/Assay Suitability Tests/Test: Relative Potency ConfidenceInterval/
297

/Dichotomous Assay (Quantal Response Assay)/Analysis/Suitability Tests/Assay Suitability Tests/Test: Relative Potency Range (%)/
/Dichotomous Assay (Quantal Response Assay)/Analysis/Suitability Tests/Assay Suitability Tests/Test: Weight W/
/Dichotomous Assay (Quantal Response Assay)/Analysis/Suitability Tests/Sample Suitability Tests/Chi-Square-Test / Z-Test(Hypothesis Test)/
/Dichotomous Assay (Quantal Response Assay)/Analysis/Suitability Tests/Sample Suitability Tests/Test: Relative Potency Value/
/Dichotomous Assay (Quantal Response Assay)/Analysis/Suitability Tests/Sample Suitability Tests/Test: Relative Potency ConfidenceInterval/
/Dichotomous Assay (Quantal Response Assay)/Analysis/Suitability Tests/Sample Suitability Tests/Test: Relative Potency Range (%)/
/Dichotomous Assay (Quantal Response Assay)/Analysis/Suitability Tests/Sample Suitability Tests/Test: Weight W/
10.8.331 Row orderSelect the sort order you want to apply to the data rows.
This element has the following attributes:
Data type Multiplicity Usage Default value
ds:T_RowOrder 0...1 optional none
Context:/Basic Bioassay Protocol/Reportable Values/
/Combination of Independent Assay Results/Potency Data/
/Dichotomous Assay (Quantal Response Assay)/Setup/Observation Data/
/Equivalence Margin Development for Biological Assays/Datatable/
/Quantitative Response Assay/Setup/Observation Data/
Data type Multiplicity Usage Default value
T_RestrictedSortOrder 1...1 required none
Context:/Control Chart/Data Table/
10.8.332 Sample suitability testsAdd the Sample suitability tests you require.
Important: Important: The results of Sample suitability tests just affect the individualStandard-vs-Test sample comparison for which they are set rather than the whole assaydocument.
Note: Note: With simultaneous regression (formerly called multiplex assay), there is nodifference in how Assay suitability tests and Sample suitability tests are evaluated.
This element has the following attributes:
Data type Multiplicity Usage Default value
298

Reference Guide | Biological Assay Package Version 26
T_SuitabilityTests 1...1 required none
Context:/Dichotomous Assay (Quantal Response Assay)/Analysis/Suitability Tests/
/Quantitative Response Assay/Analysis/Suitability Tests/
/Test System for Quantitative Response Assay/Suitability Tests/
10.8.333 Scaling parameterEnter the Scaling parameter of the test as positive decimal number.
The observed confidence interval is divided by the Scaling parameter prior to being comparedto the margins.
Tip: Tip: Set up an Equivalence margin document in PLA if you have historical data todetermine the Scaling parameter for your tests.
This element has the following attributes:
Data type Multiplicity Usage Default value
xs:double 1...1 required none
Context:/Quantitative Response Assay/Analysis/Suitability Tests/Assay Suitability Tests/choice/Equivalence Test (Scaled Parameter Range)/
/Quantitative Response Assay/Analysis/Suitability Tests/Sample Suitability Tests/choice/Equivalence Test (Scaled Parameter Range)/
/Test System for Quantitative Response Assay/Suitability Tests/Assay Suitability Tests/choice/Equivalence Test (Scaled ParameterRange)/
/Test System for Quantitative Response Assay/Suitability Tests/Sample Suitability Tests/choice/Equivalence Test (Scaled ParameterRange)/
10.8.334 Scientifically acceptableMarks dataset rows for positive or negative verification. Set to 'true' if you expect the assay ofthe row will be accepted. Set to 'false' if you expect the assay of the row will be rejected.
This element has the following attributes:
Data type Multiplicity Usage Default value
T_PositiveVerification 1...1 required none
Context:/Equivalence Margin Development for Biological Assays/Datatable/
299

10.8.335 SectionSpecify which sections of referenced documents you require to develop or verify margins.
This element has the following attributes:
Data type Multiplicity Usage Default value
T_EMDReferenceSectionFactor 1...1 required none
Context:/Equivalence Margin Development for Biological Assays/Datatable/
10.8.336 SectionExpand the node to add or view information.
This element has the following attributes:
Data type Multiplicity Usage Default value
T_COAReferenceSectionFactor 1...1 required none
Context:/Combination of Independent Assay Results/Potency Data/
/Control Chart/Data Table/
Data type Multiplicity Usage Default value
ds:T_ReferenceSectionColumn 0...1 optional none
Context:/Quantitative Response Assay/Setup/Observation Data/
10.8.337 Section keyEnter a Section key to restrict the source of this property to the section identified by the key.
Note: Note: The key you enter here must match one of the sections in the aggregateddocuments. For Quantitative response assays, each assay element is set up as a section.
Note: Note: The key only applies to document aggregation.
This element has the following attributes:
Data type Multiplicity Usage Default value
300

Reference Guide | Biological Assay Package Version 26
xs:token 0...1 optional none
Context:/Control Chart/Data Table/Column: Date/Time/
/Dichotomous Assay (Quantal Response Assay)/Setup/Observation Data/Column: Response (Affected)/
/Dichotomous Assay (Quantal Response Assay)/Setup/Observation Data/Column: Response (Tested)/
/Quantitative Response Assay/Setup/Observation Data/Column: Response Value/
10.8.338 Section property filterCurrently, no information available.
This element has the following attributes:
Data type Multiplicity Usage Default value
dr:T_SectionPropertyFilterForDocuments 0...unbounded optional none
Context:/Basic Bioassay Protocol/Templates/Combination Calculation Templates/Configuration/Template/Config/
10.8.339 Section property filterDefine a filter based on a section property to require referenced documents match this property.
This element has the following attributes:
Data type Multiplicity Usage Default value
ds:T_SectionPropertyFilterForDocuments 0...unbounded optional none
Context:/Basic Bioassay Protocol/Reportable Values/Document Reference/
/Combination of Independent Assay Results/Potency Data/Column: Document Reference/
10.8.340 Section property importCurrently, no information available.
This element has the following attributes:
Data type Multiplicity Usage Default value
dr:T_SectionPropertyImport 0...unbounded optional none
Context:
301

10.8.341 Selected methodThis column indicates the combination method selected.
This element has the following attributes:
Data type Multiplicity Usage Default value
DatasetColumn.SelectedMethod 1...1 optional none
Context:/Basic Bioassay Protocol/Reportable Values/
10.8.342 Sequence stepDisplays the sequence step number and the dose value.
Note: Note: The total number of steps and replicates of an assay element is defined in thePreparation scheme referenced by this assay element.
This element has the following attributes:
Data type Multiplicity Usage Default value
ds:T_SequenceStepColumn 1...1 required none
Context:/Dichotomous Assay (Quantal Response Assay)/Setup/Observation Data/
/Quantitative Response Assay/Setup/Observation Data/
10.8.343 SettingsThis section allows you to enable and disable Development, Verification, and Visualization. Youcan also set Confidence and Tolerance levels. Expand the node to add or view information.
This element has the following attributes:
Data type Multiplicity Usage Default value
T_Settings 1...1 required none
Context:/Equivalence Margin Development for Biological Assays/
302

Reference Guide | Biological Assay Package Version 26
10.8.344 SettingsThis section allows you to adjust various settings.
Note: Note: We will change the structure of this section in a future version.
This element has the following attributes:
Data type Multiplicity Usage Default value
T_Settings 0...1 optional none
Context:/Dichotomous Assay (Quantal Response Assay)/
/Quantitative Response Assay/
10.8.345 SetupThis section allows you to set up the assay. Expand the node to add or view information. Thefollowing features are available:
• Assay elements: Details all assay elements, that is, Standard sample, Test samples, Controlsamples, and Control lines.
• Preparation schemes: Defines Preparation schemes including dose sequences.
• Observation data: Sets up the observation data table. The table is created automatically basedon information provided on assay elements and preparation schemes. But you can set upadditional data columns such as the Position factor column.
This element has the following attributes:
Data type Multiplicity Usage Default value
xs:empty 1...1 required none
Context:/Quantitative Response Assay/
10.8.346 SetupThis section allows you to set up this assay. Expand the node to add or view information.
This section provides the following features:
• Assay elements: Details all assay elements, that is, Standard sample, Test samples, and Controlsamples.
• Preparation schemes: Defines Preparation schemes including dose sequences.
303

• Observation data: Sets up the observation data table. The table is created automatically basedon information provided on assay elements and preparation schemes. But you can set upadditional data columns such as the Position factor column.
This element has the following attributes:
Data type Multiplicity Usage Default value
xs:empty 1...1 required none
Context:/Dichotomous Assay (Quantal Response Assay)/
10.8.347 Severity level of the testSelect the Severity level of the test. The severity level controls how failed tests affect assayresults.*
The following options are available from the drop-down list:
Note: Note: Each assay also provides a summary of test results, which is called 'Overall testresult'.
• Reject: If the test fails, no potencies are reported. For reporting the Overall test result, the testis considered 'Rejected'.
• Warning: If the test fails, potencies are reported. For reporting the Overall test result, the testis considered 'Failed'.
• Information: If the test fails, potencies are reported. For reporting the Overall test result, thetest is considered 'Passed' (info available).
The following table explains how the Severity levels of failed tests influence the Overall testresult:
Overalltest result
Failed tests ofseverity level'Rejected'
Failed tests ofseverity level'Warning'
Failed tests of severitylevel 'Information'
Passed 0 0 0
Passed (infoavailable)
0 0 ≥1
Failed 0 ≥1 any number
Rejected ≥1 any number any number
Note: Note: If tests cannot be calculated and return 'not calculated' (NC) results (forexample, if Fieller's formula is needed to calculate test results and computed values are outside
304

Reference Guide | Biological Assay Package Version 26
the valid range), the behavior of the test system depends on your settings in Test exceptionhandling. Please consult the help pages on Test exception handling for additional information.
* The term 'assay' here refers to calculations for individual sample pairs (Test sample comparedto Standard) unless simultaneous regression (formerly called multiplex assay) is used. If a testis set up as an Assay suitability test, it also counts for calculations of the Overall test results ofother sample pairs in the assay document.
This element has the following attributes:
Data type Multiplicity Usage Default value
xs:empty 1...1 optional none
Context:/Quantitative Response Assay/Analysis/Suitability Tests/Assay Suitability Tests/choice/F-Test (Hypothesis Test)/
/Quantitative Response Assay/Analysis/Suitability Tests/Assay Suitability Tests/choice/Equivalence Test (Parameter Estimate)/
/Quantitative Response Assay/Analysis/Suitability Tests/Assay Suitability Tests/choice/Equivalence Test (Difference of ParameterEstimates)/
/Quantitative Response Assay/Analysis/Suitability Tests/Assay Suitability Tests/choice/Equivalence Test (Ratio of ParameterEstimates)/
/Quantitative Response Assay/Analysis/Suitability Tests/Assay Suitability Tests/choice/Equivalence Test (Scaled Parameter Range)/
/Quantitative Response Assay/Analysis/Suitability Tests/Assay Suitability Tests/choice/Point estimate tests: Parameter estimate/
/Quantitative Response Assay/Analysis/Suitability Tests/Assay Suitability Tests/choice/Point estimate tests: Difference of parameterestimates/
/Quantitative Response Assay/Analysis/Suitability Tests/Assay Suitability Tests/choice/Point estimate tests: Ratio of parameterestimates/
/Quantitative Response Assay/Analysis/Suitability Tests/Assay Suitability Tests/choice/Test: Normalized difference of asymptotes/
/Quantitative Response Assay/Analysis/Suitability Tests/Assay Suitability Tests/choice/Test: Sum of Squares Regression/
/Quantitative Response Assay/Analysis/Suitability Tests/Assay Suitability Tests/choice/Test: Sum of Squares Non-Parallelism/
/Quantitative Response Assay/Analysis/Suitability Tests/Assay Suitability Tests/choice/Test: Sum of Squares Non-Linearity/
/Quantitative Response Assay/Analysis/Suitability Tests/Assay Suitability Tests/choice/Test: Ratio sum-of-squares non-linearity tosum-of-squares regression/
/Quantitative Response Assay/Analysis/Suitability Tests/Assay Suitability Tests/choice/Test: Potency Value/
/Quantitative Response Assay/Analysis/Suitability Tests/Assay Suitability Tests/choice/Test: Potency Confidence Interval/
/Quantitative Response Assay/Analysis/Suitability Tests/Assay Suitability Tests/choice/Test: Log potency range/
/Quantitative Response Assay/Analysis/Suitability Tests/Assay Suitability Tests/choice/Test: Potency of Intermediate Dilution/
/Quantitative Response Assay/Analysis/Suitability Tests/Assay Suitability Tests/choice/Test: Potency Confidence Interval (%)/
/Quantitative Response Assay/Analysis/Suitability Tests/Assay Suitability Tests/choice/Test: Potency Range (%)/
/Quantitative Response Assay/Analysis/Suitability Tests/Assay Suitability Tests/choice/Test: Maximal Number of Outliers/
/Quantitative Response Assay/Analysis/Suitability Tests/Assay Suitability Tests/choice/Test: Maximal Sequence Step CV (%)/
/Quantitative Response Assay/Analysis/Suitability Tests/Assay Suitability Tests/choice/Test: Minimal R²/
/Quantitative Response Assay/Analysis/Suitability Tests/Assay Suitability Tests/choice/Test: Relative LOF Error (%)/
/Quantitative Response Assay/Analysis/Suitability Tests/Assay Suitability Tests/choice/Test: Weight W/
/Quantitative Response Assay/Analysis/Suitability Tests/Sample Suitability Tests/choice/F-Test (Hypothesis Test)/
/Quantitative Response Assay/Analysis/Suitability Tests/Sample Suitability Tests/choice/Equivalence Test (Parameter Estimate)/
/Quantitative Response Assay/Analysis/Suitability Tests/Sample Suitability Tests/choice/Equivalence Test (Difference of ParameterEstimates)/
/Quantitative Response Assay/Analysis/Suitability Tests/Sample Suitability Tests/choice/Equivalence Test (Ratio of ParameterEstimates)/
305

/Quantitative Response Assay/Analysis/Suitability Tests/Sample Suitability Tests/choice/Equivalence Test (Scaled Parameter Range)/
/Quantitative Response Assay/Analysis/Suitability Tests/Sample Suitability Tests/choice/Point estimate tests: Parameter estimate/
/Quantitative Response Assay/Analysis/Suitability Tests/Sample Suitability Tests/choice/Point estimate tests: Difference of parameterestimates/
/Quantitative Response Assay/Analysis/Suitability Tests/Sample Suitability Tests/choice/Point estimate tests: Ratio of parameterestimates/
/Quantitative Response Assay/Analysis/Suitability Tests/Sample Suitability Tests/choice/Test: Normalized difference of asymptotes/
/Quantitative Response Assay/Analysis/Suitability Tests/Sample Suitability Tests/choice/Test: Sum of Squares Regression/
/Quantitative Response Assay/Analysis/Suitability Tests/Sample Suitability Tests/choice/Test: Sum of Squares Non-Parallelism/
/Quantitative Response Assay/Analysis/Suitability Tests/Sample Suitability Tests/choice/Test: Sum of Squares Non-Linearity/
/Quantitative Response Assay/Analysis/Suitability Tests/Sample Suitability Tests/choice/Test: Ratio sum-of-squares non-linearity tosum-of-squares regression/
/Quantitative Response Assay/Analysis/Suitability Tests/Sample Suitability Tests/choice/Test: Potency Value/
/Quantitative Response Assay/Analysis/Suitability Tests/Sample Suitability Tests/choice/Test: Potency Confidence Interval/
/Quantitative Response Assay/Analysis/Suitability Tests/Sample Suitability Tests/choice/Test: Log potency range/
/Quantitative Response Assay/Analysis/Suitability Tests/Sample Suitability Tests/choice/Test: Potency of Intermediate Dilution/
/Quantitative Response Assay/Analysis/Suitability Tests/Sample Suitability Tests/choice/Test: Potency Confidence Interval (%)/
/Quantitative Response Assay/Analysis/Suitability Tests/Sample Suitability Tests/choice/Test: Potency Range (%)/
/Quantitative Response Assay/Analysis/Suitability Tests/Sample Suitability Tests/choice/Test: Maximal Number of Outliers/
/Quantitative Response Assay/Analysis/Suitability Tests/Sample Suitability Tests/choice/Test: Maximal Sequence Step CV (%)/
/Quantitative Response Assay/Analysis/Suitability Tests/Sample Suitability Tests/choice/Test: Minimal R²/
/Quantitative Response Assay/Analysis/Suitability Tests/Sample Suitability Tests/choice/Test: Relative LOF Error (%)/
/Quantitative Response Assay/Analysis/Suitability Tests/Sample Suitability Tests/choice/Test: Weight W/
/Test System for Quantitative Response Assay/Suitability Tests/Assay Suitability Tests/choice/F-Test (Hypothesis Test)/
/Test System for Quantitative Response Assay/Suitability Tests/Assay Suitability Tests/choice/Equivalence Test (Parameter Estimate)/
/Test System for Quantitative Response Assay/Suitability Tests/Assay Suitability Tests/choice/Equivalence Test (Difference ofParameter Estimates)/
/Test System for Quantitative Response Assay/Suitability Tests/Assay Suitability Tests/choice/Equivalence Test (Ratio of ParameterEstimates)/
/Test System for Quantitative Response Assay/Suitability Tests/Assay Suitability Tests/choice/Equivalence Test (Scaled ParameterRange)/
/Test System for Quantitative Response Assay/Suitability Tests/Assay Suitability Tests/choice/Point estimate tests: Parameter estimate/
/Test System for Quantitative Response Assay/Suitability Tests/Assay Suitability Tests/choice/Point estimate tests: Difference ofparameter estimates/
/Test System for Quantitative Response Assay/Suitability Tests/Assay Suitability Tests/choice/Point estimate tests: Ratio of parameterestimates/
/Test System for Quantitative Response Assay/Suitability Tests/Assay Suitability Tests/choice/Test: Normalized difference ofasymptotes/
/Test System for Quantitative Response Assay/Suitability Tests/Assay Suitability Tests/choice/Test: Sum of Squares Regression/
/Test System for Quantitative Response Assay/Suitability Tests/Assay Suitability Tests/choice/Test: Sum of Squares Non-Parallelism/
/Test System for Quantitative Response Assay/Suitability Tests/Assay Suitability Tests/choice/Test: Sum of Squares Non-Linearity/
/Test System for Quantitative Response Assay/Suitability Tests/Assay Suitability Tests/choice/Test: Ratio sum-of-squares non-linearityto sum-of-squares regression/
/Test System for Quantitative Response Assay/Suitability Tests/Assay Suitability Tests/choice/Test: Potency Value/
/Test System for Quantitative Response Assay/Suitability Tests/Assay Suitability Tests/choice/Test: Potency Confidence Interval/
/Test System for Quantitative Response Assay/Suitability Tests/Assay Suitability Tests/choice/Test: Log potency range/
/Test System for Quantitative Response Assay/Suitability Tests/Assay Suitability Tests/choice/Test: Potency of Intermediate Dilution/
/Test System for Quantitative Response Assay/Suitability Tests/Assay Suitability Tests/choice/Test: Potency Confidence Interval (%)/
/Test System for Quantitative Response Assay/Suitability Tests/Assay Suitability Tests/choice/Test: Potency Range (%)/
/Test System for Quantitative Response Assay/Suitability Tests/Assay Suitability Tests/choice/Test: Maximal Number of Outliers/
306

Reference Guide | Biological Assay Package Version 26
/Test System for Quantitative Response Assay/Suitability Tests/Assay Suitability Tests/choice/Test: Maximal Sequence Step CV (%)/
/Test System for Quantitative Response Assay/Suitability Tests/Assay Suitability Tests/choice/Test: Minimal R²/
/Test System for Quantitative Response Assay/Suitability Tests/Assay Suitability Tests/choice/Test: Relative LOF Error (%)/
/Test System for Quantitative Response Assay/Suitability Tests/Assay Suitability Tests/choice/Test: Weight W/
/Test System for Quantitative Response Assay/Suitability Tests/Sample Suitability Tests/choice/F-Test (Hypothesis Test)/
/Test System for Quantitative Response Assay/Suitability Tests/Sample Suitability Tests/choice/Equivalence Test (Parameter Estimate)/
/Test System for Quantitative Response Assay/Suitability Tests/Sample Suitability Tests/choice/Equivalence Test (Difference ofParameter Estimates)/
/Test System for Quantitative Response Assay/Suitability Tests/Sample Suitability Tests/choice/Equivalence Test (Ratio of ParameterEstimates)/
/Test System for Quantitative Response Assay/Suitability Tests/Sample Suitability Tests/choice/Equivalence Test (Scaled ParameterRange)/
/Test System for Quantitative Response Assay/Suitability Tests/Sample Suitability Tests/choice/Point estimate tests: Parameterestimate/
/Test System for Quantitative Response Assay/Suitability Tests/Sample Suitability Tests/choice/Point estimate tests: Difference ofparameter estimates/
/Test System for Quantitative Response Assay/Suitability Tests/Sample Suitability Tests/choice/Point estimate tests: Ratio ofparameter estimates/
/Test System for Quantitative Response Assay/Suitability Tests/Sample Suitability Tests/choice/Test: Normalized difference ofasymptotes/
/Test System for Quantitative Response Assay/Suitability Tests/Sample Suitability Tests/choice/Test: Sum of Squares Regression/
/Test System for Quantitative Response Assay/Suitability Tests/Sample Suitability Tests/choice/Test: Sum of Squares Non-Parallelism/
/Test System for Quantitative Response Assay/Suitability Tests/Sample Suitability Tests/choice/Test: Sum of Squares Non-Linearity/
/Test System for Quantitative Response Assay/Suitability Tests/Sample Suitability Tests/choice/Test: Ratio sum-of-squares non-linearity to sum-of-squares regression/
/Test System for Quantitative Response Assay/Suitability Tests/Sample Suitability Tests/choice/Test: Potency Value/
/Test System for Quantitative Response Assay/Suitability Tests/Sample Suitability Tests/choice/Test: Potency Confidence Interval/
/Test System for Quantitative Response Assay/Suitability Tests/Sample Suitability Tests/choice/Test: Log potency range/
/Test System for Quantitative Response Assay/Suitability Tests/Sample Suitability Tests/choice/Test: Potency of Intermediate Dilution/
/Test System for Quantitative Response Assay/Suitability Tests/Sample Suitability Tests/choice/Test: Potency Confidence Interval (%)/
/Test System for Quantitative Response Assay/Suitability Tests/Sample Suitability Tests/choice/Test: Potency Range (%)/
/Test System for Quantitative Response Assay/Suitability Tests/Sample Suitability Tests/choice/Test: Maximal Number of Outliers/
/Test System for Quantitative Response Assay/Suitability Tests/Sample Suitability Tests/choice/Test: Maximal Sequence Step CV (%)/
/Test System for Quantitative Response Assay/Suitability Tests/Sample Suitability Tests/choice/Test: Minimal R²/
/Test System for Quantitative Response Assay/Suitability Tests/Sample Suitability Tests/choice/Test: Relative LOF Error (%)/
/Test System for Quantitative Response Assay/Suitability Tests/Sample Suitability Tests/choice/Test: Weight W/
/Quantitative Response Assay/Analysis/Suitability Tests/Assay Suitability Tests/choice/Test: Response Value Range/
/Quantitative Response Assay/Analysis/Suitability Tests/Sample Suitability Tests/choice/Test: Response Value Range/
/Test System for Quantitative Response Assay/Suitability Tests/Assay Suitability Tests/choice/Test: Response Value Range/
/Test System for Quantitative Response Assay/Suitability Tests/Sample Suitability Tests/choice/Test: Response Value Range/
Data type Multiplicity Usage Default value
xs:empty 0...1 optional none
Context:/Quantitative Response Assay/Analysis/Suitability Tests/Document Suitability Tests/Signature State/
/Test System for Quantitative Response Assay/Suitability Tests/Document Suitability Tests/Signature State/
/Quantitative Response Assay/Analysis/Suitability Tests/Document Suitability Tests/Test on User Variable/
307

/Test System for Quantitative Response Assay/Suitability Tests/Document Suitability Tests/Test on User Variable/
10.8.348 Severity level of the testSelect the Severity level of the test. The severity level controls how failed tests affect assayresults.*
The following options are available from the drop-down list:
Note: Note: Each assay also provides a summary of test results, which is called 'Overall testresult'.
• Reject: If the test fails, no potencies are reported. For reporting the Overall test result, the testis considered 'Rejected'.
• Warning: If the test fails, potencies are reported. For reporting the Overall test result, the testis considered 'Failed'.
• Information: If the test fails, potencies are reported. For reporting the Overall test result, thetest is considered 'Passed' (info available).
The following table explains how the Severity levels of failed tests influence the Overall testresult:
Overalltest result
Failed tests ofseverity level'Rejected'
Failed tests ofseverity level'Warning'
Failed tests of severitylevel 'Information'
Passed 0 0 0
Passed (infoavailable)
0 0 ≥1
Failed 0 ≥1 any number
Rejected ≥1 any number any number
Note: Note: In some cases, tests cannot be calculated (for example, if Fieller's formula isneeded to calculate test results and computed values are outside the valid range). Tests are thenreported as 'NC' and are not used in the calculation of the Overall test result.
* The term 'assay' here refers to calculations for individual sample pairs (Test sample comparedto Standard) unless simultaneous regression (formerly called multiplex assay) is used. If a testis set up as an Assay suitability test, it also counts for calculations of the Overall test results ofother sample pairs in the assay document.
This element has the following attributes:
Data type Multiplicity Usage Default value
xs:empty 0...1 optional none
308

Reference Guide | Biological Assay Package Version 26
Context:/Combination of Independent Assay Results/Tests/Signature State/
/Combination of Independent Assay Results/Tests/Test on Potency Value/
/Combination of Independent Assay Results/Tests/Test on Potency Confidence Interval (%)/
/Combination of Independent Assay Results/Tests/Chi² Homogeneity Test/
/Combination of Independent Assay Results/Tests/Test on Potency Confidence Interval/
/Combination of Independent Assay Results/Tests/Test on Potency Coefficient of Variation (%)/
/Combination of Independent Assay Results/Tests/Test on Potency Range (%)/
/Combination of Independent Assay Results/Tests/Test on (Log) Potency Range/
/Combination of Independent Assay Results/Tests/Test on (Log) Potency Confidence Interval Length/
/Combination of Independent Assay Results/Tests/Test on Number of Valid Assays/
/Combination of Independent Assay Results/Tests/Test on maximal number of failed assays/
/Combination of Independent Assay Results/Tests/Test on Sum of Weights/
/Combination of Independent Assay Results/Tests/Test on Mean of CV (%)/
/Dichotomous Assay (Quantal Response Assay)/Analysis/Suitability Tests/Assay Suitability Tests/Chi-Square-Test / Z-Test (HypothesisTest)/
/Dichotomous Assay (Quantal Response Assay)/Analysis/Suitability Tests/Assay Suitability Tests/Test: Relative Potency Value/
/Dichotomous Assay (Quantal Response Assay)/Analysis/Suitability Tests/Assay Suitability Tests/Test: Relative Potency ConfidenceInterval/
/Dichotomous Assay (Quantal Response Assay)/Analysis/Suitability Tests/Assay Suitability Tests/Test: Relative Potency Range (%)/
/Dichotomous Assay (Quantal Response Assay)/Analysis/Suitability Tests/Assay Suitability Tests/Test: Weight W/
/Dichotomous Assay (Quantal Response Assay)/Analysis/Suitability Tests/Sample Suitability Tests/Chi-Square-Test / Z-Test(Hypothesis Test)/
/Dichotomous Assay (Quantal Response Assay)/Analysis/Suitability Tests/Sample Suitability Tests/Test: Relative Potency Value/
/Dichotomous Assay (Quantal Response Assay)/Analysis/Suitability Tests/Sample Suitability Tests/Test: Relative Potency ConfidenceInterval/
/Dichotomous Assay (Quantal Response Assay)/Analysis/Suitability Tests/Sample Suitability Tests/Test: Relative Potency Range (%)/
/Dichotomous Assay (Quantal Response Assay)/Analysis/Suitability Tests/Sample Suitability Tests/Test: Weight W/
/Dichotomous Assay (Quantal Response Assay)/Analysis/Suitability Tests/Document Suitability Tests/Signature State/
/Dichotomous Assay (Quantal Response Assay)/Analysis/Suitability Tests/Document Suitability Tests/Test on User Variable/
10.8.349 SignaturesCurrently, no information available.
This element has the following attributes:
Data type Multiplicity Usage Default value
xs:empty 1...1 required none
Context:
10.8.350 MeaningEnter text to specify the signatures this document requires.
Tip: Tip: You can enter multiline text.
309

Note: Note: If you enter a Meaning, the test only accepts and counts signatures that matchthis Meaning.
This element has the following attributes:
Data type Multiplicity Usage Default value
xs:empty 0...1 optional none
Context:/Combination of Independent Assay Results/Tests/Signature State/
/Dichotomous Assay (Quantal Response Assay)/Analysis/Suitability Tests/Document Suitability Tests/Signature State/
/Quantitative Response Assay/Analysis/Suitability Tests/Document Suitability Tests/Signature State/
/Test System for Quantitative Response Assay/Suitability Tests/Document Suitability Tests/Signature State/
10.8.351 SignatureCurrently, no information available.
This element has the following attributes:
Data type Multiplicity Usage Default value
T_AssayEventInfo 1...unbounded required none
Context:
10.8.352 Scope of the testSelect which part of the document is to be signed. The following options are available from thedrop-down list:
• Content: The test only counts signatures that confirm content of the document.
• Data: The test only counts signatures that confirm observations of the document.
This element has the following attributes:
Data type Multiplicity Usage Default value
xs:empty 0...1 optional none
Context:/Combination of Independent Assay Results/Tests/Signature State/
/Dichotomous Assay (Quantal Response Assay)/Analysis/Suitability Tests/Document Suitability Tests/Signature State/
/Quantitative Response Assay/Analysis/Suitability Tests/Document Suitability Tests/Signature State/
/Test System for Quantitative Response Assay/Suitability Tests/Document Suitability Tests/Signature State/
310

Reference Guide | Biological Assay Package Version 26
10.8.353 Confidence levelSelect the Confidence level of the test. A common value is 95%
This element has the following attributes:
Data type Multiplicity Usage Default value
T_ConfidenceLevel80Included 0...1 required none
Context:/Combination of Independent Assay Results/Tests/Chi² Homogeneity Test/choice/
10.8.354 Simulation spaceDefine the standard errors and covariances for the simulation of model parameters. For eachparameter, simulation samples a value from the uniform distribution within given limits.
Defaults
• If no Standard error is defined, the mean of the standard errors of the parameter in thereferenced assays is used as default.
• If no Covariances are defined, 0 is used as default.
This element has the following attributes:
Data type Multiplicity Usage Default value
xs:empty 1...1 required none
Context:/Equivalence Margin Development for Biological Assays/Visualization/
10.8.355 Simultaneous regressionSpecifies how the assay is to be evaluated. Set Simultaneous regression to 'true' if all samples areto be regarded as one single dataset and approximated together. Set Simultaneous regressionto 'false' if the samples are to be regarded as a collection of Standard-vs-Test comparisons witheach pair approximated separately.
Note: Note: Simultaneous regression is referred to as 'multiplex assay' in previous versionsof our software.
This element has the following attributes:
Data type Multiplicity Usage Default value
311

xs:boolean 1...1 required none
Context:/Dichotomous Assay (Quantal Response Assay)/Analysis/Analytical Model/
/Quantitative Response Assay/Analysis/Analytical Model/
10.8.356 Single-line textDefine a column that allows you to associate each observation with a single-line text. Expand thenode to add or view information.
This element has the following attributes:
Data type Multiplicity Usage Default value
T_ControlChartTextColumn 0...unbounded optional none
Context:/Control Chart/Data Table/
10.8.357 Slope (linear models)Use this test for the following models:
• Linear parallel-line model
• Slope ratio model
This element has the following attributes:
Data type Multiplicity Usage Default value
T_SingleTestStrategyWithScope 0...1 optional none
Context:/Equivalence Margin Development for Biological Assays/Test Strategies/Strategy/Equivalence Tests - Parameter Estimate/
/Equivalence Margin Development for Biological Assays/Test Strategies/Strategy/Equivalence Tests - Difference of ParameterEstimates/
/Equivalence Margin Development for Biological Assays/Test Strategies/Strategy/Equivalence Tests - Ratio of Parameter Estimates/
/Equivalence Margin Development for Biological Assays/Test Strategies/Strategy/Equivalence Tests - Scaled Parameter Range/
/Equivalence Margin Development for Biological Assays/Test Strategies/Strategy/Point Estimate Tests - Parameter Estimate/
/Equivalence Margin Development for Biological Assays/Test Strategies/Strategy/Point Estimate Tests - Difference of ParameterEstimates/
/Equivalence Margin Development for Biological Assays/Test Strategies/Strategy/Point Estimate Tests - Ratio of Parameter Estimates/
/Equivalence Margin Development for Biological Assays/Margin Development/Equivalence Tests - Parameter Estimate/
/Equivalence Margin Development for Biological Assays/Margin Development/Equivalence Tests - Difference of Parameter Estimates/
/Equivalence Margin Development for Biological Assays/Margin Development/Equivalence Tests - Ratio of Parameter Estimates/
/Equivalence Margin Development for Biological Assays/Margin Development/Equivalence Tests - Scaled Parameter Range/
312

Reference Guide | Biological Assay Package Version 26
/Equivalence Margin Development for Biological Assays/Margin Development/Point Estimate Tests - Parameter Estimate/
/Equivalence Margin Development for Biological Assays/Margin Development/Point Estimate Tests - Difference of ParameterEstimates/
/Equivalence Margin Development for Biological Assays/Margin Development/Point Estimate Tests - Ratio of Parameter Estimates/
/Equivalence Margin Development for Biological Assays/Visualization/Simulation Space/
10.8.358 Slope (nonlinear models)Use this test for the following models:
• 4-parameter logistic fit
• 4-parameter logistic fit with included blanks
• 5-parameter logistic fit
This element has the following attributes:
Data type Multiplicity Usage Default value
T_SingleTestStrategyWithScope 0...1 optional none
Context:/Equivalence Margin Development for Biological Assays/Test Strategies/Strategy/Point Estimate Tests - Parameter Estimate/
/Equivalence Margin Development for Biological Assays/Margin Development/Point Estimate Tests - Parameter Estimate/
10.8.359 Model: Slope ratioUses the Slope ratio regression model to estimate relative potency. Select a different model fromthe drop-down list if you require.
The model is defined by the following equation:
This element has the following attributes:
Data type Multiplicity Usage Default value
xs:empty 1...1 required none
Context:/Quantitative Response Assay/Analysis/Analytical Model/choice/
10.8.360 Solvent (summary)Expand the node to add or view information.
313

This element has the following attributes:
Data type Multiplicity Usage Default value
xs:empty 1...1 required none
Context:/Basic Bioassay Protocol/choice/Mode: Assay Element/Standard Sample/choice/Absolute Potency: defined by Raw Material/
/Basic Bioassay Protocol/choice/Mode: Assay Element/Test Sample/choice/Absolute Potency: defined by Raw Material/
/Basic Bioassay Protocol/choice/Mode: Assay Element/Control Sample/choice/Absolute Potency: defined by Raw Material/
/Dichotomous Assay (Quantal Response Assay)/Setup/PreparationSchemes/Preparation Scheme/choice/Absolute Potency: definedby Raw Material/
/Quantitative Response Assay/Setup/Preparation Schemes/Preparation Scheme/choice/Absolute Potency: defined by Raw Material/
10.8.361 Solvent volumeEnter the volume of the solvent.
This element has the following attributes:
Data type Multiplicity Usage Default value
T_PositiveDouble 1...1 required none
Context:/Basic Bioassay Protocol/choice/Mode: Assay Element/Standard Sample/choice/Absolute Potency: defined by Raw Material/Solvent(Summary)/
/Basic Bioassay Protocol/choice/Mode: Assay Element/Test Sample/choice/Absolute Potency: defined by Raw Material/Solvent(Summary)/
/Basic Bioassay Protocol/choice/Mode: Assay Element/Control Sample/choice/Absolute Potency: defined by Raw Material/Solvent(Summary)/
/Dichotomous Assay (Quantal Response Assay)/Setup/PreparationSchemes/Preparation Scheme/choice/Absolute Potency: definedby Raw Material/Solvent (Summary)/
/Quantitative Response Assay/Setup/Preparation Schemes/Preparation Scheme/choice/Absolute Potency: defined by Raw Material/Solvent (Summary)/
10.8.362 Solvent volume unitsEnter the unit for Solvent volume.
This element has the following attributes:
Data type Multiplicity Usage Default value
xs:string 1...1 required none
Context:
314

Reference Guide | Biological Assay Package Version 26
/Basic Bioassay Protocol/choice/Mode: Assay Element/Standard Sample/choice/Absolute Potency: defined by Raw Material/Solvent(Summary)/
/Basic Bioassay Protocol/choice/Mode: Assay Element/Test Sample/choice/Absolute Potency: defined by Raw Material/Solvent(Summary)/
/Basic Bioassay Protocol/choice/Mode: Assay Element/Control Sample/choice/Absolute Potency: defined by Raw Material/Solvent(Summary)/
/Dichotomous Assay (Quantal Response Assay)/Setup/PreparationSchemes/Preparation Scheme/choice/Absolute Potency: definedby Raw Material/Solvent (Summary)/
/Quantitative Response Assay/Setup/Preparation Schemes/Preparation Scheme/choice/Absolute Potency: defined by Raw Material/Solvent (Summary)/
10.8.363 SourceLinks this document to the source Equivalence margin development document.
This element has the following attributes:
Data type Multiplicity Usage Default value
DocumentReference.EMD 0...1 optional none
Context:/Test System for Quantitative Response Assay/
10.8.364 Standard deviation testProvides a statistical outlier detection method based on multiples of the standard deviation.
This element has the following attributes:
Data type Multiplicity Usage Default value
xs:empty 1...1 none
Context:/Quantitative Response Assay/Analysis/Data Selection Schemes/Data Selection Scheme/choice/
10.8.365 Standard errorEnter a decimal number to specify the standard error of the parameter. It is used duringsimulation to calculate confidence intervals if required by a test.
This element has the following attributes:
Data type Multiplicity Usage Default value
xs:double 0...1 optional none
315

Context:/Equivalence Margin Development for Biological Assays/Visualization/Simulation Space/A Upper Asymptote (Nonlinear Models)/
/Equivalence Margin Development for Biological Assays/Visualization/Simulation Space/B Parameter (Nonlinear Models)/
/Equivalence Margin Development for Biological Assays/Visualization/Simulation Space/C Parameter (Nonlinear Models)/
/Equivalence Margin Development for Biological Assays/Visualization/Simulation Space/D Lower Asymptote (Nonlinear Models)/
/Equivalence Margin Development for Biological Assays/Visualization/Simulation Space/G Asymmetry Parameter (NonlinearModels)/
/Equivalence Margin Development for Biological Assays/Visualization/Simulation Space/Intercept (Linear Models)/
/Equivalence Margin Development for Biological Assays/Visualization/Simulation Space/Slope (Linear Models)/
10.8.366 NameEnter a name for the Standard sample.
Examples:
'Standard', 'Std', 'Reference standard'
Note: Note: This name is also displayed in the Observation group ID column of theObservations editor. The name is used to report test results, data values, and estimates related tothis Standard sample.
Tip: Tip: We recommend to use assay element names that are unique within the assaydocument. But this is not required. Assay elements are internally identified by their uniqueObservation group ID.
This element has the following attributes:
Data type Multiplicity Usage Default value
xs:token 1...1 required none
Context:/Basic Bioassay Protocol/choice/Mode: Assay Element/Standard Sample/
/Dichotomous Assay (Quantal Response Assay)/Setup/Assay Elements/Standard Sample/
/Quantitative Response Assay/Setup/Assay Elements/Standard Sample/
10.8.367 Standard sampleThis section allows you to provide information on the Standard sample, also referred toas standard preparation or standard. In quantitative assays, the potency of preparations iscalculated in comparison to the Standard sample.
Expand the node to add or view information.
To provide information on the substance: Add the elements you need, such as Substance nameor Substance reference, from the Creatable elements pane.
316

Reference Guide | Biological Assay Package Version 26
This element has the following attributes:
Data type Multiplicity Usage Default value
T_AE_Standard 1...1 required none
Context:/Basic Bioassay Protocol/choice/Mode: Assay Element/
/Dichotomous Assay (Quantal Response Assay)/Setup/Assay Elements/
/Quantitative Response Assay/Setup/Assay Elements/
10.8.368 Step countEnter a number to specify how many dose steps this assay element requires.
This element has the following attributes:
Data type Multiplicity Usage Default value
xs:positiveInteger 1...1 required none
Context:/Dichotomous Assay (Quantal Response Assay)/Setup/PreparationSchemes/Preparation Scheme/
/Quantitative Response Assay/Setup/Preparation Schemes/Preparation Scheme/
10.8.369 Step startEnter a step number to specify the first step of the partial range.
This element has the following attributes:
Data type Multiplicity Usage Default value
xs:positiveInteger 1...1 required none
Context:/Quantitative Response Assay/Analysis/Data Selection Schemes/Data Selection Scheme/choice/Range Partial/
10.8.370 Step stopEnter a step number to specify the last step of the partial range.
This element has the following attributes:
Data type Multiplicity Usage Default value
317

xs:positiveInteger 1...1 required none
Context:/Quantitative Response Assay/Analysis/Data Selection Schemes/Data Selection Scheme/choice/Range Partial/
10.8.371 StrategyDefines a collection of tests and corresponding margins. Expand the node to add or viewinformation.
Select developed margins or enter margins manually for each test. Please consult the help pageson particular tests for additional information.
Note: Note: You can use development and verification data to evaluate test strategies.
Tip: Tip: Visualize test strategies. Please consult the Visualization section for additionalinformation.
This element has the following attributes:
Data type Multiplicity Usage Default value
T_TestStrategy 0...unbounded optional none
Context:/Equivalence Margin Development for Biological Assays/Test Strategies/
10.8.372 (Externally) studentized residualsProvides a model-based approach to outlier detection. For additional information, see, forexample: Pope, Allen J. 1976. The statistics of residuals and the detection of outliers. Rockville(MD): Geodetic Research and Development Laboratory, National Oceanic and AtmosphericAdministration, United States Department of Commerce.
This element has the following attributes:
Data type Multiplicity Usage Default value
xs:empty 1...1 none
Context:/Quantitative Response Assay/Analysis/Data Selection Schemes/Data Selection Scheme/choice/
10.8.373 SubjectEnter the subject of this comment.
318

Reference Guide | Biological Assay Package Version 26
This element has the following attributes:
Data type Multiplicity Usage Default value
xs:token 0...1 optional none
Context:/Basic Bioassay Protocol/Comment/
/Combination of Independent Assay Results/Comment/
/Control Chart/Comment/
/Dichotomous Assay (Quantal Response Assay)/Comment/
/Equivalence Margin Development for Biological Assays/Comment/
/Quantitative Response Assay/Comment/
/Test System for Quantitative Response Assay/Comment/
10.8.374 AmountEnter the amount of the substance.
This element has the following attributes:
Data type Multiplicity Usage Default value
T_PositiveDouble 1...1 required none
Context:/Basic Bioassay Protocol/choice/Mode: Assay Element/Standard Sample/choice/Absolute Potency: defined by Raw Material/Amount(Summary)/
/Basic Bioassay Protocol/choice/Mode: Assay Element/Test Sample/choice/Absolute Potency: defined by Raw Material/Amount(Summary)/
/Basic Bioassay Protocol/choice/Mode: Assay Element/Control Sample/choice/Absolute Potency: defined by Raw Material/Amount(Summary)/
/Dichotomous Assay (Quantal Response Assay)/Setup/PreparationSchemes/Preparation Scheme/choice/Absolute Potency: definedby Raw Material/Amount (Summary)/
/Quantitative Response Assay/Setup/Preparation Schemes/Preparation Scheme/choice/Absolute Potency: defined by Raw Material/Amount (Summary)/
Data type Multiplicity Usage Default value
xs:string 0...1 optional none
Context:/Dichotomous Assay (Quantal Response Assay)/Documentation/Reagent/
/Quantitative Response Assay/Documentation/Reagent/
319

10.8.375 Substance classEnter the class of the substance such as the drug class.
This element has the following attributes:
Data type Multiplicity Usage Default value
xs:token 0...1 optional none
Context:/Basic Bioassay Protocol/Documentation/
/Basic Bioassay Protocol/choice/Mode: Assay Element/Standard Sample/
/Basic Bioassay Protocol/choice/Mode: Assay Element/Test Sample/
/Basic Bioassay Protocol/choice/Mode: Assay Element/Control Sample/
/Basic Bioassay Protocol/choice/Mode: Assay Element/Control Line/
/Combination of Independent Assay Results/Documentation/
/Combination of Independent Assay Results/Group Information/Group/
/Dichotomous Assay (Quantal Response Assay)/Documentation/
/Dichotomous Assay (Quantal Response Assay)/Setup/Assay Elements/Standard Sample/
/Dichotomous Assay (Quantal Response Assay)/Setup/Assay Elements/Test Sample/
/Dichotomous Assay (Quantal Response Assay)/Setup/Assay Elements/Control Sample/
/Quantitative Response Assay/Documentation/
/Quantitative Response Assay/Setup/Assay Elements/Standard Sample/
/Quantitative Response Assay/Setup/Assay Elements/Test Sample/
/Quantitative Response Assay/Setup/Assay Elements/Control Sample/
/Quantitative Response Assay/Setup/Assay Elements/Control Line/
10.8.376 Substance descriptionEnter a description of the substance.
Tip: Tip: You can enter multiline text.
This element has the following attributes:
Data type Multiplicity Usage Default value
xs:string 0...1 optional none
Context:/Basic Bioassay Protocol/Documentation/
/Basic Bioassay Protocol/choice/Mode: Assay Element/Standard Sample/
/Basic Bioassay Protocol/choice/Mode: Assay Element/Test Sample/
/Basic Bioassay Protocol/choice/Mode: Assay Element/Control Sample/
/Basic Bioassay Protocol/choice/Mode: Assay Element/Control Line/
320
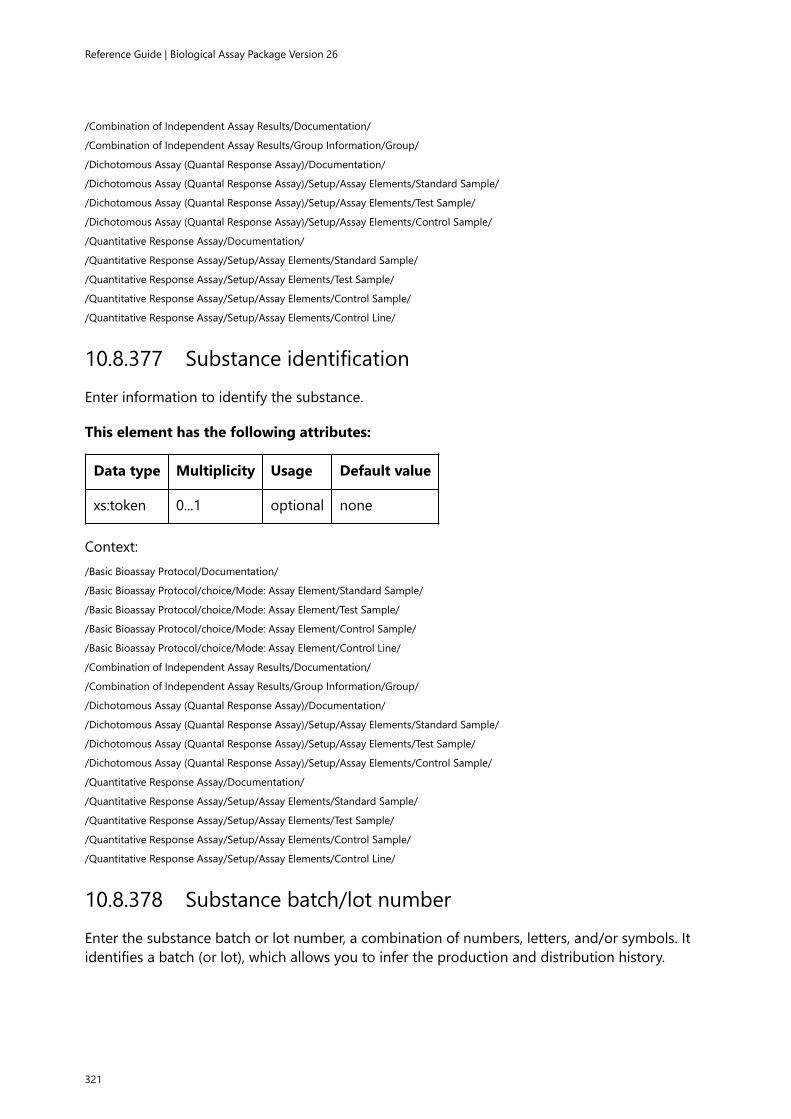
Reference Guide | Biological Assay Package Version 26
/Combination of Independent Assay Results/Documentation/
/Combination of Independent Assay Results/Group Information/Group/
/Dichotomous Assay (Quantal Response Assay)/Documentation/
/Dichotomous Assay (Quantal Response Assay)/Setup/Assay Elements/Standard Sample/
/Dichotomous Assay (Quantal Response Assay)/Setup/Assay Elements/Test Sample/
/Dichotomous Assay (Quantal Response Assay)/Setup/Assay Elements/Control Sample/
/Quantitative Response Assay/Documentation/
/Quantitative Response Assay/Setup/Assay Elements/Standard Sample/
/Quantitative Response Assay/Setup/Assay Elements/Test Sample/
/Quantitative Response Assay/Setup/Assay Elements/Control Sample/
/Quantitative Response Assay/Setup/Assay Elements/Control Line/
10.8.377 Substance identificationEnter information to identify the substance.
This element has the following attributes:
Data type Multiplicity Usage Default value
xs:token 0...1 optional none
Context:/Basic Bioassay Protocol/Documentation/
/Basic Bioassay Protocol/choice/Mode: Assay Element/Standard Sample/
/Basic Bioassay Protocol/choice/Mode: Assay Element/Test Sample/
/Basic Bioassay Protocol/choice/Mode: Assay Element/Control Sample/
/Basic Bioassay Protocol/choice/Mode: Assay Element/Control Line/
/Combination of Independent Assay Results/Documentation/
/Combination of Independent Assay Results/Group Information/Group/
/Dichotomous Assay (Quantal Response Assay)/Documentation/
/Dichotomous Assay (Quantal Response Assay)/Setup/Assay Elements/Standard Sample/
/Dichotomous Assay (Quantal Response Assay)/Setup/Assay Elements/Test Sample/
/Dichotomous Assay (Quantal Response Assay)/Setup/Assay Elements/Control Sample/
/Quantitative Response Assay/Documentation/
/Quantitative Response Assay/Setup/Assay Elements/Standard Sample/
/Quantitative Response Assay/Setup/Assay Elements/Test Sample/
/Quantitative Response Assay/Setup/Assay Elements/Control Sample/
/Quantitative Response Assay/Setup/Assay Elements/Control Line/
10.8.378 Substance batch/lot numberEnter the substance batch or lot number, a combination of numbers, letters, and/or symbols. Itidentifies a batch (or lot), which allows you to infer the production and distribution history.
321

This element has the following attributes:
Data type Multiplicity Usage Default value
xs:token 0...1 optional none
Context:/Basic Bioassay Protocol/Documentation/
/Basic Bioassay Protocol/choice/Mode: Assay Element/Standard Sample/
/Basic Bioassay Protocol/choice/Mode: Assay Element/Test Sample/
/Basic Bioassay Protocol/choice/Mode: Assay Element/Control Sample/
/Basic Bioassay Protocol/choice/Mode: Assay Element/Control Line/
/Combination of Independent Assay Results/Documentation/
/Combination of Independent Assay Results/Group Information/Group/
/Dichotomous Assay (Quantal Response Assay)/Documentation/
/Dichotomous Assay (Quantal Response Assay)/Setup/Assay Elements/Standard Sample/
/Dichotomous Assay (Quantal Response Assay)/Setup/Assay Elements/Test Sample/
/Dichotomous Assay (Quantal Response Assay)/Setup/Assay Elements/Control Sample/
/Quantitative Response Assay/Documentation/
/Quantitative Response Assay/Setup/Assay Elements/Standard Sample/
/Quantitative Response Assay/Setup/Assay Elements/Test Sample/
/Quantitative Response Assay/Setup/Assay Elements/Control Sample/
/Quantitative Response Assay/Setup/Assay Elements/Control Line/
10.8.379 Substance nameEnter a name for the substance.
Tip: Tip: You can enter a reference to a substance document instead. Select the Substancereference option from the drop-down list.
This element has the following attributes:
Data type Multiplicity Usage Default value
xs:token 0...1 required none
Context:/Basic Bioassay Protocol/Documentation/choice/
/Basic Bioassay Protocol/choice/Mode: Assay Element/Standard Sample/choice/
/Basic Bioassay Protocol/choice/Mode: Assay Element/Test Sample/choice/
/Basic Bioassay Protocol/choice/Mode: Assay Element/Control Sample/choice/
/Basic Bioassay Protocol/choice/Mode: Assay Element/Control Line/choice/
/Combination of Independent Assay Results/Documentation/choice/
/Combination of Independent Assay Results/Group Information/Group/choice/
/Dichotomous Assay (Quantal Response Assay)/Documentation/choice/
/Dichotomous Assay (Quantal Response Assay)/Setup/Assay Elements/Standard Sample/choice/
322

Reference Guide | Biological Assay Package Version 26
/Dichotomous Assay (Quantal Response Assay)/Setup/Assay Elements/Test Sample/choice/
/Dichotomous Assay (Quantal Response Assay)/Setup/Assay Elements/Control Sample/choice/
/Quantitative Response Assay/Documentation/choice/
/Quantitative Response Assay/Setup/Assay Elements/Standard Sample/choice/
/Quantitative Response Assay/Setup/Assay Elements/Test Sample/choice/
/Quantitative Response Assay/Setup/Assay Elements/Control Sample/choice/
/Quantitative Response Assay/Setup/Assay Elements/Control Line/choice/
10.8.380 Substance referenceSelect a substance document.
Tip: Tip: You can enter a substance name instead. Select the Substance name option fromthe drop-down list.
This element has the following attributes:
Data type Multiplicity Usage Default value
DocumentReference.Substance 0...1 required none
Context:/Basic Bioassay Protocol/Documentation/choice/
/Basic Bioassay Protocol/choice/Mode: Assay Element/Standard Sample/choice/
/Basic Bioassay Protocol/choice/Mode: Assay Element/Test Sample/choice/
/Basic Bioassay Protocol/choice/Mode: Assay Element/Control Sample/choice/
/Basic Bioassay Protocol/choice/Mode: Assay Element/Control Line/choice/
/Combination of Independent Assay Results/Documentation/choice/
/Combination of Independent Assay Results/Group Information/Group/choice/
/Dichotomous Assay (Quantal Response Assay)/Documentation/choice/
/Dichotomous Assay (Quantal Response Assay)/Setup/Assay Elements/Standard Sample/choice/
/Dichotomous Assay (Quantal Response Assay)/Setup/Assay Elements/Test Sample/choice/
/Dichotomous Assay (Quantal Response Assay)/Setup/Assay Elements/Control Sample/choice/
/Quantitative Response Assay/Documentation/choice/
/Quantitative Response Assay/Setup/Assay Elements/Standard Sample/choice/
/Quantitative Response Assay/Setup/Assay Elements/Test Sample/choice/
/Quantitative Response Assay/Setup/Assay Elements/Control Sample/choice/
/Quantitative Response Assay/Setup/Assay Elements/Control Line/choice/
10.8.381 Substance sub-batch/sub-lot numberEnter the substance sub-batch or sub-lot number, a combination of numbers, letters, and/orsymbols. It identifies a sub-batch (or sub-lot), which allows you to infer the production anddistribution history.
323

This element has the following attributes:
Data type Multiplicity Usage Default value
xs:token 0...1 optional none
Context:/Basic Bioassay Protocol/Documentation/
/Basic Bioassay Protocol/choice/Mode: Assay Element/Standard Sample/
/Basic Bioassay Protocol/choice/Mode: Assay Element/Test Sample/
/Basic Bioassay Protocol/choice/Mode: Assay Element/Control Sample/
/Basic Bioassay Protocol/choice/Mode: Assay Element/Control Line/
/Combination of Independent Assay Results/Documentation/
/Combination of Independent Assay Results/Group Information/Group/
/Dichotomous Assay (Quantal Response Assay)/Documentation/
/Dichotomous Assay (Quantal Response Assay)/Setup/Assay Elements/Standard Sample/
/Dichotomous Assay (Quantal Response Assay)/Setup/Assay Elements/Test Sample/
/Dichotomous Assay (Quantal Response Assay)/Setup/Assay Elements/Control Sample/
/Quantitative Response Assay/Documentation/
/Quantitative Response Assay/Setup/Assay Elements/Standard Sample/
/Quantitative Response Assay/Setup/Assay Elements/Test Sample/
/Quantitative Response Assay/Setup/Assay Elements/Control Sample/
/Quantitative Response Assay/Setup/Assay Elements/Control Line/
10.8.382 Substance variantEnter the variant of the substance.
This element has the following attributes:
Data type Multiplicity Usage Default value
xs:token 0...1 optional none
Context:/Basic Bioassay Protocol/Documentation/
/Basic Bioassay Protocol/choice/Mode: Assay Element/Standard Sample/
/Basic Bioassay Protocol/choice/Mode: Assay Element/Test Sample/
/Basic Bioassay Protocol/choice/Mode: Assay Element/Control Sample/
/Basic Bioassay Protocol/choice/Mode: Assay Element/Control Line/
/Combination of Independent Assay Results/Documentation/
/Combination of Independent Assay Results/Group Information/Group/
/Dichotomous Assay (Quantal Response Assay)/Documentation/
/Dichotomous Assay (Quantal Response Assay)/Setup/Assay Elements/Standard Sample/
/Dichotomous Assay (Quantal Response Assay)/Setup/Assay Elements/Test Sample/
/Dichotomous Assay (Quantal Response Assay)/Setup/Assay Elements/Control Sample/
324

Reference Guide | Biological Assay Package Version 26
/Quantitative Response Assay/Documentation/
/Quantitative Response Assay/Setup/Assay Elements/Standard Sample/
/Quantitative Response Assay/Setup/Assay Elements/Test Sample/
/Quantitative Response Assay/Setup/Assay Elements/Control Sample/
/Quantitative Response Assay/Setup/Assay Elements/Control Line/
10.8.383 Suitability testsThis section allows you to define the statistical tests you require for this assay document. Thetests are organized into the following categories: Assay suitability tests, Sample suitability tests,and Document suitability tests.
Expand the node to add or view information.
Note: Note: Suitability tests are required to prove the validity of your assay runs.
This element has the following attributes:
Data type Multiplicity Usage Default value
xs:empty 1...1 required none
Context:/Dichotomous Assay (Quantal Response Assay)/Analysis/
/Quantitative Response Assay/Analysis/
/Test System for Quantitative Response Assay/
10.8.384 Technical-outlier flag (factor)Displays flags to mark technical outliers.
This element has the following attributes:
Data type Multiplicity Usage Default value
ds:T_TechnicalOutlierColumn 1...1 required none
Context:/Dichotomous Assay (Quantal Response Assay)/Setup/Observation Data/
/Quantitative Response Assay/Setup/Observation Data/
10.8.385 TemplatesThis section allows you to specify the templates you need to generate assay replicates andcombination calculations.
325

This element has the following attributes:
Data type Multiplicity Usage Default value
xs:empty 1...1 required none
Context:/Basic Bioassay Protocol/
10.8.386 Template keySelect a template to require referenced documents be generated by this template.
This element has the following attributes:
Data type Multiplicity Usage Default value
xs:token 0...1 optional none
Context:/Basic Bioassay Protocol/Reportable Values/Document Reference/
/Combination of Independent Assay Results/Potency Data/Column: Document Reference/
10.8.387 Template keyCurrently, no information available.
This element has the following attributes:
Data type Multiplicity Usage Default value
xs:token 0...1 optional none
Context:
10.8.388 Template selection strategySelect a Template selection strategy from the drop-down list. Once you have generated assayreplicates, these options allow you to generate additional replicates or new versions of existingreplicates.
Note: Note: The Template selection strategy options only apply to protocols in Assayelement mode.
Existing replicates: If you increase the Number of replicates in all or some of your Test or Controlsamples and Generate again, additional replicates are created.
326

Reference Guide | Biological Assay Package Version 26
Existing elements: If you increase the Number of replicates in all or part of your Test or Controlsamples and Generate again, new versions of existing replicates are created.
This element has the following attributes:
Data type Multiplicity Usage Default value
TemplateSelectionStrategy 1...1 required none
Context:/Basic Bioassay Protocol/Templates/Assay Templates/
10.8.389 TermEnter a term to define the value of the related property. If you do not enter a term, only theProperty key itself is used as a filter, not its value. Multiple terms are combined with a logical OR,meaning that one of the specified terms has to match.
Tip: Tip: You can use an asterisk * to truncate the term. For example, enter St* to aggregateStandard samples that are named 'Standard' or 'Std'.
Example: To process Test samples, enter 'Test' as the term. To process Test and Control samples,add a second term with 'Control' as its value.
This element has the following attributes:
Data type Multiplicity Usage Default value
xs:string 1...unbounded optional none
Context:/Combination of Independent Assay Results/Potency Data/Column: Section/Property Filter/
10.8.390 TermCurrently, no information available.
This element has the following attributes:
Data type Multiplicity Usage Default value
xs:string 1...unbounded required none
Context:/Equivalence Margin Development for Biological Assays/Datatable/Column: Assay Element/Property Filter/
327

10.8.391 Tests: Normalized difference of asymptotes
This element has the following attributes:
Data type Multiplicity Usage Default value
L_TestsNormalizedDifferenceOfAsymptotes 0...1 optional none
Context:/Equivalence Margin Development for Biological Assays/Margin Development/
/Equivalence Margin Development for Biological Assays/Test Strategies/Strategy/
10.8.392 TestsAdd the tests you require.
This element has the following attributes:
Data type Multiplicity Usage Default value
T_Tests 1...1 optional none
Context:/Combination of Independent Assay Results/
10.8.393 Test exception handlingSelect how the test system behaves when tests return 'not calculated' (NC) results.
Note: Note: Tests return 'not calculated' (NC) results if they cannot run due to exceptionssuch as division by zero, ANOVA error term is zero, or nonlinear optimizer cannot find a solution(fit) for a model that is required for the test.
The following options are available from the drop-down list:
• strict: Handles NC test results as failed tests.
• informal: Reports NC test results, but otherwise ignores them.
This element has the following attributes:
Data type Multiplicity Usage Default value
T_TestExceptionHandling 1...1 required none
Context:
328
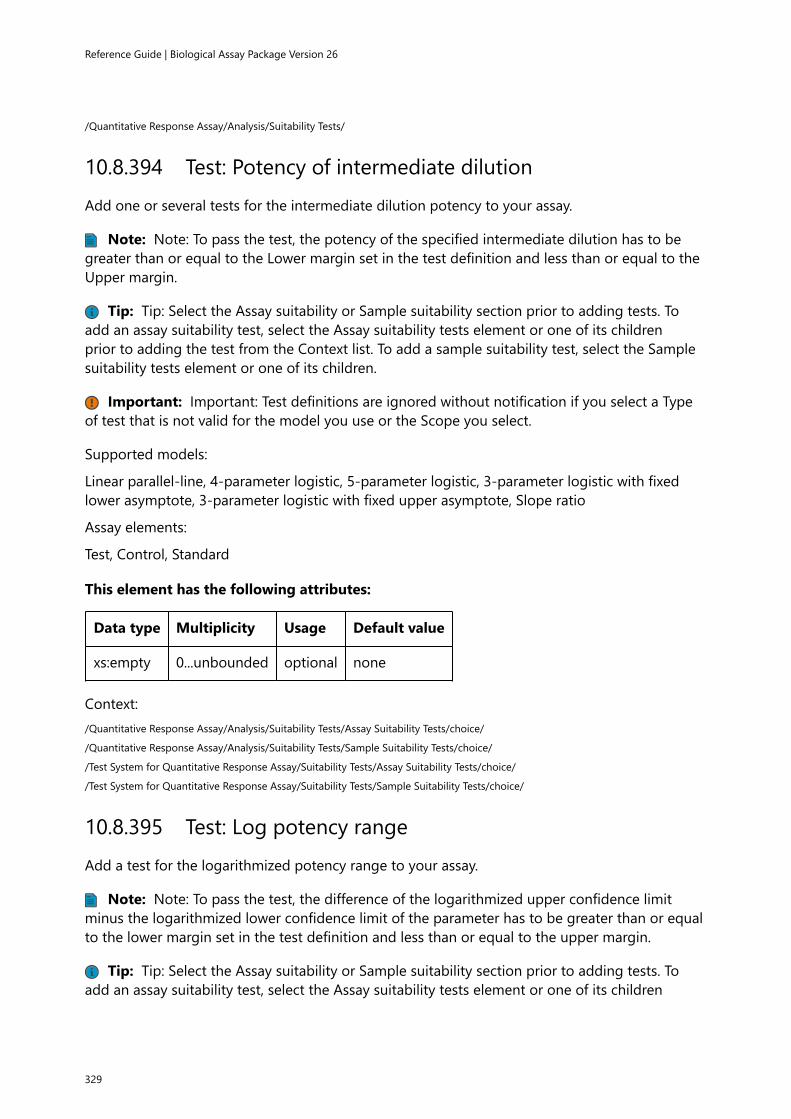
Reference Guide | Biological Assay Package Version 26
/Quantitative Response Assay/Analysis/Suitability Tests/
10.8.394 Test: Potency of intermediate dilutionAdd one or several tests for the intermediate dilution potency to your assay.
Note: Note: To pass the test, the potency of the specified intermediate dilution has to begreater than or equal to the Lower margin set in the test definition and less than or equal to theUpper margin.
Tip: Tip: Select the Assay suitability or Sample suitability section prior to adding tests. Toadd an assay suitability test, select the Assay suitability tests element or one of its childrenprior to adding the test from the Context list. To add a sample suitability test, select the Samplesuitability tests element or one of its children.
Important: Important: Test definitions are ignored without notification if you select a Typeof test that is not valid for the model you use or the Scope you select.
Supported models:
Linear parallel-line, 4-parameter logistic, 5-parameter logistic, 3-parameter logistic with fixedlower asymptote, 3-parameter logistic with fixed upper asymptote, Slope ratio
Assay elements:
Test, Control, Standard
This element has the following attributes:
Data type Multiplicity Usage Default value
xs:empty 0...unbounded optional none
Context:/Quantitative Response Assay/Analysis/Suitability Tests/Assay Suitability Tests/choice/
/Quantitative Response Assay/Analysis/Suitability Tests/Sample Suitability Tests/choice/
/Test System for Quantitative Response Assay/Suitability Tests/Assay Suitability Tests/choice/
/Test System for Quantitative Response Assay/Suitability Tests/Sample Suitability Tests/choice/
10.8.395 Test: Log potency rangeAdd a test for the logarithmized potency range to your assay.
Note: Note: To pass the test, the difference of the logarithmized upper confidence limitminus the logarithmized lower confidence limit of the parameter has to be greater than or equalto the lower margin set in the test definition and less than or equal to the upper margin.
Tip: Tip: Select the Assay suitability or Sample suitability section prior to adding tests. Toadd an assay suitability test, select the Assay suitability tests element or one of its children
329

prior to adding the test from the Context list. To add a sample suitability test, select the Samplesuitability tests element or one of its children.
Important: Important: Test definitions are ignored without notification if you select a Typeof test that is not valid for the model you use or the Scope you select.
After defining the test you have to select the parameter:
• Relative potency
• Absolute potency
Supported models:
4-parameter logistic, 5-parameter logistic
Assay elements:
Test, Control
This element has the following attributes:
Data type Multiplicity Usage Default value
xs:empty 0...unbounded optional none
Context:/Quantitative Response Assay/Analysis/Suitability Tests/Assay Suitability Tests/choice/
/Quantitative Response Assay/Analysis/Suitability Tests/Sample Suitability Tests/choice/
/Test System for Quantitative Response Assay/Suitability Tests/Assay Suitability Tests/choice/
/Test System for Quantitative Response Assay/Suitability Tests/Sample Suitability Tests/choice/
10.8.396 Test on maximal number of failed assaysAdd one or several tests for the number of failed assays. This test allows you to define an Uppermargin for the maximal number of referenced assays that are failed.
This element has the following attributes:
Data type Multiplicity Usage Default value
xs:empty 0...unbounded optional none
Context:/Combination of Independent Assay Results/Tests/
10.8.397 Test: Maximal number of outliersAdd one or several tests for the maximal number of outliers to your assay. The test countstechnical outliers, statistical outliers, and missing values.
330

Reference Guide | Biological Assay Package Version 26
Note: Note: To pass the test, the number of technical and statistical outliers and missingvalues has to be less than or equal to the Upper margin set in the test definition.
Tip: Tip: Use the 'Scope of the test' and 'Extent of the test' settings to select the assayelements for which the maximal number of outliers is to be calculated.
Tip: Tip: Select the Assay suitability or Sample suitability section prior to adding tests. Toadd an assay suitability test, select the Assay suitability tests element or one of its childrenprior to adding the test from the Context list. To add a sample suitability test, select the Samplesuitability tests element or one of its children.
Important: Important: Test definitions are ignored without notification if you select a Typeof test that is not valid for the model you use or the Scope you select.
Supported models:
Linear parallel-line, 4-parameter logistic, 5-parameter logistic, 3-parameter logistic with fixedlower asymptote, 3-parameter logistic with fixed upper asymptote, Slope ratio
Scope of the test:
• Standard only: Runs the test for the Standard sample.
• Test samples only: Runs the test for every Test sample.
• Control samples only: Runs the test for every Control sample.
• Control lines only: Runs the test for every Control line.
• All assay elements: Runs the test for every assay element.
Extent of the test:
• Assay element: Runs the test on the data of individual assay elements. Example: If you set theScope of the test to 'Test samples only', the test is evaluated for each individual Test sample.
• Assay (without simultaneous regression): Runs the test on the data of individual Test-vs-Standard and Control-vs-Standard comparisons. Example: If you set the Scope of the test to'Test samples only', the test is evaluated for each individual Test-vs-Standard comparison. Theobservations of each sample pair are regarded as a dataset for which the number of outliers isdetermined.
• Assay (simultaneous regression): Runs the test on the data of the whole assay. Example: Ifyou set the Scope of the test to 'Test samples only', the test is evaluated for the whole assay.The observations of all samples are regarded as one single dataset for which the number ofoutliers is determined.
• Sequence step: Runs the test on the data of individual sequence steps. To pass the test, thenumber of outliers of each sequence step has to be less than or equal to the Upper margin.Example: If you set the Scope of the test to 'Test samples only', the test is evaluated for eachindividual sequence step of the Test samples.
This element has the following attributes:
Data type Multiplicity Usage Default value
331

xs:empty 0...unbounded optional none
Context:/Quantitative Response Assay/Analysis/Suitability Tests/Assay Suitability Tests/choice/
/Quantitative Response Assay/Analysis/Suitability Tests/Sample Suitability Tests/choice/
/Test System for Quantitative Response Assay/Suitability Tests/Assay Suitability Tests/choice/
/Test System for Quantitative Response Assay/Suitability Tests/Sample Suitability Tests/choice/
10.8.398 Test: Maximal sequence step CV (%)Add one or several tests for the maximal percentual coefficient of variation (CV) of sequencesteps.
Note: Note: To pass the test, all sequence step CVs have to be less than or equal to theUpper margin set in the test definition.
Note: Note: Technical and statistical outliers are excluded from the calculation of the CV. Thetest returns an 'NC' (not calculated) if one or more sequence steps have only one observation.
The percentual CV is calculated as follows:
Supported models:
Linear parallel-line, 4-parameter logistic, 5-parameter logistic, 3-parameter logistic with fixedlower asymptote, 3-parameter logistic with fixed upper asymptote, Slope ratio
Scope of the test:
• Standard only: Runs the test for the Standard sample.
• Test samples only: Runs the test for every Test sample.
• Control samples only: Runs the test for every Control sample.
• Control lines only: Runs the test for every Control line.
• All assay elements: Runs the test for every assay element.
This element has the following attributes:
Data type Multiplicity Usage Default value
xs:empty 0...unbounded optional none
Context:/Quantitative Response Assay/Analysis/Suitability Tests/Assay Suitability Tests/choice/
/Quantitative Response Assay/Analysis/Suitability Tests/Sample Suitability Tests/choice/
/Test System for Quantitative Response Assay/Suitability Tests/Assay Suitability Tests/choice/
/Test System for Quantitative Response Assay/Suitability Tests/Sample Suitability Tests/choice/
332

Reference Guide | Biological Assay Package Version 26
10.8.399 Test: Pure errorUse this test for the following models:
• Linear parallel-line model
• Slope ratio model
• 4-parameter logistic fit
• 4-parameter logistic fit with included blanks
• 5-parameter logistic fit
This element has the following attributes:
Data type Multiplicity Usage Default value
T_SingleTestStrategy 0...1 optional none
Context:/Equivalence Margin Development for Biological Assays/Test Strategies/Strategy/Additional Tests/
/Equivalence Margin Development for Biological Assays/Margin Development/Additional Tests/
10.8.400 Test: Residual errorUse this test for the following models:
• Linear parallel-line model
• Slope ratio model
• 4-parameter logistic fit
• 4-parameter logistic fit with included blanks
• 5-parameter logistic fit
This element has the following attributes:
Data type Multiplicity Usage Default value
T_SingleTestStrategy 0...1 optional none
Context:/Equivalence Margin Development for Biological Assays/Test Strategies/Strategy/Additional Tests/
/Equivalence Margin Development for Biological Assays/Margin Development/Additional Tests/
10.8.401 Test: Weight (W)Add one or several tests for the weight.
333

Note: Note: To pass the test, the potency weight has to be greater than or equal to theLower margin set in the test definition.
Note: Note: The weight is defined in the European Pharmacopoeia 6.0, Chapter 5.3,Equation 6.2.1.-1.
Tip: Tip: Select the Assay suitability or Sample suitability section prior to adding tests. Toadd an assay suitability test, select the Assay suitability tests element or one of its childrenprior to adding the test from the Context list. To add a sample suitability test, select the Samplesuitability tests element or one of its children.
Important: Important: Test definitions are ignored without notification if you select a Typeof test that is not valid for the model you use or the Scope you select.
Supported models:
Linear parallel-line, 4-parameter logistic, 5-parameter logistic, 3-parameter logistic with fixedlower asymptote, 3-parameter logistic with fixed upper asymptote, Slope ratio
Assay elements:
Test, Control
This element has the following attributes:
Data type Multiplicity Usage Default value
xs:empty 0...unbounded optional none
Context:/Quantitative Response Assay/Analysis/Suitability Tests/Assay Suitability Tests/choice/
/Quantitative Response Assay/Analysis/Suitability Tests/Sample Suitability Tests/choice/
/Test System for Quantitative Response Assay/Suitability Tests/Assay Suitability Tests/choice/
/Test System for Quantitative Response Assay/Suitability Tests/Sample Suitability Tests/choice/
10.8.402 Test: Minimal R²Add one or several tests for the minimal R² to your assay.
Note: Note: To pass the test, the R² of the restricted regression fit has to be greater thanor equal to the Lower margin set in the test definition. If a method to calculate the R² value isspecified, this also affects the method used to evaluate this test.
Tip: Tip: Select the Assay suitability or Sample suitability section prior to adding tests. Toadd an assay suitability test, select the Assay suitability tests element or one of its childrenprior to adding the test from the Context list. To add a sample suitability test, select the Samplesuitability tests element or one of its children.
Important: Important: Test definitions are ignored without notification if you select a Typeof test that is not valid for the model you use or the Scope you select.
334

Reference Guide | Biological Assay Package Version 26
Supported models:
All
Assay elements:
Test, Control
This element has the following attributes:
Data type Multiplicity Usage Default value
xs:empty 0...unbounded optional none
Context:/Quantitative Response Assay/Analysis/Suitability Tests/Assay Suitability Tests/choice/
/Quantitative Response Assay/Analysis/Suitability Tests/Sample Suitability Tests/choice/
/Test System for Quantitative Response Assay/Suitability Tests/Assay Suitability Tests/choice/
/Test System for Quantitative Response Assay/Suitability Tests/Sample Suitability Tests/choice/
10.8.403 Test nameEnter a name for the test.
Tip: Tip: Use Test names to reference tests in Conditional evaluations.
This element has the following attributes:
Data type Multiplicity Usage Default value
xs:token 0...1 optional none
Context:/Quantitative Response Assay/Analysis/Suitability Tests/Assay Suitability Tests/choice/F-Test (Hypothesis Test)/
/Quantitative Response Assay/Analysis/Suitability Tests/Assay Suitability Tests/choice/Equivalence Test (Parameter Estimate)/
/Quantitative Response Assay/Analysis/Suitability Tests/Assay Suitability Tests/choice/Equivalence Test (Difference of ParameterEstimates)/
/Quantitative Response Assay/Analysis/Suitability Tests/Assay Suitability Tests/choice/Equivalence Test (Ratio of ParameterEstimates)/
/Quantitative Response Assay/Analysis/Suitability Tests/Assay Suitability Tests/choice/Equivalence Test (Scaled Parameter Range)/
/Quantitative Response Assay/Analysis/Suitability Tests/Assay Suitability Tests/choice/Point estimate tests: Parameter estimate/
/Quantitative Response Assay/Analysis/Suitability Tests/Assay Suitability Tests/choice/Point estimate tests: Difference of parameterestimates/
/Quantitative Response Assay/Analysis/Suitability Tests/Assay Suitability Tests/choice/Point estimate tests: Ratio of parameterestimates/
/Quantitative Response Assay/Analysis/Suitability Tests/Assay Suitability Tests/choice/Test: Normalized difference of asymptotes/
/Quantitative Response Assay/Analysis/Suitability Tests/Assay Suitability Tests/choice/Test: Sum of Squares Regression/
/Quantitative Response Assay/Analysis/Suitability Tests/Assay Suitability Tests/choice/Test: Sum of Squares Non-Parallelism/
/Quantitative Response Assay/Analysis/Suitability Tests/Assay Suitability Tests/choice/Test: Sum of Squares Non-Linearity/
/Quantitative Response Assay/Analysis/Suitability Tests/Assay Suitability Tests/choice/Test: Ratio sum-of-squares non-linearity tosum-of-squares regression/
335

/Quantitative Response Assay/Analysis/Suitability Tests/Assay Suitability Tests/choice/Test: Potency Value/
/Quantitative Response Assay/Analysis/Suitability Tests/Assay Suitability Tests/choice/Test: Potency Confidence Interval/
/Quantitative Response Assay/Analysis/Suitability Tests/Assay Suitability Tests/choice/Test: Log potency range/
/Quantitative Response Assay/Analysis/Suitability Tests/Assay Suitability Tests/choice/Test: Potency of Intermediate Dilution/
/Quantitative Response Assay/Analysis/Suitability Tests/Assay Suitability Tests/choice/Test: Potency Confidence Interval (%)/
/Quantitative Response Assay/Analysis/Suitability Tests/Assay Suitability Tests/choice/Test: Potency Range (%)/
/Quantitative Response Assay/Analysis/Suitability Tests/Assay Suitability Tests/choice/Test: Maximal Number of Outliers/
/Quantitative Response Assay/Analysis/Suitability Tests/Assay Suitability Tests/choice/Test: Maximal Sequence Step CV (%)/
/Quantitative Response Assay/Analysis/Suitability Tests/Assay Suitability Tests/choice/Test: Minimal R²/
/Quantitative Response Assay/Analysis/Suitability Tests/Assay Suitability Tests/choice/Test: Relative LOF Error (%)/
/Quantitative Response Assay/Analysis/Suitability Tests/Assay Suitability Tests/choice/Test: Response Value Range/
/Quantitative Response Assay/Analysis/Suitability Tests/Assay Suitability Tests/choice/Test: Weight W/
/Quantitative Response Assay/Analysis/Suitability Tests/Sample Suitability Tests/choice/F-Test (Hypothesis Test)/
/Quantitative Response Assay/Analysis/Suitability Tests/Sample Suitability Tests/choice/Equivalence Test (Parameter Estimate)/
/Quantitative Response Assay/Analysis/Suitability Tests/Sample Suitability Tests/choice/Equivalence Test (Difference of ParameterEstimates)/
/Quantitative Response Assay/Analysis/Suitability Tests/Sample Suitability Tests/choice/Equivalence Test (Ratio of ParameterEstimates)/
/Quantitative Response Assay/Analysis/Suitability Tests/Sample Suitability Tests/choice/Equivalence Test (Scaled Parameter Range)/
/Quantitative Response Assay/Analysis/Suitability Tests/Sample Suitability Tests/choice/Point estimate tests: Parameter estimate/
/Quantitative Response Assay/Analysis/Suitability Tests/Sample Suitability Tests/choice/Point estimate tests: Difference of parameterestimates/
/Quantitative Response Assay/Analysis/Suitability Tests/Sample Suitability Tests/choice/Point estimate tests: Ratio of parameterestimates/
/Quantitative Response Assay/Analysis/Suitability Tests/Sample Suitability Tests/choice/Test: Normalized difference of asymptotes/
/Quantitative Response Assay/Analysis/Suitability Tests/Sample Suitability Tests/choice/Test: Sum of Squares Regression/
/Quantitative Response Assay/Analysis/Suitability Tests/Sample Suitability Tests/choice/Test: Sum of Squares Non-Parallelism/
/Quantitative Response Assay/Analysis/Suitability Tests/Sample Suitability Tests/choice/Test: Sum of Squares Non-Linearity/
/Quantitative Response Assay/Analysis/Suitability Tests/Sample Suitability Tests/choice/Test: Ratio sum-of-squares non-linearity tosum-of-squares regression/
/Quantitative Response Assay/Analysis/Suitability Tests/Sample Suitability Tests/choice/Test: Potency Value/
/Quantitative Response Assay/Analysis/Suitability Tests/Sample Suitability Tests/choice/Test: Potency Confidence Interval/
/Quantitative Response Assay/Analysis/Suitability Tests/Sample Suitability Tests/choice/Test: Log potency range/
/Quantitative Response Assay/Analysis/Suitability Tests/Sample Suitability Tests/choice/Test: Potency of Intermediate Dilution/
/Quantitative Response Assay/Analysis/Suitability Tests/Sample Suitability Tests/choice/Test: Potency Confidence Interval (%)/
/Quantitative Response Assay/Analysis/Suitability Tests/Sample Suitability Tests/choice/Test: Potency Range (%)/
/Quantitative Response Assay/Analysis/Suitability Tests/Sample Suitability Tests/choice/Test: Maximal Number of Outliers/
/Quantitative Response Assay/Analysis/Suitability Tests/Sample Suitability Tests/choice/Test: Maximal Sequence Step CV (%)/
/Quantitative Response Assay/Analysis/Suitability Tests/Sample Suitability Tests/choice/Test: Minimal R²/
/Quantitative Response Assay/Analysis/Suitability Tests/Sample Suitability Tests/choice/Test: Relative LOF Error (%)/
/Quantitative Response Assay/Analysis/Suitability Tests/Sample Suitability Tests/choice/Test: Response Value Range/
/Quantitative Response Assay/Analysis/Suitability Tests/Sample Suitability Tests/choice/Test: Weight W/
/Test System for Quantitative Response Assay/Suitability Tests/Assay Suitability Tests/choice/F-Test (Hypothesis Test)/
/Test System for Quantitative Response Assay/Suitability Tests/Assay Suitability Tests/choice/Equivalence Test (Parameter Estimate)/
/Test System for Quantitative Response Assay/Suitability Tests/Assay Suitability Tests/choice/Equivalence Test (Difference ofParameter Estimates)/
/Test System for Quantitative Response Assay/Suitability Tests/Assay Suitability Tests/choice/Equivalence Test (Ratio of ParameterEstimates)/
/Test System for Quantitative Response Assay/Suitability Tests/Assay Suitability Tests/choice/Equivalence Test (Scaled ParameterRange)/
336

Reference Guide | Biological Assay Package Version 26
/Test System for Quantitative Response Assay/Suitability Tests/Assay Suitability Tests/choice/Point estimate tests: Parameter estimate/
/Test System for Quantitative Response Assay/Suitability Tests/Assay Suitability Tests/choice/Point estimate tests: Difference ofparameter estimates/
/Test System for Quantitative Response Assay/Suitability Tests/Assay Suitability Tests/choice/Point estimate tests: Ratio of parameterestimates/
/Test System for Quantitative Response Assay/Suitability Tests/Assay Suitability Tests/choice/Test: Normalized difference ofasymptotes/
/Test System for Quantitative Response Assay/Suitability Tests/Assay Suitability Tests/choice/Test: Sum of Squares Regression/
/Test System for Quantitative Response Assay/Suitability Tests/Assay Suitability Tests/choice/Test: Sum of Squares Non-Parallelism/
/Test System for Quantitative Response Assay/Suitability Tests/Assay Suitability Tests/choice/Test: Sum of Squares Non-Linearity/
/Test System for Quantitative Response Assay/Suitability Tests/Assay Suitability Tests/choice/Test: Ratio sum-of-squares non-linearityto sum-of-squares regression/
/Test System for Quantitative Response Assay/Suitability Tests/Assay Suitability Tests/choice/Test: Potency Value/
/Test System for Quantitative Response Assay/Suitability Tests/Assay Suitability Tests/choice/Test: Potency Confidence Interval/
/Test System for Quantitative Response Assay/Suitability Tests/Assay Suitability Tests/choice/Test: Log potency range/
/Test System for Quantitative Response Assay/Suitability Tests/Assay Suitability Tests/choice/Test: Potency of Intermediate Dilution/
/Test System for Quantitative Response Assay/Suitability Tests/Assay Suitability Tests/choice/Test: Potency Confidence Interval (%)/
/Test System for Quantitative Response Assay/Suitability Tests/Assay Suitability Tests/choice/Test: Potency Range (%)/
/Test System for Quantitative Response Assay/Suitability Tests/Assay Suitability Tests/choice/Test: Maximal Number of Outliers/
/Test System for Quantitative Response Assay/Suitability Tests/Assay Suitability Tests/choice/Test: Maximal Sequence Step CV (%)/
/Test System for Quantitative Response Assay/Suitability Tests/Assay Suitability Tests/choice/Test: Minimal R²/
/Test System for Quantitative Response Assay/Suitability Tests/Assay Suitability Tests/choice/Test: Relative LOF Error (%)/
/Test System for Quantitative Response Assay/Suitability Tests/Assay Suitability Tests/choice/Test: Response Value Range/
/Test System for Quantitative Response Assay/Suitability Tests/Assay Suitability Tests/choice/Test: Weight W/
/Test System for Quantitative Response Assay/Suitability Tests/Sample Suitability Tests/choice/F-Test (Hypothesis Test)/
/Test System for Quantitative Response Assay/Suitability Tests/Sample Suitability Tests/choice/Equivalence Test (Parameter Estimate)/
/Test System for Quantitative Response Assay/Suitability Tests/Sample Suitability Tests/choice/Equivalence Test (Difference ofParameter Estimates)/
/Test System for Quantitative Response Assay/Suitability Tests/Sample Suitability Tests/choice/Equivalence Test (Ratio of ParameterEstimates)/
/Test System for Quantitative Response Assay/Suitability Tests/Sample Suitability Tests/choice/Equivalence Test (Scaled ParameterRange)/
/Test System for Quantitative Response Assay/Suitability Tests/Sample Suitability Tests/choice/Point estimate tests: Parameterestimate/
/Test System for Quantitative Response Assay/Suitability Tests/Sample Suitability Tests/choice/Point estimate tests: Difference ofparameter estimates/
/Test System for Quantitative Response Assay/Suitability Tests/Sample Suitability Tests/choice/Point estimate tests: Ratio ofparameter estimates/
/Test System for Quantitative Response Assay/Suitability Tests/Sample Suitability Tests/choice/Test: Normalized difference ofasymptotes/
/Test System for Quantitative Response Assay/Suitability Tests/Sample Suitability Tests/choice/Test: Sum of Squares Regression/
/Test System for Quantitative Response Assay/Suitability Tests/Sample Suitability Tests/choice/Test: Sum of Squares Non-Parallelism/
/Test System for Quantitative Response Assay/Suitability Tests/Sample Suitability Tests/choice/Test: Sum of Squares Non-Linearity/
/Test System for Quantitative Response Assay/Suitability Tests/Sample Suitability Tests/choice/Test: Ratio sum-of-squares non-linearity to sum-of-squares regression/
/Test System for Quantitative Response Assay/Suitability Tests/Sample Suitability Tests/choice/Test: Potency Value/
/Test System for Quantitative Response Assay/Suitability Tests/Sample Suitability Tests/choice/Test: Potency Confidence Interval/
/Test System for Quantitative Response Assay/Suitability Tests/Sample Suitability Tests/choice/Test: Log potency range/
/Test System for Quantitative Response Assay/Suitability Tests/Sample Suitability Tests/choice/Test: Potency of Intermediate Dilution/
/Test System for Quantitative Response Assay/Suitability Tests/Sample Suitability Tests/choice/Test: Potency Confidence Interval (%)/
/Test System for Quantitative Response Assay/Suitability Tests/Sample Suitability Tests/choice/Test: Potency Range (%)/
337

/Test System for Quantitative Response Assay/Suitability Tests/Sample Suitability Tests/choice/Test: Maximal Number of Outliers/
/Test System for Quantitative Response Assay/Suitability Tests/Sample Suitability Tests/choice/Test: Maximal Sequence Step CV (%)/
/Test System for Quantitative Response Assay/Suitability Tests/Sample Suitability Tests/choice/Test: Minimal R²/
/Test System for Quantitative Response Assay/Suitability Tests/Sample Suitability Tests/choice/Test: Relative LOF Error (%)/
/Test System for Quantitative Response Assay/Suitability Tests/Sample Suitability Tests/choice/Test: Response Value Range/
/Test System for Quantitative Response Assay/Suitability Tests/Sample Suitability Tests/choice/Test: Weight W/
10.8.404 Test: Normalized difference of asymptotesAdd a test for the normalized difference of asymptotes to your assay.
Note: Note: To pass the test, the following ratio has to be greater than the lower and lessthan the upper margin, respectively: (selected asymptote (test/control) - selected asymptote(standard)) / (upper asymptote (test/control) - lower asymptote (test/control))
Tip: Tip: Select the Assay suitability or Sample suitability section prior to adding tests. Toadd an assay suitability test, select the Assay suitability tests element or one of its childrenprior to adding the test from the Context list. To add a sample suitability test, select the Samplesuitability tests element or one of its children.
Important: Important: Test definitions are ignored without notification if you select a Typeof test that is not valid for the model you use or the Scope you select.
After defining the test you have to select the parameter:
• Normalized A upper asymptote
• Normalized D lower asymptote
Scope of the test:
• Standard only: Runs the test for the Standard sample.
• Test samples only: Runs the test for every Test sample.
• Control samples only: Runs the test for every Control sample.
• Control lines only: No test is run.
• All assay elements: Runs the test for every assay element except Control lines.
This element has the following attributes:
Data type Multiplicity Usage Default value
xs:empty 0...unbounded optional none
Context:/Quantitative Response Assay/Analysis/Suitability Tests/Assay Suitability Tests/choice/
/Quantitative Response Assay/Analysis/Suitability Tests/Sample Suitability Tests/choice/
/Test System for Quantitative Response Assay/Suitability Tests/Assay Suitability Tests/choice/
/Test System for Quantitative Response Assay/Suitability Tests/Sample Suitability Tests/choice/
338

Reference Guide | Biological Assay Package Version 26
10.8.405 Test: Normalized difference of Lower asymptotesUse this test for the following models:
• 4-parameter logistic fit
• 4-parameter logistic fit with included blanks
• 5-parameter logistic fit
This element has the following attributes:
Data type Multiplicity Usage Default value
T_SingleTestStrategy 0...1 optional none
Context:/Equivalence Margin Development for Biological Assays/Test Strategies/Strategy/Tests: Normalized difference of asymptotes/
/Equivalence Margin Development for Biological Assays/Margin Development/Tests: Normalized difference of asymptotes/
10.8.406 Test: Normalized difference of Upper asymptotesUse this test for the following models:
• 4-parameter logistic fit
• 4-parameter logistic fit with included blanks
• 5-parameter logistic fit
This element has the following attributes:
Data type Multiplicity Usage Default value
T_SingleTestStrategy 0...1 optional none
Context:/Equivalence Margin Development for Biological Assays/Test Strategies/Strategy/Tests: Normalized difference of asymptotes/
/Equivalence Margin Development for Biological Assays/Margin Development/Tests: Normalized difference of asymptotes/
10.8.407 Test on (log) potency confidence interval lengthAdd one or several tests for the logarithmic potency confidence interval. Usually, this test checksthe length of the combined logarithmic relative potency/absolute potency confidence interval.With slope ratio models, this test checks the relative potency/ potency confidence intervalinstead of the logarithmic relative potency/potency confidence interval. Expand the node to addor view information.
339

This element has the following attributes:
Data type Multiplicity Usage Default value
xs:empty 0...unbounded optional none
Context:/Combination of Independent Assay Results/Tests/
10.8.408 Test on (log) potency rangeAdd one or several tests for the potency logarithmic range. Usually, this test checks the range ofthe logarithmic relative/absolute potency values that are used in the combination calculation.With slope ratio models, this test checks the relative potency/potency values instead of thelogarithmic relative potency/potency values. Expand the node to add or view information.
This element has the following attributes:
Data type Multiplicity Usage Default value
xs:empty 0...unbounded optional none
Context:/Combination of Independent Assay Results/Tests/
10.8.409 Test on potency confidence intervalAdd one or several tests for the potency confidence interval. Expand the node to add or viewinformation.
This element has the following attributes:
Data type Multiplicity Usage Default value
xs:empty 0...unbounded optional none
Context:/Combination of Independent Assay Results/Tests/
10.8.410 Test on mean of CV (%)Add one or several tests for the mean percentual coefficient of variation (CV). This test allowsyou to define Upper and Lower margins for the arithmetic mean of the percentual CV values.The percentual CV values are derived from the absolute or relative potency confidence intervals
340

Reference Guide | Biological Assay Package Version 26
which are used as input values of the combination calculation. Expand the node to add or viewinformation.
This element has the following attributes:
Data type Multiplicity Usage Default value
xs:empty 0...unbounded optional none
Context:/Combination of Independent Assay Results/Tests/
10.8.411 Test on number of valid assaysAdd one or several tests for the number of valid assays. This test allows you to define Upper andLower margins for the number of valid assays, that is, assays with the status 'Passed' or 'Passed(info available)'. Expand the node to add or view information.
This element has the following attributes:
Data type Multiplicity Usage Default value
xs:empty 0...unbounded optional none
Context:/Combination of Independent Assay Results/Tests/
10.8.412 Test on potency coefficient of variation (%)Add one or several tests for the percentual relative/absolute potency coefficient variation.Expand the node to add or view information.
This element has the following attributes:
Data type Multiplicity Usage Default value
xs:empty 0...unbounded optional none
Context:/Combination of Independent Assay Results/Tests/
10.8.413 Test on potency confidence interval (%)Add one or several tests for the percentual potency confidence interval. This test allows youto define Upper and Lower margins for the percentual potency confidence interval, that is, the
341

confidence interval relative to the absolute or relative potency value, expressed as a percentalvalue. Expand the node to add or view information.
This element has the following attributes:
Data type Multiplicity Usage Default value
xs:empty 0...unbounded optional none
Context:/Combination of Independent Assay Results/Tests/
10.8.414 Test on potency range (%)Add one or several tests for the percentual relative/absolute potency range. Expand the node toadd or view information.
This element has the following attributes:
Data type Multiplicity Usage Default value
xs:empty 0...unbounded optional none
Context:/Combination of Independent Assay Results/Tests/
10.8.415 Test on sum of weightsAdd one or several tests for the sum of weights. This test allows you to define Upper and Lowermargins for the sum of weights.
Note: Note: In this context, weight refers to the homogeneous weights, not the correctedweights that are used for heterogeneous weighting.
Expand the node to add or view information.
This element has the following attributes:
Data type Multiplicity Usage Default value
xs:empty 0...unbounded optional none
Context:/Combination of Independent Assay Results/Tests/
342

Reference Guide | Biological Assay Package Version 26
10.8.416 Test on user variableAdd one or several tests for a user variable.
Note: Note: If you enter the Key of a User variable in the test definition, but no Value, thetest only checks whether the Key exists. To have the test check the Value of the User variable, youmust also enter the Value in the test definition.
This element has the following attributes:
Data type Multiplicity Usage Default value
xs:empty 0...unbounded optional none
Context:/Dichotomous Assay (Quantal Response Assay)/Analysis/Suitability Tests/Document Suitability Tests/
/Quantitative Response Assay/Analysis/Suitability Tests/Document Suitability Tests/
/Test System for Quantitative Response Assay/Suitability Tests/Document Suitability Tests/
10.8.417 Test on potency valueAdd one or several tests for the combined relative/absolute potency value. Expand the node toadd or view information.
This element has the following attributes:
Data type Multiplicity Usage Default value
xs:empty 0...unbounded optional none
Context:/Combination of Independent Assay Results/Tests/
10.8.418 ParameterSelect the Parameter to be examined by this test.
Important: Important: Test definitions are ignored without notification if the Parameter youselect results in invalid test definitions (for example, if a test cannot be performed for the modelyou use).
Please consult the help page on the test for additional information.
This element has the following attributes:
Data type Multiplicity Usage Default value
343

T_EquivalenceTestParameter 1...1 required none
Context:/Quantitative Response Assay/Analysis/Suitability Tests/Assay Suitability Tests/choice/Equivalence Test (Parameter Estimate)/
/Quantitative Response Assay/Analysis/Suitability Tests/Sample Suitability Tests/choice/Equivalence Test (Parameter Estimate)/
/Test System for Quantitative Response Assay/Suitability Tests/Assay Suitability Tests/choice/Equivalence Test (Parameter Estimate)/
/Test System for Quantitative Response Assay/Suitability Tests/Sample Suitability Tests/choice/Equivalence Test (Parameter Estimate)/
/Quantitative Response Assay/Analysis/Suitability Tests/Assay Suitability Tests/choice/Equivalence Test (Difference of ParameterEstimates)/
/Quantitative Response Assay/Analysis/Suitability Tests/Sample Suitability Tests/choice/Equivalence Test (Difference of ParameterEstimates)/
/Test System for Quantitative Response Assay/Suitability Tests/Assay Suitability Tests/choice/Equivalence Test (Difference ofParameter Estimates)/
/Test System for Quantitative Response Assay/Suitability Tests/Sample Suitability Tests/choice/Equivalence Test (Difference ofParameter Estimates)/
/Quantitative Response Assay/Analysis/Suitability Tests/Assay Suitability Tests/choice/Equivalence Test (Ratio of ParameterEstimates)/
/Quantitative Response Assay/Analysis/Suitability Tests/Sample Suitability Tests/choice/Equivalence Test (Ratio of ParameterEstimates)/
/Test System for Quantitative Response Assay/Suitability Tests/Assay Suitability Tests/choice/Equivalence Test (Ratio of ParameterEstimates)/
/Test System for Quantitative Response Assay/Suitability Tests/Sample Suitability Tests/choice/Equivalence Test (Ratio of ParameterEstimates)/
/Quantitative Response Assay/Analysis/Suitability Tests/Assay Suitability Tests/choice/Equivalence Test (Scaled Parameter Range)/
/Quantitative Response Assay/Analysis/Suitability Tests/Sample Suitability Tests/choice/Equivalence Test (Scaled Parameter Range)/
/Test System for Quantitative Response Assay/Suitability Tests/Assay Suitability Tests/choice/Equivalence Test (Scaled ParameterRange)/
/Test System for Quantitative Response Assay/Suitability Tests/Sample Suitability Tests/choice/Equivalence Test (Scaled ParameterRange)/
/Quantitative Response Assay/Analysis/Suitability Tests/Assay Suitability Tests/choice/Point estimate tests: Parameter estimate/
/Quantitative Response Assay/Analysis/Suitability Tests/Sample Suitability Tests/choice/Point estimate tests: Parameter estimate/
/Test System for Quantitative Response Assay/Suitability Tests/Assay Suitability Tests/choice/Point estimate tests: Parameter estimate/
/Test System for Quantitative Response Assay/Suitability Tests/Sample Suitability Tests/choice/Point estimate tests: Parameterestimate/
/Quantitative Response Assay/Analysis/Suitability Tests/Assay Suitability Tests/choice/Point estimate tests: Difference of parameterestimates/
/Quantitative Response Assay/Analysis/Suitability Tests/Sample Suitability Tests/choice/Point estimate tests: Difference of parameterestimates/
/Test System for Quantitative Response Assay/Suitability Tests/Assay Suitability Tests/choice/Point estimate tests: Difference ofparameter estimates/
/Test System for Quantitative Response Assay/Suitability Tests/Sample Suitability Tests/choice/Point estimate tests: Difference ofparameter estimates/
/Quantitative Response Assay/Analysis/Suitability Tests/Assay Suitability Tests/choice/Point estimate tests: Ratio of parameterestimates/
/Quantitative Response Assay/Analysis/Suitability Tests/Sample Suitability Tests/choice/Point estimate tests: Ratio of parameterestimates/
/Test System for Quantitative Response Assay/Suitability Tests/Assay Suitability Tests/choice/Point estimate tests: Ratio of parameterestimates/
/Test System for Quantitative Response Assay/Suitability Tests/Sample Suitability Tests/choice/Point estimate tests: Ratio ofparameter estimates/
/Quantitative Response Assay/Analysis/Suitability Tests/Assay Suitability Tests/choice/Test: Normalized difference of asymptotes/
/Quantitative Response Assay/Analysis/Suitability Tests/Sample Suitability Tests/choice/Test: Normalized difference of asymptotes/
344

Reference Guide | Biological Assay Package Version 26
/Test System for Quantitative Response Assay/Suitability Tests/Assay Suitability Tests/choice/Test: Normalized difference ofasymptotes/
/Test System for Quantitative Response Assay/Suitability Tests/Sample Suitability Tests/choice/Test: Normalized difference ofasymptotes/
10.8.419 Test: Relative LOF error (%)Add one or several tests for the relative lack-of-fit error to your assay.
Note: Note: To pass the test, the relative lack-of-fit error has to be less than or equal to theUpper margin set in the test definition.
Tip: Tip: Select the Assay suitability or Sample suitability section prior to adding tests. Toadd an assay suitability test, select the Assay suitability tests element or one of its childrenprior to adding the test from the Context list. To add a sample suitability test, select the Samplesuitability tests element or one of its children.
Important: Important: Test definitions are ignored without notification if you select a Typeof test that is not valid for the model you use or the Scope you select.
The relative lack-of-fit error is calculated as follows:
where: S is the sum-of-squares lack of fit from the ANOVA table, n is the total number ofobservations, a is the upper asymptote, and d is the lower asymptote.
Supported models:
4-parameter logistic
Assay elements:
Test, Control
This element has the following attributes:
Data type Multiplicity Usage Default value
xs:empty 0...unbounded optional none
Context:/Quantitative Response Assay/Analysis/Suitability Tests/Assay Suitability Tests/choice/
/Quantitative Response Assay/Analysis/Suitability Tests/Sample Suitability Tests/choice/
/Test System for Quantitative Response Assay/Suitability Tests/Assay Suitability Tests/choice/
/Test System for Quantitative Response Assay/Suitability Tests/Sample Suitability Tests/choice/
10.8.420 Test: Potency confidence interval (%)Add one or several tests for the percentual potency confidence interval to your assay.
345

Note: Note: To pass the test, the lower confidence limit of the percentual relative potencyhas to be greater than or equal to the Lower margin set in the test definition, and the upperconfidence limit of the percentual potency has to be less than or equal to the Upper margin.
Tip: Tip: Select the Assay suitability or Sample suitability section prior to adding tests. Toadd an assay suitability test, select the Assay suitability tests element or one of its childrenprior to adding the test from the Context list. To add a sample suitability test, select the Samplesuitability tests element or one of its children.
Important: Important: Test definitions are ignored without notification if you select a Typeof test that is not valid for the model you use or the Scope you select.
Supported models:
Linear parallel-line, 4-parameter logistic, 5-parameter logistic, 3-parameter logistic with fixedlower asymptote, 3-parameter logistic with fixed upper asymptote, Slope ratio
Assay elements:
Standard, Test, Control
This element has the following attributes:
Data type Multiplicity Usage Default value
xs:empty 0...unbounded optional none
Context:/Quantitative Response Assay/Analysis/Suitability Tests/Assay Suitability Tests/choice/
/Quantitative Response Assay/Analysis/Suitability Tests/Sample Suitability Tests/choice/
/Test System for Quantitative Response Assay/Suitability Tests/Assay Suitability Tests/choice/
/Test System for Quantitative Response Assay/Suitability Tests/Sample Suitability Tests/choice/
10.8.421 Test: Ratio of sum-of-squares non-linearity to sum-of-squares regressionUse this test for the following models:
• Linear parallel-line model
• Slope ratio model
• 4-parameter logistic fit
• 4-parameter logistic fit with included blanks
• 5-parameter logistic fit
This element has the following attributes:
Data type Multiplicity Usage Default value
346

Reference Guide | Biological Assay Package Version 26
T_SingleTestStrategy 0...1 optional none
Context:/Equivalence Margin Development for Biological Assays/Test Strategies/Strategy/Additional Tests/
/Equivalence Margin Development for Biological Assays/Margin Development/Additional Tests/
Data type Multiplicity Usage Default value
xs:empty 0...unbounded optional none
Context:/Quantitative Response Assay/Analysis/Suitability Tests/Assay Suitability Tests/choice/
/Quantitative Response Assay/Analysis/Suitability Tests/Sample Suitability Tests/choice/
/Test System for Quantitative Response Assay/Suitability Tests/Assay Suitability Tests/choice/
/Test System for Quantitative Response Assay/Suitability Tests/Sample Suitability Tests/choice/
10.8.422 Test referenceSelect the test whose results are to determine whether this test is to be executed.
Note: Note: We recommend to set the Severity level of the referenced test to 'Information'.
This element has the following attributes:
Data type Multiplicity Usage Default value
xs:string 1...1 optional none
Context:/Quantitative Response Assay/Analysis/Suitability Tests/Assay Suitability Tests/choice/F-Test (Hypothesis Test)/ConditionalEvaluation/
/Quantitative Response Assay/Analysis/Suitability Tests/Assay Suitability Tests/choice/Equivalence Test (Parameter Estimate)/Conditional Evaluation/
/Quantitative Response Assay/Analysis/Suitability Tests/Assay Suitability Tests/choice/Equivalence Test (Difference of ParameterEstimates)/Conditional Evaluation/
/Quantitative Response Assay/Analysis/Suitability Tests/Assay Suitability Tests/choice/Equivalence Test (Ratio of ParameterEstimates)/Conditional Evaluation/
/Quantitative Response Assay/Analysis/Suitability Tests/Assay Suitability Tests/choice/Equivalence Test (Scaled Parameter Range)/Conditional Evaluation/
/Quantitative Response Assay/Analysis/Suitability Tests/Assay Suitability Tests/choice/Point estimate tests: Parameter estimate/Conditional Evaluation/
/Quantitative Response Assay/Analysis/Suitability Tests/Assay Suitability Tests/choice/Point estimate tests: Difference of parameterestimates/Conditional Evaluation/
/Quantitative Response Assay/Analysis/Suitability Tests/Assay Suitability Tests/choice/Point estimate tests: Ratio of parameterestimates/Conditional Evaluation/
/Quantitative Response Assay/Analysis/Suitability Tests/Assay Suitability Tests/choice/Test: Normalized difference of asymptotes/Conditional Evaluation/
/Quantitative Response Assay/Analysis/Suitability Tests/Assay Suitability Tests/choice/Test: Sum of Squares Regression/ConditionalEvaluation/
347

/Quantitative Response Assay/Analysis/Suitability Tests/Assay Suitability Tests/choice/Test: Sum of Squares Non-Parallelism/Conditional Evaluation/
/Quantitative Response Assay/Analysis/Suitability Tests/Assay Suitability Tests/choice/Test: Sum of Squares Non-Linearity/ConditionalEvaluation/
/Quantitative Response Assay/Analysis/Suitability Tests/Assay Suitability Tests/choice/Test: Ratio sum-of-squares non-linearity tosum-of-squares regression/Conditional Evaluation/
/Quantitative Response Assay/Analysis/Suitability Tests/Assay Suitability Tests/choice/Test: Potency Value/Conditional Evaluation/
/Quantitative Response Assay/Analysis/Suitability Tests/Assay Suitability Tests/choice/Test: Potency Confidence Interval/ConditionalEvaluation/
/Quantitative Response Assay/Analysis/Suitability Tests/Assay Suitability Tests/choice/Test: Log potency range/ConditionalEvaluation/
/Quantitative Response Assay/Analysis/Suitability Tests/Assay Suitability Tests/choice/Test: Potency of Intermediate Dilution/Conditional Evaluation/
/Quantitative Response Assay/Analysis/Suitability Tests/Assay Suitability Tests/choice/Test: Potency Confidence Interval (%)/Conditional Evaluation/
/Quantitative Response Assay/Analysis/Suitability Tests/Assay Suitability Tests/choice/Test: Potency Range (%)/ConditionalEvaluation/
/Quantitative Response Assay/Analysis/Suitability Tests/Assay Suitability Tests/choice/Test: Maximal Number of Outliers/ConditionalEvaluation/
/Quantitative Response Assay/Analysis/Suitability Tests/Assay Suitability Tests/choice/Test: Maximal Sequence Step CV (%)/Conditional Evaluation/
/Quantitative Response Assay/Analysis/Suitability Tests/Assay Suitability Tests/choice/Test: Minimal R²/Conditional Evaluation/
/Quantitative Response Assay/Analysis/Suitability Tests/Assay Suitability Tests/choice/Test: Relative LOF Error (%)/ConditionalEvaluation/
/Quantitative Response Assay/Analysis/Suitability Tests/Assay Suitability Tests/choice/Test: Response Value Range/ConditionalEvaluation/
/Quantitative Response Assay/Analysis/Suitability Tests/Assay Suitability Tests/choice/Test: Weight W/Conditional Evaluation/
/Quantitative Response Assay/Analysis/Suitability Tests/Sample Suitability Tests/choice/F-Test (Hypothesis Test)/ConditionalEvaluation/
/Quantitative Response Assay/Analysis/Suitability Tests/Sample Suitability Tests/choice/Equivalence Test (Parameter Estimate)/Conditional Evaluation/
/Quantitative Response Assay/Analysis/Suitability Tests/Sample Suitability Tests/choice/Equivalence Test (Difference of ParameterEstimates)/Conditional Evaluation/
/Quantitative Response Assay/Analysis/Suitability Tests/Sample Suitability Tests/choice/Equivalence Test (Ratio of ParameterEstimates)/Conditional Evaluation/
/Quantitative Response Assay/Analysis/Suitability Tests/Sample Suitability Tests/choice/Equivalence Test (Scaled Parameter Range)/Conditional Evaluation/
/Quantitative Response Assay/Analysis/Suitability Tests/Sample Suitability Tests/choice/Point estimate tests: Parameter estimate/Conditional Evaluation/
/Quantitative Response Assay/Analysis/Suitability Tests/Sample Suitability Tests/choice/Point estimate tests: Difference of parameterestimates/Conditional Evaluation/
/Quantitative Response Assay/Analysis/Suitability Tests/Sample Suitability Tests/choice/Point estimate tests: Ratio of parameterestimates/Conditional Evaluation/
/Quantitative Response Assay/Analysis/Suitability Tests/Sample Suitability Tests/choice/Test: Normalized difference of asymptotes/Conditional Evaluation/
/Quantitative Response Assay/Analysis/Suitability Tests/Sample Suitability Tests/choice/Test: Sum of Squares Regression/ConditionalEvaluation/
/Quantitative Response Assay/Analysis/Suitability Tests/Sample Suitability Tests/choice/Test: Sum of Squares Non-Parallelism/Conditional Evaluation/
/Quantitative Response Assay/Analysis/Suitability Tests/Sample Suitability Tests/choice/Test: Sum of Squares Non-Linearity/Conditional Evaluation/
/Quantitative Response Assay/Analysis/Suitability Tests/Sample Suitability Tests/choice/Test: Ratio sum-of-squares non-linearity tosum-of-squares regression/Conditional Evaluation/
/Quantitative Response Assay/Analysis/Suitability Tests/Sample Suitability Tests/choice/Test: Potency Value/Conditional Evaluation/
348

Reference Guide | Biological Assay Package Version 26
/Quantitative Response Assay/Analysis/Suitability Tests/Sample Suitability Tests/choice/Test: Potency Confidence Interval/ConditionalEvaluation/
/Quantitative Response Assay/Analysis/Suitability Tests/Sample Suitability Tests/choice/Test: Log potency range/ConditionalEvaluation/
/Quantitative Response Assay/Analysis/Suitability Tests/Sample Suitability Tests/choice/Test: Potency of Intermediate Dilution/Conditional Evaluation/
/Quantitative Response Assay/Analysis/Suitability Tests/Sample Suitability Tests/choice/Test: Potency Confidence Interval (%)/Conditional Evaluation/
/Quantitative Response Assay/Analysis/Suitability Tests/Sample Suitability Tests/choice/Test: Potency Range (%)/ConditionalEvaluation/
/Quantitative Response Assay/Analysis/Suitability Tests/Sample Suitability Tests/choice/Test: Maximal Number of Outliers/ConditionalEvaluation/
/Quantitative Response Assay/Analysis/Suitability Tests/Sample Suitability Tests/choice/Test: Maximal Sequence Step CV (%)/Conditional Evaluation/
/Quantitative Response Assay/Analysis/Suitability Tests/Sample Suitability Tests/choice/Test: Minimal R²/Conditional Evaluation/
/Quantitative Response Assay/Analysis/Suitability Tests/Sample Suitability Tests/choice/Test: Relative LOF Error (%)/ConditionalEvaluation/
/Quantitative Response Assay/Analysis/Suitability Tests/Sample Suitability Tests/choice/Test: Response Value Range/ConditionalEvaluation/
/Quantitative Response Assay/Analysis/Suitability Tests/Sample Suitability Tests/choice/Test: Weight W/Conditional Evaluation/
/Test System for Quantitative Response Assay/Suitability Tests/Assay Suitability Tests/choice/F-Test (Hypothesis Test)/ConditionalEvaluation/
/Test System for Quantitative Response Assay/Suitability Tests/Assay Suitability Tests/choice/Equivalence Test (Parameter Estimate)/Conditional Evaluation/
/Test System for Quantitative Response Assay/Suitability Tests/Assay Suitability Tests/choice/Equivalence Test (Difference ofParameter Estimates)/Conditional Evaluation/
/Test System for Quantitative Response Assay/Suitability Tests/Assay Suitability Tests/choice/Equivalence Test (Ratio of ParameterEstimates)/Conditional Evaluation/
/Test System for Quantitative Response Assay/Suitability Tests/Assay Suitability Tests/choice/Equivalence Test (Scaled ParameterRange)/Conditional Evaluation/
/Test System for Quantitative Response Assay/Suitability Tests/Assay Suitability Tests/choice/Point estimate tests: Parameter estimate/Conditional Evaluation/
/Test System for Quantitative Response Assay/Suitability Tests/Assay Suitability Tests/choice/Point estimate tests: Difference ofparameter estimates/Conditional Evaluation/
/Test System for Quantitative Response Assay/Suitability Tests/Assay Suitability Tests/choice/Point estimate tests: Ratio of parameterestimates/Conditional Evaluation/
/Test System for Quantitative Response Assay/Suitability Tests/Assay Suitability Tests/choice/Test: Normalized difference ofasymptotes/Conditional Evaluation/
/Test System for Quantitative Response Assay/Suitability Tests/Assay Suitability Tests/choice/Test: Sum of Squares Regression/Conditional Evaluation/
/Test System for Quantitative Response Assay/Suitability Tests/Assay Suitability Tests/choice/Test: Sum of Squares Non-Parallelism/Conditional Evaluation/
/Test System for Quantitative Response Assay/Suitability Tests/Assay Suitability Tests/choice/Test: Sum of Squares Non-Linearity/Conditional Evaluation/
/Test System for Quantitative Response Assay/Suitability Tests/Assay Suitability Tests/choice/Test: Ratio sum-of-squares non-linearityto sum-of-squares regression/Conditional Evaluation/
/Test System for Quantitative Response Assay/Suitability Tests/Assay Suitability Tests/choice/Test: Potency Value/ConditionalEvaluation/
/Test System for Quantitative Response Assay/Suitability Tests/Assay Suitability Tests/choice/Test: Potency Confidence Interval/Conditional Evaluation/
/Test System for Quantitative Response Assay/Suitability Tests/Assay Suitability Tests/choice/Test: Log potency range/ConditionalEvaluation/
/Test System for Quantitative Response Assay/Suitability Tests/Assay Suitability Tests/choice/Test: Potency of Intermediate Dilution/Conditional Evaluation/
349

/Test System for Quantitative Response Assay/Suitability Tests/Assay Suitability Tests/choice/Test: Potency Confidence Interval (%)/Conditional Evaluation/
/Test System for Quantitative Response Assay/Suitability Tests/Assay Suitability Tests/choice/Test: Potency Range (%)/ConditionalEvaluation/
/Test System for Quantitative Response Assay/Suitability Tests/Assay Suitability Tests/choice/Test: Maximal Number of Outliers/Conditional Evaluation/
/Test System for Quantitative Response Assay/Suitability Tests/Assay Suitability Tests/choice/Test: Maximal Sequence Step CV (%)/Conditional Evaluation/
/Test System for Quantitative Response Assay/Suitability Tests/Assay Suitability Tests/choice/Test: Minimal R²/Conditional Evaluation/
/Test System for Quantitative Response Assay/Suitability Tests/Assay Suitability Tests/choice/Test: Relative LOF Error (%)/ConditionalEvaluation/
/Test System for Quantitative Response Assay/Suitability Tests/Assay Suitability Tests/choice/Test: Response Value Range/ConditionalEvaluation/
/Test System for Quantitative Response Assay/Suitability Tests/Assay Suitability Tests/choice/Test: Weight W/Conditional Evaluation/
/Test System for Quantitative Response Assay/Suitability Tests/Sample Suitability Tests/choice/F-Test (Hypothesis Test)/ConditionalEvaluation/
/Test System for Quantitative Response Assay/Suitability Tests/Sample Suitability Tests/choice/Equivalence Test (Parameter Estimate)/Conditional Evaluation/
/Test System for Quantitative Response Assay/Suitability Tests/Sample Suitability Tests/choice/Equivalence Test (Difference ofParameter Estimates)/Conditional Evaluation/
/Test System for Quantitative Response Assay/Suitability Tests/Sample Suitability Tests/choice/Equivalence Test (Ratio of ParameterEstimates)/Conditional Evaluation/
/Test System for Quantitative Response Assay/Suitability Tests/Sample Suitability Tests/choice/Equivalence Test (Scaled ParameterRange)/Conditional Evaluation/
/Test System for Quantitative Response Assay/Suitability Tests/Sample Suitability Tests/choice/Point estimate tests: Parameterestimate/Conditional Evaluation/
/Test System for Quantitative Response Assay/Suitability Tests/Sample Suitability Tests/choice/Point estimate tests: Difference ofparameter estimates/Conditional Evaluation/
/Test System for Quantitative Response Assay/Suitability Tests/Sample Suitability Tests/choice/Point estimate tests: Ratio ofparameter estimates/Conditional Evaluation/
/Test System for Quantitative Response Assay/Suitability Tests/Sample Suitability Tests/choice/Test: Normalized difference ofasymptotes/Conditional Evaluation/
/Test System for Quantitative Response Assay/Suitability Tests/Sample Suitability Tests/choice/Test: Sum of Squares Regression/Conditional Evaluation/
/Test System for Quantitative Response Assay/Suitability Tests/Sample Suitability Tests/choice/Test: Sum of Squares Non-Parallelism/Conditional Evaluation/
/Test System for Quantitative Response Assay/Suitability Tests/Sample Suitability Tests/choice/Test: Sum of Squares Non-Linearity/Conditional Evaluation/
/Test System for Quantitative Response Assay/Suitability Tests/Sample Suitability Tests/choice/Test: Ratio sum-of-squares non-linearity to sum-of-squares regression/Conditional Evaluation/
/Test System for Quantitative Response Assay/Suitability Tests/Sample Suitability Tests/choice/Test: Potency Value/ConditionalEvaluation/
/Test System for Quantitative Response Assay/Suitability Tests/Sample Suitability Tests/choice/Test: Potency Confidence Interval/Conditional Evaluation/
/Test System for Quantitative Response Assay/Suitability Tests/Sample Suitability Tests/choice/Test: Log potency range/ConditionalEvaluation/
/Test System for Quantitative Response Assay/Suitability Tests/Sample Suitability Tests/choice/Test: Potency of Intermediate Dilution/Conditional Evaluation/
/Test System for Quantitative Response Assay/Suitability Tests/Sample Suitability Tests/choice/Test: Potency Confidence Interval (%)/Conditional Evaluation/
/Test System for Quantitative Response Assay/Suitability Tests/Sample Suitability Tests/choice/Test: Potency Range (%)/ConditionalEvaluation/
/Test System for Quantitative Response Assay/Suitability Tests/Sample Suitability Tests/choice/Test: Maximal Number of Outliers/Conditional Evaluation/
350

Reference Guide | Biological Assay Package Version 26
/Test System for Quantitative Response Assay/Suitability Tests/Sample Suitability Tests/choice/Test: Maximal Sequence Step CV (%)/Conditional Evaluation/
/Test System for Quantitative Response Assay/Suitability Tests/Sample Suitability Tests/choice/Test: Minimal R²/ConditionalEvaluation/
/Test System for Quantitative Response Assay/Suitability Tests/Sample Suitability Tests/choice/Test: Relative LOF Error (%)/ConditionalEvaluation/
/Test System for Quantitative Response Assay/Suitability Tests/Sample Suitability Tests/choice/Test: Response Value Range/Conditional Evaluation/
/Test System for Quantitative Response Assay/Suitability Tests/Sample Suitability Tests/choice/Test: Weight W/Conditional Evaluation/
10.8.423 Test: Potency confidence intervalAdd one or several tests for the potency confidence interval to your assay.
Note: Note: To pass the test, the lower confidence limit of the relative potency has to begreater than or equal to the Lower margin set in the test definition, and the upper confidencelimit of the potency has to be less than or equal to the Upper margin.
Tip: Tip: Select the Assay suitability or Sample suitability section prior to adding tests. Toadd an assay suitability test, select the Assay suitability tests element or one of its childrenprior to adding the test from the Context list. To add a sample suitability test, select the Samplesuitability tests element or one of its children.
Important: Important: Test definitions are ignored without notification if you select a Typeof test that is not valid for the model you use or the Scope you select.
Supported models:
Linear parallel-line, 4-parameter logistic, 5-parameter logistic, 3-parameter logistic with fixedlower asymptote, 3-parameter logistic with fixed upper asymptote, Slope ratio
Assay elements:
Test, Control
This element has the following attributes:
Data type Multiplicity Usage Default value
xs:empty 0...unbounded optional none
Context:/Quantitative Response Assay/Analysis/Suitability Tests/Assay Suitability Tests/choice/
/Quantitative Response Assay/Analysis/Suitability Tests/Sample Suitability Tests/choice/
/Test System for Quantitative Response Assay/Suitability Tests/Assay Suitability Tests/choice/
/Test System for Quantitative Response Assay/Suitability Tests/Sample Suitability Tests/choice/
10.8.424 Test: Potency range (%)Add one or several tests for the relative-potency range to your assay.
351

Note: Note: To pass the test, the percentual relative-potency range has to be less than orequal to the Upper margin set in the test definition.
Tip: Tip: Select the Assay suitability or Sample suitability section prior to adding tests. Toadd an assay suitability test, select the Assay suitability tests element or one of its childrenprior to adding the test from the Context list. To add a sample suitability test, select the Samplesuitability tests element or one of its children.
Important: Important: Test definitions are ignored without notification if you select a Typeof test that is not valid for the model you use or the Scope you select.
Supported models:
Linear parallel-line, 4-parameter logistic, 5-parameter logistic, 3-parameter logistic with fixedlower asymptote, 3-parameter logistic with fixed upper asymptote, Slope ratio
Assay elements:
Test, Control
This element has the following attributes:
Data type Multiplicity Usage Default value
xs:empty 0...unbounded optional none
Context:/Quantitative Response Assay/Analysis/Suitability Tests/Assay Suitability Tests/choice/
/Quantitative Response Assay/Analysis/Suitability Tests/Sample Suitability Tests/choice/
/Test System for Quantitative Response Assay/Suitability Tests/Assay Suitability Tests/choice/
/Test System for Quantitative Response Assay/Suitability Tests/Sample Suitability Tests/choice/
10.8.425 Test: Potency valueAdd one or several tests for the potency value to your assay.
Note: Note: To pass the test, the potency value has to be greater than or equal to the Lowermargin set in the test definition and less than or equal to the Upper margin.
Tip: Tip: Select the Assay suitability or Sample suitability section prior to adding tests. Toadd an assay suitability test, select the Assay suitability tests element or one of its childrenprior to adding the test from the Context list. To add a sample suitability test, select the Samplesuitability tests element or one of its children.
Important: Important: Test definitions are ignored without notification if you select a Typeof test that is not valid for the model you use or the Scope you select.
Supported models:
352

Reference Guide | Biological Assay Package Version 26
Linear parallel-line, 4-parameter logistic, 5-parameter logistic, 3-parameter logistic with fixedlower asymptote, 3-parameter logistic with fixed upper asymptote, Slope ratio
Assay elements:
Test, Control
This element has the following attributes:
Data type Multiplicity Usage Default value
xs:empty 0...unbounded optional none
Context:/Quantitative Response Assay/Analysis/Suitability Tests/Assay Suitability Tests/choice/
/Quantitative Response Assay/Analysis/Suitability Tests/Sample Suitability Tests/choice/
/Test System for Quantitative Response Assay/Suitability Tests/Assay Suitability Tests/choice/
/Test System for Quantitative Response Assay/Suitability Tests/Sample Suitability Tests/choice/
10.8.426 Test: Response value rangeAdd one or several tests for the response value range to your assay.
Note: Note: To pass the test, the minimal response value of the assay element has to begreater than or equal to the Lower margin set in the test definition, and the maximal responsevalue of the assay element has to be less than or equal to the Upper margin. The original valuesare always used, even if a Response transformation has been set. Technical and statistical outliersare excluded.
Note: Note: The test always uses untransformed response values. Response adjustmentsand Response transformations are not taken into account.
Tip: Tip: Select the Assay suitability or Sample suitability section prior to adding tests. Toadd an assay suitability test, select the Assay suitability tests element or one of its childrenprior to adding the test from the Context list. To add a sample suitability test, select the Samplesuitability tests element or one of its children.
Note: Important: Test definitions are ignored without notification if you select a Type of testthat is not valid for the model you use or the Scope you select.
Supported models:
Linear parallel-line, 4-parameter logistic, 5-parameter logistic, 3-parameter logistic with fixedlower asymptote, 3-parameter logistic with fixed upper asymptote, Slope ratio
Scope of the test:
• Standard only: Runs the test for the Standard sample.
• Test samples only: Runs the test for every Test sample.
• Control samples only: Runs the test for every Control sample.
353
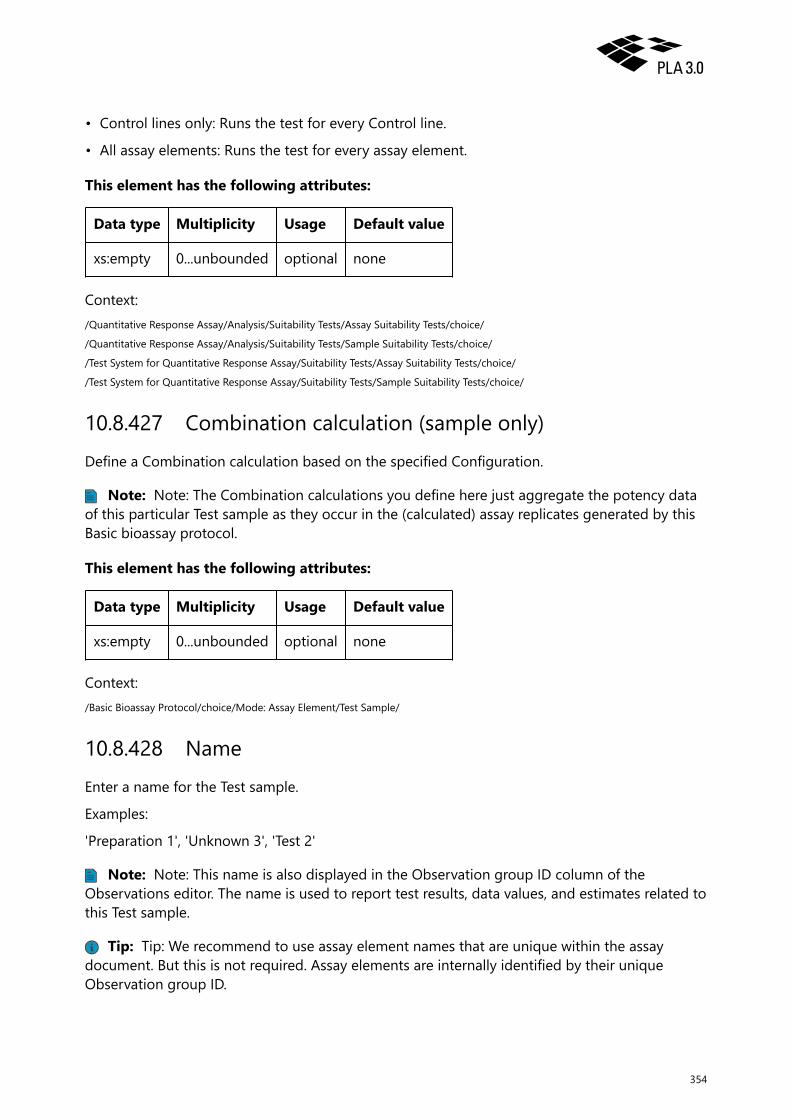
• Control lines only: Runs the test for every Control line.
• All assay elements: Runs the test for every assay element.
This element has the following attributes:
Data type Multiplicity Usage Default value
xs:empty 0...unbounded optional none
Context:/Quantitative Response Assay/Analysis/Suitability Tests/Assay Suitability Tests/choice/
/Quantitative Response Assay/Analysis/Suitability Tests/Sample Suitability Tests/choice/
/Test System for Quantitative Response Assay/Suitability Tests/Assay Suitability Tests/choice/
/Test System for Quantitative Response Assay/Suitability Tests/Sample Suitability Tests/choice/
10.8.427 Combination calculation (sample only)Define a Combination calculation based on the specified Configuration.
Note: Note: The Combination calculations you define here just aggregate the potency dataof this particular Test sample as they occur in the (calculated) assay replicates generated by thisBasic bioassay protocol.
This element has the following attributes:
Data type Multiplicity Usage Default value
xs:empty 0...unbounded optional none
Context:/Basic Bioassay Protocol/choice/Mode: Assay Element/Test Sample/
10.8.428 NameEnter a name for the Test sample.
Examples:
'Preparation 1', 'Unknown 3', 'Test 2'
Note: Note: This name is also displayed in the Observation group ID column of theObservations editor. The name is used to report test results, data values, and estimates related tothis Test sample.
Tip: Tip: We recommend to use assay element names that are unique within the assaydocument. But this is not required. Assay elements are internally identified by their uniqueObservation group ID.
354

Reference Guide | Biological Assay Package Version 26
This element has the following attributes:
Data type Multiplicity Usage Default value
xs:token 1...1 required none
Context:/Basic Bioassay Protocol/choice/Mode: Assay Element/Test Sample/
/Quantitative Response Assay/Setup/Assay Elements/Test Sample/
Data type Multiplicity Usage Default value
xs:token 0...1 required none
Context:/Dichotomous Assay (Quantal Response Assay)/Setup/Assay Elements/Test Sample/
10.8.429 Test sample (unknown)This section allows you to provide information on a Test sample, also referred to as preparationsample or unknown. The potency of Test samples is calculated in comparison to the Standardsample.
Expand the node to add or view information.
To provide information on the substance: Add the elements you need, such as Substance nameor Substance reference, from the Creatable elements pane.
Tip: Tip: The Group element allows you to mark Test samples for inclusion in a combinationcalculation. You need a Combination of assay results document to do the actual combinationcalculation.
This element has the following attributes:
Data type Multiplicity Usage Default value
T_AE_Test 0...unbounded required none
Context:/Basic Bioassay Protocol/choice/Mode: Assay Element/
/Dichotomous Assay (Quantal Response Assay)/Setup/Assay Elements/
/Quantitative Response Assay/Setup/Assay Elements/
10.8.430 Scope of the testSelect the assay elements you want to include in the test. The following options are availablefrom the drop-down list:
355
• All assay elements: Runs the test for every assay element.
• Standard only: Runs the test for Standard samples.
• Test samples only: Runs the test for every Test sample.
• Control samples only: Runs the test for every Control sample.
• Control lines only: Runs the test for every Control line.
Note: Note: The test type also influences which assay elements are included in a test. Sometests are only performed for particular types of assay elements. Moreover, the model determineswhich tests are feasible. Some test definitions may not work with your model. Please consult thehelp pages on particular tests for additional information.
Important: Important: Test definitions are ignored without notification if the Scope youselect results in invalid test definitions (for example, if a test cannot be performed for the assayelement type you select).
This element has the following attributes:
Data type Multiplicity Usage Default value
xs:empty 1...1 optional none
Context:/Quantitative Response Assay/Analysis/Suitability Tests/Assay Suitability Tests/choice/F-Test (Hypothesis Test)/
/Quantitative Response Assay/Analysis/Suitability Tests/Assay Suitability Tests/choice/Equivalence Test (Parameter Estimate)/
/Quantitative Response Assay/Analysis/Suitability Tests/Assay Suitability Tests/choice/Equivalence Test (Difference of ParameterEstimates)/
/Quantitative Response Assay/Analysis/Suitability Tests/Assay Suitability Tests/choice/Equivalence Test (Ratio of ParameterEstimates)/
/Quantitative Response Assay/Analysis/Suitability Tests/Assay Suitability Tests/choice/Equivalence Test (Scaled Parameter Range)/
/Quantitative Response Assay/Analysis/Suitability Tests/Assay Suitability Tests/choice/Point estimate tests: Parameter estimate/
/Quantitative Response Assay/Analysis/Suitability Tests/Assay Suitability Tests/choice/Point estimate tests: Difference of parameterestimates/
/Quantitative Response Assay/Analysis/Suitability Tests/Assay Suitability Tests/choice/Point estimate tests: Ratio of parameterestimates/
/Quantitative Response Assay/Analysis/Suitability Tests/Assay Suitability Tests/choice/Test: Normalized difference of asymptotes/
/Quantitative Response Assay/Analysis/Suitability Tests/Assay Suitability Tests/choice/Test: Sum of Squares Regression/
/Quantitative Response Assay/Analysis/Suitability Tests/Assay Suitability Tests/choice/Test: Sum of Squares Non-Parallelism/
/Quantitative Response Assay/Analysis/Suitability Tests/Assay Suitability Tests/choice/Test: Sum of Squares Non-Linearity/
/Quantitative Response Assay/Analysis/Suitability Tests/Assay Suitability Tests/choice/Test: Ratio sum-of-squares non-linearity tosum-of-squares regression/
/Quantitative Response Assay/Analysis/Suitability Tests/Assay Suitability Tests/choice/Test: Potency Value/
/Quantitative Response Assay/Analysis/Suitability Tests/Assay Suitability Tests/choice/Test: Potency Confidence Interval/
/Quantitative Response Assay/Analysis/Suitability Tests/Assay Suitability Tests/choice/Test: Log potency range/
/Quantitative Response Assay/Analysis/Suitability Tests/Assay Suitability Tests/choice/Test: Potency of Intermediate Dilution/
/Quantitative Response Assay/Analysis/Suitability Tests/Assay Suitability Tests/choice/Test: Potency Confidence Interval (%)/
/Quantitative Response Assay/Analysis/Suitability Tests/Assay Suitability Tests/choice/Test: Potency Range (%)/
/Quantitative Response Assay/Analysis/Suitability Tests/Assay Suitability Tests/choice/Test: Maximal Number of Outliers/
356
Reference Guide | Biological Assay Package Version 26
/Quantitative Response Assay/Analysis/Suitability Tests/Assay Suitability Tests/choice/Test: Maximal Sequence Step CV (%)/
/Quantitative Response Assay/Analysis/Suitability Tests/Assay Suitability Tests/choice/Test: Minimal R²/
/Quantitative Response Assay/Analysis/Suitability Tests/Assay Suitability Tests/choice/Test: Relative LOF Error (%)/
/Quantitative Response Assay/Analysis/Suitability Tests/Assay Suitability Tests/choice/Test: Weight W/
/Quantitative Response Assay/Analysis/Suitability Tests/Sample Suitability Tests/choice/F-Test (Hypothesis Test)/
/Quantitative Response Assay/Analysis/Suitability Tests/Sample Suitability Tests/choice/Equivalence Test (Parameter Estimate)/
/Quantitative Response Assay/Analysis/Suitability Tests/Sample Suitability Tests/choice/Equivalence Test (Difference of ParameterEstimates)/
/Quantitative Response Assay/Analysis/Suitability Tests/Sample Suitability Tests/choice/Equivalence Test (Ratio of ParameterEstimates)/
/Quantitative Response Assay/Analysis/Suitability Tests/Sample Suitability Tests/choice/Equivalence Test (Scaled Parameter Range)/
/Quantitative Response Assay/Analysis/Suitability Tests/Sample Suitability Tests/choice/Point estimate tests: Parameter estimate/
/Quantitative Response Assay/Analysis/Suitability Tests/Sample Suitability Tests/choice/Point estimate tests: Difference of parameterestimates/
/Quantitative Response Assay/Analysis/Suitability Tests/Sample Suitability Tests/choice/Point estimate tests: Ratio of parameterestimates/
/Quantitative Response Assay/Analysis/Suitability Tests/Sample Suitability Tests/choice/Test: Normalized difference of asymptotes/
/Quantitative Response Assay/Analysis/Suitability Tests/Sample Suitability Tests/choice/Test: Sum of Squares Regression/
/Quantitative Response Assay/Analysis/Suitability Tests/Sample Suitability Tests/choice/Test: Sum of Squares Non-Parallelism/
/Quantitative Response Assay/Analysis/Suitability Tests/Sample Suitability Tests/choice/Test: Sum of Squares Non-Linearity/
/Quantitative Response Assay/Analysis/Suitability Tests/Sample Suitability Tests/choice/Test: Ratio sum-of-squares non-linearity tosum-of-squares regression/
/Quantitative Response Assay/Analysis/Suitability Tests/Sample Suitability Tests/choice/Test: Potency Value/
/Quantitative Response Assay/Analysis/Suitability Tests/Sample Suitability Tests/choice/Test: Potency Confidence Interval/
/Quantitative Response Assay/Analysis/Suitability Tests/Sample Suitability Tests/choice/Test: Log potency range/
/Quantitative Response Assay/Analysis/Suitability Tests/Sample Suitability Tests/choice/Test: Potency of Intermediate Dilution/
/Quantitative Response Assay/Analysis/Suitability Tests/Sample Suitability Tests/choice/Test: Potency Confidence Interval (%)/
/Quantitative Response Assay/Analysis/Suitability Tests/Sample Suitability Tests/choice/Test: Potency Range (%)/
/Quantitative Response Assay/Analysis/Suitability Tests/Sample Suitability Tests/choice/Test: Maximal Number of Outliers/
/Quantitative Response Assay/Analysis/Suitability Tests/Sample Suitability Tests/choice/Test: Maximal Sequence Step CV (%)/
/Quantitative Response Assay/Analysis/Suitability Tests/Sample Suitability Tests/choice/Test: Minimal R²/
/Quantitative Response Assay/Analysis/Suitability Tests/Sample Suitability Tests/choice/Test: Relative LOF Error (%)/
/Quantitative Response Assay/Analysis/Suitability Tests/Sample Suitability Tests/choice/Test: Weight W/
/Test System for Quantitative Response Assay/Suitability Tests/Assay Suitability Tests/choice/F-Test (Hypothesis Test)/
/Test System for Quantitative Response Assay/Suitability Tests/Assay Suitability Tests/choice/Equivalence Test (Parameter Estimate)/
/Test System for Quantitative Response Assay/Suitability Tests/Assay Suitability Tests/choice/Equivalence Test (Difference ofParameter Estimates)/
/Test System for Quantitative Response Assay/Suitability Tests/Assay Suitability Tests/choice/Equivalence Test (Ratio of ParameterEstimates)/
/Test System for Quantitative Response Assay/Suitability Tests/Assay Suitability Tests/choice/Equivalence Test (Scaled ParameterRange)/
/Test System for Quantitative Response Assay/Suitability Tests/Assay Suitability Tests/choice/Point estimate tests: Parameter estimate/
/Test System for Quantitative Response Assay/Suitability Tests/Assay Suitability Tests/choice/Point estimate tests: Difference ofparameter estimates/
/Test System for Quantitative Response Assay/Suitability Tests/Assay Suitability Tests/choice/Point estimate tests: Ratio of parameterestimates/
/Test System for Quantitative Response Assay/Suitability Tests/Assay Suitability Tests/choice/Test: Normalized difference ofasymptotes/
/Test System for Quantitative Response Assay/Suitability Tests/Assay Suitability Tests/choice/Test: Sum of Squares Regression/
/Test System for Quantitative Response Assay/Suitability Tests/Assay Suitability Tests/choice/Test: Sum of Squares Non-Parallelism/
/Test System for Quantitative Response Assay/Suitability Tests/Assay Suitability Tests/choice/Test: Sum of Squares Non-Linearity/
357

/Test System for Quantitative Response Assay/Suitability Tests/Assay Suitability Tests/choice/Test: Ratio sum-of-squares non-linearityto sum-of-squares regression/
/Test System for Quantitative Response Assay/Suitability Tests/Assay Suitability Tests/choice/Test: Potency Value/
/Test System for Quantitative Response Assay/Suitability Tests/Assay Suitability Tests/choice/Test: Potency Confidence Interval/
/Test System for Quantitative Response Assay/Suitability Tests/Assay Suitability Tests/choice/Test: Log potency range/
/Test System for Quantitative Response Assay/Suitability Tests/Assay Suitability Tests/choice/Test: Potency of Intermediate Dilution/
/Test System for Quantitative Response Assay/Suitability Tests/Assay Suitability Tests/choice/Test: Potency Confidence Interval (%)/
/Test System for Quantitative Response Assay/Suitability Tests/Assay Suitability Tests/choice/Test: Potency Range (%)/
/Test System for Quantitative Response Assay/Suitability Tests/Assay Suitability Tests/choice/Test: Maximal Number of Outliers/
/Test System for Quantitative Response Assay/Suitability Tests/Assay Suitability Tests/choice/Test: Maximal Sequence Step CV (%)/
/Test System for Quantitative Response Assay/Suitability Tests/Assay Suitability Tests/choice/Test: Minimal R²/
/Test System for Quantitative Response Assay/Suitability Tests/Assay Suitability Tests/choice/Test: Relative LOF Error (%)/
/Test System for Quantitative Response Assay/Suitability Tests/Assay Suitability Tests/choice/Test: Weight W/
/Test System for Quantitative Response Assay/Suitability Tests/Sample Suitability Tests/choice/F-Test (Hypothesis Test)/
/Test System for Quantitative Response Assay/Suitability Tests/Sample Suitability Tests/choice/Equivalence Test (Parameter Estimate)/
/Test System for Quantitative Response Assay/Suitability Tests/Sample Suitability Tests/choice/Equivalence Test (Difference ofParameter Estimates)/
/Test System for Quantitative Response Assay/Suitability Tests/Sample Suitability Tests/choice/Equivalence Test (Ratio of ParameterEstimates)/
/Test System for Quantitative Response Assay/Suitability Tests/Sample Suitability Tests/choice/Equivalence Test (Scaled ParameterRange)/
/Test System for Quantitative Response Assay/Suitability Tests/Sample Suitability Tests/choice/Point estimate tests: Parameterestimate/
/Test System for Quantitative Response Assay/Suitability Tests/Sample Suitability Tests/choice/Point estimate tests: Difference ofparameter estimates/
/Test System for Quantitative Response Assay/Suitability Tests/Sample Suitability Tests/choice/Point estimate tests: Ratio ofparameter estimates/
/Test System for Quantitative Response Assay/Suitability Tests/Sample Suitability Tests/choice/Test: Normalized difference ofasymptotes/
/Test System for Quantitative Response Assay/Suitability Tests/Sample Suitability Tests/choice/Test: Sum of Squares Regression/
/Test System for Quantitative Response Assay/Suitability Tests/Sample Suitability Tests/choice/Test: Sum of Squares Non-Parallelism/
/Test System for Quantitative Response Assay/Suitability Tests/Sample Suitability Tests/choice/Test: Sum of Squares Non-Linearity/
/Test System for Quantitative Response Assay/Suitability Tests/Sample Suitability Tests/choice/Test: Ratio sum-of-squares non-linearity to sum-of-squares regression/
/Test System for Quantitative Response Assay/Suitability Tests/Sample Suitability Tests/choice/Test: Potency Value/
/Test System for Quantitative Response Assay/Suitability Tests/Sample Suitability Tests/choice/Test: Potency Confidence Interval/
/Test System for Quantitative Response Assay/Suitability Tests/Sample Suitability Tests/choice/Test: Log potency range/
/Test System for Quantitative Response Assay/Suitability Tests/Sample Suitability Tests/choice/Test: Potency of Intermediate Dilution/
/Test System for Quantitative Response Assay/Suitability Tests/Sample Suitability Tests/choice/Test: Potency Confidence Interval (%)/
/Test System for Quantitative Response Assay/Suitability Tests/Sample Suitability Tests/choice/Test: Potency Range (%)/
/Test System for Quantitative Response Assay/Suitability Tests/Sample Suitability Tests/choice/Test: Maximal Number of Outliers/
/Test System for Quantitative Response Assay/Suitability Tests/Sample Suitability Tests/choice/Test: Maximal Sequence Step CV (%)/
/Test System for Quantitative Response Assay/Suitability Tests/Sample Suitability Tests/choice/Test: Minimal R²/
/Test System for Quantitative Response Assay/Suitability Tests/Sample Suitability Tests/choice/Test: Relative LOF Error (%)/
/Test System for Quantitative Response Assay/Suitability Tests/Sample Suitability Tests/choice/Test: Weight W/
/Quantitative Response Assay/Analysis/Suitability Tests/Assay Suitability Tests/choice/Test: Response Value Range/choice/
/Quantitative Response Assay/Analysis/Suitability Tests/Sample Suitability Tests/choice/Test: Response Value Range/choice/
/Test System for Quantitative Response Assay/Suitability Tests/Assay Suitability Tests/choice/Test: Response Value Range/choice/
/Test System for Quantitative Response Assay/Suitability Tests/Sample Suitability Tests/choice/Test: Response Value Range/choice/
358

Reference Guide | Biological Assay Package Version 26
10.8.431 Scope of the testSelect the assay elements you want to include in the test. The following options are availablefrom the drop-down list:
• All assay elements: Runs the test for every assay element.
• Standard only: Runs the test for the Standard sample.
• Test samples only: Runs the test for every Test sample.
• Control samples only: Runs the test for every Control sample.
Note: Note: The test type also influences which assay elements are included in a test. Sometests are only performed for particular types of assay elements. Moreover, the model determineswhich tests are feasible. Some test definitions may not work with your model. Please consult thehelp pages on particular tests for additional information.
Important: Important: Test definitions are ignored without notification if the Scope youselect results in invalid test definitions (for example, if a test cannot be performed for the assayelement type you select).
This element has the following attributes:
Data type Multiplicity Usage Default value
xs:empty 0...1 optional none
Context:/Dichotomous Assay (Quantal Response Assay)/Analysis/Suitability Tests/Assay Suitability Tests/Chi-Square-Test / Z-Test (HypothesisTest)/
/Dichotomous Assay (Quantal Response Assay)/Analysis/Suitability Tests/Assay Suitability Tests/Test: Relative Potency Value/
/Dichotomous Assay (Quantal Response Assay)/Analysis/Suitability Tests/Assay Suitability Tests/Test: Relative Potency ConfidenceInterval/
/Dichotomous Assay (Quantal Response Assay)/Analysis/Suitability Tests/Assay Suitability Tests/Test: Relative Potency Range (%)/
/Dichotomous Assay (Quantal Response Assay)/Analysis/Suitability Tests/Assay Suitability Tests/Test: Weight W/
/Dichotomous Assay (Quantal Response Assay)/Analysis/Suitability Tests/Sample Suitability Tests/Chi-Square-Test / Z-Test(Hypothesis Test)/
/Dichotomous Assay (Quantal Response Assay)/Analysis/Suitability Tests/Sample Suitability Tests/Test: Relative Potency Value/
/Dichotomous Assay (Quantal Response Assay)/Analysis/Suitability Tests/Sample Suitability Tests/Test: Relative Potency ConfidenceInterval/
/Dichotomous Assay (Quantal Response Assay)/Analysis/Suitability Tests/Sample Suitability Tests/Test: Relative Potency Range (%)/
/Dichotomous Assay (Quantal Response Assay)/Analysis/Suitability Tests/Sample Suitability Tests/Test: Weight W/
10.8.432 Scope of the testSelect the assay elements to be tested for assay verification.
Note: Note: This property does not affect margin development, which always uses thevalues of the Standard samples.
359

The following options are available from the drop-down list:
• All assay elements: Runs the test for every assay element.
• Standard only: Runs the test for Standard samples.
• Test/Control samples only: Runs the test for every Test and Control sample.
Note: Note: The test type also influences which assay elements are included in a test. Sometests are only performed for particular types of assay elements. Moreover, the model determineswhich tests are feasible. Some test definitions may not work with your model. Please consult thehelp pages on particular tests for additional information.
Important: Important: Test definitions are ignored without notification if the Scope youselect results in invalid test definitions (for example, if a test cannot be performed for the assayelement type you select).
This element has the following attributes:
Data type Multiplicity Usage Default value
xs:empty 1...1 optional none
Context:/Equivalence Margin Development for Biological Assays/Test Strategies/Strategy/Equivalence Tests - Parameter Estimate/A UpperAsymptote (Nonlinear Models)/
/Equivalence Margin Development for Biological Assays/Test Strategies/Strategy/Equivalence Tests - Parameter Estimate/B Parameter(Nonlinear Models)/
/Equivalence Margin Development for Biological Assays/Test Strategies/Strategy/Equivalence Tests - Parameter Estimate/C Parameter(Nonlinear Models)/
/Equivalence Margin Development for Biological Assays/Test Strategies/Strategy/Equivalence Tests - Parameter Estimate/D LowerAsymptote (Nonlinear Models)/
/Equivalence Margin Development for Biological Assays/Test Strategies/Strategy/Equivalence Tests - Parameter Estimate/GAsymmetry Parameter (Nonlinear Models)/
/Equivalence Margin Development for Biological Assays/Test Strategies/Strategy/Equivalence Tests - Parameter Estimate/Slope(Linear Models)/
/Equivalence Margin Development for Biological Assays/Test Strategies/Strategy/Equivalence Tests - Parameter Estimate/Intercept(Linear Models)/
/Equivalence Margin Development for Biological Assays/Test Strategies/Strategy/Equivalence Tests - Parameter Estimate/A-DDifference of Asymptotes (Nonlinear Models)/
/Equivalence Margin Development for Biological Assays/Test Strategies/Strategy/Equivalence Tests - Parameter Estimate/A/D Ratio ofAsymptotes (Nonlinear Models)/
/Equivalence Margin Development for Biological Assays/Test Strategies/Strategy/Point Estimate Tests - Parameter Estimate/A UpperAsymptote (Nonlinear Models)/
/Equivalence Margin Development for Biological Assays/Test Strategies/Strategy/Point Estimate Tests - Parameter Estimate/BParameter (Nonlinear Models)/
/Equivalence Margin Development for Biological Assays/Test Strategies/Strategy/Point Estimate Tests - Parameter Estimate/CParameter (Nonlinear Models)/
/Equivalence Margin Development for Biological Assays/Test Strategies/Strategy/Point Estimate Tests - Parameter Estimate/D LowerAsymptote (Nonlinear Models)/
/Equivalence Margin Development for Biological Assays/Test Strategies/Strategy/Point Estimate Tests - Parameter Estimate/GAsymmetry Parameter (Nonlinear Models)/
/Equivalence Margin Development for Biological Assays/Test Strategies/Strategy/Point Estimate Tests - Parameter Estimate/Slope(Linear Models)/
360

Reference Guide | Biological Assay Package Version 26
/Equivalence Margin Development for Biological Assays/Test Strategies/Strategy/Point Estimate Tests - Parameter Estimate/Intercept(Linear Models)/
/Equivalence Margin Development for Biological Assays/Test Strategies/Strategy/Point Estimate Tests - Parameter Estimate/Slope(Nonlinear Models)/
/Equivalence Margin Development for Biological Assays/Test Strategies/Strategy/Point Estimate Tests - Parameter Estimate/A-DDifference of Asymptotes (Nonlinear Models)/
/Equivalence Margin Development for Biological Assays/Test Strategies/Strategy/Point Estimate Tests - Parameter Estimate/A/D Ratioof Asymptotes (Nonlinear Models)/
/Equivalence Margin Development for Biological Assays/Test Strategies/Strategy/Equivalence Tests - Scaled Parameter Range/A-DDifference of Asymptotes (Nonlinear Models, Standard only)/
10.8.433 Scope of the testSelect the scope of the test. The following options are available from the drop-down list:
• Relative potency: The test is performed for the relative potency combination calculation.
• Absolute potency: The test is performed for the absolute potency combination calculation.
This element has the following attributes:
Data type Multiplicity Usage Default value
xs:empty 0...1 optional none
Context:/Combination of Independent Assay Results/Tests/Test on Potency Value/
/Combination of Independent Assay Results/Tests/Test on Potency Confidence Interval (%)/
/Combination of Independent Assay Results/Tests/Chi² Homogeneity Test/
/Combination of Independent Assay Results/Tests/Test on Potency Confidence Interval/
/Combination of Independent Assay Results/Tests/Test on Potency Coefficient of Variation (%)/
/Combination of Independent Assay Results/Tests/Test on Potency Range (%)/
/Combination of Independent Assay Results/Tests/Test on (Log) Potency Range/
/Combination of Independent Assay Results/Tests/Test on (Log) Potency Confidence Interval Length/
/Combination of Independent Assay Results/Tests/Test on Number of Valid Assays/
/Combination of Independent Assay Results/Tests/Test on maximal number of failed assays/
/Combination of Independent Assay Results/Tests/Test on Sum of Weights/
/Combination of Independent Assay Results/Tests/Test on Mean of CV (%)/
10.8.434 Scope of the testSelect the Control line you want to include in the test.
This element has the following attributes:
Data type Multiplicity Usage Default value
xs:string 1...1 optional none
Context:
361

/Quantitative Response Assay/Analysis/Suitability Tests/Assay Suitability Tests/choice/Test: Response Value Range/choice/
/Quantitative Response Assay/Analysis/Suitability Tests/Sample Suitability Tests/choice/Test: Response Value Range/choice/
/Test System for Quantitative Response Assay/Suitability Tests/Assay Suitability Tests/choice/Test: Response Value Range/choice/
/Test System for Quantitative Response Assay/Suitability Tests/Sample Suitability Tests/choice/Test: Response Value Range/choice/
10.8.435 Signature stateAdd one or several tests for the signature state.
This element has the following attributes:
Data type Multiplicity Usage Default value
xs:empty 0...unbounded optional none
Context:/Combination of Independent Assay Results/Tests/
/Dichotomous Assay (Quantal Response Assay)/Analysis/Suitability Tests/Document Suitability Tests/
/Quantitative Response Assay/Analysis/Suitability Tests/Document Suitability Tests/
/Test System for Quantitative Response Assay/Suitability Tests/Document Suitability Tests/
10.8.436 Test strategiesThis section allows you to define the test strategies you want to evaluate in verification andvisualization. Expand the node to add or view information.
This element has the following attributes:
Data type Multiplicity Usage Default value
T_TestStrategies 1...1 optional none
Context:/Equivalence Margin Development for Biological Assays/
10.8.437 NameEnter a name for the test strategy.
This element has the following attributes:
Data type Multiplicity Usage Default value
xs:token 1...1 required none
Context:
362

Reference Guide | Biological Assay Package Version 26
/Equivalence Margin Development for Biological Assays/Test Strategies/Strategy/
10.8.438 Test strategy verificationSelect the 'yes' option from the drop-down list to use the development and verification assays toevaluate all test strategies you define.
This element has the following attributes:
Data type Multiplicity Usage Default value
T_BinaryType 1...1 required none
Context:/Equivalence Margin Development for Biological Assays/Settings/
10.8.439 Test strategy visualizationSelect the 'yes' option from the drop-down list to generate and visualize the parameterconfigurations that pass the defined test strategies. The parameter configurations are processedfor each test strategy separately.
Note: Note: Additional tests are not considered in the visualization.
This element has the following attributes:
Data type Multiplicity Usage Default value
T_BinaryType 1...1 required none
Context:/Equivalence Margin Development for Biological Assays/Settings/
10.8.440 Test: Sum-of-squares non-linearityUse this test for the following models:
• Linear parallel-line model
• Slope ratio model
• 4-parameter logistic fit
• 4-parameter logistic fit with included blanks
• 5-parameter logistic fit
This element has the following attributes:
Data type Multiplicity Usage Default value
363

T_SingleTestStrategyUpperMargin 0...1 optional none
Context:/Equivalence Margin Development for Biological Assays/Test Strategies/Strategy/Additional Tests/Test - Sum of Squares Non-Linearity/
/Equivalence Margin Development for Biological Assays/Margin Development/Additional Tests/Test - Sum of Squares Non-Linearity/
10.8.441 Test: Sum-of-squares non-linearity (Standard only)Use this test for the following models:
• Linear parallel-line model
• Slope ratio model
• 4-parameter logistic fit
• 4-parameter logistic fit with included blanks
• 5-parameter logistic fit
This element has the following attributes:
Data type Multiplicity Usage Default value
T_SingleTestStrategyUpperMargin 0...1 optional none
Context:/Equivalence Margin Development for Biological Assays/Test Strategies/Strategy/Additional Tests/Test - Sum of Squares Non-Linearity/
/Equivalence Margin Development for Biological Assays/Margin Development/Additional Tests/Test - Sum of Squares Non-Linearity/
10.8.442 Test: Sum-of-squares non-linearityAdd or delete tests for specific assay elements. Expand the node to add or view information. Thefollowing options are available:
• Sum-of-squares non-linearity (all): Combines the terms for non-linearity of the Standardsample and the Test/ Control sample.
• Sum-of-squares non-linearity (Standard only): Only uses the terms for non-linearity of theStandard sample.
• Sum-of-squares non-linearity (Test/Control): Only uses the terms for non-linearity of the Test/Control sample.
This element has the following attributes:
Data type Multiplicity Usage Default value
xs:empty 0...1 optional none
364

Reference Guide | Biological Assay Package Version 26
Context:/Equivalence Margin Development for Biological Assays/Test Strategies/Strategy/Additional Tests/
/Equivalence Margin Development for Biological Assays/Margin Development/Additional Tests/
10.8.443 Test: Sum-of-squares non-linearity (Test/Control)Use this test for the following models:
• Linear parallel-line model
• Slope ratio model
• 4-parameter logistic fit
• 4-parameter logistic fit with included blanks
• 5-parameter logistic fit
This element has the following attributes:
Data type Multiplicity Usage Default value
T_SingleTestStrategyUpperMargin 0...1 optional none
Context:/Equivalence Margin Development for Biological Assays/Test Strategies/Strategy/Additional Tests/Test - Sum of Squares Non-Linearity/
/Equivalence Margin Development for Biological Assays/Margin Development/Additional Tests/Test - Sum of Squares Non-Linearity/
10.8.444 Test: Sum-of-squares non-linearityAdd one or several tests for the sum-of-squares non-linearity (also known as sum-of-squareslack of fit) to your assay.
Note: Note: To pass the test, the sum-of-squares non-linearity (from the ANOVA table) hasto be less than or equal to the Upper margin set in the test definition.
Note: Note: We do not recommend this test if you have statistical or technical outliers. Thenumber of observations should be equal across all assays, that is, assays for which you use thistest and historical assays used in margin development.
Tip: Tip: Select the Assay suitability or Sample suitability section prior to adding tests. Toadd an assay suitability test, select the Assay suitability tests element or one of its childrenprior to adding the test from the Context list. To add a sample suitability test, select the Samplesuitability tests element or one of its children.
Important: Important: Test definitions are ignored without notification if you select a Typeof test that is not valid for the model you use or the Scope you select.
Supported models:
365

Linear parallel-line, 4-parameter logistic, 5-parameter logistic, 3-parameter logistic with fixedlower asymptote, 3-parameter logistic with fixed upper asymptote, Slope ratio
Scope of the test:
• The Standard sample is always included in the calculation.
• 'Standard only' or 'Control lines only' without simultaneous regression (each Test or Controlsample is compared separately to the Standard): No test is computed.
• 'Test samples only' or 'Control samples only' without simultaneous regression: The test iscomputed for each Test-vs-Standard or Control-vs-Standard comparison.
• 'All assay elements' without simultaneous regression: The test is computed for each Test-vs-Standard and for each Control-vs-Standard comparison.
Note: Note: With simultaneous regression (formerly called multiplex assay), all samples areregarded as one single dataset and are tested together (not as individual samples or pairwisecomparisons).
This element has the following attributes:
Data type Multiplicity Usage Default value
xs:empty 0...unbounded optional none
Context:/Quantitative Response Assay/Analysis/Suitability Tests/Assay Suitability Tests/choice/
/Quantitative Response Assay/Analysis/Suitability Tests/Sample Suitability Tests/choice/
/Test System for Quantitative Response Assay/Suitability Tests/Assay Suitability Tests/choice/
/Test System for Quantitative Response Assay/Suitability Tests/Sample Suitability Tests/choice/
10.8.445 Test: Sum-of-squares non-parallelismUse this test for the following models:
• Linear parallel-line model
• Slope ratio model
• 4-parameter logistic fit
• 4-parameter logistic fit with included blanks
• 5-parameter logistic fit
This element has the following attributes:
Data type Multiplicity Usage Default value
T_SingleTestStrategyUpperMargin 0...1 optional none
Context:
366

Reference Guide | Biological Assay Package Version 26
/Equivalence Margin Development for Biological Assays/Test Strategies/Strategy/Additional Tests/
/Equivalence Margin Development for Biological Assays/Margin Development/Additional Tests/
10.8.446 Test: Sum-of-squares non-parallelismAdd one or several tests for the sum-of-squares non-parallelism to your assay.
Note: Note: To pass the test, the sum-of-squares non-parallelism (from the ANOVA table)has to be less than or equal to the Upper margin set in the test definition.
Note: Note: We do not recommend this test if you have statistical or technical outliers. Thenumber of observations should be equal across all assays, that is, assays for which you use thistest and historical assays used in margin development.
Tip: Tip: Select the Assay suitability or Sample suitability section prior to adding tests. Toadd an assay suitability test, select the Assay suitability tests element or one of its childrenprior to adding the test from the Context list. To add a sample suitability test, select the Samplesuitability tests element or one of its children.
Important: Important: Test definitions are ignored without notification if you select a Typeof test that is not valid for the model you use or the Scope you select.
Supported models:
Linear parallel-line, 4-parameter logistic, 5-parameter logistic, 3-parameter logistic with fixedlower asymptote, 3-parameter logistic with fixed upper asymptote, Slope ratio
Scope of the test:
• The Standard sample is always included in the calculation.
• 'Standard only' or 'Control lines only' without simultaneous regression (each Test or Controlsample is compared separately to the Standard): No test is computed.
• 'Test samples only' or 'Control samples only' without simultaneous regression: The test iscomputed for each Test-vs-Standard or Control-vs-Standard comparison.
• 'All assay elements' without simultaneous regression: The test is computed for each Test-vs-Standard and for each Control-vs-Standard comparison.
Note: Note: With simultaneous regression (formerly called multiplex assay), all samples areregarded as one single dataset and are tested together (not as individual samples or pairwisecomparisons).
This element has the following attributes:
Data type Multiplicity Usage Default value
xs:empty 0...unbounded optional none
Context:/Quantitative Response Assay/Analysis/Suitability Tests/Assay Suitability Tests/choice/
367
/Quantitative Response Assay/Analysis/Suitability Tests/Sample Suitability Tests/choice/
/Test System for Quantitative Response Assay/Suitability Tests/Assay Suitability Tests/choice/
/Test System for Quantitative Response Assay/Suitability Tests/Sample Suitability Tests/choice/
10.8.447 Test: Sum-of-squares regressionUse this test for the following models:
• Linear parallel-line model
• Slope ratio model
• 4-parameter logistic fit
• 4-parameter logistic fit with included blanks
• 5-parameter logistic fit
This element has the following attributes:
Data type Multiplicity Usage Default value
T_SingleTestStrategy 0...1 optional none
Context:/Equivalence Margin Development for Biological Assays/Test Strategies/Strategy/Additional Tests/
/Equivalence Margin Development for Biological Assays/Margin Development/Additional Tests/
10.8.448 Test: Sum-of-squares regressionAdd one or several tests for the sum-of-squares regression to your assay.
Note: Note: To pass the test, the sum-of-squares regression (from the ANOVA table) has tobe less than or equal to the Upper margin set in the test definition.
Note: Note: We do not recommend this test if you have statistical or technical outliers. Thenumber of observations should be equal across all assays, that is, assays for which you use thistest and historical assays used in margin development.
Tip: Tip: Select the Assay suitability or Sample suitability section prior to adding tests. Toadd an assay suitability test, select the Assay suitability tests element or one of its childrenprior to adding the test from the Context list. To add a sample suitability test, select the Samplesuitability tests element or one of its children.
Important: Important: Test definitions are ignored without notification if you select a Typeof test that is not valid for the model you use or the Scope you select.
Supported models:
Linear parallel-line, 4-parameter logistic, 5-parameter logistic, 3-parameter logistic with fixedlower asymptote, 3-parameter logistic with fixed upper asymptote, Slope ratio
368

Reference Guide | Biological Assay Package Version 26
Scope of the test:
• The Standard sample is always included in the calculation.
• 'Standard only' or 'Control lines only' without simultaneous regression (each Test or Controlsample is compared separately to the Standard): No test is computed.
• 'Test samples only' or 'Control samples only' without simultaneous regression: The test iscomputed for each Test-vs-Standard or Control-vs-Standard comparison.
• 'All assay elements' without simultaneous regression: The test is computed for each Test-vs-Standard and for each Control-vs-Standard comparison.
Note: Note: With simultaneous regression (formerly called multiplex assay), all samples areregarded as one single dataset and are tested together (not as individual samples or pairwisecomparisons).
This element has the following attributes:
Data type Multiplicity Usage Default value
xs:empty 0...unbounded optional none
Context:/Quantitative Response Assay/Analysis/Suitability Tests/Assay Suitability Tests/choice/
/Quantitative Response Assay/Analysis/Suitability Tests/Sample Suitability Tests/choice/
/Test System for Quantitative Response Assay/Suitability Tests/Assay Suitability Tests/choice/
/Test System for Quantitative Response Assay/Suitability Tests/Sample Suitability Tests/choice/
10.8.449 Test system referenceSelect a Test system document.
This element has the following attributes:
Data type Multiplicity Usage Default value
DocumentReference.TestSystemDefinition 0...unbounded optional none
Context:/Quantitative Response Assay/Analysis/Suitability Tests/
10.8.450 Test system for quantitative response assayDefines a collection of Suitability tests and corresponding margins for Quantitative responseassays.
369
Note: Note: You can reference this Test system definition document from Quantitativeresponse assays. When you calculate an assay that references this document, the test(s) specifiedin this document are applied to the assay.
1. Expand the node to add or view information. The second level of the document structuredisplays the Name and Date of the document.
2. Double-click the Identification element in the Creatable elements pane to add it to thedocument.
Note: Note: To delete an element from the document, right-click the element in thedocument structure and select the Delete element option from the pop-up menu.
3. Double-click the Comment element in the Creatable elements pane to add a Commentsection to the document.
This element has the following attributes:
Data type Multiplicity Usage Default value
xs:empty 1...1 none
Context:Top level
10.8.451 TextEnter your comment.
Tip: Tip: You can enter multiline text. You can also add additional Text elements.
This element has the following attributes:
Data type Multiplicity Usage Default value
xs:string 0...unbounded optional none
Context:/Basic Bioassay Protocol/Comment/
/Combination of Independent Assay Results/Comment/
/Control Chart/Comment/
/Dichotomous Assay (Quantal Response Assay)/Comment/
/Equivalence Margin Development for Biological Assays/Comment/
/Quantitative Response Assay/Comment/
/Test System for Quantitative Response Assay/Comment/
Data type Multiplicity Usage Default value
370

Reference Guide | Biological Assay Package Version 26
xs:string 1...1 required none
Context:
10.8.452 Text column (factor)Define a column that allows you to associate each observation with a single-line text.
This element has the following attributes:
Data type Multiplicity Usage Default value
ds:T_TextColumn 0...unbounded required none
Context:/Dichotomous Assay (Quantal Response Assay)/Setup/Observation Data/choice/
/Quantitative Response Assay/Setup/Observation Data/choice/
10.8.453 Theoretical varianceEnter a different value for Theoretical variance if you require.
Note: Note: This setting affects tests based on ANOVA.
The default value is '1'.
This element has the following attributes:
Data type Multiplicity Usage Default value
T_NonNegativeDouble 1...1 required none
Context:/Dichotomous Assay (Quantal Response Assay)/Analysis/Analytical Model/Advanced Settings/
10.8.454 Tick values of the x-axisNote: Note: Regardless of the Tick values option you select, the x-axis corresponds to
transformed relative dose values.
Select an option from the drop-down list to change how the tick marks are labeled:
• Absolute dose: Displays absolute dose values on the tick marks of the x-axis.
• Transformed relative dose: Displays transformed relative dose values on the tick marks of thex-axis.
371

• Untransformed relative dose: Displays untransformed relative dose values on the tick marks ofthe x-axis.
This element has the following attributes:
Data type Multiplicity Usage Default value
T_Dose 1...1 required none
Context:/Dichotomous Assay (Quantal Response Assay)/Settings/Graphics/Linear Predictor: Data Plot/
/Dichotomous Assay (Quantal Response Assay)/Settings/Graphics/Linear Predictor: Full Model/
/Dichotomous Assay (Quantal Response Assay)/Settings/Graphics/Linear Predictor: Restricted Model/
/Dichotomous Assay (Quantal Response Assay)/Settings/Graphics/Probability: Data Plot/
/Dichotomous Assay (Quantal Response Assay)/Settings/Graphics/Probability: Full Model/
/Dichotomous Assay (Quantal Response Assay)/Settings/Graphics/Probability: Restricted Model/
/Quantitative Response Assay/Settings/Graphics/Data Plot/
/Quantitative Response Assay/Settings/Graphics/Full Model/
/Quantitative Response Assay/Settings/Graphics/Restricted Model/
10.8.455 Tick values of the y-axisNote: Note: Regardless of the Tick values option you select, the y-axis corresponds to
transformed response values.
Select an option from the drop-down list to change how the tick marks are labeled:
• Transformed response: Displays transformed response values on the tick marks of the y-axis.
• Untransformed response: Displays untransformed response values on the tick marks of the y-axis.
This element has the following attributes:
Data type Multiplicity Usage Default value
T_Response 1...1 required none
Context:/Quantitative Response Assay/Settings/Graphics/Data Plot/
/Quantitative Response Assay/Settings/Graphics/Full Model/
/Quantitative Response Assay/Settings/Graphics/Restricted Model/
10.8.456 Time column (factor)Define a column that allows you to associate each observation with a time.
372

Reference Guide | Biological Assay Package Version 26
This element has the following attributes:
Data type Multiplicity Usage Default value
ds:T_TimeColumn 0...unbounded required none
Context:/Dichotomous Assay (Quantal Response Assay)/Setup/Observation Data/choice/
/Quantitative Response Assay/Setup/Observation Data/choice/
10.8.457 Tolerance levelSpecifies what proportion of data is to lie within developed margins. Select 95%, for example, toexclude the outer 5% data values from the calculation. A common value is 95%.
Note: Note: A higher Tolerance level results in a greater equivalence range (distancebetween equivalence margins).
Note: Note: Use of Tolerance levels below 100% in margin development inevitably causessome development assays to fail tests based on calculated margins. Select the 100% tolerancelevel if you do not want acceptable development assays to fail.
This element has the following attributes:
Data type Multiplicity Usage Default value
T_ToleranceLevel 1...1 required none
Context:/Equivalence Margin Development for Biological Assays/Settings/
10.8.458 Update modeSelect how you want to update document references and the data provided by thesedocuments.
Tip: Tip: You can update data based on a list of referenced documents (update data) ora property filter (update all). To update data based on a property filter, you have to add aDocument property filter or a Section property filter to the Document reference section of theBasic bioassay protocol.
The following four Update modes are available:
Mode Trigger Scope
373

Autoall
Updates automaticallywhen you open orclose the Basic bioassayprotocol.
Searches the entire database for data matching theproperty filter. Updates all matching data and thelist of referenced documents in the Basic bioassayprotocol.
Autodata
Updates automaticallywhen you open orclose the Basic bioassayprotocol.
Updates data from documents currently referenced inthe Basic bioassay protocol.
Manualall
Updates when youmanually execute theupdate command in theReferences dialog.
Searches the entire database for data matching theproperty filter. Updates all matching data and thelist of referenced documents in the Basic bioassayprotocol.
Manualdata
Updates when youmanually execute theupdate command in theReferences dialog.
Updates data from documents currently referenced inthe Basic bioassay protocol.
Note: Note: Only documents for which the requesting user has read permission are checkedfor updates.
This element has the following attributes:
Data type Multiplicity Usage Default value
ds:T_UpdateMode 0...1 optional none
Context:/Basic Bioassay Protocol/Reportable Values/Document Reference/
/Combination of Independent Assay Results/Potency Data/Column: Document Reference/
10.8.459 Update modeSelect how you want to update data provided by the referenced document. The followingoptions are available from the drop-down list:
• Auto: Have data updated automatically.
• Manual: Update data manually from the References dialog.
This element has the following attributes:
Data type Multiplicity Usage Default value
dr:T_UpdateMode 1...1 required none
Context:
374

Reference Guide | Biological Assay Package Version 26
/Quantitative Response Assay/Documentation/choice/Substance Reference/Config/
/Quantitative Response Assay/Documentation/Reagent/choice/Reagent Reference/Config/
/Quantitative Response Assay/Setup/Assay Elements/Standard Sample/choice/Substance Reference/Config/
/Quantitative Response Assay/Setup/Assay Elements/Test Sample/choice/Substance Reference/Config/
/Quantitative Response Assay/Setup/Assay Elements/Control Sample/choice/Substance Reference/Config/
/Quantitative Response Assay/Setup/Assay Elements/Control Line/choice/Substance Reference/Config/
Data type Multiplicity Usage Default value
dr:T_UpdateMode 0...1 optional none
Context:/Quantitative Response Assay/Documentation/Operator/choice/Operator Reference/Config/
/Quantitative Response Assay/Documentation/Equipment/choice/Equipment Reference/Config/
10.8.460 Upper asymptote (A) (nonlinear models)Use this test for the following models:
• 4-parameter logistic fit
• 4-parameter logistic fit with included blanks
• 5-parameter logistic fit
This element has the following attributes:
Data type Multiplicity Usage Default value
T_SingleTestStrategyWithScope 0...1 optional none
Context:/Equivalence Margin Development for Biological Assays/Test Strategies/Strategy/Equivalence Tests - Parameter Estimate/
/Equivalence Margin Development for Biological Assays/Test Strategies/Strategy/Equivalence Tests - Difference of ParameterEstimates/
/Equivalence Margin Development for Biological Assays/Test Strategies/Strategy/Equivalence Tests - Ratio of Parameter Estimates/
/Equivalence Margin Development for Biological Assays/Test Strategies/Strategy/Equivalence Tests - Scaled Parameter Range/
/Equivalence Margin Development for Biological Assays/Test Strategies/Strategy/Point Estimate Tests - Parameter Estimate/
/Equivalence Margin Development for Biological Assays/Test Strategies/Strategy/Point Estimate Tests - Difference of ParameterEstimates/
/Equivalence Margin Development for Biological Assays/Test Strategies/Strategy/Point Estimate Tests - Ratio of Parameter Estimates/
/Equivalence Margin Development for Biological Assays/Margin Development/Equivalence Tests - Parameter Estimate/
/Equivalence Margin Development for Biological Assays/Margin Development/Equivalence Tests - Difference of Parameter Estimates/
/Equivalence Margin Development for Biological Assays/Margin Development/Equivalence Tests - Ratio of Parameter Estimates/
/Equivalence Margin Development for Biological Assays/Margin Development/Equivalence Tests - Scaled Parameter Range/
/Equivalence Margin Development for Biological Assays/Margin Development/Point Estimate Tests - Parameter Estimate/
/Equivalence Margin Development for Biological Assays/Margin Development/Point Estimate Tests - Difference of ParameterEstimates/
/Equivalence Margin Development for Biological Assays/Margin Development/Point Estimate Tests - Ratio of Parameter Estimates/
375

/Equivalence Margin Development for Biological Assays/Visualization/Simulation Space/
10.8.461 Upper control limitEnter the Upper control limit of the chart. Usually, control limits contain an upper and a lowerlimit. But you can also define only one of these values.
This element has the following attributes:
Data type Multiplicity Usage Default value
xs:double 0...1 optional none
Context:/Control Chart/Charts/Chart/Control Limit Definition/
10.8.462 Upper marginEnter the Upper margin of the test.
This element has the following attributes:
Data type Multiplicity Usage Default value
xs:double 1...1 required none
Context:/Combination of Independent Assay Results/Tests/Test on Potency Coefficient of Variation (%)/
/Combination of Independent Assay Results/Tests/Test on Potency Range (%)/
/Combination of Independent Assay Results/Tests/Test on (Log) Potency Range/
/Combination of Independent Assay Results/Tests/Test on (Log) Potency Confidence Interval Length/
/Combination of Independent Assay Results/Tests/Test on maximal number of failed assays/
/Combination of Independent Assay Results/Tests/Test on Potency Value/
Data type Multiplicity Usage Default value
xs:double 0...1 required none
Context:/Combination of Independent Assay Results/Tests/Test on Potency Confidence Interval (%)/
/Combination of Independent Assay Results/Tests/Test on Potency Confidence Interval/
/Combination of Independent Assay Results/Tests/Test on Number of Valid Assays/
/Combination of Independent Assay Results/Tests/Test on Sum of Weights/
/Combination of Independent Assay Results/Tests/Test on Mean of CV (%)/
376

Reference Guide | Biological Assay Package Version 26
10.8.463 Upper marginEnter the Upper margin of the test as decimal number. To pass the test, the observed value mustbe less than or equal to the Upper margin.
Note: Note: Additional information is provided on the help page of the test.
Tip: Tip: Set up an Equivalence margin document in PLA if you have historical data todetermine the margins for your tests.
This element has the following attributes:
Data type Multiplicity Usage Default value
xs:double 1...1 required none
Context:/Dichotomous Assay (Quantal Response Assay)/Analysis/Suitability Tests/Assay Suitability Tests/Test: Relative Potency Range (%)/
/Dichotomous Assay (Quantal Response Assay)/Analysis/Suitability Tests/Sample Suitability Tests/Test: Relative Potency Range (%)/
/Quantitative Response Assay/Analysis/Suitability Tests/Assay Suitability Tests/choice/Test: Potency Range (%)/
/Quantitative Response Assay/Analysis/Suitability Tests/Assay Suitability Tests/choice/Test: Relative LOF Error (%)/
/Quantitative Response Assay/Analysis/Suitability Tests/Sample Suitability Tests/choice/Test: Potency Range (%)/
/Quantitative Response Assay/Analysis/Suitability Tests/Sample Suitability Tests/choice/Test: Relative LOF Error (%)/
/Test System for Quantitative Response Assay/Suitability Tests/Assay Suitability Tests/choice/Test: Potency Range (%)/
/Test System for Quantitative Response Assay/Suitability Tests/Assay Suitability Tests/choice/Test: Relative LOF Error (%)/
/Test System for Quantitative Response Assay/Suitability Tests/Sample Suitability Tests/choice/Test: Potency Range (%)/
/Test System for Quantitative Response Assay/Suitability Tests/Sample Suitability Tests/choice/Test: Relative LOF Error (%)/
10.8.464 Upper marginEnter the Upper margin of the test as decimal number. To pass the test, the observed value mustbe less than or equal to the Upper margin.
Tip: Tip: Set up an Equivalence margin document in PLA if you have historical data todetermine the margins for your tests.
This element has the following attributes:
Data type Multiplicity Usage Default value
xs:positiveInteger 1...1 required none
Context:/Quantitative Response Assay/Analysis/Suitability Tests/Assay Suitability Tests/choice/Test: Maximal Number of Outliers/
/Quantitative Response Assay/Analysis/Suitability Tests/Sample Suitability Tests/choice/Test: Maximal Number of Outliers/
/Test System for Quantitative Response Assay/Suitability Tests/Assay Suitability Tests/choice/Test: Maximal Number of Outliers/
377

/Test System for Quantitative Response Assay/Suitability Tests/Sample Suitability Tests/choice/Test: Maximal Number of Outliers/
10.8.465 Upper marginEnter the Upper margin of the test as decimal number. The Upper margin must be greater thanor equal to the Lower margin of the test.
Note: Note: Additional information is provided on the help page of the test.
Tip: Tip: Set up an Equivalence margin document in PLA if you have historical data todetermine the margins for your tests.
This element has the following attributes:
Data type Multiplicity Usage Default value
xs:double 1...1 required none
Context:/Dichotomous Assay (Quantal Response Assay)/Analysis/Suitability Tests/Assay Suitability Tests/Test: Relative Potency Value/
/Dichotomous Assay (Quantal Response Assay)/Analysis/Suitability Tests/Assay Suitability Tests/Test: Relative Potency ConfidenceInterval/
/Dichotomous Assay (Quantal Response Assay)/Analysis/Suitability Tests/Sample Suitability Tests/Test: Relative Potency Value/
/Dichotomous Assay (Quantal Response Assay)/Analysis/Suitability Tests/Sample Suitability Tests/Test: Relative Potency ConfidenceInterval/
Data type Multiplicity Usage Default value
xs:double 0...1 required 0
Context:/Quantitative Response Assay/Analysis/Suitability Tests/Assay Suitability Tests/choice/Equivalence Test (Parameter Estimate)/
/Quantitative Response Assay/Analysis/Suitability Tests/Assay Suitability Tests/choice/Equivalence Test (Difference of ParameterEstimates)/
/Quantitative Response Assay/Analysis/Suitability Tests/Assay Suitability Tests/choice/Equivalence Test (Ratio of ParameterEstimates)/
/Quantitative Response Assay/Analysis/Suitability Tests/Assay Suitability Tests/choice/Point estimate tests: Parameter estimate/
/Quantitative Response Assay/Analysis/Suitability Tests/Assay Suitability Tests/choice/Point estimate tests: Difference of parameterestimates/
/Quantitative Response Assay/Analysis/Suitability Tests/Assay Suitability Tests/choice/Point estimate tests: Ratio of parameterestimates/
/Quantitative Response Assay/Analysis/Suitability Tests/Assay Suitability Tests/choice/Test: Normalized difference of asymptotes/
/Quantitative Response Assay/Analysis/Suitability Tests/Assay Suitability Tests/choice/Test: Sum of Squares Regression/
/Quantitative Response Assay/Analysis/Suitability Tests/Assay Suitability Tests/choice/Test: Sum of Squares Non-Parallelism/
/Quantitative Response Assay/Analysis/Suitability Tests/Assay Suitability Tests/choice/Test: Sum of Squares Non-Linearity/
/Quantitative Response Assay/Analysis/Suitability Tests/Assay Suitability Tests/choice/Test: Potency Value/
/Quantitative Response Assay/Analysis/Suitability Tests/Assay Suitability Tests/choice/Test: Potency Confidence Interval/
/Quantitative Response Assay/Analysis/Suitability Tests/Assay Suitability Tests/choice/Test: Log potency range/
/Quantitative Response Assay/Analysis/Suitability Tests/Assay Suitability Tests/choice/Test: Potency of Intermediate Dilution/
378
Reference Guide | Biological Assay Package Version 26
/Quantitative Response Assay/Analysis/Suitability Tests/Assay Suitability Tests/choice/Test: Potency Confidence Interval (%)/
/Quantitative Response Assay/Analysis/Suitability Tests/Assay Suitability Tests/choice/Test: Response Value Range/
/Quantitative Response Assay/Analysis/Suitability Tests/Sample Suitability Tests/choice/Equivalence Test (Parameter Estimate)/
/Quantitative Response Assay/Analysis/Suitability Tests/Sample Suitability Tests/choice/Equivalence Test (Difference of ParameterEstimates)/
/Quantitative Response Assay/Analysis/Suitability Tests/Sample Suitability Tests/choice/Equivalence Test (Ratio of ParameterEstimates)/
/Quantitative Response Assay/Analysis/Suitability Tests/Sample Suitability Tests/choice/Point estimate tests: Parameter estimate/
/Quantitative Response Assay/Analysis/Suitability Tests/Sample Suitability Tests/choice/Point estimate tests: Difference of parameterestimates/
/Quantitative Response Assay/Analysis/Suitability Tests/Sample Suitability Tests/choice/Point estimate tests: Ratio of parameterestimates/
/Quantitative Response Assay/Analysis/Suitability Tests/Sample Suitability Tests/choice/Test: Normalized difference of asymptotes/
/Quantitative Response Assay/Analysis/Suitability Tests/Sample Suitability Tests/choice/Test: Sum of Squares Regression/
/Quantitative Response Assay/Analysis/Suitability Tests/Sample Suitability Tests/choice/Test: Sum of Squares Non-Parallelism/
/Quantitative Response Assay/Analysis/Suitability Tests/Sample Suitability Tests/choice/Test: Sum of Squares Non-Linearity/
/Quantitative Response Assay/Analysis/Suitability Tests/Sample Suitability Tests/choice/Test: Potency Value/
/Quantitative Response Assay/Analysis/Suitability Tests/Sample Suitability Tests/choice/Test: Potency Confidence Interval/
/Quantitative Response Assay/Analysis/Suitability Tests/Sample Suitability Tests/choice/Test: Log potency range/
/Quantitative Response Assay/Analysis/Suitability Tests/Sample Suitability Tests/choice/Test: Potency of Intermediate Dilution/
/Quantitative Response Assay/Analysis/Suitability Tests/Sample Suitability Tests/choice/Test: Potency Confidence Interval (%)/
/Quantitative Response Assay/Analysis/Suitability Tests/Sample Suitability Tests/choice/Test: Response Value Range/
/Test System for Quantitative Response Assay/Suitability Tests/Assay Suitability Tests/choice/Equivalence Test (Parameter Estimate)/
/Test System for Quantitative Response Assay/Suitability Tests/Assay Suitability Tests/choice/Equivalence Test (Difference ofParameter Estimates)/
/Test System for Quantitative Response Assay/Suitability Tests/Assay Suitability Tests/choice/Equivalence Test (Ratio of ParameterEstimates)/
/Test System for Quantitative Response Assay/Suitability Tests/Assay Suitability Tests/choice/Point estimate tests: Parameter estimate/
/Test System for Quantitative Response Assay/Suitability Tests/Assay Suitability Tests/choice/Point estimate tests: Difference ofparameter estimates/
/Test System for Quantitative Response Assay/Suitability Tests/Assay Suitability Tests/choice/Point estimate tests: Ratio of parameterestimates/
/Test System for Quantitative Response Assay/Suitability Tests/Assay Suitability Tests/choice/Test: Normalized difference ofasymptotes/
/Test System for Quantitative Response Assay/Suitability Tests/Assay Suitability Tests/choice/Test: Sum of Squares Regression/
/Test System for Quantitative Response Assay/Suitability Tests/Assay Suitability Tests/choice/Test: Sum of Squares Non-Parallelism/
/Test System for Quantitative Response Assay/Suitability Tests/Assay Suitability Tests/choice/Test: Sum of Squares Non-Linearity/
/Test System for Quantitative Response Assay/Suitability Tests/Assay Suitability Tests/choice/Test: Potency Value/
/Test System for Quantitative Response Assay/Suitability Tests/Assay Suitability Tests/choice/Test: Potency Confidence Interval/
/Test System for Quantitative Response Assay/Suitability Tests/Assay Suitability Tests/choice/Test: Log potency range/
/Test System for Quantitative Response Assay/Suitability Tests/Assay Suitability Tests/choice/Test: Potency of Intermediate Dilution/
/Test System for Quantitative Response Assay/Suitability Tests/Assay Suitability Tests/choice/Test: Potency Confidence Interval (%)/
/Test System for Quantitative Response Assay/Suitability Tests/Assay Suitability Tests/choice/Test: Response Value Range/
/Test System for Quantitative Response Assay/Suitability Tests/Sample Suitability Tests/choice/Equivalence Test (Parameter Estimate)/
/Test System for Quantitative Response Assay/Suitability Tests/Sample Suitability Tests/choice/Equivalence Test (Difference ofParameter Estimates)/
/Test System for Quantitative Response Assay/Suitability Tests/Sample Suitability Tests/choice/Equivalence Test (Ratio of ParameterEstimates)/
/Test System for Quantitative Response Assay/Suitability Tests/Sample Suitability Tests/choice/Point estimate tests: Parameterestimate/
379

/Test System for Quantitative Response Assay/Suitability Tests/Sample Suitability Tests/choice/Point estimate tests: Difference ofparameter estimates/
/Test System for Quantitative Response Assay/Suitability Tests/Sample Suitability Tests/choice/Point estimate tests: Ratio ofparameter estimates/
/Test System for Quantitative Response Assay/Suitability Tests/Sample Suitability Tests/choice/Test: Normalized difference ofasymptotes/
/Test System for Quantitative Response Assay/Suitability Tests/Sample Suitability Tests/choice/Test: Sum of Squares Regression/
/Test System for Quantitative Response Assay/Suitability Tests/Sample Suitability Tests/choice/Test: Sum of Squares Non-Parallelism/
/Test System for Quantitative Response Assay/Suitability Tests/Sample Suitability Tests/choice/Test: Sum of Squares Non-Linearity/
/Test System for Quantitative Response Assay/Suitability Tests/Sample Suitability Tests/choice/Test: Potency Value/
/Test System for Quantitative Response Assay/Suitability Tests/Sample Suitability Tests/choice/Test: Potency Confidence Interval/
/Test System for Quantitative Response Assay/Suitability Tests/Sample Suitability Tests/choice/Test: Log potency range/
/Test System for Quantitative Response Assay/Suitability Tests/Sample Suitability Tests/choice/Test: Potency of Intermediate Dilution/
/Test System for Quantitative Response Assay/Suitability Tests/Sample Suitability Tests/choice/Test: Potency Confidence Interval (%)/
/Test System for Quantitative Response Assay/Suitability Tests/Sample Suitability Tests/choice/Test: Response Value Range/
10.8.466 Upper marginEnter the Upper margin of the test as decimal number. The Upper margin must be greater thanor equal to the Lower margin of the test.
Note: Note: Additional information is provided on the help page of the test.
Tip: Tip: Set up an Equivalence margin document in PLA if you have historical data todetermine the margins for your tests.
This element has the following attributes:
Data type Multiplicity Usage Default value
xs:double 1...1 required none
Context:/Quantitative Response Assay/Analysis/Suitability Tests/Assay Suitability Tests/choice/Test: Maximal Sequence Step CV (%)/
/Quantitative Response Assay/Analysis/Suitability Tests/Sample Suitability Tests/choice/Test: Maximal Sequence Step CV (%)/
/Test System for Quantitative Response Assay/Suitability Tests/Assay Suitability Tests/choice/Test: Maximal Sequence Step CV (%)/
/Test System for Quantitative Response Assay/Suitability Tests/Sample Suitability Tests/choice/Test: Maximal Sequence Step CV (%)/
10.8.467 Upper marginEnter the Upper margin of the test as decimal number. The Upper margin must be greater thanor equal to the Lower margin of the test.
Note: Note: Additional information is provided on the help page of the test.
Tip: Tip: Set up an Equivalence margin document in PLA if you have historical data todetermine the margins for your tests.
380

Reference Guide | Biological Assay Package Version 26
This element has the following attributes:
Data type Multiplicity Usage Default value
xs:double 0...1 required none
Context:/Quantitative Response Assay/Analysis/Suitability Tests/Assay Suitability Tests/choice/Test: Ratio sum-of-squares non-linearity tosum-of-squares regression/
/Quantitative Response Assay/Analysis/Suitability Tests/Sample Suitability Tests/choice/Test: Ratio sum-of-squares non-linearity tosum-of-squares regression/
/Test System for Quantitative Response Assay/Suitability Tests/Assay Suitability Tests/choice/Test: Ratio sum-of-squares non-linearityto sum-of-squares regression/
/Test System for Quantitative Response Assay/Suitability Tests/Sample Suitability Tests/choice/Test: Ratio sum-of-squares non-linearity to sum-of-squares regression/
10.8.468 Upper marginEnter the Upper margin of the test as decimal number. The Upper margin must be greater thanor equal to the Lower margin of the test.
Note: Note: Additional information is provided on the help page of the test.
Tip: Tip: Set up an Equivalence margin document in PLA if you have historical data todetermine the margins for your tests.
This element has the following attributes:
Data type Multiplicity Usage Default value
xs:double 0...1 required none
Context:/Quantitative Response Assay/Analysis/Suitability Tests/Assay Suitability Tests/choice/Equivalence Test (Scaled Parameter Range)/
/Quantitative Response Assay/Analysis/Suitability Tests/Sample Suitability Tests/choice/Equivalence Test (Scaled Parameter Range)/
/Test System for Quantitative Response Assay/Suitability Tests/Assay Suitability Tests/choice/Equivalence Test (Scaled ParameterRange)/
/Test System for Quantitative Response Assay/Suitability Tests/Sample Suitability Tests/choice/Equivalence Test (Scaled ParameterRange)/
10.8.469 Upper margin (calculated value)Select how you want to define the Upper margin of the test. The following options are availablefrom the drop-down list:
• Calculated value: Selects the corresponding Upper margin from the margins you developed.
• Manual input: Allows you to enter a decimal number to set the Upper margin manually.
381

This element has the following attributes:
Data type Multiplicity Usage Default value
T_Empty 0...1 required none
Context:/Equivalence Margin Development for Biological Assays/Test Strategies/Strategy/Equivalence Tests - Difference of ParameterEstimates/A Upper Asymptote (Nonlinear Models)/choice/
/Equivalence Margin Development for Biological Assays/Test Strategies/Strategy/Equivalence Tests - Difference of ParameterEstimates/B Parameter (Nonlinear Models)/choice/
/Equivalence Margin Development for Biological Assays/Test Strategies/Strategy/Equivalence Tests - Difference of ParameterEstimates/C Parameter (Nonlinear Models)/choice/
/Equivalence Margin Development for Biological Assays/Test Strategies/Strategy/Equivalence Tests - Difference of ParameterEstimates/D Lower Asymptote (Nonlinear Models)/choice/
/Equivalence Margin Development for Biological Assays/Test Strategies/Strategy/Equivalence Tests - Difference of ParameterEstimates/G Asymmetry Parameter (Nonlinear Models)/choice/
/Equivalence Margin Development for Biological Assays/Test Strategies/Strategy/Equivalence Tests - Difference of ParameterEstimates/Slope (Linear Models)/choice/
/Equivalence Margin Development for Biological Assays/Test Strategies/Strategy/Equivalence Tests - Difference of ParameterEstimates/Intercept (Linear Models)/choice/
/Equivalence Margin Development for Biological Assays/Test Strategies/Strategy/Equivalence Tests - Difference of ParameterEstimates/A-D Difference of Asymptotes (Nonlinear Models)/choice/
/Equivalence Margin Development for Biological Assays/Test Strategies/Strategy/Equivalence Tests - Ratio of Parameter Estimates/AUpper Asymptote (Nonlinear Models)/choice/
/Equivalence Margin Development for Biological Assays/Test Strategies/Strategy/Equivalence Tests - Ratio of Parameter Estimates/BParameter (Nonlinear Models)/choice/
/Equivalence Margin Development for Biological Assays/Test Strategies/Strategy/Equivalence Tests - Ratio of Parameter Estimates/CParameter (Nonlinear Models)/choice/
/Equivalence Margin Development for Biological Assays/Test Strategies/Strategy/Equivalence Tests - Ratio of Parameter Estimates/DLower Asymptote (Nonlinear Models)/choice/
/Equivalence Margin Development for Biological Assays/Test Strategies/Strategy/Equivalence Tests - Ratio of Parameter Estimates/GAsymmetry Parameter (Nonlinear Models)/choice/
/Equivalence Margin Development for Biological Assays/Test Strategies/Strategy/Equivalence Tests - Ratio of Parameter Estimates/Slope (Linear Models)/choice/
/Equivalence Margin Development for Biological Assays/Test Strategies/Strategy/Equivalence Tests - Ratio of Parameter Estimates/Intercept (Linear Models)/choice/
/Equivalence Margin Development for Biological Assays/Test Strategies/Strategy/Equivalence Tests - Ratio of Parameter Estimates/A-D Difference of Asymptotes (Nonlinear Models)/choice/
/Equivalence Margin Development for Biological Assays/Test Strategies/Strategy/Point Estimate Tests - Difference of ParameterEstimates/A Upper Asymptote (Nonlinear Models)/choice/
/Equivalence Margin Development for Biological Assays/Test Strategies/Strategy/Point Estimate Tests - Difference of ParameterEstimates/B Parameter (Nonlinear Models)/choice/
/Equivalence Margin Development for Biological Assays/Test Strategies/Strategy/Point Estimate Tests - Difference of ParameterEstimates/C Parameter (Nonlinear Models)/choice/
/Equivalence Margin Development for Biological Assays/Test Strategies/Strategy/Point Estimate Tests - Difference of ParameterEstimates/D Lower Asymptote (Nonlinear Models)/choice/
/Equivalence Margin Development for Biological Assays/Test Strategies/Strategy/Point Estimate Tests - Difference of ParameterEstimates/G Asymmetry Parameter (Nonlinear Models)/choice/
/Equivalence Margin Development for Biological Assays/Test Strategies/Strategy/Point Estimate Tests - Difference of ParameterEstimates/Slope (Linear Models)/choice/
/Equivalence Margin Development for Biological Assays/Test Strategies/Strategy/Point Estimate Tests - Difference of ParameterEstimates/Intercept (Linear Models)/choice/
382

Reference Guide | Biological Assay Package Version 26
/Equivalence Margin Development for Biological Assays/Test Strategies/Strategy/Point Estimate Tests - Difference of ParameterEstimates/A-D Difference of Asymptotes (Nonlinear Models)/choice/
/Equivalence Margin Development for Biological Assays/Test Strategies/Strategy/Point Estimate Tests - Ratio of Parameter Estimates/A Upper Asymptote (Nonlinear Models)/choice/
/Equivalence Margin Development for Biological Assays/Test Strategies/Strategy/Point Estimate Tests - Ratio of Parameter Estimates/B Parameter (Nonlinear Models)/choice/
/Equivalence Margin Development for Biological Assays/Test Strategies/Strategy/Point Estimate Tests - Ratio of Parameter Estimates/C Parameter (Nonlinear Models)/choice/
/Equivalence Margin Development for Biological Assays/Test Strategies/Strategy/Point Estimate Tests - Ratio of Parameter Estimates/D Lower Asymptote (Nonlinear Models)/choice/
/Equivalence Margin Development for Biological Assays/Test Strategies/Strategy/Point Estimate Tests - Ratio of Parameter Estimates/G Asymmetry Parameter (Nonlinear Models)/choice/
/Equivalence Margin Development for Biological Assays/Test Strategies/Strategy/Point Estimate Tests - Ratio of Parameter Estimates/Slope (Linear Models)/choice/
/Equivalence Margin Development for Biological Assays/Test Strategies/Strategy/Point Estimate Tests - Ratio of Parameter Estimates/Intercept (Linear Models)/choice/
/Equivalence Margin Development for Biological Assays/Test Strategies/Strategy/Point Estimate Tests - Ratio of Parameter Estimates/A-D Difference of Asymptotes (Nonlinear Models)/choice/
/Equivalence Margin Development for Biological Assays/Test Strategies/Strategy/Tests: Normalized difference of asymptotes/Test -Normalized difference of upper asymptotes/choice/
/Equivalence Margin Development for Biological Assays/Test Strategies/Strategy/Tests: Normalized difference of asymptotes/Test -Normalized difference of lower asymptotes/choice/
/Equivalence Margin Development for Biological Assays/Test Strategies/Strategy/Additional Tests/Test - Sum of Squares Regression/choice/
/Equivalence Margin Development for Biological Assays/Test Strategies/Strategy/Additional Tests/Test - Ratio sum of squares non-linearity to sum of squares regression/choice/
/Equivalence Margin Development for Biological Assays/Test Strategies/Strategy/Additional Tests/Test - Residual Error/choice/
/Equivalence Margin Development for Biological Assays/Test Strategies/Strategy/Additional Tests/Test - Pure Error/choice/
/Equivalence Margin Development for Biological Assays/Test Strategies/Strategy/Additional Tests/Test - Sum of Squares Non-Parallelism/choice/
/Equivalence Margin Development for Biological Assays/Test Strategies/Strategy/Additional Tests/Test - Sum of Squares Non-Linearity/Test - Sum of Squares Non-Linearity/choice/
/Equivalence Margin Development for Biological Assays/Test Strategies/Strategy/Additional Tests/Test - Sum of Squares Non-Linearity/Test - Sum of Squares Non-Linearity - Assay Element: Standard/choice/
/Equivalence Margin Development for Biological Assays/Test Strategies/Strategy/Additional Tests/Test - Sum of Squares Non-Linearity/Test - Sum of Squares Non-Linearity - Assay Element: Test/Control/choice/
/Equivalence Margin Development for Biological Assays/Test Strategies/Strategy/Equivalence Tests - Parameter Estimate/A UpperAsymptote (Nonlinear Models)/choice/
/Equivalence Margin Development for Biological Assays/Test Strategies/Strategy/Equivalence Tests - Parameter Estimate/B Parameter(Nonlinear Models)/choice/
/Equivalence Margin Development for Biological Assays/Test Strategies/Strategy/Equivalence Tests - Parameter Estimate/C Parameter(Nonlinear Models)/choice/
/Equivalence Margin Development for Biological Assays/Test Strategies/Strategy/Equivalence Tests - Parameter Estimate/D LowerAsymptote (Nonlinear Models)/choice/
/Equivalence Margin Development for Biological Assays/Test Strategies/Strategy/Equivalence Tests - Parameter Estimate/GAsymmetry Parameter (Nonlinear Models)/choice/
/Equivalence Margin Development for Biological Assays/Test Strategies/Strategy/Equivalence Tests - Parameter Estimate/Slope(Linear Models)/choice/
/Equivalence Margin Development for Biological Assays/Test Strategies/Strategy/Equivalence Tests - Parameter Estimate/Intercept(Linear Models)/choice/
/Equivalence Margin Development for Biological Assays/Test Strategies/Strategy/Equivalence Tests - Parameter Estimate/A-DDifference of Asymptotes (Nonlinear Models)/choice/
/Equivalence Margin Development for Biological Assays/Test Strategies/Strategy/Equivalence Tests - Parameter Estimate/A/D Ratio ofAsymptotes (Nonlinear Models)/choice/
383
/Equivalence Margin Development for Biological Assays/Test Strategies/Strategy/Point Estimate Tests - Parameter Estimate/A UpperAsymptote (Nonlinear Models)/choice/
/Equivalence Margin Development for Biological Assays/Test Strategies/Strategy/Point Estimate Tests - Parameter Estimate/BParameter (Nonlinear Models)/choice/
/Equivalence Margin Development for Biological Assays/Test Strategies/Strategy/Point Estimate Tests - Parameter Estimate/CParameter (Nonlinear Models)/choice/
/Equivalence Margin Development for Biological Assays/Test Strategies/Strategy/Point Estimate Tests - Parameter Estimate/D LowerAsymptote (Nonlinear Models)/choice/
/Equivalence Margin Development for Biological Assays/Test Strategies/Strategy/Point Estimate Tests - Parameter Estimate/GAsymmetry Parameter (Nonlinear Models)/choice/
/Equivalence Margin Development for Biological Assays/Test Strategies/Strategy/Point Estimate Tests - Parameter Estimate/Slope(Linear Models)/choice/
/Equivalence Margin Development for Biological Assays/Test Strategies/Strategy/Point Estimate Tests - Parameter Estimate/Intercept(Linear Models)/choice/
/Equivalence Margin Development for Biological Assays/Test Strategies/Strategy/Point Estimate Tests - Parameter Estimate/Slope(Nonlinear Models)/choice/
/Equivalence Margin Development for Biological Assays/Test Strategies/Strategy/Point Estimate Tests - Parameter Estimate/A-DDifference of Asymptotes (Nonlinear Models)/choice/
/Equivalence Margin Development for Biological Assays/Test Strategies/Strategy/Point Estimate Tests - Parameter Estimate/A/D Ratioof Asymptotes (Nonlinear Models)/choice/
/Equivalence Margin Development for Biological Assays/Test Strategies/Strategy/Equivalence Tests - Scaled Parameter Range/AUpper Asymptote (Nonlinear Models)/choice/
/Equivalence Margin Development for Biological Assays/Test Strategies/Strategy/Equivalence Tests - Scaled Parameter Range/BParameter (Nonlinear Models)/choice/
/Equivalence Margin Development for Biological Assays/Test Strategies/Strategy/Equivalence Tests - Scaled Parameter Range/CParameter (Nonlinear Models)/choice/
/Equivalence Margin Development for Biological Assays/Test Strategies/Strategy/Equivalence Tests - Scaled Parameter Range/DLower Asymptote (Nonlinear Models)/choice/
/Equivalence Margin Development for Biological Assays/Test Strategies/Strategy/Equivalence Tests - Scaled Parameter Range/GAsymmetry Parameter (Nonlinear Models)/choice/
/Equivalence Margin Development for Biological Assays/Test Strategies/Strategy/Equivalence Tests - Scaled Parameter Range/Slope(Linear Models)/choice/
/Equivalence Margin Development for Biological Assays/Test Strategies/Strategy/Equivalence Tests - Scaled Parameter Range/Intercept (Linear Models)/choice/
/Equivalence Margin Development for Biological Assays/Test Strategies/Strategy/Equivalence Tests - Scaled Parameter Range/A-DDifference of Asymptotes (Nonlinear Models, Standard only)/choice/
10.8.470 Upper margin (manual input)Select how you want to define the Upper margin of the test. The following options are availablefrom the drop-down list:
• Calculated value: Selects the corresponding Upper margin from the margins you developed.
• Manual input: Allows you to enter a decimal number to set the Upper margin manually.
This element has the following attributes:
Data type Multiplicity Usage Default value
xs:double 0...1 required none
Context:
384

Reference Guide | Biological Assay Package Version 26
/Equivalence Margin Development for Biological Assays/Test Strategies/Strategy/Equivalence Tests - Difference of ParameterEstimates/A Upper Asymptote (Nonlinear Models)/choice/
/Equivalence Margin Development for Biological Assays/Test Strategies/Strategy/Equivalence Tests - Difference of ParameterEstimates/B Parameter (Nonlinear Models)/choice/
/Equivalence Margin Development for Biological Assays/Test Strategies/Strategy/Equivalence Tests - Difference of ParameterEstimates/C Parameter (Nonlinear Models)/choice/
/Equivalence Margin Development for Biological Assays/Test Strategies/Strategy/Equivalence Tests - Difference of ParameterEstimates/D Lower Asymptote (Nonlinear Models)/choice/
/Equivalence Margin Development for Biological Assays/Test Strategies/Strategy/Equivalence Tests - Difference of ParameterEstimates/G Asymmetry Parameter (Nonlinear Models)/choice/
/Equivalence Margin Development for Biological Assays/Test Strategies/Strategy/Equivalence Tests - Difference of ParameterEstimates/Slope (Linear Models)/choice/
/Equivalence Margin Development for Biological Assays/Test Strategies/Strategy/Equivalence Tests - Difference of ParameterEstimates/Intercept (Linear Models)/choice/
/Equivalence Margin Development for Biological Assays/Test Strategies/Strategy/Equivalence Tests - Difference of ParameterEstimates/A-D Difference of Asymptotes (Nonlinear Models)/choice/
/Equivalence Margin Development for Biological Assays/Test Strategies/Strategy/Equivalence Tests - Ratio of Parameter Estimates/AUpper Asymptote (Nonlinear Models)/choice/
/Equivalence Margin Development for Biological Assays/Test Strategies/Strategy/Equivalence Tests - Ratio of Parameter Estimates/BParameter (Nonlinear Models)/choice/
/Equivalence Margin Development for Biological Assays/Test Strategies/Strategy/Equivalence Tests - Ratio of Parameter Estimates/CParameter (Nonlinear Models)/choice/
/Equivalence Margin Development for Biological Assays/Test Strategies/Strategy/Equivalence Tests - Ratio of Parameter Estimates/DLower Asymptote (Nonlinear Models)/choice/
/Equivalence Margin Development for Biological Assays/Test Strategies/Strategy/Equivalence Tests - Ratio of Parameter Estimates/GAsymmetry Parameter (Nonlinear Models)/choice/
/Equivalence Margin Development for Biological Assays/Test Strategies/Strategy/Equivalence Tests - Ratio of Parameter Estimates/Slope (Linear Models)/choice/
/Equivalence Margin Development for Biological Assays/Test Strategies/Strategy/Equivalence Tests - Ratio of Parameter Estimates/Intercept (Linear Models)/choice/
/Equivalence Margin Development for Biological Assays/Test Strategies/Strategy/Equivalence Tests - Ratio of Parameter Estimates/A-D Difference of Asymptotes (Nonlinear Models)/choice/
/Equivalence Margin Development for Biological Assays/Test Strategies/Strategy/Point Estimate Tests - Difference of ParameterEstimates/A Upper Asymptote (Nonlinear Models)/choice/
/Equivalence Margin Development for Biological Assays/Test Strategies/Strategy/Point Estimate Tests - Difference of ParameterEstimates/B Parameter (Nonlinear Models)/choice/
/Equivalence Margin Development for Biological Assays/Test Strategies/Strategy/Point Estimate Tests - Difference of ParameterEstimates/C Parameter (Nonlinear Models)/choice/
/Equivalence Margin Development for Biological Assays/Test Strategies/Strategy/Point Estimate Tests - Difference of ParameterEstimates/D Lower Asymptote (Nonlinear Models)/choice/
/Equivalence Margin Development for Biological Assays/Test Strategies/Strategy/Point Estimate Tests - Difference of ParameterEstimates/G Asymmetry Parameter (Nonlinear Models)/choice/
/Equivalence Margin Development for Biological Assays/Test Strategies/Strategy/Point Estimate Tests - Difference of ParameterEstimates/Slope (Linear Models)/choice/
/Equivalence Margin Development for Biological Assays/Test Strategies/Strategy/Point Estimate Tests - Difference of ParameterEstimates/Intercept (Linear Models)/choice/
/Equivalence Margin Development for Biological Assays/Test Strategies/Strategy/Point Estimate Tests - Difference of ParameterEstimates/A-D Difference of Asymptotes (Nonlinear Models)/choice/
/Equivalence Margin Development for Biological Assays/Test Strategies/Strategy/Point Estimate Tests - Ratio of Parameter Estimates/A Upper Asymptote (Nonlinear Models)/choice/
/Equivalence Margin Development for Biological Assays/Test Strategies/Strategy/Point Estimate Tests - Ratio of Parameter Estimates/B Parameter (Nonlinear Models)/choice/
/Equivalence Margin Development for Biological Assays/Test Strategies/Strategy/Point Estimate Tests - Ratio of Parameter Estimates/C Parameter (Nonlinear Models)/choice/
385

/Equivalence Margin Development for Biological Assays/Test Strategies/Strategy/Point Estimate Tests - Ratio of Parameter Estimates/D Lower Asymptote (Nonlinear Models)/choice/
/Equivalence Margin Development for Biological Assays/Test Strategies/Strategy/Point Estimate Tests - Ratio of Parameter Estimates/G Asymmetry Parameter (Nonlinear Models)/choice/
/Equivalence Margin Development for Biological Assays/Test Strategies/Strategy/Point Estimate Tests - Ratio of Parameter Estimates/Slope (Linear Models)/choice/
/Equivalence Margin Development for Biological Assays/Test Strategies/Strategy/Point Estimate Tests - Ratio of Parameter Estimates/Intercept (Linear Models)/choice/
/Equivalence Margin Development for Biological Assays/Test Strategies/Strategy/Point Estimate Tests - Ratio of Parameter Estimates/A-D Difference of Asymptotes (Nonlinear Models)/choice/
/Equivalence Margin Development for Biological Assays/Test Strategies/Strategy/Tests: Normalized difference of asymptotes/Test -Normalized difference of upper asymptotes/choice/
/Equivalence Margin Development for Biological Assays/Test Strategies/Strategy/Tests: Normalized difference of asymptotes/Test -Normalized difference of lower asymptotes/choice/
/Equivalence Margin Development for Biological Assays/Test Strategies/Strategy/Additional Tests/Test - Sum of Squares Regression/choice/
/Equivalence Margin Development for Biological Assays/Test Strategies/Strategy/Additional Tests/Test - Ratio sum of squares non-linearity to sum of squares regression/choice/
/Equivalence Margin Development for Biological Assays/Test Strategies/Strategy/Additional Tests/Test - Residual Error/choice/
/Equivalence Margin Development for Biological Assays/Test Strategies/Strategy/Additional Tests/Test - Pure Error/choice/
/Equivalence Margin Development for Biological Assays/Test Strategies/Strategy/Additional Tests/Test - Sum of Squares Non-Parallelism/choice/
/Equivalence Margin Development for Biological Assays/Test Strategies/Strategy/Additional Tests/Test - Sum of Squares Non-Linearity/Test - Sum of Squares Non-Linearity/choice/
/Equivalence Margin Development for Biological Assays/Test Strategies/Strategy/Additional Tests/Test - Sum of Squares Non-Linearity/Test - Sum of Squares Non-Linearity - Assay Element: Standard/choice/
/Equivalence Margin Development for Biological Assays/Test Strategies/Strategy/Additional Tests/Test - Sum of Squares Non-Linearity/Test - Sum of Squares Non-Linearity - Assay Element: Test/Control/choice/
/Equivalence Margin Development for Biological Assays/Test Strategies/Strategy/Equivalence Tests - Parameter Estimate/A UpperAsymptote (Nonlinear Models)/choice/
/Equivalence Margin Development for Biological Assays/Test Strategies/Strategy/Equivalence Tests - Parameter Estimate/B Parameter(Nonlinear Models)/choice/
/Equivalence Margin Development for Biological Assays/Test Strategies/Strategy/Equivalence Tests - Parameter Estimate/C Parameter(Nonlinear Models)/choice/
/Equivalence Margin Development for Biological Assays/Test Strategies/Strategy/Equivalence Tests - Parameter Estimate/D LowerAsymptote (Nonlinear Models)/choice/
/Equivalence Margin Development for Biological Assays/Test Strategies/Strategy/Equivalence Tests - Parameter Estimate/GAsymmetry Parameter (Nonlinear Models)/choice/
/Equivalence Margin Development for Biological Assays/Test Strategies/Strategy/Equivalence Tests - Parameter Estimate/Slope(Linear Models)/choice/
/Equivalence Margin Development for Biological Assays/Test Strategies/Strategy/Equivalence Tests - Parameter Estimate/Intercept(Linear Models)/choice/
/Equivalence Margin Development for Biological Assays/Test Strategies/Strategy/Equivalence Tests - Parameter Estimate/A-DDifference of Asymptotes (Nonlinear Models)/choice/
/Equivalence Margin Development for Biological Assays/Test Strategies/Strategy/Equivalence Tests - Parameter Estimate/A/D Ratio ofAsymptotes (Nonlinear Models)/choice/
/Equivalence Margin Development for Biological Assays/Test Strategies/Strategy/Point Estimate Tests - Parameter Estimate/A UpperAsymptote (Nonlinear Models)/choice/
/Equivalence Margin Development for Biological Assays/Test Strategies/Strategy/Point Estimate Tests - Parameter Estimate/BParameter (Nonlinear Models)/choice/
/Equivalence Margin Development for Biological Assays/Test Strategies/Strategy/Point Estimate Tests - Parameter Estimate/CParameter (Nonlinear Models)/choice/
/Equivalence Margin Development for Biological Assays/Test Strategies/Strategy/Point Estimate Tests - Parameter Estimate/D LowerAsymptote (Nonlinear Models)/choice/
386
Reference Guide | Biological Assay Package Version 26
/Equivalence Margin Development for Biological Assays/Test Strategies/Strategy/Point Estimate Tests - Parameter Estimate/GAsymmetry Parameter (Nonlinear Models)/choice/
/Equivalence Margin Development for Biological Assays/Test Strategies/Strategy/Point Estimate Tests - Parameter Estimate/Slope(Linear Models)/choice/
/Equivalence Margin Development for Biological Assays/Test Strategies/Strategy/Point Estimate Tests - Parameter Estimate/Intercept(Linear Models)/choice/
/Equivalence Margin Development for Biological Assays/Test Strategies/Strategy/Point Estimate Tests - Parameter Estimate/Slope(Nonlinear Models)/choice/
/Equivalence Margin Development for Biological Assays/Test Strategies/Strategy/Point Estimate Tests - Parameter Estimate/A-DDifference of Asymptotes (Nonlinear Models)/choice/
/Equivalence Margin Development for Biological Assays/Test Strategies/Strategy/Point Estimate Tests - Parameter Estimate/A/D Ratioof Asymptotes (Nonlinear Models)/choice/
/Equivalence Margin Development for Biological Assays/Test Strategies/Strategy/Equivalence Tests - Scaled Parameter Range/AUpper Asymptote (Nonlinear Models)/choice/
/Equivalence Margin Development for Biological Assays/Test Strategies/Strategy/Equivalence Tests - Scaled Parameter Range/BParameter (Nonlinear Models)/choice/
/Equivalence Margin Development for Biological Assays/Test Strategies/Strategy/Equivalence Tests - Scaled Parameter Range/CParameter (Nonlinear Models)/choice/
/Equivalence Margin Development for Biological Assays/Test Strategies/Strategy/Equivalence Tests - Scaled Parameter Range/DLower Asymptote (Nonlinear Models)/choice/
/Equivalence Margin Development for Biological Assays/Test Strategies/Strategy/Equivalence Tests - Scaled Parameter Range/GAsymmetry Parameter (Nonlinear Models)/choice/
/Equivalence Margin Development for Biological Assays/Test Strategies/Strategy/Equivalence Tests - Scaled Parameter Range/Slope(Linear Models)/choice/
/Equivalence Margin Development for Biological Assays/Test Strategies/Strategy/Equivalence Tests - Scaled Parameter Range/Intercept (Linear Models)/choice/
/Equivalence Margin Development for Biological Assays/Test Strategies/Strategy/Equivalence Tests - Scaled Parameter Range/A-DDifference of Asymptotes (Nonlinear Models, Standard only)/choice/
10.8.471 NameAutomatically inserts the user name of the current user.
This element has the following attributes:
Data type Multiplicity Usage Default value
xs:token 1...1 required none
Context:
10.8.472 User instructionsEnter text to be displayed in the User instructions section of the dashboard. User instructions areintended for template designers.
Tip: You can enter multiline text and add Markdown tagging to format User instructions.
This element has the following attributes:
Data type Multiplicity Usage Default value
387

xs:string 0...unbounded optional none
Context:/Basic Bioassay Protocol/Documentation/
/Combination of Independent Assay Results/Documentation/
/Dichotomous Assay (Quantal Response Assay)/Documentation/
/Quantitative Response Assay/Documentation/
10.8.473 Login nameAutomatically inserts the login name of the current user.
This element has the following attributes:
Data type Multiplicity Usage Default value
xs:NCName 1...1 required none
Context:
10.8.474 KeyEnter a key to identify the user variable.
This element has the following attributes:
Data type Multiplicity Usage Default value
xs:token 1...1 required none
Context:/Combination of Independent Assay Results/Documentation/User Variable/
/Dichotomous Assay (Quantal Response Assay)/Documentation/User Variable/
/Dichotomous Assay (Quantal Response Assay)/Setup/Assay Elements/Standard Sample/User Variable/
/Dichotomous Assay (Quantal Response Assay)/Setup/Assay Elements/Test Sample/User Variable/
/Dichotomous Assay (Quantal Response Assay)/Setup/Assay Elements/Control Sample/User Variable/
/Quantitative Response Assay/Documentation/User Variable/
/Quantitative Response Assay/Setup/Assay Elements/Standard Sample/User Variable/
/Quantitative Response Assay/Setup/Assay Elements/Test Sample/User Variable/
/Quantitative Response Assay/Setup/Assay Elements/Control Sample/User Variable/
/Quantitative Response Assay/Setup/Assay Elements/Control Line/User Variable/
10.8.475 User variableDefine user variables for custom reports/ custom component packages. They have nofunctionality in standard reports/ standard component packages.
388

Reference Guide | Biological Assay Package Version 26
This element has the following attributes:
Data type Multiplicity Usage Default value
xs:empty 0...unbounded optional none
Context:/Combination of Independent Assay Results/Documentation/
/Dichotomous Assay (Quantal Response Assay)/Documentation/
/Dichotomous Assay (Quantal Response Assay)/Setup/Assay Elements/Standard Sample/
/Dichotomous Assay (Quantal Response Assay)/Setup/Assay Elements/Test Sample/
/Dichotomous Assay (Quantal Response Assay)/Setup/Assay Elements/Control Sample/
/Quantitative Response Assay/Documentation/
/Quantitative Response Assay/Setup/Assay Elements/Standard Sample/
/Quantitative Response Assay/Setup/Assay Elements/Test Sample/
/Quantitative Response Assay/Setup/Assay Elements/Control Sample/
/Quantitative Response Assay/Setup/Assay Elements/Control Line/
10.8.476 KeyEnter a key to identify the user variable.
This element has the following attributes:
Data type Multiplicity Usage Default value
xs:empty 1...1 required none
Context:/Dichotomous Assay (Quantal Response Assay)/Analysis/Suitability Tests/Document Suitability Tests/Test on User Variable/
/Quantitative Response Assay/Analysis/Suitability Tests/Document Suitability Tests/Test on User Variable/
/Test System for Quantitative Response Assay/Suitability Tests/Document Suitability Tests/Test on User Variable/
10.8.477 ValueEnter the value you want to use in custom reports/ custom component packages.
Tip: Tip: You can enter multiline text.
This element has the following attributes:
Data type Multiplicity Usage Default value
xs:empty 0...1 optional none
Context:
389

/Dichotomous Assay (Quantal Response Assay)/Analysis/Suitability Tests/Document Suitability Tests/Test on User Variable/
/Quantitative Response Assay/Analysis/Suitability Tests/Document Suitability Tests/Test on User Variable/
/Test System for Quantitative Response Assay/Suitability Tests/Document Suitability Tests/Test on User Variable/
10.8.478 ValueEnter the value you want to use in custom reports/ custom component packages.
Tip: Tip: You can enter multiline text.
This element has the following attributes:
Data type Multiplicity Usage Default value
xs:empty 0...1 optional none
Context:/Combination of Independent Assay Results/Documentation/User Variable/
/Dichotomous Assay (Quantal Response Assay)/Documentation/User Variable/
/Dichotomous Assay (Quantal Response Assay)/Setup/Assay Elements/Standard Sample/User Variable/
/Dichotomous Assay (Quantal Response Assay)/Setup/Assay Elements/Test Sample/User Variable/
/Dichotomous Assay (Quantal Response Assay)/Setup/Assay Elements/Control Sample/User Variable/
/Quantitative Response Assay/Documentation/User Variable/
/Quantitative Response Assay/Setup/Assay Elements/Standard Sample/User Variable/
/Quantitative Response Assay/Setup/Assay Elements/Test Sample/User Variable/
/Quantitative Response Assay/Setup/Assay Elements/Control Sample/User Variable/
/Quantitative Response Assay/Setup/Assay Elements/Control Line/User Variable/
10.8.479 Valid for replicateEnter a valid replicate number to specify which replicate you want to generate based on thistemplate.
Note: Note: If an assay replicate is requested and no Assay template has its numberassigned, the Assay template without Valid for replicate element is used. You cannot assign morethan one template to the same replicate number.
This element has the following attributes:
Data type Multiplicity Usage Default value
xs:positiveInteger 0...unbounded optional none
Context:/Basic Bioassay Protocol/Templates/Assay Templates/Assay Template/
390

Reference Guide | Biological Assay Package Version 26
10.8.480 Verification assayMarks dataset rows as verification assays. Rows marked as verification assays (value set to 'true')are used to test derived margins.
Important: Important: To use a row as verification assay, also set the value of theDevelopment assay column to 'false'.
Tip: Tip: Use the Scientifically acceptable column to indicate whether you expect theverification assay will be accepted or rejected.
This element has the following attributes:
Data type Multiplicity Usage Default value
T_VerificationData 1...1 required none
Context:/Equivalence Margin Development for Biological Assays/Datatable/
10.8.481 Display vertical linesSelect the 'true' option from the drop-down list to add vertical grid lines to your plots.
This element has the following attributes:
Data type Multiplicity Usage Default value
xs:boolean 0...1 required none
Context:/Control Chart/Charts/Chart/Graphics Settings/
/Dichotomous Assay (Quantal Response Assay)/Settings/Graphics/Linear Predictor: Data Plot/
/Dichotomous Assay (Quantal Response Assay)/Settings/Graphics/Linear Predictor: Full Model/
/Dichotomous Assay (Quantal Response Assay)/Settings/Graphics/Linear Predictor: Restricted Model/
/Dichotomous Assay (Quantal Response Assay)/Settings/Graphics/Probability: Data Plot/
/Dichotomous Assay (Quantal Response Assay)/Settings/Graphics/Probability: Full Model/
/Dichotomous Assay (Quantal Response Assay)/Settings/Graphics/Probability: Restricted Model/
/Quantitative Response Assay/Settings/Graphics/Data Plot/
/Quantitative Response Assay/Settings/Graphics/Full Model/
/Quantitative Response Assay/Settings/Graphics/Restricted Model/
10.8.482 Degrees of freedomEnter an integer to be used as degrees of freedom of the t-distribution in visualization.
391

Note: Note: This value only applies if no assays are referenced. Otherwise, the degrees offreedom of the referenced assays are used.
This element has the following attributes:
Data type Multiplicity Usage Default value
xs:integer 0...1 required none
Context:/Equivalence Margin Development for Biological Assays/Visualization/
10.8.483 Logarithm baseSelect the logarithm base you require for visualization.
Note: Note: This selection only applies if no assays are referenced. Otherwise, the logarithmbase of the referenced assays is used.
This element has the following attributes:
Data type Multiplicity Usage Default value
xs:empty 0...1 required none
Context:/Equivalence Margin Development for Biological Assays/Visualization/
10.8.484 ModelSelect the model you require for visualization.
Note: Note: This selection only applies if no assays are referenced. Otherwise, the model ofthe referenced assays is used.
This element has the following attributes:
Data type Multiplicity Usage Default value
xs:empty 0...1 required none
Context:/Equivalence Margin Development for Biological Assays/Visualization/
392

Reference Guide | Biological Assay Package Version 26
10.8.485 VisualizationThis section allows you to set the parameters you require for simulation. Expand the node to addor view information.
Simulations sample possible configurations of the parameters that come with the modelof referenced assays. The tests selected in the Test strategies section are applied to eachconfiguration:
• Configurations that do not pass all tests are rejected.
• Configurations that pass all tests are plotted in the report.
The graphs of the report provide an overview of the assays that pass all tests within selectedmargins.
Note: Note: Default values are used for simulation parameters you do not specify or delete.
Tip: Tip: You can also visualize existing test systems if you have no related assays available.Enter the required values in the Test strategies and Visualization sections manually.
This element has the following attributes:
Data type Multiplicity Usage Default value
xs:empty 1...1 optional none
Context:/Equivalence Margin Development for Biological Assays/
10.8.486 WeightingSelect the method according to which the combination calculation should be performed. Thefollowing options are available from the drop-down list:
• by homogeneity: The system decides which method to use, based on the result of the Chi-square test on homogeneity.
• homogeneously weighted: The calculation is done using homogeneous weighting.
• heterogeneously weighted: The calculation is done using heterogeneous weighting.
• unweighted: The calculation is done without any weighting.
Note: Note: Select the type of heterogeneous weighting that you want to use from theWeighting type drop-down list.
This element has the following attributes:
Data type Multiplicity Usage Default value
393

xs:empty 1...1 required none
Context:/Combination of Independent Assay Results/
10.8.487 Weighting typeWe support several types of heterogeneously weighted combination calculations. The followingoptions are available from the drop-down list:
• EP: The weighting is done as described in the European Pharmacopoeia.
• USP<111>: The heterogeneous weighting is done as described in chapter 111 of the USPharamcopeia. This type is also referred to as semi-weighting.
• USP<1034>: The heterogeneous weighting is done as described in the (new) chapter 1034 ofthe US Pharamcopeia.
Note: Note: Please consult the corresponding USP and EP chapters for a detaileddescription of the different methods.
This element has the following attributes:
Data type Multiplicity Usage Default value
xs:empty 1...1 required none
Context:/Combination of Independent Assay Results/
10.8.488 Intercept (linear models)Use this test for the following models:
• Linear parallel-line model
• Slope ratio model
This element has the following attributes:
Data type Multiplicity Usage Default value
T_SingleTestStrategyWithScope 0...1 optional none
Context:/Equivalence Margin Development for Biological Assays/Test Strategies/Strategy/Equivalence Tests - Parameter Estimate/
/Equivalence Margin Development for Biological Assays/Test Strategies/Strategy/Equivalence Tests - Difference of ParameterEstimates/
/Equivalence Margin Development for Biological Assays/Test Strategies/Strategy/Equivalence Tests - Ratio of Parameter Estimates/
394

Reference Guide | Biological Assay Package Version 26
/Equivalence Margin Development for Biological Assays/Test Strategies/Strategy/Equivalence Tests - Scaled Parameter Range/
/Equivalence Margin Development for Biological Assays/Test Strategies/Strategy/Point Estimate Tests - Parameter Estimate/
/Equivalence Margin Development for Biological Assays/Test Strategies/Strategy/Point Estimate Tests - Difference of ParameterEstimates/
/Equivalence Margin Development for Biological Assays/Test Strategies/Strategy/Point Estimate Tests - Ratio of Parameter Estimates/
/Equivalence Margin Development for Biological Assays/Margin Development/Equivalence Tests - Parameter Estimate/
/Equivalence Margin Development for Biological Assays/Margin Development/Equivalence Tests - Difference of Parameter Estimates/
/Equivalence Margin Development for Biological Assays/Margin Development/Equivalence Tests - Ratio of Parameter Estimates/
/Equivalence Margin Development for Biological Assays/Margin Development/Equivalence Tests - Scaled Parameter Range/
/Equivalence Margin Development for Biological Assays/Margin Development/Point Estimate Tests - Parameter Estimate/
/Equivalence Margin Development for Biological Assays/Margin Development/Point Estimate Tests - Difference of ParameterEstimates/
/Equivalence Margin Development for Biological Assays/Margin Development/Point Estimate Tests - Ratio of Parameter Estimates/
/Equivalence Margin Development for Biological Assays/Visualization/Simulation Space/
10.8.489 Chi-square test / Z-test (hypothesis test)Add one or several Chi-square tests/ Z-tests to your assay. The following Types are available:
Chi-square tests
• Significance of non-parallelism
• Significance of non-linearity (lack of fit)
• Significance of non-linearity (lack of fit) for a single assay element
Z-tests
• Significance of the square coefficient
• Significance of the square coefficient for a single assay element
This element has the following attributes:
Data type Multiplicity Usage Default value
xs:empty 0...unbounded optional none
Context:/Dichotomous Assay (Quantal Response Assay)/Analysis/Suitability Tests/Assay Suitability Tests/
/Dichotomous Assay (Quantal Response Assay)/Analysis/Suitability Tests/Sample Suitability Tests/
10.8.490 Type of Chi-square test / Z-testSelect the Chi-square or Z-test Type you want to use from the drop-down list. Please consult thehelp page on the Chi-square test/ Z-test (hypothesis test) for additional information.
This element has the following attributes:
Data type Multiplicity Usage Default value
395

T_FTests 1...1 required none
Context:/Dichotomous Assay (Quantal Response Assay)/Analysis/Suitability Tests/Assay Suitability Tests/Chi-Square-Test / Z-Test (HypothesisTest)/
/Dichotomous Assay (Quantal Response Assay)/Analysis/Suitability Tests/Sample Suitability Tests/Chi-Square-Test / Z-Test(Hypothesis Test)/
396