ความสันพันธ์ระหว่างความพึงพอใจของลูกค้าในค...
18
Guoping Huang and Thitikan Satchabut Vol.5 No.1 January-June 2019 วารสารรังสิตบัณฑิตศึกษาในกลุ่มธุรกิจและสังคมศาสตร์ ปีที่ 5 ฉบับที่ 1 มกราคม-มิถุนายน 2562 120 ความสันพันธ์ระหว่างความพึงพอใจของลูกค้าในคุณภาพการบริการโลจิสติกส์และความผูกพันที่มีต่อ ตราสินค้าของลูกค้า E-commerceในประเทศจีน: การวิจัยของบริษัท S.F. Express (Group) Co., Ltd The Relationship between Customer Satisfaction with Logistics Service Quality and Customer Loyalty of China E-commerce Market: A Case of S.F. Express (Group) Co., Ltd Guoping Huang 1 and Thitikan Satchabut 2 10.14456/jrgbsrangsit.2019.9 บทคัดย่อ การวิจัยนี้แสดงให้เห็นถึงการศึกษาความสัมพันธ์ของคุณภาพการบริการด้านโลจิสติกส์ภายใต้โมเดล B2B และ B2C ของการพาณิชย์อิเลคทรอนิคส์และสถานการณ์การพาณิชย์อิเลคทรอนิคส์ปัจจุบันในประเทศจีน ซึ่งจะ โฟกัสที่การตีแผ่ความสัมพันธ์ความพึงพอใจของลูกค้าที่มีต่อคุณภาพของการให้บริการด้านโลจิสติกส์รวมไปถึง ความผูกพันของลูกค้าในตลาดพาณิชย์อิเลคทรอนิคส์ของประเทศจีน โมเดล B2C หรือ ธุรกิจที่ขายสินค้าหรือบริการ ให้กับลูกค้าหรือบุคคลทั่วไปที่รับบริการโลจิสติกส์ของเว็บสโตร์ถูกแบ่งเป็น 4 ประเภท ได้แก่ ประสิทธิภาพ (efficiency) การบรรลุ (fulfillment) ความพร้อม (availability) และความเป็นส่วนตัว (privacy) โดยแบบสอบถามทั้ง 485 ชุด นั้น จัดทาขึ้นมาเพื่อการวิเคราะห์ข้อมูลในการวิจัยนี้ ประกอบไปด้วย การวิเคราะห์เชิงพรรณนา การวิเคราะห์ ความเชื่อมั่น การวิเคราะห์ความเที่ยงตรง การวิเคราะห์องค์ประกอบเชิงยืนยัน และการวิเคราะห์การสร้างโมเดล สมการโครงสร้าง (SEM) ซึ่งได้ผลการวิเคราะห์ ดังนี้ คือ (1) ปัจจัยที่มีผลกระทบต่อความพึงพอใจและความผูกพันของลูกค้าที่มีต่อ แบรนด์มากที่สุดภายใต้การพาณิชย์อิเลคทรอนิคส์ซึ่งก็คือประสิทธิภาพ และ (2) คุณภาพของการบริการโลจิสติกส์มี ผลเชิงบวกต่อความพึงพอใจของลูกค้าและความพึงพอใจของลูกค้ามีผลสูงสุดต่อกับความภักดีต่อแบรนด์สินค้า คาสาคัญ : การบริการโลจิสติกส์ , การพาณิชย์อิเลคทรอนิคส์ , แบรนด์ของลูกค้า 1 นักศึกษาปริญญาโท หลักสูตรนานาชาติ สาขาวิชา ธุรกิจระหว่างประเทศ มหาวิทยาลัยหอการค้าไทย 2 อาจารย์ที่ปรึกษา สาขาวิชา ธุรกิจระหว่างประเทศ มหาวิทยาลัยหอการค้าไทย
-
Upload
khangminh22 -
Category
Documents
-
view
2 -
download
0
Transcript of ความสันพันธ์ระหว่างความพึงพอใจของลูกค้าในค...

Guoping Huang and Thitikan Satchabut Vol.5 No.1 January-June 2019
วารสารรังสิตบัณฑิตศึกษาในกลุ่มธุรกิจและสังคมศาสตร์ ปีที่ 5 ฉบับที่ 1 มกราคม-มิถุนายน 2562
120
ความสันพนัธ์ระหวา่งความพึงพอใจของลูกค้าในคุณภาพการบริการโลจิสติกส์และความผูกพันที่มีต่อตราสินค้าของลูกค้า E-commerceในประเทศจีน: การวิจัยของบริษัท S.F. Express (Group) Co., Ltd
The Relationship between Customer Satisfaction with Logistics Service Quality and Customer Loyalty of China E-commerce Market: A Case of S.F. Express (Group) Co., Ltd
Guoping Huang 1 and Thitikan Satchabut 2 10.14456/jrgbsrangsit.2019.9
บทคัดย่อ การวิจัยนี้แสดงให้เห็นถึงการศึกษาความสัมพันธ์ของคุณภาพการบริการด้านโลจิสติกส์ภายใต้โมเดล B2B
และ B2C ของการพาณิชย์อิเลคทรอนิคส์และสถานการณ์การพาณิชย์อิเลคทรอนิคส์ปัจจุบันในประเทศจีน ซึ่งจะโฟกัสท่ีการตีแผ่ความสัมพันธ์ความพึงพอใจของลูกค้าท่ีมีต่อคุณภาพของการให้บริการด้านโลจิสติกส์รวมไปถึงความผูกพันของลูกค้าในตลาดพาณิชย์อิเลคทรอนิคส์ของประเทศจีน โมเดล B2C หรือ ธุรกิจท่ีขายสินค้าหรือบริการให้กับลูกค้าหรือบุคคลท่ัวไปท่ีรับบริการโลจิสติกส์ของเว็บสโตร์ถูกแบ่งเป็น 4 ประเภท ได้แก่ ประสิทธิภาพ(efficiency) การบรรลุ (fulfillment) ความพร้อม (availability) และความเป็นส่วนตัว (privacy) โดยแบบสอบถามท้ัง 485 ชุด นั้น จัดท าขึ้นมาเพ่ือการวิเคราะห์ข้อมูลในการวิจัยนี้ ประกอบไปด้วย การวิเคราะห์เชิงพรรณนา การวิเคราะห์ความเช่ือม่ัน การวิเคราะห์ความเท่ียงตรง การวิเคราะห์องค์ประกอบเชิงยืนยัน และการวิเคราะห์การสร้างโมเดลสมการโครงสร้าง (SEM)
ซึ่งได้ผลการวิเคราะห์ ดังนี้ คือ (1) ปัจจัยท่ีมีผลกระทบต่อความพึงพอใจและความผูกพันของลูกค้าท่ีมีต่อแบรนด์มากท่ีสุดภายใต้การพาณิชย์อิเลคทรอนิคส์ซึ่งก็คือประสิทธิภาพ และ (2) คุณภาพของการบริการโลจิสติกส์มีผลเชิงบวกต่อความพึงพอใจของลูกค้าและความพึงพอใจของลูกค้ามีผลสูงสุดต่อกับความภักดีต่อแบรนด์สินค้า
ค าส าคัญ : การบริการโลจิสติกส,์ การพาณิชย์อิเลคทรอนิคส,์ แบรนด์ของลูกค้า
1 นักศึกษาปริญญาโท หลักสูตรนานาชาต ิสาขาวิชา ธุรกิจระหว่างประเทศ มหาวิทยาลัยหอการค้าไทย 2 อาจารย์ที่ปรึกษา สาขาวิชา ธุรกิจระหว่างประเทศ มหาวิทยาลัยหอการค้าไทย

Guoping Huang and Thitikan Satchabut Vol.5 No.1 January-June 2019
วารสารรังสิตบัณฑิตศึกษาในกลุ่มธุรกิจและสังคมศาสตร์ ปีที่ 5 ฉบับที่ 1 มกราคม-มิถุนายน 2562
121
Abstract
This research reviewed the relative studies on logistics service quality in the context of business-to- business (B2B) and business-to-customer (B2C) e-commerce, combining with the practical situation of China e-commerce. In addition, this research aimed to clarify the relationship of customer satisfaction in logistics service quality and customer loyalty in China e-commerce market. Customer perception towards logistics service quality of the B2C model or web store was divided into 4 dimensions: efficiency, fulfillment, availability and privacy. In order to analyze the data, 485 questionnaires were collected. In this research, descriptive analysis, reliability analysis, validity analysis, confirmatory factor analysis, and structural equation model (SEM) were used.
Through analyze the data, two findings were: (1) The factor that had biggest impact on customer satisfaction and customer loyalty in the electronic commerce context which was efficiency (2) Logistics service quality affected the customer satisfaction, and the customer satisfaction had the highest effect on brand loyalty.
Key words: Logistics Service, E-commerce, Customer Brand

Guoping Huang and Thitikan Satchabut Vol.5 No.1 January-June 2019
วารสารรังสิตบัณฑิตศึกษาในกลุ่มธุรกิจและสังคมศาสตร์ ปีที่ 5 ฉบับที่ 1 มกราคม-มิถุนายน 2562
122
1. Introduction In 21th century, the internet penetration around China was rising to a very high level as a result, people
have been easily getting an access to the internet. With the rapid popularization of internet, e-commerce has a great development and has a big effect on people's life. The enterprises that carried out online sales accounted for 24.7% of the national total in December 2014 (China Internet Network Information Center-CNNIC, Statistic Report on Internet Development in China, 2015). In 2014, China had 648.75 million internet users (CNNIC, 2015) and 55.7% of them ever shopping online at least one time during the past year (China Internet Watch-China Online Shopping Insights in 2014). Logistics was the biggest challenge in electronic retail industry, it is also the key differentiator between “e-retailers”. This research is focused on Chinese e-commerce market. The respondents of this study are the e-commerce consumers whom ever used the logistics service of S.F. Express (Group) Co., Ltd in China.
Two objectives of this research are to find out the factors that have big impact on customer satisfaction and loyalty under electronic commerce context; and identify the relationship between customer satisfaction of logistics service quality (LSQ) and customer loyalty under e-commerce environment. This research will help to provide a useful tool for the e-commerce operator to measure their logistics service quality, and provide an effort direction for the online store operator to acquire customer loyalty; let the B2C&C2C online store owner know that cooperate with professional logistics company will help them improve their service quality and
2. Study objective
1. To find out the factors that have significant impact on customer satisfaction and loyalty under electronic commerce context. 2. To identify the relationship between customer satisfaction of LSQ and customer loyalty under e-commerce environment. 3. Methodology
3.1 Sampling and data collection The data that we analyzed was collected from online survey. The e-commerce customers whom are
frequently shopping online in the period of past few months and accepted to answer to our questions, and ever used the logistics service of S.F. Express (Group) Co., Ltd. formed the sample. In this study, the questionnaire is used as our research instrument that includes four parts. Those four parts are the demographic information (8 items), logistics service quality (16 items, five points Likert scales), customer satisfaction (6 items, five points Likert scales) and customer loyalty (7 items, five points Likert scales).

Guoping Huang and Thitikan Satchabut Vol.5 No.1 January-June 2019
วารสารรังสิตบัณฑิตศึกษาในกลุ่มธุรกิจและสังคมศาสตร์ ปีที่ 5 ฉบับที่ 1 มกราคม-มิถุนายน 2562
123
3.2 Population According to China Internet Network Information Center(CNNIC, 2015), by the end of December 2014
there were 648.75 million internet users and 55.7% of them ever shopped online at least one time during the past year (eMarketer 2015). In addition, it referred to the statistics of China express delivery industry 2014 from China E-commerce Research Center, whereby that S.F. Express (Group) Co., Ltd accounted for 5% of online shopping market share. In other words, at the end of December 2014, the number of Chinese online shoppers who used the logistics service of S.F. Express (Group) Co., Ltd approximately are 648,750,000*55.7% *5% = 18,067,688 Customers. Due to this research is a case study of S.F. Express, so we collected the data from the customer of S.F. Express. 3.3 Sample size
We applied Yamane sample size table (Yamane, 1960) to specify the appropriate sample size. The compute formula for random sample is as following: n = N/ (1+Ne²) (1)
So, n = the size of the sample N = the population
e² = probability of error Therefore, the sample size for this study was:
n = 18,067,688/ (1+18,067,688 × 0.05²) n =3 99.9911446 ≈400
With N=18,067,688, e=0.05 (at least 95% confidence level), hence the sample size calculation result was
about 400 respondents. Therefore, the researcher would use 400 as the sample size. Random sample from filtered customers via online survey was applied for this study. In order to minimize the problem of response rate and invalid questionnaire issue, 485 questionnaires were distributed to the Chinese online shoppers whom ever used the logistics service of S.F. Express (Group) Co., Ltd by using online survey software. 3.4 Data analysis
The collected data was analyzed by descriptive statistics analysis, reliability analysis, validity analysis, confirmatory factor analysis and SEM (structural equation model) analysis. 1. Descriptive analysis was used for analysis the personal information (SadeghRast, AzadehTourani, 2012). 2. Reliability analysis was included CITC (Corrected Item-Total Correlation) value and Cronbach Alpha coefficient value as measuring standard. 3. Validity analysis using exploratory factor analysis method to test items validity. 4. Confirmatory factor analysis was aimed to test the fitness degree of research model. 5. Structural equation model analysis was a method testing hypotheses, data fitness degree and research model validity.

Guoping Huang and Thitikan Satchabut Vol.5 No.1 January-June 2019
วารสารรังสิตบัณฑิตศึกษาในกลุ่มธุรกิจและสังคมศาสตร์ ปีที่ 5 ฉบับที่ 1 มกราคม-มิถุนายน 2562
124
Refer to the measuring scales of logistics service quality which had already been tested by other authors' empirical study, and consider the e-commerce environment characteristic, finally we selected some scales which met our research requirement to form our measuring scales as be blow table:
Table 3.1 Measuring scales for satisfaction of LSQ
Dimension Item Author
Efficiency
Time between placing requisition and receiving delivery is short Mentzer et al., (2001)
You can receive the package at appointed time Sheng Tianxiang et al. (2008)
The company be able to deliver your package during holiday
The company could solve your delivery complain issue in time
Fulfillment
Shipments rarely contain the wrong items Mentzer, Flint, and Hult (2001)
Shipments rarely contain an incorrect quantity
Ability of generating the order automatic when transaction confirmed
Orders are delivered undamaged Carol C.Bienstock et al. (1997)
Availability
Online order is available Carol C.Bienstock et al. (1997)
Order tracking system is available
Could place the deliver order at any place
Customer service is 24 hrs available Mentzer, Flint, and Hult (2001)
Privacy
The company pay great attention to protect consumers personal information
Chang Yaping et al. (2009)
The company will not share the customer personal information to others
Sheng Tianxiang et al. (2008)
The website will protect customer bank account information
The order information is confidential Chang Yaping et al. (2009)

Guoping Huang and Thitikan Satchabut Vol.5 No.1 January-June 2019
วารสารรังสิตบัณฑิตศึกษาในกลุ่มธุรกิจและสังคมศาสตร์ ปีที่ 5 ฉบับที่ 1 มกราคม-มิถุนายน 2562
125
Referred to the related loyalty research theory and measuring dimensions/scales, integrated the traditional environment loyalty theory with e-commerce environment loyalty theory, we designed the below scales to measure customer loyalty:
Table 3.2 Measuring scales for customer loyalty
Dimension Item Author
Purchase intentions
You will choose this online store if need purchase the same category product
Deng Lijuan 2012
You will purchase more with this online store in the future
Word-of-mouth communications
You would like to recommend this online store when other people ask for your opinion
Tao Bao, 2012
You would like to praise this internet store to your friend
Price sensitivity
You are insist prefer this store as you trust them even the product price is a little higher than other internet store
Zeithaml, Berry and Parasuraman, 1996
You would not change to another internet store due to their marketing price promotions
Complaining behavior
You would not put bad wording on this internet store if they have occasional mistake
Zeithaml, Berry and Parasuraman, 1996
You will request compensation from this store if package damaged
4. Results 4.1 The demographic information
The demographic information includes the number of 462 usable samples. The gender information, female is the majority of questionnaire respondents that is 69% and male only 31%. Age 21-30 (65.4%) is the biggest part of samples, the following is age 31-40 (15.8%), these two age groups account for total 81.2% of online shoppers, so we can understand as young people are more likely to enjoy the online shopping than other age groups. For the education level, bachelor degree account for 61.3%, and then there is the college 16.7% and master or above 10.6%. At the aspect of monthly income, above 5000 Ren Min Bi (RMB-China currency) is 31.4%, between 3001-5000 RMB is 26.8%. Online shopping frequency, 1-3 times is the most, account for 34.2%, secondly is 4-10 times per month 27.3%. Online shopping age, 60.4% of the respondents are above 3 years. Most preference online store, 55.4% of the respondents prefer to Taobao.com and 21.9% prefer Tmall.com, which these two website

Guoping Huang and Thitikan Satchabut Vol.5 No.1 January-June 2019
วารสารรังสิตบัณฑิตศึกษาในกลุ่มธุรกิจและสังคมศาสตร์ ปีที่ 5 ฉบับที่ 1 มกราคม-มิถุนายน 2562
126
belong to the same company that named as Alibaba. Alibaba is China’s - and by some measures, the world’s - biggest online commerce company 4.2 Reliability analysis Table 4.1 Reliability Analysis
Factor Item CITC If delete item
Cronbach's Alpha Cronbach's Alpha
Efficiency
E1 .726 .804
0.855 E2 .714 .811 E3 .671 .829 E4 .686 .821
Fulfillment
F1 .736 .828
0.870 F2 .769 .815 F3 .716 .837 F4 .676 .854
Availability
A1 .746 .829
0.872 A2 .734 .834 A3 .734 .833 A4 .697 .850
Privacy
P1 .795 .906
0.922 P2 .793 .907 P3 .862 .883 P4 .827 .895
CS1 .685 .887
Satisfaction
CS2 .695 .886
0.899 CS3 .705 .884 CS4 .758 .876 CS5 .738 .879 CS6 .773 .874
Loyalty
LOY1 .742 .899
0.913
LOY2 .787 .894 LOY3 .776 .895 LOY4 .774 .896 LOY5 .684 .906 LOY6 .717 .902 LOY7 .675 .906
Guoping Huang and Thitikan Satchabut Vol.5 No.1 January-June 2019
วารสารรังสิตบัณฑิตศึกษาในกลุ่มธุรกิจและสังคมศาสตร์ ปีที่ 5 ฉบับที่ 1 มกราคม-มิถุนายน 2562
127
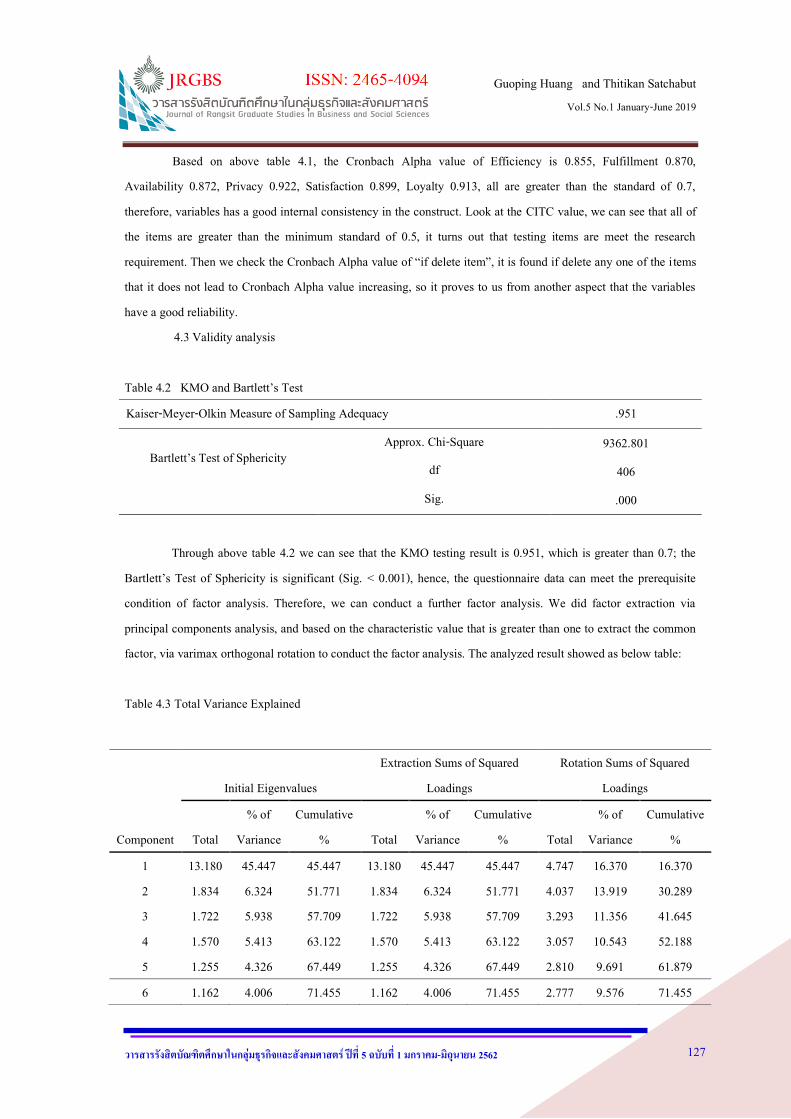
Based on above table 4.1, the Cronbach Alpha value of Efficiency is 0.855, Fulfillment 0.870, Availability 0.872, Privacy 0.922, Satisfaction 0.899, Loyalty 0.913, all are greater than the standard of 0.7, therefore, variables has a good internal consistency in the construct. Look at the CITC value, we can see that all of the items are greater than the minimum standard of 0.5, it turns out that testing items are meet the research requirement. Then we check the Cronbach Alpha value of “if delete item”, it is found if delete any one of the i tems that it does not lead to Cronbach Alpha value increasing, so it proves to us from another aspect that the variables have a good reliability. 4.3 Validity analysis Table 4.2 KMO and Bartlett’s Test Kaiser-Meyer-Olkin Measure of Sampling Adequacy .951
Bartlett’s Test of Sphericity
Approx. Chi-Square 9362.801
df 406 Sig. .000
Through above table 4.2 we can see that the KMO testing result is 0.951, which is greater than 0.7; the
Bartlett’s Test of Sphericity is significant (Sig. < 0.001), hence, the questionnaire data can meet the prerequisite condition of factor analysis. Therefore, we can conduct a further factor analysis. We did factor extraction via principal components analysis, and based on the characteristic value that is greater than one to extract the common factor, via varimax orthogonal rotation to conduct the factor analysis. The analyzed result showed as below table: Table 4.3 Total Variance Explained
Component
Initial Eigenvalues Extraction Sums of Squared
Loadings Rotation Sums of Squared
Loadings
Total % of
Variance Cumulative
% Total % of
Variance Cumulative
% Total % of
Variance Cumulative
% 1 13.180 45.447 45.447 13.180 45.447 45.447 4.747 16.370 16.370 2 1.834 6.324 51.771 1.834 6.324 51.771 4.037 13.919 30.289 3 1.722 5.938 57.709 1.722 5.938 57.709 3.293 11.356 41.645 4 1.570 5.413 63.122 1.570 5.413 63.122 3.057 10.543 52.188 5 1.255 4.326 67.449 1.255 4.326 67.449 2.810 9.691 61.879 6 1.162 4.006 71.455 1.162 4.006 71.455 2.777 9.576 71.455

Guoping Huang and Thitikan Satchabut Vol.5 No.1 January-June 2019
วารสารรังสิตบัณฑิตศึกษาในกลุ่มธุรกิจและสังคมศาสตร์ ปีที่ 5 ฉบับที่ 1 มกราคม-มิถุนายน 2562
128
From table 4.3 as it can be seen, factor analysis that we got 6 common factors and the explanatory ability is 16.370%, 13.919%, 11.356%, 10.543%, 9.691%, 9.576%, respectively. Total explanatory ability reaches a value of 71.455%, which is greater than 50% and it means the six factors that is screened out and has a good representativeness. 4.4 Structure equation model analysis (SEM) When applied structure equation model (SEM) to verify theoretical model, a good model fitness was the necessary condition for using SEM analyzing method (Byrne, 2010). Model fitness was the conformance degree in between expected covariance matrix and sampling covariance matrix that calculated by researcher’ model, better model fitness represent that model and sample were closer. In order to achieve this purpose, the researching must consider related important statistics index that provided by SEM. In this paper, we selected several indexes to assess the fitness of integrated model, including minimum discrepancy (CMIN) testing, CMIN/DF ratio, goodness of fit (GFI), adjusted goodness of fit (AGFI),root mean square error of approximation (RMSEA), non-normed fit index (NFI), Trucker lewis index (TLI), incremental fit index (IFI) and comparative fit index (CFI). When the fitness degree between model and data was accessed, it should be comprehensive to consider each index, if most of the index met requirement then we could deem a good fitness between the model and the data.
SEM (Structure equation model)

Guoping Huang and Thitikan Satchabut Vol.5 No.1 January-June 2019
วารสารรังสิตบัณฑิตศึกษาในกลุ่มธุรกิจและสังคมศาสตร์ ปีที่ 5 ฉบับที่ 1 มกราคม-มิถุนายน 2562
129
4.5 Model fitness test Table 4.4 Model fitness
Fitness index Acceptable range Measurements
CMIN
895.004 DF
362
CMIN/DF <3 2.472 GFI >0.8 0.876
AGFI >0.8 0.851 RMSEA <0.08 0.057
IFI >0.9 0.942 NFI >0.9 0.907
TLI(NNFI) >0.9 0.935
CFI >0.9 0.942
Note: CMIN= minimum discrepancy, DF= degree of freedom, CMIN/DF= minimum discrepancy divided by its degree of freedom, GFI= goodness of fit index, AGFI= adjusted goodness of fit index, RMSEA= root mean square error of approximation, IFI= incremental fit index, NFI= normed fit index, TLI= Trucker lewis index, CFI= comparative fit index.
From above table 4.4, we can see that CMIN/DF value is 2.588, which is less than the standard of below 3. GFI= 0.876, AGFI= 0.851, greater than 0.8 is acceptable (Baumgartner and Hombur, 1996). NFI=0.907, TLI=0.935, IFI=0.942 and CFI=0.942, all of them are exceed 0.9, they meet the standard of above 0.9, indicating good model fit degree; RMSEA value is 0.057, less than 0.08. Therefore, we can conclude that it is above fit indexes conform to standard of SEM research, which means the model has a good fitness. 4.6 Hypothesis test
The first three hypotheses: H1: logistics service quality has an effect on customer satisfaction H2: logistics service quality has an effect on customer loyalty H3: customer satisfaction has an effect on customer loyalty

Guoping Huang and Thitikan Satchabut Vol.5 No.1 January-June 2019
วารสารรังสิตบัณฑิตศึกษาในกลุ่มธุรกิจและสังคมศาสตร์ ปีที่ 5 ฉบับที่ 1 มกราคม-มิถุนายน 2562
130
Testing model This paper's testing model design majorly based on the e-SERQUAL model (Parasuraman et al. 2005), the
customer loyalty measuring scale of Zeithaml et al., (1996) and the Sweden customer satisfaction barometer model, applying the traditional logistics service quality theory in the internet environment, finally develop the testing model as below:
Testing Model
Perceived LSQ
Source: Parasuraman et al., 2005

Guoping Huang and Thitikan Satchabut Vol.5 No.1 January-June 2019
วารสารรังสิตบัณฑิตศึกษาในกลุ่มธุรกิจและสังคมศาสตร์ ปีที่ 5 ฉบับที่ 1 มกราคม-มิถุนายน 2562
131
Table 4.5 Path Coefficient of Structure Equation Model
Path
STD (β)
Un. STD
S.E. C.R.(t-value)
P
Result
Satisfaction <--- Efficiency 0.269 0.219 0.054 4.06 *** Acceptable
Satisfaction <--- Fulfillment 0.14 0.12 0.051 2.368 0.018 Acceptable
Satisfaction <--- Availability 0.196 0.146 0.051 2.894 0.004 Acceptable
Satisfaction <--- Privacy 0.246 0.192 0.047 4.099 *** Acceptable Loyalty <--- Efficiency 0.168 0.187 0.07 2.668 0.008 Acceptable Loyalty <--- Fulfillment 0.139 0.164 0.065 2.515 0.012 Acceptable Loyalty <--- Availability 0.144 0.148 0.065 2.268 0.023 Acceptable Loyalty <--- Privacy 0.158 0.17 0.061 2.81 0.005 Acceptable
Loyalty <--- Satisfaction 0.304 0.417 0.079 5.26 *** Acceptable
Note: *** (P<0.001) STD = Standardized Estimate; Un.STD= Unstandardized Estimate; S.E = Standardized Error; C.R.T-value= Critical Ratio; P= Significance Difference value
From above table 4.5, we can see all of the beta (β) value <1, means it has significantly positive
correlation; all of the T-value >1.96, means it has significantly positive correlation; all of the P-value <0.05, means it has significantly positive correlation. Hence, we can conclude that the hypotheses are valid. 5. Discussion 5.1 The relationship between logistics service quality and customer satisfaction
The relative research about the formation of internet customer satisfaction, many scholars explored the influence of website or service attribute to satisfaction. For example, Szymanski and Hise (2000) researched the customer satisfaction of internet store, they conducted empirical research finding out that convenience, web design and finance security had positive impact on internet consumer satisfaction. Under the conventional business-to-business (B2B) environment, Daugherty, Stank and Ellinger (1998), Innis and Londe (1994) proved improving logistical service quality which would help improving customer satisfaction. Mentzer, Flint and Kent (2001) believed that personnel contact quality, order release quantities, information quality, order procedures, order condition, order quality, timeliness and order discrepancy handling these 9 dimensions had positive impact on customer satisfaction. They compared different market segment and got a conclusion: the customer of different product market had different expectation to logistics service quality.

Guoping Huang and Thitikan Satchabut Vol.5 No.1 January-June 2019
วารสารรังสิตบัณฑิตศึกษาในกลุ่มธุรกิจและสังคมศาสตร์ ปีที่ 5 ฉบับที่ 1 มกราคม-มิถุนายน 2562
132
Summing up the above, this research proposed a hypothesis: H1 Logistics service quality had an effect on customer satisfaction.
The analysis results showed the beta (β) of efficiency to satisfaction was 0.269 (P<0.01), which was significant positive correlation, therefore, the hypothesis was valid. Beta (β) of fulfillment to satisfaction was 0.140 (P<0.05), which was significant positive correlation, therefore, the hypothesis was valid. Beta (β) of availability to satisfaction was 0.196 (P<0.05), which was significant positive correlation, therefore, the hypothesis was valid. Beta (β) of privacy to satisfaction was 0.246 (P<0.01), which was significant positive correlation, therefore, the hypothesis was valid. The research result is closed to other scholars’ research outcome, like Daugherty, etc., (1998) and Innis, etc., (1994), they proved that improving logistical service quality would help to improve customer satisfaction. Hence, we can conclude that our theory make sense. 5.2 The relationship between logistics service quality and customer loyalty
Ramanathan (2010) based on B2C environment, regard logistics service performance as an independent variable to research, it influences to customer loyalty, and the result shows that the influence of logistics service performance to customer loyalty will increase according to online store improving its efficiency. Agatz (2008) found that customers take logistics service as an important concerning factor when shopping online. Third-party logistics service plays an important role in making sure customer satisfaction under the e-commerce background. No matter it is under B2C or customer-to-customer (C2C) e-commerce background, only after the customers selected a product and submit the order then logistics service comes into play.
In this research, the author considered that logistics service could be an absolute necessary step to the online shopping, the improvement of logistics service quality will enhance customer satisfaction and affect the customer loyalty. If customers suffer poor third party logistics service quality, even though, online merchants provide excellent quality product, the customer also lose their loyalty to the merchants. In contrast, when a high-level third party logistics service quality equals to a good product condition and merchant service level, it will highly satisfy the customer and get their loyalty.
In conclusion, this research propose a hypothesis: H2 Logistics service quality has an effect on customer loyalty.
The analysis results showed the beta (β) of efficiency to loyalty was 0.168 (P<0.01), significant positive correlation, thus, hypothesis was valid. Beta (β) of fulfillment to loyalty was 0.139 (P<0.05), significant positive correlation, therefore, hypothesis was valid. Beta (β) of availability to loyalty was 0.144 (P<0.05), significant positive correlation, therefore, hypothesis was valid. Beta (β) of privacy to loyalty was 0.158 (P<0.01), significant positive correlation, thus hypothesis was valid.
The results showed that logistics service quality had direct impact on customer loyalty under the e-commerce context which was a little different from some other scholars’ research, as they focused on researching the affection of satisfaction to customer loyalty. It supported the opinions like Ramanathan (2010) and Cho (2008)

Guoping Huang and Thitikan Satchabut Vol.5 No.1 January-June 2019
วารสารรังสิตบัณฑิตศึกษาในกลุ่มธุรกิจและสังคมศาสตร์ ปีที่ 5 ฉบับที่ 1 มกราคม-มิถุนายน 2562
133
that they believed logistics service quality had a significant positive influence on enterprises performance and customer loyalty. 5.3 The relationship between customer satisfaction and customer loyalty
The vigorous advocate of Oliver et al., (1980), proved customer satisfaction as an antecedent for acquiring customer loyalty. Anderson and Srinivasan (2003) applied this research theory to internet environment. They divided the relationship moderating factors of satisfaction and loyalty into two types: consumer individual factor and company business factor. They found that convenient motivation and purchase volume would enhance the influence of satisfaction to loyalty but purchasing laziness would weaken the satisfaction influence. Semeijn et al., (2005) conducted a research on the internet retail industry and proved that satisfaction was an antecedent of customer loyalty formation.
In this research, the author believed that customer satisfaction and loyalty had a significant positive correlation, which meant customer satisfaction was an important determining factor of loyalty. Under the internet environment, consumer will compare their shopping experience of some online store to their inner expectation, if they perceived the online store performance exceed owe expectation, customer will feel satisfy. Such satisfaction will affect customer to decide whether they should continuously shop through this online store. In other words, high satisfaction to online store’s product or service will make customer be loyal to it. Summing up above, this research propose a hypothesis: H3 Customer satisfaction had an effect on loyalty. The analytical results showed the beta (β) of satisfaction to loyalty was 0.304 (P<0.01), significant positive correlation, thus hypothesis was valid. This beta (β) was the highest value among the whole SEM path coefficient, which satisfaction was the most important factor to loyalty.
Regarding the two hypotheses as above analysis, we could find the factors that affect customer loyalty not only satisfaction factor, but also other factors like efficiency, fulfillment, availability and privacy in order to compare the path coefficient value between different factors. As a result, we could know that satisfactory had biggest impact on customer loyalty. This is similar to some other scholars researches, which their research state satisfaction not the only determining factor to customer loyalty, but also many other factors. This research only figure out some of the factors that directly affect customer loyalty under e-commerce context with different situation that still have many other factors affecting it. 5.4 Implication
(1). First, it provided a useful tool for the e-commerce operator to measure their logistics service quality. With the fast-developing time of e-commerce, customer is easily find out their desired product or service via internet and other customers’ shopping experience. However, customer has limited time and energy, so how to attract and retain them is very important. This research looks at the practical situation of logistics service of B2C&C2C online store, develops the measuring scales of consumer perceived logistics service quality to help enterprise diagnose their logistics service quality’s advantages and disadvantages.

Guoping Huang and Thitikan Satchabut Vol.5 No.1 January-June 2019
วารสารรังสิตบัณฑิตศึกษาในกลุ่มธุรกิจและสังคมศาสตร์ ปีที่ 5 ฉบับที่ 1 มกราคม-มิถุนายน 2562
134
(2). Second, it provided an effort direction for the online store operator to acquire customer loyalty. No matter under the traditional environment or newly internet environment is a critical method for enterprise to acquire profits. However, customer loyalty building takes a long time. This research through empirical analysis gets a direction of winning customer loyalty: keeps increasing enterprise’s logistics service quality, which means efficiency quality, fulfillment quality, availability quality and privacy quality.
(3). Third, B2C&C2C online store should enhance the cooperation with professional logistics company. Along with the increasing popularization of internet, we can predict that the online shopping market will expand gradually. Through this research, we know that the customers are most care point while shopping online is whether they can get the product fast, means logistics efficiency. The online store must seek for a faster, accurate and convenient logistics delivery way, by now horizontal alliances of e-commerce and third-party logistics is a good way attracting more and more attention, through resource complementary could achieve a tripartite win-win situation between Online Stores, Logistics Company and Consumer. 5.5 Limitation of study
(1) For the research sample, this research only looked at B2C internet retail industry and questionnaire respondent limit at whom prefer to use S.F. Express service, so the universality of research results would need to be further verified.
(2) This study only performed in China e-commerce market, which might lead to some different responses from the different e-consumers as the study was conducted in other countries, the real market environment and local culture are difference.
Recommendations for future research (1) The research logistics service quality scales developed only based on China e-commerce market, but
under different situation, the dimension of logistics service quality would need to be further refined or expanded. (2) This research scope only looked at the e-commerce market of B2C&C2C internet consumption,
should expand the research field to different forms of e-commerce. (3) This research did not explore the internet consumer characteristic, in the future, we can use the
internet consumer’s characteristic as a control variable to further analyze the difference of loyalty’s different driving factor under internet environment.
(4) This research did not aim at exploring commercial website type, for compare whether different website will have influence on research result, we recommend differentiate the type of website in the future study. 6. Conclusion
Based on the literature review of relative research on consumer perceived logistics service quality, this research subdivides B2C web store consumer perceived logistics service quality as 4 dimensions, via questionnaire

Guoping Huang and Thitikan Satchabut Vol.5 No.1 January-June 2019
วารสารรังสิตบัณฑิตศึกษาในกลุ่มธุรกิจและสังคมศาสตร์ ปีที่ 5 ฉบับที่ 1 มกราคม-มิถุนายน 2562
135
method to collect consumer data and then conduct a rigorous analysis. The questionnaire is included four parts: demographic information, logistics service quality, customer satisfaction and customer loyalty, totally 37 items. The greater proportion of samplings of demographic information is as following details: 69% of online shopper is female, age range 21-30 (65.4%), bachelor degree account for 61.3%, 31.4% month income above 5000RMB, 34.2% shopping online 1-3 times/month, 60.4% shopping online over 3 years and 55.4% prefer to purchase via Taobao.com.
This research applied the SEM technique to test the hypothesized model. The result of SEM fitness index are as following details: CMIN/DF ratio is 2.472, which is less than the standard of 3. GFI=0.876, as it can be acceptable (Baumgartner and Homburg,1996) proposed that GFI ranges between 0 to 1 and higher value indicating better fit, GFI >0.8 acceptable, GFI >0.9 good fit). AGFI=0.851, as it can be acceptable (Doll, Xia, Torkzadeh (1994) proposed that AGFI ranges between 0 to 1 and higher value indicating better fit, GFI >0.8, hence, i t is acceptable, AGFI >=0.9 indicating good fit relative to the baseline model). TLI= 0.935, IFI=0.942, CFI=0.942, all the values are exceeding the standard of 0.9 (Hu and Bentler, 1999, proposed TLI, IFI and CFI index if it is greater than 0.9 representing acceptable). RMSEA=0.057, meet the standard of below 0.08. Above fitness indexes meet the standard of SEM research, which is lead to a conclusion that the research model has good fitness degree. According to the hypothesis results is shown in Table 4.5, all the hypotheses in this research have been accepted. All of the P-value<0.05, means there is positive relationship among logistics service quality, customer satisfaction and customer loyalty. Reference CIW, I. (2015). China Online Shopping Insights in 2014. China Internet Watch (CIW), Retrieved from https://www.chinainternetwatch.com/14875/china-online-shopping-insights-2014/ CNNIC, I. (2015). The 35th Statistical report on internet development in China. China Internet Network Information Center (CNNIC), Retrieved from https://cnnic.com.cn/IDR/ReportDownloads/201507/P020150720486421654597.pdf Bienstock, C. C., Mentzer, J. T., & Bird, M. M. (1996). Measuring physical distribution service quality. Journal of the Academy of Marketing Science, 25 (1), 31-44. Banomyong, R., & Supatn, N. (2011). Selecting logistics providers in Thailand: a shippers' perspective. European Journal of Marketing, 45(3), 419-437. Harris, L. C., & Goode, M. M. (2004). The four levels of loyalty and the pivotal role of trust: a study of online service dynamics. Journal of retailing, 80 (2), 139-158. Heim, G. R., & Sinha, K. K. (2001). Operational drivers of customer loyalty in electronic retailing: An empirical analysis of electronic food retailers. Manufacturing & Service Operations Management, 3(3), 264-271.

Guoping Huang and Thitikan Satchabut Vol.5 No.1 January-June 2019
วารสารรังสิตบัณฑิตศึกษาในกลุ่มธุรกิจและสังคมศาสตร์ ปีที่ 5 ฉบับที่ 1 มกราคม-มิถุนายน 2562
136
Huang, Y. K., Kuo, Y. W., & Xu, S. W. (2009). Applying importance-performance analysis to evaluate logistics service quality for online shopping among retailing delivery. International Journal of Electronic BusinessManagement, 7(2), 128-136. Lambert, D. M., Stock, J. R., & Sterling, J. U. (1990). A gap analysis of buyer and seller perceptions of the importance of marketing mix attributes. In AMA Educators’ Proceedings. American Marketing Association, Chicago, IL. Lei Y. (2013). The effects of 3PL service quality on the relationship between merchant service quality and customer loyalty. Harbin Institute of Technology, 162-165. Loiacono, E.T., Watson, R.T. and Hoodhue, D.L. (2002).WEBQUAL: Measure of web site quality. 2002 Marketing Educators Conference: Marketing Theory and Applications,13, 432-437. McKinney, V., Yoon, K., & Zahedi, F. (2002). The measurement of web-customer satisfaction: An expectation and disconfirmation approach. Information Systems Research, 13, 296-315. Mentzer, J. T., Flint, D. J., & Hult, G. T. M. (2001). Logistics service quality as a segment-customized process. Journal of marketing, 65(4), 82-104. Oliver, R. L. (1980). A cognitive model of the antecedents and consequences of satisfaction decisions. Journal of marketing research, 460-469. Parasuraman, A., Zeithaml, V. A., & Berry, L. L. (1988). Servqual. Journal of retailing, 64(1), 12-40. Parasuraman, A., Zeithaml, V. A., & Malhotra, A.(2005). ES-QUAL a multiple-item scale for assessing electronic service quality. Journal of service research, 7(3), 213-233. Rabinovich, E. (2006). Logistics service providers in internet supply chains. California Management Review, 48(4), 84-108. Ramanathan, R. (2010). The moderating roles of risk and efficiency on the relationship between logistics performance and customer loyalty in e-commerce. Transportation Research Part E: Logistics and Transportation Review, 46(6), 950-962. Rao, S., Goldsby, T. J., Griffis, S. E., & Iyengar, D. (2011). Electronic Logistics Service Quality (e‐LSQ): Its Impact on the Customer’s Purchase Satisfaction and Retention. Journal of Business Logistics, 32(2), 167-179. Szymanski, D. M., & Hise, R. T. (2000). E-satisfaction: an initial examination. Journal of retailing,76(3), 309-322. Schefter, P., & Reichheld, F. (2000). E-loyalty: your secret weapon on the Web. Harvard Business Review, 78(4), 105-113. Sadegh Rast Azadeh Tourani, (2012). Evaluation of Employees’ Job Satisfaction and Role of Gender Difference: An Empirical Study at Airline Industry in Iran, International Journal of Business and Social Science, 3(7), 91-100.

Guoping Huang and Thitikan Satchabut Vol.5 No.1 January-June 2019
วารสารรังสิตบัณฑิตศึกษาในกลุ่มธุรกิจและสังคมศาสตร์ ปีที่ 5 ฉบับที่ 1 มกราคม-มิถุนายน 2562
137
Shankar, V., Smith, A. K., & Rangaswamy, A. (2003). Customer satisfaction and loyalty in online and offline environments. International journal of research in marketing, 20(2), 153-175.
Statistical report on Internet development in China. (n.d.). Retrieved from https://cnnic.com.cn/IDR/ReportDownloads/201507/P020150720486421654597.pdf Van Riel, A. C., Liljander, V., & Jurriens, P. (2001). Exploring consumer evaluations of e-services: a portal site. International Journal of Service Industry Management 12(4), 359-377. Zeithaml, V. A., Berry, L. L., & Parasuraman, A. (1996). The behavioral consequences of service quality. Journal of Marketing, 31-46. Zeithaml, V. A., Parasuraman, A., & Malhotra, A. (2002). Service quality delivery through web sites: a critical review of extant knowledge. Journal of the academy of Marketing science, 30(4), 362-375. Zheng, B. (2008). A study on logistics service quality and its relationship with customer Loyalty of B2C internet store. (Master's thesis). Dalian University of Technology.