The potential of flow cytometry in the study of Bacillus cereus
Upload
khangminh22Category
view
1download
0
Brigham Young University Brigham Young University
BYU ScholarsArchive BYU ScholarsArchive
Undergraduate Honors Theses
2021-06-18
A FRET FLOW CYTOMETRY-BASED SCREENING ASSAY FOR A FRET FLOW CYTOMETRY-BASED SCREENING ASSAY FOR
MULTIPLEX ANALYSIS OF METABOLITES IN T. BRUCEI MULTIPLEX ANALYSIS OF METABOLITES IN T. BRUCEI
Ronald A. Zegarra BYU
Follow this and additional works at: https://scholarsarchive.byu.edu/studentpub_uht
BYU ScholarsArchive Citation BYU ScholarsArchive Citation Zegarra, Ronald A., "A FRET FLOW CYTOMETRY-BASED SCREENING ASSAY FOR MULTIPLEX ANALYSIS OF METABOLITES IN T. BRUCEI" (2021). Undergraduate Honors Theses. 196. https://scholarsarchive.byu.edu/studentpub_uht/196
This Honors Thesis is brought to you for free and open access by BYU ScholarsArchive. It has been accepted for inclusion in Undergraduate Honors Theses by an authorized administrator of BYU ScholarsArchive. For more information, please contact [email protected], [email protected].

i
Honors Thesis
A FRET FLOW CYTOMETRY-BASED SCREENING ASSAY FOR MULTIPLEX
ANALYSIS OF METABOLITES IN T. BRUCEI
Ronald Alejandro Zegarra
Submitted to Brigham Young University
in partial fulfillment of graduation requirements for University Honors
Department of Chemistry and Biochemistry Brigham Young University
June 2021
Advisor: Kenneth A. Christensen Honors Coordinator: Walter Paxton

ii

iii

iv

v
ABSTRACT
Kinetoplastid parasites are a significant public health issue in some tropical and
subtropical regions of the world. Kinetoplastid parasites all require glycolysis for survival,
with host glucose key for ATP production. One such parasite, Trypanosoma brucei,
exclusively metabolizes glucose in its bloodstream form. Trypanosomal glycolysis is unique
because it displays unconventional structural features. Hence, glucose metabolism has been
studied extensively in T. brucei and is a therapeutic target in kinetoplastid parasites.
The lack of in vivo analytical techniques for measuring vital glycolytic metabolites in
situ has restricted the ability of researchers to test, with high sensitivity and specificity, the
essential roles glycolytic metabolites play in both parasite differentiation and regulation of
metabolism. Using endogenously expressed Förster resonance energy transfer (FRET)
biosensors, we have been able to track in vivo glucose concentrations via flow cytometry in
cultured T. brucei parasites, which has enabled unprecedented analysis of the dynamics of
intracellular glucose under changing extracellular conditions, including a screening assay for
potential glucose uptake inhibitors.
We are currently expanding our FRET biosensor suite to measure glycolytic
metabolites and simultaneously screen for specific glycolytic inhibitors throughout the
metabolic pathway. We expect to use biosensors for glucose, ATP, pH, and pyruvate.
However, these sensors typically use the same fluorescent proteins, making it extraordinarily
difficult to monitor multiple biosensors in the flow cytometer. To overcome this limitation,
we present a cellular barcoding method in which multiple cell lines expressing a different
biosensor have unique labels to separate individual sensor responses via flow cytometry.
Each cell line is distinguishable from one another using a cell surface staining scheme or
vi
barcode. Using this approach, we demonstrated the separation of up to four unique
populations, thus allowing the analysis of multiple analytes in a single screening assay. As
proof of principle, we demonstrated the barcoding of two cell lines expressing cytosolic
glucose or ATP sensors and simultaneously measured cytosolic glucose and ATP. We found
that cellular barcoding does not interfere with parasite cell viability, and cell populations
remained distinguishable over time. We also showed that the individual FRET biosensor
responses remain unaffected by barcoding. Finally, we demonstrated that this method could
be used in a high-throughput screening assay for T. brucei and other kinetoplast parasites to
identify compounds that inhibit glycolysis.

vii

viii

ix

x

xi
ACKNOWLEDGEMENTS
I would like to thank the BYU College of Physical and Mathematical Sciences, the
BYU Department of Chemistry and Biochemistry, the BYU Honors Department, and the
National Health Institute for funding research presented as a part of this thesis. Without their
support, progress on this project and my personal development would have been substantially
less.
Also, I want to thank my advisor and mentor, Dr. Kenneth A. Christensen, for
accepting an inexperienced and ambitious undergraduate and taking the time to help me
become a scientist. I want to thank Dr. Christine Ackroyd for being a second mentor in the
lab and constantly feeding my curiosity. Thank you to Charles Voyton for initially
conceiving the idea of barcoding biosensor-expressing trypanosomes and Jacob Vance for his
initial work selecting and testing various dyes as barcodes. Thank you to the Jim Morris
Laboratory at Clemson University for transfecting the cell lines used.
I am incredibly grateful to my constant companion, Isabelle Anne Zegarra. Her
support means more than she could ever know. And finally, for my parents, Ronald I.
Zegarra and Violeta Y. Zegarra, for the long hours of work and the immense sacrifice they
made to give my siblings and me the opportunity to a better life in the United States. I could
not have done this without any of them—esto es para ustedes.

xii

xiii

xiv

xv
CONTENTS Title i
Abstract v
Acknowledgments xi
Table of Contents xv
Introduction 1
Results & Discussion 6
1.1 Barcode staining scheme could potentially distinguish four 6
different parasitic populations, simultaneously
1.2 Biosensor response is unaffected by barcoding 7
1.3 Biosensor response is statistically significant 9
1.4 Multiplex screening assay 11
1.5 Drug assay supports multiplex biosensor efficiency 13
Conclusions 15
Methods 15
1.1 Cells, Constructs, and Reagents 15
1.2 T. brucei transfection and localization of biosensors 16
1.3 T. brucei culture 16
1.4 Sample preparation and flow cytometry 16
1.5 Selection and optimization of barcoding dyes 17
1.6 Testing parasite viability and population distribution of barcoded cells 18
over time
1.7 Creating a Z-prime experiment and analyzing high and low glucose
Response over time 18

xvi
1.8 Running a barcoded multiplex assay 19
1.9 Testing barcoded biosensor response with drug treatments 19
Further Acknowledgements 20
Abbreviations 21
References: 21

xvii

xviii

xix

xx

1
INTRODUCTION
According to the World Health Organization, the kinetoplastids Trypanosoma brucei,
Trypanosoma cruzi, and Leishmania spp. parasites are the causative agents of some of the most
significant neglected tropical diseases endemic, mainly in tropical and subtropical areas. 1,2
Roughly half a billion people are at risk of contracting these diseases. Current estimates indicate
that more than 20 million individuals are infected with some form of a kinetoplastid pathogen,
resulting in extensive morbidity and more than 100,000 yearly deaths combined. 3
Unfortunately, many treatments for kinetoplastid parasite infections have serious adverse side
effects, including death.4,5,6 Hence, identifying additional drug targets and developing
kinetoplastid-specific inhibitors that could become new therapeutics are unmet needs.
Kinetoplastid parasites are motile protozoans and include the human pathogens T. brucei,
T. cruzi, and Leishmania spp. Kinetoplast protozoa share significant similarities in both cellular
biology and metabolism7 that are distinct from mammalian cells. For example, kinetoplastids
have unique peroxisomes (known as glycosomes) in which the bulk of glycolysis occurs.7,8 In
addition, kinetoplastid parasites are vector-borne diseases. As a result, they have complex life
cycles in which they survive in different life stages in insects or mammalian hosts.7-9 Although
the abrupt changes in environmental conditions between life stages could negatively affect the
protozoan parasite, T. brucei, has evolved survival mechanisms to adapt to nutrient availability
changes. 10-13 Importantly, the changes in life stages mean that all kinetoplastid protozoan
parasites depend on host metabolism for survival.7-9 In its mammalian bloodstream form, the
parasites rely heavily on glucose metabolism.
Glucose is essential for kinetoplastid survival in the mammalian host, where it acts as
both a signal and a metabolic energy source.4,13-15 For example, when T. brucei moves from the

2
tsetse fly to the mammalian bloodstream, the parasite experiences increased glucose.13,16 High
glucose is the signal that induces parasite differentiation to the bloodstream form (BSF), which
can survive in the mammalian host.10-13 Importantly, BSF T. brucei relies nearly exclusively on
glucose metabolism for survival within the host. Glucose also plays a pivotal role in Leishmania
spp. infections16,17 where glucose and its metabolites are essential for the anaplerotic synthesis of
glutamate, the primary free amino acid needed to differentiate from the insect form to the
intracellular form found in its mammalian host.16,17
Since glucose metabolism plays a critical role in the kinetoplastid life cycle and viability,
targeting glucose metabolism is an attractive strategy for generating anti-parasite therapeutics.4
For example, a recent report outlines how a specific inhibitor of trypanosome
phosphofructokinase, an essential enzyme in glycolysis, kills BSF T. brucei in a mouse model in
which the parasites had migrated to the brain. Importantly, this phosphofructokinase inhibitor
had no substantial host toxicity.18 Since this mouse model of T. brucei infection is similar to the
late-stage disease in humans,18 this work demonstrates that parasite-specific glycolysis inhibitors
are viable therapeutic targets.
Our focus here is to develop a screening approach to identify small molecules which
impact specific steps of T. brucei glycolysis. Such inhibitors could be used as either metabolic
probes to illuminate individual steps of metabolism or act as trypanocidal compounds that would
serve as lead compounds for drug development. Regardless of the final use of identified
compounds, the screen itself requires analysis of the concentrations of individual metabolites
consumed or created in different stages of glycolysis. Advances made in the measurement of
glycolytic metabolites, as carried out here, therefore have significance for the field of multiplex

3
assay development and metabolomics, the study of small-molecule metabolites in cells, tissues,
and organisms.19
Obtaining broad coverage of the metabolome is challenging because of the broad range
of physicochemical properties of the small molecules in question.19,20 Metabolomic studies
currently utilize primarily two techniques; mass spectrometry and nuclear magnetic resonance
(NMR).19,20 While both techniques can measure a high number of metabolites simultaneously,
neither is ideally suited for measuring metabolites in intact organisms.19-21 Small-molecule
fluorescent probes have a long history quantifying relative and absolute concentrations of
intracellular analytes such as pH and Ca2+.22 For example, the Christensen lab has used probes
coupled with fluorescein, which can report pH, for pH quantification in T. brucei glycosomes.23,24
Using a signal peptide fluorescein conjugate, such as F-PTS1, pH conditions inside glycosomes
were dynamically analyzed under starvation conditions.24
Recently, a wide variety of genetically encoded Förster resonance energy transfer (FRET)
sensors have been developed to measure various metabolites, as well as pH, protein activity, and
protein-protein interactions.15, 22-27 Such biosensors can be targeted to individual cellular
locations, including individual organelles, thus allowing unprecedented analysis of changes in
individual metabolite concentration in live cells. Moreover, to increase the efficiency of these
non-destructive monitoring techniques, a fluorescent protein glucose biosensor (FLII12Pglu-
700μδ6 ) has been used to measure intracellular glucose with flow cytometry. This combination
of techniques has enabled the measurement of observable changes in glucose concentrations
within the cytosol and the glycosomes of live T. brucei.25 These intracellularly expressed
biosensors offer invaluable tools for monitoring in situ metabolic response(s) to changing
environmental conditions.
4
Our goal was to apply biosensors to screen multiple glycolytic metabolites in
kinetoplastid parasites.15,22-26 If such biosensors could be analyzed together, a single assay could
be used to screen for inhibitors of more than one step of glycolysis. The combination of
biosensors would then provide a critical tactical advantage over a standard single metabolite
screening assay. In addition, since inhibitors of earlier steps of glycolysis affect glycolytic
downstream metabolic steps, the assay itself contains the opportunity for secondary hit
validation; molecules identified as hits of early stages of glycolysis could be validated by their
impact on downstream metabolites, including the end-product ATP.
FRET sensor utility in studies of multiple metabolites in a single in vivo application is
hampered by the significant spectral overlap between different FRET sensors, which has made
their combined use impossible. Fluorescence barcoding has previously been used to measure
multiple signals of different origins in a single sample simultaneously. 28 This barcoding
technique is performed by staining different cells with unique fluorescent dyes, mixing the
samples together before flow cytometry analysis, and running them as single samples. Notably,
the staining of different cell types allows separate analysis of cells containing different
biosensors and thus eliminates the problem of spectral overlap between different biosensors in
the same sample. Here we demonstrate the use of fluorescence barcoding to create a proof of
principle multiplexed screening assay to identify inhibitors of multiple steps of glycolysis. The
assay relies on measurements of glucose (the first metabolite used in glycolysis) and ATP, the
final product of glycolysis.
The protein biosensors used in the assay are FLII12Pglu-700μδ6 (FLIP700) and
AT1.03YEMK (YEMK). FLIP700 measures cytosolic glucose levels, while YEMK measures
cytosolic adenosine triphosphate (ATP) levels. FLIP700 and YEMK were cloned into pXS6.Q

5
25,29,30 and transfected into BSF T. brucei. The glucose and ATP sensors used here contain no
signal (targeting) sequence and are therefore expressed in the cytosol.31,32
We used these two biosensors to design a screening assay that allows analysis of glucose
and ATP in the cytosol using a single flow cytometry assay. In short, fluorescent protein
biosensors that monitor important metabolites were genetically encoded and expressed in live T.
bruci BSF parasites. Biosensor-expressing parasites were labeled with desired concentrations of
one or two surface reactive dyes (cellular barcoding), then mixed into a single sample. A similar
barcoding approach27 has been used to obtain multiplexed measurements of enzymatic activity
with FRET biosensors. Here we report the first use of cellular barcoding to monitor changes in
intracellular metabolites and demonstrate its effectiveness when applied into a multiplexed
screening assay.
Using a model staining scheme, we show that four distinct populations could be
identified within a mixture. The concentrations of dye in this mixture have an insignificant effect
on parasite viability and do not diminish in brightness over time. Using these dyes, we
demonstrate that readout from two sensors can be monitored in a single assay. Moreover, we
show that cellular barcoding does not affect FRET biosensor response. In other words, whether a
transgenic parasite expressing a sensor is stained or unstained, the response of the biosensor to
changing extracellular conditions remains the same. Finally, we demonstrate that multiplexed
biosensors can be effectively used to simultaneously screen for inhibitors of multiple glycolytic
steps in a single assay. The resulting assay is proof of principle that a barcoding approach can be
used to eliminate problems associated with spectral overlap and, therefore, allow the creation of
a singel assay to analyze multiple metabolites.

6
RESULTS & DISCUSSION
A barcode staining scheme can distinguish four different parasite populations.
Cellular barcoding combined with the readout of multiple FRET biosensors via flow
cytometry should enable the simultaneous detection of multiple unique analytes in a single assay.
However, effective cellular barcoding requires selecting fluorescent barcoding dyes with
emission spectra that do not overlap with other barcoding dyes or with biosensor fluorescence.
We tested the feasibility of cellular barcoding using covalent cell-surface labels for different
biosensor-expressing cell populations, using multiple N-hydroxysuccinimidyl (NHS) protein
reactive dyes. Importantly, these dyes have minimal spectral overlap with the FRET biosensor
emission. We first tested whether multiple FRET biosensor-expressing populations could be
distinguished using the barcoding NHS-conjugated dyes, Sulfo-Cyanine 3 (Cy3) and Sulfo-
Cyanine 7 (Cy7). BSF wild-type T. brucei were stained with either no dye, Cy3, Cy7, or both
barcoding dyes. The dye combination was designed to create four different populations that
could be distinguished from each other by flow cytometry. Figure 1A shows each of the four
barcoded populations, run as separate samples and then combined into a single plot. These data
demonstrate that this staining scheme can achieve sufficient separation of the fluorescence
intensities to allow the individual analysis of four distinct populations. Indeed, when the
barcoded populations were combined into a single sample and then analyzed in a single flow
cytometry experiment, each labeled population was clearly distinguished from the other (Figure
1B).

7
These data, shown in Figure 1, show proof of principle separation of four different barcoded
populations in a single flow cytometry experiment, using two different dyes. However, more
populations could be created by adjusting the individual dye concentrations. For example, using
three intensity levels for each dye would allow nine different stained populations when analyzed
using flow cytometry.33,34 Therefore, we conclude that this staining scheme is an efficient model
that could be modified to match the desired number of analytes in a myriad of unique
experiments.
Biosensor response is unaffected by barcoding
FRET biosensors can be highly sensitive. If the barcoding itself alters either biosensor
response or cellular behavior, cellular barcoding could not be used. For example, covalent
attachment to surface receptors could impact the delivery of extracellular cargo to the cytosol
A B
Figure 1. Using Sulfo-Cyanine3 (Cy3) and Sulfo-Cyanine7 (Cy7) dyes, four distinguishable populations can be made. (A) Scatter plots of a four-population staining scheme using BF WT cells with each population run separately and (B) all combined and run simultaneously.

8
and alter the analyte concentrations the biosensors measure. In addition, the attachment of
fluorophores to the molecule of interest can potentially alter the molecular properties of the cell
surface receptors and may affect the relevant conformational states and dynamics of flexible
biomolecules like intrinsically disordered proteins (IDP).35 Depending on the size of the
molecule being studied, the fluorophores could also compete with extracellular ligands by
blocking key signals for nutritional intake.35 To minimize this effect, the concentration of the
dyes used for labeling was previously optimized.23-25,27
To ensure that our labeling methods did not alter either the biosensor response or
intracellular analyte levels, we compared the biosensor response in cells that were barcoded
differently. BSF cells expressing the cytosolic glucose sensor FLII12Pglu-700μδ6 (FLIP700)23-
25,27 cells were divided into four unique populations by cellular barcoding with Cy3 and Cy7
dyes. Specifically, one group was barcoded with Cy3 and Cy7, and the other groups barcoded
with either Cy3 or Cy7. The last group was not barcoded as a control. The four barcoded
populations were placed in increasing glucose concentrations, and the biosensor response of each
population was recorded by flow cytometric analysis. As shown in Figure 2, there was no
significant difference between each barcoded population and the unbarcoded control sample.
This result indicates that the glucose biosensor response is not influenced by the use of barcoding
dyes over the entire range of glucose concentrations tested, consistent with the conclusion that
barcoding dyes allow reliable measurements of the metabolites their barcoded signals represent.

9
Biosensor response is statistically significant
In a screening assay, it is necessary to distinguish between a positive result (inhibition of
the target) and the noise inherent in individual measurements. For example, a lower experimental
uncertainty and a greater separation between a positive and a negative results in a more powerful
screening assay. The Z' factor is the most commonly used statistical parameter to gauge assay
quality and track assay performance during a screening experiment. 36 A higher Z' value indicates
better screening assay performance because it separates positive and negative control
populations, which is necessary to distinguish actual inhibition from experimental noise.
Specifically, Z' values closer to 1 show a complete statistical separation between positive and
negative controls in an assay.36The advantage of a Z' analysis is its simplicity as it reduces the
Figure 3
Figure 2. Barcoding does not affect sensor response to differing concentrations of glucose. BSF cells expressing FLIP700 were divided into four unique populations by cellular barcoding with Cy3 and Cy7 dyes. The barcoded sample was placed in increasing concentrations of glucose, and the biosensor response of each population is shown overlapped with an unbarcoded sample control for comparison.

10
myriad of variables found within the signal assay to a single parameter.37 Because of its
suitability to interpret information-rich data sets in multiple parameters (i.e., barcoded
biosensors), the value of a Z' analysis in our multiplexed screening assay is pivotal to assessing
its feasibility.
Initially, a Z' experiment was performed separately for each biosensor. Using unbarcoded
BSF T. brucei cells expressing FLIP700, one sample was equally divided into two populations
and treated with either 0 mM or 7 mM extracellular glucose. The FLIP700 biosensor response
under each condition represented the physiological range of extracellular glucose concentrations
and were our positive and negative controls. Next, we performed an identical experiment using
the YEMK biosensor since the presence or absence of extracellular glucose would result in
depleted intracellular ATP. Specifically, unbarcoded BSF T. brucei cells expressing YEMK were
separated into two equal populations and treated with either 0 mM or 7 mM extracellular
glucose.
Figure 3 shows the results of these experiments. There was a unique and significant
difference between high and low glucose responses in each separate cell line. The FLIP700
(Figure 3A) had a Z' value of 0.81, while YEMK (Figure 3B) had a corresponding Z' value of
0.82. These Z’ values reflect a high dynamic range between controls and repeatability within
each population.

11
Multiplexed screening assay
Supported by the previous experiments, it was evident that a viable multiplex assay could
be performed using the combination of covalent dyes and biosensor-expressing cell lines
described above. BSF cells expressing FLIP700 were barcoded with Cy3.32,33 Similarly, BSF
cells expressing YEMK were barcoded with Cy7.32,33 Once barcoded, FLIP700 and YEMK
samples were combined and divided equally into two heterogeneous populations and treated with
either 0 mM glucose or 7 mM glucose as our high and low controls.
The uniquely treated heterogenous barcoded populations were separately loaded into the
same 384 well plate (Corning 384 Well Deep Well Plate). The low (0 mM glucose) control
population and the high (0.7 mM glucose) control multiplexed population each had (n=192)
samples distributed equally in the plate, adding up to 384 samples total. The plate was run
Figure 3. Plots representing FRET/CFP of high and low controls in BSF cells expressing the ATP biosensor in cytosol (1), or glucose biosensor in the cytosol (2). Plots show the ratio of ECFP/EYFP intensity emission (x-axis) and ECFP emission (y-axis) of BSF cells expressing pDR-GW AT1.03YEMK (YEMK) in cytosol (1) or FLII12Pglu-700μδ6 (FLIP700) in cytosol (2). High controls correspond to cells incubated in 7 mM extracellular glucose (1.C, 2.D), and low controls corresponds to cells incubated in 0 mM extracellular glucose (1.A, 2.B). Z-prime values for cytosol and cytosol assays are calculated as 0.81 and 0.82, respectively.

12
simultaneously, allowing for all barcoded biosensors to run as a single sample. The biosensor
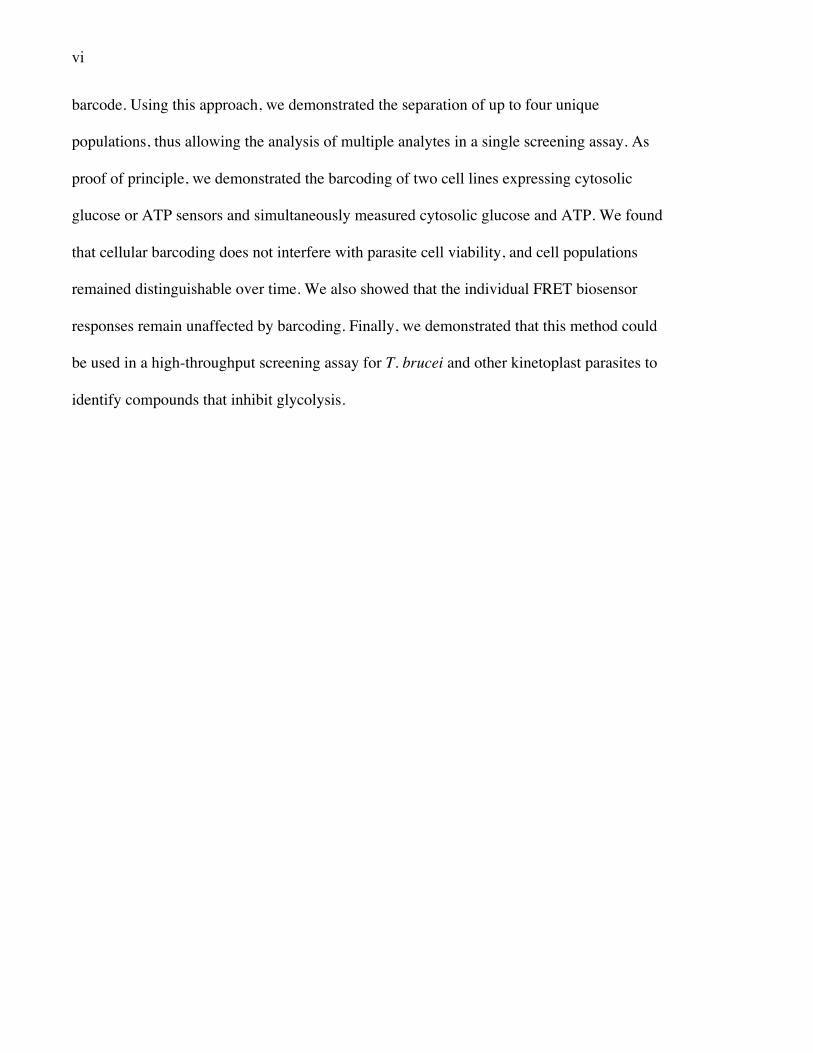
response for each population was recorded by the flow cytometer. As depicted in Figure 4, there
was a significant difference between each barcoded population with a Z' for YEMK and
FLIP700 of 0.83 and 0.79, respectively. This suggests that a specific biosensor reflects the
concentration of its specific metabolite in the cellular location of the biosensor and can therefore
be used to measure metabolite concentration.
Figure 4. Plots representing FRET/ECFP emissions of combined (n: 384) C7 barcoded pDR-GW AT1.03YEMK (YEMK) (A, C), and Cy3 barcoded FLII12Pglu-700μδ6 (Flip700) (B, D). Plots show the ratio of ECFP/EYFP intensity emission (x-axis) and ECFP Intensity emission (y-axis) of BSF cells simultaneously expressing pDR-GW AT1.03YEMK (YEMK) in cytosol (A, C) or FLII12Pglu-700μδ6 in cytosol (B, D). High control (n=192) corresponds to cells incubated in 7 mM glucose (C, D), and low controls (n=192) corresponds to cells incubated in 0 mM glucose (A, B). Z-prime values for cytosolic ATP and cytosolic glucose assays are calculated as 0.83 and 0.79, respectively.

13
Drug assay supports multiplex biosensor efficiency
To demonstrate that multiplexed biosensors can be used to simultaneously screen for
inhibitors of multiple glycolytic steps in a single assay, we screened a small selection of
available anti-kinetoplastid drugs as well as reference anti-trypanosomal compounds.
We picked inhibitors that would specifically impact single targets or aspects of glycolysis
(i.e., ATP only or glucose only), except for 2-deoxyglucose (2-DOG), which due to its
biochemical composition influences both glucose levels and therefore ATP levels that result
from glucose metabolism.38 High concentrations of salicylhydrozamic acid (SHAM) + glycerol
are known to only affect ATP and NADH production; therefore, it should only lower ATP
signals in the YEMK biosensor while not impacting glucose metabolism or the signal of the
FLIP700 glucose bioscensor.39 6-deoxyglucose (6-DOG) was used to allosterically compete with
the regular intake of glucose into the cell. Because glucose transport across the plasma
membrane is likely to be the rate-limiting step of glucose utilization within metabolism40,
treatment with 6-DOG should lower glucose uptake while not affecting ATP production.
Therefore, treatment with 6-DOG should only lower the FLIP700 signal while not affecting
YEMK signals within the cell samples.
Each compound was tested in duplicate at 50 mM with 7 mM glucose and 0 mM glucose
used as controls. As shown in Figure 5, there was a significant difference in biosensor response
within the combined barcoded BSF cell populations. Compounds were initially scored as active
if they inhibited the FRET response at a minimum of three standard deviations below the average
of high (7 mM glucose) controls (Figure 5) in all replicates without altering BSF parasite
viability. Figure 5 also showed a significant and simultaneous response difference between the
controls and the treated samples. 2-deoxyglucose (2-DOG) reduced both glucose and ATP

14
concentration in the cytosol. Salicylhydrozamic acid (SHAM) + glycerol only reduced ATP
concentration in the cytosol. While 6-deoxyglucose (6-DOG) only reduced glucose concentration
in the cytosol. Since our biosensors are highly specific and only correspond to their assigned
metabolite, the findings described above indicate that our barcoded biosensor cell lines give
reliable and robust measurements of their metabolite when used simultaneously.
Figure 5. Bar graph representing FRET emission of combined Cy3 barcoded FLII12Pglu-700μδ6 (Flip700) in Blue and C7 barcoded pDR-GW AT1.03YEMK (YEMK) in Red. Bars show the ratio of ECFP/EYFP intensity emission (x-axis) and the treatment administered (y-axis). High control corresponds to cells incubated in 7 mM extracellular glucose; low control corresponds to cells incubated in 0 mM extracellular glucose. 50 mM of 2-deoxyglucose (2Dog) was administered to combined BSF C3/C7 barcoded cells in 0.7 mM extracellular glucose (High+2-Dog). 50 mM of combined Salicylhydroxaminc acid (SHAM) and 5 mM glycerol was administered to combined BSF C3/C7 barcoded cells in 0.7 mM extracellular glucose (High+SHAM+glycerol). 50 mM of 6-deoxyglucose (6-Dog) was administered to combined BSF C3/C7 barcoded cells in 0.7 mM extracellular glucose (High+6Dog).

15
CONCLUSIONS
We have shown that multiple populations can be distinguished using two unique
barcoding dyes. With the selection and optimization of barcoding dyes, including the use of three
dyes rather than two, we hypothesize that the number of populations could be modified to fit a
large suite of FRET biosensors. We showed the method's robustness by demonstrating that
cellular barcoding has no effect on biosensor response and that the method appropriately models
single-cell analysis. We showed that barcoding can be used to simultaneously measure multiple
analytes in multiple locations, that each sensor responds sensitively and robustly to its respective
analyte, and that the method can highlight relationships between metabolically related analytes
(glucose and ATP). This approach could enable flow cytometric monitoring of multiple
metabolites in different cellular locations in a single experiment.
In the future, we propose that this method could be used for a variety of applications,
including high-throughput screening in T. brucei and other kinetoplast parasites. Additionally,
we anticipate that multiplexed measurements of important metabolic analytes will be crucial for
developing future drug therapies for kinetoplastid-caused diseases, such as trypanosomiasis,
leishmaniasis, and Chagas disease.
METHODS
Cells, Constructs, and Reagents
All experiments were performed using 427 BSF parasites. BSF cells were continuously
cultured in HMI9 media supplemented with 5% fetal bovine serum and 5% Corning Nu-Serum
IV. Cell culture media components, including the selection antibiotics (blasticidin, G418, and

16
hygromycin) were purchased from Sigma (St. Louis.; MO). Cy3 and Cy7 NHS ester dyes were
purchased from Lumiprobe (Hunt Valley, Maryland). To control for the potential effects of
fluorescent media components, parasites were suspended in phosphate-buffered saline (137 mM
NaCl, 2.7 mM KCl, 10 mM Na2HPO4, and 1.8 mM KH2PO4) for all experiments.
T. brucei transfection and localization of biosensors
The plasmids for the FRET biosensors, pRSET-FLII12Pglu-700μδ6 (FLIP700) and pDR-
GW AT1.03YEMK (YEMK), were obtained from Addgene (Addgene plasmids #13568 and
#28004 respectively).22,24,25 Each biosensor was cloned into the pXS6 expression vector using the
Q5 mutagenesis kit, restriction endonucleases, and other cloning reagents from New England
Biolabs (Ipswich, MA). The FLIP700 sensor was localized to the glycosomes by appending a C-
terminal peroxisomal targeting sequence using site-directed mutagenesis as described by Voyton
et al.22 Parasites were transfected and isolated as described by Wang et al.29
T. brucei culture
BSF cultures were counted via flow cytometry on a Beckman Coulter CytoFLEX flow
cytometer and diluted daily to a concentration of 2.0 X 10⁵ cells/mL to maintain cell densities at
approximately 1.0 X 10⁶ cells/mL for experimental use the following day. Parasites expressing a
FRET biosensor were grown in media containing blasticidin (5 µg/mL), hygromycin (5 µg/mL),
and G418 (1.5 µg/mL) antibiotics. WT cells were grown in media without antibiotics.
Sample preparation and flow cytometry

17
For flow cytometry experiments, cells were centrifuged at 1000 RCF for 10 minutes,
washed three times in PBS to remove media (centrifuging at 1000 RCF for 5 minutes in between
each wash) and stained at varying concentrations for a period of 30 minutes. After staining, cells
were washed two to four times before flow cytometric analysis. Experiments were performed on
a Thermo Fisher Scientific Attune NxT flow cytometer with a four-laser (405 nm, 488 nm, 561
nm, 638 nm) excitation configuration. Emissions due to YFP (530/30) and FRET (530/30) were
detected by excitation with the 488 nm and 405 nm lasers, respectively. Cy3 (585/42) and Cy7
(780/60) were excited with the 561 nm and 638 nm lasers. Gain settings for each fluorescent
channel were adjusted to minimize the robust coefficient of variation (rCV) for the signal in
each.
Flow cytometric data were analyzed using FlowJo (FlowJo LLC, Ashland, OR). For all
experiments, dead cells and doublets were excluded from analysis using forward scatter (FSC)
and side scatter (SSC) parameters (FSC-height vs. SSC-height and FSC-area vs. FSC-height,
respectively). For barcoding experiments, cells were then separated into distinct populations
according to their Cy3 and Cy7 fluorescence characteristics before analyzing biosensor response
in each population. Biosensor response was determined according to the ratio FRET/CFP.
Selection and optimization of barcoding dyes
Cy3 and Cy7 dyes were selected due to their fluorescence spectra that overlap minimally
with FRET biosensor spectra. Additionally, the high water-solubility of the sulfonated dyes
allows for more efficient washing after staining. Dye concentrations were determined empirically
by staining BSF cells with a 24-point 1:2 serial dilution of each dye. By comparing relative
fluorescence intensities at each point in the dose-response, concentrations were selected that

18
showed minimal (less than 5%) overlap between adjacent populations. The selected dyes were
then tested for effects on viability and sustained fluorescent intensity over a period of 3 hours to
determine whether the staining concentration of dye were toxic to parasites. Both Cy3 and Cy7
were shown to have a minimal effect on parasite viability (less than 5%) and negligible loss in
fluorescence intensity over the period tested. Graph created through Sigmaplot 11.0 (Systat
Software Inc.; San Jose, CA).
Testing parasite viability and population distinction of barcoded cells over time
Approximately 2-4 X 10⁷ BSF WT cells were washed, stained with Cy3, Cy7, both, or
neither, washed, and combined as described above in "sample preparation and flow cytometry".
The barcoded cells were analyzed at 10-15 µL/min for 3 hours. To measure the effect of the dyes
on viability, the FSC-height histograms of 15-minute timepoints at the beginning and end of the
3-hour time course assay was compared. FSC was used to estimate live cells. Graph created
through Sigmaplot 11.0 (Systat Software Inc.; San Jose, CA).
Creating a Z-prime experiment and analyzing high and low glucose response over time
Approximately 2-4 X 10⁷ BSF pRSET FLII12Pglu-700μδ6 or BSF AT1.03YEMK
(YEMK) cells were washed and prepared as described above in "sample preparation and flow
cytometry". Following final wash, equal amount of cells/µL were separately resuspended in
either PBS (0 mM glucose) or 7mM glucose and incubated in ambient condition for 35 mins
before being analyzed via flow cytometry as described above. FSC was used to estimate live
cells. 100 µL of the cell suspension (~20,000 cells per well) was pipetted into the wells; high
controls contained 7 mM glucose, and low controls contain no glucose. FSC was used to

19
estimate live cells. Graph created through Sigmaplot 11.0 (Systat Software Inc.; San Jose, CA).
The following equations was utilized to calculate the Z-prime:
3𝜎("#$%&$') = 𝑆𝑡𝑎𝑛𝑑𝑎𝑟𝑑𝐷𝑒𝑣𝑖𝑎𝑡𝑖𝑜𝑛𝑜𝑓7𝑚𝑀"high"𝑠𝑎𝑚𝑝𝑙𝑒𝑠
3𝜎()$*&#+,&) = 𝑆𝑡𝑎𝑛𝑑𝑎𝑟𝑑𝐷𝑒𝑣𝑖𝑎𝑡𝑖𝑜𝑛𝑜𝑓0𝑚𝑀"low" samples
𝑍! = 1 −3𝜎(#$%&'%() + 3𝜎(*%+'$,-')|𝜇(#$%&'%() − 𝜇(*%+'$,-')|
𝜇(#$%&'%() = 𝑚𝑒𝑎𝑛𝑜𝑓7𝑚𝑀"high" 𝑠𝑎𝑚𝑝𝑙𝑒𝑠
𝜇(*%+'$,-') = 𝑚𝑒𝑎𝑛𝑜𝑓0𝑚𝑀"low"𝑠𝑎𝑚𝑝𝑙𝑒𝑠
Running a barcoded multiplex screening assay
Approximately 3--6 X 10⁷ BSF pRSET FLII12Pglu-700μδ6 and BSF AT1.03YEMK
(YEMK) cells were washed and separately prepared as described above in "sample preparation
and flow cytometry." Following final wash, equal amount of cells/µL were resuspended in PBS
and treated. BSF pRSET FLII12Pglu-700μδ6 was barcoded with C3 and BSF AT1.03YEMK was
barcoded with C7. Barcoded incubation was done at ambient conditions for 30 minutes.
Following barcoded incubation, each barcoded population was respectively quenched with 1%
BSA in PBS, washed at 1000 RCF for 5 minutes and recombined as one joined sample. 100 µL
of the cell suspension (~40,000 cells per well) was pipetted into the wells containing high control
(7mM glucose) or low control (0 mM glucose). After a 35-minute incubation, the barcoded cells
were analyzed at 10-15 µL/min for 2 hours. FSC was used to estimate live cells. Graph created
through Sigmaplot 11.0 (Systat Software Inc.; San Jose, CA).
Testing barcoded multiplexed screening assay with drug treatments with known impacts

20
Approximately 2-4 X 10⁷ BSF pRSET FLII12Pglu-700μδ6 and BSF AT1.03YEMK cells
were washed and prepared as described above in "Running a barcoded multiplex assay." 100 µL
of the cell suspension (~40,000 cells per well) was pipetted into the wells containing the test
compounds to a final concentration of 50 mM in 0.7 mM glucose. Treatment administered
consisted of 3 replicates. 2-Deoxy-D-Glucose "2-Dog" (Cayman Chemical Company Inc.; Ann
Arbor, MI) was administered at 50 mM in mQH2O as solvent. 6-Deoxy-D-Glucose "6-Dog"
(Cayman Chemical Company Inc.; Ann Arbor, MI) was administered at 50 mM in mQH2O as
solvent. Salicylhydroxaminc acid "SHAM" (Sigma-Aldrich Inc.; St. Louis, MO) was
administered at 50 mM in 1% DMSO as solvent and combined with 5 mM glycerol (Sigma-
Aldrich Inc.; St. Louis, MO). Low control consisted of a starved (0 mM glucose) C3/C7
barcoded cell population; while high control consisted of a C3/C7 barcoded cell population re-
suspended in 0.7 mM glucose. FSC was used to estimate live cells. Graph created through
Sigmaplot 11.0 (Systat Software Inc.; San Jose, CA).
FURTHER ACKNOWLEDGEMENT
pRSET FLII12Pglu-700μδ6 was a gift from Wolf Frommer (Addgene plasmid # 13568).
The plasmid was cloned into pXS6.Q by Charles Voyton.18,22-25 Transfection was done by the
Morris Lab (Clemson University.; Clemson, SC).
AT1.03YEMK (Addgene plasmid #28004) was purchased from Addgene. The plasmid
was cloned into pXS6.Q by Jacob Vance and Garrett Parker. Transfection was done by the
Morris Lab (Clemson University.; Clemson, SC).

21
Funding was provided by the NIH grant number R21AI105656 and in part by a NIH
Center for Biomedical Excellence (COBRE) grant under award number P20GM109094.
ABBREVIATIONS
T. brucei, Trypanosoma brucei; BSF, bloodstream form; T. brucei, Trypanosoma brucei;
MCF, metacyclic form; NMR, nuclear magnetic resonance; FRET, Förster resonance energy
transfer; WT, wild-type; NHS, N-hydroxysuccinimidyl; Cy3, Sulfo-Cyanine3; Cy7, Sulfo-
Cyanine7; FLIP700, FLII12Pglu-700μδ6; FSC, forward scatter; SSC, side scatter.
REFERENCES
1. Sunyoto, T.; Boelaert, M.; Meheus, F. Understanding the economic impact of
leishmaniasis on households in endemic countries: a systematic review. Expert review of
anti-infective therapy 2019, 17, 57-69.
2. Bartsch, S. M.; Bottazzi, M. E.; Asti, L.; Strych, U.; Meymandi, S.; Falcón-Lezama, J.
A.; Randall, S.; Hotez, P. J.; Lee, B. Y. Economic value of a therapeutic Chagas vaccine
for indeterminate and Chagasic cardiomyopathy patients. Vaccine 2019, 37, 3704-3714
3. Bukachi, S. A.; Wandibba, S.; Nyamongo, I. K. The socio-economic burden of human
African trypanosomiasis and the coping strategies of households in the South Western
Kenya foci. PLoS neglected tropical diseases 2017, 11, e0006002.

22
4. Maria Laura, S.; Carolina Leticia, B.; Alan, T. Chapter 14 - The Challenge of Finding
New Therapies for Sleeping Sickness; The Microbiology of Central Nervous System
Infections; Elsevier Inc, 2018; pp 279–303.
5. J. Stein; S. Mogk; C.N. Mudogo; B.P. Sommer; M. Scholze; A. Meiwes; M. Huber; A.
Gray; M. Duszenko Drug Development Against Sleeping Sickness: Old Wine in New
Bottles? Current medicinal chemistry 2014, 21, 1713-1727.
6. Joice, A. C.; Harris, M. T.; Kahney, E. W.; Dodson, H. C.; Maselli, A. G.; Whitehead, D.
C.; Morris, J. C. Exploring the mode of action of ebselen in Trypanosoma brucei
hexokinase inhibition. International journal for parasitology -- drugs and drug
resistance 2013, 3, 154-160.
7. Stuart, K.; Brun, R.; Croft, S.; Fairlamb, A.; Gürtler, R. E.; McKerrow, J.; Reed, S.;
Tarleton, R. Kinetoplastids: Related Protozoan Pathogens, Different
Diseases. 2008, 118 (4), 1301–1310.
8. Anonymous kinetoplast; Oxford University Press: 2020.
9. HIDE, G. History of Sleeping Sickness in East Africa. Clinical Microbiology
Reviews 1999, 12, 112-125.
10. Vonlaufen, N.; Kanzok, S. M.; Wek, R. C.; Sullivan Jr, W. J. Stress response pathways in
protozoan parasites. Cellular microbiology 2008, 10, 2387-2399.
11. Tielens, A. G. M.; Van Hellemond, J. J., Differences in energy metabolism between
trypanosomatidae. Parasitol. Today 1998, 14 (7), 265-271.
12. Bringaud, F.; Rivière, L.; Coustou, V. Energy Metabolism of Trypanosomatids:
Adaptation to Available Carbon Sources. 2006, 149 (1), 1–9.

23
13. Ooi, C.; Bastin, P. More than meets the eye: understanding Trypanosoma brucei
morphology in the tsetse. Frontiers in cellular and infection microbiology 2013, 3, 71.
14. Langford, C. K.; Burchmore, R. J. S.; Hart, D. T.; Wagner, W.; Landfear, S. M.
Biochemistry and molecular genetics of Leishmania glucose transporters. Parasitology
1994, 108, S73-S83.
15. Gordhan, H. M.; Milanes, J. E.; Qiu, Y.; Golden, J. E.; Christensen, K. A.; Morris, J. C.;
Whitehead, D. C. A targeted delivery strategy for the development of potent
trypanocides. Chemical communications (Cambridge, England) 2017, 53, 8735-8738.
16. Louassini; M. Foulquié; R. Benítez; J. Adroher Citric-Acid Cycle Key Enzyme Activities
during In vitro Growth and Metacyclogenesis of Leishmania infantum Promastigotes.
The Journal of parasitology 1999, 85, 595-602.
17. Akhoundi, M.; Kuhls, K.; Cannet, A.; Votýpka, J.; Marty, P.; Delaunay, P.; Sereno, D. A
Historical Overview of the Classification, Evolution, and Dispersion of Leishmania
Parasites and Sandflies. 2016, 10 (3), e0004349.
18. P. A. M.; Pettit, S.; Walkinshaw, M. D. Fast acting allosteric phosphofructokinase
inhibitors block trypa-nosome glycolysis and cure acute African trypanosomiasis in mice.
Nature Communications 2021, 12, 1-10
19. CREEK, D. J.; NIJAGAL, B.; KIM, D.; ROJAS, F.; MATTHEWS, K. R.; BARRETT,
M. P. Metabolomics Guides Rational Development of a Simplified Cell Culture Medium
for Drug Screening against Trypanosoma brucei. Antimicrobial Agents and
Chemotherapy 2013, 57, 2768-2779.
20. Darren J Creek; Muriel Mazet; Fiona Achcar; Jana Anderson; Dong-Hyun Kim; Ruwida
Kamour; Pauline Morand; Yoann Millerioux; Marc Biran; Eduard J Kerkhoven;

24
Achuthanunni Chokkathukalam; Stefan K Weidt; Karl E V Burgess; Rainer Breitling;
David G Watson; Frédéric Bringaud; Michael P Barrett Probing the Metabolic Network
in Bloodstream-Form Trypanosoma brucei Using Untargeted Metabolomics with Stable
Isotope Labelled Glucose. PLoS pathogens 2015, 11.
21. Hennig, K.; Abi-Ghanem, J.; Bunescu, A.; Meniche, X.; Biliaut, E.; Ouattara, A.; Lewis,
M.; Kelly, J.; Braillard, S.; Courtemanche, G.; Chatelain, E.; Béquet, F. Metabolomics,
lipidomics and proteomics profiling of myoblasts infected with Trypanosoma cruzi after
treatment with different drugs against Chagas disease. Metabolomics 2019, 15, 1-12.
22. Voyton, C. M.; Choi, J.; Qiu, Y.; Morris, M. T.; Ackroyd, P. C.; Morris, J. C.;
Christensen, K. A. A Microfluidic-Based Microscopy Platform for Continuous
Interrogation of Trypanosoma brucei during Environmental Perturbation. Biochemistry
(Easton) 2019, 58, 875-882.
23. Lin, S.; Morris, M. T.; Ackroyd, P. C.; Morris, J. C.; Christensen, K. A. Peptide-Targeted
Delivery of a pH Sensor for Quantitative Measurements of Intraglycosomal pH in Live
Trypanosoma brucei. Biochemistry (Easton) 2013, 52, 3629-3637.
24. Lin, S.; Voyton, C.; Morris, M. T.; Ackroyd, P. C.; Morris, J. C.; Christensen, K. A. pH
regulation in glycosomes of procyclic form Trypanosoma brucei. The Journal of
biological chemistry 2017, 292, 7795-7805.
25. Voyton, C. M.; Qiu, Y.; Morris, M. T.; Ackroyd, P. C.; Suryadi, J.; Crowe, L.; Morris, J.
C.; Christensen, K. A. A FRET flow cytometry method for monitoring cytosolic and
glycosomal glucose in living kinetoplastid parasites. PLoS neglected tropical
diseases 2018, 12, e0006523.

25
26. Lin, S.; Morris, M. T.; Ackroyd, P. C.; Morris, J. C.; Christensen, K. A. Peptide-Targeted
Delivery of a pH Sensor for Quantitative Measurements of Intraglycosomal pH in Live
Trypanosoma brucei. Biochemistry (Easton) 2013, 52, 3629-3637.
27. Voyton, C. M.; Morris, M. T.; Ackroyd, P. C.; Morris, J. C.; Christensen, K. A., FRET
Flow Cytometry-Based High Throughput Screening Assay To Identify Disrupters of
Glucose Levels in Trypanosoma brucei. ACS Infect. Dis. 2018, 4 (7), 1058-1066.
28. Doucette, J.; Zhao, Z. Y.; Geyer, R. J.; Barra, M. M.; Balunas, M. J.; Zweifach, A.,
Flow Cytometry Enables Multiplexed Measurements of Genetically Encoded
Intramolecular FRET Sensors Suitable for Screening. J. Biomol. Screen 2016, 21 (6),
535-547.
29. Wang, Z.; Morris, J. C.; Drew, M. E.; Englund, P. T. Inhibition of Trypanosoma brucei
Gene Expression by RNA Interference Using an Integratable Vector with Opposing T7
Promoters. The Journal of biological chemistry 2000, 275, 40174-40179.
30. Burkard, G.; Fragoso, C. M.; Roditi, I. Highly efficient stable transformation of
bloodstream forms of Trypanosoma brucei. Molecular and biochemical
parasitology 2007, 153, 220-223.
31. Hiromi Imamura; Kim P. Huynh Nhat; Hiroko Togawa; Kenta Saito; Ryota Iino;
Yasuyuki Kato-Yamada; Takeharu Nagai; Hiroyuki Noji; James A. Wells Visualization
of ATP Levels inside Single Living Cells with Fluorescence Resonance Energy Transfer-
Based Genetically Encoded Indicators. Proceedings of the National Academy of Sciences
- PNAS 2009, 106, 15651-15656.

26
32. Bermejo, C.; Haerizadeh, F.; Takanaga, H.; Chermak, D.; Frommer, W. B., Dynamic
analysis of cytosolic glucose and ATP levels in yeast using optical sensors. Biochem.
J. 2010, 432, 399-406.
33. Nolan, G. P.; Krutzik, P. O. Fluorescent cell barcoding in flow cytometry allows high-
throughput drug screening and signaling profiling. Nature methods 2006, 3, 361-368.
34. Krutzik, P. O.; Clutter, M. R.; Trejo, A.; Nolan, G. P. Fluorescent Cell Barcoding for
Multiplex Flow Cytometry. Current Protocols in Cytometry 2011, 55, 6.31.1-6.31.15.
35. Luitz, M. P.; Barth, A.; Crevenna, A. H.; Bomblies, R.; Lamb, D. C.; Zacharias, M.
Covalent dye attachment influences the dynamics and conformational properties of
flexible peptides. PloS one 2017, 12, e0177139.
36. Zhang, J.; Chung, T. D. Y.; Oldenburg, K. R. A Simple Statistical Parameter for Use in
Evaluation and Validation of High Throughput Screening Assays. Journal of
biomolecular screening 1999, 4, 67-73.
37. Iversen, P. W.; Eastwood, B. J.; Sittampalam, G. S.; Cox, K. L. A Comparison of Assay
Performance Measures in Screening Assays: Signal Window, Z' Factor, and Assay
Variability Ratio. Journal of biomolecular screening 2006, 11, 247-252.
38. Pajak, B.; Siwiak, E.; Sołtyka, M.; Priebe, A.; Zieliński, R.; Fokt, I.; Ziemniak, M.;
Jaśkiewicz, A.; Borowski, R.; Domoradzki, T.; Priebe, W. 2-Deoxy-d-Glucose and Its
Analogs: From Diagnostic to Therapeutic Agents. International journal of molecular
sciences 2019, 21, 234.
39. Clarkson, A. B.; Grady, R. W.; Grossman, S. A.; McCallum, R. J.; Brohn, F. H.
Trypanosoma brucei brucei: A systematic screening for alternatives to the

27
salicylhydroxamic acid-glycerol combination. Molecular and biochemical
parasitology 1981, 3, 271-291.
40. Eisenthal, R.; Game, S.; Holman, G. D. Specificity and kinetics of hexose transport in
Trypanosoma brucei. Biochimica et biophysica acta. Biomembranes 1989, 985, 81-89.
Copyright © 2022 FDOKUMEN