Production, assay, and optimization of Chitinase enzyme ...
17
International Journal of Advance Research, Ideas and Innovations in Technology © 2021, www.IJARIIT.com All Rights Reserved Page |1299 ISSN: 2454-132X Impact Factor: 6.078 (Volume 7, Issue 4 - V7I4-1704) Available online at: https://www.ijariit.com Production, assay, and optimization of Chitinase enzyme produce by bacterial isolates from fish waste dumped soil K. Shameem Rani [email protected] MSS Wakf Board College, KK Nagar, Tamil Nadu S. Kulandaivel [email protected] VPMM College of arts and Science, Krishnankoil, Tamil Nadu ABSTRACT The effective chitinase enzyme producing organisms were isolated from prawn shell dumped soil. The isolates were named as FS1 &FS2. The chitinase enzyme was produced only when the organisms was grown on medium containing the prawn shell powder. Optimizations of enzyme production (pH, temparture, substrate concentration) were carried out. In this study both FS1(46.7U/ml) FS2 (77.8U/ml) bacterial strain produced maximum chitinase at pH 7.0. maximum chitinase enzyme was obtained in 0.5% substrate concentration (140U/ml) in 96hrs by FS1 and in 0.8% in substrate concentration (93.3U/ml) in 72 hrs. This enzyme was highly used for antifungal activity. Keywords: Chitin, Prawn Shell, N-acetyl-D-glucosamine INTRODUCTION Chitin is a polymer of N-acetyl D-glucosamine residues linked by β-1,4 bonds and it is the second most abundant renewable natural polymer after cellulose(Krithika and Chellaram, 2016). Chitin is Translucent, Pliable, Resilient, quite tough and Insoluble in water. It is widely distributed in nature and almost 10% global landings of aquatic products consist of organisms rich in chitinous materials(Jing Wang et al., 2015) The presence of chitinolytic microbes indicates the availability of chitin in the soil (Krithika & Chellaram, 2016). Chitinolytic bacteria can degrade chitin-containing waste into oligo and monomeric components (Kuddus & Ahmad, 2013) by using chitinase enzyme, due to the chitinase enzyme allow conversion the abundant chitin into useful products (Natsir et al., 2017) and most of the organisms utilize chitin as a source of nitrogen and carbon including Bacteria (Serratia, Bacillus, Aeromonas, Vibrio,Pseudomonas, Enterobacter, Actinomycetes etc.,), Fungi (Trichoderma, Aspergillus etc.,), viruses, insects, higher plants and animals. Among the microorganisms 90 – 99% chitinolytic populations are actinomycetes (Bansode & Bajekal, 2006), while only a fraction of them arebacterial and less than 1% are fungi (Alexander, 1977).Among the commonly isolated actinomycetes genera were streptosporangium (47%), Streptomyces (30%), Micromonospora (15%) and a group of the allied genera Actinomadura, Microtetraspora, and Nonomuraea (8%).Chitinases are hydrolytic and mycolytic in nature (Park et al., 1992). studies with cultures showed that relatively few marine bacteria ranging from 0.4 – 19 % only of the total cultured bacteria degrade chitin (Okutani et al., 1975). Screening and isolation of organisms capable of producing chitinase is usually is done on a medium containing chitin. Chitinase activity can be qualitatively assayed by determining the clearance zone developed around the colonies (CZ) to colony size (CS) growing on the chitin agar medium (Cody, 1989;Wirth &Wolf, 1990). This procedure requires longer incubation time for about 5 to6 days and is relatively less sensitive because of the poor visualization of the CZ. Most bacteria isolated express maximum chitinase during the third day of fermentation. Chitinase producing Fish dumping soil bacteria play an important role in the degradation of chitin. Thus, the present study has been narrowed on Isolation, Screening, Production, Assay and Optimization of chitinase producers from Fish dumping soil sample from Madurai, Tamilnadu, India.
-
Upload
khangminh22 -
Category
Documents
-
view
0 -
download
0
Transcript of Production, assay, and optimization of Chitinase enzyme ...

International Journal of Advance Research, Ideas and Innovations in Technology
© 2021, www.IJARIIT.com All Rights Reserved Page |1299
ISSN: 2454-132X
Impact Factor: 6.078 (Volume 7, Issue 4 - V7I4-1704)
Available online at: https://www.ijariit.com
Production, assay, and optimization of Chitinase enzyme
produce by bacterial isolates from fish waste dumped soil K. Shameem Rani
MSS Wakf Board College, KK Nagar, Tamil Nadu
S. Kulandaivel
VPMM College of arts and Science, Krishnankoil, Tamil Nadu
ABSTRACT
The effective chitinase enzyme producing organisms were isolated from prawn shell dumped soil. The isolates were
named as FS1 &FS2. The chitinase enzyme was produced only when the organisms was grown on medium containing
the prawn shell powder. Optimizations of enzyme production (pH, temparture, substrate concentration) were carried out.
In this study both FS1(46.7U/ml) FS2 (77.8U/ml) bacterial strain produced maximum chitinase at pH 7.0. maximum
chitinase enzyme was obtained in 0.5% substrate concentration (140U/ml) in 96hrs by FS1 and in 0.8% in substrate
concentration (93.3U/ml) in 72 hrs. This enzyme was highly used for antifungal activity.
Keywords: Chitin, Prawn Shell, N-acetyl-D-glucosamine
INTRODUCTION
Chitin is a polymer of N-acetyl D-glucosamine residues linked by β-1,4 bonds and it is the second most abundant renewable
natural polymer after cellulose (Krithika and Chellaram, 2016). Chitin is Translucent, Pliable, Resilient, quite tough and
Insoluble in water. It is widely distributed in nature and almost 10% global landings of aquatic products consist of organisms
rich in chitinous materials (Jing Wang et al., 2015) The presence of chitinolytic microbes indicates the availability of chitin
in the soil (Krithika & Chellaram, 2016). Chitinolytic bacteria can degrade chitin-containing waste into oligo and
monomeric components (Kuddus & Ahmad, 2013) by using chitinase enzyme, due to the chitinase enzyme allow conversion
the abundant chitin into useful products (Natsir et al., 2017) and most of the organisms utilize chitin as a source of nitrogen
and carbon including Bacteria (Serratia, Bacillus, Aeromonas, Vibrio, Pseudomonas, Enterobacter, Actinomycetes etc.,),
Fungi (Trichoderma, Aspergillus etc.,), viruses, insects, higher plants and animals.
Among the microorganisms 90 – 99% chitinolytic populations are actinomycetes (Bansode & Bajekal, 2006), while only a
fraction of them are bacterial and less than 1% are fungi (Alexander, 1977).Among the commonly isolated actinomycetes
genera were streptosporangium (47%), Streptomyces (30%), Micromonospora (15%) and a group of the allied genera
Actinomadura, Microtetraspora, and Nonomuraea (8%).Chitinases are hydrolytic and mycolytic in nature (Park et al.,
1992). studies with cultures showed that relatively few marine bacteria ranging from 0.4 – 19 % only of the total cultured
bacteria degrade chitin (Okutani et al., 1975). Screening and isolation of organisms capable of producing chitinase is usually
is done on a medium containing chitin. Chitinase activity can be qualitatively assayed by determining the clearance zone
developed around the colonies (CZ) to colony size (CS) growing on the chitin agar medium (Cody, 1989; Wirth &Wolf,
1990). This procedure requires longer incubation time for about 5 to 6 days and is relatively less sensitive because of the
poor visualization of the CZ. Most bacteria isolated express maximum chitinase during the third day of fermentation.
Chitinase producing Fish dumping soil bacteria play an important role in the degradation of chitin. Thus, the present study
has been narrowed on Isolation, Screening, Production, Assay and Optimization of chitinase producers from Fish dumping
soil sample from Madurai, Tamilnadu, India.

International Journal of Advance Research, Ideas and Innovations in Technology
© 2021, www.IJARIIT.com All Rights Reserved Page |1300
MATERIALS AND METHODS Collection of Fish dumping soil The Seafood waste dumping ground soil at the depth of approximately 2- 3cm was collected (from Perungudi, Madurai) in
a sterile plastic bag with the help of sterile spatula, the mouth of the bag were tied properly and carried to laboratory for
further use. This soil was very rich with chitinous material and hence this source is used for isolating chitinolytic
organisms.
Collection of Prawn shell
The Prawn shell wastes were collected from fish market, Therkuvasal, Madurai, Tamilnadu. These wastes were washed
with tap water repeatedly and dried oven at 80˚C for 48 hours. After drying, the shells were milled to fine particles. These
powdered prawn shell is used as a chitin powder for further experiments.
ISOLATION OF CHITINASE PRODUCERS From the collected soil sample, 1g of soil sample was added to sterile water with suitable dilution (10ˉ1 to 10ˉ10).
From each dilution, 0.1ml was transferred to petriplates containing the chitin agar medium plates by Spread plate technique.
The Spread plate method was used to isolate the soil microorganisms. The plates were incubated at 37ºC for 2-3 days. Chitin
producers were selected based on the morphology, color and zone formation. Well grown isolated colonies were picked and
selected for production of chitinase.
Composition of Chitin Agar medium: K2HPO4 – 0.1 g, Nacl – 0.5 g, Chitin powder ( Prawn shell powder) – 0.5 g,
MgSo4.7H2O – 0.004 g, CaCl2 – 0.002 g in 100ml of distilled water (Renwick et al., 1991).
SCREENING OF CHITINASE PRODUCING BACTERIA: From primary screening, two bacterial isolates were selected based on morphologically different and they were streaked on
freshly prepared Chitin Agar plates and the plates were incubated at 37ºC for 3-4 days. After incubation the plates were
flooded with 0.1% Congo red solution and Destaining with 1% Nacl solution of the plates showed a zone of clearance
around the two different colonies (FS1 & FS2) which confirmed chitinolytic activity. These bacteria were subcultured and
maintained in slants at 4ºC.
IDENTIFICATION OF CHITINOLYTIC BACTERIA The selected chitin degrading bacteria FS1 and FS2 were subjected to morphological and biochemical identification as per
Bergey’s Manual of systematic bacteriology.
CHITINASE ENZYME PRODUCTION BY SUBMERGED FERMENTATION For the production of Chitinase enzyme, both FS1 and FS2 culture were inoculated in 250ml conical flask containing the
fermentation medium (Chitin Agar medium). These medium contains three different concentration of substrate (Prawn shell
powder) such as 0.2%, 0.5% & 0.8%. Then, the flasks were incubated at 37ºC under shaking condition for 4-6 days. After,
every 24 hrs 10ml of culture broth was taken and centrifuged at 3000 rpm for 10mins and the resultant supernatant was used
to perform enzyme activity.
PRE-TREATMENT OF PRAWN SHELL POWDER: 0.1g of Prawn shell powder is dissolved in 1.5ml of concentrated Hcl and make up to 100ml using distilled water. It will be
used as a substrate stock solution. This form of colloidal chitin is easily utilized by chitinolytic bacteria for chitinase enzyme
production.
ASSAY OF CHITINASE ENZYME Chitinase production was measured in terms of chitinase activity exhibited by the culture supernatant in the enzyme assay.
Chitinase activity was assayed by DNS method (Miller, 1959).
Preparation of standard curve of N-acetyl-D-glucosamine (GlcNAc)
Preparation of standard curve of N-acetyl-D-glucosamine was drawn by measuring the absorbance of solutions containing
varied N-acetyl-D-glucosamine levels using 3,5-Dinitrosalicylic acid (DNS) reagent. Standard solution of N- acetyl-D-
glucosamine at concentrations of 100 to 1000 μg/ml was prepared using distilled water. Different concentration of test
solution make with 1ml of distilled water, 3 ml of DNS reagent was added, and the mixture was incubated in a boiling water
bath for 10 mins, instead of test solution, distilled water used as a blank. The color development was measured for the
absorbance at wavelength of 540nm using colorimeter. A graph was plotted between GlcNAc concentrations against their
absorbance value at 540nm (Table 2 and Figure 1).
One Unit (1U) of chitinase was defined as the amount of enzyme that released one μmol of reducing sugar as N-acetyl
glucosamine (Glucose) per ml per min under the assay conditions.

International Journal of Advance Research, Ideas and Innovations in Technology
© 2021, www.IJARIIT.com All Rights Reserved Page |1301
Preparation of DNS Reagent
• Sodium Hydroxide – 8g
• 3,5-Dinitrosalicylic Acid (DNS) – 1g
• Sodium Potassium Tartarate – 30g
• Distilled water - 100 ml
Quantitative Assay for Chitinase
The cell free supernatant was used as an enzyme source. Two sterile test tubes were taken and labeled as Blank and Test.
The Test sample consisted of 1ml of 0.1M Sodium Phosphate buffer (pH-7), 1ml of 0.1% Substrate (colloidal chitin)
followed by 1ml of Supernatant (enzyme), instead of Substrate, 1ml of distilled water was added as a blank (control assay).
Tubes were incubated at 37°C for 1 hr.
After incubation, the reaction was stopped by adding 3 ml of DNS reagent in each tube and heated in boiling water bath for
15mins and cooled rapidly in cold water. Then, the absorption of enzyme activity was measured at 540nm. The reducing
sugar was estimated using standard curve of glucose.
OPTIMIZATION OF ENZYME ACTIVITY The optimization of chitinase enzyme activity was performed to various conditions i.e. different substrate concentration (0.5
to 2.5ml from 0.1%), temperature (35, 37, 39 and 41), pH (5-9) and enzyme concentration (0.5 to 2.5ml). The factors were
studied in a sequential manner. One factor was optimized at a time. The optimal level of this factor was incorporated in the
next step.
In this optimization of chitinase production, the maximum chitinase activity of 0.5% (Substrate concentration) of 96th
hour FS1 culture was taken and0.8% (Substrate concentration) of 72nd hour FS2 culture was taken as an enzyme source.
Effect of different temperature for chitinase production:
The measurement of the optimum temperature was conducted by placing reaction mixture contains 1ml of Enzyme, 1ml of
0.1% Substrate, 1ml of 0.1M Sodium Phosphate Buffer (pH – 7), instead of substrate, 1ml of distilled water was used as a
control (for all test). The tubes were incubated in different temperature ranging from 35ºC, 37ºC, 39ºC and 41ºC for 1hr.
After incubation, the enzyme activity was performed to both cultures. The optimum temperature for FS1 culture was 37ºC
and FS2 culture was 39ºC.
Effect of different pH for chitinase production:
The optimal pH of the chitinase was determined by varying the pH of 0.1M Sodium Phosphate Buffer (5, 6, 7, 8 &
9). These different pH containing Buffer solution was added in a different reaction mixture tubes and the tubes were
incubated at 37ºC (FS1 culture) and 39ºC (FS2 culture) for 1 hr. Then, the enzyme activity was performed.
Effect of different Substrate concentration for chitinase production:
The optimum substrate for chitinase production was determined by adding different concentration of 0.1% substrate such
as 0.5ml to 2.5ml in each tube containing 1ml of Enzyme and 1ml of 0.1M Sodium Phosphate Buffer (pH – 7 in both
cultures). These tubes were incubated at 37ºC (FS1 culture) and 39ºC (FS2 culture). The maximum chitinase activity
was obtained in 0.5ml of 0.1% substrate in both FS1 and FS2 cultures.
Effect of different Enzyme concentration for Chitinase production:
For optimization of chitinase enzyme was determined by varying the Enzyme concentration by adding 1 ml of Buffer ( pH-
7), 0.5 ml of Substrate and different concentration of enzymes (0.5 to 2.5 ml) to each tube and incubated both FS1 and FS2
cultures at 37ºC and 39ºC. The maximum enzyme activity was obtained in 2.5ml of enzyme containing tubes i.e the Enzyme
activity was increased by increasing of Enzyme concentration.
RESULTS Isolation and Selection of chitinase producers Chitinolytic bacteria were isolated from Fish dumping area soil, Madurai, Tamilnadu. The isolates were screened based on
zone of clearance. From the primary screening method, two colonies were selected for secondary screening and labeled as
FS1 and FS2. The results were shown in Plate 1.
Identification of chitinolytic bacteria
The isolates were tentatively identified as Actinomycetes (FS1 and FS2) by Morphological and Biochemical test (Kreig,

International Journal of Advance Research, Ideas and Innovations in Technology
© 2021, www.IJARIIT.com All Rights Reserved Page |1302
1984), according to Bergey’s manual of systematic bacteriology. The result was shown in Plate 2 and Table 1.
Production medium for chitinolytic bacteria
Different sets of growth media were formulated by varying the substrates. In each sets of two cultures, substrate
concentration only differ such as 0.2 %, 0.5% and 0.8 %. The results were shown in Plate 3, Table 3, Table 4, Figure 2
and Figure 3. The maximum chitinase enzyme activity was observed in FS1 bacteria at the concentration of 0.5% chitin (140
U/ml) after 96 hrs. The maximum chitinase activity was observed in FS2 bacteria at the concentration of 0.8% chitin
(93.33 U/ml) after 72 hrs.
Optimization of enzyme activity
Effect of temperature for chitinase production Chitinase production was maximum at 37ºC (46.7 U/ml) by FS1 bacteria and 39ºC (46.7 U/ml) by FS2 bacteria. The results
were shown in Table 5, Table 6, Figure 4 and Figure 5.
Effect of pH for chitinase production
The effect of pH of media for the chitinase production, the bacterial cultures were grown at different pH (5 to 9). Among
the tested pH, pH – 7 was optimum for both FS1 (46.7 U/ml) and FS2 (77.8 U/ml) bacteria. The results were shown in Table
7, Table 8 and Figure 6 and Figure 7.
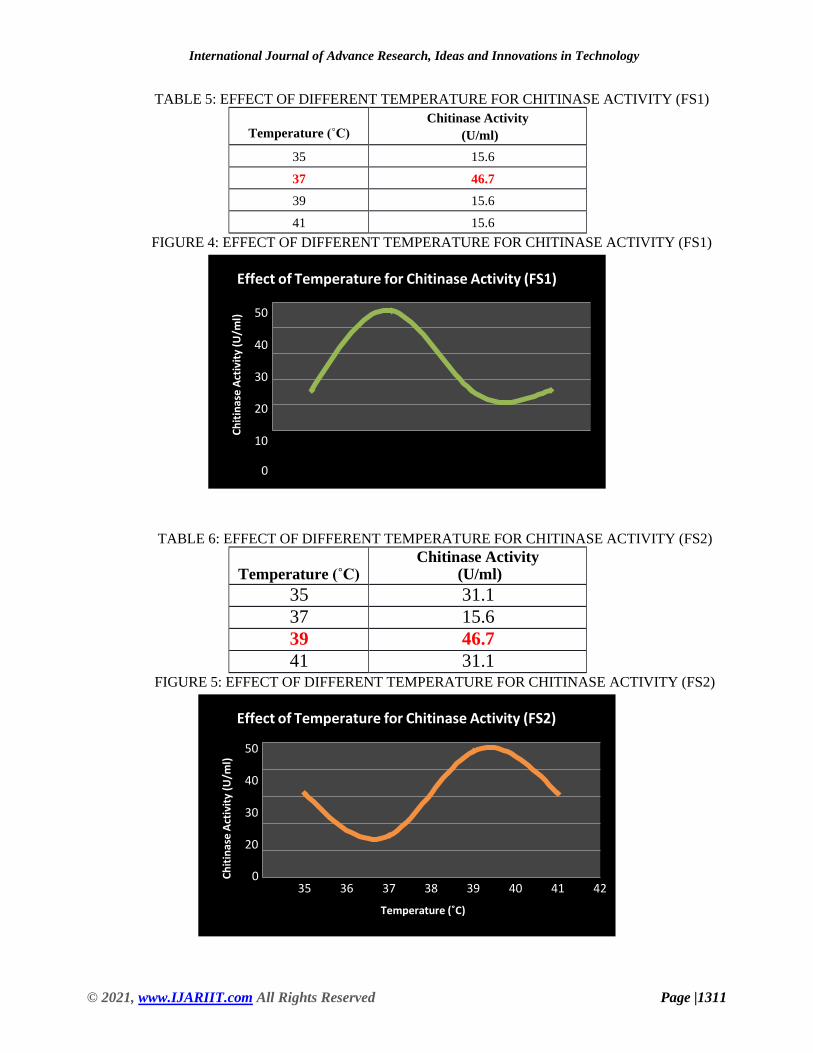
Effect of Substrate concentration for chitinase activity
0.5ml to 2.5ml concentrations of 0.1% substrate was used to elucidate the best concentration for maximum chitinase activity
which can be exploited at the industrial level. FS1 and FS2 produced maximum enzyme at 0.5ml of 0.1% stock solution.
Accordingly both FS1 and FS2 produced 77.8 U/ml of enzyme, respectively. The results were shown in Table 9, Table 10,
Figure 8 and Figure 9.
Effect of Enzyme concentration for chitinase activity
Different concentrations of enzyme were used to elucidate the best concentration for maximum chitinase activity. The
maximium enzyme activity was shown in both FS1 and FS2 at 2.5ml of enzyme concentration. Accordingly, FS1 produced
77.8 U/ml and FS2 bacteria produced 140 U/ml of enzyme, respectively. The results were shown in Table 11, Table 12,
Figure 10 and Figure 11.
CONCLUSION In the present study, the isolated FS1 and FS2 bacteria (Plate 1) showed effective chitinase production with the utilization
of chitin from prawn shell waste powder and the isolates were tentatively identified as Actinomycetes (FS1 and FS2) by
Morphological and Biochemical test (Plate 2, Table 1).
In our studies, Plate 3, Table 3 and Table 4 shows that the substrate concentration in production medium was produced the
maximum chitinase activity shown by FS1 was observed in 0.5% (140 U/ml) after 96 hrs and FS2 bacteria was observed in
0.8% (93.33 U/ml) after 72 hrs. Similarly, (Anuradha and Revathi, 2013) reported that produced highest chitinase in
V.aestuaianus (0.11 U/ml) and Exiguobacterium (0.31 U/ml) after 96 hrs of incubation time and 72 hrs in F.odoratus (0.18
U/ml) and S.putrefaciens (0.29 U/ml). In the case of K.gibsonii (Paul, 2012) also reported at 72 hrs of incubation time.
Similar observations were also reported by (Saadoun et al., 2009) with Streptomyces S242 (0.0456 U/ml) and (Shankar
Subramaniam et al., 2012) also reported Streptomyces sp, with 96 hrs of incubation. Although (Mane et al., 2018) reported
maximum chitinase production at 168 hrs of incubation by Neisseria sp. One of the reasons for decreased production may
be the lack of nutritions or production of toxic chemicals in the medium results in the inactivation of secretary
machinery of the enzymes.
The growth of bacteria and enzyme production are also affected with the change in incubation temperature. In our isolated
both FS1 and FS2 bacteria were produced maximum chitinase (46.7 U/ml) at 37ºC and 39ºC. The results were shown in
Table 5 and Table 6. (Kuddus and Ahmad, 2013; Mane et al., 2018; and Bansode and Bajekal, 2006) also reported
maximum chitinase production at 37ºC in A.hydrophila, HS4 (43.08 U/ml); A.punctata, HS6 (53.22 U/ml); Neisseria sp;
Bacillus, SB5 and Streptomyces, SB1. In the case of Bacillus licheniformis (Jholapara et al., 2013) and Streptomyces S242
(saadoun et al., 2009); K.gibsonii (Paul, 2012) reported at 35ºC. 32ºC in Streptomyces sp, (Shankar and Subramaniam,
2012). 30ºC was reported in Flavobacterium (0.05 U/ml) (Anuradha and Revathi, 2013); S.hygroscopicus (Haggag and
Abdallh, 2012) and T3 (1.327 U/ml) (Natsir et al., 2017). In the case of Exiguobacterium (0.04 U/ml) (Anuradha and Revathi,
2013), the optimum temperature for chitinase production was 10ºC. 40ºC was reported in Vibrio aestuarianus (0.09 U/ml)
and Shewenella putrefaciens (0.11 U/ml) (Anuradha and Revathi, 2013). 45ºC in Nocordia, SB4 (Bansode and Bajekal,
2006). 50-60ºC in Fungi, VB2 (Bansode and Bajekal, 2006). Bacterial growth was absent in 60ºC.

International Journal of Advance Research, Ideas and Innovations in Technology
© 2021, www.IJARIIT.com All Rights Reserved Page |1303
In this study, Both FS1 (46.7 U/ml) and FS2 (77.8 U/ml) bacteria Produce maximum chitinase at pH-7. The results were
shown in Table 7 and Table 8. Different organisms have different pH optima and decrease or increase in pH on either side
of the optimum value results in poor microbial growth. Similar pH optima has been reported in the case of Bacillus
licheniformis ((Jholapara et al., 2013), was optimum at pH-4, Streptomyces sp, (Shankar Subramaniam et al., 2012) was
optimum at pH-5. In the case of Vibrio aestuarianus (0.065 U/ml), Flavobacterium odoratus (0.085 U/ml), Exiguobacterium
(0.075 U/ml) (Anuradha and Revathi, 2013); Neisseria sp, (Mane et al., 2018); Streptomyces SB1 (Bansode and Bajekal,
2006) produced maximum chitinase at pH-6. (Paul, 2012) has been repoted pH-6.5 in K.gibsonii. Similarly, the optimum
pH-7 was reported in Streptomyces hygroscopicus (Haggag and Abdallh, 2012); Aeromonas punctata, HS6 (73.43U/ml)
(Kuddus and Ahmad, 2013); Streptonyces strain242 (0.042 U/ml) and Fungi, VB2 (Bansode and Kajekal, 2006). In the case
of Shewenella putrefaciens (0.05 U/ml) (Anuradha and Revathi, 2013); Aeromonas hydrophila, HS4 (93.27 U/ml) (Kuddus
and Ahmad, 2013) produced maximum chitinase at pH-8. Streptomyces, VB3; Bacillus, SB5 and Nocordia,SB4 (Bansode
and Bajekal, 2006) produce maximum chitinase at pH-9.
Table 9 and Table 10, shows that the maximum chitinase production for FS1 and FS2 were observed in 0.5ml of 0.1%
substrate (77.8 U/ml). (Natsir et al., 2017) observed maximum chitinase in 0.06% (0.343 U/ml) and decreased in 0.08-
0.14%. A.hydrophila, HS4 (52.8 U/ml) and A.punctata, HS6 (43.4 U/ml) were produced maximum chitinase in 0.3% and
K.gibsonii (Paul, 2012) reported in 0.6%. Bacillus licheniformis (Jholapara et al., 2013) reported in 1.5%. 1.6% (0.0774
U/ml) was best in streptomyces sp, (Saadoun et al., 2009) and 2% in V.aestuarianus (0.05 U/ml); F.odoratus (0.075 U/ml);
S.putrefaciens (0.04 U/ml) and Exiguobacterium (0.039 U/ml) (Anuradha and Revathi, 2013). Table 11 and Table 12 shows
that effect of Enzyme concentration for chitinase production. In this study, 0.5 – 2.5 ml of different concentration
of enzymes could be used and they are gradually increased and maximum chitinase observed in 2.5 ml of the enzyme
concentration i.e. 77.8 U/ml (FS1) and 140 U/ml (FS2).
REFERENCES [1] Ajit, N.S., Verma, R., and Shanmugam, V., (2006). Extracellular Chitinase of Fluorescent Pseudomonas antifungal to
Fusarium Oxysporum f.Sp. dianthi causing carnation wilt. Curr.Microbiol. 52: 310 – 316.
[2] Alexander, M., (1977). Microbiology of other Polysaccharides: Introduction to Soil Microbiology. 2: 196 – 202.
[3] Anuradha, V., and Revathi, K., (2013). Purification and Characterization of bacterial Chitinase isolated from
Crustacean Shells. Int. J. Pure App. Biosci. 1(4): 1 – 11.
[4] Awarenet, 2004. Handbook for the Prevention and Minimization of waste and valorization of by-products in European
Agro-Food Industries. Gaiker Centro Technol.
[5] Bai, Y., Eijsink, V.G.H., Kielak, A.M., et al., (2016). Genomic comparison of chitinolytic enzyme systems from
terrestrial and aquatic bacteria. Environ. Microbiol. 18: 38 – 49.
[6] Benhamou, N., and Asselin, A., (1989). Attempted localization of a substrate for chitinase in plant cells reveals
abundant N-acetyl-D-glucosamine residues in secondary walls. Biol. Cell. 67: 341 – 350.
[7] Blackwell, J., (1988). Physical methods for the determination of Chitin Structure and Conformation. In. J. met. Enzymol.
eds.16 (Part B): 435 – 442.Cody, R.M., (1989). Curr. Microbiol. 19: 201 – 205.
[8] Collinge, D.B., Kragh, K.M., Mikkelsen, J.D., Nielsen, K.K., Ramussen, U., and Vad, K., (1993). J. Plant chitinases.
Plant. 3: 31 – 40.
[9] Connell, T.D., Metzger, D.J., Lynch, J., and Fplster, J.P., (1998). Endochitinase is transported to the extracellular milieu
by the eps-encoded general secretory pathway of Vibrio cholera. J. Bacteriol. 180: 5591 – 5600.
[10] Dahiya, N., Tewari, R., Tiwari, R.P., and Hoondal, G.S., (2005a). Production of an antifungal Chitinase from
Enterobacter sp, NRG4 and its applications in Protoplast production. World. J. Microbiol. Biotechnol. 21: 1611 – 1616.
[11] Dahiya, N., Tewari, R., Tiwari, R.P., and Hoondal, G.S., (2005b). Chitinase production in Solid-state fermentation by
Enterobacter sp, NRG4 using statistical experimental design. Curr. Microbiol. 51(4): 222-228.
[12] Dahiya, N., Tewari, R., Tiwari, R.P., and Hoondal, G.S., (2005c). Chitinase from Enterobacter sp, NRG4: its
Purification, Characterization and reaction pattern. Electr. J. Biotechnol. 8 (2): 10.
[13] De-Jong, A.J., Cordewener, J., Lo Schiavo, F., Terzi, M., Vandeckerkhove, J., Van-Kammen, A., and De-Vries, S.,
(1992). A carrot somatic embryo mutantis rescued by chitinase. Plant cell: 4: 425 – 433.
[14] Duffy, BK., and Weller, D.M., (1995). Use of Gaeumannomyces graminis var.graminis alone and in combination with
fluorescent Pseudomonas sp, to suppress take all of wheat. Plant Dis. 79: 907 – 911.
[15] Escott, G.M., and Adams, D.J., (1995). Chitinase activity in Human serum and Leukocytes. Infec. Immun. 63: 4770 –
4773.
[16] Escott, G.M.W., Walter, C.E., Ingham, E., and Adams, D.J., (1996). Expression of Chitinase activity monocyte
differentiation. In. Chitin Enzymol. 2: 3 – 10.
[17] Felse. P.A., and Panda, T., (2000). Production of microbial Chitinases – A revisit.Biopros. Eng. 23: 127 – 134.
[18] Flach, J., Pilet, P.E., and Jolles, P., (1992). What’s new in Chitinase research? Experi. 48: 701 – 716.
[19] Gooday, G.M., Wei-Yun, Z., and O’Donnell, R.W., (1992). What are the roles of Chitinases in the growing Fungus?

International Journal of Advance Research, Ideas and Innovations in Technology
© 2021, www.IJARIIT.com All Rights Reserved Page |1304
FEMS Microbiol. Lett. 100: 387 – 392.
[20] Gooday, G.W., (1995). Diversity of roles of Chitinases in nature. In : Zakaria MB, Wan uda WM, Abdullah MP, editors.
Chitin and Chitosan. Malaysia: Penerbit University Kebangsaan. 191 – 202.
[21] Halimahtussadiyah, R., Muh.Natsir, Desy, K., and Sukma, P.U., (2017). Isolation and Identification of Chitinolytic
bacteria of Pohara river of South East Sulawesi and the Optimization production of Chitinase enzyme.
[22] Islam, R., Datta, B., (2015). Diversity of Chitinases and their Industrial potential.Int. J. Appl. Re. 1(3): 55 – 60.
[23] Ismail, S., Ruqayyah A.O., Ziad, J., Qotaiba, A., (2009). Influence of culture conditions of Streptomyces sp, (Strain
S242) on chitinase production. J. Microbiol. 58(4): 339 – 345.
[24] Jing, W., Jiquan, Z., Fengge, S., Tianshu, G., and Jianhai, X., (2015). Purification and Characterization of chitinases
from Ridgetail White Prawn Exopalaemon carinicauda. 20: 1955 – 1967.
[25] Jung, W.J., An, K.N., Jin, Y.L., Park, R.D., and Lim, K.T., (2003). Biological control of damping-off caused by
Rhizoctonia solani using Chitinase producing Paenibacillus illinoisensis KJA-424. Soil Biol.Biochem. 35: 1261 – 1264.
[26] Kacem, H., Abdoulaye, J.S.B., Catarina, E., Lassad, N., Jordi, M., Ultrastructural characters of the Spermatozoan of
the digenean Hypocreadium caputuvadum kacem etal., 2011 (Lepocreadioidea: Lepocreadiidae), an intestinal parasite
of Balistes capriscus in Tunisia. C. R. Biol. 355: 637 – 644.
[27] Krieg, N.R., and Holt, J.G., (1984). Bergey’s manual of Systematic Bacteriology. The Williams and Wilkins co.,
Baltimore and London. 1: 161 – 172.
[28] Krithika, S., and Chellaram, C., (2016). Isolation, Screening and Characteriztion of Chitinase producing bacteria from
Marine wastes. Int. J. Pharma and Pharmaceu. sci. 8 (5).
[29] Kuranda, M.J., and Robbins, P.W., (1991). Chitinase is required for cell separation during growth of Saccharomyces
cerevisiae. J. Biol. Chem. 226: 19758 – 19767.
[30] Laine, L.A., and Lo, C.J., (1996). Diagnosis of Fungal infection with a chitinase.
[31] PCT Int. Appl. Wo 9802742A122 (CA 128, 86184).
[32] Langer, R.C., Fengwu, L., Vsevolod, P., Alexander, K., and Vientz, J.M., (2002). Monoclonal antibody against the
Plasmodium falciparum chitinase, PfCHT1, recognizes in a malaria transmission blocking epitope in Plasmodium
gallinaceum ookinetes unrelated to the chitinase PgCHTI. Infect. Immun. 1581 – 1590.
[33] Leung, D.W.M., (1992). Involvement of plant chitinase in sexual reproduction of higher plants. Phytochem. 31: 1899
– 1900.
[34] Lundblad, G., Hederstedt, B., Lind, J., and Steby, M., (1974). Chitinase in Goat serum. Eur. J. Biochem. 46: 367 – 376.
[35] Mane, R.S., Patil, G.S., and Choradiya, B.R., (2018). Acidic Chitinase production by Neisseria sp. 7 (7): 2081 – 2086.
[36] Manucharova, N.A., Belova, E.V., Polyanskaya, L.M., Zenova, G.M., (2004). A Chitinolytic Actinomycete complex in
Chernozem soil. 73 (1): 56 – 59.
[37] Mellor, K.J., Nicholas, R.O., and Adams, D.J., (1994). Purification and Characterization of chitinases from Candida
albicans. FEMS Microbiol.Lett. 119: 111 – 118.
[38] Merzendorfer, H., and Zimoch, L., (2003). Chitin metabolism in Insects: Structure, Function and regulation of Chitin
Synthases and Chitinases. Exp. Biol. 206: 4393 – 4412.
[39] Miller, G.L., (1959). Use of DinitroSalicylic Acid reagent for determination of Reducing Sugar. Anal. Chem. 31 (3):
426 – 428.
[40] Mini, K.P., (2012). Microbial Chitinases - Isoaltion, Purification and Characterization.
[41] Miyashita, K., Fugii, T., and Sawada, Y., (1991). Molecular cloning and Characterization of chitinase gene from
Streptomyces lividans 66. J. Microbiol. 137: 2065 – 2072.
[42] Mukherjee, G., and Sen, S.K., (2004). Characterization and Identiification of Chitinase producing Streptomyces
venezuelae P10. Int. J. Exp. Biol. 42: 541 – 544.
[43] Murata, M., and Okutani, T., (1975). Rare and interesting squid from Jan. IV. An occurrence of Gonatopsis gaponicus
okiyama in the sea of Okhotsk (oegopsida: Gonatidae). 33(4): 210 – 211.
[44] Paoletti, M.G., Lorenzo, N., Roberta, D., and Salvatore, M., (2007). Human gastric juice contains chitinases that can
degrade chitin. Ann. Nutr. Metab. 51: 244 – 251.
[45] Park, R.D., Kim, K.M., Cho, M.J., (1992). Purification and Characterization of ethylene induced β-1,3-glucanase from
Soyabean (Glycins max c.) leaves. Kor. J. Biochem. 25: 597 – 603.
[46] Patil, S.R., Ghormade, V., Deshpande, M.V., (2009). Chitinolytic enzymes: an exploration. Enzyme Microbiol.Technol.
26: 473 – 483.
[47] Punja, Z.K., and Zhang, Y.Y., (1993). Plant Chitinases and their role in resistance to Fungal diseases. J. Nematol. 25:
526 – 540.
[48] Ramirez, M.A., Rodriguez, A.T., Luis, A., C, P., (2010). Chitin and its derivatives as biopolymers with potential
agricultural applications. Biotechnol. Apli. 27: 270 – 276.
[49] Renwick, A., Campbell, R., Coe, S., (1991). Assessment of in vitro screening systems for potential biocontrol agents
of Gaeumannomyces graminis. Plant Pathol. 40: 524 – 532.
[50] Riddhi, J.J., Radhika, S.M., and Chhaya S.S., (2013). Optimization of cultural conditions for Chitinase production from
Chitinolytic bacterium isolated from Soil sample. Int. J. Pharm. Bio Sci . 4 (2): 464 – 471.
[51] Robbins, P.W., Albright, C., and Benfield, B., (1988). Cloning and Expression of a Streptomyces plicatus chitinase

International Journal of Advance Research, Ideas and Innovations in Technology
© 2021, www.IJARIIT.com All Rights Reserved Page |1305
(Chitinase-63) in Escherichia coli. J. Bio. chem. 263: 443 – 447.
[52] Roberts, A., and Selitrenkoff, N., (1988). Colloidal chitin preparations. J. Gen. Microbiol. 134: 169 – 176.
[53] Robinson, S.P., Jacobs, A.K., and Dry, I.B., (1997). A class IV chitinase is highly expressed in grape berries during
ripening. Plant Phsiol. 114: 771 – 778.
[54] Saima, M. K., Roohi, I.Z.A., (2013). Isolation of novel Chitinolytic bacteria and Production, Optimization of
extracellular Chitinase. J. Gen. Eng and Biotechnol. 11: 39 – 46.
[55] Shankar, S., Venkatraman, R., Guru, K.N., (2012). Studies on Production of Enzyme Chitinase from Streptomyces sp.
and its antifungal activity. J. Pharma. Re. 5 (3): 1409 – 1413.
[56] Shen, K.T., Chen, M.H., Chan, H.Y., Jeng, J.H., Wang, Y.J., (2009). Inhibitory effects of Chitooligosaccharides on
tumor growth and metastasis. Food chem. Toxicol. 47: (1864 – 1871).
[57] Someya, N., Numata, S., Nakajima, M., Hasebe, A., Hibi, T., and Akutsu, K., (2003). Biological control of rice blast
by the epiphytic bacterium Erwinia ananas transformed with a chitinolytic enzyme gene from an antagonistic
bacterium, Serratia marcescens strain B2. J. Gen. Plant pathol. 69: 276 – 282.
[58] Stephan, J.M., Gerhard, A.W., (1990). Dye-labelled Substrates for the assay and detection of chitinase and lysozyme
activity. J. Microbiol. Met. 12(3-4): 197 – 205.
[59] Suresh, P.V., and Chandrasekaran, M., (1998). Utilization of Prawn waste for Chitinase production by the marine
fungus Beauveria bassiana by Solid substrate Fermentation. World J. Microbiol. Biotechnol. 14: 655 – 660.
[60] Toppe, J., Albrektsen, S., Hope, B., Aksnes, A., (2007). Chemical composition, Mineral content and amino acid and
lipid profiles in bones from various Fish species. Comp. Biochem. Physiol. 146 (3): 395 – 401.
[61] Trudel, J., and Asselin, A., (1989). Detection of Chitinase activity after Polysaccharide Gel Electrophoresis. Anal.
Biochem. 178: 362 – 366.
[62] Tsai, G., Wu, Z., and Su, W., (2000). Antibacterial activity of a Chitooligosaccharide mixture prepared by cellulase
digestion of shrimp chitosan and its application to Milk preservation. J. Food protection. 63(6): 747 – 752.
[63] Vaidya, R.J., Shah, I.M., Vyas, P.R., and Chhatpar, H.S., (2001). Production of chitinase and its optimization from a
novel isolate Alcaligens xylosoxydans potential in antifungal biocontrol. World J. Microbiol. Biotechnol. 17: 691 – 696.
[64] Vijay, B.B., and Shyam, S.B., (2006). Characterization of Chitinases from microorganisms isolated from Lonar Lake.
Ind. J. Biotechnol. 5: 357 – 363.
[65] Wafaa, M.H., Elham, G.A., (2012). Purification and Characterization of Chitinase produced by Endophytic
Streptomyces hygroscopicus against some phytopathogens. J. Microbiol. Re. 2(5): 145 – 151.
[66] Wang, S.L., and Chang, W.T., (1997). Purification and Characterization of two bifunctional Chitinase by Pseudomonas
aeruginosa K-187 in a Shrimp and Crab shell powder medium. Appl. Environ. Microbiol. 63: 380 – 386.
[67] Wen, C.M.,Tseng, C.S., Cheng, C.Y., and Li, Y.K., (2002). Purification, Characterization and Cloning of a chitinases
from Bacillus sp. NCTU2. Biotechnol. Appl. Biochem. 35: 213 – 219.
[68] Woo, C.J., and Park, H.D., (2003). An extracellular Bacillus sp, chitinase for the production of chitotriose as a major
chitinolytic product. Biotechnol. Lett. 25: 409
– 412.
[69] Wu, C.T., Leubner-Metzger, G., Meins, F.J.R., and Bradford, K.J., (2001). Class I β-1,3-Glucanase and chitinase are
expressed in the micropylarendosperm of tomato seeds prior to radicle emergence. Plant physiol. 126: 1299 – 1313.

International Journal of Advance Research, Ideas and Innovations in Technology
© 2021, www.IJARIIT.com All Rights Reserved Page |1306
PLATE 1: ISOLATION OF CHITINASE PRODUCING BACTERIA FROM FISH DUMPING SOIL
(FS1 and FS2 bacteria)
PLATE 2: MORPHOLOGY OF ACTINOMYCETES (100X)
TABLE 1: MORPHOLOGICAL AND BIOCHEMICAL CHARACTERISTICS OF BACTERIAL ISOLATES
S.No Characteristics Bacterial Isolates
FS1 FS2
1 Gram’s staining (+), Rod shape (+), Rod shape
2 Starch hydrolysis Positive Positive
3 Citrate utilization Positive Positive
4 Indole Negative Negative
5 Methyl red Positive Positive
6 Vogues proskauer Negative Negative
7 Catalase test Negative Negative
FS1 FS2

International Journal of Advance Research, Ideas and Innovations in Technology
© 2021, www.IJARIIT.com All Rights Reserved Page |1307
8 TSI test Acid butt,Alkaline slant Alkaline slant
PLATE 3: PRODUCTION OF CHITINASE ENZYME BY THE ISOLATED (FS1 AND FS2)
BACTERIA IN SUBMERGED FERMENTATION
TABLE 2: ESTIMATION OF GLUCOSE
Conc.of NAG ( µg/ml)
OD value (540 nm)
100 0.09
200 0.18
300 0.19
400 0.28
500 0.33
600 0.39
700 0.45
800 0.50
900 0.55
1000 0.55

International Journal of Advance Research, Ideas and Innovations in Technology
© 2021, www.IJARIIT.com All Rights Reserved Page |1308
FIGURE 1: STANDARD GRAPH FOR ESTIMATION OF
GLUCOSE
Table 3: Effect of different Substrate concentration for enzyme activity in
production medium (FS1)
Incubation period
(hr)
Substrate concentration/
Chitinase Activity (U/ml)
0.20% 0.50% 0.80%
24 62.2 15.6 62.2
48 77.8 46.7 77.8
72 93.3 108.9 77.8
96 124.4 140.0 46.7
120 93.3 108.9 31.1
144 62.2 46.7 15.6
Effect of Substrate concentration for Enzyme activity (FS1)
160
140
120
100
0.20%
80 0.50%
0 24 48 72 96 120 144
Incubation period (hr)
Standard curve for estimation of GlcNAc
0.6
0.
5
0.
4
0.
f(x) = 0 x + 0.06
R = 0.98
0 200 400 600
800 1000 1200
Concentration of NAG (μg/ml)
OD
Val
ue
(5
40
nm
)

International Journal of Advance Research, Ideas and Innovations in Technology
© 2021, www.IJARIIT.com All Rights Reserved Page |1309
FIGURE 2: EFFECT OF DIFFERENT SUBSTRATE CONCENTRATION FOR ENZYME
ACTIVITY IN PRODUCTION MEDIUM (FS1)
Ch
itin
ase
Act
ivit
y (U
/ml)

International Journal of Advance Research, Ideas and Innovations in Technology
© 2021, www.IJARIIT.com All Rights Reserved Page |1310
TABLE 4: EFFECT OF DIFFERENT SUBSTRATE CONCENTRATION FOR ENZYME ACTIVITY
IN PRODUCTION MEDIUM (FS2)
Incubation period
(hr)
Substrate Concentration/
Chitinase Activity (U/ml)
0.20% 0.50% 0.80%
24 31.1 62.2 15.6
48 31.1 77.8 93.3
72 46.7 62.2 93.3
96 62.2 77.8 46.7
120 31.1 77.8 31.1
144 15.6 62.2 15.6
FIGURE 3: EFFECT OF DIFFERENT SUBSTRATE CONCENTRATION FOR ENZYME
ACTIVITY IN PRODUCTION MEDIUM (FS2)
Effect of Substrate concentration for Enzyme activity (FS2)
100
90
80
70
60
50
40
0.20%
0.50%
24 48 72 96 120 144
Incubation period (hr)
Ch
itin
ase
Act
ivit
y (U
/ml)
International Journal of Advance Research, Ideas and Innovations in Technology
© 2021, www.IJARIIT.com All Rights Reserved Page |1311
TABLE 5: EFFECT OF DIFFERENT TEMPERATURE FOR CHITINASE ACTIVITY (FS1)
Temperature (˚C)
Chitinase Activity
(U/ml)
35 15.6
37 46.7
39 15.6
41 15.6
FIGURE 4: EFFECT OF DIFFERENT TEMPERATURE FOR CHITINASE ACTIVITY (FS1)
TABLE 6: EFFECT OF DIFFERENT TEMPERATURE FOR CHITINASE ACTIVITY (FS2)
Temperature (˚C)
Chitinase Activity (U/ml)
35 31.1
37 15.6
39 46.7
41 31.1 FIGURE 5: EFFECT OF DIFFERENT TEMPERATURE FOR CHITINASE ACTIVITY (FS2)
Effect of Temperature for Chitinase Activity (FS1)
50
40
30
20
10
0
34 35 36 37 38 39 40 41 42
Effect of Temperature for Chitinase Activity (FS2)
50
40
30
20
0
34 35 36 37 38 39 40 41 42
Temperature (˚C)
Ch
itin
ase
Act
ivit
y (U
/ml)
C
hit
inas
e A
ctiv
ity
(U/m
l)

International Journal of Advance Research, Ideas and Innovations in Technology
© 2021, www.IJARIIT.com All Rights Reserved Page |1312
TABLE 7: EFFECT OF DIFFERENT PH FOR CHITINASE ACTIVITY (FS1)
pH Chitinase Activity (U/ml)
5 15.6
6 15.6
7 46.7
8 31.1
9 15.6 FIGURE 6: EFFECT OF DIFFERENT PH FOR CHITINASE ACTIVITY (FS1)
TABLE 8: EFFECT OF DIFFERENT PH FOR CHITINASE ACTIVITY (FS2)
pH Chitinase Activity (U/ml)
5 31.1
6 15.6
7 77.8
8 62.2
9 15.6
FIGURE 7: EFFECT OF DIFFERENT PH FOR CHITINASE ACTIVITY (FS2)
Effect of pH for Chitinase Activity (FS1)
50
40
30 20
10
0 6.5 7
pH
7.5 8 8.5 9 9.5
Effect of pH for Chitinase Activity (FS2)
90
80
70
60
50
40 6.5 7
pH
7.5 8 8.5 9 9.5
Ch
itin
ase
Act
ivit
y (U
/ml)
C
hit
inas
e A
ctiv
ity
(U/m
l)
International Journal of Advance Research, Ideas and Innovations in Technology
© 2021, www.IJARIIT.com All Rights Reserved Page |1313
TABLE 9: EFFECT OF DIFFERENT SUBSTRATE CONCENTRATION FOR CHITINASE ACTIVITY
(FS1)
Substrate concentration
(ml)
Chitinase Activity (U/ml)
0.5 77.8
1.0 46.7
1.5 62.2
2.0 15.6
2.5 15.6
FIGURE 8: EFFECT OF DIFFERENT SUBSTRATE CONCENTRATION FOR CHITINASE
ACTIVITY (FS1)
TABLE 10: EFFECT OF DIFFERENT SUBSTRATE CONCENTRATION FOR CHITINASE ACTIVITY (FS2)
Substrate concentration (ml)
0.5
1.0
1.5
2.0
2.5
Chitinase Activity (U/ml)
77.8
31.1
15.6
15.6
15.6
FIGURE 9: EFFECT OF DIFFERENT SUBSTRATE CONCENTRATION FOR CHITINASE ACTIVITY (FS2)
Effect of Substrate concentration for Chitinase Activity (FS1)
100
80
60
40
0.5 1.5 2.5
Substrate concentration (ml)
Effect of Substrate concentration for Chitinase Activity (FS2)
100
80
60
40
0 0.5 1 1.5 2 2.5 3
Substrate concentration (ml)
Ch
itin
ase
Act
ivit
y (U
/ml)
C
hit
inas
e A
ctiv
ity
(U/m
l)

International Journal of Advance Research, Ideas and Innovations in Technology
© 2021, www.IJARIIT.com All Rights Reserved Page |1314
TABLE 11: EFFECT OF DIFFERENT ENZYME CONCENTRATION FOR CHITINASE ACTIVITY (FS1)
Enzyme concentration
(ml)
Chitinase Activity (U/ml)
0.5 15.6
1 15.6
1.5 46.7
2 46.7
2.5 77.8
FIGURE 10: EFFECT OF DIFFERENT ENZYME CONCENTRATION FOR CHITINASE ACTIVITY
(FS1)
TABLE 12: EFFECT OF DIFFERENT ENZYME CONCENTRATION FOR CHITINASE ACTIVITY
(FS2)
Enzyme concentration
(ml)
Chitinase Activity
(U/ml)
0.5 15.6
1.0 31.1
1.5 93.3
2.0 108.9
2.5 140.0
FIGURE 11: EFFECT OF DIFFERENT ENZYME CONCENTRATION FOR CHITINASE ACTIVITY
(FS2)
Effect of Enzyme concentration for Chitinase Activity (FS1)
100
80
60
40
20 0 0.5 1 1.5 2 2.5 3
Enzyme concentration (ml)
Effect of Enzyme concentration for Chitinase activity (FS2)
160
140
120
100
80 0 0.5 1 1.5 2 2.5 3
Enzyme concentration (ml)
Ch
itin
ase
Act
ivit
y (U
/ml)
C
hit
inas
e A
ctiv
ity
(U/m
l)

International Journal of Advance Research, Ideas and Innovations in Technology
© 2021, www.IJARIIT.com All Rights Reserved Page |1315
*Dr.K.Shameem Rani, Associate Professor, Department of Zoology,
M.S.S.Wakf Board College,Madurai.
**S.Kulanidaivel, Assistant Professor Department of Microbiology,
VPMM Arts and Science College for Women, Krishnan kovil.