The proteome and transcriptome analysis of Bacillus subtilis in response to salicylic acid
Upload
independentCategory
view
1download
0
TECHNICAL ADVANCE
Development of Arabidopsis whole-genome microarrays andtheir application to the discovery of binding sites for the TGA2transcription factor in salicylic acid-treated plants
Francoise Thibaud-Nissen1,*, Hank Wu1, Todd Richmond2, Julia C. Redman1, Christopher Johnson3,†, Roland Green2, Jonathan
Arias3,‡ and Christopher D. Town1
1The Institute for Genomic Research, 9712 Medical Center Drive, Rockville, MD 20850, USA,2NimbleGen Systems Inc., Madison, WI 53711, USA, and3University of Maryland, Baltimore County, Baltimore, MD 21250, USA
Received 5 January 2006; revised 8 March 2006; accepted 15 March 2006.
*For correspondence (fax þ1 301 838 0208; e-mail [email protected]).†Present address: Cellular Neurophysiology Section, Cellular Neurobiology Research Branch, IPR/NIDA/NIH/DHHS, Baltimore, MD 21224, USA.‡Present address: Center for Scientific Review, National Institutes of Health, Bethesda, MD 20892, USA.
Summary
We have developed two long-oligonucleotide microarrays for the analysis of genome features in Arabidopsis
thaliana, in particular for the high-throughput identification of transcription factor-binding sites. The first
platform contains 190 000 probes representing the 2-kb regions upstream of all annotated genes at a density of
seven probes per promoter. The second platform is divided into three chips, each of over 390 000 features, and
represents the entire Arabidopsis genome at a density of one probe per 90 bases.
Protein–DNA complexes resulting from the formaldehyde fixation of leaves of plants 2 h after exposure to
1 mM salicylic acid (SA) were immunoprecipitated using antibodies against the TGA2 transcription factor.
After reversal of the cross-links and amplification, the resulting ChIP sample was hybridized to both platforms.
High signal ratios of the ChIP sample versus raw chromatin for clusters of neighboring probes provided
evidence for 51 putative binding sites for TGA2, including the only previously confirmed site in the promoter of
PR-1 (At2g14610). Enrichment of several regions was confirmed by quantitative real-time PCR. Motif search
revealed that the palindromic octamer TGACGTCA was found in 55% of the enriched regions. Interestingly, 15
of the putative binding sites for TGA2 lie outside the presumptive promoter regions. The effect of the 2-h SA
treatment on gene expression was measured using Affymetrix ATH1 arrays, and SA-induced genes were found
to be significantly over-represented among genes neighboring putative TGA2-binding sites.
Keywords: ChIP-chip, immunoprecipitation, microarray, TGA, transcription factor, Arabidopsis thaliana.
Introduction
Microarrays of complementary DNA, oligonucleotides or
amplicons have been developed for expression analysis in
Arabidopsis thaliana by many entities, including the Ara-
bidopsis Functional Genomics Consortium (Wisman and
Ohlrogge, 2000); Affymetrix (Redman et al., 2004; Zhu and
Wang, 2000); Operon (Zanetti et al., 2005); a European con-
sortium (Crowe et al., 2003); and The Institute for Genomic
Research (TIGR) (Kim et al., 2003). These arrays, which focus
on representing exons and are biased to the genes’ 3¢ ends,
have provided valuable information on the timing and
location of expression of most Arabidopsis genes. Gaining
an understanding of the orchestration of patterns of
expression will, however, require a different set of tools.
Recently, arrays representing entire genomes or large
genomic regions have been deployed to determine gene
structure empirically in Arabidopsis (Stolc et al., 2005;
Yamada et al., 2003) and to analyze genome features such as
chromatin structure (Schubeler et al., 2004); sites of DNA
152 ª 2006 The AuthorsJournal compilation ª 2006 Blackwell Publishing Ltd
The Plant Journal (2006) 47, 152–162 doi: 10.1111/j.1365-313X.2006.02770.x

modifications (Kurdistani et al., 2004); and DNA–protein
binding sites (Ren et al., 2000).
Chromatin immunoprecipitation (ChIP) is a technology
that allows the enrichment of DNA targets to which specific
proteins (e.g. transcription factors) are bound in vivo. On a
small scale and with a priori knowledge, these binding sites
can be confirmed and quantified by sequence-specific PCR
(Johnson et al., 2001; Orlando, 2000). However, at the
discovery level, finding all genomic targets of a particular
transcription factor requires a more open-ended approach.
Identification of the binding sites of over 100 yeast tran-
scription factors in vivo has been successfully accomplished
by hybridization of immunoprecipitated chromatin to whole-
genome arrays (Iyer et al., 2001; Lee et al., 2002; Ren et al.,
2000). This approach (termed ChIP-chip) has also been used
for the discovery of the binding sites of the transcription
factors Sp1, cMyc and p53 on human chromosomes 21 and
22 (Cawley et al., 2004); the profiling of chromatin and of
DNA modifications in an Arabidopsis heterochromatic knob
(Lippman et al., 2004); and, on a smaller scale, the identifi-
cation of acetylated histones in the vicinity of 88 tobacco
genes (Chua et al., 2004). To address similar questions at the
genome-wide level in Arabidopsis, we have developed two
long-oligonucleotide microarrays representing large frac-
tions of the Arabidopsis genome. The ATH1_P1 array
represents exclusively promoter regions, defined as the 2-
kb region upstream of a gene’s start codon, of all 27 166
Arabidopsis genes annotated in TIGR release 4; while the
ATH1_WG1 array is a whole-genome array. We report the
utility of these arrays for the discovery of transcription
factor-binding sites, based on results obtained using anti-
bodies to the TGA2 transcription factor.
The TGA factors were first characterized in tobacco by
their ability to bind the as-1 element of the CaMV 35S
promoter, a 20-bp element containing two TGACG boxes,
and to promote transcription (Katagiri et al., 1989; Lam et al.,
1989). The as-1 like elements have been identified in plant
promoters of genes responding to salicylic acid (SA) or
auxin. In vitro, the TGACG motif is sufficient for TGA factor
binding (Lam et al., 1989). However demonstration of DNA
binding by TGA factors in vivo has been limited to GNT35
and GNT1 in tobacco, and to PR-1 in Arabidopsis (Johnson
et al., 2001, 2003). In Arabidopsis, the TGA family comprises
10 members. In the presence of SA, and upon activation by
NPR1 (Fan and Dong, 2002; Zhou et al., 2000), TGA2 and
TGA3 bind to the pathogenesis-related (PR-1) promoter, as
demonstrated in planta by chromatin immunoprecipitation
(Johnson et al., 2003). In the tga2-tga5-tga6 triple mutant,
PR-1 expression is severely reduced and systemic acquired
resistance (SAR) is abolished (Zhang et al., 2003), indicating
the essential role of at least some TGA factors in the
establishment of SAR.
We performed ChIP-chip experiments using an antibody
specific to TGA2 (Johnson et al., 2003). A total of 51 regions
of the genome were found enriched in the ChIP sample.
Fifty-five per cent of these contain the palindromic motif
TGACGTCA, which includes the TGACG box characteristic of
the TGA factor family. In all cases the motif coincides
precisely with the peak of enrichment detected on the array.
These results indicate that our arrays permit the discovery of
many putative binding sites for the TGA2 transcription
factor. Furthermore, 15 of these enriched regions lie outside
the presumptive promoter regions, an observation that
highlights the advantage of using the whole-genome array
over the promoter-only array. Finally, a significant propor-
tion of genes neighboring putative TGA2-binding sites were
induced by SA, as determined by microarrray analysis. Our
findings demonstrate the validity of the two designs and
their utility for high-throughput discovery of transcription
factor-binding sites in Arabidopsis.
Results
Design of ATH1_P1: a whole-genome promoter array
The first array design targeted exclusively the promoter re-
gions of annotated genes, as these are the most probable
binding sites of transcription factors. This design was
developed within the limitations of 190 546 features per
microarray and 27 166 genes in the Version 4 annotation of
the Arabidopsis genome, and therefore allowed seven
probes within the presumptive promoter region of each
gene (2 kb upstream of the ATG start codon), except for 30
genes for which 20 probes per promoter were designed.
Constraints were placed on oligonucleotide sequence and
position, so that the probes would both have similar
hybridization properties and be regularly spaced across the
promoter regions. The length of the probes was allowed to
vary between 54 and 65 bases, and the targeted Tm was set
to 76�C as this temperature was shown to be optimal for the
hybridization of DNA to whole-genome arrays (R.G., unpub-
lished results). In our hands, the size of the sheared
chromatin used for hybridization ranges between 0.4 and
2.5 kb, with most of the DNA around 0.8 kb in size. With this
in mind, and to allow detection of an enriched region by a
minimum of two probes, the maximum distance between
two adjacent probes was set to 600 nt. In the first pass of the
design algorithm, this distance constraint was fulfilled for
23 736 promoters. For 3400 promoters, however, some
adjacent probes were separated by over 600 bases and an
alternative design strategy was used. For these promoter
regions, the probes were designed within seven given
intervals of 150 bases spaced regularly throughout the
promoter to ensure a maximum distance of 450 bases
between two adjacent probes. A similar strategy, but with
different spacing parameters, was used for a subset of 30
promoters represented by 20 probes. The final design is
characterized by an average gap between two adjacent
Arabidopsis whole-genome microarrays 153
ª 2006 The AuthorsJournal compilation ª 2006 Blackwell Publishing Ltd, The Plant Journal, (2006), 47, 152–162
probes of 206 bases, a mean probe length of 62 bases, and a
Tm of 76.4 � 2.4�C.
Design of ATH1_WG1: a whole-genome array
Reports of binding of transcription factors outside promoter
regions (Cawley et al., 2004) and improvements in the
microarray technology prompted the design of a whole-
genome array, contained on three chips, which took
advantage of the doubling of the feature density on any
chip (to 390 000) and the implementation of a two-color
hybridization protocol.
First, repetitive regions totaling 15% of the genome were
excluded from the pseudomolecules (TIGR release 5). The
algorithm described in Experimental procedures was then
run three times with different parameters on the resulting
unmasked 101 091 579 bases. A summary of the parameters
used for each design iteration, and the statistics used to
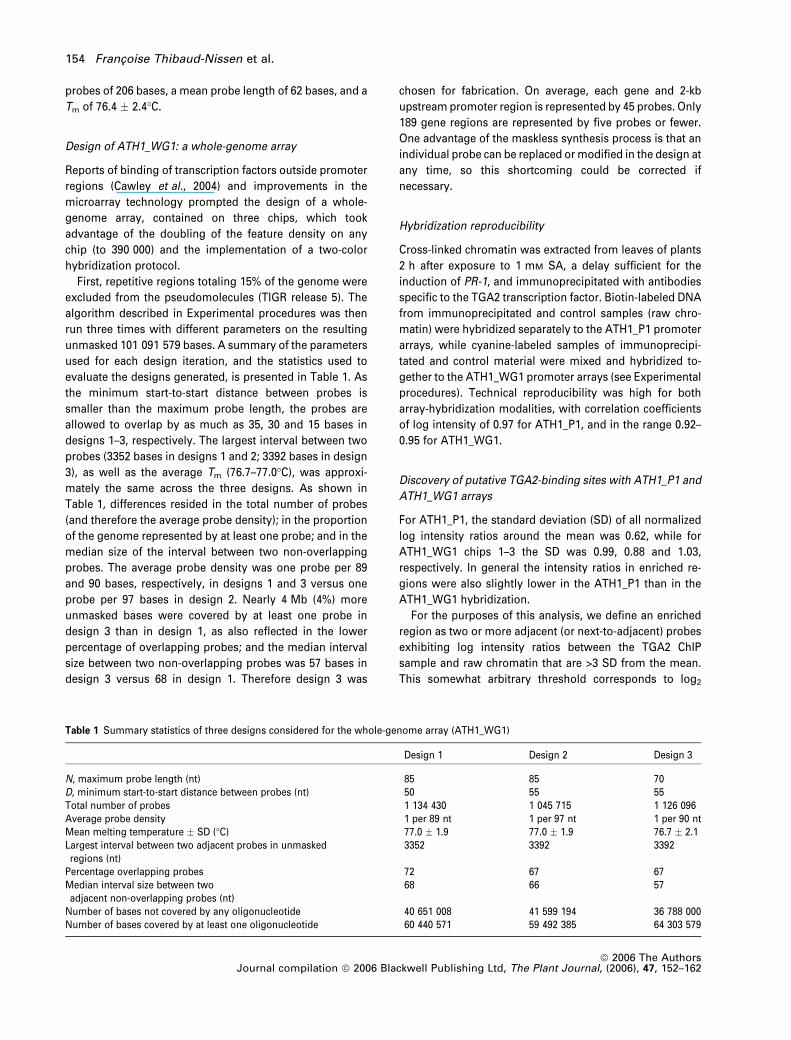
evaluate the designs generated, is presented in Table 1. As
the minimum start-to-start distance between probes is
smaller than the maximum probe length, the probes are
allowed to overlap by as much as 35, 30 and 15 bases in
designs 1–3, respectively. The largest interval between two
probes (3352 bases in designs 1 and 2; 3392 bases in design
3), as well as the average Tm (76.7–77.0�C), was approxi-
mately the same across the three designs. As shown in
Table 1, differences resided in the total number of probes
(and therefore the average probe density); in the proportion
of the genome represented by at least one probe; and in the
median size of the interval between two non-overlapping
probes. The average probe density was one probe per 89
and 90 bases, respectively, in designs 1 and 3 versus one
probe per 97 bases in design 2. Nearly 4 Mb (4%) more
unmasked bases were covered by at least one probe in
design 3 than in design 1, as also reflected in the lower
percentage of overlapping probes; and the median interval
size between two non-overlapping probes was 57 bases in
design 3 versus 68 in design 1. Therefore design 3 was
chosen for fabrication. On average, each gene and 2-kb
upstream promoter region is represented by 45 probes. Only
189 gene regions are represented by five probes or fewer.
One advantage of the maskless synthesis process is that an
individual probe can be replaced or modified in the design at
any time, so this shortcoming could be corrected if
necessary.
Hybridization reproducibility
Cross-linked chromatin was extracted from leaves of plants
2 h after exposure to 1 mM SA, a delay sufficient for the
induction of PR-1, and immunoprecipitated with antibodies
specific to the TGA2 transcription factor. Biotin-labeled DNA
from immunoprecipitated and control samples (raw chro-
matin) were hybridized separately to the ATH1_P1 promoter
arrays, while cyanine-labeled samples of immunoprecipi-
tated and control material were mixed and hybridized to-
gether to the ATH1_WG1 promoter arrays (see Experimental
procedures). Technical reproducibility was high for both
array-hybridization modalities, with correlation coefficients
of log intensity of 0.97 for ATH1_P1, and in the range 0.92–
0.95 for ATH1_WG1.
Discovery of putative TGA2-binding sites with ATH1_P1 and
ATH1_WG1 arrays
For ATH1_P1, the standard deviation (SD) of all normalized
log intensity ratios around the mean was 0.62, while for
ATH1_WG1 chips 1–3 the SD was 0.99, 0.88 and 1.03,
respectively. In general the intensity ratios in enriched re-
gions were also slightly lower in the ATH1_P1 than in the
ATH1_WG1 hybridization.
For the purposes of this analysis, we define an enriched
region as two or more adjacent (or next-to-adjacent) probes
exhibiting log intensity ratios between the TGA2 ChIP
sample and raw chromatin that are >3 SD from the mean.
This somewhat arbitrary threshold corresponds to log2
Table 1 Summary statistics of three designs considered for the whole-genome array (ATH1_WG1)
Design 1 Design 2 Design 3
N, maximum probe length (nt) 85 85 70D, minimum start-to-start distance between probes (nt) 50 55 55Total number of probes 1 134 430 1 045 715 1 126 096Average probe density 1 per 89 nt 1 per 97 nt 1 per 90 ntMean melting temperature � SD (�C) 77.0 � 1.9 77.0 � 1.9 76.7 � 2.1Largest interval between two adjacent probes in unmaskedregions (nt)
3352 3392 3392
Percentage overlapping probes 72 67 67Median interval size between twoadjacent non-overlapping probes (nt)
68 66 57
Number of bases not covered by any oligonucleotide 40 651 008 41 599 194 36 788 000Number of bases covered by at least one oligonucleotide 60 440 571 59 492 385 64 303 579
154 Francoise Thibaud-Nissen et al.
ª 2006 The AuthorsJournal compilation ª 2006 Blackwell Publishing Ltd, The Plant Journal, (2006), 47, 152–162

ratios of 1.86 for the ATH1_P1 array, and 2.98, 2.64 and 3.09
for chips 2 and 3, respectively, of the ATH1_WG1 array, and
is towards the high end of the typical two- to eightfold
enrichment range reported for ChIP-chip (Buck and Lieb,
2004). Totals of 250, 87, 100 and 60 probes showing ratios
above the respective cut-offs for the ATH1_P1 array and
chips 2 and 3 of the ATH1_WG1 array clustered into 51
regions (Table S1). Fourteen regions (group 1 in Table S2)
were found enriched with both versions of the array; 11
regions were found enriched with the ATH1_P1 array only
(group 2); and 26 were found enriched with the ATH1_WG1
array only (groups 3 and 4), of which 15 fell outside promoter
regions and the range of ATH1_P1 probes (group 4). The
false-positive rate associated with each cluster was estima-
ted as 6 and 21% for the ATH1_P1 and ATH1_WG1 arrays,
respectively.
A majority of enriched regions contain extended TGACG
motifs
The cis-element characteristic of the TGA transcription fac-
tor family is the TGACG box (Lam and Lam, 1995). To test
whether this motif, or any other 1- to 10-mer, was more
frequent than expected by chance in the 51 enriched regions,
the 1-kb sequences flanking the enriched probes on both
sides were searched for over-represented motifs using the
program SIFT (Hudson and Quail, 2003). The resulting fre-
quency of each motif was compared with the entire Ara-
bidopsis genome. This analysis revealed that the most
significantly over-represented sequences (P < 10)10) all
contain the TGACG motif at their core (Figure 1). The most
significant motif was TGACGTCATC, present in 15 enriched
regions (P ¼ 2.88 · 10)35). However, the shorter TGACGTCA
motif was found in 28 (55%) of the enriched regions identi-
fied on either array (P ¼ 8.89 · 10)34). It is composed of two
overlapping TGACG boxes on opposite strands and, when
present, is invariably in the center of the enriched region.
The close match between the co-ordinates of the peak in
enrichment and the location of the TGACGTCA motif
strongly supports the authenticity of these regions, and
establishes the center of the enriched region as the putative
binding site for the TGA2 transcription factor. Interestingly,
only three enriched regions contain an as-1-like TGACG
tandem, with distances of up to 30 bases between the two
elements.
Genic context and enrichment profiles of TGA-binding
regions
Of the 14 regions reported to be enriched by both ATH1_P1
and ATH1_WG1 arrays (group 1 in Table S1), 11 contain the
TGACGTCA sequence, and one (the PR-1 promoter) has an
as-1-like element in its center. A 600-bp region of the PR-1
promoter, centered 690 bases upstream of the gene’s start
codon, was determined to be enriched approximately 20-
fold by the ATH1_P1 array and 40-fold by the ATH1_WG1
array (Figure 2a). It should be noted that the PR-1 promoter
is one of 30 promoters represented by 20 probes in the
ATH1_P1 array, while the other promoters are represented
by seven probes. Enrichment in this region was confirmed
by real-time PCR using multiple pairs of primers (Figure 2b),
and was shown to coincide with the location of the as-1
motif ()676 to )698 bases), an element that is essential for
the activation of PR-1 transcription, and binds Arabidopsis
TGA2 (Johnson et al., 2003). Examples of other enriched
promoter regions reported by both arrays are presented in
Figure 3; further examples can be found in Figure S1. Up to
15-fold enrichment was detected by the array in the 1-kb
region upstream of the WRKY51 transcription factor
At5g64810 (Figure 3a), and confirmed by real-time PCR
reactions across this region (Figure 3b). Four probes located
between 800 and 1200 bases upstream of the scarecrow
transcription factor At5g66770 start site exhibited about
eightfold enrichment in the ChIP sample on ATH1_WG1
arrays and fourfold enrichment in the ATH1_P1 array
(Figure 3c). An eightfold enrichment was also measured by
real-time PCR for this promoter (Figure 3d). In addition,
11 promoter regions, each represented by, on average,
Figure 1. Over-represented motifs in the 51 regions found enriched on at
least one of the arrays.
All motifs with associated P-values <10)10 are shown. The number of enriched
regions containing at least one motif is shown on the right: black highlight,
sub-motifs found in all over-represented motifs; gray highlight, sub-motifs
found in 75–99% of over-represented motifs.
Arabidopsis whole-genome microarrays 155
ª 2006 The AuthorsJournal compilation ª 2006 Blackwell Publishing Ltd, The Plant Journal, (2006), 47, 152–162

2.45 probes 3 SD above the mean, were four- to fivefold
enriched on the ATH1_P1 array, but not reported by the
ATH1_WG1 array using the same cut-off (group 2 in
Table S2). Among these, eight (72%) contain a TGACGTCA
motif and one an as-1-like element. On further inspection of
the ATH1_WG1 array, below-threshold peaks of enrichment
formed by several probes ranging from 5.5- to 6.5-fold
(approximately 2.5 SD) were also detected for all these
regions on the ATH1_WG1 array.
Similarly, 11 promoters identified as enriched on the
ATH1_WG1 array were not called enriched on the promoter-
only array (group 3), probably due to the smaller size of
these regions and the lower probe density on the ATH1_P1
array. These enriched regions are detected by, on average,
2.7 probes above threshold on the ATH1_WG1 array, com-
pared with 4.7 probes for group 1 regions. For example,
three probes spanning a 300-base enriched region 1 kb
upstream of the start site of At3g18530, an expressed
protein, and four probes in a 600-base region located 500
bases upstream of the protein phosphatase 2C gene
At1g79630, were enriched approximately eightfold on the
ATH1_WG1 array (Figure S2). For both these examples, only
one probe in this region was enriched on the ATH1_P1 array.
Three of the 11 regions (27%) in this category contain a
TGACGTCA motif, compared with 79% of the enriched
regions above threshold on both arrays, and 72% above
threshold on ATH1_P1.
Enriched regions located outside presumptive promoter
regions
Hybridizations to the ATH1_WG1 chips revealed 15 enriched
regions outside presumptive promoter regions (see group 4,
Table S2), six (40%) of which contain a TGACGTCA motif in
their centers, and one a GATGACG motif. Location of these
At2g14610
–2
2
4
6
0
0
5
10
15
–56249 6250 6251
Log2
(in
tens
ity r
atio
)Lo
g2 (
rela
tive
abun
danc
e)
Chromosome coordinate (in Kb)
(a)
(b)
Figure 2. Enrichment of the PR-1 (At2g14610) promoter in the TGA2 ChIP
sample compared with raw chromatin on the array and by real-time PCR.
(a) Log base 2 of the intensity ratio of TGA2 ChIP versus raw chromatin
detected on the promoter-only ATH1_P1 array (circles, dashed line) and the
whole-genome ATH1_WG1 array (triangles, solid line). Probes with ratios >3
SD are represented by larger filled symbols. Horizontal arrow, beginning of
the PR-1 coding region and direction of transcription; vertical arrow, location
of the as-1-like element.
(b) Log base 2 of the relative abundance of 10 120–200-bp segments of the PR-
1 promoter in the TGA2 ChIP sample versus raw chromatin, as detected by
real-time PCR. Co-ordinates on chromosome 2 are on the x-axis.
At5g64810
1
–1
2
3
4
5
0
Log2
(in
tens
ity r
atio
) (a)
At5g66770
(c)
2
4
0
–2
25924 25926
Log2
(re
lativ
e ab
unda
nce)
Chromosome coordinate (in kb)
(b)
26676 26677 26678
(d)
Figure 3. Enrichment of the At5g64810 and At5g66770 promoter in the TGA2
ChIP sample compared with raw chromatin on the array and by real-time PCR.
(a, c) Enrichment detected on the array: (a) At5g64810; (c) At5g66770.
Symbols as for Figure 2(a), except that vertical arrows indicate the location
of TGACGTCA motifs.
(b, d) Enrichment detected by real-time PCR: (b) At5g64810 promoter region;
(d) At5g66770 promoter region. Co-ordinates on chromosome 5 are indicated
on the x-axis.
156 Francoise Thibaud-Nissen et al.
ª 2006 The AuthorsJournal compilation ª 2006 Blackwell Publishing Ltd, The Plant Journal, (2006), 47, 152–162

regions was examined in relation to gene structures
innotated within 3 kb. Three regions occur downstream of
the nearest gene; four are more than 2 kb upstream of the
nearest gene; two are located within annotated genes; and
six belong to two of these categories. For example, a 1-kb
region located in the last exon of the zinc-finger protein gene
At3g13810 and 3–4 kb upstream of the F-box protein gene
At3g13820 is enriched sevenfold in the TGA2 ChIP sample
(Figure 4a). A ninefold enrichment was detected in the last
exon and 3¢ UTR of the pseudo-response regulator 2 gene
At4g18020 (Figure 4b), a region located 8960 bases
upstream of At4g18010 and 8981 bases downstream of
At4g18030, and was confirmed by real-time PCR (data not
shown). The 3¢ end of the single-exon gene At2g28650 is
enriched 14-fold and was detected by nine probes in
ATH1_WG1 (Figure 4c). This gene encodes a member of the
EXO70 exocyst subunit family, as does At2g28640, a gene
starting 2.7 kb downstream of the enriched region.
Functions of the genes downstream of enriched regions
In order to gain insight into the biological processes con-
trolled by TGA2, the functions of genes in the proximity of
the putative TGA2-binding regions were examined. Forty-
four of the 51 regions lie between )2 and 0.5 kb (for groups
1–3) or between )3 and 0.5 kb (for group 4) of the translation
start of 62 genes, as measured from the center of the
enrichment (Table S2). GOslim annotations, available for 22
of these 62 genes, were retrieved from The Arabidopsis
Information Resource (TAIR) database, and the representa-
tion of each category in this set was compared with the en-
tire genome with the GoStats utility of GOTOOLBOX (Martin
et al., 2004). We found that genes with kinase activity, or
genes involved in response to stress or external stimulus,
were over-represented in the subset (P < 0.05).
Correlation between enriched regions and SA induction of
neighboring genes
We measured by microarray analysis the changes in
expression of the genes close to enriched regions 2 h after
treatment with 1 mM SA. We found that seven genes out of
the 65 genes close to a putative TGA2-binding site showed a
significant increase in transcript levels, using an adjusted
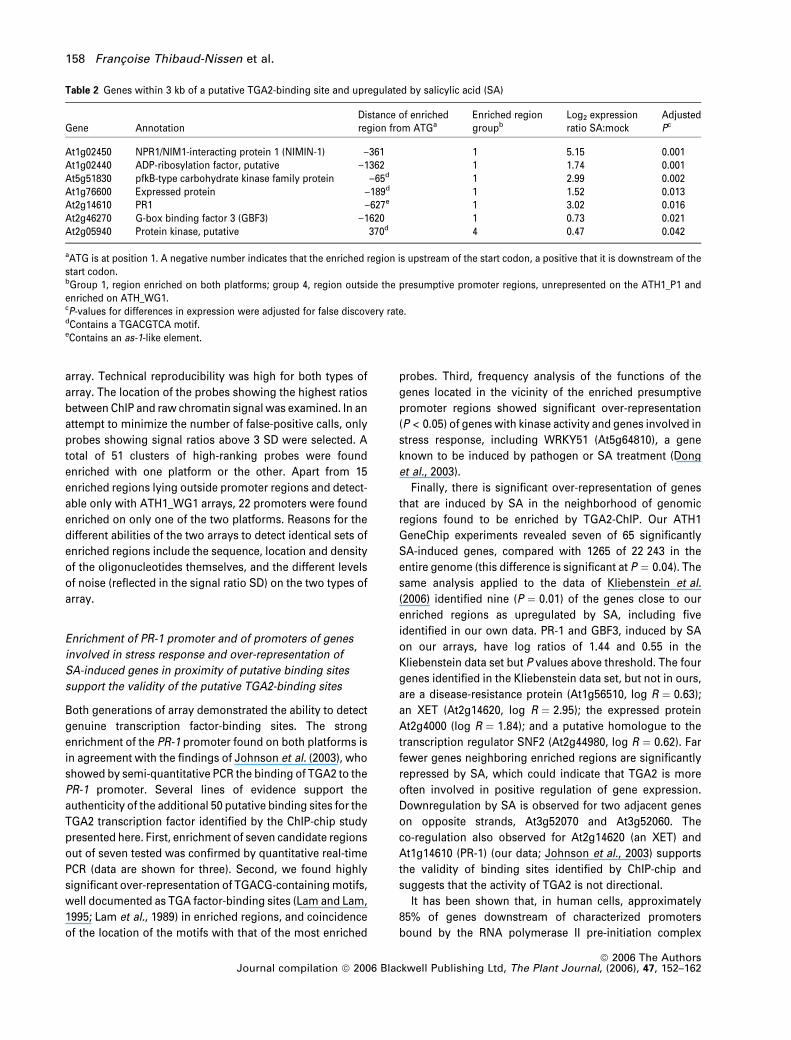
P-value threshold of 0.05 (Table 2 and Table S2). This is
significantly greater than the number expected by chance
(P ¼ 0.04), considering that 1265 genes out of the 22243
represented on the array are up-regulated by SA and that 17
of the 65 genes neighboring enriched regions (21%) are not
represented on the ATH1 array and thus lack expression
data. Several of the significantly regulated genes play a role
in disease resistance, including the NPR1-interacting protein
NIMIN1 and PR1; two are kinases. These seven genes are
located close to six putative TGA2-binding sites (At1g02240
and At1g02450 are associated with the same binding
region). All of the six regions close to SA-induced genes are
between )2 and 0.5 kb from the gene start codon, and five
were predicted by both types of array. Three of the six
regions contain a TGACGTCA motif and one an as-1-like
element.
Discussion
Performance of the arrays
We have designed two sets of long oligonucleotides repre-
senting different parts of the Arabidopsis genome. For the
first array, probes were designed in the regions 2 kb up-
stream of all annotated genes’ start codons, at an average
density of one probe per 286 bases. The possibility of tran-
scription factor-binding sites outside presumptive promoter
regions prompted us to generate a second design, in which
the entire genome (with the exclusion of repetitive regions)
is represented. The characteristics of the second set of
probes are similar to those of the first set, but the probes are,
on average, 90 bases apart start to start. The proportion of
probesmapping exclusively to their intended location with a
75% identity cut-off is very high in both designs (87 and 82%
in the ATH1_P1 and ATH1_WG1 sets, respectively), which
should limit issues of cross-hybridization.
In order to evaluate the utility of the two designs for the
discovery of transcription factor-binding sites, we compared
a ChIP sample immunoprecipitated with TGA2 antibodies to
non-immunoprecipitated chromatin on both versions of the
0
–1
1
2
3
4
4544 4546 4548
At3g13810 At3g13820
Log2
(in
tens
ity r
atio
)
10003 10005 10007
At4g18020
12294 12296 12298
At2g28640 At2g28650
Chromosome coordinate (in Kb)
(a) (b) (c)Figure 4. Regions outside presumptive promot-
ers detected as enriched in the TGA2 ChIP
sample compared with raw chromatin.
(a) At3g13810/20; (b) At4g18020; (c) At2g28640/
50. Symbols as for Figure 2(a), except that ver-
tical arrows indicate the location of TGACGTCA
motifs. Note that the promoter array does not
interrogate these enriched regions. Co-ordinates
of probes on their respective chromosome are
indicated on the x-axis.
Arabidopsis whole-genome microarrays 157
ª 2006 The AuthorsJournal compilation ª 2006 Blackwell Publishing Ltd, The Plant Journal, (2006), 47, 152–162
array. Technical reproducibility was high for both types of
array. The location of the probes showing the highest ratios
between ChIP and raw chromatin signal was examined. In an
attempt to minimize the number of false-positive calls, only
probes showing signal ratios above 3 SD were selected. A
total of 51 clusters of high-ranking probes were found
enriched with one platform or the other. Apart from 15
enriched regions lying outside promoter regions and detect-
able only with ATH1_WG1 arrays, 22 promoters were found
enriched on only one of the two platforms. Reasons for the
different abilities of the two arrays to detect identical sets of
enriched regions include the sequence, location and density
of the oligonucleotides themselves, and the different levels
of noise (reflected in the signal ratio SD) on the two types of
array.
Enrichment of PR-1 promoter and of promoters of genes
involved in stress response and over-representation of
SA-induced genes in proximity of putative binding sites
support the validity of the putative TGA2-binding sites
Both generations of array demonstrated the ability to detect
genuine transcription factor-binding sites. The strong
enrichment of the PR-1 promoter found on both platforms is
in agreement with the findings of Johnson et al. (2003), who
showed by semi-quantitative PCR the binding of TGA2 to the
PR-1 promoter. Several lines of evidence support the
authenticity of the additional 50 putative binding sites for the
TGA2 transcription factor identified by the ChIP-chip study
presented here. First, enrichment of seven candidate regions
out of seven tested was confirmed by quantitative real-time
PCR (data are shown for three). Second, we found highly
significant over-representation of TGACG-containingmotifs,
well documented as TGA factor-binding sites (Lam and Lam,
1995; Lam et al., 1989) in enriched regions, and coincidence
of the location of the motifs with that of the most enriched
probes. Third, frequency analysis of the functions of the
genes located in the vicinity of the enriched presumptive
promoter regions showed significant over-representation
(P < 0.05) of genes with kinase activity and genes involved in
stress response, including WRKY51 (At5g64810), a gene
known to be induced by pathogen or SA treatment (Dong
et al., 2003).
Finally, there is significant over-representation of genes
that are induced by SA in the neighborhood of genomic
regions found to be enriched by TGA2-ChIP. Our ATH1
GeneChip experiments revealed seven of 65 significantly
SA-induced genes, compared with 1265 of 22 243 in the
entire genome (this difference is significant at P ¼ 0.04). The
same analysis applied to the data of Kliebenstein et al.
(2006) identified nine (P ¼ 0.01) of the genes close to our
enriched regions as upregulated by SA, including five
identified in our own data. PR-1 and GBF3, induced by SA
on our arrays, have log ratios of 1.44 and 0.55 in the
Kliebenstein data set but P values above threshold. The four
genes identified in the Kliebenstein data set, but not in ours,
are a disease-resistance protein (At1g56510, log R ¼ 0.63);
an XET (At2g14620, log R ¼ 2.95); the expressed protein
At2g4000 (log R ¼ 1.84); and a putative homologue to the
transcription regulator SNF2 (At2g44980, log R ¼ 0.62). Far
fewer genes neighboring enriched regions are significantly
repressed by SA, which could indicate that TGA2 is more
often involved in positive regulation of gene expression.
Downregulation by SA is observed for two adjacent genes
on opposite strands, At3g52070 and At3g52060. The
co-regulation also observed for At2g14620 (an XET) and
At1g14610 (PR-1) (our data; Johnson et al., 2003) supports
the validity of binding sites identified by ChIP-chip and
suggests that the activity of TGA2 is not directional.
It has been shown that, in human cells, approximately
85% of genes downstream of characterized promoters
bound by the RNA polymerase II pre-initiation complex
Table 2 Genes within 3 kb of a putative TGA2-binding site and upregulated by salicylic acid (SA)
Gene AnnotationDistance of enrichedregion from ATGa
Enriched regiongroupb
Log2 expressionratio SA:mock
AdjustedPc
At1g02450 NPR1/NIM1-interacting protein 1 (NIMIN-1) )361 1 5.15 0.001At1g02440 ADP-ribosylation factor, putative )1362 1 1.74 0.001At5g51830 pfkB-type carbohydrate kinase family protein )65d 1 2.99 0.002At1g76600 Expressed protein )189d 1 1.52 0.013At2g14610 PR1 )627e 1 3.02 0.016At2g46270 G-box binding factor 3 (GBF3) )1620 1 0.73 0.021At2g05940 Protein kinase, putative 370d 4 0.47 0.042
aATG is at position 1. A negative number indicates that the enriched region is upstream of the start codon, a positive that it is downstream of thestart codon.bGroup 1, region enriched on both platforms; group 4, region outside the presumptive promoter regions, unrepresented on the ATH1_P1 andenriched on ATH_WG1.cP-values for differences in expression were adjusted for false discovery rate.dContains a TGACGTCA motif.eContains an as-1-like element.
158 Francoise Thibaud-Nissen et al.
ª 2006 The AuthorsJournal compilation ª 2006 Blackwell Publishing Ltd, The Plant Journal, (2006), 47, 152–162

factor IID are expressed (Kim et al., 2005). However, a lower
correlation is expected in the case of whole plants or plant
organs, for several reasons. TGA2 might be present, active
or bound only in particular cell types, while expression
analysis on whole leaves measures transcript levels in all
cells regardless of the presence of a TGA factor, thus
potentially ‘diluting’ the changes in expression caused by
TGA2. It is also possible that TGA2 binding to a promoter
region is not sufficient for the recruitment of the RNA
polymerase and for transcription, which would explain why
only a fraction of genes close to putative TGA2-binding sites
are induced or repressed by SA. This study is an attempt at
unraveling the role of the TGA factors in triggering SAR. It is
likely that other transcription factors or protein-binding
proteins are also involved.
Extending the TGA factor recognition motif
Based on their high frequency in the enriched regions, we
propose that GATGACGTCA or TGACGTCAmight be higher-
affinity cis-elements of the TGA2 transcription factor than
TGACG alone. This is supported by in vitro observations that
the C-box ATGACGTCAT binds TGA1 with higher affinity
than T- or G-boxes, and with same affinity as an as-1
tetramer (Izawa et al., 1993; de Pater et al., 1996).
Significance of enriched regions outside presumptive
promoter regions
Fifteen enriched regions are located outside the 2-kb pro-
moter regions and, for most, within genes and/or beyond
3 kb from the start codon of a gene. The high incidence of
the TGACGTCA motif in these enriched regions in Arabid-
opsis argues for the authenticity of these sites, as do similar
findings in the human genome. In human cell cultures, 13%
of the Transcription Factor IID (TFIID) binding sites identified
are more than 2.5 kb away from any 5¢ ends (Kim et al.,
2005), and on chromosomes 21 and 22 only 22% of the
binding sites of Sp1, cMyc and p53 lie in the promoter
regions, while 36% reside in 3¢ ends and non-coding RNA
(Cawley et al., 2004).
Which array to use?
Based on this study, the ATH_WG1 array offers two advan-
tages over the ATH1_P1 design described here. Higher probe
density allows a more robust detection of enriched regions,
which might be represented by only one or two increased-
intensity oligonucleotides on the ATH1_P1 array. The dis-
tribution of probes throughout the genome not only pro-
vides an unbiased genome-wide scan for binding sites, but
also provides information about local background hybrid-
ization around enriched regions, which may help to better
define and detect these regions.
An important advantage of the maskless in situ synthesis
system is that probes can be added or removed from the
array at the time of fabrication. It is therefore possible, for
example, to fabricate a smaller array containing only probes
designed in the putative target regions of a given transcrip-
tion factor for confirmation of initial results. Alternatively, as
approximately 85% of the putative TGA2-binding sites are
between )3 andþ1 kb of the start of each gene, it is probable
that a compromise 390 000-probe array, comprising probes
only in this window, would allow the discovery of most
binding sites for Arabidopsis transcription factors while
significantly decreasing the cost per experiment.
Experimental procedures
Probe design
ATH1_P1 array. DNA sequences 0 to )2 kb of all Arabidopsis genetranslation start sites, as annotated in TIGR release 4, were extractedfrom the pseudomolecules, regardless of their proximity to neigh-boring genes or the existence of annotated untranslated regions.Probes varying in size from 54 to 65 bp were selected in these re-gions using a scoring algorithm that weighted the deviation from atarget melting temperature of 76�C; the position of the probe withregard to other selected probes in the same region; a sliding win-dow average of 24-mer frequency within the probe; and a Booleanmeasure of whether the probe complied with a number of simplebase-pair composition rules. The target melting temperature foreach probe was determined using a calculation by Bolton andMcCarthy (1962) as described by Sambrook et al. (1989). After probeselection, the distribution of probe positions was evaluated for eachtarget region. For promoters where there was an interval >600 bpbetween any two probes, probes were reselected using the samecriteria, but forcing selection within one of seven 150-bp non-overlapping windows within the target region.
ATH1_WG1 array. The latest set of Arabidopsis pseudomoleculesfrom TIGR (release 5) weremasked for Arabidopsis repeat sequencespresent in REPBASE (Jurka, 2000); for Escherichia coli sequencesretrieved from the National Center for Biotechnology Information(NCBI); and for vector sequences present in the TIGR UniVec data-base using REPEATMASKER (http://www.repeatmasker.org). Theprobe design algorithm proceeded on the unmasked sequences asfollows. Starting from position 1, a probe of the next N residues isselected and then trimmed from the 3¢ end until the targeted Tm of76�C, or a lower cut-off length of 55 bases, is reached. If no probecan be designed that satisfies these Tm and length constraints, or ifpart of the probe is masked or contains an ambiguous base, theprobe is discarded and the design process repeated one basedownstream. The probe is also rejected if it exceeds the limitationsin the number of cycles required for its synthesis. When a probe isfound in this region that satisfies all the design constraints, it isselected for synthesis. The design process is then repeated D nu-cleotides downstream (where D is the minimum start-to-start probespacing). The algorithm was run several times with different valuesfor the parameters of maximum length (N) and distance (D).
Sequences of the probes and mapping information are availableat http://www.tigr.org/tdb/e2k1/ath1/TGA_factors/project_summary.shtml. Both oligo sets were synthesized on glass slides usingmaskless synthesis technology (Nuwaysir et al., 2002), and areavailable from NimbleGen, Inc.
Arabidopsis whole-genome microarrays 159
ª 2006 The AuthorsJournal compilation ª 2006 Blackwell Publishing Ltd, The Plant Journal, (2006), 47, 152–162
Amplification of ChIP samples
Plant treatment, isolation of raw chromatin and immunoprecipita-tion were performed as described by Johnson et al. (2003). Immu-noprecipitated samples were amplified according to Wang et al.(2002), with the following modifications: Sequenase (USB) andPrimer A (5¢-GTTTCCCAGTCACGATC NNNNNNNNN) were usedinstead of reverse transcriptase and Primer D, and amplification wascarried on with Primer B (5¢-GTTTCCCAGTCACGATC) for 15 and 30cycles.
Labeling and hybridization to the ATH1_P1 array
Digestion of samples down to 100–200 bases was done by incuba-ting 6 lg amplified DNA for 3 min at 37�C in the presence of 0.05 UDNAse I and 1· One-Phor-All buffer (Amersham, Piscataway, NJ,USA). End-labeling of the digested DNA was performed for 90 minat 37�C in the presence of 1· buffer provided with the terminaltransferase, 1 ll biotin-N6-ddATP (Perkin-Elmer, Wellesley, MA,USA) and 2 ll terminal transferase (Promega, Madison, WI, USA) ina 20-ll volume. The terminal transferase was heat-inactivated at95�C for 15 min.
Before application to the microarray, the labeled sample wasdried down, resuspended in 40% Formamide, 8 mM Tris, 0.8 mM
EDTA, 5· saline sodium citrate (SSC), 0.08% sodium dodecylsulfate (SDS), denatured for 5 min at 95�C, spun down andcooled to 42�C. After overnight hybridization at 42�C, the arrayswere washed briefly at 42�C in wash solution WS1 (0.2% SDSand 0.2· SSC), transferred to wash solution WS2 (0.2· SSC) for1 min, and placed in stain solution (1 ng ll)1 Cy3-streptavidin(Pierce Chemical Company, Rockford, IL, USA), 100 mM 2-mor-pholinoethanesulfonic acid (MES) salts, 1 M NaCl, 0.05% Tween-20) for 25 min. After a rinse in WS2, the slides were placed inantibody solution [100 mM MES salts, 1 M NaCl, 0.05% Tween-20,0.2 mg ml)1 goat IgG, 50 mg ml)1 bovine serum albumin,250 ng ml)1 anti-streptavidin (Vector Laboratories, Burlingame,CA, USA)] for 25 min. Following rinsing in WS2, the slides werestained once more, rinsed for 1 min in WS2 and for 30 sec inWS3 (0.05· SSC), and spun dry.
Labeling and hybridization to the ATH1_WG1 array
Amplified DNA (1 lg) was labeled by random priming in the pres-ence of Cy3- or Cy5-labeled random nonamers, 10 nM dNTP and100 U Klenow polymerase. Following isopropanol precipitation,12 lg of each Cy3- and Cy5-labeled probe were resuspended to-gether in hybridization buffer (NimbleGen, Inc.), denatured for5 min at 95�C, cooled to 42�C and applied to the array. After over-night hybridization at 42�C, the slides were incubated successivelyin WS1 and 0.1 mM dithiothreitol (DTT) for 2 min at 45�C, in WS2buffer with 0.1 mM DTT for 1 min, and in WS3 with 0.1 mM DTT for15 sec. The slides were then dipped in 70% ethanol before spin-drying.
Analysis of the ChIP arrays
The arrays were scanned using a Genepix 4000 scanner (AxonInstruments). Correlation coefficients of log2 signals between tech-nical replicateswerecalculatedusing two replicatesof theTGA2ChIPsample on ATH1_P1 array or, in the case of the ATH1_WG1 array,15 000 probes present on more than one chip of the set.
The signal intensities were normalized pairwise using the Q-spline method described by Workman et al. (2002), as implemented
by the Bioconductor project. Probes showing log2 ratio 3 SD abovethe mean were considered enriched. We verified that all theseexhibited medium-to-high signal intensity in the TGA2 ChIPhybridization. For each chip, enriched probes were sorted accordingto their location on the genome. An enriched region was defined bya cluster of at least two adjacent or next-to-adjacent enrichedprobes. The number of false-positive clusters predicted for eacharray was calculated as 0.00135 · 0.00135 · 4 · n (with 0.00135 theprobability of an oligo having a ratio >3 SD; n ¼ number of oligoson the array), and was compared with the number of enrichedregions identified for estimation of the false-positive rate.
Real-time PCR verification
Five to 10 unique primer pairs were designed across the enrichedregions of interest using PRIMER3 (Rozen and Skaletski, 2000).Amplification of the 120–200-base products was performed in 15 llvolume with 0.5 ng amplified ChIP or raw chromatin sample, 0.4 lMof each primer, 1 · SYBRGreen RT–PCR mastermix (EuroGentech,Seraing, Belgium). The reactions were performed in duplicate ineach run, and each run was repeated once. The fluorescence ofdouble-stranded DNA was recorded using ABI7900HT (Applied Bi-osystems, Foster City, CA, USA). The DDCT value method was usedto evaluate the relative abundance of each amplified product in thetwo samples, as described in the ABI 7700 sequence-detectionsystem User Bulletin 2. Three promoters, present in equal amountsin the ChIP sample and the raw chromatin, as indicated by anaverage intensity ratio of 1 on the promoter array, were used asendogenous references. The threshold cycles (CT) of the corres-ponding amplicons were averaged, and used to normalize the CT ofthe test amplicons.
Expression arrays
Affymetrix ATH1 arrays were hybridized with labeled cRNA fromthree biological replicates of rosette leaves harvested 2 h afterspraying with 1 mM SA in 0.01% Silwet, or with 0.01% Silwet(Redman et al., 2004). The data were analyzed using the bio-conductor packages AFFY (Gautier et al., 2004) and LIMMA (Smyth,2004). Expression was background-corrected and quantile-nor-malized with robust multi-array analysis, and a mixed-effectslinear model was applied to the data. The data are publiclyaccessible as series GSE3984 in the NCBI Gene ExpressionOmnibus. After false discovery-rate adjustment of P-values(Benjamini and Hochberg, 1995), the expression of 1265 of the22 243 genes represented on the array (based on TIGR release 5annotation) was found to be significantly induced by SA(P < 0.05). The probability of over-representation by chance ofsignificantly induced genes among those close to enriched re-gions was estimated using the binomial distribution. Cel files ofarrays hybridized with cRNA from leaves harvested 4 h afterspraying with 0.3 mM SA and 0.02% Silwet, or with 0.02% Silwetwere provided by Dan Kliebenstein (Kliebenstein et al., 2006) andanalyzed in the same manner.
Scanning of enriched regions for motifs
The 2-kb regions surrounding the clusters of high-ranking probeswere searched for over-represented motifs using the program SIFT
(Hudson and Quail, 2003). The frequency of any 1- to 10-mer wascompared in the list of regions of interest and in the entire Arabid-opsis genome split into 2-kb fragments. The probabilities of each
160 Francoise Thibaud-Nissen et al.
ª 2006 The AuthorsJournal compilation ª 2006 Blackwell Publishing Ltd, The Plant Journal, (2006), 47, 152–162
motif occurring by chance were computed and all motifs with a P-value <10)10 are reported here.
Determination of the over-representation of functional
categories
For each gene downstream of a potential TGA2-binding site, GO-Slim terms were retrieved from the TAIR database. The probabilityof the observed difference in the frequencies of GOSlim terms in thesample group and in the entire genome was evaluated usingthe hypergeometric distribution, as implemented in GOTOOLBOX
(Martin et al., 2004).
Acknowledgements
We are grateful to Dr Dan Kliebenstein for providing the .cel files ofhis SA experiment. This work is supported by the National ScienceFoundation (MCB-0600882).
Supplementary Material
The following supplementary material is available for this articleonline:Figure S1. Enrichment on the arrays of At3g50860 and At3g04260promoters in the TGA2 ChIP sample compared with raw chromatin:(a) At3g50860; (b) At3g04260. Symbols as for Figure 2(a). The co-ordinates of the probes on their respective chromosome areindicated on the x-axis. Vertical arrows indicate the location ofTGACGTCA motifs, if present.Figure S2. Enrichment of At3g18530 and At1g76930 promoters inthe TGA2 ChIP sample compared with raw chromatin on the arrays:(a) At3g18530; (b) At1g76930. Symbols as for Figure 2(a). The co-ordinates of the probes on their respective chromosome areindicated on the x-axis. In both cases, only one probe of the ATH_P1array is 3 SD above the mean.Table S1 Number of probes 3 SD above the mean and number ofcorresponding enriched regionsTable S2 Putative TGA2-binding sites identified on ATH_P1 and/orATH_WG1 arrays and their neighboring genesThis material is available as part of the online article from http://www.blackwell-synergy.com
References
Benjamini, Y. and Hochberg, Y. (1995) Controlling the false discov-ery rate: a practical and powerful approach to multiple testing.J. Roy. Stat. Soc. Series B, 57, 289–300.
Bolton, E.T. and McCarthy, B.J. (1962) A general method for theisolation of RNA complementary to DNA. Proc. Natl Acad. Sci.USA, 48, 1390–1397.
Buck, M.J. and Lieb, J.D. (2004) ChIP-chip: considerations for thedesign, analysis, and application of genome-wide chromatinimmunoprecipitation experiments. Genomics, 83, 349–360.
Cawley, S., Bekiranov, S., Ng, H.H. et al. (2004) Unbiased mappingof transcription factor binding sites along human chromosomes21 and 22 points to widespread regulation of noncoding RNAs.Cell, 116, 499–509.
Chua, Y.L., Mott, E., Brown, A.P., MacLean, D. and Gray, J.C. (2004)Microarray analysis of chromatin-immunoprecipitated DNAidentifies specific regions of tobacco genes associated withacetylated histones. Plant J. 37, 789–800.
Crowe, M.L., Serizet, C., Thareau, V. et al. (2003) CATMA: acomplete Arabidopsis GST database. Nucleic Acids Res. 31,156–158.
Dong, J., Chen, C. and Chen, Z. (2003) Expression profiles of theArabidopsis WRKY gene superfamily during plant defense re-sponse. Plant Mol. Biol. 51, 21–37.
Fan, W. and Dong, X. (2002) In vivo interaction between NPR1 andtranscription factor TGA2 leads to salicylic acid-mediated geneactivation in Arabidopsis. Plant Cell, 14, 1377–1389.
Gautier, L., Cope, L., Bolstad, B.M. and Irizarry, R.A. (2004) affy –analysis of Affymetrix GeneChip data at the probe level. Bioin-formatics, 20, 307–315.
Hudson, M.E. and Quail, P.H. (2003) Identification of promoter mo-tifs involved in the network of phytochrome A-regulated geneexpression by combined analysis of genomic sequence andmicroarray data. Plant Physiol. 133, 1605–1616.
Iyer, V.R., Horak, C.E., Scafe, C.S., Botstein, D., Snyder, M. and
Brown, P.O. (2001) Genomic binding sites of the yeast cell-cycletranscription factors SBF and MBF. Nature, 409, 533–538.
Izawa, T., Foster, R. and Chua, N.H. (1993) Plant bZIP protein DNAbinding specificity. J. Mol. Biol. 230, 1131–1144.
Johnson, C., Boden, E., Desai, M., Pascuzzi, P. and Arias, J. (2001) Invivo target promoter-binding activities of a xenobiotic stress-activated TGA factor. Plant J. 28, 237–243.
Johnson, C., Boden, E. and Arias, J. (2003) Salicylic acid andNPR1 induce the recruitment of trans-activating TGA factors to adefense gene promoter in Arabidopsis. Plant Cell, 15, 1846–1858.
Jurka, J. (2000) Repbase update: a database and an electronicjournal of repetitive elements. Trends Genet. 16, 418–420.
Katagiri, F., Lam, E. and Chua, N.H. (1989) Two tobacco DNA-bind-ing proteins with homology to the nuclear factor CREB. Nature,340, 727–730.
Kim, H., Snesrud, E.C., Haas, B., Cheung, F., Town, C.D. and Quac-
kenbush, J. (2003) Gene expression analyses of Arabidopsischromosome 2 using a genomic DNA amplicon microarray.Genome Res. 13, 327–340.
Kim, T.H., Barrera, L.O., Zheng, M., Qu, C., Singer, M.A., Richmond,
T.A., Wu, Y., Green, R.D. and Ren, B. (2005) A high-resolutionmap of active promoters in the human genome. Nature, 436,876–880.
Kliebenstein, D.J., West, M.A., van Leeuwen, H., Kim, K., Doerge,
R.W., Michelmore, R.W. and St Clair, D.A. (2006) Genomic surveyof gene expression diversity in Arabidopsis thaliana. Genetics,172, 1179–1189.
Kurdistani, S.K., Tavazoie, S. and Grunstein, M. (2004) Mappingglobal histone acetylation patterns to gene expression. Cell, 117,721–733.
Lam, E. and Lam, Y.K. (1995) Binding site requirements and differ-ential representation of TGA factors in nuclear ASF-1 activity.Nucleic Acids Res. 23, 3778–3785.
Lam, E., Benfey, P.N., Gilmartin, P.M., Fang, R.X. and Chua, N.H.
(1989) Site-specific mutations alter in vitro factor binding andchange promoter expression pattern in transgenic plants. Proc.Natl Acad. Sci. USA, 86, 7890–7894.
Lee, T.I., Rinaldi, N.J., Robert, F. et al. (2002) Transcriptional regu-latory networks in Saccharomyces cerevisiae. Science, 298, 799–804.
Lippman, Z., Gendrel, A.V., Black, M. et al. (2004) Role of transpo-sable elements in heterochromatin and epigenetic control. Nat-ure, 430, 471–476.
Martin, D., Brun, C., Remy, E., Mouren, P., Thieffry, D. and Jacq, B.
(2004) GOTOOLBOX: functional analysis of gene datasets based ongene ontology. Genome Biol. 5, R101.
Arabidopsis whole-genome microarrays 161
ª 2006 The AuthorsJournal compilation ª 2006 Blackwell Publishing Ltd, The Plant Journal, (2006), 47, 152–162

Nuwaysir, E.F., Huang, W., Albert, T.J. et al. (2002) Gene expressionanalysis using oligonucleotide arrays produced by masklessphotolithography. Genome Res. 12, 1749–1755.
Orlando, V. (2000) Mapping chromosomal proteins in vivo by for-maldehyde-crosslinked-chromatin immunoprecipitation. TrendsBiochem. Sci. 25, 99–104.
de Pater, S., Pham, K., Memelink, J. and Kijne, J. (1996) Bindingspecificity and tissue-specific expression pattern of the Arabid-opsis bZIP transcription factor TGA2. Mol. Gen. Genet. 250, 237–239.
Redman, J.C., Haas, B.J., Tanimoto, G. and Town, C.D. (2004)Development and evaluation of an Arabidopsis whole genomeAffymetrix probe array. Plant J. 38, 545–561.
Ren, B., Robert, F., Wyrick, J.J. et al. (2000) Genome-wide locationand function of DNA binding proteins. Science, 290, 2306–2309.
Rozen, S. and Skaletski, H.J. (2000) PRIMER3 on the WWW for gen-eral users and for biologist programmers. In BioinformaticsMethods and Protocols: Methods in Molecular Biology (Krawetz,S. and Misener, S., eds). Totowa, NJ: Humana Press, pp. 365–386.
Sambrook, J., Fritsch, E.F. and Maniatis, T. (1989) Molecular Clo-ning: A Laboratory Manual, 2nd edn. Cold Spring Harbor, NY:Cold Spring Harbor Laboratory Press.
Schubeler, D., MacAlpine, D.M., Scalzo, D. et al. (2004) The histonemodification pattern of active genes revealed through genome-wide chromatin analysis of a higher eukaryote. Genes Dev. 18,1263–1271.
Smyth, G.K. (2004) Linear models and empirical Bayes methods forassessing differential expression inmicroarray experiments. Stat.Appl. Genet. Mol. Biol. 3, 3.
Stolc, V., Samanta, M.P., Tongprasit, W. et al. (2005) Identificationof transcribed sequences in Arabidopsis thaliana by using high-
resolution genome tiling arrays. Proc. Natl Acad. Sci. USA, 102,4453–4458.
Wang, D., Coscoy, L., Zylberberg, M., Avila, P.C., Boushey, H.A.,
Ganem, D. and DeRisi, J.L. (2002) Microarray-based detection andgenotyping of viral pathogens. Proc. Natl Acad. Sci. USA, 99,15687–15692.
Wisman, E. and Ohlrogge, J. (2000) Arabidopsis microarray servicefacilities. Plant Physiol. 124, 1468–1471.
Workman, C., Jensen, L.J., Jarmer, H., Berka, R., Gautier, L., Nielser,
H.B., Saxild, H.H., Nielsen, C., Brunak, S. and Knudsen, S. (2002) Anew non-linear normalization method for reducing variability inDNA microarray experiments. Genome Biol. 3, 1–16.
Yamada, K., Lim, J., Dale, J.M. et al. (2003) Empirical analysis oftranscriptional activity in the Arabidopsis genome. Science, 302,842–846.
Zanetti, M.E., Chang, I.F., Gong, F., Galbraith, D.W. and Bailey-
Serres, J. (2005) Immunopurification of polyribosomal com-plexes of Arabidopsis for global analysis of gene expression.Plant Physiol. 138, 624–635.
Zhang, Y., Tessaro, M.J., Lassner, M. and Li, X. (2003) Knockoutanalysis of Arabidopsis transcription factors TGA2, TGA5, andTGA6 reveals their redundant and essential roles in systemic ac-quired resistance. Plant Cell, 15, 2647–2653.
Zhou, J.M., Trifa, Y., Silva, H., Pontier, D., Lam, E., Shah, J. and
Klessig, D.F. (2000) NPR1 differentially interacts with members ofthe TGA/OBF family of transcription factors that bind an elementof the PR-1 gene required for induction by salicylic acid. Mol.Plant Microbe Interact. 13, 191–202.
Zhu, T. and Wang, X. (2000) Large-scale profiling of the Arabidopsistranscriptome. Plant Physiol. 124, 1472–1476.
162 Francoise Thibaud-Nissen et al.
ª 2006 The AuthorsJournal compilation ª 2006 Blackwell Publishing Ltd, The Plant Journal, (2006), 47, 152–162
Copyright © 2022 FDOKUMEN