Efficacy and safety of Jianzhong decoction in treating peptic ...
Journal of Chromatography A, 909 (2001) 237–247www.elsevier.com/ locate /chroma
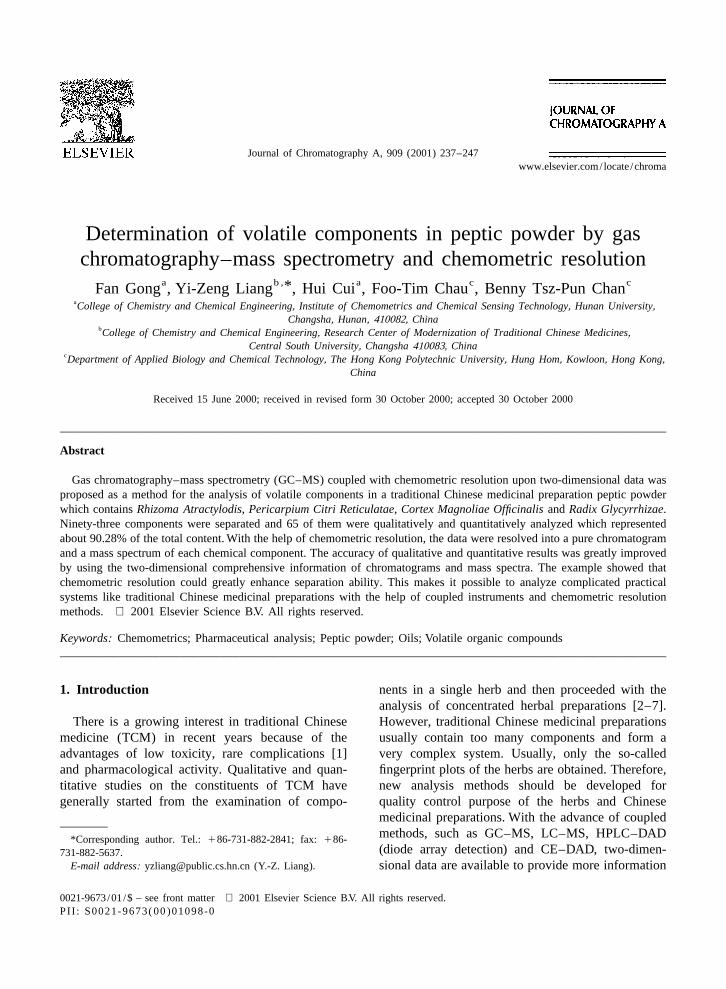
Determination of volatile components in peptic powder by gaschromatography–mass spectrometry and chemometric resolution
a b , a c c*Fan Gong , Yi-Zeng Liang , Hui Cui , Foo-Tim Chau , Benny Tsz-Pun ChanaCollege of Chemistry and Chemical Engineering, Institute of Chemometrics and Chemical Sensing Technology, Hunan University,
Changsha, Hunan, 410082, ChinabCollege of Chemistry and Chemical Engineering, Research Center of Modernization of Traditional Chinese Medicines,
Central South University, Changsha 410083, ChinacDepartment of Applied Biology and Chemical Technology, The Hong Kong Polytechnic University, Hung Hom, Kowloon, Hong Kong,
China
Received 15 June 2000; received in revised form 30 October 2000; accepted 30 October 2000
Abstract
Gas chromatography–mass spectrometry (GC–MS) coupled with chemometric resolution upon two-dimensional data wasproposed as a method for the analysis of volatile components in a traditional Chinese medicinal preparation peptic powderwhich contains Rhizoma Atractylodis, Pericarpium Citri Reticulatae, Cortex Magnoliae Officinalis and Radix Glycyrrhizae.Ninety-three components were separated and 65 of them were qualitatively and quantitatively analyzed which representedabout 90.28% of the total content. With the help of chemometric resolution, the data were resolved into a pure chromatogramand a mass spectrum of each chemical component. The accuracy of qualitative and quantitative results was greatly improvedby using the two-dimensional comprehensive information of chromatograms and mass spectra. The example showed thatchemometric resolution could greatly enhance separation ability. This makes it possible to analyze complicated practicalsystems like traditional Chinese medicinal preparations with the help of coupled instruments and chemometric resolutionmethods. 2001 Elsevier Science B.V. All rights reserved.
Keywords: Chemometrics; Pharmaceutical analysis; Peptic powder; Oils; Volatile organic compounds
1. Introduction nents in a single herb and then proceeded with theanalysis of concentrated herbal preparations [2–7].
There is a growing interest in traditional Chinese However, traditional Chinese medicinal preparationsmedicine (TCM) in recent years because of the usually contain too many components and form aadvantages of low toxicity, rare complications [1] very complex system. Usually, only the so-calledand pharmacological activity. Qualitative and quan- fingerprint plots of the herbs are obtained. Therefore,titative studies on the constituents of TCM have new analysis methods should be developed forgenerally started from the examination of compo- quality control purpose of the herbs and Chinese
medicinal preparations. With the advance of coupledmethods, such as GC–MS, LC–MS, HPLC–DAD*Corresponding author. Tel.: 186-731-882-2841; fax: 186-(diode array detection) and CE–DAD, two-dimen-731-882-5637.
E-mail address: [email protected] (Y.-Z. Liang). sional data are available to provide more information
0021-9673/01/$ – see front matter 2001 Elsevier Science B.V. All rights reserved.PI I : S0021-9673( 00 )01098-0
238 F. Gong et al. / J. Chromatogr. A 909 (2001) 237 –247
for the same chemical analysis. Besides the retention In this paper, the volatile components of peptictime, peak height and peak area information from the powder were studied with GC–MS, followed by thechromatographic technique, the spectral information resolution of the two-dimensional data with thefrom mass selective detector or diode array detector HELP method. Mass spectra of each componentenhances identification of components from both the become accessible through unique resolution. Then,spectral and chromatographic directions. The evolv- qualitative identification of these constituents wasing approaches recently developed in chemometrics, performed using retention times and mass spectra.such as evolving factor analysis (EFA) [8–10], Next, the quantitative analyses were carried out withwindow factor analysis (WFA) [11,12], heuristic the overall volume integration method [23–25].evolving latent projections (HELP) [13–15], ortho-gonal projection resolution (OPR) [16], and subwin-dow factor analysis (SFA) [17,18], have progressed 2. Theoryrapidly. Since all the methods mentioned above areessentially window-dependent methods, the chemo- A two-dimensional data A produced by GC–m3nmetric methods how to define reasonably the elution MS can be represented as follows:windows of the components were also developed
tA 5 CS 1 Em3nquickly [19–22]. As a result, hyphenated instrumentstcoupled with chemometric resolution make it pos-
5Oc s 1 E (i 5 1, 2, . . . ,N) (1)i isible to quantify one complicated system clearly andaccurately, since the chromatographic profiles of where A denotes an absorbance matrix expressingm3n
chemical components possess an advantage of first- N components of m chromatographic scan points at nin-first-out, which makes it possible to resolve them atom mass units or wavelength points. C is the purein an evolving way. Such methods have been applied chromatographic matrix, and S is the pure massto many fields [23–28]. spectral matrix. E represents the noise. t is the
Peptic powder is an ancient concentrated prepara- transform of matrix S. The unique resolution of ation in China [29]. It can clear away pathogenic two-dimensional data into chromatograms and spec-dampness, moisturize spleen, promote the circulation tra of the pure chemical constituents is carried outof qi and regulate the stomach. This formulation is with local full rank analysis in the HELP method.composed of four single herbs. They are Rhizoma Only concise theoretical explanation is showed hereAtractylodis (atractylodes rhizome), Pericarpium for the sake of brevity, while detail description couldCitri Reticulatae (tangerine peel), Cortex Magnoliae be found in Refs. [13–15].Officinalis (magnolia bark) and Radix Glycyrrhizae 1. Confirm the background and correct a drifting(licorice root) [30]. The volatile constituents of base line.peptic powder are pharmacological active. 2. Determine the number of components, the selec-
Some work has been done upon the essential oil tive region and zero-component region of eachcomposition of the former three single herbs with component by the use of the evolving latentGC or GC–MS [31–33]. The identification of com- projective graph and rankmap on the basis of theponents is conducted only with retention indices or eigenstructure tracking analysis.through the direct similarity searches in the MS 3. With the help of the selective information andlibrary. Thus, only very few chemical components zero-component region, conduct a unique res-could be identified, since the overlapping chromato- olution of two-dimensional data into pure chro-graphic peaks always present a problem for similar matographic profiles and mass spectra by meanssearch from the MS library. As a result, the quali- of local full rank analysis.tative and quantitative results are not reliable. Un- 4. Verify the reliability of the resolved result.fortunately, this case inevitably occurs for a compli- After the pure chromatogram and spectrum of thecated system even under good separating conditions ith component have been resolved, this componentand optimization of chromatographic separating con- can be determined qualitatively by comprehensiveditions is not a trivial task at all. use of the chromatographic retention time and mass
F. Gong et al. / J. Chromatogr. A 909 (2001) 237 –247 239
tspectrum. Next, the term c s in Eq. (1) is taken as 70 eV ionization energy in full scan mode in the 40i i
the overall volume integration value. Similar to the to 426 u mass range with 0.2 s / scan velocity. Thegeneral chromatographic quantitative method with ionization source temperature was set at 2308C.
tpeak area, c s is directly proportional to the mass ofi i
the ith component and so it is quantified. 3.5. Data analysis
Data analysis was performed on a Pentium based3. Experimental IBM compatible personal computer. All programs of
HELP and other methods were coded in MATLAB3.1. Materials 5.1 for Windows. The library search and spectral
matching of the resolved pure components wereAll single herbs that are used in peptic powder conducted on the National Institute of Standards and
were purchased from the market, and identified by a Technology (NIST) MS database containing aboutresearcher from Institute of Materia Medica, Hunan 62000 compounds.Academy of Traditional Chinese Medicine andMateria Medica, Changsha, Hunan, China.
4. Results and discussion3.2. Extraction of volatile oil
4.1. Qualitative analysisAll these crude herbs were dried for about 60 min
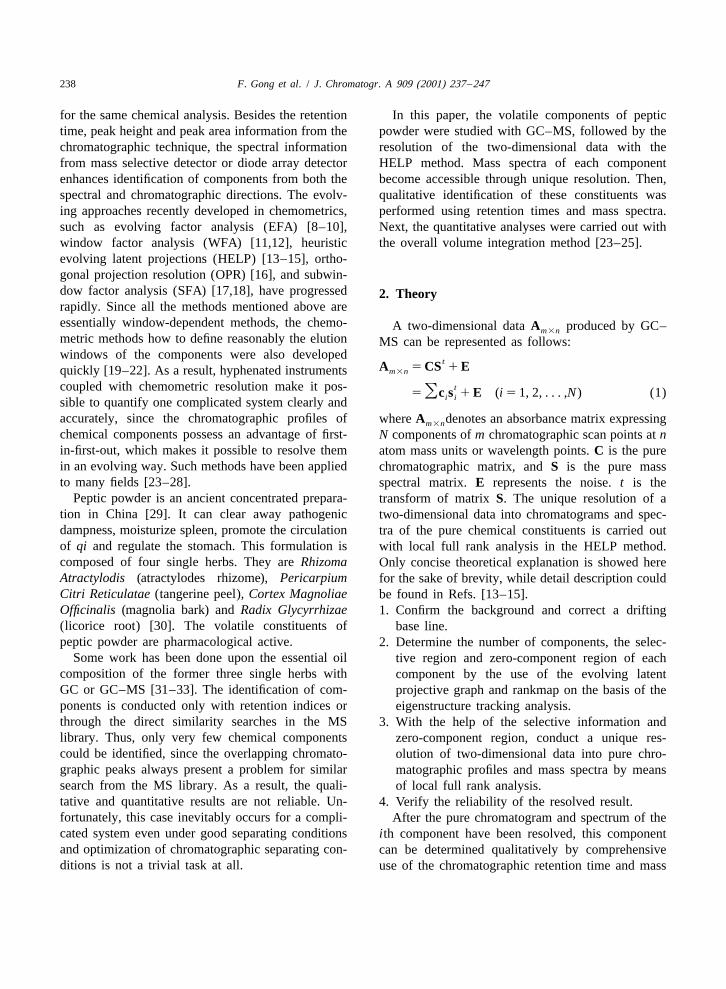
under 408C at first. Subsequently, 200 g Rhizoma The curve in Fig. 1 shows the real total ionicAtractylodis, 96 g Pericarpium Citri Reticulatae, 96 chromatogram (TIC) of the volatile oil of pepticg Cortex Magnoliae Officinalis and 64 g Radix powder. As can be seen from this profile, 45Glycyrrhizae were pre-mixed, then swollen with over chromatographic peaks appear and some of them1000 ml of distilled water in a standard extractor for overlap with one another. However, the similarityextracting volatile oil and allowed to stand for 30 indices (SIs) obtained from direct searching with themin under room temperature. Next, about 100 ml of NIST MS database are quite low for many of thesedistilled water was added. Then, the essential oil was chromatographic peaks. On the other hand, the sameprepared according to the standard extracting method component is possibly searched at different chro-for the volatile oil in Traditional Chinese Medicinesin Chinese Pharmacopoeia [34].
3.3. Instruments
A GC-17A gas chromatograph and a QP-5000mass spectrometer (both from Shimadzu) was em-ployed in this study.
3.4. Detection of volatile oil
In the gas chromatographic system, an OV-17capillary column (30 m30.25 mm I.D.) was used.Column temperature was maintained at 608C for 2min, and then programmed from 608C to 2708C atthe rate 208C/min. Inlet temperature was kept at2508C. Helium carrier gas was used at a constantflow-rate of 1 ml /min. In the mass spectrometer, Fig. 1. TIC curve of volatile oil of peptic powder. The A and B
1electron impact (EI ) mass spectra were recorded at peak clusters are investigated.
240 F. Gong et al. / J. Chromatogr. A 909 (2001) 237 –247
matographic scan points. All these indicate the greatcomplexity of the system under study, or sayingconcretely, most of the chromatographic peaks areoverlapped. If these overlapping peaks are not re-solved, the simple search with the NIST MS data-base will definitely fail, because the mass spectrumof mixtures measured can never get a good matchingindex with that of a pure component in the NIST MSdatabase. Furthermore, for the component with lowcontent, it is also very difficult to be identifiedcorrectly with the NIST MS database, since a two-dimensional data obtained by mass spectral measure-ment unavoidably contains peaks associated withcolumn background and residual gases. Withoutbackground correction, both the resolution of theoverlapped peaks and the identification of the com-
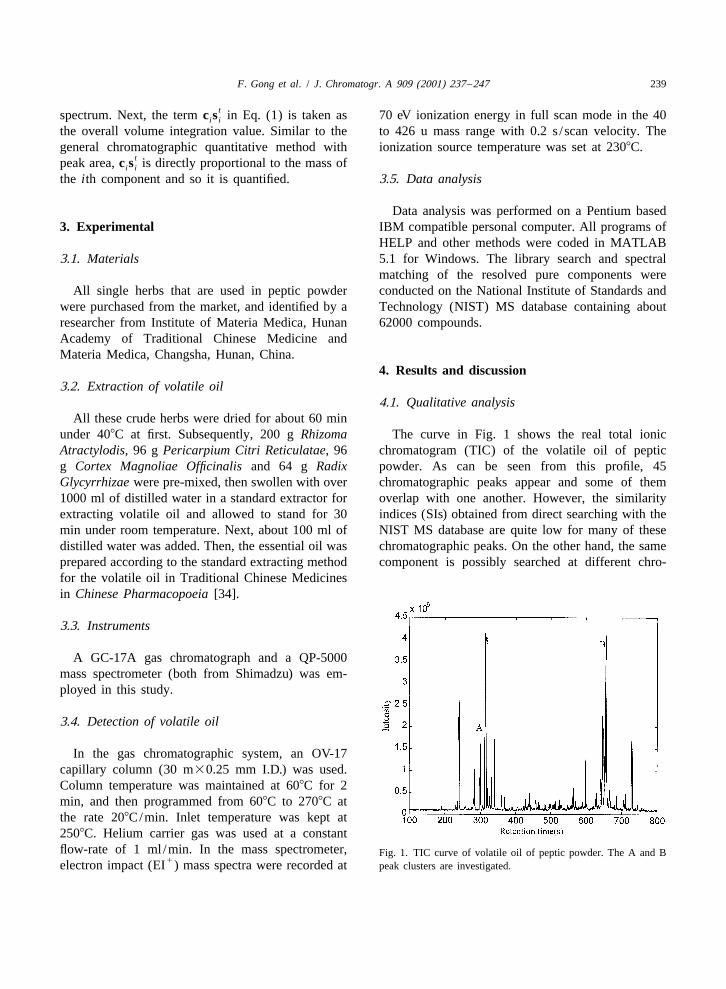
Fig. 2. TIC curve for A peak cluster (within 295–305 s).ponents with low content are impossible. For com-mercial GC–MS systems, background subtraction isusually performed as follows. First, a scan point, library. Therefore, peak cluster A is generally re-which only contains the background mass spectrum, garded as a one-component system in a classicis subjectively found. Next, the intensities of the analytical way. However, if HELP resolution methodsame inter mass numbers appearing in the target and is applied to the two-dimensional data matrix of peakbackground spectra are subtracted, and so the practi- cluster A, two isomeric components named a-phel-cal target mass spectrum is obtained. Obviously, the landrene and trans-ocimene with the molecularpractical target mass spectrum strongly depends on formula C H can be resolved even their mass10 16
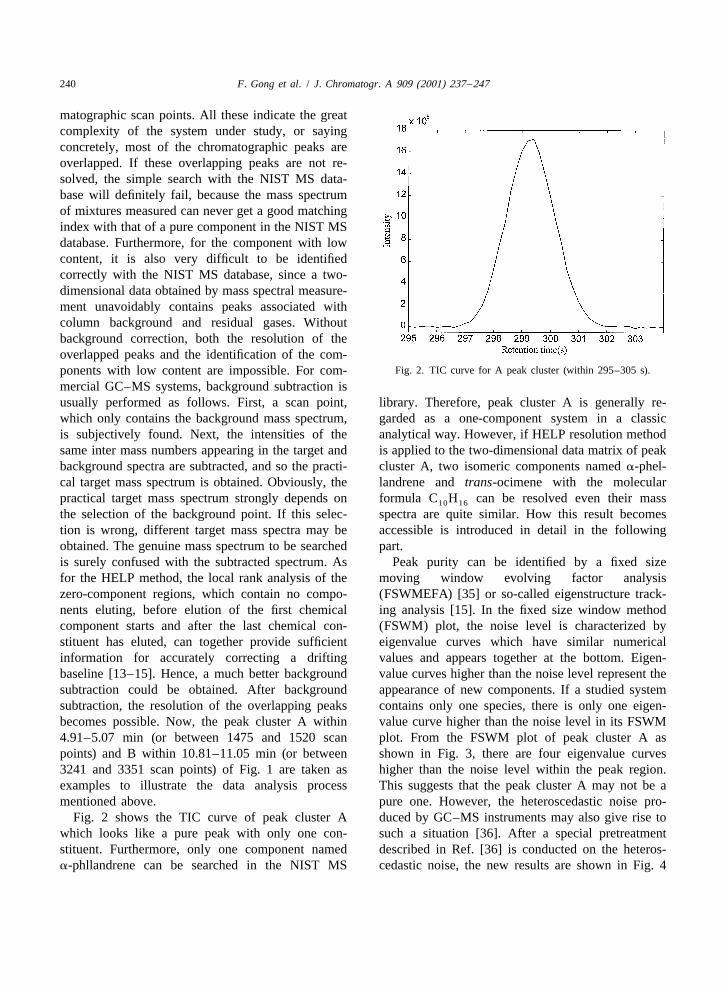
the selection of the background point. If this selec- spectra are quite similar. How this result becomestion is wrong, different target mass spectra may be accessible is introduced in detail in the followingobtained. The genuine mass spectrum to be searched part.is surely confused with the subtracted spectrum. As Peak purity can be identified by a fixed sizefor the HELP method, the local rank analysis of the moving window evolving factor analysiszero-component regions, which contain no compo- (FSWMEFA) [35] or so-called eigenstructure track-nents eluting, before elution of the first chemical ing analysis [15]. In the fixed size window methodcomponent starts and after the last chemical con- (FSWM) plot, the noise level is characterized bystituent has eluted, can together provide sufficient eigenvalue curves which have similar numericalinformation for accurately correcting a drifting values and appears together at the bottom. Eigen-baseline [13–15]. Hence, a much better background value curves higher than the noise level represent thesubtraction could be obtained. After background appearance of new components. If a studied systemsubtraction, the resolution of the overlapping peaks contains only one species, there is only one eigen-becomes possible. Now, the peak cluster A within value curve higher than the noise level in its FSWM4.91–5.07 min (or between 1475 and 1520 scan plot. From the FSWM plot of peak cluster A aspoints) and B within 10.81–11.05 min (or between shown in Fig. 3, there are four eigenvalue curves3241 and 3351 scan points) of Fig. 1 are taken as higher than the noise level within the peak region.examples to illustrate the data analysis process This suggests that the peak cluster A may not be amentioned above. pure one. However, the heteroscedastic noise pro-
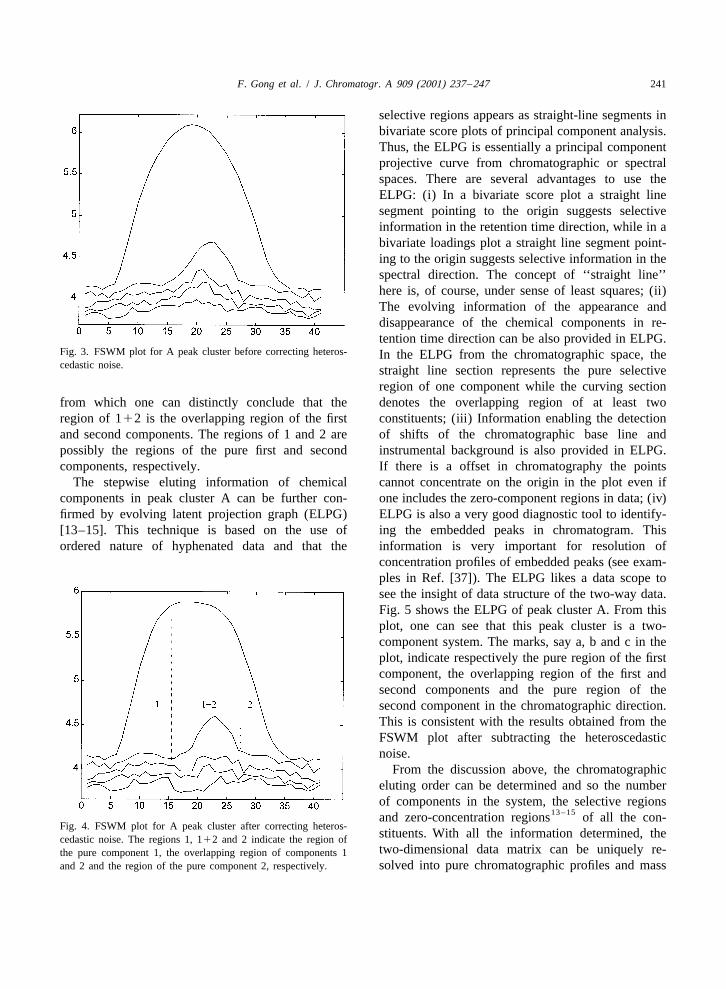
Fig. 2 shows the TIC curve of peak cluster A duced by GC–MS instruments may also give rise towhich looks like a pure peak with only one con- such a situation [36]. After a special pretreatmentstituent. Furthermore, only one component named described in Ref. [36] is conducted on the heteros-a-phllandrene can be searched in the NIST MS cedastic noise, the new results are shown in Fig. 4
F. Gong et al. / J. Chromatogr. A 909 (2001) 237 –247 241
selective regions appears as straight-line segments inbivariate score plots of principal component analysis.Thus, the ELPG is essentially a principal componentprojective curve from chromatographic or spectralspaces. There are several advantages to use theELPG: (i) In a bivariate score plot a straight linesegment pointing to the origin suggests selectiveinformation in the retention time direction, while in abivariate loadings plot a straight line segment point-ing to the origin suggests selective information in thespectral direction. The concept of ‘‘straight line’’here is, of course, under sense of least squares; (ii)The evolving information of the appearance anddisappearance of the chemical components in re-tention time direction can be also provided in ELPG.
Fig. 3. FSWM plot for A peak cluster before correcting heteros- In the ELPG from the chromatographic space, thecedastic noise. straight line section represents the pure selective
region of one component while the curving sectionfrom which one can distinctly conclude that the denotes the overlapping region of at least tworegion of 112 is the overlapping region of the first constituents; (iii) Information enabling the detectionand second components. The regions of 1 and 2 are of shifts of the chromatographic base line andpossibly the regions of the pure first and second instrumental background is also provided in ELPG.components, respectively. If there is a offset in chromatography the points
The stepwise eluting information of chemical cannot concentrate on the origin in the plot even ifcomponents in peak cluster A can be further con- one includes the zero-component regions in data; (iv)firmed by evolving latent projection graph (ELPG) ELPG is also a very good diagnostic tool to identify-[13–15]. This technique is based on the use of ing the embedded peaks in chromatogram. Thisordered nature of hyphenated data and that the information is very important for resolution of
concentration profiles of embedded peaks (see exam-ples in Ref. [37]). The ELPG likes a data scope tosee the insight of data structure of the two-way data.Fig. 5 shows the ELPG of peak cluster A. From thisplot, one can see that this peak cluster is a two-component system. The marks, say a, b and c in theplot, indicate respectively the pure region of the firstcomponent, the overlapping region of the first andsecond components and the pure region of thesecond component in the chromatographic direction.This is consistent with the results obtained from theFSWM plot after subtracting the heteroscedasticnoise.
From the discussion above, the chromatographiceluting order can be determined and so the numberof components in the system, the selective regions
13–15and zero-concentration regions of all the con-Fig. 4. FSWM plot for A peak cluster after correcting heteros-
stituents. With all the information determined, thecedastic noise. The regions 1, 112 and 2 indicate the region oftwo-dimensional data matrix can be uniquely re-the pure component 1, the overlapping region of components 1
and 2 and the region of the pure component 2, respectively. solved into pure chromatographic profiles and mass
242 F. Gong et al. / J. Chromatogr. A 909 (2001) 237 –247
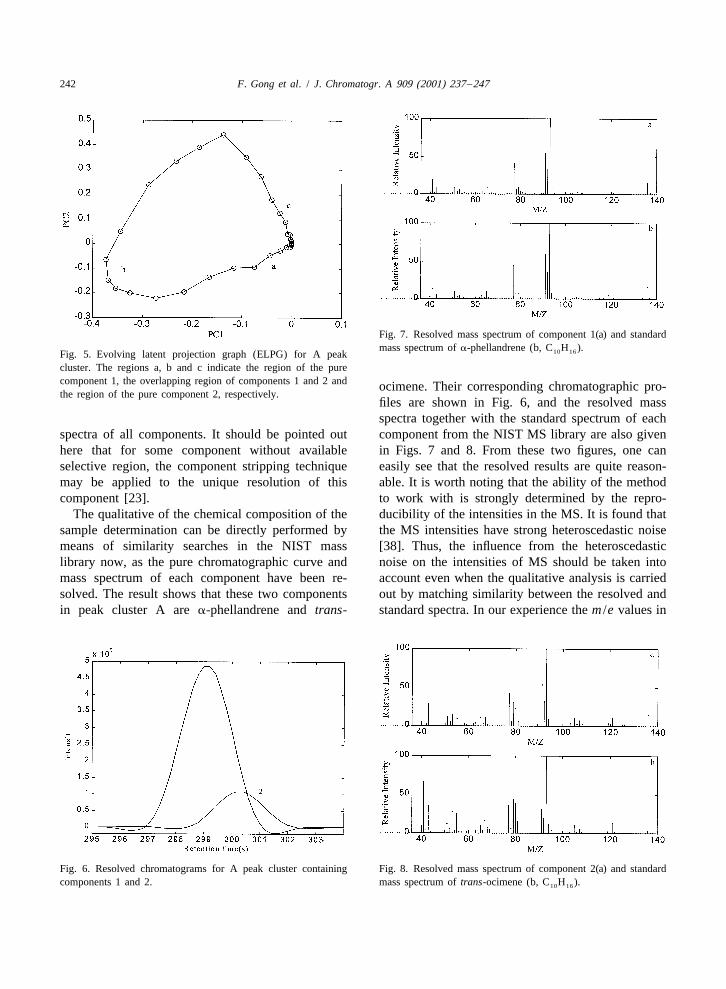
Fig. 7. Resolved mass spectrum of component 1(a) and standardmass spectrum of a-phellandrene (b, C H ).10 16Fig. 5. Evolving latent projection graph (ELPG) for A peak
cluster. The regions a, b and c indicate the region of the purecomponent 1, the overlapping region of components 1 and 2 and ocimene. Their corresponding chromatographic pro-the region of the pure component 2, respectively.
files are shown in Fig. 6, and the resolved massspectra together with the standard spectrum of each
spectra of all components. It should be pointed out component from the NIST MS library are also givenhere that for some component without available in Figs. 7 and 8. From these two figures, one canselective region, the component stripping technique easily see that the resolved results are quite reason-may be applied to the unique resolution of this able. It is worth noting that the ability of the methodcomponent [23]. to work with is strongly determined by the repro-
The qualitative of the chemical composition of the ducibility of the intensities in the MS. It is found thatsample determination can be directly performed by the MS intensities have strong heteroscedastic noisemeans of similarity searches in the NIST mass [38]. Thus, the influence from the heteroscedasticlibrary now, as the pure chromatographic curve and noise on the intensities of MS should be taken intomass spectrum of each component have been re- account even when the qualitative analysis is carriedsolved. The result shows that these two components out by matching similarity between the resolved andin peak cluster A are a-phellandrene and trans- standard spectra. In our experience the m /e values in
Fig. 6. Resolved chromatograms for A peak cluster containing Fig. 8. Resolved mass spectrum of component 2(a) and standardcomponents 1 and 2. mass spectrum of trans-ocimene (b, C H ).10 16
F. Gong et al. / J. Chromatogr. A 909 (2001) 237 –247 243
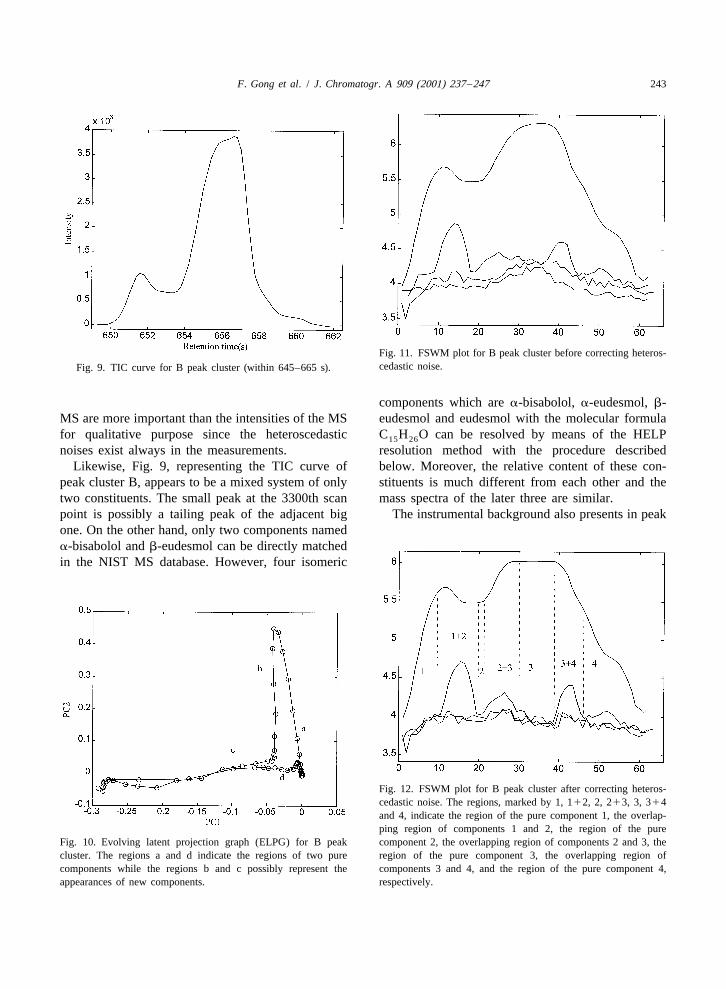
Fig. 11. FSWM plot for B peak cluster before correcting heteros-cedastic noise.Fig. 9. TIC curve for B peak cluster (within 645–665 s).
components which are a-bisabolol, a-eudesmol, b-MS are more important than the intensities of the MS eudesmol and eudesmol with the molecular formulafor qualitative purpose since the heteroscedastic C H O can be resolved by means of the HELP15 26
noises exist always in the measurements. resolution method with the procedure describedLikewise, Fig. 9, representing the TIC curve of below. Moreover, the relative content of these con-
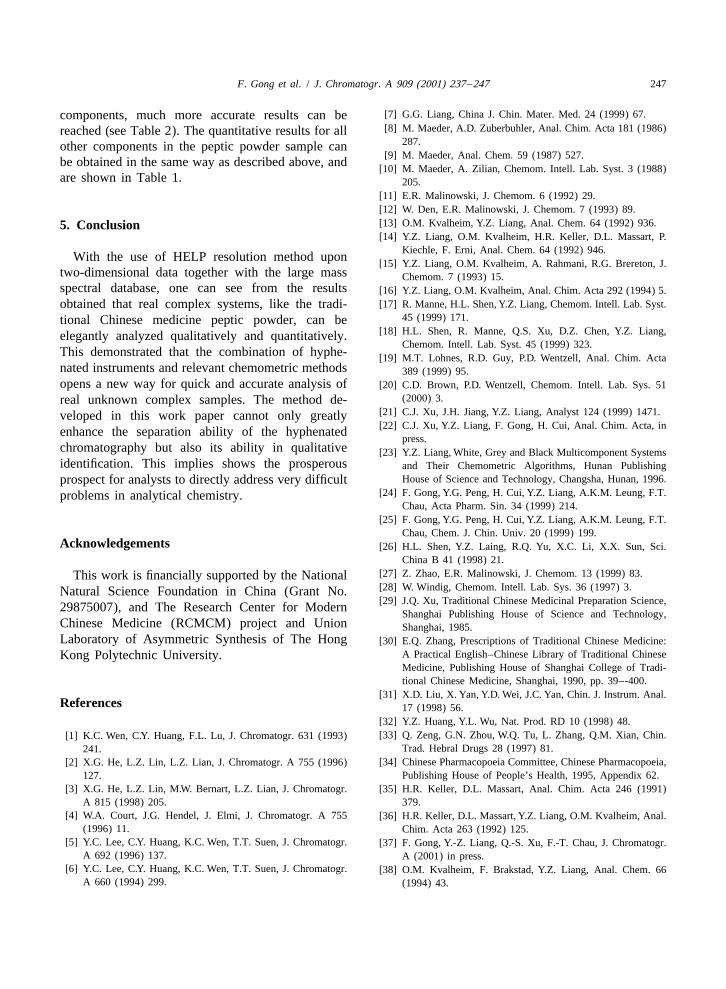
peak cluster B, appears to be a mixed system of only stituents is much different from each other and thetwo constituents. The small peak at the 3300th scan mass spectra of the later three are similar.point is possibly a tailing peak of the adjacent big The instrumental background also presents in peakone. On the other hand, only two components nameda-bisabolol and b-eudesmol can be directly matchedin the NIST MS database. However, four isomeric
Fig. 12. FSWM plot for B peak cluster after correcting heteros-cedastic noise. The regions, marked by 1, 112, 2, 213, 3, 314and 4, indicate the region of the pure component 1, the overlap-ping region of components 1 and 2, the region of the pure
Fig. 10. Evolving latent projection graph (ELPG) for B peak component 2, the overlapping region of components 2 and 3, thecluster. The regions a and d indicate the regions of two pure region of the pure component 3, the overlapping region ofcomponents while the regions b and c possibly represent the components 3 and 4, and the region of the pure component 4,appearances of new components. respectively.
244 F. Gong et al. / J. Chromatogr. A 909 (2001) 237 –247
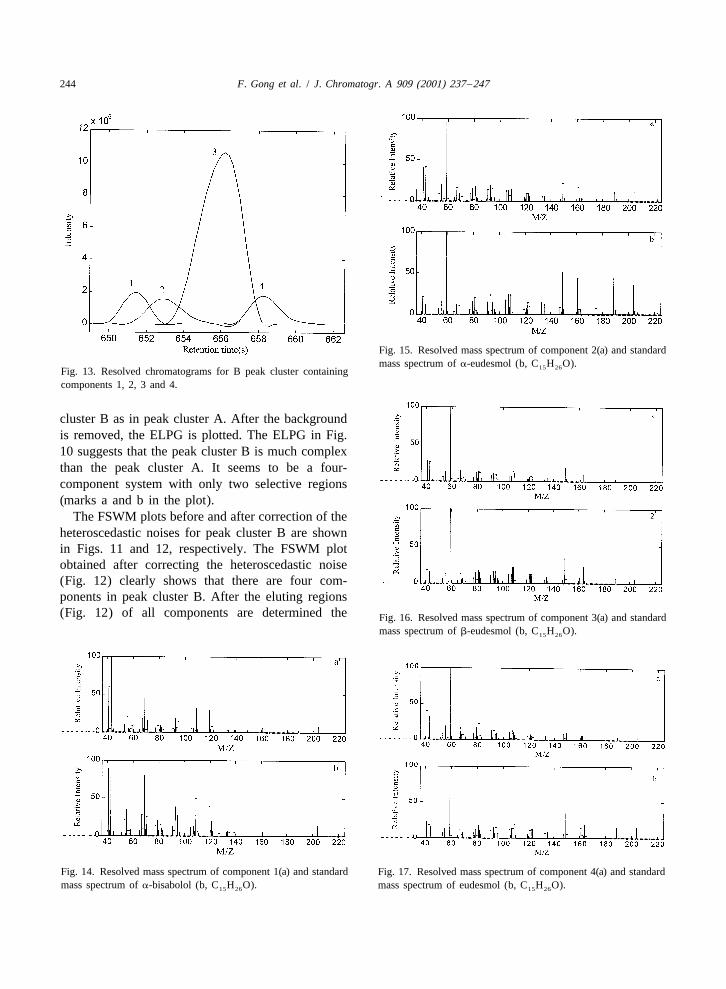
Fig. 15. Resolved mass spectrum of component 2(a) and standardmass spectrum of a-eudesmol (b, C H O).15 26Fig. 13. Resolved chromatograms for B peak cluster containing
components 1, 2, 3 and 4.
cluster B as in peak cluster A. After the backgroundis removed, the ELPG is plotted. The ELPG in Fig.10 suggests that the peak cluster B is much complexthan the peak cluster A. It seems to be a four-component system with only two selective regions(marks a and b in the plot).
The FSWM plots before and after correction of theheteroscedastic noises for peak cluster B are shownin Figs. 11 and 12, respectively. The FSWM plotobtained after correcting the heteroscedastic noise(Fig. 12) clearly shows that there are four com-ponents in peak cluster B. After the eluting regions(Fig. 12) of all components are determined the Fig. 16. Resolved mass spectrum of component 3(a) and standard
mass spectrum of b-eudesmol (b, C H O).15 26
Fig. 14. Resolved mass spectrum of component 1(a) and standard Fig. 17. Resolved mass spectrum of component 4(a) and standardmass spectrum of a-bisabolol (b, C H O). mass spectrum of eudesmol (b, C H O).15 26 15 26

F. Gong et al. / J. Chromatogr. A 909 (2001) 237 –247 245
Table 1Qualitative and quantitative results of volatile oil from peptic powder
Retention Name of Molecular Relativetime component formula concentration(s) (%)
105.0 3-Methyl-3-buten-1-ol C H O 0.085 10
191.0 n-Hexanal C H O 0.096 12
231.2 Tricyclene C H 0.1610 16
239.4 cis-Ocimene C H 9.5110 16
255.4 trans-2,7-Dimethyl-3-octen-5-yne C H 0.1010 16
259.0 Camphene C H 0.1510 16
277.2 1,1-Dimethyl-2-[3-methyl-1,3- C H 0.0810 16
butadienyl] -cyclopropane281.2 b-Pinene C H 0.6010 16
283.6 b-Myrcene C H 1.8910 16
299.2 a-Phellandrene C H 3.7610 16
301.0 trans-Ocimene C H 0.9610 16
307.2 2-Carene C H 0.2110 16
315.6 D-Limonene C H 26.6810 16
321.0 [1]-Sabinene C H 0.7310 16
323.0 6-Methyl-5-heptene-2-one C H O 0.068 14
326.2 3,7-Dimethyl-1,3,7-octatriene C H 0.4310 16
331.4 m-Cymene C H 1.3210 16
340.2 g-Terpinene C H 2.7910 16
359.4 trans-Linaloloxide C H O 0.1110 18 2
360.6 Terpinolene C H 0.5310 16
368.8 3,7-Dimethyl-1,6-octadien-3-ol C H O 0.4910 18
390.2 cis-1-Meythyl-4-[1-methylethyl]-2- C H O 0.1110 18
Cyclohexen-1-ol403.0 2-Phenylethanal C H O 0.048 8
405.0 trans-1-Methyl-4-[1-methylethyl]-2- C H O 0.1210 18
cyclohexen-1-ol424.0 n-Decanal C H O 0.1012 20
428.4 L-4-Terpioeol C H O 0.3610 18
430.8 L-Borneol C H O 0.0910 18
435.6 Myrcenol C H O 0.1510 18
436.6 exo-Isocamphanone C H O 0.2310 16
439.2 a-Terpineol C H O 0.6110 18
443.2 [R]-[1]-Citronellal C H O 0.1910 18
452.6 b-Citronellal C H O 0.0310 18
455.8 [2]-cis-Sabinol C H O 0.3810 16
457.8 3-Decyn-2-ol C H O 0.2610 18
461.8 [1]-Verbenol C H O 0.0910 18
466.8 cis-Geraniol C H O 0.6110 18
475.2 trans-Verbenol C H O 0.1110 16
483.6 Limoneon monoxide C H O 0.2810 16
496.0 Undecyne C H O 0.1310 18
500.6 a-Phenylallyl alcohol C H O 0.039 10
506.4 Aromadendrene C H O 0.2115 24
511.4 2-[2-Butynyl]-cyclohexanone C H O 0.1310 14
512.2 Limonene epoxide C H O 0.2710 16
523.6 2,7-Dimethyl-2,6-octadien-1-ol C H O 0.7410 18
528.4 Isocaryophyllene C H 0.2815 24
530.6 Germacreme C H 0.1415 24
246 F. Gong et al. / J. Chromatogr. A 909 (2001) 237 –247
Table 1. Continued
Retention Name of Molecular Relativetime component formula concentration(s) (%)
547.8 a-Humulene C H 0.1715 24
563.6 b-Elemene C H 0.0815 24
569.8 cis-b-Farnesene C H 0.2715 24
580.0 3,3,7,7-Tertramethyl-5-[2-methyl-1- C H 1.2515 24
propenyl]-tricyclo 4.1.0.02,4 heptane590.0 4,11,11-Trimethyl-8-methylene- C H 0.2815 24
bicyclo-7.2.0 undec-4-ene599.0 Elemol C H 2.1215 24
627.2 D-Nerolidol C H O 0.4215 26
630.0 Decahydro-1,1,4,7-tetramethyl-1H- C H O 0.6515 26
cycloprope azulen-4-ol640.6 [2]-Globulol C H O 0.2415 26
641.6 Juiper camphor C H O 2.0815 26
651.4 a-Bisabolol C H O 1.6015 26
652.8 a-Eudesmol C H O 2.0215 26
656.4 b-Eudesmol C H O 13.4115 26
658.2 Eudesmol C H O 1.8715 26
668.0 Diethyl Phthalate C H O 0.2913 24 2
686.0 [2]-Spathulenol C H O 0.5615 24
705.8 Solavetivone C H O 0.5115 22
708.6 Nootkatone C H O 0.3215 22
729.0 4-Formylbiphenyl C H O 5.7013 10
unique resolution into chromatograms and mass be used to roughly deduce possible structures ofspectra can be then conducted on the two-dimension- them here.al data. Figs. 13–17 show the resolved results. Thesefigures definitely support the presence of four iso- 4.2. Quantitative analysismeric components in peak cluster B.
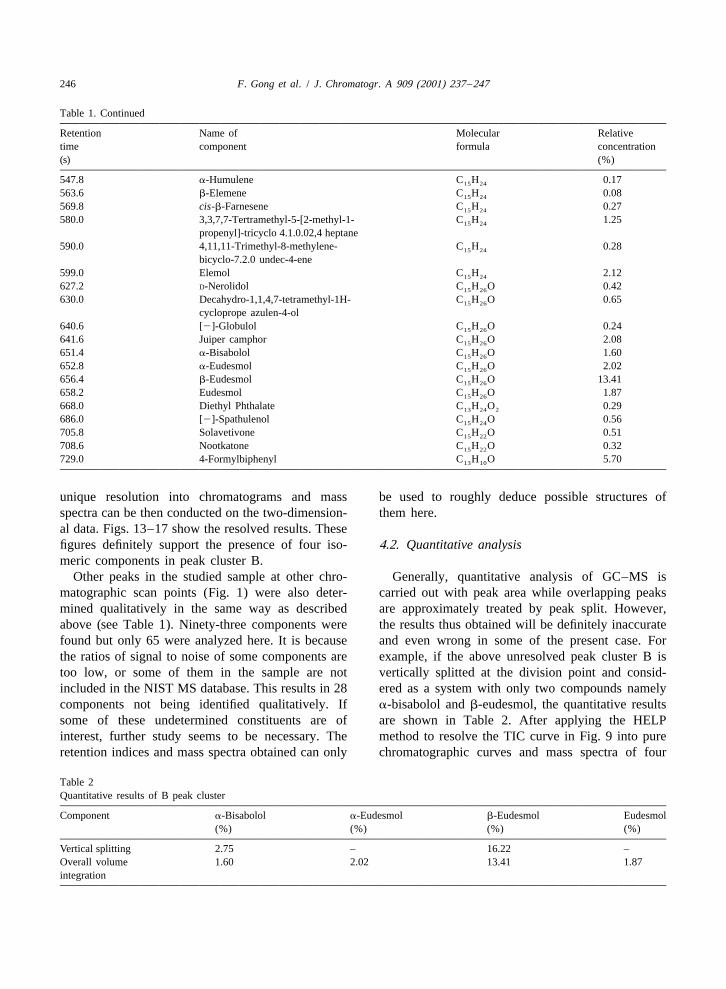
Other peaks in the studied sample at other chro- Generally, quantitative analysis of GC–MS ismatographic scan points (Fig. 1) were also deter- carried out with peak area while overlapping peaksmined qualitatively in the same way as described are approximately treated by peak split. However,above (see Table 1). Ninety-three components were the results thus obtained will be definitely inaccuratefound but only 65 were analyzed here. It is because and even wrong in some of the present case. Forthe ratios of signal to noise of some components are example, if the above unresolved peak cluster B istoo low, or some of them in the sample are not vertically splitted at the division point and consid-included in the NIST MS database. This results in 28 ered as a system with only two compounds namelycomponents not being identified qualitatively. If a-bisabolol and b-eudesmol, the quantitative resultssome of these undetermined constituents are of are shown in Table 2. After applying the HELPinterest, further study seems to be necessary. The method to resolve the TIC curve in Fig. 9 into pureretention indices and mass spectra obtained can only chromatographic curves and mass spectra of four
Table 2Quantitative results of B peak cluster
Component a-Bisabolol a-Eudesmol b-Eudesmol Eudesmol(%) (%) (%) (%)
Vertical splitting 2.75 – 16.22 –Overall volume 1.60 2.02 13.41 1.87integration
F. Gong et al. / J. Chromatogr. A 909 (2001) 237 –247 247
[7] G.G. Liang, China J. Chin. Mater. Med. 24 (1999) 67.components, much more accurate results can be[8] M. Maeder, A.D. Zuberbuhler, Anal. Chim. Acta 181 (1986)reached (see Table 2). The quantitative results for all
287.other components in the peptic powder sample can[9] M. Maeder, Anal. Chem. 59 (1987) 527.
be obtained in the same way as described above, and[10] M. Maeder, A. Zilian, Chemom. Intell. Lab. Syst. 3 (1988)
are shown in Table 1. 205.[11] E.R. Malinowski, J. Chemom. 6 (1992) 29.[12] W. Den, E.R. Malinowski, J. Chemom. 7 (1993) 89.[13] O.M. Kvalheim, Y.Z. Liang, Anal. Chem. 64 (1992) 936.5. Conclusion[14] Y.Z. Liang, O.M. Kvalheim, H.R. Keller, D.L. Massart, P.
Kiechle, F. Erni, Anal. Chem. 64 (1992) 946.With the use of HELP resolution method upon
[15] Y.Z. Liang, O.M. Kvalheim, A. Rahmani, R.G. Brereton, J.two-dimensional data together with the large mass Chemom. 7 (1993) 15.spectral database, one can see from the results [16] Y.Z. Liang, O.M. Kvalheim, Anal. Chim. Acta 292 (1994) 5.
[17] R. Manne, H.L. Shen, Y.Z. Liang, Chemom. Intell. Lab. Syst.obtained that real complex systems, like the tradi-45 (1999) 171.tional Chinese medicine peptic powder, can be
[18] H.L. Shen, R. Manne, Q.S. Xu, D.Z. Chen, Y.Z. Liang,elegantly analyzed qualitatively and quantitatively.Chemom. Intell. Lab. Syst. 45 (1999) 323.
This demonstrated that the combination of hyphe- [19] M.T. Lohnes, R.D. Guy, P.D. Wentzell, Anal. Chim. Actanated instruments and relevant chemometric methods 389 (1999) 95.opens a new way for quick and accurate analysis of [20] C.D. Brown, P.D. Wentzell, Chemom. Intell. Lab. Sys. 51
(2000) 3.real unknown complex samples. The method de-[21] C.J. Xu, J.H. Jiang, Y.Z. Liang, Analyst 124 (1999) 1471.veloped in this work paper cannot only greatly[22] C.J. Xu, Y.Z. Liang, F. Gong, H. Cui, Anal. Chim. Acta, inenhance the separation ability of the hyphenated
press.chromatography but also its ability in qualitative [23] Y.Z. Liang, White, Grey and Black Multicomponent Systemsidentification. This implies shows the prosperous and Their Chemometric Algorithms, Hunan Publishing
House of Science and Technology, Changsha, Hunan, 1996.prospect for analysts to directly address very difficult[24] F. Gong, Y.G. Peng, H. Cui, Y.Z. Liang, A.K.M. Leung, F.T.problems in analytical chemistry.
Chau, Acta Pharm. Sin. 34 (1999) 214.[25] F. Gong, Y.G. Peng, H. Cui, Y.Z. Liang, A.K.M. Leung, F.T.
Chau, Chem. J. Chin. Univ. 20 (1999) 199.Acknowledgements [26] H.L. Shen, Y.Z. Laing, R.Q. Yu, X.C. Li, X.X. Sun, Sci.
China B 41 (1998) 21.[27] Z. Zhao, E.R. Malinowski, J. Chemom. 13 (1999) 83.This work is financially supported by the National[28] W. Windig, Chemom. Intell. Lab. Sys. 36 (1997) 3.Natural Science Foundation in China (Grant No.[29] J.Q. Xu, Traditional Chinese Medicinal Preparation Science,29875007), and The Research Center for Modern
Shanghai Publishing House of Science and Technology,Chinese Medicine (RCMCM) project and Union Shanghai, 1985.Laboratory of Asymmetric Synthesis of The Hong [30] E.Q. Zhang, Prescriptions of Traditional Chinese Medicine:
A Practical English–Chinese Library of Traditional ChineseKong Polytechnic University.Medicine, Publishing House of Shanghai College of Tradi-tional Chinese Medicine, Shanghai, 1990, pp. 39–-400.
[31] X.D. Liu, X. Yan, Y.D. Wei, J.C. Yan, Chin. J. Instrum. Anal.References 17 (1998) 56.
[32] Y.Z. Huang, Y.L. Wu, Nat. Prod. RD 10 (1998) 48.[33] Q. Zeng, G.N. Zhou, W.Q. Tu, L. Zhang, Q.M. Xian, Chin.[1] K.C. Wen, C.Y. Huang, F.L. Lu, J. Chromatogr. 631 (1993)
Trad. Hebral Drugs 28 (1997) 81.241.[34] Chinese Pharmacopoeia Committee, Chinese Pharmacopoeia,[2] X.G. He, L.Z. Lin, L.Z. Lian, J. Chromatogr. A 755 (1996)
Publishing House of People’s Health, 1995, Appendix 62.127.[3] X.G. He, L.Z. Lin, M.W. Bernart, L.Z. Lian, J. Chromatogr. [35] H.R. Keller, D.L. Massart, Anal. Chim. Acta 246 (1991)
A 815 (1998) 205. 379.[4] W.A. Court, J.G. Hendel, J. Elmi, J. Chromatogr. A 755 [36] H.R. Keller, D.L. Massart, Y.Z. Liang, O.M. Kvalheim, Anal.
(1996) 11. Chim. Acta 263 (1992) 125.[5] Y.C. Lee, C.Y. Huang, K.C. Wen, T.T. Suen, J. Chromatogr. [37] F. Gong, Y.-Z. Liang, Q.-S. Xu, F.-T. Chau, J. Chromatogr.
A 692 (1996) 137. A (2001) in press.[6] Y.C. Lee, C.Y. Huang, K.C. Wen, T.T. Suen, J. Chromatogr. [38] O.M. Kvalheim, F. Brakstad, Y.Z. Liang, Anal. Chem. 66
A 660 (1994) 299. (1994) 43.
Copyright © 2022 FDOKUMEN