Detection of Volatile Organic Compounds by Analyses of ...
10
Sensors and Materials, Vol. 23, No. 7 (2011) 359–368 MYU Tokyo S & M 0852 * Corresponding author: e-mail: [email protected] ** Corresponding author: e-mail: [email protected] 359 Detection of Volatile Organic Compounds by Analyses of Polymer-Coated Quartz Crystal Microbalance Sensor Arrays Mutsumi Kimura * , Ye Liu, Ryosuke Sakai, Seiko Sato, Toshihiro Hirai, Tadashi Fukawa and Takashi Mihara 1,** Department of Functional Polymer Science, Faculty of Textile Science and Technology, Shinshu University, Ueda, Nagano 386-8567, Japan 1 Future Creation Laboratory, Olympus Corporation, Tokyo 192-8512, Japan (Received January 11, 2011; accepted February 17, 2011) Key words: chemical sensor, QCM, recognition layer, polymer, volatile organic compound, glass transition temperature The responses of polymer-coated quartz crystal microbalance (QCM) sensors upon exposure to volatile organic compounds (VOCs) were studied under various operational conditions and were applied to the detection of VOCs by the response analyses of QCM sensor arrays. Three flexible polymers exhibited different responses and selectivities to four VOCs. The differences in sensitivity and responsivity produce response patterns for the classification and identification of VOC vapors. 1. Introduction Quartz crystal microbalance (QCM) has been established as a piezoelectric mass transducer that can be used to measure weight changes. (1,2) The resonance frequency is proved to decrease linearly with the increase in weight on the QCM electrode at a nanogram level. Weight detection sensors have been developed by the modification of the QCM surface with various types of material and these sensors can be used for monitoring dynamic processes such as chemisorption, reactions, and intermolecular interactions. (3,4) Adsorption or binding amounts and equilibrium constants in various events could be determined quantitatively from the time courses of the frequency decrease of the surface-modified QCM sensors, responding to the addition of analytical targets.
-
Upload
khangminh22 -
Category
Documents
-
view
3 -
download
0
Transcript of Detection of Volatile Organic Compounds by Analyses of ...

Sensors and Materials, Vol. 23, No. 7 (2011) 359–368MYU Tokyo
S & M 0852
*Corresponding author: e-mail: [email protected]**Corresponding author: e-mail: [email protected]
359
Detection of Volatile Organic Compoundsby Analyses of Polymer-Coated Quartz Crystal
Microbalance Sensor ArraysMutsumi Kimura*, Ye Liu, Ryosuke Sakai, Seiko Sato,Toshihiro Hirai, Tadashi Fukawa and Takashi Mihara1,**
Department of Functional Polymer Science, Faculty of Textile Science and Technology, Shinshu University, Ueda, Nagano 386-8567, Japan
1Future Creation Laboratory, Olympus Corporation, Tokyo 192-8512, Japan
(Received January 11, 2011; accepted February 17, 2011)
Key words: chemical sensor, QCM, recognition layer, polymer, volatile organic compound, glass transition temperature
The responses of polymer-coated quartz crystal microbalance (QCM) sensors upon exposure to volatile organic compounds (VOCs) were studied under various operational conditions and were applied to the detection of VOCs by the response analyses of QCM sensor arrays. Three fl exible polymers exhibited different responses and selectivities to four VOCs. The differences in sensitivity and responsivity produce response patterns for the classifi cation and identifi cation of VOC vapors.
1. Introduction
Quartz crystal microbalance (QCM) has been established as a piezoelectric mass transducer that can be used to measure weight changes.(1,2) The resonance frequency is proved to decrease linearly with the increase in weight on the QCM electrode at a nanogram level. Weight detection sensors have been developed by the modifi cation of the QCM surface with various types of material and these sensors can be used for monitoring dynamic processes such as chemisorption, reactions, and intermolecular interactions.(3,4) Adsorption or binding amounts and equilibrium constants in various events could be determined quantitatively from the time courses of the frequency decrease of the surface-modifi ed QCM sensors, responding to the addition of analytical targets.

360 Sensors and Materials, Vol. 23, No. 7 (2011)
Polymers have been used as molecular recognition layers owing to their great design fl exibility. The polymers offer an advantage as a sorbent coating for the detection of analytes using QCM sensors because they provide specifi c interactions with analytes as well as form stable thin fi lms.(5–16) Polymers can offer amplifi ed sensitivity and a real-time response in the QCM sensor systems. In this work, the responses of polymer-coated QCM sensors upon exposure to volatile organic compounds (VOCs) were studied under various operational conditions and were also applied to the detection of VOCs by the response analyses of QCM sensor arrays. Sensors for the detection of VOCs in the areas of environmental monitoring, health care, food industry, and odor classifi cation have been an intense subject for research and development.(5–15) Small and integrated VOC sensors based on QCMs have been developed to enable on-site, real-time, and selective detection of VOCs. One of the issues in the creation of these sensor systems for pattern recognition of VOCs is the selection of appropriate sensitive polymers used as a coating for QCM sensors. In this context, the selectivity and sensitivity of various polymer fi lms have been explored.(3,4) This work is aimed at the detection of four VOCs by the response analyses of QCM sensors coated with four different polymer fi lms. We report the structural dependence of the selectivity and sensitivity of crystalline polystyrene, fl exible polybutadiene, and polybutadiene-based copolymers.
2. Methods
2.1 QCM study QCM is an electroacoustic method suitable for mass and viscoelestic analyses of adsorbed layers at the solid/liquid interface. Sauerbrey developed correlating changes in the oscillation frequency of a piezoelectric crystal with the mass deposited on it. The frequency changes are directly proportional to the added mass as the added mass behaves elastically similarly to the quartz itself as described using the following equation:(17)
∆F = −Cf ∆m, (1)
where ∆F is the change in the resonance frequency owing to the added mass (∆m), and Cf is a proportionality constant (0.934 ng−1 Hz for a 9 MHz quartz crystal). The QCM sensor consisted of a disk-shaped AT-cut piezoelectronic quartz crystal deposited with gold electrodes on both sides. The QCM sensor crystal operated at a frequency of 9 MHz and the diameter of the crystal is 8.6 mm. AT-cut QCMs (TamaDevice Co., Ltd., diameter of gold electrode: 5.0 mm) were fi rst cleaned in a UV/ozone cleaner and used immediately for the deposition of polymer fi lms. The surface modifi cation with polymer thin fi lms on the gold electrodes, the adsorption of VOCs, and the sensor responses can be evaluated by determining the frequency changes. Polystyrene (PS), polybutadiene (PBD), poly(acrylonitrile-co-butadiene) (PAB), and poly(styrene-co-butadiene) (PSB) were purchased from Sigma-Aldrich and used as recognition layers without any purification. These polymers were dissolved in organic solvents (tetralin for PS, PBD, and PSB, and o-dichlorobenzene for PAB) at
Sensors and Materials, Vol. 23, No. 7 (2011) 361
various concentrations ([PS] = 10 wt%, [PBD] = 6 wt%, [PAB] = 5 wt%, and [PSB] = 7 wt%). Polymer fi lms were deposited onto the QCM surface by spin-coating. The surface morphologies of the polymer fi lms on the QCMs were analyzed by SEM. After deposition, the sensors were dried under vacuum at 60°C for 12 h to draw out the remaining solvent. The electrical characteristics of the polymer-coated QCMs were evaluated using a network impedance analyzer (Agilent Technology, Model 4395A).
2.2 Dilution fl ow system for vapor mixing(18–23)
The dilution fl ow system for VOC vapors is composed of three components: a calibration unit, a measuring chamber, and a data acquisition system. The calibration unit consists of six mass fl ow controllers (MFCs) and magnetic valve systems (MVSs), which is connected to bubblers to generate VOC vapors with various concentrations. Four types of VOC (n-octane (hydrocarbon), toluene (aromatic hydrocarbon), acetone (ketone), and ethanol (alcohol)) were chosen as analytes to be tested in this study because of the different sensitivities of the polymer-coated QCM sensors to these VOCs in this experiment. The test vapors of VOCs were generated from the temperature-controlled bubblers (saturation vapor pressures were calculated using the Antoine equation) with ultrapure nitrogen gas (99.9995%) as a carrier gas and then diluted to adjusted concentrations using the computer-driven MFCs. We used ultrapure nitrogen gas as a carrier gas to avoid the infl uence of moisture. The concentrations of VOCs are calculated as a volume part using the partial pressure of VOCs at room temperature. Diluted gases are led into the measuring chamber containing twelve QCMs coated with polymers using the computer-driven MVS, and the frequency changes of modifi ed QCMs were monitored in response to the incorporation of VOCs. The temperature in the measuring chamber was stabilized using a Peltier thermostat to avoid the temperature-dependent frequency changes and the temperature of the chamber was monitored during the experiments. Six universal frequency counters (Agilent Technology, Model 53131A) are able to determine twelve frequencies at the same time. Each counter reports the absolute frequencies of twelve QCMs through GP-IB communication with the computer.
3. Results and Discussion
The chemical structures of the four polymers are shown in Fig. 1(a). The four polymers, PS, PBD, PAB, and PSB, were deposited onto the gold electrode of QCMs by spin-coating. The SEM image of the PBD-coated QCM shows a smooth and uniform surface. The thickness of the PBD layer was 400 nm as observed in the cross-sectional SEM image shown in Fig. 1(b). The deposition of polymer fi lms on QCMs induced the frequency decrease at approximately 7,000 Hz. Using the Sauerbrey equation, this frequency decrease is equivalent to a mass coating of 7,400 ng. The thickness of the deposited polymer fi lms is about 400 nm, estimated from the weight obtained from the frequency decrease, the density of polymers, and the area of the electrode. The estimated thicknesses agree with those observed from the SEM images. The polymer-coated QCMs were set into the measurement chamber and the sensing properties of polymer-coated QCMs were investigated by measuring the frequency

362 Sensors and Materials, Vol. 23, No. 7 (2011)
changes when the film was exposed to VOC vapors in the measurement chamber. Toluene, n-octane, acetone, and ethanol were chosen as common representatives of the different classes of solvents. The measurements consist of an exposure phase and a regeneration phase. During the exposure phase, the films on QCMs act as recognition layers for VOC molecules, and the incorporation of VOC molecules within the polymer film causes the frequency to decrease. After reaching a constant frequency, the incorporated VOC molecules are released by the supply of pure carrier gas. During the regeneration process, the frequency of the sensors rises due to the mass decreasing in the polymer film. Figure 2 shows time courses of sensor responses (∆F) of the QCMs coated with PS and PBD responding to exposure to 1,000 ppm toluene vapor at 20°C. The sensor responses ∆F were obtained from the frequency differences between the corresponding QCM frequencies at the beginning and end of the exposure phase. When the PBD thin film was employed, the frequency of the QCM decreased rapidly in response to the exposure to toluene vapor and saturated at −∆F = 69 Hz within 20 s. When the carrier gas was changed to pure nitrogen gas, the frequency returned to the original value within 20 s, which indicates fast adsorption and desorption processes of toluene in the PBD film. On the other hand, the PS-coated QCM exhibited a very slow frequency change in the adsorption and desorption of toluene vapor, and −∆F reached 60 Hz after 6,000 s. The response time of PS-coated QCM (t90% = 2,750 s) was a significantly longer than that of the PBD-coated QCM (t90% = 7 s). The difference in sensing responsivity between PS- and PBD-coated QCMs may be based on the chemical structures of the polymers. Since the glass transition temperature (Tg) of PS is 95°C, PS is solid at room temperature. In contrast, PBD is a flexible elastic material at room temperature owing to its low Tg (Tg < −90°C).(24)
Fig. 1. (a) Chemical structures of PS, PBD, PAB, and PSB used in this study. (b) Cross-sectional SEM image of PBD film.

Sensors and Materials, Vol. 23, No. 7 (2011) 363
The diffusion of toluene within the hard PS film is slow compared with that within the soft PBD film. Thus, the PS-coated QCM sensor needs a long period to reach a saturated state in response to the exposure to toluene vapor. The diffusion coefficients (D) of toluene vapor into PBD and PS films coated on the QCM electrode are determined from the analyses of sensor responses using Fick’s second equation:(25)
∆Ft /∆F∞ = 4(D/�)1/2(t1/2/L), (2)
where ∆Ft is the frequency change due to the adsorption of toluene vapor into the polymer films at any time t, ∆F∞ is the frequency change in the saturated state in the adsorption process, and L is the film thickness on the QCM electrode. The D values of toluene vapor in PBD and PS films were obtained from plots of ∆Ft /∆F∞ as a function of t1/2/L. The D values of toluene vapor were estimated to be 5.4 × 10⁻¹¹ and 2.7 × 10⁻¹³ cm2/s for PBD and PS films, respectively. The D value of the PBD film was 200 times that of the PS film, indicating a rapid diffusion of toluene vapor in flexible PBD films. Figure 3(a) shows the ∆F∞ change of PBD-coated sensors in sensing toluene at various concentrations of 50–6,000 ppm. A linear correlation was obtained with a correlation coefficient of 0.992 and a slope of 0.095 Hz/ppm. The linear correlation between ∆F and toluene concentrations makes it possible to determine the concentration of toluene vapor in unknown samples. The detection limit of toluene was 20 ppm for the PBD-coated sensor. The sensor responses were recorded versus time until the steady state was reached, and then the complete desorption of toluene vapor from the PBD film was achieved using pure nitrogen. The experiment was repeated ten times to ensure complete reproducibility and reversibility of the sensor. The PBD-coated QCMs showed good reproducibility and reversibility in toluene sensing. Figure 3(b)
Fig. 2. Frequency changes of PBD (solid line)- and PS (dotted line)-coated QCMs (film thickness is 500 nm) upon exposure to 1,000 ppm toluene vapor measured at 20°C.

364 Sensors and Materials, Vol. 23, No. 7 (2011)
shows the dependence of ∆F∞ on the temperature of the tested chamber. The response of the PBD-coated QCM sensor at 0°C is about 4 times that at 20°C, and ∆F∞ decreased with increasing temperature. When the PBD fi lm is exposed to toluene vapor, gaseous toluene condenses within the PBD fi lm. The ∆F∞ decreasing with rising temperature can be explained by the increase in the equilibrium vapor pressure. The sensor responses strongly depend on the ambient temperature as well as the concentration of target VOCs. The ∆F∞ and t90% values of the PBD- and PS-coated QCMs upon exposure to 1,000 ppm VOCs are summarized in Table 1. When exposed to 1,000 ppm acetone vapor, the PBD-coated QCM showed a smaller frequency change than the PS-coated QCM. Ethanol produced almost equal frequency decreases in both polymers. The response sequences of the PBD- and PS-coated QCMs were toluene = n-octane >> ethanol > acetone and toluene > n-octane > acetone > ethanol, indicating the selectivity of the polymer fi lms. The selectivity can be explained on the basis of the following three physicochemical properties of VOCs and polymers: the molecular weight of VOCs, the equilibrium vapor pressure of VOCs, and the affi nity of the polymer for VOC vapor. PBD and PS exhibited different patterns of selectivity in VOC sensing, suggesting a difference in the affi nity of the polymers for VOC vapors. The affi nity of polymers for VOC vapors mainly coincides with the solubility parameter (δ) towards organic solvents.(26) The solubility parameter provides a numerical estimate of the degree of intermolecular interaction between two different materials.(25) The solubility parameter of PBD (δ = 7.3) is closer to that of n-octane (δ = 7.0), but is smaller than that of ethanol (δ = 12.7).(27) The closer the solubility parameters between PBD and n-octane, the more will they be able to interact with each other, resulting in a higher response of the sensor coated with PBD to n-octane vapor. Toluene and n-octane, having closer parameters with PBD and PS, result in larger responses than ethanol and acetone. Since PS showed very slow responses to toluene and n-octane, the detection of VOCs at the saturated state
(a) (b)
Fig. 3. (a) Responses of PBD-coated QCM sensor as a function of toluene concentration at 20°C. (b) Temperature dependence of ∆F∞ for PBD-coated QCM sensor upon exposure to 1,000 ppm toluene vapor.
Sensors and Materials, Vol. 23, No. 7 (2011) 365
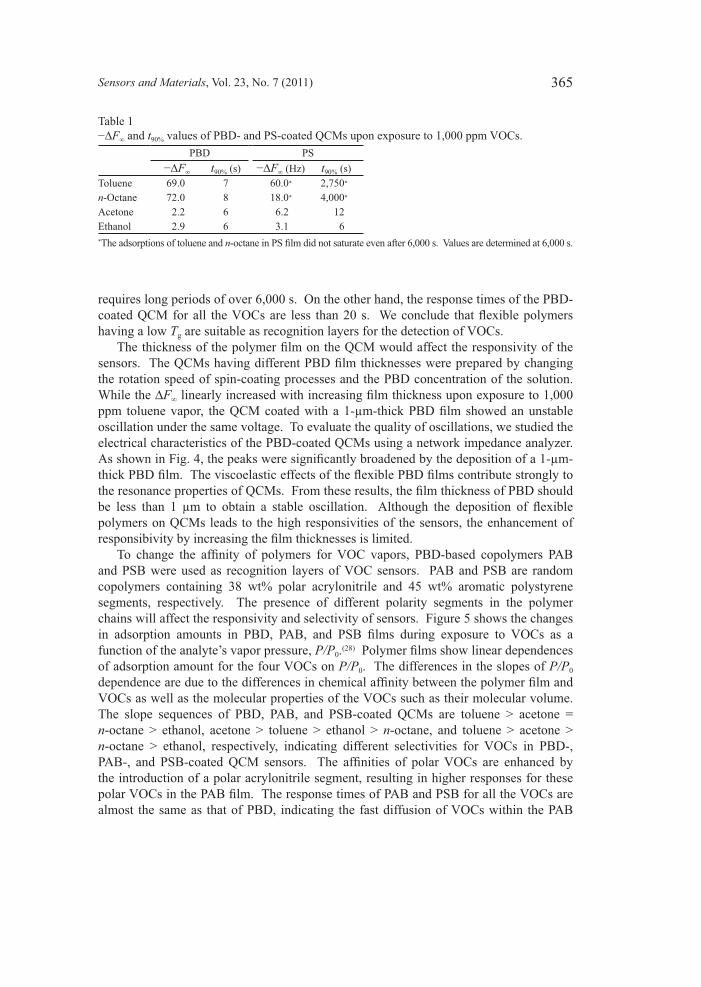
requires long periods of over 6,000 s. On the other hand, the response times of the PBD-coated QCM for all the VOCs are less than 20 s. We conclude that fl exible polymers having a low Tg are suitable as recognition layers for the detection of VOCs. The thickness of the polymer fi lm on the QCM would affect the responsivity of the sensors. The QCMs having different PBD fi lm thicknesses were prepared by changing the rotation speed of spin-coating processes and the PBD concentration of the solution. While the ∆F∞ linearly increased with increasing fi lm thickness upon exposure to 1,000 ppm toluene vapor, the QCM coated with a 1-μm-thick PBD fi lm showed an unstable oscillation under the same voltage. To evaluate the quality of oscillations, we studied the electrical characteristics of the PBD-coated QCMs using a network impedance analyzer. As shown in Fig. 4, the peaks were signifi cantly broadened by the deposition of a 1-μm-thick PBD fi lm. The viscoelastic effects of the fl exible PBD fi lms contribute strongly to the resonance properties of QCMs. From these results, the fi lm thickness of PBD should be less than 1 μm to obtain a stable oscillation. Although the deposition of fl exible polymers on QCMs leads to the high responsivities of the sensors, the enhancement of responsibivity by increasing the fi lm thicknesses is limited. To change the affi nity of polymers for VOC vapors, PBD-based copolymers PAB and PSB were used as recognition layers of VOC sensors. PAB and PSB are random copolymers containing 38 wt% polar acrylonitrile and 45 wt% aromatic polystyrene segments, respectively. The presence of different polarity segments in the polymer chains will affect the responsivity and selectivity of sensors. Figure 5 shows the changes in adsorption amounts in PBD, PAB, and PSB fi lms during exposure to VOCs as a function of the analyte’s vapor pressure, P/P0.(28) Polymer fi lms show linear dependences of adsorption amount for the four VOCs on P/P0. The differences in the slopes of P/P0 dependence are due to the differences in chemical affi nity between the polymer fi lm and VOCs as well as the molecular properties of the VOCs such as their molecular volume. The slope sequences of PBD, PAB, and PSB-coated QCMs are toluene > acetone = n-octane > ethanol, acetone > toluene > ethanol > n-octane, and toluene > acetone > n-octane > ethanol, respectively, indicating different selectivities for VOCs in PBD-, PAB-, and PSB-coated QCM sensors. The affi nities of polar VOCs are enhanced by the introduction of a polar acrylonitrile segment, resulting in higher responses for these polar VOCs in the PAB fi lm. The response times of PAB and PSB for all the VOCs are almost the same as that of PBD, indicating the fast diffusion of VOCs within the PAB
Table 1−∆F∞ and t90% values of PBD- and PS-coated QCMs upon exposure to 1,000 ppm VOCs.
PBD PS−∆F∞ t90% (s) −∆F∞ (Hz) t90% (s)
Toluene 69.0 7 60.0* 2,750*
n-Octane 72.0 8 18.0* 4,000*
Acetone 2.2 6 6.2 12Ethanol 2.9 6 3.1 6*The adsorptions of toluene and n-octane in PS fi lm did not saturate even after 6,000 s. Values are determined at 6,000 s.

366 Sensors and Materials, Vol. 23, No. 7 (2011)
Fig. 4. Frequency-dependent impedance for PBD-coated QCMs having different fi lm thicknesses at 20°C: (a) only QCM, (b) 500-nm-thick QCM coated with PBD, and (c) 1-μm-thick QCM coated with PBD. The fi lm thicknesses were estimated on the basis of the frequency changes.
Fig. 5. Dependence of adsorption amounts on fraction of VOC vapor pressures in the case of (a) PBD-, (b) PAB-, and (c) PSB-coated QCMs at 20°C: (●) toluene, (○) n-octane, (∆) acetone, and (▲) ethanol.
(a) (b) (c)
(a)
(b)
(c)

Sensors and Materials, Vol. 23, No. 7 (2011) 367
and PSB fi lms. The above difference in sensitivity produces response patterns for the classifi cation and identifi cation of unknown VOC vapors. The responses of the three QCMs coated with PBD, PAB, and PSB produce a recognition pattern that can be used to detect VOCs.(29)
In conclusion, we proposed three sensitive polymers used to coat QCM sensors for the creation of these sensor systems for pattern recognition of VOCs. Three fl exible polymers, PBD, PAB, and PSB, exhibited different selectivities to four VOCs. The sensitivity of the sensor can be tuned by combining polybutadiene segments and the other segment in the copolymers. The simultaneous measurement of the QCM array having polymer fi lms of different sensitivities provides the recognition pattern for the detection of VOCs. Therefore, the polymers as obtained in this study are found to be suitable for use in VOC sensor arrays. Further combination of these selective polymers with miniaturized micro-electromechanical systems (MEMS) will open a new opportunity to realize integrated compact sensor systems. The design, structure, and sensing abilities of chemical sensor systems employing a microcantilever sensor array coated with selective polymers will be described in the future.
Acknowledgements
This work was partially supported by “Regional Innovation Cluster Program of Nagano” from the Ministry of Education, Culture, Sports, Science, and Technology, Japan.
References
1 W. H. King, Jr.: Anal. Chem. 36 (1964) 1735. 2 J. W. Grate: Chem. Rev. 100 (2000) 2627. 3 A. Janshoff, H. C. Galla and C. Steinem: Angew. Chem. Int. Ed. 39 (2000) 4004. 4 J. Janata and M. Josowicz: Nat. Mater. 2 (2003) 19. 5 M. Matsuguchi and T. Ueno: Sens. Actuators B 113 (2006) 94. 6 M. Kikuchi, N. Tsuru and S. Shiratori: Sci. Technol. Adv. Mater. 7 (2006) 156. 7 H. Zeng, Y. Jiang, G. Xie and J. Yu: Sens. Actuators B 122 (2007) 1. 8 P. Si, J. Mortensen, A. Komolov, J. Denborg and P. J. Møller: Anal. Chem. Acta 597 (2007)
223. 9 S. Ichinohe, H. Tanaka and Y. Konno: Sens. Actuators B 123 (2007) 306. 10 M. Matsuguchi, T. Ueno, T. Aoki and M. Yoshida: Sens. Actuators B 131 (2008) 652. 11 J.-F. Ju, M.-J. Syu, H.-S. Teng, S.-K. Chou, Y.-S. Chang: Sens. Actuators B 132 (2008) 319. 12 M. M. Ayad and N. L. Torad: Talanta 78 (2009) 1280. 13 X. Du, Z. Wang, J. Huang, S. Tao, X. Tang and Y. Jiang: J. Mater. Sci. 44 (2009) 5872. 14 T. Baimpos, P. Boutikos, V. Nikolakis and D. Kouzoudis: Sens. Actuators A 158 (2010) 249. 15 X. Wang, B. Ding, M. Sun, J. Yu and G. Sun: Sens. Actuators B 144 (2010) 11. 16 E. Nomura, A. Hosoda, M. Takagaki, H. Mori, Y. Miyake, M. Shibakami and H. Taniguchi:
Langmuir 26 (2010) 10226. 17 G. Sauerbrey: Z. Phys. 155 (1959) 206. 18 A. Hierlemann, K. Bodenhöfer, M. Fluck, V. Schurig and W. Göpel: Anal. Chim. Acta 346 (1997)
327.
368 Sensors and Materials, Vol. 23, No. 7 (2011)
19 C. Heil, G. R. Windscheif, St. Braschohs, J. Flörke, J. Gläser, M. Lopez, J. Müller-Albrecht, U. Schramm, J. Bargon and F. Vögtle: Sens. Actuators B 61 (1999) 51.
20 M. C. Harrillo, M. J. Fernández, I. Sayago, M. García, M. Aleixandre, J. P. Santos, L. Arés, J. Gutiérrez, I. Grácia and C. Cané: Thin Solid Films 467 (2004) 234.
21 S.-C. Ha, Y. Yang, Y. S. Kim, S.-H. Kim, Y. J. Kim and S. M. Cho: Sens. Actuators B 108 (2005) 258.
22 C.-Y. Yang, C.-L. Li and C.-J. Lu: Anal. Chim. Acta 565 (2006) 17. 23 I. Sugimoto, T. Nagaoka, M. Seyama, M. Nakamura and K. Takahashi: Sens. Actuators B 124
(2007) 53. 24 Polymer Database (PoLyInfo), National Institute for Material Science, Materials Database
Station, http://polymer.nims.go.jp/index_en.html. 25 M. M. Ayad, G. El-Hefnawey and N. L. Torad: J. Hazard. Mater. 168 (2009) 85. 26 H. J. Vandenburg, A. A. Clifford, K. D. Bartle, R. E. Carlson, J. Carroll and I. D. Newton:
Analyst 124 (1999) 1707. 27 H. Gamsjäger, J. W. Lorimer, P. Scharlin and D. G. Shaw: Pure Appl. Chem. 80 (2008) 233. 28 E. J. Severin and N. S. Lewis: Anal. Chem. 72 (2000) 2008. 29 X. Jin, Y. Hung, A. Mason and X. Zeng: Anal. Chem. 81 (2009) 595.