Two Dimensional Modelling of Volatile Organic Compounds ...
104
University of Alberta Two Dimensional Modelling of Volatile Organic Compounds Adsorption in a Fixed Bed Adsorber by Dereje Tamiru Tefera A thesis submitted to the Faculty of Graduate Studies and Research in partial fulfillment of the requirements for the degree of Master of Science in Environmental Engineering Civil and Environmental Engineering © Dereje Tamiru Tefera Fall 2013 Edmonton, Alberta Permission is hereby granted to the University of Alberta Libraries to reproduce single copies of this thesis and to lend or sell such copies for private, scholarly or scientific research purposes only. Where the thesis is converted to, or otherwise made available in digital form, the University of Alberta will advise potential users of the thesis of these terms. The author reserves all other publication and other rights in association with the copyright in the thesis and, except as herein before provided, neither the thesis nor any substantial portion thereof may be printed or otherwise reproduced in any material form whatsoever without the author's prior written permission.
-
Upload
khangminh22 -
Category
Documents
-
view
1 -
download
0
Transcript of Two Dimensional Modelling of Volatile Organic Compounds ...

University of Alberta
Two Dimensional Modelling of Volatile Organic
Compounds Adsorption in a Fixed Bed Adsorber
by
Dereje Tamiru Tefera
A thesis submitted to the Faculty of Graduate Studies and Research
in partial fulfillment of the requirements for the degree of
Master of Science
in
Environmental Engineering
Civil and Environmental Engineering
© Dereje Tamiru Tefera
Fall 2013
Edmonton, Alberta
Permission is hereby granted to the University of Alberta Libraries to reproduce single
copies of this thesis and to lend or sell such copies for private, scholarly or scientific
research purposes only. Where the thesis is converted to, or otherwise made available in
digital form, the University of Alberta will advise potential users of the thesis of these
terms.
The author reserves all other publication and other rights in association with the copyright
in the thesis and, except as herein before provided, neither the thesis nor any substantial
portion thereof may be printed or otherwise reproduced in any material form whatsoever
without the author's prior written permission.

Abstract
In this research two-dimensional mathematical models were developed to study
adsorption of single component volatile organic compounds (VOCs) and
competitive adsorption of n-component mixtures of VOCs from dilute gas streams
in a fixed-bed adsorber. The models consist of the macroscopic mass, energy and
momentum conservation equations and isotherm equations. Langmuir isotherm
was used for single component VOC adsorption, while a new multicomponent
isotherm model was derived to predict adsorption equilibria of VOCs mixture
from single component isotherm data. The models were validated with
experiments wherein deviation between measured and modeled data was
quantified using the mean absolute relative error (MARE).
The single component adsorption model predicted the breakthrough curves of the
tested VOCs (acetone, benzene, toluene and 1, 2, 4-trimethylbenzene as well as
the pressure drop and temperature during benzene adsorption with MRAE of 2.6,
11.8, and 0.8%, respectively. The model also showed very good sensitivity to the
changes in operations variables such as temperature and superficial velocity of the
carrier gas, channeling, and adsorbent particle size. The competitive adsorption
model predicted the breakthrough profiles of binary and eight-component VOCs
mixtures with 13 and 12%, MRAE respectively while that of the adsorbed
amounts was 1 and 2%, respectively. These results indicate the accuracy of the
models to simulate a fixed bed adsorber and their potential to be used for
enhancing absorber design and optimization.

Acknowledgements
First and foremost I would like to express my sincere debt of gratitude to my
supervisor, Dr. Zaher Hashisho, for his dedication to the research, expertise,
supervision, and encouragement extended to me throughout my course work and
research. Dr. Zaher Hashisho’s support, guidance and valuable comments during
the thesis and paper writing are also greatly appreciated. I consider it an honor to
work with you.
Secondly I would like to acknowledge financial support for this research from
Ford Motor Company and the Natural Science and Engineering Research Council
(NSERC) of Canada. I also acknowledge the support of infrastructure and
instruments grants from Canada Foundation for Innovation (CFI), NSERC, and
Alberta Advanced Education and Technology.
Third, I would like to show my appreciation to the technical support staffs of the
Civil and Environmental Engineering Department at the University of Alberta:
Dale Lathe, Elena Dlusskaya and Chen Liang for their assistance and cooperation
during the research.
I also thank my fellows in the Air Quality Characterization and Control Lab for
their cooperation.
Finally I would like to thank my family, friends and anyone who directly or
indirectly have lent their helping hands in this venture.

Table of Contents
CHAPTER 1 INTRODUCTION ..................................................................... 1
1.1 Background ........................................................................................................ 2
1.2 Research Objectives .......................................................................................... 5
1.3 Thesis Outline .................................................................................................... 7
1.4 References .......................................................................................................... 8
CHAPTER 2 TWO-DIMENSIONAL MODELING OF VOLATILE
ORGANIC COMPOUNDS ADSORPTION ONTO BEADED
ACTIVATED CARBON ............................................................... 11
2.1 Introduction ...................................................................................................... 12
2.2 Model Development and Validation ............................................................. 13
2.2.1 Physical Model and Assumptions .................................................. 13
2.3 Governing Transport Phenomena .................................................................. 14
2.3.1 Adsorbate Mass Balance ................................................................ 14
2.3.2 Energy Balance .............................................................................. 17
2.3.3 Momentum Balance ....................................................................... 18
2.3.4 Initial/ Boundary Conditions and Input Parameters ...................... 19
2.3.5 Solution Method ............................................................................ 25
2.3.6 Experimental Method .................................................................... 26
2.4 Results and discussion .................................................................................... 28
2.4.1 Isotherm Parameters ...................................................................... 28
2.4.2 Model Validation ........................................................................... 30
2.4.3 Adsorbed Phase Concentration Distribution ................................. 32
2.4.4 Temperature Distribution ............................................................... 34
2.4.5 Pressure Distribution and Velocity Field ....................................... 36
2.4.6 Parametric Study ............................................................................ 37
2.4.6.1 Effect of Adsorbate Loading, Carrier Gas Temperature, and
Superficial Velocity .................................................................... 38
2.4.6.2 Effect of Particle Size .................................................................. 41

2.5 References ........................................................................................................ 44
CHAPTER 3 MODELING COMPETITIVE ADSORPTION OF
MIXTURES OF VOLATILE ORGANIC COMPOUNDS
(VOCS) ONTO BEADED ACTIVATED CARBON (BAC) ....... 48
3.1 Introduction ...................................................................................................... 49
3.2 Model Development and Validation ............................................................. 51
3.2.1 Physical Model .............................................................................. 51
3.3 Governing Transport Phenomena .................................................................. 52
3.3.1 Mass Balance for the Gas Phase .................................................... 53
3.3.2 Mass Balance for the Solid Phase .................................................. 53
3.3.3 Multicomponent Competitive Adsorption Isotherm ...................... 53
3.3.4 Energy Balance .............................................................................. 54
3.3.5 Momentum Balance ....................................................................... 54
3.3.6 Variable and parameters definition ................................................ 55
3.3.7 Initial and Boundary Conditions .................................................... 60
3.3.8 Method of Solution ........................................................................ 62
3.3.9 Experimental Methods ................................................................... 62
3.4 Results and Discussion ................................................................................... 64
3.4.1 Single Component Isotherm Parameters ....................................... 64
3.4.2 Binary Component (n=2) Adsorption ............................................ 68
3.4.3 Multicomponent (n=8) Adsorption ................................................ 73
3.5 References ........................................................................................................ 81
CHAPTER 4 CONCLUSION AND RECOMMENDATION ....................... 84
4.1 Conclusion ........................................................................................................ 85
4.2 Recommendation for Future Work ............................................................... 88
CHAPTER 5 APPENDICES ......................................................................... 90
APPENDIX A Derivation of Isotherm Equation for Competitive
Adsorption ........................................................................................................ 91
APPENDIX B Physical Properties of the Adsorbates ........................................ 95
References ................................................................................................................ 96

List of Tables
Table 2.1.Initial/ Boundary conditions and input parameters ............................... 20
Table 2.2. Model parameters................................................................................. 21
Table 2.3 Langmuir isotherm parameters ............................................................. 29
Table 3.1 Model variables and parameters ........................................................... 56
Table 3.2 Initial and boundary conditions ............................................................ 62
Table 3.3.Langmuir isotherm parameters ............................................................. 68

List of Figures
Figure 2.1. Linearized form of Langmuir isotherm to determine the isotherm
parameters for (a) acetone, (b) benzene (c) toluene (d) 1, 2, 4-
trimethybenzene (TMB). ...................................................................... 29
Figure 2.2. Comparison of the modeled and experimental breakthrough
curves of acetone, (b) benzene, (c) toluene and (d) 1,2,4-
trimethylbenzene on BAC. MRAE and RMSE were 2.0 and 1.2 %
for acetone, 0.4 and 1.1 % for benzene, 4.0% and 1.0 % for toluene,
and 4.0% and 0.7 % for TMB, respectively ......................................... 31
Figure 2.3. Solid-phase concentration of benzene on BAC indicating earlier
saturation at the bed periphery compared to the bed center. (a)
Progress in bed saturation with benzene over time and (b) the radial
adsorbed phase concentration of benzene in the mass transfer zone
(Z = 90 mm from the outlet, t= 33 min) ............................................... 33
Figure 2.4.Temperature distribution during adsorption on BAC: (a) bed
temperature profile 33 min after the start of benzene adsorption, (b)
radial temperature profile during adsorption of acetone, benzene,
toluene and 1,2,4-trimethylbenzene in the respective mass transfer
zone and (c) comparison of modelled and measured temperature
profile at the center of the reactor (r=0.0 cm, z= 8.0 cm) .................... 35
Figure 2.5. Variation of pressure and axial velocity in the bed during
adsorption of benzene at 33 min after the start of adsorption .............. 37
Figure 2.6 (a) Effect of carrier gas temperature on benzene breakthrough, (b)
modeled effect of inlet benzene concentration on bed temperature,
and (c) modeled effect of superficial velocity on benzene
breakthrough curve ............................................................................... 40
Figure 2.7. Effect of halving and doubling the adsorbent particle size (base
case, dp = 0.75mm) on adsorption dynamics of benzene: (a)
breakthrough profile; (b) radial velocity profile at the mass transfer
zone; and (c) bed pressure drop ............................................................ 43

Figure 3.1 Calculation of Langmuir isotherm parameters for individual
compounds (a) 1,2,4-trimethylbenzene, (b) 2,2-
dimethylpropylbenzene, (c) indane, (d) decane, (e) 2-butoxy
ethanol, (f) 2-hepatnone, (g) heptane, (h) n-butyl acetate, and (i) n-
butanol. ................................................................................................. 67
Figure 3.2. Competitive adsorption of decane and heptane (a) comparison of
experimental 3 and modelled breakthrough curves, (b) comparison
of amount adsorbed 300 min after the start of adsorption of each
component with the measure data 3 and (c) adsorbed phase two-
dimensional concentration distribution at 45, 75 and 180 min after
the start of adsorption ........................................................................... 73
Figure 3.3 Competitive adsorption of n-butanol, n-butyl acetate, 2-heptanone,
2-butoxyethanol, decane, indane, 2, 2-dimethylpropylbenzene
(DMPB), and 1, 2, 4-trimethylbenzene (TMB); (a) comparison of
experimental 3 and modelled breakthrough curves and (b)
comparison of experimental 3 and modelled masses adsorbed of
each adsorbate 390 min after the start of adsorption ............................ 77
Figure 3.4. Adsorbed phase concentration distribution of 1, 2, 4-
trimethylbenzene (1), 2, 2-dimethylpropylbenzene (2), indane (3),
decane (4), 2-butoxyethanol (5), 2-heptanone (6) n-butyl acetate (7)
and n-butanol (8), (a) 75 and (b) 105 min after the start of
adsorption. ............................................................................................ 79

1
CHAPTER 1 INTRODUCTION
2
1.1 Background
The definition of volatile organic compound (VOCs) varies among regulatory
systems depending on whether the emphasis is on their impact to the environment
or directly to human health. For example the United states Environmental
Protection Agency (USEPA) defines VOC as “any compound of carbon,
excluding carbon monoxide, carbon dioxide, carbonic acid, metallic carbides or
carbonates, and ammonium carbonate, which participates in atmospheric
photochemical reactions” 1. The Canadian Environmental Protection Act (CEPA)
on the other hand, giving emphasis to commonly encountered VOCs that would
have an effect on air quality, defines VOCs as “carbon-containing gases and
vapors such as gasoline fumes and solvents excluding carbon dioxide, carbon
monoxide, methane, and chlorofluorocarbons” 2. The World Health Organisation
defines VOC as any organic compound whose boiling point is in the range from
(50-100°C) to (240-260°C) 3 and the European Union on defines VOC as “any
organic compound having an initial boiling point less than or equal to 250 °C
measured at a standard atmospheric pressure of 101.3 kPa and can do damage to
visual or audible senses” 2. The last definition seems to include most VOCs of
environmental concern and those that have direct health effect on human beings.
VOCs are emitted to the atmosphere from natural (biogenic) and anthropogenic
sources. Natural sources of VOCs include forests, wetlands, oceans and volcanoes
4. The most common anthropogenic sources of VOCs are vehicular emission,
chemical manufacturing facilities, refineries, factories, consumer, commercial
products and others. 5 Automotive painting operation is the main source of VOCs

3
emissions in the automotive manufacturing industry 6,
7. VOCs emission from
automotive painting consists of a mixture of high and low molecular weight
organic compounds including aromatic hydrocarbons, esters, ketones, alcohols,
and glycol ethers 7,
6. It was reported that that 6.58 kg of VOCs is used as paint
solvents per vehicle in a typical automotive plant in North America 7.
VOCs are of a concern because of their health and environmental impacts. Some
VOCs degrade in the troposphere to produce different secondary pollutants that
may be harmful to human health as well as to the environment 8, 9
. Some others
are known to be carcinogenic or react in the atmosphere to form mutagenic or
carcinogenic species 10
. Prolonged exposure to some VOCs could result in
damage to liver and central nervous system 7,
11,
12
. VOCs also plays a major role
in the formation of photochemical smog and various toxic by-products under
sunlight 13
14
which in turn leads to respiratory effects in humans, visibility
problems and cause damage to building materials and vegetation. For these
reasons, environmental legislation requires elimination or control of large portion
of VOC emission produced during different industrial activities 15
and this
requires improved and efficient abatement methods, particularly for the treatment
of dilute VOC-laden air streams 15
.
Technologies generally considered in end of pipe control of VOCs emission
include incineration, absorption, adsorption, catalytic and thermal oxidation,
condensation, biofiltration and membrane separation 11,
16,
17,
18,
19,
20,
21
.
Adsorption is a widely used method for VOC control because of its low cost and
high capturing efficiency even at very low concentrations compared to other

4
VOCs control methods 6,
13,22, 23
. In addition, adsorption is a non-destructive
control method allowing for the recovery of VOCs for possible recycle and reuse.
Fixed-bed adsorption is one of the most widely used industrial and small scale air
pollution control processes. Fixed bed adsorbers could be used to treat VOC-
containing air streams over a wide range of flow rate, (several hundreds to
hundreds thousands of cubic feet per minute) and VOCs concentrations (as low as
several parts per billion by volume (ppbv)) 24,
25
. Hence, optimizing the design
and operation conditions of the fixed-bed adsorber is evidently important to
improve the efficiency and reduce the cost of VOC control.
The basis for traditional design and optimization approach of adsorption systems
is the experimental data obtained with pilot scale systems. This approach could
rarely be used to predict the response of the unit to variables other than those
specifically tested for in a pilot scale system and it is also difficult to extrapolate
the design to other applications 26
. Therefore, pilot plant design is usually
expensive and time consuming. However, validated mathematical model can be
used to facilitate the design and optimization of the adsorber by reducing the
number of pilot scale testes required to evaluate various operation conditions
which also reduces the related time and costs 27
. Once validated, mathematical
models can also be used to predict response or sensitivity of the adsorber to
changes in variables that can`t be easily measured 26, 28
. Earlier studies 29, 30, 31, 32,
33 that modeled VOC adsorption in a fixed bed adsorber focused on axial variation
of adsorption and flow parameters. However, such a one-dimensional approach
for simulating a fixed bed can have limited accuracy of prediction. Comparison of

5
results from experiments and one dimensional model of fixed bed adsorbers
indicates the need for at least a two dimensional (radial and axial) model to
simulate transport phenomena in a fixed bed adsorber 34
. The concentration wave
fronts at the center and periphery of a fixed bed differ significantly when the ratio
of column diameter to particle size is less or equal to 30 34,35, 36
. It was also
suggested that the channeling effect is significant even for a larger ratio of column
diameter to the particle size 34, 37, 38
. Therefore, one-dimensional models are not
sufficient to accurately describe transport phenomena in a fixed bed adsorber and
a two dimensional (2D) model is needed 39, 40, 41
.
Previous studies on modelling of dynamic adsorption of competing adsorbates
focused on binary 42, 43 44
or ternary 45, 46
mixtures. However, most industrial
emissions usually consist of mixture of more than three adsorbates, as is the case
of emission from automotive painting booths 7,
47
. Hence, there is a need for
developing a mathematical model that can accurately predict competitive
adsorption of mixtures of large number of adsorbates. A comprehensive model for
the study of adsorption process consists of the model for the analysis of dynamic
adsorption (a macroscopic mass, energy and momentum conservation equations)
and the equilibrium adsorption (isotherm equations). These two sets of models
should be coupled and solved together.
1.2 Research Objectives
The goal of this research is to develop and validate a fully predictive two-
dimensional mathematical model to study the process of adsorption of VOCs,

6
commonly emitted from automotive painting operations onto a fixed bed of
beaded activated carbon (BAC). Hence, the following objectives can be described.
Modeling and validation of the adsorption of single component VOC
streams which will be done by (a) developing a fully predictive 2D
mathematical model to solve the transport phenomena in a fixed bed
adsorber during adsorption of VOC and validating the model with
experimentally measured data for adsorption of various VOCs selected
based on their molecular weight and or boiling point; and (b)
performing sensitivity analysis to study the model response to changes
in the adsorber’s operation parameters and adsorbent properties.
Modeling and validation of competitive adsorption of mixture of VOCs
onto BAC which will be done by developing (a) a multicomponent
competitive adsorption isotherm model that can predict equilibrium
adsorption of n-component VOCs mixture using single-component
isotherm parameters; (b) a fully predictive two-dimensional transient
mathematical model for the transport of mass, energy and momentum
during the competitive adsorption of n-component VOCs mixture onto
a fixed bed of BAC.
These objectives will be achieved by modeling a small scale fixed-bed adsorber
and conducting experiments using a similar set up and conditions to validate the
model.

7
This research is significant for the study of VOCs adsorption because: (1) the
model developed is fully predictive and could be used to significantly reduce the
number of experiments needed and related costs for the design of new fixed bed
adsorbers and optimization of the existing ones. (2) The model is sensitive to
operation parameters and adsorbent property so it could be used for screening
purpose during preliminary study and/ or to investigate the optimum operation
condition. (3) The competitive adsorption model developed could be used to study
adsorption of complex mixture of VOCs regardless of the number of components
which is very important to enhance the understanding of competitive adsorption
(4) The isotherm equation model developed can be used to predict the equilibrium
capacity of the adsorbent for each component of the mixture during competitive
adsorption using single component isotherm parameters alone. Overall this
research is very important to increase our understanding of adsorption process in a
fixed bed of porous adsorbent.
1.3 Thesis Outline
The thesis consists of four chapters, each of which will contribute to the main goal
of the study. The second chapter focuses on the modelling and validation of
adsorption of single component adsorbates from gaseous stream. Chapter 3
presents details on the modelling and validation of competitive adsorption of a
mixture of VOCs. The second and the third chapters also review previous
researches conducted in the area of study. Chapter 4 presents the conclusions and
the implication of the results to the field of VOC control.

8
1.4 References
1. USEPA Definition of Volatile Organic Compounds (VOC), last upadated,
2009. http://www.epa.gov/ttn/naaqs/ozone/ozonetech/def_voc.htm
(accessed 20/08/2013 ),
2. Directive 2004/42/CE of the European Parliament and the Council, 2004.
http://eur-
lex.europa.eu/LexUriServ/LexUriServ.do?uri=OJ:L:2004:143:0087:0096:E
N:PDF (accessed 20/08/2013),
3. Berenjian, A.; Chan, N.; Malmiri, H. J., Volatile Organic Compounds
removal methods: A review. American Journal of Biochemistry and
Biotechnology 2012, 8, (4), 220-229.
4. Guenther, A., A global model of natural volatile organic compound
emissions. Journal of Geophysical Research 1995, 100, (D5), 8873-8892.
5. Piccot, S. D.; Watson, J. J.; Jones, J. W., A global inventory of volatile
organic compound emissions from anthropogenic sources. Journal of
Geophysical Research 1992, 97, (D9), 9897-9912.
6. Golovoy, A.; Braslaw, J., Adsorption of automotive paint solvent on
activated carbon. I. Equilibrium adsorption of single vapors. Journal of the
Air Pollution Control Association 1981, 31, (8), 861-865.
7. Kim, B. R., VOC emissions from automotive painting and their control: A
review. Environmental Engineering Research 2011, 16, (1), 1-9.
8. Wayne, R. P., Chemistry of Atmospheres. Clarendon: Oxford, 1991.
9. Finaly-Pitts, B. J., Pitts, J.N, Atmospheric Chemistry: Fundamentals and
Experimental Techniques Wiley: New York, 1986.
10. Strauss, W., Mainwarning, S. J., Air Pollution. Edward Arnold: London,
1984.
11. Johnsen, D. L.; Mallouk, K. E.; Rood, M. J., Control of electrothermal
heating during regeneration of activated carbon fiber cloth. Environmental
Science and Technology 2011, 45, (2), 738-743.
12. Alcañiz-Monge, J.; Pérez-Cadenas, M.; Marco-Lozar, J., Removal of
harmful volatile organic compounds on activated carbon fibres prepared by
steam or carbon dioxide activation. Adsorption Science and Technology
2012, 30, (6), 473-482.
13. Das, D.; Gaur, V.; Verma, N., Removal of volatile organic compound by
activated carbon fiber. Carbon 2004, 42, (14), 2949-2962.
14. Nevers, N.D, Air Pollution Control Engineering. Mc-Graw-Hill: Singapore,
2000.
15. Mota, J.P., Lyubchik, S. (eds), Recent Advances in Adsorption Processes for
Environmental Protection and Security. Springer: The Netherlands, 2008.
16. Parmar, G. R.; Rao, N. N., Emerging control technologies for volatile
organic compounds. Critical Reviews in Environmental Science and
Technology 2009, 39, (1), 41-78.
17. Leethochawalit, M.; Bustard, M. T.; Wright, P. C.; Meeyoo, V., Novel
vapor-phase biofiltration and catalytic combustion of volatile organic

9
compounds. Industrial and Engineering Chemistry Research 2001, 40, (23),
5334-5341.
18. Li, C.; Moe, W. M., Activated carbon load equalization of discontinuously
generated acetone and toluene mixtures treated by biofiltration.
Environmental Science and Technology 2005, 39, (7), 2349-2356.
19. Kim, K. J.; Kang, C. S.; You, Y. J.; Chung, M. C.; Seung, W. J.; Jeong, W.
J.; Woo, M. W.; Ahn, H. G., Adsorption-desorption characteristics of
modified activated carbons for volatile organic compounds 2006; Vol. 159,
pp 457-460.
20. Kim, K. J.; Kang, C. S.; You, Y. J.; Chung, M. C.; Woo, M. W.; Jeong, W.
J.; Park, N. C.; Ahn, H. G., Adsorption-desorption characteristics of VOCs
over impregnated activated carbons. Catalysis Today 2006, 111, (3-4), 223-
228.
21. Hashisho, Z.; Emamipour, H.; Cevallos, D.; Rood, M. J.; Hay, K. J.; Kim,
B. J., Rapid response concentration-controlled desorption of activated
carbon to dampen concentration fluctuations. Environmental Science and
Technology 2007, 41, (5), 1753-1758.
22. Ramos, M. E.; Bonelli, P. R.; Cukierman, A. L.; Ribeiro Carrott, M. M. L.;
Carrott, P. J. M., Adsorption of volatile organic compounds onto activated
carbon cloths derived from a novel regenerated cellulosic precursor. Journal
of Hazardous Materials 2010, 177, (1-3), 175-182.
23. Shonnard, D. R.; Hiew, D. S., Comparative environmental assessment of
VOC recovery and recycle design alternatives for a gaseous waste stream.
Environmental Science and Technology 2000, 34, (24), 5222-5228.
24. Calvert, S. A. E., Harold M. (eds.), Handbook of Air Pollution Control
Technology,. John Wiley & Sons: New York, 1984.
25. Handbook of Chemistry and Physics. 54th
Edition ed.; The Chemical Rubber
Company: Cleveland.
26. Weber, W. J.; Smith, E. H., Simulation and design models for adsorption
processes. Environmental Science & Technology 1987, 21, (11), 1040-1050.
27. Thomas, W. J.; Crittenden, B. D., Adsorption technology and design.
Butterworth-Heinemann: Oxford Boston Johannesburg, 1998.
28. Xu, Z.; Cai, J. G.; Pan, B. C., Mathematically modeling fixed-bed
adsorption in aqueous systems. Journal of Zhejiang University: Science A
2013, 14, (3), 155-176.
29. Fournel, L.; Mocho, P.; Brown, R.; Le Cloirec, P., Modeling breakthrough
curves of volatile organic compounds on activated carbon fibers. Adsorption
2010, 16, (3), 147-153.
30. Joly, A.; Perrard, A., Linear driving force models for dynamic adsorption of
volatile organic compound traces by porous adsorbent beds. Mathematics
and Computers in Simulation 2009, 79, (12), 3492-3499.
31. Murillo, R.; García, T.; Aylón, E.; Callén, M. S.; Navarro, M. V.; López, J.
M.; Mastral, A. M., Adsorption of phenanthrene on activated carbons:
Breakthrough curve modeling. Carbon 2004, 42, (10), 2009-2017.
32. Puértolas, B.; López, M. R.; Navarro, M. V.; López, J. M.; Murillo, R.;
García, T.; Mastral, A. M., Modelling the breakthrough curves obtained
10
from the adsorption of propene onto microporous inorganic solids.
Adsorption Science and Technology 2010, 28, (8-9), 761-775.
33. Chuang, C. L.; Chiang, P. C.; Chang, E. E., Modeling VOCs adsorption
onto activated carbon. Chemosphere 2003, 53, (1), 17-27.
34. Mohamadinejad, H.; Knox, J. C.; Smith, J. E., Experimental and Numerical
Investigation of Two-Dimensional CO2 Adsorption/Desorption in Packed
Sorption Beds Under Non-ideal Flows. Separation Science and Technology
2003, 38, (16), 3875-3904.
35. Cohen, Y.; Metzner, A. B., Wall effects in laminar flow of fluids through
packed beds. AIChE Journal 1981, 27, (5), 705-715.
36. Yin, F.; Wang, Z.; Afacan, A.; Nandakumar, K.; Chuang, K. T.,
Experimental studies of liquid flow maldistribution in a random packed
column. Canadian Journal of Chemical Engineering 2000, 78, (3), 449-457.
37. Cohen, Y.; Metzner, A. B., Wall effects in laminar flow of fluids through
packed beds. AIChE Journal 1981, 27, (4), 705-715.
38. Cohen, Y.; Metzner, A. B., Wall effects in laminar flow of fluids through
packed beds. AIChE J. 1981, 27, (4 ),.705-715.).
39. Benenati, R. F.; Brosilow, C. B., Void fraction distribution in beds of
spheres. AIChE Journal 1962, 8, (3), 359-361.
40. Vortmeyer, D.; Winter, R. P., Improvement in reactor analysis incorporating
porosity and velocity profiles. German Chemical Engineering 1984, 7, (1),
19-25.
41. Schwartz, C. E.; Smith, J. M., Flow distribution in packed beds. Industrial
& Engineering Chemistry 1953, 45, (6), 1209-1218.
42. Lillo-Ródenas, M. A.; Fletcher, A. J.; Thomas, K. M.; Cazorla-Amorós, D.;
Linares-Solano, A., Competitive adsorption of a benzene-toluene mixture
on activated carbons at low concentration. Carbon 2006, 44, (8), 1455-
1463.
43. Ahmed, M. J.; Mohammed, A. H. A. K.; Kadhum, A. A. H., Modeling of
breakthrough curves for adsorption of propane, n-butane, and Iso-butane
mixture on 5A molecular sieve zeolite. Transport in Porous Media 2011,
86, (1), 215-228.
44. Gironi, F.; Piemonte, V., VOCs removal from dilute vapour streams by
adsorption onto activated carbon. Chemical Engineering Journal. 2011,
172, (2–3), 671-677.
45. Lu, L.; Wang, Q.; Liu, Y., Adsorption and separation of ternary and
quaternary mixtures of short linear alkanes in zeolites by molecular
simulation. Langmuir 2003, 19, (25), 10617-10623.
46. To, P. C.; Mariñas, B. J.; Snoeyink, V. L.; Wun, J. N., Effect of pore-
blocking background compounds on the kinetics of trace organic
contaminant desorption from activated carbon. Environmental Science and
Technology 2008, 42, (13), 4825-4830.
47. Wang, H.; Jahandar Lashaki, M.; Fayaz, M.; Hashisho, Z.; Philips, J. H.;
Anderson, J. E.; Nichols, M., Adsorption and desorption of mixtures of
organic vapors on beaded activated carbon. Environmental Science and
Technology 2012, 46, (15), 8341-8350.

11
CHAPTER 2 TWO-DIMENSIONAL MODELING OF
VOLATILE ORGANIC COMPOUNDS ADSORPTION
ONTO BEADED ACTIVATED CARBON
A version of this chapter was accepted for publication in Environmental Science
& Technology, http://pubs.acs.org/doi/abs/10.1021/es402369u. Reproduced with
permission from Dereje Tamiru Tefera, Masoud Jahandar Lashaki,
Mohammadreza Fayaz, Zaher Hashisho, John H. Philips, James E. Anderson,
Mark Nichols. 2013

12
2.1 Introduction
Adsorption onto activated carbon has been widely used for controlling emissions
of volatile organic compounds (VOCs) at low concentration because of its cost
effectiveness, high capturing efficiency and regenerability of the adsorbent for
reuse 1, 2
. The fixed bed is one of the most widely used reactor configuration both
in small and large scale VOC adsorption units. Therefore, detailed knowledge of
transport phenomena in such an adsorber is essential for its proper design,
performance analysis and optimization. Earlier studies 3, 4, 5, 6, 7
that modeled fixed
bed absorber dynamics in the gas-phase focused on axial variation of adsorption
and flow parameters. However, there is still a need for models that can accurately
predict the two dimensional variation of transport variables, particularly during
adsorption from dilute gas streams. Experimental investigations have confirmed
that conventional one-dimensional models are not sufficient to describe transport
phenomena in a fixed bed adsorber due to the radial variation of flow dynamics in
addition to the axial one 8, 9, 10
. The temperature, velocity, and concentration
gradients in the radial direction are significant and need to be accounted for,
particularly when the particle to bed diameter ratio is less than 30 11, 12
.
Daszkowski and Eingenberger 13
also showed that the radial heat transfer could be
accurately modelled only if radial flow variation is taken into account.
Measurements of radial velocity and concentration profiles showed significant
difference between the center and periphery of the reactor 14,15,
. Measuring radial
variation of flow parameters is difficult. Therefore, developing a mathematical
model that can accurately predict the two dimensional variation of transport

13
phenomena during adsorption of VOCs, particularly from dilute gas streams, is
useful for improved design and optimization of fixed bed absorbers.
Automotive painting booths are the main source of VOCs emission during vehicle
manufacturing. These emissions, which are typically captured using adsorption,
consist of organic compounds, which contain different functional groups, and
have a range of boiling points, and adsorption and desorption properties 16, 17
.
Hence it is useful to understand adsorption dynamics of VOCs and the effect of
operation conditions on the adsorber performance. The main objective of this
study is to develop a comprehensive model that can accurately simulate transport
phenomena during VOC adsorption in a fixed bed adsorber. For this purpose, a
two-dimensional model, solved using the finite element method, was developed
and validated using measured data. The model was also used to examine the effect
on the adsorber performance of variation of relevant operation conditions, such as
adsorbate loading, carrier gas temperature, pressure drop, and adsorbent particle
size.
2.2 Model Development and Validation
2.2.1 Physical Model and Assumptions
The simulated adsorber consisted of a reactor with a 0.76 cm inner radius (R)
containing a 12 cm long fixed-bed of BAC with 0.75 mm mean particle diameter
(dp). A 10 standard liters per minute (SLPM) air stream containing 1000 ppmv of
the VOC entered from the top of the reactor at a superficial velocity (Vs) of 0.914
m/s and exited from the bottom of the reactor. Major assumptions used in model

14
development include negligible variation of flow properties in the angular
direction, negligible adsorption of the carrier gas, ideal gas behavior, and
symmetric flow condition and geometry along the adsorber center plane.
2.3 Governing Transport Phenomena
2.3.1 Adsorbate Mass Balance
Derivation of the governing equation for the mass transport is based on the
concept that the fixed bed of porous adsorbent particles consists of a stationery
(solid adsorbent) phase and a mobile (gas) phase. The adsorbate is transported in
the mobile phase by convection and dispersion. The advection-dispersion
transport equation is derived based on the conservation of adsorbate mass flux
entering and leaving a small representative element of the bed (equation 2.1).
Definition and value of the model input parameters and variables are presented in
Table 2.2.
( ) ( ) .............................................................................. 2.1
The bed porosity, , varies with radial distance from the reactor center (equations
2.2, 2.3, and 2.4) 18
( (
)) .............................................................................................. 2.2
where
( )
................................................................................................ 2.3
f =
............................................................................................................................................. 2.4
and D = |
| ...................................................................................................................... 2.5

15
where the radial and axial mass dispersion coefficients 19, 14
are given by equations
2.6a and 2.6b, respectively.
(
)
............................................................................................................ 2.6a
(
)
........................................................................................................ 2.6b
The governing transport equation in the solid phase (adsorbent) is similar to that
in the gas phase except that the contribution of convection and dispersion to the
adsorbate transport is negligible and the main mass transport takes place by
diffusion of the adsorbate in the porous adsorbent particles. Such diffusive
transport takes place by pore and /or surface diffusion which can be modelled at
individual particle level, but is time and computationally intensive. Alternatively,
an approximation using the linear driving force (LDF) 20
model can be used
(equation 2.7) to describe the diffusion of the adsorbate in the adsorbent. The LDF
has similar accuracy to more complex diffusion models in predicting mass
transfer in the adsorbent particle 20-29
. Coupling of the solid and gas phase
governing equations is made through source/sink terms, whereby the mass sink in
the gas phase is equal to the mass source in the solid phase.
........................................................................................................................................... 2.7
is proportional to the adsorbed phase concentration gradient and mass transfer
will take place until equilibrium is reached (equation 2.8).
( ) .................................................................................................................... 2.8
= ........................................................................................................................................ 2.9

16
The overall mass transfer coefficient, Kov, accounts for the external (gas-solid
interface) diffusion, pore diffusion and surface diffusion mass transfer
resistances19
:
......................................................................................................................... 2.10
............................................................................................................................... 2.11
...................................................................................................................................... 2.12
.......................................................................................................................................... 2.13
The effective diffusion coefficient is the resultant of molecular and Knudsen
diffusion coefficients:
............................................................................................................................ 2.14
where DAB 30
and Dk 31
are expressed as:
√
((∑ )
(∑ )
) ........................................................................ 2.15
√
...................................................................................................................... 2.16
A temperature-dependent Langmuir isotherm (equation 2.17) was used to model
the equilibrium condition because of its accuracy at low concentration 32
.
.................................................................................................................................... 2.17
(
) ............................................................................................................. 2.18

17
2.3.2 Energy Balance
In balancing the energy fluxes from and into a small representative element of the
bed, two basic assumptions were made, namely thermal homogeneity between the
solid and gas phases and negligible viscous heat dissipation. Heat transport takes
place by convection and diffusion (equation 2.19), similar to mass transport.
. ( ) = ............................................................................ 2.19
The effective heat capacity of the solid and gas phases, is calculated using
equation 2.20.
= (1- ) + .............................................................................................. 2.20
Kef is the symmetric thermal diffusion tensor:
= |
| ........................................................................................................................ 2.21
The axial and radial thermal dispersion coefficients (Kax and Kr) account for the
stagnant bed conductivity, Kb, and the effect of convection on the thermal
conductivity (the second term in equations 2.22a and 2.22b)18
.
Kr
. ................................................................................................................. 2.22a
Kax
................................................................................................................. 2.22b
Kb ( ) ......................................................................................................... 2.23
Because other sources such as viscous dissipation are considered negligible, the
main heat source to the system during adsorption is the heat of adsorption
(equation 2.24):
( )
....................................................................................................................... 2.24

18
The heat of adsorption is dependent on the properties of the adsorbate and
adsorbent 33
:
= ...... 2.25
2.3.3 Momentum Balance
The gas is assumed Newtonian and its flow behavior in porous media depends on
properties of the solid matrix and the flowing gas and the flow velocity. The
porous matrix is stationery and its linear momentum is negligible hence the most
significant interaction forces contributing to momentum dissipation are the
friction forces that the gas encounters at the boundaries of the pore. In this study,
a modified momentum balance equation (equation 2.26) which accounts for Darcy
and Brinkman viscous terms, Forchheimer inertial term, and Navier–Stokes’
convective term 18
was used to model the non-Darcy gas flow in the BAC.
((
) ( )
) = + .................................................................... 2.26
where the shear stress is defined in terms of gas viscosity (equation 2.27).
J = (
( ( )
( ) )) ........................................................................ 2.27
The momentum sink of the flow in a fixed bed of porous adsorbent is accounted
for by Darcy’s friction loss, Forchheimer’s inertial term, and an adsorption sink:
S = (
| |
) ............................................................................................................ 2.28
The continuity equation accounts for the compressibility of the gas and an
adsorption sink:

19
( )
( ) = Sm ............................................................................................................ 2.29
The bed permeability (K) is a function of particle diameter and bed porosity 18
K=
( ) .................................................................................................................................. 2.30
Forchheimer’s drag coefficient ( ) is a function of bed permeability and particle
and bed diameter 18
:
√ ....................................................................................................................................... 2.31
=0.55( (
)) ......................................................................................................... 2.32
2.3.4 Initial/ Boundary Conditions and Input Parameters
For mass transfer, a concentration boundary condition (BC) at the inlet and a flux
boundary condition at the outlet were used. For heat transfer, a temperature
boundary condition at the inlet, a constant flux (outflow) boundary condition at
the outlet, and a convective heat flux at the wall were specified. For momentum
balance, a normal velocity boundary condition at the inlet and an atmospheric
pressure were specified at the outlet Table 2.1.

20
Table 2.1.Initial/ Boundary conditions and input parameters
Physics Inlet
(Z=H)
Outlet (Z=0) Adsorber wall
(r=R)
Initial
condition
(t=0)
Mass transfer c=
=
Boundary flux
( )=0
( ) =0
Zero flux c=0
=0
Heat transfer T=Tinlet ( )=0 ( ) T=295K
Momentum
transfer
=0.914
m/s
P=1 atm No slip P=1 atm
u=0
Parameters used in the current simulation and their respective sources are
provided in Table 2.2.

21
Table 2.2. Model parameters
Parameter Description Value /equation Units Source
b Temperature-
dependent
Langmuir affinity
coefficient
m
3/kg
32
Pre-exponential
constant in
Langmuir isotherm
Table 2.2 m3/kg
c Gas phase
concentration
kg/m3 Equation 2.1
Empirical
correction factor
for Forchheimer’s
drag coefficient
calculation
1 Equation
2.32
Inlet gas
concentration
1000 ppmv Table 2.1
cs Adsorbed phase
concentration
kg/m3 Equation 2.7
cse Equilibrium
adsorbed phase
concentration
kg/m3 Equation 2.9
cso Adsorbed phase
concentration
equilibrium with
inlet gas phase
concentration.
kg/m3 Equation
2.10
Gas heat capacity 2 (
)
J/kg.K 34
Adsorbent particle
heat capacity
706.7 J/kg.K 35
Effective
volumetric heat
capacity of the
solid-gas system
J/(m3.K) Equation
2.20
D Symmetric mass
dispersion tensor
cm2/s Equation 2.5
Molecular
diffusivity of the
adsorbate in air
cm2/s Equation
2.15
Dax Axial dispersion
coefficient
cm2/s Equation
2.6b

22
Reactor diameter 0.01524 m Measured
Deff Effective diffusion
coefficient
cm2/s Equation
2.14
Dk Knudsen diffusivity cm2/s Equation
2.16
dp Average particle
diameter
0.00075 m 17
Dr Radial dispersion
coefficient
m2/s Equation
2.6a
F Body force N/m3
Equation
2.26
Heat of adsorption kJ/mol Equation
2.25
Adsorbate heat of
vaporization
kJ/mol 33-35
J Shear stress N/m2
Equation
2.27
K Bed permeability m2 Equation
2.30
Axial thermal
diffusion
coefficient
W/m.K Equation
2.22b
Stagnant bed
thermal
conductivity
W/m.K Equation
2.23
kef Symmetric thermal
diffusion
coefficient
W/m.K Equation
2.21
kf Air thermal
conductivity T
0.00039333
W/m.K 36
Overall mass
transfer coefficient
1/s Equation
2.10
Adsorbent particle
thermal
conductivity
W/m.K 37
Radial thermal
diffusion
coefficient
W/m.K Equation
2.22a
Wall heat transfer
coefficient
+0.054
(
)
1 38

23
IP Ionization potential eV 33
MA and
MB
Molecular weight
of adsorbate and
air, respectively
g/mol
N Number of data
points
Pressure Pa Equation
2.26
Molecular Peclet
number for heat
transfer
1 39
Prandtl number
1 38
qe Adsorbent
equilibrium
capacity
g/g Equation
2.17
qm Adsorbent
maximum
equilibrium
capacity
g/g Table 2.3
r Variable radial
distance
m
R Radius of the
adsorber
⁄ m
Rep Particle Reynolds
number
1 19
Rg Ideal gas constant 8.314 J/(mol.K)
S Momentum sink N/ m3
Sc Schmidt number
1
19
Heat source J/(m3.s) Equation
2.24
Mass sink kg/(m3.s) Equation 2.1
t Adsorption time s Equation 2.1
T Temperature K Equation
2.19
Tinlet Gas inlet
temperature
300 K BC1
Wall temperature 295 K BC1
u Gas flow velocity
vector
m/s Equation
2.26

24
| | Resultant velocity m/s Equation
2.28
Adsorbent pore
volume
0.57 cc/g Measured
Superficial velocity
( )
m/s Calculated
Average micropore
width
1.02 nm Measured
Z Axial distance m
Greek Symbols
Parameter Description Value /equation Unit Source
α Polarizability (cm3x10
-
24)
33
Empirical
correction factor
for mass diffusion
terms
20 1 19
Forchheimer’s
drag coefficient
kg/m4 Equation
2.31
γ Surface tension mN/m 33
Bulk bed porosity 1 Equation 2.3
Particle porosity 1 Equation
2.11
Bed porosity as a
function of radial
distance from the
center
Equation 2.2
Gas viscosity Pa.s COMSOL
material
database
Bulk bed density 606 kg/m3 Measured
Gas density kg/m3
COMSOL
material
database
Particle density kg/m3 Equation
2.12

25
Particle tortuosity 1 Equation
2.13
(∑ ) (∑ )
Atomic diffusion
volumes
1 30
2.3.5 Solution Method
Simulation of the coupled mass, energy and momentum balance and constitutive
equations was performed using COMSOL Multiphysics version 4.3a where the
developed governing equations were solved numerically using the finite element
method.
COMSOL’s built-in models for mass transfer in a porous adsorbent assume
instantaneous equilibrium between the gas and the adsorbent and negligible mass
transfer resistance, which is not the case for adsorption from dilute streams where
the mass transfer resistance is significant. Hence, simulation of mass transfer was
performed using equation-based modelling through COMSOL’s PDE interface
and coupled to the built-in energy and momentum transport models.
Best modeling practices suggest the use of higher order elements; at least second
order element and even higher order element should be used for convective term
to avoid solution instability 40-42
. In this study a second-order element for
concentration, temperature and pressure and a third-order element for velocity
field were used with systematic mesh refinement until a grid-independent solution
was obtained, as confirmed by the calculated 0.42% relative error in concentration
using 13,847 elements and 26,772 elements.

26
2.3.6 Experimental Method
To validate the model, breakthrough experiments were performed using four
selected VOCs. A stainless steel tube with a 0.76 cm inner radius and a height of
15 cm was filled with 13.3 g of microporous BAC. The reactor was loaded in such
a way that the net height of the BAC bed was 12 cm. A 1.5 cm thick glass wool
layer was used at the top and bottom of the reactor to support the bed. The effect
of the glass wool layer on the flow and adsorption was considered negligible. The
BAC had a BET area of 1390 m2/g, micropore volume of 0.51 cm
3/g, and total
pore volume of 0.57 cm3/g. The concentration at the outlet of the reactor was
measured using a flame ionization detector (FID) (Baseline Mocon, Series 9000).
For the validation of the temperature profile a 0.9 mm thermocouple (Omega) was
inserted at the center of the reactor to measure instantaneous temperatures during
adsorption. The pressure drop across the adsorbent bed during adsorption was
determined as the difference between the pressure drop across the reactor
(measured with a mass flow controller, Alicat Scientific) with and without the
BAC.
To determine the Langmuir model parameters, the adsorption isotherms for
acetone, benzene, and toluene were determined gravimetrically using a sorption
analyzer (TA Instruments, model VTI-SA) at 25°C and nitrogen as carrier gas. A
detailed description of the experimental set-up was presented elsewhere17
. The
system logged the equilibrium weight of the BAC sample (3–5 mg) in response to
a step change in the concentration of the adsorbate in the carrier gas. The
27
equilibrium was assumed to be reached when the weight change is less than 0.001
wt percent in 5 min. For 1, 2, 4-trimethybenzene, the isotherm was obtained by
completing a mass balance on a reactor loaded with 7g of BAC and adsorbing at
250, 500 and 1000 ppmv of 1, 2, 4-trimethybenzene in a 10 SLPM air stream at
25oC. The adsorption setup and method is similar to the one used in the model
validation experiments.
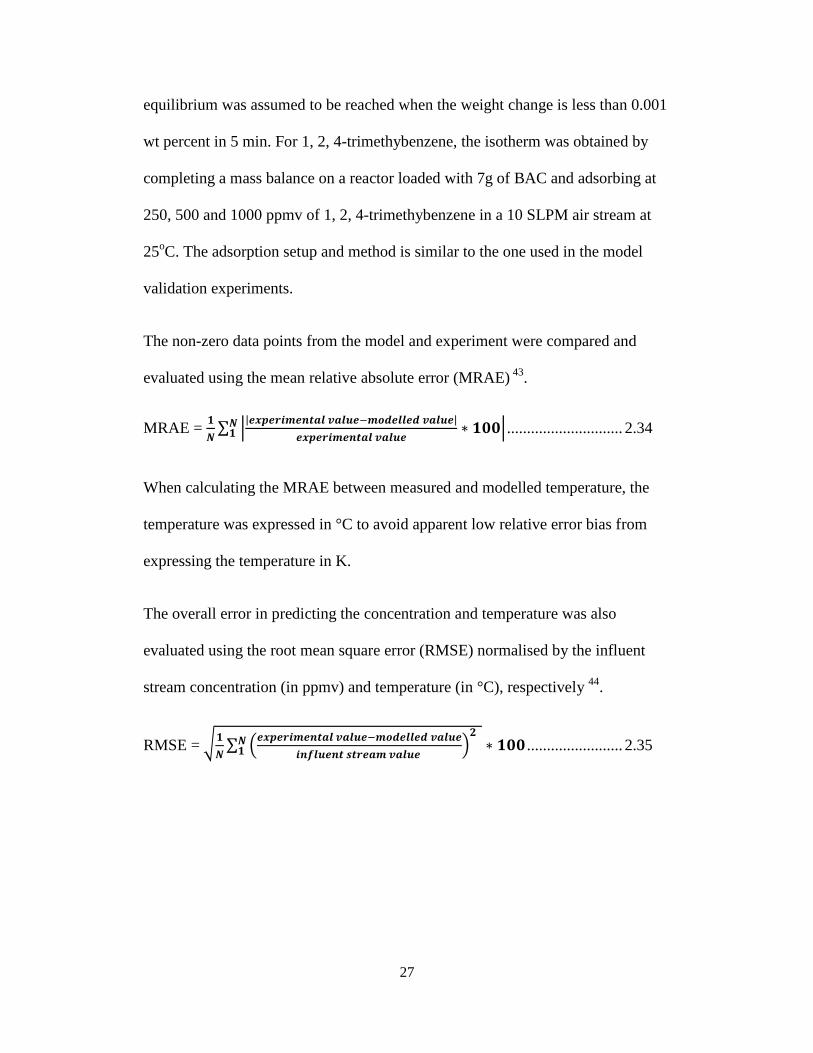
The non-zero data points from the model and experiment were compared and
evaluated using the mean relative absolute error (MRAE) 43
.
MRAE =
∑ |
| |
|
............................. 2.34
When calculating the MRAE between measured and modelled temperature, the
temperature was expressed in °C to avoid apparent low relative error bias from
expressing the temperature in K.
The overall error in predicting the concentration and temperature was also
evaluated using the root mean square error (RMSE) normalised by the influent
stream concentration (in ppmv) and temperature (in °C), respectively 44
.
RMSE = √
∑ (
)
........................ 2.35

28
2.4 Results and discussion
2.4.1 Isotherm Parameters
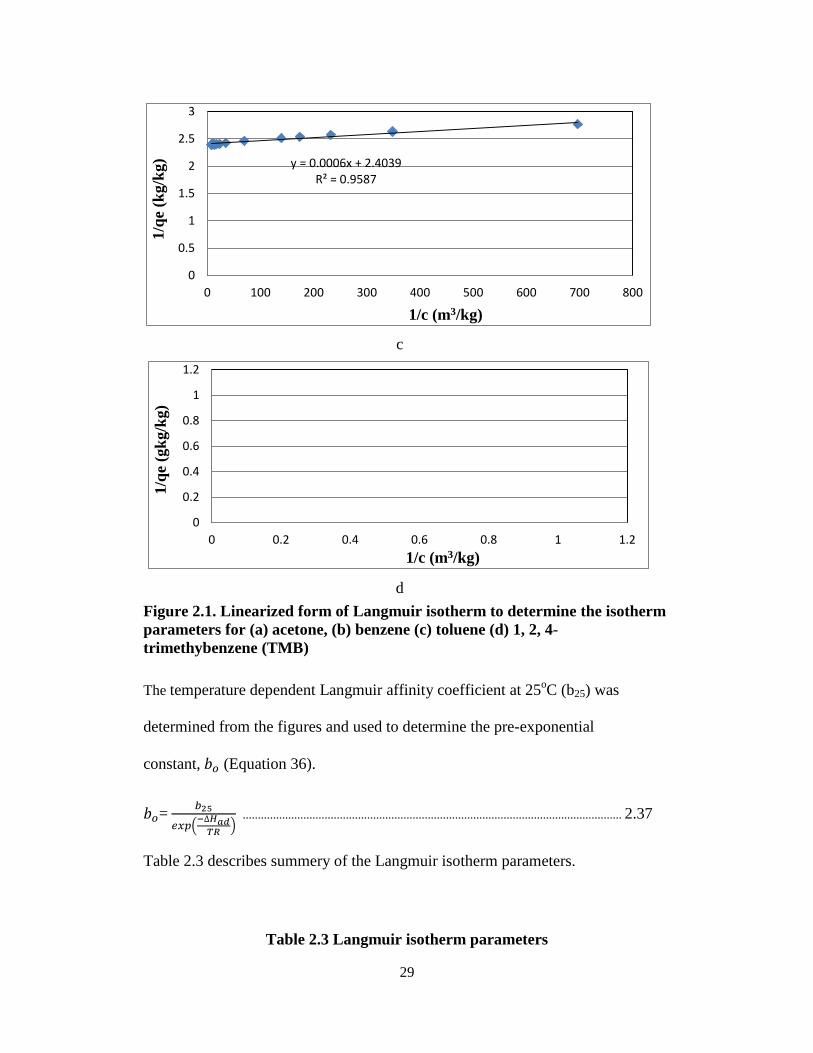
The Langmuir isotherm parameters were determined by fitting measured
experimental data for each adsorbate to the linearized isotherm equation (equation
2.36). In this equation the slope of the lines is (
) and the y-intercept is (
)
are determined graphically Figure 2.1.
.......................................................................................................................... 2.36
a
b
y = 0.008x + 2.4481 R² = 0.9954
0
0.5
1
1.5
2
2.5
3
3.5
4
0 20 40 60 80 100 120 140 160
1/q
e (k
g/kg
)
1/c (m3/kg)
y = 0.0025x + 2.3678 R² = 0.9754
0
0.5
1
1.5
2
2.5
3
3.5
0 50 100 150 200 250 300
1/q
e (k
g/k
g)
1/c (m3/kg)
29
c
d
Figure 2.1. Linearized form of Langmuir isotherm to determine the isotherm
parameters for (a) acetone, (b) benzene (c) toluene (d) 1, 2, 4-
trimethybenzene (TMB)
The temperature dependent Langmuir affinity coefficient at 25oC (b25) was
determined from the figures and used to determine the pre-exponential
constant, (Equation 36).
=
(
) ............................................................................................................................. 2.37
Table 2.3 describes summery of the Langmuir isotherm parameters.
Table 2.3 Langmuir isotherm parameters
y = 0.0006x + 2.4039 R² = 0.9587
0
0.5
1
1.5
2
2.5
3
0 100 200 300 400 500 600 700 800
1/q
e (k
g/k
g)
1/c (m3/kg)
0
0.2
0.4
0.6
0.8
1
1.2
0 0.2 0.4 0.6 0.8 1 1.2
1/q
e (g
kg/k
g)
1/c (m3/kg)

30
Compounds ( ) (m3/kg)
Acetone 0.41 306 3.38E-07
Benzene 0.42 947 1.45E-07
Toluene 0.42 4006 1.38E-07
1, 2, 4-Trimethybenzene 0.46 7241 1.54E-11
2.4.2 Model Validation
Breakthrough experiments were used for validating the model performance
because the concentration profile is coupled to the other flow variables such as
flow velocity, pressure and temperature. Figure 2.2 shows modelled and measured
breakthrough curves of individual organic adsorbates selected based on their
range of boiling points, acetone (56oC), benzene (80
oC), toluene (111
oC) and 1, 2,
4-trimethylbenzene (TMB) (170oC). The model predicted the experimental
breakthrough curves for the selected VOCs with an overall MRAE of 2.6% and
RMSE of 1.0%. The agreement between the model and the experimental results is
encouraging, as the model only uses independently determined properties of the
adsorbent and adsorbate, and the adsorber geometry and operating conditions.
The model and experiments revealed a sharper breakthrough curve for acetone
(Figure 2.2a) and a more gradual breakthrough curve for TMB (Figure 2.2d). This
is because among the selected adsorbates, acetone is the smallest in size with the
lowest diffusion resistance while TMB is the largest with the highest diffusion
resistance. The good agreement supports the accuracy of the model assumptions,
equations, and parameters. It also suggests that the model could be used to study
the adsorption dynamics of a wide range of adsorbates, including the VOCs in

31
paint emissions which consists of a large number of organic compounds with a
range of functional groups and physical properties 16
.
(a)
(b)
(c )
(d)
Figure 2.2. Comparison of the modeled and experimental breakthrough
curves of acetone, (b) benzene, (c) toluene and (d) 1,2,4-trimethylbenzene on
BAC. MRAE and RMSE were 2.0 and 1.2 % for acetone, 0.4 and 1.1 % for
benzene, 4.0% and 1.0 % for toluene, and 4.0% and 0.7 % for TMB,
respectively
model experiment
0
250
500
750
1000
0 50 100 150 200 250
Con
cen
trati
on
(p
pm
v)
Time (min)
0
250
500
750
1000
0 50 100 150 200 250Con
cen
trati
on
(p
pm
v)
Time (min)
0
250
500
750
1000
0 50 100 150 200 250
Con
cen
trati
on
(p
pm
v)
Time (min)
0
250
500
750
1000
0 50 100 150 200 250
Con
cen
trati
on
(p
pm
v)
Time (min)
32
2.4.3 Adsorbed Phase Concentration Distribution
Figure 2.3 shows the variation of axial and radial adsorbed-phase concentration
for benzene. As the adsorbate is fed into the bed, the inlet portion of the bed
becomes saturated and the mass transfer zone moves down the bed until the entire
bed is saturated. The variation of the adsorbed phase concentration in the radial
direction shows that the wall region of the bed is saturated earlier than the bed
center because of channelling near the wall. This would be seen as an earlier
breakthrough than if the model was a one-dimensional model along the bed center
line.

33
Figure 2.3. Solid-phase concentration of benzene on BAC indicating earlier
saturation at the bed periphery compared to the bed center. (a) Progress in
bed saturation with benzene over time and (b) the radial adsorbed phase
concentration of benzene in the mass transfer zone (Z = 90 mm from the
outlet, t= 33 min)
(a)
(a)
(b)
0
0.05
0.1
0.15
0.2
0.25
0 2 4 6 8
Ad
sorb
ed p
hase
con
cen
trati
on
(k
g/m
3)
Radial distance (mm)
Inlet
0 min 33 min 50 min 162 min 133 min 100 min
Inlet
Outlet

34
2.4.4 Temperature Distribution
The model results for two-dimensional temperature distribution during benzene
adsorption reveal that the thermal wave advances through the bed with the mass
transfer zone (MTZ) but at a higher velocity (Figure 2.3a). At t=33min, the MTZ
is at 30 mm from the reactor inlet (Figure 2.3a) whereas the heat transfer zone is
at about 40 mm (Figure 2.4a). Adsorption is an exothermic process and the bed
temperature could increase depending on the adsorbate loading and heat of
adsorption. The BAC bed temperature was highest for 1, 2, 4-trimethybenzene
followed by toluene, benzene, and acetone (Figure 2.4b). This order is the same as
the order of the heat of adsorption for the selected compounds. Figure 2.4 b
reveals that the bed temperature during adsorption also varied across the bed, and
is higher at the center than at the periphery due to the convective heat transfer at
the wall. The results obtained using this model are consistent with previous
experimental measurements 9, 39, 45, 46
which supports the reliability of this model
to predict instantaneous radial and axial temperature profiles accurately for the
VOCs evaluated. Similarly, the model predicted the transient temperature profile
at the center of the bed (r=0.0 cm, z=8.0 cm, Figure 2.4c) with a MRAE of 0.8%
and RMSE of 3.9%.

35
a
b
c
Figure 2.4.Temperature distribution during adsorption on BAC: (a) bed
temperature profile 33 min after the start of benzene adsorption, (b) radial
temperature profile during adsorption of acetone, benzene, toluene and 1,2,4-
trimethylbenzene in the respective mass transfer zone and (c) comparison of
modelled and measured temperature profile at the center of the reactor
(r=0.0 cm, z= 8.0 cm)
293
295
297
299
301
303
305
0 2 4 6 8
Tem
per
atu
re (
K)
Radial distance (mm)
1,2,4-trimethylbenzene
toluene
benzene
acetone
273
281
289
297
305
0 50 100 150 200 250
Tem
per
atu
re (
K)
Time (min)
model experiment
r = 0

36
2.4.5 Pressure Distribution and Velocity Field
Pressure drop is mainly influenced by the porosity of the adsorbent bed. The
lowest pressure drop during benzene adsorption occurs at the outlet of the reactor
and the maximum at the inlet (Figure 2.5). The modelled net pressure drop across
the bed after 33min of adsorption is about 3.0 kPa which is comparable to the
experimentally measured one (3.4 kPa). The MRAE (11.8 %) could be due to the
use of gas viscosity instead of effective viscosity 47, 38
in the model and/or
experimental error in measuring the pressure drop. The axial variation of pressure
drop reflects axial variation of velocity (Figure 2.5). The axial flow velocity
decreased sharply in the inlet region because the flow encounters high bed
resistance and further reduction in the MTZ (40 mm from the inlet at 33min) due
to the additional momentum sink during adsorption, and increased towards the
outlet as the pressure drop linearly decreased and enabled the gas to expand
(Figure 2.5). The higher pressure drop at the top of the reactor stabilizes the flow
and allows sufficient contact time for mass transfer and reduce the effect of
channeling (Figure 2.3a). This agrees with Chahbani and Tondeur’s conclusion on
the importance of pressure drop in fixed-bed adsorption45
.

37
Figure 2.5. Variation of pressure and axial velocity in the bed during
adsorption of benzene at 33 min after the start of adsorption
2.4.6 Parametric Study
In typical industrial applications, absorbers are often downstream of the plant and
the absorber’s performance could be affected by the performance and variation in
process parameters of upstream plant operations. Therefore, it is useful to
understand how the adsorber performance is affected when its operational
parameters and input conditions are varied.
0
0.02
0.04
0.06
0.08
0.1
0.12
0.60.70.80.911.11.2
Rea
ctor
len
gth
(m
)
Axial velocity (m/s)
r = 0

38
2.4.6.1 Effect of Adsorbate Loading, Carrier Gas Temperature, and
Superficial Velocity
The effect of carrier gas temperature on adsorption of benzene was modelled and
experimentally validated. Increasing the inlet gas temperature from 300K to 308K
resulted in 22.5% reduction in the bed service time (defined as the time when the
outlet adsorbate concentration is 1% of the inlet, i.e. the 1% breakthrough time)
because higher temperature lowers the adsorption capacity of the adsorbent
(Figure 2.6a). Good agreement was observed between the model and experimental
results.
To investigate the effect of adsorbate inlet concentration on the bed temperature,
benzene concentration in the inlet air was incrementally increased from 1,000
ppmv to 30,000 ppmv in the model. The maximum adsorption temperature
attained for each case is plotted against the inlet concentration in Figure 2.6b. The
increase in the adsorbent temperature is directly proportional to benzene
concentration because of the proportionately higher heat released per unit of gas
flow through the adsorber. This result is consistent with earlier experimental
measurements48
.
To investigate the effect of the superficial velocity, every other conditions and
parameters were kept constant and the base case superficial velocity was
increased and decreased by a factor of two. The 5% breakthrough time decreased
by (55%) for 2Vs while it increased by 109% for Vs/2 (Figure 2.6c). A slight
change in the shape of the breakthrough curve was also observed as indicated by
the throughput ration (TPR) which is the ratio of 5% breakthrough time to the

39
50% breakthrough time. The TPR decreased from 0.93 to 0.87 as the superficial
velocity increased from Vs to 2Vs indicating a relatively shallower breakthrough
while it increased to 0.94 when the superficial velocity decreased to Vs/2
indicating a relatively steeper breakthrough 49
. This is because the lower is the
superficial velocity; the longer is the contact time and the more efficient is the
mass transfer. These results are consistent with previous findings50-52
.

40
a
b
c
Figure 2.6 (a) Effect of carrier gas temperature on benzene breakthrough, (b)
modeled effect of inlet benzene concentration on bed temperature, and (c)
modeled effect of superficial velocity on benzene breakthrough curve
0.00E+00
2.50E+02
5.00E+02
7.50E+02
1.00E+03
0.00E+00 5.00E+01 1.00E+02 1.50E+02 2.00E+02 2.50E+02
Con
cen
trati
on
(pp
mv)
Time (min)
model (308 K) model (300 K)experiment (308 K) experiment (300 K)
y = 0.0028x + 297.96
R² = 0.996
300
340
380
0 10,000 20,000 30,000
Ad
sorb
ent
tem
per
atu
re
(K)
Adsorbate inlet concentration (ppmv)
0
250
500
750
1000
0 100 200 300 400 500Con
cen
trati
on
(p
pm
v)
Time (min)
2Vs Vs Vs/2

41
2.4.6.2 Effect of Particle Size
Activated carbon adsorbents are characterized by their micropores into which the
adsorbate molecules need to diffuse. As the adsorbent particle size increases, the
mass transfer resistance increases since the adsorbate needs to travel a longer path
to reach the deepest micropores. Hence some of the adsorbate molecules would
penetrate the adsorbent bed before it is saturated, and the breakthrough curve
becomes shallower. On the other hand, as the adsorbent particle size decreases,
the mass transfer of the adsorbate becomes faster, the overall rate of adsorption
becomes higher and the breakthrough curve becomes sharper (Figure 2.7a)
resulting in more complete bed utilization, possibly allowing a reduction in
operational costs. Further research is still needed to confirm the model results.
The variation in the radial velocity as a result of variation in the radial bed
porosity is related to the adsorbent particle size. The maximum radial velocity was
obtained at about one particle diameter from the wall of the reactor due to
channelling (Figure 2.7 b) which is also consistent with previous measurements 46
.
Reducing the particle size by half reduces the channeling effect while doubling
the particle size increases the channelling effect (Figure 2.7b).
Decreasing particle size increases the bed utilization efficiency which will
decrease adsorbent or servicing costs but increases the pressure drop and energy
consumption. The pressure drop increases because the bulk bed porosity decreases
and the flow resistance through the bed increases. Increasing particle size has the
opposite effect (Figure 2.7c).

42
The results obtained in this paper are encouraging as they show that the model can
accurately predict the mass, heat, and momentum transfer using adsorbate and
adsorbent properties (without the need for fitting parameters) and the adsorber’s
operating conditions. Hence the model could be used to optimize operational
parameters and the adsorbent material during the design of an adsorber in order to
minimize overall operational costs.

43
a
b
c
Figure 2.7. Effect of halving and doubling the adsorbent particle size (base
case, dp = 0.75mm) on adsorption dynamics of benzene: (a) breakthrough
profile; (b) radial velocity profile at the mass transfer zone; and (c) bed
pressure drop
0.5dp dp 2dp
0
200
400
600
800
1000
0 50 100 150 200 250 300
Con
cen
trati
on
(p
pm
v)
Time (min)
0
0.5
1
1.5
2
2.5
0 2 4 6 8Rad
ial
vel
oci
ty (
m/s
)
Radial distance (mm)
1.01E+05
1.05E+05
1.09E+05
1.13E+05
0 20 40 60 80 100 120
Pre
ssu
re d
rop
(P
a)
Reactor length (mm)

44
2.5 References
1. Hunter, P.; Oyama, S. T., Control of Volatile Organic Compound
Emissions: Conventional and Emerging Technologies. Wiley: New York
2000.
2. Parmar, G. R.; Rao, N. N., Emerging control technologies for volatile
organic compounds. Critical Reviews in Environmental Science and
Technology 2009, 39, (1), 41-78.
3. Fournel, L.; Mocho, P.; Brown, R.; Le Cloirec, P., Modeling breakthrough
curves of volatile organic compounds on activated carbon fibers. Adsorption
2010, 16, (3), 147-153.
4. Joly, A.; Perrard, A., Linear driving force models for dynamic adsorption of
volatile organic compound traces by porous adsorbent beds. Mathematics
and Computers in Simulation 2009, 79, (12), 3492-3499.
5. Murillo, R.; García, T.; Aylón, E.; Callén, M. S.; Navarro, M. V.; López, J.
M.; Mastral, A. M., Adsorption of phenanthrene on activated carbons:
Breakthrough curve modeling. Carbon 2004, 42, (10), 2009-2017.
6. Puértolas, B.; López, M. R.; Navarro, M. V.; López, J. M.; Murillo, R.;
García, T.; Mastral, A. M., Modelling the breakthrough curves obtained
from the adsorption of propene onto microporous inorganic solids.
Adsorption Science and Technology 2010, 28, (8-9), 761-775.
7. Chuang, C. L.; Chiang, P. C.; Chang, E. E., Modeling VOCs adsorption
onto activated carbon. Chemosphere 2003, 53, (1), 17-27.
8. Benenati, R. F.; Brosilow, C. B., Void fraction distribution in beds of
spheres. AIChE Journal 1962, 8, (3), 359-361.
9. Vortmeyer, D.; Winter, R. P., Improvement in reactor analysis incorporating
porosity and velocity profiles. German hemical ngineering 1984, 7, (1), 19-
25.
10. Schwartz, C. E.; Smith, J. M., Flow Distribution in Packed Beds. Industrial
& Engineering Chemistry 1953, 45, (6), 1209-1218.
11. Cohen, Y.; Metzner, A. B., Wall effects in laminar flow of fluids through
packed beds. AIChE Journal 1981, 27, (4), 705-715.
12. Mohamadinejad, H.; Knox, J. C.; Smith, J. E., Experimental and umerical
nvestigation of wo-Dimensional CO2 dsorption/esorption in acked orption
eds nder on-ideal lows. Separation Science and Technology 2003, 38, (16),
3875-3904.
13. Daszkowski, T.; Eigenberger, G., A reevaluation of fluid flow, heat transfer
and chemical reaction in catalyst filled tubes. Chemical Engineering Science
1992, 47, (9–11), 2245-2250.
14. Cohen, Y.; Metzner, A. B., Wall effects in laminar flow of fluids through
packed beds. AIChE Journal 1981, 27, (5), 705-715.
15. Yin, F.; Wang, Z.; Afacan, A.; Nandakumar, K.; Chuang, K. T.,
Experimental studies of liquid flow maldistribution in a random packed
column. Canadian Journal of Chemical Engineering 2000, 78, (3), 449-457.
16. Wang, H.; Jahandar Lashaki, M.; Fayaz, M.; Hashisho, Z.; Philips, J. H.;
Anderson, J. E.; Nichols, M., Adsorption and desorption of mixtures of

45
organic vapors on beaded activated carbon. Environmental Science and
Technology 2012, 46, (15), 8341-8350.
17. Lashaki, M. J.; Fayaz, M.; Wang, H.; Hashisho, Z.; Philips, J. H.; Anderson,
J. E.; Nichols, M., Effect of adsorption and regeneration temperature on
irreversible adsorption of organic vapors on beaded activated carbon.
Environmental Science and Technology 2012, 46, (7), 4083-4090.
18. Nield, D. A.; Bejan, A. Nield, D.A; Bejan. A. Convection in orous edia;
Springer: New York, 2006.
19. Dantas, T. L. P.; Luna, F. M. T.; Silva Jr, I. J.; Torres, A. E. B.; De
Azevedo, D. C. S.; Rodrigues, A. E.; Moreira, R. F. P. M., Modeling of the
fixed-bed adsorption of carbon dioxide and a carbon dioxideitrogen mixture
on zeolite 13X. Brazilian Journal of Chemical Engineering 2011, 28, (3),
533-544.
20. Sircar, S.; Hufton, J. R., Why does the linear driving force model for
adsorption kinetics work? Adsorption 2000, 6, (2), 137-147.
21. Farooq, S.; Ruthven, D. M., A comparison of linear driving force and pore
diffusion models for a pressure swing adsorption bulk separation process.
Chemical Engineering Science 1990, 45, (1), 107-115.
22. Sircar, S.; Hufton, J. R., Intraparticle adsorbate concentration profile for
linear driving force model. AIChE Journal 2000, 46, (3), 659-660.
23. Liaw, C. H.; Wang, J. S. P.; Greenkorn, R. A.; Chao, K. C., Kinetics of
fixed-bed adsorption - new solution. AIChE Journal 1979, 25, (2), 376-381.
24. Başaǧaoǧlu, H.; Ginn, T. R.; McCoy, B. J.; Marino, M. A., Linear driving
force approximation to a radial diffusive model. AIChE Journal 2000, 46,
(10), 2097-2105.
25. Giraudet, S.; Pré, P.; Le Cloirec, P., Modeling the heat and mass transfers in
temperature-swing adsorption of volatile organic compounds onto activated
carbons. Environmental Science and Technology 2009, 43, (4), 1173-1179.
26. Raghavan, N. S.; Hassan, M. M.; Ruthven, D. M., Numerical simulation of
a PSA system using a pore diffusion model. Chemical Engineering Science
1986, 41, (11), 2787-2793.
27. Do, D. D.; Rice, R. G., Revisiting approximate solutions for batch
adsorbers: explicit half time. AIChE Journal 1995, 41, (2), 426-429.
28. Hartzog, D. G.; Sircar, S., Sensitivity of PSA process performance to input
variables. Adsorption 1995, 1, (2), 133-151.
29. Jiang, L.; Biegler, L. T.; Fox, V. G., Simulation and optimization of
pressure-swing adsorption systems for air separation. AIChE Journal 2003,
49, (5), 1140-1157.
30. Logan, D. A., Estimating physical properties for control equipment design.
Environmental Progress 1997, 16, (4), 237-242.
31. Shi, Y.; Lee, Y. T.; Kim, A. S., Knudsen Diffusion Through Cylindrical
Tubes of Varying Radii: Theory and Monte Carlo Simulations. Transport in
Porous Media 2012, 93, (3), 517-541.
32. Giraudet, S.; Pŕ, P.; Le Cloirec, P., Modeling the temperature dependence of
adsorption equilibriums of VOC(s) onto activated carbons. Journal of
Environmental Engineering 2010, 136, (1), 103-111.

46
33. Giraudet, S.; Pré, P.; Tezel, H.; Le Cloirec, P., Estimation of adsorption
energies using the physical characteristics of activated carbons and the
molecular properties of volatile organic compounds. Carbon 2006, 44, (12),
2413-2421.
34. Smith, J. M.; Van Ness, H. C.; Abbott, M. M., Introduction to hemical
ngineering hermodynamics. 7th
ed.; McGraw-Hill: Boston, 2005; p xviii,
817 p.
35. Bowen, D. H. M., HIST 15-Perry's eavyweight andbook for hemical
ngineers. Abstracts of Papers of the American Chemical Society 2008, 236.
36. Kannuluik, W. G.; Carman, E. H., The emperature ependence of the hermal
onductivity of ir. Australian Journal of Scientific Research Series a-
Physical Sciences 1951, 4, (3), 305-314.
37. Kuwagaki, H.; Meguro, T.; Tatami, J.; Komeya, K.; Tamura, K., An
improvement of thermal conduction of activated carbon by adding graphite.
Journal of Materials Science 2003, 38, (15), 3279-3284.
38. Bey, O.; Eigenberger, G., Gas flow and heat transfer through catalyst filled
tubes. International Journal of Thermal Sciences 2001, 40, (2), 152-164.
39. Kwapinski, W., Combined wall and thermal effects during non-isothermal
packed bed adsorption. Chemical Engineering Journal 2009, 152, (1), 271-
276.
40. Oliemans, R. V. A., ERCOFTAC's role in promoting computational fluid
dynamics. Houille Blanche 2000, (7-8), 43-46.
41. Hutton, A. G., Quality and trust in industrial computational fluid dynamics.
2001, (3-4), 25-28.
42. Oberkampf, W. L.; Trucano, T. G., Verification and validation in
computational fluid dynamics. Progress in Aerospace Sciences 2002, 38,
(3), 209-272.
43. Jahandar Lashaki, M.; Fayaz, M.; Niknaddaf, S.; Hashisho, Z., Effect of the
adsorbate kinetic diameter on the accuracy of the Dubinin-Radushkevich
equation for modeling adsorption of organic vapors on activated carbon.
Journal of Hazardous Materials 2012, 241-242, 154-163.
44. Williams, L. E.; Barnett, M. O.; Kramer, T. A.; Melville, J. G., Adsorption
and transport of arsenic(V) in experimental subsurface systems. Journal of
Environmental Quality 2003, 32, (3), 841-850.
45. Chahbani, M. H.; Tondeur, D., Pressure drop in fixed-bed adsorbers.
Chemical Engineering Journal 2001, 81, (1-3), 23-34.
46. Negrini, A. L.; Fuelber, A.; Freire, J. T.; Thoméo, J. C., Fluid dynamics of
air in a packed bed:velocity profiles and the continuum model assumption.
Brazilian Journal of Chemical Engineering 1999, 16, (4), 421-432.
47. Breugem, W. P., The effective viscosity of a channel-type porous medium.
Physics of Fluids 2007, 19, (10).
48. Pré, P.; Delage, F.; Faur-Brasquet, C.; Le Cloirec, P., Quantitative structure-
activity relationships for the prediction of VOCs adsorption and desorption
energies onto activated carbon. Fuel Processing Technology 2002, 77-78,
345-351.

47
49. Hashisho, Z.; Rood, M.; Botich, L., Microwave-swing adsorption to capture
and recover vapors from air streams with activated carbon fiber cloth.
Environmental Science and Technology 2005, 39, (17), 6851-6859.
50. Chern, J. M.; Chien, Y. W., Adsorption of nitrophenol onto activated
carbon: isotherms and breakthrough curves. Water Research 2002, 36, (3),
647-655.
51. Pan, B. C.; Meng, F. W.; Chen, X. Q.; Pan, B. J.; Li, X. T.; Zhang, W. M.;
Zhang, X.; Chen, J. L.; Zhang, Q. X.; Sun, Y., Application of an effective
method in predicting breakthrough curves of fixed-bed adsorption onto resin
adsorbent. Journal of Hazardous Materials 2005, 124, (1-3), 74-80.
52. Mark M. Benjamin, D. F. L., Water Quality Engineering: Physical /
Chemical Treatment Processes. John Wiley & Sons: Inc., Hoboken, New
Jersey, 2013.

48
CHAPTER 3 MODELING COMPETITIVE ADSORPTION
OF MIXTURES OF VOLATILE ORGANIC COMPOUNDS
(VOCS) ONTO BEADED ACTIVATED CARBON (BAC)
A version of this chapter will be submitted for publication. Reproduced with
permission from Dereje Tamiru Tefera, Zaher Hashisho, John H. Philips, James
E. Anderson, Mark Nichols

49
3.1 Introduction
Painting booths are the main source of volatile organic compounds (VOCs) in the
automotive industry 1,2
. These emissions originate from the use of solvent-based
and waterborne paints and consists of a complex mixture of organic vapours with
wide range of functional groups, boiling point, and volatility 3
. VOCs from
automotive painting operations are often sent to an abatement system to reduce
their potential impact on public health and the environment before discharge to
the atmosphere 4. Adsorption on a fixed bed of activated carbon is a commonly
used abatement method for capturing VOCs emissions from industrial gas
streams. Multicomponent adsorption involves both the interactions among the
adsorbates and the adsorbate-adsorbent interactions, with the complexity of
multicomponent adsorption increasing as the number of components in the
mixture increases 5. One of the most important adsorbate-adsorbate interactions in
multicomponent adsorption is competition for the active adsorption sites. In
competitive adsorption, a component with stronger affinity to the adsorbent will
preferentially adsorb and can reduce the adsorbed phase concentration of the
component with weaker affinity 6
. In a fixed bed adsorber, the effects of
competitive adsorption are observed as a component with weaker affinity showing
an increase in outlet concentration above its inlet concentration as it is displaced
from the adsorbed phase by a second component with stronger affinity 3
. Because
experimental study of multicomponent adsorption is usually expensive and time-
consuming, development of mathematical models to predict multicomponent
adsorption is very important for better understanding of the process, and for

50
proper design, analysis and optimization of fixed bed adsorbers for VOCs
emission control.
A comprehensive model for the adsorption process consists of a model for the
analysis of dynamic adsorption (macroscopic mass, energy and momentum
conservation equations) coupled to a model of equilibrium adsorption (isotherm
equations). Previous studies on modelling dynamic adsorption of competing
adsorbates focused on binary 6, 7 8
or ternary 9, 10
mixtures. However, most
industrial emissions usually consist of mixture of more than three adsorbates, as is
the case of emissions from automotive painting booths 3,1
. Hence, there is a need
for developing a mathematical model to predict the multicomponent competitive
adsorption of mixtures of any number of adsorbates.
To model equilibrium multicomponent adsorption, the first and the simplest
model used was the extended Langmuir isotherm equation. The Langmuir
isotherm was extended by Butler and Ockrent 11
to predict binary component
adsorption with the same assumption that Langmuir made for single-component
adsorption. The Langmuir isotherm was then extended to predict equilibrium
adsorption of multicomponent mixtures 12
. Due to discrepancies of the extended
Langmuir isotherm model seen for concentrated feed systems, various
investigators developed different multicomponent isotherm models such as
isotherms based on ideal adsorbed solution theory and real adsorbed solution
theory 12
as well as isotherm models based on potential theory 13
. Jain and
Snoeyink 14
demonstrated the limitation of extending single-component Langmuir
isotherms to competitive adsorption of binary systems and proposed a new form

51
of competitive isotherm model, called the modified Langmuir-like equation, for
binary mixtures of organic compounds in wastewater. A similar model was then
developed for the prediction of competitive adsorption of a ternary mixture from
liquid stream 15
. These models are computationally simple and showed very good
prediction capability for low concentration streams but are limited to ternary
component mixtures. In the current work, a new n-component adsorption model
similar to Jain and Snoeyink’s model was derived to predict the competitive
adsorption isotherm of any n-component VOCs mixture from the gas phase, with
n limited only by computational capability.
The goal of this research is to develop a fully predictive mathematical model to
study the competitive adsorption of a mixture of VOCs. This will be achieved by
developing: 1) a multicomponent competitive adsorption isotherm model that can
predict equilibrium adsorption of an n-component VOCs mixture using single-
component isotherm parameters; 2) a fully predictive two-dimensional
mathematical model for the transport of mass, energy and momentum during the
competitive adsorption of the n-component VOCs mixture onto a fixed bed of
beaded activated carbon.
3.2 Model Development and Validation
3.2.1 Physical Model
The bench scale adsorber used to validate the model consisted of a cylindrical
reactor with a 0.76 cm inner radius (R) loaded with 7.16 g of beaded activated
carbon (BAC) particles (mean diameter = 0.75 mm) resulting in a net bed length

52
(L) of 6.5 cm. A 10 SLPM air stream containing 500 ppmv of the test adsorbates
entered from the top of the reactor at a superficial velocity of 0.914 m/s and exited
from the bottom of the reactor. The flow field was calculated using 2-dimensional
axisymmetric geometry to reduce the computational time. Major assumptions
made include: negligible variation of flow properties in the angular direction;
negligible adsorption of the carrier gas; ideal gas behavior; and symmetric flow
conditions.
3.3 Governing Transport Phenomena
The model is based on the concept that the fixed bed adsorber consists of two-
phases, the mobile (gas) phase and the immobile (solid adsorbent) phase where
mass transfer of adsorbate is described by advection-dispersion and by diffusion
in the gas and solid phases, respectively. The multi-component transport model
was developed by extending a validated single-component transport model 16
to n-
components coupled with a new competitive adsorption isotherm model. Table
3.1 provides the definitions and equations for the model variables and
parameters.

53
1.1.1 Mass Balance for the Gas Phase
The convection-dispersion mass transfer equation for the transport of multiple
adsorbates in the gas phase (ith
component) is:
( ) ( ) ....................................................................... 3.1
3.3.2 Mass Balance for the Solid Phase
The diffusive adsorbate transport in the solid phase is approximated using the
linear driving force (LDF) model 17 18
.
( ) ............................................................................................. 3.2
3.3.3 Multicomponent Competitive Adsorption Isotherm
A competitive adsorption isotherm model (equation 3.3) was derived to predict
the equilibrium adsorption of the n-component adsorbate mixture using single-
component isotherm parameters. Derivation of the competitive adsorption
isotherm equation is provided in the Appendix A .
∑
(∑ )
.................................................................................... 3.3
Where: is the equilibrium adsorption capacity of the ith
component (i =1 to n);
=( ) for k= i to n-1 and , for k = n
is the affinity coefficient 19
where j=1 to k
(
) ................................................................................... 3.4

54
Equation 3 was coupled with the mass transfer model (equations 3.1 and 3.2) to
model the competitive adsorption of both a binary mixture and an eight
component mixture of VOCs.
3.3.4 Energy Balance
The energy balance assumes local thermal equilibrium between the solid and gas
phase; and negligible viscous heat dissipation and pressure work. Hence,
convection- diffusion heat transport was used 20
.
. ( ) = ∑
… ................................................................... 3.5
The domain heat source due to the adsorption of the ith
component, neglecting the
viscous dissipation, is given as:
( )
................................................................................................................... 3.6
3.3.5 Momentum Balance
A modified momentum balance equation (equation 3 7) which accounts for Darcy
and Brinkman viscous terms, Forchheimer’s inertial term, and Navier–Stokes’
convective term20
was used to model the non-Darcy gas flow of multicomponent
VOCs in the fixed bed adsorber.
((
) ( )
) = + ....................................................... 3.7
The shear stress is defined in terms of fluid viscosity (equation 3.8).

55
J = (
( ( )
( ) )) .............................................................................. 3.8
Momentum dissipation of the flow in the fixed-bed adsorber is accounted for by
Darcy’s friction loss factor, Forchheimer’s inertial term, and a sink term due to
the adsorption of the n components (equation 3.9).
S = (
| |
∑
) ..................................................................................................... 3.9
The continuity equation accounts for the compressibility of the fluid and the sink
due to the adsorption of the n components (equation 3.10).
( )
( )=∑
.................................................................................................... 3.10
3.3.6 Variable and parameters definition
Table 3.1 shows the definition of the model variables and parameters.

56
Table 3.1 Model variables and parameters
Symbol Description Value /Formula Units Source
bj Temperature-
dependent
Langmuir affinity
coefficient
Equation 3.4
m
3/kg
19
Pre-exponential
constant in
Langmuir
isotherm
Table 3.3 m3/kg Equation
3.15
ci Gas phase
concentration
Equation 3.1 kg/m3 N/A
Empirical
correction factor
for
Forchheimer’s
drag coefficient
calculation
0.55 ( (
))
1 20
Inlet gas
concentration
250 for binary mixture,
62.5 for eight-component
mixture
ppmv Table 3.2
cs, i Adsorbed phase
concentration
Equation 3.2 kg/m3
17
cse, i Equilibrium
adsorbed phase
concentration
qe,i kg/m3 N/A
cso,i Adsorbed phase
concentration in
equilibrium with
inlet gas phase
concentration
qm,i kg/m3 N/A
Gas heat capacity 2 ( ) (air)
J/kg.K 21
Adsorbent heat
capacity
706.7 (BAC) J/kg.K 22
Effective
volumetric heat
capacity of the
solid-gas system
(1- ) + J/(m3.K)
20
Di Symmetric mass
dispersion tensor |
|
cm2/s N/A

57
Molecular
diffusivity √
((∑ )
(∑ )
)
cm2/s
23
Dax,i Axial dispersion
coefficient (
)
cm
2/s
24
Reactor inner
diameter
0.0152 m Measured
Deff,i Effective
diffusion
coefficient
cm
2/s
25
Dk,i Knudsen
diffusivity √
cm2/s
26
dp Average
adsorbent
particle diameter
7.5x10⁻⁴
(BAC) m 27
Dr,i Radial dispersion
coefficient (
)
m
2/s
28
F Body force g N/m3
20
g Acceleration of
gravity
9.81 m/s2
Heat of
adsorption ( )
kJ/mol 29
Adsorbate heat of
vaporization
Table B.1 kJ/mol Appendix B
I Unit vector N/A N/A
J Shear stress Equation 3.8 N/m2 N/A
K Bed permeability
( )
m2
20
Axial thermal
diffusion
coefficient
W/m.K 30
Stagnant bed
thermal
conductivity
( ) W/m.K 30
kef Symmetric
thermal diffusion |
| W/m.K N/A

58
coefficient
kf Gas thermal
conductivity 0.0003939333 (Air)
W/m.K 31
Overall mass
transfer
coefficient
1/s 28
Adsorbent
particle thermal
conductivity
( ) W/m.K 32
Radial thermal
diffusion
coefficient
W/m.K 30
Wall heat
transfer
coefficient
+ 0.054
(
)
1 33
IPi Ionization
potential
Table B 1 eV Appendix B
MA,i Molecular weight Table B 1 g/mol 3
MB Gas molecular
weight
29 (Air) g/mol
Gas pressure Equation 3.7 Pa N/A
Molecular Peclet
number for heat
transfer
1 30
Prandtl number
1 33
qe,i Adsorbent
equilibrium
capacity
Equation 3.3 g/g N/A
qm,i Adsorbent
maximum
capacity
Table 3.3 g/g Calculated
r Radial distance Variable m N/A
R Radius of the
adsorber
m N/A
Rep Particle Reynolds
number
1 28
Rg Ideal gas
constant
8.314 J/(mol.K)
S Momentum sink Equation 9 N/ m3 N/A

59
due to adsorption
Sci Schmidt number
1 28
Heat source due
to adsorption
Equation 3.6 J/(m3.s) N/A
Mass sink due to
adsorption
Equation 3.2 kg/(m3.s) N/A
t Adsorption time Variable s N/A
T Temperature Equation 3.5 K N/A
Tinlet Gas inlet
temperature
300 K (BC2)
Adsorber wall
temperature
295 K (BC2)
u Gas flow velocity
vector
Equation 3.7 m/s N/A
| | Resultant
velocity
Equation 3.9 m/s N/A
Adsorbent pore
volume
0.57 (BAC) cm3/g Measured
Superficial
velocity m/s Table 3.2
Adsorbent
average
micropore width
1.02 (BAC) nm Measured
Z Axial distance Variable m N/A
Greek Symbols
Parameter Description Value /equation Unit Source
αi Polarizability Table B 1 cm3x10
-24 Appendix B
Empirical
correction factor
for mass diffusion
terms
20 1 28
Forchheimer’s
drag coefficient
√ kg/m
4
20
γi Surface tension Table B 1 mN/m Appendix B
Bulk bed porosity
( )
1 20
Particle porosity 1 16

60
Bed porosity as a
function of radial
distance from the
center
( (
)
(
))
20
Gas viscosity Temperature dependent Pa.s COMSOL
material
database
Bulk bed density 606 kg/m3 Measured
Gas density Temperature dependent kg/m3
COMSOL
material
database
Adsorbent
particles density
kg/m
3
22
Adsorbent
particles
tortuosity
1 34
(∑ ) Atomic diffusion
volume
Table B 1 1 23
(∑ ) Atomic diffusion
volume of air
20.1 1 23
Indices
i Component index ranging from 1 to n components
j Summation index ranging from 1 to k
k Summation index ranging from i to n
n Number of adsorbates in the mixture
**N/A: Not applicable
3.3.7 Initial and Boundary Conditions
The initial and boundary conditions used with the model are summarized in

61
Table 3.2 . For mass transfer, a concentration boundary condition at the inlet and a
flux boundary condition at the outlet were used. For heat transfer, a temperature
boundary condition at the inlet, a constant flux boundary condition at the outlet,
and a convective heat flux at the wall were specified. For momentum balance, a
normal velocity boundary condition was set at the inlet and a constant pressure
was set at the outlet.

62
Table 3.2 Initial and boundary conditions
Physics Inlet
(Z=H)
Outlet (Z=0) Adsorber wall
(r=R)
Initial
condition
Mass
transfer =
=
Boundary flux
( )=0 and
( ) =0
Zero flux =0
=0
Heat
transfer
T=Tinlet ( )=0 ( ) T=295K
Momentum
transfer =0.914
m/s
P=1atm No slip P=1atm
u=0
3.3.8 Method of Solution
Simulation of the coupled mass, energy and momentum balance was performed
using COMSOL Multiphysics version 4.3a where the developed governing
equations were solved numerically using the finite element method. A second-
order element was used for concentration, temperature and pressure while a third-
order element was used for velocity to avoid solution instability and enhance
convergence 35-37
. Convergence of the solution was confirmed by systematic mesh
refinement until a grid-independent solution was obtained. The final solution was
presented using a total mesh of 43,868 elements which showed a relative
deviation of only 0.80% from the solution obtained by using a finer mesh, 61,898.
3.3.9 Experimental Methods
To validate the model, measured breakthrough concentrations and amounts of
adsorbates adsorbed for a binary mixture and an eight-component VOCs mixture
from a previous study 3 were used. The modelled scenarios used the same

63
adsorbent properties and similar experimental conditions as those for the
experimental measurements.
The deviation between the modelled and measured breakthrough profiles was
evaluated using two error metrics. For non-zero data points, mean relative
absolute error (MRAE) 38
was used.
MRAE =
∑ |
| |
|
............................. 3.12
Where N is the number of data points compared.
The overall error in predicting the experimental breakthrough profiles was
evaluated using the root mean square error (RMSE) normalised by the influent
stream concentration 39
.
RMSE = √
∑ (
)
........................ 3.13
In addition to the comparison to breakthrough concentrations, the model was
validated by comparing the modeled amounts of each specie adsorbed on the
BAC to the amounts measured by solvent extraction of the BAC following the
adsorption as reported in Wang et al.3.
The prediction of the competitive multicomponent adsorption isotherm is based
on single-component adsorption isotherm parameters which were obtained by
fitting single-component experimental adsorption isotherm data to the single-
component Langmuir isotherm model. Single-component adsorption isotherm
data of the VOCs (n-heptane, n-butanol, n-butyl acetate, 2-heptanone, 2-

64
butoxyethanol, n-decane, indane, 2,2-dimethylpropylbenzene and 1,2,4-
trimethylbenzene) were obtained through mass balance on a fixed bed of 4 to 5 g
of BAC adsorbing at three different influent VOC concentrations in a 10 SLPM
air stream at 25oC. Detailed information about the experimental setup used for the
adsorption has been described previously 27,
3. Adsorption was continued until
equilibrium between the gas and the adsorbent was reached as indicated by
effluent gas concentration measured using a photoionization detector (Minirae
2000, Rae Systems). Adsorption was stopped 20 min after the measured effluent
and influent gas concentrations were equal, to ensure that equilibrium between the
gas and solid phases had been reached. The experimental single component
adsorption isotherms and the isotherm parameters are provided in the Supporting
Information.
3.4 Results and Discussion
3.4.1 Single Component Isotherm Parameters
The pure component Langmuir isotherm parameters were determined by
linearizing the corresponding isotherm equation (equation 3.14) and fitting the
resulting equation to measured isotherm data Figure 3.1, obtained by completing a
mass balance on a reactor loaded with 4 to 5g of BAC and adsorbing at 25oC
where air is used as carrier gas. In equation 3.14 the slope of the line is (
),
the y-intercept is (
). Hence, and can be readily calculated at 25
oC.
........................................................................................... 3.14

65
Knowing the value of bj at 25 o
C (using Figure 3.1and equation 3.15), bo,j can be
calculated using equation 3.15
(
) ............................................................................................ 3.15

66
a
b
c
d
e
data points Linear (data points)
y = 0.0003x + 2.1725
R² = 0.9804
0
0.5
1
1.5
2
2.5
3
0 250 500 750 1000
1/q
e (k
g/k
g)
1/c (m3/kg)
y = 0.0003x + 2.1649
R² = 0.9968
0
0.5
1
1.5
2
2.5
0 250 500 750 1000
1/q
e (k
g/k
g)
1/c (m3/ kg)
y = 0.0003x + 2.1655
R² = 0.9736
0
0.5
1
1.5
2
2.5
3
0 250 500 750 1000
1/q
e (
kg/k
g)
1/c (m3/kg)
y = 0.0004x + 2.2274
R² = 0.9439
0
0.5
1
1.5
2
2.5
3
0 250 500 750 1000
1/q
e (
kg/k
g)
1/c (m3/kg)
y = 0.0007x + 2.2034
R² = 0.998
0
0.5
1
1.5
2
2.5
3
0 250 500 750 1000
1/q
e (
kg/k
g)
1/c (m3/kg)

67
f
g
h
i
Figure 3.1 Calculation of Langmuir isotherm parameters for individual
compounds (a) 1,2,4-trimethylbenzene, (b) 2,2-dimethylpropylbenzene, (c)
indane, (d) decane, (e) 2-butoxy ethanol, (f) 2-hepatnone, (g) heptane, (h) n-
butyl acetate, and (i) n-butanol.
Table 3.3. shows Langmuir isotherm parameters for each compound: the
maximum adsorption capacity (qm,i), the Langmuir affinity coefficient at 25oC (bj
at25oC) and the pre-exponential constant in the temperature dependent Langmuir
affinity coefficient (bo,j).
y = 0.00105x + 2.28717
R² = 0.99491
0
0.5
1
1.5
2
2.5
3
3.5
0 250 500 750 1000
1/q
e (
kg/k
g)
1/c (m3/kg)
y = 0.0013x + 2.7082
R² = 0.9594
0
0.5
1
1.5
2
2.5
3
3.5
4
4.5
5
0 500 1000 1500
1/q
e (
kg
/kg)
1/c (m3/kg)
y = 0.0013x + 2.3963
R² = 0.9938
0
0.5
1
1.5
2
2.5
3
3.5
4
0 250 500 750 1000
1/q
e (
kg/k
g)
1/c (m3/kg)
y = 0.0009x + 2.3945 R² = 0.9933
0
0.5
1
1.5
2
2.5
3
3.5
4
0 500 1000 1500
1/q
e (
kg/k
g)
1/c (m3/kg)

68
Table 3.3.Langmuir isotherm parameters
Compound qm,i
(Kg/Kg)
bj at25oC
(m3/kg)
bo,j
(m3/kg)
1,2,4-trimethylbenzene 0.46 7242 9.73389E-12
2,2-dimethylpropylbenzene 0.46 7216 9.3829E-12
Indane 0.46 5338 8.64472E-13
Decane 0.45 4455 6.08374E-13
2-butoxyethanol 0.45 3148 2.34228E-13
2-heptnone 0.44 2287 1.77605E-13
Heptane 0.37 2083 5.00574E-12
n-butyl acetate 0.42 1843 9.86569E-15
n-butanol 0.42 1710 1.51552E-15
3.4.2 Binary Component (n=2) Adsorption
Figure 3.2a shows the adsorption breakthrough curves of a mixture of n-decane
(decane) and n-heptane (heptane) as compared to the experimental result from a
previous study 3. The model predicted the measured breakthrough curves of the
binary mixture with a MRAE of 13% and RMSE of 11%. While numerical error
and/ or model assumptions could be contributors, the deviation is most likely due
to the experimental error in measuring the breakthrough concentrations with
tedlar bags and gas chromatography-mass spectrometry (GC-MS) 3. For instance,
after the bed was completely saturated and heptane was no longer adsorbing or
being displaced by decane, the measured effluent concentration of heptane 3 was
as low as 86% of the expected (inlet) concentration. Similarly, the effluent decane
concentration was measured to be as much as 111% of the inlet concentration at

69
300 min, which is unlikely as there were no other adsorbates in the mixture that
should be capable of displacing decane.
Initially, i.e., prior to breakthrough, both decane and heptane were completely
adsorbed because there were enough active adsorption sites for both, resulting in a
zero effluent concentration (Figure 3.2a). At about 75min after the start of
adsorption, heptane broke through and its effluent concentration then rapidly
increased beyond the inlet concentration until it reached a maximum value of 2.3
times its influent concentration (at about 143 min) because of continuous
desorption due to displacement by decane from the inlet region of the bed. The
deviation between the modelled and measured peaks could be due to
approximation errors such as errors in determining mass transfer resistance and
equilibrium parameters and /or experimental error in concentration measurements.
Subsequently, the heptane effluent concentration decreased until reaching its
influent concentration. Decane broke through at 152 min and continued to adsorb
until the bed was completely saturated (about 248 min after the start of
adsorption).
Figure 3.2b compares the amounts of decane and heptane adsorbed at the
conclusion of the experiment (300 min after the start of adsorption) as given by
the model and as experimentally determined. The model predicted the total
amount adsorbed with a 1% MRAE compared to the experimentally determined
value. The MRAE was larger for heptane (200%) than for decane (0.74%), in part
since the adsorbed amount of heptane was smaller and could lead to a larger
relative error. Inhomogeneity of the BAC sample may have also contributed.
70
Extraction was performed for a small representative sample, about 1 g, taken from
the 7.16g of saturated BAC after adsorption. 3 Because heptane is preferentially
found towards the outlet part of the bed at the end of adsorption, if the entire bed
sample was not well mixed prior to sampling and extraction, the experimental
result could underestimate the overall adsorbed amount of heptane.
The mechanism of competitive adsorption of heptane and decane can be seen in
Figure 3.2c, showing the evolution of the two-dimensional adsorbed phase
concentration distribution of each component in the bed at 45, 75 and 180 min
after the start of adsorption. After 45 min decane was adsorbing closer to the inlet
of the bed (about 15 to 25 mm from the inlet) by displacing adsorbed heptane
while heptane adsorbed on the readily available adsorption sites where there was
no competition from decane (about 25 to 40 mm from the inlet). In general the
portion of the bed saturated with decane increased with adsorption time and
heptane was continuously displaced from the region closer to the inlet by decane.
After 75 min from the start of adsorption the adsorbed phase concentration
distribution of heptane showed a more diffuse mass transfer zone since heptane
was displaced by decane closer to the inlet and adsorbed on the unoccupied
adsorption sites closer to the outlet. In contrast, decane showed a narrower mass
transfer zone. After 180 min decane had almost completely displaced heptane and
occupied the entire bed. Figure 3.2c also shows the velocity of mass transfer zone
is higher for heptane which indicates that heptane has a higher rate of diffusion
and adsorbs faster than decane. On the other hand decane was still adsorbing
when heptane broke through indicating that decane has stronger affinity to the

71
adsorbent and adsorbed by displacing heptane which is consistent with the
literature 40
. The latter point is substantiated by the values of the Langmuir
affinity coefficient and the mass transfer resistance, which was higher for decane.

72
Model
Experiment
(a)
(b)
n-Heptane
n-Decane
n-Heptane
n-Decane
0
250
500
750
0 50 100 150 200 250 300 350 400
Con
cen
tart
aio
n (
pp
m)
Time (min)
0
10
20
30
40
50
n-Heptane n-Decane Total amount
adsorbed
Am
ou
nt
ad
sorb
ed
(% b
y w
eigh
t of
BA
C)
Model Experiment

73
(c)
Figure 3.2. Competitive adsorption of decane and heptane (a) comparison of
experimental 3 and modelled breakthrough curves, (b) comparison of amount
adsorbed 300 min after the start of adsorption of each component with the
measure data 3 and (c) adsorbed phase two-dimensional concentration
distribution at 45, 75 and 180 min after the start of adsorption
3.4.3 Multicomponent (n=8) Adsorption
Figure 3.3a compares the modelled breakthrough curves of an eight-component
VOC mixture with experimentally measured ones 3. The mixture contained
organic solvents representing different functional groups present in VOCs that are
commonly present in automotive painting emissions. Detailed information about
the properties of these adsorbates and the composition of the influent gas is given
elsewhere 3
. The modelled and measured breakthrough curves were in good
agreement as indicated by the MRAE and RMSE values of 12 and 9 %,
respectively. The deviations are most likely due to experimental error 3. For
45 min 45 min 75 min 75 min 180 min 180 min
Decane Heptane Decane Heptane Decane
Heptane
Inlet
Outlet

74
example the effluent concentration of displaced light adsorbates such as n-butanol
and n-butyl acetate should equal their influent concentration towards the end of
adsorption; however, they were lower. The magnitude of experimental error is
shown by the fact that the experimentally measured concentrations of most
species fluctuated by up to ± 5 ppmv towards the end of adsorption. Inaccuracies
of model approximation could also be reflected in the error metrics.
In the first 70 min after the start of adsorption all compounds adsorbed and the
total effluent concentration was about 0.25 % of the total influent concentration.
At 70 min the effluent concentration of butanol increased sharply and then
reached a maximum of 121 % more than its influent concentration at about 133
min. This was followed by the breakthrough of n-butyl acetate whose effluent
concentration also increased rapidly to reach a peak value of about 121 % more
than its influent concentration at 144 min. This was followed by 2-heptanone and
2-butoxyethanol which showed an overshoot of 50 and 19 % respectively. The
overshoot of these four compounds is attributed to the effect of concentration on
the adsorbent followed by rapid displacement by more strongly adsorbing
components (decane, indane, DMPB and TMB and/ or by displacing themselves
as any compound with higher affinity to the adsorbent can displace the one with
lower affinity. The first two components, n-butanol and n-butyl acetate, showed a
very fast adsorption rate which is partly due to their higher molecular diffusivity
and the enhancement of the diffusion rate by displacement by the heavier
components in the mixture 41
. On the other hand, the strongly competing
adsorbates (TMB, DMPB, indane and decane) had relatively diffuse breakthrough
75
curves and needed longer times to reach saturation. This is because these
adsorbates have stronger adsorption affinities to BAC which increased their
diffusion resistance and reduce their rate of diffusion. Also, these compounds both
adsorb to unoccupied sites and by displacing more weakly adsorbing components.
Figure 3.3b compares the modelled and measured amounts adsorbed (by percent
weight of BAC) of each component 390 min after the start of adsorption 3. In
general, there is very good agreement between the measured and the modelled
values except for low molecular weight compounds. The MRAE between the
modelled and experientially determined total mass adsorbed was 2.2%. The
MRAE was larger for the lighter compounds possibly due to inhomogeneity in the
extracted sample and/or the smaller amounts adsorbed of the lighter compounds.
Wang et al. 3 reported that the amounts adsorbed based on solvent extraction of
the BAC was lower than the amounts adsorbed obtained by integrating the areas
above the breakthrough curves.

76
Model
Experiment
(a)
n-butanol
n-butylacetate
2-heptnone
2-butoxyethanol
decane
indan
2,2-dimethylpropylbenzene
1,2,4-trimethylbenzene
n-butanol
n-butyl acetate
2-heptanone
2-butoxyethanol
decane
indan
2,2-dimethylpropylbenzene
1,2,4-trimethylbenzene
0
20
40
60
80
100
120
140
0 100 200 300 400 500 600 700
Eff
luen
t co
mp
osi
tion
(p
pm
v)
Time (min)

77
(b)
Figure 3.3 Competitive adsorption of n-butanol, n-butyl acetate, 2-
heptanone, 2-butoxyethanol, decane, indane, 2, 2-dimethylpropylbenzene
(DMPB), and 1, 2, 4-trimethylbenzene (TMB); (a) comparison of
experimental 3 and modelled breakthrough curves and (b) comparison of
experimental 3 and modelled masses adsorbed of each adsorbate 390 min
after the start of adsorption
Figure 3.4 illustrates the two-dimensional adsorbed phase concentration
distribution of each component of the mixture after 75 and 105 min from the start
of adsorption. The inlet part of the bed is occupied with the four more strongly
competing components and the adsorbed phase concentration of light components
(with weaker affinity to the adsorbent) occupied the region towards the outlet of
the bed. The pattern within the advancing mass transfer zone in the bed is
consistent with the breakthrough of the respective components. Components with
weaker affinity to the adsorbent diffused faster and occupied the adsorption sites
0
10
20
30
40
50A
mou
nt
ad
sorb
ed
(% b
y w
eigh
t of
BA
C)
Model Experiment

78
faster than the strongly competing ones, as indicated by the movement of their
mass transfer zones. Of the eight components, n-butanol, n-butyl acetate, and 2-
heptanone are the most readily displaced adsorbates and their adsorbed phase
concentration showed four distinct regions in the bed from the inlet down to the
outlet: where they were almost completely displaced, where they are being
displaced, where their rate of adsorption dominates desorption due to
displacement, and where they are adsorbing. This is consistent with the
breakthrough indicated by the corresponding overshoots (Figure 3.3a) and the
Langmuir affinity coefficient. The displaced adsorbates have lower affinity
coefficient, heat of adsorption, mass transfer resistance relative to the
corresponding displacing adsorbates. In addition, the displacement of the lighter
adsorbates decreased their mass transfer resistance and resulted in their relatively
sharper breakthrough curves consistent with previous experimental findings. 41,
42
On the other hand, the heavier adsorbates had a shallower breakthrough not only
due to their higher mass transfer resistance but also because they adsorbed by
displacing the lighter adsorbates which further retarded their mass transfer rate.

79
Figure 3.4. Adsorbed phase concentration distribution of 1, 2, 4-
trimethylbenzene (1), 2, 2-dimethylpropylbenzene (2), indane (3), decane (4),
2-butoxyethanol (5), 2-heptanone (6) n-butyl acetate (7) and n-butanol (8), (a)
75 and (b) 105 min after the start of adsorption.
(a)
(b)
1 2 3 4 5 6 7 8
1 2 3 4 5 6 7 8

80
In general the model developed in this study showed promising accuracy in
predicting the dynamics of competitive adsorption of VOCs from the gas stream.
The model is fully predictive and theoretically could be used for the study of
competitive adsorption of any n-component VOC mixture. The newly derived
multicomponent competitive adsorption isotherm equation, coupled with the
dynamic adsorption model, reasonably described the equilibrium adsorption of a
2- and 8-component VOC mixture. The result of the study is helpful to understand
the mechanism of competitive adsorption from the gas phase.

81
3.5 References
1. Kim, B. R., VOC emissions from automotive painting and their control: A
review. Environmental Engineering Research 2011, 16, (1), 1-9.
2. Chiang, Y. C.; Lee, C. C.; Su, W. P., Adsorption behaviors of activated
carbons for the exhaust from spray painting booths in vehicle surface
coating. Toxicological & Environmental Chemistry. 2006, 88, (3), 453-467.
3. Wang, H.; Jahandar Lashaki, M.; Fayaz, M.; Hashisho, Z.; Philips, J. H.;
Anderson, J. E.; Nichols, M., Adsorption and desorption of mixtures of
organic vapors on beaded activated carbon. Environmental Science and
Technology 2012, 46, (15), 8341-8350.
4. Sexton, K.; Westberg, H., Ambient hydrocarbon and ozone measurements
downwind of a large automotive painting plant. Environmental Science and
Technology 1980, 14, (3), 329-332.
5. Helfferich, F. G.; Klein, G., Multicomponent Chromatography; Theory of
Interference. M. Dekker: New York,, 1970; P viii, 419 p.
6. Lillo-Ródenas, M. A.; Fletcher, A. J.; Thomas, K. M.; Cazorla-Amorós, D.;
Linares-Solano, A., Competitive adsorption of a benzene-toluene mixture
on activated carbons at low concentration. Carbon 2006, 44, (8), 1455-
1463.
7. Ahmed, M. J.; Mohammed, A. H. A. K.; Kadhum, A. A. H., Modeling of
Breakthrough Curves for Adsorption of Propane, n-Butane, and Iso-Butane
Mixture on 5A Molecular Sieve Zeolite. Transport in Porous Media 2011,
86, (1), 215-228.
8. Gironi, F.; Piemonte, V., VOCs removal from dilute vapour streams by
adsorption onto activated carbon. Chemical Engineering Journal. 2011,
172, (2–3), 671-677.
9. Lu, L.; Wang, Q.; Liu, Y., Adsorption and separation of ternary and
quaternary mixtures of short linear alkanes in zeolites by molecular
simulation. Langmuir 2003, 19, (25), 10617-10623.
10. To, P. C.; Mariñas, B. J.; Snoeyink, V. L.; Wun, J. N., Effect of pore-
blocking background compounds on the kinetics of trace organic
contaminant desorption from activated carbon. Environmental Science and
Technology 2008, 42, (13), 4825-4830.
11. Butler, J. A. V.; Ockrent, C., Studies in electrocapillarity. Part III: The
surface tensions of solutions containing two surface-active solutes. Journal
of Physical Chemistry. 1930, 34, (12), 2841-2859.
12. Do, D. D., Adsorption analysi : Equilibria and Kinetics. Imperial College
Press: London, 2008; Vol. v 2.
13. Toth, J., Adsorption: Theory, Modeling, and Analysis Marcel Dekker.Inc:
New York, 2002; Vol. 107.
14. Jain, J. S.; Snoeyink, V. L., Adsorption from bisolute systems on active
carbon. Journal of the Water Pollution Control Federation 1973, 45, (12),
2463-2479.

82
15. Alkhamis, K. A.; Wurster, D. E., Prediction of adsorption from
multicomponent solutions by activated carbon using single-solute
parameters. Part II - Proposed equation. AAPS PharmSciTech 2002, 3, (3).
16. Dereje Tamiru Tefera, M. J. L., Mohammadreza Fayaz , John H. Philips,
James E. Anderson, Mark Nichols,Zaher Hashisho, Two-Dimensional
Modeling of Volatile Organic Compounds Adsorption onto Beaded
Activated Carbon. In Environmental Science & Technology, 2013.
17. Giraudet, S.; Pré, P.; Le Cloirec, P., Modeling the heat and mass transfers in
temperature-swing adsorption of volatile organic compounds onto activated
carbons. Environmental Science and Technology 2009, 43, (4), 1173-1179.
18. Joly, A.; Perrard, A., Linear driving force models for dynamic adsorption of
volatile organic compound traces by porous adsorbent beds. Mathematics
and Computers in Simulation 2009, 79, (12), 3492-3499.
19. Giraudet, S.; Pŕ, P.; Le Cloirec, P., Modeling the temperature dependence of
adsorption equilibriums of VOC(s) onto activated carbons. Journal of
Environmental Engineering 2010, 136, (1), 103-111.
20. Nield, D. A.; Bejan, A. Nield, D.A; Bejan. A. Convection in Porous Media;
Springer: New York, 2006.
21. Smith, J. M.; Van Ness, H. C.; Abbott, M. M., Introduction to Chemical
Engineering thermodynamics. 7th ed.; McGraw-Hill: Boston, 2005; p xviii,
817 p.
22. Bowen, D. H. M., HIST 15-Perry's Heavyweight Handbook for Chemical
Engineers. Abstracts of Papers of the American Chemical Society 2008,
236.
23. Logan, D. A., Estimating physical properties for control equipment design.
Environmental Progress 1997, 16, (4), 237-242.
24. Cohen, Y.; Metzner, A. B., Wall effects in laminar flow of fluids through
packed beds. AIChE Journal 1981, 27, (5), 705-715.
25. Mu, D.; Liu, Z. S.; Huang, C.; Djilali, N., Determination of the effective
diffusion coefficient in porous media including Knudsen effects.
Microfluidics and Nanofluidics 2008, 4, (3), 257-260.
26. Shi, Y.; Lee, Y. T.; Kim, A. S., Knudsen Diffusion Through Cylindrical
Tubes of Varying Radii: Theory and Monte Carlo Simulations. Transport in
Porous Media 2012, 93, (3), 517-541.
27. Lashaki, M. J.; Fayaz, M.; Wang, H.; Hashisho, Z.; Philips, J. H.; Anderson,
J. E.; Nichols, M., Effect of adsorption and regeneration temperature on
irreversible adsorption of organic vapors on beaded activated carbon.
Environmental Science and Technology 2012, 46, (7), 4083-4090.
28. Dantas, T. L. P.; Luna, F. M. T.; Silva Jr, I. J.; Torres, A. E. B.; De
Azevedo, D. C. S.; Rodrigues, A. E.; Moreira, R. F. P. M., Modeling of the
fixed-bed adsorption of carbon dioxide and a carbon dioxidenitrogen
mixture on zeolite 13X. Brazilian Journal of Chemical Engineering 2011,
28, (3), 533-544.
29. Giraudet, S.; Pré, P.; Tezel, H.; Le Cloirec, P., Estimation of adsorption
energies using the physical characteristics of activated carbons and the

83
molecular properties of volatile organic compounds. Carbon 2006, 44, (12),
2413-2421.
30. Kwapinski, W., Combined wall and thermal effects during non-isothermal
packed bed adsorption. Chemical Engineering Journal 2009, 152, (1), 271-
276.
31. Kannuluik, W. G.; Carman, E. H., The Temperature Dependence of the
Thermal Conductivity of Air. Australian Journal of Scientific Research
Series A-Physical Sciences 1951, 4, (3), 305-314.
32. Kuwagaki, H.; Meguro, T.; Tatami, J.; Komeya, K.; Tamura, K., An
improvement of thermal conduction of activated carbon by adding graphite.
Journal of Materials Science 2003, 38, (15), 3279-3284.
33. Bey, O.; Eigenberger, G., Gas flow and heat transfer through catalyst filled
tubes. International Journal of Thermal Sciences 2001, 40, (2), 152-164.
34. Guo, P., Dependency of Tortuosity and Permeability of Porous Media on
Directional Distribution of Pore Voids. Transport in Porous Media 2012,
95, (2), 285-303.
35. Oberkampf, W. L.; Trucano, T. G., Verification and validation in
computational fluid dynamics. Progress in Aerospace Sciences 2002, 38,
(3), 209-272.
36. Hutton, A. G., Quality and trust in industrial computational fluid dynamics.
Houille Blanche 2001, (3-4), 25-28.
37. Oliemans, R. V. A., ERCOFTAC's role in promoting computational fluid
dynamics. Houille Blanche 2000, (7-8), 43-46.
38. Jahandar Lashaki, M.; Fayaz, M.; Niknaddaf, S.; Hashisho, Z., Effect of the
adsorbate kinetic diameter on the accuracy of the Dubinin-Radushkevich
equation for modeling adsorption of organic vapors on activated carbon.
Journal of Hazardous Materials 2012, 241-242, 154-163.
39. Williams, L. E.; Barnett, M. O.; Kramer, T. A.; Melville, J. G., Adsorption
and transport of arsenic(V) in experimental subsurface systems. Journal of
Environmental Quality 2003, 32, (3), 841-850.
40. Sulaymon, A. H.; Ahmed, K. W., Competitive adsorption of furfural and
phenolic compounds onto activated carbon in fixed bed column.
Environmental Science and Technology 2008, 42, (2), 392-397.
41. To, P. C.; Mariñas, B. J.; Snoeyink, V. L.; Wun, J. N., Effect of strongly
competing background compounds on the kinetics of trace organic
contaminant desorption from activated carbon. Environmental Science and
Technology 2008, 42, (7), 2606-2611.
42. Pelekani, C.; Snoeyink, V. L., Kinetic and equilibrium study of competitive
adsorption between atrazine and Congo red dye on activated carbon: The
importance of pore size distribution. Carbon 2001, 39, (1), 25-37.

84
CHAPTER 4 CONCLUSION AND RECOMMENDATION
85
4.1 Conclusion
This research set out to develop a fully predictive and accurate two dimensional
mathematical model to investigate adsorption of volatile organic compounds from
diluted gaseous stream in a fixed bed adsorber. This research is important because
it contributes to the understanding of the mechanism of adsorption of single and
multicomponent VOCs from diluted gas streams. The model developed in this
study could be used to facilitate the design and optimization of the fixed bed
adsorber and reduces the number of pilot scale testes required to measure the
effect of various operation and design variables.
The first part (chapter two) of the research concentrated on the development and
simulation of a 2D single component VOC adsorption model. The model was
validated for different VOCs selected based on their molecular weight, boiling
point and affinity to the adsorbent in order to ensure the accuracy of the model for
the adsorption of a range of VOCs emitted from automotive painting operations.
The model was validated for effluent concentration, pressure and temperature
with experimentally measured data from a bench-scale fixed bed adsorber. The
deviation of the model result from the measured effluent concentration, pressure
and temperature, as measured by the relative mean relative absolute error
(MRAE) was 2.6, 11.8 and 1.1% respectively indicating that the model has
comparable accuracy to the experimental tests and could be used to reduce the
number of experiments needed. To complete the validation of the single
component model, the response of the model to changes in the adsorber’s
operation condition (carrier gas temperature, adsorbate loading, superficial

86
velocity) and adsorbent property (particle size) was investigated. The model was
found to be sensitive to changes to the operation conditions and adsorbent particle
size and the response of the model was consistent with earlier experimental
studies. The major conclusions of the parametric study are the following:
As the adsorbate loading increases, the bed temperature increases,
As the carrier gas temperature increases, the breakthrough time decreases,
As the superficial velocity increases, the breakthrough time decreases and
the breakthrough become more diffused,
As the particle size decreases, the breakthrough become sharper
indicating enhanced mass transfer rate.
The second part of this research focused on the modeling of competitive
adsorption of n-component mixture of VOCs from dilute gas streams. This was
done by extending the validated single component dynamic adsorption model
(chapter 2) to predict competitive adsorption of mixture of adsorbates and
deriving a new competitive adsorption isotherm model. The model was validated
using published (breakthrough curve and total amount adsorbed) data on the
competitive adsorption of binary and an eight component mixtures of VOCs. For
the binary and eight-component mixtures, the MRAE of the breakthrough profiles
was 13 and 12%, respectively while the MRAE of the adsorbed amounts was 1
and 2%, respectively which confirms the accuracy of the model to predict
competitive adsorption of mixture of VOCs. This study is important because it
enhance the understanding of competitive adsorption of mixture of VOCs
regardless of the number of adsorbates involved which was not available in

87
previous studies. The major conclusions from study of competitive adsorption are
summarized as follows:
During initial stage of the adsorption of mixture of VOCs onto BAC there
is abundant adsorption sites, thus strongly adsorbing as well as weakly
adsorbing components can readily adsorb onto vacant adsorption sites
though there is still competition. However, as adsorption time increases
the inlet region of the bed is dominated by strongly adsorbing
components. This is because adsorbates with higher affinity adsorbed by
displacing weakly adsorbed components. The weakly adsorbing
components (relatively faster mass transfer rate) on the other hand move
ahead with the bulk fluid and occupy the fresh adsorption sites first in the
front part of the bed. This process continues until the mass transfer zone
of the lighter components reach the outlet region of the bed. After that
adsorbates with higher affinity continue to adsorb by displacing the
weakly adsorbed components until they occupy the whole region of the
bed. As a result the large portion of the adsorbed phase concentration
consists of the heavier or strongly adsorbing components as the
adsorption time increases. The effluent concentrations of weakly
adsorbing components sharply increase, once they breakthrough, to a
value above their inlet concentration because they are displaced from the
adsorbed phase.

88
The competition of the components for the adsorption sites could be
related to heat of adsorption, affinity coefficient, and mass transfer
resistance as follows:
The higher is the affinity coefficient the stronger is the
competition of the component, i.e. components with higher
affinity coefficients displace components with lower affinity
coefficients.
The higher is the mass transfer resistance the higher is the
competition of the adsorbate. This is because the mass transfer
resistance itself depends on the affinity of the adsorbate
(adsorbent-adsorbate interaction), hence the higher is the affinity
of the adsorbate for the adsorbent the more strongly it adsorbs and
the higher is the pore or surface diffusion of the adsorbate.
The higher is the heat of adsorption the higher is the competition
of the adsorbate for adsorption sites. The stronger is the adsorbate
adsorbent interaction the higher is the heat of adsorption.
4.2 Recommendation for Future Work
The research completed for this thesis has highlighted a number of topics that
needs further research. The major research areas are:
The effect of carrier gas moisture on the adsorption of VOCs. The general
understanding in the existing literature is that the presence of moisture can
reduce the adsorption capacity of activated carbon for VOCs, particularly

89
for polar ones. Hence, accurate analysis of the effect of moisture on
adsorption of VOCs should be investigated.
In order to offset the effect of moisture on the adsorption of VOCs onto
activated carbon some industries increase the adsorption temperature.
However, the higher is the adsorption temperature the lower is the
adsorption capacity of the adsorbent to the adsorbate. The model
developed in this study could be modified to account for the effect of
temperature on the moisture content and adsorption of water vapor and
VOCs. Hence the model can help in finding the optimum adsorption
temperature.
The model could be modified to simulate the desorption process following
VOC(s) adsorption. This could be very helpful to investigate the most
important parameters affecting the process of regeneration.
Another immediate research topic is the modelling of different adsorber
configurations such as fluidized bed, moving bed etc. This could be
helpful in selection of the best adsorber configuration for a particular VOC
adsorption application.

90
CHAPTER 5 APPENDICES
APPENDIX A Derivation of Isotherm Equation for Competitive Adsorption
APPENDIX B Physical Properties of the Adsorbates

91
APPENDIX A Derivation of Isotherm Equation for Competitive
Adsorption
Single component Langmuir isotherm model was extended by Butler and Ockrent
1 to predict competitive adsorption of mixture of binary component until Jain and
Snoeyink 2 revealed the limitation of the former extension of single component
Langmuir isotherm to competitive adsorption of binary system and proposed a
new form of competitive isotherm for binary mixture of organic compounds from
wastewater (equation A1 and A2) wherein ( > ) 3.
=( )
+
....................................................................... A1
............................................................................................. A2
The model for adsorption competing binary mixture was then modified for the
prediction of ternary ( ) mixture from an aqueous system 4.
( )
( )
................................... A3
( )
............................................................ A4
..................................................................................... A5

92
General isotherm equation for ith
component adsorbate
In the current study, the model for competitive adsorption of ternary system was
extended for n-component mixture of VOCs for adsorption from a gas stream and
tested with an eight-component VOCs mixture in which (
).
( )
( )
( )
( )
( )
+
( )
( )
....................................................................... A6
( )
( )
( )
( )
+
( )
( )
........................................................................ A7
( )
( )
( )
+( )
( )
........................................................................ A8
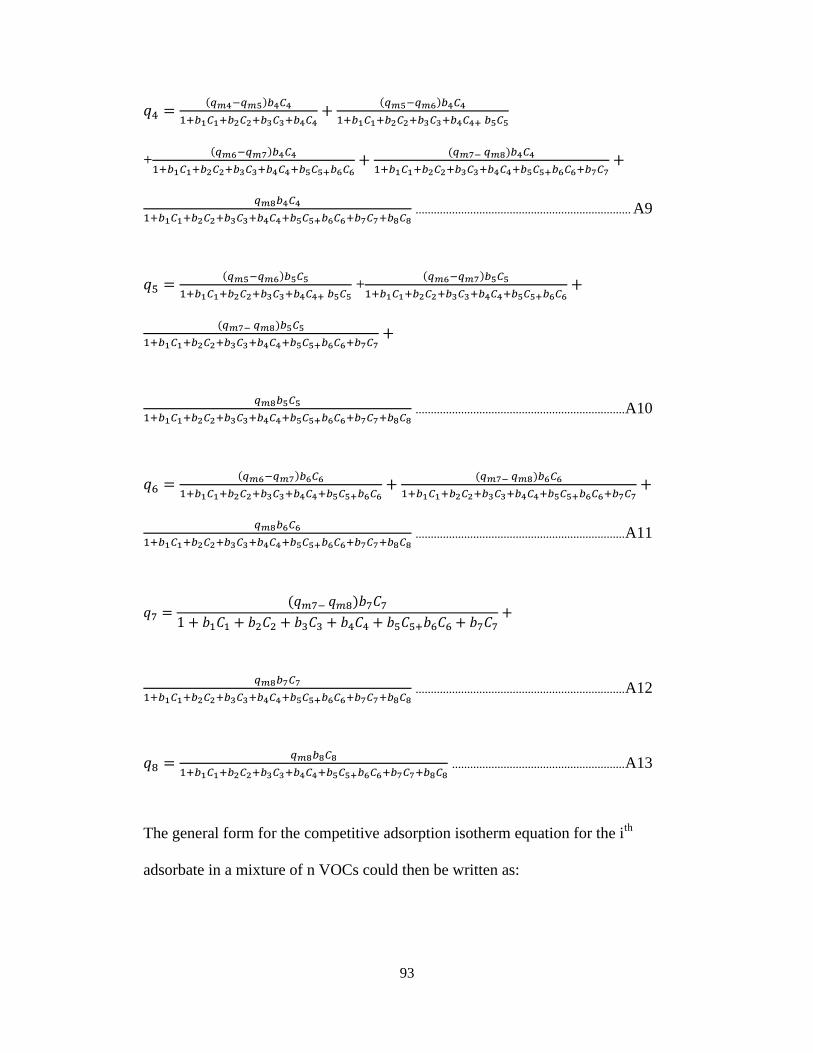
93
( )
( )
+( )
( )
....................................................................... A9
( )
+
( )
( )
..................................................................... A10
( )
( )
..................................................................... A11
( )
..................................................................... A12
......................................................... A13
The general form for the competitive adsorption isotherm equation for the ith
adsorbate in a mixture of n VOCs could then be written as:

94
∑
∑
: ................................................................................................................ A14
Where:
=( ) for k= i to n-1
and , for k = n

95
APPENDIX B Physical Properties of the Adsorbates
Table B. 1 shows the physical properties of the adsorbates studied.
Table B. 1. Physical properties of the adsorbates
Compound MA,i5
(g/mol) (∑ )
6, 7
(kJ/mol)
α 8, 9
(10-
24cm
3)
γ 6, 8-10
(mN/m)
IP 8, 9,10
(eV)
Butanol 74.10 91.28 43.29 8.71 25.57 10.14
n-Butyl acetate 116.20 133.72 36.14 12.61 24.35 10.10
Heptane 100.21 147.18 36.66 13.60 20.14 9.90
2-Heptanone 114.20 148.70 39.5 13.51 24.80 9.37
2-Butoxyethanol 118.20 137.68 47.06 13.00 27.40 10.00
n-Decane 142.30 168.3 38.75 19.10 23.90 10.20
1,2,4-trimethybenze 120.20 152.06 39.2 15.87 28.70 8.27
Indane 118.20 127.90 49.05 15.48 27.50 8.40
2,2-
Dimethylpropylbenzene
148.20 192.98 46.74 19.59 28.80 7.71

96
References:
1. Butler, J. A. V.; Ockrent, C., Studies in electrocapillarity. Part III: The
surface tensions of solutions containing two surface-active solutes. Journal
of Physical chemistry 1930, 34, (12), 2841-2859.
2. Jain, J. S.; Snoeyink, V. L., Adsorption from bisolute systems on active
carbon. Journal of the Water Pollution Control Federation 1973, 45, (12),
2463-2479.
3. Jain, J. S.; Vernon, L. S., Adsorption from Bisolute Systems on Active
Carbon. Journal (Water Pollution Control Federation) 1973, 45, (12),
2463-2479.
4. Alkhamis, K. A.; Wurster, D. E., Prediction of adsorption from
multicomponent solutions by activated carbon using single-solute
parameters. Part II--Proposed equation. AAPS PharmSciTech 2002, 3, (3),
E23.
5. Wang, H.; Jahandar Lashaki, M.; Fayaz, M.; Hashisho, Z.; Philips, J. H.;
Anderson, J. E.; Nichols, M., Adsorption and desorption of mixtures of
organic vapors on beaded activated carbon. Environmental Science and
Technology 2012, 46, (15), 8341-8350.
6. Bowen, D. H. M., HIST 15-Perry's heavyweight handbook for chemical
engineers. Abstracts of Papers of the American Chemical Society 2008, 236.
7. Smith, J. M.; Van Ness, H. C.; Abbott, M. M., Introduction to Chemical
Engineering Thermodynamics. 7th ed.; McGraw-Hill: Boston, 2005; p xviii,
817 p.
8. Lide, D. R., CRC Handbook of Chemistry and Physics. 89th edition; Lide,
D.R., Ed; CRC Press: Boca Raton, FL, 2008.
9. Ullmann, F., Ullmann's Encyclopedia of Industrial Chemistry. In VCH:
Weinheim: Germany, 1985; Vol. 40 .
10. Giraudet, S.; Pré, P.; Tezel, H.; Le Cloirec, P., Estimation of adsorption
energies using the physical characteristics of activated carbons and the
molecular properties of volatile organic compounds. Carbon 2006, 44, (12),
2413-2421.