Influence of chemical composition of olive oil on the development of volatile compounds during...
13
ORIGINAL PAPER Influence of chemical composition of olive oil on the development of volatile compounds during frying Giuseppe Procida • Angelo Cichelli • Dario Compagnone • Rube ´n M. Maggio • Lorenzo Cerretani • Michele Del Carlo Received: 22 July 2009 / Revised: 21 September 2009 / Accepted: 28 September 2009 / Published online: 16 October 2009 Ó Springer-Verlag 2009 Abstract In this study, 15 virgin olive oils from an industrial oil plant in the Abruzzo region were analyzed in terms of the volatile compounds responsible for the char- acteristic odor and olfactory perception of virgin olive oils and its modification upon frying (up to 60 min of heat treatment). Dynamic headspace–gas chromatography–mass spectrometry analysis was used to evaluate the volatile profile before and after each frying step and examine cor- relations with qualitative characteristic of oil (fatty acid composition, total phenolic compound content, tocopherols and pigments). The chemometric approach (genetic algo- rithms–partial least squares/multiple linear regression) developed for this study is a novel model for data treatment to select important variables in olive oil composition and understand their influence on spoilage during frying. An inverse correlation between oleic acid content and forma- tion of toxic volatiles such as acrolein and crotonal during frying was demonstrated. Moreover, it was also observed that pigments such as chlorophylls, pheophytins, and carotenoids may prevent the formation of some aldehydes during frying. Keywords Virgin olive oil Volatile compounds Frying Degradation Safety Acrolein Chemometric Introduction It is estimated that globally about 20 million tons of frying fats and oils are used each year, with an estimated value of $83 billion in the United States alone [1]. Frying is a fast, convenient and energy-efficient cooking method that increases palatability due to fat absorption, crust formation and formation of pleasant flavors and odors [2]. However, it is well known that heating oils for extended periods of time at high temperatures in the presence of environmental oxy- gen and water from food leads to severe thermal oxidation. This causes a series of reactions, namely hydrolysis, isom- erization and polymerization, whose decomposition prod- ucts adversely affect both the flavor and color of oils [3–5]. These decomposition products, also known as polar contaminant materials (PCM), tend to remain liquid and cannot be filtered out of the oil. They are also deposited on the surfaces of the fryer and absorbed by food. The PCM fraction is thought to include most of the potential toxic products produced in frying oils [6]. In biological tests conducted by Billek [7], rats fed used frying oil displayed hematological changes indicative of liver damage. Accord- ing to Kahl and Hildebrandt [8], the presence of by-products G. Procida Dipartimento dei Materiali e delle Risorse Naturali, Universita ` di Trieste, Via A. Valerio 6, 34127 Trieste, Italy A. Cichelli DASTA, Universita ` G. d’Annunzio Chieti-Pescara, Viale Pindaro 42, 65127 Pescara, Italy D. Compagnone M. Del Carlo (&) Dipartimento di Scienze degli Alimenti, Universita ` di Teramo, Via C. Lerici 1, 64023 Mosciano Stazione (TE), Italy e-mail: [email protected] R. M. Maggio Departamento de Quı ´mica Analı ´tica, Facultad de Ciencias Bioquı ´micas y Farmace ´uticas, Universidad Nacional de Rosario and Instituto de Quı ´mica Rosario, (CONICET-UNR), Suipacha 531, Rosario (S2002LRK), Argentina L. Cerretani (&) Dipartimento di Scienze degli Alimenti, Universita ` di Bologna, P.zza Goidanich, 60, 47521 Cesena (FC), Italy e-mail: [email protected] 123 Eur Food Res Technol (2009) 230:217–229 DOI 10.1007/s00217-009-1160-7
-
Upload
independent -
Category
Documents
-
view
4 -
download
0
Transcript of Influence of chemical composition of olive oil on the development of volatile compounds during...

ORIGINAL PAPER
Influence of chemical composition of olive oil on the developmentof volatile compounds during frying
Giuseppe Procida • Angelo Cichelli •
Dario Compagnone • Ruben M. Maggio •
Lorenzo Cerretani • Michele Del Carlo
Received: 22 July 2009 / Revised: 21 September 2009 / Accepted: 28 September 2009 / Published online: 16 October 2009
� Springer-Verlag 2009
Abstract In this study, 15 virgin olive oils from an
industrial oil plant in the Abruzzo region were analyzed in
terms of the volatile compounds responsible for the char-
acteristic odor and olfactory perception of virgin olive oils
and its modification upon frying (up to 60 min of heat
treatment). Dynamic headspace–gas chromatography–mass
spectrometry analysis was used to evaluate the volatile
profile before and after each frying step and examine cor-
relations with qualitative characteristic of oil (fatty acid
composition, total phenolic compound content, tocopherols
and pigments). The chemometric approach (genetic algo-
rithms–partial least squares/multiple linear regression)
developed for this study is a novel model for data treatment
to select important variables in olive oil composition and
understand their influence on spoilage during frying. An
inverse correlation between oleic acid content and forma-
tion of toxic volatiles such as acrolein and crotonal during
frying was demonstrated. Moreover, it was also observed
that pigments such as chlorophylls, pheophytins, and
carotenoids may prevent the formation of some aldehydes
during frying.
Keywords Virgin olive oil � Volatile compounds �Frying � Degradation � Safety � Acrolein � Chemometric
Introduction
It is estimated that globally about 20 million tons of frying
fats and oils are used each year, with an estimated value of
$83 billion in the United States alone [1]. Frying is a fast,
convenient and energy-efficient cooking method that
increases palatability due to fat absorption, crust formation
and formation of pleasant flavors and odors [2]. However, it
is well known that heating oils for extended periods of time
at high temperatures in the presence of environmental oxy-
gen and water from food leads to severe thermal oxidation.
This causes a series of reactions, namely hydrolysis, isom-
erization and polymerization, whose decomposition prod-
ucts adversely affect both the flavor and color of oils [3–5].
These decomposition products, also known as polar
contaminant materials (PCM), tend to remain liquid and
cannot be filtered out of the oil. They are also deposited on
the surfaces of the fryer and absorbed by food. The PCM
fraction is thought to include most of the potential toxic
products produced in frying oils [6]. In biological tests
conducted by Billek [7], rats fed used frying oil displayed
hematological changes indicative of liver damage. Accord-
ing to Kahl and Hildebrandt [8], the presence of by-products
G. Procida
Dipartimento dei Materiali e delle Risorse Naturali,
Universita di Trieste, Via A. Valerio 6, 34127 Trieste, Italy
A. Cichelli
DASTA, Universita G. d’Annunzio Chieti-Pescara,
Viale Pindaro 42, 65127 Pescara, Italy
D. Compagnone � M. Del Carlo (&)
Dipartimento di Scienze degli Alimenti, Universita di Teramo,
Via C. Lerici 1, 64023 Mosciano Stazione (TE), Italy
e-mail: [email protected]
R. M. Maggio
Departamento de Quımica Analıtica,
Facultad de Ciencias Bioquımicas y Farmaceuticas,
Universidad Nacional de Rosario and Instituto de Quımica
Rosario, (CONICET-UNR), Suipacha 531,
Rosario (S2002LRK), Argentina
L. Cerretani (&)
Dipartimento di Scienze degli Alimenti, Universita di Bologna,
P.zza Goidanich, 60, 47521 Cesena (FC), Italy
e-mail: [email protected]
123
Eur Food Res Technol (2009) 230:217–229
DOI 10.1007/s00217-009-1160-7

of lipid peroxidation in food is undesirable, because the
nutritional value of food decreases with the destruction of
unsaturated fatty acids and other essential food constituents
with an unsaturated lipid structure. Nielsen et al. [9] also
reported that almost all amino acids react with primary and
secondary products of oxidized lipids, thereby decreasing
the digestive quality of proteins, amino acids and fats that
may affect weight gain. Another dangerous compound
formed from food carbohydrates and amino acids by heating
(primarily in fried potato products, bread and coffee) is
acrylamide [10]. Its exposure and toxic effects have been
evaluated by the IARC [11] and a joint FAO/WHO expert
committee on food additives [12]. Special studies have also
dealt with the general toxicity of acrylamide (Mutation
Research, 2005) and its nutritional risks.
The peroxide value (PV) is one of the most frequently
used parameters for assessing the quality of edible oils
during production, storage and marketing. PV shows the
degree of oxidation and measures the amount of total
peroxides as a primary product of oil oxidation [13]. Pro-
gressive lipid oxidation causes hydroperoxide decomposi-
tion (or evolution) yielding multiple secondary products
characterized by different molecular weight (MW) with
respect to starting triglycerides which include volatile
compounds (lower MW), oxidized triglycerides (medium
MW) and triacylglycerols polymers (higher MW).
Although numerous methods for the determination of
volatile compounds are known, the problem of accurate
measurement still exists, particularly for constituents of
low MW. Several methods require the isolation and, fre-
quently, pre-concentration of volatile compounds before
separation by gas chromatography (GC). The dynamic
headspace (DHS) technique, involving the collection of the
volatile fraction, has the advantage of minimal manipula-
tion of the sample and avoids contaminants or artifacts. In
the present study, DHS–GC–mass spectrometry (DHS–
GC–MS) optimized by Barcarolo et al. [14] was used for
the analysis of volatile compounds in olive oils.
Frying is influenced by a large number of variables: the
type of process (i.e. continuous or discontinuous), the
surface to oil volume ratio, the food itself (if it comes in
contact with the oil), the possible addition of fresh oil,
temperature and finally, and of particular relevance, the
kind of oil used [15]. Virgin olive oil is well known for its
fatty acid composition, minor constituents, including toc-
opherols, b-carotene and mainly phenolic compounds that
contribute to its high-oxidative stability [16]. The fatty acid
composition of virgin olive oils (in particular the low
amount of polyunsaturated fatty acids) has an important
effect on their stability during frying, but other factors,
such as the amount and types of naturally occurring minor
constituents can also affect oil stability and the formation
of undesirable fried food by-products [17].
The objectives of this investigation were to study the
chemical changes produced during frying with extra virgin
olive oil (EVOO) and to evaluate the influence of the
diverse classes of compounds naturally present (fatty acids,
phenols, tocopherols and pigments). For this purpose, a
model frying system at 180 �C up to 60 min was used, and
modifications in volatile compounds were analyzed by
DHS–GC–MS. The use of chemometric techniques, such
as genetic algorithms (GA), capable of screening the rel-
evant variables [18], and studies of multiple linear
regression (MLR), able to build efficient mathematical
models and even simple understanding [19], may be crucial
for in-depth studies and analysis of cost–efficiency
relationships.
Materials and methods
Reagents and standards
The standards used for spectrophotometric evaluation of
phenols (gallic acid), antioxidant activity (a-tocopherol)
and ABTS [2,20-azinobis(3-ethylbenzothiazoline)-6-sul-
fonic acid, diammonium salt], and ethyl propionate were
obtained from Sigma-Aldrich (St. Louis, MO, USA). All
solvents were of analytical or HPLC grade (Merck & Co.
Inc., Darmstadt, Germany).
Samples
Sampling of 15 virgin olive oils was carried out directly in
an industrial mill over a period of 3 months from 2006 to
2007: November (7 samples), December (6 samples) and
January (2 samples). Samples were stored in the dark at
room temperature until analysis and frying treatment.
Sample preparation
A 150 mL of each EVOO sample were used for the frying
experiments using a 250 mL black glass beaker with a
surface to volume ratio of 50.2 cm2/150 mL. Two con-
secutive 30-min frying cycles were carried out using gel-
atinized maize starch. During the frying process, the oil
was heated to 180� (the temperature was controlled during
the entire process, and was maintained between 175 and
185 �C). At the end of first frying cycle, the oil was cooled
for 15 min at room temperature.
Gelatinized maize starch was prepared to obtain 3-g
cubes. These cubes had a volume of 1 cm3, and were
prepared using starch maize and distilled water (1:3, w/
w). For each frying cycle, 20 mL of oil was collected
immediately after the frying process and analyzed within
24 h.
218 Eur Food Res Technol (2009) 230:217–229
123
Free acidity and PV
Evaluation of primary auto-oxidation products was carried
out by the determination of the PV according to the official
method described in Regulation EEC 2568/91 [20]. Free
acidity (FA) was also determined according to EU official
method [20]. The mean values are the average of three
replicates per sample.
Extraction and analysis of total phenolic compound
content
Extraction and analysis of total phenolic compounds were
carried out according to Del Carlo et al. [21]. Briefly, C18
cartridges (1 g, 6 mL) (International Sorbent Technology,
UK) were used for the extraction of the phenolic fraction
according to the following protocol: 1 g of olive oil was
dissolved in 10 mL of n-hexane, and the solution was loaded
onto a column previously conditioned with 2 9 10 mL of
methanol and 2 9 10 mL of n-hexane. The column was
eluted with 4 9 10 mL of n-hexane to eliminate the lipo-
philic fraction, and retained phenolic compounds were
recovered by eluting with 4 9 10 mL of methanol.
The total phenolic compound content of the extract was
evaluated colorimetrically using the Folin–Ciocalteau
reagent. The method was adapted as described by Singleton
and Rossi [22]. A diluted extract (0.5 mL of 1:10, v/v) or
phenolic standard was mixed with Folin–Ciocalteau
reagent (5 mL, 1:10 diluted with Nanopure water) and
aqueous Na2CO3 (4 mL, 1 M). Solutions were maintained
at room temperature for 60 min and total polyphenols were
determined colorimetrically at 725 nm. Gallic acid stan-
dard solutions were used to calibrate the method, and
phenolic content was expressed as gallic acid equivalents
(GAE). The mean values were the average of two repli-
cates per sample.
Chlorophylls analysis by HPLC
For determination of chlorophylls a and b and the respec-
tive products of transformation, the pheophytins a and b,
the analytical procedure reported by Minguez Mosquera
et al. [23] was used. This technique is characterized by
preliminary extraction of the pigments by liquid-phase
distribution (LPD). LPD is realized using n-hexane and
dimethylformamide (DMF) as solvents; the hexanic frac-
tion retains lipids and carotenoids, while the DMF fraction
retains chlorophylls and chlorophyllic derivatives such as
pheophytins and xanthophylls. The former fraction was
used for spectrophotometric determination of carotenoids
(vide infra). The latter fraction was then treated with a 2%
Na2SO4 and re-extracted with n-hexane–diethyl ether (1:1);
organic and aqueous phases were obtained, and the first
was discarded removing polyphenols and other hydrophilic
compounds, while the second was dried and re-suspended
in acetone before HPLC injection. The mean values are the
average of two replicates per sample.
Spectrophotometric analysis of carotenoids
The hexanic fraction obtained during chlorophyll extrac-
tion was used for spectrophotometric determination of
carotenoids. 3 mL of the solution were placed into a cuv-
ette and the absorbance measured at k = 454 nm with a
LambdaBio 20 Spectrophotometer (Perkin Elmer, Monza,
Italy). The b-carotene concentration was determined
according to the following equation:
Cðmg� kg�1Þ ¼ E � 10; 000
2; 592
The mean values are the average of two replicates per
sample.
a-Tocopherol determination
A solution of oil (1 g) in acetone (10 mL) was analyzed by
HPLC on a RP-C18 column (particle size 4 lm, 250, 4 mm
i.d.). 20 lL were injected and eluted with 0.5% H3PO4 water
solution and acetonitrile/methanol 1:1 (v/v) at a flow rate of
1.3 mL min-1. A UV detector at k = 295 nm was used. The
mean values are the average of two replicates per sample.
Estimation of TEAC activity using the ABTS�? assay
The radical scavenging activity was measured using the
TEAC (a-tocopherol equivalent antioxidant activity)
method modified for lipophilic samples. The ABTS�?
solution was prepared by reaction of a 7 mM aqueous
ABTS solution with a potassium persulfate (K2S2O8)
solution, final concentration 2.45 mM, as proposed by Re
et al. [24]. Following the storage in the dark for 16 h, the
radical cation solution was further diluted in n-hexane/
ethanol 1:9 v/v until the initial absorbance value of
0.7 ± 0.05 at 734 nm was reached. Each phenolic extract
under study was directly analyzed at three different dilution
ratios (1:5, 1:10, 1:20) in n-hexane/ethanol: a constant
volume (30 lL) of the prepared solutions was added to the
ABTS�? solution and the decrease in absorbance was
recorded after 3 min under stirring. In the same experi-
mental conditions, a dose–response curve for a-tocopherol
as the reference compound was constructed in the range of
0.15–2.40 lM using the percent absorbance reduction as
response signal. For each sample, lmoL g-1 of a-tocoph-
erol equivalent was calculated using the linear regression
equation, yielding the RSA–TTP value. The mean values
are the average of two replicates per sample.
Eur Food Res Technol (2009) 230:217–229 219
123
Fatty acid composition
The fatty acid composition of oil samples, before frying,
was determined as methyl esters by capillary GC (Clarus
500 GC Perkin Elmer Inc., Shelton, CT) according to
Bendini et al. [13] after alkaline treatment of samples. The
alkaline treatment was carried out by mixing 0.05 g of oil
dissolved in 2 mL of n-hexane with 1 mL of 2 N KOH in
methanol according to Christie [25]. The mean values are
the average of two replicates per sample.
DHS–GC–MS analysis of volatile compounds
Olive oil (about 7 g) was weighed in a 10 mL vial and
mixed with an internal standard (ethyl propionate,
35.6 lg). The vials were sealed with an aluminum rubber
septum and conditioned at 35 �C for 15 min before the
analysis. The stripping into a heated block (70 �C) was
carried out for 120 s with helium at a rate of 8 mL min-1.
Volatile compounds were driven into a capillary tube that
was inside a cryogenic trap (liquid nitrogen) maintained at
-100 �C, and connected in on-column mode to the capil-
lary gas chromatograph. The connection to the analytical
column was not direct, as a Y press was inserted and
connected to a vapor exit valve. During the sampling step,
helium was back-flushed through the analytical column
with an outlet in the vapor exit device to avoid any con-
tamination of the column. At the end of sampling (purging)
time, the trap was heated to 240 �C for 5 s and volatile
compounds were desorbed and transferred to the analytical
column. The electronic eight-port valve switched, so that
helium came back in the original direction. The analytical
column used was a capillary fused silica column, 50-m
length 0.32-mm i.d., coated with PS 264, 3-lm film
thickness. The capillary GC was coupled directly to an MD
800 mass spectrometer. Gas chromatographic conditions
were an initial oven temperature of 40 �C for 6 min, then
raised by 5 �C min-1 to 180 �C and held for 5 min; sub-
sequently, the temperature was raised by 7 �C min-1 to
200 �C and held for 2 min, and finally raised by 7 �C
min-1 to 240 �C with 10 min of isotherm. The transfer line
temperature was kept at 250 �C. Mass spectrometer was
scanning from m/z 29 to 300 at 0.5-s cycle time. The mean
values are the average of two replicates per sample.
Chemometric methods
Genetic algorithms–partial least squares (GA-PLS)
Genetic algorithms are general purpose search algorithms
inspired by Charles Darwin’s principle of the ‘survival of
the fittest’ to solve complex optimization problems [26,
27]. GA-PLS [28] is hybrid approach that combines GA as
a powerful optimization method with PLS [29–32] as a
robust statistical method for variable selection. The com-
bination of variables and the internal predictivity of the
derived PLS model in GA-PLS correspond to a chromo-
some (binary bit string, by which the existence of a vari-
able is represented) and its fitness (explained variance and
the root mean square error in prediction, RMSEP) in GA,
respectively.
GA-PLS consists of three basic steps:
1. An initial population of chromosomes is created.
2. Fitness of each chromosome in the population is
evaluated by the internal predictivity of PLS.
3. The population of chromosomes in the next generation
is reproduced (selection, crossover and mutation of
chromosomes)
Steps 2 and 3 are continued until the number of the
repetitions is reached at the designated number of
generations.
In this study, crossover was set at 50% probability.
Mutation changes the value of a gene of an individual with
a given probability to introduce a degree of random noise
into the procedure. This helps to avoid local optima. In this
experiment, mutation occurs with a probability of 10%.
The initial population consisted of 30 chromosomes that
were evolved through minimal 200 generations. As a cri-
terion for accepting a solution, it was assumed that a
solution was already present in the population during the
last five generations [33]. This procedure was repeated for
10 different initial populations by applying different
‘seeds’ to find the optimal input variable subsets for neo-
formation compounds (NFCs).
In this study, it was important to obtain a model con-
taining as few variables as possible because this will pro-
vide a simple and interpretable model. Therefore, the
quality of a chromosome is determined by both its internal
predictivity and the number of variables it uses.
Data were processed employing GA-PLS routines [34]
running in Matlab (Mathworks Inc., Natick, MA, USA).
Multiple linear regression (MLR)
Multiple linear regression is one of the simplest methods of
producing a multivariate calibration model [19], and is still
one of the most commonly used. The advantage of MLR is
its simple form and easily interpretable mathematical
expression. A fixed regressor model is used, which of the
form:
Y ¼ XBþ E ð1Þ
where B are the unknown parameters and Y are the vectors,
the measured calibration data for regressor variables X and
response variable Y, respectively. The error vector, E,
220 Eur Food Res Technol (2009) 230:217–229
123

consists of the systematic modeling errors and random
measurement errors assumed to have normal distribution
and expected value E(E) = 0. Estimated of the parameter
values are determined by minimizing E. This is simply
done by solving the equation:
B0 ¼ XXT� ��1
XTY ð2Þ
where B0 is the least squares estimate of B. This produces a
model:
Z ¼ XB0 ð3Þ
where Z is the predicted response vector given the cali-
bration matrix X [19]. Although utilized to a large effect,
MLR is vulnerable to descriptors (variables) which are
correlated to one another, making it impossible to dis-
criminate among correlated sets that are significant to the
model. To overcome this problem, new methodologies
based on the MLR have been developed which include best
MLC [35], Heuristic method [36], GA, stepwise MLR [37]
and factor analysis MLR [38].
The MLR models with sequential variable selection
were constructed using the Design-Expert� 7.0.0 software
(Stat-Easy Inc., Minneapolis, MN, USA). For sequential
variable selection, a stepwise regression with type II error
associated with the F-in = 0.10 (a-in) and type I error
associated with the F-out = 0.30 (a-out) was carried out.
In addition, forward regression was carried out with a-
in = 0.20, when the first did not yield satisfactory results.
Results and discussion
Evaluation of FA and PV
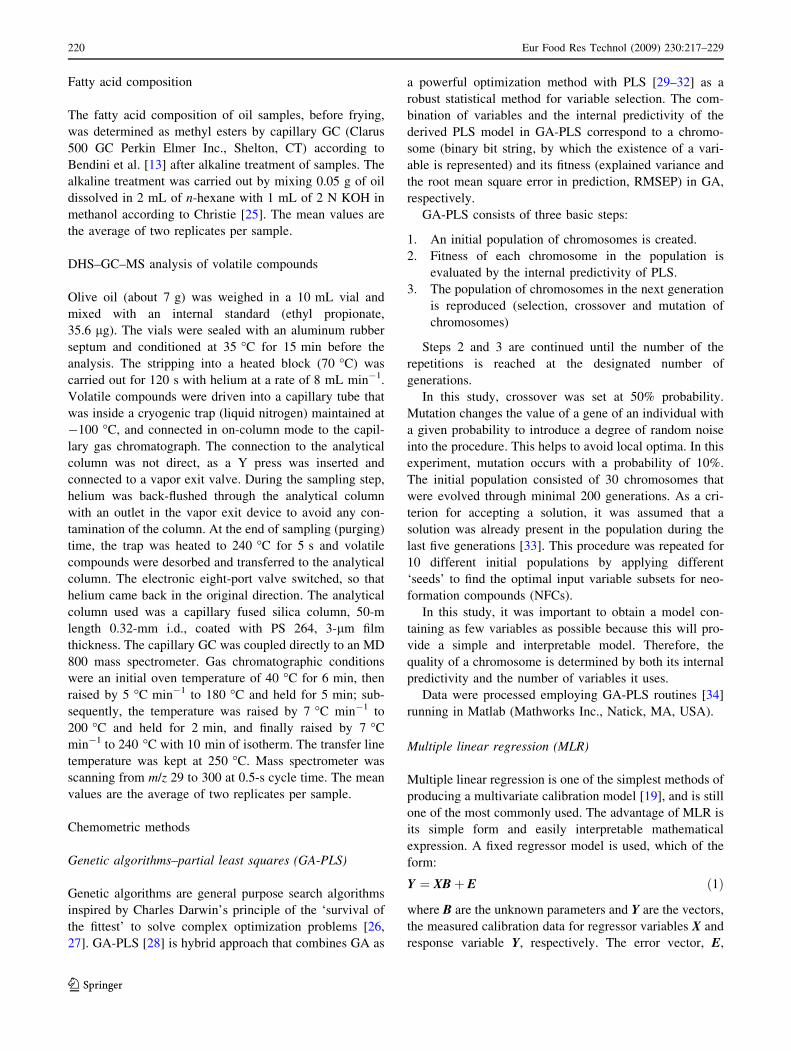
The FA values (reported in Table 1) of the oils studied
ranged from 0.14 to 1.03%. Taking into account, the FA of
oil samples, there were 14 oils that could be classified as
‘‘extra virgin olive oil’’ with low free FA values (B0.8%),
while one samples (S15) had an FA between 0.8 and 2%
that defined it as ‘‘virgin olive oil’’ according to European
regulations [39]. Regarding PV, the samples showed values
from 5.5 to 11.2 meq O2 kg-1 oil and an average value of
7.5 (Table 1). This confirms that the samples were all
freshly produced. PV data of all samples were lower than
their legal limit of 20 meq O2 kg-1 [39], respectively.
Phenols, tocopherols and carotenoid content
Untreated EVOO samples were analyzed to quantify phe-
nols, tocopherols and carotenoids, which are known for their
antioxidant activity [16, 40], to evaluate their effects on oil
changes after frying treatment. Data are reported in Table 1.
With respect to the content of phenolic compounds, two
analyses were carried out. In the first, total phenolic com-
pound content (TTP) was evaluated by spectrophotometric
analysis with Folin–Ciocalteau reagent. The TTP reported in
Table 1 presented a high variability depending on the vari-
ety of olives, different typologies of transformation and
production systems [41]. TTP ranged from 266.6 to
803.5 mg GAE kg-1 for S15 and S8, respectively. Fifteen
samples showed a medium average value of 408.8
(mg GAE kg-1 of oil), which demonstrates the virgin olive
oils used in this study were of good quality. In particular, 4
samples showed a TTP lower than 400 mg GAE kg-1; 8
ranged between 401 and 500 mg GAE kg-1 and 3 higher
than 501 mg GAE kg-1. These data are in good agreement
with other quality parameters such as FA and PV and con-
firm the good quality and freshness of the samples.
RSA–TTP values showed a low correlation with TTP
analysis (r = 0.48 for P \ 0.1). However, the outside
values showed an agreement between two analyses, and, in
fact, S8 showed the highest TTP and RSA–TTP values.
S15 exhibited the lowest values for TTP and RSA–TTP.
In EVOO, tocopherols present were found as: a-, b- and
c-tocopherols. a-tocopherol was by far the most abundant
isoform of vitamin E [42]. Table 1 reports the tocopherol
content of the 15 oils before frying treatment. In five
samples tested, the total tocopherol was not below
100 mg kg-1, and only one sample (S7) exceeded
150 mg kg-1 of oil. The average tocopherol concentration
was 115.7 mg kg-1 of oil, which is medium low and is
related to the olive variety and degree of fruit ripening [43].
Spectrophotometric analysis of total carotenoid showed
minimum value of 1.3 and maximum of 2.9, expressed as
mg kg-1 of oil (Table 1). Although low, these values are in
agreement with the previous results reported [44] for olive
oil produced in the Molise region close to the area of
production of this sample oil (Abruzzo region).
Fatty acid composition
Differences in fatty acid composition between the 15 oil
samples were more pronounced for palmitic (C16:0),
stearic (C18:0), oleic (C18:1) and linoleic (C18:2) acids
(Table 1). With regards to the ratio between oleic and
linoleic acid (C18:1/C18:2), the average value of 14.1 is
high and represents an important contribute to virgin olive
oil oxidative stability [16]. In particular, this ratio ranged
from 9.8 to 17.2 and the highest values were observed in
samples S4 and S10.
Volatile profile of the analyzed samples at frying time
zero (t0)
DHS-GC–MS analysis of volatile fractions of virgin olive
oil samples at t0, just prior to the frying process, showed
Eur Food Res Technol (2009) 230:217–229 221
123
Ta
ble
1C
hem
ical
char
acte
rist
ics
of
oli
ve
oil
sam
ple
sb
efo
refr
yin
gtr
eatm
ent
Sam
ple
nam
e
FA
PV
TP
P(G
AE
)R
SA
-TP
PC
aro
t-T
ot
To
co-T
ot
C1
6:0
C1
6:1
C1
8:0
C1
8:1
C1
8:2
C1
8:3
C2
0:0
C2
0:3
C2
2:0
C2
4:0
C1
8:1
/
C1
8:2
S1
0.1
65
.12
82
.20
.77
62
.13
10
8.7
10
.81
0.9
51
.88
79
.14
5.8
00
.29
0.3
20
.52
0.1
10
.04
13
.64
S2
0.2
75
.53
77
.50
.62
52
.70
13
3.7
11
.44
0.8
81
.95
78
.81
5.4
10
.31
0.3
50
.52
0.1
20
.05
14
.57
S3
0.1
74
.82
73
.60
.49
92
.14
11
5.4
12
.36
0.9
61
.77
78
.52
4.9
50
.28
0.3
10
.56
0.0
90
.03
15
.86
S4
0.4
29
.22
89
.20
.29
71
.47
95
.51
2.4
21
.01
1.9
07
8.6
74
.61
0.2
70
.32
0.5
40
.09
0.0
31
7.0
7
S5
0.2
58
.53
36
.80
.61
21
.56
92
.61
3.3
71
.06
1.6
37
7.3
15
.22
0.2
80
.28
0.5
70
.09
0.0
31
4.8
1
S6
0.1
45
.83
14
.30
.77
82
.69
90
.91
1.2
70
.80
1.7
87
9.4
35
.27
0.3
00
.31
0.5
40
.10
0.0
41
5.0
7
S7
0.2
26
.85
18
.70
.33
72
.76
18
8.7
10
.68
0.8
11
.82
79
.71
5.4
80
.31
0.3
20
.56
0.1
10
.04
14
.55
S8
0.2
28
.08
03
.51
.13
71
.85
13
6.5
11
.65
0.8
01
.86
77
.17
6.8
70
.34
0.3
60
.65
0.1
10
.05
11
.23
S9
0.3
97
.06
16
.40
.57
32
.11
13
2.3
12
.91
1.0
21
.78
76
.63
6.1
70
.29
0.3
00
.61
0.1
00
.04
12
.42
S1
00
.28
6.0
43
3.8
0.5
73
2.8
51
24
.41
1.7
70
.91
1.7
87
9.5
14
.62
0.2
90
.30
0.5
40
.09
0.0
31
7.2
1
S1
10
.20
6.0
37
8.4
0.6
04
2.9
31
10
.61
0.8
80
.90
1.8
08
0.0
34
.94
0.2
90
.31
0.5
50
.10
0.0
41
6.2
0
S1
20
.22
6.4
33
1.6
0.8
34
2.2
61
18
.81
1.5
30
.94
1.6
87
8.5
95
.78
0.3
10
.30
0.5
70
.10
0.0
41
3.6
0
S1
30
.31
7.4
47
7.1
1.0
85
1.6
37
9.8
11
.64
0.7
82
.11
76
.84
7.0
30
.32
0.3
80
.61
0.1
20
.05
10
.93
S1
40
.53
10
.03
05
.60
.57
52
.77
77
.71
2.6
10
.83
2.0
17
5.2
77
.69
0.3
10
.35
0.6
30
.12
0.0
59
.79
S1
51
.03
11
.22
66
.60
.27
21
.33
12
3.3
11
.62
0.7
21
.80
78
.84
5.4
70
.32
0.3
20
.63
0.1
10
.04
14
.41
Mea
n0
.33
7.3
40
8.8
0.6
29
2.2
21
15
.71
1.8
70
.89
1.8
37
8.2
45
.68
0.3
00
.32
0.5
80
.10
0.0
41
4.1
2
Min
0.1
44
.82
66
.60
.27
21
.33
77
.71
0.6
80
.72
1.6
37
5.2
74
.61
0.2
70
.28
0.5
20
.09
0.0
39
.79
Max
1.0
31
1.2
80
3.5
1.1
37
2.9
31
88
.71
3.3
71
.06
2.1
18
0.0
37
.69
0.3
40
.38
0.6
50
.12
0.0
51
7.2
1
FA
free
acid
ity
per
cen
tag
e(e
xp
ress
edas
,g
ole
icac
ido
n1
00
go
fo
il;
mea
no
fS
D=
0.0
2),
PV
per
ox
ide
val
ues
(ex
pre
ssed
asm
eqO
2k
g-
1o
il;
mea
no
fS
D=
0.3
),T
TP
,R
SA
-TP
Pto
tal
ph
eno
ls
exp
ress
edas
gal
lic
acid
equ
ival
ent
(mg
gal
lic
acid
kg
-1
of
oil
),C
aro
t-to
tto
tal
caro
ten
oid
con
ten
t(m
gk
g-
1o
fo
il),
To
co-t
ot
tota
lto
cop
her
ol
con
ten
t(e
xp
ress
edas
mg
kg
-1
of
oil
),C
16
:0-
C2
4:0
fatt
yac
idco
mp
osi
tio
n(e
xp
ress
edas
per
cen
tag
e),
C1
8:1
/C1
8:2
rati
ob
etw
een
ole
ican
dli
no
leic
acid
s
222 Eur Food Res Technol (2009) 230:217–229
123

Table 2 Volatile compounds (expressed in lg kg-1) in olive oil samples before frying treatment
Rt Compound name S1 S2 S3 S4 S5 S6 S7 S8 S9 S10 S11 S12 S13 S14 S15
4.04 Acetaldehyde 24.7 42.9 28.6 17.0 14.8 28.4 19.5 60.9 23.3 31.8 29.8 27.6 83.5 14.8 92.4
4.69 Methylformate 10.8 145.4 131.2 6.5 21.7 31.9 51.4 13.6 24.3 21.2 40.9 17.6 30.0 8.0 147.4
5.41 Ethanol 6.4 2.1 2.3 4.6 1.0 1.1 2.5 1.1 1.2 1.4 2.7 0.7 5.6 2.8 6.0
6.32 2-Propenal (acrolein) n.d. n.d. n.d. n.d. n.d. n.d. n.d. n.d. n.d. n.d. n.d. n.d. n.d. n.d. n.d.
6.64 Propanal n.d. n.d. n.d. n.d. n.d. n.d. n.d. n.d. n.d. n.d. n.d. n.d. n.d. n.d. n.d.
7.63 Ethylformate 29.1 228.9 60.4 47.1 102.7 129.9 163.3 15.2 91.3 208.6 188.6 93.3 130.8 n.d. 343.1
7.81 Methylthiomethane 680.1 753.5 493.3 n.d. 342.1 600.5 488.5 246.2 372.6 212.6 411.5 365.3 555.9 683.8 842.7
8.15 Methylacetate 133.7 722.2 686.5 47.8 382.3 296.3 463.9 72.3 594.7 385.3 449.7 323.3 148.1 96.5 1,005.4
8.75 Dimethylsulfone 5.1 6.6 5.1 n.d. 4.4 8.6 n.d. 9.4 6.1 n.d. 7.6 3.9 n.d. 15.7 5.2
9.48 1-Propanol 29.6 53.1 30.5 11.5 33.0 70.5 42.5 45.6 54.2 24.7 62.8 42.0 173.8 39.3 295.1
10.04 2-Butenal (crotonal) n.d. n.d. n.d. n.d. n.d. n.d. n.d. n.d. n.d. n.d. n.d. n.d. n.d. n.d. n.d.
10.89 3-Buten-2-one n.d. n.d. n.d. n.d. n.d. n.d. n.d. n.d. n.d. n.d. n.d. n.d. n.d. n.d. n.d.
10.96 2-Butenone 3.9 n.d. n.d. 25.56 n.d. n.d. n.d. 4.99 3.3 n.d. n.d. n.d. n.d. n.d. 26.09
11.18 Butanal n.d. n.d. n.d. n.d. n.d. n.d. n.d. n.d. n.d. n.d. n.d. n.d. n.d. n.d. n.d.
11.42 2-Butanone 192.7 237.4 131.4 227.1 89.7 174.2 170.7 56.4 97.5 123.2 98.1 118.6 202.9 249.1 75.5
12.17 2-Methyl-3-buten-2-ol 10.3 3.9 8.9 n.d. 4.3 7.1 6.5 1.6 4.8 3.8 4.7 3.1 8.5 13.9 11.3
12.36 Ethylacetate 118.6 878.4 607.1 229.9 507.9 542.5 793.3 233.2 690.1 702.8 698.9 564.3 543.4 113.4 1,792.8
13.01 Isobutanol 125.1 462.2 398.5 28.0 237.2 457.1 518.4 178.5 327.2 262.1 457.2 311.4 607.2 224.1 1,067.3
13.76 2-Methyl-2-butanol 44.7 45.3 36.7 24.1 20.8 52.6 54.7 12.2 24.5 19.4 26.8 24.8 86.8 58.9 75.6
14.57 3-Methylbutanal 12.9 24.2 5.0 9.1 11.4 6.7 10.9 2.2 21.4 8.3 7.2 6.9 12.9 22.7 19.1
14.86 Diacetyl 1.5 1.7 0.8 1.2 0.5 1.3 1.1 0.3 0.4 n.d. 0.4 0.6 2.3 0.9 2.6
14.96 Butylformate 5.3 2.3 2.3 1.1 1.2 4.2 1.7 3.3 1.9 3.7 0.9 2.8 11.0 2.8 6.5
15.12 2-Methylbutanal 13.8 39.8 21.1 23.3 10.2 4.5 3.7 13.1 24.9 210.7 19.0 20.0 58.1 35.4 73.0
15.57 2-Methyltetrahydrofuran n.d. n.d. n.d. n.d. n.d. n.d. n.d. n.d. n.d. n.d. n.d. n.d. n.d. n.d. n.d.
15.98 1-Penten-3-ol 46.3 61.4 35.5 16.6 24.5 60.2 43.5 11.5 47.2 22.7 34.0 34.6 94.9 52.4 37.9
16.8 Pentanal n.d. n.d. n.d. n.d. n.d. n.d. n.d. n.d. n.d. n.d. n.d. n.d. n.d. n.d. n.d.
17.51 Ethylpropionate n.d. 6.6 6.9 2.3 5.1 7.5 11.3 4.0 7.9 10.2 12.1 11.1 5.9 1.7 49.6
17.64 3-Ethyl-2,2-
dimethyloxirane
n.d. n.d. n.d. n.d. n.d. n.d. n.d. n.d. n.d. n.d. n.d. n.d. n.d. n.d. n.d.
18.68 3-Methyl-1-butanol 73.8 676.1 535.1 35.5 287.5 659.7 579.8 138.3 388.7 452.8 488.4 396.5 677.3 190.1 1,079.8
18.88 2-Methyl-1-butanol 41.6 284.7 316.3 28.5 122.8 247.8 232.9 90.8 184.8 171.1 209.9 163.8 247.4 104.7 490.4
20.32 Amylformate 44.7 n.d. 25.5 4.6 3.3 20.4 n.d. 2.1 n.d. 5.5 n.d. 33.5 44.2 9.9 11.7
20.33 1-Pentanol n.d. n.d. n.d. n.d. n.d. n.d. n.d. n.d. n.d. n.d. n.d. n.d. n.d. n.d. n.d.
21.55 2-Hexanone 2.9 5.7 3.0 1.6 1.4 2.8 5.4 1.5 3.1 6.4 1.7 2.2 5.4 6.9 3.3
21.98 3-Hexenal 11.4 5.0 n.d. n.d. n.d. n.d. n.d. n.d. n.d. n.d. n.d. n.d. n.d. n.d. n.d.
22.13 Octane 512.4 444.2 430.6 376.7 265.8 440.7 334.3 137.0 370.1 390.6 283.5 308.2 608.8 478.5 911.8
22.41 2-Octene 1.8 n.d. 2.1 1.6 1.1 1.8 1.5 0.7 1.7 1.7 1.1 1.4 2.0 2.2 4.9
24.23 1-Octene 98.3 121.7 98.1 96.9 54.8 117.9 111.1 44.9 81.2 115.3 75.0 75.9 155.2 128.5 179.9
24.71 2-Hexenal 165.6 166.4 81.8 70.4 81.4 213.4 54.2 55.6 99.0 80.6 119.3 89.3 295.1 114.9 137.3
24.81 3-Hexenol 25.8 39.3 22.5 n.d. 2.2 29.8 20.6 4.1 9.3 18.4 20.9 13.7 45.9 12.8 27.0
25.04 2-Hexenol 22.3 54.5 48.9 7.9 17.3 104.4 27.9 4.9 27.9 36.2 55.8 50.6 97.0 24.0 70.7
25.19 1-Hexanol 28.5 153.2 116.1 10.8 31.0 176.5 52.5 10.5 46.1 59.9 122.8 62.5 97.9 41.1 186.6
26.34 2-Heptanone 3.4 3.8 2.7 n.d. n.d. 1.8 n.d. 0.2 1.0 n.d. 0.8 1.7 1.1 n.d. 0.7
26.86 Heptanal 30.1 6.0 22.2 n.d. 4.2 16.1 n.d. 3.1 10.5 6.6 8.2 13.2 20.0 9.5 11.6
29.39 2-Heptenal 11.8 n.d. 17.1 n.d. n.d. 14.4 n.d. n.d. 4.0 0.9 4.6 13.7 16.0 1.2 1.8
29.67 Heptanol 0.8 1.0 n.d. 0.3 n.d. 1.8 n.d. n.d. n.d. 0.7 n.d. 1.1 1.3 n.d. n.d.
30.51 6-Methyl-5-hepten-2-one 2.1 0.9 2.0 0.7 1.1 1.7 0.9 0.4 0.6 0.7 1.8 1.2 1.7 1.5 2.1
31.22 Octanal 1.2 n.d. 2.1 n.d. 0.5 0.6 n.d. 0.4 1.3 0.6 3.8 5.9 6.8 1.8 3.0
35.26 Nonanal 5.5 1.0 11.1 1.5 0.6 8.6 1.1 0.9 1.5 0.7 2.7 7.8 7.6 0.7 0.8
Internal standard isooctane at 0.02 lL = 13.8 lg
n.d. not detected
Eur Food Res Technol (2009) 230:217–229 223
123
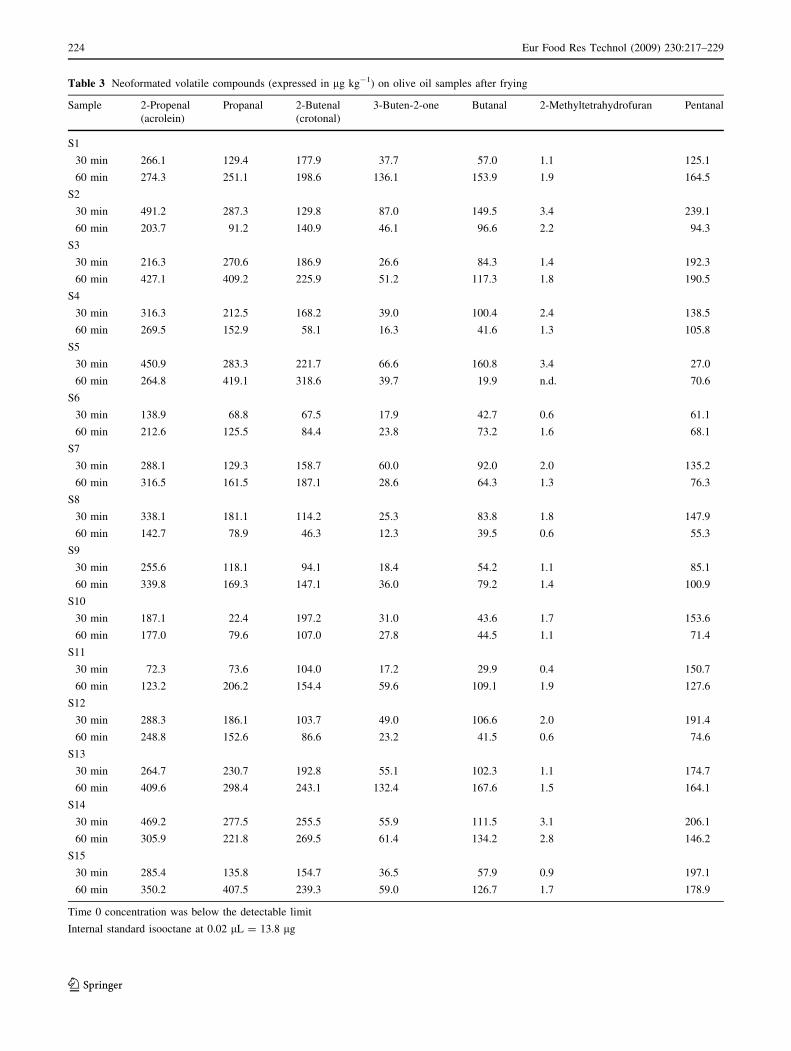
Table 3 Neoformated volatile compounds (expressed in lg kg-1) on olive oil samples after frying
Sample 2-Propenal
(acrolein)
Propanal 2-Butenal
(crotonal)
3-Buten-2-one Butanal 2-Methyltetrahydrofuran Pentanal
S1
30 min 266.1 129.4 177.9 37.7 57.0 1.1 125.1
60 min 274.3 251.1 198.6 136.1 153.9 1.9 164.5
S2
30 min 491.2 287.3 129.8 87.0 149.5 3.4 239.1
60 min 203.7 91.2 140.9 46.1 96.6 2.2 94.3
S3
30 min 216.3 270.6 186.9 26.6 84.3 1.4 192.3
60 min 427.1 409.2 225.9 51.2 117.3 1.8 190.5
S4
30 min 316.3 212.5 168.2 39.0 100.4 2.4 138.5
60 min 269.5 152.9 58.1 16.3 41.6 1.3 105.8
S5
30 min 450.9 283.3 221.7 66.6 160.8 3.4 27.0
60 min 264.8 419.1 318.6 39.7 19.9 n.d. 70.6
S6
30 min 138.9 68.8 67.5 17.9 42.7 0.6 61.1
60 min 212.6 125.5 84.4 23.8 73.2 1.6 68.1
S7
30 min 288.1 129.3 158.7 60.0 92.0 2.0 135.2
60 min 316.5 161.5 187.1 28.6 64.3 1.3 76.3
S8
30 min 338.1 181.1 114.2 25.3 83.8 1.8 147.9
60 min 142.7 78.9 46.3 12.3 39.5 0.6 55.3
S9
30 min 255.6 118.1 94.1 18.4 54.2 1.1 85.1
60 min 339.8 169.3 147.1 36.0 79.2 1.4 100.9
S10
30 min 187.1 22.4 197.2 31.0 43.6 1.7 153.6
60 min 177.0 79.6 107.0 27.8 44.5 1.1 71.4
S11
30 min 72.3 73.6 104.0 17.2 29.9 0.4 150.7
60 min 123.2 206.2 154.4 59.6 109.1 1.9 127.6
S12
30 min 288.3 186.1 103.7 49.0 106.6 2.0 191.4
60 min 248.8 152.6 86.6 23.2 41.5 0.6 74.6
S13
30 min 264.7 230.7 192.8 55.1 102.3 1.1 174.7
60 min 409.6 298.4 243.1 132.4 167.6 1.5 164.1
S14
30 min 469.2 277.5 255.5 55.9 111.5 3.1 206.1
60 min 305.9 221.8 269.5 61.4 134.2 2.8 146.2
S15
30 min 285.4 135.8 154.7 36.5 57.9 0.9 197.1
60 min 350.2 407.5 239.3 59.0 126.7 1.7 178.9
Time 0 concentration was below the detectable limit
Internal standard isooctane at 0.02 lL = 13.8 lg
224 Eur Food Res Technol (2009) 230:217–229
123

that the sample aroma consisted of a complex mixture of
more than 38 compounds, representing 97.8–99.9% of the
total GC area (data not shown). Table 2 reports basic
information on the volatile composition of virgin olive oils
before frying. The total volatile content (TVs) of all sam-
ples ranged from 1.4 to 9.1 mg kg-1. Furthermore, in the
headspace of all oil samples, the identified compounds
were mainly alcohols (0.5–3.3 mg kg-1), ketones (0.1–
0.3 mg kg-1), esters (\3.4 mg kg-1), hydrocarbons
(\1.9 mg kg-1) and aldehydes (\0.3 mg kg-1), while no
organic acids or furans were found.
As expected, all fresh olive oil samples contained C6
compounds, also called ‘‘green volatiles’’ which are of
great importance for the green perception in virgin olive oil
flavor [45].
These compounds are derived from a cascade of enzy-
matic reactions starting with the formation, by the action of
lipoxygenase (LOX), of 13-hydroperoxides from linoleic
and linolenic acid [46]. The percentage of C6 aldehydes
ranged between 30 and 79% of total LOX products, with
the exception of one sample having a mean value of 50%.
These values are in accordance with the recent findings in
the analysis of volatile compounds of EVOO [47].
The mean total C6 content was 0.3 mg kg-1, whereas
the mean total C5 content was 1.2 mg kg-1 of which 49
and 58% were C6 and C5 alcohols, respectively.
Neoformation compounds
The analysis of the 15 samples collected, respectively, at
30 min (t30) and 60 min (t60) during the frying process
showed that seven compounds that were not detectable in
the samples at t0 were present after the thermal treatment;
namely, five aldehydes (2-propenal, 2-butenal, propanal,
butanal and pentanal), 1 ketone (3-buten-2-one), 1 furan (2-
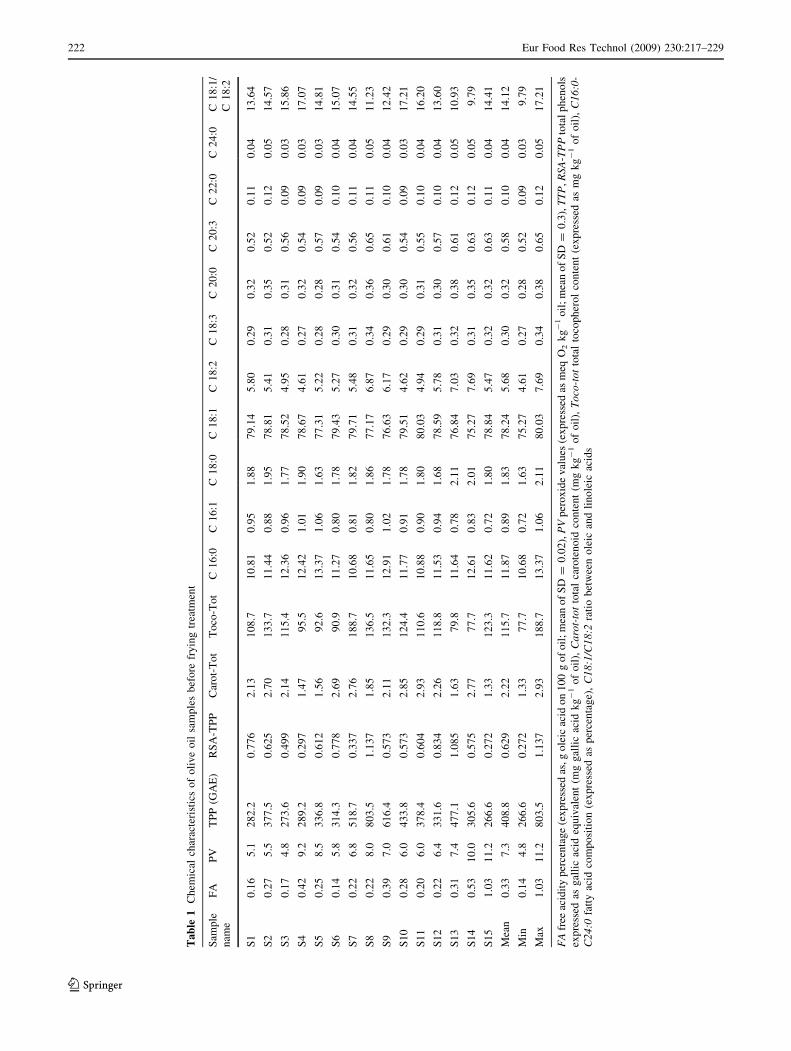
methyltetrahydrofuran) are reported in Table 3. Figure 1
shows the mean content of these compounds expressed as a
natural logarithm for a better evaluation of the different
trends during frying in the same scale.
Quantitatively, the five aldehydes represent the most
abundant compounds formed during the frying process and
are general markers of oxidation. As a mean value over the
15 samples, they represent 95% of the total area of NFCs
both for t30 and t60 of frying process. Among aldehydes, 2-
propenal (acrolein) was the most abundant representing 34
and 32% of total aldehydes formed at t30 and t60 frying
process, respectively. Acrolein concentration ranged
between 72.3 and 491.2 lg kg-1 at 30 min and 123.2 and
427.1 lg kg-1 at 60 min. No significant differences in
acrolein concentrations were observed after t30 and t60.
Propanal was the second most abundant aldehyde produced
during the frying process. This compound represented 20
and 25% of total aldehyde formed at t30 and t60, respectively.
Propanal concentrations ranged between 22.4 and
287.3 lg kg-1 at t30 and 78.9 and 419.1 lg kg-1 at t60.
Significant differences in propanal concentration (mean
value) were observed: 173.8 and 215.0 lg kg-1 after 30 and
60 min, respectively. 2-butenal was the third most abundant
aldehyde produced during frying. This compound repre-
sented 18 and 19% of total aldehyde formed at t30 and t60,
respectively. 2-butenal concentrations ranged between 67.5
and 255.5 lg kg-1 at 30 min and 46.3 and 318.6 lg kg-1 at
60 min. No significant differences in 2-butenal concentra-
tions were observed after 30 and 60 min. Pentanal was also
produced during frying, and represented 17 and 13% of total
aldehyde formed at t30 and t60 min, respectively. Pentanal
concentrations ranged between 27.0 and 239.1 lg kg at t30
min and 71.4 and 190.5 lg kg-1 at t60 min. As a mean value,
no significant differences in pentanal concentration were
observed after 30 and 60 min. Finally, butanal was the fifth
most abundant aldehyde detected in fried olive oil. This
compound accounted for the 10% of total aldehyde at both
t30 and t60. Butanal concentrations ranged between 29.9 and
149.5 lg kg-1 at t30 and from 19.9 and 167.6 lg kg-1 at t60.
As a mean value, no significant differences in butanal con-
centrations were observed after 30 and 60 min.
Among the aldehydes detected, only pentanal is reported
to be responsible for a woody, bitter and oily aroma [48].
Acrolein and crotonal have been reported to be toxic
compounds [49, 50]. The ketone 3-buten-2-one and 2-
methyltetrahydrofuran constituted the remaining 5% of
total neoformation products, and none of these compounds
was relevant in terms of off-flavor and toxicity. Nonethe-
less, all these compounds can be used singularly, or as a
group, as a marker of high-temperature thermal oxidation.
Chemometric analysis
The aim of this analysis was to identify compounds present
in olive oil that were statistically related to the develop-
ment of compounds during frying. In the first instance, a
screening step for relevant variables using a GA coupled
0.0
0.5
1.0
1.5
2.0
2.5
0 min 30 min 60 min
ln (
µg k
g-1
)
Frying time
acrolein
propanal
crotonal
pentanal
butanal
3-buten-2-one
2-methyltetrahydrofuran
Fig. 1 Plot showing the trends of neoformated volatile compounds
on olive oil samples during frying. Mean values of data of Table 3 are
reported in the figure
Eur Food Res Technol (2009) 230:217–229 225
123

q
q
qqq
q
q
A B
C D
E F
G H
Fig. 2 Histograms of cumulative frequency of compounds results of
GA-PLS screening for acrolein (a), propanal (b), crotonal (c), 3-
buten-2-one (d), butanal (e), 2-methyltetrahydrofuran (MTHF) (f) and
pentanal (g). Variance versus number of compounds (h) contributing
to the PLS model. Gene frequency versus number of compounds
(h) contributing to the PLS model
226 Eur Food Res Technol (2009) 230:217–229
123
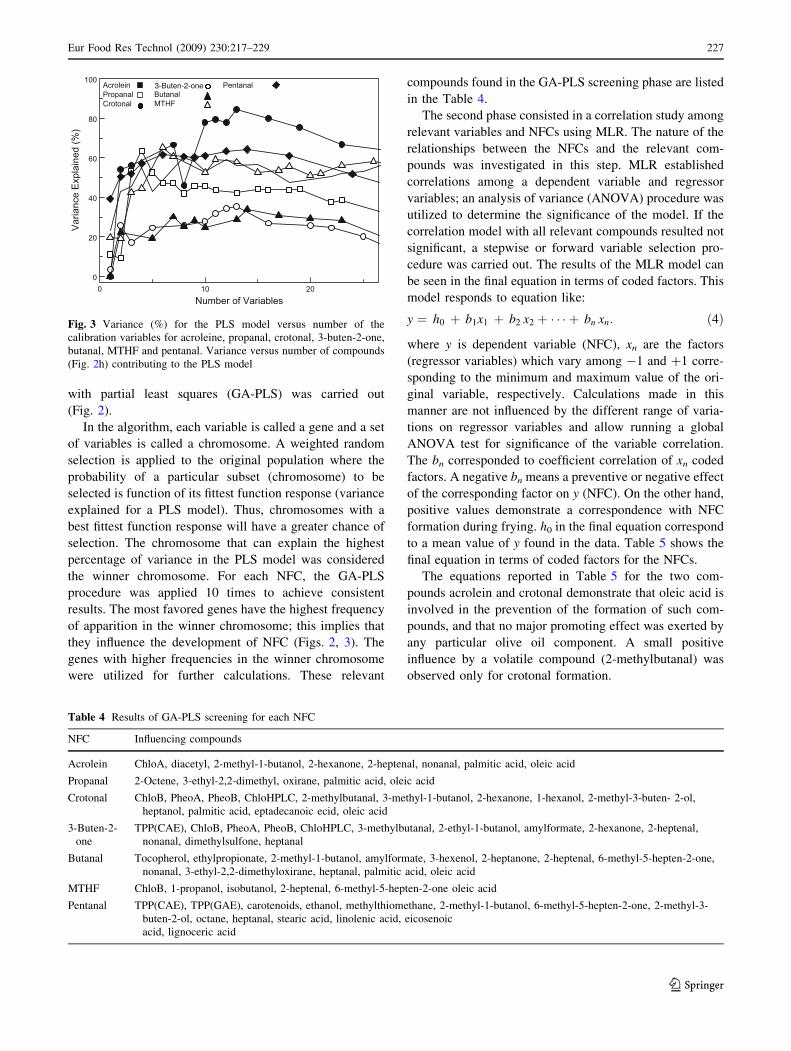
with partial least squares (GA-PLS) was carried out
(Fig. 2).
In the algorithm, each variable is called a gene and a set
of variables is called a chromosome. A weighted random
selection is applied to the original population where the
probability of a particular subset (chromosome) to be
selected is function of its fittest function response (variance
explained for a PLS model). Thus, chromosomes with a
best fittest function response will have a greater chance of
selection. The chromosome that can explain the highest
percentage of variance in the PLS model was considered
the winner chromosome. For each NFC, the GA-PLS
procedure was applied 10 times to achieve consistent
results. The most favored genes have the highest frequency
of apparition in the winner chromosome; this implies that
they influence the development of NFC (Figs. 2, 3). The
genes with higher frequencies in the winner chromosome
were utilized for further calculations. These relevant
compounds found in the GA-PLS screening phase are listed
in the Table 4.
The second phase consisted in a correlation study among
relevant variables and NFCs using MLR. The nature of the
relationships between the NFCs and the relevant com-
pounds was investigated in this step. MLR established
correlations among a dependent variable and regressor
variables; an analysis of variance (ANOVA) procedure was
utilized to determine the significance of the model. If the
correlation model with all relevant compounds resulted not
significant, a stepwise or forward variable selection pro-
cedure was carried out. The results of the MLR model can
be seen in the final equation in terms of coded factors. This
model responds to equation like:
y ¼ h0 þ b1x1 þ b2 x2 þ � � � þ bn xn: ð4Þ
where y is dependent variable (NFC), xn are the factors
(regressor variables) which vary among -1 and ?1 corre-
sponding to the minimum and maximum value of the ori-
ginal variable, respectively. Calculations made in this
manner are not influenced by the different range of varia-
tions on regressor variables and allow running a global
ANOVA test for significance of the variable correlation.
The bn corresponded to coefficient correlation of xn coded
factors. A negative bn means a preventive or negative effect
of the corresponding factor on y (NFC). On the other hand,
positive values demonstrate a correspondence with NFC
formation during frying. h0 in the final equation correspond
to a mean value of y found in the data. Table 5 shows the
final equation in terms of coded factors for the NFCs.
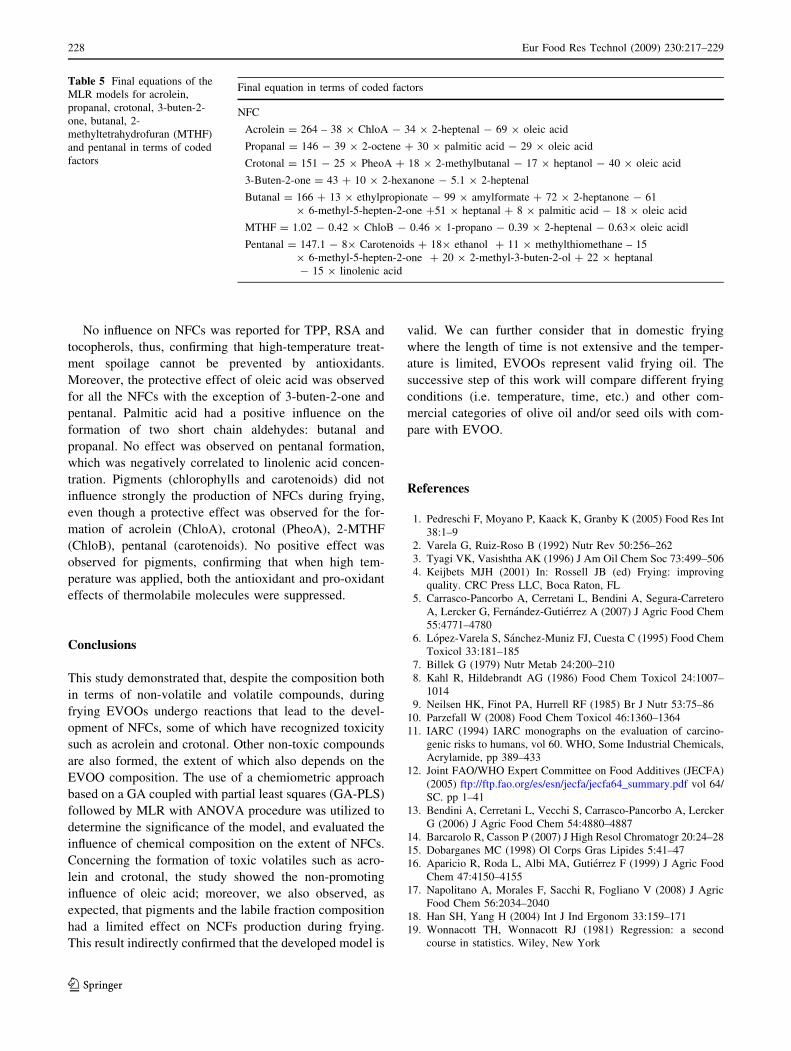
The equations reported in Table 5 for the two com-
pounds acrolein and crotonal demonstrate that oleic acid is
involved in the prevention of the formation of such com-
pounds, and that no major promoting effect was exerted by
any particular olive oil component. A small positive
influence by a volatile compound (2-methylbutanal) was
observed only for crotonal formation.
3-Buten-2-one
Fig. 3 Variance (%) for the PLS model versus number of the
calibration variables for acroleine, propanal, crotonal, 3-buten-2-one,
butanal, MTHF and pentanal. Variance versus number of compounds
(Fig. 2h) contributing to the PLS model
Table 4 Results of GA-PLS screening for each NFC
NFC Influencing compounds
Acrolein ChloA, diacetyl, 2-methyl-1-butanol, 2-hexanone, 2-heptenal, nonanal, palmitic acid, oleic acid
Propanal 2-Octene, 3-ethyl-2,2-dimethyl, oxirane, palmitic acid, oleic acid
Crotonal ChloB, PheoA, PheoB, ChloHPLC, 2-methylbutanal, 3-methyl-1-butanol, 2-hexanone, 1-hexanol, 2-methyl-3-buten- 2-ol,
heptanol, palmitic acid, eptadecanoic ecid, oleic acid
3-Buten-2-
one
TPP(CAE), ChloB, PheoA, PheoB, ChloHPLC, 3-methylbutanal, 2-ethyl-1-butanol, amylformate, 2-hexanone, 2-heptenal,
nonanal, dimethylsulfone, heptanal
Butanal Tocopherol, ethylpropionate, 2-methyl-1-butanol, amylformate, 3-hexenol, 2-heptanone, 2-heptenal, 6-methyl-5-hepten-2-one,
nonanal, 3-ethyl-2,2-dimethyloxirane, heptanal, palmitic acid, oleic acid
MTHF ChloB, 1-propanol, isobutanol, 2-heptenal, 6-methyl-5-hepten-2-one oleic acid
Pentanal TPP(CAE), TPP(GAE), carotenoids, ethanol, methylthiomethane, 2-methyl-1-butanol, 6-methyl-5-hepten-2-one, 2-methyl-3-
buten-2-ol, octane, heptanal, stearic acid, linolenic acid, eicosenoic
acid, lignoceric acid
Eur Food Res Technol (2009) 230:217–229 227
123
No influence on NFCs was reported for TPP, RSA and
tocopherols, thus, confirming that high-temperature treat-
ment spoilage cannot be prevented by antioxidants.
Moreover, the protective effect of oleic acid was observed
for all the NFCs with the exception of 3-buten-2-one and
pentanal. Palmitic acid had a positive influence on the
formation of two short chain aldehydes: butanal and
propanal. No effect was observed on pentanal formation,
which was negatively correlated to linolenic acid concen-
tration. Pigments (chlorophylls and carotenoids) did not
influence strongly the production of NFCs during frying,
even though a protective effect was observed for the for-
mation of acrolein (ChloA), crotonal (PheoA), 2-MTHF
(ChloB), pentanal (carotenoids). No positive effect was
observed for pigments, confirming that when high tem-
perature was applied, both the antioxidant and pro-oxidant
effects of thermolabile molecules were suppressed.
Conclusions
This study demonstrated that, despite the composition both
in terms of non-volatile and volatile compounds, during
frying EVOOs undergo reactions that lead to the devel-
opment of NFCs, some of which have recognized toxicity
such as acrolein and crotonal. Other non-toxic compounds
are also formed, the extent of which also depends on the
EVOO composition. The use of a chemiometric approach
based on a GA coupled with partial least squares (GA-PLS)
followed by MLR with ANOVA procedure was utilized to
determine the significance of the model, and evaluated the
influence of chemical composition on the extent of NFCs.
Concerning the formation of toxic volatiles such as acro-
lein and crotonal, the study showed the non-promoting
influence of oleic acid; moreover, we also observed, as
expected, that pigments and the labile fraction composition
had a limited effect on NCFs production during frying.
This result indirectly confirmed that the developed model is
valid. We can further consider that in domestic frying
where the length of time is not extensive and the temper-
ature is limited, EVOOs represent valid frying oil. The
successive step of this work will compare different frying
conditions (i.e. temperature, time, etc.) and other com-
mercial categories of olive oil and/or seed oils with com-
pare with EVOO.
References
1. Pedreschi F, Moyano P, Kaack K, Granby K (2005) Food Res Int
38:1–9
2. Varela G, Ruiz-Roso B (1992) Nutr Rev 50:256–262
3. Tyagi VK, Vasishtha AK (1996) J Am Oil Chem Soc 73:499–506
4. Keijbets MJH (2001) In: Rossell JB (ed) Frying: improving
quality. CRC Press LLC, Boca Raton, FL
5. Carrasco-Pancorbo A, Cerretani L, Bendini A, Segura-Carretero
A, Lercker G, Fernandez-Gutierrez A (2007) J Agric Food Chem
55:4771–4780
6. Lopez-Varela S, Sanchez-Muniz FJ, Cuesta C (1995) Food Chem
Toxicol 33:181–185
7. Billek G (1979) Nutr Metab 24:200–210
8. Kahl R, Hildebrandt AG (1986) Food Chem Toxicol 24:1007–
1014
9. Neilsen HK, Finot PA, Hurrell RF (1985) Br J Nutr 53:75–86
10. Parzefall W (2008) Food Chem Toxicol 46:1360–1364
11. IARC (1994) IARC monographs on the evaluation of carcino-
genic risks to humans, vol 60. WHO, Some Industrial Chemicals,
Acrylamide, pp 389–433
12. Joint FAO/WHO Expert Committee on Food Additives (JECFA)
(2005) ftp://ftp.fao.org/es/esn/jecfa/jecfa64_summary.pdf vol 64/
SC. pp 1–41
13. Bendini A, Cerretani L, Vecchi S, Carrasco-Pancorbo A, Lercker
G (2006) J Agric Food Chem 54:4880–4887
14. Barcarolo R, Casson P (2007) J High Resol Chromatogr 20:24–28
15. Dobarganes MC (1998) Ol Corps Gras Lipides 5:41–47
16. Aparicio R, Roda L, Albi MA, Gutierrez F (1999) J Agric Food
Chem 47:4150–4155
17. Napolitano A, Morales F, Sacchi R, Fogliano V (2008) J Agric
Food Chem 56:2034–2040
18. Han SH, Yang H (2004) Int J Ind Ergonom 33:159–171
19. Wonnacott TH, Wonnacott RJ (1981) Regression: a second
course in statistics. Wiley, New York
Table 5 Final equations of the
MLR models for acrolein,
propanal, crotonal, 3-buten-2-
one, butanal, 2-
methyltetrahydrofuran (MTHF)
and pentanal in terms of coded
factors
Final equation in terms of coded factors
NFC
Acrolein = 264 – 38 9 ChloA - 34 9 2-heptenal - 69 9 oleic acid
Propanal = 146 - 39 9 2-octene ? 30 9 palmitic acid - 29 9 oleic acid
Crotonal = 151 - 25 9 PheoA ? 18 9 2-methylbutanal - 17 9 heptanol - 40 9 oleic acid
3-Buten-2-one = 43 ? 10 9 2-hexanone - 5.1 9 2-heptenal
Butanal = 166 ? 13 9 ethylpropionate - 99 9 amylformate ? 72 9 2-heptanone - 61
9 6-methyl-5-hepten-2-one ?51 9 heptanal ? 8 9 palmitic acid - 18 9 oleic acid
MTHF = 1.02 - 0.42 9 ChloB - 0.46 9 1-propano - 0.39 9 2-heptenal - 0.639 oleic acidl
Pentanal = 147.1 - 89 Carotenoids ? 189 ethanol ? 11 9 methylthiomethane – 15
9 6-methyl-5-hepten-2-one ? 20 9 2-methyl-3-buten-2-ol ? 22 9 heptanal
- 15 9 linolenic acid
228 Eur Food Res Technol (2009) 230:217–229
123
20. European Community, Commission Regulation No 2568/91/
EEC, July 11 (1991) Off J Eur Commun L248:1–83
21. Del Carlo M, Saccheti G, Di Mattia C, Compagnone D, Mas-
trocola D, Liberatore L, Cichelli A (2004) J Agric Food Chem
52:4072–4079
22. Singleton VL, Rossi JA (1965) Am J Enol Vitic 16:144–158
23. Mınguez-Mosquera MI, Gandul-Rojas B, Gallardo-Guerrero L
(1992) J Agric Food Chem 40:60–63
24. Re R, Pellegrini N, Proteggente A, Pannala A, Yang M, Rice
Evans C (1999) Free Radic Biol Med 26:1231–1237
25. Christie WW (1998) In: Christie WW (ed) Gas chromatography
and lipids. The Oily Press, Ayr, Scotland, pp 64–84
26. Goldberg DE (1989) Genetic algorithms in search, optimization
and machine learning. Addison-Wesley Publishing Company,
Reading, MA
27. Holland JH (1975) Adaptation in natural and artificial systems.
University of Michigan Press, Ann Arbor, MI
28. Hasegawa K, Miyashita Y, Funatsu K (1997) J Chem Inf Comput
Sci 37:306–310
29. Martens H, Naes T (1989) Multivariate calibration. Wiley,
Chichester
30. Thomas EV (1994) Anal Chem 66:795A–804A
31. Geladi P, Kowalski BR (1986) Anal Chim Acta 185:1–17
32. Haaland DM, Thomas EV (1988) Anal Chem 60:1193–1202
33. Leardi R, Boggia R, Terrile M (1992) J Chemom 6:267–281
34. Leardi R, Lupianez A (1998) Chemolab 41:195–207
35. Du H, Watzl J, Wang J, Zhang X, Yao X, Hu Z (2008) J Sep Sci
31:2325–2333
36. Li X, Luan F, Si H, Hu Z, Liu M (2007) Toxicol Lett 175:136–
144
37. Freedman DA (1983) Am Stat 27:152–155
38. Leonard JT, Roy K (2008) Eur J Med Chem 43:81–92
39. European Community, Commission Regulation No. 1989/2003/
EC, November 6 (2003) Off J Eur Commun L295:57–77
40. Mateos R, Dominguez MM, Espartero JL, Cert A (2003) J Agric
Food Chem 51:7170–7175
41. Cerretani L, Bendini A, Del Caro A, Piga A, Vacca V, Caboni
MF, Gallina-Toschi T (2006) Eur Food Res Technol 222:354–
361
42. Cerretani L, Lerma-Garcıa MJ, Herrero-Martınez JM, Gallina-
Toschi T, Simo-Alfonso EF (2009) (submitted for publication)
43. Boskou D, Blekas G, Tsimidou M (2006) In: Boskou D (ed)
Olive oil chemistry and technology, 2nd edn. American Oil
Chemists’ Society, Champaign, IL, pp 41–72
44. Cerretani L, Motilva MJ, Romero MP, Bendini A, Lercker G
(2008) Eur Food Res Technol 226:1251–1258
45. Aparicio R, Morales MT (1998) J Agric Food Chem 46:1116–
1122
46. Williams M, Salas JJ, Sanchez J, Harwood JL (2000) Phyto-
chemistry 53:13–19
47. Zunin P, Boggia R, Lanteri S, Leardi R, De Andreis R, Evan-
gelisti F (2004) J Chromatogr A 1023:271–276
48. Morales MT, Luna G, Aparicio R (2005) Food Chem 91:293–301
49. Faroon O, Roney N, Taylor J, Ashizawa A, Lumpkin MH, Ple-
wak DJ (2008) Toxicol Ind Health 24:447–490
50. Li L, Holian A (1998) Rev Environ Health 13:99–108
Eur Food Res Technol (2009) 230:217–229 229
123