Correlating sensory attributes, textural parameters and volatile ...
Upload
khangminh22Category
view
0download
0
Review
Non-Volatile Particle Number EmissionMeasurements with Catalytic Strippers: A Review
Barouch Giechaskiel *, Anastasios D. Melas , Tero Lähde and Giorgio Martini
European Commission—Joint Research Centre (JRC), 21027 Ispra, Italy; [email protected] (A.D.M.);[email protected] (T.L.); [email protected] (G.M.)* Correspondence: [email protected]; Tel.: +39-0332-78-5312
Received: 21 May 2020; Accepted: 23 June 2020; Published: 24 June 2020�����������������
Abstract: Vehicle regulations include limits for non-volatile particle number emissions with sizeslarger than 23 nm. The measurements are conducted with systems that remove the volatile particlesby means of dilution and heating. Recently, the option of measuring from 10 nm was included in theGlobal Technical Regulation (GTR 15) as an additional option to the current >23 nm methodology.In order to avoid artefacts, i.e., measuring volatile particles that have nucleated downstream ofthe evaporation tube, a heated oxidation catalyst (i.e., catalytic stripper) is required. This reviewsummarizes the studies with laboratory aerosols that assessed the volatile removal efficiency ofevaporation tube and catalytic stripper-based systems using hydrocarbons, sulfuric acid, mixtureof them, and ammonium sulfate. Special emphasis was given to distinguish between artefacts thathappened in the 10–23 nm range or below. Furthermore, studies with vehicles’ aerosols that reportedartefacts were collected to estimate critical concentration levels of volatiles. Maximum expected levelsof volatiles for mopeds, motorcycles, light-duty and heavy-duty vehicles were also summarized.Both laboratory and vehicle studies confirmed the superiority of catalytic strippers in avoidingartefacts. Open issues that need attention are the sulfur storage capacity and the standardization oftechnical requirements for catalytic strippers.
Keywords: vehicle emissions; particle measurement programme (PMP); portable emissionsmeasurement systems (PEMS); volatile removal efficiency; non-volatiles; solid particle number;catalytic stripper; evaporation tube; artefact
1. Introduction
In order to reduce pollution from particulate matter (PM), limits for the PM mass emissions ofvehicles are applicable in most countries worldwide [1]. The engine and aftertreatment improvementsreduced the emitted PM levels close to the detection limit of the PM methodology [2]. In order tofurther control the emissions of ultrafine particles, which do not contribute significantly to the PMmass, the European Union (EU) regulations included limits for the non-volatile particle emissions oflight-duty, heavy-duty, and non-road mobile machinery since 2011–2013 [3,4].
The particle number methodology is based on sampling from a dilution tunnel where the wholeexhaust gas is mixed with ambient air dilution air. In order to measure only non-volatile particles,the sample is pre-conditioned first in a hot diluter at 150 ◦C and then in an evaporation tube at350 ◦C, the so called volatile particle remover [5,6]. After a secondary dilution at ambient temperature,a particle number counter (PNC) counts all (non-volatile) particles above 23 nm. In reality the detectionefficiency of the PNC, typically a condensation particle counter (CPC), is around 50% at 23 nm, >90%at 41 nm and 0% at 17 nm. The 23 nm cut-off size was selected in order to include the smallestprimary soot particles, and exclude the volatile nucleation mode particles that could survive thepre-conditioning unit. The methodology was extended, but more simplified, to measure directly from
Vehicles 2020, 2, 342–364; doi:10.3390/vehicles2020019 www.mdpi.com/journal/vehicles

Vehicles 2020, 2 343
the tailpipe during on-road tests with the real-driving emissions (RDE) regulation for both light-dutyand heavy-duty vehicles [7]. The portable emissions measurement systems (PEMS) set the volatileparticle remover at 300 ◦C, in order to reduce energy consumption. From the controlled laboratoryenvironment, the measurements can take place under any environmental and driving conditions, thusthe measurement equipment can be challenged. Indeed, the survival of volatile particles through thethermal pre-conditioning unit or formation of volatile particles after the unit can lead to false highconcentrations of volatiles that will be counted as non-volatile particles. This was quite unlikely withthe 23 nm cut-off size of the PNC, but has happened in the sub-23 nm range [8,9], raising concerns asto whether the methodology should be extended below 23 nm.
On the other hand, a major criticism of the particle number methodology is that it excludesan important fraction of non-volatile particles below 23 nm that are emitted by many vehicletechnologies [10]. For example, sub-23 nm non-volatile particles have been reported for heavy-dutyvehicles [11], especially during urea injection [12], gasoline fueled vehicles [13], both port-fuel anddirect injection vehicles. Recently, concerns for CNG (compressed natural gas) fueled vehicles werealso raised [3,12]. Mopeds and motorcycles have also a high percentage of sub-23 nm particles.For this reason, the intention is to extend the methodology to include particles from approximately10 nm. The 10 nm size was selected in order to permit the upgrade of existing PN systems withoutinvestment costs and to minimize the higher risk of surviving (or re-nucleating) volatile particles [14].Furthermore, it will be suitable for the upgrade of the current 23 nm PEMS [15,16]. Developing amethodology to count smaller than 10 nm particles would be extremely challenging due to theuncertainties related to particle losses and calibration procedures.
A proposed methodology to eliminate the volatiles and make the methodology more robustis the catalytic stripper [17]. The idea is based on catalytic converters of vehicles, which removehydrocarbons (in addition to CO and NOx). Typically, they utilize a ceramic honeycomb monolithicsubstrate (support) with many small parallel channels. The monolith walls are coated with an activecatalyst layer [18]. The catalytic coating includes noble metal catalysts (such as Pt and Pd) impregnatedon a porous high surface area layer of inorganic carrier (support), the washcoat, such as alumina andsilica. The support material often contains additives such as promoters and stabilizers. Based on NOx
storage catalysts [19,20], the catalytic strippers include sometimes a sulfur trap to further improve theirremoval efficiency of sulfuric acid containing aerosol. Catalytic strippers have been used not only inthe automotive field [21], but also in the aviation field [22], and for atmospheric measurements [23].
Thermodenuders can also remove volatiles species from the exhaust gas [24,25]. In thethermodenuders, the sample is first heated in an evaporation tube, and then it passes throughan unheated section containing adsorbing material, most often activated carbon, which adsorbs mostof the evaporated components.
The objective of this study is to review the volatile removal efficiency and sulfur storage capacityof catalytic strippers and their suitability for inclusion in the particle number systems. The reviewresults are compared with the current methodology that uses hot dilution and evaporation tubeand with thermodenuders used in research. In order to put the results into the right context, actualvolatile emission levels from vehicles are also summarized. Finally, recommendations for technicalrequirements for catalytic strippers are proposed.
2. Materials and Methods
This review focused on studies that characterized catalytic strippers and evaporation tubes asstandalone systems or in volatile particle removers of particle number systems (i.e., downstreamof a hot dilution at temperature >150 ◦C). We searched in Google Scholar with keywords “catalyticstripper”, “evaporation tube + particles” and “volatile removal efficiency”. The search resulted in 533,900 and 73 documents, respectively. From the abstracts it was decided whether the documents wererelevant or not. The only acceptance criterion was the inclusion in the text of volatile removal efficiencywith laboratory aerosols or vehicles’ exhaust. Studies that used evaporation tubes or catalytic strippers

Vehicles 2020, 2 344
for measurements of vehicle exhaust were excluded, unless there was discussion of possible artefacts,or comparisons between catalytic strippers and evaporation tubes on the removal of volatile particles.In total, 29 studies were selected, 18 used a laboratory aerosol, and 14 a vehicle’s aerosol (3 were incommon). Table 1 summarizes the studies included.
Table 1. Number of studies assessing evaporation tubes (ET), catalytic strippers (CS), or thermodenuders(TD). The laboratory studies were conducted with hydrocarbons (HCs) and/or sulfuric acid (H2SO4).In brackets the studies using CS with sulfur trap.
System Laboratory HCs Laboratory H2SO4 Vehicles’ Aerosol
ET 13 6 14CS 15 (9) 7 (5) 8 (7)
CS vs. ET or TD 10 (6) 6 (4) 8 (7)
We used the same search engine for sulfur storage capacity of catalysts and SO2 to SO3 conversionrates. Keywords such as “sulfur trap”, sulfur storage catalyst”, “sulfur absorber”, “sulfur poisoning”were used. Only key studies were used because the objective was to put the catalytic stripper assessmentresults into perspective (i.e., compare with automotive catalytic converters).
We also reviewed emission levels of volatile and semi-volatile components at the tailpipe of thevehicles or at the dilution tunnel. The focus was on two-stroke mopeds, motorcycles, gasoline anddiesel light-duty and heavy-duty vehicles mainly of recent technologies. Special attention was paidto emission levels during the cold start of the engines, filter regenerations, or prolonged highwayoperation, where high levels of volatiles are expected. The search was narrowed to hydrocarbons, SO2,SO3 and H2SO4, which were the species that were used for the evaluation of the catalytic strippers andevaporation tubes. The research was not extensive, as the target was to find typical maximum levelsthat the particle number systems can be challenged.
3. Results
The particle number systems measure non-volatile particles >23 nm. Note that “solids” or“non-volatile” particles are by definition the particles that remain after thermal pre-treatment at 350 ◦Cfor a residence time of approximately 0.2–0.4 s. The term “volatiles” in this text covers all species thatare in gaseous state at temperatures below 350 ◦C. More appropriate terms such as semi-volatile orintermediate volatility compounds will not be used [26].
3.1. Volatile Particle Remover
The particle number systems consist of a volatile particle remover (VPR) and a particle numbercounter (PNC). Figure 1 presents a volatile particle remover with an evaporation tube (upper panel) ora catalytic stripper (lower panel).
3.1.1. Evaporation Tube-Based Systems
The exhaust gas at the dilution tunnel is already diluted and cooled down to ambient temperaturelevels (usually between 20 ◦C and 50 ◦C). The diluted aerosol typically consists of soot particles withsome species condensed on them, volatile nucleation mode particles, and volatile species in the gasphase. The volatile particles contain high percentages of compounds such as organics and sulfuricacid [27]. The soot particles are aggregates consisting of primary soot particles having diametersbetween 20 nm and 30 nm [28]. The geometric mean diameter of the soot mode is around 50–70 nm [2],but for modern gasoline engines, means of around 30 nm have also been reported [4]. The nucleationmode size-range is usually below 20 nm.

Vehicles 2020, 2 345
Figure 1. Schematic of volatile particle removers based on evaporation tube (upper panel) and catalyticstripper (lower panel). PNC = particle number counter.
In the primary hot diluter (≥150 ◦C) some of the condensed material evaporates and the nucleationmode particles evaporate and shrink. Furthermore, the concentration (and partial pressure) of thevolatiles species decreases. In the evaporation tube (350 ◦C) most of the volatile particles and thecondensed material evaporate. The cold diluter downstream of the evaporation tube further dilutesthe sample to bring the temperature and the soot concentration to an appropriate range for the PNC.During this process it is possible to have re-condensation on the soot particles and/or re-nucleation ofvolatile species (i.e., formation of new volatile particles) especially if the dilution ratio is not sufficientlyhigh. The nucleated particles due to the low concentrations of available species are unlikely to growover 23 nm in diameter, and thus they will not be counted by the PNC, which has detection efficiencyof 50% for particles of 23 nm diameter. The particles nucleated downstream of the evaporation tubeand counted with a PNC are called volatile artefacts [14]. The next sections will summarize the studiesthat evaluated the concentration levels of volatile species that artefacts can be avoided.
3.1.2. Catalytic Stripper-Based Systems
When a catalytic stripper is used, instead (or in addition to) an evaporation tube, the volatilespecies in the gas phase are oxidized (Figure 1, lower panel). Then, during dilution and cooling at thesecondary diluter the concentrations of nucleating species is too low to form volatile particles and,thus, the possibility for artefacts is minimized.
There are three types of catalytic strippers. Those that comprise:
• Only oxidation catalyst;• Sulfur trap and oxidation catalyst (in this order);• Oxidation catalyst and sulfur trap.
The first catalytic stripper for automotive use was mentioned in 1995 [17]. It was constructed froma commercial diesel oxidation catalyst (DOC) and operated at 300 ◦C. A cooling coil tube downstreamof the catalytic stripper reduced the sample temperature to ambient levels. Optimization work in termsof particle losses and volatile removal efficiency was presented in 2007 [29]. In particular, a vortex
Vehicles 2020, 2 346
tube diluter downstream of the catalytic stripper minimized thermophoretic losses. Later the catalyticstripper was installed in a particle number system compliant with the European regulations replacingthe evaporation tube [30].
A catalytic stripper with an upstream sulfur trap was presented in 2003 [31]. The sulfur trapprevented poisoning of the oxidation catalyst by trapping the sulfur species and minimized artefactsfrom the nucleation of SO3. This concept was compared to a thermodenuder in 2010 [32]. Later theposition of the sulfur trap was assessed at a different catalytic stripper and it was found to have highersulfur storage capacity when placed downstream [33]. The majority of the catalytic strippers in themarket for research or regulation purposes consist either only of an oxidation catalyst or oxidationcatalyst with a sulfur trap downstream.
3.2. Hydrocarbons
Figure 2 summarizes the volatile removal efficiency of studies that used hydrocarbons (tetracosaneC24, octacosane C28, tetracontane C40 and emery oil) for evaporation tube [5,30,32,34–43] and catalyticstripper-based [30,32–41,44–47] systems. Each point is a test. The mass concentration of the challengeaerosol can be seen in the y-axis. The x-axis is divided in four areas which indicate whether no or someparticles remained (or nucleated) downstream of the system under evaluation.
Figure 2. Volatile removal evaluation with hydrocarbons depending on whether none or some particlesremained (or re-nucleated) <10 nm, between 10 and 23 nm, and >23 nm. Open circles: evaporationtubes (ET); asterisks: thermodenuders (TD); solid circles: hot dilution and evaporation tubes (HD + ET);open squares: catalytic strippers (CS); solid squares: hot dilution and catalytic strippers (HD + CS).“S” indicates CS with sulfur trap.
• No particles remained downstream of the system under evaluation (blue color). Note that typicallythe lower detection size of these studies was around 3–6 nm.
• Particles with sizes lower than 10 nm were detected downstream of the system under evaluation(orange color). These cases are of low risk for the future >10 nm regulation but could have artefactswith low cut-off counters.
• Particles in the size region 10–23 nm remained (green color). These cases are risky for the future>10 nm regulation and indicate hydrocarbons mass levels that could lead to “volatile” artefacts.
• Particles larger than 23 nm were detected (red color). These cases would affect also the results ofthe current >23 nm regulation.

Vehicles 2020, 2 347
In each area the results are separately plotted for:
• Standalone evaporation tubes (ET) (open circles).• Thermodenuders (TD) (asterisks).• Hot dilution (typically 10:1) plus evaporation tubes (HD + ET) (solid circles).• Standalone catalytic strippers (CS) (open squares).• Hot dilution plus catalytic strippers (HD + CS) (solid squares).
For better clarity the evaporation tube (stand alone or downstream of a hot dilution) andthermodenuder tests are enclosed in dashed squares. Only the tests with the maximum reportedconcentrations in each study are plotted.
The hot dilution plus evaporation tube (HD + ET) results resulted in artefacts >23 nmwhen challenged with 15 mg/m3 [34], while levels 2–12 mg/m3 had artefacts in the 10–23 nmrange [36,39]. Artefacts <10 nm were detected with masses in a wide range of 0.01 mg/m3 to8.5 mg/m3 [5,30,32,36,37,39–41]. On the other hand, no artefacts were seen with masses up to 1.5 mg/m3
for the combination of hot dilution and evaporation tube [43], confirming that the results might besystem dependent. Standalone evaporation tubes (ET) could have artefacts <10 nm already at lowlevels (0.25 mg/m3) [5].
The catalytic stripper systems had no artefacts above 10 nm, with one exception which wasprobably solid residuals from impurities in the atomized material [45,48]. Masses up to 2 mg/m3
resulted in some particles remaining <10 nm for some standalone catalytic strippers [36,40,41,44].For other standalone or with hot-dilution catalytic stripper systems, masses up to 8–15 mg/m3 had noparticles remaining [34,36,39]. There was no difference between CS with or without sulfur trap, as bothcan remove hydrocarbon masses >10 mg/m3 without any remaining particles.
3.3. H2SO4
Figure 3 summarizes the results for H2SO4 and H2SO4 with hydrocarbons (C24 orC28) for evaporation tube-based [32,35,38–41] and catalytic stripper-based [32,35,38–41,44]systems. Particles >23 nm remained only with thermodenuder (3.8 mg/m3) [32] or evaporationtube after hot dilution (0.3 mg/m3) [39]. When the concentration was 1 mg/m3, some particles inthe 10–23 nm range remained for the thermodenuder, and evaporation tube after hot dilution [40].With mixture of H2SO4 with hydrocarbons, the evaporation tube had artefacts in the 10–23 nm rangeeven at 0.1 mg/m3 [41]. Particles <10 nm remained even at very low masses (<0.2 mg/m3 of H2SO4 orH2SO4 and HCs) for the thermodenuder and the evaporation tube after hot dilution, although in onecase, the evaporation tube with hot dilution could handle 2.5 mg/m3 with artefact <10 nm [38]. Only thecatalytic stripper could completely remove sulfuric acid aerosol without any particle remaining atconcentrations ranging from 0.1 mg/m3 [35,39,41] to 1 mg/m3 [38] or even 9.3 mg/m3 [44]. At the>10 mg/m3 range only one standalone catalytic stripper with a sulfur trap downstream of the oxidationcatalyst was evaluated [44]. Although it could remove up to 9.3 mg/m3 H2SO4 without any particlesremaining, at 16 mg/m3 some particles remained below 10 nm, and at 28 mg/m3 particles remained atthe 10–23 nm range. Only one study compared a catalytic stripper with and without a sulfur trap [40].The version with sulfur trap could handle up to 1 mg/m3 without significant artefacts while without thetrap remaining particles were detected already on H2SO4 concentrations above 0.07 mg/m3. In general,catalytic strippers with a sulfur trap could handle higher H2SO4 containing aerosol.

Vehicles 2020, 2 348
Figure 3. Volatile removal evaluation with sulfuric acid aerosol or sulfuric acid and hydrocarbons(symbols with background) depending on whether none or some particles remained (or re-nucleated)<10 nm, between 10 and 23 nm, and >23 nm. Open circles: evaporation tubes (ET); asterisks:thermodenuders (TD); solid circles: hot dilution and evaporation tubes (HD + ET); open squares:catalytic strippers (CS); solid squares: hot dilution and catalytic strippers (HD + CS). “S” indicates CSwith sulfur trap.
3.4. Ammonium Sulfate
A catalytic stripper based on a commercial vehicle aftertreatment DOC, used downstream of ahot dilution, could evaporate and shrink ammonium sulfate particles, but a residual with a meanbetween 10 nm and 20 nm remained due to the atomization method [29]. In another study, a CSdownstream of a hot diluter started to show some breakthrough only at inlet concentration of around1 × 107 p/cm3 (8.5 mg/m3) [39]. The hot diluter and evaporation tube combination had breakthrough ata one order of magnitude lower concentrations. A later study confirmed the findings and showed thatthe breakthrough particles had a size <23 nm [38].
3.5. Vehicles’ Exhaust
Figure 4, which is organized in the same way as the previous figures, summarizes the results withvehicles’ exhaust for evaporation tube [3,8,33,34,41,49–57] and catalytic stripper [3,8,33,34,41,50,52,57]systems. The volatile mass concentrations refer to the inlet of the systems, which were samplingfrom the full dilution tunnel. They were estimated from the nucleation mode size distributions.The horizontal lines indicate the levels of volatiles of the different tested categories: mopeds >10 mg/m3,diesel with DPF but without diesel oxidation catalyst (DOC) 6 mg/m3, and all the rest (GDI, DPFregenerations and heavy duty diesel vehicles) <1 mg/m3. The chemical composition of the volatiles isunknown (i.e., was not measured in any of the studies).
The hot dilution and evaporation tube had cases with remaining particles even at low levels:with 0.05 mg/m3 there were particles <10 nm [41], while with mass 0.5 mg/m3 or higher particles10–23 nm remained (in one case also particles >23 nm) [49]. However, there was a case in which thehot dilution and evaporation tube could handle 15 mg/m3 without artefacts (primary hot dilution25:1) [34]. The catalytic stripper (standalone or downstream of a hot dilution) did not have cases whereparticles >10 nm remained. There were cases that particles <10 nm remained at mass concentrations0.65 mg/m3 [52] or 6.1 mg/m3 [33] (as standalone) or 30–50 mg/m3 downstream of a hot dilution [8,34].There were many experiments with CS that no particles remained with concentrations even >10 mg/m3.

Vehicles 2020, 2 349
Figure 4. Volatile removal evaluation with vehicles’ exhaust depending on whether none or someparticles remained (or re-nucleated) <10 nm, between 10 and 23 nm, and >23 nm. Solid circles: hotdilution and evaporation tubes (HD + ET); open squares: catalytic strippers (CS); solid squares: hotdilution and catalytic strippers (HD + CS). “S” indicates CS with sulfur trap. DOC = diesel oxidationcatalyst; DPF = diesel particulate filter; GDI = gasoline direct injection; HDV = heavy-duty vehicle.
4. Discussion
This review summarized the studies that evaluated evaporation tubes and catalytic stripperswith laboratory or vehicles’ exhaust aerosol. The implications of the results will be discussed in thefollowing sections.
4.1. Evaporation Tube
The concept that was introduced in the particle number regulations is very efficient, as summarizedin the literature [14]. The hot dilution with the evaporation tube in combination with a counter thatmeasures particles >23 nm is a reliable methodology as artefacts have rarely been reported.
The temperature of the evaporation tube and the residence time is appropriate for the evaporationof volatile particles. The theory estimates necessary time around 10–16 ms for typical commercialsystems [5,44], which is much less than the 200–400 ms residence time in the systems, although theavailable time at the critical temperature region (>250 ◦C) is shorter. The upstream dilution at 150 ◦Cpre-heats the sample and ensures that the desired temperature will be reached in the evaporationtube. Most importantly, it dilutes the sample and reduces the partial pressures, thus minimizing thepossibility of nucleation downstream of the evaporation tube. Nevertheless, nucleation has beenreported many times with both laboratory and vehicles’ exhaust aerosol. Theoretically, the nucleation ofhydrocarbons is unlikely because very high concentrations are required (>3 mg/m3 [5]). However, theexperimental data with laboratory hydrocarbon aerosols showed that standalone evaporation tubescould not handle 0.25 mg/m3. Evaporation tubes, even with a hot dilution upstream (dilution 10:1),could not handle 8.5 mg/m3 (0.85 mg/m3 at the inlet of the evaporation tube) as particles <10 nmremained (or nucleated). The case where particles >23 nm remained was atomized emery oil (15 mg/m3)with hot dilution 25:1. In this case it is possible that there were impurities and the evaporated emeryoil condensed on the solid residuals downstream of the evaporation tube growing them to the over 23nm range [48].
When sulfuric acid is available, formation of nucleation particles is very probable. Theoreticalcalculation and experimental results have shown nucleation possibility even at 0.3 µg/m3 levels [5].Small amounts of ammonia (<20 ppb) may significantly enhance the binary nucleation rate of sulfuricacid and water [58–60], for example at vehicles with SCR (selective catalytic reduction for NOx)

Vehicles 2020, 2 350
systems or gasoline vehicles with three-way catalysts (TWC) [61]. Experimentally, nucleation particlesdownstream of a VPR with evaporation tube were measured from a heavy-duty vehicle equipped withSCR [62]. However, the size of the H2SO4 nuclei (critical clusters) is approximately 1–1.5 nm and highconcentrations of H2SO4 are needed to grow them to 3 nm in diameter [63,64]. Interestingly, laboratoryexperiments with sulfuric acid (and humidity) have reported size distributions peaking at 18 nm [65]or even >200 nm [44]. Similarly, experiments with SO2 (converted to SO3) gave nucleation modespeaking at 16 nm (1.8 ppm SO2) [66], 45 nm (61.4 ppm SO2) [66], or even >70 nm (200 ppm) [33].
Nuclei typically grow to bigger than 3 nm sizes with organics [67], even at low concentrations asexperiments with heavy-duty engine have shown [68]. The fuel sulfur was 1 ppm, and the (effective)contribution of the lubricant was 2–9 ppm (estimated sulfuric acid concentration 1.5–5.8 × 1012 cm−3)and the final mean size was <10 nm [69]. The nucleation mode peaked at 15 nm when the sulfur (fuelplus effective lubricant) was approximately 50 ppm (sulfuric acid 3.3 × 1013 cm−3). Growth rates of6–24 nm/s were measured for a heavy-duty engine with 8 mg/m3 organics emissions [70]. Another studyfound a nucleation mode of 6 nm when organics were available with concentration 1011 cm−3 [71].With appropriate residence time (1 s), in the presence of a high amount of organics (1014 cm−3) thenucleation mode peaked at 20 nm [72]. Approximately 1 ppm of propane corresponds to 1 × 1012 cm−3
organics [73]. This is calculated using the appropriate molecular mass and an assumed 10–30% fractionof total organics potentially condensing on the particulates phase [73]. Thus, it can be assumed thatwith hydrocarbon concentrations >100 ppm at the outlet of the evaporation tube the nucleated sulfuricacid particles can grow to sizes of 20 nm.
The laboratory tests with sulfuric acid (and hydrocarbons in some cases) confirmed the previousstudies. In all cases with the evaporation tubes there was re-nucleation. Mass of 0.9 mg/m3 or lowerresulted in nucleation mode particles >10 nm even with a hot dilution of 10:1. However, for themajority of the cases, with high dilution ratios (>100:1 primary hot dilution) there are no reportedcases of re-nucleation [74] except with 2-stroke mopeds. Studies comparing evaporation tubes withcatalytic strippers gave equivalent results (within 10%) for both 23 nm and 10 nm systems [39,75,76].Higher differences of the 10 nm systems were attributed to the different cut-off curves of the counters.
4.2. Catalytic Stripper
The studies with catalytic strippers proved that much higher concentrations can be handled forboth hydrocarbons and/or sulfuric acid aerosols than with evaporation tubes. For example, no artefactswere seen when catalytic strippers were challenged with hydrocarbons. In a few cases without hotpre-diluter particles <10 nm remained. Similarly, most concentrations of sulfuric acid were efficientlyremoved. Only in a few cases standalone systems had particles remaining <10 nm. The results withvehicle exhaust were similar to the laboratory aerosols. The standalone catalytic stripper had in somecases particles remaining <10 nm, while the evaporation tube systems often had particles remaining>10 nm at various challenge mass levels.
The conclusion based on the current experimental results is to use a catalytic stripper whenmeasurements of particles >10 nm are conducted. For lower sizes, the catalytic stripper is necessary,but not artefact-free, and a hot pre-diluter is recommended. For lower than 10 nm measurements, thehigh particle losses of the catalytic stripper have also to be considered.
4.2.1. Oxidation and Sulfur Trap Parts
Figure 5a plots separately examples of the two parts of a catalytic stripper: the oxidation part andthe sulfur storage part. In actual catalytic strippers the two parts are continuous. At some catalyticstrippers the sulfur trap is upstream of the oxidation part, in some downstream, and in some othersit does not exist. As discussed before (Figure 1), the oxidation part evaporates nucleation modeparticles and oxidizes the volatile particles (actually the particles should be evaporated earlier in anevaporation tube in order to have more efficient oxidation in the gaseous phase). The condensedmaterial on the soot particles is also evaporated and oxidized. In this oxidation part the SO2 and SO3

Vehicles 2020, 2 351
are considered to remain unaffected; especially catalytic strippers without a sulfur trap rely on thisassumption. The actual SO2 to SO3 conversion, however, depends on the catalyst formulation as willbe discussed in Section 4.2.2. Modern engines equipped with oxidation converters and dependingon the fuel and lubricant sulfur content, can have relatively high SO3 concentrations and this couldresult in nucleation of sulfuric acid at the exit of the catalytic stripper. The sulfur trap retains sulfur,minimizing this possibility.
At low temperatures (<350 ◦C) sulfur is stored through adsorption or condensation (physicallybounded sulfate), while, at higher temperatures (>400 ◦C) sulfur is stored as chemically bound metalsulfate [77]. Adhesion of sulfate in mist form on the catalyst is also possible at low temperatures.Under oxygen deficient conditions H2S is formed, which is poisonous for metal surfaces.
Sulfur traps may include an oxidation catalyst, e.g., platinum, to facilitate the SO2 to SO3 reaction.Typical sulfur storage systems are based on alkaline earth or alkali metal oxides and their mixtureson alumina washcoat. Other materials such as zinc, nickel, chromium, and copper are used either asstand-alone scavengers or as promoters, to modify trap performance, strengthen desired reactions, andinfluence the adsorption/desorption temperatures.
4.2.2. SO2 to SO3 Conversion
Figure 5b summarizes SO2 to SO3 conversion efficiencies from the literature of commonly usedoxidation catalysts (based also on the review in [78]). The space velocity was around 35,000–50,000 h−1.Higher space velocities result in lower conversions [79,80]. Conversion rates for other catalyst materialscan be found in the literature (e.g., [81,82]). The extent of the conversion depends mainly on theexhaust gas temperature, the type of noble metal used and the loading, and composition of thewashcoat. The SO2 to SO3 conversion starts to increase at around 200 ◦C, reaches a maximum at 450 ◦Cas the reaction kinetics accelerate and then gradually decreases due to thermodynamic equilibriumlimitations. The three studies with catalytic strippers are in agreement with the published data andvary from 0% to 37.5% at 275 ◦C to 300 ◦C actual aerosol temperature [30,33,36]. The need for a low orhigh SO2 to SO3 conversion depends on the concept of the catalytic stripper (only oxidation part orwith sulfur trap).
Figure 5. Catalytic stripper: (a) the two parts of a catalytic stripper: oxidation catalyst and sulfur trap.Products of reactions such as CO2 and H2O are not plotted; (b) SO2 to SO3 conversion for variousnoble metals and combinations. Pt [79,83–86], Pt/Pd [87], Pt/Rh [87], Pt/V [84], Pd [84,87]. Asterisks areexperimental data with catalytic strippers [30,33,36].
4.2.3. Storage Capacity
The SOx (SO2 and/or SO3) retention capacity is typically expressed in milligrams of SOx capturedper gram of sorbent. A review of the literature of sorbent systems for the removal of the SOx from
Vehicles 2020, 2 352
flue gases reported values from a few mg to hundreds of mg per gram of sorbent [88]. In vehicleapplications, the catalyst capacity in sulfate storage depends on the noble metal and the washcoatcomposition. Studies with diesel oxidation catalysts (DOCs) with 1% Pt on alumina found 16–50 mgsulfates per gram of washcoat (1.6–5%) at 350 ◦C [80,89,90], but 0% for SiC washcoat [89]. A Pd onalumina adsorbed up to 7% SO2 at 320 ◦C [91]. At temperatures higher than 400 ◦C, percentages ofup to 4% have been reported for Pt, Pt/Pd, or Pt/V catalysts [84,92–94]. Dedicated studies with sulfurtraps have reported SO2 capacity of 40–70% at temperatures 300–400 ◦C [95,96].
Materials are generally post-characterized for total sulfur content. However, a substantialconcentration of SO3 can be present in the flue gas well before the total capacity is reached [81].This means that the total capacity of an absorber or adsorber is a poor indication of actual performanceduring operation. Therefore, the performance of catalytic strippers is characterized in real time.
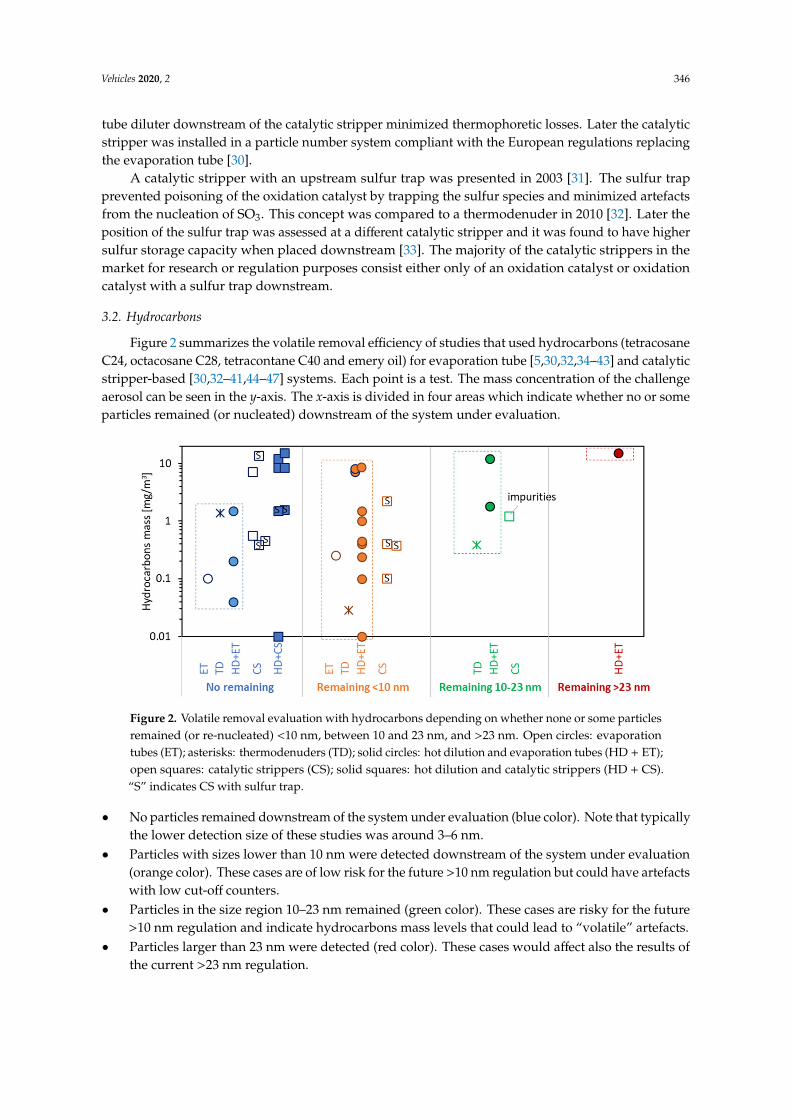
Figure 6 plots a hypothetical sulfur storage test based on published similarstudies [20,33,36,83,97–103]. At time t0, SO2 in O2 and N2 is inserted in the catalytic stripper.The SO2 level is typically between 20 and 150 ppm (100% in the figure) in order to have adequatemeasurement accuracy with the SO2 analyzer. Initially, the measured SO2 outlet concentration is zerobecause the SO2 is stored in the trap (either as SO2 or metal sulfate after conversion to SO3). At somepoint (tb) breakthrough of SO2 will start. From this point, the trapping efficiency is not 100%. SO3 willalso start to appear at the outlet of the catalytic stripper. For simplification, in this figure, it is assumedthat SO3 appears at the same time with the SO2, but this is not necessarily true. This SO3 poses a riskfor particles formation. Figure 6b gives an example of a particle size distribution measured at the outletof the catalytic stripper during the breakthrough period (t2). Note that during the initial storage phaseno particles were emitted (t1). At point (teq) the sulfur storage capacity will be saturated and the SO2
and SO3 outlet concentrations will be stabilized. From teq the sulfur trap is behaving like an oxidationcatalyst and produces SO3 with high probability for particle formation (Figure 6b, size distribution t3).The exact time of appearance and the magnitude of the size distributions depend on many parameterssuch as SO2 levels, SO2 to SO3 conversion rate, humidity, and availability of hydrocarbons [33,66].The transition from tb to teq was plotted as a linear function for simplicity reasons; however, in realityit is sigmoidal-like curve.
Figure 6. Hypothetical sulfur storage test with SO2: (a) SOx concentrations over time; (b) particle sizedistributions during the sulfur storage test.
The “total storage capacity” area is C1 + C2 + C3. Note that usually there are no SO3 measurements,so the determination of C3 is not possible and not reported. Note also that even if the SO3 breakthroughstarts after the SO2 breakthrough, the definitions of the areas remain the same, because if there isalready SO3 in the aerosol, it might not be completely stored in the sulfur trap already at time tb.The important area, however, is C1, which is called “complete storage capacity”. The determination of

Vehicles 2020, 2 353
the breakthrough point (tb) is typically set to 1% SO2 to cover the uncertainty of the SO2 measurement,but 0% has also been used for catalytic strippers.
The sulfur mass Cm [mg/s] passing through the catalyst is:
Cm = 10−6× Cv × ρSO2 × (Q/60) × (MS/MSO2) × 103, (1)
where Cv is the SO2 passing through the catalyst [ppmv], ρSO2 is the density of SO2 at 0 ◦C [2.86 g/L],Q is the catalytic stripper flow rate at 0 ◦C [L/min], MS is the molecular mass of sulfur [32 g/mol], MSO2 isthe molecular weight of sulfur dioxide [64 g/mol]. The sulfur capacity C [mg S] can be estimated byintegrating Cm for the appropriate time and assuming a retention efficiency R. Typically, the “complete”capacity should be reported (C1 in Figure 6a), where the retention efficiency R is 100% (integrationuntil tb). After tb the retention efficiency can be estimated from the surface area of the graph.
C = Σ0−t (Ri × Cm). (2)
The composition and the amount of the washcoat of catalytic strippers is not disclosed, so “total”captured sulfur mass is reported (or mass/L of catalyst). Values of approximately 6–23 mg or 0.7–1 g/Lhave been reported [33,36], with re-nucleation artefacts beginning already at 20–40% of the capacity.It can be assumed that research in this area can further increase the storage capacity. For example,a sulfur trap stored almost up to 15 g/L with no evidence of poisoning of a NOx catalyst downstreamof the sulfur trap [104].
Based on Equations (1) and (2), the time until saturation t [h] of a catalytic stripper with sulfurtrap can be estimated based on the following equation:
t = 11.7 × C/Q/E, (3)
where E are the expected SOx emissions [ppmv SOx]. Assuming 2.5 mg effective (complete) sulfurcapacity (C1 in Figure 6a) and 1 L/min flowrate, for 0.5 ppm SOx emissions, the time until saturationwould be 58 h. Considering the dilution at the dilution tunnel and at the pre-diluter, this time wouldincrease approximately 100 times. Similarly, a system at the tailpipe would also use a high dilution ofat least 100:1. It should be highlighted that a catalytic stripper used directly at the tailpipe needs somedilution in order to ensure that enough oxygen will be available for oxidation at rich or stoichiometricmodes of engine operation.
4.2.4. Position of Sulfur Trap
The first CS with sulfur trap had the trap upstream of the oxidation catalyst in order to protectthe oxidation catalyst from poisoning [31,105], because the sulfates formed inhibit reactants fromadsorbing on the active sites [77,106]. Tests showed that the total sulfur capacity was 60% lowercompared to the configuration where the sulfur trap was downstream [33]. It was assumed that,the sulfur was primarily stored as SO2, because no SO3 was available upstream of the sulfur trap.Further tests showed that poisoning of the oxidation catalyst (saturated with sulfur) did not affect thevolatile removal [36]. Nevertheless, the light-off temperatures were lower when the sulfur trap wasupstream [33]. As the catalytic stripper is used at a constant high temperature (350 ◦C), the light-off
temperature is not of concern. For these reasons, the downstream position is the preferred one incommercial systems.
4.3. Open Issues
The superiority of the catalytic stripper compared to the evaporation tube for sub-23 nmmeasurements was shown experimentally in many studies. The addition of a sulfur trap in manycases gave an advantage of retention of sulfuric acid. However, there are no technical requirementsor specifications for catalytic strippers, so non-optimized systems might be used resulting in lower

Vehicles 2020, 2 354
than expected performance. The following sections will discuss issues related to particle losses, sulfurstorage capacity, and typical vehicles’ aerosol.
4.3.1. Particle Losses
The particle losses in a volatile particle remover are due to diffusion and thermophoresis.The thermophoretic losses are around 25% without any dilution downstream of the volatile particleremover, but less than 10% with dilution. The diffusion losses are size-dependent and for catalyticstrippers are from 15% to 40% more compared to 100 nm [29,33,36]. The thermophoretic losses aresimilar for catalytic strippers and evaporation tubes for similar setup. The major drawback of catalyticstrippers versus evaporation tubes is the additional size dependent diffusion losses. Tests with a particlenumber system replacing the evaporation tube with a catalytic stripper gave <20% difference at the10 nm losses [39]. The design of a catalytic stripper is a compromise between volatile removal efficiencyand non-volatile particles’ penetrations [29,44]. Particle number systems with optimized catalyticstrippers have achieved <20% losses at 10 nm [29,36], but typically the losses are higher [39,107].The regulation uses an average particle number concentration reduction factor (PCRF) of 30 nm, 50 nm,and 100 nm to take into account the particle losses and the dilution ratio. This average PCRF is basedon the fact that vehicles’ size distributions have geometric mean diameter around 50 nm. In order tominimize the influence of the small particle losses on the results, restrictions for the sub-23 nm sizesare necessary. The future >10 nm regulation will have a limit for the ratio PCRF15 to PCRF100 of <2.Another solution is to use two particle number counters with different cut-off sizes (at 23 and 10 nm,approximately) and correct for the losses below 23 nm [8].
For 30 nm (and larger) sizes the differences of the losses between identical systems with evaporationtubes or catalytic strippers are less than 10% [39]. This value is well within the range seen betweenvarious commercial systems with evaporation tubes. The average PCRF, which takes into accountthe losses at 30 nm, 50 nm and 100 nm, will partly offset the size-dependent losses. Furthermore, thepenetration of the complete system does not depend so much on the VPR, but mainly on the PNC [76].Consequently, the differences of the systems with 23 nm PNCs will be within the typical experimentaluncertainties (5%). Indeed, most comparisons of >23 nm systems with and without catalytic strippersgave comparable results [39,75,76]. With the current regulations, catalytic strippers are not allowed inthe volatile particle removers, because it is required that the materials do not react with exhaust gascomponents. However, assuming that a system with catalytic stripper fulfils all the rest requirements(e.g., PCRF30 to PCRF100 ratio <1.3), and based on the aforementioned findings, there is no reason toexclude catalytic strippers for >23 nm measurements. Thus, future regulation should permit the use ofcatalytic strippers even for measurements of particles >23 nm.
4.3.2. SO3 Conversion Risks
The catalytic strippers with only the oxidation part do not convert SO2 to SO3, but this needsto be checked, because at the temperature required by the regulation (350 ◦C) some conversion maytake place (as discussed in Figure 5b). This could result in higher risk for re-nucleation compared toan evaporation tube (where no SO2 to SO3 conversion takes place). In this case it is necessary thatmost of the hydrocarbons are removed, so the nuclei will not grow to the measurement range of thecounting instruments.
Catalytic strippers with sulfur trap showed efficient removal even for high concentrations ofsulfuric acid. However, the risk with these systems is that they may be saturated if proper attentionis not given. At the moment there is no alarm/warning for such cases. Due to their high SO2 to SO3
conversion, when they are saturated they may result in higher nucleation probability compared tothe simple oxidation catalytic strippers or evaporation tubes. For modern light-duty vehicles withlow sulfur fuel and lubricant, the time until saturation is hundreds of hours (with some dilution) [33].For applications using high sulfur content fuels (e.g., marine engines), however, they could saturate onlyin a couple of hours [35]. Maximum SO2 concentrations are given in Table 2 for recent technologies (and

Vehicles 2020, 2 355
fuels). Higher concentrations could be measured when the fuel sulfur content is >15 ppm, e.g., in India,Central and South America or in Africa [108]. For example, the expected SO2 concentrations are <1 ppmfor modern vehicles [35], and peaks of 20 ppm may appear, and in extreme cases (e.g., regenerations)even higher (150 ppm) [109]. However, measurement campaigns in countries with high sulfur contentfuel have reported average SO2 concentrations of 20–120 ppm [110] or even higher when there weremaintenance issues with the vehicles [111]. As it was discussed in Figure 6b, high SO2 or SO3
concentrations can result in sulfuric acid nucleation particles peaking at sizes >10 nm [33,66].In addition to the SO2 to SO3 reaction, it is not well understood how the catalytic strippers
react with the exhaust aerosol. In a few cases non-volatile particle formation has been found inevaporation tubes, but also in catalytic strippers [32,41]. In another case, a catalytic stripper measuredhigher non-volatile particle concentrations than an evaporation tube [50]. This is an area that needsfurther research.
4.3.3. Vehicles’ Volatile Aerosol
Table 2 gives the mass of volatiles reported as nucleation mode (NM) particles in the literature.These are the actual (maximum) levels that particle number systems may be challenged with. What isnot always known is the chemical composition, and when detailed analysis is undertaken, hundreds ofcompounds can be found [112]. Furthermore, it is not possible to define easily a “typical” compositionas it depends on the engine out emissions, the aftertreatment devices, the fuel, the lubricant, andthe driving style. For example, for a heavy-duty engine without aftertreatment devices, branchedalkanes and alkyl-substituted cycloalkanes from unburned fuel and/or lubricating oil contributed>95% of the nanoparticle mass, and sulfuric acid <5% [113]. Another study indicated that the organiccomponent of diesel nanoparticles comprised compounds with carbon numbers in the C24–C32 range,derived almost entirely from unburned oil [114]. For a heavy-duty diesel vehicle with a catalyzedcontinuously regenerating trap (CRT) and 420 ppm sulfur fuel the majority of the NM was sulfates [115].Similarly, for light-duty NM particles, the sulfate to organic ratios were from 0.2 to 20 depending onthe engine load (and exhaust gas temperature) for 350 ppm fuel sulfur [116]. Chemical analysis of aheavy-duty DPF having mainly nucleation mode particles (1.2 × 10¹¹ p/km) showed a high amount ofBTEX compounds (benzene, toluene, ethylbenzene, m,p-xylenes, and o-xylene) and PAHs (polycyclicaromatic hydrocarbons) [117]. Similar results were noted for light-duty vehicles and, additionally,alkanes had high concentrations [118]. Toluene, isopentane, m,p-xylene, 1,2,4-trimethylbenzene, ando-xylene were the dominant volatile organic compounds emitted from the tailpipe exhaust of themotorcycles [119].
Table 2. Peak concentrations during cold start, during the test cycle or regenerations. HCs and SO2
concentrations refer to the tailpipe, NM to the dilution tunnel. HC = hydrocarbons; HD = heavy-duty;LD = light-duty; NM = nucleation mode.
Technology Period NM [mg/m3] Gas HCs [ppm] SO2 [ppm] References
Moped Cold start >10 >50,000 60 [8,34,49]Motorcycle Cold start 10,000–35,000 12–20 [120–122]Motorcycle Cycle 0.4 300–5000 9–20 [123,124]
LD Gasoline Cold start 5 12,000 10 [125–130]LD Diesel Cold start low 350 10 [128,131]LD Diesel Regeneration 1 200 25 [57,132–134]HD Diesel Regeneration 1–12 250 150 [109,115,135–139]
For completeness, examples of measured gaseous hydrocarbons are given in Table 1. They aremeasured according to the regulated procedure (with heated line at 191 ◦C), thus they represent“light” hydrocarbons and they do not necessarily correlate with the NM reported in the same table.Furthermore, typically less than 30% of total HC is condensed on soot particles. The catalytic strippersremove the hydrocarbons more efficiently in the gas phase than in the particle phase [33]. Thus, the

Vehicles 2020, 2 356
interpretation of these concentrations as requirements for catalytic strippers should be done withprecaution. Moreover, the gas oxidation efficiency check may not be necessary if the volatile particles’removal efficiency is checked. Nevertheless, it could be a useful and easy check for the long termvolatile removal efficiency stability, especially as the catalytic stripper is poisoned by sulfur compoundsover time. At the temperatures prescribed in the regulations (300–400 ◦C) the oxidation efficiency ofCH4 is low, thus a gas such as propane is more suitable and also typically available in most laboratoriesthat do vehicle emissions testing (for calibration of other gas analyzers).
4.3.4. Catalytic Stripper Technical Requirements
Table 3 gives suggestions for future tests that could be required for the characterization of catalyticstrippers (standalone or in a VPR system). Examples and citations where more details can be foundare also given. Regarding particle losses, the requirements of the regulation should be fulfilled,i.e., PCRF15 to PCRF100 ratio <2. The wall temperature is also defined in the requirements, usuallybetween 300 ◦C to 400 ◦C. For catalytic strippers, it seems that the lower temperature limit is moreadvantageous because the SO2 to SO3 conversion is lower. This conversion ratio should be reported,especially for systems without a sulfur trap, which should have very low conversion. Systems with asulfur trap should report the sulfur storage capacity. Two values should be reported: the complete(i.e., until no SO2 is measured downstream of the catalytic stripper) and the total (i.e., until the SO2
concentration at the outlet of the catalytic stripper is stabilized). The measurement of SO3 (and H2SO4)is challenging. In the presence of water vapor in particular, sulfuric acid will be formed, that is corrosiveand there are concerns regarding potential damage to the analytical equipment or even artefacts [81].The particle removal efficiency should also be given. At the moment the preferred generation methodis evaporation-condensation technique with tetracontane particles, as the atomization method of oilscan result in residual particles from impurities in the atomized material. Even though the oxidationefficiency (e.g., of propane) is not so relevant for the specific application of catalytic strippers, it couldbe evaluated as a simple check of the long-term stability of the oxidation efficiency.
Table 3. Suggestions for technical requirements of catalytic strippers. The references give theexperimental setups of the proposed tests. HC = hydrocarbons; VRE = volatile removal efficiency.
Test Comment Example Reference
Particle losses As required in the regulation [33,36]Wall temperature As required in the regulation 300 ◦C to 350 ◦C Regulation
SO2 to SO3 conversion To be declared % [33,36]Sulfur storage capacity Based on SO2 mg [33,36]
VRE H2SO4 Feasibility to be assessed >99.9%; >1 mg/m3 [39,44]VRE gaseous HCs Long term efficiency C3H8 >99.9%; >10,000 ppm [33]VRE particle HCs Tetracontane particles >99.9%; >1 mg/m3 [30,33,36]
5. Conclusions
This review summarized the volatile removal efficiency of evaporation tubes (ET), thermodenuders(TD), and catalytic strippers (CS). Some of the catalytic strippers had only an oxidation part and somehad, additionally, a sulfur trap upstream or downstream of the oxidation part.
Theoretically, CS oxidize the hydrocarbons resulting in smaller (if any) growth of any volatilenucleation mode particles, compared to evaporation tubes that reduce hydrocarbons only by dilution.CS with sulfur traps store sulfur compounds, thus, further minimizing any possibility of nucleatingparticles. On the other hand, if the sulfur trap is saturated, any existing SO3 or SO3 formed in theCS might enhance nucleation. At very high SO2 and/or SO3 concentrations the nucleated particlesmay grow to the measuring range of the instruments. Considering that modern vehicles emit someSO3 (and thus there is potential for nucleation) and the ET does not oxidize the hydrocarbons, the

Vehicles 2020, 2 357
CS is a safer option for avoiding volatile artefacts (i.e., measuring re-nucleated volatile particles asnon-volatiles).
The summary of the published experimental results showed that ET and TD could handleup to 2 mg/m3 of hydrocarbons without artefacts, but in some cases particles <10 nm remained.Masses >2 mg/m3 resulted in artefacts in the 10–23 nm range or even >23 nm (15 mg/m3) on someoccasions. CS did not have any artefacts >10 nm in any of the studies (with one exception that werepresumably solid residuals). Inlet masses up to 13 g/m3 could be handled with CS in most caseswithout any particles remaining, but in some cases particles <10 nm were detected after CS even athydrocarbon compound masses below 2 mg/m3.
With sulfuric acid containing aerosol, particles were always detected downstream of ET and TD:they were <10 nm with <0.2 mg/m3 upstream concentrations (with one exception of hot dilution andevaporation tube that could handle up to 2.5 mg/m3). The CS could efficiently handle the sulfuric acidaerosol. However, at concentrations >1 mg/m3 some particles below 10 nm remained. The limited datashow that with a sulfur trap higher masses can be handled. In two cases, CS with a sulfur trap couldhandle at least 9 mg/m3 without any particles remaining.
The vehicle exhaust aerosol had remaining particles larger than 10 nm for masses >0.5 mg/m3
and <10 nm even for masses of 0.05 mg/m3 for the ET systems. The CS had no cases with remainingparticles >10 nm. There were cases with particles <10 nm when the mass was 0.65 mg/m3 (standalone)or 50 mg/m3 (downstream of hot dilution).
In general, the experimental results of the reviewed studies showed that the CS is the safest optionfor minimum artefacts for measurements >10 nm. Studies below 10 nm still need attention, even withCS, both regarding the volatile removal efficiency, but also the high particle losses. The above resultsalso confirm that the CS should be allowed in place or in addition to the ET of the existing systemsmeasuring >23 nm.
Due to the substantial variability of the results and the different removal efficiencies of the varioussystems, in order to standardize the evaluation of the systems, it is recommended to include a volatileremoval efficiency test. Realistic levels of challenge aerosol should be in the order of 1 mg/m3 (exceptmopeds that exceed 10 mg/m3). At the moment, it is not clear what is a representative chemicalcomposition of the volatile particles, but it seems that sulfuric acid plays a major role in their formationand should also be included in the volatile removal assessment of the systems. However, H2SO4 iscorrosive and there are concerns regarding potential damage to the analytical equipment or evenartefacts. Catalytic strippers with sulfur traps should report their storage capacity and those without,should confirm that no (or minimum) SO2 to SO3 conversion takes place.
Author Contributions: Conceptualization, B.G.; formal analysis, B.G.; writing—original draft preparation, B.G.and A.D.M.; writing—review and editing, T.L. and G.M.; All authors have read and agreed to the publishedversion of the manuscript.
Funding: This research received no external funding.
Acknowledgments: The authors would like to acknowledge the comments of A. Mamakos and Y. Otsuki at earlierdraft versions. B.G. appreciates the discussions with L. Ntziachristos.
Conflicts of Interest: The authors declare no conflict of interest.
References
1. Giechaskiel, B.; Maricq, M.; Ntziachristos, L.; Dardiotis, C.; Wang, X.; Axmann, H.; Bergmann, A.; Schindler, W.Review of motor vehicle particulate emissions sampling and measurement: From smoke and filter mass toparticle number. J. Aerosol Sci. 2014, 67, 48–86. [CrossRef]
2. Giechaskiel, B.; Mamakos, A.; Andersson, J.; Dilara, P.; Martini, G.; Schindler, W.; Bergmann, A. Measurementof automotive nonvolatile particle number emissions within the European legislative framework: A review.Aerosol Sci. Technol. 2012, 46, 719–749. [CrossRef]

Vehicles 2020, 2 358
3. Giechaskiel, B.; Lähde, T.; Suarez-Bertoa, R.; Clairotte, M.; Grigoratos, T.; Zardini, A.; Perujo, A.; Martini, G.Particle number measurements in the European legislation and future JRC activities. Combust. Engines 2018,174, 3–16. [CrossRef]
4. Giechaskiel, B.; Joshi, A.; Ntziachristos, L.; Dilara, P. European regulatory framework and particulate matteremissions of gasoline light-duty vehicles: A review. Catalysts 2019, 9, 586. [CrossRef]
5. Giechaskiel, B.; Drossinos, Y. Theoretical investigation of volatile removal efficiency of particle numbermeasurement systems. SAE Int. J. Engines 2010, 3, 1140–1151. [CrossRef]
6. Burtscher, H. Physical characterization of particulate emissions from diesel engines: A review. J. Aerosol Sci.2005, 36, 896–932. [CrossRef]
7. Giechaskiel, B.; Bonnel, P.; Perujo, A.; Dilara, P. Solid particle number (SPN) portable emissions measurementsystems (PEMS) in the European legislation: A review. IJERPH 2019, 16, 4819. [CrossRef]
8. Giechaskiel, B.; Vanhanen, J.; Väkevä, M.; Martini, G. Investigation of vehicle exhaust sub-23 nm particleemissions. Aerosol Sci. Technol. 2017, 51, 626–641. [CrossRef]
9. Johnson, K.C.; Durbin, T.D.; Jung, H.; Chaudhary, A.; Cocker, D.R.; Herner, J.D.; Robertson, W.H.; Huai, T.;Ayala, A.; Kittelson, D. Evaluation of the European PMP methodologies during on-road and chassisdynamometer testing for dpf equipped heavy-duty diesel vehicles. Aerosol Sci. Technol. 2009, 43, 962–969.[CrossRef]
10. Giechaskiel, B.; Manfredi, U.; Martini, G. Engine exhaust solid sub-23 nm particles: I. literature survey.SAE Int. J. Fuels Lubr. 2014, 7, 950–964. [CrossRef]
11. Rönkkö, T.; Virtanen, A.; Kannosto, J.; Keskinen, J.; Lappi, M.; Pirjola, L. Nucleation mode particles with anonvolatile core in the exhaust of a heavy duty diesel vehicle. Environ. Sci. Technol. 2007, 41, 6384–6389.[CrossRef]
12. Giechaskiel, B. Solid particle number emission factors of Euro VI heavy-duty vehicles on the road and in thelaboratory. IJERPH 2018, 15, 304. [CrossRef] [PubMed]
13. Mayer, A.; Czerwinski, J.; Kasper, M.; Ulrich, A.; Mooney, J.J. Metal Oxide Particle Emissions from Diesel andPetrol Engines; SAE: Warrendale, PA, USA, 2012.
14. Giechaskiel, B.; Martini, G. Engine exhaust solid sub-23 nm particles: II feasibility study for particle numbermeasurement systems. SAE Int. J. Fuels Lubr. 2014, 7, 935–949. [CrossRef]
15. Giechaskiel, B.; Mamakos, A.; Woodburn, J.; Szczotka, A.; Bielaczyc, P. Evaluation of a 10 nm particle numberportable emissions measurement system (PEMS). Sensors 2019, 19, 5531. [CrossRef] [PubMed]
16. Giechaskiel, B.; Lähde, T.; Gandi, S.; Keller, S.; Kreutziger, P.; Mamakos, A. Assessment of 10-nm particlenumber (PN) portable emissions measurement systems (PEMS) for future regulations. IJERPH 2020, 17, 3878.[CrossRef] [PubMed]
17. Abdul-Khalek, I.S.; Kittelson, D.B. Real time measurement of volatile and solid exhaust particles using acatalytic stripper. SAE Trans. 1995, 104, 462–478. [CrossRef]
18. Twigg, M.V. Catalytic control of emissions from cars. Catal. Today 2011, 163, 33–41. [CrossRef]19. Roy, S.; Baiker, A. NOx storage–reduction catalysis: From mechanism and materials properties to
storage–reduction performance. Chem. Rev. 2009, 109, 4054–4091. [CrossRef]20. Liu, G.; Gao, P.-X. A review of NOx storage/reduction catalysts: Mechanism, materials and degradation
studies. Catal. Sci. Technol. 2011, 1, 552–568. [CrossRef]21. Xu, F.; Chen, L.; Stone, R. Effects of a catalytic volatile particle remover (VPR) on the particulate matter
emissions from a direct injection spark ignition engine. Environ. Sci. Technol. 2011, 45, 9036–9043. [CrossRef]22. Lobo, P.; Durdina, L.; Brem, B.T.; Crayford, A.P.; Johnson, M.P.; Smallwood, G.J.; Siegerist, F.; Williams, P.I.;
Black, E.A.; Llamedo, A.; et al. Comparison of standardized sampling and measurement reference systemsfor aircraft engine non-volatile particulate matter emissions. J. Aerosol Sci. 2020, 145, 105557. [CrossRef]
23. Lin, Y.; Bahreini, R.; Zimmerman, S.; Fofie, E.A.; Asa-Awuku, A.; Park, K.; Lee, S.-B.; Bae, G.-N.; Jung, H.S.Investigation of ambient aerosol effective density with and without using a catalytic stripper. Atmos. Environ.2018, 187, 84–92. [CrossRef]
24. Burtscher, H.; Baltensperger, U.; Bukowiecki, N.; Cohn, P.; Hüglin, C.; Mohr, M.; Matter, U.; Nyeki, S.;Schmatloch, V.; Streit, N.; et al. Separation of volatile and non-volatile aerosol fractions by thermodesorption:Instrumental development and applications. J. Aerosol Sci. 2001, 32, 427–442. [CrossRef]

Vehicles 2020, 2 359
25. Huffman, J.A.; Ziemann, P.J.; Jayne, J.T.; Worsnop, D.R.; Jimenez, J.L. Development and characterizationof a fast-stepping/scanning thermodenuder for chemically-resolved aerosol volatility measurements.Aerosol Sci. Technol. 2008, 42, 395–407. [CrossRef]
26. Donahue, N.M.; Kroll, J.H.; Pandis, S.N.; Robinson, A.L. A two-dimensional volatility basis set—Part 2:Diagnostics of organic-aerosol evolution. Atmos. Chem. Phys. 2012, 12, 615–634. [CrossRef]
27. Maricq, M.M. Chemical characterization of particulate emissions from diesel engines: A review. J. Aerosol Sci.2007, 38, 1079–1118. [CrossRef]
28. Choi, S.; Myung, C.L.; Park, S. Review on characterization of nano-particle emissions and PM morphologyfrom internal combustion engines: Part 2. Int. J. Autom. Technol. 2014, 15, 219–227. [CrossRef]
29. Khalek, I.A. Sampling system for solid and volatile exhaust particle size, number, and mass emissions.SAE Trans. 2007, 116, 122–133. [CrossRef]
30. Khalek, I.A.; Bougher, T. Development of a solid exhaust particle number measurement system using acatalytic stripper technology. SAE Int. J. Engines 2011, 4, 610–618. [CrossRef]
31. Kittelson, D.B.; Stenitzer, M. A new catalytic stripper for removal of volatile particles. In Proceedings of the7th ETH Conference on Combustion Generated Nanoparticles, Zurich, Switzerland, 18–20 August 2003.
32. Swanson, J.; Kittelson, D. Evaluation of thermal denuder and catalytic stripper methods for solid particlemeasurements. J. Aerosol Sci. 2010, 41, 1113–1122. [CrossRef]
33. Amanatidis, S.; Ntziachristos, L.; Giechaskiel, B.; Katsaounis, D.; Samaras, Z.; Bergmann, A. Evaluationof an oxidation catalyst (“catalytic stripper”) in eliminating volatile material from combustion aerosol.J. Aerosol Sci. 2013, 57, 144–155. [CrossRef]
34. Giechaskiel, B.; Zardini, A.; Martini, G. Particle emission measurements from L-category vehicles. SAE Int.J. Engines 2015, 8, 2322–2337. [CrossRef]
35. Amanatidis, S.; Ntziachristos, L.; Karjalainen, P.; Saukko, E.; Simonen, P.; Kuittinen, N.; Aakko-Saksa, P.;Timonen, H.; Rönkkö, T.; Keskinen, J. Comparative performance of a thermal denuder and a catalytic stripperin sampling laboratory and marine exhaust aerosols. Aerosol Sci. Technol. 2018, 52, 420–432. [CrossRef]
36. Melas, A.D.; Koidi, V.; Deloglou, D.; Daskalos, E.; Zarvalis, D.; Papaioannou, E.; Konstandopoulos, A.G.Development and evaluation of a catalytic stripper for the measurement of solid ultrafine particle emissionsfrom internal combustion engines. Aerosol Sci. Technol. 2020, 54, 704–714. [CrossRef]
37. Giechaskiel, B.; Riccobono, F.; Bonnel, P. Feasibility Study on the Extension of the Real-Driving Emissions (RDE)Procedure to Particle Number (PN): Chassis Dynamometer Evaluation of Portable Emission Measurement Systems(PEMS) to Measure Particle Number (PN) Concentration: Phase II; Publications Office: Luxembourg, 2015;ISBN 978-92-79-51003-8.
38. Otsuki, Y.; Tochino, S.; Kondo, K.; Haruta, K. Portable Emissions Measurement System for Solid Particle NumberIncluding Nanoparticles Smaller than 23 nm; SAE International: Warrendale, PA, USA, 2017.
39. Otsuki, Y.; Takeda, K.; Haruta, K.; Mori, N. A Solid Particle Number Measurement System Including NanoparticlesSmaller than 23 Nanometers; SAE International: Warrendale, PA, USA, 2014.
40. Kiwull, B.; Wolf, J.C.; Niessner, R. Evaluation of Volatile Particle Remover Devices for Exhaust Particle Quantification;Technische Universität München: Munich, Germany, 2015.
41. Zheng, Z.; Johnson, K.C.; Liu, Z.; Durbin, T.D.; Hu, S.; Huai, T.; Kittelson, D.B.; Jung, H.S. Investigation ofSolid Particle Number Measurement: Existence and Nature of Sub-23nm Particles Under PMP Methodology.J. Aerosol Sci. 2011, 42, 883–897. [CrossRef]
42. Kasper, M. Characterisation of the Second Generation PMP “Golden Instrument”; SAE International: Warrendale,PA, USA, 2008.
43. Giechaskiel, B.; Carriero, M.; Martini, G.; Krasenbrink, A.; Scheder, D. Calibration and validation of variouscommercial particle number measurement systems. SAE Int. J. Fuels Lubr. 2009, 2, 512–530. [CrossRef]
44. Swanson, J.; Kittelson, D.; Giechaskiel, B.; Bergmann, A.; Twigg, M. A miniature catalytic stripper for particlesless than 23 nanometers. SAE Int. J. Fuels Lubr. 2013, 6, 542–551. [CrossRef]
45. Emery Oil Removal Efficiency. Available online: http://catalytic-instruments.com/wp-content/uploads/2019/
09/Application-note0007.pdf (accessed on 24 June 2020).46. Crayford, A.P.; Johnson, M.; Marsh, R.; Sevcenco, Y.; Walters, D.; Williams, P.; Christie, S.; Chung, W.;
Petzold, A.; Ibrahim, A.; et al. SAMPLE III (SC01): Contribution to Aircraft Engine PM Certification Requirementand Standard First Specific Contract—Final Report; EASA: Cologne, Germany, 2011.

Vehicles 2020, 2 360
47. Kim, S.; Kondo, K.; Otsuki, Y.; Haruta, K. A New On-Board PN Analyzer for Monitoring the Real-DrivingCondition; SAE International: Warrendale, PA, USA, 2017.
48. Ho, J.; Kournikakis, B.; Gunning, A.; Fildes, J. Submicron aerosol characterization of water by a differentialmobility particle sizer. J. Aerosol Sci. 1988, 19, 1425–1428. [CrossRef]
49. Giechaskiel, B.; Chirico, R.; DeCarlo, P.F.; Clairotte, M.; Adam, T.; Martini, G.; Heringa, M.F.; Richter, R.;Prevot, A.S.H.; Baltensperger, U. Evaluation of the particle measurement programme (PMP) protocol toremove the vehicles’ exhaust aerosol volatile phase. Sci. Total Environ. 2010, 408, 5106–5116. [CrossRef]
50. Giechaskiel, B. Differences between tailpipe and dilution tunnel sub-23 nm nonvolatile (solid) particlenumber measurements. Aerosol Sci. Technol. 2019, 53, 1012–1022. [CrossRef]
51. Mamakos, A.; Martini, G.; Marotta, A.; Manfredi, U. Assessment of different technical options in reducingparticle emissions from gasoline direct injection vehicles. J. Aerosol Sci. 2013, 63, 115–125. [CrossRef]
52. Ntziachristos, L.; Amanatidis, S.; Samaras, Z.; Giechaskiel, B.; Bergmann, A. Use of a catalytic stripper as analternative to the original PMP measurement protocol. SAE Int. J. Fuels Lubr. 2013, 6, 532–541. [CrossRef]
53. Mamakos, A.; Martini, G.; Manfredi, U. Assessment of the legislated particle number measurement procedurefor a Euro 5 and a Euro 6 compliant diesel passenger cars under regulated and unregulated conditions.J. Aerosol Sci. 2013, 55, 31–47. [CrossRef]
54. Giechaskiel, B.; Riccobono, F.; Mendoza-Villafuerte, P.; Grigoratos, T. Particle Number (PN)—Portable EmissionsMeasurement Systems (PEMS) Heavy Duty Vehicles Evaluation Phase at the Joint Research Centre (JRC); PublicationsOffice: Luxembourg, 2016.
55. Zheng, Z.; Durbin, T.D.; Karavalakis, G.; Johnson, K.C.; Chaudhary, A.; Cocker, D.R.; Herner, J.D.;Robertson, W.H.; Huai, T.; Ayala, A.; et al. Nature of sub-23-nm particles downstream of the Europeanparticle measurement programme (PMP)-compliant system: A real-time data perspective. Aerosol Sci. Technol.2012, 46, 886–896. [CrossRef]
56. Ntziachristos, L.; Giechaskiel, B.; Pistikopoulos, P.; Samaras, Z. Comparative Assessment of Two DifferentSampling Systems for Particle Emission Type-Approval Measurements; SAE International: Warrendale, PA,USA, 2005.
57. Giechaskiel, B. Particle number emissions of a diesel vehicle during and between regeneration events.Catalysts 2020. [CrossRef]
58. Yu, F. Effect of ammonia on new particle formation: A kinetic H2SO4-H2O-NH3 nucleation model constrainedby laboratory measurements. J. Geophys. Res. 2006, 111. [CrossRef]
59. Lemmetty, M.; Vehkamäki, H.; Virtanen, A.; Kulmala, M.; Keskinen, J. Homogeneous ternaryH2SO4–NH3–H2O nucleation and diesel exhaust: A classical approach. Aerosol Air Qual. Res. 2007,7, 489–499. [CrossRef]
60. Benson, D.R.; Yu, J.H.; Markovich, A.; Lee, S.-H. Ternary homogeneous nucleation of H2SO4, NH3, and H2Ounder conditions relevant to the lower troposphere. Atmos. Chem. Phys. 2011, 11, 4755–4766. [CrossRef]
61. Suarez-Bertoa, R.; Pechout, M.; Vojtíšek, M.; Astorga, C. Regulated and non-regulated emissions from Euro 6diesel, gasoline and CNG vehicles under real-world driving conditions. Atmosphere 2020, 11, 204. [CrossRef]
62. Czerwinski, J.; Zimmerli, Y.; Mayer, A.; Heeb, N.; Lemaire, J.; D’Urbano, G.; Bunge, R. Testing of CombinedDPF+SCR Systems for HD-Retrofitting—VERTdePN; SAE International: Warrendale, PA, USA, 2009.
63. Sipila, M.; Berndt, T.; Petaja, T.; Brus, D.; Vanhanen, J.; Stratmann, F.; Patokoski, J.; Mauldin, R.L.;Hyvarinen, A.-P.; Lihavainen, H.; et al. The role of sulfuric acid in atmospheric nucleation. Science 2010, 327,1243–1246. [CrossRef]
64. Uhrner, U.; von Löwis, S.; Vehkamäki, H.; Wehner, B.; Bräsel, S.; Hermann, M.; Stratmann, F.; Kulmala, M.;Wiedensohler, A. Dilution and aerosol dynamics within a diesel car exhaust plume—CFD simulations ofon-road measurement conditions. Atmos. Environ. 2007, 41, 7440–7461. [CrossRef]
65. Olin, M.; Alanen, J.; Palmroth, M.R.T.; Rönkkö, T.; Dal Maso, M. Inversely modeling homogeneousH2SO4—H2O nucleation rate in exhaust-related conditions. Atmos. Chem. Phys. 2019, 19, 6367–6388.[CrossRef]
66. Karjalainen, P.; Rönkkö, T.; Pirjola, L.; Heikkilä, J.; Happonen, M.; Arnold, F.; Rothe, D.; Bielaczyc, P.;Keskinen, J. Sulfur driven nucleation mode formation in diesel exhaust under transient driving conditions.Environ. Sci. Technol. 2014, 2336–2343. [CrossRef] [PubMed]
67. Du, H.; Yu, F. Nanoparticle formation in the exhaust of vehicles running on ultra-low sulfur fuel.Atmos. Chem. Phys. 2008, 8, 4729–4739. [CrossRef]

Vehicles 2020, 2 361
68. Vaaraslahti, K.; Keskinen, J.; Giechaskiel, B.; Solla, A.; Murtonen, T.; Vesala, H. Effect of lubricant on theformation of heavy-duty diesel exhaust nanoparticles. Environ. Sci. Technol. 2005, 39, 8497–8504. [CrossRef]
69. Lemmetty, M.; Rönkkö, T.; Virtanen, A.; Keskinen, J.; Pirjola, L. The effect of sulphur in diesel exhaust aerosol:Models compared with measurements. Aerosol Sci. Technol. 2008, 42, 916–929. [CrossRef]
70. Khalek, I.A.; Kittelson, D.B.; Brear, F. Nanoparticle Growth During Dilution and Cooling of Diesel Exhaust:Experimental Investigation and Theoretical Assessment; SAE International: Warrendale, PA, USA, 2000.
71. Arnold, F.; Pirjola, L.; Rönkkö, T.; Reichl, U.; Schlager, H.; Lähde, T.; Heikkilä, J.; Keskinen, J. First onlinemeasurements of sulfuric acid gas in modern heavy-duty diesel engine exhaust: Implications for nanoparticleformation. Environ. Sci. Technol. 2012, 46, 11227–11234. [CrossRef]
72. Vouitsis, E.; Ntziachristos, L.; Samaras, Z. Modelling of diesel exhaust aerosol during laboratory sampling.Atmos. Environ. 2005, 39, 1335–1345. [CrossRef]
73. Vouitsis, E.; Ntziachristos, L.; Samaras, Z. Theoretical investigation of the nucleation mode formationdownstream of diesel after-treatment devices. Aerosol Air Qual. Res. 2008, 8, 37–53. [CrossRef]
74. Yamada, H.; Funato, K.; Sakurai, H. Application of the PMP methodology to the measurement of sub-23nm solid particles: Calibration procedures, experimental uncertainties, and data correction methods.J. Aerosol Sci. 2015, 88, 58–71. [CrossRef]
75. Giechaskiel, B.; Martini, G. JRC sub-23 nm update. In Proceedings of the 37th PMP meeting, Brussels,Belgium, 7 October 2015.
76. AVL Comments on GTR15 Ammendment. Available online: https://wiki.unece.org/display/trans/PMP+
Web+Conference+02+April (accessed on 24 June 2020).77. Neyestanaki, A.K.; Klingstedt, F.; Salmi, T.; Murzin, D.Y. Deactivation of postcombustion catalysts, a review.
Fuel 2004, 83, 395–408. [CrossRef]78. Giechaskiel, B.; Ntziachristos, L.; Samaras, Z.; Casati, R.; Scheer, V.; Vogt, R. Effect of Speed and Speed-Transition
on the Formation of Nucleation Mode Particles from a Light Duty Diesel Vehicle; SAE International: Warrendale,PA, USA, 2007.
79. Cooper, B.J.; Thoss, J.E. Role of NO in diesel particulate emission control. SAE Trans. 1989, 98, 612–624.[CrossRef]
80. Kröcher, O.; Widmer, M.; Elsener, M.; Rothe, D. Adsorption and desorption of SOx on diesel oxidationcatalysts. Ind. Eng. Chem. Res. 2009, 48, 9847–9857. [CrossRef]
81. Li, L.; King, D.L. Method for determining performance of sulfur oxide adsorbents for diesel emission controlusing online measurements of SO2 and SO3 in the effluent. Ind. Eng. Chem. Res. 2004, 43, 4452–4456.[CrossRef]
82. Koutsopoulos, S.; Rasmussen, S.B.; Eriksen, K.M.; Fehrmann, R. The role of support and promoter on theoxidation of sulfur dioxide using platinum based catalysts. Appl. Catal. A Gen. 2006, 306, 142–148. [CrossRef]
83. Xue, E.; Seshan, K.; van Ommen, J.G.; Ross, J.R.H. Catalytic control of diesel engine particulate emission:Studies on model reactions over a EuroPt-1 (Pt/SiO2) catalyst. Appl. Catal. B Environ. 1993, 2, 183–197.[CrossRef]
84. Wyatt, M.; Manning, W.A.; Roth, S.A.; D’Aniello, M.J.; Andersson, E.S.; Fredholm, S.C.G. The design offlow-through diesel oxidation catalysts. SAE Trans. 1993, 102, 211–223. [CrossRef]
85. Horiuchi, M.; Saito, K.; Ichihara, S. The effects of flow-through type oxidation catalysts on the particulatereduction of 1990’s diesel engines. SAE Trans. 1990, 99, 1268–1278. [CrossRef]
86. Hamzehlouyan, T.; Sampara, C.; Li, J.; Kumar, A.; Epling, W. Experimental and kinetic study of SO2 oxidationon a Pt/γ-Al2O3 catalyst. Appl. Catal. B Environ. 2014, 152, 108–116. [CrossRef]
87. Koltsakis, G. Catalytic automotive exhaust aftertreatment. Prog. Energy Combust. Sci. 1997, 23, 1–39.[CrossRef]
88. Mathieu, Y.; Tzanis, L.; Soulard, M.; Patarin, J.; Vierling, M.; Molière, M. Adsorption of SOx by oxidematerials: A review. Fuel Process. Technol. 2013, 114, 81–100. [CrossRef]
89. Smedler, G.; Ahlström, G.; Fredholm, S.; Frost, J.; Lööf, P.; Marsh, P.; Walker, A.; Winterborn, D.High Performance Diesel Catalysts for Europe Beyond 1996; SAE International: Warrendale, PA, USA, 1995.
90. Henk, M.G.; Williamson, W.B.; Silver, R.G. Diesel Catalysts for Low Particulate and Low Sulfate Emissions;SAE International: Warrendale, PA, USA, 1992.
91. Lampert, J.; Kazi, M.; Farrauto, R. Palladium catalyst performance for methane emissions abatement fromlean burn natural gas vehicles. Appl. Catal. B Environ. 1997, 14, 211–223. [CrossRef]

Vehicles 2020, 2 362
92. Kärkkäinen, M.; Honkanen, M.; Viitanen, V.; Kolli, T.; Valtanen, A.; Huuhtanen, M.; Kallinen, K.; Vippola, M.;Lepistö, T.; Lahtinen, J.; et al. Deactivation of diesel oxidation catalysts by sulphur in laboratory andengine-bench scale aging. Top Catal. 2013, 56, 672–678. [CrossRef]
93. Taylor, K.C. Sulfur storage on automotive catalysts. Ind. Eng. Chem. Prod. Res. Dev. 1976, 15, 264–268.[CrossRef]
94. Wang, Q.; Zhu, J.; Wei, S.; Chung, J.S.; Guo, Z. Sulfur poisoning and regeneration of NOx storage–reductionCu/K2Ti2O5 catalyst. Ind. Eng. Chem. Res. 2010, 49, 7330–7335. [CrossRef]
95. Liu, X.; Chen, L.; Qi, G. Enhanced SO2 capture performance of MnO2 by doping with alkali metal ions fordiesel emission control. Chem. Eng. Technol. 2018, 41, 1675–1681. [CrossRef]
96. Li, L.; King, D.L. High-capacity sulfur dioxide absorbents for diesel emissions control. Ind. Eng. Chem. Res.2005, 44, 168–177. [CrossRef]
97. Horiuchi, M.; Saito, K.; Ichihara, S. Sulfur Storage and Discharge Behavior on Flow-Through Type OxidationCatalysts; SAE International: Warrendale, PA, USA, 1991.
98. Centi, G.; Passarini, N.; Perathoner, S.; Riva, A. Combined DeSOx/DeNOx reactions on a copper on aluminasorbent-catalyst. 1. Mechanism of sulfur dioxide oxidation-adsorption. Ind. Eng. Chem. Res. 1992, 31,1947–1955. [CrossRef]
99. Limousy, L.; Mahzoul, H.; Brilhac, J.F.; Gilot, P.; Garin, F.; Maire, G. SO2 sorption on fresh and aged SOxtraps. Appl. Catal. B Environ. 2003, 42, 237–249. [CrossRef]
100. Dawody, J.; Skoglundh, M.; Olsson, L.; Fridell, E. Sulfur deactivation of Pt/SiO2, Pt/BaO/Al2O3, andBaO/Al2O3 NOx storage catalysts: Influence of SO2 exposure conditions. J. Catal. 2005, 234, 206–218.[CrossRef]
101. Dawody, J.; Skoglundh, M.; Olsson, L.; Fridell, E. Kinetic modelling of sulfur deactivation of Pt/BaO/Al2O3
and BaO/Al2O3 NOx storage catalysts. Appl. Catal. B Environ. 2007, 70, 179–188. [CrossRef]102. Kylhammar, L.; Carlsson, P.-A.; Ingelsten, H.H.; Grönbeck, H.; Skoglundh, M. Regenerable ceria-based SOx
traps for sulfur removal in lean exhausts. Appl. Catal. B Environ. 2008, 84, 268–276. [CrossRef]103. Hamzehlouyan, T.; Sampara, C.S.; Li, J.; Kumar, A.; Epling, W.S. Kinetic study of adsorption and desorption
of SO2 over γ-Al2O3 and Pt/γ-Al2O3. Appl. Catal. B Environ. 2016, 181, 587–598. [CrossRef]104. Yoshida, K.; Asanuma, T.; Nishioka, H.; Hayashi, K.; Hirota, S. Development of NOx Reduction System for Diesel
Aftertreatment with Sulfur Trap Catalyst; SAE International: Warrendale, PA, USA, 2007.105. Englund, J.; Xie, K.; Dahlin, S.; Schaefer, A.; Jing, D.; Shwan, S.; Andersson, L.; Carlsson, P.-A.; Pettersson, L.J.;
Skoglundh, M. Deactivation of a Pd/Pt bimetallic oxidation catalyst used in a biogas-powered Euro VIheavy-duty engine installation. Catalysts 2019, 9, 1014. [CrossRef]
106. Argyle, M.; Bartholomew, C. Heterogeneous catalyst deactivation and regeneration: A review. Catalysts2015, 5, 145–269. [CrossRef]
107. Chasapidis, L.; Melas, A.D.; Tsakis, A.; Zarvalis, D.; Konstandopoulos, A. A Sampling and Conditioning ParticleSystem for Solid Particle Measurements Down to 10 nm; SAE International: Warrendale, PA, USA, 2019.
108. Miller, J.; Jin, L. Global Progress toward Soot-Free Diesel Vehicles; International Council Clean Transportation(ICCT) Report; ICCT: Washington, DC, USA, 2019.
109. Yamada, H.; Inomata, S.; Tanimoto, H. Mechanisms of increased particle and VOC emissions during DPFactive regeneration and practical emissions considering regeneration. Environ. Sci. Technol. 2017, 51,2914–2923. [CrossRef] [PubMed]
110. Yasar, A.; Haider, R.; Tabinda, A.B.; Kausar, F.; Khan, M. A comparison of engine emissions from heavy,medium, and light vehicles for CNG, diesel, and gasoline fuels. Pol. J. Environ. Stud. 2013, 22, 1277–1281.
111. Tavares, J.R.; Sthel, M.S.; Campos, L.S.; Rocha, M.V.; Lima, G.R.; da Silva, M.G.; Vargas, H. Evaluationof pollutant gases emitted by ethanol and gasoline powered vehicles. Proc. Environ. Sci. 2011, 4, 51–60.[CrossRef]
112. Gentner, D.R.; Worton, D.R.; Isaacman, G.; Davis, L.C.; Dallmann, T.R.; Wood, E.C.; Herndon, S.C.;Goldstein, A.H.; Harley, R.A. Chemical composition of gas-phase organic carbon emissions from motorvehicles and implications for ozone production. Environ. Sci. Technol. 2013, 47, 11837–11848. [CrossRef]
113. Tobias, H.J.; Beving, D.E.; Ziemann, P.J.; Sakurai, H.; Zuk, M.; McMurry, P.H.; Zarling, D.; Waytulonis, R.;Kittelson, D.B. Chemical analysis of diesel engine nanoparticles using a nano-DMA/thermal desorptionparticle beam mass spectrometer. Environ. Sci. Technol. 2001, 35, 2233–2243. [CrossRef]

Vehicles 2020, 2 363
114. Sakurai, H.; Tobias, H.J.; Park, K.; Zarling, D.; Docherty, K.S.; Kittelson, D.B.; McMurry, P.H.; Ziemann, P.J.On-line measurements of diesel nanoparticle composition and volatility. Atmos. Environ. 2003, 37, 1199–1210.[CrossRef]
115. Swanson, J.J.; Kittelson, D.B.; Watts, W.F.; Gladis, D.D.; Twigg, M.V. Influence of storage and release onparticle emissions from new and used CRTs. Atmos. Environ. 2009, 43, 3998–4004. [CrossRef]
116. Schneider, J.; Hock, N.; Weimer, S.; Borrmann, S.; Kirchner, U.; Vogt, R.; Scheer, V. Nucleation particles indiesel exhaust: Composition inferred from in situ mass spectrometric analysis. Environ. Sci. Technol. 2005,39, 6153–6161. [CrossRef]
117. Karavalakis, G.; Gysel, N.; Schmitz, D.A.; Cho, A.K.; Sioutas, C.; Schauer, J.J.; Cocker, D.R.; Durbin, T.D.Impact of biodiesel on regulated and unregulated emissions, and redox and proinflammatory properties ofPM emitted from heavy-duty vehicles. Sci. Total Environ. 2017, 584, 1230–1238. [CrossRef]
118. Alves, C.A.; Lopes, D.J.; Calvo, A.I.; Evtyugina, M.; Rocha, S.; Nunes, T. Emissions from light-duty dieseland gasoline in-use vehicles measured on chassis dynamometer test cycles. Aerosol Air Qual. Res. 2015, 15,99–116. [CrossRef]
119. Tsai, J.-H.; Huang, P.-H.; Chiang, H.-L. Air pollutants and toxic emissions of various mileage motorcycles forECE driving cycles. Atmos. Environ. 2017, 153, 126–134. [CrossRef]
120. Ntziachristos, L.; Vonk, W.A.; Papadopoulos, G.; van Mensch, P.; Geivanidis, S.; Mellios, G.; Papadimitriou, G.;Steven, H.; Elstgeest, M.; Ligterink, N.E.; et al. Effect Study of the Environmental Step Euro 5 for L-CategoryVehicles; European Commission: Brussels, Belgium, 2017; ISBN 978-92-79-70203-7.
121. Kontses, A.; Ntziachristos, L.; Zardini, A.A.; Papadopoulos, G.; Giechaskiel, B. Particulate emissions fromL-Category vehicles towards Euro 5. Environ. Res. 2020, 182, 109071. [CrossRef]
122. Costagliola, M.A.; Murena, F.; Prati, M.V. Exhaust emissions of volatile organic compounds of poweredtwo-wheelers: Effect of cold start and vehicle speed. Contribution to greenhouse effect and troposphericozone formation. Sci. Total Environ. 2014, 468, 1043–1049. [CrossRef]
123. Liu, X.; Deng, B.; Fu, J.; Xu, Z.; Liu, J.; Li, M.; Li, Q.; Ma, Z.; Feng, R. The effect of air/fuel composition on theHC emissions for a twin-spark motorcycle gasoline engine: A wide condition range study. Chem. Eng. J.2019, 355, 170–180. [CrossRef]
124. Szymlet, N.; Lijewski, P.; Sokolnicka, B.; Siedlecki, M.; Domowicz, A. Analysis of research method, results andregulations regarding the exhaust emissions from two-wheeled vehicles under actual operating conditions.J. Ecol. Eng. 2020, 21, 128–139. [CrossRef]
125. Kašpar, J.; Fornasiero, P.; Hickey, N. Automotive catalytic converters: Current status and some perspectives.Catal. Today 2003, 77, 419–449. [CrossRef]
126. Jaworski, A.; Madziel, M.; Lejda, K. Creating an emission model based on portable emission measurementsystem for the purpose of a roundabout. Environ. Sci. Pollut. Res. 2019, 26, 21641–21654. [CrossRef]
127. Zhu, G.; Liu, J.; Fu, J.; Xu, Z.; Guo, Q.; Zhao, H. Experimental study on combustion and emission characteristicsof turbocharged gasoline direct injection (GDI) engine under cold start new European driving cycle (NEDC).Fuel 2018, 215, 272–284. [CrossRef]
128. Yang, Z.; Liu, Y.; Wu, L.; Martinet, S.; Zhang, Y.; Andre, M.; Mao, H. Real-world gaseous emissioncharacteristics of Euro 6b light-duty gasoline- and diesel-fueled vehicles. Transp. Res. Part D Transp. Environ.2020, 78, 102215. [CrossRef]
129. Ma, C.; Wu, L.; Mao, H.; Fang, X.; Wei, N.; Zhang, J.; Yang, Z.; Zhang, Y.; Lv, Z.; Yang, L. Transientcharacterization of automotive exhaust emission from different vehicle types based on on-road measurements.Atmosphere 2020, 11, 64. [CrossRef]
130. Simonen, P.; Kalliokoski, J.; Karjalainen, P.; Rönkkö, T.; Timonen, H.; Saarikoski, S.; Aurela, M.; Bloss, M.;Triantafyllopoulos, G.; Kontses, A.; et al. Characterization of laboratory and real driving emissions ofindividual Euro 6 light-duty vehicles—Fresh particles and secondary aerosol formation. Environ. Pollut.2019, 255, 113175. [CrossRef]
131. Ko, J.; Son, J.; Myung, C.-L.; Park, S. Comparative study on low ambient temperature regulated/unregulatedemissions characteristics of idling light-duty diesel vehicles at cold start and hot restart. Fuel 2018, 233,620–631. [CrossRef]
132. Bikas, G.; Zervas, E. Regulated and non-regulated pollutants emitted during the regeneration of a dieselparticulate filter. Energy Fuels 2007, 21, 1543–1547. [CrossRef]

Vehicles 2020, 2 364
133. Jung, S.; Lim, J.; Kwon, S.; Jeon, S.; Kim, J.; Lee, J.; Kim, S. Characterization of particulate matter from dieselpassenger cars tested on chassis dynamometers. J. Environ. Sci. 2017, 54, 21–32. [CrossRef]
134. R’Mili, B.; Boréave, A.; Meme, A.; Vernoux, P.; Leblanc, M.; Noël, L.; Raux, S.; D’Anna, B. Physico-chemicalcharacterization of fine and ultrafine particles emitted during diesel particulate filter active regeneration ofEuro 5 diesel vehicles. Environ. Sci. Technol. 2018, 52, 3312–3319. [CrossRef]
135. Ruehl, C.; Smith, J.D.; Ma, Y.; Shields, J.E.; Burnitzki, M.; Sobieralski, W.; Ianni, R.; Chernich, D.J.;Chang, M.-C.O.; Collins, J.F.; et al. Emissions during and real-world frequency of heavy-duty dieselparticulate filter regeneration. Environ. Sci. Technol. 2018, 52, 5868–5874. [CrossRef] [PubMed]
136. Giechaskiel, B.; Gioria, R.; Carriero, M.; Lähde, T.; Forloni, F.; Perujo, A.; Martini, G.; Bissi, L.M.; Terenghi, R.Emission factors of a Euro VI heavy-duty diesel refuse collection vehicle. Sustainability 2019, 11, 1067.[CrossRef]
137. Doozandegan, M.; Hosseini, V.; Ehteram, M.A. Solid nanoparticle and gaseous emissions of a diesel enginewith a diesel particulate filter and use of a high-sulphur diesel fuel and a medium-sulphur diesel fuel. Proc.Inst. Mech. Eng. Part. D J. Automob. Eng. 2017, 231, 941–951. [CrossRef]
138. Rothe, D.; Knauer, M.; Emmerling, G.; Deyerling, D.; Niessner, R. Emissions during active regenerationof a diesel particulate filter on a heavy duty diesel engine: Stationary tests. J. Aerosol Sci. 2015, 90, 14–25.[CrossRef]
139. Smith, J.D.; Ruehl, C.; Burnitzki, M.; Sobieralski, W.; Ianni, R.; Quiros, D.; Hu, S.; Chernich, D.; Collins, J.;Huai, T.; et al. Real-time particulate emissions rates from active and passive heavy-duty diesel particulatefilter regeneration. Sci. Total Environ. 2019, 680, 132–139. [CrossRef] [PubMed]
© 2020 by the authors. Licensee MDPI, Basel, Switzerland. This article is an open accessarticle distributed under the terms and conditions of the Creative Commons Attribution(CC BY) license (http://creativecommons.org/licenses/by/4.0/).
Copyright © 2022 FDOKUMEN