Correlating sensory attributes, textural parameters and volatile ...

ORIGINAL PAPER
Emission of volatile compounds by Erwinia amylovora:biological activity in vitro and possible exploitationfor bacterial identification
Francesco Spinelli • Antonio Cellini • Joel L. Vanneste •
Maria T. Rodriguez-Estrada • Guglielmo Costa •
Stefano Savioli • Frans J. M. Harren • Simona M. Cristescu
Received: 7 July 2011 / Revised: 28 November 2011 / Accepted: 8 December 2011
� Springer-Verlag 2011
Abstract Several analytical techniques such as gas
chromatography–mass spectrometry, proton transfer reac-
tion–mass spectrometry and laser photoacoustic detection,
were used to characterize the volatiles emitted by Erwinia
amylovora and other plant-pathogenic bacteria. Diverse
volatiles were found to be emitted by the different bacterial
species examined. The distinct blend of volatiles produced
by bacteria allowed their identification using an electronic
nose (e-nose). The present study reports the discrimination
of E. amylovora, the fire blight pathogen, from other plant-
associated bacteria using an e-nose based on metal oxide
semiconductor sensors. Two different approaches were
used for bacterial identification. The first one was the direct
comparison of the odorous profiles of unknown bacterial
isolates with four selected reference species. The second
approach was the use of previously developed databases
representing the odorous variability among several bacte-
rial species. Using these two strategies, the e-nose suc-
cessfully identified the isolates in 87.5 and 62.5% of the
cases, respectively. Finally, the profiling of the volatiles
emitted by E. amylovora lead to identify some metabolic
markers with a potential biological activity in vitro.
Keywords Fire blight � VOCs � Erwinia amylovora �2,3-Butanediol � Electronic nose � Plant growth promotion
Introduction
Identification of bacterial species, including plant patho-
gens, is currently based on the sequencing of ribosomal
genes (Han 2006). Although molecular techniques are
highly reliable, they are time consuming and require spe-
cific equipments and trained personnel (Tothill 2001). In
addition, they do not provide information about the phys-
iological activity of microbes (Gardner et al. 1998).
Many microbial species, such as bacteria and yeasts, are
characterized by typical odour emissions, which reflect their
metabolism and interactions with the environment (Gibson
et al. 1997; McEntegart et al. 2000; Magan and Evans 2000;
Bachinger and Mandenius 2000). Several researchers
showed that the detection of volatile organic compounds
(VOCs) produced in vitro by microorganisms can be
exploited for their identification (Gibson et al. 1997; Wilson
et al. 2004; Keshri and Magan 2000; Magan and Evans 2000;
Dutta et al. 2002; Marilley et al. 2004; Momol et al. 2004;
Rock et al. 2008; Spinelli et al. 2011b). Therefore, bacterial
identification via the analysis of VOCs could also provide
key information on the biology of the species.
In addition, VOCs identification can also allow plant
disease diagnosis (Jonsson et al. 1997; Wilson and Lester
Communicated by D. Treutter.
A contribution to the Special Issue: Pome Fruit Health.
F. Spinelli (&) � A. Cellini � G. Costa
Dipartimento di Colture Arboree, University of Bologna,
Viale Fanin 46, 40127 Bologna, Italy
e-mail: [email protected]
J. L. Vanneste
The New Zealand Institute for Plant and Food Research Ltd.,
Ruakura Research Centre, Private Bag 3123,
Hamilton 3240, New Zealand
M. T. Rodriguez-Estrada � S. Savioli
Dipartimento di Scienze degli Alimenti, University of Bologna,
Viale Fanin 40, 40127 Bologna, Italy
F. J. M. Harren � S. M. Cristescu
Radboud University, Life Science Trace Gas Facility,
Heyendaalseweg 135, 6525 AJ Nijmegen, The Netherlands
123
Trees
DOI 10.1007/s00468-011-0667-2

1998; Harper 2001; Prithiviraj et al. 2004; Vikram et al.
2005; Laothawornkitkul et al. 2008; Spinelli et al. 2010,
2011a).
Gas or liquid chromatography combined with mass
spectrometry (GC–MS, HPLC–MS) and proton transfer
reaction–mass spectrometry (PTR-MS) provide the
opportunity to identify microorganisms, however these
methods are time consuming, expensive and usually more
complex than the standard molecular methods (Saevels
et al. 2003; Turner and Magan 2004). Therefore, simpler,
faster alternative systems for the real-time monitoring of
aroma are needed (Tothill 2001). One of the candidate
instruments to achieve this challenge is the electronic-nose
(e-nose). Electronic noses analyze gaseous mixtures to
discriminate between different, but similar, mixtures, and
in the case of simple mixtures, to quantify the concentra-
tion of the constituents (Pardo and Sberveglieri 2004).
Therefore, by mimicking the mammalian smell sensor,
e-noses are able to detect the olfactory fingerprint of a
specimen (Pavlou and Turner 2000). Presence of bacteria is
detected by changes in the chemical composition of the
headspace vapours (McEntegart et al. 2000). In contrast to
GC–MS, the e-nose does not identify and quantify each
headspace component, but it records the global effect of the
volatile mixture on the sensors (Pardo and Sberveglieri
2004). To discriminate between samples, the output from
the sensor array may be interpreted via a variety of meth-
ods, such as pattern recognition algorithms, principal
component analysis (PCA), discriminant function analysis,
cluster analysis and artificial neural network.
The gram-negative bacterium Erwinia amylovora which
is the causal agent of fire blight of pomaceous plant, leads
to the most serious bacterial disease of apple and pear trees.
Under optimal conditions fire blight can kill an entire tree
in a single growing season. The early stages of the infec-
tion are not associated with obvious symptoms; but control
of the pathogen, after it has been established, is often dif-
ficult and requires radical pruning intervention. A tool for
the early detection of E. amylovora in the orchard and in
propagation material would be useful to prevent the spread
of the disease. Electronic noses based on metal oxide
semiconductor technology may allow the recognition of
bacterial species, such as E. amylovora, based on aroma
emissions profiling.
The advantages of e-noses, compared to traditional
identification techniques, are due to the time saving (min-
utes instead of days) and an operator-friendly interface.
In the present work, two electronic noses, EOS835 and
EOS507, have been compared for their efficacy in dis-
criminating the plant pathogen E. amylovora from the other
bacterial species usually isolated from the same host plants
(i.e. Malus domestica and Pyrus communis). In addition,
the VOCs produced by in vitro culture of E. amylovora and
other plant-associated bacteria were identified by PTR-MS
and GC–MS.
The e-nose used in this study was first designed and
engineered at the Sensor Lab in Brescia (Pardo and
Sberveglieri 2004), and it is now commercialized by the
SACMI Company (Imola, Italy, www.sacmi.it) as the
Electronic Olfactory System EOS507. EOS507 uses
advanced control electronics and has a user-friendly data
analysis interface. The gas is sensed by its effect on the
electrical resistance of the SnO2 semiconductor, resulting
from combustion reactions occurring with active oxygen
species on the surface of the SnO2 particles (Pardo and
Sberveglieri 2004).
As compared to the previous versions (such as EOS835),
EOS507 does not need to be connected to a computer,
since it integrates an operating system with analysis and
recognition programs.
Electronic noses does not allow identification or quanti-
fication of single compounds in complex mixtures (Pardo
and Sberveglieri 2004). Such information, could be useful to
isolate single volatile compounds with biological effects on
plant hosts, and to provide better markers for identification,
thus leading to the improvement of e-nose sensors. There-
fore, other methods must be adopted for the identification of
the single volatiles contributing to the odorous fingerprint of
the different bacterial species. GC–MS provides a precise
identification of single compounds, despite the technique
being complicated and time consuming. PTR-MS also
requires dedicated and expensive instrumentation, and its
output consists of a qualitative profile of masses that cannot
be uniquely linked to single molecules; on the other hand, it
allows a real-time monitoring of variations in the mass
profile (Boamfa et al. 2004). Laser photoacoustic detection
(LPD) is another on-line method, which can be used for the
direct measure of specific compounds, such as the gaseous
plant stress hormone ethylene (Cristescu et al. 2008).
In the present work, bacterial isolates obtained from the
epiphytic biocoenosis harboured by apple flowers, leaves
and fruitlets, were identified using traditional methods and
divided in different groups. For each group one or more
isolates were identified using molecular methods, these
isolates were then identified with the e-nose and the data
were compared with those obtained by molecular methods.
In addition, the VOCs emitted by E. amylovora 1540, 1/79
and 8865, Pantoea agglomerans P10c, Pseudomonas flu-
orescens A506, Bacillus amyloliquefaciens IN937 and
Bacillus subtilis AM01 were characterized by GC–MS and
PTR-MS. The absence of ethylene production by E. amy-
lovora was also determined by LPD.
Finally, preliminary experiments were performed to
evaluate the possible biological effects of gaseous com-
pounds released by bacterial cultures on other bacteria and
pear plants.
Trees
123

Materials and methods
Bacterial isolation, cultivation and standard
identification
The bacterial species used in this work were E. amylovora,
Erwinia carotovora ssp. carotovora, Erwinia pyrifoliae,
Pseudomonas syringae pv. syringae, P. syringae pv.
tomato, P. syringae pv. papulans, and P. syringae pv. pisi,
Pseudomonas chicori, Pseudomonas aeruginosa, Pseudo-
monas vart, P. fluorescens, P. agglomerans, B. amyloliq-
uefaciens and B. subtilis (Table 1). Those strains were used
to build up the database of the volatile fingerprints of the
different species. Most of the species considered in this
work are commonly found on the surface of apple plants.
Among them, some strains of P. fluorescens and P. ag-
glomerans are commercially available as biological control
agents like BlightBan� and Blossom BlessTM
, respectively.
Epiphytic bacteria were isolated from the surface of
apple flowers, leaves and fruits collected from a ‘Braeburn’
apple experimental orchard at Ruakura Research Station,
Hamilton (New Zealand). For the isolation, entire flowers,
leaves or fruitlet were washed in 10 mL of a sterile solution
of MgSO4 10 mM amended with Tween 20 (1%, v/v). The
washing solution was vortexed for 1 min and then spread
on Luria Agar (LA) Petri dishes amended with cyclohex-
imide (50 mg/L). Twenty-four putatively different isolates
were purified and stored in glycerol-stock at -20�C.
All twenty-four isolates were screened for gram color-
ation, colony morphology, production of fluorescent pig-
ments on King’s B medium and production of an
hypersensitive reaction (HR) on tobacco leaves. In addi-
tion, the semi-selective Miller and Shroth medium (Miller
and Schroth 1972) and Pseudomonas Syringae Syringae
Medium (PSSM) (Atlas 2000) were used to screen for
E. amylovora and P. syringae pv syringae, respectively. In
all screening tests, the following bacterial strains were used
as a control: E. amylovora (1540, 8865, 1/79 and DCA289/
01), P. syringae pv syringae (3523 and 4647), P. ag-
glomerans (252, P10c and DCA269/01) and P. fluorescens
(A506 and A3480-73T).
The putative identification of these isolates was con-
firmed by sequencing a 804 bp fragment of the 16SrDNA
after amplification using the PCR primers 27f and 1492r
developed by Martin-Laurent et al. (2001). DNA
sequencing was carried out at the Waikato DNA Sequence
Facility. DNA sequences were resolved using a 3130XL
Genetic Analyzer System fitted with 50 cm capillary arrays
(Applied Biosystems) loaded with POP-7 polyacrylamide
matrix (Applied Biosystems). DNA templates were pre-
pared using Big Dye v3.1 terminator chemistry (Applied
Biosystems). When required, DNA sequences were com-
pared with DNA sequences deposited in GenBank� from
the National Centre for Biotechnology Information (NCBI)
using the programme BLAST 2.2.25 (Zhang et al. 2000).
Among the 24 isolates, only 12 were chosen for molecular
identification. Those isolates represented all the different
groups of bacteria obtained with the previous screening.
Classification using the e-nose was also carried on for those
strains.
Electronic nose equipment and analysis
The olfactory fingerprints were collected with the e-noses
EOS835 and EOS507 (SACMI Inc., Imola, Italy), based on
an array of six different sensors constituted of metal-oxide
semiconductors.
Initially, 46 previously known bacterial strains belong-
ing to nine species (standard strains, Table 1) and twenty-
four unknown bacterial strains were grown on Luria broth
(LB) for 24 h, before transferring 1 mL of each culture to
20 mL of Ceria 132 medium (Vanneste et al. 1992) in
50 mL glass vials closed by a screw cap with a PTFE
septum. These cultures were incubated at 27�C for 3 h
under moderate shaking. Eight replicates from each strain
were used for the e-nose readings. Results from the 46
known strains allowed the development of a database of
olfactory fingerprints. This database was successively used
to identify the 24 unknown isolates and for the recognition
of additional type strains (e.g., E. amylovora 1/79, 178,
1392).
A second set of experiments was performed, comparing
each unknown isolate with only two strains belonging to
the most abundant species isolated from apple and pear
phyllosphere (E. amylovora and P. syringae pv. syringae or
P. agglomerans and P. fluorescens).
Gas-chromatographic air, or air filtered by multiple
passages through active charcoal and silica gel, was used as
reference. Since this air has a very low relative humidity
(RH) (close to zero), a humidifier, consisting of a porous
stone gargling in sterile water, was used to obtain air with a
RH similar to that of samples. The e-nose readings were set
according to the following parameters: ‘Warm Up’: 00,‘Wait’: 00, ‘Before’: 0.80, ‘During’: 0.30, ‘After’: 0.80,‘Clean End’: 00. For each vials, two e-nose analyses were
performed. During the first one, the headspace accumulated
during 3 h of culturing was sampled, whereas in the second
one, the volatiles readily produced were collected and
analysed.
Gas chromatography–mass spectrometry
Headspace–solid-phase microextration–GC–MS (HS–
SPME–GC–MS) determination of VOCs emission was
performed according to Francioso et al. (2010). The bacterial
strains (E. amylovora 1540, 1/79, 8865; P. fluorescens A506,
Trees
123

Table 1 List of bacterial species and strains used as standard for the development of a VOCs profile database
Bacterial strains Organisms Type Geographic origin Isolation
Ea 1540 Erwinia amylovora Plant pathogenic New Zealand D.W. Dye
Ea 8865 Erwinia amylovora Plant pathogenic New Zealand S.V. Thomson
Ea DCA289/01 Erwinia amylovora Plant pathogenic Italy F. Spinelli
Ea 2.58 Erwinia amylovora Plant pathogenic New Zealand R.K. Taylor
Ea 7/74 Erwinia amylovora Plant pathogenic Germany W. Zeller
Ea 13253 Erwinia pyrifoliae Plant pathogenic Japan R.K. Taylor
Ea J21 Erwinia pyrifoliae Plant pathogenic Japan R.K. Taylor
Ea 13249 Erwinia pyrifoliae Plant pathogenic Japan R.K. Taylor
EIC 5 Erwinia carotovora carotovora Plant pathogenic New Zealand P.J. Wright
EIC6 Erwinia carotovora carotovora Plant pathogenic New Zealand P.J. Wright
EIC26 Erwinia carotovora carotovora Plant pathogenic New Zealand P.J. Wright
Ecc 1524 Erwinia carotovora subsp. carotovora Plant pathogenic UK D.W. Dye
Pss 3523 Pseudomonas syringae pv. syringae Plant pathogenic Australia J.P. Wilkie
Pss 4647 Pseudomonas syringae pv. syringae Plant pathogenic New Zealand J.L. Vanneste
Pss 4355 Pseudomonas syringae pv. syringae Plant pathogenic New Zealand D.R.W. Watson
Pss 02.43 Pseudomonas syringae pv. syringae Plant pathogenic Unknown Unknown
Pst 2843 Pseudomonas syringae pv. tomato Plant pathogenic USA W.H. Burkholder
Pst 3362 Pseudomonas syringae pv. tomato Plant pathogenic New Zealand J.P. Wilkie
Pst 4049 Pseudomonas syringae pv. papulans Plant pathogenic Canada B.N. Dhanvantari
Pspi 2651 Pseudomonas syringae pv. pisi Plant pathogenic New Zealand J.M. Young
Pspi 2661-69 Pseudomonas syringae pv. pisi Plant pathogenic Unknown Unknown
Pspi 2254 sub II Pseudomonas syringae pv. pisi Plant pathogenic Unknown Unknown
Psp 4040 Pseudomonas syringae pv. papulans Plant pathogenic USA B.N. Dhanvantari
Psp 4044 Pseudomonas syringae pv. papulans Plant pathogenic Canada B.N. Dhanvantari
Psp 9986 Pseudomonas syringae pv. papulans Plant pathogenic Unknown Unknown
Pc 1258 Pseudomonas chicori Plant pathogenic Unknown Unknown
Pv 83597737 Pseudomonas vart Plant pathogenic Unknown Unknown
Eh 252 Pantoea agglomerans Epiphytic USA S.V. Beer
Eh DCA269/01 Pantoea agglomerans Epiphytic Italy F. Spinelli
Eh C9-1 Pantoea agglomerans Epiphytic USA C. Ishimaru
Eh B7 Pantoea agglomerans Epiphytic Italy J.L. Vanneste
Eh B18 Pantoea agglomerans Epiphytic Italy J.L. Vanneste
Eh B22 Pantoea agglomerans Epiphytic Italy J.L. Vanneste
Eh 265 Pantoea agglomerans Epiphytic Canada D.W. Dye
P10c Pantoea agglomerans Epiphytic New Zealand J.L. Vanneste
P10c9aRI Pantoea agglomerans Epiphytic New Zealand J.L. Vanneste
Eh RGcalyx Pantoea agglomerans Epiphytic New Zealand J.L. Vanneste
Eh G9 Pantoea agglomerans Epiphytic New Zealand J.L. Vanneste
Eh G12 Pantoea agglomerans Epiphytic New Zealand J.L. Vanneste
Eh HB6 Pantoea agglomerans Epiphytic New Zealand J.L.Vanneste
Eh 318 Pantoea agglomerans Epiphytic USA S.V. Beer
Eh 10:22 Pantoea agglomerans Epiphytic New Zealand J.L. Vanneste
Pf A506 Pseudomonas fluorescens Epiphytic USA S.E. Lindow
Pf 862 Pseudomonas fluorescens Animal Health Laboratory, Hamilton NZ
Pf A3480-73T Pseudomonas fluorescens Epiphytic Unknown Unknown
Pa 981 Pseudomonas aeruginosa Human pathogen Animal Health Laboratory, Hamilton NZ
Trees
123

B. amyloliquefaciens IN937, B. subtilis AM01, and
P. agglomerans P10c) were grown on Luria agar at 27�C
for 24 h. Successively, 100 lL of the culture was trans-
ferred in 5 mL of Murashige and Skoog medium enriched
with acetoin (1.76 g/L) to enhance 2,3-butanediol produc-
tion. Before the GC–MS analysis, the samples were
incubated at 40�C for 20 min in a thermostatic bath. A
50/30 m divynilbenzene/carboxen/polydimethylsiloxane
(DVB/Carboxen/PDMS) Stable Flex SPME fiber (Supelco,
Bellefonte, PA, USA) was inserted through the septum into
the vial, which was kept at 40�C for 30 min. Vial pene-
tration depth was set at 20 mm and, after 30 min of
extraction, the SPME fiber was inserted into the injection
port of the Shimadzu GC–MS–QP2010 Plus (Shimadzu,
Tokyo, Japan). The injection penetration depth was set at
51 mm. The SPME fiber was desorbed at 260�C for 10 min
in the split mode. The chromatographic separation of vol-
atile compounds was performed on a ZB-5 ms fused-silica
capillary column (30 m 9 0.25 mm i.d. 9 0.25 m) coated
with 5% phenylpolysiloxane–95% poly (dimethylsiloxane)
(Phenomenex, Torrance, CA, USA). The oven was pro-
grammed to heat from 45�C (kept for 10 min) to 200�C at
3�C/min and kept at 200�C for 8 min. The injector and
transfer line temperatures were set at 260 and 210�C,
respectively. Helium was used as the carrier gas at a con-
stant flow rate of 1 mL/min and a linear velocity of
36.2 cm/s; the split ratio was 1:30. The filament emission
current was 70 eV. A mass range from 40 to 700 m/z was
scanned at a rate of 1,428 amu/s. Identification of volatile
compounds was performed by comparing their retention
time and mass spectra with data reported in the literature
(Francioso et al. 2010) and the NIST/EPA/NIH Mass
Spectral Database (NIST 05, National Institute of Stan-
dards and Technology, Gaithersburg, MD, USA).
The terpenes and terpenoids produced by E. amylovora
1/79 were also determined. These compounds were col-
lected, analysed and identified according to Rapparini et al.
(2004). E. amylovora was cultured in 500 mL Erlenmeyer
flask filled with 150 mL of Ceria 132. The cultures were
incubated at 27�C for 24 h under moderate shaking. For the
collection of volatiles, 450 mL of gas were sampled from
each vial at a flow rate of 30 mL/min onto carbonaceous
traps (Carbograph 1 and Carbograph 2, LARA, Rome,
Italy) packed in glass tubes. Two VOC samplings for each
culture were collected simultaneously. The gas sampling
was conducted on four independent bacterial cultures. The
final bacterial population was assessed by 10-fold
sequential dilutions and plating. The trapped compounds
were thermodesorbed at 250�C and cryofocused at -150�C
on a fused silica liner using a Thermal Desorption Cold
Trap Injector (Chrompack, Middleburg, the Netherlands)
connected to a Hewlett Packard 5890 gas chromatograph
(GC) using a 5970 quadrupole mass spectrometer (MS) as
detection system (Hewlett Packard, Palo Alto, CA, USA).
The desorbed sample, enriched on the cryofocusing unit,
was transferred to the capillary column (60 m 9 0.25 mm
i.d., 0.25 lm film of polymethylsiloxane; HP-1, Hewlett
Packard) by heating the fused silica liner to 230�C. The
separation of terpenes was achieved by maintaining the
oven temperature at 40�C for 10 min and programming to
220�C at 5�C/min. Mass spectra and the reconstructed
chromatogram were obtained by automatically scanning in
the mass range m/z from 20 to 200 a.m.u. Identification of
terpenes was attained by comparing the retention time and
mass spectra with those of authentic standards. Quantifi-
cation of monoterpenes was performed after calculation of
standard curves and response factors for each compound,
and using d14-cymene as internal standards (ISTD). The
comparison of the response for the m/z 93 ion was gener-
ally used for quantification. The biogenic VOC emission
rates were calculated by multiplying the concentration
difference between chamber inlet and outlet air with the air
flow through the chamber, divided by the total biomass dry
weight of the plant material.
Proton transfer reaction-mass spectrometry
Proton transfer reaction-mass spectrometry analysis was
carried out for the strain E. amylovora 1540, P. fluorescens
A506, P. agglomerans P10c, B. amyloliquefaciens IN937a
and B. subtilis AM01. The measurement was taken during
the first 2 days of bacterial growth in LB medium and kept
at room temperature (22�C). Air and non-inoculated LB
medium were used as reference. All mass fragments from
mass 21 to 96 were monitored during the analysis. Three
cultures for each bacterium were measured and five scans
were made for each culture.
Ethylene detection
E. amylovora 1540 and P. agglomerans P10c were grown
in LB medium supplemented with 10 lM methionine to
enhance ethylene emission. To monitor the ethylene pro-
duction, a CO2 laser-based photoacoustic trace gas detector
(ETD-300, Sensor Sense B. V., Nijmegen, The Nether-
lands) was used in combination with a gas handling system
(type VC-6, Sensor Sense B. V., Nijmegen, The Nether-
lands) designed for measuring up to six sampling cuvettes
per experiment. Analyses were performed repetitively at
10-min intervals for each sample and a constant air flux of
2 L/h. Non-inoculated medium was used as reference.
Interorganism communication
The effects of volatile compounds emitted by actively
growing E. amylovora 1/79 and P. agglomerans P10c
Trees
123

cultures were tested for their possible effect on E. amylo-
vora growth. The headspace of donor bacterial culture was
pumped through a culture of E. amylovora 1/79 at a flow
rate of 5 mL/min. The donor and receiving bacteria were
cultured in 50 mL glass vials containing 5 mL of LB
incubated at 27�C. To avoid contamination, the air sampled
for the headspace of the donor culture was filter sterilized
before the emission in the receiving one. The headspace of
vials containing 5 mL of sterile LB was used as control.
Furthermore, emissions of volatile by E. amylovora 1/79,
B. subtilis AM01, B. amyloliquefaciens FZB42 and P. ag-
glomerans P10c were also tested for their possible effects on
the growth and the induction of disease resistance on in vitro-
cultivated pear plants (cv. ‘Abbe Fetel’). For this purpose,
bacteria and plants were grown in the same jar avoiding
physical contact. The bacteria were grown in 5 mL of solid
Ceria 132 minimal medium amended with acetoin (1.76 g/L)
to stimulate the production of 2,3-butanediol. The plants were
grown on Murashige and Skoog medium, containing sucrose
(30 g/L), myoinositol (100 mg/L), thiamine–HCl (1 mg/L),
nicotinic acid (1 mg/L), pyridoxine (1 mg/L), glycine (2
mg/L), N6-benzylaminopurine (1 mg/L), indolebutyric acid
(0.05 mg/L), GA3 (0.1 mg/L), and agar (6.5 g/L).
The jars containing the bacteria and the plants were kept
at 22�C under artificial light (12 h/day). Each treatment
consisted of six replicates containing six plants each. After
15 days of co-culture, on the plants form three replicates,
plant growth was evaluated by measuring leaf surface and
dry biomass. To evaluate the plant surface, each plants was
scanned and the resulting images were processed by an
imaging program (GIMP 2.6.6.–GNU Image Manipulation
Program). The plants from the remaining replicates were
infected with E. amylovora 1/79. The infection was per-
formed by pinching the tip of the first three leaves with
tweezers dipped in a bacterial suspension (106 cfu/mL).
Seven days after the infection, the disease incidence and
severity were measured. Disease severity was recorded as
the total length (mm) of necrotic tissue per plant.
Statistical analysis
The olfactory profiles were constructed using the Nose
Pattern Editor Program (v. 2.6.0) developed by SACMI.
Different mathematical algorithms (Classical, Fourier,
Single Point, Many Points) were tested. The Many Points
algorithm was generally chosen for the analysis where a
limited number of thesis was compared. The transformed
data were successively processed by means of principal
component analysis (PCA) using the MATLAB 6.5 soft-
ware (MathWorks Inc.).
Statistical differences in PTR-MS profiles were tested
using Statistica 7 (StatSoft Inc.). Significance was assumed
at P \ 0.05.
PCA and Cluster analysis for PTR-MS and GC–MS,
respectively, were performed using Statistica 7 (StatSoft
Inc.).
Results
Electronic nose recognition
The e-nose allowed to cluster strains of the same species,
therefore, allowing to build up the generic database and to
identify the unknown bacterial isolates (Fig. 1).
Nonetheless, the distinction among the clusters formed
by the olfactory profiles of the different species was not
always complete and a partial overlapping was found,
notably between E. amylovora and P. syringae pv syringae
(Fig. 1). Therefore, specific subplots that included only a
limited number of species, were built to stress the differ-
ences between those species. However, a partial overlap-
ping between the P. syringae pv syringae and E. amylovora
clusters still occurred (data not shown).
The twenty-four unknown bacterial strains identified by
traditional methods were grouped in seven clusters
(Table 2). At least one bacteria for each cluster was iden-
tified by the sequencing of 16S rRNA gene (Table 2).
When the isolates were identified by molecular analysis,
the e-nose classification, using the olfactory profiles of the
type strains collected at the same date, confirmed the
molecular analysis in 91.67% of the cases. On the other
Fig. 1 2-D principal component analysis on e-nose profiling of
several bacterial species. Despite an overall homogeneous clustering,
Pseudomonas syringae and Erwinia amylovora clusters partially
overlap
Trees
123

hand, the e-nose identification by comparison to the
olfactory profiles classified in the data-bases matched the
molecular identification in 50% of the cases (Table 2).
When the isolates were identified by biochemical char-
acteristics, the e-nose classification, using the olfactory
profiles of the type strains collected at the same date,
confirmed the molecular analysis in 83.3% of the cases.
Whereas, the e-nose identification, by comparison to the
olfactory profiles classified in the databases, matched the
biochemical identification only in 50% of the cases
(Table 2).
Overall, the e-nose confirmed the identification obtained
using other techniques in about 90% of the cases, but only
when the type strains used to build the database were
included in the same measuring session. On the other hand,
the percentage of correct identification dropped to nearby
60% when the measurements were compared to the data-
base (Table 2).
The more recent version of the e-nose (EOS507)
implemented several modifications allowing a better sta-
bility and, therefore, a higher reliability of data obtained in
different measure sessions. Preliminary data support the
feasibility of a data-base for the identification of species.
GC–MS analysis
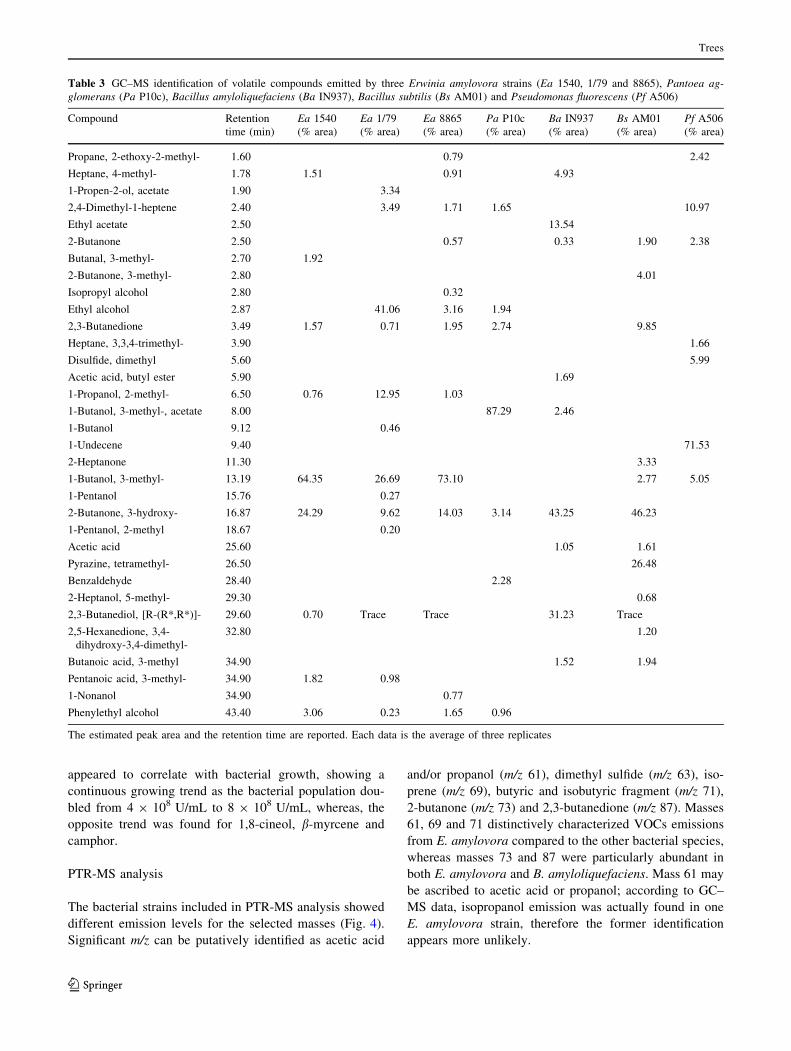
The composition of VOCs, expressed as percent of the total
ion count (TIC), emitted by the different bacterial strains is
presented in Table 3. Nineteen compounds were found
in the headspace of E. amylovora cultures, which were
not detected in the sterile growing medium. Among them,
2,3-butanedione, 3-methyl-1-butanol, 2,3-butanediol, phenyl-
ethyl alcohol, 3-hydroxy-2-butanone and 2-methyl-1-propanol
were produced by all the E. amylovora strains examined.
2-methyl-1-propanol was the only compound exclusively
emitted by E. amylovora. The percentage of some of
the released volatiles varied from different strains of
E. amylovora, but 3-methyl-1-butanol, 3-hydroxy-2-buta-
none, and phenylethyl alcohol were always the most abundant.
In the VOC profile of P. agglomerans, 3-methyl-1-butanol
acetate was the characteristic of this species representing
*87% of total VOC. Regarding the VOC profiles of both
B. amyloliquefaciens and B. subtilis, 5 compounds: 2-buta-
none, 3-hydroxy-2-butanone, acetic acid, 2,3-butanediol
and 3-methyl-butanoic acid were common to both strains.
However, ethyl acetate and acetic acid butyl ester were
characteristic of B. amyloliquefaciens, whereas isopropyl
alcohol was only found in B. subtilis. The main VOC present
in P. fluorescens was 1-undecene (*71% of total VOC),
which was only detected in this strain.
The differences found in the headspace composition of
the diverse bacterial cultures allowed to discriminate the
species via cluster analysis (Fig. 2). The distinction among
the bacterial species was based on the presence or absence
of VOCs in the headspace and not on the abundance of the
single VOCs. The E. amylovora strains were all linked
together by the cluster analysis, P. agglomerans (formerly
Erwinia herbicola) was, due to their taxonomic proximity,
the closest bacterium to E. amylovora followed by P. flu-
orescens. The two Bacillus species clustered together and
they were clearly separated from the gram-negative bac-
teria and they were the most distant from E. amylovora.
E. amylovora strain 1/79 was also used for a charac-
terization of terpene emissions. Isoprene and limonene
were the most intensely emitted terpenes (Fig. 3). In
addition, isoprene, limonene, b-pinene and 3-carene,
Table 2 Comparison of the identification of different bacterial species based on the sequencing of 16S rRNA genes (molecular identification), or
on biochemical characteristics (putative identification) and e-nose profiling
Isolate nr. Molecular identification e-nose 1* e-nose 2* Isolate nr. Putative identification e-nose 1* e-nose 2*
4 Pseudomonas graminis ? ? 1 Pantoea agglomerans ? ?
6 Pantoea agglomerans ? ? 3 Pantoea agglomerans - -
16 Pseudomonas syringae ? - 5 Pseudomonas graminis - -
20 Pseudomonas sp. ? ? 7 Pantoea agglomerans ? ?
23 Pseudomonas graminis ? - 10 Pantoea agglomerans ? ?
27 Pseudomonas syringae ? - 11 Pantoea agglomerans ? ?
28 Pseudomonas syringae - - 19 Pseudomonas fluorescens ? ?
29 Pantoea agglomerans ? - 22 Pseudomonas fluorescens ? ?
34 Pseudomonas syringae ? - 24 Pantoea agglomerans ? -
35 Staphylococcus haemolyticus ? ? 25 Pseudomonas graminis ? ?
37 Staphylococcus haemolyticus ? ? 30 Pantoea agglomerans ? ?
38 Bacillus sp. ? ? 36 Erwinia amylovora ? ?
Electronic nose recognition was tested either along with standard bacterial strains (1*), or in a different session (2*). ? means that the
identification obtained with the e-nose was in agreement with either the identification based on 16SrDNA sequence or on the identification based
on biochemical characteristics
Trees
123
appeared to correlate with bacterial growth, showing a
continuous growing trend as the bacterial population dou-
bled from 4 9 108 U/mL to 8 9 108 U/mL, whereas, the
opposite trend was found for 1,8-cineol, b-myrcene and
camphor.
PTR-MS analysis
The bacterial strains included in PTR-MS analysis showed
different emission levels for the selected masses (Fig. 4).
Significant m/z can be putatively identified as acetic acid
and/or propanol (m/z 61), dimethyl sulfide (m/z 63), iso-
prene (m/z 69), butyric and isobutyric fragment (m/z 71),
2-butanone (m/z 73) and 2,3-butanedione (m/z 87). Masses
61, 69 and 71 distinctively characterized VOCs emissions
from E. amylovora compared to the other bacterial species,
whereas masses 73 and 87 were particularly abundant in
both E. amylovora and B. amyloliquefaciens. Mass 61 may
be ascribed to acetic acid or propanol; according to GC–
MS data, isopropanol emission was actually found in one
E. amylovora strain, therefore the former identification
appears more unlikely.
Table 3 GC–MS identification of volatile compounds emitted by three Erwinia amylovora strains (Ea 1540, 1/79 and 8865), Pantoea ag-glomerans (Pa P10c), Bacillus amyloliquefaciens (Ba IN937), Bacillus subtilis (Bs AM01) and Pseudomonas fluorescens (Pf A506)
Compound Retention
time (min)
Ea 1540
(% area)
Ea 1/79
(% area)
Ea 8865
(% area)
Pa P10c
(% area)
Ba IN937
(% area)
Bs AM01
(% area)
Pf A506
(% area)
Propane, 2-ethoxy-2-methyl- 1.60 0.79 2.42
Heptane, 4-methyl- 1.78 1.51 0.91 4.93
1-Propen-2-ol, acetate 1.90 3.34
2,4-Dimethyl-1-heptene 2.40 3.49 1.71 1.65 10.97
Ethyl acetate 2.50 13.54
2-Butanone 2.50 0.57 0.33 1.90 2.38
Butanal, 3-methyl- 2.70 1.92
2-Butanone, 3-methyl- 2.80 4.01
Isopropyl alcohol 2.80 0.32
Ethyl alcohol 2.87 41.06 3.16 1.94
2,3-Butanedione 3.49 1.57 0.71 1.95 2.74 9.85
Heptane, 3,3,4-trimethyl- 3.90 1.66
Disulfide, dimethyl 5.60 5.99
Acetic acid, butyl ester 5.90 1.69
1-Propanol, 2-methyl- 6.50 0.76 12.95 1.03
1-Butanol, 3-methyl-, acetate 8.00 87.29 2.46
1-Butanol 9.12 0.46
1-Undecene 9.40 71.53
2-Heptanone 11.30 3.33
1-Butanol, 3-methyl- 13.19 64.35 26.69 73.10 2.77 5.05
1-Pentanol 15.76 0.27
2-Butanone, 3-hydroxy- 16.87 24.29 9.62 14.03 3.14 43.25 46.23
1-Pentanol, 2-methyl 18.67 0.20
Acetic acid 25.60 1.05 1.61
Pyrazine, tetramethyl- 26.50 26.48
Benzaldehyde 28.40 2.28
2-Heptanol, 5-methyl- 29.30 0.68
2,3-Butanediol, [R-(R*,R*)]- 29.60 0.70 Trace Trace 31.23 Trace
2,5-Hexanedione, 3,4-
dihydroxy-3,4-dimethyl-
32.80 1.20
Butanoic acid, 3-methyl 34.90 1.52 1.94
Pentanoic acid, 3-methyl- 34.90 1.82 0.98
1-Nonanol 34.90 0.77
Phenylethyl alcohol 43.40 3.06 0.23 1.65 0.96
The estimated peak area and the retention time are reported. Each data is the average of three replicates
Trees
123

The data obtained by PTR-MS analyzed via PCA con-
firmed that the bacterial species group the in different
clusters (Fig. 5).
Ethylene detection
Ethylene produced by E. amylovora strains 1540, 1/79 and
8865, P. agglomerans strain P10c and B. amyloliquefaciens
IN937a was monitored in real-time or with an accumula-
tion system. The ethylene concentration in the bacterial
cultures did not change during time and was similar to
levels found in sterile LB medium. This indicates that those
bacteria did not release ethylene (Fig. 6).
Biological effects of VOCs
To verify whether the produced volatiles compounds were
affected by intra-specific (E. amylovora 1/79) or inter-
specific competitors (P. agglomerans P10c), the VOCs
emitted by actively growing Ea1/79 and P10c cultures were
transferred to a newly inoculated Ea1/79 culture. Neither
the VOCs present in P10c, nor in Ea1/79 culture affected
the pathogen growth (Fig. 7).
The GC–MS and PTR-MS data suggested that E. amy-
lovora is able to produce 2,3-butanediol. In addition, 2,3-
butanediol production was confirmed in E. amylovora,
P. agglomerans, and B. amyloliquefaciens by a positive
reaction with Methyl Red-Voges Proskauer (MRVP) test
(Bergey et al. 1984). Since 2,3-butanediol has been sug-
gested to promote plant growth and resistance against
pathogens (Ryu et al. 2003), the effect of the VOCs
released by a E. amylovora cultures was tested in vitro on
pear plants.
Fig. 2 Cluster analysis of the GC–MS data obtained from the
headspace analysis of Erwinia amylovora Ea 1540, Ea 1/79, Ea 8865,
Pantoea agglomernas P10c, Pseudomonas fluorescens PfA506,
Bacillus subtilis AM01 and Bacillus amyloliquefaciens IN937. The
data used for the cluster analysis are reported in Table 3
Fig. 3 Terpene emitted by Erwinia amylovora strain 1/79. The data,
normalized for bacterial population, are expressed as mean ± stan-
dard error of three independent replicates
Fig. 4 PTR-MS profiles of Erwinia amylovora (Ea 1540), Bacillussubtilis (Bs AM01), Bacillus amyloliquefaciens (Ba IN937), Pantoeaagglomerans (Pa P10c) and Pseudomonas fluorescens (Pf A506).
Columns, inside each mass fragment, labelled with the same letter do
not differ according to SNK test (P B 0.05)
Fig. 5 Cluster analysis of the PTR-MS data obtained from the
headspace analysis of Erwinia amylovora (Ea), Pantoea agglomerans(Pa), Pseudomonas fluorescens (Pf), Bacillus subtilis (Bs) and
Bacillus amyloliquefaciens (Ba). The data used for the cluster
analysis are reported in Fig. 4
Trees
123

Plants showed marked increases in dry weight and leaf
area in co-culture with 2,3-butanediol-producing bacteria,
including E. amylovora (Fig. 8). These increases were
mainly due to a higher number of later shoots characterized
by smaller leaves, which modified the plant habitus.
Therefore, the volatiles emitted by the bacterial culture
produced a branching effect on plant. Although the pre-
liminary data could not be statistically validated, the dis-
ease incidence appears to be slightly reduced in the plants
grown with 2,3-butanediol-producing bacteria (namely,
E. amylovora 1/79, P. agglomerans P10c, and B. amylo-
liquefaciens FZB42) compared to the negative control
(B. subtilis AM01).
Discussion
The power and accuracy of e-nose technology were already
demonstrated in many fields, such as medical diagnosis,
foods and drinks industries, and environmental assessment
of pollutants. In this work, the e-nose was successfully used
for the recognition of different plant associated bacteria.
Electronic nose was initially used to confirm the identifi-
cation of a number of known standard strains. Subse-
quently, the variability of the olfactory profiles of the
different strains belonging to the same bacterial species
was determined and exploited to build up a database of
bacterial olfactory profiles. Later, these data were tested for
the recognition of unknown bacterial cultures isolated from
a New Zealand apple orchard.
Overall, the discrimination power of the e-nose for
plant-associated bacteria appears promising. This is espe-
cially true when standards species are used in the same
measuring session: 21 out of 24 (87.5%) samples were
identified accordingly to molecular or phenotypical char-
acterization (Table 3, e-nose 1 columns). On the other
hand, the score (62.5%) is poor when unknown samples are
referred to a standard data-base obtained in a different
measuring session (Table 3, e-nose 2 columns). This may
be due to inherent limits in the e-nose construction
(resulting in measure drifts), its sensitivity to external
conditions (such as humidity of the sample and the envi-
ronmental air), and intra-specific variability in bacterial
species. These issues undermined the efforts to constitute a
reliable database of bacterial olfactive profiles. Nonethe-
less, technological advances improved the measuring sta-
bility, as shown by the recent e-nose model EOS507;
moreover, the data-base can in principle be indefinitely
refined by including olfactive profiles from more and more
diverse bacterial species. E. amylovora is considered a
relatively homogeneous species, in contrast with highly
diversified species such as P. syringae. Thus, although all
the E. amylovora strains would probably cluster together,
partial overlapping or inclusion within the distinctive fea-
tures of other species may occur.
In this sense, GC–MS and, to some extent, PTR-MS,
would help identify marker components in the odour blend
of a specific bacterial species. Among the most interesting,
putative markers, a special interest is represented by
compounds with a biological effect. For instance, terpenes
are well-known modulators of plant pathogenic responses
(Theis and Lerdau 2003), and their precursor, isoprene,
Fig. 6 CO2 laser-based ethylene detection: the ethylene release by
the axenic culture medium (LB) and different bacterial culture. The
graph shows ethylene production at 2 h of accumulation in the
headspace. None of the bacteria produce detectable amount of
ethylene
Fig. 7 Growth of Erwiniaamylovora Ea1/79 treated with
VOCs produced by Pantoeaagglomerans P10c (a) and
E. amylovora Ea1/79
(b) cultures. VOCs emitted
by the axenic growing medium
were used as a control.
Standard error is shown
Trees
123

could be detected by GC–MS and, putatively, by PTR-MS
in E. amylovora.
Isoamyl alcohol (3-methyl-butanol) and 2-methyl-pro-
panol were found in plant growth-promoting bacteria, such
as B. subtilis strain GB03 and B. amyloliquefaciens IN937a
(Farag et al. 2006). Their synthesis proceeds from valine,
leucine and isoleucine. These products were not detected
for the same species in the present work, probably due to
the different growing conditions and experimental settings.
However, 3-methyl-butanol and 2-methyl-propanol were
found in E. amylovora, along with other compounds from
related pathways, such as 3-methyl-pentanoic acid. Inter-
estingly, Farag and colleagues found that GB03 and
IN937a induced systemic resistance by the ethylene–
jasmonate pathway and other mechanisms, respectively.
The ethylene–jasmonate independent resistance triggered
by IN937a may be primed by specifically emitted com-
pounds, such as isoamyl alcohol, acetic acid butyl ester and
butanol-3-methyl acetate.
Acetoin (3-hydroxy-2-butanone) and its derivative 2,3-
butanediol are known to promote plant growth (Ryu et al.
2003; Farag et al. 2006; Zhang et al. 2007). The bio-
chemical pathway starts from pyruvate, and prevails over
pyruvate fermentation, yielding lactate or ethanol, and
respiration in acidic and anoxic conditions (Ryu et al.
2003). A possible physiological effect of 2,3-butanediol
affects auxin metabolism (Zhang et al. 2007), leading to
increased plant growth and lateral root emission. In this
work, acetoin, 2,3-butanediol, and the related compound
2,3-butanedione were found in E. amylovora; furthermore,
pear plants exposed to 2,3-butanediol-emitting bacteria
were promoted in dry mass and branching, thus supporting
the involvement of auxin regulation.
In Arabidopsis, 2,3-butanediol not only acts as growth
promoting compound (Ryu et al. 2003), but it is also able to
trigger induced system resistance (Ryu et al. 2004). How-
ever, in our experiments, only a modest, non significant,
reduction of plant susceptibility to E. amylovora was found
on the plant grown alongside 2,3-butanediol producing
bacteria. These differences may be linked to the dissimilar
physiological and ecological interactions occurring in the
two pathosystems. Nonetheless, further experiments are
needed to confirm this trend and to verify whether the
VOCs produced by E. amylovora can prime plant defences.
Finally, since neither IN937a, or E. amylovora produce
ethylene the induction of plant resistance might linked with
an ethylene-independent mechanism.
In conclusion, the feasibility of bacterial isolates dis-
crimination on the basis of volatile emissions was dem-
onstrated. The knowledge of volatiles contributing to the
biological effects and odorous profiles of plant pathogenic
bacteria may represent the first and crucial step to develop
highly sensitive, specific sensors for their identification and
for the early diagnosis of plant diseases.
New information on bacterial metabolism and activity,
arising from the identification of the emitted VOCs, may
shed light on the interactions between bacterial pathogens
and plant hosts, and provide useful technological tools for
their modulation.
Acknowledgments The authors gratefully thank Elena Rondelli,
Deirdre Cornish and Janet Yu for their active participation to the
research and for their excellent work. The project was partially fun-
ded by Q-Detect: FP7-KBBE Project ‘‘Developing quarantine pest
detection methods for use by national plant protection organizations
(NPPO) and inspection services’’. We also thank the COST-Action
864: PomeFruitHealth for coordinating the European research groups
on fire blight and proving the opportunity of research exchanges and
collaborations.
References
Atlas RM (2000) Handbbok of microbiological media. CRC Press.
Boca Raton, Florida
Bachinger T, Mandenius CF (2000) Searching for process information
in the aroma cell cultures. Trends Biotechnol 18:494–500
Fig. 8 Effects of bacterial volatile compounds on the growth of pear
‘Abbe Fetel’. Left panel: comparison of dry weights (white) and plant
surfaces (grey) of plants exposed to different bacterial strains. Rightpanel: incidence (white) and severity (grey) of fire blight in plants
exposed to the same bacterial strains. The bacterial strains are
Bacillus amyloliquefaciens (FZB42), Pantoea agglomerans (P10c),
Bacillus subtilis (AM01) and Erwinia amylovora (1/79). Data are
expressed as mean ± standard deviation of nine plants. None of the
differences are significant
Trees
123

Bergey DH, Holt JG, Krieg NR (1984) Bergey’s manual of systematic
bacteriology. vol. 1. Williams and Wilkins, Baltimore
Boamfa EI, Steeghs MML, Cristescu SM, Harren FJM (2004) Trace
gas detection from fermentation processes in apples and rice; a
comparison between proton-transfer-reaction mass spectrometry
and laser photoacoustics. Int J Mass Spectrom 239:193–201
Cristescu SM, Persijn ST, Te Lintel Hekkert S, Harren FJM (2008)
Laser-based systems for trace gas detection in life sciences. Appl
Phys B Lasers Opt 92:343–349
Dutta R, Hines EL, Gardner JW, Boilot P (2002) Bacteria classifi-
cation using Cyranose 320 electronic nose. BioMed Eng OnLine
1:1–7
Farag MA, Ryu CM, Sumner LW, Pare PW (2006) GC–MS SPME
profiling of rhizobacterial volatiles reveals prospective inducers
of growth promotion and induced systemic resistance in plants.
Phytochemistry 67:2262–2268
Francioso O, Rodriguez-Estrada MT, Montecchio D, Salomoni C,
Caputo A, Palenzona D (2010) Chemical characterization of
municipal wastewater sludges produced by two-phase anaerobic
digestion for biogas production. J Hazard Mater 175:740–746
Gardner JW, Craven M, Dow C, Hines EL (1998) The prediction of
bacteria type and culture growth phase by an electronic nose with a
multi-layer perceptron network. Meas Sci Technol 9:120–127
Gibson TD, Prosser O, Hulbert JN, Marshall RW, Corcoran P, Lowery
P, Ruck-Keene EA, Heron S (1997) Detection and simultaneous
identification of microorganisms from headspace samples using an
electronic nose. Sensor Actuat B Chem 44:413–422
Han XY (2006) Bacterial identification based on 16S ribosomal RNA
gene sequence analysis. In: Tang YW, Stratton CW (eds)
Advanced techniques in diagnostic microbiology. Springer-
Verlag, New York, pp 323–332
Harper WJ (2001) The strengths and weaknesses of the electronic
nose. Adv Exp Med Biol 488:59–71
Jonsson A, Winquist F, Schnurer J, Sundgren H, Lundtrom I (1997)
Electronic nose for microbial quality classification of grains. Int
J Food Microbiol 35:187–193
Keshri G, Magan N (2000) Detection and differentiation between
mycotoxigenic and non-mycotixogenic strains of Fusarium spp
using volatile production profiles and hydrolytic enzymes.
J Appl Microbiol 89:825–833
Laothawornkitkul J, Moore JP, Taylor JE, Possell M, Gibson TM,
Hewitt CN, Paul ND (2008) Discrimination of plant volatile
signatures by an electronic nose: a potential technology for plant
pest and disease monitoring. Environ Sci Technol 42:8433–8439
Magan N, Evans P (2000) Volatiles as an indicator of fungal activity
and differentiation between species, and the potential use of
electronic nose technology for early detection of grain spoilage.
J Stored Prod Res 36:319–340
Marilley L, Ampuero S, Zesiger T, Casey MG (2004) Screening of
aroma-producing lactic acid bacteria with an electronic nose. Int
Dairy J 14:849–856
Martin-Laurent F, Philippot L, Hallet S, Chaussod R, Germon JC,
Soulas G, Catroux G (2001) DNA extraction from soils: old bias
for new microbial diversity analysis methods. Appl Environ
Microbiol 67:2354–2359
McEntegart CM, Penrose WR, Strathmann S, Stetter JR (2000)
Detection and discrimination of coliform bacteria with gas
sensor arrays. Sensor Actuat B Chem 70:170–176
Miller TD, Schroth MN (1972) Monitoring the epiphytic population
of Erwinia amylovora on pear with a selective medium.
Phytopathology 62:1175–1182
Momol MT, Balaban MO, Korel F, Odabasi A, Momol EA, Folkes G,
Jones JB (2004) Discrimination of plant pathogenic bacteria
using an electronic nose. Plant Health Progr (online)
Pardo M, Sberveglieri G (2004) Electronic olfactory systems based on
metal oxide semiconductor sensor arrays. MRS Bull 29:703–708
Pavlou AK, Turner APF (2000) Sniffing out the truth: clinical
diagnosis using the electronic nose. Clin Chem Lab Med
38:99–112
Prithiviraj B, Vikram A, Kushalappa AC, Yaylayan V (2004) Volatile
metabolite profiling for the discrimination of onion bulbs
infected by Erwinia carotovora ssp. carotovora, Fusariumoxysporum and Botrytis allii. Eur J Plant Pathol 110:371–377
Rapparini F, Baraldi R, Miglietta F, Loreto F (2004) Isoprenoid
emission in trees of Quercus pubescens and Quercus ilex with
lifetime exposures to naturally high CO2 environment. Plant Cell
Environ 27:381–391
Rock F, Barsan N, Weimar U (2008) Electronic nose: current status
and future trends. Chem Rev 108:705–725
Ryu CM, Farag MA, Hu CH, Reddy MS, Wei HX, Pare PW,
Kloepper JW (2003) Bacterial volatiles promote growth in
Arabidopsis. PNAS 100:4927–4932
Ryu CM, Farag MA, Hu CH, Reddy MS, Kloepper JW, Pare PW
(2004) Bacterial volatiles induce systemic resistance in Arabid-opsis. Plant Physiol 134:1017–1026
Saevels S, Lammertyn J, Berna AZ, Veraverbeke EA, Di Natale C,
Nicolaı BM (2003) Electronic nose as a non-destructive tool to
evaluate the optimal harvest date of apples. Postharvest Biol
Technol 30:3–14
Spinelli F, Noferini M, Vanneste JL, Costa G (2010) Potentials of the
electronic nose for the diagnosis of bacterial and fungal diseases
in fruit trees. EPPO Bulletin 40:59–67
Spinelli F, Costa G, Rondelli E, Vanneste JL, Rodriguez Estrada MT,
Busi S, Savioli S, Harren FJM, Crespo E, Cristescu SM (2011a)
Emission of volatiles during the pathogenic interaction between
Erwinia amylovora and Malus domestica. Acta Hortic
896:55–63
Spinelli F, Costa G, Rondelli E, Vanneste JL, Rodriguez Estrada MT,
Busi S, Savioli S, Cristescu S (2011b) Volatile compounds
produced by Erwinia amylovora and their potential exploitation
for bacterial identification. Acta Hortic 896:77–84
Theis N, Lerdau M (2003) The evolution of function in plant
secondary metabolites. Int J Plant Sci 164:93–102
Tothill IE (2001) Biosensors developments and potential applications
in the agricultural diagnosis sector. Comput Electron Agr
30:205–218
Turner APF, Magan N (2004) Electronic noses and disease diagnos-
tics. Nat Rev Microbiol 2:161–166
Vanneste JL, Yu J, Beer SV (1992) Role of antibiotic production by
Erwinia herbicola Eh252 in biological control of Erwiniaamylovora. J Bacteriol 174:2785–2796
Vikram A, Hamzehzarghani H, Kushalappa AC (2005) Volatile
metabolites from the headspace of onion bulbs inoculated with
postharvest pathogens as a tool for disease discrimination. Can J
Plant Pathol 27:194–203
Wilson AD, Lester DG (1998) Application of aromascan analysis to
detect and diagnose oak wilt in live oaks. Phytopathology 88:S97
Wilson AD, Lester DG, Oberle CS (2004) Development of conduc-
tive polymer analysis for the rapid detection and identification of
phytopathogenic microbes. Phytopathology 94:419–431
Zhang Z, Schwartz S, Wagner L, Miller W (2000) A greedy algorithm
for aligning DNA sequences. J Comput Biol 7:203–214
Zhang H, Kim MS, Krishnamachari V, Payton P, Sun Y, Grimson M,
Farag MA, Ryu CM, Allen R, Melo IS, Pare PW (2007)
Rhizobacterial volatile emissions regulate auxin homeostasis and
cell expansion in Arabidopsis. Planta 226:839–851
Trees
123
Copyright © 2022 FDOKUMEN