Improving Storage Performance with Non-Volatile Memory ...
117
Improving Storage Performance with Non-Volatile Memory-based Caching Systems A THESIS SUBMITTED TO THE FACULTY OF THE GRADUATE SCHOOL OF THE UNIVERSITY OF MINNESOTA BY Ziqi Fan IN PARTIAL FULFILLMENT OF THE REQUIREMENTS FOR THE DEGREE OF Doctor of Philosophy Prof. David H.C. Du April, 2017
-
Upload
khangminh22 -
Category
Documents
-
view
0 -
download
0
Transcript of Improving Storage Performance with Non-Volatile Memory ...

Improving Storage Performance withNon-Volatile Memory-based Caching Systems
A THESIS
SUBMITTED TO THE FACULTY OF THE GRADUATE SCHOOL
OF THE UNIVERSITY OF MINNESOTA
BY
Ziqi Fan
IN PARTIAL FULFILLMENT OF THE REQUIREMENTS
FOR THE DEGREE OF
Doctor of Philosophy
Prof. David H.C. Du
April, 2017

c© Ziqi Fan 2017
ALL RIGHTS RESERVED

Acknowledgements
I would like to express my sincere appreciation to my advisor, Prof. David H.C. Du. He
taught me how to become an independent thinker with critical thinking. I learned from
him how to identify valuable research issues and attack them directly and elegantly. His
five-year mentorship leads my way into a deep understanding of the computer science
field, invokes my tremendous interest in doing research, and will have long lasting impact
on my future career.
I would also like to thank Prof. Tian He, Prof. Zhi-li Zhang, and Prof. David
Lilja for serving as my committee members and for their invaluable comments and
suggestions.
It is an honor for me to be a member of the Center for Research in Intelligent
Storage (CRIS). I would like to thank my CRIS mentor, Doug Voigt (currently with
HP Enterprise), for his great efforts in collaborating with me to conquer each research
project. I also want to thank CRIS members and friends: Xiang Cao, Zhichao Cao,
Jim Diehl, Hebatalla Eldakiky, Xiongzi Ge, Alireza Haghdoost, Weiping He, Bingzhe
Li, Peng Li, Manas Minglani, Dongchul Park, Yaobin Qin, Fenggang Wu, Hao Wen,
Jinfeng Yang, Ming-hong Yang, Baoquan Zhang, and Meng Zou. I learned so much
through the discussion and collaboration. Thanks for their help and support.
Finally, I would like to thank NSF and CRIS sponsor companies for funding my
projects as well as the Minnesota Supercomputing Institute for providing access to
their research facilities and offering timely support.
i

Dedication
• To my paternal grandfather, who is always missed. May he rest in peace.
• To my family and my friends, who are always there for me. Especially to my mom
(Shuang Qiu), my dad (Lilu Fan), and my wife (Yingxu Liu), whose love, support
and understanding give me the strength to make it this far.
ii

Abstract
With the rapid development of new types of non-volatile memory (NVRAM), e.g., 3D
Xpoint, NVDIMM, and STT-MRAM, these technologies have been or will be integrated
into current computer systems to work together with traditional DRAM. Compared with
DRAM, which can cause data loss when the power fails or the system crashes, NVRAM’s
non-volatile nature makes it a better candidate as caching material. In the meantime,
storage performance needs to keep up to process and accommodate the rapidly generated
amounts of data around the world (a.k.a the big data problem). Throughout my Ph.D.
research, I have been focusing on building novel NVRAM-based caching systems to
provide cost-effective ways to improve storage system performance. To show the benefits
of designing novel NVRAM-based caching systems, I target four representative storage
devices and systems: solid state drives (SSDs), hard disk drives (HDDs), disk arrays,
and high-performance computing (HPC) parallel file systems (PFSs).
For SSDs, to mitigate their wear out problem and extend their lifespan, we propose
two NVRAM-based buffer cache policies which can work together in different layers
to maximally reduce SSD write traffic: a main memory buffer cache design named
Hierarchical Adaptive Replacement Cache (H-ARC) and an internal SSD write buffer
design named Write Traffic Reduction Buffer (WRB). H-ARC considers four factors
(dirty, clean, recency, and frequency) to reduce write traffic and improve cache hit
ratios in the host. WRB reduces block erasures and write traffic further inside an SSD
by effectively exploiting temporal and spatial localities.
For HDDs, to exploit their fast sequential access speed to improve I/O throughput,
we propose a buffer cache policy, named I/O-Cache, that regroups and synchronizes
long sets of consecutive dirty pages to take advantage of HDDs’ fast sequential access
speed and the non-volatile property of NVRAM. In addition, our new policy can dy-
namically separate the whole cache into a dirty cache and a clean cache, according to
the characteristics of the workload, to decrease storage writes.
For disk arrays, although numerous cache policies have been proposed, most are
either targeted at main memory buffer caches or manage NVRAM as write buffers and
separately manage DRAM as read caches. To the best of our knowledge, cooperative
iii

hybrid volatile and non-volatile memory buffer cache policies specifically designed for
storage systems using newer NVRAM technologies have not been well studied. Based on
our elaborate study of storage server block I/O traces, we propose a novel cooperative
HybrId NVRAM and DRAM Buffer cACHe polIcy for storage arrays, named Hibachi.
Hibachi treats read cache hits and write cache hits differently to maximize cache hit
rates and judiciously adjusts the clean and the dirty cache sizes to capture workloads’
tendencies. In addition, it converts random writes to sequential writes for high disk
write throughput and further exploits storage server I/O workload characteristics to
improve read performance.
For modern complex HPC systems (e.g., supercomputers), data generated during
checkpointing are bursty and so dominate HPC I/O traffic that relying solely on PFSs
will slow down the whole HPC system. In order to increase HPC checkpointing speed,
we propose an NVRAM-based burst buffer coordination system for PFSs, named col-
laborative distributed burst buffer (CDBB). Inspired by our observations of HPC ap-
plication execution patterns and experimentations on HPC clusters, we design CDBB
to coordinate all the available burst buffers, based on their priorities and states, to help
overburdened burst buffers and maximize resource utilization.
iv

Contents
Acknowledgements i
Dedication ii
Abstract iii
List of Tables viii
List of Figures ix
1 Introduction 1
2 Cooperative NVRAM-based Write Buffers for SSDs 6
2.1 Introduction . . . . . . . . . . . . . . . . . . . . . . . . . . . . . . . . . . 6
2.2 Background . . . . . . . . . . . . . . . . . . . . . . . . . . . . . . . . . . 10
2.3 Related work . . . . . . . . . . . . . . . . . . . . . . . . . . . . . . . . . 12
2.4 Proposed Design . . . . . . . . . . . . . . . . . . . . . . . . . . . . . . . 14
2.4.1 Host Write Buffer Cache: H-ARC . . . . . . . . . . . . . . . . . 14
2.4.2 Internal SSD Write Buffer: WRB . . . . . . . . . . . . . . . . . . 21
2.5 Experiments . . . . . . . . . . . . . . . . . . . . . . . . . . . . . . . . . . 25
2.5.1 Evaluation Setup . . . . . . . . . . . . . . . . . . . . . . . . . . . 25
2.5.2 Evaluation Results and Analysis . . . . . . . . . . . . . . . . . . 26
2.6 Conclusion . . . . . . . . . . . . . . . . . . . . . . . . . . . . . . . . . . 34
3 An NVRAM-based Buffer Cache Policy for HDDs 35
3.1 Introduction . . . . . . . . . . . . . . . . . . . . . . . . . . . . . . . . . . 35
v

3.2 Related Work . . . . . . . . . . . . . . . . . . . . . . . . . . . . . . . . . 37
3.3 Our Proposed Approach: I/O-Cache . . . . . . . . . . . . . . . . . . . . 40
3.3.1 Approach Overview . . . . . . . . . . . . . . . . . . . . . . . . . 40
3.3.2 Real Cache Hit . . . . . . . . . . . . . . . . . . . . . . . . . . . . 41
3.3.3 Real Cache Miss, Ghost Cache Hit . . . . . . . . . . . . . . . . . 41
3.3.4 Both Real and Ghost Cache Misses . . . . . . . . . . . . . . . . . 43
3.3.5 Cache Eviction & Balance Algorithm . . . . . . . . . . . . . . . . 45
3.3.6 Sequential List . . . . . . . . . . . . . . . . . . . . . . . . . . . . 46
3.3.7 System Consistency and Crash Recovery . . . . . . . . . . . . . . 46
3.4 Evaluation . . . . . . . . . . . . . . . . . . . . . . . . . . . . . . . . . . . 47
3.4.1 Experimental Setup . . . . . . . . . . . . . . . . . . . . . . . . . 47
3.4.2 System I/O Performance . . . . . . . . . . . . . . . . . . . . . . 50
3.4.3 Cache Hit Ratio . . . . . . . . . . . . . . . . . . . . . . . . . . . 53
3.5 Conclusion . . . . . . . . . . . . . . . . . . . . . . . . . . . . . . . . . . 54
4 A Cooperative Hybrid Caching System for Storage Arrays 55
4.1 Introduction . . . . . . . . . . . . . . . . . . . . . . . . . . . . . . . . . . 55
4.2 Storage System Workload Properties . . . . . . . . . . . . . . . . . . . . 58
4.3 Insight and Discussion . . . . . . . . . . . . . . . . . . . . . . . . . . . . 59
4.4 Hibachi: A Hybrid Buffer Cache . . . . . . . . . . . . . . . . . . . . . . 61
4.4.1 Architecture . . . . . . . . . . . . . . . . . . . . . . . . . . . . . 61
4.4.2 Right Prediction . . . . . . . . . . . . . . . . . . . . . . . . . . . 62
4.4.3 Right Reaction . . . . . . . . . . . . . . . . . . . . . . . . . . . . 62
4.4.4 Right Adjustment . . . . . . . . . . . . . . . . . . . . . . . . . . 64
4.4.5 Right Transformation . . . . . . . . . . . . . . . . . . . . . . . . 65
4.4.6 Put Them All Together: Overall Workflow . . . . . . . . . . . . 66
4.5 Performance Evaluation . . . . . . . . . . . . . . . . . . . . . . . . . . . 67
4.5.1 Evaluation Setup . . . . . . . . . . . . . . . . . . . . . . . . . . . 67
4.5.2 Evaluation Results . . . . . . . . . . . . . . . . . . . . . . . . . . 68
4.6 Related Work . . . . . . . . . . . . . . . . . . . . . . . . . . . . . . . . . 74
4.7 Conclusion . . . . . . . . . . . . . . . . . . . . . . . . . . . . . . . . . . 75
vi

5 An NVRAM-based Burst Buffer Coordination System for PFSs 76
5.1 Introduction . . . . . . . . . . . . . . . . . . . . . . . . . . . . . . . . . . 76
5.2 Background and Related Work . . . . . . . . . . . . . . . . . . . . . . . 78
5.2.1 Checkpoint/Restart . . . . . . . . . . . . . . . . . . . . . . . . . 78
5.2.2 HPC Application Characteristics . . . . . . . . . . . . . . . . . . 79
5.2.3 Non-volatile Memory . . . . . . . . . . . . . . . . . . . . . . . . . 81
5.3 Our Proposed Approach: CDBB . . . . . . . . . . . . . . . . . . . . . . 81
5.3.1 CDBB Overview . . . . . . . . . . . . . . . . . . . . . . . . . . . 82
5.3.2 BB Coordinator . . . . . . . . . . . . . . . . . . . . . . . . . . . 84
5.3.3 BB . . . . . . . . . . . . . . . . . . . . . . . . . . . . . . . . . . . 84
5.3.4 CKPT Writer . . . . . . . . . . . . . . . . . . . . . . . . . . . . . 85
5.4 Performance Evaluation . . . . . . . . . . . . . . . . . . . . . . . . . . . 85
5.4.1 Implementation . . . . . . . . . . . . . . . . . . . . . . . . . . . . 85
5.4.2 Testbed . . . . . . . . . . . . . . . . . . . . . . . . . . . . . . . . 86
5.4.3 Evaluation Setup . . . . . . . . . . . . . . . . . . . . . . . . . . . 86
5.4.4 Evaluation Results . . . . . . . . . . . . . . . . . . . . . . . . . . 87
5.5 Conclusion . . . . . . . . . . . . . . . . . . . . . . . . . . . . . . . . . . 90
6 Conclusion 92
References 94
vii

List of Tables
2.1 Trace Characteristics . . . . . . . . . . . . . . . . . . . . . . . . . . . . . 26
3.1 Trace Characteristics . . . . . . . . . . . . . . . . . . . . . . . . . . . . . 52
4.1 Trace Characteristics . . . . . . . . . . . . . . . . . . . . . . . . . . . . . 67
viii

List of Figures
1.1 Memory and Storage Technologies . . . . . . . . . . . . . . . . . . . . . 2
2.1 Overall System Architecture and Design . . . . . . . . . . . . . . . . . . 8
2.2 H-ARC Architecture . . . . . . . . . . . . . . . . . . . . . . . . . . . . . 14
2.3 H-ARC Operation . . . . . . . . . . . . . . . . . . . . . . . . . . . . . . 20
2.4 WRB Architecture . . . . . . . . . . . . . . . . . . . . . . . . . . . . . . 21
2.5 Block-level LRU Policy and Victim Selection Example . . . . . . . . . . 23
2.6 A Combination of Six Comprehensive Schemes and the Proposed Scheme 25
2.7 Total Write Traffics (block counts) From Host to NAND Flash (lower is
better). The memory size in X-axis represents the number of 4K page.
For example, 1K means 1024 × 4K pages. . . . . . . . . . . . . . . . . . 27
2.8 Total Write Page Count Reduction by Different Layers (higher is better).
Here, LB-C and LRU-W stand for LB-CLOCK and LRU-WSR respectively. 28
2.9 Host-side Main Write Buffer Cache Performance (lower is better). Each
chart shows total SSD write traffic (i.e., write page count) after each
scheme processes write requests in main memory. . . . . . . . . . . . . . 29
2.10 Cache Hit Ratios of Both Reads and Writes. . . . . . . . . . . . . . . . . 31
2.11 Cache Hit Ratios of Trace mds with Cache Size of 16K Pages. The read
cache hit ratio and the write cache hit are separated. . . . . . . . . . . . 32
2.12 Cache Hit ratios of Trace fio zipf under Cache Size of 32K Pages. The
read cache hit ratio and the write cache hit are separated. . . . . . . . . 33
3.1 System Architecture . . . . . . . . . . . . . . . . . . . . . . . . . . . . . 37
3.2 Sequential list update operations. Key is the beginning page number of
consecutive dirty pages. Value is the length of the consecutive dirty pages. 44
3.3 I/O completion time including both storage reads and storage writes. . 48
ix

3.4 Storage write count in pages. . . . . . . . . . . . . . . . . . . . . . . . . 49
3.5 Storage write count in I/Os. . . . . . . . . . . . . . . . . . . . . . . . . . 50
3.6 Cache hit ratio of both reads and writes. . . . . . . . . . . . . . . . . . . 51
4.1 Overall System Architecture . . . . . . . . . . . . . . . . . . . . . . . . . 56
4.2 Temporal distance histograms of a storage server I/O workload. Four
figures represent temporal distance in terms of a read request after the
same read request, write after write, read after write, and write after read. 57
4.3 Access and block distributions for various frequencies. Three figures show
frequency in terms of combined read and write requests, read requests
only, and write requests only. For a given frequency, the blocks curve
shows the percentage of the total number of blocks that are accessed at
least that many times, and the accesses curve shows the percentage of the
total number of accesses that are to blocks accessed at least that many
times. . . . . . . . . . . . . . . . . . . . . . . . . . . . . . . . . . . . . . 58
4.4 NVRAM impact on storage write traffic. . . . . . . . . . . . . . . . . . . 60
4.5 Hibachi Architecture and Algorithm. . . . . . . . . . . . . . . . . . . . . 63
4.6 Average read hit rates . . . . . . . . . . . . . . . . . . . . . . . . . . . . 69
4.7 Hibachi’s NVRAM and DRAM contribution to total read hit rates . . . 70
4.8 Normalized read cache latency for Hibachi. LatD stands for average
DRAM access latency. LatN is average NVRAM access latency. . . . . . 71
4.9 Total write hit rate comparison . . . . . . . . . . . . . . . . . . . . . . . 72
4.10 Average write throughput with disk arrays . . . . . . . . . . . . . . . . . 73
5.1 An example of HPC application execution patterns . . . . . . . . . . . . 79
5.2 An overview of the CDBB coordination system . . . . . . . . . . . . . . 80
5.3 A high-level illustration of CDBB checkpointing workflow . . . . . . . . 82
5.4 The BB coordinator checkpointing workflow . . . . . . . . . . . . . . . . 83
5.5 Applications used for Light, Medium, and Heavy experiments . . . . . . 87
5.6 Combined total CKPT completion time for each experiment . . . . . . . 88
5.7 Total CKPT completion time for each application. Note that y-axes are
in different scales for the three figures. . . . . . . . . . . . . . . . . . . . 89
x
5.8 CKPT completion time of each CKPT operation for application NAMD,
phylobayes, and pBWA. Note that y-axes are in different scales for the
three figures. . . . . . . . . . . . . . . . . . . . . . . . . . . . . . . . . . 90
xi

Chapter 1
Introduction
With the rapid development of new types of non-volatile memory (NVRAM), e.g., 3D
Xpoint, NVDIMM, and STT-MRAM, these technologies have been or will be integrated
into current computer systems to work together with traditional DRAM. Figure 1.1
is a summary of current memory and storage technologies. Compared with DRAM,
which can cause data loss when the power fails or the system crashes, NVRAM’s non-
volatile nature makes it a better candidate as caching material. In the meantime,
storage performance needs to keep up to process and accommodate the rapidly generated
amounts of data around the world (a.k.a the big data problem). Throughout my Ph.D.
research, I have been focusing on building novel NVRAM-based caching systems to
provide cost-effective ways to improve storage system performance. To show the benefits
of designing novel NVRAM-based caching systems, I target four representative storage
devices and systems: solid state drives (SSDs), hard disk drives (HDDs), disk arrays,
and high-performance computing (HPC) parallel file systems (PFSs).
NAND Flash-based SSDs achieve much faster random access speed than traditional
HDDs (up to 100×) and are widely deployed in computer storage systems [1, 2]. NAND
Flash consists of data blocks, each of which contains a fixed number of pages (typically
64 or 128 pages). Flash supports page read and write operations and block erasure
operations. Data are only written to clean pages because Flash does not support in-
place updates. Due to slow erase operation speed (around 2 ms), Flash Translation
Layer (FTL) firmware instead writes data to clean pages first and marks the original
page as invalid. Later, a periodically triggered or on-demand garbage collection (GC)
1

2
Volatile Non-volatile
DRAM
SRAM
Production Early Production Emerging
NAND Flash
MRAM
STT RAM
PRAM
3D Xpoint
RRAM
Storage
NAND Flash
HDD
Magnetic tape
Optical
Memory
Figure 1.1: Memory and Storage Technologies
mechanism reclaims the (invalid) blocks containing invalid pages, thereby reclaiming
previously invalid blocks. However, Flash, by nature, allows a limited number of block
cell erasures (about 1K for TLC and 10K for MLC). Thus, Flash-based SSDs cannot
avoid low endurance problems (particularly MLC/TLC Flash-based SSDs). Moreover,
SSD write speed (around 200 µs) is much slower than SSD read speed (around 25 µs).
Since many SSD write operations eventually cause many SSD erase operations, reducing
SSD write traffic plays a crucial SSD reliability role.
To bypass this limitation, many write buffer cache schemes have been proposed [3,
4, 5, 6, 7]. All existing schemes belong to either a main memory buffer cache design (i.e.,
host-side) or an SSD write buffer design (i.e., inside SSDs). Thus, they only address
only one facet. However, for better (optimal) performance, we must simultaneously
consider two facets. Therefore, as our first work, we propose two cooperative buffer
cache schemes within different layers: a main memory buffer cache (named H-ARC)
and an internal SSD write buffer (named WRB). To the best of our knowledge, this is
the first work simultaneously addressing both mechanisms. This comprehensive write
buffer mechanism can provide a holistic SSD system view for write traffic reduction (i.e.,
combine each scheme’s write traffic reduction contribution).
Today hard disk drives (HDDs) are still the most common storage devices despite
the rapid evolution and expansion of SSDs. As spinning devices, HDDs’ sequential
3
access speed for both read and write (on the order of 100MB/s) is orders of magnitude
faster than random access speed (roughly 1MB/s) [8]. The slow random access speed
is always a bottleneck constraining HDDs’ I/O performance. In order to solve the slow
random write problem, two major approaches can be followed: (1) decreasing storage
write traffic and (2) changing random write I/Os to sequential write I/Os. For the
first approach, using NVRAM as main memory gives us opportunities to delay writes
to storage. Using this delayed write property, many buffer cache polices have been
designed for SSDs to increase their lifespan [9] [10]. Our evaluation results show that
minimizing storage writes alone will not significantly improve performance. For the
second approach, several buffer cache polices try to group many random writes to fewer
sequential writes before issuing them to storage [11] [12]. However, these cache policies
are designed for write buffers and deal with dirty pages only.
To solve the aforementioned HDDs’ random access problem, as our second work,
we present a novel NVRAM-based buffer cache policy, termed I/O-Cache. I/O-Cache
dynamically separates the whole buffer cache into a clean cache caching all the clean
pages and a dirty cache caching all the dirty pages. To decrease storage writes, we
prioritize the dirty cache more than the clean cache when dynamically resizing these
caches. The dynamic separation enables our cache policy to suit various workloads: read
intensive or write intensive. To improve storage performance when evicting from the
dirty cache, instead of only synchronizing and evicting a single dirty page, I/O-Cache
will try to synchronize the longest set of consecutive dirty pages (according to their page
numbers) as long as the length of this longest set of consecutive dirty pages is above
a threshold. Then one of the pages will be evicted and the rest will be migrated to
the clean cache. If the length of the longest set of consecutive dirty pages is below the
threshold, I/O-Cache will synchronize and evict the least recently used dirty page. The
threshold is very necessary; without it, always choosing the longest set of consecutive
dirty pages from the dirty cache will lead to a low cache hit ratio and bad storage
performance. When evicting from the clean cache, I/O-Cache will always choose the
least recently used page. We evaluate our proposed schemes with various traces. The
experimental results show that I/O-Cache shortens I/O completion time, decreases write
I/Os, and improves the cache hit ratio compared with existing cache policies.
Traditional disk arrays are still playing an important role, especially for large data

4
centers, since their capacity per dollar cost is much lower than the “high-end” all-
flash arrays [13]. Disk arrays consist of HDDs which are rotational devices. To gain
hybrid buffer cache design insights, we make an in-depth study of storage system I/O
workloads. These storage system level I/O workloads are very different from server-
side I/O workloads due to server-side buffer/cache effects. We evaluate and analyze
the impact of different NVRAM sizes, access latencies, and cache design choices on
storage performance. Based on these key observations, as our third work, we propose
a novel cooperative HybrId NVRAM and DRAM Buffer cACHe polIcy for storage disk
arrays, named Hibachi. Hibachi transcends conventional buffer cache policies by 1)
distinguishing read cache hits from write cache hits to improve both read and write hit
rates; 2) learning workload tendencies to adjust the page caching priorities dynamically
to shorten page access latencies; 3) regrouping cached dirty pages to transform random
writes to sequential writes to maximize I/O throughput; and 4) using accurate and
low-overhead page reuse prediction metrics customized for storage system workloads.
Parallel file systems (PFSs) are the centerpieces used to satisfy the storage needs
of supercomputers. Supercomputers need to host high-performance computing (HPC)
applications which can run days or even months. However, failures (hardware failures
and software bugs) happen at many time and places that can cause the unexpected
termination of HPC applications [14]. To prevent the restart of these time consuming
applications, checkpoint/restart techniques were invented and are utilized to provide
fault tolerance such that intermediate results are saved for data recovery and applica-
tion resumption. As the HPC scale grows bigger and bigger, checkpointing has become
a bottleneck that constrains its performance [15, 16, 17]. To improve checkpointing
speed, an intermediate layer, called a burst buffer (BB), is often used to alleviate the
burden on PFSs. BBs consist of fast storage media and/or dedicated software and net-
work stacks that can absorb checkpoint data orders of magnitude faster than PFSs.
Then the buffered data will be drained to PFSs in the background if necessary. Tradi-
tional burst buffers mostly consist of solid state drives, but newly developed NVRAM
technologies (e.g., 3D Xpoint, PCM, and NVDIMM) are better candidates due to their
better performance.
There are two types of burst buffer architectures: centralized BB or distributed BB.

5
In a centralized BB architecture, a big BB appliance or multiple BB appliances will ab-
sorb checkpoint data from all the compute nodes [18, 19, 20, 21]. The checkpoint data
must be transmitted through a network to reach the centralized BB. On the contrary,
in the more popular distributed BB architecture, each BB is smaller capacity and put
closer, or even attached directly, to each compute node [17, 16, 22]. Under the dis-
tributed BB architecture, the absorption of checkpoint data is much quicker than using
networks since BBs are closer to the data origin. It is also more scalable and flexible to
add/remove distributed BBs to/from compute nodes as needed. However, the downside
of the distributed BB architecture is potentially low BB resource utilization; without
proper scheduling and coordination, some BBs are overburdened while others might be
idle.
As mentioned above, while the distributed BB architecture has plenty of advan-
tages it can suffer low resource utilization. This problem is particularly severe for
NVRAM-based BBs since NVRAM is much more expensive than other storage media
(e.g., SSD), which makes NVRAM much more valuable and scarce. Based on our obser-
vations of HPC application execution patterns and experimentations on HPC systems,
as our fourth work, we propose a novel BB coordination system, named collaborative
distributed burst buffer (CDBB), to improve resource utilization and further increase
HPC checkpointing speed. Specifically, we design a BB coordinator to monitor and
control all BBs to make them work collaboratively. When an application performs
checkpointing, instead of only relying on local BBs, the BB coordinator will globally
select available remote BBs (based on their priority and on-the-fly status) in nodes
running other applications to contribute and alleviate the burden of those local BBs.
The rest of this thesis is organized as follows. Chapter 2 provides two cache policies,
H-ARC and WRB, to reduce SSD writes to extend their lifespan. Chapter 3 describes
the proposed I/O-Cache to take advantage of HDD’s fast sequential write speed. Chap-
ter 4 presents the proposed Hibachi as a second level hybrid cache to boost disk arrays’
performance. Chapter 5 shows the proposed CDBB coordination system to increase
checkpointing speed for HPC parallel file systems. Finally, Chapter 6 concludes the
dissertation.

Chapter 2
Cooperative NVRAM-based
Write Buffers for SSDs
2.1 Introduction
DRAM is the most common main memory technology. Despite DRAM’s high endurance
and fast read/write access speed advantages, it suffers data loss in the event of power
failures or system crashes [23]. To solve this problem, combining DRAM’s fast access
speed and Flash’s persistence in non-volatile DIMMs [24] has recently occurred and
proven to provide reliable main memory systems. In addition, new non-volatile memory
(NVRAM) technologies, such as phase change memory (PCM), Memristor, and STT-
RAM, have rapidly developed and are expected to replace computer system DRAMs in
the near future. These emerging NVRAM technologies offer other advantages beyond
non-volatility. For example, compared to DRAM, Memristor and PCM can achieve
higher density, and Memristor and STT-RAM can provide faster read access and lower
energy consumption [25, 26]. Therefore, we assume a computer system has a CPU,
NVRAM as main memory, and SSDs as storage devices [27]. The SSD also contains
an NVRAM write buffer. Figure 2.1 depicts an architecture we employ throughout this
chapter.
NAND Flash-based solid state drives (SSDs) achieve much faster random access
speed than the traditional hard disk drives (up to 100×) and are widely deployed in
computer storage systems [1, 2]. NAND Flash consists of data blocks, each of which
6

7
contains a fixed number of pages (typically 64 or 128 pages). Flash supports page read
and write operations and block erasure operations. Data are only written to clean pages
because Flash does not support in-place updates. Due to slow erase operation speed
(around 2 ms), Flash Translation Layer (FTL) firmware alternatively writes data to
clean pages first and marks the original page as invalid. Later, a periodically triggered or
on-demand garbage collection (GC) mechanism reclaims the (invalid) blocks containing
invalid pages, thereby reclaiming previously invalid blocks. However, Flash, by nature,
allows a limited number of block cell erasures (about 1K for TLC and 10K for MLC).
Thus, Flash-based SSDs cannot avoid low endurance problems (particularly MLC/TLC
Flash-based SSDs). Moreover, SSD write speed (around 200 µs) is much slower than
SSD read speed (around 25 µs). Since many SSD write operations eventually cause
many SSD erase operations, reducing SSD write traffic plays a crucial SSD reliability
role.
To bypass this limitation, many write buffer cache schemes have been proposed [3, 4,
5, 6, 7, 28]. All existing schemes belong to either a main memory buffer cache design (i.e.,
host-side) or an SSD write buffer design (i.e., inside SSDs). Thus, they only address
only one facet. However, for better (optimal) performance, we must simultaneously
consider two facets. Therefore, in this chapter we propose two cooperative buffer cache
schemes within different layers: a main memory buffer cache (named H-ARC) and an
internal SSD write buffer (named WRB). To the best of our knowledge, this is the first
work simultaneously addressing both mechanisms. This comprehensive write buffer
mechanism can provide a holistic SSD system view for write traffic reduction (i.e., each
scheme’s write traffic reduction contribution).
Most exiting DRAM-based main memory cache designs mainly focus on improving
read cache hit ratios for clean pages because newly written or dirty pages (i.e., updated
pages) must be frequently flushed to underlying storage for reliability. However, if
NVRAM is a main memory, dirty pages can still safely remain, even across power failures
or system crashes. As a result, main memory and dirty page storage synchronization
can dramatically decrease without sacrificing data consistency [29]. This provides an
opportunity to decrease SSD write traffic. A part of main memory must be reserved for
the read cache (clean pages) whenever system performance is critical.
To decrease storage write traffic, one possible approach is to keep dirty pages in

8
CPU
Host Buffer Cache
Flash Translation Layer SSD
File System
NAND Flash Memory
Host
Write
Write Buffer Cache
Read
Figure 2.1: Overall System Architecture and Design
memory as long as possible. However, this hurts a read cache hit ratio. It is very
challenging to determine a proper cache size for both dirty pages and clean pages.
Solving this problem requires designing a dynamic split-cache mechanism for dirty pages
and clean pages that effectively accommodates unpredictable workloads. With hits on
such a split-cache, dirty page write requests reduce storage write traffic and read request
hits on either clean or dirty pages improve read performance. This implies the overall
hit ratio is also an important factor. That is, when memory is full, a victim page must
be judiciously selected to improve overall performance.
To meet all these challenges, we propose a novel main memory buffer cache algo-
rithm named a Hierarchical Adaptive Cache Replacement (H-ARC). H-ARC is basi-
cally inspired by the existing Adaptive Cache Replacement (ARC) cache algorithm [30].
However, unlike ARC that considers only recency and frequency, H-ARC considers four
factors: dirty and clean as well as recency and frequency. H-ARC first determines the
desired dirty and clean page cache size ratios by splitting the total cache space into a
dirty page cache portion and a clean page cache portion. This split dynamically adjusts
based on workload access patterns. For this, H-ARC maintains two ghost caches for
each dirty page cache and clean page cache. A ghost cache is a data structure only
storing recently evicted page metadata. Each cache can grow or shrink according to
workloads. For example, if a cache hits in the ghost cache of the dirty page cache, the
desired dirty page cache size increases. Similarly, if a cache hits in the ghost cache of the
clean page cache, the desired clean page cache size increases. Note that due to a fixed

9
total cache size, the other cache size must decrease accordingly. To keep dirty pages in
the cache longer, we prioritize enlarging the dirty page cache faster than enlarging the
clean page cache.
Once the desired dirty (or clean) page cache size is determined, to select a victim,
each page cache space is subdivided into a recency cache and a frequency cache. Similar
to ARC, the recency cache stores pages recently referenced once. The frequency cache
stores pages recently referenced at least twice. Both the recency cache and frequency
cache in each dirty and clean page cache also have a correspondingly maintained ghost
cache. Thus, if a cache hits in a ghost cache, the corresponding real cache size grows.
Unlike dirty and clean caches, no priority is given to both recency and frequency caches.
That is, both cache sizes symmetrically grow and shrink. When a cache fills, a page is
evicted from one of the four real cache sections based on LRU policy.
The proposed H-ARC notably reduces SSD write traffic and increases cache hit
ratios at the host-side main memory layer (i.e., outside SSDs). Now, these initially
‘filtered’ write traffics can be further reduced inside SSDs using an internal SSD write
buffer mechanism. We propose a novel SSD write buffer scheme named Write Traffic
Reduction Buffer (WRB). For SSD scalability, WRB employs hash tables for a fast
block search (O(1) complexity), which is more appropriate than a sequential search
(O(n) complexity). WRB effectively reduces Flash block erase operations by selecting
a victim block with the highest block utilization to exploit spatial localities. Moreover,
to exploit temporal localities, WRB first checks whether the number of cache pages
belonging to the block is greater than a predefined threshold. WRB evicts the block
with highest block utilization only if the number exceeds the threshold value. Otherwise,
it chooses a victim block containing the LRU page based on a block-level LRU policy
because this can help increase a write cache hit ratio and consequently reduces SSD
write traffic.
The main contributions of this work are as follows:
• A novel host buffer cache scheme : This work proposes a novel main buffer
cache mechanism named H-ARC with dynamic features effectively adaptive to
various workloads. Consequently, it significantly reduces SSD write traffic and
improves cache hit ratios.

10
• A novel internal SSD write buffer scheme : In addition to the host buffer
cache algorithm, this work proposes another internal SSD mechanism to further
reduce SSD write traffic, named WRB. WRB is an internal SSD write buffer
algorithm that reduces Flash block erasures as well as write traffic by exploiting
both temporal and spatial localities.
• Implementation for a comprehensive mechanism : Since this is the first
work simultaneously addressing both host and internal SSD buffers, relevant
schemes do not exist for fair evaluation. Thus, we select several representative
algorithms at different layers and implement several holistic write buffer cache
mechanisms by combining them.
The structure of this chapter is as follows. Section 2.2 provides background knowl-
edge of current memory technologies and Section 2.3 discusses related studies on existing
buffer cache policies. Section 2.4 describes the proposed write buffer cache design and
operations. In Section 2.5, extensive evaluations and analyses demonstrate the proposed
design’s effectiveness. Finally, Section 2.6 concludes this work.
2.2 Background
Current memory technologies such as DRAM and SRAM face technological limitations
for continued improvement [31]. NAND Flash memory, unlike DRAM and SRAM,
is a non-volatile memory and retains a variety of merits including light weight, lower
power consumption, fast random access, and shock resistance [32, 33, 34, 2]. Thus, it is
widely adopted in enterprise applications as well as personal mobile devices [35, 36, 37].
However, Flash memory has a longer access latency (about 50–100x) than DRAM, and
cannot avoid a shortened lifespan due to its inborn physical limitation [38, 39, 40, 41].
Though there have been recent NAND Flash technical breakthroughs such as Samsung’s
3D V-NAND technology [42] and Micron’s NVDIMM [43], NAND Flash is unlikely to
replace DRAM as main memory. Instead, it is expected to be used as a wholesale
swap-out of entire disk-based enterprise data infrastructures [2].
As a result, there are intense efforts to develop new DRAM alternative memory
technologies as well as a NAND Flash alternative. Most of these new technologies are

11
non-volatile memories because non-volatility can provide additional advantages such
as new power saving modes for quick wakeup as well as faster power-off recovery and
restart for HPC applications [31]. These new technologies include PRAM (or PCM),
STT-RAM, MRAM, RRAM, and 3D XPoint. Phase Change Memory (PRAM or PCM)
is one of the most promising new NVRAM technologies and can provide higher scalabil-
ity and storage density than DRAM [44, 45]. In general, PCM still has a 5–10× longer
latency than DRAM. To overcome PCM’s speed deficiency, various system architec-
tures have been designed to integrate PCM into current systems without performance
degradation [25, 46, 47, 48, 49, 50, 51].
Magnetic RAM (MRAM) and Spin Torque Transfer RAM (STT-RAM) are expected
to replace SRAM and DRAM within the next few years [52, 53, 54]. The attractiveness
of replacing those volatile memories with high speed and high endurance non-volatile
memory makes these new technologies very competitive [31]. STT-RAM reduces the
transistor count and, consequently, provides a low cost, high-density solution. Many
enterprise and personal devices use MRAM for an embedded cache memory. Due to
MRAM and STT-RAM process compatibility with conventional CMOS processes, they
can be built directly on top of CMOS logic wafers, unlike NAND Flash memory [31].
Resistive RAM (RRAM) is considered a potential candidate to replace NAND Flash
memory [55]. SanDisk and HP (inventor of the memristor RRAM) are actively devel-
oping next generation RRAM technology. However, technical breakthroughs have con-
tinuously evolved NAND Flash memory technology for the last several generations and
it has been industrially wide-spread. Thus, transitioning to RRAM, as a NAND flash
replacement, is not expected within a decade [31].
Micron and Intel recently introduced 3D XPoint non-volatile memory technology and
this technology is presently considered another DRAM alternative [56]. The companies
claim that this technology is a resistive memory technology, but many researchers believe
it is an existing type of Phase Change Memory (PCM) technology [31]. 3D Xpoint
technology has high endurance, high density, and promising performance that is much
better than NAND Flash, but slightly slower than DRAM. Thus, it is expected to target
high performance in-memory processing applications [57].

12
2.3 Related work
Most DRAM-based cache algorithms primarily focus on improving read cache hit ratios
because all dirty pages are frequently flushed to underlying storage [58]. Both recency
and frequency are two main factors to improve cache hit ratios. Least Recently Used
(LRU) [59] and Least Frequently Used (LFU) [60] consider only one factor and ignore the
other one. To bypass this limitation, Megiddo et al. proposed Adaptive Replacement
Cache (ARC) [30]. ARC divides the total cache space into two sections: recency cache
and frequency cache. The recency cache stores pages referenced once and the frequency
cache stores pages recently referenced at least twice. ARC maintains two ghost caches
for each recency cache and frequency cache. The ghost cache is a data structure keeping
only metadata of recently evicted pages. Due to a fixed total cache size, each ghost cache
hit triggers enlarging the corresponding real cache size and shrinking the other real cache
size. Consequently, each real cache dynamically grows or shrinks according to workload
characteristics.
Unlike the aforementioned DRAM-based cache algorithms, existing NVRAM-based
cache algorithms primarily concentrate on SSD write traffic reduction to extend flash-
based SSD lifetimes. Existing caching algorithms for NAND flash memory can be largely
classified into two main categories: a main memory buffer cache algorithm (i.e., external
to an SSD) and an internal SSD write buffer algorithm. The main memory buffer cache
algorithms operate in host NVRAM-based main memory systems and there are several
existing studies examining them. Park et al. proposed a Clean First LRU (CFLRU)
algorithm [61]. CFLRU splits the total cache space into a working region and a clean-
first region. The clean-first region is a cache area near the LRU end position. Clean
pages are first evicted from the clean-first region with LRU policy. If there is no clean
page in the clean-first region, dirty pages are evicted. However, CFLRU does not
consider frequency and must pre-configure the clean-first region size. Thus, if the size is
too large, the cache hit ratio suffers due to early hot clean page eviction. On the other
hand, if the size is too small, dirty pages are evicted early. Qiu et al. proposed a cache
policy in NVMFS [29]. NVMFS splits the whole cache into two smaller caches: a dirty
page cache and a clean page cache. Each cache grows and shrinks based on page hits.
However, it ignores frequency. Jung et al. improved the LRU algorithm with an add-on

13
page replacement strategy, named LRU Write Sequence Reordering (LRU-WSR) [5].
LRU-WSR provides dirty pages with a second chance before eviction to decrease write
traffic. For each dirty page, it adds a hot/cold page indicator bit. LRU-WSR initially
assumes all dirty pages are hot pages. If a victim is dirty and hot, LRU-WSR marks
it as a cold page and migrates it to the MRU position. If a victim is clean, or dirty
and cold, LRU-WSR evicts it right away. If a dirty page hits, it considers the page hot.
However, giving a second chance may hurt a cache hit ratio. As an example, giving a
second chance to some cold dirty pages causes some hot clean page evictions.
Unlike using NVRAM as main memory, some studies have investigated an internal
SSD write buffer cache algorithm. Jo et al. proposed the Flash Aware Buffer man-
agement (FAB) scheme. FAB considers block space utilization. It groups the pages
belonging to the same block and evicts those pages with the largest number [6]. In
case of a tie, FAB follows LRU order. However, FAB only considers block utilization
and ignores temporal locality. Moreover, FAB is not scalable for SSD capacity be-
cause it sequentially looks up all indexes. Kim et al. proposed Block Padding LRU
(BPLRU) [3] that is also rooted in the grouping-based management. BPLRU is funda-
mentally based on the LRU policy to select victims in a write buffer. Whenever any
page in a block hits, the corresponding block moves to the Most Recently Used (MRU)
position. When a buffer fills, a block in the LRU position is evicted. Since BPLRU
only considers temporal locality (i.e., LRU) for victim block selection, for completely
random workloads, it incurs a large number of additional reads for page padding, which
significantly degrades overall performance. Debnath et al. proposed another SSD write
buffer algorithm named Large Block CLOCK (LB-CLOCK) [62]. LB-CLOCK considers
both recency and block utilization to select a victim. It dynamically varies a priority
between these two metrics to adapt to workload characteristics. Kang et al. proposed
a Coldest and Largest Cluster (CLC) algorithm [7]. CLC combines FAB and LRU. It
maintains two lists: a size-independent cluster list and a size-dependent cluster list.
The size-independent list is sorted with LRU policy to exploit temporal locality for hot
clusters. The size-dependent list is sorted by a cluster size to exploit spatial locality
for cold clusters. Initially, CLC inserts pages in the size-independent list. When the
size-independent list is full, CLC moves clusters from the LRU position of the size-
independent list to the size-dependent list. When the size-dependent list is full, CLC

14
Dirty cache Clean cache Dirty ghost cache Clean ghost cache
Cache
Cache directory
Dirty frequency
Dirty recency
Recency ghost
Frequency ghost
Clean frequency
Clean recency
Recency ghost
Frequency ghost
Figure 2.2: H-ARC Architecture
evicts the largest cluster from its tail. Wu et al. proposed a Block-Page Adaptive Cache
(BPAC) [4]. BPAC is based on the CLC algorithm and tries to dynamically adjust each
list size according to workloads.
2.4 Proposed Design
This section presents two NVRAM-based buffer cache policies: a host-side write buffer
cache design (named H-ARC) and an internal SSD write buffer design (named WRB).
2.4.1 Host Write Buffer Cache: H-ARC
Architecture
The proposed Hierarchical Adaptive Replacement Cache (H-ARC) is an NVRAM-based
main memory write buffer cache algorithm. Primary H-ARC design goals are to reduce
SSD write traffic and to increase cache hit ratios for both reads and writes. Unlike
existing DRAM-based algorithms that only consider recency and/or frequency, H-ARC
considers four factors–dirty, clean, recency, and frequency–to exploit NVRAM non-
volatility. H-ARC is fundamentally inspired by the learning process of the existing
Adaptive Replacement Cache (ARC). It adopts a ghost cache concept [30]. However,
the proposed H-ARC hierarchically applies the learning process. That is, at a higher
level, H-ARC first divides a whole cache space into two sections to determine a desired
cache size for both dirty pages and clean pages. At the next level, for each dirty page

15
cache and clean page cache, H-ARC further subdivides these two cache spaces into
two respective subsections to determine a desired size for both a recency cache and a
frequency cache. Now, the whole main cache space is split into four subsections (dirty-
recency, dirty-frequency, clean-recency, and clean-frequency). H-ARC also adopts a
ghost cache for four respective real caches to dynamically adjust each cache size (please
refer to Figure 2.2). Each ghost cache maintains only evicted data page metadata from
each corresponding real cache. Each real cache stores data pages and their metadata.
Operations
This section describes H-ARC operations. A dirty page cache and a clean page cache
are denoted by D and C respectively. The aforementioned four real cache regions are
denoted as follows: a dirty-recency cache (D1i), a dirty-frequency cache (D2i), a clean-
recency cache (C1i), and a clean frequency cache (C2i).
Four ghost caches are maintained: D1o, D2o, C1o, and C2o which are the ghost caches
of the corresponding real caches D1i, D2i, C1i, and C2i. For convenience, this section
follows the notation convention: D denotes dirty, C denotes clean, subscript 1 denotes
one time reference (to capture recency), subscript 2 describes at least two times reference
(to capture frequency), subscript i describes cached pages in real caches, subscript o
presents cached pages in the ghost caches. A ghost cache only stores metadata of the
recently evicted pages from corresponding real caches. Each cache size is the number of
pages stored. Assuming the maximum physical cache size (i.e., memory size) is L, the
summation of all four real cache sizes cannot be greater than L. The summation of all
the real caches and ghost caches cannot be greater than 2∗L. Conceptually D1i and D2i
can be grouped as dirty real cache denoted by Di, and C1i and C2i can be grouped as a
clean real cache denoted by Ci. Similarly, each corresponding ghost caches are grouped
together denoted by Do and Co.
All the real caches and ghost caches are initially empty. For each read/write request
r from workloads, one of the following three cases happens: (1) Real cache hit, (2) Real
cache miss, but ghost cache hit, (3) Both real and ghost cache misses.
(1) Real Cache Hit
If a read or write request r hits in any real cache (C1i, C2i, D1i, or D2i), H-ARC
16
migrates the referenced data page from its original location to the most recently used
(MRU) position to either C2i or D2i according to the original state of the referenced
data page in the cache. This is because the page is now referenced at least twice in the
real cache.
If a request r is a read request and hits in C1i or C2i, the referenced page state
does not change (i.e., still remains a clean page). H-ARC migrates it from its original
location in either C1i or C2i to MRU position in C2i. Similarly, if the r hits in D1i or
D2i, this also does not change the referenced page state (i.e., remains a dirty page).
H-ARC migrates it from its original location either in D1i or D2i to MRU position in
D2i.
Unlike a read request, a write request changes the referenced page state. If a write
request r hits in either C1i or C2i, it changes the page state from a clean page to a dirty
page. H-ARC migrates it from its original location to the MRU position in D2i. If the
write request r hits in D1i or D2i, this page still remains a dirty page. H-ARC migrates
it from its original location to the MRU position in D2i. Note that we consider both
reads and writes for a reference count.
(2) Real Cache Miss, Ghost Cache Hit
When a request r hits in a ghost cache and misses in the real caches, H-ARC follows
three steps. First, H-ARC adjusts the real cache size to capture the current workload
tendency (writes vs. reads, frequency vs. recency). Second, if the cache is full, a page
must be evicted from a real cache. Third, the new page is inserted into its corresponding
real cache. Figure 2.3 illustrates these steps.
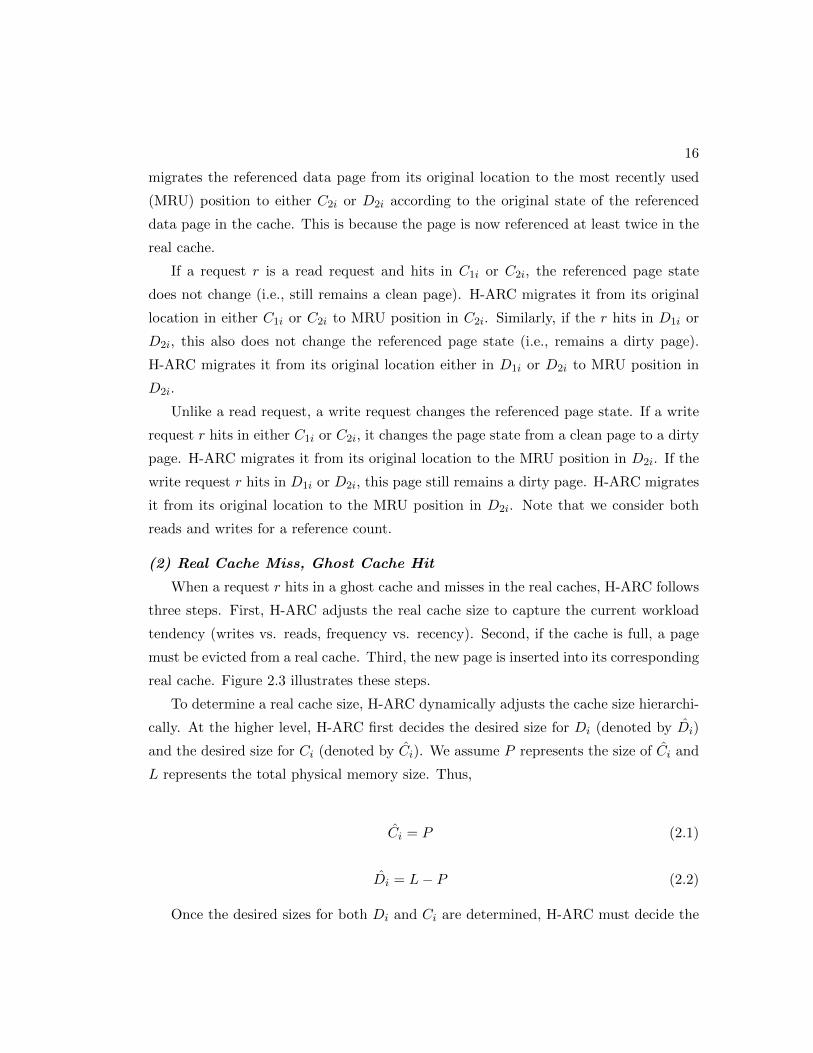
To determine a real cache size, H-ARC dynamically adjusts the cache size hierarchi-
cally. At the higher level, H-ARC first decides the desired size for Di (denoted by Di)
and the desired size for Ci (denoted by Ci). We assume P represents the size of Ci and
L represents the total physical memory size. Thus,
Ci = P (2.1)
Di = L− P (2.2)
Once the desired sizes for both Di and Ci are determined, H-ARC must decide the

17
desired size for D1i (denoted by D1i) and D2i (denoted by D2i) for a dirty cache region.
Similarly, for a clean cache region, both the desired size for C1i (denoted by C1i) and C2i
(denoted by C2i) must be determined at the same time. Here, two fractions PC and PD
are adopted to denote the desired ratio for C1i and D1i inside Ci and Di respectively.
The equations are shown below:
C1i = PC ∗ Ci (2.3)
C2i = Ci − C1i (2.4)
D1i = PD ∗ Di (2.5)
D2i = Di − D1i (2.6)
At the higher level, if a page hits in Co (clean ghost cache), it implies the clean
page should not have been evicted from the clean cache. To compensate for this, H-
ARC enlarges the clean cache size (Ci). Every time a ghost hit occurs in Co, Ci (or P )
increases by 1. According to Equation (2.2), Di decreases by the same size. Please note
that P cannot be larger than L. The equation of P adjustment is described as follows:
P = min{P + 1, L} (2.7)
If, on the other hand, a page hits in Do (dirty ghost cache), it implies the dirty
page should not have been evicted from the dirty cache. Thus, H-ARC must enlarge
the dirty cache size (Di). To meet our goal of write traffic reduction, H-ARC tries to
keep dirty pages in the cache longer. Unlike the aforementioned Ci increment policy,
H-ARC enlarges Di much faster than Ci. If the clean ghost cache size (Co) is smaller
than the dirty ghost cache size (Do), Di increases by two. If the size of Co is greater
than or equal to Do, Di increases by two times the quotient of Co and Do. That is,
if the Do size is smaller, Di increases faster. According to Equation (2.1), Ci must be
decreased by the same size. Again, the total size of Ci and Di cannot be larger than L,
and P cannot be smaller than 0. The equation of P adjustment is shown as follows:

18
P =
{max{P − 2, 0} if |Co| < |Do|max{P − 2 ∗ |Co|
|Do| , 0} if |Co| ≥ |Do|(2.8)
After H-ARC determines both the dirty cache size and the clean cache size, H-ARC
determines both a recency cache size and a frequency cache size for each dirty cache and
clean cache. If a ghost page hits in either a clean-recency ghost cache (C1o) or a dirty-
recency ghost cache (D1o), it implies this recency page should not have been evicted
from the cache. So, H-ARC enlarges the corresponding clean-recency cache size (C1i)
or the dirty-recency cache size (D1i) by increasing PC or PD accordingly. Similarly, if a
page hits in either a clean-frequency ghost cache (C2o) or a dirty-frequency ghost cache
(D2o), H-ARC enlarges the corresponding real cache sizes (C2i or D2i) by decreasing PC
or PD accordingly. Unlike the dirty and clean cache region adjustment, the frequency
and recency cache size adjustment is symmetric since H-ARC does not provide any
priority for these two factors. After the adjustment of PC (or PD), all four region sizes
(C1i, C2i, D1i and D2i) are recalculated with Equations (2.3)-(2.6). The equations of
PC and PD adjustments are presented below:
• A clean-recency ghost cache hit in C1o: H-ARC enlarges C1i. Thus, PC increases.
PC =
min{PC + 1P , 1} if |C2o| < |C1o|
min{PC +|C2o||C1o|P , 1} if |C2o| ≥ |C1o|
(2.9)
• A clean-frequency ghost cache hit in C2o: H-ARC enlarges C2i. Thus, PC in-
creases.
PC =
max{PC − 1P , 0} if |C1o| < |C2o|
max{PC −|C1o||C2o|P , 0} if |C1o| ≥ |C2o|
(2.10)
• A dirty-recency ghost cache hit in D1o: H-ARC enlarges D1i. Thus, PD increases.
PD =
min{PD + 1L−P , 1} if |D2o| < |D1o|
min{PD +|D2o||D1o|L−P , 1} if |D2o| ≥ |D1o|
(2.11)

19
• A dirty-frequency ghost cache hit in D2o: H-ARC enlarges D2i. Thus, PD in-
creases.
PD =
max{PD − 1L−P , 0} if |D1o| < |D2o|
max{PD −|D1o||D2o|L−P , 0} if |D1o| ≥ |D2o|
(2.12)
Now, all desired cache sizes are determined. Please note that a desired cache size
does not mean a real cache size, but a targeting cache size. That is, the real cache
size is not adjusted until H-ARC performs the eviction and balance procedures. The
eviction and balance procedures are as follows: After obtaining all the desired sizes,
H-ARC compares them to each current real cache size. H-ARC gradually changes the
real cache size until their desired size by evicting a page from a real cache that is larger
than its desired size.
Specifically, at the higher level, if the size of Ci is greater than or equal to Ci and
the request r is in Do, H-ARC evicts a page from Ci. Otherwise, H-ARC evicts a page
from Di. At the lower level, assuming H-ARC is evicting from Ci, if the size of C1i is
larger than C1i, H-ARC evicts the LRU page from C1i and inserts its metadata into
the MRU position in C1o. Otherwise, H-ARC evicts the LRU page out from C2i and
inserts its metadata into the MRU position in C2o. Similar operations are applied to
Di if H-ARC evicts a page from Di.
Figure 2.3 illustrates this operation. Assuming a page hits in the dirty ghost cache,
H-ARC must increase the dirty cache size and decrease the clean cache size accordingly
following H-ARC policies. For this, H-ARC first evicts the page located in the clean
cache LRU position and its page metadata is inserted in the clean ghost cache MRU
position. Then, H-ARC increases the dirty cache size and shrinks the clean cache size
accordingly. Finally, it stores the referenced page data into the MRU position of the
dirty cache and removes the corresponding page metadata from the dirty ghost cache.
(3) Both Real and Ghost Cache Misses
When the real caches are not full, H-ARC simply inserts the page into the MRU
position of C1i if r is a read request, or into the MRU position of D1i if r is a write
request.
When the real caches are full, H-ARC must evict a page from a real cache to secure a
space for the new page insertion. In addition, H-ARC tries to equalize the size of D and

20
Dirty cache Clean cache Dirty ghost Clean ghost
Cache hit!
(3) Insert data to a cache (1) Evict LRU data to a ghost cache
(2) Increase a desired dirty cache size and decrease a desired clean cache size
Figure 2.3: H-ARC Operation
C. For D, as an example, H-ARC makes an attempt to equalize the size of D1 and D2.
Specifically, D includes D1i, D2i, D1o and D2o. D1 includes D1i and D1o. D2 includes
D2i and D2o. This equalization process is required to avoid cache starvation. H-ARC
can cause this cache starvation if one real cache size and its corresponding ghost cache
size are both very large. Since the total cache size is fixed, the other real cache size
and its corresponding ghost cache size are very small. Therefore, the small cache has
difficulty growing quickly due to low cache hit probabilities even if the current workload
favors it.
To solve this problem, H-ARC checks a C size. If the size of C is greater than L
(this means it already takes more than half of the total cache space including both real
and ghost caches), H-ARC evicts a page from C. Otherwise, H-ARC evicts a page from
D. Assuming H-ARC decides to evict a page from C, H-ARC checks the C1 size. If the
C1 size is greater than L/2 (this means it already takes half of the total cache space for
C), H-ARC evicts a page from C1. Otherwise, it evicts a page from C2. The eviction
process in D is similar to the process in C.
When H-ARC actually performs an eviction from a region (e.g., C1), H-ARC first
evicts the LRU page in C1o and executes the aforementioned eviction and balance pro-
cedures. This is because a ghost page space for an evicted page from the real cache
region must be secured first. If C1o is empty, H-ARC simply evicts the LRU page in
C1i.
Finally, after a real page eviction, H-ARC inserts a new page into the MRU position

21
BLK#1 Count:4
BLK#2 Count:3
BLK#N-3 Count:1
BLK#N-1 Count:2
Bucket 0
Bucket 1
Bucket 2
Bucket 3 … Bucket
N-3 Bucket
N-2 Bucket
N-1
BLK#3 Count:6
NULL NULL
LRU Tail
LRU Head
…
Cache
Hash table array
Block node lists
Figure 2.4: WRB Architecture
of C1i if r is a read request, or into the MRU position of D1i if r is a write request.
• Eviction&Balance (EB) Algorithm
In the last two cases, a new page needs to be inserted into the real cache. In case
the real caches are full, we need to evict a page out of cache to reclaim space for this
new page. We design an Eviction&Balance (EB) algorithm to identify a real page to be
evicted and to balance the real cache sizes towards their desired sizes. With the defined
P , PD and PC , we can easily calculate the desired size of Ci, Di, C1i, C2i, D1i, D2i
though Equations (2.1)-(2.6). After obtaining all the desired sizes, we compare them
with the current size of each real cache. We will evict from one real cache that is larger
than its desired size.
Specifically, at the higher level, if the size of Ci is larger than or equal to Ci and the
request r is in Do, we will evict a page from Ci. Otherwise, we will evict a page from
Di. At the lower level assuming we are evicting from Ci, if the size of C1i is larger than
C1i, we will evict the LRU page out from C1i and insert its page number into the MRU
position in C1o. Otherwise, we will evict the LRU page out from C2i and insert its page
number into the MRU position in C2o. Similar operation will happen in Di if we need
to evict a page out from this side.
2.4.2 Internal SSD Write Buffer: WRB
The proposed H-ARC significantly reduces write traffic to SSDs and increases cache hit
ratios at the host main memory layer. These initially ‘filtered’ write traffic can be further
reduced inside SSDs by an internal SSD write buffer mechanism. This section proposes

22
a novel SSD write buffer algorithm named Write Traffic Reduction Buffer (WRB).
Architecture
Figure 2.4 shows WRB architecture. For each write request, WRB checks whether the
request page exists in the buffer and then groups the page into a relevant block. Thus,
an efficient data structure is important to minimize search overhead. Unlike personal
mobile devices or small capacity SSDs that typically adopt a simple sequential search
(O(n) complexity) [6], WRB uses hash tables for a fast block search (O(1) complexity).
Block node lists are composed of double linked list of blocks to implement a block-level
LRU policy (please refer to Figure 2.5). Each block node contains a block number,
a page counter, two pointers for previous and next blocks, and a pointer array for
data pages in the buffer cache. All block nodes are sorted by recency (i.e., block-
level LRU policy). The block number represents a unique block number in NAND
flash-based SSDs. The page counter shows the number of page allocated to the block.
Two pointers are adopted to implement double linked list of blocks (i.e., forward and
backward pointers). In addition, each block maintains a pointer array to indicate each
data page in the buffer cache.
Operations
WRB is a write buffer inside SSDs and considers only write requests. WRB can take
advantage of internal SSD knowledge. NAND Flash-based SSDs perform block unit
erasures, each of which contains a fixed number of pages (e.g. 64). A single page update
may shortly trigger a whole block erasure for garbage collection (GC) [32]. Moreover,
if a GC block contains many valid pages, it causes a very low GC efficiency. Thus,
to minimize block erase counts and to improve GC efficiency, judicious batch eviction
of dirty pages without sacrificing a cache hit ratio is important. WRB considers the
following three main operations: (1) search, (2) insertion, and (3) eviction.
(1) Search
When an SSD write page request arrives, it contains a page number in addition to a
request operation type. WRB feeds this page number to a hash function to get a hash
value. This hash value enables WRB to directly search for the relevant block the page

23
BLK#0 Count:4
14 15 18 3 8 12 13 4 6 0 7 16 17 5
BLK#1 Count:3
BLK#3 Count:1
BLK#4 Count:2
BLK#2 Count:6
24 25
LRU MRU
Cache (full)
Block node lists
Hit!
BLK#0 Count:4
14 15 18 3 8 12 13 4 6 0 7 16 17 5
BLK#1 Count:3
BLK#3 Count:1
BLK#4 Count:2
BLK#2 Count:6
24 25
LRU MRU
Victim
(a) Before Referenced.
BLK#0 Count:4
14 15 18 3 8 12 13 4 6 0 7 16 17 5
BLK#1 Count:3
BLK#3 Count:1
BLK#4 Count:2
BLK#2 Count:6
24 25
LRU MRU
Cache (full)
Block node lists
Hit!
BLK#0 Count:4
14 15 18 3 8 12 13 4 6 0 7 16 17 5
BLK#1 Count:3
BLK#3 Count:1
BLK#4 Count:2
BLK#2 Count:6
24 25
LRU MRU
Victim candidate: LRU block Victim candidate: largest count
(b) After Referenced and Victim Selection.
Figure 2.5: Block-level LRU Policy and Victim Selection Example
belongs to. WRB harnesses this hash table data structure to achieve a fast block search.
This efficient and fast search capability is a crucial factor when a buffer size increases.
If WRB finds a relevant block node, it searches whether or not the page already
exists in the write buffer. If the page hits the buffer, WRB changes the page status
from clean to dirty and updates the page. If the page does not hit the buffer, WRB
inserts the new page into the buffer and updates pointer information in the block node.
Both cases (hit or miss) require the corresponding block node to move to the MRU
position in the block node lists. This implies WRB follows a block-level LRU policy.
Figure 2.5 provides a simple block-level LRU example. As in Figure 2.5 (a), when a
page 13 hits in the buffer, unlike a typical page-level LRU policy, all pages (page 12, 13,
14, 15, 16, and 17) belonging to the same block (Block #2) move to the MRU position
even though all the other pages are not referenced (Figure 2.5 (b)).
(2) Insertion
After a search operation, if the proposed scheme does not find a relevant block node
(i.e., a hash table returns ‘null’) or the request page does not exist in the buffer, the
page must be inserted in the buffer. If a block node does not exist, the proposed scheme
first allocates a new corresponding block node to a head position (i.e., MRU position)

24
of the block node lists and sets a page counter value to 1. At the same time, it links
the new block node to the hash table and inserts the new page into the buffer. Finally,
the scheme sets the page pointer in the block node in order to link to the new page
inserted. Although the block node exists, if the page does not exist in the buffer, WRB
moves the block node to MRU position of the lists and increases the page counter by 1.
Similarly, it sets the page pointer to the new page in the buffer.
(3) Victim selection and eviction
If the buffer is full and a new data page needs to be inserted, the proposed scheme
must evict some pages from the buffer to make a room for the new page. To utilize
spatial locality, WRB evicts all relevant pages belonging to the same block at once. This
can reduce the number of block erasures. Thus, WRB first tries to choose a victim block
with the largest page count. However, this simple policy overlooks temporal locality.
Consequently, it may hurt a cache hit rate. As mentioned, the cache hit rate is also an
important factor to reduce SSD write traffic. Therefore, we must consider the temporal
locality as well as the spatial locality.
A more complicated algorithm and data structure may be able to help a little bit
increase performance. However, the write buffer is very quickly filled with data and
whenever a new data page comes into the buffer, this eviction operation must be per-
formed every time. Considering the much lower computing capabilities of an embedded
CPU (about 10× less than a typical host CPU) and resources inside SSDs, it may not
be a practical solution [2, 1, 63]. Based on this observation, WRB adopts a simple and
effective solution for temporal locality: a threshold value. That is, when the buffer is
full, instead of always choosing a victim block node with the largest page count value,
WRB first checks whether the page count is greater than a predefined threshold value.
If the count is over than the threshold value, WRB chooses the block as a victim and
evicts all the pages belonging to the block. If the count value is not greater than the
threshold, WRB chooses the LRU block node and evicts all the pages in the block at
once.
Figure 2.5 (b) shows this victim selection example. For a simple example, let’s
assume the buffer is full, the block size is 6 pages, and the threshold value is 3. WRB
can choose either a block node with a largest page count (Block #2) or LRU block

25
ARC LRU-WSR H-ARC
FAB BPLRU LB-CLOCK WRB
Host buffer cache design
SSD write buffer design
Six combination schemes Proposed
Figure 2.6: A Combination of Six Comprehensive Schemes and the Proposed Scheme
node (Block #4) as a victim block. In this example, since the Block #2 has a greater
page count (i.e., 6) than the threshold value (3), WRB chooses Block #2 as a victim.
Assuming the Block #2 had a smaller page count (e.g., 2) than the threshold, WRB
would choose the LRU block node (Block #4) and evict all the pages (page 24 and 25)
at once.
2.5 Experiments
We propose two cooperative buffer cache schemes at different layers: a host-side buffer
cache (named H-ARC) and an internal SSD write buffer (named WRB). Since this work
is, to our knowledge, the first comprehensive write buffer mechanism simultaneously
addressing both layers, relevant schemes do not exist for fair comparison. Thus, we
implement six comprehensive schemes by selecting representative buffer algorithms for
each layer and combining them. Both ARC [30] and LRU-WSR [5] are selected for a
host-side buffer cache algorithm. FAB [6], BPLRU [3], and LB-CLOCK [62] are chosen
for an internal SSD write buffer algorithm. As in Figure 2.6, a combination of six
comprehensive schemes are implemented and evaluated.
2.5.1 Evaluation Setup
The proposed scheme is implemented on the basis of the Sim-ideal [64] simulator. Sim-
ideal configures cache schemes (e.g., cache size, page size, etc.) based on a given config-
uration file. Then, it loads a trace file into an internal data structure (i.e., queue) and
processes each trace requests from the queue according to the time stamp information.
All experiments assume a 4KB memory page size.
The evaluation adopts six traces (please refer to Table 2.1) from real workloads and

26
Table 2.1: Trace CharacteristicsTrace Name Total Requests Unique Pages R/W Ratio
mds 0 11,921,428 741,522 1:2.56wdev 0 2,368,194 128,870 1:3.73web 0 7,129,953 1,724,201 1:0.76fio zipf 524,411 291,812 1:0.25fio pareto 524,345 331,137 1:0.25File server 1,417,814 406,214 1:0.35
synthetic workloads. Real workloads use MSR Cambridge traces [65]. MSR Cambridge
traces consist of 36 volumes containing 179 disks from 13 Microsoft enterprise servers
with different purposes for one week. They are classified into 13 categories based on
server types. Each category consists of 2 or 3 traces. These traces represent data
accesses from a typical enterprise data center. We simply adopt the first volume of
traces from 3 categories (mds, wdev, and web) because the other traces in the same
category show similar characteristics. All selected traces are relatively write-intensive.
We generate synthetic workloads using two benchmarks: fio [66] and Filebench [67].
Since MSR Cambridge traces are block I/O traces that can be observed by a block
device layer, we enable direct I/O option for fio and Filebench. Then, the traces are
collected by using Linux blkrace. This direct I/O enables the read/write requests to
bypass the virtual file system layer (mainly a page cache in main memory) and to go to
the block layer directly. In this way, we can collect the block layer traces and their actual
access patterns are close to the access patterns of main memory. For fio benchmarks,
we configure 80% read requests and 20% write requests because this is a common access
ratio. In addition, the fio benchmark uses two different distribution types (zipf and
pareto). For Filebench, we select a popular file server model. Table 2.1 describes these
traces in detail.
2.5.2 Evaluation Results and Analysis
Overall performance
All write page requests first buffer in the host write buffer cache and then, these ‘filtered’
write requests are buffered again in the internal SSD write buffer to minimize SSD write
traffic. Figure 2.7 presents total write traffics (i.e., write block counts) of each scheme

27
0
20
40
60
80
100
120
140
160
1k 2k 4k 8k 16k
Wri
te B
lock
Cou
nt (
Uni
t:100
)
Cache Size (Pages)
ARC+FABARC+BPLRU
ARC+LB-CLOCKLRU-WSR+FAB
LRU-WSR+BPLRULRU-WSR+LB-CLOCK
Proposed
(a) mds
0
20
40
60
80
100
120
140
160
1k 2k 4k 8k 16k 32k
Wri
te B
lock
Cou
nt (
Uni
t:100
)
Cache Size (Pages)
ARC+FABARC+BPLRU
ARC+LB-CLOCKLRU-WSR+FAB
LRU-WSR+BPLRULRU-WSR+LB-CLOCK
Proposed
(b) wdev
0
50
100
150
200
250
1k 2k 4k 8k 16k 32k
Wri
te B
lock
Cou
nt (
Uni
t:100
0)
Cache Size (Pages)
ARC+FABARC+BPLRU
ARC+LB-CLOCKLRU-WSR+FAB
LRU-WSR+BPLRULRU-WSR+LB-CLOCK
Proposed
(c) web
0
100
200
300
400
500
600
700
1k 2k 4k 8k 16k 32kW
rite
Blo
ck C
ount
(U
nit:1
00)
Cache Size (Pages)
ARC+FABARC+BPLRU
ARC+LB-CLOCKLRU-WSR+FAB
LRU-WSR+BPLRULRU-WSR+LB-CLOCK
Proposed
(d) fio zipf
0
100
200
300
400
500
600
700
800
1k 2k 4k 8k 16k 32k
Wri
te B
lock
Cou
nt (
Uni
t:100
)
Cache Size (Pages)
ARC+FABARC+BPLRU
ARC+LB-CLOCKLRU-WSR+FAB
LRU-WSR+BPLRULRU-WSR+LB-CLOCK
Proposed
(e) fio pareto
0
20
40
60
80
100
120
1k 2k 4k 8k 16k 32k
Wri
te B
lock
Cou
nt (
Uni
t:100
0)
Cache Size (Pages)
ARC+FABARC+BPLRU
ARC+LB-CLOCKLRU-WSR+FAB
LRU-WSR+BPLRULRU-WSR+LB-CLOCK
Proposed
(f) file server
Figure 2.7: Total Write Traffics (block counts) From Host to NAND Flash (lower isbetter). The memory size in X-axis represents the number of 4K page. For example,1K means 1024 × 4K pages.
after those two write buffer schemes (i.e., host-side and SSD-side) process the write
traffics. As in the Figure 2.7, the proposed scheme outperforms the other schemes by
up to 3× particularly in the fio zipf and pareto workloads. In addition to the proposed
scheme, both LRU-WSR + BPLRU and LRU-WSR + LB-CLOCK schemes also show
good overall performance compared to other combinations. Specifically, in web and
file server workloads with small cache sizes of 1K through 4K, they exhibit slightly
better performance than the proposed scheme by an average of 10.1% (1K), 9.6% (2K)
and 9% (4K). However, as the memory size grows, the proposed scheme shows better
performance than both schemes by an average of 17.8% (16K) and 51.4% (32K).

28
8460
8480
8500
8520
8540
8560
8580
ARC+FAB
ARC+BPLRU
ARC+LB-C
LRU-W+FAB
LRU-W+BPLRU
LRU-W+LB-C
Proposed
Wri
te P
age
Red
uctio
n(U
nit:1
000)
Comprehensive Schemes
Host SSD
(a) mds
1740
1760
1780
1800
1820
1840
ARC+FAB
ARC+BPLRU
ARC+LB-C
LRU-W+FAB
LRU-W+BPLRU
LRU-W+LB-C
Proposed
Wri
te P
age
Red
uctio
n(U
nit:1
000)
Comprehensive Schemes
Host SSD
(b) wdev
2400
2450
2500
2550
2600
2650
2700
2750
ARC+FAB
ARC+BPLRU
ARC+LB-C
LRU-W+FAB
LRU-W+BPLRU
LRU-W+LB-C
Proposed
Wri
te P
age
Red
uctio
n(U
nit:1
000)
Comprehensive Schemes
Host SSD
(c) web
0
20
40
60
80
100
ARC+FAB
ARC+BPLRU
ARC+LB-C
LRU-W+FAB
LRU-W+BPLRU
LRU-W+LB-C
ProposedW
rite
Pag
e R
educ
tion(
Uni
t:100
0)
Comprehensive Schemes
Host SSD
(d) fio zipf
0
20
40
60
80
100
ARC+FAB
ARC+BPLRU
ARC+LB-C
LRU-W+FAB
LRU-W+BPLRU
LRU-W+LB-C
Proposed
Wri
te P
age
Red
uctio
n(U
nit:1
000)
Comprehensive Schemes
Host SSD
(e) fio pareto
0
20
40
60
80
100
120
ARC+FAB
ARC+BPLRU
ARC+LB-C
LRU-W+FAB
LRU-W+BPLRU
LRU-W+LB-C
Proposed
Wri
te P
age
Red
uctio
n(U
nit:1
000)
Comprehensive Schemes
Host SSD
(f) file server
Figure 2.8: Total Write Page Count Reduction by Different Layers (higher is better).Here, LB-C and LRU-W stand for LB-CLOCK and LRU-WSR respectively.
Both ARC + FAB and LRU-WSR + FAB schemes tend to show lower performance
than others. They exhibit significantly lower performance than the others, particularly
in wdev, web, and file server workloads. To analyze this, we performed another extensive
experiment to compare FAB with other write buffer schemes: FAB vs. BP-LRU, LB-
CLOCK, and WRB. Unlike other workloads where FAB shows decent (2.1% and 1.9%
better in fio zipf and fio pareto workloads) or slightly lower (16.7% lower in the mds
workload) performance, it exhibits remarkably lower performance in wdev, web, and
file server workloads. Specifically, FAB shows 2.1× (wdev), 4.2× (web), and 3.3× (file

29
0 100 200 300 400 500 600 700 800 900
1K 2K 4K 8K 16K 32K 64K
Wri
te P
age
Cou
nt (
Uni
t:100
0)
Cache Size (Pages)
LRUCFLRU
LRU-WSRARC
H-ARC
(a) mds
0 100 200 300 400 500 600 700 800 900
1K 2K 4K 8K 16K 32K 64K
Wri
te P
age
Cou
nt (
Uni
t:100
0)
Cache Size (Pages)
LRUCFLRU
LRU-WSRARC
H-ARC
(b) wdev
0
200
400
600
800
1000
1200
1400
1600
1K 2K 4K 8K 16K 32K 64K
Wri
te P
age
Cou
nt (
Uni
t:100
0)
Cache Size (Pages)
LRUCFLRU
LRU-WSRARC
H-ARC
(c) web
0
20
40
60
80
100
120
1K 2K 4K 8K 16K 32K 64KW
rite
Pag
e C
ount
(U
nit:1
000)
Cache Size (Pages)
LRUCFLRU
LRU-WSRARC
H-ARC
(d) fio zipf
0
20
40
60
80
100
120
1K 2K 4K 8K 16K 32K 64K
Wri
te P
age
Cou
nt (
Uni
t:100
0)
Cache Size (Pages)
LRUCFLRU
LRU-WSRARC
H-ARC
(e) fio pareto
0
50
100
150
200
250
300
350
400
4K 8K 16K 32K 64K 128K 256K
Wri
te P
age
Cou
nt (
Uni
t:100
0)
Cache Size (Pages)
LRUCFLRU
LRU-WSRARC
H-ARC
(f) file server
Figure 2.9: Host-side Main Write Buffer Cache Performance (lower is better). Eachchart shows total SSD write traffic (i.e., write page count) after each scheme processeswrite requests in main memory.
server) lower performance than the others when configured with a 1K page buffer size.
This is the root cause for both ARC + FAB and LRU-WSR + FAB schemes showing
significantly lower performance than other schemes for those workloads, especially with
a smaller buffer size.
Even though each scheme in each different layer cooperatively reduces total SSD
write traffic, investigating respective contributions is also meaningful because there
were no studies exploring it. Figure 2.8 displays total write page count reduction for
each scheme. This stacked column chart presents each scheme’s contribution to total
write traffic reduction in each different layer. As in Figure 2.8, all host-side main buffer

30
cache schemes make a dominant contribution to total write traffic reduction compared
to inside-SSD write buffer schemes: 99.7% (mds), 99.4% (wdev), 99.3% (web), 83.3%
(fio zipf), 79.5% (fio pareto), and 83% (file server) (please note mds, wdev, and web
workloads do not start from 0).
Figure 2.8 also provides performance comparison among inside-SSD write buffer
schemes with the following configurations: 64K numbers of 4K pages host buffer size and
4K numbers of 4K pages SSD buffer size. Since an SSD write buffer cache’s contribution
is not significant, especially in mds, wdev, and web workloads, their Y-axis values do
not begin with 0 in order to magnify SSD write buffer effects. As in Figure 2.8, each
performance gap is not notably as much different as the host-side buffer schemes are.
Moreover, as described before, since the host-side contribution is a dominant factor, in
the following Subsection 2.5.2, we perform deeper experiments and analysis, particularly
for host-side main buffer cache schemes.
Host-side Write Buffer Cache Effect
Figure 2.9 presents host-side write buffer cache performance in main memory. For
more extensive and informative experiments, two more representative schemes are added
in addition to the aforementioned three schemes: LRU [59] and CFLRU [61]. Least
Recently Used (LRU) cache policy is the most representative and widely adopted cache
policy, and Clean First LRU (CFLRU) can be referred to the related work section
(Section 2.3). For objective comparison, the same configurations in [5] are employed.
Among these five schemes, both LRU and ARC focus on cache hit ratio improvement,
and the other three (CFLRU, LRU-WSR, and the proposed H-ARC) concentrate more
on write traffic reduction. Thus, this experiment addresses not only cache hit ratio, but
also write traffic for fairness.
(1) Write traffic
Each chart in Figure 2.9 shows total SSD write traffic (i.e., write page count) after
each scheme processes write requests in main memory. Intuitively, all policies exhibit
better performance as a cache size grows. For instance, H-ARC with 64K pages memory
size in fio pareto workload (Figure 2.9 (e)) generates only 26.9% of write traffic compared
to H-ARC with 1K pages memory size. This is because a larger cache enables each

31
40
45
50
55
60
65
70
75
1K 2K 4K 8K 16K 32K 64K
Cac
he H
it R
atio
(%
)
Cache Size (Pages)
MINLRU
CFLRULRU-WSR
ARCH-ARC
(a) mds
50
60
70
80
90
1K 2K 4K 8K 16K 32K 64K
Cac
he H
it R
atio
(%
)
Cache Size (Pages)
MINLRU
CFLRULRU-WSR
ARCH-ARC
(b) wdev
20
25
30
35
40
45
50
55
1K 2K 4K 8K 16K 32K 64K
Cac
he H
it R
atio
(%
)
Cache Size (Pages)
MINLRU
CFLRULRU-WSR
ARCH-ARC
(c) web
0 5
10 15 20 25 30 35 40 45
1K 2K 4K 8K 16K 32K 64K
Cac
he H
it R
atio
(%
)
Cache Size (Pages)
MINLRU
CFLRULRU-WSR
ARCH-ARC
(d) fio zipf
0
5
10
15
20
25
30
35
40
1K 2K 4K 8K 16K 32K 64K
Cac
he H
it R
atio
(%
)
Cache Size (Pages)
MINLRU
CFLRULRU-WSR
ARCH-ARC
(e) fio pareto
0
10
20
30
40
50
60
70
80
4K 8K 16K 32K 64K 128K 256K
Cac
he H
it R
atio
(%
)
Cache Size (Pages)
MINLRU
CFLRULRU-WSR
ARCH-ARC
(f) file server
Figure 2.10: Cache Hit Ratios of Both Reads and Writes.
scheme to hold more pages in the cache for a longer time. In addition, a larger cache can
provide each scheme with better eviction policy opportunities based on each algorithm,
resulting in a high cache hit ratio as well as low write traffic.
On the contrary, as the cache size decreases, the performance gap among these cache
policies decreases. In fact, with small cache sizes, all cache policies show performance
similar to an LRU scheme. Due to a limited cache space, it is difficult for each scheme to
capture enough information to improve victim choices. However, the proposed H-ARC
exhibits slightly better performance than others, even with the smallest memory size

32
0
10
20
30
40
50
60
70
MIN LRU CFLRULRU-WSR ARC H-ARC
Cac
he H
it R
atio
(%
)
Cache Policies
Read Write
Figure 2.11: Cache Hit Ratios of Trace mds with Cache Size of 16K Pages. The readcache hit ratio and the write cache hit are separated.
configurations: by an average of 1.9% (mds), 0.08% (wdev), 3.9% (web), 2.3% (fio fipf),
0.7% (fio pareto), and 0.7% (file server) respectively.
As the cache size increases (e.g., 16K pages to 64K pages), the performance discrep-
ancy among each scheme increases. Especially, H-ARC significantly reduces SSD write
traffic. For example, in fio zipf and fio pareto workloads, H-ARC with a cache size of
128K pages generates no write traffic (i.e., zero write page count), which implies all
dirty pages are kept in the cache and no dirty page is consequently evicted. Please note
we omit the plots with 128K pages memory size in fio zipf and pareto worklods for plot
space efficiency.
For the three write intensive traces (mds, wdev, and web), with cache size of 16K
pages, for instance, H-ARC shows better performance than other schemes by an average
of 73.8% (LRU), 74.4% (CFLRU), 80.8% (ARC), and 76.2% (LRU-WSR) respectively.
For the three read intensive traces (fio zipf, fio pareto, and file server), with cache size
of 32K pages, for another example, the proposed scheme decreases storage write traffics
by an average of 80.9% (LRU), 82.8% (CFLRU), 83.7% (ARC), and 87.1% (LRU-WSR)
respectively.
(2) Cache hit ratio
This paper considers both reads and writes for cache hit ratio. Figure 2.10 presents
cache hit ratios of each scheme. For reference, MIN algorithm [68] is added. MIN is an
optimal offline cache policy and discards a victim page that will not be referenced for
the longest time in the future. Since looking all future references ahead is impossible,

33
0
5
10
15
20
25
30
35
40
MIN LRU CFLRULRU-WSR ARC H-ARC
Cac
he H
it R
atio
(%
)
Cache Policies
Read Write
Figure 2.12: Cache Hit ratios of Trace fio zipf under Cache Size of 32K Pages. The readcache hit ratio and the write cache hit are separated.
MIN algorithm is not practical. However, it can provide the highest theoretical cache
hit ratio as an optimal offline policy. For better understanding, to magnify performance
effect, Figure 2.10 (a), (b), and (c) do not begin with 0 at Y-axis. As in Figure 2.10, both
H-ARC and ARC achieve the highest cache hit ratios. Unlike other cache policies that
only consider recency information, both H-ARC and ARC consider both frequency and
recency factors. Consequently, they can detect hot pages and cold pages more effectively.
For LRU, CFLRU, and LRU-WSR, their cache hit ratios are almost identical because
they are all fundamentally based on LRU which only considers recency.
Interestingly, in some cases, the proposed H-ARC achieves higher cache hit ratios
than ARC whose main goal is cache hit ratio maximization, not write traffic reduction.
To investigate this, we chose one write intensive workload (i.e., mds with 16K pages)
and made a deeper analysis. Figure 2.11 splits the total cache hit ratio into read and
write cache hit ratio in detail. Although H-ARC shows slightly lower read cache hit
ratio than ARC (2.0% vs. 2.2%), its write cache hit ratio is higher than ARC (54.6%
vs. 50.4%). Consequently, overall cache hit ratio of H-ARC is higher than ARC. On the
other hand, for read intensive workload (e.g., fio zipf), overall cache hit ratio of ARC
is higher than H-ARC because fio zipf workload is read intensive and ARC can achieve
higher read cache hit ratio than H-ARC as shown in Figure 2.12 (12.4% vs. 11.4%)

34
2.6 Conclusion
This paper proposed two novel cooperative buffer cache schemes in different layers (host-
side and SSD-side) for computer systems utilizing Non-Volatile Memories (NVRAM) for
the purpose of SSD write traffic reduction. The main goal of the proposed design is
to extend SSD lifetimes by reducing total SSD write traffic. To meet the goal, we
first propose a novel host-side buffer cache mechanism named Hierarchical Adaptive
Replacement Cache (H-ARC). Unlike existing DRAM-based schemes whose main goal
is to improve cache hit ratios , H-ARC focuses on write traffic reduction as well as
cache hit ratio improvement, thereby considering four factors: dirty, clean, recency, and
frequency. Moreover, H-ARC dynamic features enable H-ARC to effectively adapt to
various workloads.
In addition to the proposed main buffer cache mechanism, we propose an interal
SSD write buffer scheme named WRB. WRB reduced Flash block erasures and write
traffic by exploiting temporal locality and spatial locality. WRB first selected a victim
with the highest block utilization and, only if the page count is over than a predefined
threshold, it evicted the block with highest block utilization. Otherwise, it evicted a
block on the basis of a block-level LRU policy.
To our knowledge, this comprehensive design for SSD lifetime extension is the first
work to simultaneously address both layer. These two cooperative write buffer cache
mechanisms can provide a holistic view of SSD write traffic reduction for NVRAM-based
computer systems. Thus, for fair comparison, we implemented several comprehensive
designs by selecting representative schemes in each layer and combining them. Exper-
imental results with various workloads demonstrated that the proposed design showed
significantly better performance, thereby reducing SSD write traffic by up to 3×.

Chapter 3
An NVRAM-based Buffer Cache
Policy for HDDs
3.1 Introduction
Dynamic random-access memory (DRAM) is the most common technology used for
caching purposes. It is widely deployed in small devices such as laptops, cameras,
cellular phones as well as in large disk arrays. Despite DRAM’s advantages of high
endurance and fast read/write access speed, due to its volatile nature, DRAM suffers
from data loss in the event of power failures or system crashes.
In the last several years, new types of non-volatile memory, such as phase change
memory (PCM), Memristor and STT-MRAM, have rapidly developed into possible
candidates for main memory in future computer systems. The emerging non-volatile
memory technologies may offer other advantages in addition to their non-volatile nature.
For examples, Memristor and PCM can achieve higher density, while Memristor [69] and
STT-MRAM [70] can provide faster read accesses and consume less energy [71] [72].
A typical computer system consists of one or several multi-core CPUs, DRAM as
main memory and hard disk drives (HDDs) as storage. Figure 3.1 shows a promising
system architecture that replaces DRAM with NVRAM as main memory [73]. With
NVRAM as main memory, dirty pages in the buffer cache can be retrievable after power
failures or system crashes. As a result, the frequency of dirty page synchronization from
the buffer cache to storage can be cut down dramatically without jeopardizing data
35

36
consistency [9].
Today HDDs are still the most common storage devices despite the rapid evolution
and expansion of solid state drives. As spinning devices, HDDs’ sequential access speed
for both read and write (on the order of 100MB/s) is orders of magnitude faster than
random access speed (roughly 1MB/s) [8]. The slow random access speed is always a
bottleneck constraining HDDs’ I/O performance. In order to solve the slow random
write problem, two major approaches can be followed: (1) decreasing storage write traf-
fic, and (2) changing random write I/Os to sequential write I/Os. For the first approach,
using NVRAM as main memory gives us opportunities to delay writes to storage. Using
this delayed write property, many buffer cache polices have been designed for SSDs to
increase their lifespan [9] [10]. Our evaluation results show that minimizing storage
writes alone will not significantly improve performance. For the second approach, sev-
eral buffer cache polices try to group many random writes to fewer sequential writes
before issuing them to storage [11] [12]. However, these cache policies are designed for
write buffers and deal with dirty pages only. In this chapter, we develop a buffer cache
policy dealing with both clean pages and dirty pages since our NVRAM will work as
main memory.
To solve the aforementioned HDDs’ random access problem, we present a novel
NVRAM based buffer cache policy, termed I/O-Cache. I/O-Cache dynamically sepa-
rates the whole buffer cache into a clean cache caching all the clean pages and a dirty
cache caching all the dirty pages. To decrease storage writes, we prioritize the dirty
cache more than the clean cache when dynamically resizing these caches. The dynamic
separation enables our cache policy to suit various workloads: read intensive or write
intensive. To improve storage performance when evicting from the dirty cache, instead
of only synchronizing and evicting a single dirty page, I/O-Cache will try to synchro-
nize the longest set of consecutive dirty pages (according to their page numbers) as long
as the length of this longest set of consecutive dirty pages is above a threshold (e.g.,
10). Then one of the pages will be evicted and the rest will be migrated to the clean
cache. If the length of the longest set of consecutive dirty pages is below the threshold,
I/O-Cache will synchronize and evict the least recently used dirty page. The threshold
is very necessary; without it, always choosing the longest set of consecutive dirty pages
from the dirty cache will lead to a low cache hit ratio and bad storage performance.

37
14 Center for Research in Intelligent Storage Confidential: CRIS Member Companies Only
CPU
Non-volatile
Memory
Hard Disk
Drive
Main Memory
Storage
Figure 3.1: System Architecture
When evicting from the clean cache, I/O-Cache will always choose the least recently
used page. We evaluate our proposed schemes with various traces. The experimental
results show that I/O-Cache shortens I/O completion time, decreases write I/Os, and
improves the cache hit ratio compared with existing cache policies.
The structure of this chapter is as follows. In the next section we describe the related
work about cache policies. Section 3.3 gives a detailed description of our proposed buffer
cache policy along with some discussion about system crash recovery. In Section 3.4, we
evaluate the effectiveness of I/O-Cache and discuss the experimental results. Finally,
Section 3.5 provides our conclusions.
3.2 Related Work
Buffer cache policies can be categorized into two types: storage independent cache
policies that try to maximize the cache hit ratio and storage dependent cache policies
that try to improve system performance based on the type of storage devices.
For the first category, storage independent cache policies, Belady’s optimal page
replacement policy leads to the highest cache hit ratio [74]. This algorithm always
discards pages that will not be needed for the longest time into the future. However, due
to the impossibility of predicting an infinite future access pattern, Belady’s algorithm

38
can never be fully implemented. Many proposed cache policies try to increase their
cache hit ratio towards Belady’s theoretical optimal hit ratio.
Recency and frequency are two major parameters to help predict a page’s future
access pattern. The most well-known cache policy depending on recency is the Least
Recently Used (LRU) algorithm, which always evicts the least recently used page. LRU
takes advantage of recency but overlooks frequency. On the other hand, the Least
Frequently Used (LFU) algorithm only depends on frequency, which keeps counting
how many times a page has been accessed and evicts the page with the lowest access
count [75]. Many policies combine frequency and recency together to take advantage of
both methods. For example, Adaptive Replacement Cache (ARC ) [76] splits the whole
cache into two smaller real caches: a recency cache storing pages being accessed once
recently and a frequency cache storing pages being accessed at least twice recently. In
addition, two ghost caches are maintained, one for each real cache. A ghost cache is
a data structure storing only the metadata of recently evicted pages. As a learning
process, each real cache can grow or shrink along with the workload’s tendency to
recency or frequency based on the ghost cache hits.
The second category, storage dependent cache policies, can be further split into
DRAM based, NVRAM based, HDD based and SSD based policies. For DRAM based
policies, due to its volatile nature, in the current Linux operating system, background
threads called “pdflush” automatically synchronize dirty pages periodically to prevent
data loss [77]. To evaluate the impact of this auto synchronization mechanism, we create
a buffer cache policy, named LRU-DRAM, that utilizes basic LRU policy and forces
each dirty page to flush back every thirty seconds (default configuration for pdflush).
With DRAM as main memory, it is difficult to optimize storage writes since dirty pages
are forced to write back, but some work has been done by exploiting storage reads.
Jiang et al. propose a cache policy named DUal LOcality (DULO) taking advantage
of HDDs’ fast sequential read speed and prefetching mechanism to increase system
throughput [78].
NVRAM based cache policies are usually co-designed with either HDDs or SSDs
as storage. With NVRAM as main memory and SSDs as storage, to mitigate SSDs’
wear-out problem and extend their lifespan, many cache policies have been designed to
minimize storage writes by delaying dirty page eviction from NVRAM. For example,

39
Park et al. propose a Clean First LRU (CFLRU ) algorithm which splits the whole cache
into a working region and a clean-first region [10]. The clean-first region is one portion
of the cache near the end of the LRU position. Clean pages will be evicted first from
the clean-first region following an LRU order. Dirty pages will be evicted if no clean
page is left in the clean-first region. Qiu et al. propose a cache policy in NVMFS [9]
which splits the whole cache into two smaller caches: a dirty page cache and a clean
page cache. Each cache will enlarge or shrink based on page hits. Jung et al. enhanced
the LRU algorithm with an add-on page replacement strategy, called Write Sequence
Reordering (LRU-WSR) [79]. To decrease write traffic, they give dirty pages a second
chance by adding a bit to each dirty page to denote whether it is a hot page or a cold
page. Initially, they assume all the dirty pages are hot. If the current eviction candidate
is dirty and hot, they mark it as a cold page and migrate it to the most recently used
(MRU) position. If the current eviction candidate is dirty and cold, or it is clean, it
gets evicted right away. If a cache hit happens to a cold dirty page, it will upgrade to
a hot page and move to the MRU position.
Beyond NVRAM as main memory, NVRAM can also work as a write buffer. As a
dedicated write buffer, no page from read requests are cached. For an example of using
a buffer to decrease flash page writes, Jo et al. propose Flash Aware Buffer management
(FAB). This approach clusters pages in the same block and evicts the pages in a block
with the largest number of pages [80]. If there is a tie, it will evict the largest recently
used cluster. Kang et al. propose a Coldest and Largest Cluster (CLC ) algorithm which
combines FAB and LRU. CLC maintains two lists of clustered pages (sequential pages):
(1) the size-independent cluster list sorted in the LRU fashion to explore temporal
locality for hot clusters; (2) the size-dependent cluster list sorted by cluster size to
explore spatial locality for cold clusters [81]. Initially, CLC inserts pages in the size-
independent list. When the size-independent list is full, CLC moves clusters from the
LRU position of the size-independent list to the size-dependent list. When the size-
dependent list is full, CLC evicts the largest cluster from its tail. Wu et al. propose a
Block-Page Adaptive Cache (BPAC ) to improve upon the CLC approach [82]. BPAC ’s
difference is that it adaptively adjusts the size of each list based on the workload.
With NVRAM as a write buffer for disk arrays, some cache policies try to shift
random storage writes into sequential storage writes. For example, Gill et al. propose

40
two cache policies, Wise Ordering for Writes (WOW ) [11] and Spatially and Tempo-
rally Optimized Write (STOW) [12], that change the order of cached dirty pages from a
strictly CLOCK order to a monotonic CLOCK order to increase HDDs’ write through-
put. Their work is different from ours in that our work will address both clean pages
and dirty pages instead of only dirty pages.
3.3 Our Proposed Approach: I/O-Cache
3.3.1 Approach Overview
To improve HDDs’ I/O performance and increase cache hit ratio for system performance,
we present I/O-Cache. I/O-Cache dynamically separates the whole buffer cache into a
clean real cache storing all the clean pages and a dirty real cache storing all the dirty
pages. To decrease storage writes, we prioritize the dirty real cache more than the clean
real cache during dynamic cache resizing. The dynamic separation enable our cache
policy to suit both read intensive and write intensive workloads. Two ghost caches are
maintained, one for each real cache, to assist with the process of adaptively changing
its size. A ghost cache only stores the page number (metadata) of recently evicted
pages from its corresponding real cache. The size of each cache is the number of pages
stored in it. Physically, the real caches are of a larger capacity than the ghost caches
because real caches store actual data, but when we are discussing cache size we mean
the number of page entries. If we define the maximum real cache size to be L pages,
then the sum of the two real caches (one dirty and one clean) can never be larger than
L pages, and the total number of pages maintained in the two real caches (storing data
and metadata) and two ghost caches (storing only metadata) can never be larger than
2 ∗ L page entries.
To improve storage performance, when evicting from the dirty cache, instead of
only flushing and evicting a single page, I/O-Cache will try to flush the longest set of
consecutive dirty pages (according to page number) as long as the length of this set is
above a threshold (e.g., 10). Then one page will be evicted and the rest of the pages will
be migrated to the clean cache. If the length of the longest set of consecutive dirty pages
is below the threshold, I/O-Cache will flush and evict the least recently used dirty page.
When evicting from the clean cache, I/O-Cache will always choose the least recently

41
used page.
Initially, all the real caches and ghost caches are empty. For every read or write
request r from the workload, one and only one of the three cases will happen:
• Real cache hit.
• Real cache miss, but ghost cache hit.
• Both real and ghost cache misses.
Our cache name notation follows these intuitions: D means dirty, C means clean, sub-
script i means the cached pages are real pages with both data and metadata, and
subscript o means the cached pages are ghost pages with only metadata.
3.3.2 Real Cache Hit
If a page request r is a read request and a cache hit in Ci, this page remains to be a
clean page, so we migrate it from its original location to the most recently used (MRU)
position of Ci. Similarly, if the request r is a read request and a cache hit in Di, this
page remains to be a dirty page, so we migrate it from its original location to the MRU
position of Di.
If the request r is a write request and a cache hit in Ci, this page changes from
a clean page to a dirty page, so we migrate it from its original location to the MRU
position of Di. Since a new page is inserted into Di, we need to update our unique data
structure: sequential list. We will explain why we need this data structure and how it
is updated in the following sections. If the request r is a write request and a cache hit
in Di, this page remains to be a dirty page, so we migrate it from its original location
to the MRU position of Di.
3.3.3 Real Cache Miss, Ghost Cache Hit
For the real cache miss and ghost cache hit case, three steps will happen:
• Adjustment of the desired sizes of the real caches in order to capture the current
workload’s tendency to writes versus reads.

42
• If the cache is full, a page will be evicted from a real cache such that all the real
caches sizes will be balanced towards their desired sizes.
• Insert the new page into its corresponding real cache.
First, we need to decide the desired size for Di, denoted as Di, and the desired size
for Ci, denoted as Ci. Here, we use an integer P to represent the size of Ci. Again,
we use L to denote the maximum real cache size in terms of page entries as used in
Section 3.3.1. Thus,
Ci = P (3.1)
Di = L− P (3.2)
If a ghost page hit happens in Co, it means previously we should not have evicted this
clean page out of the real cache. To remedy this, we will enlarge Ci. Every time there
is a ghost hit at Co, Ci (or P ) will be increased by one page. According to Equation
(3.2), Di will be decreased by the same amount. Note that P can never be larger than
L. The equation of P adjustment is shown below:
P = min{P + 1, L} (3.3)
On the other hand, if a ghost hit happens in Do, it means previously we should not
have evicted this dirty page out of the real cache. To remedy this, we will enlarge Di.
In order to save write traffic and keep dirty pages in the cache longer, rather than the
increment used with Ci, we enlarge Di much faster. If the size of Co is smaller than
Do, Di will be increased by two. If the size of Co is greater than or equal to Do, Di
will be increased by two times the quotient of the cache sizes of Co and Do. Thus, the
smaller the size of Do, the larger the increment. According to Equation (3.1), Ci will
be decreased by the same amount. Again, the combined size of Ci and Di can never be
larger than L, and P cannot be smaller than 0. The equation of P adjustment is shown
below:

43
P =
{max{P − 2, 0} if |Co| < |Do|max{P − 2 ∗ |Co|
|Do| , 0} if |Co| ≥ |Do|(3.4)
After all the desired cache size adjustments, we call the Eviction & Balance (EB)
algorithm to evict a real page out if the real caches are full. Note that if the real caches
are not full, all the ghost caches will be empty since a ghost page will be generated only
after a real page eviction. The EB algorithm will be introduced in Section 3.3.5.
Finally, we will insert the page into the MRU position of Ci if it is a read request
or Di if it is a write request. If we insert the page to Di, the sequential list needs to be
updated accordingly. Lastly, the hit ghost page will be deleted.
3.3.4 Both Real and Ghost Cache Misses
The last case is when a request r misses in both real caches and ghost caches. When
the real caches are not full, we can simply insert the page into the MRU position of Ci
if r is a read request, or into the MRU position of Di if r is a write request. For the
case of dirty page insertion to Di, the sequential list needs to be updated accordingly.
When the real caches are full, we need to evict a real page out of cache to reclaim
space for the new page insertion. At the same time, we try to equalize the size of D and
C. The reason for this equalization is that we want to avoid “cache starvation.” “Cache
starvation” can happen in I/O-Cache if one real cache size and its corresponding ghost
cache size are both very large. Then, the other real cache size must be very small as
well as its corresponding ghost cache size. In this situation, the side with the smaller
ghost cache size has difficulty enlarging in a short duration, even if the current workload
favors it, since fewer ghost cache hits can happen.
To achieve the goal of equalization, we will check the size of C (i.e., the total number
of page entries in both the clean real cache and clean ghost cache combined). If the
size of C is greater than L, which means it already takes more than half of the total
available cache entries including both real and ghost caches (i.e., 2 ∗ L), then we will
evict from this side. Otherwise, we will evict from D.
When we actually perform an eviction from a region, e.g., C, we will evict the LRU
page in its ghost cache and call the EB algorithm to evict a real page. The reason for

44
Key Value
1 3
5 4
16 7
30 20
55 32
Key Value
1 3
5 4
16 7
30 20
(a) Dirty cache flushing and evic-tion
Key Value
1 3
5 4
16 7
30 20
55 32
Key Value
1 3
5 4
16 7
30 20
55 32
100 1
(b) Dirty page insertion with pagenumber 100
Key Value
1 3
5 4
16 7
30 20
55 32
Key Value
1 3
5 4
15 8
30 20
55 32
(c) Dirty page insertion with pagenumber 15
Key Value
1 3
5 4
16 7
30 20
55 32
Key Value
1 3
5 4
16 8
30 20
55 32
(d) Dirty page insertion with pagenumber 23
Key Value
1 3
5 4
16 7
30 20
55 32
Key Value
1 8
16 7
30 20
55 32
(e) Dirty page insertion with pagenumber 4
Figure 3.2: Sequential list update operations. Key is the beginning page number ofconsecutive dirty pages. Value is the length of the consecutive dirty pages.
evicting a ghost page out first is when the EB algorithm evicts a real page, this page
needs to be inserted into its corresponding ghost cache.
Finally, after a real page eviction, a free page slot is reclaimed and we can insert the
new page into the MRU position of Ci if r is a read request, or into the MRU position
of Di if r is a write request. If we insert the page to Di, the sequential list needs to be
updated accordingly.

45
3.3.5 Cache Eviction & Balance Algorithm
In the last two cases, a new page needs to be inserted into the real cache. In case the
real caches are full, we need to evict a page out of cache to reclaim space for this new
page. We design an Eviction & Balance (EB) algorithm to evict a real page and to
balance the real cache sizes towards their desired sizes. With the defined P , we can
easily calculate the desired size of Ci and Di though Equations (3.1) and (3.2). After
obtaining Ci and Di, we compare them with each real cache’s actual size. We will evict
from the real cache whose actual size is larger than its desired size.
Specifically, if the size of Ci is larger than or equal to Ci and the request r is in Do,
we will evict a page from Ci. Otherwise, we will evict a page from Di. When evicting
from Ci, we will evict the LRU page out from Ci and insert its page number into the
MRU position of Co. Contrary to evicting from Ci, when evicting from Di, we will first
try to synchronize the longest set of consecutive dirty pages in Di (with the help of the
sequential list), evict the leading page out (i.e., the page with smallest page number of
these synchronized pages) and migrate the rest of them to the LRU end of Ci. However,
to execute this series of operations, we have to make sure the length of the longest set
of consecutive dirty pages is above a given threshold (e.g., 10). If its length is below the
threshold, we will evict the LRU page out from Di. In either case, we will insert the
evicted page’s page number into the MRU position of Do. Since a dirty page is evicted
out of Di, we need to update the sequential list accordingly. The sequential list is a
data structure to accelerate the process of finding the longest set of consecutive dirty
pages (detail in Section 3.3.6).
As a comparison, a similar algorithm could evict from Di without using the afore-
mentioned threshold mechanism and flush the longest set of consecutive dirty pages all
the time. We call this cache policy Longest. Intuitively, Longest should outperform I/O-
Cache since Longest could “fully utilize” HDDs’ fast sequential write speed. However,
through evaluation, Longest leads to a low cache hit ratio and bad storage performance
as shown in Figure 3.3 and Figure 3.6. We will explain the reason in Section 3.4.

46
3.3.6 Sequential List
The sequential list is designed to accelerate identification of the longest set of consecutive
dirty pages in Di. The sequential list is a key-value store where each entry’s key is the
beginning page number of some consecutive dirty pages and its value is the length (i.e.,
a count) of those consecutive dirty pages. For example, dirty pages in Di with page
numbers 3, 4, 5, 6 will be stored as (3, 4) in the sequential list. Note that the sequential
list only introduces negligible space overhead compared with real buffer cache pages.
A dirty page insertion, a dirty page synchronization, or a consecutive dirty pages
synchronization will trigger sequential list updates. For a dirty page synchronization or
consecutive dirty pages synchronization, the corresponding entry containing that page
or those pages will be deleted. For a dirty page insertion, if the dirty page has no
consecutive neighbors in Di, a new entry is created and inserted to the sequential list. If
the dirty page is consecutive to one or some cached dirty pages, the corresponding entry
will be updated accordingly. Some examples of the sequential list update operations are
shown in Figure 3.2.
3.3.7 System Consistency and Crash Recovery
System crashes are inevitable, hence it is always an important issue in designing a
consistent system that can recover quickly. Since I/O-Cache may delay dirty page
synchronization, the chance of many dirty pages staying in the cache after system crashes
will be high. Here, we propose two simple solutions facing two different kinds of system
failures.
When facing system crashes or unexpected power failures, we have to reboot the
whole system. In order to make sure the system will be consistent, all the dirty pages
will be flushed back to storage through the following steps. The boot code needs to
be modified such that the page table will be well retained regardless of the crashes.
Then, identify all the cached dirty pages from the page table, and synchronize them to
the storage immediately. Finally, reinitialize the page table and continue the regular
booting process.
When facing hardware failures, the dirty pages in NVRAM may not be recoverable.
To mitigate the risk of losing data, we add a timer to each dirty page so that a dirty

47
page must be flushed back after a certain time elapses. For example, after a page is
updated for one hour, it will be forced to be written to the storage and become a clean
page.
3.4 Evaluation
In this section, we evaluate our proposed NVRAM based buffer cache policy along with
several existing policies as listed below (detailed policy descriptions can be found in
Section 3.2):
• LRU : Least Recently Used cache policy.
• LRU-DRAM : Mimicking DRAM based Least Recently Used cache policy with
dirty page synchronization every 30 seconds.
• CFLRU : Clean First LRU cache policy. 10% of the cache space near the LRU
position is allocated as the clean-first region, same configuration as used in [79].
• LRU-WSR: Least Recently Used-Writes Sequence Reordering cache policy.
• Longest : Our proposed comparison cache policy which always flushes longest set
of consecutive dirty pages from its dirty cache (detailed algorithm description can
be found in Section 3.3.5).
• I/O-Cache: Our proposed I/O-Cache cache policy with a threshold of 10 (empir-
ical number).
3.4.1 Experimental Setup
To evaluate our proposed buffer cache policy, we compare I/O-Cache with existing work
in terms of cache hit ratio, I/O completion time, storage write number in pages and
storage write number in I/Os. A high cache hit ratio not only improves the system
performance but also reduces storage writes to HDDs. With a similar cache hit ratio,
the number of I/Os and their sizes can greatly influence the total I/O completion time.
To acquire the cache hit ratio and storage write number in pages, we have implemented
I/O-Cache along with other comparison cache policies on the Sim-ideal, a multi-level

48
16Center for Research in Intelligent Storage CRIS Confidential
webproxy
0
500000
1000000
1500000
2000000
2500000
1K 2K 4K 8K 16K 32K
IO C
om
ple
tio
n T
ime
(MS
)
Cache Size (Pages)
LRU LRU-DRAM CFLRU LRU-WSR Longest I/O-CACHE
(a) Web Proxy
4Center for Research in Intelligent Storage CRIS Confidential
Rsrch
0
2000000
4000000
6000000
8000000
10000000
12000000
1K 2K 4K 8K 16K 32K
IO C
om
ple
tio
n T
ime
(MS
)
Cache Size (Pages)
LRU LRU-DRAM CFLRU LRU-WSR Longest I/O-CACHE
(b) rsrch 0
8Center for Research in Intelligent Storage CRIS Confidential
src2
0
1000000
2000000
3000000
4000000
5000000
6000000
7000000
8000000
1K 2K 4K 8K 16K 32K
IO C
om
ple
tio
n T
ime
(MS
)
Cache Size (Pages)
LRU LRU-DRAM CFLRU LRU-WSR Longest I/O-CACHE
(c) src2 0
12Center for Research in Intelligent Storage CRIS Confidential
wdev
0
1000000
2000000
3000000
4000000
5000000
6000000
7000000
8000000
1K 2K 4K 8K 16K 32K 64K
IO C
om
ple
tio
n T
ime
(MS
)
Cache Size (Pages)
LRU LRU-DRAM CFLRU LRU-WSR Longest I/O-CACHE
(d) wdev 0
Figure 3.3: I/O completion time including both storage reads and storage writes.
caching simulator. The Sim-ideal simulator is developed within our research group with
years of efforts and we have made it available here [83] to the public. The I/O completion
time and storage write number in I/Os are acquired from the DiskSim [84] simulator.
For the experiments, we configure the size of a memory page to be 4 KB. For DiskSim,
we use a Seagate Cheetah 15K.5 hard drive as the HDD model.
We use two types of traces for evaluation. The first type is MSR Cambridge traces
shared from SNIA [85] and provided by Narayanan et al. [86]. MSR Cambridge traces
consist of 36 volumes containing 179 disks from 13 Microsoft enterprise servers with
different purposes for one week. These traces are classified into 13 categories based on
server types. Each category consists of two or three traces. These traces represent data
accesses from a typical enterprise data center. For space efficiency, we show the results

49
14Center for Research in Intelligent Storage CRIS Confidential
webproxy
0
10000
20000
30000
40000
50000
60000
70000
1K 2K 4K 8K 16K 32K
Wri
te C
ou
nt
(Pa
ges
)
Cache Size (Pages)
LRU LRU-DRAM CFLRU LRU-WSR Longest I/O-CACHE
(a) Web Proxy
2Center for Research in Intelligent Storage CRIS Confidential
Rsrch
0
500000
1000000
1500000
2000000
2500000
3000000
1K 2K 4K 8K 16K 32K
Wri
te C
ou
nt
(Pa
ges
)
Cache Size (Pages)
LRU LRU-DRAM CFLRU LRU-WSR Longest I/O-CACHE
(b) rsrch 0
6Center for Research in Intelligent Storage CRIS Confidential
src2
0
500000
1000000
1500000
2000000
2500000
1K 2K 4K 8K 16K 32K
Wri
te C
ou
nt
(Pa
ges
)
Cache Size (Pages)
LRU LRU-DRAM CFLRU LRU-WSR Longest I/O-CACHE
(c) src2 0
10Center for Research in Intelligent Storage CRIS Confidential
wdev
0
200000
400000
600000
800000
1000000
1200000
1400000
1600000
1800000
1K 2K 4K 8K 16K 32K 64K
Wri
te C
ou
nt
(Pa
ges
)
Cache Size (Pages)
LRU LRU-DRAM CFLRU LRU-WSR Longest I/O-CACHE
(d) wdev 0
Figure 3.4: Storage write count in pages.
of three traces, rsrch 0, src2 0 and wdev 0, since their results have similar patterns.
The second type of trace is a synthetic workload generated by a popular benchmark:
Filebench [87]. Since MSR Cambridge traces are block I/O traces that have been seen
by storage, in order to show the effect of traces that are seen by main memory, we have
to generate them ourselves. To achieve this goal, for Filebench, we enable the directI/O
option. DirectI/O enables the read/write requests to bypass main memory and go to
storage devices directly. Then we collect the traces using Linux blktrace. In this way,
even though we collect the traces from the storage layer, their actual access pattern is
close to accessing main memory. We select a popular model, Web Proxy, as the profile
for Filebench to generate our trace. Table 3.1 describes these traces in detail.

50
15Center for Research in Intelligent Storage CRIS Confidential
webproxy
0
10000
20000
30000
40000
50000
60000
70000
1K 2K 4K 8K 16K 32K
Wri
te C
ou
nt
(IO
s)
Cache Size (Pages)
LRU LRU-DRAM CFLRU LRU-WSR Longest I/O-CACHE
(a) Web Proxy
3Center for Research in Intelligent Storage CRIS Confidential
Rsrch
0
500000
1000000
1500000
2000000
2500000
1K 2K 4K 8K 16K 32K
Wri
te C
ou
nt
(IO
s)
Cache Size (Pages)
LRU LRU-DRAM CFLRU LRU-WSR Longest I/O-CACHE
(b) rsrch 0
7Center for Research in Intelligent Storage CRIS Confidential
src2
0
200000
400000
600000
800000
1000000
1200000
1400000
1600000
1800000
1K 2K 4K 8K 16K 32K
Wri
te C
ou
nt
(IO
s)
Cache Size (Pages)
LRU LRU-DRAM CFLRU LRU-WSR Longest I/O-CACHE
(c) src2 0
11Center for Research in Intelligent Storage CRIS Confidential
wdev
0
200000
400000
600000
800000
1000000
1200000
1400000
1K 2K 4K 8K 16K 32K 64K
Wri
te C
ou
nt
(IO
s)
Cache Size (Pages)
LRU LRU-DRAM CFLRU LRU-WSR Longest I/O-CACHE
(d) wdev 0
Figure 3.5: Storage write count in I/Os.
3.4.2 System I/O Performance
In order to capture total I/O completion time including both storage reads and writes,
we need to get storage I/O traces (called TO) for DiskSim from the input traces (called
TI) that feed into Sim-ideal. We will describe how to generate TO from TI in the
following paragraphs. Each I/O request in TI includes a request type (read or write),
logical block address (LBA), size of the request, and timestamp of the request being
generated. Similar attributes are used to describe each I/O request in TO.
For LRU-DRAM policy, two conditions can trigger storage writes: periodical dirty
page synchronization and dirty page eviction. For each trace, TI , we use the first entry’s
timestamp in TI as the initial time. Cached dirty pages will be flushed to storage no

51
13Center for Research in Intelligent Storage CRIS Confidential
webproxy
0.00%
10.00%
20.00%
30.00%
40.00%
50.00%
60.00%
70.00%
80.00%
90.00%
100.00%
1K 2K 4K 8K 16K 32K
Ca
che
Hit
Ra
tio
Cache Size (Pages)
LRU LRU-DRAM CFLRU LRU-WSR Longest I/O-CACHE
(a) Web Proxy
1Center for Research in Intelligent Storage CRIS Confidential
Rsrch
0.00%
10.00%
20.00%
30.00%
40.00%
50.00%
60.00%
70.00%
80.00%
90.00%
100.00%
1K 2K 4K 8K 16K 32K
Ca
che
Hit
Ra
tio
Cache Size (Pages)
LRU LRU-DRAM CFLRU LRU-WSR Longest I/O-CACHE
(b) rsrch 0
5Center for Research in Intelligent Storage CRIS Confidential
src2
0.00%
10.00%
20.00%
30.00%
40.00%
50.00%
60.00%
70.00%
80.00%
90.00%
100.00%
1K 2K 4K 8K 16K 32K
Ca
che
Hit
Ra
tio
Cache Size (Pages)
LRU LRU-DRAM CFLRU LRU-WSR Longest I/O-CACHE
(c) src2 0
9Center for Research in Intelligent Storage CRIS Confidential
wdev
0.00%
10.00%
20.00%
30.00%
40.00%
50.00%
60.00%
70.00%
80.00%
90.00%
100.00%
1K 2K 4K 8K 16K 32K 64K
Ca
che
Hit
Ra
tio
Cache Size (Pages)
LRU LRU-DRAM CFLRU LRU-WSR Longest I/O-CACHE
(d) wdev 0
Figure 3.6: Cache hit ratio of both reads and writes.
longer than thirty seconds after they become dirty. These storage writes are set with
the timestamp as the time being flushed and they are included in TO. Meanwhile, if a
page insertion triggers a dirty page eviction at time t, the evicted dirty page needs to
be written to storage with a new timestamp t, and this I/O request becomes part of TO.
For all the other policies, pages will only be synchronized during dirty page eviction.
Similarly, if a new page insertion triggers a dirty page (or a sequence of consecutive dirty
pages) synchronization at time t, this will create a new storage write with timestamp t
in TO. For storage reads, whenever a buffer cache miss happens, a storage read request
will be inserted into TO with the timestamp of the requested page.
After all the entries from TI have been processed and a complete trace of TO is
created, we feed TO to DiskSim to calculate the total I/O completion time. The total

52
I/O completion time is calculated as total time of run minus total disk idle time.
Figures 3.3 shows I/O completion time for different buffer cache policies under var-
ious cache sizes and traces. The x axis denotes the cache size in pages. The y axis
denotes the I/O completion time in milliseconds. Across four traces, one observation
is that for each policy, the bigger the cache size, the shorter the I/O completion time.
For example, in trace Web Proxy as shown in Figure 3.3(a), the I/O completion time
of I/O-Cache under a cache size of 32K pages is only 9.08% of that under a cache size
of 1K pages; the I/O completion time of LRU under a cache size of 32K pages is only
13.77% of that under a cache size of 1K pages. For LRU, LRU-DRAM, CFLRU and
LRU-WSR, the reason is two-fold: (1) with a larger cache size, pages can be held in
the cache for a longer time before eviction; (2) with a larger cache size, better page
eviction choices can be made to increase the cache hit ratio and decrease the storage
I/Os. For I/O-Cache, a third reason for this improved performance is a larger cache
size gives higher chances that longer sets of consecutive dirty pages can be flushed to
exploit HDDs’ fast sequential access speed. For Longest, we will discuss its “bipolar”
performance later.
Another observation is that I/O-Cache shortens I/O completion time significantly
compared with other policies. For trace rsrch 0, I/O-Cache shortens I/O completion
time to 74.3%, 73.4%, 73.8%, 74.3%, and 51.4% on average, and up to 49.1%, 49.9%,
49.3%, 49.3%, and 25.7% compared with LRU, LRU-DRAM, CFLRU, LRU-WSR, and
Longest, respectively. For trace wdev 0, I/O-Cache shortens I/O completion time to
78.3%, 69.8%, 78.2%, 78.5%, and 70.4% on average, and up to 56.1%, 52.7%, 56.2%,
56.3%, and 31.8% compared with LRU, LRU-DRAM, CFLRU, LRU-WSR, and Longest,
respectively.
To discover the reason why I/O-Cache can improve storage performance dramati-
cally, we plot two additional experimental results: storage write count in I/Os as shown
Table 3.1: Trace CharacteristicsTrace Name Total Requests Unique Pages Read/Write Ratio
Web Proxy 795,462 76,915 1:0.09rsrch 0 3,044,209 87,601 1:10.1src2 0 2,881,834 178,582 1:7.30wdev 0 2,368,194 128,870 1:3.73

53
in Figure 3.5 and storage write count in pages as shown in Figure 3.4. From Figure 3.4,
we can see that LRU-DRAM and Longest generate many more storage writes. For LRU-
DRAM, the reason is the periodical dirty page synchronization. For Longest, the reason
is a low cache hit ratio, which will be shown in Figure 3.6. Figure 3.4 also shows that
I/O-Cache, LRU, CFLRU, and LRU-WSR have mostly overlapping page write counts.
This indicates I/O-Cache’s great storage performance does not come from merely re-
ducing storage page writes. Figure 3.5 shows that I/O-Cache decreases storage write
I/Os dramatically. This demonstrates that I/O-Cache can successfully regroup many
short random write I/Os into fewer sequential write I/Os, which HDDs can finish much
faster.
3.4.3 Cache Hit Ratio
Cache hit ratios (in percentages) are total hit ratios including both read and write. The
cache hit ratios of these policies are shown in Figure 3.6. Obviously, with a larger cache
size, each cache policy achieves a higher cache hit ratio. For all four traces I/O-Cache
achieves the highest average cache hit ratio. In some cases, for example the Web Proxy
trace with a cache size of 8K pages, I/O-Cache can increase the cache hit ratio as
significantly as 13.21% compared with LRU.
Longest has a very low cache hit ratio. Longest always flushes the longest set of
consecutive dirty pages from the dirty cache, which leads to an inevitable situation
where there are no more consecutive dirty pages. We call the beginning of this situation
“bad time.” Following this state, if a newly inserted dirty page is consecutive with an
existing dirty page, they will become the longest set of consecutive dirty pages. Per the
policy, they will be the next to be flushed and one of them will be evicted. However,
the newly inserted dirty page is fairly hot and should not be evicted so early. To solve
this problem, I/O-Cache utilizes a threshold as mentioned in Section 3.3.5. Referring
back to Longest ’s storage performance as shown in Figure 3.3, it performs quite poorly
when the cache size is small. This is because the cache cannot accumulate too many
consecutive dirty pages before reaching “bad time.” When the cache size becomes larger,
we find that Longest can perform comparably with the others since “bad time” has not
yet been reached.
The reason that I/O-Cache’s cache hit ratio is higher than LRU ’s is due a “cache

54
de-pollution” effect. The buffer cache tends to be polluted by long sequential accesses,
such as file copying and system scanning, which might be only accessed once for a
long period of time and have poor temporal locality. Keeping this kind of pages in
the cache might end up evicting more valuable pages. As a result, the cache hit ratio
will drop. Our proposed method, by flushing long sets of consecutive dirty pages and
migrating them to the LRU end of the clean cache for future eviction, provides more
opportunities to cache random pages longer. Similarly, Yang et al. propose a cache
policy that excludes very long sets of sequential pages from being accepted into the
cache. Their approach actually prevents cache pollution in the first place and increases
cache hit ratio [88]. Note that Yang’s policy does not contradict with ours, since cached
short sets of consecutive pages can be accumulated into long sets of consecutive pages.
Our experiments show that this regrouping does happen.
3.5 Conclusion
In this chapter, we have presented a novel non-volatile memory based buffer cache policy,
I/O-Cache. Our approach uses NVRAM to cache dirty pages longer than traditional
DRAM caches, and it regroups and synchronizes long sets of consecutive dirty pages to
take advantage of HDDs’ fast sequential access speed. Additionally, to decrease storage
writes, I/O-Cache can dynamically split the whole cache into a dirty cache and a clean
cache according to the workload’s tendency for read or write requests. The performance
of I/O-Cache is evaluated with various traces. The results show that our proposed cache
policy shortens I/O completion time, decreases I/O traffic, and increases the cache hit
ratio compared with existing work.

Chapter 4
A Cooperative Hybrid Caching
System for Storage Arrays
4.1 Introduction
Due to the rapidly evolving non-volatile memory (NVRAM) technologies such as 3D
XPoint [56], NVDIMM [43], and STT-MRAM [54], hybrid memory systems that utilize
both NVRAM and DRAM technologies have become promising alternatives to DRAM-
only memory systems [89].
Storage systems can also benefit from these new hybrid memory systems. As an
example, Figure 4.1 shows the storage systems can be a storage server, storage controller,
or any part of a data storage system that contains a hybrid memory cache. Storage
systems typically rely on DRAM as a read cache due to its short access latency. To
hide lengthy I/O times, reduce write traffic to slower disk storage, and avoid data loss,
storage system write buffers can use NVRAM.
Buffer cache policies have been studied for decades. They mostly examine main
memory buffer cache strategies, e.g., LRU [90], ARC [30], and CLOCK-DWF [91]. Mul-
tilevel buffer cache studies focus on read performance, e.g., MQ [92] and Karma [93],
or separately managed NVRAM as write buffers and DRAM as read caches, e.g., Ne-
tApp ONTAP caching software [94]. However, cooperative hybrid buffer cache policies
that combine newer NVRAM technologies with DRAM targeted specifically for storage
systems have not been well studied.
55

56
Application
OS
Buffer/Cache
Storage Area Network (SAN)
DRAM NVRAM
Application, web or database servers
Application
OS
Buffer/Cache
Application
OS
Buffer/Cache
… …
Hibachi Cache
Figure 4.1: Overall System Architecture
To gain hybrid buffer cache design insights, we make an elaborate study of storage
system I/O workloads. These storage system level I/O workloads are very different
from server-side I/O workloads due to server-side buffer/cache effects. We evaluate and
analyze the impact of different NVRAM sizes, access latencies, and cache design choices
on storage performance. Based on these key observations, we propose a novel coopera-
tive HybrId NVRAM and DRAM Buffer cACHe polIcy for storage disk arrays, named
Hibachi. Hibachi transcends conventional buffer cache policies by 1) distinguishing read
cache hits from write cache hits to improve both read and write hit rates; 2) learning
workload tendencies to adjust the page caching priorities dynamically to shorten page
access latencies; 3) regrouping cached dirty pages to transform random writes to se-
quential writes to maximize I/O throughput; and 4) using accurate and low-overhead
page reuse prediction metrics customized for storage system workloads.
We evaluate Hibachi with real block I/O traces [65, 85] on both simulators and disk
arrays. Compared to traditional buffer cache policies, Hibachi substantially improves
both read and write performance under various storage server I/O workloads: up to

57
1 4 16 64 256 1K 4K 32K0
20000
40000
60000
80000
100000
Temporal Distance
Num
ber
of A
cces
ses
(a) web 0 read after read
1 4 16 64 256 1K 4K 32K0
50000
100000
150000
200000
250000
Temporal Distance
Num
ber
of A
cces
ses
(b) web 0 write after write
1 4 16 64 256 1K 4K 32K0
3000
6000
9000
12000
15000
Temporal Distance
Num
ber
of A
cces
ses
(c) web 0 read after write
1 4 16 64 256 1K 4K 32K0
40000
80000
120000
160000
200000
Temporal Distance
Num
ber
of A
cces
ses
(d) web 0 write after read
Figure 4.2: Temporal distance histograms of a storage server I/O workload. Four figuresrepresent temporal distance in terms of a read request after the same read request, writeafter write, read after write, and write after read.
a 4× read hit rate improvement, up to an 8.4% write hit rate improvement, and up
to a 10× write throughput improvement. We believe our work shows the potential of
designing better storage system hybrid buffer cache policies and motivates future work
in this area.
The structure of this chapter is as follows. Section 4.2 provides our observations
on storage system workload studies. Section 4.3 discusses the impact of NVRAM on
cache performance and cache design choices. Section 4.4 gives a detailed description
of our proposed cooperative hybrid buffer cache policy followed by an evaluation in
Section 4.5. In Section 4.6, we present some related work about NVRAM and caching
policies. Finally, Section 4.7 concludes our work.

58
1 4 16 64 256 1K 4K 16K 64K0
20
40
60
80
100
Frequency
Percentage of blocks Percentage of accesses
(a) web 0 read and write
1 2 4 8 32 128 512 2K 8K0
20
40
60
80
100
Frequency
Percentage of blocks Percentage of accesses
(b) web 0 read only
1 4 16 64 256 1K 4K 16K 64K0
20
40
60
80
100
Frequency
Percentage of blocks Percentage of accesses
(c) web 0 write only
Figure 4.3: Access and block distributions for various frequencies. Three figures showfrequency in terms of combined read and write requests, read requests only, and writerequests only. For a given frequency, the blocks curve shows the percentage of the totalnumber of blocks that are accessed at least that many times, and the accesses curveshows the percentage of the total number of accesses that are to blocks accessed at leastthat many times.
4.2 Storage System Workload Properties
Storage system workloads are very different from server-side workloads. Zhou et al. [92]
claimed temporal locality (recency) is notably poor in storage level (second level) work-
loads since the server-side buffer caches filter out the majority of recent same data
requests. At the storage system level, frequency, which is the total number of times the
same data is accessed over a longer period, can more accurately predict a page’s reuse
probability.
This work simultaneously considers both the read cache and write buffer by expand-
ing prior workload characterization work to examine both read access patterns and
write access patterns instead of only focusing on read patterns. The temporal distance
is measured as the number of unique page or block requests between one request and the

59
same request in the future. We examine temporal distances in terms of a read request
after the same read request, a write after write, a read after write, and a write after
read of the same data. Frequency, a different measurement, shows whether a majority
of accesses are concentrated within a small portion of blocks (which are ideal pages
to buffer) in terms of combined read and write requests, read requests only, and write
requests only. The detailed temporal distance and frequency calculation method can be
found in Zhou’s work [92].
Though we analyze many traces, we choose one representative, web 0, from the
MSR Traces to demonstrate our findings (other traces show similar patterns). web 0
is a one-week block I/O trace captured from a Microsoft enterprise web server [65, 85].
Figure 4.2 presents our workload analysis results for temporal distance. Figure 4.3
presents our workload analysis results for frequency. The majority of read after read
accesses (Figure 4.2(a)) have a large distance, which means poor temporal locality or
recency. However, in contrast to previous work that used different traces, we found that
a large number of write after write temporal distances (Figure 4.2(b)) are short, which
shows strong recency (likely due to the server-side forced synchronization). For read
after write (Figure 4.2(c)) and write after read (Figure 4.2(d)), recency properties are
no better than read after read. Note that the total number of read after write requests
is very small compared to the other types of requests.
For frequency of mixed read and write (Figure 4.3(a)), read only (Figure 4.3(b)), and
write only (Figure 4.3(c)), the wide areas between the two percentage curves indicate
that most accesses are concentrated within a few blocks. This implies both read and
write requests show good frequency and can be optimized with an appropriate caching
policy.
4.3 Insight and Discussion
Because of their non-volatility, NVRAM write buffers can minimize write traffic by
reducing and delaying dirty page synchronization. To demonstrate their effectiveness of
write traffic reduction compared to a DRAM-only buffer cache, we conduct some simple
experiments. As a baseline, we consider a fixed-size, DRAM-only buffer cache that
periodically flushes dirty pages to persistent storage (disk) similar to Linux’s “pdflush”

60
Rsrch write deduction
00.10.20.30.40.50.60.70.80.91
0 4MB 8MB 16MB 32MB 64MB 128MB 256MB
Normalize
d Write Ra
te
NVRAM Size
DRAM Size = 256 MB
Figure 4.4: NVRAM impact on storage write traffic.
threads functionality. Next, we add different amounts of NVRAM to work with the
DRAM. For simplicity and a fair comparison, both NVRAM and DRAM adopt the
LRU replacement policy. NVRAM caches dirty pages which are evicted only when the
NVRAM’s capacity is reached. Figure 4.4 shows one example of our experiments with
the MSR rsrch 0 trace. Compared to the DRAM-only buffer cache, adding NVRAM
that is as little as 1.56% of the amount of DRAM can reduce write traffic by 55.3%.
This huge impact is mostly caused by strong write request recency in the storage server
I/O workload.
Currently, the access latency of most NVRAM technologies is several times longer
than DRAM’s. When NVRAM is used to buffer dirty pages, a read hit on a dirty
page needs to access NVRAM. This is slower than reading the page from DRAM. This
leads to a question about the trade-off between page migration and page replication
policies. If we choose a page replication mechanism, a read hit in NVRAM could
trigger a page copy from NVRAM to DRAM. We could gain read performance if the
page is later accessed multiple times. But if not, one page of cache space in DRAM is
wasted. On the other hand, if we choose page migration (which means a single page
can never exist in both NVRAM and DRAM), no space is wasted, but there is a risk
of longer average read access latency if there are updates between reads that bring the
page back to NVRAM. We execute another experiment to compare page migration vs.
page replication performance. For storage server I/O workloads, we found that page

61
replication causes a lower cache hit ratio and does not improve read performance. As
Section 4.5.2 will show, this result is because read hits occur mostly in DRAM and
rarely in NVRAM. Therefore, we choose page migration for our storage system buffer
cache design.
4.4 Hibachi: A Hybrid Buffer Cache
Due to the different performance characteristics of NVRAM and DRAM, Hibachi utilizes
DRAM as a read cache for clean pages and NVRAM mostly as a write buffer for dirty
pages. However, our four main design factors (described in Section 4.4.2 through 4.4.5)
significantly improve Hibachi.
4.4.1 Architecture
Figure 4.5 presents our proposed Hibachi architecture. Hibachi largely consists of two
real caches and two ghost caches. The clean cache manages all the clean pages in
DRAM and NVRAM (possibly), and the dirty cache keeps track of all the dirty pages
in NVRAM. The ratio between the clean cache and the dirty cache capacity (i.e., black
arrow in the figure) dynamically adjusts according to the current workload’s tendency
assisted by the two ghost caches. For example, some NVRAM space can be borrowed
as an extension of the clean cache to cache hot clean pages. Unlike the real caches,
the clean ghost cache and the dirty ghost cache only maintain metadata (i.e., page
numbers) of recently evicted pages, not real data. A recency-based policy such as LRU
(Least Recently Used) manages the dirty cache and a frequency-based cache policy
such as LFU-Aging (Least Frequently Used with Aging) [95] manages the clean cache.
The following section (Section 4.4.2) describes the rationale for adopting these two
different policies. Each data page in both real caches maintains a counter. Clean page
counters record their access frequencies and dirty page counters are used for migration
purposes. To further improve write performance, Hibachi converts random disk writes
to sequential disk writes to exploit HDD’s superior sequential access performance. To
efficiently maintain and identify consecutive dirty pages, the dirty cache maintains two
hashmaps and a sequential list (i.e., data structures in the dashed line rectangle).

62
4.4.2 Right Prediction
To achieve a high cache hit ratio, the ultimate question is how to predict whether
a page will be reused in the near future. Our workload characterization on recency
and frequency in Section 4.2 sheds some light on this question. Note that recency and
frequency are the most effective and accurate prediction metrics [30]. For storage system
level workloads, the temporal distance of a read request after the same read request is
considerably long. Thus, recency is not so helpful to predict clean page reuse. On the
contrary, the temporal distances of write after write requests are relatively short. Thus,
recency can be useful to predict dirty page reuse. The frequency metrics for both read
and write requests are fairly good since most accesses concentrate on a small portion of
pages.
Based on the above analysis, Hibachi uses a frequency-based cache policy, i.e., LFU-
Aging [95] (Least Frequently Used with Aging), to manage the clean cache, and a
recency-based cache policy, i.e., LRU (Least Recently Used), to manage the dirty cache.
The reasons we choose LFU-Aging and LRU are twofold: they are widely adopted, and
they cause low overhead. Clearly, other fancier cache policies can be designed or applied
to each side with the potential of increasing cache hit ratio, but high algorithm overhead
can offset the overall performance gain.
LFU-Aging [95] is an improved version of the traditional LFU algorithm. LFU is
prone to cache pollution problems due to some items only being frequently accessed for
a short period of time. Without properly enforced aging, these items waste cache space
and receive no hits. To resolve this problem, LFU-Aging reduces all frequency counts by
half when the average of all the frequency counters in the cache exceeds a given average
frequency threshold. We set the average frequency threshold to 5.5 as used in [96].
4.4.3 Right Reaction
Typically, if a page gets a hit, its priority increases to delay eviction. For recency, the
page is moved to the MRU (Most Recently Used) position. For frequency, the page’s
frequency counter is increased. However, for hybrid memory, considering the limited
NVRAM space and DRAM’s shorter access latency, Hibachi distinguishes between read
hits and write hits in order to fully utilize NVRAM to improve write hit rate (i.e.,

63DRAM Capacity = 4 Pages NVRAM Capacity = 4 Pages
Clean Cache = 5 Pages Dirty Cache = 3 PagesClean Ghost Cache Dirty Ghost Cache
Real Page
Ghost Page
1 4 2 1 2 3 0 1
LRU MRU
Keystart Value
99
20
201
…
…
Keyend Value
205
…
120
…
30
Sequential List
99‐120
…
20‐30
201‐205
…
Figure 4.5: Hibachi Architecture and Algorithm.
minimize write traffic) and to fully utilize DRAM to shorten read access latency.
Based on our observations, only write hits on dirty pages save storage write traffic.
If a page is written once or rarely, but frequently read, keeping it in NVRAM wastes
precious NVRAM space. Also, since NVRAM’s read latency is several times longer than
DRAM’s, we should quickly migrate the page from NVRAM to DRAM. Therefore, we
need to detect these kinds of pages and treat them differently. Our measurement in
Section 4.2 shows that read after write temporal locality is poor and read and write
frequency is good. Keeping this in mind, our design includes a frequency counter for
each dirty page. A dirty page’s counter increases only when a read hit happens. On
the other hand, when a write hit happens on the dirty page, its counter will not be
increased. Instead we move the page to the most recently used position, since the dirty
cache is managed by the LRU policy.
When a dirty page is selected for eviction from NVRAM, we first compare its fre-
quency with the frequency of the least frequent clean page in DRAM. If the dirty page’s
frequency is greater than the clean page’s frequency, the clean page is evicted instead
of the dirty page, and the dirty page will be migrated to DRAM. Otherwise, the dirty

64
page is evicted from NVRAM. Note that the frequency counters of dirty pages are also
aged by the LFU-Aging algorithm.
4.4.4 Right Adjustment
For higher cache hit rates, Hibachi can adjust the dirty cache size and the clean cache
size according to workloads’ tendency (e.g., read intensive versus write intensive). For
example, if the current workload is read intensive, Hibachi can detect it and borrow
NVRAM to cache hot clean pages. To decrease storage writes, we prioritize the dirty
cache over the clean cache during cache size adjustment. Two ghost caches, one for
each real cache, are maintained to assist the adaptively resizing process. A ghost cache
only stores the page number (metadata) of recently evicted pages, not the actual data.
A similar adjustment mechanism can be found in our previous work [58]. However, the
adjustment mechanism in that work is designed for an NVRAM-only buffer cache, so
we modify and extend it to fit the hybrid memory architecture as shown below.
We use D to denote the desired size for the dirty cache, and C to denote the desired
size for the clean cache. We use S to denote the sum of maximum real pages that can
be stored in both NVRAM and DRAM.
If a page hits the clean ghost cache, it means we should not have evicted this clean
page. To remedy this, we will enlarge C. Every time there is a ghost hit, C increases
by one page and D decreases by one page. Note that neither C nor D can be larger
than S.
Similarly, a page hitting the dirty ghost cache implies we should not have evicted
this dirty page. To remedy this, we will enlarge D. To save write traffic and keep dirty
pages in the cache longer, we enlarge D much faster. If the clean ghost cache size is
smaller than the dirty ghost cache, D increases by two. If the clean ghost cache size
is greater than or equal to the dirty ghost cache size, D increases by two times the
quotient of the clean ghost cache size and the dirty ghost cache size. Thus, the smaller
the dirty ghost cache size, the larger the increment.

65
4.4.5 Right Transformation
Buffer cache policies usually only evict a single page at a time when the cache needs
to reclaim space. Moreover, if the victim is a dirty page, it should be flushed before
its eviction. For Hibachi, if the victim is in the clean cache, it deals with it similarly
to the majority of buffer cache policies. However, Hibachi will do quite intelligent
and efficient judgment and operations when the victim is in the dirty cache since it is
designed for disk arrays. As spinning devices, HDD’s sequential access speed (on the
order of 100MB/s) is orders of magnitude faster than its random access speed (roughly
1MB/s) [8]. The slow random access speed is always a bottleneck constraining HDD
I/O performance. This section presents how Hibachi transforms random disk writes to
sequential disk writes to exploit the fast sequential write speed [23].
When evicting from the dirty cache, Hibachi first tries to synchronize the longest
set of consecutive dirty pages (with the help of the sequential list described later), evict
the least frequent page, and migrate the rest of the pages to the LRU end of the clean
cache. However, to execute this series of operations, we have to ensure the length of the
longest set of consecutive dirty pages is over a given threshold (e.g., 10). If its length is
below the threshold, Hibachi evicts the LRU page from the dirty cache. In either case, it
inserts the evicted page’s page number into the MRU position of the dirty ghost cache.
Since a dirty page is evicted, it must update the sequential list accordingly.
The sequential list is designed to accelerate identifying the longest set of consecutive
dirty pages in the dirty cache. If several pages have consecutive page numbers, they
constitute a sequential page list (sequential list for short). All sequential lists are stored
in a priority queue ordered by the length (page count) of the sequential list. It has
a double-HashMap structure that efficiently keeps track of the consecutiveness of the
cached dirty pages. Hibachi stores two pieces of HashMap information of both the
start and end page number into the sequential list. Every time a new dirty page is
added, Hibachi checks whether it can merge into any existing sequential lists by looking
up two Hash Tables. If the new dirty page can merge into any existing sequential lists,
Hibachi merges two sequential lists into one larger list. Then, the two HashMaps and the
sequential list information are updated accordingly. For example, assuming a sequential
list with page numbers 3, 4, 5, and 6 (represented by 3-6) already exists, Hibachi stores
3→(3-6) in the start HashMap and 6→(3-6) in the end HashMap. When a new dirty

66
page number 7 enters the dirty cache, Hibachi consults two HashMaps to see whether
there are any sequential lists starting with 8 or ending with 6. In this example, since
Hibachi finds sequential list (3-6) ends with 6, it merges the new page number 7 with
the existing sequential list (3-6) into a larger sequential list (3-7). Hibachi updates all
HashMaps and the sequential list entry accordingly.
Note that the sequential list only introduces negligible space overhead. A sequential
list update only occurs when a dirty page is inserted to the cache or a dirty page is
evicted. For a dirty page synchronization or consecutive dirty pages synchronization,
the corresponding sequential list entry containing the page(s) is deleted. For a dirty
page insertion, if the dirty page has no consecutive neighbors in the dirty cache, a new
sequential list entry is created and inserted into the HashMaps and the priority queue.
The aforementioned threshold mechanism is very important to Hibachi. Intuitively,
continuously flushing the longest dirty pages to disk arrays could “fully utilize” HDDs’
fast sequential write performance. However, based on our analysis and evaluation,
we found this approach can lead to a low cache hit ratio and poor storage performance
because always flushing the longest set of consecutive dirty pages may cause an inevitable
situation where there are no more consecutive dirty pages. We call the beginning of this
situation “bad time.” After the “bad time,” if a newly inserted dirty page can merge
with an existing dirty page, they become the longest set of consecutive dirty pages. Per
the policy, they will be the eviction candidate next time. However, this newly inserted
dirty page may be hot data and should not be evicted so early. Thus, by avoiding
this problem, the threshold mechanism provides a simple and effective way to exploit
sequential write opportunities without losing temporal locality.
4.4.6 Put Them All Together: Overall Workflow
Now, we integrate all these four approaches together and describe an overall workflow.
A cache hit triggers one of the following three cases: 1) if it is a read hit on a clean page
or a dirty page, we increase its frequency counter; 2) if it is a write hit on a clean page,
we migrate the page to NVRAM and insert it to the MRU position; or 3) if it is a write
hit on a dirty page, we keep it in NVRAM and move it from the current position to
the MRU position. When a page hits a ghost cache, we enlarge the desired size for its
corresponding cache. Note that the dirty cache can only grow up to the capacity of the

67
Table 4.1: Trace CharacteristicsTrace Name Total Requests Unique Pages R/W Ratio
rsrch 0 3,044,209 87,601 1:10.10wdev 0 2,368,194 128,870 1:3.73stg 0 5,644,682 1,507,247 1:2.28ts 0 3,779,371 222,267 1:3.79
NVRAM, while the clean cache can grow up to the sum of the capacity of the DRAM
and NVRAM.
For cache misses, when both the DRAM and NVRAM are not full, missed pages
are fetched from storage and inserted into DRAM for read misses and into NVRAM for
write misses. When the cache space is full, if the clean cache size is larger than its desired
size, Hibachi evicts the least frequent clean page. Otherwise, Hibachi evicts a victim
from the dirty cache side. Before eviction, the length of the longest consecutive dirty
pages is checked. If the length is above the threshold, Hibachi evicts a dirty page with
the least frequency among these consecutive dirty pages and migrates the remaining
pages to the clean cache. However, if the length is equal to or below the threshold,
Hibachi favors temporal locality more. Thus, Hibachi checks the LRU page of the dirty
cache. If its frequency is greater than the least frequently used page in the clean cache,
it evicts the clean page and moves the dirty page to the clean cache. Otherwise, the
dirty LRU page is evicted. Please note: before migrating a dirty page from NVRAM to
DRAM, or evicting a dirty page, the page must be first synchronized to storage.
4.5 Performance Evaluation
4.5.1 Evaluation Setup
To evaluate our proposed buffer cache policy, we compare Hibachi with two pop-
ular cache policies: LRU (Least Recently Used) and ARC (Adaptive Replacement
Cache) [30]. We modified both policies to fit into hybrid memory systems as follows;
• Hybrid-LRU : DRAM is a clean cache for clean pages, and NVRAM is a write
buffer for dirty pages. Both caches use the LRU policy.

68
• Hybrid-ARC : An ARC-like algorithm to dynamically split NVRAM to cache both
clean pages and dirty pages, while DRAM is a clean cache for clean pages.
Hibachi and these two policies are implemented on Sim-ideal, a public, open-source,
multi-level caching simulator [64]. For evaluations, we configure a 4KB cache block
size and employ the popular MSR Cambridge enterprise server traces [65, 85]. As in
Table 4.4.6, four MSR traces (rsrch 0, wdev 0, stg 0 and ts 0) are adopted because the
experimental results of the rest of the MSR traces show similar patterns. Cache size
refers to the total size of both DRAM (half of the total) and NVRAM (the other half).
The cache sizes vary from 8MB (2,048 of 4KB blocks) to 256MB (65,536 of 4KB blocks),
which spans a small to large percentage of the workload footprint (i.e., unique pages for
each trace in Table 4.4.6).
For performance metrics, both read and write hit rates are employed to evaluate
caching policy performance. In addition to these hit rates, we evaluate cache latency
with various DRAM and NVRAM latency configurations to consider diverse NVRAM
and DRAM performance disparities. Lastly, real disk array write throughput is also
evaluated. To observe Hibachi ’s performance impact on disk arrays, whenever a dirty
page(s) needs to synchronize with storage, Sim-ideal logs the I/O requests to a file.
We make these I/O requests compatible to the Fio [66] tool, which will later replay
these requests on a disk array for Hibachi, Hybrid-LRU, and Hybrid-ARC evaluation.
Fio is a flexible tool that can both produce synthetic I/O traces and replay I/O traces.
To avoid host interference, we set Fio with “direct=1” and “ioengine=sync,” which
bypasses the host page cache. For the disk array, we use mdadm [97] – a Linux Software
RAID array management tool to create a RAID 5 with six Seagate SAS disk drives
(ST6000NM0034-MS2A, SAS 12Gbps, 6TB, 7200rpm).
4.5.2 Evaluation Results
Read Performance
Figure 4.6 presents average read hit rates of Hibachi under different cache sizes with
different workloads. Compared to Hybrid-LRU, Hibachi significantly improves the read
hit ratio by an average of 3× (8MB total cache size), 2.9× (16MB), 1.8× (32MB), and

69
1Center for Research in Intelligent Storage CRIS Confidential
Rsrch
0.00%
1.00%
2.00%
3.00%
4.00%
5.00%
6.00%
7.00%
8.00%
9.00%
8MB 16MB 32MB 64MB 128MB 256MB
Rea
d H
it R
ate
Total Cache Size
Hybrid-LRU Hybrid-ARC Hibachi
(a) rsrch 0
6Center for Research in Intelligent Storage CRIS Confidential
wdev
0.00%
5.00%
10.00%
15.00%
20.00%
25.00%
8MB 16MB 32MB 64MB 128MB 256MB
Rea
d H
it R
ate
Total Cache Size
Hybrid-LRU Hybrid-ARC Hibachi
(b) wdev 0
11Center for Research in Intelligent Storage CRIS Confidential
stg
0.00%
0.50%
1.00%
1.50%
2.00%
2.50%
3.00%
3.50%
4.00%
4.50%
5.00%
8MB 16MB 32MB 64MB 128MB 256MB
Rea
d H
it R
ate
Total Cache Size
Hybrid-LRU Hybrid-ARC Hibachi
(c) stg 0
16Center for Research in Intelligent Storage CRIS Confidential
ts
0.00%
2.00%
4.00%
6.00%
8.00%
10.00%
12.00%
14.00%
16.00%
18.00%
8MB 16MB 32MB 64MB 128MB 256MB
Rea
d H
it R
ate
Total Cache Size
Hybrid-LRU Hybrid-ARC Hibachi
(d) ts 0
Figure 4.6: Average read hit rates
1.1× (64MB), respectively. It improves up to approximately 4× (2.41% in Hybrid-
LRU vs. 9.87% in Hibachi with a 16MB cache size, ts 0 workload). Hibachi also
outperforms Hybrid-ARC by an average of 2.7× (8MB), 1.9× (16MB), 1.2× (32MB),
1.1× (64MB), respectively. As Figure 4.6 illustrates, the performance improvement
generally increases with smaller cache sizes. This improvement results from Hibachi ’s
Right Prediction, Right Reaction, and Right Adjustment. Considering these storage
server I/O workloads are typically write-intensive and the total read hit rate percent is
quite low, these are substantial improvements.
Figure 4.7 is a stacked column chart displaying both NVRAM and DRAM contribu-
tions to Hibachi total read hit rates. Thus, Figure 4.7 decomposes Hibachi ’s total read

70
2Center for Research in Intelligent Storage CRIS Confidential
Rsrch
0.00%
1.00%
2.00%
3.00%
4.00%
5.00%
6.00%
7.00%
8.00%
9.00%
8MB 16MB 32MB 64MB 128MB 256MB
Hit
Rate
Total Cache Size
Read hit on DRAM Read hit on NVRAM
(a) rsrch 0
7Center for Research in Intelligent Storage CRIS Confidential
wdev
0.00%
5.00%
10.00%
15.00%
20.00%
25.00%
8MB 16MB 32MB 64MB 128MB 256MB
Hit
Rate
Total Cache Size
Read hit on DRAM Read hit on NVRAM
(b) wdev 0
12Center for Research in Intelligent Storage CRIS Confidential
stg
0.00%
0.50%
1.00%
1.50%
2.00%
2.50%
3.00%
3.50%
4.00%
4.50%
5.00%
8MB 16MB 32MB 64MB 128MB 256MB
Hit
Rate
Total Cache Size
Read hit on DRAM Read hit on NVRAM
(c) stg 0
17Center for Research in Intelligent Storage CRIS Confidential
ts
0.00%
2.00%
4.00%
6.00%
8.00%
10.00%
12.00%
14.00%
16.00%
18.00%
8MB 16MB 32MB 64MB 128MB 256MB
Hit
Rate
Total Cache Size
Read hit on DRAM Read hit on NVRAM
(d) ts 0
Figure 4.7: Hibachi’s NVRAM and DRAM contribution to total read hit rates
hit rates into NVRAM hit rates and DRAM hit rates for better understanding. As ex-
pected, a dominant portion of read hits occurs in DRAM because DRAM is configured
as a read cache (i.e., the clean cache). Even though NVRAM is primarily configured as
a write buffer (i.e., the dirty cache), Hibachi dynamically adjusts the dirty cache size
and the clean cache size according to workload characteristics. Thus, for read-intensive
periods in each workload, Hibachi dynamically borrows NVRAM space to cache hot
clean pages to increase cache hit ratios. Consequently, NVRAM read hit rate contri-
butions are clearly visible in Figure 4.7, which verifies Hibachi ’s dynamic adjustment
feature (i.e., Right Adjustment described in Section 4.4.4).
In general, average read cache latency is more important than average write cache
latency because read operations are more response-time critical than write operations.

71
3Center for Research in Intelligent Storage CRIS Confidential
Rsrch
0
0.5
1
1.5
2
2.5
3
8MB 16MB 32MB 64MB 128MB 256MB
Norm
ali
zed
Cach
e L
ate
ncy
Total Cache Size
LatD:LatN=1:1 LatD:LatN=1:5 LatD:LatN=1:10
(a) rsrch 0
8Center for Research in Intelligent Storage CRIS Confidential
wdev
0
0.5
1
1.5
2
2.5
3
8MB 16MB 32MB 64MB 128MB 256MB
Norm
ali
zed
Cach
e L
ate
ncy
Total Cache Size
LatD:LatN=1:1 LatD:LatN=1:5 LatD:LatN=1:10
(b) wdev 0
13Center for Research in Intelligent Storage CRIS Confidential
stg
0
0.5
1
1.5
2
2.5
3
8MB 16MB 32MB 64MB 128MB 256MB
Norm
ali
zed
Ca
che
La
ten
cy
Total Cache Size
LatD:LatN=1:1 LatD:LatN=1:5 LatD:LatN=1:10
(c) stg 0
18Center for Research in Intelligent Storage CRIS Confidential
ts
0
0.5
1
1.5
2
2.5
3
3.5
8MB 16MB 32MB 64MB 128MB 256MB
Norm
ali
zed
Ca
che
La
ten
cy
Total Cache Size
LatD:LatN=1:1 LatD:LatN=1:5 LatD:LatN=1:10
(d) ts 0
Figure 4.8: Normalized read cache latency for Hibachi. LatD stands for average DRAMaccess latency. LatN is average NVRAM access latency.
Different NVRAM technologies have very different read latencies. Compared to DRAM,
their read access latency can range from similar (e.g., NVDIMM) to 10× longer (e.g.,
PCM). To explore the impact of NVRAM’s access latency on read performance, the
following formula can calculate the average read cache latency:
ARCL = LatN ∗RateN + LatD ∗RateD
ARCL is the average read cache latency, LatN is average NVRAM read Latency, LatD
is average DRAM read Latency, RateN is Read hit rate at NVRAM, and RateD is Read
hit rate at DRAM. We assume average DRAM access latency is 50 ns. Our experiments

72
4Center for Research in Intelligent Storage CRIS Confidential
Rsrch
0.00%
10.00%
20.00%
30.00%
40.00%
50.00%
60.00%
70.00%
80.00%
90.00%
100.00%
8MB 16MB 32MB 64MB 128MB 256MB
Wri
te H
it R
ate
Total Cache Size
Hybrid-LRU Hybrid-ARC Hibachi
(a) rsrch 0
9Center for Research in Intelligent Storage CRIS Confidential
wdev
0.00%
10.00%
20.00%
30.00%
40.00%
50.00%
60.00%
70.00%
80.00%
90.00%
8MB 16MB 32MB 64MB 128MB 256MB
Wri
te H
it R
ate
Total Cache Size
Hybrid-LRU Hybrid-ARC Hibachi
(b) wdev 0
14Center for Research in Intelligent Storage CRIS Confidential
stg
0.00%
10.00%
20.00%
30.00%
40.00%
50.00%
60.00%
70.00%
80.00%
8MB 16MB 32MB 64MB 128MB 256MB
Wri
te H
it R
ate
Total Cache Size
Hybrid-LRU Hybrid-ARC Hibachi
(c) stg 0
19Center for Research in Intelligent Storage CRIS Confidential
ts
0.00%
10.00%
20.00%
30.00%
40.00%
50.00%
60.00%
70.00%
80.00%
8MB 16MB 32MB 64MB 128MB 256MB
Wri
te H
it R
ate
Total Cache Size
Hybrid-LRU Hybrid-ARC Hibachi
(d) ts 0
Figure 4.9: Total write hit rate comparison
vary the average NVRAM access latency to 1, 5, and 10× longer than DRAM’s.
As a Hibachi example, RateN and RateD are presented in Figure 4.7 and the cor-
responding normalized ARCL is plotted in Figure 4.8. As in Figure 4.8, even for the
case that assumes NVRAM read latency is 10× longer than DRAM, the largest ARCL
performance disparity is just 3.16× the case where we assume NVRAM read latency is
the same as DRAM. However, in most cases, there is not such performance degradation.
A meaningful takeaway is that even though some NVRAM’s read latency is far from
DRAM’s, an intelligent hybrid scheme (such as Hibachi ’s Right Reaction to identify
hot read pages and migrate them to DRAM quickly) can minimize overall performance
degradation.

73
5Center for Research in Intelligent Storage CRIS Confidential
Rsrch
0
2000
4000
6000
8000
10000
12000
14000
16000
18000
8MB 16MB 32MB 64MB 128MB 256MB
Th
rou
gh
pu
t in
KB
/s
Total Cache Size
Hybrid-LRU Hybrid-ARC Hibachi
(a) rsrch 0
10Center for Research in Intelligent Storage CRIS Confidential
wdev
0
2000
4000
6000
8000
10000
12000
14000
16000
18000
20000
8MB 16MB 32MB 64MB 128MB 256MB
Th
rou
gh
pu
t in
KB
/s
Total Cache Size
Hybrid-LRU Hybrid-ARC Hibachi
(b) wdev 0
15Center for Research in Intelligent Storage CRIS Confidential
stg
0
1000
2000
3000
4000
5000
6000
8MB 16MB 32MB 64MB 128MB 256MB
Th
rou
gh
pu
t in
KB
/s
Total Cache Size
Hybrid-LRU Hybrid-ARC Hibachi
(c) stg 0
20Center for Research in Intelligent Storage CRIS Confidential
ts
0
500
1000
1500
2000
2500
3000
3500
4000
4500
5000
8MB 16MB 32MB 64MB 128MB 256MB
Th
rou
gh
pu
t in
KB
/s
Total Cache Size
Hybrid-LRU Hybrid-ARC Hibachi
(d) ts 0
Figure 4.10: Average write throughput with disk arrays
Write Performance
Figure 4.9 presents average write hit rates of all three cache policies under different
cache sizes with different workloads. Compared to Hybrid-LRU, Hibachi improves write
hit ratios by an average of 2.2% (8MB total cache size), 2.5% (16MB), 4.7% (32MB),
4.8% (64MB), 8.4% (128MB), and 3.4% (256MB), respectively. Similarly, compared to
Hybrid-ARC, performance improves by an average of 2.7%, 3.4%, 5.7%, 5.0%, 8.4%,
and 3.4%, respectively. A higher hit rate results in write response time improvement
and reduced write traffic to storage arrays.
Figure 4.10 plots average write throughput on the real disk array. Hibachi improves
average write throughput across all cases and up to more than 10× Hybrid-LRU and

74
Hybrid-ARC when the cache size is large. This is because a large NVRAM cache space
enables Hibachi to accumulate more consecutive dirty pages with the help of Hibachi ’s
Right transformation. On the other hand, both Hybrid-LRU and Hybrid-ARC do not
have a strong correlation between the cache size and write throughput. This implies
that write traffic in the larger write buffer cache is not necessarily more friendly to
disk storage arrays if the cache scheme is not equipped with an intelligent write buffer
management mechanism like Hibachi.
4.6 Related Work
DRAM-based cache policies (i.e., page replacement policies) have been studied for
decades. Belady’s cache policy is well-known for an offline optimal algorithm [68]. A
primary goal of traditional inline cache policies is to improve a cache hit rate towards
the optimal rate. Most cache policies utilize recency and frequency to predict a page’s
future access. The most representative recency-based cache policy is the Least Recently
Used (LRU) algorithm. However, this overlooks frequency factor. Many LRU vari-
ants have been proposed for different use cases [61, 5]. Similarly, the Least Frequently
Used (LFU) algorithm only considers frequency, and many variants have been devel-
oped [92, 95]. To take advantage of both frequency and recency, some cache policies
(e.g., ARC ) are designed by adapting to workload characteristics [30, 58].
With the advancement of new NVRAM technologies, replacing DRAM with NVRAM,
or using DRAM and NVRAM hybrid systems, is recently drawing more attention.
New NVRAM technologies include STT-RAM [54, 53], MRAM [52], NVDIMM [24],
PCM [44, 45], RRAM [55], and 3D XPoint [56, 57]. Among them, STT-RAM, MRAM,
and NVDIMM have potential to replace DRAM, while the other are still several times
slower than DRAM.
NVRAM-based cache policies are generally co-designed with storage devices such as
HDDs or SSDs. Hierarchical ARC (H-ARC ) employs NVRAM as main memory and
SSDs as storage to extend SSD lifespan. H-ARC is designed to minimize storage write
traffic by dynamically splitting the cache space into four subspaces: dirty/clean caches
and frequency/recency caches [58]. I/O-Cache adopts NVRAM as main memory and
HDDs as storage to maximize I/O throughput [23]. I/O-Cache intelligently regroups

75
many small random write requests into fewer and longer sequential write requests to
exploit HDDs’ fast sequential write performance.
DRAM and NVRAM hybrid memory systems are another approach to integrate
NVRAM into computer systems. PDRAM [98] is a heterogeneous architecture for main
memory composed of DRAM and NVRAM memories with a unified address. A page
manager is utilized to allocate and migrate pages across DRAM and NVRAM. Qureshi
et al. [46] discuss a design of NVRAM-based primary main memory with DRAM as a
faster cache. Our proposed Hibachi policy belongs to this category. However, Hibachi
is designed for storage arrays instead of main memory. Moreover, it manages NVRAM
and DRAM cooperatively instead of individually.
4.7 Conclusion
Based on our in-depth study of storage server I/O workloads and our insightful analysis
of hybrid memory properties, we propose Hibachi – a novel cooperative hybrid cache ex-
ploiting the synergy of NVRAM and DRAM for storage arrays. Hibachi utilizes DRAM
as a read cache for clean pages and NVRAM mostly as a write buffer for dirty pages.
In addition, it judiciously integrates the proposed four main design factors: Right Pre-
diction, Right Reaction, Right Adjustment, and Right Transformation. Consequently,
Hibachi outperforms popular conventional cache policies in terms of both read perfor-
mance and write performance. This work shows the potential of designing better cache
policies to improve storage system performance and motivates us to put more effort into
this area of research.
Chapter 5
An NVRAM-based Burst Buffer
Coordination System for PFSs
5.1 Introduction
For high-performance computing (HPC), with its countless hardware components and
complex software stacks, failures become the norm rather than exceptions. For a super-
computer with tens of thousands of nodes, the mean time between failures (MTBF) can
be in the order of hours [14]. However, many scientific HPC applications (e.g., simula-
tions, modeling, and mathematical calculations) need to run days or even months before
completion. As one of the most popular fault tolerance techniques, checkpoint/restart
(C/R) is used to periodically store the intermediate application states (usually some
files) into parallel file systems (PFSs). Then, if failures do happen, the application can
be restarted by reading back those intermediate files and resuming from there instead
of starting from scratch.
Many studies show that checkpoint (CKPT) activity is the dominating contributer
to total HPC I/O traffic and application run time [15, 16, 17]. Even though PFSs are
designed to provide high aggregate I/O throughput, the large amount of bursty writes
generated during checkpointing means that PFSs alone are not sufficient and become
the bottleneck of the whole HPC system.
To improve checkpointing speed, an intermediate layer, called a burst buffer (BB),
is often used to alleviate the burden on PFSs. BBs consist of fast storage media and/or
76

77
dedicated software and network stacks that can absorb checkpoint data orders of mag-
nitude faster than PFSs. Then the buffered data will be drained to PFSs in the back-
ground if necessary. Traditional burst buffers mostly consist of solid state drives, but
newly developed NVRAM technologies (e.g., 3D Xpoint, PCM, and NVDIMM) are bet-
ter candidates due to their better performance. In this work, we will focus on these
emerging NVRAM-based BBs.
There are two types of burst buffer architectures: centralized BB or distributed BB.
In a centralized BB architecture, a big BB appliance or multiple BB appliances will ab-
sorb checkpoint data from all the compute nodes [18, 19, 20, 21]. The checkpoint data
must be transmitted through a network to reach the centralized BB. On the contrary,
in the more popular distributed BB architecture, each BB is smaller capacity and put
closer, or even attached directly, to each compute node [17, 16, 22]. Under the dis-
tributed BB architecture, the absorption of checkpoint data is much quicker than using
networks since BBs are closer to the data origin. It is also more scalable and flexible to
add/remove distributed BBs to/from compute nodes as needed. However, the downside
of the distributed BB architecture is potentially low BB resource utilization; without
proper scheduling and coordination, some BBs are overburdened while others might be
idle.
By observing HPC application execution patterns and experimenting on the Itasca
HPC cluster (described in Section 5.4.2), we find there are opportunities to optimize
the distributed BB architecture to improve BB resource utilization. Here is a summary
of our observations: 1) Multiple HPC applications are running concurrently instead
of few; 2) Compute nodes running the same application are at the same HPC phase
(e.g., reading data, computation, checkpointing); 3) Compute nodes running different
applications could be in distinct HPC phases; 4) Some applications (hence their compute
nodes) do not perform checkpointing; 5) Write throughput to peer compute nodes (1.83
GB/s) is much higher than write throughput to the PFS (0.52 GB/s).
As mentioned above, while the distributed BB architecture has plenty of advantages
it can suffer low resource utilization. This problem is particularly severe for NVRAM-
based BBs since NVRAM is much more expensive than other storage media (e.g., SSD),
which makes NVRAM much more valuable and scarce. Based on our observations of
HPC application execution patterns and experimentations on HPC systems, we propose

78
a novel BB coordination system, named collaborative distributed burst buffer (CDBB),
to improve resource utilization and further increase HPC checkpointing speed. Specif-
ically, we design a BB coordinator to monitor and control all BBs to make them work
collaboratively. When an application performs checkpointing, instead of only relying
on local BBs, the BB coordinator will globally select available remote BBs (based on
their priority and on-the-fly status) in nodes running other applications to contribute
and alleviate the burden of those local BBs. We have built a proof-of-concept CDBB
prototype and evaluated it on the Itasca HPC cluster at the Minnesota Supercomputing
Institute. Compared with a traditional distributed burst buffer system using local BBs
only, the results show that under a light workload, CDBB only introduces negligible
overhead, and under medium and heavy workloads, CDBB can improve CKPT speed
by up to 8.4×.
The structure of this chapter is as follows. In Section 5.2, we present some back-
ground and related work about checkpoint/restart tools, HPC application characteris-
tics, and NVRAM technologies. Section 5.3 gives a detailed description of our proposed
CDBB coordination system followed by evaluations in Section 5.4. Finally, Section 5.5
concludes our work.
5.2 Background and Related Work
5.2.1 Checkpoint/Restart
There are two types of C/R tools: application-level C/R tools and system-level C/R
tools. Application-level C/R tools come with applications themselves; only data needed
for restart are stored, so the checkpoint data size could be very small. System-level
C/R tools are transparent to applications and usually checkpoint the whole memory
space touched by the applications; thus, the checkpoint data size could be much larger.
System-level C/R tools are used to checkpoint applications without innate C/R func-
tionalities.
Here, we use a very popular system-level C/R tool, DMTCP (Distributed Multi-
Threaded CheckPointing) [99], as a reference to explain how C/R tools work. DMTCP is
in user space, does not require root privilege, and is independent from system kernel ver-
sion, which makes it very flexible and user-friendly. DMTCP has a dmtcp coordinator

79
CRIS Confidential
Compute node 1
Compute node 2
Compute node x
…
Application A
Application N
Reading Computation Checkpointing
Compute node 3
Compute node 4Application B
Compute node 5
Time
Figure 5.1: An example of HPC application execution patterns
process which must be started before operating dmtcp checkpoint or dmtcp restart.
Checkpoints can be performed automatically on an interval, or they can be initiated
manually on the command line of the dmtcp coordinator. Once issued a checkpoint
request, the dmtcp coordinator will inform all the corresponding processes to halt, and
each process will generate a checkpoint image individually. At the same time, a script
is created for restart purposes.
5.2.2 HPC Application Characteristics
In a typical HPC cluster with hundreds or thousands of compute nodes, usually there
are tens or hundreds of applications running concurrently. We used the showq command
to show the job queue of the Mesabi cluster at the Minnesota Supercomputing Institute
and found that 636 active jobs were running [100]. Also, the online real-time job queue
report of the Stampede supercomputer at the Texas Advanced Computing Center showed
699 active jobs were running [101].
Figure 5.1 is a high-level simplified illustration of HPC application execution pat-
terns. As shown in the figure, many applications, which start at different times, are
running in the cluster. These applications need to read data (usually from PFSs) and
perform computation. Applications with C/R requirements will perform checkpointing
with frequencies set by the applications or users. After one checkpointing operation

80
BB
Coordinator
…Compute
Node
Compute
Node…
HPC Application I
BB
CKPT Coordinator
BB
…
Parallel File System
Storage Servers Metadata Servers
…
…Compute
Node
Compute
Node…
HPC Application II
BB
CKPT Coordinator
BB
Compute
Node
Compute
Node…
HPC Application N
BB
CKPT Coordinator
BB
Control Path
Data Path
Compute
Node
BB
Figure 5.2: An overview of the CDBB coordination system
is done, the computation resumes. This pattern repeats until either the application
is finished or any failures happen, in which case the applications will restart from the
latest checkpointing image.
Figure 5.1 clearly shows that the execution patterns of compute nodes assigned
to the same application are quite similar to each other whereas that of the compute
nodes assigned to different applications could be quite distinct. For example, when
the compute nodes running Application A are performing checkpointing, the compute
nodes running Application B are doing computation. In addition, some applications do
not perform checkpointing at all, so they will continuously do computation until the
end (Figure 5.1 Application N ). These insights give CDBB opportunities to perform
optimization on BB utilization. If there is only one application running in the whole
cluster or all the applications in the cluster happen to have the exact same execution
patterns, then CDBB would not contribute too much since all the BBs are either being
used or idle at the same time.

81
5.2.3 Non-volatile Memory
Current memory technologies such as DRAM and SRAM face technological limita-
tions to continued improvement [31]. As a result, there are intense efforts to develop
new DRAM-alternative memory technologies. Most of these new technologies are non-
volatile memories, because non-volatility can provide additional advantages such as new
power saving modes for quick wakeup as well as faster power-off recovery and restart
for HPC applications [31]. These new technologies include PCM, STT-RAM, MRAM,
RRAM, and 3D XPoint.
Phase Change Memory (PCM) is one of the most promising new NVM technologies
and can provide higher scalability and storage density than DRAM [44, 45]. In general,
PCM still has a 5–10× longer latency than DRAM. To overcome PCM’s speed defi-
ciency, various system architectures have been designed to integrate PCM into current
systems without performance degradation [25, 46, 47, 48, 49, 50, 51]. Magnetic RAM
(MRAM) and Spin-Torque Transfer RAM (STT-RAM) are expected to replace SRAM
and DRAM within the next few years [52, 53, 54]. STT-RAM reduces the transistor
count and, consequently, provides a low-cost, high-density solution. Many enterprise and
personal devices use MRAM for an embedded cache memory. Resistive RAM (RRAM)
is considered a potential candidate to replace NAND Flash memory [55]. SanDisk and
Hewlett Packard Enterprise are actively developing next generation RRAM technology.
Micron and Intel recently introduced 3D XPoint non-volatile memory technology that
is presently considered another DRAM alternative [56]. 3D Xpoint technology has high
endurance, high density, and promising performance that is much better than NAND
Flash but slightly slower than DRAM. Thus, it is expected to target high-performance
in-memory processing [57].
5.3 Our Proposed Approach: CDBB
Collaborative distributed burst buffer (CDBB) is a coordination system to maximize
the utilization of all available burst buffers and increase checkpointing speed. We will
use some concepts in DMTCP (introduced in Section 5.2.1) as assistance to describe
our design, but CDBB is designed as a general framework that does not have any
dependencies on the particular implementation or design of any C/R tools.

82
Node 1
CKPT WriterBBBB Coordinator
Node 2
Control Path Data Path
…
PFS
Node x
2.a
12.b
2.c3
4
Figure 5.3: A high-level illustration of CDBB checkpointing workflow
5.3.1 CDBB Overview
Figure 5.2 is an overview of our proposed CDBB coordination system. It depicts a
typical HPC cluster with hundreds or thousands of compute nodes running various
types of HPC applications. CKPT coordinators (e.g., dmtcp coordinator) will control
compute nodes running applications with C/R needs. Each compute node is equipped
with a small NVRAM-based BB. All the BBs are communicating with, and coordinated
by, a BB coordinator. CKPT data are either written to BBs and drained to PFSs in the
background or written to PFSs directly. The PFS usually consists of multiple storage
servers controlled by one or more metadata servers.
To illustrate the checkpointing workflow of CDBB, we simplify the whole system
into Figure 5.3. As shown in the figure, there is one BB coordinator monitoring and
coordinating all the BBs. Each BB (one per compute node) will absorb CKPT data
generated by CKPT writers. A CKPT writer represents a CKPT process which gen-
erates CKPT data periodically and writes to either a BB or the PFS. Before a CKPT
writer sends the real CKPT data (e.g., the CKPT writer in Figure 5.3 Node 1), it will
first negotiate with the BB coordinator (Figure 5.3 Path 1) to determine the best place

83
Start
ReceiveControl Data
Control Data fromBB or Writer?
CheckStatusStore
Writer
Local BB haveenough space?
Let writerwrite to local
BBYes
No
Remote BB with largestspace left have enough
space?
Let writerwrite to
remote BBYes
Let writerwrite to PFS
No
UpdateStatusStore BB
Figure 5.4: The BB coordinator checkpointing workflow
to write. There are three possible places: the local BB (through Figure 5.3 path 2.a), a
remote BB (through Figure 5.3 path 2.b), and the PFS (through Figure 5.3 path 2.c).
Note that the local BB refers to the BB located in the same compute node as the CKPT
writer. BBs will drain their buffered data to the PFS in the background (Figure 5.3
path 3) and report their latest status to the BB coordinator (Figure 5.3 path 4). Details
about the BB coordinator, BBs, and CKPT writers will be presented in the following
sections.

84
5.3.2 BB Coordinator
The BB coordinator is the brain behind CDBB. It coordinates every individual BB to
make globally optimized decisions about where the CKPT data should go. A process
flowchart of the BB coordinator is shown in Figure 5.4.
A work cycle of the BB coordinator starts with the arrival of control data. The
control data could be sent from either a BB or a CKPT writer. If it is from a BB,
the BB coordinator will update its StatusStore with the latest status of the sending
BB. The StatusStore stores the status of all BBs. For the current design, only the
space utilization is stored, since it is the only metric the BB coordinator uses to make
decisions. As our future work, more metrics such as compute nodes’ CPU utilization
and data sharing information between processes will be added into the StatusStore to
make CDBB smarter.
If the control data is from a CKPT writer, the BB coordinator will be notified of
how much data the CKPT writer wants to write. Then the BB coordinator will check
the StatusStore and reply to the CKPT writer with the best place to write. To make a
decision, the BB coordinator will check the availability in the following priority order:
the local BB→remote BBs→the PFS. Specifically, the status of the local BB will be
checked first. If the local BB’s remaining space is larger than the incoming CKPT data
size, the BB coordinator will reply to the CKPT writer and let it write to the local BB.
If the local BB does not have enough space, then the BB coordinator will check whether
the remote BB with the most space left has enough space. If so, the remote BB will be
selected as the destination. Note that whenever a BB is chosen to absorb the incoming
CKPT data, the StatusStore will be updated accordingly to reflect that BB’s increased
space utilization. Finally, if none of the BBs have enough space, the CKPT writer will
be notified to write to the PFS directly. Some corresponding location information of
the CKPT data will be stored in a LocationStore, which will be used if the CKPT data
is needed for restart purposes (not shown in the flowchart).
5.3.3 BB
Individual BBs are the building blocks of CDBB. We design and implement each BB
instance using a classic producer-consumer model. We create two data structures to

85
assist the management of each BB: a DataStore is the space storing CKPT data, and
a MetaStore stores the corresponding metadata (e.g., data size, offset, CKPT data
ID, and writing location) of the CKPT data for data draining and application restart
purposes. For the producer of a BB, as long as the DataStore has enough space to
accommodate the incoming CKPT data, it will insert the data into the DataStore and
the MetaStore. For the consumer, as long as there are any CKPT data needing to
be drained, it will use the information from the MetaStore to write the data in the
DataStore to the PFS. Note that the CKPT data in the DataStore will be drained in a
first-in-first-out (FIFO) manner controlled by the MetaStore. As long as one batch of
CKPT data has been written to the PFS successfully, the BB will send its latest status
(e.g., space utilization) to the BB coordinator to let it know more space is available in
this BB.
5.3.4 CKPT Writer
Each CKPT writer represents an HPC checkpointing process. Once the CKPT writers
receive a checkpoint request from their CKPT coordinator, they will generate CKPT
data by collecting the corresponding data associated with the application processes.
Then CKPT writers will contact the BB coordinator to get directions about where to
send the CKPT data. Each CKPT coordinator might have different CKPT frequency
as specified by the application or the system administrator. CKPT tools, application
types, and CKPT frequencies might affect the size of CKPT data.
5.4 Performance Evaluation
5.4.1 Implementation
To evaluate the performance of CDBB, we built a proof-of-concept prototype using C
with the Message Passing Interface (MPI). Rank 0 is dedicated as the BB coordinator.
Rank is an MPI term to denote each process. The last rank in each compute node acts
as the local BB. The rest of the ranks in each compute node are CKPT writers. For each
BB rank, it spawns two threads: one as the producer and the other as the consumer.
Each application could have a different number of CKPT writers, which will be awoken

86
at the same time to generate CKPT data.
As the baseline comparison, we implement a traditional burst buffer prototype sys-
tem in which each CKPT writer will only utilize its local BB. If the local BB is full,
CKPT writers will write to the PFS directly. We call this prototype system the local
distributed burst buffer (LDBB). For LDBB, similar to CDBB, one compute node has
one BB and several CKPT writers. But LDBB does not have the BB coordinator.
LDBB is implemented with C and MPI as well.
5.4.2 Testbed
We evaluate the performance of CDBB on the Itasca cluster located at the Minnesota
Supercomputing Institute [102]. Itasca is an HP Linux cluster with 1091 compute nodes,
8728 total cores, and 26 TB of aggregated RAM space. Each compute node is equipped
with two quad-core 2.8 GHz Intel Nehalem processors and 24 GB of memory. It can
achieve 3 GB/s node-to-node communication through a QDR InfiniBand interconnec-
tion. The back end storage is a Panasas ActiveStor 14 data-storage system with 1.281
PB of usable storage capacity and peak performance of 30 GB/s read/write and 270,000
IOPS [103].
Note that since there is no real NVRAM in our testbed system, we reserve 4 GB of
memory on each compute node to emulate NVRAM-based burst buffers.
5.4.3 Evaluation Setup
We use the statistics collected by Kaiser et al. [104], as shown in Figure 5.5, to emulate
multiple HPC applications running concurrently in an HPC cluster. These CKPT data
were generated using the DMTCP tool (introduced in Section 5.2.1) with a frequency
of every ten minutes. When creating CKPT data, DMTCP’s compression feature was
disabled. Almost all these applications were run for two hours with the exception
that bowtie (after 50 minutes) and pBWA (after 110 minutes) finished earlier. Each
application was distributed among 64 cores. A detailed description of all the applications
can be found in [104]. We design three representative experiments from the statistics to
emulate scenarios under a light workload, a medium workload, and a heavy workload.
We use the “Avg. CKPT Size” as the metric to describe applications listed in Figure 5.5.

87
CRIS Confidential
Experiment Setup
Application Avg. CKPT Size
NAMD 10GB
Espresso++ 17GB
openfoam 17GB
echam 18GB
mpiblast 33GB
gromacs 34GB
eulag 35GB
phylobayes 39GB
nwchem 42GB
CP2K 43GB
LAMMPS 52GB
ray 75GB
bowtie 94GB
QE 99GB
pBWA 132GB
Light
Heavy
Medium
Figure 5.5: Applications used for Light, Medium, and Heavy experiments
The Light experiment consists of the five smallest applications. The Medium experiment
consists of the two smallest applications, one in the middle, and the two largest. The
Heavy experiment consists of the five largest applications.
We run each experiment, Light, Medium, and Heavy, using 46 nodes (368 cores in
total) from the cluster. Among them, 320 cores will act as CKPT writers, 46 cores will
act as BBs (one BB per node), and one core will act as the BB coordinator (on rank
0). There is one core left doing nothing. Among the 320 CKPT writers, every 64 of
them will represent one application, which is the same configuration as the statistics
collected in [104]. For each experiment, there are five emulated applications. Each
application is started randomly within the first ten minutes and runs for one hour.
Once an application is started, it will perform CKPT every ten minutes. For each
CKPT operation, 64 CKPT writers running the same application will each write the
same amount of data such that their sum is equal to the “Avg. CKPT size” of that
application as listed in Figure 5.5.
5.4.4 Evaluation Results
We measure each application’s CKPT completion time for each CKPT operation. This
time is measured as the difference between the ending time of the application’s slowest

88
1Center for Research in Intelligent Storage CRIS Confidential
Summary
26.76
74.10
160.08
23.04
621.32
730.71
0.00
100.00
200.00
300.00
400.00
500.00
600.00
700.00
800.00
Light Medium Heavy
To
tal
CK
PT
Co
mp
leti
on
Tim
e (S
)
Experiment Type
CDBB LDBB
Figure 5.6: Combined total CKPT completion time for each experiment
finishing CKPT writer (among 64 CKPT writers) and the starting time of the CKPT
operation. A CKPT writer finishes when its CKPT data are written completely, either
to a BB or the PFS.
Figure 5.6 shows the combined total CKPT completion time for the three experi-
ments. The total CKPT completion time is the sum of the CKPT completion times of
all the applications’ CKPT operations. In the Light experiment, CDBB, surprisingly
at first look, takes 3.72 seconds longer than LDBB. However, this result is expected,
since under the light workload, all CKPT data could be absorbed by local BBs, and
CDBB’s coordination capabilities do not help yet cause some overhead. Note that each
application ran for one hour, so the overhead of 3.72 seconds is negligible (∼0.1%).
In the Medium and Heavy experiments, compared with LDBB, the results show
that CDBB significantly shortens total CKPT completion time by 8.4× and 4.6×, re-
spectively. For CDBB, the total CKPT completion times of the three experiments are
almost proportional to the total amount of CKPT data needing to be checkpointed.
This relationship is ascribed to CDBB’s ability to coordinate all available BBs to help
absorb CKPT data. On the contrary, for LDBB, we find that when the local BBs are
insufficient to accommodate all the incoming CKPT data, its CKPT speed becomes
much slower since it has to wait until all the PFS writes are finished.

89
2Center for Research in Intelligent Storage CRIS Confidential
Small
2.79
4.74 4.95 5.19
9.09
2.39
4.05 4.01 4.25
8.35
0.00
2.00
4.00
6.00
8.00
10.00
NAMD Espresso++ openfoam echam mpiblast
To
tal
CK
PT
Co
mp
leti
no
Tim
e (S
)
Application Type
CDBB LDBB
(a) The Light experiment
3Center for Research in Intelligent Storage CRIS Confidential
Mix
2.58
8.14 8.70
23.55 31.12 2.85
4.74
50.54
230.39
332.80
0.00
50.00
100.00
150.00
200.00
250.00
300.00
350.00
NAMD Espresso++ phylobayes QE pBWA
To
tal
CK
PT
Co
mp
leti
no
Tim
e (S
)
Application Type
CDBB LDBB
(b) The Medium experiment
4Center for Research in Intelligent Storage CRIS Confidential
Large
10.46 17.23
41.45 44.39 46.55 58.20
113.03
155.78 161.94
241.76
0.00
50.00
100.00
150.00
200.00
250.00
LAMMPS ray bowtie QE pBWA
To
tal
CK
PT
Co
mp
leti
no T
ime
(S)
Application Type
CDBB LDBB
(c) The Heavy experiment
Figure 5.7: Total CKPT completion time for each application. Note that y-axes are indifferent scales for the three figures.
In addition, we plot total CKPT time by application (i.e., the sum of all of one appli-
cation’s CKPT operations) in Figure 5.7. For CDBB, similar to the above observation,
each application’s total CKPT time is proportional to its CKPT data size. For LDBB,
an interesting finding is that the total CKPT times of the same application, QE, in the
Medium (230.39 s) and Heavy (161.94 s) experiments are quite different. It is the same
case for application pBWA (332.80 s versus 241.76). One possible reason is that the
throughput of the PFS is quite unstable due to I/O contention caused by other running
jobs in the Itasca cluster. In LDBB, application QE and pBWA need to write to the
PFS, so their CKPT completion time will be affected. We further plot the CKPT com-
pletion time for each CKPT operation (CKPT run) in Figure 5.8. Here we select three
representative applications to plot: the smallest application, NAMD, from the Light

90
5Center for Research in Intelligent Storage CRIS Confidential
Small NAMD
0.64
0.56
0.46
0.57 0.56 0.54
0.46 0.46
0.47 0.46
0.00
0.10
0.20
0.30
0.40
0.50
0.60
0.70
Run 1 Run 2 Run 3 Run 4 Run 5
CK
PT
Co
mp
leti
no T
ime
(S)
CKPT Run No.
CDBB LDBB
(a) Application NAMD
6Center for Research in Intelligent Storage CRIS Confidential
Mix phylobayes
2.31 1.76 1.52 1.56 1.55
9.21
14.28 13.46
7.06 6.53
0.00
2.00
4.00
6.00
8.00
10.00
12.00
14.00
16.00
Run 1 Run 2 Run 3 Run 4 Run 5
CK
PT
Co
mp
leti
no T
ime
(S)
CKPT Run No.
CDBB LDBB
(b) Application phylobayes
7Center for Research in Intelligent Storage CRIS Confidential
Large pBWA
9.77 10.85 10.94
7.09 7.89
46.11
40.85
46.83
53.33 54.64
0.00
10.00
20.00
30.00
40.00
50.00
60.00
Run 1 Run 2 Run 3 Run 4 Run 5
CK
PT
Co
mp
leti
no T
ime
(S)
CKPT Run No.
CDBB LDBB
(c) Application pBWA
Figure 5.8: CKPT completion time of each CKPT operation for application NAMD,phylobayes, and pBWA. Note that y-axes are in different scales for the three figures.
experiment; the middle application, phylobayes, from the Medium experiment; and the
largest application, pBWA, from the Heavy experiment. From Figure 5.8, we can see
that for each run, CDBB’s completion time variation for the same application is small
whereas LDBB’s completion time variation is larger due to the PFS I/O contention as
mentioned above.
5.5 Conclusion
Slow checkpointing speed is the Achilles’ heel of HPC systems due to the limited band-
width of parallel file systems. To increase checkpointing speed, adding NVRAM into
compute nodes as burst buffers has been previously proposed and studied. However,

91
current HPC systems relying only on local burst buffers could waste precious NVRAM
resources. By maximizing burst buffer utilization, our newly proposed burst buffer co-
ordination system, named collaborative distributed burst buffer (CDBB), can further
speed up checkpointing. By building a proof-of-concept prototype, we demonstrate the
potential of CDBB. Under a light workload, CDBB only introduces negligible overhead,
and under medium and heavy workloads, CDBB can improve CKPT speed by up to
8.4×.

Chapter 6
Conclusion
This thesis focuses on using new NVRAM technologies (e.g., 3D Xpoint, STT-MRAM,
and NVDIMM) to build novel caching systems to improve the performance of various
types of storage devices and storage systems.
In Chapter 2, we propose two novel cooperative buffer cache schemes in different
layers (host-side and SSD-side) for computer systems utilizing Non-Volatile Memories
(NVM) for the purpose of SSD write traffic reduction. The main goal of the proposed
design is to extend SSD lifetimes by reducing total SSD write traffic. To meet the goal,
we first propose a novel host-side buffer cache mechanism named Hierarchical Adaptive
Replacement Cache (H-ARC). Unlike existing DRAM-based schemes whose main goal
is to improve cache hit ratios, H-ARC focuses on write traffic reduction as well as
cache hit ratio improvement, thereby considering four factors: dirty, clean, recency, and
frequency. Moreover, H-ARC’s dynamic features enable H-ARC to effectively adapt to
various workloads.
In addition to the proposed main buffer cache mechanism, we propose an internal
SSD write buffer scheme named WRB. WRB reduces Flash block erasures and write
traffic by exploiting temporal locality and spatial locality. WRB first selects a victim
with the highest block utilization and, only if the page count is over a predefined thresh-
old, it evicts the block with highest block utilization. Otherwise, it evicts a block on
the basis of a block-level LRU policy. To our knowledge, this comprehensive design for
SSD lifetime extension is the first work to simultaneously address both layers. These
two cooperative write buffer cache mechanisms can be combined to provide a holistic
92

93
view of SSD write traffic reduction for NVRAM-based computer systems.
In Chapter 3, we present a novel non-volatile memory based buffer cache policy,
I/O-Cache. Our approach uses NVRAM to cache dirty pages longer than traditional
DRAM caches, and it regroups and synchronizes long sets of consecutive dirty pages to
take advantage of HDDs’ fast sequential access speed. Additionally, to decrease storage
writes, I/O-Cache can dynamically split the whole cache into a dirty cache and a clean
cache according to the workload’s tendency for read or write requests. The performance
of I/O-Cache is evaluated with various traces. The results show that our proposed cache
policy shortens I/O completion time, decreases I/O traffic, and increases the cache hit
ratio compared with existing work.
In Chapter 4, based on our in-depth study of storage server I/O workloads and our
insightful analysis of hybrid memory properties, we propose Hibachi – a novel cooper-
ative hybrid cache exploiting the synergy of NVRAM and DRAM for storage arrays.
Hibachi utilizes DRAM as a read cache for clean pages and NVRAM mostly as a write
buffer for dirty pages. In addition, it judiciously integrates the proposed four main
design factors: Right Prediction, Right Reaction, Right Adjustment, and Right Trans-
formation. Consequently, Hibachi outperforms popular conventional cache policies in
terms of both read performance and write performance. This work shows the potential
of designing better cache policies to improve storage system performance and motivates
us to put more effort into this area of research.
In Chapter 5, we consider that slow checkpointing speed is the Achilles’ heel of HPC
systems due to the limited bandwidth of parallel file systems. To increase checkpointing
speed, adding NVRAM into compute nodes as burst buffers has been previously pro-
posed and studied. However, current HPC systems relying only on local burst buffers
could waste precious NVRAM resources. To maximize burst buffer utilization, we pro-
pose a burst buffer coordination system, named collaborative distributed burst buffer
(CDBB), which can further speed up checkpointing. By building a proof-of-concept
prototype, we demonstrate the potential of CDBB. Under a light workload, CDBB only
introduces negligible overhead, and under medium and heavy workloads, CDBB can
improve checkpoint speed by up to 8.4×.

References
[1] Jianguo Wang, Dongchul Park, Yannis Papakonstantinou, and Steven Swanson.
SSD In-Storage Computing for Search Engines. IEEE Transactions on Computers,
PP(4):1–14, 2016.
[2] Dongchul Park, Jianguo Wang, and Yang-Suk Kee. In-Storage Computing for
Hadoop MapReduce Framework: Challenges and Possibilities. IEEE Transactions
on Computers, PP(4):1–14, 2016.
[3] Hyojun Kim and Seongjun Ahn. BPLRU: A Buffer Management Scheme for
Improving Random Writes in Flash Storage. In FAST, 2008.
[4] G. Wu, X. He, and B. Eckart. An Adaptive Write Buffer Management Scheme for
Flash-based SSDs. ACM Transactions on Storage, 8(1):1–24, 2012.
[5] H. Jung, H. Shim, S. Park, S. Kang, and J. Cha. Lru-wsr: integration of lru and
writes sequence reordering for flash memory. IEEE Transactions on Consumer
Electronics, 54(3):1215–1223, 2008.
[6] H. Jo, J. Kang, S. Park, J. Kim, and J. Lee. FAB: Flash-aware Buffer Management
Policy for Portable Media Players. IEEE Transactions on Consumer Electronics,
54(3):1215–1223, 2008.
[7] S. Kang, S. Park, H. Jung, H. Shim, and J. Cha. Performance Trade-offs in
Using NVRAM Write Buffer for Flash Memory-based Storage Devices. IEEE
Transactions on Computers, 58(6):744–758, 2009.
[8] Remzi H. Arpaci-Dusseau and Andrea C. Arpaci-Dusseau. Operating Systems:
Three Easy Pieces. Arpaci-Dusseau Books, 0.91 edition, May 2015.
94

95
[9] S. Qiu and A. L. N. Reddy. NVMFS: A Hybrid File System for Improving Random
Write in NAND-flash SSD. In MSST, pages 1–5, 2013.
[10] S. Park, D. Jung, J. Kang, J. Kim, and J. Lee. CFLRU: a Replacement Algorithm
for Flash Memory. In CASES, pages 234–241, 2006.
[11] Binny S. Gill and Dharmendra S. Modha. Wow: Wise ordering for writes - combin-
ing spatial and temporal locality in non-volatile caches. In Proceedings of the 4th
Conference on USENIX Conference on File and Storage Technologies - Volume 4,
FAST’05, pages 10–10, Berkeley, CA, USA, 2005. USENIX Association.
[12] Binny S. Gill, Michael Ko, Biplob Debnath, and Wendy Belluomini. Stow: A
spatially and temporally optimized write caching algorithm. In Proceedings of the
2009 Conference on USENIX Annual Technical Conference, USENIX’09, pages
26–26, Berkeley, CA, USA, 2009. USENIX Association.
[13] Jiao Hui, Xiongzi Ge, Xiaoxia Huang, Yi Liu, and Qiangjun Ran. E-hash: An
energy-efficient hybrid storage system composed of one ssd and multiple hdds.
In Proceedings of the Third International Conference on Advances in Swarm In-
telligence - Volume Part II, ICSI’12, pages 527–534, Berlin, Heidelberg, 2012.
Springer-Verlag.
[14] Leonardo Bautista-Gomez, Seiji Tsuboi, Dimitri Komatitsch, Franck Cappello,
Naoya Maruyama, and Satoshi Matsuoka. Fti: High performance fault tolerance
interface for hybrid systems. In Proceedings of 2011 International Conference for
High Performance Computing, Networking, Storage and Analysis, SC ’11, pages
32:1–32:32, New York, NY, USA, 2011. ACM.
[15] Adam Moody, Greg Bronevetsky, Kathryn Mohror, and Bronis R. de Supinski.
Design, modeling, and evaluation of a scalable multi-level checkpointing system.
In Proceedings of the 2010 ACM/IEEE International Conference for High Perfor-
mance Computing, Networking, Storage and Analysis, SC ’10, pages 1–11, Wash-
ington, DC, USA, 2010. IEEE Computer Society.
[16] Raghunath Rajachandrasekar, Adam Moody, Kathryn Mohror, and Dhabaleswar
K. (DK) Panda. A 1 pb/s file system to checkpoint three million mpi tasks. In

96
Proceedings of the 22Nd International Symposium on High-performance Parallel
and Distributed Computing, HPDC ’13, pages 143–154, New York, NY, USA,
2013. ACM.
[17] Jianguo Wang, Dongchul Park, Yang Suk Kee, Yannis Papakonstantinouy, and
Steven Swanson. SSD In-Storage Computing for List Intersection. In DaMoN,
pages 1 – 8, June 2016.
[18] N. Liu, J. Cope, P. Carns, C. Carothers, R. Ross, G. Grider, A. Crume, and
C. Maltzahn. On the role of burst buffers in leadership-class storage systems. In
012 IEEE 28th Symposium on Mass Storage Systems and Technologies (MSST),
pages 1–11, April 2012.
[19] T. Wang, S. Oral, Y. Wang, B. Settlemyer, S. Atchley, and W. Yu. Burstmem:
A high-performance burst buffer system for scientific applications. In 2014 IEEE
International Conference on Big Data (Big Data), pages 71–79, Oct 2014.
[20] S. Thapaliya, P. Bangalore, J. Lofstead, K. Mohror, and A. Moody. Managing i/o
interference in a shared burst buffer system. In 2016 45th International Conference
on Parallel Processing (ICPP), pages 416–425, Aug 2016.
[21] C. Chen, M. Lang, L. Ionkov, and Y. Chen. Active burst-buffer: In-transit process-
ing integrated into hierarchical storage. In 2016 IEEE International Conference
on Networking, Architecture and Storage (NAS), pages 1–10, Aug 2016.
[22] T. Wang, S. Oral, M. Pritchard, B. Wang, and W. Yu. Trio: Burst buffer based
i/o orchestration. In 2015 IEEE International Conference on Cluster Computing,
pages 194–203, Sept 2015.
[23] Ziqi Fan, Alireza Haghdoost, David H.C. Du, and Doug Voigt. I/O-Cache: A Non-
volatile Memory Based Buffer Cache Policy to Improve Storage Performance. In
MASCOTS, pages 102–111, 2015.
[24] Viking. NVDIMM-Fastest Tier in Your Storage Strategy. Technical report, Viking
Technology, 2014.

97
[25] B. C. Lee, E. Ipek, O. Mutlu, and D. Burger. Architecting Phase Change Memory
as a Scalable DRAM Alternative. In ISCA, pages 2–13, 2009.
[26] Michael Krause. The Solid State Storage (R-)Evolution. Technical report,
Hewlette Packard, 2012.
[27] E. Lee, H. Bahn, and S. H. Noh. Unioning of the Buffer Cache and Journaling
Layers with Non-volatile Memory. In FAST, pages 73–80, 2013.
[28] Y. Liu, X. Ge, X. Huang, and D. H. C. Du. Molar: A cost-efficient, high-
performance hybrid storage cache. In 2013 IEEE International Conference on
Cluster Computing (CLUSTER), pages 1–5, Sept 2013.
[29] S. Qiu and A. L. N. Reddy. NVMFS: A Hybrid File System for Improving Random
Write in NAND-flash SSD. In MSST, pages 1–5, 2013.
[30] N. Megiddo and D. S. Modha. ARC: a Self-tuning, Low Overhead Replacement
Cache. In FAST, pages 115–130, 2003.
[31] Thomas Coughlin and Edward Grochowski. Emerging Non-Volatile Memory and
Spin Logic Technology and Memory Manufacturing Report. Technical report,
Coughlin Associates, 2015.
[32] Dongchul Park, Biplob Debnath, and David Du. CFTL: A Convertible Flash
Translation Layer Adaptive to Data Access Patterns. In SIGMETRICS, pages
365–366, 2010.
[33] Jianguo Wang, Eric Lo, Man Lung Yiu, Jiancong Tong, Gang Wang, and Xi-
aoguang Liu. The Impact of Solid State Drive on Search Engine Cache Manage-
ment. In SIGIR, pages 693–702, 2013.
[34] Dongchul Park, Biplob Debnath, and David H.C. Du. A Dynamic Switching
Flash Translation Layer based on A Page-Level Mapping. IEICE Transactions on
Information and Systems, E99-D(6):51–60, June 2016.
[35] M. Murugan and David H.C. Du. Rejuvenator: A Static Wear Leveling Algorithm
for NAND Flash Memory with Minimized Overhead. In MSST, pages 1–12, 2011.

98
[36] N. Agrawal, V. Prabhakaran, T. Wobber, J. Davis, M. Manasse, and R. Panigrahy.
Design Tradeoffs for SSD Performance. In USENIX ATC, pages 57–70, 2008.
[37] Dongchul Park, Biplob Debnath, and David Du. A Workload-Aware Adaptive
Hybrid Flash Translation Layer with an Efficient Caching Strategy. In MASCOTS,
pages 248 – 255, 2011.
[38] L. Chang and T. Kuo. An Adaptive Striping Architecture for Flash Memory
Storage Systems of Embedded Systems. In RTAS, pages 187–196, 2002.
[39] D. Jung, Y. Chae, H. Jo, J. Kim, and J. Lee. A Group-based Wear-leveling
Algorithm for Large-capacity Flash Memory Storage Systems. In CASES, pages
160–164, 2007.
[40] L. Chang. On Efficient Wear Leveling for Large-scale Flash Memory Storage
Systems. In SAC, pages 1126–1130, 2007.
[41] J. Kang, H. Jo, J. Kim, and J. Lee. A Superblock-based Flash Translation Layer
for NAND Flash Memory. In EMSOFT, pages 161–170, 2006.
[42] Samsung. Samsung V-NAND Technology. Technical report, Samsung Electronics,
2014.
[43] mandetech. Micron brings nvdimms to enterprise.
[44] S. Raoux, G. W. Burr, M. J. Breitwisch, C. T. Rettner, Y.-C. Chen, R. M. Shelby,
M. Salinga, D. Krebs, S.-H. Chen, H.-L. Lung, and C. H. Lam. Phase-change
random access memory: A scalable technology. IBM Journal of Research and
Development, 52(4):465–479, 2008.
[45] Simone Raoux, Feng Xiong, Matthias Wuttig, and Eric Pop. Phase change mate-
rials and phase change memory. MRS Bulletin, 39(08):703–710, 2014.
[46] M. K. Qureshi, V. Srinivasan, and J. A. Rivers. Scalable High Performance Main
Memory System Using Phase-change Memory Technology. In ISCA, pages 24–33,
2009.

99
[47] W. Zhang and T. Li. Exploring Phase Change Memory and 3d Die-stacking
for Power/thermal Friendly, Fast and Durable Memory Architectures. In PACT,
pages 101–112, 2009.
[48] H. B. Sohail, B. Vamanan, and T. N. Vijaykumar. MigrantStore: Leveraging
Virtual Memory in DRAM-PCM Memory Architecture. Technical report, Purdue
University, TR-ECE-12-02, 2012.
[49] L. Ramos, E. Gorbatov, and R. Bianchini. Page Placement in Hybrid Memory
Systems. In ICS, pages 85–95, 2011.
[50] X. Wu and A. L. N. Reddy. SCMFS : A File System for Storage Class Memory.
In SC, pages 1–11, 2011.
[51] R. Freitas. Storage Class Memory: Technology, Systems and Applications. In Hot
Chips Symposium, pages 1–37, 2010.
[52] W. J. Gallagher and S. S. P. Parkin. Development of the Magnetic Tunnel Junction
MRAM at IBM: From First Junctions to a 16-Mb MRAM Demonstrator Chip.
IBM Journal of Research and Development, 50(1):5–23, 2006.
[53] Takayuki Kawahara, Kenchi Ito, Riichiro Takemura, and Hideo Ohno. Spin-
transfer torque RAM technology: review and prospect. Microelectronics Relia-
bility, 52(4):613–627, 2012.
[54] EETimes Asia. STT-MRAM to lead 4.6B dollars non volatile memory market in
2021, 2016.
[55] Rainer Waser, Regina Dittmann, Georgi Staikov, and Kristof Szot. Redox-based
resistive switching memories–nanoionic mechanisms, prospects, and challenges.
Advanced materials, 21(25-26):2632–2663, 2009.
[56] Micron. 3D XPoint Technology. Technical report, Micron Technology, 2015.
[57] Intel. 3D XPoint Unveiled: The Next Breakthrough in Memory Technology.
Technical report, Intel Corporation, 2015.

100
[58] Z. Fan, D. H.C. Du, and D. Voigt. H-ARC: A non-volatile memory based cache
policy for solid state drives. In MSST, pages 1–11, 2014.
[59] R. L. Mattson, J. Gecsei, D. R. Slutz, and I. L. Traiger. Evaluation Techniques
for Storage Hierarchies. IBM Systems Journal, 9(2):78–117, 1970.
[60] A. V. Aho, P. J. Denning, and J. D. Ullman. Principles of Optimal Page Replace-
ment. Journal of the ACM, 18(1):80–93, 1971.
[61] S. Park, D. Jung, J. Kang, J. Kim, and J. Lee. CFLRU: a Replacement Algorithm
for Flash Memory. In CASES, pages 234–241, 2006.
[62] Biplob Debnath, Sunil Subramanya, David H.C. Du, and David J. Lilja. (Large
Block CLOCK (LB-CLOCK): A write caching algorithm for solid state disks. In
MASCOTS, pages 1–9, 2009.
[63] Jianguo Wang, Dongchul Park, Yang Suk Kee, Yannis Papakonstantinouy, and
Steven Swanson. SSD In-Storage Computing for List Intersection. In DaMoN,
pages 1 – 8, June 2016.
[64] Alireza Haghdoost. sim-ideal: Ideal multi-level cache simulator, 2013.
[65] D. Narayanan, A. Donnelly, and A. I. T. Rowstron. Write Offloading: Practical
Power Management for Enterprise Storage. In FAST, pages 253–267, 2008.
[66] fio. http://freecode.com/projects/fio.
[67] Filebench. http://filebench.sourceforge.net/.
[68] L. A. Belady. A Study of Replacement Algorithms for Virtual Storage Computers.
IBM Systems Journal, 5(2):78–101, 1966.
[69] L. O. Chua. Memristor: The Missing Circuit Element. IEEE Transactions on
Circuit Theory, 18(5):507–519, 1971.
[70] E. Kultursay, M. Kandemir, A. Sivasubramaniam, and O. Mutlu. Evaluating
STT-RAM as an Energy-efficient Main Memory Alternative. In ISPASS, pages
256–267, 2013.

101
[71] B. C. Lee, E. Ipek, O. Mutlu, and D. Burger. Architecting Phase Change Memory
as a Scalable DRAM Alternative. In ISCA, pages 2–13, 2009.
[72] Michael Krause. The Solid State Storage (R-)Evolution. Technical report,
Hewlette Packard, 2012.
[73] E. Lee, H. Bahn, and S. H. Noh. Unioning of the Buffer Cache and Journaling
Layers with Non-volatile Memory. In FAST, pages 73–80, 2013.
[74] L. A. Belady. A Study of Replacement Algorithms for Virtual Storage Computers.
IBM Systems Journal, 5(2):78–101, 1966.
[75] A. V. Aho, P. J. Denning, and J. D. Ullman. Principles of Optimal Page Replace-
ment. Journal of the ACM, 18(1):80–93, 1971.
[76] N. Megiddo and D. S. Modha. ARC: a Self-tuning, Low Overhead Replacement
Cache. In FAST, pages 115–130, 2003.
[77] Daniel Bovet and Marco Cesati. Understanding The Linux Kernel. Oreilly &
Associates Inc, 2005.
[78] Song Jiang, Xiaoning Ding, Feng Chen, Enhua Tan, and Xiaodong Zhang. Dulo:
An effective buffer cache management scheme to exploit both temporal and spatial
locality. In Proceedings of the 4th Conference on USENIX Conference on File and
Storage Technologies - Volume 4, FAST’05, pages 8–8, Berkeley, CA, USA, 2005.
USENIX Association.
[79] H. Jung, H. Shim, S. Park, S. Kang, and J. Cha. Lru-wsr: integration of lru and
writes sequence reordering for flash memory. IEEE Transactions on Consumer
Electronics, 54(3):1215–1223, 2008.
[80] H. Jo, J. Kang, S. Park, J. Kim, and J. Lee. FAB: Flash-aware Buffer Management
Policy for Portable Media Players. IEEE Transactions on Consumer Electronics,
54(3):1215–1223, 2008.
[81] S. Kang, S. Park, H. Jung, H. Shim, and J. Cha. Performance Trade-offs in
Using NVRAM Write Buffer for Flash Memory-based Storage Devices. IEEE
Transactions on Computers, 58(6):744–758, 2009.

102
[82] G. Wu, X. He, and B. Eckart. An Adaptive Write Buffer Management Scheme for
Flash-based SSDs. ACM Transactions on Storage, 8(1):1–24, 2012.
[83] Alireza Haghdoost. sim-ideal: Ideal multi-level cache simulator, 2013.
[84] John S. Bucy and Gregory R. Ganger. The disksim simulation environment version
3.0 reference manual. Technical report, 2003.
[85] SNIA. http://www.snia.org/.
[86] D. Narayanan, A. Donnelly, and A. I. T. Rowstron. Write Offloading: Practical
Power Management for Enterprise Storage. In FAST, pages 253–267, 2008.
[87] V. Tarasov, E. Zadok, and S. Shepler. Filebench: A flexible framework for file
system benchmarking. ;login: The USENIX Magazine, 41(1):6–12, March 2016.
[88] Jingpei Yang, Ned Plasson, Greg Gillis, Nisha Talagala, Swaminathan Sundarara-
man, and Robert Wood. Hec: Improving endurance of high performance flash-
based cache devices. In Proceedings of the 6th International Systems and Storage
Conference, SYSTOR ’13, pages 10:1–10:11, New York, NY, USA, 2013. ACM.
[89] Jian Xu and Steven Swanson. Nova: A log-structured file system for hybrid
volatile/non-volatile main memories. In Proceedings of the 14th Usenix Conference
on File and Storage Technologies, FAST’16, pages 323–338, Berkeley, CA, USA,
2016. USENIX Association.
[90] Asit Dan and Don Towsley. An approximate analysis of the lru and fifo buffer
replacement schemes. In Proceedings of the 1990 ACM SIGMETRICS Conference
on Measurement and Modeling of Computer Systems, SIGMETRICS ’90, pages
143–152, New York, NY, USA, 1990. ACM.
[91] Soyoon Lee, Hyokyung Bahn, and Sam H. Noh. Clock-dwf: A write-history-aware
page replacement algorithm for hybrid pcm and dram memory architectures. IEEE
Trans. Comput., 63(9):2187–2200, September 2014.
[92] Yuanyuan Zhou, Zhifeng Chen, and Kai Li. Second-level buffer cache management.
IEEE Trans. Parallel Distrib. Syst., 15(6):505–519, June 2004.

103
[93] Gala Yadgar, Michael Factor, and Assaf Schuster. Karma: Know-it-all replace-
ment for a multilevel cache. In Proceedings of the 5th USENIX Conference on
File and Storage Technologies, FAST ’07, pages 25–25, Berkeley, CA, USA, 2007.
USENIX Association.
[94] Mark Woods. Optimizing storage performance and cost with intelligent caching.
Technical report, NetApp, August 2010.
[95] Martin Arlitt, Ludmila Cherkasova, John Dilley, Rich Friedrich, and Tai Jin.
Evaluating content management techniques for web proxy caches. SIGMETRICS
Perform. Eval. Rev., 27(4):3–11, March 2000.
[96] Sam Romano and Hala ElAarag. A quantitative study of recency and frequency
based web cache replacement strategies. In Proceedings of the 11th Communica-
tions and Networking Simulation Symposium, CNS ’08, pages 70–78, New York,
NY, USA, 2008. ACM.
[97] mdadm - manage md devices aka linux software raid.
http://neil.brown.name/blog/mdadm.
[98] G. Dhiman, R. Ayoub, and T. Rosing. Pdram: A hybrid pram and dram main
memory system. In ACM/IEEE Design Automation Conference, pages 664–669,
July 2009.
[99] Jason Ansel, Kapil Arya, and Gene Cooperman. Dmtcp: Transparent checkpoint-
ing for cluster computations and the desktop. In Proceedings of the 2009 IEEE
International Symposium on Parallel&Distributed Processing, IPDPS ’09, pages
1–12, Washington, DC, USA, 2009. IEEE Computer Society.
[100] Mesabi at the minnesota supercomputing institute.
https://www.msi.umn.edu/content/mesabi.
[101] Stampede at the texas advanced computing center.
https://www.tacc.utexas.edu/stampede/.
[102] Itasca at the minnesota supercomputing institute.
https://www.msi.umn.edu/content/itasca.

104
[103] Msi purchases new storage system. https://www.msi.umn.edu/content/msi-
purchases-new-storage-system.
[104] J. Kaiser, R. Gad, T. SuB, F. Padua, L. Nagel, and A. Brinkmann. Deduplication
potential of hpc applications checkpoints. In 2016 IEEE International Conference
on Cluster Computing (CLUSTER), pages 413–422, Sept 2016.