Olive Oil Export Markets Selection by MCDM
12
[email protected] 1 THE SELECTION OF TARGET MARKETS FOR TURKISH OLIVE OIL BY MULTI CRITERIA DECISION TECHNIQUES Baris Carikci (Chief Researcher in TUBITAK- TUSSIDE, PhD. Candidate in Istanbul University of Business School) Abstract The production of Turkish olive oil will increase due to new olive trees planted in the recent 10 years. Although there has been a sharp rise of olive oil consumption within in Turkey for the last decade, Turkey will have a big amount of olive oil surplus in the following years. Turkey olive producers have to find export markets for their olive oil surplus. In this research the would-be target countries are found by using AHP. The outcome is compared with a group company targets and target markets for the olive producers are recommended. Propose Worldwide olive oil consumption still is a very small part of total oil consumption. However, increasing health awareness, the fact that olive oil is actually a kind of fruit juice (not chemically modified) and the increase in the purchasing power of developing countries will increase the demand for olive oil in the future (Siskos, 2001). From the sectoral view, it is seen that the 5,5 billion $ olive oil market is dominated by the big players such as Spain and Italy but for the future it seems that they won’t be able to deliver all the demand from developing countries by themselves. In particular, there is no increase in the number of olive trees and area of olive orchards (Table 1) in these countries and periodicity due to the changing weather behavior influences the productivity in a negative manner. These countries has been solving that problem by reexporting, which means that first they import from the olive oil producer countries and then export the imported olive oil to the big markets under their labels. Basically they use the other producer countries as their suppliers (Kavallari, 2006). Table 1. Top Olive Producers in terms of Area of the Orchards (area of ha) Countries 2008 2009 2010 2011 2012 World 9.982.000 9.436.000 9.771.000 10.113.000 10.201.000 Spain 2.483.000 2.449.000 2.475.000 2.503.000 2.427.000 Tunusia 2.400.000 1.900.000 2.300.000 1.600.000 1.700.000 Italy 1.167.000 1.161.000 1.180.000 1.190.000 1.144.000 Morocco 547.000 665.000 830.000 900.000 968.000 Greece 806.000 815.000 834.000 913.000 934.000 Turkey 707.000 727.000 742.000 786.000 805.000 Syria 617.000 635.000 647.000 684.000 695.000 Lebanon 56.000 57.000 53.000 56.000 57.0000 Portugal 347.000 344.000 343.000 343.000 345.000 Algeria 263.000 276.000 282.000 295.000 310.000 Libya 200.000 189.000 205.000 216.000 205.000 Argentina 61.000 56.000 59.000 62.000 64.000 Jordan 64.000 60.000 60.000 62.000 62.000
-
Upload
independent -
Category
Documents
-
view
1 -
download
0
Transcript of Olive Oil Export Markets Selection by MCDM

1
THE SELECTION OF TARGET MARKETS FOR TURKISH OLIVE OIL BY MULTI
CRITERIA DECISION TECHNIQUES
Baris Carikci (Chief Researcher in TUBITAK- TUSSIDE, PhD. Candidate in Istanbul University of Business School)
Abstract
The production of Turkish olive oil will increase due to new olive trees planted in the recent 10 years.
Although there has been a sharp rise of olive oil consumption within in Turkey for the last decade,
Turkey will have a big amount of olive oil surplus in the following years. Turkey olive producers have
to find export markets for their olive oil surplus. In this research the would-be target countries are found
by using AHP. The outcome is compared with a group company targets and target markets for the olive
producers are recommended.
Propose
Worldwide olive oil consumption still is a very small part of total oil consumption. However, increasing
health awareness, the fact that olive oil is actually a kind of fruit juice (not chemically modified) and the
increase in the purchasing power of developing countries will increase the demand for olive oil in the
future (Siskos, 2001).
From the sectoral view, it is seen that the 5,5 billion $ olive oil market is dominated by the big players
such as Spain and Italy but for the future it seems that they won’t be able to deliver all the demand from
developing countries by themselves. In particular, there is no increase in the number of olive trees and
area of olive orchards (Table 1) in these countries and periodicity due to the changing weather behavior
influences the productivity in a negative manner. These countries has been solving that problem by
reexporting, which means that first they import from the olive oil producer countries and then export the
imported olive oil to the big markets under their labels. Basically they use the other producer countries
as their suppliers (Kavallari, 2006).
Table 1. Top Olive Producers in terms of Area of the Orchards (area of ha)
Countries 2008 2009 2010 2011 2012
World 9.982.000 9.436.000 9.771.000 10.113.000 10.201.000
Spain 2.483.000 2.449.000 2.475.000 2.503.000 2.427.000
Tunusia 2.400.000 1.900.000 2.300.000 1.600.000 1.700.000
Italy 1.167.000 1.161.000 1.180.000 1.190.000 1.144.000
Morocco 547.000 665.000 830.000 900.000 968.000
Greece 806.000 815.000 834.000 913.000 934.000
Turkey 707.000 727.000 742.000 786.000 805.000
Syria 617.000 635.000 647.000 684.000 695.000
Lebanon 56.000 57.000 53.000 56.000 57.0000
Portugal 347.000 344.000 343.000 343.000 345.000
Algeria 263.000 276.000 282.000 295.000 310.000
Libya 200.000 189.000 205.000 216.000 205.000
Argentina 61.000 56.000 59.000 62.000 64.000
Jordan 64.000 60.000 60.000 62.000 62.000

2
For the last decade the number of olive trees in Turkey has increased from 90 million to 160 million
(Table 2). It is expected that the olive oil production will have reached 500 thousand tones by 2023.
Turkey’s performance is not satisfactory with 141 million dollar export of olive oil. Turkey’s top
performing export countries for olive oil is given supplement A. The quality and labelling is insufficient
and the production of the small and medium sized companies is too low and to supply the big amount
of olive oil demanded by the giant companies such as Metro, Real, Wallmart, Carrefour (Tunalioglu,
2011). Unless Turkey wants to be trapped by Italy and Spain, Turkey has to find its own markets, where
Turkey can gain more added values and find sustainability in the export.
Table 2. Turkey Olive Oil Tree Existence
(Million Trees) 2005 2006 2007 2008 2009 2010 2011 2012 2013
Fertile 96 97 104 106 109 111 117 120 129
Not Mature 16 31 40 45 44 45 37 37 37
Total 113 129 144 151 153 157 155 157 167
Turkey’s olive oil export has been quite variable for the last decade and the quantity depends on the
demand from Spain and Italy or Spain’s total supply. Unless there is a supply problem (weather
condition) in these countries, Turkey is not good in exporting olive oil. In Table 3 and Figure 1 (in terms
of 1000 $) we can see the trends and numbers of Turkey olive oil export. Turkey olive oil increased only
in the years when there was a demand from Italy and Spain. In 2005 the %65 of export goes to Spain
and Italy. When there is no demand from Italy or Spain, total export cannot exceed 100,000,000 $.
Table 3.Turkey’s Olive Oil Export
Total
Export
Other
Countries
Italy and Spain Italy (A) Spain (B) %
(A+B)
2005 299,999 104,442 195,557 126,944 68,613 65.19
2006 179,388 102,195 77,193 66,348 10,845 43.03
2007 134,580 99,956 34,624 28,933 5,691 25.73
2008 71,066 66,088 4,978 4,978 - 7.00
2009 96,202 79,343 16,859 14,464 2,395 17.52
2010 64,232 59,524 4,708 3,767 941 7.33
2011 49,409 49,231 178 178 - 0.36
2012 76,773 67,367 9,406 4,088 5,318 12.25
2013 294,543 194,011 100,532 39,402 61,130 34.13
2014 87,977 87,283 694 694 - 0.79
Average Price 3,380 $ 3,655 $ 3,010$ 3,180 2,892

3
Figure 1. Turkey’s Olive Oil Export Trend
As a result we can say that Turkey’s olive oil production will increase in the future due to the increase
in Olive Trees. However, Turkey’s export capacity is quite limited because of quality problems, bad
branding and supply variation. Turkey’s current situation shows that Turkey only can export if dominant
players cannot supply. Turkey must find the export countries to market its own olive oil for better
economic outcome. That means Turkey must discover best target markets (in terms of price,
sustainability, competition, tariffs) for olive oil. Since there are a lot of conflicting criteria’s to determine
the target markets, multi criteria techniques are useful to fulfill this job.
Literature Research
Toksari (2008) investigated in his research to determine the target markets for durable goods producers
in Interior Anatolia region Turkey. In the research the region was divided into 4 sub-region and 5 main
criteria groups to compare these alternatives. MCDM (Multi Criteria Decision Making) were used for
ordering the sub-regions.
Zhao (2011) tried to explore the target regions for China’a textile export by using fuzzy AHP. They use
5 main criteria groups and 5 clustered region for target markets. The criteria’s used in this research are
not only related with market quantity but also economic variables and political stability. MCDM were
used for ordering the country clusters.
Nowak (2012) made a descriptive research for the target countries for olive oil. In the report, the
countries are ordered according to 4 main criteria’s (market size, unit price, quantity of import, market
grow). Since these criteria’s are in conflict, they need to be weighted and ordered in general, but the
research is limited with descriptive results.
0
50.000
100.000
150.000
200.000
250.000
300.000
350.000
2005 2006 2007 2008 2009 2010 2011 2012 2013 2014
Total Export Others Spain and Italy

4
Buerki (2014) developed a methodology to explore the export potential of the countries. In this research
number of criteria’s are developed to order the countries and whether there is a significant difference
among country clusters.
Miencinskine (2013) made a research by using MCDM for determining export targets in Europe. The
criteria’s are weighted by experts and then normalized country values for criteria’s are multiplied by
wiegths.
Ozturk (2015) also developed a list of criteria’s to compare the countries, but it is just a literature review
of the past academic research. MCDM is not used for and ordering.
Brewer (2007) designed a model to predict the export promising countries for Australia. The research
uses a statistical method whether a country is good export market or not.
Cavuslugil (2004) developed two phases for export markets. First 10 country clusters are created and
then each cluster is assessed according to own merits, which are normalized country economic and
sociologic variables.
Atalay (2012) used MCDM to decide the export markets for Turkey’s timber and timber products. 5
main and 32 sub criteria’s are designed to order the alternative countries.
Selection of Criteria’s
In this research, the target markets for the export growth of the olive oil of Turkey are chosen by using
MCDM techniques. The criteria’s are selected not only from the current potential of the olive oil
consumption but also from the future potential of the olive oil consumption. There are 4 main criteria’s
including 15 sub criteria’s. The criteria’s are collected from the literature and discussed with a group
expert consisting of 10 people from producers, academicians and non-government organizations. The
hierarchy among the criteria’s are shown below (Figure 2).

5
Figure 2. Hierarchy of Criteria’s
Weight of Criteria’s
The weights of the criteria’s are calculated by using Analytical Hierarchy Process. The pairwise
comparisons are determined by the individuals in the group. The comparisons are united by using
geometric mean. First main criteria’s are compared and then sub criteria’s are compared within each
main criteria. The final weight are found by multiplying the main criteria and sub criteria weight. In
Table 4, the weight of the criteria’s are given. No threshold for conformity are exceeded in each
comparison. A sample is given below Table 5.
1 2 3 4 Weights
1. Economy 0,14 0,12 0,18 0,13 0,14
2. Olive Oil Market 0,35 0,30 0,31 0,27 0,31
3. Business Relation with Turkey 0,22 0,27 0,28 0,32 0,27
4. Turkey's Current Position in the Market 0,29 0,31 0,24 0,28 0,28
Target Marktes
Economy
GDP per a person
Gini Cofficient
Increase GDP per a person
Olive Oil Market
Import of Olive Oil
Import Unit Price
HHI
Net Export
Business Relation with Turkey
Turkey's share in the import of the country
Business Distance
Tariff
Increase in Trade with Turkey
Turkey's Current Position in the Market
Market Share
Unit Price
Inrease in Market Share
Geographical Distance

6
Table 4. The Weight of the Criteria’s
Main Criteria Weight Sub Criteria Weight Final Weight
Economy 0,141
GDP per a person 0,387 0,055
Gini coefficient 0,388 0,055
Increase GDP per a person 0,224 0,032
Olive Oil Market 0,307
Import of Olive Oil 0,323 0,099
Import Unit Price 0,390 0,120
HHI 0,106 0,033
Net Export 0,181 0,056
Business Relation
with Turkey
0,267
Turkey's share in the import
of the country
0,200 0,053
Business Distance 0,364 0,097
Tariff 0,149 0,040
Increase in Trade with Turkey 0,288 0,077
Turkey's Current
Position in the
Market
0,282
Market Share 0,234 0,066
Unit Price 0,174 0,049
Increase in Market Share 0,390 0,110
Geographical Distance 0,201 0,057
The main criteria’s to order the countries are economic situation, olive oil market, economic relation
and culture differences and Turkey’s position in olive oil market. In general, the criteria’s are not only
related with the current position of the market but also the criteria’s chosen are also related with the
future of the market. From that point of view, the research is successful to find the markets with a future
potential. When the weights of main criteria’s are compared, all of them expect economic situation
criteria’s have nearly the same weight. The current olive oil market with 30.7% is the most important
main criteria. The trade and cultural closeness criteria %26.7. The current situation of Turkey in the
market is 28.2%. Economic situation of the country is only 14.1% respectively. The most important sub
criteria is the unit price of olive oil paid by the country (%12).
Finding Alternatives
Though in the beginning all countries were supposed to be would-be target markets, the experts
discussed that the assessment of the countries which imports less than 30 million $ from Turkey are not
necessary to take into account. The countries are filtered according to this assumption and totally 130
countries are found above the limit. For these 130 countries, the value of each criteria are found from
internet data bases and normalized with respect to selected suitable normalization method. The summary
of internet data bases and normalization methods used for each criteria is given below Table 6.

7
Table 6. Data Sources and Normalization Methods
Main Criteria Sub Criteria Data Source Normalization1
Economic GDP per a person www.imf.org Xcountry/Xmax
Gini coefficient www.worldbank.org (1/Xcountry)/(1/Xmax)
Increase GDP per a
person
www.imf.org Xcountry/Xmax
Olive Oil
Market
Import of Olive Oil http://www.trademap.org/ Xcountry/Xmax
Import Unit Price http://www.trademap.org/ Xcountry/Xmax
HHI http://www.trademap.org/ (1/Xcountry)/(1/Xmin)
Net Export http://www.trademap.org/ Xcountry/(Xmax - Xmin)
Business
Relation with
Turkey
Turkey's share in the
import of the country
www.tuik.gov.tr Xcountry/Xmax
Business Distance http://geert-hofstede.com (1/Xcountry)/(1/Xmin)
Tariff www.tuik.gov.tr Xcountry/(Xmax - Xmin)
Increase in Trade with
Turkey
www.tuik.gov.tr (1/Xcountry)/(1/Xmin)
Turkey's
Current
Position in the
Market
Market Share http://www.trademap.org/ Xcountry/Xmax
Unit Price www.tuik.gov.tr Xcountry/(Xmax - Xmin)
Increase in Market
Share
http://www.trademap.org/ Xcountry/Xmax
Geographical
Distance
http://www.timeanddate.com
http://www.trademap.org/
Xcountry/Xmax
Ordering Countries
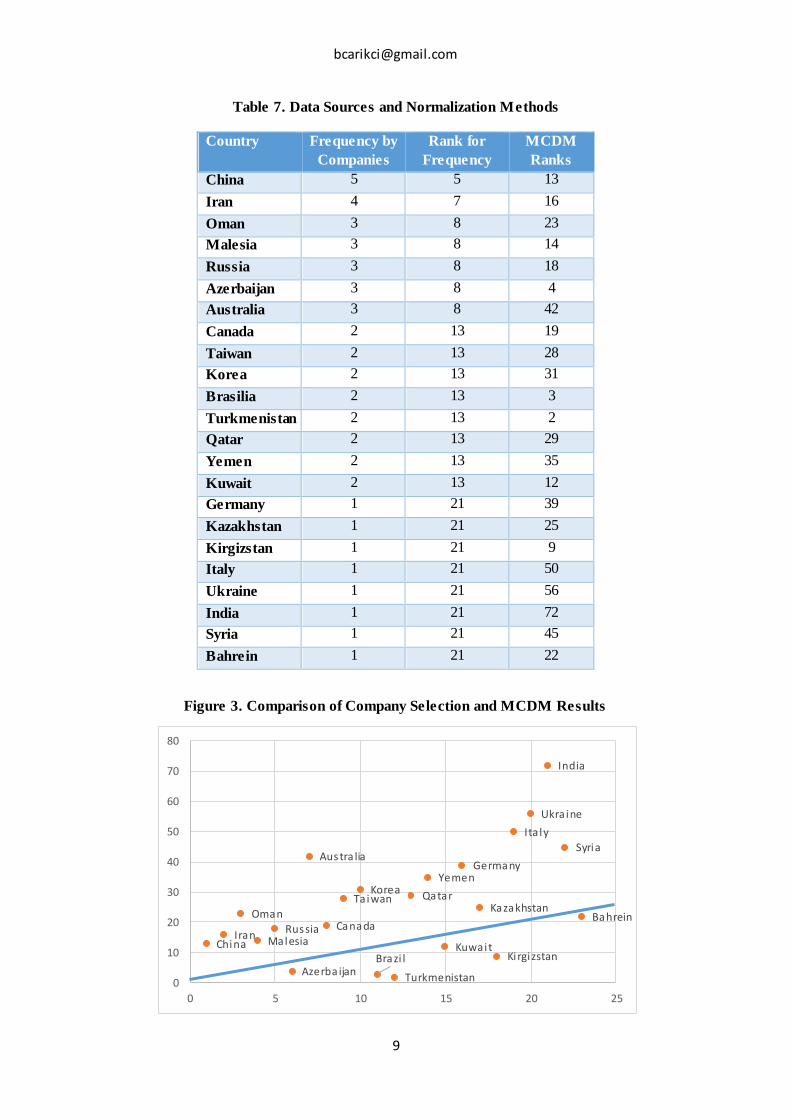
The target markets are ordered by using Simple Additive Weighting Methods. The results are compared
also with the expectation of the 20 companies’ top fours. Table 6 shows the ranking of the countries
according to general points they collected from MCDM. In Table 7 and Figure 3 Company target
markets and MCDM results are given. In Figure 3 vertical axis is the rank of MCDM and horizontal is
the result of the company surveys. The line in the middle creates two spatial. The spatial below shows
the countries with good company results but relatively bad MCDM results. The spatial above shows the
countries with good MCDM results good but relatively bad company results.
1 Xcountry is the value of investigated country in this criteria, Xmax is the maximum value in this criteria, Xmin is the
minimum value in this criteria

8
Table 6. Rank of the Countries
Countries General Rank Economy Rank Market Rank Relation with
Turkey Rank
Turkey’s Position
in Olive Oil
Market
Rank
USA 0,52 1 0,08 4 0,24 1 0,10 54 0,09 76
Turkmenistan 0,50 2 0,06 31 0,09 81 0,19 1 0,17 3
Brazil 0,50 3 0,06 24 0,18 6 0,16 4 0,09 81
Azerbaijan 0,49 4 0,07 9 0,05 120 0,18 2 0,19 1
Iraq 0,48 5 0,04 108 0,09 70 0,17 3 0,18 2
Japan 0,47 6 0,06 34 0,19 4 0,10 51 0,12 27
Switzerland 0,47 7 0,08 6 0,17 7 0,10 49 0,12 30
UAE 0,46 8 0,10 2 0,14 12 0,12 25 0,10 54
Kirgizstan 0,44 9 0,04 107 0,10 47 0,15 8 0,14 10
Saudi Arabia 0,43 11 0,08 5 0,12 22 0,12 28 0,12 35
9
Table 7. Data Sources and Normalization Methods
Country Frequency by
Companies
Rank for
Frequency
MCDM
Ranks
China 5 5 13
Iran 4 7 16
Oman 3 8 23
Malesia 3 8 14
Russia 3 8 18
Azerbaijan 3 8 4
Australia 3 8 42
Canada 2 13 19
Taiwan 2 13 28
Korea 2 13 31
Brasilia 2 13 3
Turkmenistan 2 13 2
Qatar 2 13 29
Yemen 2 13 35
Kuwait 2 13 12
Germany 1 21 39
Kazakhstan 1 21 25
Kirgizstan 1 21 9
Italy 1 21 50
Ukraine 1 21 56
India 1 21 72
Syria 1 21 45
Bahrein 1 21 22
Figure 3. Comparison of Company Selection and MCDM Results
ChinaIran
Oman
MalesiaRussia
Azerba ijan
Austra lia
Canada
TaiwanKorea
Brazi l
Turkmenistan
Qatar
Yemen
Kuwait
Germany
Kazakhstan
Kirgizstan
Ita ly
Ukra ine
India
Syria
Bahrein
0
10
20
30
40
50
60
70
80
0 5 10 15 20 25

10
Result
The research shows that instead of exporting developed markets, Turkey has to choose the markets,
where economic activity has been increasing and where the taste of the olive oil has been recently
discovered. Especially the countries with the similar business culture, close trade relations and GDP
growth can be selected as target markets for the future. The olive oil production companies still feel that
their target markets should be today’s markets. That means, they are much oriented with the high
consumption markets in the world. On the other hand, the research shows that the Turkish companies
should try to approach the developing markets, because there is a big tendency of the olive oil
consumption increase in those countries and they really pay high prices for the olive oil.
The rich Middle East countries should be target markets because they pay high prices and Turkey has
the advantage of logistic costs and business experience. Even though the consumption of Turkic
republics are very limited today, their economic performance indicates that they could be consumers
with the high prices of the future and Turkey’s close relation with these countries is a clear competitive
advantage. BRIC (Brazil, Russia, India, and China) countries should be very attractive for Turkey,
because of high economic growth and olive oil consumption potential. European countries are not seen
very attractive in this research because they protect Italy and Spain by holding high tariffs on Turkey.
Even though Spain and Italy are the top importers, they are also not seen attractive for export market
due to their reexport policy.
The most important fact that is revealed in this research is that the future of the Turkey’s export is the
olive oil consumption of the developing countries. The consumption of the developed markets has
increased just 200 million dollar from 4.4 billion to 4.6 billion dollar for the last decade. Turkey has
limited chance in those markets because they were conquered by Italy and Spain and high tariffs are in
effect for Turkish olive oil. On the other hand, the consumption of the developing countries has tripled
from 300 million dollar to 1 billion dollar. As the results show, developing countries should be direction
of Turkish olive oil export.

11
Supplement A: Turkey’s Export Performance for Olive Oil According to Value in $
Importing
Countries
2013
Export
($)
2013
Net
Export
($)
Share in
Turkey’s
Export (%)
2013
Export
Quantity
(tone)
2013
Unit
Price
($/ton)
2009 –
2013
Growth
% ($)
2009 –
2013
Growth
% (tone)
2012 -
2013
Growth
% ($)
Rank of
importing
country in $
in the World
Share of
importing
country in $
in the world
Tariff
(%)
Total 141.079 140.811 100 42.354 3.331 30 35 198
1. USA 36.721 36.566 26 11.034 3.328 50 60 282 2 14,3 0
2. Spain 27.567 27.567 19,5 9.532 2.892 1.498 4 6 39,9
3. Saudi Arabia 18.233 18.233 12,9 5.376 3.392 21 22 40 22 0,6 5
4. Japan 13.463 13.463 9,5 3.571 3.770 15 17 134 8 3,8 0
5. Iran 9.245 9.245 6,6 3.083 2.999 109 119 509 33 0,2 50
6. Italia 5.844 5.815 4,1 1.838 3.180 214 156 12.887 1 26,5 39,9
7. China 3.880 3.880 2,8 956 4.059 32 29 21 9 3,1 10
8. Canada 3.485 3.485 2,5 959 3.634 18 21 168 11 2,4 0
9. UAE 2.573 2.573 1,8 717 3.589 -1 -1 42 23 0,3 5
10. Yemen 2.484 2.484 1,8 692 3.590 88 88 775 72 0 5

12
Sources
Brewer P., (2007) Physical Distance and Australian Export Market Selection, Australian
Jounal of Management, Vol:32,
Buerki T., Mohan R., Lizardi S., (2014) International Market Selection Criteria for
Emergimg MArkets, The Journal of Business Strategy,
Kavallari A., Maas, S., Schitz, M., ( 2011), Examining the determinants of Olive oil demand
in nonproducing countries: evidence from Germany and the UK, Journal of
Products Marketing, 2011
Miecinskiene A., Stasyte V., Kazlauskaite J., (2013) Reasoning of Export market selection,
Business, Procidia Management and Education,
Nowak D., (2008),International Market Selection: Developing a regional spesific procedure
for central and east europe, Journal of Transnational Mangement Development
Procidia Engineering
Ozturk A., Joiner E., Cavuslugil T. (2015) , Delineating Foreign Market Potentia: A tool for
International Market Selection, Thunderbird Business Review,
Siskos Y., Matsatnis N., Baourakis G., (2001) Multicriteria Analysis in Agriculture
marketing: the cases of french Olive Oil Markets, European Journal of
Operational Research
Toksarı M., Toksarı D., (2011) Bulanık Analitik Hiyerarşi Prosesi Yaklaşımı Kullanılarak
Hedef Pazarın Belirlenmesi, ODTU Gelişme Dergisi
Tunalıoğlu R., (2008) new aproaches and changes in olive oil marketing in Turkey,
International Syposium on Olive Growing
Yüksel İ., Akın A., (2006), Analitik Hiyerarşi Prosesi Yöntemiyle İşletmelerde Strateji
Belirleme, Doğuş Üniversitesi Dergisi, 2006
Zhao J., Li J., Li L. (2011), An Analysis on the Target Market of China’s Textile and Garment
Export Trade, Procidia Engineering
Url-1 <http:// www. uzzk.org.tr>, alındığı tarih: 18.04.2015.
Url-2 <http:// www.trademap.org/ >, alındığı tarih: 12.04.2015.
Url-3 <http:// www.egebirlik.org.tr / >, alındığı tarih: 10.04.2015.
Url-4 <http:// http://geert-hofstede.com/turkey.html/ >, alındığı tarih: 11.04.2015.
Url-5 <http:// www.imf.org/ >, alındığı tarih: 14.04.2015.