Case Study Analysis of a Heavily Loaded Road Pavement Structure Constructed on Black Cotton Soil
Upload
independentCategory
view
3download
0
lable at ScienceDirect
Atmospheric Environment 98 (2014) 168e178
Contents lists avai
Atmospheric Environment
journal homepage: www.elsevier .com/locate/atmosenv
Spatial and seasonal variation and source apportionment of volatileorganic compounds (VOCs) in a heavily industrialized region
Yetkin Dumanoglu*, Melik Kara, Hasan Altiok, Mustafa Odabasi, Tolga Elbir,Abdurrahman BayramDepartment of Environmental Engineering, Faculty of Engineering, Dokuz Eylul University, Tinaztepe Campus, 35160 Buca, Izmir, Turkey
h i g h l i g h t s
� Aliphatic hydrocarbons were the predominant VOCs in the Aliaga atmosphere.� Major sources were refinery, petrochemical industry, diesel exhaust, and solvent use.� The largest contribution (54%) to VOCs was from the refinery and petroleum products.� Carcinogenic risks were the highest for 1,2-dichloroethane followed by benzene.
a r t i c l e i n f o
Article history:Received 18 March 2014Received in revised form17 July 2014Accepted 21 August 2014Available online 23 August 2014
Keywords:Volatile organic compounds (VOCs)Positive matrix factorization (PMF)Source apportionmentRisk assessmentAliaga
* Corresponding author.E-mail addresses: [email protected], y
http://dx.doi.org/10.1016/j.atmosenv.2014.08.0481352-2310/© 2014 Elsevier Ltd. All rights reserved.
a b s t r a c t
Source apportionment is generally applied to a time series of pollutant concentrations measured at asingle site. However, in a complex airshed having multiple pollutant sources, it may be helpful to collectsamples from several sites to ensure that some of them have low contributions from specific sources.Ambient air samples (n ¼ 160) were collected by passive sampling during four seasons in 2009 and 2010at forty different sites in Aliaga, Turkey to determine the spatial, seasonal variations and possible sourcesof volatile organic compounds (VOCs). Fifty-eight VOCs (S58VOC) were detected. S58VOC concentrationsranged between 0.1 and 1770 mg m�3 (avg ± SD, 67 ± 193 mg m�3). Aliphatic hydrocarbons were generallypredominant with a high percentage of contribution (31%e88%) at all sites. Aromatic VOCs were thesecond highest group (8e50%), followed by halogenated VOCs (1e24%) and oxygenated VOCs (0.04e5.9%). Highly variable spatial distribution of ambient VOC concentrations suggested that the majorsources in this region were industrial plants. Generally, VOC concentrations were higher in summer thanin winter probably due to increased volatilization from their sources at higher ambient temperatures.However, high atmospheric VOC concentrations were also observed in winter and fall near the petroleumrefinery and petrochemical complex, probably due to the calm conditions and high atmospheric stabilitythat is commonly encountered during the winter months in the area, restricting the dilution of pollut-ants. The newest version of EPA PMF (V5.0) (Positive Matrix Factorization) having the capability ofhandling multiple site data was used for source apportionment. Refinery and petroleum products,petrochemical industry, solvent use and industrial processes, and vehicle exhaust were the identifiedVOC sources in the study area, contributing 56%, 22%, 12%, and 10%, respectively to the S58VOC con-centrations. Carcinogenic risks due to lifetime exposure to seven VOCs were also estimated. Estimatedrisks were the highest for 1,2-dichloroethane, followed by benzene, chloroform, and carbon tetrachlo-ride. Carcinogenic risks for trichloroethene, 1,1,2-trichloroethane, and bromoform were lower than thegeneral acceptable risk level of 1.0 � 10�6. However, risks for 1,2-dichloroethane, benzene, chloroform,and carbon tetrachloride were substantially higher than the acceptable level. It was concluded thatcarcinogenic risks may reach considerably high levels for a significant portion of the population living inthe study area.
© 2014 Elsevier Ltd. All rights reserved.
[email protected] (Y. Dumanoglu).
Y. Dumanoglu et al. / Atmospheric Environment 98 (2014) 168e178 169
1. Introduction
Volatile organic compounds (VOCs) significantly affect thechemistry of atmosphere and human health. They play an impor-tant role in the formation of secondary pollutants (i.e., troposphericozone, peroxyacetylnitrate, and secondary organic aerosols), mayenhance the global greenhouse effect (Finlayson-Pitts and Pitts,2000), and some of them can contribute to stratospheric ozonedepletion. Their toxic and carcinogenic human health effects arealso well known (Dewulf and Langenhove, 1999; Guo et al., 2004;Srivastava et al., 2005).
VOCs can be emitted from combustion processes utilizing fossilfuels, petroleum refining, storage and distribution of petroleumproducts, solvent use and several other industrial processes (Cetinet al., 2003; Lin et al., 2004). In urban atmospheres, high concen-trations of VOCs mainly originate from motor vehicle exhausts andevaporative emissions (Elbir et al., 2007). Emission from thevegetation is also an important source for some highly reactiveVOCs (Kalabokas et al., 2001; Guenther et al., 2006).
Among chemical industries, petroleum refineries and petro-chemical plants have been identified as large emitters of VOCs(Deluchi, 1993; Chen et al., 2005; Rao et al., 2007; Pandya et al.,2007; Yen and Horng, 2009; Baltrenas et al., 2011). Aliaga indus-trial region located near Izmir, Turkey is one of the most pollutedareas in the country in terms of persistent organic pollutants(POPs), particulate matter, inorganic pollutants and trace elements(Elbir, 2002; Elbir and Muezzinoglu, 2004; Cetin et al., 2007; Cetinand Odabasi, 2007; Bozlaker et al., 2008a, 2008b; Odabasi et al.,2009; Kaya et al., 2012). This region also contains several VOCsources including a large petroleum refinery, a petrochemicalcomplex and several ironesteel plants with electric arc furnaces(EAFs). Although the area has been studied in detail for POPs, therehas been limited number of studies on VOCs (Cetin et al., 2003;Civan et al., 2009, 2012). The objectives of this study were (1) todetermine the spatial and seasonal variation of ambient concen-trations of VOCs, (2) to identify and apportion possible VOC sourcesusing EPA PMF (V5.0), and (3) to assess the carcinogenic risks due toinhalation exposure to these compounds in Aliaga, Turkey. Ambientconcentrations of 58 VOCs were measured at 40 sites during fourseasons (summer, fall, winter and spring) between June 2009 andApril 2010 (n ¼ 160). Data was resolved by EPA PMF to determinethe most important sources contributing to ambient concentra-tions. Carcinogenic risks associated with inhalation exposure toVOCs were also estimated using the measured ambient air con-centrations and unit risk values. To our knowledge, this is one of thefirst detailed studies investigating the VOCs in the Aliaga industrialregion.
2. Materials and methods
2.1. Sampling program and sample collection
The study area (Aliaga industrial region, Turkey) is located~45 km north of the metropolitan city of Izmir, Turkey. The regioncontains several pollutant sources, including a large petroleumrefinery and a petrochemical complex, several petroleum and pe-troleum storage tank fields, several ferrous scrap processing iron-esteel plants with electric arc furnaces (EAFs), scrap storage andclassification sites, steel rolling mills, coal storage and packaging, anatural gas-fired power plant, very intense transportation activitiesof ferrous scrap trucks, heavy road traffic, ship breaking yards, andbusy ports with scrap iron dockyards (Fig. 1).
Ambient VOCs were collected using passive sampling cartridges(Radiello, Code 130) (Parra et al., 2006; Roukos et al., 2009;Villanueva et al., 2014), consisting of a stainless steel mesh
cylinder (100 mesh grid opening and 5.8 mm diameter) packedwith 530 ± 30 mg of activated charcoal (particle size 35e50 mesh)(Fig. S1).
Ambient air samples were collected during four seasons at fortydifferent sites in the Aliaga industrial region. Long-term(1954e2013) average air temperatures were provided from Turk-ish State Meteorological Service (http://www.mgm.gov.tr) as 28,18.8, 8.8, and 15.8 �C for summer, fall, winter, and spring, respec-tively. The sampling periods were selected as 04e09 July 2009,02e09 September 2009, 04e11 January 2010, and 05e12 April2010, representing the summer, fall, winter, and spring, respec-tively. A total of 160 samples were collected (40 sites � 4 seasons).Average sampling time ranged between 5 and 7 days. Similar tolong-term seasonal values, average air temperatures were 27.1,19.9,9.3, and 15.9 �C for summer, fall, winter, and spring sampling pe-riods, respectively. The prevailing winds are from northwesterlyand southeasterly directions in the region. The annual prevailingwind directions were fromWNW (26.5%) NW (13.3%) N (13.0%) andS (8.8%) while the mean wind speeds were 3.2, 3.2, 3.0, and3.1 m s�1 for summer, fall, winter, and spring sampling periods,respectively.
2.2. Sample preparation and analysis
Passive sampling cartridges within their sealed glass containerswere labeled and capped to avoid any contamination and desorp-tion. The samples were placed into tightly closed plastic bags andkept in a freezer until they were processed. During measurement,cartridges for VOCs were placed in a diffusive body (made of pol-ycarbonate and microporous polyethylene, 50 mm long, 16 mmdiameter, 5 mm wall thickness and 10 mm pore size) and thesediffusive bodies were fixed onto triangular polycarbonate sup-porting plates. A polypropylene mountable shelter protected thesampler from rain and direct sunlight during the sampling. Themountable shelter and samplers were placed at 1.5 m above theground (Fig. S2).
After sampling, contents of cartridges were placed into tubesand 2.0 ml carbon disulfide (CS2, SigmaeAldrich) was added as theextraction solvent. Samples were extracted in an ultrasonic bath for15 min. Then the cartridge was discarded from the tube and theextracts were centrifuged for another 15min to obtain a clear phaseat the top (Radiello, 2014). The extracted samples were stored in afreezer at �20 �C until they were analyzed.
The samples were analyzed with a gas chromatograph (GC)(Agilent 6890N) equipped with a mass selective (MS) detector(Agilent 5973 inert MSD). The chromatographic column was HP5-MS (30 m, 0.25 mm, 0.25 mm) and the carrier gas was helium at1mlmin�1 and36cms�1 linearvelocitywitha split ratioof 1:20. Theinlet temperaturewas 240 �C. The temperature programwas: initialoven temperature 40 �C, hold for 3 min, 40e120 �C at 5 �C min�1,hold for 1 min. Ionization mode of the MS was electron impact (EI).Ion source, quadrupole, and GC/MSD interface temperatures were230, 150, and 280 �C, respectively. The MSD was run in selected ionmonitoring. Compounds were identified based on their retentiontimes (within ±0.05 min of the retention time of calibration stan-dard), target and qualifier ions. Identified compounds were quan-tified using the external standard calibration procedure.
Following the analysis, the VOC concentrations in air (averagedover the exposure time interval) were calculated by a mass balancefrom the pollutant masses retained on the cartridge:
CVOC ¼ md �mbQK � t
� 106 (1)

Fig. 1. Map of the study area.
Y. Dumanoglu et al. / Atmospheric Environment 98 (2014) 168e178170
where md is the adsorbed mass of compound (mg) sampled duringtime t (min) under the concentration in air CVOC (mg m�3), mb themass of compound (mg) on a non-exposed cartridge (blank) and QKis the sampling rate of the compounds (ml min�1). Sampling rates(at 298 K) that were provided by the manufacturer were used incalculations for most of the compounds. For some compounds thesampling rates were not available. The following equation providedby the manufacturer was used for these compounds:
QK ¼ D�
2664 2ph
ln�rdra
�3775 (2)
where D is the diffusion coefficient of the compound in air(cm2 min�1), h is the height of the cylinder (cm), rd is the radius ofthe diffusive cylindrical surface (cm), and ra is the radius of theadsorbing surface (cm).
Sampling rates vary with temperature as expressed by thefollowing Equation:
QK ¼ Q298 ��
T298
�1:5(3)
where QK is the sampling rate at the temperature T (K) and Q298 isthe reference value at 298 K. The sampling rate has a variation of±5% for 10 �C temperature difference. QK is invariant with humiditywithin the range of 15e90% and wind speed between 0.1 and10 m s�1. For the calculation of the VOC concentrations during thefour sampling periods, sampling rates were adjusted using thecorresponding average temperatures measured.
2.3. Quality control/quality assurance
Quantifiable VOC amounts (instrumental detection limits, IDL)were determined from linear extrapolation from the lowest stan-dard in calibration curve using the area of a peak having a chro-matographic signal/noise ratio of 3. These amounts ranged from 2to 5 pg (for 1 ml injection, split ratio 1:20). Blank sample cartridges

Y. Dumanoglu et al. / Atmospheric Environment 98 (2014) 168e178 171
were used to determine if there was any contamination during thesampling and extraction. For the field blanks, four diffusive sam-plers for each campaign were taken to the sampling site andreturned to the laboratory, extracted and analyzed like the samples.The extraction solvent (CS2) was also analyzed for the same pur-pose. None of the VOCs were detected in the solvent blanks whileonly a few compounds were detected in cartridge blanks. The blankamounts were generally <1% of the sample amounts. For thecompounds detected in blanks the method detection limit (MDL)was defined as the mean blank mass plus three standard de-viations. Instrumental detection limits were used for the com-pounds that were not detected in blanks. Sample quantitiesexceeding the MDL were quantified and corrected by subtractingthe mean blank amount from the sample amount. For seven dayssampling period, MDLs for analyzed VOCs ranged between 0.002(p-diethylbenzene) and 0.50 (n-pentane) mg m�3. During thesampling periods reproducibility tests were performed by collo-cating three replicate diffusive samplers at some sampling siteshaving high as well as low VOC concentrations. Relative standarddeviations of VOC concentrations determined from replicate sam-plings were generally less than 10% and they ranged between 1%(1,2-dichloroethane) and 8% (n-nonane).
2.4. Positive matrix factorization (PMF)
Positive matrix factorization (PMF) has been widely used as areceptor modeling tool (Jorquera and Rappengluck, 2004; Brownet al., 2007; Lee et al., 2008; Chan et al., 2011; Habre et al., 2011;Mansha et al., 2012; Wang et al., 2012). Basic information relatedto PMF has been discussed by Hopke (2003). PMF has some sig-nificant advantages over the principal component analysis (PCA).The main advantage is the uncertainty-weighting of each datapoint in PMF, as opposed to the implicit assumption made intraditional PCA settings that each data point has an equal weight. Asecond advantage is that the factors in PMF are not necessarilyorthogonal to each other. This meets the observation of real-sourcesignatures which are also not orthogonal to each other. Further-more, the non-negativity constraint in PMF is an additionaladvantage.
In PMF model a matrix X of data of dimension n rows and mcolumns, where n and m are the number of samples and thenumber of species, can be factorized into two matrixes, namelyG(n � p) and F(p � m), and the residual matrix, E, where p is thenumber of factors.
X ¼ GF þ E (4)
The product of G and F explains the systematic variations in X.The residuals, Eij can be expressed as:
Eij ¼ Xij �Xph¼1
Gih,Fhj (5)
The object function Q that has to be minimized is defined as:
QðEÞ ¼Xmi¼1
Xnj¼1
"EijSij
#2(6)
where Sij is the uncertainty in Xij. The next step of the process is tominimize Q as a function of G and F with the constraints of all el-ements of G and F to be non-negative. The solution of Equation (6)is obtained using the program of PMF (Paatero, 1997).
Data was resolved using the EPA PMF (V5.0) (U.S. EPA, 2014a).The input data file consisted of receptor concentration (C) anduncertainty (U) matrices. U for each variable was calculated using C
and the method detection limit (MDL). If C was above the MDL, Uwas assumed to be (0.1C þMDL/3), and if else C replaced by MDL/2and U was assumed to be (0.2C þ MDL/3) (Tauler et al., 2009; Janget al., 2013).
In the PMF analysis, 15% extra modeling uncertainty wasimposed to account for changes in the source profiles and othersources of variability. Species with low signal-to-noise or a highpercentage of data below the detection limit do not provide enoughvariability in concentrations to meaningfully contribute to factoridentification. Therefore, some species (cis-1,2-dichloroethene, 1,3-dichloropropane, 1,2,3-trichloropropane, 1-pentene, trans-2-pentene, 1,3-dicholorobenzene, cis-2-pentene, p-diethylbenzene,2,2,4-trimethypentane, 2,3,4-trimethylpentane, and tert-butylbenzene) were excluded from PMF analysis since they had lessthan 0.2 of signal-to-noise ratio or 70% of their values were smallerthan BDL. PMF input data statistics for VOCs are presented inTable S1.
To determine the optimal number of sources, 4e6 factors wereexamined. The model was run 20 times with a random seed todetermine the stability of Q values; Q values were stable and allruns converged. The Q (robust) and Q (true) values were 14,241 and14,279. The Q values, the resulting source profiles, and the scaledresiduals distributions were studied and the 4 factor solution wasselected based on the scaled residuals distributions and the inter-pretability of the resulting profiles (Belis et al., 2013; Wang et al.,2013). All of the scaled residual distributions were approximatelysymmetric within the range of �3 and þ3 that represents goodagreement between the observed and predicted values (Friendet al., 2012; Li et al., 2013).
As each sample is associated with its own inherent uncertainty,PMF generally requires a large number of samples to make stableand reliable source identification. Therefore, data collected in thepresent study at all sampling sites and in all the campaigns werelumped together for PMF source apportionment analysis. A similarapproach has also been used by other recent studies (Lau et al.,2010; Civan et al., 2011; Lin et al., 2013; Yuan et al., 2013).
2.5. Estimation of carcinogenic risks for inhalation exposure
Carcinogenic risk associated with inhalation exposure to VOCswas calculated by (US EPA, 2005):
R ¼ C � UR (7)
where R is the probability of excess lifetime cancer risk, C is the airconcentration of VOC of interest (mg m�3), and UR is the Unit Risk(mg m�3)�1. UR is the upper-bound excess lifetime cancer risk of anaverage adult estimated to result from continuous exposure to anagent at a concentration of 1 mg m�3 in air. Seven VOCs among the58 compounds measured in the present study have available unitrisk values. UR values were obtained as 7.8 � 10�6, 2.3 � 10�5,2.6� 10�5, 6.0� 10�6, 4.1�10�6, 1.6� 10�5, 1.1�10�6 for benzene,chloroform, 1,2-dichloroethane, carbon tetrachloride, tri-chloroethene, 1,1,2-trichloroethane, and bromoform, respectivelyfrom the Integrated Risk Information System of the US EPA (US EPA,2014b).
3. Results and discussion
3.1. Spatial and seasonal variations of VOC concentrations
Fifty-eight VOCs (S58VOC) were detected and quantified in theambient air of Aliaga, Turkey. VOCs were measured during foursampling periods representing the seasons winter, spring, summer,and fall. A total of 160 samples were collected at 40 sampling sites

Y. Dumanoglu et al. / Atmospheric Environment 98 (2014) 168e178172
and analyzed to determine the seasonal VOC levels and their spatialdistribution in the region. A summary of VOC concentrationsmeasured in this study is presented in Table 1. S58VOC concentra-tions during the sampling campaigns ranged between 0.1 and1770 mg m�3 (avg ± SD, 67 ± 193 mg m�3) in the region. The con-centrations of VOCs measured in this study were in the range ofthose found for other Turkish urban areas (Civan et al., 2011; Pekeyand Yilmaz, 2011). The cities of Bursa and Kocaeli, having similar
Table 1VOC concentrations measured (mg m�3) in Aliaga, Turkey.
Compounds Min. Max. Average SD N
Aromatic compoundsBenzene 0.417 30.0 2.7 4.1 152Toluene 0.052 297.8 7.7 26.8 154Ethylbenzene 0.009 13.4 0.6 1.6 145m,p-Xylene 0.038 41.2 2.8 5.8 150Styrene 0.007 42.2 0.6 4.4 90o-Xylene 0.015 14.6 0.7 1.7 157Isopropylbenzene 0.009 1.9 0.1 0.2 132Propylbenzene 0.007 3.3 0.1 0.4 1241,2,4-Trimethylbenzene 0.014 3.8 0.2 0.5 141tert-butyl benzene 0.008 0.04 0.02 0.01 441,3,5-Trimethylbenzene 0.030 11.9 0.6 1.6 126sec-butylbenzene 0.004 0.8 0.04 0.1 124p-Isopropyltoluene 0.015 0.7 0.1 0.1 152n-butylbenzene 0.010 1.0 0.1 0.1 125Naphthalene 0.007 0.3 0.03 0.03 128m-Ethyltoluene 0.006 9.6 0.4 1.2 142p-Ethyltoluene 0.016 3.9 0.2 0.5 130o-Ethyltoluene 0.007 4.2 0.2 0.5 1501,2,3-Trimethylbenzene 0.009 3.7 0.2 0.5 147m-Diethylbenzene 0.010 1.0 0.1 0.1 98p-Diethylbenzene 0.004 0.7 0.1 0.1 88Halogenated compoundscis-1,2-Dichloroethene 0.017 1.0 0.1 0.2 22Chloroform 0.066 6.8 0.4 0.9 951,1,1-Trichloroethane 0.022 0.3 0.1 0.03 1461,2-Dichloroethane 0.079 136.2 3.7 12.6 147Carbon tetrachloride 0.069 5.1 0.6 0.4 152Trichloroethene 0.025 3.2 0.1 0.3 1451,1,2-Trichloroethane 0.020 0.5 0.1 0.1 541,3-Dichloropropane 0.026 0.2 0.1 0.05 24Tetrachloroethene 0.011 1.4 0.1 0.1 153Chlorobenzene 0.007 0.04 0.02 0.01 103Bromoform 0.017 0.1 0.04 0.02 611,2,3-Trichloropropane 0.034 0.6 0.1 0.1 241,2-Dichlorobenzene 0.024 0.6 0.1 0.1 951,3-Dichlorobenzene 0.008 0.03 0.02 0.01 49Aliphatic compoundsIsopentene 0.402 319.3 8.1 33.7 1501-Pentene 0.013 0.3 0.1 0.1 34n-Pentane 1.001 472.9 26.9 70.4 90trans-2-Pentene 0.008 0.03 0.02 0.01 18cis-2-Pentene 0.007 25.0 1.3 4.7 403-Methylpentane 0.192 97.9 5.8 13.8 932,4-Dimethylpentane 0.014 16.0 0.6 1.9 115Methylcyclopentane 0.187 76.4 4.7 11.2 762-Methylhexane 0.047 58.9 2.1 7.4 1342,3-Dimethylpentane 0.021 29.9 1.3 4.0 1053-Methylhexane 0.063 87.1 3.1 11.5 1512,2,4-Trimethylpentane 0.010 7.3 0.2 0.8 92n-Heptane 0.082 147.5 4.6 17.5 133Methylcyclohexane 0.043 104.0 1.7 9.2 1522,3,4-Trimethylpentane 0.009 2.7 0.2 0.4 542-Methylheptane 0.015 48.3 0.9 4.8 1363-Methylheptane 0.020 32.0 0.8 3.5 122n-Octane 0.029 81.8 1.7 8.0 152n-Nonane 0.046 50.1 1.0 5.0 151n-Decane 0.041 26.6 1.0 3.1 154n-Undecane 0.028 12.9 0.5 1.5 156Oxygenated compoundsMethyl isobutyl ketone 0.013 0.1 0.04 0.02 63Butyl acetate 0.039 2.9 0.3 0.3 153
major industrial regions show a similar pattern for the mean VOCconcentrations. The total VOC concentrations measured in theOctober and April were 1450 and 1710 mg m�3 in Bursa (Civan et al.,2011). Concentrations of some major VOCs measured at urban andindustrial sites around the world are presented in Table S2. Theaverage concentrations of BTEX in the sampling area within fourcampaigns was 2.7 mg m�3 for benzene, 7.7 mg m�3 for toluene,2.8 mg m�3 for m,p-xylene, 0.7 mg m�3 for o-xylene, 0.6 mg m�3 forethylbenzene. These concentrations were comparable to those re-ported previously for urban and industrial areas (Table S2).
Aliphatic hydrocarbons were generally predominant with a highpercentage of contribution (between 31% and 88%) at all sites. Ar-omatic VOCs were the second highest group (8e50%) followed byhalogenated VOCs (1e24%) and oxygenated VOCs (0.04e5.9%). Thecontributions of the hydrocarbon groups to the total VOCs aresimilar to the results for Hailuogou Scenic Area, China (Zhang et al.,2014). Since the emissions of aliphatic hydrocarbons and aromaticVOCs are mainly from traffic, evaporative emissions, fuel combus-tion in industry, and industrial processes like petroleum refiningand petrochemical production (Watson et al., 2001; Battermanet al., 2002; Na et al., 2005; Rao et al., 2007; Pandya et al., 2007;Jiun-Horng et al., 2008; Cai et al., 2010; Baltrenas et al., 2011),several industrial activities in the region (i.e., petroleum refinery,petrochemical complex, ironesteel plants, several petroleum andpetroleum products storage tanks, power plant, ship breaking),
Table 2Seasonal S58VOC concentrations at the sampling sites.
Site No S58VOC (mg m�3)
Summer Fall Winter Spring Average SD
1 14.3 25.4 5.4 5.1 12.5 9.62 30.1 14.4 12.0 5.9 15.6 10.33 82.3 20.8 4.6 4.7 28.1 36.94 68.7 10.6 5.7 5.9 22.7 30.75 277.0 41.1 40.7 24.3 95.8 121.16 137.6 199.6 17.4 14.5 92.3 91.77 131.3 33.7 27.0 20.6 53.2 52.38 161.0 84.4 17.5 17.3 70.1 68.49 1.1 90.6 91.4 58.2 60.3 42.410 75.2 1163.3 829.4 1769.9 959.5 706.511 0.5 63.7 132.2 23.0 54.9 57.812 58.4 25.1 46.2 11.6 35.3 21.013 0.2 420.8 265.8 588.9 318.9 250.114 443.8 165.7 109.0 96.8 203.8 162.815 2.0 30.1 14.8 18.9 16.4 11.616 85.0 543.3 8.4 13.6 162.6 256.217 49.7 19.2 6.4 6.2 20.4 20.518 33.6 10.0 5.2 6.6 13.9 13.319 44.5 12.4 7.3 5.6 17.4 18.320 21.7 4.2 7.9 4.9 9.7 8.221 40.4 25.9 17.1 16.2 24.9 11.222 36.9 20.0 12.8 12.4 20.5 11.423 87.6 18.6 10.7 9.2 31.5 37.624 10.7 81.4 8.1 16.5 29.2 35.025 22.4 15.0 9.7 7.5 13.6 6.626 22.3 12.3 12.9 7.6 13.8 6.127 60.1 17.5 19.8 11.4 27.2 22.228 59.7 21.2 25.4 11.3 29.4 21.029 34.1 29.6 17.7 12.1 23.4 10.230 59.5 16.3 8.7 11.0 23.9 24.031 36.2 12.0 14.3 9.3 17.9 12.332 52.6 45.3 16.1 12.5 31.6 20.333 23.0 21.3 5.7 7.1 14.3 9.234 19.9 25.1 6.0 8.1 14.8 9.235 0.2 10.1 8.4 9.4 7.0 4.636 0.1 7.8 6.3 5.1 4.8 3.337 51.8 13.5 7.2 8.0 20.1 21.338 0.1 7.7 6.3 4.6 4.7 3.339 107.8 22.0 19.3 12.0 40.3 45.240 0.8 12.8 9.8 9.4 8.2 5.1

Fig. 2. Spatial distribution of annual average and seasonal S58VOC concentrations (mg m�3) in the study area.
Y. Dumanoglu et al. / Atmospheric Environment 98 (2014) 168e178 173
dense transportation activity of trucks, and busy ports seem to havea substantial impact on the region's atmosphere.
Table 2 illustrates the seasonal variations of the mean concen-trations of S58VOCs in the 40 sampling sites. Generally, VOC con-centrations were higher in summer than in winter, as found inmany other studies (Batterman et al., 2002; Kourtidis et al., 2002;Hoque et al., 2008), probably due to increased volatilization ofVOCs from oil products at higher ambient temperatures (27.1 �C insummer vs. 9.3 �C in winter). Average summer/winter concentra-tion ratios showed a decreasing trend with decreasing vaporpressure of VOCs and ranged between 5.01 (for the most volatileVOC, isopentene) and 1.20 (for the least volatile VOC, naphthalene)supporting this hypothesis. Similarly, Kourtidis et al. (1999) havealso reported an increase in evaporative emissions with increasingtemperature. However, the highest atmospheric VOC concentra-tions in the present studywere observed also inwinter and fall nearthe petroleum refinery and petrochemical complex. A possiblereason for this observation may be the calm conditions and highatmospheric stability that is commonly encountered during thewinter months in the area, restricting the dilution of pollutants(Elbir, 2003; Sari and Bayram, 2014).
Fig. 2 shows the spatial distribution of annual average ambientair S58VOC concentrations (mg m�3) in the study area. The spatialdistribution of VOC concentrations suggested that the major sour-ces in the region were the petroleum refinery, petrochemicalcomplex, and several petroleum storage tanks, supporting the ob-servations of the recent studies conducted in the area (Bozlakeret al., 2008a; Kaya et al., 2012). Spatial variation of the concentra-tions indicated that the highest levels were clustered at a few
sampling sites that are located around the petroleum refinery andthe petrochemical plant.
While the concentrations of n-pentane, isopentene and n-hep-tane were the highest in aliphatic VOCs, toluene was the mostabundant aromatic VOC observed during the sampling campaigns(Table 1), followed by m,p-xylene, benzene, ethylbenzene, andstyrene in Aliaga atmosphere, respectively. The presence of thesemajor aromatic VOCs has also been reported in previous studiesconducted in urban and industrial atmospheres (Hong et al., 2006;Parra et al., 2006; Rao et al., 2007; Pandya et al., 2007; Hoque et al.,2008; Kume et al., 2008; Baltrenas et al., 2011). The highest levels oftoluene were measured at sites 10, 13 and 14 that were located inthe vicinity of the refinery and the petrochemical plant. Similarobservations have also been reported recently (Na et al., 2005; Raset al., 2009; Civan et al., 2011). Sites 35, 36, 38 and 40 indicated thelowest concentrations since these sites were located near the vil-lages far away from the industrial regions and they could beregarded as background sites.
Regarding the toluene levels, although is not regulated by Eu-ropean legislation, WHO established a guideline value of260 mg m�3 (expressed as a weekly average) for the protection ofhuman health (WHO, 2000). The weekly mean concentration oftoluene exceeded this limit value at site 13, with a mean value of298 mg m�3, whereas it was also high at other sites like 14 and 10(71 and 69 mg m�3, respectively). According to Directive 2000/69/EC (European Community, 2000), the annual mean benzene con-centrations in ambient air must not exceed 5 mg m�3. The con-centration of benzene exceeded this limit value at sites 10, 14, 13and 11, with the mean values of 20.2, 8.6, 6.5 and 5.9 mg m�3
respectively, whereas at other sites like 9 and 8 concentrations
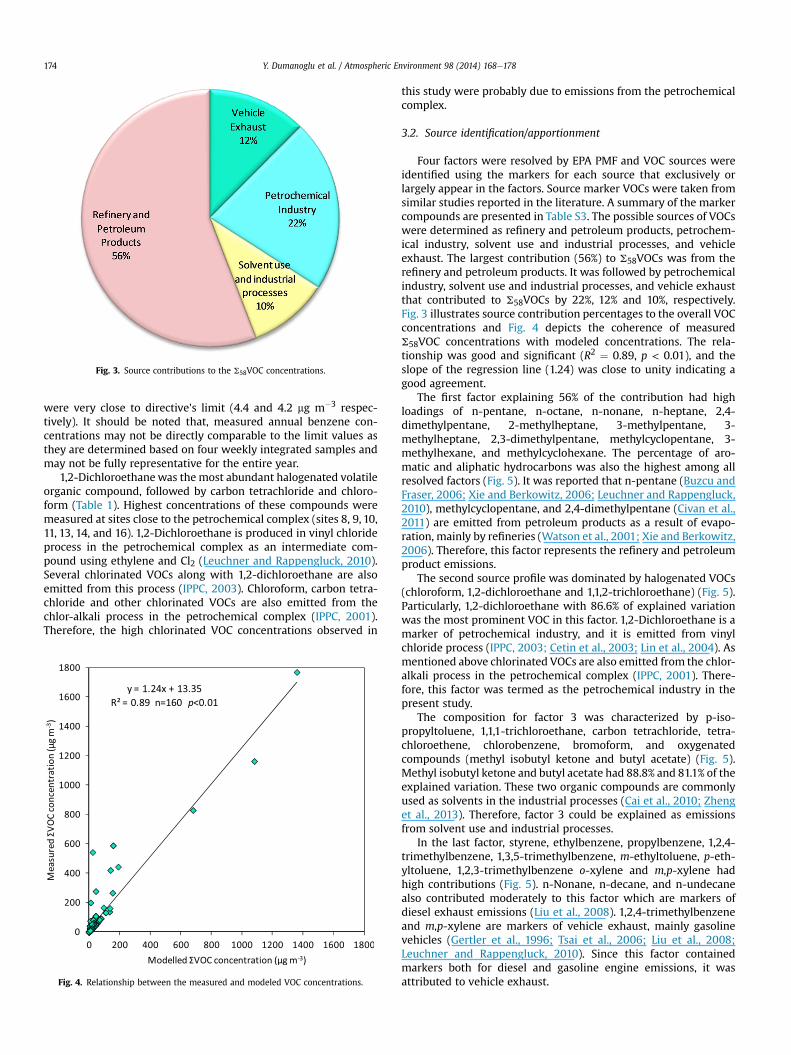
Fig. 3. Source contributions to the S58VOC concentrations.
Y. Dumanoglu et al. / Atmospheric Environment 98 (2014) 168e178174
were very close to directive's limit (4.4 and 4.2 mg m�3 respec-tively). It should be noted that, measured annual benzene con-centrations may not be directly comparable to the limit values asthey are determined based on four weekly integrated samples andmay not be fully representative for the entire year.
1,2-Dichloroethanewas themost abundant halogenated volatileorganic compound, followed by carbon tetrachloride and chloro-form (Table 1). Highest concentrations of these compounds weremeasured at sites close to the petrochemical complex (sites 8, 9, 10,11, 13, 14, and 16). 1,2-Dichloroethane is produced in vinyl chlorideprocess in the petrochemical complex as an intermediate com-pound using ethylene and Cl2 (Leuchner and Rappengluck, 2010).Several chlorinated VOCs along with 1,2-dichloroethane are alsoemitted from this process (IPPC, 2003). Chloroform, carbon tetra-chloride and other chlorinated VOCs are also emitted from thechlor-alkali process in the petrochemical complex (IPPC, 2001).Therefore, the high chlorinated VOC concentrations observed in
Fig. 4. Relationship between the measured and modeled VOC concentrations.
this study were probably due to emissions from the petrochemicalcomplex.
3.2. Source identification/apportionment
Four factors were resolved by EPA PMF and VOC sources wereidentified using the markers for each source that exclusively orlargely appear in the factors. Source marker VOCs were taken fromsimilar studies reported in the literature. A summary of the markercompounds are presented in Table S3. The possible sources of VOCswere determined as refinery and petroleum products, petrochem-ical industry, solvent use and industrial processes, and vehicleexhaust. The largest contribution (56%) to S58VOCs was from therefinery and petroleum products. It was followed by petrochemicalindustry, solvent use and industrial processes, and vehicle exhaustthat contributed to S58VOCs by 22%, 12% and 10%, respectively.Fig. 3 illustrates source contribution percentages to the overall VOCconcentrations and Fig. 4 depicts the coherence of measuredS58VOC concentrations with modeled concentrations. The rela-tionship was good and significant (R2 ¼ 0.89, p < 0.01), and theslope of the regression line (1.24) was close to unity indicating agood agreement.
The first factor explaining 56% of the contribution had highloadings of n-pentane, n-octane, n-nonane, n-heptane, 2,4-dimethylpentane, 2-methylheptane, 3-methylpentane, 3-methylheptane, 2,3-dimethylpentane, methylcyclopentane, 3-methylhexane, and methylcyclohexane. The percentage of aro-matic and aliphatic hydrocarbons was also the highest among allresolved factors (Fig. 5). It was reported that n-pentane (Buzcu andFraser, 2006; Xie and Berkowitz, 2006; Leuchner and Rappengluck,2010), methylcyclopentane, and 2,4-dimethylpentane (Civan et al.,2011) are emitted from petroleum products as a result of evapo-ration, mainly by refineries (Watson et al., 2001; Xie and Berkowitz,2006). Therefore, this factor represents the refinery and petroleumproduct emissions.
The second source profile was dominated by halogenated VOCs(chloroform, 1,2-dichloroethane and 1,1,2-trichloroethane) (Fig. 5).Particularly, 1,2-dichloroethane with 86.6% of explained variationwas the most prominent VOC in this factor. 1,2-Dichloroethane is amarker of petrochemical industry, and it is emitted from vinylchloride process (IPPC, 2003; Cetin et al., 2003; Lin et al., 2004). Asmentioned above chlorinated VOCs are also emitted from the chlor-alkali process in the petrochemical complex (IPPC, 2001). There-fore, this factor was termed as the petrochemical industry in thepresent study.
The composition for factor 3 was characterized by p-iso-propyltoluene, 1,1,1-trichloroethane, carbon tetrachloride, tetra-chloroethene, chlorobenzene, bromoform, and oxygenatedcompounds (methyl isobutyl ketone and butyl acetate) (Fig. 5).Methyl isobutyl ketone and butyl acetate had 88.8% and 81.1% of theexplained variation. These two organic compounds are commonlyused as solvents in the industrial processes (Cai et al., 2010; Zhenget al., 2013). Therefore, factor 3 could be explained as emissionsfrom solvent use and industrial processes.
In the last factor, styrene, ethylbenzene, propylbenzene, 1,2,4-trimethylbenzene, 1,3,5-trimethylbenzene, m-ethyltoluene, p-eth-yltoluene, 1,2,3-trimethylbenzene o-xylene and m,p-xylene hadhigh contributions (Fig. 5). n-Nonane, n-decane, and n-undecanealso contributed moderately to this factor which are markers ofdiesel exhaust emissions (Liu et al., 2008). 1,2,4-trimethylbenzeneand m,p-xylene are markers of vehicle exhaust, mainly gasolinevehicles (Gertler et al., 1996; Tsai et al., 2006; Liu et al., 2008;Leuchner and Rappengluck, 2010). Since this factor containedmarkers both for diesel and gasoline engine emissions, it wasattributed to vehicle exhaust.
Fig. 5. PMF source profiles for VOCs in the Aliaga region.
Y. Dumanoglu et al. / Atmospheric Environment 98 (2014) 168e178 175
According to PMF analysis, source contributions at each sam-pling site in the region were also determined. Fig. 6 shows thespatial distributions of the contributions of identified sources in thestudy area. The spatial distributions of the sources support the
findings of the receptor modeling and identification of the sources.The prevailing winds in the region are from northwesterly di-rections. Therefore, in addition to the sites near the sources, somesites located downwind from the sources have also been affected

Fig. 6. Spatial distribution of source contributions to the S58VOC concentrations (mg m�3) in the study area.
Y. Dumanoglu et al. / Atmospheric Environment 98 (2014) 168e178176
and high concentrations weremeasured at these sites. Refinery andpetroleum products and petrochemical industry emissions mainlyaffected the sites nearby. The contribution of vehicle exhaust ismore widespread compared to refinery and petroleum productsand petrochemical industry emissions, as this is a diffuse source,emitted from highways and streets in the area. The contribution ofvehicle exhaust was relatively higher at sites located near steelplants and ports, due to intense truck traffic on the roads. Thecontribution of solvent use and industrial processes mainly affectedthe sites near the refinery, petrochemical plant and iron-steelplants.
3.3. Carcinogenic risk assessment for inhalation exposure
There are several residential sites in the region (Fig. 1), thatsome of them having high ambient air VOC concentrations.Furthermore, there are several thousands of workers employed bythe industries in the area where the highest concentrations weremeasured. As a result, a significant population living andworking inthe Aliaga area is exposed to high concentrations of VOCs that someare known to be carcinogenic. Therefore, the health risks associatedwith the industrial VOC emissions were also assessed. Carcinogenicrisks were estimated for seven VOCs (benzene, chloroform, 1,2-dichloroethane, carbon tetrachloride, trichloroethene, 1,1,2-trichloroethane, and bromoform), using available unit risk factors

Fig. 7. Estimated cancer risk values for different VOCs at the sampling sites. Error barsrepresent one standard deviation.
Y. Dumanoglu et al. / Atmospheric Environment 98 (2014) 168e178 177
(Fig. 7). Risks were the highest for 1,2-dichloroethane, followed bybenzene, chloroform, and carbon tetrachloride. Carcinogenic risksdue to lifetime exposure to trichloroethene, 1,1,2-trichloroethane,and bromoformwere lower than the general acceptable risk level of1.0 � 10�6. However, risks for 1,2-dichloroethane, benzene, chlo-roform, and carbon tetrachloride were substantially higher thanthe acceptable level, ranging between 6.0 � 10�6e1.2 � 10�3,5.9 � 10�6e1.6 � 10�4, 1.7 � 10�6e4.4 � 10�5, and2.9 � 10�6e1.1 � 10�5, respectively (Fig. 7). Based on these upper-bound risk estimates, it can be argued that carcinogenic risksmay reach considerably high levels for a significant portion of thepopulation living in the Aliaga region. However, it should be notedthat annual average VOC concentrations (Table 1) have large stan-dard deviations, adding an additional uncertainty to the estimatedrisks.
4. Conclusions
Ambient air samples (n ¼ 160) were collected by passive sam-pling in 2009 and 2010 at forty different sites in Aliaga, Turkey todetermine the spatial, seasonal variations of VOCs and to identifytheir sources.
Fifty-eight VOCs (S58VOC) were detected in the ambient air ofAliaga. S58VOC concentrations during the sampling campaignsranged between 0.1 and 1770 mg m�3 (avg ± SD, 67 ± 193 mg m�3).These concentrations were comparable to those reported previ-ously for urban and similar industrial areas. Aliphatic hydrocarbonswere generally predominant, followed by aromatic, halogenatedand oxygenated VOCs. The spatial distribution of ambient VOCconcentrations was highly variable and it indicated that the majorsources in the region were the industrial plants.
The newest version of EPA PMF (V5.0) (Positive Matrix Factor-ization) having the capability of handling multiple site data wasused for source apportionment. Four sources were identified asrefinery and petroleum products, petrochemical Industry, vehicleexhaust, and solvent use and industrial processes in the study area,contributing 56%, 22%, 10%, and 12%, respectively to the S58VOCconcentrations.
Carcinogenic risks due to lifetime exposure to seven VOCs werealso estimated. Estimated risks were the highest for 1,2-dichloroethane, followed by benzene, chloroform, and carbon tet-rachloride. Carcinogenic risks for trichloroethene, 1,1,2-trichloroethane, and bromoform were lower than the general
acceptable risk level of 1.0 � 10�6. However, risks for 1,2-dichlo-roethane, benzene, chloroform, and carbon tetrachloride weresubstantially higher than the acceptable level. Based on theseupper-bound risk estimates, it was concluded that carcinogenicrisks may reach to considerably high levels for a significant portionof the population living in the study area.
Appendix A. Supplementary data
Supplementary data related to this article can be found at http://dx.doi.org/10.1016/j.atmosenv.2014.08.048.
References
Baltrenas, P., Baltrenaite, E., Sereviciene, V., Pereira, P., 2011. Atmospheric BTEXconcentrations in the vicinity of the crude oil refinery of the Baltic region.Environ. Monit. Assess. 182, 115e127.
Batterman, S.A., Peng, C.Y., Braun, J., 2002. Levels and composition of volatileorganic compounds on commuting routes in Detroit, Michigan. Atmos. Environ.36, 6015e6030.
Belis, C.A., Karagulian, F., Larsen, B.R., Hopke, P.K., 2013. Critical review and meta-analysis of ambient particulate matter source apportionment using receptormodels in Europe. Atmos. Environ. 69, 94e108.
Bozlaker, A., Muezzinoglu, A., Odabasi, M., 2008a. Atmospheric concentrations, drydeposition and air-soil exchange of polycyclic aromatic hydrocarbons (PAHs) inan industrial region in Turkey. J. Hazard. Mater. 153, 1093e1102.
Bozlaker, A., Odabasi, M., Muezzinoglu, A., 2008b. Dry deposition and soileair gasexchange of polychlorinated biphenyls (PCBs) in an industrial area. Environ.Pollut. 156, 784e793.
Brown, S.G., Frankel, A., Hafner, H.R., 2007. Source apportionment of VOCs in the LosAngeles area using positive matrix factorization. Atmos. Environ. 41, 227e237.
Buzcu, B., Fraser, M.P., 2006. Source identification and apportionment of volatileorganic compounds in Houston, TX. Atmos. Environ. 40, 2385e2400.
Cai, C.J., Geng, F.H., Tie, X.X., Yu, Q.O., An, J.L., 2010. Characteristics and sourceapportionment of VOCs measured in Shanghai, China. Atmos. Environ. 44,5005e5014.
Cetin, E., Odabasi, M., Seyfioglu, R., 2003. Ambient volatile organic compound (VOC)concentrations around a petrochemical complex and a petroleum refinery. Sci.Total Environ. 312, 103e112.
Cetin, B., Yatkin, S., Bayram, A., Odabasi, M., 2007. Ambient concentrations andsource apportionment of PCBs and trace elements around an industrial area inIzmir, Turkey. Chemosphere 69, 1267e1277.
Cetin, B., Odabasi, M., 2007. Particle-phase dry deposition and air-soil gas-exchangeof polybrominated diphenyl ethers (PBDEs) in Izmir, Turkey. Environ. Sci.Technol. 41, 4986e4992.
Chan, Y.-c., Hawas, O., Hawker, D., Vowles, P., Cohen, D.D., Stelcer, E., Simpson, R.,Golding, G., Christensen, E., 2011. Using multiple type composition data andwind data in PMF analysis to apportion and locate sources of air pollutants.Atmos. Environ. 45, 439e449.
Chen, C.L., Fang, H.Y., Shu, C.M., 2005. Source location and characterization of vol-atile organic compound emissions at a petrochemical plant in Kaohsiung,Taiwan. J. Air Waste Manag. Assoc. 55, 1487e1497.
Civan, M., Elbir, T., Seyfioglu, R., Sofuoglu, S., Bayram, A., Muezzinoglu, A.,Odabasi, M., Tuncel, G., 2009. Spatial distributions of organic and inorganicpollutants at Aliaga, Turkey. In: Proceedings of Abstracts e 7th InternationalConference on Air Quality Science and Application, Istanbul, Turkey, 24 e 27March 2009, p. 289.
Civan, M.Y., Kuntasal, O.O., Tuncel, G., 2011. Source apportionment of ambientvolatile organic compounds in Bursa, a heavily industrialized city in Turkey.Environ. Forensics 12, 357e370.
Civan, M., Elbir, T., Seyfioglu, R., Kuntasal, O., Bayram, A., Dogan, G., Yurdakul, S.,Andic, O., Muezzinoglu, A., Sofuoglu, S.C., Pekey, H., Pekey, B., Bozlaker, A.,Odabasi, M., Tuncel, G., 2012. Spatial distribution of VOC concentrations andcancer risk around an industrial region at Western Turkey. In: Proceedings of4th International Symposium on Air Quality Management at Urban, Regionaland Global Scales, Istanbul, Turkey, 10e13 September 2012.
Deluchi, M.A., 1993. Emissions from the production, storage, and transport of crude-oil and gasoline. J. Air Waste Manag. Assoc. 43, 1486e1495.
Dewulf, J., Langenhove, H.V., 1999. Anthropogenic volatile organic compounds inambient air and natural waters: a review on recent developments of analyticalmethodology, performance and interpretation of field measurements.J. Chromatogr. A 843, 163e177.
Elbir, T., 2002. Application of an ISCST3 model for predicting urban air pollution inthe Izmir metropolitan area. Int. J. Environ. Pollut. 18, 498e507.
Elbir, T., 2003. Comparison of model predictions with the data of an urban airquality monitoring network in Izmir, Turkey. Atmos. Environ. 37, 2149e2157.
Elbir, T., Muezzinoglu, A., 2004. Estimation of emission strengths of primary airpollutants in the city of Izmir, Turkey. Atmos. Environ. 38, 1851e1857.
Y. Dumanoglu et al. / Atmospheric Environment 98 (2014) 168e178178
Elbir, T., Cetin, B., Cetin, E., Bayram, A., Odabasi, M., 2007. Characterization of volatileorganic compounds (VOCs) and their sources in the air of Izmir, Turkey. Envi-ron. Monit. Assess. 133, 149e160.
European Community, 2000. Directive 2000/69/EC of the European Parliament andof the Council relating to limit values for benzene and carbon monoxide inambient air. Official J. L 313.
Finlayson-Pitts, B.J., Pitts Jr., J.N., 2000. Chemistry of the Upper and Lower Atmo-sphere: Theory, Experiments, and Applications. Academic Press, San Diego.
Friend, A.J., Ayoko, G.A., Jayaratne, E.R., Jamriska, M., Hopke, P.K., Morawska, L.,2012. Source apportionment of ultrafine and fine particle concentrations inBrisbane, Australia. Environ. Sci. Pollut. Res. 19, 2942e2950.
Gertler, A.W., Fujita, E.M., Pierson, W.R., Wittorff, D.N., 1996. Apportionment ofNMHC tailpipe vs non-tailpipe emissions in the Fort McHenry and TuscaroraMountain Tunnels. Atmos. Environ. 30, 2297e2305.
Guenther, A., Karl, T., Harley, P., Wiedinmyer, C., Palmer, P.I., Geron, C., 2006. Esti-mates of global terrestrial isoprene emissions using MEGAN (Model of emis-sions of gases and aerosols from nature). Atmos. Chem. Phys. 6, 3181e3210.
Guo, H., Lee, S.C., Louie, P.K.K., Ho, K.F., 2004. Characterization of hydrocarbons,halocarbons and carbonyls in the atmosphere of Hong Kong. Chemosphere 57,1363e1372.
Habre, R., Coull, B., Koutrakis, P., 2011. Impact of source collinearity in simulatedPM2.5 data on the PMF receptor model solution. Atmos. Environ. 45,6938e6946.
Hong, Y.J., Jeng, H.W.A., Gau, Y.Y., Lin, C., Lee, I.L., 2006. Distribution of volatileorganic compounds in ambient air of Kaohsiung, Taiwan. Environ. Monit.Assess. 119, 43e56.
Hopke, P.K., 2003. Recent developments in receptor modeling. J. Chemom. 17,255e265.
Hoque, R.R., Khillare, P.S., Agarwal, T., Shridhar, V., Balachandran, S., 2008. Spatialand temporal variation of BTEX in the urban atmosphere of Delhi, India. Sci.Total Environ. 392, 30e40.
IPPC (Integrated Pollution Prevention and Control), 2001. Reference Document onBest Available Techniques in the Chlor-alkali Manufacturing Industry.
IPPC (Integrated Pollution Prevention and Control), 2003. Reference Document onBest Available Techniques in the Large Volume Organic Chemical Industry.
Jang, E., Alam, M.S., Harrison, R.M., 2013. Source apportionment of polycyclic aro-matic hydrocarbons in urban air using positive matrix factorization and spatialdistribution analysis. Atmos. Environ. 79, 271e285.
Jiun-Horng, T., Kuo-Hsiung, L., Chih-Yu, C., Nina, L., Sen-Yi, M., Hung-Lung, C., 2008.Volatile organic compound constituents from an integrated iron and steel fa-cility. J. Hazard. Mater. 157, 569e578.
Jorquera, H., Rappenglück, B., 2004. Receptor modeling of ambient VOC at Santiago,Chile. Atmos. Environ. 38, 4243e4263.
Kalabokas, P.D., Hatzaianestis, J., Bartzis, J.G., Papagiannakopoulos, P., 2001. Atmo-spheric concentrations of saturated and aromatic hydrocarbons around a Greekoil refinery. Atmos. Environ. 35, 2545e2555.
Kaya, E., Dumanoglu, Y., Kara, M., Altiok, H., Bayram, A., Elbir, T., Odabasi, M., 2012.Spatial and temporal variation and air-soil exchange of atmospheric PAHs andPCBs in an industrial region. Atmos. Pollut. Res. 3, 435e449.
Kourtidis, K.A., Ziomas, I.C., Rappenglueck, B., Proyou, A., Balis, D., 1999. Evaporativetraffic hydrocarbon emissions, traffic CO and speciated HC traffic emissionsfrom the city of Athens. Atmos. Environ. 33, 3831e3842.
Kourtidis, K.A., Ziomas, I., Zerefos, C., Kosmidis, E., Symeonidis, P.,Christophilopoulos, E., Karathanassis, S., Mploutsos, A., 2002. Benzene, toluene,ozone, NO2 and SO2 measurements in an urban street canyon in Thessaloniki,Greece. Atmos. Environ. 36, 5355e5364.
Kume, K., Ohura, T., Amagai, T., Fusaya, M., 2008. Field monitoring of volatile organiccompounds using passive air samplers in an industrial city in Japan. Environ.Pollut. 153, 649e657.
Lau, A.K.H., Yuan, Z., Yu, J.Z., Louie, P.K.K., 2010. Source apportionment of ambientvolatile organic compounds in Hong Kong. Sci. Total Environ. 408, 4138e4149.
Lee, S., Liu, W., Wang, Y., Russell, A.G., Edgerton, E.S., 2008. Source apportionment ofPM2.5: comparing PMF and CMB results for four ambient monitoring sites inthe southeastern United States. Atmos. Environ. 42, 4126e4137.
Leuchner, M., Rappengluck, B., 2010. VOC sourceereceptor relationships in Houstonduring TexAQS-II. Atmos. Environ. 44, 4056e4067.
Li, N., Hopke, P.K., Kumar, P., Cliff, S.S., Zhao, Y., Navasca, C., 2013. Source appor-tionment of time- and size-resolved ambient particulate matter. Chemom.Intell. Lab. Syst. 129, 15e20.
Lin, Y., Qiu, X.H., Zhao, Y.F., Ma, J., Yang, Q.Y., Zhu, T., 2013. Polybromobenzenepollutants in the atmosphere of North China: levels, distribution, and sources.Environ. Sci. Technol. 47, 12761e12767.
Lin, T.Y., Sre, U., Tseng, S.H., Chiu, K.H., Wu, C.H., Lo, J.G., 2004. Volatile organiccompound concentrations in ambient air of Kaohsiung petroleum refinery inTaiwan. Atmos. Environ. 38, 4111e4122.
Liu, Y., Shao, M., Fu, L.L., Lu, S.H., Zeng, L.M., Tang, D.G., 2008. Source profiles ofvolatile organic compounds (VOCs) measured in China: part I. Atmos. Environ.42, 6247e6260.
Mansha, M., Ghauri, B., Rahman, S., Amman, A., 2012. Characterization and sourceapportionment of ambient air particulate matter (PM2.5) in Karachi. Sci. TotalEnviron. 425, 176e183.
Na, K., Moon, K.C., Kim, Y.P., 2005. Source contribution to aromatic voc concentra-tion and ozone formation potential in the atmosphere of Seoul. Atmos. Environ.39, 5517e5524.
Odabasi, M., Bayram, A., Elbir, T., Seyfioglu, R., Dumanoglu, Y., Bozlaker, A.,Demircioglu, H., Altiok, H., Yatkin, S., Cetin, B., 2009. Electric arc furnaces forsteel-making: hot spots for persistent organic pollutants. Environ. Sci. Technol.43, 5205e5211.
Paatero, P., 1997. Least squares formulation of robust non-negative factor analysis.Chemom. Intell. Lab. Syst. 37, 23e35.
Pandya, G.H., Kondawar, V.K., Gavane, A.G., 2007. An integrated investigation ofvolatile organic compounds emission in the atmosphere from refinery and itsoff-site facilities. Indian J. Chem. Technol. 14, 283e291.
Parra, M.A., Gonzalez, L., Elustondo, D., Garrigo, J., Bermejo, R., Santamaria, J.M.,2006. Spatial and temporal trends of volatile organic compounds (VOC) in arural area of northern Spain. Sci. Total Environ. 370, 157e167.
Pekey, B., Yilmaz, H., 2011. The use of passive sampling to monitor spatial trends ofvolatile organic compounds (VOCs) at an industrial city of Turkey. Microchem. J.97, 213e219.
Radiello, 2014. Volatile Organic Compounds (VOCs) e Chemically Desorbed withCS2. http://www.radiello.it/english/cov_chim_en.htm (accessed in July 2014).
Rao, P.S., Ansari, M.F., Gavane, A.G., Pandit, V.I., Nema, P., Devotta, S., 2007. Seasonalvariation of toxic benzene emissions in petroleum refinery. Environ. Monit.Assess. 128, 323e328.
Ras, M.R., Marce, R.M., Borrull, F., 2009. Characterization of ozone precursor volatileorganic compounds in urban atmospheres and around the petrochemical in-dustry in the Tarragona region. Sci. Total Environ. 407, 4312e4319.
Roukos, J., Riffault, V., Locoge, N., Plaisance, H., 2009. VOC in an urban and industrialharbor on the French North Sea coast during two contrasted meteorologicalsituations. Environ. Pollut. 157, 3001e3009.
Sari, D., Bayram, A., 2014. Quantification of emissions from domestic heating inresidential areas of _Izmir, Turkey and assessment of the impact on local/regional air-quality. Sci. Total Environ. 488e489, 429e436.
Srivastava, A., Joseph, A.E., Patil, S., More, A., Dixit, R.C., Prakash, M., 2005. Air toxicsin ambient air of Delhi. Atmos. Environ. 39, 59e71.
Tauler, R., Viana, M., Querol, X., Alastuey, A., Flight, R.M., Wentzell, P.D., Hopke, P.K.,2009. Comparison of the results obtained by four receptor modelling methodsin aerosol source apportionment studies. Atmos. Environ. 43, 3989e3997.
Tsai, W.Y., Chan, L.Y., Blake, D.R., Chu, K.W., 2006. Vehicular fuel composition andatmospheric emissions in South China: Hong Kong, Macau, Guangzhou, andZhuhai. Atmos. Chem. Phys. 6, 3281e3288.
US EPA (U.S. Environmental Protection Agency), 2014a. EPA Positive MatrixFactorization (PMF) 5.0, Fundamentals and User Guide. http://www.epa.gov/heasd/research/pmf.html (accessed in May 2014).
US EPA (U.S. Environmental Protection Agency), 2014b. Integrated Risk InformationSystem (IRIS). http://www.epa.gov/iris/index.html (accessed on January 2014).
US EPA (U.S. Environmental Protection Agency), 2005. Guidelines for CarcinogenRisk Assessment. EPA/630/P-03/001F. US Environmental Protection Agency,Risk Assessment Forum, Washington, DC.
Villanueva, F., Tapia, A., Notario, A., Albaladejo, J., Martinez, E., 2014. Ambient levelsand temporal trends of VOCs, including carbonyl compounds, and ozone atCabaneros National Park border, Spain. Atmos. Environ. 85, 256e265.
Wang, Y., Hopke, P.K., Xia, X., Rattigan, O.V., Chalupa, D.C., Utell, M.J., 2012. Sourceapportionment of airborne particulate matter using inorganic and organicspecies as tracers. Atmos. Environ. 55, 525e532.
Wang, Y., Huang, J., Hopke, P.K., Rattigan, O.V., Chalupa, D.C., Utell, M.J., Holsen, T.M.,2013. Effect of the shutdown of a large coal-fired power plant on ambientmercury species. Chemosphere 92, 360e367.
Watson, J.G., Chow, J.C., Fujita, E.M., 2001. Review of volatile organic compoundsource apportionment by chemical mass balance. Atmos. Environ. 35,1567e1584.
World Health Organization (WHO), 2000. Air Quality Guidelines for Europe. In:European Series, Second ed., vol. 91. WHO Regional Publications, p. 252.
Xie, Y.L., Berkowitz, C.M., 2006. The use of positive matrix factorization with con-ditional probability functions in air quality studies: an application to hydro-carbon emissions in Houston, Texas. Atmos. Environ. 40, 3070e3091.
Yen, C.H., Horng, J.J., 2009. Volatile organic compounds (VOCs) emission charac-teristics and control strategies for a petrochemical industrial area in middleTaiwan. J. Environ. Sci. Health A Toxic Hazard. Subst. Environ. Eng. 44,1424e1429.
Yuan, Z., Zhong, L., Lau, A.K.H., Yu, J.Z., Louie, P.K.K., 2013. Volatile organic com-pounds in the Pearl River Delta: identification of source regions and recom-mendations for emission-oriented monitoring strategies. Atmos. Environ. 76,162e172.
Zhang, J., Sun, Y., Wu, F., Sun, J., Wang, Y., 2014. The characteristics, seasonal vari-ation and source apportionment of VOCs at Gongga Mountain, China. Atmos.Environ. 88, 297e305.
Zheng, J., Yu, Y., Mo, Z., Zhang, Z., Wang, X., Yin, S., Peng, K., Yang, Y., Feng, X., Cai, H.,2013. Industrial sector-based volatile organic compound (VOC) source profilesmeasured in manufacturing facilities in the Pearl River Delta, China. Sci. TotalEnviron. 456-457, 127e136.
Copyright © 2022 FDOKUMEN