Seismic axial collapse of shear damaged heavily reinforced ...

Spatial distribution and source identification of trace elementsin topsoil from heavily industrialized region, Aliaga, Turkey
Melik Kara & Yetkin Dumanoğlu & Hasan Altıok &
Tolga Elbir & Mustafa Odabası & Abdurrahman Bayram
Received: 22 January 2014 /Accepted: 14 May 2014 /Published online: 24 May 2014# Springer International Publishing Switzerland 2014
Abstract Topsoil samples (n=40) were collected froma heavily industrialized region in Turkey. The regionincludes several scrap processing iron–steel plants withelectric arc furnaces (EAFs), a petroleum refinery, apetrochemical complex, steel rolling mills, a naturalgas-fired power plant, ship-breaking yards and verydense transportation activities. The region has under-gone a rapid transition from an agricultural region to aheavily industrialized region in the last three decades.Collected soil samples were analyzed for 48 trace ele-ments using inductively coupled plasma-mass spec-trometry (ICP-MS). The elemental distribution patternin the region indicated that Nemrut area with denseiron–steel production activities was a hotspot for ele-mental pollution. In addition to crustal elements, con-centrations of anthropogenic trace elements (i.e., Fe, Zn,Pb, Mn, Cu, Cd, Cr and Mo) were very high in the areainfluencing many parts of the region. Elemental compo-sitions of fugitive sources polluting the soil (i.e., pavedand unpaved roads, slag piles, EAFs filter dust piles andcoal piles) were also determined. The methods (enrich-ment factors [EFs] and the index of geoaccumulation[Igeo]) used for determination of pollution status of soilshowed that Cr, Ag, Zn, As and Pb were the strongly
contaminating elements for the region. Principal com-ponent analysis (PCA) clearly indicated that anthropo-genic sources (steel production, refinery and petrochem-ical processes and traffic) were important sources in thisregion.
Keywords Trace elements . Topsoil . Pollutionassessment .GIS .Fugitivesources . Iron–steel emissions
Introduction
In industrial and urban areas, several pollutants areemitted from different sources such as industrial plants,vehicle emissions, residential heating, fugitive sourcesand natural activities (Guo et al. 2012; Anatolaki andTsitouridou 2007; Azimi et al. 2005; Salvador et al.2004). Soil is a crucial component of the ecosystem,and in industrial and urban areas it receives largeamounts of trace elements from several sources.Therefore, accumulated pollutants in surface soils canbe transported to different environmental components,such as deep soil, water, plants and dust particles. Whileelemental contamination of soils is caused mainly byatmospheric deposition, soil also affects the air qualitysince enriched trace elemental contents in atmosphericparticulate matter originate from resuspension of pollut-ed soils (Ashbaugh et al. 2003).
Assessment of the trace elemental contents in soiland their origin are primary objectives for maintainingand improving soil quality in many regions. Therefore,to establish reliable policies for a sustainable soil quality
Environ Monit Assess (2014) 186:6017–6038DOI 10.1007/s10661-014-3837-z
M. Kara (*)Center for Air Resources Engineering and Science,Clarkson University, Potsdam, NY 13699-5708, USAe-mail: [email protected]
M. Kara :Y. Dumanoğlu :H. Altıok : T. Elbir :M. Odabası :A. BayramDepartment of Environmental Engineering, Dokuz EylulUniversity, Tinaztepe Campus, Izmir 35160, Turkey

for a region, it is necessary to have a good knowledge ofsoil pollution. Soil pollution is often determined bycomparing elemental concentrations with the relatedenvironmental guidelines (CCME 2007; VROM 2000)and by using potential ecological risk index with respectto relevant background levels (Luo et al. 2012). Severalstatistical methods have also been widely used to deter-mine the degree of the pollution in the soil. (Dragovicet al. 2008; Wei and Yang 2010; Li et al. 2014).Multivariate analyses (principal component analysis[PCA] and cluster analysis [CA]) for identification ofpossible sources (Zhao et al. 2007; Chen et al. 2008; Liand Feng 2012) and geostatistical analysis (spatial map-ping based on GIS) for determining of possible hotspotsof trace elements (Zhao et al. 2014; Yesilonis et al. 2008;Guo et al. 2012; Yuan et al. 2014) have also been usedfor industrial and urban soils.
Soil pollution has become a severe problem in manyparts of the world due to human activities (Facchinelliet al. 2001; Solgi et al. 2012; Zhang 2006; Davis et al.2009). Following rapid social and economic develop-ment over the past several decades, soil trace elementalpollution in urban, industrial, agricultural and miningareas has also become serious and widespread in someregions of Turkey. Recently, studies were carried out onsoils affected by human activities (i.e., industrial andmining) in different regions of Turkey (Odabasi et al.2010; Canbay et al. 2010; Gemici et al. 2009; Koz et al.2012; Kumru and Bakac 2003; Yatkin and Bayram2011; Yaylalı-Abanuz 2011). Results have indicated thattrace element concentrations in soil reached up to highlevels in some heavily industrialized regions (i.e.,Iskenderun, Gebze). Aliaga region is also one of theheavily industrialized regions in Turkey. The regionhas undergone a rapid transition from an agriculturalregion to a heavily industrial region, and has formed acomplete industrial structure arising from iron–steelproduction from scrap, petroleum refining, petrochemi-cal plants, electric power generation and other industries(i.e., fertilizer plants, steel rolling mills). The establish-ment of industrial activities without proper planning andsubsequent population increase have resulted in impor-tant impacts on the local ecosystem and posed a poten-tial threat to human health.
The objectives of this study were (1) to determine theconcentrations of trace elements in soils of a heavilyindustrialized region (Aliaga, Turkey) and characterizetheir spatial distribution using a GIS (GeographicInformation System)-based interpolation method, and
(2) to identify the possible sources of trace elements insoils. Samples from fugitive dust sources (paved andunpaved roads, slag and coal piles, and stack dust fromscrap processing iron–steel plants with electric arc fur-naces [EAFs]) were also characterized to determine theireffect on soil pollution.
Materials and methods
Study area and sampling sites
Located in ∼50 km north of Izmir, Turkey, the Aliagaregion contains several significant pollutant sources in-cluding scrap processing iron–steel plants with EAFs, alarge petroleum refinery, a petrochemical complex, sev-eral steel rolling mills, a natural gas-fired power plant, afertilizer plant, scrap storage and classification sites,large slag and scrap piles, a very dense transportationactivity of ferrous scrap trucks, heavy road and railtraffic, ship-breaking yards and busy ports used forproduct and raw material shipping. The Aliaga town,with a population of ∼60,000, several villages and agri-cultural areas, are also located in the region. The regionlocated on the coast of Aegean Sea is mainly classifiedwithin the local climate of the Mediterranean Sea char-acterized by hot, dry summers and cool, wet winters andspring. The annual rainfall reaches to 688 mm whilehighest monthly rainfall is 131 mm during December(TSMS 2013). The prevailing wind directions are north-west for summer and southeast for winter. Locations ofthe sampling sites, industrial activities and settlements inthe study area and wind rose for the region are illustratedin Fig. 1.
Sample collection and analysis
The topsoil samples (upper 5 cm layer) were collectedfrom industrial (n=7), Nemrut area (n=13) and non-industrial (rural or residential) (n=20) sites in July2009 (in dry period) in the study area. Also, fugitivedust samples were collected from paved roads (n=13),unpaved roads (n=8), slag piles (n=4), EAF filter dust(n=3), coal dust (n=1), PM10 and PM2.5 (n=3) from thestack gas of EAFs after fabric filters in the Nemrutindustrial area (Fig. 1).
The soil samples were collected as composites of at theleast 10 points in each sampling site and the plant roots,leaves and stones were initially removed. Approximately
6018 Environ Monit Assess (2014) 186:6017–6038

Fig. 1 General view of the study area
Environ Monit Assess (2014) 186:6017–6038 6019

500-g samples were placed into polyethylene bags andtransported to laboratory within a portable icebox. At thelaboratory, the samples were passed through a plasticsieve (1 mm mesh size) after being homogenized manu-ally. Soil samples for each site (∼0.5 g) were weighedusing a microbalance (GEC Avery, capable of weighing100 μg) and they were digested using a HNO3 (65 %,Merck, Suprapur®) and HCl (30 %, Merck, Suprapur®)mixture with a microwave digestion system (MARS 5,CEM Corp.). Digested samples were diluted to 100 mLwith deionized water (18.2 MΩ/cm) and filteredthrough a 0.45 μm PTFE filter (Millipore) beforeanalysis. The same procedures were applied for thefugitive dust samples after they were sieved through a75-μm mesh sieve (i.e., the fine size fraction classifiedby EPA Method AP-42).
PM10 and PM2.5 samples from the stack gas of EAFswere collected using a sampling train for PM10 andPM2.5 fractions (Model PF 20357, PF 20358, PF20359; Zambelli Inc.) according to EPA Method 201/201A. The sampling was carried out with a flow rate of14.27 l/min determined according to stack gas proper-ties and 4 mm nozzle size was used to obtain anisokinetic sampling. Teflon filters (PTFE) (47 mm,2.0–μm pore size; Whatman) conditioned at 103 °Cfor 1 h followed by 1 h in a desiccator were weighedbefore and after sample collection using a microbalance(Mettler-Toledo; capable of weighing 1 μg). The filterswere digested and prepared using the same proceduresutilized for other samples.
Analysis of trace elements (Ag, Al, As, B, Ba, Be, Bi,Ca, Cd, Ce, Co, Cr, Cu, Dy, Er, Eu, Fe, Ga, Gd, Hg, Ho,K, La, Li, Lu, Mg, Mn, Mo, Na, Nd, Ni, P, Pb, Pr, Rb,Sb, Se, Sm, Sn, Sr, Tb, Th, Tl, U, V, Y, Yb and Zn) werecarried out using inductively coupled plasma-massspectrometry (ICP-MS) (Agilent 7700x, with HMI).Quality control/quality assurance procedures wereapplied during the sample preparation and analysis.Aliquots of reference material sandy loam soil(CRM030-50) from RTC (RT Corp.) were digestedand analyzed along with the samples to determinerecovery efficiencies of the extraction procedure.The recovery of elements was in the range of 80–110 %of the certified elemental concentrations. The continuingcheck verification standard solution was used to checkthe validity of calibration curve during the analysis. Thelimit of detection (LOD) values for all elements wasdefined as the average plus three standard deviations ofthe blank sample amounts.
Physical and chemical properties of soil
In the study area, the most common soil group (67.5 %)is non-calcareous brown soils which are non-calcareoussoils over non-calcareous rock or massive limestone.They are followed by colluvial soils (11.5 %), brownforest soils (7.7 %), rendzina soils (5.4 %), alluvial soils(5.2 %), red brown Mediterranean soils (1.3 %), non-calcareous brown forest soils (1.2 %) and saline–alka-line soils (0.2 %) (Eroglu and Bozyigit 2013).
The pH of all soils was measured potentiometricallyin a 1:2.5 soil–water suspension using a pH meter(WTW pH 720) instrument. The mean pH value was7.8 while soil samples according to pH ranges weredetermined as slight acid for 2 %, neutral for 20 %,slightly alkaline for 42 %, moderately alkaline for23 %, strongly alkaline for 5 % and very strong alkalinefor 8 %. On the other hand, soil moisture content wasdetermined by weighting sub-samples of soils beforeand after drying at 103 °C in an oven for 24 h, and theorganic matter content was determined by loss on igni-tion in a muffle furnace at 600 °C for 4 h. While theaverage water content of soil was 3.1±1.8 % (with min.0.8 % and max. 9.1 %), average organic matter contentwas 8.5±5.2 % (with min. 2.9 % and max. 30.7 %) andaverage clay content was 36.8±11.9 % (with min.13.6 % and max. 61.3 %).
Statistical analysis
The statistical methods were applied to process theanalytical data to determine its distribution and correla-tion among the parameters. The IBM SPSS Statisticsversion 21 software was used for statistical analyses ofelemental concentrations in the soil samples. Basic sta-tistical parameters such as mean, median, standard de-viation, skewness and kurtosis were computed alongwith multivariate statistical techniques (PCA and CA).The PCA was carried out using Varimax rotation andKaiser Normalization and the CA was applied to thestandardized matrix of samples, using hierarchical clus-tering method. While PCA is used to describe possiblesources, CA organizes a set of variables into two ormore mutually exclusive unknown groups/clustersbased on combination of internal variables. In addition,an interpolation method (the inverse distance weighted[IDW]) was employed using GIS mapping software(ArcGIS 10) to determine the concentration levels oftrace elements in unsampled sites.
6020 Environ Monit Assess (2014) 186:6017–6038
Contamination assessment methods
The enrichment factor (EF) for trace elements in soil iswidely used as an index to identify their origins (crustalor anthropogenic) and to evaluate the degree of anthro-pogenic influences. It is calculated by Eq. 1:
EFTE ¼ CTE=CRð Þsample
CTE=CRð Þbackground; ð1Þ
where (CTE/CR)sample is the ratio of the concentration ofthe trace elements (TE) to that of reference element (R)in the soil sample, and (CTE/CR)background is the sameratio in the background soil. In this study, EF values forsurface soil samples were calculated using local back-ground soil to represent the regional geochemistry. Alwas selected as the reference element since it is one ofthe major components of the local soil. However, dif-ferent crustal elements (i.e., Ti, Sr, Fe, Mn and Na) havebeen used as the reference in the previous studies(Srinivasa Gowd et al. 2010; Iqbal and Shah 2011).Different classifications of EFs have been used to assessthe degree of anthropogenic input to soil (Acosta et al.2009; Gerdol et al. 2000; Varrica et al. 2000; Yuan et al.2014). Five categories were used in the present study;deficiency to minimal enrichment (EF<2), moderateenrichment (2<EF≤5), severe enrichment (5<EF≤20),very high enrichment (20<EF≤40) and extremely highenrichment (40<EF) (Iqbal and Shah 2011; Li and Feng2012; Yongming et al. 2006).
The contamination levels of trace elements in in-dustrial, urban and rural soils are evaluated by usingthe index of geoaccumulation (Igeo) introduced byMuller (1969). Igeo is used to determine trace elemen-tal contamination in soils by comparing the currentand pre-industrial concentrations of the elements. Thebackground or earth’s crust soil concentrations areused for calculation of Igeo because it is not alwayseasy to reach pre-industrial concentrations. It is com-puted using Eq. 2:
Igeo ¼ log2CTE
1:5BTE
� �; ð2Þ
where CTE denotes the measured concentrations ofthe trace elements in the examined soil and BTE
denotes the concentration of the element in the earth’scrust (Taylor and McLennan 1995). The constant 1.5allows analyzing the lithogenic variations of the con-tent of a given substance in the environment and to
detect very small anthropogenic influences (Muller 1969).The Igeo is classified as: uncontamined (Igeo≤0), un-contaminated to moderately contaminated (0<Igeo≤1),moderately contaminated (1<Igeo≤2), moderately tostrongly contaminated (2<Igeo≤3), strongly contaminat-ed (3<Igeo≤4), strongly to extremely contaminated(4<Igeo≤5) and extremely contaminated (5<Igeo)(Cheng et al. 2014; Iqbal and Shah 2011; Loskaet al. 2004).
To further assess the contamination levels of traceelements, the PI and the integrated pollution index(IPI) of elements were calculated using the followingequations:
PITE ¼ CTE=TTE ð3Þ
IPIN ¼ IPI2avg þ PI2max
� �=2
h i1=2; ð4Þ
where CTE is the concentration of a trace element insampled soil and TTE is the corresponding target con-centration of Dutch soil guidelines (VROM 2000),which are based on extensive studies on human andecotoxicology effects of soil contamination. In Eq. 4,IPIavg is the average value of all PITE, and PImax is themaximum value (Nemerow 1991). The IPIN is classifiedas: safe (IPIN≤0.7), precaution (0.7<IPIN≤1), slight pol-lution (1<IPIN≤2), moderate pollution (2<IPIN≤3) andheavy pollution (IPIN≥3) (Luo et al. 2012).
Results and discussions
The concentrations and spatial distributions of traceelements in the topsoil
The mean (and standard deviation) elemental concen-trations of non-industrial, industrial and Nemrut areasites are given in Table 1 along with overall median,kurtosis and skewness statistics. The Nemrut area waspresented and evaluated separately since it containsmany activities related to iron–steel production fromscrap.
Elemental composition indicated that the soil sam-ples from both industrial and non-industrial sites weredominated by crustal elements such as Ca, Fe, Al, Mgand K and the sea salt element, Na which is typical forAegean region. These elements were followed by thetrace elements (Zn, Mn, Pb) emitted by iron–steel pro-duction from scrap. This finding was consistent with
Environ Monit Assess (2014) 186:6017–6038 6021

Table 1 Elemental concentrations in industrial, Nemrut area, and non-industrial sites, and distributional statistics
Mean ± standard deviation (mg/kg dw) Overall
Industrial Nemrut area Residential/rural All regions Median Kurtosis Skewness(n=7) (n=13) (n=20) (n=40)
Caa 49.2±28.8 62.8±30.9 24.8±15.3 41.1±28.8 35.6 0.20 0.97
Fea 23.6±7.4 50.9±17.3 15.9±5.3 27.9±18.7 20.1 0.66 1.28
Ala 15.3±2.9 15.8±5.5 16.2±5.4 15.9±4.9 15.2 0.21 0.47
Mga 7.9±4.9 13.9±9.8 7.1±8.1 9.3±8.6 5.9 5.98 2.39
Zn 311±221 6,065±4,854 151±167 1,957±3,754 219 4.19 2.26
K 3,715±1,210 3,150±1,423 4,251±1,681 3,813±1,564 3,584 −0.54 0.44
Mn 731±284 3,148±1,704 612±221 1,397±1,486 672 4.18 2.05
Na 788±266 2,113±1,141 938±688 1,261±966 799 0.49 1.31
Pb 128±157 1,309±963 37.1±36.1 437±776 63.1 3.24 2.07
P 764±416 690±273 731±290 726±306 613 1.74 1.37
Ba 261±91.7 346±90.4 201±42.5 257±93.5 213 −0.23 0.89
Cu 54.6±52.6 237±118 24.3±15.8 94.1±117 28.5 0.54 1.40
Cr 30.6±19.1 232±146 20.8±15.5 86.2±125 24 4.60 2.14
Sr 136±78.2 115±35.8 82.7±53.6 103±57.7 86.4 3.36 1.66
Ga 50.4±18 77.9±32.5 40±8.78 53.5±25.9 41.3 4.35 1.98
Ni 50.2±23.7 71.9±36.6 18.5±8.21 40.8±32.9 30.2 2.64 1.58
V 63.8±46.3 41.4±20.6 26.8±7.53 38.6±27.1 32.5 10.75 3.07
Sn 2.77±2.27 32.5±16.5 2.81±3.11 11.7±16.5 2.71 0.79 1.49
Ce 42.8±10.3 28.1±10.7 38.3±10.9 36.1±11.8 35.6 0.26 0.21
B 5.3±1.99 25.5±17.8 5.12±4.04 11.3±13.7 5.68 4.31 2.22
As 31.7±18.5 25.5±14.7 16.9±29 22.4±23.8 17.7 12.97 3.18
Cd 0.88±0.85 23.5±21.3 0.38±0.59 7.42±15.5 0.45 8.19 2.77
Rb 16.8±4.38 18±10.8 20.7±7.96 19.1±8.38 17.9 0.12 0.57
Co 13.9±6.5 16.7±7.41 9.75±2.82 12.7±6.05 12 4.90 1.96
La 22.3±7.6 13.7±4.96 18.3±4.89 17.7±6.19 17.2 3.43 1.04
Nd 17.8±3.53 12.9±4.4 16±3.99 15.4±4.34 15.8 0.53 0.06
Th 11±4.94 9±4.56 9.38±3.55 9.6±4.11 8.92 −0.69 0.49
Y 10.9±1.41 8.24±2.01 10.5±2.67 9.89±2.49 9.87 2.17 0.76
Mo 2.31±1.44 8.02±4.78 1.07±1.44 3.57±4.21 1.33 1.32 1.56
Li 3.79±1.12 7.36±3.9 6.4±2 6.17±2.84 5.73 1.06 1.01
Sb 1.69±2.56 5.3±3.25 0.57±0.55 2.21±2.94 0.6 0.90 1.50
Ag 0.21±0.18 3.84±3.24 0.18±0.17 1.28±2.42 0.16 5.35 2.41
Pr 4.51±0.87 3.2±1.12 4.01±0.99 3.87±1.1 4 0.56 0.01
Bi 0.37±0.18 2.5±1.96 0.24±0.09 0.94±1.47 0.33 5.49 2.42
Sm 3.23±0.59 2.34±0.72 2.92±0.7 2.8±0.75 2.86 0.72 0.10
U 2.27±0.91 2.11±0.91 1.6±0.85 1.89±0.9 1.49 0.00 1.04
Gd 2.77±0.44 2.04±0.6 2.55±0.59 2.44±0.62 2.49 1.05 0.13
Dy 1.99±0.28 1.51±0.39 1.89±0.44 1.8±0.43 1.8 1.68 0.41
Se 1.12±0.18 1.16±0.43 1.01±0.23 1.08±0.3 1.03 6.10 1.78
Be 1.26±0.45 1.13±0.59 0.87±0.23 1.03±0.43 0.97 3.08 1.60
Er 1.04±0.15 0.79±0.2 1.01±0.26 0.95±0.25 0.95 2.02 0.69
Yb 0.9±0.14 0.69±0.17 0.9±0.25 0.84±0.23 0.84 2.53 0.95
6022 Environ Monit Assess (2014) 186:6017–6038

previous studies around this region (Yatkin and Bayram2011; Cetin et al. 2007). The mean concentrations of Zn,Mn, Pb were 6,065, 3,148, 1,309 mg/kg dw in Nemrutarea; 311, 731, 128 mg/kg dw in industrial sites and 151,612, 37.1 mg/kg dw in non-industrial sites, respectively.On the other hand, the mean concentrations of Ni, V, Asand Co that are anthropogenic elements associated withoil refining and combustion were measured as 71.9,41.4, 25.5, 16.7 mg/kg dw in Nemrut area; 50.2, 63.8,31.7, 13.9 mg/kg dw in industrial sites; and 18.5, 26.8,16.9, 9.8 mg/kg dw in non-industrial sites, respectively.B concentrations were also highest in Nemrut area, 25.5,5.3 and 5.1 mg/kg dw in Nemrut area, industrial sitesand non-industrial sites, respectively. This may be dueto the groundwater use in the cooling towers of severalplants having geothermal interferences in the study area(Senguler et al. 2000; Ozkan et al. 2011). Some anthro-pogenic elements in non-industrial sites and, generally,the rare earth element concentrations were lower than1 mg/kg dw.
The skewness values were calculated for each ele-ment (Table 1). The skewness is an indicator used indistribution analysis as a sign of asymmetry and devia-tion from a normal distribution. In nature, if an elementis not influenced by anthropogenic sources, it follows anormal distribution in an area (Zhao et al. 2010). Theelements Al, Ba, Ca, Gd, K, Rb and rare earth elementswere normally distributed in the topsoil of the studyarea, so they are thought to be affected mainly by thesoil parent materials. Ag, As, B, Bi, Cd, Cr, Mg,Mn, Pb,V and Zn (skewness >2) exhibited a right-skewed dis-tribution (most values are concentrated on left of themean, with extreme values to the right) with moreoutliers, which might be attributed to the anthropogenic
inputs and different rock types that may cause a largevariation in concentrations of some crustal elementssuch as Mg. On the other hand, other anthropogenicelements like Be, Co, Cu, Ga, Mo, Ni, Sb, Se, Sn, Srand Tl showed asymmetric distribution patterns withskewness values >1.5.
In the study area, the spatial distribution patterns ofsoil elemental concentrations varied greatly among sam-pling sites. The highest concentrations for almost alltrace elements were measured in Nemrut area and in-dustrial sites due to anthropogenic sources (Table 1).The mean concentrations of trace elements in theNemrut area were up to 61, 40, 35, 22, 12, 11, ten, ten,nine and eight times higher than those in non-industrialsites for Cd, Zn, Pb, Ag, Sn, Cr, Cu, Bi, Sb and Mo,respectively since iron–steel production from scrapemits significant amounts of these elements, both fromstack emissions and fugitive sources such as large slagand scrap piles. On the other hand, crustal elements(such as P, Ba, Sr) and rare earth elements (Nd, Pr,Sm, Dy, Er) levels did not show significant differencesamong the sampling sites. The spatial distributions ofselected elemental concentrations were mapped by IDWmethod and depicted in Figs. 2 and 3. The Fe, Zn, Cdand Cr distribution trends were generally similar, al-though their concentrations were different, indicatingthat these elements emitted from the same sources.However, the distribution of Fe was wider because it iscrustal as well as anthropogenic (due to steel plantemissions) in this area. The spatial distribution of Cuand Ga were slightly different from the distribution ofZn, Cd and Cr. Although the highest Cu and Ga con-centrations were found in iron–steel production areasimilar to other elements related to iron–steel production,
Table 1 (continued)
Mean ± standard deviation (mg/kg dw) Overall
Industrial Nemrut area Residential/rural All regions Median Kurtosis Skewness(n=7) (n=13) (n=20) (n=40)
Hg 0.16±0.29 0.58±0.44 0.15±0.27 0.43±0.41 0.25 0.94 1.29
Eu 0.53±0.1 0.41±0.14 0.43±0.1 0.45±0.12 0.45 0.11 0.04
Tl 0.57±0.29 0.34±0.11 0.29±0.12 0.36±0.19 0.3 3.69 1.98
Ho 0.38±0.05 0.29±0.08 0.37±0.09 0.35±0.09 0.35 1.87 0.54
Tb 0.37±0.07 0.25±0.08 0.34±0.09 0.32±0.09 0.31 0.61 0.37
Lu 0.15±0.02 0.11±0.03 0.15±0.05 0.14±0.04 0.14 2.69 1.09
a In g/kg dw
Environ Monit Assess (2014) 186:6017–6038 6023

Fig. 2 Spatial distribution of trace elements (Fe, Ag, Zn, Cd, Cr, Co) in soils around the Aliaga region
6024 Environ Monit Assess (2014) 186:6017–6038
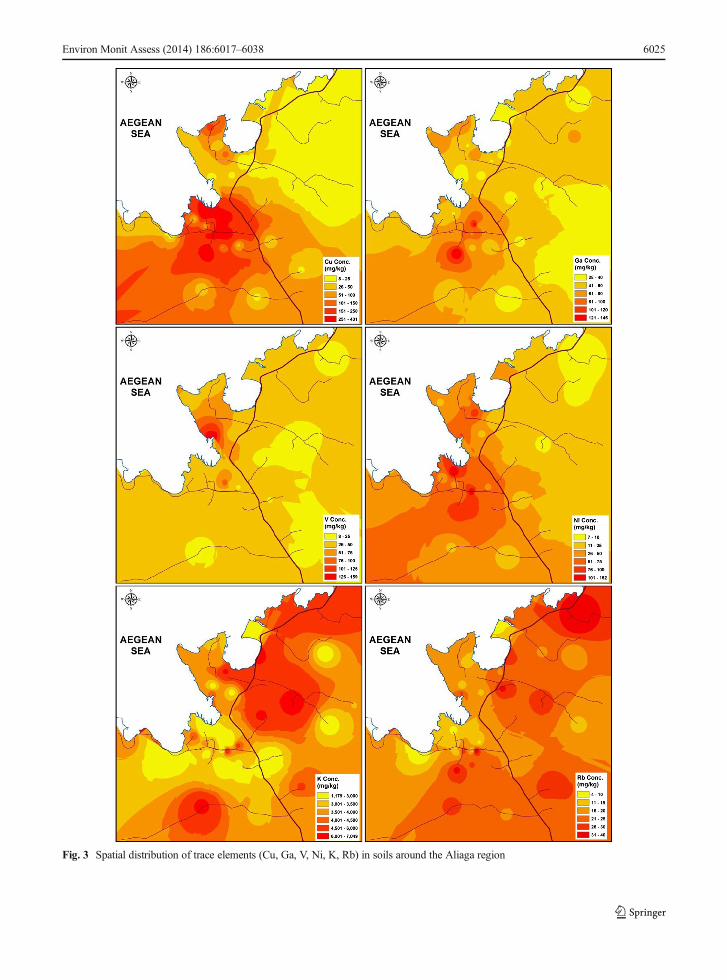
Fig. 3 Spatial distribution of trace elements (Cu, Ga, V, Ni, K, Rb) in soils around the Aliaga region
Environ Monit Assess (2014) 186:6017–6038 6025

their concentrations were also high in the vicinity of shipbreaking yards and in the peninsula. Copper recycling byremoving the plastic insulation from copper wire andelectronic wastes are performed on the scraps from shipbreaking. This procedure is conducted by uncontrolledburning of the plastic coating in open areas. Therefore,substantial amounts of Cu are emitted from this recyclingprocess and salvage activities. As shown in Figs. 2 and 3,V hotspots were mainly in the petrochemical and refineryarea in peninsula because it is a marker for fuel-oilcombustion (Kim and Hopke 2004). Co and Ni showeda similar pattern and associated with the distribution of Vin the peninsula, since they were also emitted from oilcombustion, petrochemical complex and refinery. On theother hand, Co and Ni are also associated with iron–steelindustries using ferrous scrap (Ismail et al. 2013; Lineet al. 1997; Temple and Linzon 1976; U.S. GeologicalSurvey 2013). Therefore, the highest concentrations forNi and Co were measured in Nemrut area (iron–steelproduction area). K and Rb had completely differentspatial distribution patterns from the marker elements ofdominating sources (i.e., Cd, Zn, Pb, Ag, Sn, Cr, Cu, Bi,Sb for iron–steel production; V, Ni and Co for oil com-bustion, petroleum refining and petrochemical industry).Concentrations of K and Rb were lower in the Nemrutarea and industrial site. K has a crustal origin and is alsoemitted from wood combustion from residential heatingalong with Rb.
Present mean elemental levels in the industrial andnon-industrial soils were also compared with those re-ported form other regions around the world and uppercontinental crust (UCC) in Table 2. Concentrations ofsome crustal elements (Al, K, Mg, Na, Sr and Ba) werelower than those in UCCs and some rural regions. Caand Fe concentrations were considerably higher thanUCCs. This indicated that crustal element concentra-tions depend on the soil/rock formations; hence crustalelemental concentrations vary with regard to geologicalorigin. As compared to a previous study in the sameindustrial region (Yatkin and Bayram 2011), the con-centrations of Co, Cr, Mg, Ni, Sr and V were similarhowever levels of Cd, Cu, Fe, Mn, Pb and Zn wereconsiderably higher. Increase in the elemental concen-trations related to the iron–steel production might beattributed to their accumulation in the soil and increas-ing activities of these plants recently. Although the meanconcentrations of As, Cd, Cu, Mn, Pb and Zn measuredin industrial sites of the present study were higher thanmost of the reported levels in the Table 2, Cr, Cu and Ni
levels were lower than those reported from industrialarea in Ghaziabad, India (Chabukdhara and Nema2013). Mean concentrations of several elements fornon-industrial sites in this region were comparable tothose reported from other urban and rural sites.
The elemental concentrations of fugitive sources
In the study region, especially in Nemrut area, signifi-cant pollutant sources for soils are the fugitive sources(i.e., paved and unpaved roads, slag piles, EAFs filterdust piles and coal piles) and regular emissions fromstacks of the iron–steel plants. The uncontrolled partic-ulate matter emissions are emitted from roads by resus-pension due to moving vehicles, from the piles due toloading and dumping activities, and due to wind entrain-ment from the slag storage areas and coal screeningareas. These particulate matter emissions are thenaccumulated in local soil by dry and wet deposition.Therefore, samples were collected from these sourcesand they were characterized in terms of their ele-mental composition. Table 3 shows the elementalcompositions of the samples collected from fugitiveand regular sources.
Paved and unpaved roads
Dust from paved and unpaved roads is one of the majorsources of particulate matter in Nemrut area due to verydense transportation activity of ferrous scrap trucks. Themajor arterial roads (Canakkale-Izmir and Foca roads)passed through the study area. The mean hourly vehiclecounts were 125, 39 and 25 in Foca road and 496, 161and 134 in Canakkale-Izmir road for passenger cars,light duty trucks and heavy duty trucks, respectively.The elemental composition of paved road dust wasdominated by crustal elements such as Fe, Ca, Mg andAl. In addition, Zn and Pb were abundant in paved roaddust. These results were consistent with the other studies(Han et al. 2009; Lin et al. 2008). The elemental com-position of unpaved road dust was similar to the pavedroads, since the emissions from iron–steel production isthe dominant source in the area. On the other hand, theconcentrations in main roads (Canakkale-Izmir andFoca roads) were lower as compared to those in pavedroads. As compared to the elemental concentrations ofsoil samples in Nemrut area, the crustal element levels(Ca, Al andMg) were similar. However, Fe, Zn, Mn and
6026 Environ Monit Assess (2014) 186:6017–6038

Tab
le2
Com
parisonof
elem
entalconcentratio
ns(m
g/kg)with
theprevious
studiesaround
theworld
As
Ba
Cd
Co
Cr
Cu
Fe
KMg
Mn
Mo
Ni
PPb
SrV
Zn
Reference
Aliaga,Izm
irIndustrial(including
Nem
rutarea)
28312
1416
152
164
40,036
3,376
11,524
2,181
5.7
63720
836
123
503,763
ThisStudy
Aliağa,Izm
irNon-industrial
16201
0.4
9.7
2124
15,896
4,250
7,112
612
1.1
18731
3783
27150
ThisStudy
Aliaga,Izm
irIndustrial
512
2.3
23163
4527,800
18,300
14,300
864
6285
190
781,092
YatkinandBayram
(2011)
Kanpur,India
Industrial
295
2,652
4238
105
54159
SrinivasaGow
detal.(2010)
HongKong
Industrial
181.3
2687
62Chenetal.(1997)
Ghaziabad,India
Industrial
1.1
807
295
25,457
809
279
225
373
ChabukdharaandNem
a(2013)
Weinan,China
Industrial
8.5
542
1196
20538
2546
7771
Liand
Feng(2012)
Annaba,Algeria
Industrial
0.4
3139
24,270
355
5368
Maasetal.(2010)
Murcia,Spain
Urban
531
9.2
229.3
28,202
208
1419
27Acostaetal.(2009)
Xuzhou,China
Urban
0.6
7334
459
334
37198
169
Wang(2013)
Lishuicity,C
hina
Urban
8.8
0.5
6.4
3536
1463
43192
Luetal.(2010)
CentralCatalonia,
Spain
Urban
227
0.3
2520
21,754
463
2420
7450
72Tum
eetal.(2011)
China
Urban
110.4
7638
2727
74Cheng
etal.(2014)
MexicoCity,M
exico
Urban
135
9349
116
447
Rodríguez-Salazar
etal.(2011)
Hangzhoucity,C
hina
Rural/Urban
6.3
0.3
9.3
6237
415
2046
116
T.Chenetal.(2008)
NoviS
ad,S
erbia
Rural/Urban
1.7
3.6
2226
29110
SkrbicandDurisic-M
ladenovic
(2010)
Korea
Rural
1.9
0.4
1322
14132
Koetal.(2010)
Belgrade,Serbia
Rural
1.4
468.6
953
320
4222
Dragovicetal.(2008)
Luxem
bourg
Rural
58232
0.8
24124
3294,000
12,000
4,000
1,364
2070
44116
338
224
Horckmansetal.(2005)
Faridpur,B
angladesh
Rural
6.9
0.1
3812
20,372
3,841
282
24353
8.5
103
Rahman
andNaidu
(2010)
Islamabad,P
akistan
Rural
1.9
1823
148,371
1,124
2,988
424
3384
34Iqbaland
Shah
(2011)
Granada,S
pain
Rural
7.9
944
2020
1737
Díezetal.(2009)
Upper
Contin
ental
Crust
Background
1.5
550
0.1
1035
2535,000
28,000
13,300
600
1.5
20700
20350
6071
Taylor
andMcL
ennan(1995)
Environ Monit Assess (2014) 186:6017–6038 6027

Table 3 The elemental composition of the samples collected from fugitive and regular sources (mg/kg dw)
Fugitive sources The stack gas of EAFs
Paved roads Unpaved road Slag piles Filter dust Coal piles PM10 PM2.5
Fea 218±62.4 158±67.7 152±98.8 217±11.7 23.6 231±36.5 203±43.9
Caa 79.9±14.1 76.7±25.6 106±35.2 20.1±1 10 5.145±2.9 1.63±0.85
Mga 14.7±3.9 22.9±18.9 45.1±28.6 8.3±0.29 1.5 5.053±0.73 4.49±0.65
Ala 16.6±3.5 17.3±3.5 20.5±5.7 3.6±0.04 9.2 2.225±0.88 1.82±1.14
Zna 16.9±10.3 18.5±10.7 18.5±10.8 164±2.1 1.3 234±59.4 241±20.3
Mn 9,313±2,825 8,222±3,177 9,886±6,219 13,743±639 953 16,994±2,445 12,920±2,084
Pb 3,872±2,009 4,010±2,271 3,596±1,742 21,297±996 260 22,067±2,982 34,561±4,510
Na 1,809±718 3,219±1,663 3,518±4,507 15,115±625 533 23,169±3,457 25,179±4,004
K 1,950±664 1,934±499 1,987±969 11,468±610 1,045 16,219±2,956 19,658±4,544
Cr 948±293 788±233 1,138±931 1,851±126 53.5 1,943±153 1,736±190
P 904±91.2 872±214 875±298 837±26.5 756 771±204 1,010±234
Ba 684±125 614±143 724±292 454±18 347 628±148 834±169
Cu 774±180 605±257 556±316 2,216±70.6 75.5 2,839±358 3,068±527
Sr 205±29.2 221±15.5 245±19.5 72±2.82 246 54.8±9.31 47.9±6.14
Ni 247±75.5 169±64.3 147±85.2 180±9.22 30.4 204±38.9 251±62.7
B 117±44.5 122±37.2 140±80.1 377±1.43 15.6 348±78.1 315±11.4
Ga 121±21.7 113±22.2 129±47.2 109±0.76 67.1 190±41.9 236±35.4
V 115±27.3 120±49.4 124±59.2 53.1±4.76 21 41±6.93 36.2±5.08
Sn 74.5±31.3 66.5±30 69.4±40.9 516±10.4 3.37 679±44.5 787±107
Cd 66.8±33.9 65.8±41.5 57.5±33.3 733±34.7 3.78 928±190 949±198
Rb 21.5±7.59 19.4±6.05 28.2±24.6 62±0.59 5.71 83±15.9 108±24.6
Mo 43±17.8 27.9±11.9 24.1±14.3 33.5±2.2 2.41 43.1±9.26 60.5±10.4
As 33.8±3.93 31.1±10.1 23.3±10.7 48.7±1.81 7.66 62.3±5.25 74.5±2.25
Ce 24.6±2.84 26±4.38 22.4±7.64 4.83±0.07 20.8 5.22±0.86 4.1±0.48
Ag 17.4±8.86 18.2±10.1 18.8±12.4 173±4.98 1.32 216±45.2 293±57
Co 28.6±7.73 21.7±8.88 16.1±8.3 17.7±0.7 8.88 17.2±1.88 17.1±1.59
Li 12.7±3.3 14.3±2.59 13±2.84 36.9±1.39 8.11 44.9±5.82 39.4±1.73
La 12.6±1.54 12.7±2.41 11.5±4.3 2.1±0.03 10.5 1.17±0.31 0.9±0.01
Nd 10.6±1.01 10.8±2.14 10.9±2.45 2.03±0.08 8.7 1.26±0.17 0.85±0.07
Y 6.96±0.77 7.92±1.96 6.83±2.06 0.95±0.03 10 0.3±0.07 0.22±0.03
Bi 9.94±4.81 7.5±4.61 6.31±2.88 78±17.2 0.51 69.8±8.8 92.5±8.77
Th 5.45±1.35 4.87±1.6 4.53±3.02 0.26±0.02 3.05 0.14±0.03 0.07±0.02
Sb 4.79±2.21 4.79±2.6 3.95±1.71 29.3±0.84 0.25 38.7±4.56 46.6±6.97
Pr 2.7±0.31 2.79±0.57 2.91±0.81 0.47±0.04 2.26 0.29±0.02 0.19±0.01
Se 1.45±0.6 1.49±0.72 1.74±0.75 7.09±0.31 0.68 14±0.43 19.2±1.12
Sm 1.79±0.24 1.89±0.45 1.71±0.59 0.23±0.05 1.8 0.02±0.04 0.01±0.01
U 1.81±0.28 2±0.57 1.7±0.25 0.32±0.01 1.36 0.26±0.07 0.18±0.02
Gd 1.49±0.22 1.63±0.4 1.34±0.51 0.16±0.01 1.73 0.03±0.02 ND
Dy 1.23±0.14 1.39±0.33 1.14±0.35 0.16±0.02 1.56 ND ND
Be 0.69±0.15 0.79±0.27 0.76±0.43 0.12±0.01 1.42 0.05±0.02 0.03±0.01
Er 0.62±0.08 0.73±0.21 0.56±0.19 0.06±0.02 0.85 ND ND
Hg 0.58±0.23 0.58±0.32 0.53±0.39 2.1±0.34 0.42 7.08±2.58 9±3.1
Yb 0.56±0.07 0.67±0.18 0.53±0.17 0.06±0.01 0.66 ND ND
6028 Environ Monit Assess (2014) 186:6017–6038

Pb concentrations were up to five times higher than thesoil samples.
Slag piles
During iron–steel production slag is created as a solidwaste. Its elemental concentrations were higher than thetypical concentrations in Aliaga soil. Therefore, slagposes an environmental risk to human and natural lifethat come into contact with this substance. The area ofthe slag piles were 0.46 km2 in the Nemrut area. Theelemental composition of slag dust was dominated bycrustal elements such as Fe, Ca, Mg and Al. Highconcentrations of Zn and Pb were also observed in theslag dust samples. The element percentages of slag(<75 μm) were 15 % for Fe, 10 % for Ca, 4.5 % forMg, 2.1 % for Al, 1.8 % for Zn, 1.0 % for Mn and 0.4 %for Pb.
Coal piles
The coal screening and packaging plants in the Nemrutarea are one of the significant fugitive dust sources.Open coal processing area covered 0.24 km2 in thestudy area. The elemental concentrations were obvious-ly lower than other dust samples. Elemental composi-tion shows the abundance of Fe, Ca, Al, Mg, Zn, K, Mnand Na in the coal dust (<75 μm). Comparison of theprofiles in the present study with those reported previ-ously (Kong et al. 2011) showed similarities.
EAFs filter dusts
Isokinetic for PM10 and PM2.5 sampling was carriedout at the stack gas of EAFs after fabric filters. Filterdust samples (<75 μm) were also collected from the
plants. The results indicated that PM and filter dustsamples contained substantial amounts of Fe, Zn, Mn,K, Mg, Ca, Al, Pb, Cd, Cr, Cu and Sn. The followingmean percentage contributions were determined: 24 %,23 %, 16 % for Zn; 20 %, 23 %, 22 % for Fe; 2.5 %,2.3 %, 1.5 % for Na; 3.5 %, 2.2 %, 2.1 % for Pb; 1.3 %,1.7 %, 1.4 % for Mn; 2 %, 1.6 %, 1.2 % for K, 0.2 %,0.5 %, 2 % for Ca, 0.5 %, 0.5 %, 0.8 % for Mg in PM2.5,PM10 and filter dust, respectively. The percentage ofcrustal elements was higher in coarse fraction. In addi-tion, percentage of Cu, Al, Cr, Cd, P and Sn were rangedbetween 0.1 % and 0.3 %. The percentage contributionsof these elements in the present study were consistentwith the reported elemental composition of EAF dust inprevious studies (Yatkin and Bayram 2008; Sofilić et al.2004; Patil et al. 2013).
Assessment of pollution state and sources
Three approaches (EF, Igeo and IPI) were used for deter-mination of pollution status of soil samples, and thepossible sources were identified by PCA and CA inthe Aliaga region.
The EFs calculated relative to the background site forindustrial (including Nemrut area) and non-industrialsites are shown in Fig. 4a and b. As an indicator ofanthropogenic input in industrial sites, EFs indicatedmoderate enrichment for Ni, Fe, Na and Sb, and severeenrichment for Mn, B, Hg, Cr, Cu, Bi and Mo. Since theiron–steel plants with EAFs contributed significantly tothe soil pollution, Sn (EF=32.8) and Zn (EF=37.4) inindustrial sites (including Nemrut area) were highlyenriched compared to the non-industrial sites (EFZn=1.8, EFSn=5.1). However, Ag, Pb and Cdwere extreme-ly enriched in industrial sites with EFs of 42.6, 47.1 and121.4, respectively, whereas they were 3.9, 2.5 and 4.2
Table 3 (continued)
Fugitive sources The stack gas of EAFs
Paved roads Unpaved road Slag piles Filter dust Coal piles PM10 PM2.5
Eu 0.3±0.04 0.32±0.05 0.29±0.12 0.05±0.02 0.32 ND ND
Tl 0.44±0.11 0.43±0.15 0.25±0.11 1.87±0.1 0.74 2.97±0.29 3.61±0.27
Ho 0.21±0.03 0.25±0.07 0.19±0.07 0.01±0.01 0.27 ND ND
Tb 0.19±0.03 0.22±0.06 0.17±0.08 0.01±0.01 0.23 ND ND
Lu 0.06±0.01 0.08±0.03 0.06±0.03 ND 0.05 ND ND
a In g/kg dw
Environ Monit Assess (2014) 186:6017–6038 6029

for non-industrial sites. EFs for many trace elementsindicated no enrichment for non-industrial sites.
The non-industrial sites appeared to be uncontami-nated with negative Igeo values for the all trace elements.The mean Igeo values for Cd, Ag, Zn, As, Pb, Sb, Bi, Hg,Cu, Ga, Mo, Cr, Ni, Mn and Sn in the industrial sites(including Nemrut area) were in the range of 0.25–4.78.While Igeo values revealed strong to extreme contami-nation by Cr, they indicated strong contamination forAg, Zn, As, Pb in the industrial sites. Figure 5 presentsthe boxplots of the Igeo values for the trace elements inthe industrial sites. In Horozgedigi village located in
Nemrut area, the Igeo values for Cd, Ag, Pb, Zn and Sbwere found to be 7.96, 6.28, 6.39, 6.58 and 4.51, re-spectively showing extreme contamination.
The assessment of the EFs and Igeo values for theindustrial sites (including Nemrut area) indicated thatCd, Pb, Ag, Zn, Sn, Bi. Hg and Mo originated fromanthropogenic sources and they might pose a seriousrisk for soil environment in the industrial sites.
The PI values were calculated for As, Ba, Be, Cd, Co,Cr, Cu, Hg, Mo, Ni, Pb, Sb, Se, Tl, Vand Zn accordingto target concentrations given by Dutch soil guidelines,and then IPIN values were determined for the study sites.
0.1
1
10
100
Li
K
Ce
Tb
La
Sm
Nd
Gd
Eu
Pr
Dy
Rb Y
Ho
Er
Yb
Lu P
Se
Th
As
Co
Ba
Be
Mg
Ga V Tl
U
Ca
Sr
Ni
Fe
Na
Sb
Mn B
Hg
Cr
Cu
Bi
Mo
Sn
Zn
Ag
Pb
Cd
EFs
(a)
0.1
1
10
100
Sb
Li
Ni
K La
Eu
Ce
Tb
Sm
Nd
Pr
V
Gd
Se
Co
Dy
Fe
Cr
Ba Y
Ga
Ho
Rb
Th
Er P
Ca
Yb
Mn
Lu
Be
As
Zn B
Cu
Bi
Tl
U
Mg
Pb
Na
Sr
Ag
Mo
Cd
Hg
Sn
EFs
(b)
Fig. 4 Enrichment factors of elements in industrial (a), non-industrial (b) sites. The error bars represent 1 standard deviation
-2
0
2
4
6
8
10
Cd Ag Zn As Pb Sb Bi Hg Cu Ga Mo Cr Ni Mn Sn
Igeo
Val
ue
Fig. 5 Boxplots of the Igeo values for trace elements in the industrial sites
6030 Environ Monit Assess (2014) 186:6017–6038
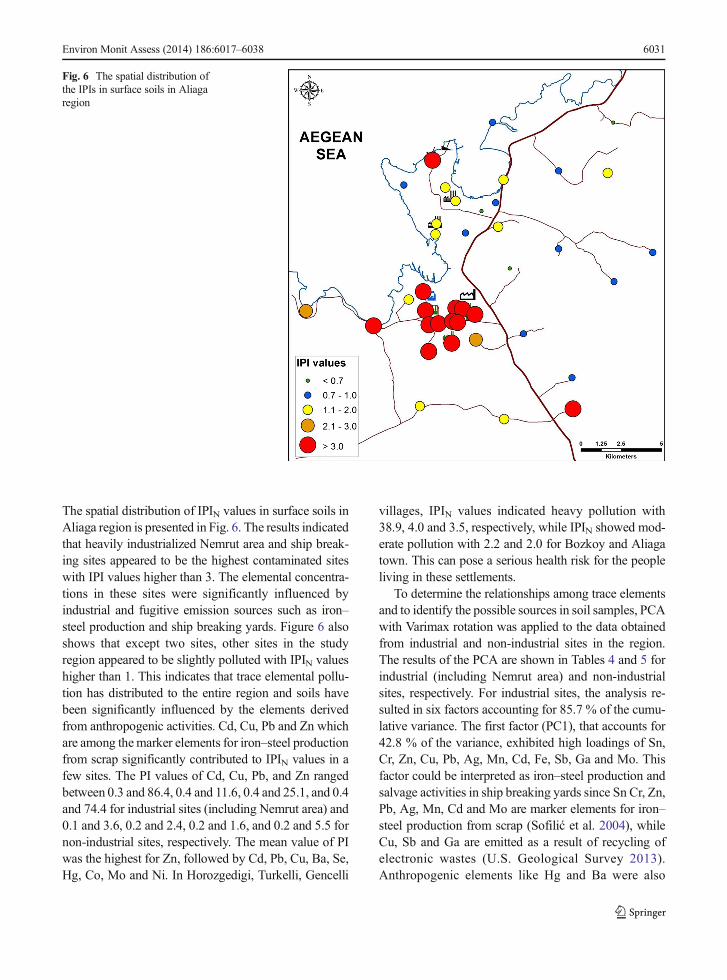
The spatial distribution of IPIN values in surface soils inAliaga region is presented in Fig. 6. The results indicatedthat heavily industrialized Nemrut area and ship break-ing sites appeared to be the highest contaminated siteswith IPI values higher than 3. The elemental concentra-tions in these sites were significantly influenced byindustrial and fugitive emission sources such as iron–steel production and ship breaking yards. Figure 6 alsoshows that except two sites, other sites in the studyregion appeared to be slightly polluted with IPIN valueshigher than 1. This indicates that trace elemental pollu-tion has distributed to the entire region and soils havebeen significantly influenced by the elements derivedfrom anthropogenic activities. Cd, Cu, Pb and Zn whichare among themarker elements for iron–steel productionfrom scrap significantly contributed to IPIN values in afew sites. The PI values of Cd, Cu, Pb, and Zn rangedbetween 0.3 and 86.4, 0.4 and 11.6, 0.4 and 25.1, and 0.4and 74.4 for industrial sites (including Nemrut area) and0.1 and 3.6, 0.2 and 2.4, 0.2 and 1.6, and 0.2 and 5.5 fornon-industrial sites, respectively. The mean value of PIwas the highest for Zn, followed by Cd, Pb, Cu, Ba, Se,Hg, Co, Mo and Ni. In Horozgedigi, Turkelli, Gencelli
villages, IPIN values indicated heavy pollution with38.9, 4.0 and 3.5, respectively, while IPIN showed mod-erate pollution with 2.2 and 2.0 for Bozkoy and Aliagatown. This can pose a serious health risk for the peopleliving in these settlements.
To determine the relationships among trace elementsand to identify the possible sources in soil samples, PCAwith Varimax rotation was applied to the data obtainedfrom industrial and non-industrial sites in the region.The results of the PCA are shown in Tables 4 and 5 forindustrial (including Nemrut area) and non-industrialsites, respectively. For industrial sites, the analysis re-sulted in six factors accounting for 85.7 % of the cumu-lative variance. The first factor (PC1), that accounts for42.8 % of the variance, exhibited high loadings of Sn,Cr, Zn, Cu, Pb, Ag, Mn, Cd, Fe, Sb, Ga and Mo. Thisfactor could be interpreted as iron–steel production andsalvage activities in ship breaking yards since Sn Cr, Zn,Pb, Ag, Mn, Cd and Mo are marker elements for iron–steel production from scrap (Sofilić et al. 2004), whileCu, Sb and Ga are emitted as a result of recycling ofelectronic wastes (U.S. Geological Survey 2013).Anthropogenic elements like Hg and Ba were also
Fig. 6 The spatial distribution ofthe IPIs in surface soils in Aliagaregion
Environ Monit Assess (2014) 186:6017–6038 6031

associated with this factor. This finding was also inagreement with the pollution status of soil. The secondfactor (PC2) accounted for 12.19 % of the variance andassociated mainly with Mo and Ni. The primary uses ofNi and Mo are in the production of alloys includingstainless steel (ATSDR 2005). Ni is also emitted fromfuel-oil combustion. Therefore this factor also presentsindustrial activities. The third factor (PC3) showed highloadings with Se, Al, Mg and Sb. This factor could beassociated with emissions related to traffic and road dust(Stortini et al. 2009; Beuck et al. 2011). The fourthfactor (PC4) accounted for 7 % of the variance, and it
was associated with crustal elements like Ba, Sr and P(Srimuruganandam and Shiva Nagendra 2012). Thefifth (PC5) and sixth (PC6) factors were loaded withCo, Ni, V and As. Hence, these factors represent oilcombustion in refinery and petrochemical complexes(Karanasiou et al. 2009; Mansha et al. 2012). On theother hand, for the non-industrial sites, factors extractedfrom PCA were consistent with those for industrialsites since the anthropogenic sources affected the en-tire region. The extracted seven components accountedfor 91.4 % of the cumulative variance for the non-industrial sites. The first factor (PC1) that accounts for
Table 4 Factor analysis on ele-mental composition of industrialsoil samplesa,b
aExtraction method: principalcomponent analysis; rotationmethod: Varimax with KaisernormalizationbFactor loadings >0.400 werereported
PC1 PC2 PC3 PC4 PC5 PC6
Sn 0.962
Cr 0.916
Zn 0.909
Cu 0.909
Pb 0.900
Ag 0.896
Mn 0.880
Cd 0.876
Fe 0.849
B 0.822
Sb 0.810 0.407
Ga 0.806
Mo 0.771 0.500
Hg 0.704
Ba 0.686 0.423
Gd −0.646 −0.575Na 0.638
Ca 0.799
K −0.791Rb −0.697Se 0.856
Al 0.836
Mg 0.475 0.762
Sr 0.800
P 0.671
Co 0.906
Li 0.558 0.665
Ni 0.453 0.466
As 0.752
V 0.750
% of Variance 42.76 12.19 11.53 7.00 6.80 5.41
6032 Environ Monit Assess (2014) 186:6017–6038

23.7 % of the variance is associated with crustalelements (Sr, Mg, Ca, Na and Fe) and some anthro-pogenic elements (Ni, Mo and Hg). Therefore, this factorcould be explained as polluted soil, since anthropogenicinterferences (such as residual oil combustion) could beseen for the source. The second factor (PC2) accountedfor 20.2 % of the variance, associated with Fe, Zn, Cd,Cu, Pb, Cr, Sb, Ag, Co and Mn. Hence, this factorrepresents iron–steel production from scrap. Third(PC3) and sixth factors (PC6) are associated with iron–steel production, similar to PC2. The fourth factor (PC4)showed high loadings with Se, Al, Ba, Gd and Ga. This
factor might be explained as traffic and road dust. Thefifth factor (PC5) accounted for 10.4 % of the variance,associated with Ni, V, Co and Se which are the markerelements for fuel-oil combustion. The last factor withhigh loading of P may be related to fertilizer use inagricultural areas and emissions of the fertilizer plant inthe area.
The results of CA for 40 sampling sites using theirtrace elemental concentrations were illustrated with adendrogram in Fig. 7. Four groups were defined by thedendrogram in the study area. Mean concentrations forsome elements of each cluster and the number of the
Table 5 Factor analysis onelemental composition ofnon-industrial soil samplesa,b
aExtraction method: principalcomponent analysis; rotationmethod: Varimax with KaisernormalizationbFactor loadings >0.400 werereported
PC1 PC2 PC3 PC4 PC5 PC6 PC7
Sr 0.963
As 0.956
Mg 0.950
Hg 0.922
Mo 0.918
Ca 0.818
Na 0.715 0.543
Ni 0.610 0.594
Fe 0.519 0.493 0.513
Zn 0.974
Cd 0.974
Cu 0.923
Pb 0.857 0.410
Cr 0.830 0.442
B 0.890
Sn 0.846
Sb 0.482 0.733
Li 0.717
Ag 0.611 0.693
Ga 0.965
Ba 0.965
Se 0.668 0.579
Gd 0.650 0.522
Al −0.496 0.526 −0.410V 0.798
Co 0.407 0.672 0.426
K −0.766Mn 0.545 0.699
Rb −0.494 −0.579P 0.884
% of Variance 23.71 20.17 12.71 11.41 10.43 7.69 5.31
Environ Monit Assess (2014) 186:6017–6038 6033

sampling sites included in each cluster are given inTable 6. Groups 1 and 2 included mostly the samplescollected from non-industrial sites. In these groups,there were relatively low concentrations of anthropo-genic elements, and high concentrations of K, Al, P, Ce,
La, Pr, Rb, Sm and Th. Group 3 contained the highestconcentrations of Cd, Cr, Cu, Fe, Mn, Mo, Ni, Pb, Snand Zn among all the groups. The pollution level wasthe heaviest. All soils in Group 3 were located inNemrut area and this group reflected the influence of
Fig. 7 Dendrogram obtained by cluster analysis for trace element contents in soil samples
6034 Environ Monit Assess (2014) 186:6017–6038

iron–steel production from scrap. The last group wasslightly different from Group 3. Group 4 has also highconcentrations for anthropogenic elements and high pol-lution level although concentrationswere lower than thosein Group 3. It included some residential sites within theNemrut area as well as the industrial Nemrut area sites.
Conclusions
The surface soil samples were collected from industrialand non-industrial sites in July 2009 in the study area.
Fugitive dust samples were also collected from pavedroads, unpaved roads, slag piles, EAF filter dust, coaldust, PM10 and PM2.5 from the stack gas of EAFs.The results of the study indicated the impact ofanthropogenic sources on the levels of trace elementsin region’s soil. The soil was extremely contaminateddue to industrial activities, especially by iron–steelproduction and other associated activities in theNemrut area. Elemental composition indicated thatsoil samples were dominated by crustal elements.These elements were followed by Zn, Mn, Pb, emittedby iron–steel production from scrap. Concentrations ofCd, Zn, Pb, Ag, Sn, Cr, Cu, Bi, Sb and Mo in industrialsites were also high, consistent with those reported inprevious studies.
Fugitive sources like paved and unpaved roads, slagpiles, EAFs filter dust piles and coal piles were alsosignificant pollution sources for soils in the area. Theelemental composition measured in soil samples wassimilar to the composition of fugitive sources. Fe, Mn,Zn and Pb were the dominant elements for both soil andfugitive sources samples. The mean elemental compo-sition for iron–steel production emissions were 24 %,22 %, 2.8 %, 1.5 %, 0.3 %, 0.2 %, 0.2 % and 0.1 % forZn, Fe, Pb, Mn, Cu, Al, Cr and Cd, respectively.
EF and Igeo values were also calculated for traceelements. The highest EF values were calculatedfor Ag, Pb, Cd, Mn, B, Hg, Cr, Cu, Bi and Mo.Igeo values revealed strong to extreme contaminationby Cr. Moreover, Igeo values for Ag, Zn, As and Pbindicated strong contamination in industrial sites. Theassessment of the EFs and Igeo values for the indus-trial sites indicated that Cd, Pb, Ag, Zn, Sn, Bi. Hgand Mo originated from anthropogenic sources andthey may pose a serious risk for soil environment inthe industrial sites. According to IPIN values, heavilyindustrialized Nemrut area and ship breaking sitesappeared to be the highest contaminated sites. ThePCA results also indicated that anthropogenic sources(steel production, refinery and petrochemical processes,and traffic and road dust) were important sources inthis region.
Acknowledgments This study was funded by the “Assessmentof current status of Aliaga industrial region for air pollution”project conducted by Dokuz Eylul University and supported bythe Turkish Ministry of Environment and Urbanism and by theindustries located in Aliaga region. We also thank the Scientificand Technological Research Council of Turkey (TUBITAK) forscholarship support for the first author.
Table 6 Comparison of means of elemental concentrations(mg/kg dw) among clusters, and number of sites included ineach cluster
Group 1 Group 2 Group 3 Group 4
Mean of trace elements
Fe 18,370 16,162 65,694 42,439
Zn 194 218.38 7,855 4,597
Mn 649 631 4,503 2,278
K 4,176 4,473 2,397 3,023
Pb 50.4 61.9 1,650 1,044
P 770 820 516 628
Cr 24.9 19.6 353 157
Cu 31.8 27.8 326 182
Ni 26.5 26.4 101 56.9
Ga 44.6 41.3 82.9 70.6
V 39.4 27.1 56.2 42.1
Sn 2.39 3.80 41.5 24.9
B 4.35 6.64 40.2 16.6
Cd 0.57 0.49 28.4 18.7
As 14.4 16.8 21.0 44.5
Co 10.8 11.0 16.8 16.1
Rb 20.4 19.6 13.4 18.7
Mo 1.28 1.02 12.7 6.15
La 20.5 18.5 8.99 15.4
Sb 0.52 0.88 7.51 4.52
Y 10.8 10.3 6.16 9.37
Ag 0.15 0.24 5.12 2.87
Th 10.6 9.71 4.83 9.65
Bi 0.28 0.27 3.24 1.93
Number of sites included in each cluster
Non-industrial sites 12 7 0 1
Industrial sites 3 3 0 2
Nemrut Area 2 0 4 6
Environ Monit Assess (2014) 186:6017–6038 6035

References
Acosta, J. A., Cano, A. F., Arocena, J. M., Debela, F., &Martínez-Martínez, S. (2009). Distribution ofmetals in soil particle sizefractions and its implication to risk assessment of play-grounds in Murcia City (Spain). Geoderma, 149(1–2), 101–109. doi:10.1016/j.geoderma.2008.11.034.
Anatolaki, C., & Tsitouridou, R. (2007). Atmospheric depositionof nitrogen, sulfur and chloride in Thessaloniki, Greece.Atmospheric Research, 85(3–4), 413–428. doi:10.1016/j.atmosres.2007.02.010.
Ashbaugh, L. L., Carvacho, O. F., Brown, M. S., Chow, J. C.,Watson, J. G., & Magliano, K. C. (2003). Soil sample col-lection and analysis for the fugitive dust characterizationstudy. Atmospheric Environment, 37(9–10), 1163–1173.doi:10.1016/S1352-2310(02)01022-1.
ATSDR. (2005). Toxicological profile for nickel. Atlanta: Agencyfor Toxic Substances and Disease Registry.
Azimi, S., Rocher, V., Muller, M., Moilleron, R., & Thevenot,D. R. (2005). Sources, distribution and variability ofhydrocarbons and metals in atmospheric deposition inan urban area (Paris, France). Science of the TotalEnvironment, 337(1–3), 223–239. doi:10.1016/j.scitotenv.2004.06.020.
Beuck, H., Quass, U., Klemm, O., & Kuhlbusch, T. A. J. (2011).Assessment of sea salt and mineral dust contributions toPM10 in NW Germany using tracer models and positivematrix factorization. Atmospheric Environment, 45(32),5813–5821. doi:10.1016/j.atmosenv.2011.07.010.
Canbay, M., Aydin, A., & Kurtulus, C. (2010). Magnetic suscep-tibility and heavy-metal contamination in topsoils along theIzmit Gulf coastal area and IZAYTAS (Turkey). Journal ofApplied Geophysics, 70(1), 46–57. doi:10.1016/j.jappgeo.2009.11.002.
CCME. (2007).Canadian soil quality guidelines for the protectionof environmental and human health. Quebec: CanadianCouncil of Ministers of the Environment.
Cetin, B., Yatkin, S., Bayram, A., & Odabasi, M. (2007). Ambientconcentrations and source apportionment of PCBs andtrace elements around an industrial area in Izmir, Turkey.Chemosphere, 69(8), 1267–1277. doi:10.1016/j.chemosphere.2007.05.064.
Chabukdhara, M., & Nema, A. K. (2013). Heavy metals assess-ment in urban soil around industrial clusters in Ghaziabad,India: Probabilistic health risk approach. Ecotoxicology andEnvironmental Safety, 87, 57–64. doi:10.1016/j.ecoenv.2012.08.032.
Chen, T. B., Wong, J. W. C., Zhou, H. Y., & Wong, M. H. (1997).Assessment of trace metal distribution and contamination insurface soils of Hong Kong. Environmental Pollution, 96(1),61–68. doi:10.1016/S0269-7491(97)00003-1.
Chen, T., Liu, X., Zhu, M., Zhao, K., Wu, J., Xu, J., et al. (2008).Identification of trace element sources and associated riskassessment in vegetable soils of the urban–rural transitionalarea of Hangzhou, China. Environmental Pollution, 151(1),67–78. doi:10.1016/j.envpol.2007.03.004.
Cheng, H., Li, M., Zhao, C., Li, K., Peng, M., Qin, A., et al. (2014).Overview of trace metals in the urban soil of 31 metropolisesin China. Journal of Geochemical Exploration, in press (0),doi:10.1016/j.gexplo.2013.08.012.
Davis, H. T., Marjorie Aelion, C., McDermott, S., & Lawson,A. B. (2009). Identifying natural and anthropogenicsources of metals in urban and rural soils using GIS-based data, PCA, and spatial interpolation. EnvironmentalPollution, 157(8–9), 2378–2385. doi:10.1016/j.envpol.2009.03.021.
Díez, M., Simón, M., Martín, F., Dorronsoro, C., García, I., & VanGestel, C. A. M. (2009). Ambient trace element backgroundconcentrations in soils and their use in risk assessment.Science of the Total Environment, 407(16), 4622–4632. doi:10.1016/j.scitotenv.2009.05.012.
Dragovic, S., Mihailovic, N., & Gajić, B. (2008). Heavy metals insoils: distribution, relationship with soil characteristics andradionuclides and multivariate assessment of contaminationsources. Chemosphere, 72(3), 491–495. doi:10.1016/j.chemosphere.2008.02.063.
Eroglu, I., & Bozyigit, R. (2013). The natural and humanitarianfactors affecting the land use in Aliağa. Marmara CografyaDergisi, 27, 353–400 (in Turkish).
Facchinelli, A., Sacchi, E., & Mallen, L. (2001). Multivariatestatistical and GIS-based approach to identify heavy metalsources in soils. Environmental Pollution, 114(3), 313–324.doi:10.1016/S0269-7491(00)00243-8.
Gemici, Ü., Tarcan, G., Melis Somay, A., & Akar, T. (2009).Factors controlling the element distribution in farming soilsand water around the abandoned Halıköy mercury mine(Beydağ, Turkey). Applied Geochemistry, 24(10), 1908–1917. doi:10.1016/j.apgeochem.2009.07.004.
Gerdol, R., Bragazza, L., Marchesini, R., Alber, R., Bonetti, L.,Lorenzoni, G., et al. (2000). Monitoring of heavy metal depo-sition in Northern Italy by moss analysis. EnvironmentalPollution, 108(2), 201–208. doi:10.1016/S0269-7491(99)00189-X.
Guo, G., Wu, F., Xie, F., & Zhang, R. (2012). Spatial distributionand pollution assessment of heavy metals in urban soils fromsouthwest China. Journal of Environmental Sciences, 24(3),410–418. doi:10.1016/S1001-0742(11)60762-6.
Han, B., Bai, Z., Ji, H., Guo, G., Wang, F., Shi, G., et al. (2009).Chemical characterizations of PM10 fraction of paved roaddust in Anshan, China. Transportation Research Part D:Transport and Environment, 14(8), 599–603. doi:10.1016/j.trd.2009.07.010.
Horckmans, L., Swennen, R., Deckers, J., & Maquil, R. (2005).Local background concentrations of trace elements in soils: acase study in the Grand Duchy of Luxembourg. CATENA,59(3), 279–304. doi:10.1016/j.catena.2004.09.004.
Iqbal, J., & Shah, M. H. (2011). Distribution, correlation and riskassessment of selected metals in urban soils from Islamabad,Pakistan. Journal of Hazardous Materials, 192(2), 887–898.doi:10.1016/j.jhazmat.2011.05.105.
Ismail, M. H. S., Zhang, X. T., & Lazim, M. F. M. (2013).Removal of boron and arsenic from petrochemical wastewa-ter by using aquatic booster as adsorbent. Polish Journal ofEnvironmental Studies, 22(2), 403–408.
Karanasiou, A. A., Siskos, P. A., & Eleftheriadis, K. (2009).Assessment of source apportionment by Positive MatrixFactorization analysis on fine and coarse urban aerosol sizefractions. Atmospheric Environment, 43(21), 3385–3395.doi:10.1016/j.atmosenv.2009.03.051.
Kim, E., & Hopke, P. K. (2004). Source apportionment of fineparticles in Washington, DC, utilizing temperature-resolved
6036 Environ Monit Assess (2014) 186:6017–6038

carbon fractions. Journal of the Air & Waste ManagementAssociation, 54(7), 773–785.
Ko, B.-G., Park, S.-J., Jung, G.-B., Kim,M.-K., Kim, G.-Y., Hong,S.-Y., et al. Characteristics of soil heavy metal contents in theagricultural areas near closed mine in Korea. In R. J. Gilkes,Prakongkep, N., editors (Ed.), Symposium 3.5.1 Heavy metalcontaminated soils. 19th World Congress of Soil Science;Soil Solutions for a Changing World, Brisbane, Australia,2010 (pp. 27–30): IUSS.
Kong, S., Ji, Y., Lu, B., Chen, L., Han, B., Li, Z., et al. (2011).Characterization of PM10 source profiles for fugitive dust inFushun-a city famous for coal. Atmospheric Environment,45(30), 5351–5365. doi:10.1016/j.atmosenv.2011.06.050.
Koz, B., Cevik, U., & Akbulut, S. (2012). Heavy metal analysisaround Murgul (Artvin) copper mining area of Turkey usingmoss and soil. Ecological Indicators, 20, 17–23. doi:10.1016/j.ecolind.2012.02.002.
Kumru, M. N., & Bakac, M. (2003). R-mode factor analysisapplied to the distribution of elements in soils from theAydın basin, Turkey. Journal of Geochemical Exploration,77(2–3), 81–91. doi:10.1016/S0375-6742(02)00271-6.
Li, X., & Feng, L. (2012). Multivariate and geostatistical analyzesof metals in urban soil of Weinan industrial areas, Northwestof China. Atmospheric Environment, 47, 58–65. doi:10.1016/j.atmosenv.2011.11.041.
Li, Z., Ma, Z., van der Kuijp, T. J., Yuan, Z., & Huang, L. (2014).A review of soil heavy metal pollution from mines in China:pollution and health risk assessment. Science of the TotalEnvironment, 468–469, 843–853. doi:10.1016/j.scitotenv.2013.08.090.
Lin, H.-Y., Hung, C.-H., Yuan, C.-S., Chen, C.-J., Chen, W.-C.,Chiang, S.-W., et al. (2008). Characteristics and source iden-tification of roadside suspended particles. TransportationResearch Part D: Transport and Environment, 13(8), 531–538. doi:10.1016/j.trd.2008.09.013.
Line, D. E., Wu, J., Arnold, J. A., Jennings, G. D., & Rubin, A. R.(1997). Water quality of first flush runoff from 20 industrialsites. Water Environment Research, 69(3), 305–310. doi:10.2175/106143097x125489.
Loska, K., Wiechuła, D., & Korus, I. (2004). Metal con-tamination of farming soils affected by industry.EnvironmentInternational, 30(2), 159–165. doi:10.1016/S0160-4120(03)00157-0.
Lu, S., Wang, H., & Guo, J. Magnetic response of heavy metalspollution in urban soils: magnetic proxy parameters as anindicator of heavy metals pollution. In R. J. Gilkes,Prakongkep, N. (Eds.), Working Group 3.3 Soils in urbanand industrial areas. 19th World Congress of Soil Science;Soil Solutions for a Changing World, Brisbane, Australia,2010 (pp. 32–35): IUSS.
Luo, X.-S., Yu, S., Zhu, Y.-G., & Li, X.-D. (2012). Trace metalcontamination in urban soils of China. Science of the TotalEnvironment, 421–422(0), 17–30. doi:10.1016/j.scitotenv.2011.04.020.
Maas, S., Scheifler, R., Benslama, M., Crini, N., Lucot, E.,Brahmia, Z., et al. (2010). Spatial distribution of heavy metalconcentrations in urban, suburban and agricultural soils in aMediterranean city of Algeria. Environmental Pollution,158(6), 2294–2301. doi:10.1016/j.envpol.2010.02.001.
Mansha, M., Ghauri, B., Rahman, S., & Amman, A. (2012).Characterization and source apportionment of ambient
air particulate matter (PM2.5) in Karachi. Science of theTotal Environment, 425, 176–183. doi:10.1016/j.scitotenv.2011.10.056.
Muller, G. (1969). Index of geoaccumulation in sediments of theRhine River. GeoJournal, 2, 108–118.
Nemerow, N. L. (1991). Stream, lake, estuary, and ocean pollu-tion: Van Nostrand-Reinhold.
Odabasi, M., Bayram, A., Elbir, T., Seyfioglu, R., Dumanoglu, Y.,& Ornektekin, S. (2010). Investigation of soil concentrationsof persistent organic pollutants, trace rlements, and anionsdue to iron–steel plant emissions in an industrial region inTurkey.Water, Air, & Soil Pollution, 213(1–4), 375–388. doi:10.1007/s11270-010-0392-2.
Ozkan, R., Sener, M., Helvaci, C., & Sener, M. F. (2011).Hydrothermal alterations and relationship with thermal wa-ters at Aliağa (İzmir) geothermal field. Bulletin of the EarthSciences, 32, 1–20.
Patil, R. S., Kumar, R., Menon, R., Shah, M. K., & Sethi, V. (2013).Development of particulate matter speciation profiles for majorsources in six cities in India. Atmospheric Research, 132–133,1–11. doi:10.1016/j.atmosres.2013.04.012.
Rahman, M. M., & Naidu, R. Concentrations of arsenic and othermetals in agricultural soils of Bangladesh. In R. J. Gilkes,Prakongkep, N. (Eds.), Symposium 3.5.1 Heavy metal con-taminated soils. 19th World Congress of Soil Science; SoilSolutions for a Changing World, Brisbane, Australia, 2010(pp. 42–45): IUSS.
Rodríguez-Salazar, M., Morton-Bermea, O., Hernández-Álvarez,E., Lozano, R., & Tapia-Cruz, V. (2011). The study of metalcontamination in urban topsoils of Mexico City using GIS.Environmental Earth Sciences, 62(5), 899–905. doi:10.1007/s12665-010-0584-5.
Salvador, P., Artinano, B., Alonso, D. G., Querol, X., & Alastuey,A. (2004). Identification and characterisation of sources ofPM10 in Madrid (Spain) by statistical methods. AtmosphericEnvironment, 38(3), 435–447. doi:10.1016/j.atmosenv.2003.09.070.
Senguler, I., Sener, M., & Kok, M. V. (2000). PaleotemperatureAnalysis of Aliaga (Izmir, Turkey) Geothermal Field. EnergySources, 22(4), 357–362. doi:10.1080/00908310050013956.
Skrbic, B., & Durisic-Mladenovic, N. (2010). Chemometric interpre-tation of heavymetal patterns in soils worldwide.Chemosphere,80(11), 1360–1369. doi:10.1016/j.chemosphere.2010.06.010.
Sofilić, T., Rastovčan-Mioč, A., Cerjan-Stefanović, Š., Novosel-Radović, V., & Jenko, M. (2004). Characterization of steelmill electric-arc furnace dust. Journal of HazardousMaterials,109(1–3), 59–70. doi:10.1016/j.jhazmat.2004.02.032.
Solgi, E., Esmaili-Sari, A., Riyahi-Bakhtiari, A., & Hadipour, M.(2012). Soil contamination of metals in the three industrialestates, Arak, Iran. Bulletin of Environmental Contaminationand Toxicology, 88(4), 634–638. doi:10.1007/s00128-012-0553-7.
Srimuruganandam, B., & ShivaNagendra, S.M. (2012). Applicationof positive matrix factorization in characterization of PM10 andPM2.5 emission sources at urban roadside. Chemosphere,88(1), 120–130. doi:10.1016/j.chemosphere.2012.02.083.
Srinivasa Gowd, S., Ramakrishna Reddy, M., & Govil, P. K.(2010). Assessment of heavy metal contamination in soilsat Jajmau (Kanpur) and Unnao industrial areas of the GangaPlain, Uttar Pradesh, India. Journal of Hazardous Materials,174(1–3), 113–121. doi:10.1016/j.jhazmat.2009.09.024.
Environ Monit Assess (2014) 186:6017–6038 6037

Stortini, A. M., Freda, A., Cesari, D., Cairns,W. R. L., Contini, D.,Barbante, C., et al. (2009). An evaluation of the PM2.5 traceelemental composition in the Venice Lagoon area and ananalysis of the possible sources. Atmospheric Environment,43(40), 6296–6304. doi:10.1016/j.atmosenv.2009.09.033.
Taylor, S. R., & McLennan, S. M. (1995). The geochemicalevolution of the continental crust. Reviews of Geophysics,33(2), 241–265. doi:10.1029/95RG00262.
Temple, P. J., & Linzon, S. N. (1976). Boron as a phytotoxic airpollutant. Journal of the Air Pollution Control Association,26(5), 498–499. doi:10.1080/00022470.1976.10470278.
TSMS (2013). Turkish State Meteorological Service. http://www.mgm.gov.tr/veridegerlendirme/il-ve-ilceler-istatistik.aspx?m=IZMIR#sfB. Accessed October 2013.
Tume, P., Bech, J., Reverter, F., Bech, J., Longan, L., Tume, L.,et al. (2011). Concentration and distribution of twelve metalsin Central Catalonia surface soils. Journal of GeochemicalExploration, 109(1–3), 92–103. doi:10.1016/j.gexplo.2010.10.013.
U.S. Geological Survey (2013). Mineral commodity summaries2013 (pp. 198). U.S. Geological Survey.
Varrica, D., Aiuppa, A., & Dongarrà, G. (2000). Volcanic andanthropogenic contribution to heavy metal content in lichensfrom Mt. Etna and Vulcano island (Sicily). EnvironmentalPollution, 108(2), 153–162. doi:10.1016/S0269-7491(99)00246-8.
VROM (2000). Circular on target values and intervention valuesfor soil remediation Annex A: target values, soil remediationintervention values and indicative levels for serious contam-ination (pp. Page 8). Dutch Ministry of Housing, SpatialPlanning and Environment.
Wang, X. S. (2013). Magnetic properties and heavy metal pollu-tion of soils in the vicinity of a cement plant, Xuzhou (China).Journal of Applied Geophysics, 98, 73–78. doi:10.1016/j.jappgeo.2013.08.008.
Wei, B., & Yang, L. (2010). A review of heavy metal contamina-tions in urban soils, urban road dusts and agricultural soilsfrom China. Microchemical Journal, 94(2), 99–107. doi:10.1016/j.microc.2009.09.014.
Yatkin, S., & Bayram, A. (2008). Determination of major naturaland anthropogenic source profiles for particulate matter andtrace elements in Izmir, Turkey. Chemosphere, 71(4), 685–696. doi:10.1016/j.chemosphere.2007.10.070.
Yatkin, S., & Bayram, A. (2011). Investigation of chemical com-positions of urban, industrial, agricultural, and rural top-soilsin Izmir, Turkey. CLEAN – Soil, Air, Water, 39(6), 522–529.doi:10.1002/clen.201000117.
Yaylalı-Abanuz, G. (2011). Heavy metal contamination of surfacesoil around Gebze industrial area, Turkey. MicrochemicalJournal, 99(1), 82–92. doi:10.1016/j.microc.2011.04.004.
Yesilonis, I. D., Pouyat, R. V., & Neerchal, N. K. (2008).Spatial distribution of metals in soils in Baltimore,Maryland: role of native parent material, proximity tomajor roads, housing age and screening guidelines.Environmental Pollution, 156(3), 723–731. doi:10.1016/j.envpol.2008.06.010.
Yongming, H., Peixuan, D., Junji, C., & Posmentier, E. S. (2006).Multivariate analysis of heavy metal contamination in urbandusts of Xi’an, Central China. Science of the TotalEnvironment, 355(1–3), 176–186. doi:10.1016/j.scitotenv.2005.02.026.
Yuan, G.-L., Sun, T.-H., Han, P., Li, J., & Lang, X.-X. (2014).Source identification and ecological risk assessment of heavymetals in topsoil using environmental geochemical mapping:typical urban renewal area in Beijing, China. Journal ofGeochemical Exploration, 136, 40–47. doi:10.1016/j.gexplo.2013.10.002.
Zhang, C. (2006). Using multivariate analyses and GIS to identifypollutants and their spatial patterns in urban soils in Galway,Ireland. Environmental Pollution, 142(3), 501–511. doi:10.1016/j.envpol.2005.10.028.
Zhao, Y.-F., Shi, X.-Z., Huang, B., Yu, D.-S., Wang, H.-J., Sun,W.-X., et al. (2007). Spatial distribution of heavy metals inagricultural soils of an industry-based peri-urban area inWuxi, China. Pedosphere, 17(1), 44–51. doi:10.1016/S1002-0160(07)60006-X.
Zhao, Y., Wang, Z., Sun, W., Huang, B., Shi, X., & Ji, J. (2010).Spatial interrelations and multi-scale sources of soil heavymetal variability in a typical urban–rural transition area inYangtze River Delta region of China. Geoderma, 156(3–4),216–227. doi:10.1016/j.geoderma.2010.02.020.
Zhao, L., Xu, Y., Hou, H., Shangguan, Y., & Li, F. (2014). Sourceidentification and health risk assessment of metals in urbansoils around the Tanggu chemical industrial district, Tianjin,China. Science of the Total Environment, 468–469, 654–662.doi:10.1016/j.scitotenv.2013.08.094.
6038 Environ Monit Assess (2014) 186:6017–6038
Copyright © 2022 FDOKUMEN