Will European soil-monitoring networks be able to detect changes in topsoil organic carbon content?
33
Received date: 6/28/2007 Revised date: 1/21/2008 Accept date: 3/19/2008 Will European soil monitoring networks be able to detect changes in topsoil organic carbon content? Nicolas P.A. SABY 1 , Patricia H. BELLAMY 2 , Xavier MORVAN 1 , Dominique ARROUAYS 1 , Robert J.A. JONES 2 , Frank G.A. VERHEIJEN 2 , Mark G. KIBBLEWHITE 2 , Ann VERDOODT 3 , Judit Berényi Üveges 4 , Alexandra Freudenschuß 5 , Catalin SIMOTA 6 1 INRA, US 1106, Unité InfoSol, Centre de recherches d’Orléans, Domaine de Limère, 45166 Olivet Cedex, France 2 National Soil Resources Institute, Building 53, School of Applied Sciences, Cranfield University, Bedfordshire, MK43 0AL, United Kingdom 3 Laboratory of Soil Science, Ghent University, Krijgslaan 281 (S8), 9000 Gent, Belgium 4 Növény-és Talajvédelmi Központi Szolgálat, Talajvédelmi Fejlesztési Osztály, 1118 Budapest, Budaörsi út 141-145 5 Federal Research and Training Centre for Forests, Dept. Forest Ecology and Soil, Unit Site and Vegetation, Seckendorff Gudent Weg 8, 1131 Vienna 6 Research Institute for Soil Science and Agrochemistry (RISSA), 61 Bd.Marasti, 71331 Bucharest, Romania Corresponding author : Nicolas Saby 1
Transcript of Will European soil-monitoring networks be able to detect changes in topsoil organic carbon content?

Received date: 6/28/2007 Revised date: 1/21/2008 Accept date: 3/19/2008
Will European soil monitoring networks be able to detect changes in topsoil
organic carbon content?
Nicolas P.A. SABY1, Patricia H. BELLAMY2, Xavier MORVAN1, Dominique
ARROUAYS1, Robert J.A. JONES2, Frank G.A. VERHEIJEN2, Mark G.
KIBBLEWHITE2, Ann VERDOODT3, Judit Berényi Üveges4, Alexandra
Freudenschuß5, Catalin SIMOTA6
1 INRA, US 1106, Unité InfoSol, Centre de recherches d’Orléans, Domaine de
Limère, 45166 Olivet Cedex, France
2 National Soil Resources Institute, Building 53, School of Applied Sciences,
Cranfield University, Bedfordshire, MK43 0AL, United Kingdom
3 Laboratory of Soil Science, Ghent University, Krijgslaan 281 (S8), 9000 Gent,
Belgium
4 Növény-és Talajvédelmi Központi Szolgálat, Talajvédelmi Fejlesztési Osztály, 1118
Budapest, Budaörsi út 141-145
5 Federal Research and Training Centre for Forests, Dept. Forest Ecology and Soil,
Unit Site and Vegetation, Seckendorff Gudent Weg 8, 1131 Vienna
6 Research Institute for Soil Science and Agrochemistry (RISSA), 61 Bd.Marasti,
71331 Bucharest, Romania
Corresponding author:
Nicolas Saby
1
LI2106
Text Box
Global Change Biology, Volume 14, Issue 10, Date: October 2008, Pages: 2432-2442

INRA, US 1106, Unité InfoSol, Centre de recherches d’Orléans, Domaine de Limère,
45166 Olivet Cedex, France
Phone: +33 2 38 41 48 24
Fax: +33 2 38 41 78 69
Keywords: Soil; organic carbon; monitoring; network; Kyoto protocol; verification;
detection of change; Europe; concentration.
Running title: Detection of changes in soil OC by monitoring
Date of receipt:
2

Abstract 1
2
3
4
5
6
7
8
9
10
11
12
13
14
15
16
17
18
19
20
Within the United Nations Framework Convention on Climate Change articles 3.3
and 3.4 stipulate that some voluntary activities leading to an additional carbon (C)
sequestration in soils could be accounted as C sinks in national greenhouse gas
inventories. These additional C stocks should be verifiable. In this work, we assess
the feasibility of verifying the effects of changes in land use or management practice
on soil organic carbon (SOC), by comparing minimum detectable changes in SOC
concentration for existing European networks suitable for soil monitoring. Among the
tested scenarios the minimum detectable changes differed considerably amongst soil
monitoring networks. Considerable effort would be necessary for some member
states to reach acceptable levels of minimum detectable change for C sequestration
accounting. For SOC, a time interval of about 10 years would enable the detection of
some simulated large changes in most European countries. In almost all cases, the
minimum detectable change in SOC stocks remains greater than annual greenhouse
gases emissions. Therefore, it is unlikely that soil monitoring networks could be used
for annual national C accounting. However, the importance of organic C in soil
functions, and as an indicator of soil condition and trends, underlines the importance
of establishing effective national soil monitoring networks.
3

1 Introduction 20
21
22
23
24
25
26
27
28
29
30
31
32
33
34
35
36
37
38
39
40
Within the United Nations Framework Convention on Climate Change articles 3.3
and 3.4 stipulate that some voluntary activities leading to an additional carbon (C)
sequestration in soils could be accounted as C sinks in national greenhouse gas
inventories. Such additions to accounted C stocks would have to be verifiable: their
accounting is conditional on meeting a requirement to verify the sequestration
claimed. Smith (2004) reviewed possible definitions of the verifiability of C sinks and
sources in soils and, at its most stringent, verification would entail such a large
number of measurements, that the resources needed would be prohibitively
expensive. This is certainly true, if specific regulatory sampling and testing is done.
A recent review of European soil monitoring networks (SMNs) has been carried out
within the ENVASSO project - ENVironmental ASsessment of Soil for mOnitoring -
(Kibblewhite et al. 2005). ENVASSO has been funded under the European Union’s
6th Framework Programme for Research and Technical Development and has shown
that, in most countries in Europe, official systems for comprehensive soil monitoring
exist already, are planned, or are under development. In this context, soil monitoring
is defined as ‘continuous or repeated observation, measurement, and evaluation of
soil and/or related environmental or technical data for defined purposes, according to
prearranged schedules in space and time, using standardized methods for data
collection and analysis’ and a soil monitoring network is defined as ‘A spatial
arrangement of soil monitoring sites, designed to be representative of soil type, land 41
use and climatic zones; the spatial arrangement maybe random or on a regular grid’
(ENVASSO 2007). Most existing national monitoring systems have undertaken a
single sampling only, and thus they remain inventories at present. Most of these
42
43
44
4
45
46
47
48
49
50
51
52
53
54
55
56
57
58
59
60
61
62
63
64
65
66
67
68
69
systems have measured soil organic carbon (SOC) concentrations, in addition to
other soil properties, and are geo-referenced with sufficient precision for repeat
sampling campaigns.
In relation to climate change, or to changes in land use or cultivation practices, SOC
content may increase or decrease and a major issue is to assess whether these
changes are detectable by soil monitoring taking, into account the uncertainties
caused by spatial heterogeneity, sampling methods and analytical errors. Indeed, the
evaluation of the confidence with which changes in SOC content can be detected is
important for the implementation of EC Directives, national treaties, emissions trading
schemes, and a posteriori validation of predicted changes using modelling. The
spatial variability of SOC content strongly influences the ability to detect changes
(Conant& Paustian 2002a, 2002b, Conant et al. 2003). At the field scale, numerous
studies have addressed this issue (see for example, (2002b, Conant et al. 2003,
Conen et al. 2003, Garten & Wullscheleger 1999, Saby & Arrouays 2004, Smith
2004). At a regional or national scale, it is necessary to assess the effect of the
number of sites and of inherent soil spatial variability on the detection of a change in
SOC (see for example Saby & Arrouays 2004 and Bellamy et al. 2005). To our
knowledge, such an assessment has never been performed at a continental scale.
The relatively dense (5 km x 5 km) soil monitoring network of England and Wales,
the National Soil Inventory (NSI) described by McGrath and Loveland (1992), has
recently been shown to be effective for recording aggregate SOC losses from these
countries between 1978 and 2003 (Bellamy et al. 2005). However, the density of soil
monitoring sites varies considerably between European countries. In this paper, we
5

assess the feasibility of verifying the effects of changes in land use or soil
management practice on SOC content, by comparing minimum detectable levels of
change in SOC concentrations for existing European networks suitable for soil
monitoring, based on the information collected during the ENVASSO project. It is
believed that ENVASSO has identified most soil monitoring networks in Europe but
some are known to have been excluded because of data confidentiality and problems
of national coordination (Morvan et al. 2008).
70
71
72
73
74
75
76
77
2.1 78
79
80
81
82
83
2 Materials and methods
Theory
We assume that the soil monitoring sites identified within each country will be
revisited on a second and subsequent occasions as this is the most efficient way of
monitoring change (Lark et al. 2006). This means for a monitoring network in which
each site is visited at least twice there is a paired sample situation and the change at
each site can be calculated. For any particular monitoring network of a variable x, n
sites are sampled at time t0 and again at time t1. An estimate of the mean change ( d )
in x is
84
85
nxxd ti
n
iti /)(
10 ,1
,∑=
−= (1) 86
87 where xi,t is the measurement at site i at time t and n is the number of sites in the
monitoring network. An estimate of the standard error of d is nsd
2
where sd2 is an
estimate of the variance of the differences (de Gruijter et al. 2006) . However, it is not
possible to estimate this variance directly as we know very little about the variation of
change in SOC concentrations at European scale, as currently most soil monitoring
networks within Europe are inventories. An alternative estimate of the standard error
88
89
90
91
92
6

of d is ns 22
, where s2 is an estimate of the variance of x on the first occasion. This
alternative estimate requires us to assume that this variance does not change over
time and that the correlation between the two sampling times is small. In this paper
the latter assumption is investigated for SOC concentration using data from the NSI
of England and Wales. However, this estimate of the standard error of the mean
change is conservative and has been calculated in the same way for all countries to
compare their monitoring networks.
93
94
95
96
97
98
99
100
101
102
103
Assuming a normal distribution for the mean change in SOC concentration (invoking
the Central Limit Theorem), estimates of a 100(1-α)% confidence interval for this
mean change can be written (Barnett 2002):
nszdDnszd /2/2 αα +<<− (2) 104
105
106
where zα is the value of the standardized normal distribution at probability α.
The condition for detection of a mean change y is that
0/2 >− nszy α that is nszy /2α> 107
108 and hence the minimum detectable change (MDC) is
nszy /2α= (3) 109
110
111
With the assumption that the SOC concentration is changing at an estimated rate of
change k and that this is constant over the whole time interval t, then
nkszt 2α> 112
113 and the minimum time to detect a given rate of change k is
nkszt 2α= (4) 114
7

115
116
Equation 3 can also be used to estimate the number of sites required to detect a
certain level of change y i.e.
2
222y
szn α> (5) 117
118
119
120
121
122
123
124
125
126
127
128
129
130
2.2 Data 131
132
133
2.2.1 134
135
136
137
138
If the assumption made above is valid, (i.e. that the correlation between repeated
samplings is small), the variance s2 described above is the natural heterogeneity of
SOC concentration across the landscape, as well as the variation due to the
measurement of SOC concentration. It has been found that the best estimate of s2 is
a combination of the estimate of the landscape variation from previous studies
s2landscape and the expected measurement errors (see Ramsey 1998). All these
sources of error can be assumed to be independent so that
2222landscapesa ssss ++= (6)
where s2a is the analytical variance and s2
s is the sampling variance from the
sampling of the soil in the field. s2a + s2
s can be assumed to be the within-site
variability. The within-site variability needs to be quantified as it can make a
significant contribution to the overall variation.
The following sources of data were used to estimate the minimum detectable
changes in SOC concentration across Europe:
Soil monitoring networks in Europe
A metadata collection was conducted by means of a questionnaire completed by
ENVASSO partners from 25 European countries, providing information on national
soil monitoring networks (SMNs), their site sampling designs, the geo-reference of
the monitoring sites, the parameters measured at each site and the number of
8

sampling campaigns (Morvan et al. 2007). Where possible, descriptive statistics
(mean, median, standard deviation) were also collected for each parameter within
each country, categorised by three land use classes (arable, forest, pasture) and
peat soils.
139
140
141
142
143
2.2.2 144
145
146
147
148
149
150
Metadata of within-site variation
To obtain estimates of the sampling variance (s2s) and the analytical variance (s2
a),
we conducted a meta-analysis of published and some unpublished data. The
following relevant factors were included in the compilation: area of the site (ranging
from 1 m2 to 20 ha), number of samples, mean values of soil parameters, indication
of within-site variability (i.e. variance, or standard deviation, or coefficient of
variation). We also extracted data on analytical variability when available. Literature
searches were performed using the electronic database “Web of Science”. Some
unpublished data were also supplied by ENVASSO partners (mainly from France and
Slovakia) and we excluded references to tropical soils. One hundred and twenty sites
were retained. The data were used to derive quantitative estimates of the mean
values, variances, standard deviations and coefficients of variation for all available
parameters. We examined the possible relationships between within-site variability
and site area and/or mean values. From these relationships we derived estimates of
the coefficient of variations for all the sites for which the area was known.
151
152
153
154
155
156
157
158
159
2.2.3 160
161
162
163
Digital map of organic carbon in top soils across Europe
Jones et al. (2005) developed a methodology for estimating organic carbon
concentrations (%) in topsoils (OCTOP) across Europe. The information presented in
map form (Jones et al. 2004) is also available as a database which can be
9
downloaded from the EU-soils web site (http://eusoils.jrc.it) hosted by the Joint
Research Centre, Ispra (I). The OCTOP map and database provide policy-makers
with estimates of current topsoil OC concentrations when developing strategies for
soil protection at regional level. Although the methodology used to compile OCTOP is
based on pedotransfer functions, the results have been validated using SOC
concentrations from more than 12,000 sites in England and Wales (from the NSI),
and Italy. Statistical analysis showed that 95% of the variation in the estimated SOC
concentrations, aggregated on the basis of European soil map units (SMU), was
accounted for by the measured SOC concentration from the detailed inventories
conducted in these countries (Jones et al. 2005). Therefore, these baseline data
were used to estimate national distributions of soil organic carbon (SOC). Processing
of data was performed on harmonized spatial data layers in raster format with a
1 km × 1 km grid spacing. Using SOC concentration values on this 1km grid, the
variances were calculated for each country. We set the initial SOC concentration
value for each monitoring site identified in the ENVASSO project, to the topsoil OC
(OCTOP) predicted by Jones et al. (2005) because the data from the individual sites
were not available for reasons of confidentiality.
164
165
166
167
168
169
170
171
172
173
174
175
176
177
178
179
180
181
182
183
3.1 184
185
186
187
188
3 Results
Investigation into assumptions made in the methodology
One of the main findings of the ENVASSO survey of SMN’s across Europe was that
very few had actually been resampled (Morvan et al. 2007, Morvan et al.). This
meant that it was impossible to estimate sd2 (the standard error of mean change)
directly. Only the NSI for England and Wales, has been resampled for SOC
10

189
190
191
192
193
194
195
196
197
198
199
200
201
202
203
204
205
206
207
208
209
210
211
212
213
concentration and, thus the assumption that the correlation of SOC concentrations
between sampling times is small, could be examined. Table 1 shows the standard
deviations of the original NSI sample of SOC concentrations; the resampled SOC
concentrations, standardised to cover the same interval at all sites; and the
difference at each site. It can be seen that under arable agriculture the assumption is
reasonable (an over-estimation of 15%), but the standard deviation is over-estimated
by 30% for grassland and by more than 100% under forest. Since these are all over-
estimations, the estimate of minimum detectable change will also be an over-
estimate and, as long as the same methodology is applied across Europe, the results
will be comparable.
The data collected from the ENVASSO survey was comprehensive regarding the
number and geographical location of monitoring sites, but few countries supplied
summary statistics of their data. Therefore, the variation of SOC concentrations at
the landscape scale had to be estimated from the digital map of topsoil OC across
Europe. To examine the effect of using this methodology on the results, the data from
the few countries supplying summary statistics were used to estimate the minimum
detectable change (MDC) within land use classes and this was compared with the
MDC calculated using the SOC map. Figure 1 shows the results for England & Wales
(treated as one country), Hungary, Romania, France, Belgium, and Austria. The
MDC is not well estimated for soils under forest in those countries with large areas of
forest, however, the estimate using the European OCTOP map falls between those
for arable and grassland for all countries, except Belgium where it is slightly smaller.
The original assumption that there is a weak correlation between sample values led
to estimates derived using the summary statistics for each country being over
11
estimates, particularly for forest soils. The estimation of variation from OCTOP is not
affected by extreme values because it is derived from a combination of soil, climate
and land use data on a 1 km x 1 km grid rather than from point samples (monitoring
sites) and as such is a more robust estimator. The MDC for the only country for
which information on the variation of change was available, England & Wales, is also
shown in Figure 1 (as E & W_res), where the MDC is estimated using the directly
estimated variance of differences at individual sites. It is impossible to draw
conclusions from one dataset but this result does indicate that the estimate of MDC,
using the estimate of variance from OCTOP, gives a reasonable estimate of MDC for
OC concentration of soil under grassland and arable land use.
214
215
216
217
218
219
220
221
222
223
224
3.2 225
226
227
228
229
230
3.3 231
232
233
234
235
236
Within-site variability
We found a strong relationship between the within-site variability of SOC
concentration and the site area. Figure 2 shows the relationship between the
coefficients of variation of SOC concentration and the area of sites, grouped into area
classes. The analytical value (1) corresponds to the coefficient of variation obtained
by re-analysing the same sample several times.
National variances
National variances of values of topsoil SOC concentration predicted across Europe
using OCTOP show a marked effect of latitude (Figure 3). The northern countries
have very high standard deviations, which can be related to the existence of soils
with very high SOC concentration (peat soils) and very low SOC concentrations in
some intensively cropped areas. By contrast, soils in Mediterranean countries are
12

generally characterised by lower and more uniform SOC concentrations with smaller
standard deviations.
237
238
3.4 239
240
241
242
243
244
245
246
247
248
249
250
251
252
253
254
255
256
3.5 257
258
259
260
Number of monitoring sites
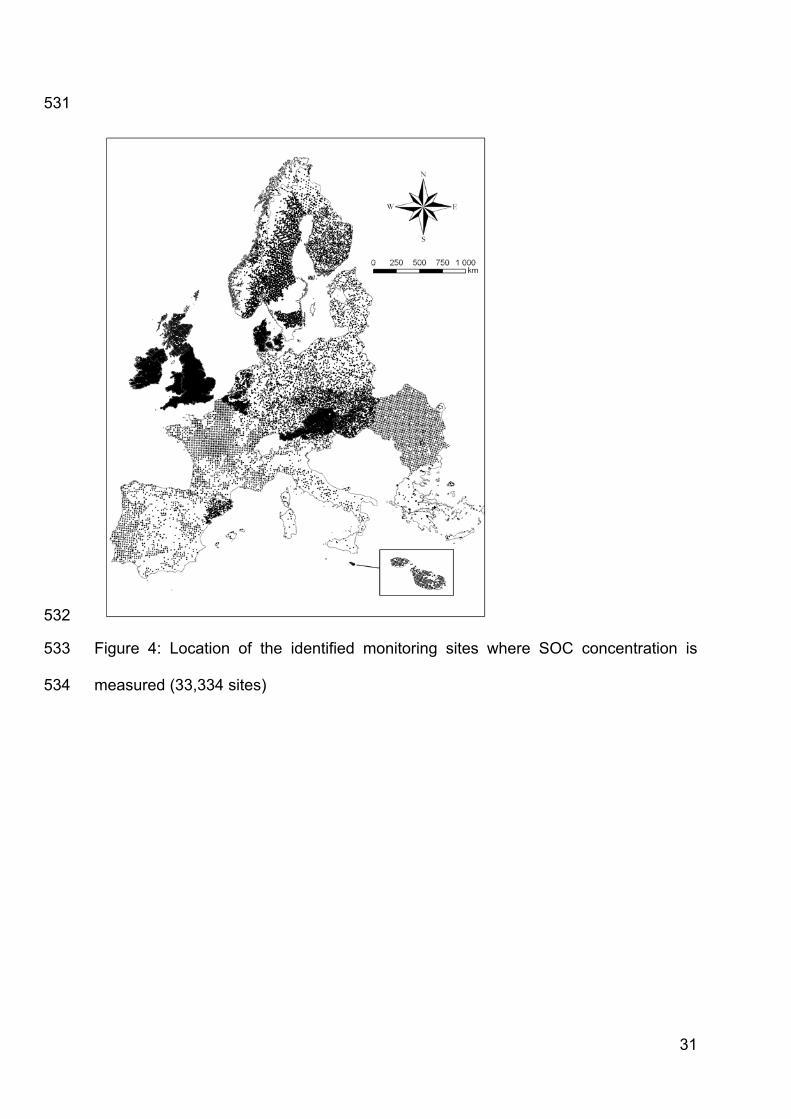
Figure 4 and Table 1 show the heterogeneous distribution of the monitoring sites for
SOC concentration for each country reported by an ENVASSO partner. Some
countries have relatively dense networks (e.g. England and Wales, Northern Ireland,
Austria, Denmark, Malta), whereas in other countries soil monitoring sites are
relatively scarce (Spain, Italy, Greece). Some ENVASSO partners reported forest
sites only, generally belonging to the International Co-operative Programme (ICP) on
Forest Soil Condition Survey in Europe (Vanmechelen et al. 1997), although the
countries represented are known to have implemented SMNs more widely than just
on forest land. For example, detailed information was not obtainable for some SMNs
such as those described by Ibáñez et al (2005) for Spain, and by Filippi (2005) for
Italy, whereas information on site coordinates is also lacking for agricultural areas in
Sweden or Belgium (Van Orshoven et al. 1993). Topsoil OC concentration was
measured at 33,334 monitoring sites, representing 92 % of the monitoring sites
identified by ENVASSO, making the topsoil OC indicator one of the most widely
available indicators of soil status in Europe. Only SMNs in Austria, Estonia, Finland,
Germany and Slovenia reported that topsoil OC was not measured at all monitoring
sites.
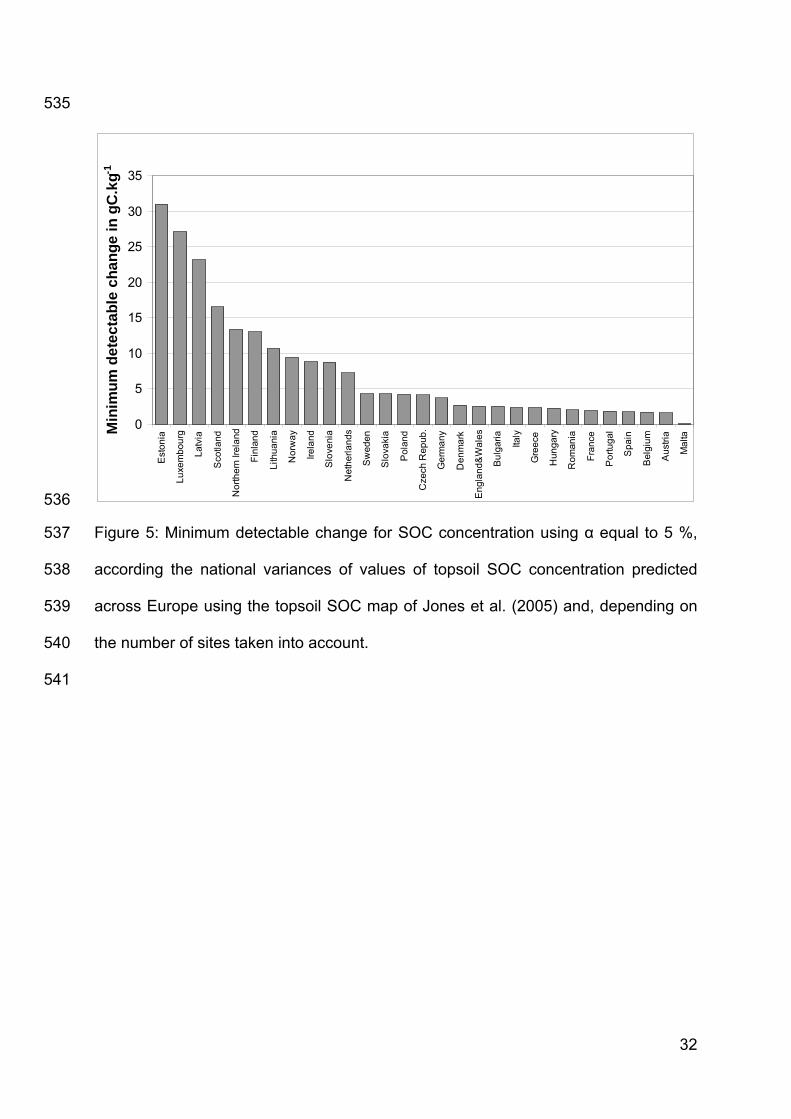
Minimum detectable change
The minimum detectable change (MDC) using α equal to 0.05 was highly variable
amongst SMNs (see Figure 5). As expected, the highest values of MDC for SOC
concentration were observed in countries having very organic soils and/or having
13

very few sites measuring this indicator. Six countries show a MDC larger than 10
gC.kg
261
262
263
3.6 264
265
266
267
268
269
270
271
272
273
274
275
276
277
278
279
280
281
282
283
284
-1. The large MDC observed for both Estonia and Slovenia would be reduced if
SOC concentrations were measured at all the existing monitoring sites.
Number of sites required
The policy process requires the number of sites, by country necessary to achieve a
given MDC. We estimated the number of sites (n1) required to detect a relative
change of 5 % in the national mean of topsoil OC concentration, which was chosen
because it is the requirement for monitoring soil in the UK (Environment Agency
2007). Table 2 shows that n1 mainly depends on country area and on the variability of
SOC concentrations within the country, such that a total of 57,628 sites would be
required for the EU-27 countries. If we compare this estimate to the actual number of
sites, n, where measurements of SOC concentration are undertaken currently, we
can deduce an estimate of the additional number of sites, n2 that would be needed in
each country to achieve this level of detectable of change. Except for some countries
where relatively dense SMNs exist already, most of the countries would have to
make considerable efforts to be in a position to detect a 5 % relative change in SOC
concentration.
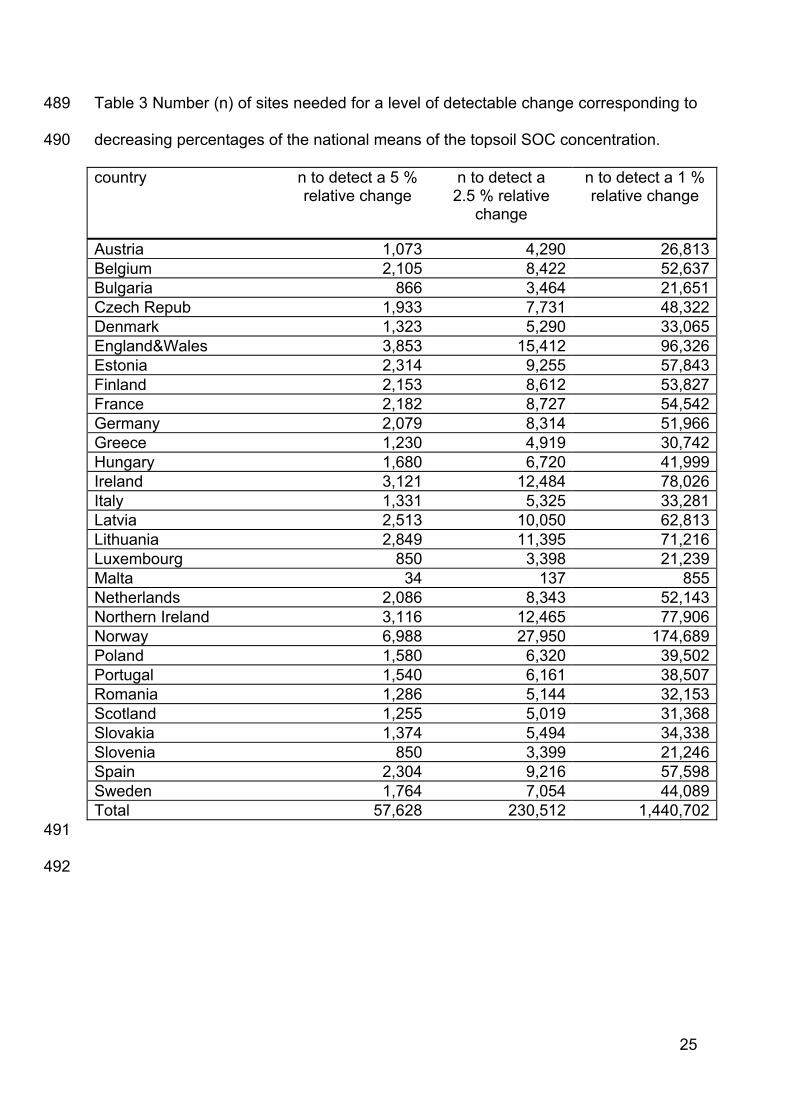
Using the data available, it is possible to do the same calculation for any desired
relative change we might wish to detect. Table 3 shows that except for Malta, the
number of sites needed to detect a 1 % relative change would exceed 20,000 in all
national cases, and more than 170,000 in Norway, which would be prohibitive under
current circumstances. At the European scale, the number of sites needed would be
close to 1,000,000.
14

3.7 285
286
287
288
289
290
291
292
293
294
295
296
297
298
299
300
301
302
303
304
305
306
307
308
Time required to detect a given change
With the following assumptions: (i) that a variable is changing at an estimated rate of
change k; (ii) that this is constant over the whole time interval between samplings
and over the whole of Europe; and (iii) if we assume a given number of sites and α
equal to 0.05, it is possible to calculate the time necessary to detect a given change.
Equation 4 was used to develop an example based on a study from Bellamy et al
(2005). This showed very large changes in SOC concentrations across England and
Wales, from 1978 to 2003. They used data from the National Soil Inventory of
England and Wales obtained during two sampling campaigns, the first during the
period 1978-83 (McGrath et al. 1992) and the second 1995-2003. Bellamy et al
(2005) demonstrated that OC has been lost from soils across England and Wales at
a mean rate of 0.6% yr-1 (relative to the existing SOC concentration), over the period
1979-2003. They also found that the relationship between rate of C loss and initial
OC concentration was independent of land use, suggesting a link to environmental
change. By supposing that such a change is occurring throughout Europe, it is
possible to calculate the time interval needed to allow detection of this change, either
by using existing SMNs, or as described previously by simulating the existence of
additional sites.
For most countries with relatively dense SMNs, the time necessary to detect such a
change is below or close to 10 yr (Figure 6). This result supports the idea that, at
least for these more dense SMNs, and assuming a relatively large change in this
parameter, a time interval of 10 yr would be efficient. The cases of Estonia and
Slovenia give a good example of the importance of archiving samples. Analysing
15
309
310
311
312
313
314
315
316
317
318
319
320
321
322
323
324
325
326
327
328
329
330
331
332
333
organic C on archived samples for all sites would reduce the number of years
needed from about 30 years to about 10 years.
4 Discussion All the calculations described rely on several assumptions regarding the variation of
SOC concentration and its change: (1) a normal distribution of the mean change in
SOC concentration, (2) repeated sampling is carried out by the same method, (3)
that the variance of SOC concentration remains the same on successive sampling
occasions, (4) the correlation between the repeat and original samples is small so
that the variation in SOC at a single sample can be used to estimate the variance of
change and (5) the variation of OC within a country can estimated using the
European map of topsoil organic carbon (OCTOP). These assumptions have been
investigated as far as possible using the available data and it has been shown that a
reasonable estimate of the MDC for soils under arable and grassland, in each
country, can be made. They are also essential to enable estimates to be made from
the available data that are comparable across Europe.
It was also assumed that within-site variability is only dependant on site area and the
mean value of SOC concentration, and that these relationships hold throughout
Europe. This is likely to be false, as it is well known that numerous other factors may
control OC variability at site level (e.g. climate effects on soil drainage status, land-
use, soil type, management practices, etc.). However, using literature values for
estimating a within-site variance should not greatly affect the results obtained, as the
measured within-site variation is much smaller than the between-site national
variation.
16
Although Bellamy et al. (2005) explored how their results for England and Wales,
showing a relatively rapid rate of change in SOC concentration, might be
extrapolated to similar soils and climates, there is no quantitative evidence that such
changes are widespread across the soils of Europe. Our study shows the magnitude
of change in SOC concentration that might be detectable at continental and regional
scales. Policy makers might be interested in knowing the changes in OC stocks and
associated fluxes represented by this change, for example in the context of a Soil
Framework Directive (COM 2006). An estimate of topsoil OC stocks across Europe
can be obtained from the database of Jones et al. (2005) and application of
pedotransfer functions of the type proposed by Adams (1973) and pedotransfer rules
of the type defined by Van Ranst et al. (1995) to estimate bulk densities. If the
calculated MDC by country is added to the estimate of topsoil OC concentration and
the estimation of soil bulk density is repeated, the difference between these
estimated stocks represents the magnitude of change that is detectable in the
European stocks of topsoil OC. Table 3 shows that for most of the countries,
detectable changes range from 1 to 10% in the base estimate of stock. These
changes are very similar to the projected changes (about 6%) simulated by Smith et
al. (2007) in mineral soil C of European Russia and Ukraine’s croplands and
grasslands over the last ten years of their simulation (2060-2069), under the
business as usual scenario. This suggests that over about 10 years most of the
existing SMNs could be used to verify such changes. However, it would be important
to measure bulk density wherever possible during monitoring to allow better
estimates of carbon stock to be made. It was found in the ENVASSO survey that bulk
density was measured at less than 10% of the monitoring sites so future soil
monitoring programmes need to address this. Over shorter timescales, most of these
334
335
336
337
338
339
340
341
342
343
344
345
346
347
348
349
350
351
352
353
354
355
356
357
358
17

networks could only detect changes of more than the total national annual
greenhouse gas emissions. For example, Arrouays et al. (2002) estimated that the
potential of additional C storage in soil in France is about 5 Tg yr
359
360
361
362
363
364
365
366
367
368
369
370
371
372
373
374
375
376
377
378
379
380
381
382
383
-1. Assuming this
rate of change, its statistical assessment using the present French SMN would take
about 45 years.
Conclusion
The important role of carbon in soil functions and as an indicator of soil condition and
trends underlines the importance of effective national soil monitoring networks that
could contribute to developing an overall European picture of long term trends in soil
organic carbon. Our results suggest that the minimum detectable changes in SOC
concentration differ considerably amongst soil monitoring networks in Europe.
Considerable effort would be necessary for some countries to reach acceptable
levels of minimum detectable changes in C concentration. A time interval of about
10 years would enable the detection, in most European countries, of some large
simulated changes in topsoil OC concentration. National soil monitoring networks are
not suitable to detect annual changes in soil carbon stocks but would allow longer
term assessments.
Acknowledgements
This work has been conducted under the European 6th Framework Programme of
Research ENVASSO Project Contract no 022713. The financial support of the
European Commission is gratefully acknowledged. The following participants in the
ENVASSO Project provided the data and information on existing soil monitoring
networks without which it would not have been possible to prepare this publication:,
P. Strauss, H. Spiegel, E. Goidts, G. Colinet, S. Sleutel, T. Sishkov, N. Kolev, V.
18
384
385
386
387
388
389
390
391
392
393
394
395
396
397
398
399
400
401
402
403
Penizek, J. Kozak, T. Ballström, P. Penu, T. Köster, H. Lilja, C. Jolivet, R. Baritz, C.
Kosmas, G. Becher, J.P. Renaud, A.H. Arnoldussen, P. Pavlenda, P. Neville, P.
Michopoulos, E. Herzberger, P. Simoncic, D. Fay, V.V. Buivydaite, A. Karklins, S.
Camilleri, S. Sammut, A. Higgins, J. Crawford, M. Rutgers, J. Niedzwiecki, T.
Stuczynski, M. Da Conceição Goncalves, R. Dias Mano, A. Lilly, G. Hudson, M.
Zupan, J. Kobza, I. Simo Josa, M. Olsson
References
Adams WA (1973) The effect of organic matter and true densities of some
uncultivated podzolic soils. Journal of Soil Science, 24.
Arrouays D, Balesdent J, Germon J, Jayet P, Soussana J, Stengel P (2002)
Mitigation of. the greenhouse effect. Increasing carbon stocks in French
agricultural soils? In Synthesis of an assessment report by the French
Instritute for Agricultural Research (INRA) on request of the French Ministry for
Ecology and sustainable development, pp. 33. INRA.
Barnett V (2002) Sample survey: Principles and Methods. Arnold, London.
Bellamy PH, Loveland PJ, Bradley RI, Lark RM, Kirk GJD (2005) Carbon losses from
all soils across England and Wales 1978-2003. Nature, 437, 245-248.
COM (2006) 232. Proposal for a DIRECTIVE OF THE EUROPEAN PARLIAMENT
AND OF THE COUNCIL establishing a framework for the protection of soil and
amending Directive 2004/35/EC. http:// ec.europa.eu/environment/soil/ last
accessed 23/03/2007
404
405
406
407
408
Conant RT, Paustian K (2002a) Potential soil carbon sequestration in overgrazed
grassland ecosystems - art. no. 1143. Global Biogeochemical Cycles, 16,
1143-1143.
19

409
410
411
412
413
414
415
416
417
418
419
420
Conant RT, Paustian K (2002b) Spatial variability of soil organic carbon in
grasslands: implications for detecting change at different scales.
Environmental Pollution, 116, 127-135.
Conant RT, Smith G, Paustian K (2003) Spatial variability of soil carbon in forested
and cultivated sites: implications for change detection. Journal of
Environmental Quality, 32, 278-286.
Conen F, Yakutin M, Sambuu A (2003) Potential for detecting changes in soil organic
carbon concentrations resulting from climate change. Global Change Biology,
9, 1515-1520.
de Gruijter J, Brus DJ, Bierkens MFP, Knotters M (2006) Sampling for Natural
Resource Monitoring. Springer-Verlag, 332 pp.
ENVASSO (2007) Glossary of key Terms for European Soil Monitoring System.
http://www.envasso.com/content/downloads.html421
422
423
424
425
426
427
428
429
430
431
432
433
Filippi N (2005) Soil Mapping and Soil Monitoring: State of Progress and Use in Italy.
In Soil Resources of Europe Vol. Research Report No 9 (eds Jones RJA,
Houšková B, Bullock P, Montanarella L), pp. 193-200. Office for Official
Publications for the European Communities, Luxembourg.
Garten C, Wullscheleger S (1999) Soil carbon inventories under a bioenergy crop
(Switchgrass): measurement limitations. Journal of Environmental Quality, 28,
1359-1365.
Ibáñez JJ, Sánchez Díaz J, de Alba S, López Árias M, Boixadera J (2005) Collection
of Soil Information in Spain: a review in 2003. In Soil Resources of Europe
Vol. Research Report No 9 (eds Jones RJA, Houšková B, Bullock P,
Montanarella L), pp. 345-356. Office for Official Publications for the European
Communities, Luxembourg.
20
434
435
436
437
438
439
440
441
442
443
444
445
446
447
448
449
450
451
452
453
454
455
456
457
458
Jones RJA, Hiederer R, Rusco E, Loveland PJ, Montanarella L (2004) The map of
organic carbon in topsoils in Europe,Version 1.2. In Explanation of Special
Publication Ispra 2004 No.72 (S.P.I.04.72), pp. 26 and 01 map in ISO B01
format. Office for Official Publications of the European Communities,
Luxembourg.
Jones RJA, Hiederer R, Rusco E, Loveland PJ, Montanarella L (2005) Estimating
organic carbon in the soils of Europe for policy support. European Journal of
Soil Science, 56, 655-671.
Kibblewhite M, Jones RJA, Baritz R, Huber S, Arrouays D, Micheli E, Dufour MJD
(2005) ENVASSO. Environmental Assessment of Soil for Monitoring. In EC
desertification meeting. Brussels.
Lark RM, Bellamy PH, Rawlins BG (2006) Spatio-temporal variability of some metal
concentrations in the soil of eastern England, and implications for soil
monitoring. Geoderma, 133, 363-379.
McGrath SP, Loveland PJ (1992) The Soil Geochemical Atlas of England and Wales.
Blackie Academic & Professional, London.
Morvan X, Richer de Forges A, Arrouays D, et al. (2007) Une analyse des stratégies
d’échantillonnage des réseaux de surveillance de la qualité des sols en
Europe. Etude et Gestion des Sols, 14, 302-310.
Morvan X, Saby NPA, Arrouays D, et al. (2008) Soil monitoring in Europe: A review
of existing systems and requirements for harmonisation. Science of the Total
Environment, 391, 1-12.
Ramsey MH (1998) Sampling as a source of measurement uncertainty: techniques
for quantification and comparison with analytical sources. Journal of Analytical
Atomic Spectrometry, 13, 97-104.
21
459
460
461
462
463
464
465
466
467
468
469
470
471
472
473
474
475
476
477
478
479
480
481
Saby N, Arrouays D (2004) Simulation of the Use of a Soil-Monitoring Network to
Verify Carbon Sequestration in Soils: Will Changes in Organic Carbon Stocks
be Detectable? Soil Science and Plant Analysis, 35, 2379-2396.
Smith J, Smith P, Wattenbach M, et al. (2007) Projected changes in the organic
carbon stocks of cropland mineral soils of European Russia and the Ukraine,
1990-2070. Global Change Biology, 13, 342-356.
Smith P (2004) How long before a change in soil organic carbon can be detected?
Global Change Biology, 10, 1878-1883.
Van Orshoven J, Deckers JA, Vandenbroucke D, Feyen J (1993) The completed
database of Belgian soil profile data and its applicability in planning and
management of rural land. Bulletin des Recherches Agronomiques de
Gembloux, 28, 511-521.
Van Ranst E, Thomasson AJ, Daroussin J, Hollis JM, Jones RJA, Jamagne M (1995)
Elaboration of an extended knowledge database to interpret the 1:1,000,000
EU Soil Map for environmental purposes. In European Land Information
Systems for Agro-Environmental Monitoring (eds King D, Jones RJA,
Thomasson AJ), pp. 71-84. Office for Official Publications of the European
Communities, Luxembourg.
Vanmechelen L, Groenemans R, Van Ranst E (1997) Forest Soil Condition in
Europe: Results of a large-scale soil survey. pp. 261. EC- UN/ECE in co-
operarion with the Ministry of the Fleminsh Community, Brussels, Geneva.
22

481
482
Table 1 Estimates of standard deviations of SOC concentrations using data from the
National Soil Inventory of England and Wales.
Landuse Arable (n=658) Grassland
(n=996)
Forest (n=210)
Mean initial SOC(g/kg)
29.49 46.66 81.89
Standard deviation of
original sampling of SOC(g/kg)
28.23 36.28 91.43
Standard deviation of resampled SOC(g/kg)
19.40 21.02 66.39
Estimated s.d. of difference under assumption of no covariance
34.25 41.93 113.0
Directly estimated s.d. of difference (g/kg)
29.81 32.65 54.5
483
484
23

Table 2: Number (n) of sites where SOC concentration is measured; theoretical
number (n
484
485
486
487
1) of sites needed to detect a relative change of 5 % from the national
mean of topsoil SOC concentrations according to national statistics on variances;
number (n2) of additional sites needed in comparison with n,
Country n n1 n2
Austria 3,313 1,073 0 Belgium 2,546 2,105 0 Bulgaria 432 866 434 Czech Repubic 738 1,933 1,195 Denmark 848 1,323 475 England&Wales 6,018 3,853 0 Estonia 128 2,314 2,186 Finland 1,446 2,153 707 France 1,532 2,182 650 Germany 1,254 2,079 825 Greece 146 1,230 1,084 Hungary 1,328 1,680 352 Ireland 1,317 3,121 1,804 Italy 341 1,331 990 Latvia 127 2,513 2,386 Lithuania 146 2,849 2,703 Luxembourg 6 850 844 Malta 271 34 0 Netherlands 531 2,086 1,555 Northern Ireland 582 3,116 2,534 Norway 1,057 6,988 5,931 Poland 894 1,580 686 Portugal 290 1,540 1,250 Romania 948 1,286 338 Scotland 721 1,255 534 Slovakia 424 1,374 950 Slovenia 56 850 794 Spain 1,009 2,304 1,295 Sweden 4,885 1,764 0 Total 33,334 57,628 32,498 488
489
24
489
490
Table 3 Number (n) of sites needed for a level of detectable change corresponding to
decreasing percentages of the national means of the topsoil SOC concentration.
country n to detect a 5 % relative change
n to detect a 2.5 % relative
change
n to detect a 1 % relative change
Austria 1,073 4,290 26,813Belgium 2,105 8,422 52,637Bulgaria 866 3,464 21,651Czech Repub 1,933 7,731 48,322Denmark 1,323 5,290 33,065England&Wales 3,853 15,412 96,326Estonia 2,314 9,255 57,843Finland 2,153 8,612 53,827France 2,182 8,727 54,542Germany 2,079 8,314 51,966Greece 1,230 4,919 30,742Hungary 1,680 6,720 41,999Ireland 3,121 12,484 78,026Italy 1,331 5,325 33,281Latvia 2,513 10,050 62,813Lithuania 2,849 11,395 71,216Luxembourg 850 3,398 21,239Malta 34 137 855Netherlands 2,086 8,343 52,143Northern Ireland 3,116 12,465 77,906Norway 6,988 27,950 174,689Poland 1,580 6,320 39,502Portugal 1,540 6,161 38,507Romania 1,286 5,144 32,153Scotland 1,255 5,019 31,368Slovakia 1,374 5,494 34,338Slovenia 850 3,399 21,246Spain 2,304 9,216 57,598Sweden 1,764 7,054 44,089Total 57,628 230,512 1,440,702 491
492
25
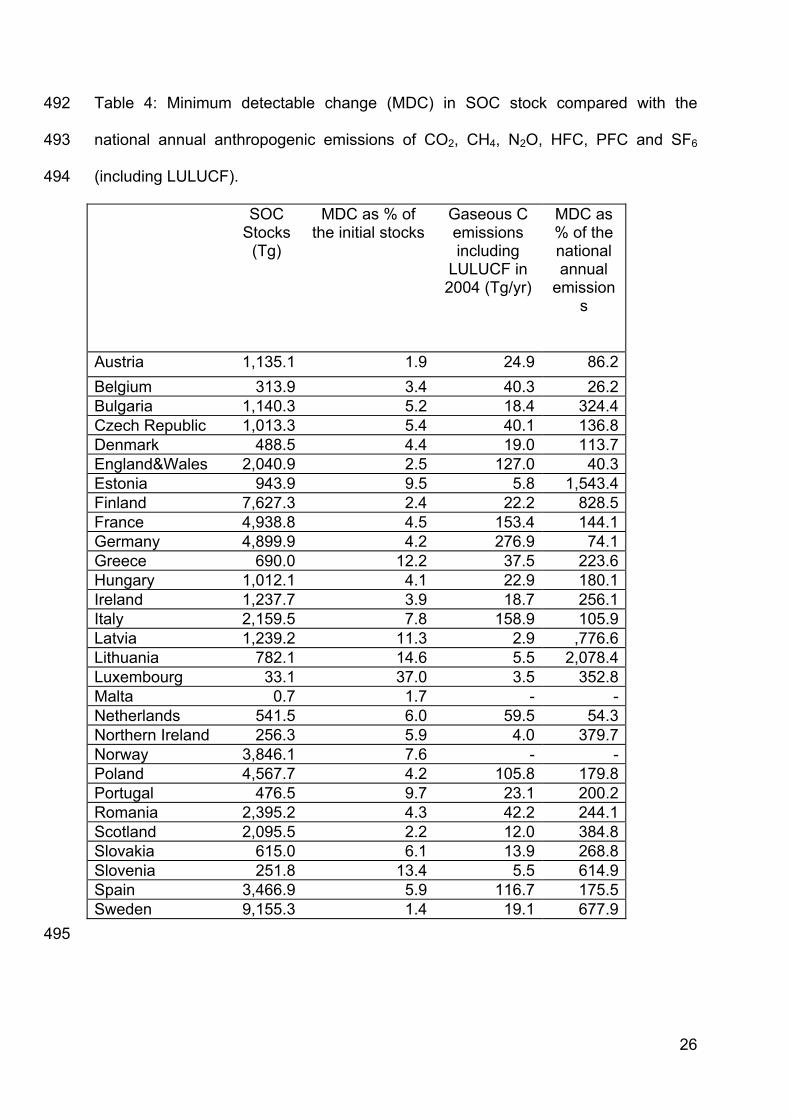
Table 4: Minimum detectable change (MDC) in SOC stock compared with the
national annual anthropogenic emissions of CO
492
493
494
2, CH4, N2O, HFC, PFC and SF6
(including LULUCF).
SOC Stocks
(Tg)
MDC as % of the initial stocks
Gaseous C emissions including
LULUCF in 2004 (Tg/yr)
MDC as % of the national annual
emissions
Austria 1,135.1 1.9 24.9 86.2 Belgium 313.9 3.4 40.3 26.2 Bulgaria 1,140.3 5.2 18.4 324.4 Czech Republic 1,013.3 5.4 40.1 136.8 Denmark 488.5 4.4 19.0 113.7 England&Wales 2,040.9 2.5 127.0 40.3 Estonia 943.9 9.5 5.8 1,543.4 Finland 7,627.3 2.4 22.2 828.5 France 4,938.8 4.5 153.4 144.1 Germany 4,899.9 4.2 276.9 74.1 Greece 690.0 12.2 37.5 223.6 Hungary 1,012.1 4.1 22.9 180.1 Ireland 1,237.7 3.9 18.7 256.1 Italy 2,159.5 7.8 158.9 105.9 Latvia 1,239.2 11.3 2.9 ,776.6 Lithuania 782.1 14.6 5.5 2,078.4 Luxembourg 33.1 37.0 3.5 352.8 Malta 0.7 1.7 - - Netherlands 541.5 6.0 59.5 54.3 Northern Ireland 256.3 5.9 4.0 379.7 Norway 3,846.1 7.6 - - Poland 4,567.7 4.2 105.8 179.8 Portugal 476.5 9.7 23.1 200.2 Romania 2,395.2 4.3 42.2 244.1 Scotland 2,095.5 2.2 12.0 384.8 Slovakia 615.0 6.1 13.9 268.8 Slovenia 251.8 13.4 5.5 614.9 Spain 3,466.9 5.9 116.7 175.5 Sweden 9,155.3 1.4 19.1 677.9
495
26

Figure Legends 495
496
497
Figure 1: Minimum detectable changes in SOC concentrations estimated using
summary statistics from National monitoring networks (solid symbols), and European
top soil SOC map (Jones et al 2005) (stars) for six European countries and also 498
using actual resampled data for England and Wales (E&W_res)499
500
501
502
503
504
505
506
507
508
509
510
511
512
513
514
515
516
Figure 2: Median coefficients of variation in SOC concentration according to site
area; The analytical value corresponds to the coefficient of variation obtained by
multiple analyses of the same sample.
Figure 3: Calculated standard deviation of SOC concentration, using the topsoil SOC
map of Jones et al. {, 2005 #117} for the countries represented in the ENVASSO
project.
Figure 4: Location of the identified monitoring sites where SOC concentration is
measured (33,334 sites)
Figure 5: Minimum detectable change for SOC concentration using α equal to 5 %,
according the national variances of values of topsoil SOC concentration predicted
across Europe using the topsoil SOC map of Jones et al. {, 2005 #117} and,
depending on the number of sites taken into account.
Figure 6: Number of years needed to detect a change in SOC concentration at a
mean rate of 0.6% yr-1 (relative to the existing SOC concentration). Grey: all
monitoring sites; black: sites where SOC concentration has been measured to date.
27

0
2
4
6
8
10
12
14
16
18
E &W_res
England& Wales
Hungary Romania France Belgium Austria
Min
imum
det
ecta
ble
chan
ge (g
/kg)
ForestArablePastureJones et al. (2005)
516
Figure 1: Figure 1: Minimum detectable changes in SOC concentrations estimated 517
using summary statistics from National monitoring networks (solid symbols), and 518
European top soil SOC map (Jones et al 2005) (stars) for six European countries and 519
also using actual resampled data for England and Wales (E&W_res)520
521
28

0
1
2
3
4
5
6
7
8
9
Analytical 1 to 400 m² 400 m² to 1 ha 1 ha to 20 ha
Sampling site area
Coe
ffici
ent o
f var
iatio
n %
522
523
524
525
526
Figure 2: Median coefficients of variation in SOC concentration according to site
area; The analytical value corresponds to the coefficient of variation obtained by
multiple analyses of the same sample.
29

0 5 10 15 20 25
Finland
Scotland
EstoniaNorthern Ireland
Ireland
Norway
SwedenLatvia
England&Wales
Netherlands
GermanyLithuania
Poland
Czech Repub
AustriaSlovakia
Belgium
Hungary
DenmarkFrance
Luxembourg
Slovenia
RomaniaSpain
Bulgaria
Italy
PortugalGreece
Malta
Soil organic C content in g kg-1
527 528
529
530
531
Figure 3: Calculated standard deviation of SOC concentration, using the topsoil SOC
map of Jones et al. (2005) for the countries represented in the ENVASSO project.
30
531
532
533
534
Figure 4: Location of the identified monitoring sites where SOC concentration is
measured (33,334 sites)
31
535
0
5
10
15
20
25
30
35E
ston
ia
Luxe
mbo
urg
Latv
ia
Sco
tland
Nor
ther
n Ire
land
Finl
and
Lith
uani
a
Nor
way
Irela
nd
Slo
veni
a
Net
herla
nds
Sw
eden
Slo
vaki
a
Pol
and
Cze
ch R
epub
.
Ger
man
y
Den
mar
k
Eng
land
&W
ales
Bul
garia Italy
Gre
ece
Hun
gary
Rom
ania
Fran
ce
Por
tuga
l
Spa
in
Bel
gium
Aus
tria
Mal
taMin
imum
det
ecta
ble
chan
ge in
gC
.kg-1
536
537
538
539
540
541
Figure 5: Minimum detectable change for SOC concentration using α equal to 5 %,
according the national variances of values of topsoil SOC concentration predicted
across Europe using the topsoil SOC map of Jones et al. (2005) and, depending on
the number of sites taken into account.
32
542
0
10
20
30
40
50
60
70
80
90Lu
xem
bour
g
Latv
ia
Lith
uani
a
Est
onia
Slo
veni
a
Gre
ece
Nor
way
Nor
ther
n Ire
land
Por
tuga
l
Net
herla
nds
Italy
Slo
vaki
a
Cze
ch R
epub
.
Irela
nd
Spa
in
Bul
garia
Pol
and
Sco
tland
Ger
man
y
Den
mar
k
Finl
and
Fran
ce
Rom
ania
Hun
gary
Bel
gium
Eng
land
&W
ales
Sw
eden
Aus
tria
Mal
ta
Num
ber o
f yea
rs n
eede
d
543
544
545
546
547 548
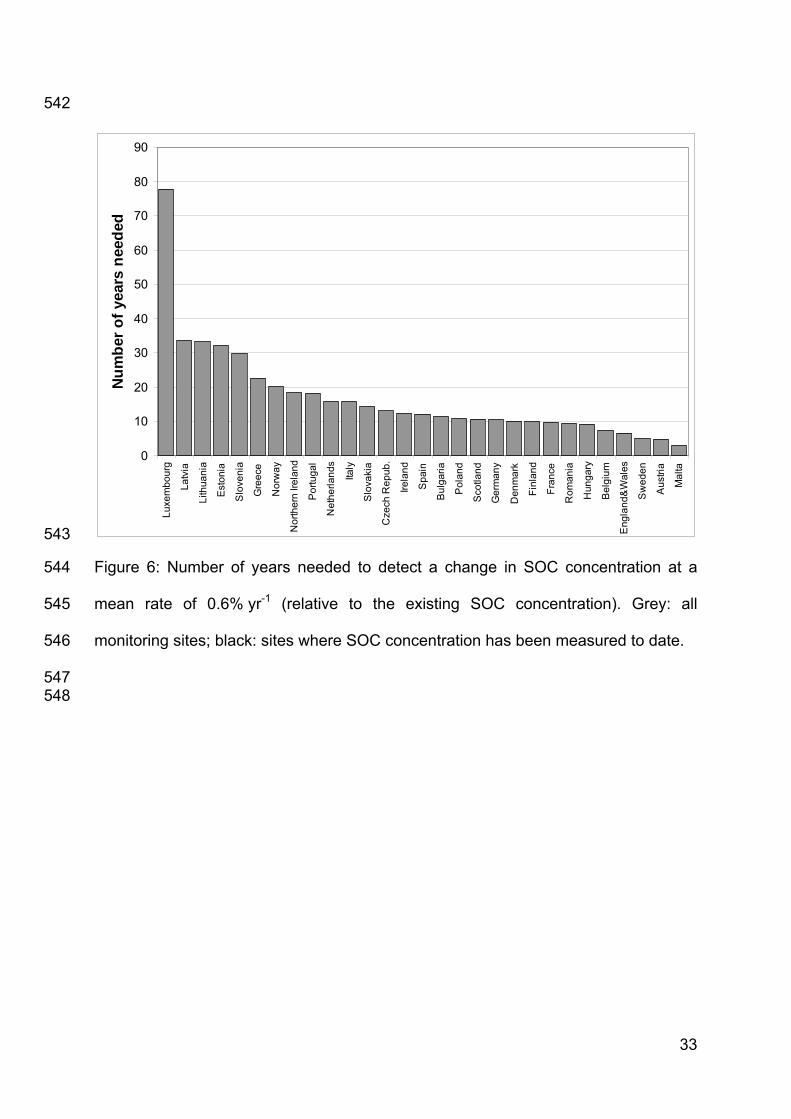
Figure 6: Number of years needed to detect a change in SOC concentration at a
mean rate of 0.6% yr-1 (relative to the existing SOC concentration). Grey: all
monitoring sites; black: sites where SOC concentration has been measured to date.
33