Novel Diagnostic Tools to Detect and Monitor Persistent ...
149
TECHNISCHE UNIVERSITÄT MÜNCHEN Lehrstuhl für Ökologische Chemie und Umweltanalytik Novel Diagnostic Tools to Detect and Monitor Persistent Organic Pollutants in Remote Mountainous Areas Walkiria Levy López Vollständiger Abdruck der von der Fakultät Wissenschaftszentrum Weihenstephan für Ernährung, Landnutzung und Umwelt der Technischen Universität München zur Erlangung des akademischen Grades eines Doktors der Naturwissenschaften genehmigten Dissertation. Vorsitzender: Univ.-Prof. Dr. W. Huber Prüfer der Dissertation: 1. apl. Prof. Dr. Dr. K.-W. Schramm 2. Univ.-Prof. Dr. Dr. J. C. Munch 3. Univ.-Prof. Dr. Dr. Dr. hc. (Zonguldak Univ./Türkei) H. Parlar Die Dissertation wurde am 14.02.2008 bei der Technischen Universität München eingereicht und durch die Fakultät Wissenschaftszentrum Weihenstephan für Ernährung, Landnutzung und Umwelt am 21.05.2008 angenommen.
-
Upload
khangminh22 -
Category
Documents
-
view
1 -
download
0
Transcript of Novel Diagnostic Tools to Detect and Monitor Persistent ...

TECHNISCHE UNIVERSITÄT MÜNCHEN
Lehrstuhl für Ökologische Chemie und Umweltanalytik
Novel Diagnostic Tools to Detect and Monitor
Persistent Organic Pollutants in Remote Mountainous Areas
Walkiria Levy López
Vollständiger Abdruck der von der Fakultät Wissenschaftszentrum Weihenstephan für Ernährung, Landnutzung und Umwelt der Technischen Universität München zur Erlangung des akademischen Grades eines
Doktors der Naturwissenschaften
genehmigten Dissertation. Vorsitzender: Univ.-Prof. Dr. W. Huber Prüfer der Dissertation: 1. apl. Prof. Dr. Dr. K.-W. Schramm 2. Univ.-Prof. Dr. Dr. J. C. Munch 3. Univ.-Prof. Dr. Dr. Dr. hc. (Zonguldak Univ./Türkei) H. Parlar Die Dissertation wurde am 14.02.2008 bei der Technischen Universität München eingereicht und durch die Fakultät Wissenschaftszentrum Weihenstephan für Ernährung, Landnutzung und Umwelt am 21.05.2008 angenommen.


A mis padres Manón y Rolando


Acknowledgements
Acknowledgements The current work was carried out from November 2004 to November 2007 at the Institute of Ecological Chemistry in the German Research Center for Environmental Health. I would like to acknowledge warmly the people who have helped me to accomplish this thesis: Prof. Dr. K.-W. Schramm for giving me the opportunity to work in his group, for his patience, support and understanding during my PhD, his direct way, the excellent comments and critical remarks Prof. Dr. J. C. Munch for his gentle manner and for accepting to be reviewer of this work Prof. Dr. H. Parlar for the kind and prompt acceptance to be reviewer of this work B. Henkelmann for the thousand analytical measurements, his efficiency and the endless questions he had to survive, even without losing his mood S. Bernhöft for the practical and numerous help given at the laboratory performing either analytical or bio-analytical procedures with excellent competence C. Corsten and N. Radoslava for the laboratory help regarding EROD bioassays and the good working atmosphere B. Danzer for her continuous support and assistance during my PhD work J. Kotalik for her friendly welcome to the group and for her laboratory assistance G. Pfister for all the SPMD work and his kind and positive mood T. Bovee, for giving me the opportunity of staying at the Institute of Food Safety (RIKILT, Wageningen University and Research Center, The Netherlands) and being trained in the use of yeast-based bioassays, as well as for the gift of the modified yeast strain used in the current work. My thanks go also to his working group W. Beisker for his excellent disposition and for performing the flow cytometry measurements at the Institute of Toxicology (German Research Center for Environmental Health) A. Zsolnay and F. Buegger for the elementary analysis measurements carried out at the Institute of Soil Ecology (German Research Center for Environmental Health) R. Hünert for kindly performing and providing the scanning electron microscopies of SPMD W. Behr for his constructive comments about the English grammar and style of this work My colleagues M. Pandelova, S. Fiedler, A. Ud-Daula and A. Stocker for the excellent working atmosphere during my PhD N. Fischer, A. Niklaus, M. Kirchner, G. Jakobi, G. Kocsis, I. Offenthaler, M. Uhl, W. Moche, C. Bellis, P. Wess and all the MONARPOP team for miscellaneous assistance My husband Frank for his understanding and support during all these years together


Table of Contents
i
Table of Contents
Table of Contents-------------------------------------------------------------------------------------- i
List of Figures ---------------------------------------------------------------------------------------- iii
List of Tables------------------------------------------------------------------------------------------- v
Abstract------------------------------------------------------------------------------------------------- vi
List of Publications --------------------------------------------------------------------------------viii
Abbreviations and Acronyms ------------------------------------------------------------------- ix
1. INTRODUCTION --------------------------------------------------------------------------------- 1
1.1 Research Objectives--------------------------------------------------------------------------------------------------5
2. BACKGROUND AND METHODS ----------------------------------------------------------- 6
2.1 Family of compounds studied --------------------------------------------------------------------------------------6 2.1.1 Polychlorinated Dibenzo-p-dioxins, Dibenzofurans and Polychlorinated Biphenyls --------------------6 2.1.2 Organochlorine Pesticides-----------------------------------------------------------------------------------------8 2.1.3 Polynuclear Aromatic Hydrocarbons----------------------------------------------------------------------------9 2.1.4 Physicochemical properties ------------------------------------------------------------------------------------- 10
2.2 Sampling Methods-------------------------------------------------------------------------------------------------- 17 2.2.1 Active air sampling----------------------------------------------------------------------------------------------- 17 2.2.2 Passive air sampling---------------------------------------------------------------------------------------------- 18
2.2.2.1 Needles as a natural passive sampler ------------------------------------------------------------------------ 18 2.2.2.2 SPMD as passive air sampler --------------------------------------------------------------------------------- 19 2.2.2.3 Coated stir bar as passive air sampler------------------------------------------------------------------------ 28
2.2.3 Soil as a POP accumulation matrix ---------------------------------------------------------------------------- 30
2.3 Sampling Sites ------------------------------------------------------------------------------------------------------- 31 2.3.1 Bavarian and Bohemian forest sites --------------------------------------------------------------------------- 31 2.3.2 Alpine region sites------------------------------------------------------------------------------------------------ 33
2.4 Laboratory Procedures-------------------------------------------------------------------------------------------- 35 2.4.1 Analytical determinations --------------------------------------------------------------------------------------- 35
2.4.1.1 Clean-up procedure--------------------------------------------------------------------------------------------- 35 2.4.1.2 Detection and quantification of POP------------------------------------------------------------------------- 37
2.4.2 Bioassay determinations----------------------------------------------------------------------------------------- 38 2.4.2.1 EROD micro assay --------------------------------------------------------------------------------------------- 38 2.4.2.2 Extraction of bio-accumulative compounds ---------------------------------------------------------------- 40 2.4.2.3 Clean-up to select persistent compounds-------------------------------------------------------------------- 40 2.4.2.4 EROD micro bioassay procedure----------------------------------------------------------------------------- 40 2.4.2.5 Yeast based estrogenic assay---------------------------------------------------------------------------------- 41 2.4.2.6 Estrogenic bioassay--------------------------------------------------------------------------------------------- 43
2.5 Statistical analysis -------------------------------------------------------------------------------------------------- 45
3. RESULTS AND DISCUSSION --------------------------------------------------------------46

Table of Contents
ii
3.1 OCP in the Bavarian and Bohemian forests ------------------------------------------------------------------ 46 3.1.1 Air concentrations ------------------------------------------------------------------------------------------------ 46 3.1.2 SPMD -------------------------------------------------------------------------------------------------------------- 47 3.1.3 Needles------------------------------------------------------------------------------------------------------------- 51 3.1.4 Soil------------------------------------------------------------------------------------------------------------------ 53 3.1.5 OCP distribution in the investigated matrices---------------------------------------------------------------- 56
3.2 PAH in the Bavarian and Bohemian forests ------------------------------------------------------------------ 61 3.2.1 PAH distribution in the investigated matrices---------------------------------------------------------------- 61 3.2.2 Comparison of PAH concentrations in SPMD, active sampler, and spruce needles-------------------- 65
3.3 PCDD/F in the Bavarian and Bohemian forests ------------------------------------------------------------- 70 3.3.1 PCDD/F: Needles and Active sampler ------------------------------------------------------------------------ 70 3.3.2 PCDD/F: SPMD and Needles as abiotic and biotic passive samplers ------------------------------------ 74
3.4 SPMD and CSB as passive samplers for air monitoring of POP ----------------------------------------- 75 3.4.1 OCP----------------------------------------------------------------------------------------------------------------- 75 3.4.2 PAH ---------------------------------------------------------------------------------------------------------------- 76 3.4.3 PCB----------------------------------------------------------------------------------------------------------------- 78
3.5 Results in the Alpine Region ------------------------------------------------------------------------------------- 83 3.5.1 Monitoring of PAH by SPMD in the alpine region: altitude profiles------------------------------------- 83 3.5.2 SPMD: Data interpretation regarding exposure time for OCP--------------------------------------------- 86 3.5.3 Accumulation of OCP in the matrices soil, needles and SPMD in the altitude profiles --------------- 95
3.6 Brief approach to the passive sampling performance ------------------------------------------------------ 98 3.6.1 Use of performance reference compounds in SPMD-------------------------------------------------------- 98 3.6.2 Calculation of sampling rates ----------------------------------------------------------------------------------100 3.6.3 Calculation of fugacities----------------------------------------------------------------------------------------103
3.7 Bioassay Determinations -----------------------------------------------------------------------------------------104 3.7.1 Dioxin-like compounds in soils: Comparison of analytical measurements and bioassay determinations --------------------------------------------------------------------------------------------------------------104 3.7.2 Inter-comparison of estrogenicity in water by means of yeast-based assays ---------------------------110 3.7.3 Determination of the capability of response of the genetically modified yeast in presence of estrogenic substances ------------------------------------------------------------------------------------------------------112 3.7.4 AhR inducers and endocrine disrupters in forested mountain areas -------------------------------------115
4. CONCLUSIONS-------------------------------------------------------------------------------117
4.1 Sampling techniques to detect and monitor POP-----------------------------------------------------------117
4.2 Bioassays-------------------------------------------------------------------------------------------------------------120
5. FUTURE RESEARCH OPTIONS ---------------------------------------------------------121
6. BIBLIOGRAPHY ------------------------------------------------------------------------------122
APPENDIX I ------------------------------------------------------------------------------------------130
APPENDIX II -----------------------------------------------------------------------------------------133

List of Figures
iii
List of Figures Figure 2-1: Schematic diagram of the general molecular structures of PCDD/F where 1 ≤ x + y ≤ 8 and PCB where 1 ≤ x + y ≤ 10. The ortho, meta and para positions are indicated in the PCB structure.------------------------7 Figure 2-2: Low volume active sampler and schematic representation of a cartridge design. ---------------------- 17 Figure 2-3: Schematic representation and SPMD preparation at the laboratory. ------------------------------------- 20 Figure 2-4: Uptake stages in SPMD as a function of the time. ---------------------------------------------------------- 21 Figure 2-5: Schematic representation of one compartment model for SPMD. Cair: compound concentration in air, ku: uptake rate constant, Cs: compound concentration within the SPMD, ke: elimination rate constant.----------- 22 Figure 2-6: Schematic overview of the concentration distribution air-SPMD. Cair: compound concentration in air, Cae: compound concentration at the membrane outside boundary layer, Cme: compound concentration at the membrane inside boundary layer, Cmi: compound concentration at the membrane internal side, Cs: compound concentration in SPMD, δ: effective thickness of each region and their associated subscripts. --------------------- 23 Figure 2-7: Coated stir bar scheme and PDMS polymeric structure. --------------------------------------------------- 28 Figure 2-8: Scheme of the mass transfer in passive samplers (modified from Gorecki and Namienski, 2002). - 29 Figure 2-9: Sampling sites at the Bavarian and Bohemian forests. H: Haidel, B: Boubin, R: Ruckowitzschachten and M: Mitterfels. --------------------------------------------------------------------------------------------------------------- 31 Figure 2-10: Deployment structure for coated stir bars and SPMD.---------------------------------------------------- 32 Figure 2-11: Sampling chart at the Bavarian and Bohemian forests. --------------------------------------------------- 33 Figure 2-12: Sampling sites in the Alpine mountain region: MONARPOP project. --------------------------------- 34 Figure 2-13: Sampling preparation scheme for PCDD/F and PCB. ASE: Accelerated Solvent Extraction.------ 36 Figure 2-14: Sampling preparation scheme for PAH and OCP. --------------------------------------------------------- 37 Figure 2-15: Schematic representation of Chytochrome P4501A1 induction (modified from Whitlock et al., 1996. ------------------------------------------------------------------------------------------------------------------------------ 39 Figure 2-16: 7-ethoxyresorufin-O-deethylation reaction. ---------------------------------------------------------------- 39 Figure 2-17: Molecular structures of 17 ß-Estradiol, Diethylstilbestrol and 17α-Ethynylestradiol. --------------- 44 Figure 3-1: PCA case scores (37) of OCP (11) for the active sampling campaigns A, B, C, E, F, I, K and L. Axis 1 accounts for 63.6 % and axis 2 for 13.7 % of the variability (77.3 % of the total). --------------------------------- 47 Figure 3-2: Concentrations in SPMD after ½ year at 4 sites (n=2) and 1 ½ years (n=2) exposure at 3 sites. a) HCH isomers, OCA, PCAS, PeCB and HCB b) Chlorinated pesticides c) DDT family. H: Haidel, B: Boubin, R: Ruckowitzschachten and M: Mitterfels. ½ : ½ year deployment 1 ½: 1 ½ year deployment ------------------------ 49 Figure 3-3: Correlations of SPMD ½ year exposure (n=2) and 3 months active sampling at Haidel. a) DDT family b) CHC isomers, OCS, PCAS, PeCB and HCB. Sampling October 2003. ------------------------------------ 50 Figure 3-4: Correlations of SPMD ½ year exposure and 3 months active sampling at Haidel. a) Year 2005 b) Year 2006.------------------------------------------------------------------------------------------------------------------------ 51 Figure 3-5: HCH isomer concentrations (pg g-1 dry weight needles) in a) needles ½ year b) needles 1 ½ years and c) 2 ½ years of age at 4 sampling sites in 2003. H: Haidel, B: Boubin, R: Ruckowitzschachten, M: Mitterfels, 0.5: ½ year old needles, 1.5: 1 ½ years old needles and 2.5: 2 ½ years old needles. -------------------- 52 Figure 3-6: HCB, PCAS, p,p´-DDT and γ-HCH concentrations (pg g-1 dry needles) in needles ½ year of age at 4 sampling sites. H: Haidel, B: Boubin, R: Ruckowitzschachten, M: Mitterfels.---------------------------------------- 53 Figure 3-7: Concentration of PAH in humus soil at four spatially closely related sites. Analysis carried out at the GSF and LfU. H: Haidel, B: Boubin, R: Ruckowitzschachten, M: Mitterfels. ---------------------------------------- 62 Figure 3-8: Selected PAHs quantified in 1 year old needles at R5 and ½ and 1 ½ years old needles at Haidel. Needles collected in 2005. ----------------------------------------------------------------------------------------------------- 64 Figure 3-9: Percentage distribution of selected PAH in needles collected at different ages at the Bavarian Forest. UBA 1 year old: needles of 1 year of age at R5. GSF: ½ and 1 ½ years old needles at Haidel.-------------------- 64 Figure 3-10: PCA case scores (33) of PAH (16) for the active sampling campaigns A, B, C, E, F, K and L. PC 1 accounts for 80.4 % and PC 2 for 8.4 % of the variability (88.8 % of the total). -------------------------------------- 65 Figure 3-11: PAH distribution (%) in needles ½, 1 ½ and 2 ½ years old and active sampler at Haidel. Sampling October 2003. Classification according to the number of benzene rings (BbFA, BkFA included in 5-6 rings). - 66 Figure 3-12: PCA case scores (24) of PAH (18) for needles. 2.5: 2 ½ years old, 1.5: 1 ½ years old and 0.5: ½ year old. 3: year 2003 and 4: year 2004. PC 1 accounts for 59.3 % and PC 2 for 13.8 % of the variability (73.1 % of the total). ---------------------------------------------------------------------------------------------------------------------- 67 Figure 3-13: PAH distribution (%) in SPMD for ½ year and 1 ½ years exposure at 4 sampling sites and active sampler at Haidel. Site codes: H: Haidel, B: Boubin, R: Ruckowitzschachten and M: Mitterfels. ----------------- 68 Figure 3-14: PAH concentrations in SPMD ½ year exposure (n=2) and active sampler 3 month exposure at Haidel. a) Low molecular weight PAH b) High molecular weight PAH.----------------------------------------------- 69 Figure 3-15: PCDD/F homologues distribution (%) in ½ year old spruce needles and SPMD exposed for ½ year at H: Haidel, R: Ruckowitzschachten, M: Mitterfels and B: Boubin and in active sampling, campaign A at Haidel. Sampling October 2003.---------------------------------------------------------------------------------------------- 70

List of Figures
iv
Figure 3-16: PCDD/F homologues distribution (%) in ½, 1 ½ and 2 ½ years old spruce needles and active sampling, campaign A at Haidel. Sampling October 2003.--------------------------------------------------------------- 71 Figure 3-17: a) PCDD and b) PCDF homologue concentrations of spruce needles and active sampler (campaign A, 3 months exposure) at Haidel. Diamonds, squares and circles represent ½, 1 ½ and 2 ½ needle ages, respectively. Sampling in October 2003. Correlation coefficient between active sampling and ½ year old needles.------------------------------------------------------------------------------------------------------------------------------------- 72 Figure 3-18: a) PCDD congener concentrations in spruce needles and active sampler. HxDD 1: 1,2,3,6,7,8-HxCDD, HxDD 2: 1,2,3,7,8,9-HxCDD, HxDD 3: 1,2,3,4,7,8-HxCDD. b) PCDF congener concentrations in spruce needles and active sampler. PeCDF 1: 1,2,3,7,8/1,2,3,4,8-PeCDF, PeCDF 2: 2,3,4,7,8-PeCDF, HxCDF1: 1,2,3,4,7,8/1,2,3,4,7,9-HxCDF, HxCDF 2: 2,3,4,6,7,8-HxCDF, HxCDF 3: 1,2,3,6,7,8-HxCDF. Sampling October 2003. Correlation coefficient between active sampling (Campaign A, 3 month exposure) and ½ year old needles. Diamonds, squares and circles represent ½, 1 ½ and 2 ½ needle ages, respectively. ---------------------- 73 Figure 3-19: PCDD/F homologue concentrations in SPMD ½ year and 1 ½ years exposure at 3 sites. Samplings in October 2003 and 2004.----------------------------------------------------------------------------------------------------- 75 Figure 3-20: Fluorene and Phenanthrene concentrations (pg CSB-1) in coated bars (n=2) after ½ and 1 ½ year exposure at four sampling sites and air concentrations (pg m-3 air) at Haidel. 0.5: ½ year exposure, 1.5: 1 ½ years exposure. H: Haidel, B: Boubin, R: Ruckowitzschachten and M: Mitterfels. A and E: Campaigns A and E, respectively.---------------------------------------------------------------------------------------------------------------------- 77 Figure 3-21: PCB concentrations in SPMD (pg SPMD-1) (n=2) and CSB (pg CSB-1) (n=2) after ½ year exposure at a) Haidel and b) Boubin. No SPMD repetition available at Haidel. -------------------------------------------------- 79 Figure 3-22: PCB concentrations in active sampler and coated stir bars (n=2) after a) ½ year and b) 1 ½ year deployment at Haidel. Note that PCB 28 and 52 were excluded for the 1 ½ exposure correlation. ---------------- 80 Figure 3-23: Concentration of Phenanthrene (ng PHE kg-1 triolein) at 5 sampling sites (4 altitude profiles). --- 84 Figure 3-24: Concentration of Fluoranthrene (ng FL kg-1 triolein) at 5 sampling sites (4 altitude profiles). ----- 85 Figure 3-25: Concentration of Pyrene (ng FL kg-1 triolein) at 5 sampling sites (4 altitude profiles).-------------- 85 Figure 3-26: PCA case scores (58) of OCP (23). Axis 1 accounts for 43.8 % and Axis 2 for 21.0 % of the variability (64.8 % of the total). SM1: SPMD deployed ½ year, SM2: SPMD deployed 1 year. ------------------- 87 Figure 3-27: a) p,p´-DDT and b) dieldrin concentrations at the altitude profiles for the periods 1, 2 and 3. The sum of periods 1 and 2 is also depicted. ------------------------------------------------------------------------------------- 89 Figure 3-28: p,p´-DDE concentrations at the altitude profiles for the periods 1, 2 and 3. The sum of periods 1 and 2 is also depicted. ---------------------------------------------------------------------------------------------------------- 90 Figure 3-29: HCB concentrations at the altitude profiles for the periods 1, 2 and 3. The sum of periods 1 and 2 is also depicted.------------------------------------------------------------------------------------------------------------------ 90 Figure 3-30: α-HCH concentrations at the altitude profiles for the periods 1, 2 and 3. ------------------------------ 92 Figure 3-31: PCA case scores (31) of OCP (18). PC 1 accounts for 65.5 % and PC 2 for 9.2 % of the variability (74.7 % of the total). Higher subplots numbers indicate higher sites at the altitude profile.------------------------- 95 Figure 3-32: Cluster analysis of OCP in humus soil samples (UPGMA). Altitude profiles, sampling 2004. ---- 96 Figure 3-33: Altitude profiles at a) Sl-34 and b) DE-21 sites. Humus sampling 2004. ------------------------------ 97 Figure 3-34: Cluster analysis of OCP in needle samples at altitude profiles (UPGMA). Sampling 2004.-------- 97 Figure 3-35: TE-EROD values after 24 hours incubation (n=3) and WHO-TEQ values (WHO, 1998) calculated as the sum of PCDD/F, PCB and PAH in humus samples at two altitude profiles. ----------------------------------105 Figure 3-36: TE-EROD values after 24 hours and 72 incubation (n=3) and WHO-TEQ values (WHO, 1998) calculated as the sum of PCDD/F and PCB WHO-TEQ in humus samples at two altitude profiles.--------------106 Figure 3-37: TE-EROD values (n=3) after 72 hours incubation and WHO-TEQ values (WHO, 1998) calculated as the sum of PCDD/F and PCB WHO-TEQ from the analytical determinations of 31 humus samples from Norway spruce forest sites. ---------------------------------------------------------------------------------------------------107 Figure 3-38: TE-EROD values after 72 hours incubation and WHO-TEQ values (WHO, 1998) for PCDD/F and PCB. EROD data points are the mean values of 3 replicates. Site codes: H: Haidel, B: Boubin, R: Ruckowitzschachten and M: Mitterfels. h: humus and m: mineral soil. -----------------------------------------------108 Figure 3-39: non-ortho PCB and mono-ortho PCB concentration values in humus and mineral soils at H: Haidel, B: Boubin, R: Ruckowitzschachten and M: Mitterfels 4. h: humus and m: mineral soil. ---------------------------109 Figure 3-40: Concentrations of PCB 126 and TE-EROD values in 29 humus samples form the alpine region. 109 Figure 3-41: Inter-laboratory reported results on the sample 10 nM Estradiol (n=6). Laboratory 7 corresponds to GSF ------------------------------------------------------------------------------------------------------------------------------111 Figure 3-42: Correlation between expected and measured values for laboratory 7 (GSF). ------------------------111 Figure 3-43: Percentage of genetically modified yeast activated after 18 hours incubation at different standard concentrations (nM) for DES, 17ß-E and 17α-E measured by flow cytometry. --------------------------------------112 Figure 3-44: Dose-response curves after 18 hours incubation for DES, 17ß-E and 17α-E (nM). a) Fluorescence per well (n=6). b) Activated cells P2 in the total cell population. ------------------------------------------------------114

List of Tables
v
List of Tables Table 2-1: Properties of some PAH. Molecular structure, MW (g mol-1), log Koa at 25°C and amount of PAH in the particulate phase (%). ------------------------------------------------------------------------------------------------------ 12 Table 2-2: Properties of some OCP. Molecular structure, MW (g mol-1), log Koa at 5°C and KH (Pa m3 mol-1 ) at 25°C. ------------------------------------------------------------------------------------------------------------------------------ 14 Table 2-3: 13C labelled PCDD and PAH used as PRC. ------------------------------------------------------------------- 27 Table 2-4: PDMS and LDPE selected properties. Tg: glass-transition temperature. Rusina et al., 2007.--------- 29 Table 2-5: Active sampling campaigns at Haidel: sampling periods and predominant wind directions. ---------- 33 Table 2-6: Altitude profiles in the Alps. ------------------------------------------------------------------------------------ 34 Table 3-1: Organic carbon content and total pesticide concentration (pg g-1 dry soil) in humus and mineral soil at H: Haidel, B: Boubin, R: Ruckowitzschachten and M: Mitterfels. ------------------------------------------------------ 54 Table 3-2: Concentration values for HCH isomers in the different matrices analysed. Results are the mean values at 4 sampling sites (n=4). The air concentrations are the mean annual values at Haidel. n.d. = non detectable. - 56 Table 3-3: Isomer ratios related to the γ-HCH isomer at the different matrices. -------------------------------------- 57 Table 3-4: Concentration values for PeCB, HCB, PCAS and OCS in the different matrices analysed. Results are the mean values of the 4 sampling sites (n=4). The air concentrations are the mean annual values at Haidel. n.d. = non detectable. ---------------------------------------------------------------------------------------------------------------- 58 Table 3-5: Concentration values for trans-CHL, cis-CHL, oxy-CHL, HC, trans-HCE and cis-HCE in the different matrices analysed (n=4). The air concentrations are the mean annual value at Haidel. n.d. = non detectable. ------------------------------------------------------------------------------------------------------------------------ 58 Table 3-6: Concentrations for some pesticides in the different matrices analysed. The results are the mean values of the 4 sampling sites. The air concentrations are the mean annual value at Haidel. n.d. = non detectable. ----- 59 Table 3-7: Concentration of DDT and its derivatives in the different matrices analysed (n=4). The air concentrations are the mean annual values at Haidel. n.d. = non detectable. ------------------------------------------ 60 Table 3-8: Amount of DDT compounds related to o, p'-DDT in the matrices analysed. The results are the ratios of the concentrations. ----------------------------------------------------------------------------------------------------------- 60 Table 3-9: Percentage values for selected PAH in the different matrices analysed. Results are given considering the mean of the 4 sampling sites excepting the air concentrations (only at Haidel). n.d. = not detectable.-------- 61 Table 3-10: Concentration of OCP in SPMD (pg SPMD-1) and CSB (pg CSB-1) after ½ and 1 ½ years exposure at four sampling sites. Air concentrations for the A and E campaigns at Haidel are also depicted. SPMD data at Haidel after 1 ½ exposure is not available due to triolein losses. n.d. = not detectable, n. a. = not analysable --- 81 Table 3-11: Concentration of PCB in SPMD (pg SPMD-1) and CSB (pg CSB-1) after ½ and 1 ½ years exposure at four sampling sites. Air concentrations for the A and E campaigns at Haidel are also depicted. SPMD data at Haidel after 1 ½ exposure is not available due to triolein losses. n.d. = not detectable, n. a. = not analysable.--- 82 Table 3-12: Concentration of organochlorine compounds (ng organochlorine kg-1 triolein) at two altitude profiles. The percentage values indicate the difference between the annual period and the sum of the two half year periods. CH-01: Switzerland-Klosters, DE-21: Germany-Eschenlohe. ------------------------------------------- 94 Table 3-13: 13C-PAH recovery (%) after different deployment times. ------------------------------------------------- 98 Table 3-14: 13C-PCDD/F recovery (%) in exposed and unexposed SPMD (n=2) after different deployment times.------------------------------------------------------------------------------------------------------------------------------------- 99 Table 3-15: 13C-PCDD/F amounts in exposed and unexposed SPMD.------------------------------------------------100 Table 3-16: SPMD sampling rates (m3 air day-1) at 2 sampling sites for Periods 1, 2 and 3. ----------------------101 Table 3-17: SPMD and coated bar sampling rates (m3 air day-1) at Haidel, ½ year deployment. -----------------102 Table 3-18: Fugacities (Pa) in air and SPMD. ----------------------------------------------------------------------------103 Table 3-19: EC50 values for dose-response curves after 18 hours incubation for DES, 17ß-E and 17α-E (nM). Response determined as fluorescence per well (n=6) and activated cells in the total cell population. ------------113 Table 3-20: EROD results after 72 hours incubation ( pg TCDD EQ/ g dry soil) and estrogenic activity ( pg 17ß- Estradiol/ g dry soil) in humus (HUM) and mineral (MSL) soils (n=3).-----------------------------------------------115
Abstract
vi
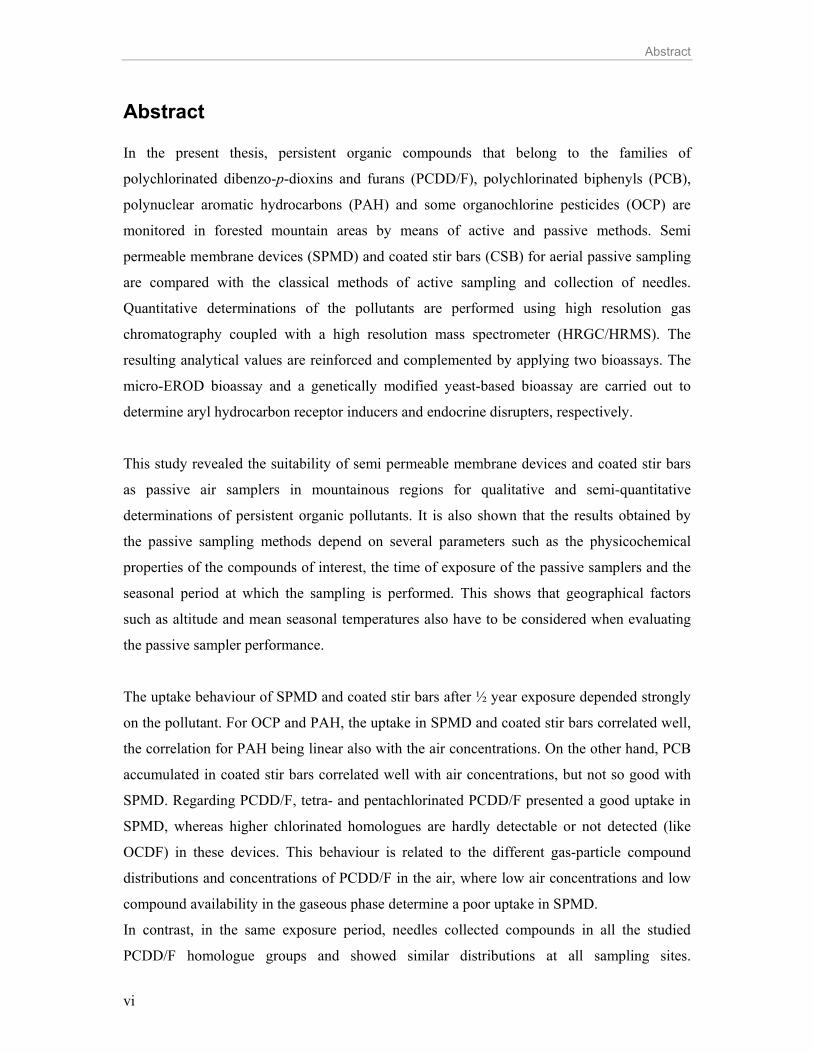
Abstract In the present thesis, persistent organic compounds that belong to the families of
polychlorinated dibenzo-p-dioxins and furans (PCDD/F), polychlorinated biphenyls (PCB),
polynuclear aromatic hydrocarbons (PAH) and some organochlorine pesticides (OCP) are
monitored in forested mountain areas by means of active and passive methods. Semi
permeable membrane devices (SPMD) and coated stir bars (CSB) for aerial passive sampling
are compared with the classical methods of active sampling and collection of needles.
Quantitative determinations of the pollutants are performed using high resolution gas
chromatography coupled with a high resolution mass spectrometer (HRGC/HRMS). The
resulting analytical values are reinforced and complemented by applying two bioassays. The
micro-EROD bioassay and a genetically modified yeast-based bioassay are carried out to
determine aryl hydrocarbon receptor inducers and endocrine disrupters, respectively.
This study revealed the suitability of semi permeable membrane devices and coated stir bars
as passive air samplers in mountainous regions for qualitative and semi-quantitative
determinations of persistent organic pollutants. It is also shown that the results obtained by
the passive sampling methods depend on several parameters such as the physicochemical
properties of the compounds of interest, the time of exposure of the passive samplers and the
seasonal period at which the sampling is performed. This shows that geographical factors
such as altitude and mean seasonal temperatures also have to be considered when evaluating
the passive sampler performance.
The uptake behaviour of SPMD and coated stir bars after ½ year exposure depended strongly
on the pollutant. For OCP and PAH, the uptake in SPMD and coated stir bars correlated well,
the correlation for PAH being linear also with the air concentrations. On the other hand, PCB
accumulated in coated stir bars correlated well with air concentrations, but not so good with
SPMD. Regarding PCDD/F, tetra- and pentachlorinated PCDD/F presented a good uptake in
SPMD, whereas higher chlorinated homologues are hardly detectable or not detected (like
OCDF) in these devices. This behaviour is related to the different gas-particle compound
distributions and concentrations of PCDD/F in the air, where low air concentrations and low
compound availability in the gaseous phase determine a poor uptake in SPMD.
In contrast, in the same exposure period, needles collected compounds in all the studied
PCDD/F homologue groups and showed similar distributions at all sampling sites.

Abstract
vii
Furthermore, the distribution patterns of PAH accumulated in needles also remained without
significant changes at all sampling sites and even in the different periods of collection.
The uptake behaviour of SPMD depends on the deployment time, as these devices pass from
an initial linear uptake phase to a curvilinear phase until reaching an equilibrium phase.
Longer exposures therefore generally implied higher compound uptake in SPMD, but
compounds with intermediate to low octanol-air partition coefficient were in equilibrium or
approaching equilibrium after ½ year deployment. Lower temperatures, generated seasonally
or by altitudinal conditions cause higher compound accumulation.
Accumulation also depended on the altitude for some of the pollutants. Humus soil and
SPMD exhibited higher accumulations at the higher sites of the altitude profiles for OCP,
whereas concentrations of PAH in SPMD decreased with altitude and were not detected at all
at the higher altitude sites. In contrast, needles seem to be strongly influenced by local
characteristics, so no profile tendency was found for the analysed compounds.
The analytical results were complemented by applying two bioassays. Micro-EROD bioassay
results were as a general trend higher than analytical results. However, samples with the
highest analytical PCB values presented a lower bioassay activity (lower EROD response),
which is possibly related to inhibitory effects. Higher concentrations of non-ortho PCB may
be the reason for the slightly antagonistic response in the EROD bioassay. The yeast modified
bioassay to determine estrogenic disrupters was successfully implemented as part of the
present study and later applied to environmental samples from remote forested sites.
Concentration levels of estrogenic disrupters were low in the studied areas.
To summarize, the novel passive techniques are promising tools to determine persistent
organic compounds in remote areas. The bioassay determinations were complementary to the
analytical methods and allowed a better data interpretation than the sole use of the analytical
results.

List of Publications
viii
List of Publications I. Levy W, Henkelmann B, Pfister G, Kirchner M, Jakobi G, Niklaus A, Kotalik J,
Bernhöft S, Schramm K-W. 2006. Comparison of PAH concentrations in Semipermeable Membrane Devices, low volume active sampler, and spruce needles. Organohalogen Compounds, 64: 45-48.
II. Levy W, Henkelmann B, Pfister G, Kirchner M, Jakobi G, Niklaus A, Kotalik J,
Bernhöft S, Fischer N, Schramm K-W. 2007. Monitoring of PCDD/Fs in a mountain forest by means of active and passive sampling. Environmental Research, 105: 300-306.
III. Levy W, Henkelmann B, Pfister G, Bernhöft S, Niklaus A, Kirchner M, Jakobi G,
Bassan R, Belis C, Jakl T, Kräuchi N, Magnani T, Perthen-Palmisano B, Schröder P, Schrott H, Sedivy I, Simončič P, Vannini P, Vilhar U, Schramm K-W. 2007. Semipermeable membrane devices (SPMD) as passive samplers: Data interpretation regarding exposure time. Organohalogen Compounds, 69: 599-603.
IV. Levy W, Henkelmann B, Pfister G, Bernhöft S, Niklaus A, Kirchner M, Jakobi G,
Bassan R, Belis C, Jakl T, Kräuchi N, Magnani T, Perthen-Palmisano B, Schröder P, Schrott H, Sedivy I, Simončič P, Vannini P, Vilhar U, Schramm K-W. 2007. Dioxin-like compounds in soils: Comparison of analytical measurements and bioassay determinations. Proceedings of SECOTOX: Environmental Management, Engineering, Planning and Economics, 1: 528-532.
V. Levy W, Henkelmann B, Pfister G, Bernhöft S, Niklaus A, Kirchner M, Jakobi G,
Bassan R, Belis C, Kräuchi N, Moche W, Offenthaler I, Simončič P, Uhl M, Weiss P, Schramm K-W. Long term studies with semipermeable membrane devices (SPMD) in montanious areas (submitted).
VI. Fried K W, Bazzi R, Levy Lopez W, Corsten C, Schramm K-W, Bell D R, Rozman K
K. 2007. Relationship between aryl hydrocarbon receptor-affinity and the induction of EROD activity by 2,3,7,8-tetrachlorinated phenothiazine and derivatives. Toxicology and Applied Pharmacology, 224: 147-155.

Abbreviations and Acronyms
ix
Abbreviations and Acronyms
17α-E 17α-Ethynylestradiol 17β-E 17β-Estradiol A Sampler area AhR Aryl hydrocarbon Receptor Arnt Aryl receptor nuclear tanslocator ASE Accelerated Solvent Extraction B Boubin BCF Bio concentration factor C Compound concentration Cair Compound concentration in air Cs Compound concentration in SPMD CSB Coated Stir Bars δ Effective thickness DDT Dichloro Diphenyl Trichloroethane DES Diethylstilbestrol EC50 Effect Concentration 50 % ER Estrogen Receptor EROD 7-Ethoxyresorufin-O-deethylase f Fugacity F Flux H Haidel hERα Human estrogen receptor α HRGC High Resolution Gas Chromatography HRMS High Resolution Mass Spectrometry ke Elimination rate constant KH Henry´s law constant Km Membrane resistance coefficient Ko Total mass transfer coefficient Koa Octanol-air partition coefficient Kp Particle-gas partition coefficient Ksa SPMD-air partition coefficient KT Overall uptake rate constant ku Uptake rate constant LDPE Low Density Polyethylene LOD Limit of Detection LOQ Limit of Quantification LowVol Low Volume M Mitterfels MW Molecular Weight N Normal conditions (1 atm, 273 K) NE North-East NW North-West OCP Organochlorine Pesticides OCDF Octachlorodibenzo furan Φ Particulate-phase fraction PAH Polynuclear Aromatic Hydrocarbons PAS Passive air samplers PC Principal Component PCA Principal Component Analysis PCB Polychlorinated Biphenyls PCDD Polychlorinated Dibenzo-p-dioxins PCDF Polychlorinated Dibenzofurans PDMS Polydimethylsiloxane POP Persistent Organic Pollutants PRC Performance Reference Compounds R Ruckowitzschachten R2 Correlation coefficient
Rs Sampling rate SE South-East So Octanol solubility SPE Solid Phase Extraction SPMD Semi Permeable Membrane Devices SPME Solid Phase Micro Extraction SW South-West TCDD 2,3,7,8-Tetrachlorodibenzo-p-dioxin TEF Toxic Equivalency Factor TEQ Toxic Equivalent TSP Total Suspended Particulate concentration TWA Time weighted average UPGMA Unweighted Par Group method with
Mathematical Averages V Sampler volume WHO World Health Organization yEGFP enhanced green fluorescent protein Z Fugacity capacity

x

Introduction
1
1. INTRODUCTION In the process of industrialisation, the efforts to improve the quality of life went hand in hand
with technological progress, where the chemical industry has always played an important role.
Surrounded by man-made compounds in every variety and quantity, the awareness of their
possible harmfulness to nature and mankind only developed late, usually after experiencing
severe accidents that awoke public consciousness about the way we influence the
environment. Incidents in the course of the last decades such as human intoxications by
polychlorinated biphenyls in food in Japan in 1968, by dioxin environmental exposure in
Missouri in 1971, by an outburst of dioxins in Seveso, Italy in 1976, are just a few examples
out of hundreds. These accidents were not the first ones, but have made public the potential
toxicity and adverse effects of synthetic chemicals on the environment and human health. In
this way, community concern, public pressure and government responsiveness started to arise
in the sixties and seventies.
In particular, industrial production and wide spread use of persistent organic pollutants (POP)
led to long lasting human exposure. Among them, polychlorinated biphenyls (PCB) are
technical mixtures that were widely used in the industry and nowadays are still used in
capacitors, transformers and welding implements because of their inherent properties as good
isolators, their thermo stability and low reactivity. Another important group to mention are the
organochlorine pesticides (OCP), which were used for many decades and left after-effects that
are still present nowadays. Other families of compounds such as polychlorinated dibenzo-p-
dioxins (PCDD) and polychlorinated dibenzofurans (PCDF) are produced as secondary
industrial products, e.g. by chlorine bleaching, or indeliberately e.g. by incineration processes.
Polynuclear aromatic hydrocarbons (PAH) are compounds that naturally occur in the
environment, but the increase in industrialization raised their air levels significantly.
Persistent organic pollutants are prone to long-range transport in the atmosphere due to their
persistence and volatility, such that they spread to and contaminate areas where they were
never used. They travel worldwide by mechanisms of cold condensation followed by re-
volatilisation, the atmosphere acting as a distillation system where the compounds condensate
at different temperatures depending on their physicochemical properties and on environmental
conditions (Lohmann et al., 2007). The fact that POP can be integrated in a new ecosystem
after undertaking long-range transport generates an impact on the new environment that it is
necessary to address (Wania, 2003). POP are transferred from the atmosphere to the soil

Introduction
2
compartment by dry and wet deposition where the vegetation is the intermediate compartment
between them (Smith and Jones, 2000). In this way the accumulation of lipophilic compounds
in needles allows them to be used as a natural passive sampler. This accumulation is strongly
related to the species (Böhme at al., 1999). Spruce needles (Picea abies (L.) Karst) are
suitable to be used as natural passive sampler (Umlauf and McLachlan, 1994). However,
considerations as sampling season and location as well as age of the needles can not be
disregarded. Spruce needles are used in this study as natural samplers to monitor and
qualitatively determine POP.
The transport mechanism favours the accumulation of POP in cold areas such as polar and
mountainous regions, where the re-volatilisation decreases. In high altitude areas, the
mountainous barriers oblige the air masses to ascend, decreasing their temperature and
leading to condensation and POP accumulation. Therefore, mountainous areas are particularly
well suited for monitoring contamination of the environment by POP. However, the difficulty
to access these remote areas implies the use of novel sampling techniques to achieve an
accurate knowledge of the POP deposition and adequate POP monitoring in these regions.
Classical techniques based on active volume sampling, implying energy supply, are not
always logistically possible. The active volume sampler is composed of a cartridge with a
glass fibber filter (to collect compounds attached to particles) and a resin (to retain gas phase
compounds) connected to a pumping system. This is the most common sampling technique
despite the need of energy supply and regularly maintenance. These requirements generate
practical restrictions on the number and locations of the geographical sites suitable for active
sampling as well as on the frequency of the monitoring.
Thus, passive air samplers (PAS), uptaking compounds by passive mass transfer, based on the
free flow of compounds from the air to an accumulation matrix, are seen as an alternative to
the active volume samplers (Harner et al., 2006). Passive samplers are cheaper in
implementation and manipulation and also of easier in maintenance than the active samplers.
The potential of semi permeable membrane devices (SPMD) as passive air samplers was
demonstrated in the laboratory by Petty and collaborators in 1993 (Petty et al., 1993). The
usefulness of SPMD as aerial samplers was later confirmed in aerial determinations of OCP in
the field (Prest et al., 1995). Advantages such as no need of energy supply and the ability of

Introduction
3
targeting a broad range of compounds are determinant factors to choose this kind of passive
sampling technology (Ockenden et al., 1998). Subsequently, studies to determine the presence
of contaminants, their sources and their spatial distributions in air with SPMD were emerging
(Ockenden et al., 2001; Lohmann et al., 2001; Meijer et al., 2003) and with them some
important issues to be addressed: for example, the determination of the best deployment
conditions, the optimal deployment period, knowledge of the SPMD uptake kinetics at the
moment of sampling and the conversion from the passive sampler concentrations to the real
air concentrations (Lohmann et al., 2001; Söderström and Bergqvist, 2004; Bartkow et al.,
2005).
In recent years, the use of other passive samplers, e.g. coated stir bars is seen as a promising
tool for passive air sampling, as well (Henkelmann et al., 2007). These single-phase devices
consist of a sorption polymer coating a magnetic rod encapsulated in glass. The device’s
qualities such as low cost, possibility of re-utilization and the possibility of direct thermal
desorption avoiding clean-up procedures make coated stir bars a good candidate for passive
air sampling (Baltussen et al., 1999; Rusina et al., 2007).
In the present thesis, POP concentration levels are studied in European mountain forest
regions, where the accumulation of POP is favoured. For this study, classic and novel
techniques for air sampling are used in order to determine their respective advantages and
disadvantages. The classical methods are active volume sampling employed to determine air
concentrations quantitatively and spruce needle collection, utilized as a qualitative monitor
screening. These sampling techniques were compared with the recent, promising passive air
samplers, SPMD and coated stir bars. To reinforce the monitoring in the forested areas, soil
samples acting as a final sink and providing the historical fingerprint related to POP
deposition at these mountainous sites were analysed.
In the work, POP were determined analytically. Thus, each compound was analysed and
quantified separately. However, the mixture of synthetic and natural organic compounds
accumulated in the environment to which the living organisms are exposed can generate
synergic, agonist or antagonist effects. These effects are not considered and even ignored by
the single analytical determinations. Further, some of the persistent organic compounds
penetrate the cell membrane due to their lipophilicity and persistence and are able to
bioaccumulate leading to magnified accumulation along the trophic chain. Organic

Introduction
4
compounds, such as aromatic hydrocarbons, are able to pass through the membrane and act as
enzyme inducers through specific binding to two important receptor groups: the aryl
hydrocarbon receptor (AhR) and the estrogen receptor (ER). The AhR is known to participate
in multiple mechanisms of the normal physiology in vertebrates, such as reproduction,
immunity and cell proliferation (Fujii-Kuriyama et al., 2007). It is also involved in the
elimination mechanisms of xenobiotics and its activation can cause effects such as
teratogenesis and tumour promotion (Hankinson, 1995; Estabrook, 1996). The disruption of
endocrine systems via the ER leads to hormone-dependent diseases and to carcinogenic
effects (Toppari et al., 1996).
As the classical analytical determinations are not able to cover these environmental aspects,
two bioassays considering the potential of the sample as AhR inducer and ER disrupter are
performed in this study as complementary methods: the 7-Ethoxyresorufin-O-deethylase
(EROD) bioassay to determine the AhR inducers and a genetically modified yeast-based
bioassay to determine ER disrupters. The samples from the accumulation matrices SPMD,
needles and soil are used for these determinations.
The present thesis is organized as follows: In chapter 2, methods to sample and quantify POP
are described as well as the theory behind them. A brief review of the studied POP is also
included. In chapter 3, the results are shown and discussed using different passive sampling
techniques after analytical measurements (Papers I and II). The relationships between passive
and active sampling are also considered (Papers I, II and unpublished data). To complement
this, the uptake behaviour of SPMD regarding time of exposure and altitude gradient of the
sampling sites is analysed (Papers III and V). In a second step, the results of analytical and
EROD determinations are compared (Paper IV). The EROD bioassay is applied as a routine
assay (Paper VI) and the yeast-based bioassay was implemented successfully at the laboratory
(unpublished data). Additionally, both bio-analytical determinations are presented together as
a final data analysis of the monitored area (unpublished data). General conclusions are given
in chapter 4 and finally, further investigation is proposed in chapter 5.
This work forms part of two projects, one in the Bavarian and Bohemian forests (Project-No.
76a-8731.2 - 2000/1) and the second in the Alpine region (Monitoring Network in the Alpine
Region for Persistent and other Organic Pollutants: MONARPOP).

Introduction
5
1.1 Research Objectives For the present thesis, monitoring of POP in different matrices was performed in European
mountainous areas. The main objective was to understand the differences between active and
novel air passive sampling techniques in order to achieve a deeper understanding and to
further develop the use of these novel techniques in remote areas. The application of two
bioassays was performed with the purpose to determine potential biological effects generated
by the accumulation of POP in these regions, effects not accounted for the analytical
determinations.
To achieve these objectives, the present work addresses the following issues: a) Air monitoring of POP in remote mountainous areas.
b) Comparison of alternative methods of air sampling for POP: SPMD and coated stir bars
versus classical low volume active sampling.
c) Monitoring of natural compartments indicating short and long term loading: spruce
needles, humus and mineral soil.
d) Reinforcement and complementary of the analytical determinations by applying two
bioassays to establish the total potential of the samples as AhR inducers and endocrine
disrupters.

Background and Methods
6
2. BACKGROUND AND METHODS 2.1 Family of compounds studied According to the Stockholm Convention, POP are defined based on the following properties:
a) persistence, b) bioaccumulation c) long-range environmental transport and d) adverse
effects such as toxicity and ecotoxicity to humans or the environment. The identification
criteria of new POP are also based on these above mentioned points (Stockholm Convention,
2001).
This work studies the classical POP such as polychlorinated dibenzo-p-dioxins and
polychlorinated dibenzofurans (PCDD/F) and polychlorinated biphenyls (PCB), but also an
extended list of pesticides, as well as the more relevant polynuclear aromatic hydrocarbons
(PAH).
2.1.1 Polychlorinated Dibenzo-p-dioxins, Dibenzofurans and Polychlorinated Biphenyls
These compounds are chlorinated aromatic molecules. The degree and position of the chlorine
substituents determine the properties of each compound. For example, a higher degree of
chlorination increases the octanol-air partition coefficient (Koa) value, an important property
to indicate the compound affinity between air and a lipophilic phase. More chlorine
substituents in the molecule cause a decrease in the compound volatility.
PCDD/F are structures with two aromatic rings bound through a third oxygenated ring. Two
oxygens are exhibited in PCDD and one in PCDF (Figure 2-1). From the 75 PCDD and 135
PCDF, only 7 and 10 respectively, are of importance regarding their toxic effects. The planar
configuration of these compounds favours the binding to the AhR. 2,3,7,8-
Tetrachlorodibenzo-p-dioxin (TCDD) is the most toxic compound of the family and therefore
used as reference compound in dose-response curves and for the calculation of toxicity
equivalency factors (TEFs) for other compounds. The physicochemical properties of this
family, named colloquially dioxins, are taken from Harner et al., (2000) and Chen et al.,
(2002).
PCB are biphenyl molecules substituted with chlorine (Figure 2-1). PCB are less toxic than
PCDD/F but they are environmentally present in higher amounts. In this work, PCB are
numbered according to the IUPAC nomenclature (Ballschmiter and Zell, 1980). From the 209
possible chlorine substitutions in the biphenyl molecule, compounds without chlorine in ortho

Background and Methods
7
positions tend to a planar configuration. For instance, the non-ortho PCB, also called planar
PCB are more potentially active than ortho PCB and thus, exhibit more affinity for the AhR.
12 of the 209 congeners are considered toxic, the most toxic being the PCB 126. The
compounds analysed in this work are the indicator PCB (28, 52, 101, 138, 153, 180), which
are exhibited at higher environmental levels, the non-ortho PCB (77, 81, 126, 169), which are
dioxin-like compounds and thus the more reactive, and the mono-ortho PCB (105, 114, 118,
123, 156, 157, 167, 189) that follow in reactivity the non-ortho PCB group. The
physicochemical properties of PCB used in this work are taken from the compilation and
evaluation of data properties performed by Li et al. (2003).
O
O OPolychlorinated dibenzo-p-dioxins Polychlorinated dibenzofurans
Polychlorinated biphenyls
Clx ClxCly Cly
Clx Cly
ortho meta
para
Figure 2-1: Schematic diagram of the general molecular structures of PCDD/F where 1 ≤ x + y ≤ 8 and PCB where 1 ≤ x + y ≤ 10. The ortho, meta and para positions are indicated in the PCB structure.
The toxicity effect of PCDD/F and PCB can be estimated using Toxic Equivalency Factors
(TEF). The TEF values are related to the most toxic compound TCDD which is assigned with
a TEF value of 1.0. The TEF value of a compound i (TEFi) multiplied with the concentration
of this compound (Ci) in the sample gives the Toxic Equivalent (TEQ) value. Thus, the
weighted sum of TEFi of the n compounds present in the sample gives the TEQ for the whole
sample as schematized below.
TEQTEFCni
i ii =×∑ =
=1
The TEF values used in the current work correspond to the international TEF values evaluated
by the World Health Organization (WHO) called also WHO-TEF. These values are taken
from the TEF re-evaluation assessed for the WHO in 1997 (Van den Berg et al., 1998).

Background and Methods
8
2.1.2 Organochlorine Pesticides Hexachlorocyclohexane (HCH) isomers were produced commercially, the technical mixtures
containing around 60-70 % α-, 5-12 % β-, 10-12 % γ-, 6-10 % δ- and 3-4 % of ε-isomer
(Sittig, 1985). These hexacyclic structures are non planar and their isomer reactivity is
determined by the amount of chlorine substituents in axial or equatorial orientation around the
ring. δ-HCH has one, α-HCH two and γ-HCH three axial chlorines, respectively. The β-
isomer has all its chlorines in the equatorial orientation. Axial chlorines cause more
compound reactivity, the γ-isomer being the most reactive of all of them (Keith, 1997) and the
one with insecticide properties. Lindane is the commercial name of the insecticide that has 99
% of the γ-isomer.
Hexachlorobenzene (HCB) sources are not limited to its past use as a fungicide, but it is still
generated in the organic chemical production as a by-product and it is an impurity in diverse
chemicals. It is also produced during waste incineration. In the atmosphere with hydroxyl
radicals, it has an estimated half life of 2 years and is usually present in the vapour phase. It is
strongly absorbed in soils and sediments (Pesticide Data Sheets). Pentachloroanisole (PCAS)
is formed by methylation of pentachlorophenol and can also be produced as a transformation
product of HCB via pentachlorobenzene (PeCB) as intermediate. Octachlorostyrene (OCS) is
a secondary product in the industrial production of tetrachlorethene and tetrachloromethane,
without known utilization.
Technical chlordane (CHL) is composed of 60-85 % of the cis- and trans-stereoisomers cis-
CHL and trans-CHL, where cis-CHL is more persistent than trans-CHL. Chlordane has low
mobility in the soil matrix, where it is absorbed. Oxychlordane is the main metabolite of
chlordane and is even more toxic than the parent material. The commercial mixture contains
heptachlor (HC) as a minor constituent (up to 10 %) and cis- and trans-nonachlor. Heptachlor
is an insecticide restricted to the use in power transformers to control ants. The hydrolysis of
heptachlor in soils is considerable, degrading to 1-hydroxychlordene, cis- and trans-
heptachloroepoxide (cis-HCE, trans-HCE) and an unidentified metabolite. Cis-HCE is a
persistent metabolite and also bioconcentrates in the food chain (Keith, 1997).
Aldrin has high acute toxicity and tends to degrade to dieldrin, a non- systemic pesticide. The
persistence of dieldrin in soils is longer than 7 years. Endrin is a stereoisomer of dieldrin.
Endrin is characterised by a high persistence in the soil matrix, up to 14 years. The technical

Background and Methods
9
endosulfan, used as a pesticide until today is composed of at least 94 % of α- and β- isomers
with a ratio of 7:3, respectively.
The 6 DDT compounds, p,p'-DDT, o,p'-DDT, p,p'-DDD, o,p'-DDD p,p'-DDE and o,p'-DDE,
are adsorbed strongly in soil. Standard technical mixtures of the DDT pesticide consist of
around 70 % p,p'-DDT and 15 % o,p’-DDT. DDE is an impurity of the pesticide DDT. DDD
and DDE are also biodegradation products of DDT (Keith, 1997). Chlorine pesticides such as
methoxychlor had a boom in usage after the DDT banning in the 70s until the middle of the
90s, when actions to ban it started due to its toxicity. Methoxychlor and mirex exhibit high
lipid solubility, a high stability and high toxicity, and are therefore included into the list of
pesticides to monitor. Some physicochemical properties of the pesticides analysed can be
found in section 2.1.4.
2.1.3 Polynuclear Aromatic Hydrocarbons Polynuclear aromatic hydrocarbons are composed of aromatic rings fused together by means
of sharing a pair of carbon atoms. The rings can be arranged linearly, angularly or clustered.
The result is a planar molecular structure. The environmentally significant PAH of the more
of 500 known aromatic structures are those molecules which contain two to seven benzene
rings. In this group, there is a large number of PAH which differ regarding to the number and
position of their aromatic rings. Therefore, they differ in their inherent chemistry. Physical
and chemical properties of PAH also vary with molecular weight. For instance, PAH
resistance to oxidation, reduction, and vaporization increases with increasing molecular
weight, whereas the aqueous solubility of these compounds decreases. As a result, PAH differ
in their behaviour, environment spreading and effects on biological systems. PAH can be
divided into two groups based on their physicochemical properties and biological
characteristics. The low molecular weight PAH (2 to 3 benzene rings) have significant acute
toxicity to aquatic organisms, whereas the high molecular weight PAH, with 4 to 7 rings do
not. However, several members of the high molecular weight PAH have been known to be
carcinogenic. The low molecular weight PAH present a low affinity for particle adsorption,
whereas higher molecular weight PAH have a strong adsorption affinity onto particles
surfaces.
The PAH analysed in this work are the 16 compounds called priority pollutants by the United
States Environmental Protection Agency (EPA PAH): Naphthalene (NA), Acenaphthylene
Background and Methods
10
(ACL), Acenaphthene (AC), Fluorene (FL), Phenanthrene (PHE), Anthracene (AN),
Fluoranthene (FA), Pyrene (PY), Benz(a)anthracene (BaA), Chrysene (Chr),
Benzo[b]fluoranthene (BbFA), Benzo[k]fluoranthene (BkFA), Benzo[a]pyrene (BaP),
Indeno[1,2,3-cd]pyrene (IP), Dibenz[a,h]anthracene (DBahA). Three more are added due to
their potential toxicity: Benzo[e]pyrene (BeP), Perylene (PE) and Benzo(b)naphtho(1,2-
d)thiophene. Further information is given in the following section 2.1.4.
2.1.4 Physicochemical properties The uptake of compounds is not only related to the sampler characteristics and the
environmental conditions, but to the physicochemical properties of the compounds as well.
POP undergo dry and wet deposition. Dry deposition can be either gaseous or particulate,
depending mainly on the vapour pressures of the compounds, particulate size and wind speed.
Wet deposition is the washout of chemicals associated to the vapour phase and particulate
material during precipitation and is related to the water-air partition coefficient and washout
ratio (Barber et al., 2004). As a consequence, the particle size distribution plays an important
role in both depositional processes, where the compounds can either be associated completely
or partially to the particulate matter or can stay exclusively in the gaseous phase. A
combination of compound properties and environmental aspects determines the gas-particle
partitioning for a given compound, a key factor during the sampling uptake. The compound
distribution in the gaseous-particulate phases determines the availability of the compound to
be transported into the passive sampling device, directly or after desorption processes from
the particulate material.
In this section, some selected properties of interest are given for the posterior analysis of
compound uptake in the passive samplers. The molecular structure and molecular weight
(MW) are provided. These properties are of importance because they influence the compound
diffusivity. The diffusivity gives the facility of one substance to be transported within another.
For example, compounds with higher MW and rigid structures tend to have a lower
diffusivity through membranes (Reynolds et al., 1990; Huckins et al., 2006). The octanol-air
partition coefficient (Koa) indicates the compound affinity between atmospheric and organic
phases and it can be resembled to the affinity between air and the triolein phase in SPMD
(Ksa) or air and the coating polymer of stir bars. Koa is defined as the ratio of the compound
concentration in 1-octanol (mol/L) to the compound concentration in air at equilibrium
(mol/L). Therefore, the definition used in the current work, implies a dimensionless octanol-
air partition coefficient.

Background and Methods
11
Higher Koa values mean higher affinity for the fatty phase. The Koa is also closely related to
the gas-particle partitioning of organic compounds in air (Finizio et al., 1997). Organic
compounds with high Koa values are more prone to be absorbed into particulate matter. The
particle-partitioning of POP is influenced by the source of the pollutants. PCDD/F and PAH,
originated in combustion and incineration processes, are from the beginning partially
associated with particles, whereas PCB and OCP in the gaseous phase are exchanged with
atmospheric aerosol after volatilization. The fraction of compounds available as gaseous is
also influenced by other factors, such as the environmental temperature. It is also observed
that even the size of particles to which the compounds are attached varies with the
temperature, and thus with the season (Kiss et al., 1998).
A study performed by Lohmann and co-workers (2000) showed, in general terms, the
following percentages of particle bounded compounds: PCB ≤ 50 %, Tetra to PentaCDD/F
from 7 to 98 %, HexaCDD/F from 69 to 100 %, PAH with MW ≤ 200 mainly associated to
the gas phase (≤ 25 % particle bounded fraction) and PAH with MW ≥ 252 almost completely
particle bounded. The gaseous percentage of the compound is the readily available fraction
able to diffuse through the membrane of the passive samplers. For the PAH the gaseous-
particle percentage distribution is listed for each compound, if known (Table 2-1). The Koa
values for PAH are also given in table 2-1. These values were calculated from the
dimensionless Henry’s law constant (KH) and the octanol-water partition coefficient (Odabasi
et al., 2006).
For OCP, the Henry’s law constant is given as an indicator of the affinity of the pesticide to
the gaseous phase in relation to the aqueous phase (Table 2-2). Higher KH values imply more
atmospheric partitioning, therefore greater availability to undergo atmospheric transport. The
tendency of a compound to escape from one phase (fugacity) is calculated based on the
Henry’s law constant and Koa (Mackay, 1979; Schramm et al., 1987). The calculation of the
fugacity is shown in Appendix I. The OCP data are obtained from the Pesticide Data Sheets.
Otherwise, sources are indicated at the end of the table 2-2.
The abbreviations used for PAH and OCP compounds in the current work are given in the
tables 2-1 and 2-2, respectively.

Background and Methods
12
Table 2-1: Properties of some PAH. Molecular structure, MW (g mol-1), log Koa at 25°C and amount of PAH in the particulate phase (%).
Compound Molecular structure MW (g mol-1) log Koa
Particulate phase (%)
Naphtalene (NA)
128.2 - 0.0 %a
Acenaphthene (AC)
154.2 6.52 -
Acenaphthylene (ACL)
152.2 6.34 -
Fluorene (FL)
166.2 6.90 -
Phenanthrene (PHE)
178.2 7.68 1.9 %b
Anthracene (AN)
178.2 - 0.5 %a
Fluoranthene (FA)
202.3 8.76 19.1 %b
Pyrene (PY)
202.1 - 29.6 %b
Benzo(b)naphtha (1,2-d)thiophene (BbnT)
S
234.3 - -
Benz(a)anthracene (BaA)
228.3 10.28 62.7 %b
Cyclopenta(cd)pyrene (CPP)
226.3 - -

Background and Methods
13
Compound Molecular structure MW (g mol-1) log Koa
Particulate phase (%)
Chrysene (Chr)
228.3 10.30 99 %c
Benzo(b)fluoranthene (BbFA)
252.3 11.34 92.3 %b
Benzo(k)fluoranthene (BkFA)
252.3 11.37 -
Benzo(e)pyrene (BeP)
252.3 - -
Benzo(a)pyrene (BaP)
252.3 11.56 98.3 %a
Perylene (PE)
252.3 - 90.0 %a
Indeno(1,2,3-cd)pyrene (IP)
276.3 12.43 -
Dibenz(a,h)anthracene (DBahA)
278.3 12.59 100 %b
Benzo(g,h,i)perylene (BghiP)
276.4 12.55 100 %b
a) Arey et al., 1987 b) Horstmann and McLachlan, 1998 c) Thrane and Mikalsen, 1981.

Background and Methods
14
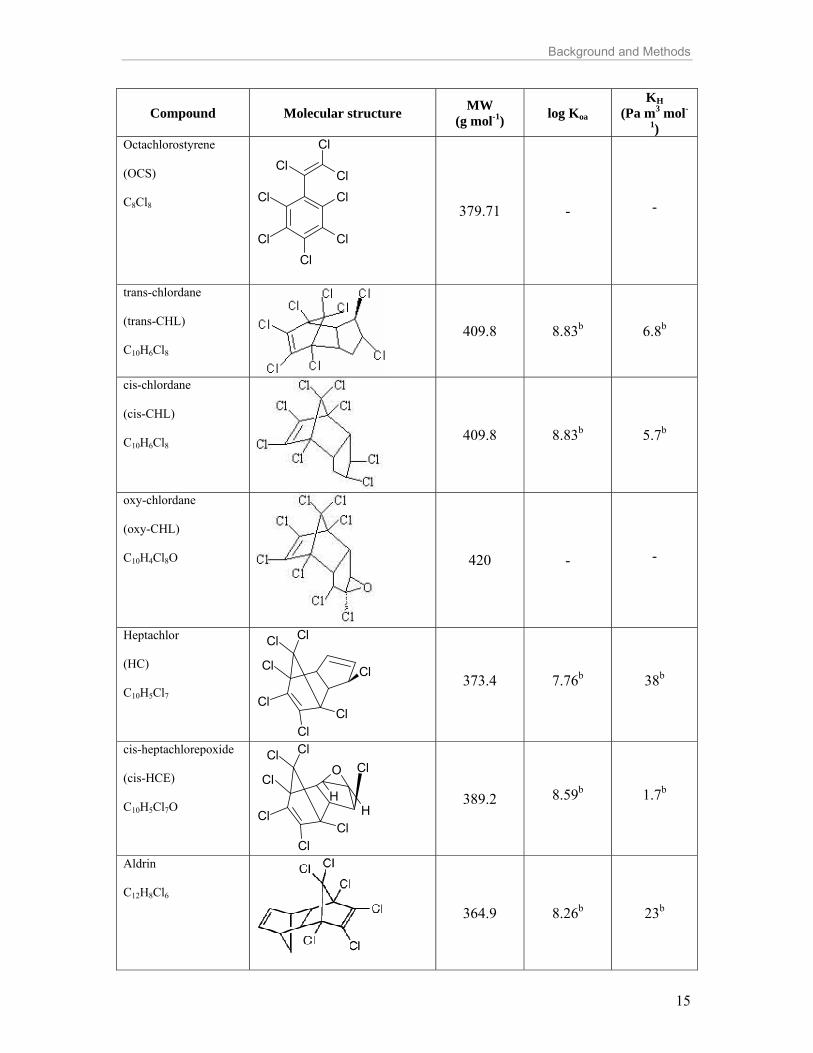
Table 2-2: Properties of some OCP. Molecular structure, MW (g mol-1), log Koa at 5°C and KH (Pa m3 mol-1 ) at 25°C.
Compound
Molecular structure MW
(g mol-1) log Koa KH
(Pa m3 mol-
1) α-Hexachlorocyclohexane (α-HCH) C6H6Cl6
Cl Cl
Cl
Cl
Cl
Cl
290.83 8.39a 0.652a
β-Hexachlorocyclohexane (β-HCH) C6H6Cl6
ClCl
Cl
Cl
Cl
Cl
290.83 10.06a 0.0374a
γ -Hexachlorocyclohexane (γ-HCH) C6H6Cl6 (Lindane > 99 % γ-HCH)
Cl Cl
Cl
Cl
ClCl
290.83 8.67a 0.272a
δ -Hexachlorocyclohexane (δ-HCH) C6H6Cl6
ClCl
Cl
Cl
Cl
Cl
290.83 - -
Pentachlorobenzene (PeCB) C6HCl5
ClCl
ClCl
Cl
250.32 7.18b 72b
Hexachlorobenzene (HCB) C6Cl6
ClCl
ClCl
Cl
Cl
284.79 8.09b 65b
Pentachloroanisole (PCAS) C7Cl5OH3
Cl
ClCl
Cl
Cl
OMe
280.38 - -
Background and Methods
15
Compound
Molecular structure MW
(g mol-1) log Koa KH
(Pa m3 mol-
1) Octachlorostyrene (OCS) C8Cl8
ClCl
Cl
Cl
Cl
ClCl
Cl
379.71 - -
trans-chlordane (trans-CHL) C10H6Cl8
409.8 8.83b 6.8b
cis-chlordane (cis-CHL) C10H6Cl8
409.8 8.83b 5.7b
oxy-chlordane (oxy-CHL) C10H4Cl8O
420 - -
Heptachlor (HC) C10H5Cl7
ClCl
Cl
Cl
Cl
Cl
Cl
373.4 7.76b 38b
cis-heptachlorepoxide (cis-HCE) C10H5Cl7O
ClCl
Cl
Cl
Cl
Cl
Cl
O
HH
389.2 8.59b 1.7b
Aldrin C12H8Cl6
364.9 8.26b 23b

Background and Methods
16
Compound
Molecular structure MW
(g mol-1) log Koa KH
(Pa m3 mol-
1) Dieldrin C12H8Cl6O
380.9 8.84b 1.1b
α-Endosulfan C9H6Cl6O3S
406.9 9.81b 0.70b
β-Endosulfan C9H6Cl6O3S
406.9 9.68b 0.045b
Methoxychlor C16H15Cl3O2
O O
Cl ClCl
345.6 - 1.62
Mirex C10Cl12
Cl
Cl Cl
ClCl
ClCl
ClCl
Cl
ClCl
545.5 - -
p, p'-DDT C14H9Cl5 ClCl
H
CCl3
354.5 9.73b 1.1b
p, p'-DDD C14H10Cl4 ClCl
H
CHCl2
320.1 10.03b 0.5b
p, p'-DDE C14H8Cl4
ClClCCl2
318.0 9.70b 4.2b
a) Xiao et al., 2004 b) Shen and Wania, 2005.

Background and Methods
17
2.2 Sampling Methods The sampling methods are described generally, but practical considerations, related
specifically to this work, are also included.
2.2.1 Active air sampling This kind of sampling is defined as “methods that require physical intervention or external
energy input” (Huckins et al., 2006). Low volume active sampling (LowVol) is the kind of
active method chosen here, because it allows the collection of compounds for periods of some
months, in contrast to high or medium volume sampling designed to work for some hours or
days. In this way, it is possible to determine the time weighted average (TWA) concentrations
e.g. over different seasons or monthly. In an air volume active sampler, air is pumped through
a collector cartridge filled with XAD amberlite topped with a fibreglass filter (Figure 2-2),
where organic compounds are accumulated. This sampling method comprises the particulate
(fibreglass filter) as well as the gas phase (XAD resin) of the compound. The volume of
pumped air and the direction of the air uptake are modifiable and known. To assure accuracy
and reliability of the data, a high degree of maintenance is necessary. It requires calibration of
the sampler following adequate quality assurance and control procedures, leading to high
operation costs. Figure 2-2 depicts a LowVol active sampler (Digitel blower, DPA96)
deployed at the Bavarian Forest. Note the 5 different cartridges which allow the sampler to
collect compounds discriminated by the predominant winds: North-West (NW), South-West
(SW), North-East (NE), South-East (SE) directions and calm. The pump is switched on/off
through the different cartridges according to the direction of the dominant wind.
Figure 2-2: Low volume active sampler and schematic representation of a cartridge design.
Fibreglass filter Particulate phase uptake
Amberlite XAD Gaseous phase uptake
Frit

Background and Methods
18
2.2.2 Passive air sampling Huckins and co-workers defined passive samplers as “human-made devices where sample
collection occurs in a completely passive manner” (Huckins et al., 2006). The process of
accumulation of compounds into these devices is based on diffusion or sorption of chemicals
from one matrix to another of higher compound affinity. The advantage of the passive air
samplers (PAS) in comparison to the active samplers is their simple operation, requiring no
power supply and allowing long deployment times. One important advantage of the
integrative uptake achieved at long deployment periods is the detection of compounds
otherwise unnoticed by active air sampling over a short period. Within this work, two types of
PAS are defined:
a) Natural passive samplers such as spruce needles (Picea abies (L.) Karst)
b) Human-made samplers, such as SPMD and coated stir bars.
The man-made samplers have the advantage of their standardized design, in contrast to the
natural passive samplers, whose uptake capacity depends on the growing conditions,
geographical site and age of the plants. Human-made passive devices can also be deployed in
remote areas where there is no vegetation. On the other hand, the cost of the natural passive
samplers lies only in the plant collection.
2.2.2.1 Needles as a natural passive sampler The uptake of POP is strongly dependent on the vegetation species chosen for the
biomonitoring (Böhme et al., 1999). Evergreen conifer forests are an excellent sink of organic
compounds due to the lipophilic properties of the needles cuticle and their great superficial
area. Spruce trees have good collection efficiency for particles and a good interception of
precipitation, and these factors make this species suitable as a passive sampler (Umlauf and
McLachlan, 1994). The needles accumulate compounds not only from the gaseous, but also
from the particulate phase.
This passive sampler has been roughly considered as a single compartment where a mass
balance can be applied considering only uptake and elimination processes. However, Umlauf
et al. (1994) have obtained results that express concern about considering needles as a single
well-mixed compartment. Tolls and McLachlan, (1994) suggested a two-compartment system
as a model in the uptake of lipophilic compounds thorough the leaf.
The mass transfer of the compounds from the air into the leaf is still not well-known in detail
but the transport processes are the following ones: a) diffusion transport (mainly Eddy
diffusion) through the bulk air to the air laminar layer that surrounds the canopy b) transport

Background and Methods
19
through the laminar layer to the surface of the leaf and c) diffusive transport from the surface
of the leaf into it. The uptake into the leaf is a parallel mass transfer through cuticle and
stomata, where the mass transfer resistance of the cuticle pathway presents more variability
than the stomatal pathway. The differences in cuticle type can imply different permeabilities,
thus different mass transfer coefficients for POP (Barber et al., 2004).
The accumulation of lipophilic compounds in needles increases with the needle age until
senescence starts, and this accumulation is strongly related to the species used as a passive
sampler (Hellström et al., 2004). The applied method of extraction removes POP accumulated
in the cuticle, but not compounds accumulated in the inner compartment of the leaf. It is also
important to mention that the vegetation scavenging effect (the uptake and accumulation of
compounds into the vegetation) is dependant of the current season. There seems to be greater
scavenging effects in the spring/summer months in comparison to the autumn/winter ones
(Lee et al., 1999). Due to this, it is a key issue to sample the different year classes
simultaneously so as to get independency from possible seasonal variations present in the
needles (Kylin et al., 2003). The vegetation growth is also an important factor related to the
scavenging effect of the vegetation. Foliar biomass of the sampling sites is determined in
order to detect possible influences of this factor (Jaward et al., 2005). To estimate the foliar
biomass, the stand biomass is measured.
2.2.2.2 SPMD as passive air sampler SPMD are integrative passive samplers, as they accumulate compounds during the sampling
time until reaching an equilibrium stage. The uptake is based on the contaminant
concentration difference between the air and the semi-permeable device, but only small
compounds are able to penetrate through the membrane. As a consequence, contaminants
associated with particulate material are mainly not absorbed, such that toxic compounds
within this group can be underestimated when using SPMD.
The sampler used in this work consists of a tube composed of a polymeric membrane (low
density polyethylene: LDPE) that encloses a lipophilic solvent: triolein (1,2,3-tris[cis-9-
octadecenoylglycerol]glycerol). The LDPE membrane has transient polymeric cavities of
about 10 A° diameter. This size exclusion avoids the diffusion of triolein out of the membrane
and simultaneously limits the uptake of large organic molecules through it (Figure 2-3).
Triolein is a natural triglyceride (MW 885.4) that solidifies at -4°C, is able to dissolve solid
fats and does not react with absorbed pollutants. These characteristics make SPMD suitable
for the uptake of hydrophobic organic chemicals with molecular weights lower than 600

Background and Methods
20
Daltons. As triolein is found as a natural storage lipid in most organisms and the size
exclusion of molecules able to be transported through biological membranes is around 9.8 A°
(Opperhuizen et al., 1985), SPMD are expected to mimic roughly the accumulation in living
organisms.
Figure 2-3: Schematic representation and SPMD preparation at the laboratory. According to Bartkow et al. (2005), the exchange of compounds between the passive device
and the air can be divided in three steps
1) a linear uptake stage where the uptake is proportional to the concentration of the compound
in the device surroundings
2) a curvilinear stage where the elimination of the absorbed compound from the device
achieves importance and
3) a steady state stage where the uptake/elimination of the analyte in the device approaches
equilibrium (Figure 2-4).
When the device is operating in the linear uptake stage, the sampler is called kinetic sampler.
For devices designed to operate in the kinetic stage, the exposure time is a key factor in the
passive sampler performance. Other parameters of importance to define the accumulation
capacity of passive samplers are film thickness, sampler area (A), sampler volume (V) and the
sampler area to volume ratio A/V.
In this work, SPMD are designed as LDPE membranes (length 23 cm, wide 2.5 cm, thickness
≈ 67.5 µm) filled with 0.7 ml triolein 99 % (Sigma-Aldrich, Taufkirchen, Germany) that were
heat sealed under inert gas conditions (N2) in a glove chamber to avoid contaminations. The
sampler area (A) is ≈ 115 cm2 and the area to volume ratio A/V≈ 165 cm-1.
67µm 80-100 µm
LDPE Triolein
Transient cavities 10 A°
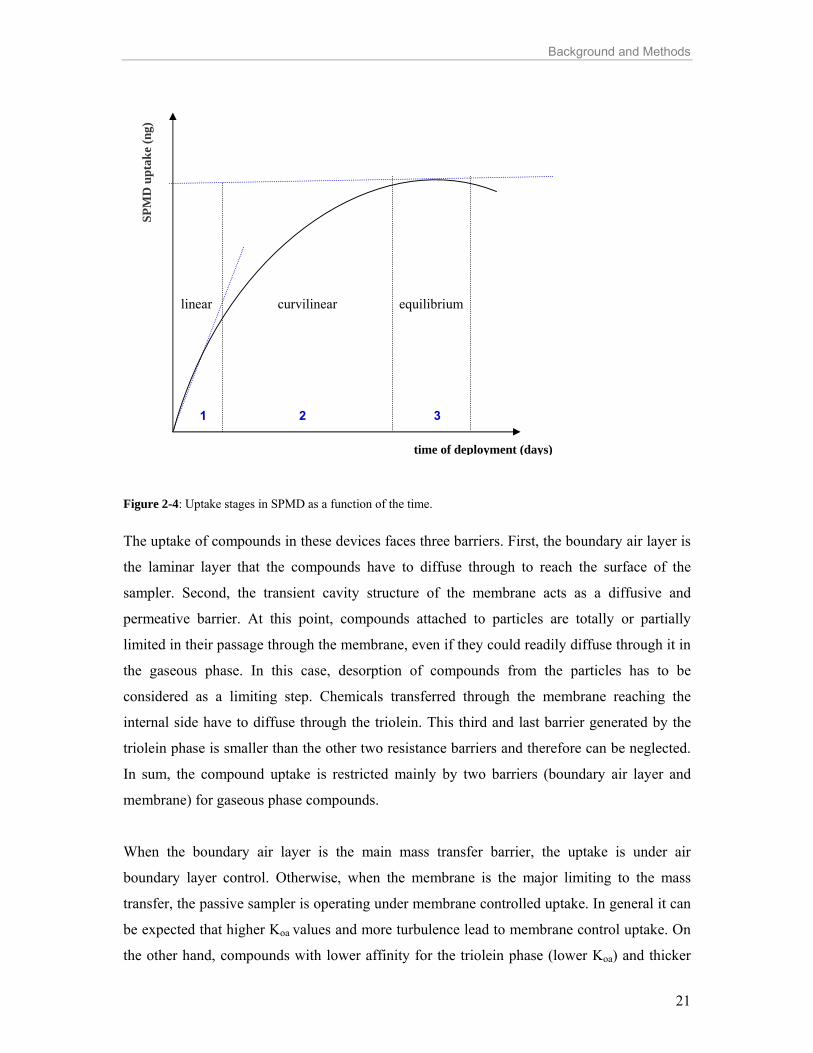
Background and Methods
21
Figure 2-4: Uptake stages in SPMD as a function of the time. The uptake of compounds in these devices faces three barriers. First, the boundary air layer is
the laminar layer that the compounds have to diffuse through to reach the surface of the
sampler. Second, the transient cavity structure of the membrane acts as a diffusive and
permeative barrier. At this point, compounds attached to particles are totally or partially
limited in their passage through the membrane, even if they could readily diffuse through it in
the gaseous phase. In this case, desorption of compounds from the particles has to be
considered as a limiting step. Chemicals transferred through the membrane reaching the
internal side have to diffuse through the triolein. This third and last barrier generated by the
triolein phase is smaller than the other two resistance barriers and therefore can be neglected.
In sum, the compound uptake is restricted mainly by two barriers (boundary air layer and
membrane) for gaseous phase compounds.
When the boundary air layer is the main mass transfer barrier, the uptake is under air
boundary layer control. Otherwise, when the membrane is the major limiting to the mass
transfer, the passive sampler is operating under membrane controlled uptake. In general it can
be expected that higher Koa values and more turbulence lead to membrane control uptake. On
the other hand, compounds with lower affinity for the triolein phase (lower Koa) and thicker
time of deployment (days)
SPM
D u
ptak
e (n
g)
1 2 3
linear curvilinear equilibrium
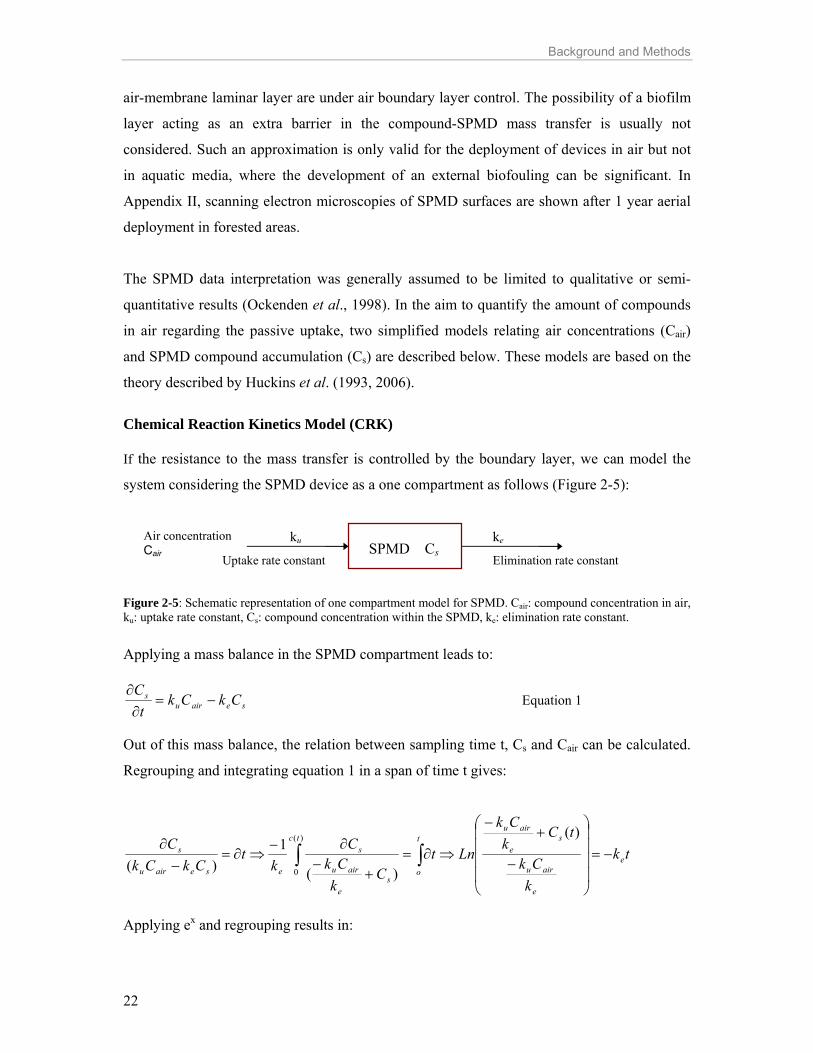
Background and Methods
22
air-membrane laminar layer are under air boundary layer control. The possibility of a biofilm
layer acting as an extra barrier in the compound-SPMD mass transfer is usually not
considered. Such an approximation is only valid for the deployment of devices in air but not
in aquatic media, where the development of an external biofouling can be significant. In
Appendix II, scanning electron microscopies of SPMD surfaces are shown after 1 year aerial
deployment in forested areas.
The SPMD data interpretation was generally assumed to be limited to qualitative or semi-
quantitative results (Ockenden et al., 1998). In the aim to quantify the amount of compounds
in air regarding the passive uptake, two simplified models relating air concentrations (Cair)
and SPMD compound accumulation (Cs) are described below. These models are based on the
theory described by Huckins et al. (1993, 2006).
Chemical Reaction Kinetics Model (CRK) If the resistance to the mass transfer is controlled by the boundary layer, we can model the
system considering the SPMD device as a one compartment as follows (Figure 2-5):
Figure 2-5: Schematic representation of one compartment model for SPMD. Cair: compound concentration in air, ku: uptake rate constant, Cs: compound concentration within the SPMD, ke: elimination rate constant. Applying a mass balance in the SPMD compartment leads to:
seairus CkCk
tC
−=∂∂
Equation 1
Out of this mass balance, the relation between sampling time t, Cs and Cair can be calculated.
Regrouping and integrating equation 1 in a span of time t gives:
tk
kCk
tCkCk
LntC
kCk
Ck
tCkCk
Ce
e
airu
se
airut
o
tc
se
airu
s
eseairu
s −=⎟⎟⎟⎟
⎠
⎞
⎜⎜⎜⎜
⎝
⎛
−
+−
⇒∂=+
−∂−
⇒∂=−
∂∫∫
)(
)(
1)(
)(
0
Applying ex and regrouping results in:
Air concentration Cair
ku
Uptake rate constant SPMD Cs
ke
Elimination rate constant

Background and Methods
23
( ) ( )tksaairs
tk
e
airus
ee eCtCekCk
tC −− −Κ=⇒−= 1)(1)( Equation 2
where Ksa is the SPMD-air partition coefficient (Ksa= ku/ke). When the SPMD is still in the linear stage, the amount of compound released from the SPMD
to the air compartment is negligible, thus from equation 1 keCs→0
airus Ckt
C ≅∂∂⇒ Equation 3
Integrating this approximation in a span of time t leads to:
( ) tCktC airus = Linear uptake stage Equation 4 When the SPMD has reached equilibrium conditions, such that the concentrations do not
change anymore, equation 1 leads to:
seairus CkCkt
C =⇒=∂∂ 0 Equation 5
so the compound concentrations in the air and the SPMD are related through the uptake and
elimination rate constants:
sa
s
u
seair
CkCk
CΚ
== Equilibrium conditions Equation 6
Mass Transfer Coefficient Model This model describes the mass transfer in the system by means of mass transfer coefficients.
The compound concentrations in the different compartments are schematized in Figure 2-6:
Figure 2-6: Schematic overview of the concentration distribution air-SPMD. Cair: compound concentration in air, Cae: compound concentration at the membrane outside boundary layer, Cme: compound concentration at the membrane inside boundary layer, Cmi: compound concentration at the membrane internal side, Cs: compound concentration in SPMD, δ: effective thickness of each region and their associated subscripts.
Cs
triolein Cmi membrane
Cme Cair
Cae
δa δm δs

Background and Methods
24
Appling Fick´s First law and assuming concentration homogeneity within the device, the flux
F ( moles s-1) generated is:
δ∂∂
−=CDAF , Equation 1
where D is the diffusivity of the compound (cm2 s-1) and A is the sectional area (cm2) where
the compound is transferred (membrane surface area), δ (cm) and C (moles cm-3). Substituting
the mass transfer coefficients km=Dm/δm and ka = Da/δa in the equation 1:
tCVCCAkCCAkF s
SPMDaeairSPMDamimeSPMDm ∂∂
=−=−= )()( Equation 2
where VSPMD is the sampler volume. Using the equilibrium partition coefficients defined as
Kms=Cmi/Cs, Kma=Cme/Cae and Ksa=Cs/Cair the equation is re-written as a function of the
variables of interest Cair and Cs, obtaining:
tCVKCKCAkF s
SPMDmssmaairSPMDo ∂∂
=−= )( Equation 3
where ko is the total mass transfer coefficient: a
ma
mo kK
kk+=
11 Equation 4
Assuming independence and additively of the coefficients and regrouping and integrating the
equation 3 we obtain:
)1()1( )/( tksaair
VtKAk
ms
maairs
TSPMDmsSPMDo eKCeKKCC −− −=−= Equation 5
In this equation the overall uptake rate constant is defined as kT = koASPMDKms/VSPMD.
Equation 5 describes the uptake stages depicted in Figure 2-3. In short exposure periods, for
t→ 0 the limit of the exponential term tends to
( ) SPMDmsSPMDoVtKAk VtKAke SPMDmsSPMDo /1lim /( →− − Equation 6
Substituting this term in equation 5 and Ksa by Kma/Kms, a linear time-dependent function is
obtained:

Background and Methods
25
SPMDSPMDomaairSPMDmsSPMDoms
maairs VtAkKCVtKAk
KKCC // == Equation 7
In this linear stage, the uptake of compounds depends on the design of the device (volume and
area) and the physicochemical properties of the chemical. The sampling rate Rs is defined as
the volume of compound incorporated by the passive sampler per unit of time:
SPMDomas AkKR = Equation 8
and substituting equation 8 in equation 7:
tCVCRVtRCC airsssssairs // =⇒= Equation 9
In this way, in the linear uptake stage, the sampling rate of a compound can be calculated if
the SPMD and air concentrations of the compound for a determined exposure time are known.
It is interesting to remark that the sampling rate is only a function of the sampler design and
physicochemical properties of the compound (equation 8), and thus independent of the
compound air concentrations. This implies that for a determined temperature, Rs is a single
known value.
For the empirical calculation of sampling rates, CsVs is equivalent to the amount of mass Ns
sequestered in the SPMD. Substituting Ns in the equation 9 leads to:
tCNR airss /= Equation 10
Once sampling rates for compounds have been established for a determined sampling design
using equation 10, these sampling rates can be used to estimate the air concentrations of a
compound, from the compound uptake into the SPMD and the time of deployment.
In devices deployed enough time to reach steady state conditions the exponential term of
equation 5 tends to zero and thus:
saairs KCC = equilibrium conditions Equation 11

Background and Methods
26
In the equilibrium stage the concentrations in air and SPMD are related exclusively through
the SPMD-air partition coefficient Ksa, which can be substituted as a first approximation by
the octanol-air partition coefficient Koa, obtaining:
oasairoaairs KCCKCC /=⇒= Equation 12
The equation 12 allows the calculation of the compound air concentration just knowing the
Koa value and the amount of chemical accumulated in the device under steady state
conditions.
Note that the two models presented above can be related through the constants; elimination
rate constant ke in the kinetic model (equation 2) and overall uptake rate constant kT in the
mass transfer coefficient model (equation 5).
Performance Reference Compounds
Performance reference compounds (PRC) are non-interfering organic chemicals with medium
to high affinity for triolein which are added to it before the membrane enclosure and
distributed homogeneously in the lipid phase (Huckins et al., 2002a). In preference, PRC have
to be compounds not exhibited in the environment and due to this, deuterated PAH or 13C-
PCB compounds are adequate. The purpose of these compounds is to assess the effect of
environmental variables at the different sampling sites. The theory is based on the assumption
that the elimination rate (ke) of PRC is related to the uptake rate of the corresponding native
compounds (Petty et al., 2000). The release of PRC follows an exponential decay with the
exposure time:
tkPRC
C
C
t
ePRC
PRCPRCe
PRC e
oPRC
PRC
oPRC
eCCtkCC
Ckt
C −=⇒∂−=∂
⇒−=∂
∂∫ ∫
0
Equation 1
The initial amount of PRC (CPRCo) and the remaining amount after the exposure time (CPRC)
are known, such that the elimination rate can be calculated by regrouping the equation 1:
tC
CLnk PRC
oPRC
e
⎟⎠⎞
⎜⎝⎛
= Equation 2
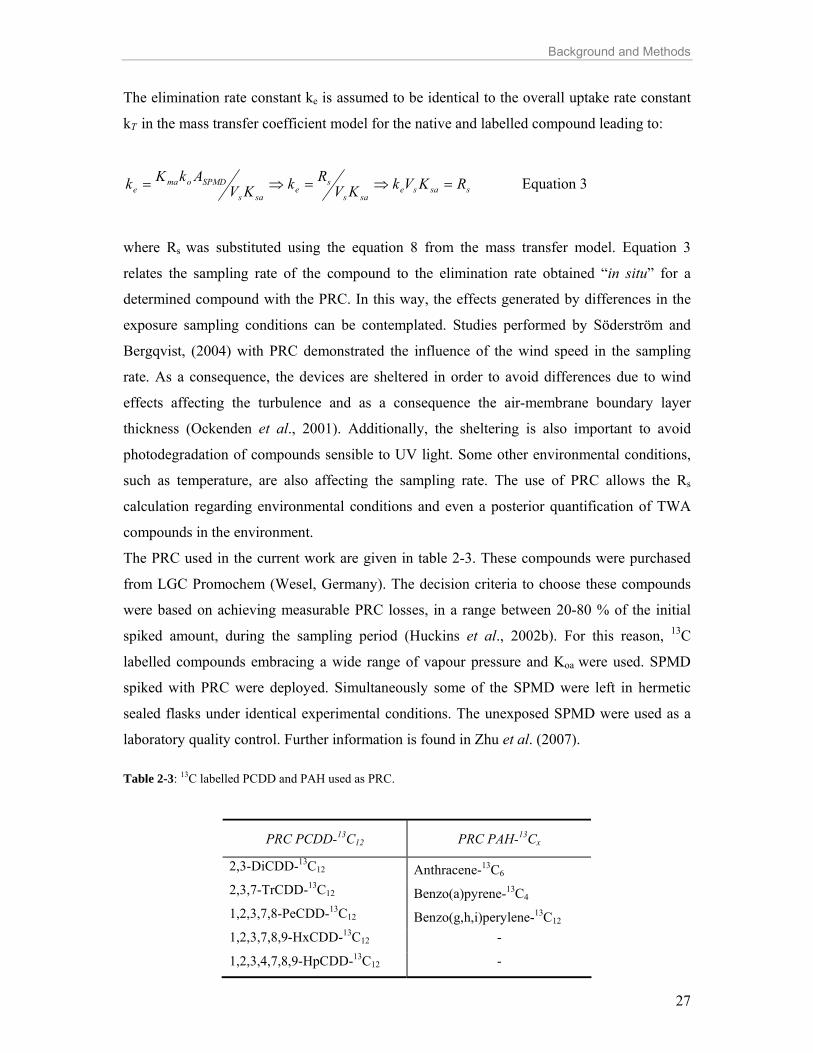
Background and Methods
27
The elimination rate constant ke is assumed to be identical to the overall uptake rate constant
kT in the mass transfer coefficient model for the native and labelled compound leading to:
ssasesas
se
sas
SPMDomae RKVkKV
RkKVAkKk =⇒=⇒= Equation 3
where Rs was substituted using the equation 8 from the mass transfer model. Equation 3
relates the sampling rate of the compound to the elimination rate obtained “in situ” for a
determined compound with the PRC. In this way, the effects generated by differences in the
exposure sampling conditions can be contemplated. Studies performed by Söderström and
Bergqvist, (2004) with PRC demonstrated the influence of the wind speed in the sampling
rate. As a consequence, the devices are sheltered in order to avoid differences due to wind
effects affecting the turbulence and as a consequence the air-membrane boundary layer
thickness (Ockenden et al., 2001). Additionally, the sheltering is also important to avoid
photodegradation of compounds sensible to UV light. Some other environmental conditions,
such as temperature, are also affecting the sampling rate. The use of PRC allows the Rs
calculation regarding environmental conditions and even a posterior quantification of TWA
compounds in the environment.
The PRC used in the current work are given in table 2-3. These compounds were purchased
from LGC Promochem (Wesel, Germany). The decision criteria to choose these compounds
were based on achieving measurable PRC losses, in a range between 20-80 % of the initial
spiked amount, during the sampling period (Huckins et al., 2002b). For this reason, 13C
labelled compounds embracing a wide range of vapour pressure and Koa were used. SPMD
spiked with PRC were deployed. Simultaneously some of the SPMD were left in hermetic
sealed flasks under identical experimental conditions. The unexposed SPMD were used as a
laboratory quality control. Further information is found in Zhu et al. (2007).
Table 2-3: 13C labelled PCDD and PAH used as PRC.
PRC PCDD-13C12 PRC PAH-13Cx
2,3-DiCDD-13C12 Anthracene-13C6 2,3,7-TrCDD-13C12 Benzo(a)pyrene-13C4 1,2,3,7,8-PeCDD-13C12 Benzo(g,h,i)perylene-13C12 1,2,3,7,8,9-HxCDD-13C12 -
1,2,3,4,7,8,9-HpCDD-13C12 -

Background and Methods
28
2.2.2.3 Coated stir bar as passive air sampler Coated stir bars (CSB) were first introduced by Arthur and Pawliszyn in 1990. The device
design is a rod covered with a coating of a polymeric material (Figure 2-7), able to retain the
compounds by dissolution or partitioning (sorption). In this way, these PAS comprise only a
single phase of a coating material. The polymer chosen is polydimethylsiloxane (PDMS) with
the characteristics of being a rubber-like, homogeneous and non-porous material, in which the
chemicals can be dissolved (Baltussen et al., 2002). This material satisfies the requisite of
“zero sink”. This means that the analyte concentration at the air-polymer interface remains
close to zero during the sampling period, avoiding interferences in the sampling rate of
additional analyte (Chen and Pawliszyn, 2003).
Figure 2-7: Coated stir bar scheme and PDMS polymeric structure. The advantage of using CSB is that, unlike other PAS, they do not require a clean-up step.
The dissolved compounds can be analysed by solid-phase micro extraction (SPME) for which
they are desorbed thermically under an inert gas stream coupled to a gas chromatograph
followed by a mass spectrometer.
The coated stir bars used for this study have a length of 20 mm and a PDMS film thickness of
1.0 mm. They were acquired with the commercial name of TwistersTM from Gerstel
(Mülheim, Germany). The mean diameter is approximately 3.5 mm and this result in an
effective area of A ≈ 220 mm2 and an A to V ratio of A/V≈ 1.4 mm-1. This means that the
effective area of the SPMD used for this study is more than 50 times larger than the PDMS
coating area of the CSB. On the other hand, diffusion coefficients of organic substances in the
PDMS coating are higher than in the LDPE membrane (Rusina et al., 2007). As a
consequence, coated stir bars exhibit lower resistance to the molecular transport of organic
compounds through the membrane than SPMD. Due to this, the sampling rate is more likely
Magnetic rod
1mm
Glass tube
PDMS-coating
PDMS structure
O SiSi
CH3 CH3
CH3CH3
O
20 mm
3.5 mm

Background and Methods
29
to be controlled by the membrane in SPMD with compounds of intermediate Koa values,
whereas in coated stir bars, these compounds exhibit a lower resistance through the coating
that favours a control by the air boundary layer. Table 2-4 summarizes selected properties of
LDPE and PDMS, the interface polymers in SPMD and coated stir bars, respectively.
Table 2-4: PDMS and LDPE selected properties. Tg: glass-transition temperature. Rusina et al., 2007.
Polymer Thickness (mm)
Density (g cm-3)
Melting point (°C)
Tg (°C)
Structural unit
PDMS 0.4 1.15 150-200 -120 [-Si(CH3)2-]nO-
LDPE 0.066 0.915 120 -40 [-CH2-CH2-]n
Coated stir bars present as an advantage lower costs at the laboratory in comparison with
SPMD regarding usage of time and solvents during the sample preparation as well as the cost
of the device itself. Coated bars can be re-used after conditioning. As a disadvantage, the lack
of standard procedures and experience in air monitoring with these one-phase devices has to
be considered.
Mass Transfer Model
The passive sampling process is described by Fick´s first law and schematized in Figure 2-8.
Figure 2-8: Scheme of the mass transfer in passive samplers (modified from Gorecki and Namienski, 2002).
Applying the Fick´s first law and integrating over a time t, leads to:
tDAC
MCCDA
tM air
sois
δδ=⇒
−=
∂∂ )(
, Equation 1
where Ms is the analyte mass, Ci is the analyte concentration inside the sorption coating and
Co is the concentration at the membrane interface. The other terms were defined earlier for
C
δ
A
Ci Cair
Co

Background and Methods
30
SPMD. The simplification that the compound concentration Ci at the diffusive layer is equal
to the air concentration of the compound (Cair) was applied and also the “zero sink” principle,
i.e. C0 → 0. This equation allows the calculation of the air concentrations knowing the
amount of analyte absorbed in the coating, compound diffusivity and the device design
parameters A and δ. This time-related linear uptake allows the calculation of TWA
concentration of compounds in these devices.
2.2.3 Soil as a POP accumulation matrix Soil can be schematically described as a three compartment model as follows (Harner et. al,
2001):
a) a top layer that acts as a soil-air exchange layer,
b) a buffer layer where chemicals are leached down from the top and diffused up from the
bottom and
c) a reservoir layer where chemicals can be accumulated for long terms.
For this study, soil samples were taken at two depths, comprising the humus layer and the
deeper mineral layer. The humus samples were collected by taking the whole humus found
within a 30 x 30 cm metal frame. 10 pits along a 5 x 30 m rectangular grid were randomly
collected per sampling site and mixed as a pooled sample. After taking the humus layer, the
uppermost 10 cm soil beneath was defined as the mineral soil. Using the compartment model
described above by Harner et. al (2001), the humus samples belong to the first two mentioned
layers, but the mineral soil not always corresponds completely to the reservoir layer. The fate
of POP is highly influenced by the organic content in soil and the soil texture. Due to this the
comparison of data among different sampling sites has to be done considering these properties
(Daly et al., 2007). The organic carbon content was determined by elementary analysis
measurement carried out at the Institute of Soil Ecology in the Soil Functions and Material
fluxes group (Dr. A. Zsolnay) in the German Research Center for Environmental Health.

Background and Methods
31
2.3 Sampling Sites
2.3.1 Bavarian and Bohemian forest sites Sampling took place in a mountainous area at the Bavarian and Bohemian forests (Central
Europe). The four sampling sites Mitterfels (M), Ruckowitzschachten (R), Haidel (H) and
Boubin (B) (Figure 2-9) are of similar characteristics regarding altitude, temperature regime,
forest stand characteristic and as far as possible, similar contaminant sources (Kirchner et al.,
2006).
The forest stands (foliar biomass) are at Mitterfels 40 m2/ha, at Haidel 46 m2/ha, at Boubin 54
m2/ha and at Ruckowitzschachten 60 m2/ha (measurement error ± 3 m2/ha). The forest
composition at Boubin and Mitterfels is based mainly of spruce stands (Picea abies (L.)
Karst), but deciduous species such as beech, rowan berry and ash maple are also found (< 10
%) at Haidel. In contrast, Ruckowitzschachten has approximately the same amount of beech
and spruce stands. The solar irradiation is determined by the geographical characteristics and
decreases in the following order: Mitterfels (1030 m a.s.l.) and Haidel (1160 m a.s.l.), both
hills with round ends, Ruckowitzschachten (slope facing to the west, 1130 m a.s.l.) and
Boubin (slope facing to the north, 1300 m a.s.l.). The sampling sites are characterized by soils
of granite and gneiss bed rock and belong to the same altitudinal zone. The soil texture classes
corresponding to the sampling in mineral soils are classified as sandy loam or silt loam
textures, except for Mitterfels, that has silt-loamy sand and loamy sand textures.
Figure 2-9: Sampling sites at the Bavarian and Bohemian forests. H: Haidel, B: Boubin, R: Ruckowitzschachten and M: Mitterfels.
Bavarian Forest/Sumava
Biosphere Reserve of Sumava
National Park of Sumava Natural Park of Bavarian Forest
National Park of Bavarian Forest B
M
H
R
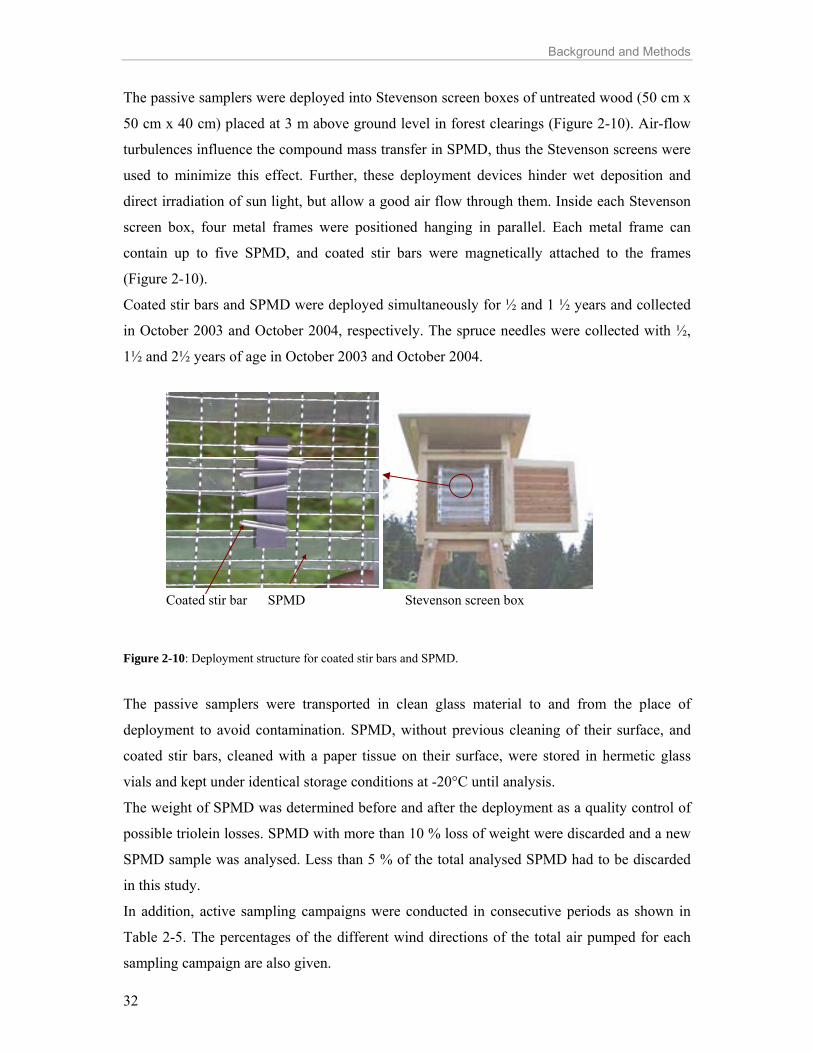
Background and Methods
32
The passive samplers were deployed into Stevenson screen boxes of untreated wood (50 cm x
50 cm x 40 cm) placed at 3 m above ground level in forest clearings (Figure 2-10). Air-flow
turbulences influence the compound mass transfer in SPMD, thus the Stevenson screens were
used to minimize this effect. Further, these deployment devices hinder wet deposition and
direct irradiation of sun light, but allow a good air flow through them. Inside each Stevenson
screen box, four metal frames were positioned hanging in parallel. Each metal frame can
contain up to five SPMD, and coated stir bars were magnetically attached to the frames
(Figure 2-10).
Coated stir bars and SPMD were deployed simultaneously for ½ and 1 ½ years and collected
in October 2003 and October 2004, respectively. The spruce needles were collected with ½,
1½ and 2½ years of age in October 2003 and October 2004.
Figure 2-10: Deployment structure for coated stir bars and SPMD.
The passive samplers were transported in clean glass material to and from the place of
deployment to avoid contamination. SPMD, without previous cleaning of their surface, and
coated stir bars, cleaned with a paper tissue on their surface, were stored in hermetic glass
vials and kept under identical storage conditions at -20°C until analysis.
The weight of SPMD was determined before and after the deployment as a quality control of
possible triolein losses. SPMD with more than 10 % loss of weight were discarded and a new
SPMD sample was analysed. Less than 5 % of the total analysed SPMD had to be discarded
in this study.
In addition, active sampling campaigns were conducted in consecutive periods as shown in
Table 2-5. The percentages of the different wind directions of the total air pumped for each
sampling campaign are also given.
Coated stir bar SPMD Stevenson screen box

Background and Methods
33
Table 2-5: Active sampling campaigns at Haidel: sampling periods and predominant wind directions.
Period Campaign codes
NE (%)
SE (%)
SW (%)
NW (%)
Calm (%)
Time (days)
20.08.03 -16.10.03 A 13.0 11.0 21.1 11.4 43.4 56 16.10.03 -27.01.04 B 13.6 17.1 17.1 13.8 38.3 100 27.01.04 -26.03.04 C 12.0 12.4 21.3 22.8 31.4 57 07.09.04 -26.10.04 E 7.9 13.8 19.0 16.7 42.6 50 26.10.04 -02.02.05 F 8.4 12.8 23.2 21.2 34.4 98 25.08.05 -10.11.05 I 13.8 26.6 11.7 9.6 38.3 78 10.11.05 -17.03.06 K 11.8 9.4 17.0 13.8 48.0 125 17.03.06 -11.07.06 L 7.3 9.7 16.6 15.0 51.4 112
Campaigns D, G and H were lost. Note that the cartridges from campaigns A and E were
collected at the same time as coated stir bars, SPMD and needles. In the following chart the
active sampling campaigns, SPMD and coated stir bars deployment periods and needle
collection are shown (Figure 2-11).
Figure 2-11: Sampling chart at the Bavarian and Bohemian forests. Humus and mineral soil was sampled in October 2004. Extra campaigns of ½ year SPMD
deployment and needle collection were performed in October 2005 and 2006.
2.3.2 Alpine region sites 40 sampling sites (yellow points) were located all along the alpine mountainous chain, out of
which 7 (orange points) were altitude profiles (Figure 2-12).
The altitude profiles had 4 to 8 monitoring points at different heights but at the same
geographical site. The altitude profiles are coded with the country abbreviation prior to the
October 2003 May 2003 October 2004 Time
SPMD and CSB
2 ½, 1 ½ and ½ years of age 2 ½, 1 ½ and ½ years of age Sampling of spruce needles
Campaign A Campaign B
Campaign C Campaign D
Campaign E Campaign F Active sampling
½ year deployment
1 ½ years deployment
Campaign G

Background and Methods
34
sampling site number followed by a subplot number that increases with the altitude. Table 2-6
depicts the codes of the sampling sites of altitude profiles.
More information about the sampling sites is included in the MONARPOP official page:
http://www.monarpop.at.
Figure 2-12: Sampling sites in the Alpine mountain region: MONARPOP project.
In general, the sampling sites were at an average altitude of 1400 m a. s. l. and situated in
dominant spruce stand sites away from contaminant sources. Needles, humus and mineral soil
were collected at all sampling sites. SPMD and low active samplers were employed at the
altitude profiles. The sampling procedures were also given in the above mentioned
MONARPOP official page, to which the interested reader is referred.
Table 2-6: Altitude profiles in the Alps.
Countries Sampling sites: codes and heights (m a.s.l.) Switzerland CH-01-1 CH-01-2 CH-01-3 CH-01-4 CH-01-5 CH-01-6 CH-01-7 CH-01-8
Height (m a.s.l.) 1300 1410 1470 1520 1600 1700 2540 2663
Italy IT-04-1 IT-04-2 IT-04-3 IT-04-4 - - - -
Height (m a.s.l.) 1123 1305 1553 1656 - - - -
Germany DE-21-1 DE-21-2 DE-21-3 DE-21-4 DE-21-5 DE-21-6 - -
Height (m a.s.l.) 830 1030 1230 1450 1650 2650 - -
Germany DE-23-1 DE-23-2 DE-23-3 DE-23-4 - - - -
Height (m a.s.l.) 805 1005 1210 1420 - - - -
Slovenia SI-34-1 SI-34-2 SI-34-3 SI-34-4 - - - -
Height (m a.s.l.) 1194 1354 1532 1638 - - - -
Austria AT-47-1 AT-47-2 AT-47-3 AT-47-4 AT-47-5 AT-47-6 - -
Height (m a.s.l.) 1134 1381 1470 1614 1779 3100 - -

Background and Methods
35
In the text, further details about the samplings are presented only when it is necessary for the
discussion of results.
2.4 Laboratory Procedures
2.4.1 Analytical determinations Sample clean-up and extraction techniques were carried out as documented in the form of
Standard Operation Procedures (SOPs) in the accredited Dioxin Laboratory at the Institute of
Ecological Chemistry in the German Research Center for Environmental Health. The quality
assurance system is accredited according to the norms DIN EN ISO/IEC 17025 (Certificate
DAC-P-0141-01-00). Due to this, these techniques are not described in detail here but briefly
mentioned according to the needs of the present work. The laboratory works with a quality
assurance (QA) and a quality control (QC) system related to the analytical determinations for
the PCCD/F, PCB, PAH and OCP. This means to accomplish blanks of the extraction and
clean-up procedures, to carry out blanks of the analysed matrices, to use standards of
reference, to calibrate the instruments and to perform replicates of samples and blanks, among
others activities.
2.4.1.1 Clean-up procedure The extraction and clean-up procedures for PCDD/F and PCB (Figure 2-13) and for PAH and
OCP (Figure 2-14) are given schematically as well as a short explanation about the performed
steps. To remove interferences, several liquid chromatography steps are carried out
consecutively:
PCDD/F and PCB
Sandwich column: Composed by silica gel, silica gel treated with 44 % H2SO4 and
anhydrous Na2SO4. The objective is to eliminate interfering organic compounds by reactions
of oxidation and sulfuration with sulfuric acid as an oxidant agent. Na2SO4 eliminates possible
water remains from the extraction step. This step also removes 2 to 4 ringed PAH.
Reversible carbon column: This step separates the PCB from the PCDD/F. It is called
reversible because after a first eluting with n-hexane to obtain the PCB fraction, the column is
inverted and upside-down eluted again to get the PCCD/F fraction with toluene. This
separation is based on the different affinity of PCB and PCDD/F for n-hexane.
Solid Phase Extraction (SPE) column: The octadecyl (C18) silica gel is composed of C18
hydrocarbon bounded to the silica gel support. This column retains in the hydrophobic
stationary phase long chain hydrocarbons that can interfere in the posterior analysis.

Background and Methods
36
Figure 2-13: Sample preparation scheme for PCDD/F and PCB. ASE: Accelerated Solvent Extraction. Alumina oxide column: This step is carried out according to Thielen and Olsen (1988). The
basic alumina oxide removes non-polar halogenated aromatics, sulphur compounds and polar
pollutants, among others.
Florisil column: Florisil is magnesium silicate with basic properties. This column eliminates
chlorinated aromatic compounds based on the selection of the correct elution solvent, in this
case, dichloromethane.
PAH and OCP
Mixed column: Composed of an alumina oxide layer and a silica gel layer. This column
eliminates non-polar halogenated aromatics such as PCB and polar contaminants. The silica
layer removes also polar pollutants as well as lipids.
The SPE column was already described for PCDD/F and PCB.
Extraction
Sample Spiked with 13C12-STDs
Cartridges: n-hexane/acetone 3:1 Soxhlet 24 h
SPMD: cyclohexane Shaker 24 h
Needles: cyclohexane Shaker 24 h
Soil: n-hexane/acetone 3:1 ASE 30 min
Sandwich column
Alumina oxide column
Florisil column
Reversible carbon column
SPE C18 column
Concentration N2 stream
Concentration N2 stream
PCB analysis HRGC/HRMS
PCB
PCDD/F
PCDD/F analysis HRGC/HRMS

Background and Methods
37
Figure 2-14: Sample preparation scheme for PAH and OCP.
2.4.1.2 Detection and quantification of POP The analytical determinations of POP are performed by a high-resolution mass spectrometer
(HRMS) Finnigan MAT 95 (Thermo Electron GmbH, Bremen, Germany) coupled with a high
resolution gas chromatograph Agilent GC 5890 (Agilent Technologies, Palo Alto, CA, USA).
The chromatographic separation is achieved by splitless injection (cold injection system CIS3,
Gerstel GmbH, Mülheim, Germany) on different columns (Restek GmbH, Sulzbach,
Germany) depending on the family of compounds analysed. The mass spectrometer is
operated in select ion monitoring (SIM) mode at a resolution of 8000. The two most intense
ions of the molecular ion cluster are monitored for the unlabelled and labelled standard
isomers. The 13C-labelled standards and the deuterated PAH standard mixtures are purchased
from LGC Promochem (Wesel, Germany).
In the case of coated stir bars, POP are desorbed by a thermal desorption unit which is
connected on line with the HRGC/HRMS. This newly developed method is detailed in
Henkelmann et al. (2007).
Extraction
Sample
Cartridges: n-hexane/acetone 3:1 Soxhlet 24 h
SPMD: cyclohexane Shaker 24 h
Needles: cyclohexane Shaker 24 h
Soil: n-hexane/acetone 3:1 ASE 30 min Mixed column
SPE C18 column
Concentration N2 stream
PAH Spiked with 2H-STDs OCP Spiked with 13C12-STDs
PAH and OCP analysis HRGC/HRMS

Background and Methods
38
For the quantification of the analytical results the following parameters have to be considered
(Henkelmann et al., 1996; Oheme, 1998): a) Response factors between the recovery and
internal standards in order to determine the recovery rates for each analysis (recovery rate in
the range of 70-115 %). b) Response ratio between native and the equivalent labelled
compounds (ratio 1 ± 10 %). If these parameters are satisfactory, the laboratory procedures
were carried out successfully.
After this first check, the analysis results are quantified considering the next points: a)
Retention time differences between the analyte and its corresponding standard has to be less
than 3 seconds. b) The measured isotope ratio should not be apart more than ± 15 % of the
theoretical value c) The signal/noise ratio has to be at least in a 3:1 relation. If these
considerations are accomplished, the analytical measurements are adequate, allowing the
quantification of the analysed compounds.
2.4.2 Bioassay determinations As the analytical determinations study each compound individually, they are not
representative of the environmental responses generated by the whole sample. Assays based
on a determined receptor are able to detect all compounds in the sample that exhibit response
to it (Müller, 2002). Due to this, two bioassays considering two different potential effects are
conducted. One is the EROD micro assay used to detect AhR inducers, which are related to
the potential teratogenicity and carcinogenicity of the sample. The other is a yeast estrogen
bioassay to determine estrogenic inducers able to cause functional disorders in reproduction,
development and cell differentiation, among others. In this section, the background and
methods of these two bioassays are explained. The bioassays are carried out in the Laboratory
of Ecotoxicology (security level S1) at the Institute of Ecological Chemistry in the German
Research Center for Environmental Health.
2.4.2.1 EROD micro assay
Proteins such as some of the P450 enzymes are substrate inducible. This process is a
mechanism of protection to eliminate xenobiotics that otherwise would accumulate in the
organism. On the other hand, the enzyme induction for one substrate can cause the increased
metabolism of another existing enzyme (Whitlock, 1999) generating secondary effects. Our
enzyme of interest is the cytochrome P4501A1. The Aryl hydrocarbon Receptor (AhR)
mediates the agonist response having high binding affinity and broad substrate specificity.
This receptor is found in the cytoplasm together with the protein hp90. The receptor binds to
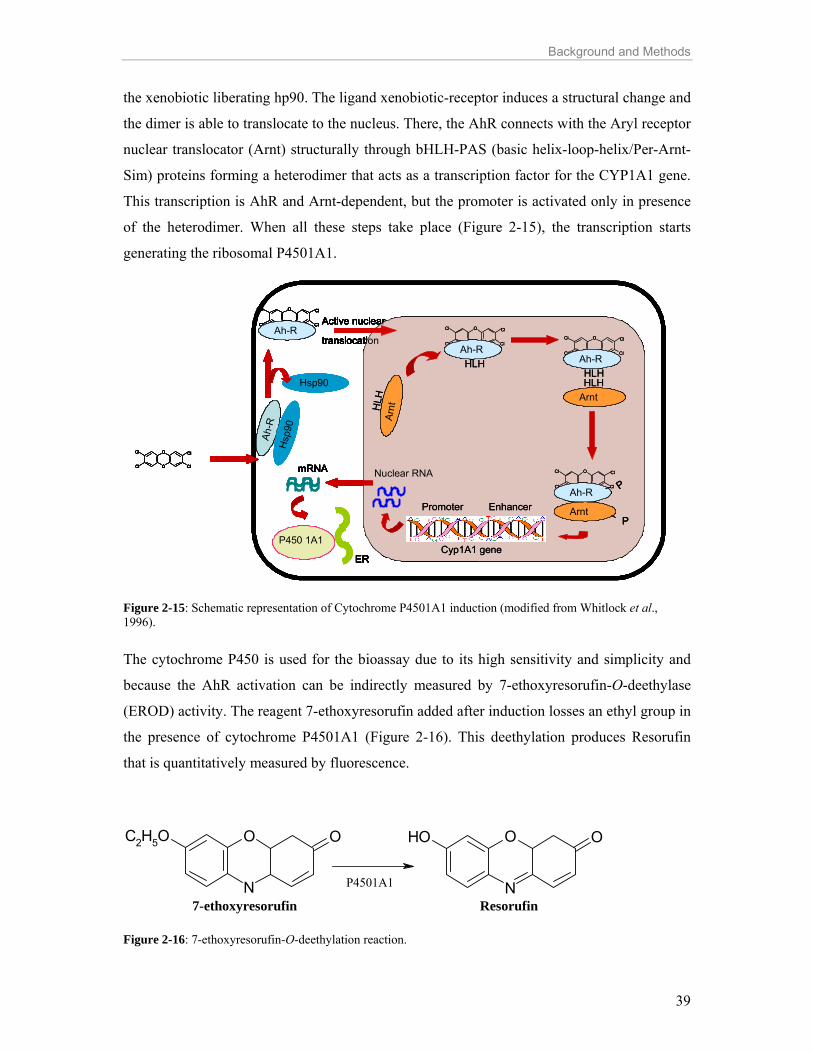
Background and Methods
39
the xenobiotic liberating hp90. The ligand xenobiotic-receptor induces a structural change and
the dimer is able to translocate to the nucleus. There, the AhR connects with the Aryl receptor
nuclear translocator (Arnt) structurally through bHLH-PAS (basic helix-loop-helix/Per-Arnt-
Sim) proteins forming a heterodimer that acts as a transcription factor for the CYP1A1 gene.
This transcription is AhR and Arnt-dependent, but the promoter is activated only in presence
of the heterodimer. When all these steps take place (Figure 2-15), the transcription starts
generating the ribosomal P4501A1.
Figure 2-15: Schematic representation of Cytochrome P4501A1 induction (modified from Whitlock et al., 1996). The cytochrome P450 is used for the bioassay due to its high sensitivity and simplicity and
because the AhR activation can be indirectly measured by 7-ethoxyresorufin-O-deethylase
(EROD) activity. The reagent 7-ethoxyresorufin added after induction losses an ethyl group in
the presence of cytochrome P4501A1 (Figure 2-16). This deethylation produces Resorufin
that is quantitatively measured by fluorescence.
OC2H5O O
N N
O OOH
Figure 2-16: 7-ethoxyresorufin-O-deethylation reaction.
Hsp90
O
OCl
Cl Cl
Cl
O
OCl
Cl Cl
Cl
Ah-R
Ah-R
Hsp
90
Active nuclear
translocation
ArntHLH
O
OCl
Cl Cl
Cl
Ah-RHLH
O
OCl
Cl Cl
Cl
Ah-RHLH
Arnt
O
OCl
Cl Cl
Cl
Ah-R P
PPromoter Enhancer
Cyp1A1 gene
Nuclear RNAmRNA
ER
P450 1A1
ArntH
LH Hsp90
O
OCl
Cl Cl
Cl
O
OCl
Cl Cl
Cl
Ah-R
Ah-R
Hsp
90
Active nuclear
translocation
ArntHLH
O
OCl
Cl Cl
Cl
Ah-RHLH
O
OCl
Cl Cl
Cl
Ah-RHLH
Arnt
O
OCl
Cl Cl
Cl
Ah-R P
PPromoter Enhancer
Cyp1A1 gene
Nuclear RNAmRNA
ER
P450 1A1
ArntH
LH Hsp90
O
OCl
Cl Cl
Cl
O
OCl
Cl Cl
Cl
Ah-R
Ah-R
Hsp
90
Active nuclear
translocation
ArntHLH
O
OCl
Cl Cl
Cl
Ah-RHLH
O
OCl
Cl Cl
Cl
Ah-RHLH
Arnt
O
OCl
Cl Cl
Cl
Ah-R P
PPromoter Enhancer
Cyp1A1 gene
Nuclear RNAmRNA
ER
P450 1A1
ArntH
LH Hsp90
O
OCl
Cl Cl
Cl
O
OCl
Cl Cl
Cl
Ah-R
Ah-R
Hsp
90
Active nuclear
translocation
ArntHLH
O
OCl
Cl Cl
Cl
Ah-RHLH
O
OCl
Cl Cl
Cl
Ah-RHLH
Arnt
O
OCl
Cl Cl
Cl
Ah-R P
PPromoter Enhancer
Cyp1A1 gene
Nuclear RNAmRNA
ER
P450 1A1
ArntH
LH Hsp90
O
OCl
Cl Cl
Cl
O
OCl
Cl Cl
Cl
Ah-R
Ah-R
Hsp
90
Active nuclear
translocation
ArntHLH
O
OCl
Cl Cl
Cl
Ah-RHLH
O
OCl
Cl Cl
Cl
Ah-RHLH
Arnt
O
OCl
Cl Cl
Cl
Ah-R P
PPromoter Enhancer
Cyp1A1 gene
Nuclear RNAmRNA
ER
P450 1A1
ArntH
LH Hsp90
O
OCl
Cl Cl
Cl
O
OCl
Cl Cl
Cl
Ah-R
Ah-R
Hsp
90
Active nuclear
translocation
ArntHLH
O
OCl
Cl Cl
Cl
Ah-RHLH
O
OCl
Cl Cl
Cl
Ah-RHLH
Arnt
O
OCl
Cl Cl
Cl
Ah-R P
PPromoter Enhancer
Cyp1A1 gene
Nuclear RNAmRNA
ER
P450 1A1
ArntH
LH Hsp90
O
OCl
Cl Cl
Cl
O
OCl
Cl Cl
Cl
Ah-R
Ah-R
Hsp
90
Active nuclear
translocation
ArntHLH
O
OCl
Cl Cl
Cl
Ah-RHLH
O
OCl
Cl Cl
Cl
Ah-RHLH
Arnt
O
OCl
Cl Cl
Cl
Ah-R P
PPromoter Enhancer
Cyp1A1 gene
Nuclear RNAmRNA
ER
P450 1A1
Hsp90Hsp90
O
OCl
Cl Cl
Cl
O
OCl
Cl Cl
Cl
Ah-RO
OCl
Cl Cl
Cl
Ah-RAh-R
Ah-R
Hsp
90
Ah-R
Ah-R
Hsp
90H
sp90
Active nuclear
translocation
ArntHLH
ArntArntHLH
O
OCl
Cl Cl
Cl
Ah-RHLH
O
OCl
Cl Cl
Cl
Ah-RO
OCl
Cl Cl
Cl
Ah-RAh-RHLH
O
OCl
Cl Cl
Cl
Ah-RHLH
O
OCl
Cl Cl
Cl
Ah-RO
OCl
Cl Cl
Cl
Ah-RAh-RHLH
Arnt
O
OCl
Cl Cl
Cl
Ah-R P
PArntArnt
O
OCl
Cl Cl
Cl
Ah-RO
OCl
Cl Cl
Cl
Ah-RAh-R PP
PPPromoter Enhancer
Cyp1A1 gene
Promoter Enhancer
Cyp1A1 gene
Nuclear RNAmRNA
ER
P450 1A1P450 1A1
ArntH
LH
Arnt
ArntH
LH
7-ethoxyresorufin Resorufin
P4501A1

Background and Methods
40
TCDD, a potent inductor, is used as the xenobiotic of reference in this bioassay. Planar
aromatic compounds or compounds close to planarity such as PAH, PCB and PCDD/F are
chemicals able to produce a response in this bioassay.
2.4.2.2 Extraction of bio-accumulative compounds The samples were subjected to a pre-treatment, which selected organic bio-accumulative
compounds from the complex mixture. Samples were Soxhlet extracted with 800 ml toluene
for 24 hrs in order to obtain the lipophilic extracts.
2.4.2.3 Clean-up to select persistent compounds The obtained extract was concentrated to 4 ml and then a clean-up step was carried out on a
“sandwich” column. The finality of this column is to eliminate the non persistent compounds
and organic interferences that can either generate cytotoxicity in the EROD bioassay or are
non persistent and polar after treatment with sulphuric acid (Schwirzer et al., 1998).
The column consisted of 10 g active silica gel, 20 g silica gel (44 % H2SO4), 40 g silica gel (4
% H2O), 10 g Na2SO4 from bottom to top. The sample was eluted with 900 ml n-hexane. The
eluate was concentrated and transferred to 200 µl DMSO under N2 stream at 45 °C. The
carrier solvent for the bioassay was a mixture of DMSO/ Isopropanol 4:1 where persistent
bio-accumulative compounds are present.
2.4.2.4 EROD micro bioassay procedure
The rat liver cell line (HII4E) expressing the cytochrome P450 is cultured to perform the
ethoxyresorufin-O-deethylase (EROD) bioassay based on Donato et al. (1993), with
modifications as described in Schwirzer et al. (1998). In brief, H4IIE cells are incubated in
culture flasks at 37°C and 7.5 % CO2. The hepatic cells are trypsinised and then counted
(Neubauer cell counter) and diluted in supplemented medium (DMEM) in order to achieve a
cell concentration of 1x10⁵ cells ml-1. This H4IIE cell suspension is seeded into 96 well plates
and incubated for 24 hours. Following this, the cells are exposed to 2,3,7,8 TCDD standard
concentrations and to the sample extracts for 24 and 72 hours. Blanks are also carried out.
After incubation, the medium is substituted by a 7-Ethoxyresorufin solution 8 µM and the
Resorufin produced is measured by fluorescence (excitation 535 nm, emission 590 nm) after
30 minutes incubation. The protein determination is performed according to Pierce (Micro
BCA Protein Assay Kit). The EROD induction of the sample after incubation is compared to
the 2,3,7,8-TCDD response. The obtained values are interpolated in a dose-response function

Background and Methods
41
regarding TCDD induction. This four parameter logistic function is described by the
minimum value A equal to the limit of quantification, the slope of the curve B, the EC50 value
C and the asymptotic value D representing the ligand efficiency or maximal induction. EC50
(Effect Concentration 50 %) is the concentration that induces a response half of the maximal
possible.
B
CXDADy
⎟⎠⎞
⎜⎝⎛+
−+=
1 4 parameter logistic function
The results are given as toxicity equivalent values (TE values) pg TCDD per g sample. TE
values obtained after 72 hours incubation are related to the persistent compounds in the
sample. TE values obtained after 24 hours incubation are related to all compounds able to
elicit response in the bioassay, thus persistent and non-persistent. In the non-persistent group
are found high molecular weight PAH not eliminated in the clean-up step. TE values are used
to compare toxicities related to a determined mechanism of action. In this case the TE scale
compares compounds and their ability to bind to the AhR. Therefore, the implied substances
are all the dioxin-like compounds, or compounds with planar aromatic structures able to bind
to the AhR.
The bioassay is performed with extracts from the matrices: humus, mineral soil, needles and
SPMD. In needles and SPMD, the response values were below the limit of quantification.
Possible toxicity effects generated by these matrices in the hepatic cell cultures were
controlled performing the resazurin test. This cytotoxicity determination is based on the
ability of intact cells to reduce the resazurin reagent (blue) to resorufin (red). After the EROD
assay the well plates are washed and incubated with resazurin 0.01 % for 1 hour (Schwirzer et
al., 1998). The reduction achieved after incubation is detected by fluorescence in a multi-well
plate reader (LumiCount, SPECTRA Fluor) excitation 550 nm, emission 590 nm. Higher
fluorescence measurement means more intact cells. The fluorescence of the sample is
compared with the fluorescence obtained with untreated cells used as a control sample
(Strotmann et al., 1993).
2.4.2.5 Yeast based estrogenic assay
Estrogenic disrupters are substances that interfere in the structure or function of the endocrine
system and thus, in the hormone regulation machinery. The cytochrome involved in the

Background and Methods
42
hormonal regulation mechanisms tested in the yeast based estrogenic assay is also a protein of
the P450 super family, as the cytochrome involved in the mechanism of xenobiotic
elimination tested in the EROD micro assay. For the yeast based estrogenic assay, the P450
aromatase is the result of the CYP19 gene expression (Simpson et al., 1994). This enzyme is
called aromatase because it creates a phenolic A-ring from 3 ketone A-ring androgens
(aromatization), converting them to the corresponding estrogens. This transformation controls
androgen-estrogen levels in the organism. A hormone misbalance causes disorders at the
structural and functional level in reproduction and development such as, among others, energy
homeostasis (Simpson et al., 2005). Estrogens and compounds that mimic estrogens, like PCB
153, dioxins, dieldrin and p,p´-DDT are able to elicit an estrogenic response (Andersson et al.,
1999, Blair et al., 2000). The mechanism of action is complex and will only be described in
general terms. The ligand binds to the ER, dimerizes and forms a protein complex with an
estrogen responsive element (Shibata et al., 1997). This responsive element, which belongs to
the gene promoter regions, modulates the gene transcription. This mechanism of receptor-
based selectivity allows different tissues producing the same hormones to activate the gene
transcription only under the response of selective receptors (Katzenellenbogen et al., 1996).
The co-activators of the ER, specific of each cellular type, activate the structural changes in
the chromatin (Müller et al., 2002). After chromatin re-modelling, mRNA codes are
transcripted specifically for one protein. This protein later generates an estrogenic effect in the
target issue.
For the yeast based estrogenic assay, a yeast strain (Saccharomyces cerevisiae) expressing the
human estrogen receptor α (hER α) and the enhanced green fluorescent protein (yEGFP) was
used as it is able to generate a response to estrogen exposure. This yeast strain has integrated
the hER α reporter but also the yEGFP reporter in its genome (Bovee et al., 2004a), instead of
the extra-chromosomal expression plasmid presented in other strains (Routledge and Sumpter,
1996). In this way, there is no risk of losing the response of the cell due to the plasmid
elimination. Other advantages are lower incubation time and no need to substrate addition.
However, it is important to remark that the bioassay sensitivity decreases with this new strain
in comparison to the sensitivity achieved with the yeast genetically modified by Routledge
and Sumpter (EC50≈0.6 instead of EC50≈0.2). The use of a yeast strain is convenient due to its
robustness, low cost and lack of endogenous receptors (Breithofer et al., 1998, Bovee et al.,
2004b). The substance used to perform the dose-response curve is 17-ß Estradiol due to its
potent estrogenic activity (Routledge and Sumpter, 1997).

Background and Methods
43
2.4.2.6 Estrogenic bioassay
Extraction and clean-up to select estrogenic substances
Active substances are Soxhlet extracted from the soil with CH2Cl2 for 24 hours. After this, the
sample is concentrated and filtered through Na2SO4 to eliminate possible water remains.
Following this, a solid phase extraction (SPE) to eliminate impurities such as linear
hydrocarbon chains is conducted. The eluate is concentrated in a N2 stream and this enriched
extract is transferred to 200 µl Methanol as final carrier.
Bioassay procedure
The modified yeast strain was a gift from Bovee T. (RIKILT, Institute of Food Safety,
Wageningen University and Research Center, The Netherlands), and the culturing conditions
were followed according to Bovee et al. (2004a). The bioassay was performed as described in
Bovee et al. (2004b; 2005), with some slightly modifications. In brief, aliquots of the bioassay
medium were treated in parallel with 17ß-Estradiol standards and samples in order to keep the
ratio standard/medium and sample/medium at 0.005. The carrier solvent for the 17ß-Estradiol
standards was methanol and the standard curve ranged from 5x10-12 to 2x10⁻⁹ M. 96 well
plates, containing standards and samples, were incubated at 30°C, 225 rpm for 15 hours or
until reaching the maximal answer in the 17ß-Estradiol standard curve. Solvent blanks with
bioassay medium were also included in all 96 well plates. Fluorescence was measured at 535
nm (excitation 485 nm) in a luminescence multi-well plate reader (LumiCount, SPECTRA
Fluor). The fluorescence signals were corrected with the blank medium values obtained at the
measurement time. Samples, standards and blanks were performed in quadruplicates. From
these quadruplicates, the mean value of the 3 with lower standard deviation among the 4
responses was taken as the final bioassay response. The corresponding estrogenic values were
calculated using the 17ß-Estradiol dose-response curve (4 parameter logistic function).
Validation: Inter-laboratory
This bioassay was implemented in the Laboratory of Ecotoxicology at the Institute of
Ecological Chemistry while this work was in progress. Thus, the quality and standardization
of the new bioassay had to be controlled. To achieve this, the laboratory participated in the
inter-laboratory “Screening Methods for Water Data Information in Support of the
Implementation of the Water Framework Directive (SWIFT-WFD)” supported by the
European Union. 6 batches of 11 unknown samples each were screened consecutively.
Results were calculated and sent for evaluation by the organizing commission. 7 laboratories
from 5 European countries took part in this inter-laboratory. The agreement between

Background and Methods
44
analytical and bioassay results was also determined as a control by the inter-laboratory
commission. The analytical determination is described in Días-Cruz et al. (2003) and the
clean-up and extraction of the samples was performed according to Céspedes et al. (2004).
The values obtained at the laboratory of Ecotoxicology at the German Research Center for
Environmental Health proved to be accurate. The inter-laboratory results were reported
internally in the SWIFT deliverable D23: Inter-comparison of estrogenicity in water
determined by yeast-based bioassays. More information is given in Section 3.7.2.
Validation: Comparison of two measurement methods
As a second quality step, the bioassay response was measured by two methods: fluorescence
at the plate reader (classical method) and by flow cytometry. The fluorescence measurement
gives the response per well, so homogeneity and the same cell amount per well are necessary
to achieve accuracy and comparable measurements among wells. The second measurement
gives a specific fluorescence answer that represents the response per amount of counted cells.
The flow cytometry measurements were carried out at the Institute of Toxicology by Dr.
Wolfgang Beisker in the German Research Center for Environmental Health.
With this measurement, it is also possible to differentiate between inducted and non-inducted
cells. In this way, the capability of response of the yeast strain can be assessed. To achieve
this, three substances known for their strong binding affinity (17ß-Estradiol, Diethylstilbestrol
and 17α-Ethynylestradiol) were evaluated at different induction doses for the two
measurement techniques (Figure 2-17). Diethylstilbestrol is a teratogenicity synthetic estrogen
and 17α-ethynylestradiol is a potent endocrine modulator used broadly as an oral
contraceptive. In Section 3.7.3, the obtained measurements are analyzed.
OH
H
H
OH
H
OH
H
HH
OH OH
OH
Diethylstilbestrol17ß-Estradiol
17a-Ethynylestradiol
Figure 2-17: Molecular structures of 17 ß-Estradiol, Diethylstilbestrol and 17α-Ethynylestradiol.
17α-Ethynylestradiol
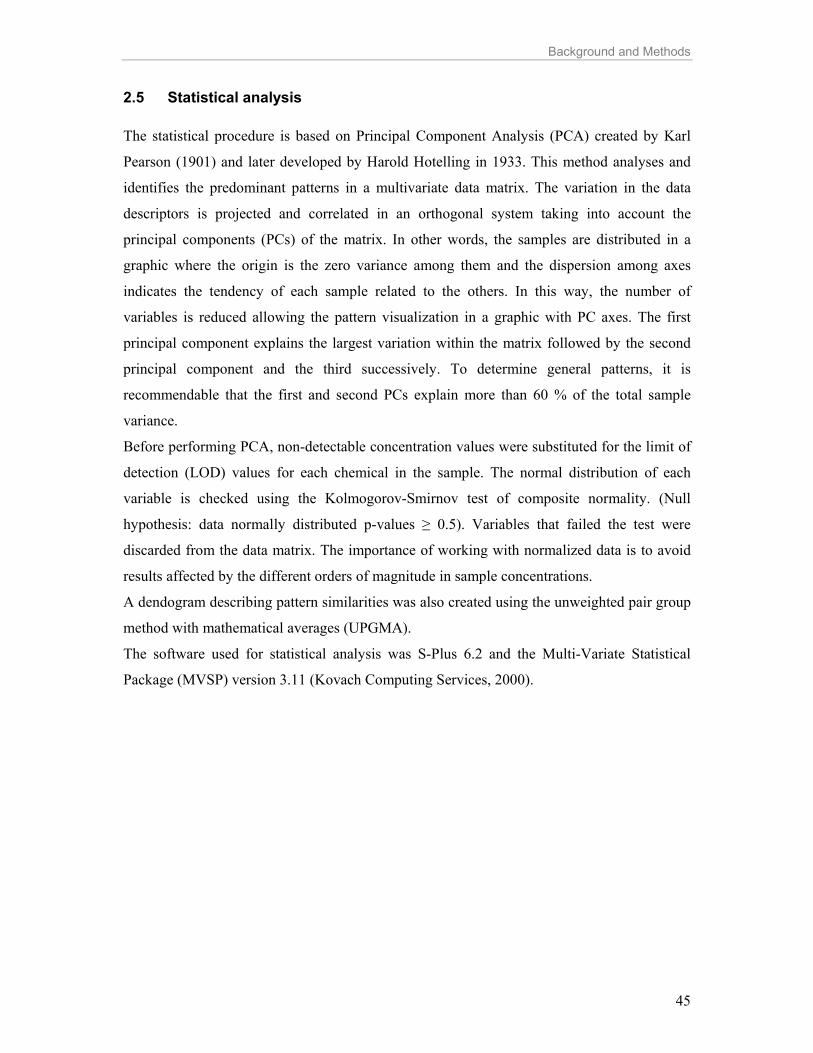
Background and Methods
45
2.5 Statistical analysis The statistical procedure is based on Principal Component Analysis (PCA) created by Karl
Pearson (1901) and later developed by Harold Hotelling in 1933. This method analyses and
identifies the predominant patterns in a multivariate data matrix. The variation in the data
descriptors is projected and correlated in an orthogonal system taking into account the
principal components (PCs) of the matrix. In other words, the samples are distributed in a
graphic where the origin is the zero variance among them and the dispersion among axes
indicates the tendency of each sample related to the others. In this way, the number of
variables is reduced allowing the pattern visualization in a graphic with PC axes. The first
principal component explains the largest variation within the matrix followed by the second
principal component and the third successively. To determine general patterns, it is
recommendable that the first and second PCs explain more than 60 % of the total sample
variance.
Before performing PCA, non-detectable concentration values were substituted for the limit of
detection (LOD) values for each chemical in the sample. The normal distribution of each
variable is checked using the Kolmogorov-Smirnov test of composite normality. (Null
hypothesis: data normally distributed p-values ≥ 0.5). Variables that failed the test were
discarded from the data matrix. The importance of working with normalized data is to avoid
results affected by the different orders of magnitude in sample concentrations.
A dendogram describing pattern similarities was also created using the unweighted pair group
method with mathematical averages (UPGMA).
The software used for statistical analysis was S-Plus 6.2 and the Multi-Variate Statistical
Package (MVSP) version 3.11 (Kovach Computing Services, 2000).

Results and Discussion
46
3. RESULTS AND DISCUSSION 3.1 OCP in the Bavarian and Bohemian forests
3.1.1 Air concentrations All compounds were detected in the active sampler, except for mirex, methoxychlor, ε-HCH
and trans-HCE. Correlations between the compounds showed relationships within each
family. PeCB and HCB correlated with r2 =0.95. PeCB is an impurity in the HCB industrial
production and formation. Furthermore, HCB degrades as an intermediate compound to PeCB
by dechlorination which could be the reason for the high correlation between them in air
besides other matrices. The PeCB concentrations approximately amounted to half of the HCB
concentrations in all the sampling periods, averaging 33 pg m-3 for PeCB and 67 pg m-3 for
HCB. This is concordant with continental average concentrations for these two compounds
(PeCB 45 pg m-3 and HCB 89 pg m-3) obtained by Shen et al. (2005) in the North American
atmosphere. The compound HCB was characterized by the highest air concentrations within
this group of chemicals.
α-HCH and γ-HCH were well correlated (r2 =0.90). The α- and γ- isomers were present in
concentrations 50 and 100 times higher than the β-HCH, respectively. δ-HCH was not always
detected or detected close to the limit of detection with values around 0.15 pg m-3. The
dominant γ-HCH isomer varied between 11 and 34 pg m-3 without clear seasonal tendency but
higher seasonal variability than α-HCH. This trend could also be observed in other studies
(Motelay-Massei et al., 2005).
Additionally, correlations among chemical families, namely HCH isomers and cyclodiene
pesticides were also found: α- and γ-HCH with cis-HCE (r2=0.87 and r2=0.94, respectively).
Dieldrin and α-Endosulfan correlated with r2=0.86. The correlations among compounds of
different families could be related to the origin of the contamination. Long-range transport
contaminants coming along with the air mass fluxes cause the fluctuations for compounds of
similar physicochemical properties to correlate well. Endosulfan is an insecticide and timber
preservative of common use in the Mediterranean area and thus showed also high
concentrations in the air. In particular, α-Endosulfan with an average value of 28 pg m-3
showed high fluctuations between campaigns from 8.6 to 43.4 pg m-3. Endosulfan is
employed seasonally during spring time. Thus, concentration variations caused by its episodic
application are expected.
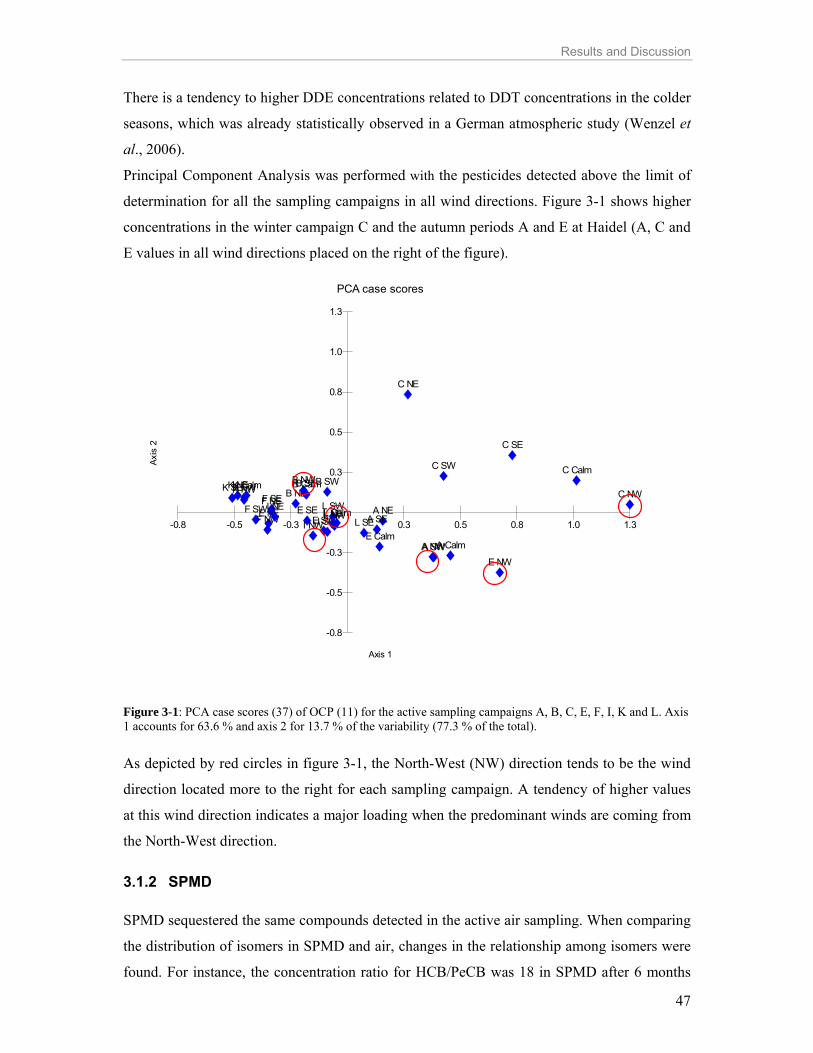
Results and Discussion
47
There is a tendency to higher DDE concentrations related to DDT concentrations in the colder
seasons, which was already statistically observed in a German atmospheric study (Wenzel et
al., 2006).
Principal Component Analysis was performed with the pesticides detected above the limit of
determination for all the sampling campaigns in all wind directions. Figure 3-1 shows higher
concentrations in the winter campaign C and the autumn periods A and E at Haidel (A, C and
E values in all wind directions placed on the right of the figure).
PCA case scores
Axis
2
Axis 1
A NEA SE
A SWA NWA Calm
B NEB SEB SWB NWB Calm
C NE
C SE
C SW
C NW
C Calm
E NE E SEE SW
E NW
E Calm
F NEF SEF SW
F NWI NE
I SWI NW
K NEK SEK SWK NWK Calm
L NEL SE
L SWL NWL Calm
-0.3
-0.5
-0.8
0.3
0.5
0.8
1.0
1.3
-0.3-0.5-0.8 0.3 0.5 0.8 1.0 1.3
Figure 3-1: PCA case scores (37) of OCP (11) for the active sampling campaigns A, B, C, E, F, I, K and L. Axis 1 accounts for 63.6 % and axis 2 for 13.7 % of the variability (77.3 % of the total). As depicted by red circles in figure 3-1, the North-West (NW) direction tends to be the wind
direction located more to the right for each sampling campaign. A tendency of higher values
at this wind direction indicates a major loading when the predominant winds are coming from
the North-West direction.
3.1.2 SPMD SPMD sequestered the same compounds detected in the active air sampling. When comparing
the distribution of isomers in SPMD and air, changes in the relationship among isomers were
found. For instance, the concentration ratio for HCB/PeCB was 18 in SPMD after 6 months

Results and Discussion
48
exposure, whereas this ratio was around 2 in cartridges of the active sampling. The different
compound distribution obtained in the active and passive samplers point out the uptake
“selectivity” of the SPMD whereas the active sampler reflects the air concentrations. The
passive sampler sequestered more HCB than PeCB, the first with a Koa value of one order of
magnitude higher than PeCB (8.09 and 7.19, respectively). Furthermore, the HCH isomers
also exhibited changes in their concentration distribution. The highest concentrations were
detected for the γ-HCH isomer. γ-HCH accumulated 3 times more than α-HCH in SPMD of ½
year deployment, whereas it was only two times more for active sampling. Additionally, the
ratio γ-HCH/ β-HCH averaged 24. Taking into account that β-HCH is 100 times less
concentrated in air than γ-HCH, β-HCH has a better uptake by the SPMD than the γ-HCH
isomer. HCH isomers represent different hydrophilic characteristics, β-HCH being much
more hydrophobic than α- and γ-isomers (Quintero et al., 2005). This is indicated by the Koa
of this compounds being, 8.39, 10.06 and 8.67 for the α-, β- and γ-isomers, respectively. As a
consequence, this explains the higher SPMD uptake of β-HCH compared to α,γ-HCH
isomers, besides other factors such as the absence of axial chlorines. It is also worth to
mention that β-HCH does not only present a better uptake in SPMD but that the bio
concentration factor (BCF) in human fat for β-HCH is also similar, being more than 25 times
higher than the BCF for the α,γ-HCH isomers (Willett et al., 1998). This is concordant with
the fact that SPMD mimic biological membranes.
Analysing the compound uptake after 1 ½ years, a change in the relationship between
compounds can be observed again. Not only the compound lipophilicity but also the exposure
time is a key factor for the uptake kinetics. Figure 3-2 shows the concentrations for the two
different exposure periods. Aldrin and HC were close to the limit of detection after 1/2 year
exposure, whereas after 1 ½ years exposure, low concentrations were detected in SPMD. For
these compounds exhibited in low air concentrations long deployment periods are advisable
for proper detection and monitoring. In contrast, PeCB and HCB decreased in their SPMD
concentrations after the longer exposure period. The concentrations in air for PeCB and HCB
were 26.4 and 65.8 pg m-3 in the campaign A (coincident with the end of ½ year SPMD
deployment) decreasing to 24.0 and 40.3 pg m-3 in the campaign E (coincident with the end of
1 ½ year SPMD deployment), respectively. Therefore, long deployments to determine PeCB
and HCB are not advisable if a linear integrative uptake is desiderable. As a consequence, in
order to determine the adequate deployment period and thus, real air concentrations using
SPMD, it is necessary to know the current uptake stage for each compound (Bartkow et al.,
2005).

Results and Discussion
49
0
2000
4000
6000
8000
10000
12000
a-HCH b-HCH g-HCH d-HCH PeCB HCB PCAS OCS
Con
cent
ratio
n (p
g/SP
MD
)
H 1/2 B 1/2 R 1/2 M 1/2 B 1 1/2 R 1 1/2 M 1 1/2
0
500
1000
1500
2000
2500
3000
3500
4000
trans-CHL cis-CHL oxy-CHL HC cis-HCE Aldrin Dieldrin Mirex
Con
cent
ratio
n (p
g/SP
MD
)
H 1/2 B 1/2 R 1/2 M 1/2 B 1 1/2 R 1 1/2 M 1 1/2
0
2000
4000
6000
8000
10000
12000
p, p’-DDT o, p’-DDT p, p’-DDD o, p’-DDD p, p’-DDE o, p’-DDE
Con
cent
ratio
n (p
g/SP
MD
)
H 1/2 B 1/2 R 1/2 M 1/2 B 1 1/2 R 1 1/2 M 1 1/2
Figure 3-2: Concentrations in SPMD after ½ year at 4 sites (n=2) and 1 ½ years (n=2) exposure at 3 sites. a) HCH isomers, OCA, PCAS, PeCB and HCB b) Chlorinated pesticides c) DDT family. H: Haidel, B: Boubin, R: Ruckowitzschachten and M: Mitterfels. ½ : ½ year deployment 1 ½: 1 ½ year deployment.
a)
c)
b)
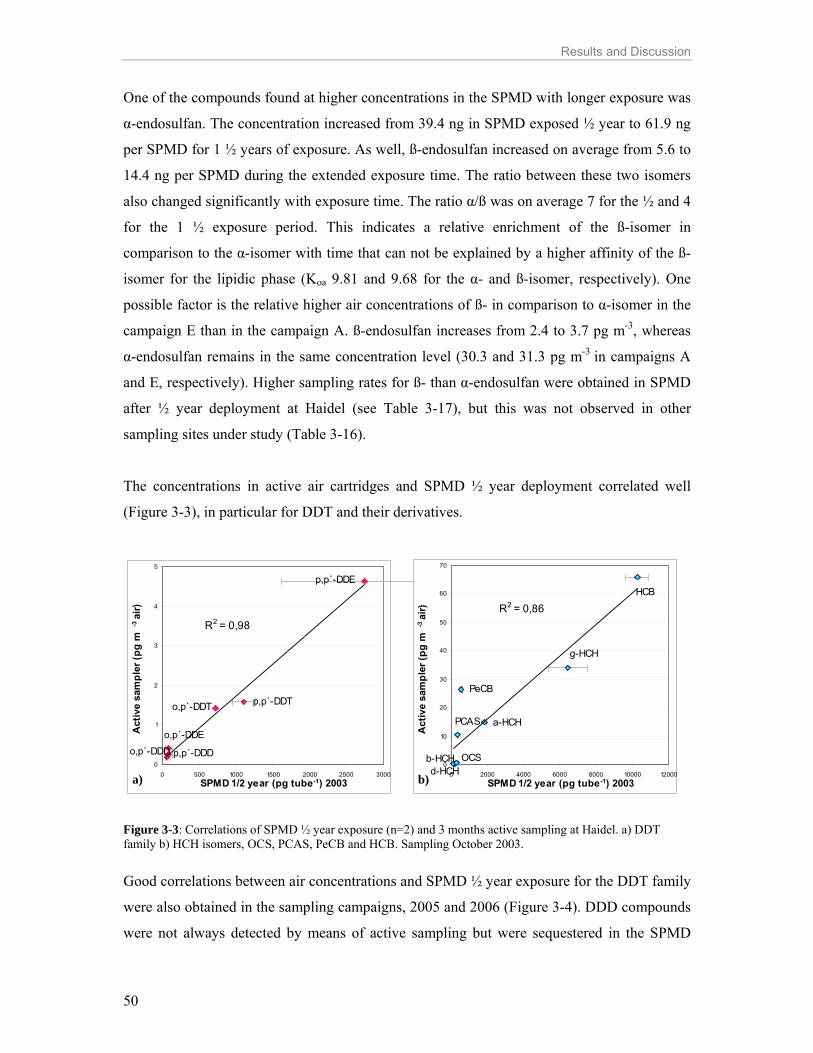
Results and Discussion
50
One of the compounds found at higher concentrations in the SPMD with longer exposure was
α-endosulfan. The concentration increased from 39.4 ng in SPMD exposed ½ year to 61.9 ng
per SPMD for 1 ½ years of exposure. As well, ß-endosulfan increased on average from 5.6 to
14.4 ng per SPMD during the extended exposure time. The ratio between these two isomers
also changed significantly with exposure time. The ratio α/ß was on average 7 for the ½ and 4
for the 1 ½ exposure period. This indicates a relative enrichment of the ß-isomer in
comparison to the α-isomer with time that can not be explained by a higher affinity of the ß-
isomer for the lipidic phase (Koa 9.81 and 9.68 for the α- and ß-isomer, respectively). One
possible factor is the relative higher air concentrations of ß- in comparison to α-isomer in the
campaign E than in the campaign A. ß-endosulfan increases from 2.4 to 3.7 pg m-3, whereas
α-endosulfan remains in the same concentration level (30.3 and 31.3 pg m-3 in campaigns A
and E, respectively). Higher sampling rates for ß- than α-endosulfan were obtained in SPMD
after ½ year deployment at Haidel (see Table 3-17), but this was not observed in other
sampling sites under study (Table 3-16).
The concentrations in active air cartridges and SPMD ½ year deployment correlated well
(Figure 3-3), in particular for DDT and their derivatives.
p,p´-DDD
p,p´-DDE
o,p´-DDE
o,p´-DDT p,p´-DDT
o,p´-DDD
R2 = 0,98
0
1
2
3
4
5
0 500 1000 1500 2000 2500 3000SPMD 1/2 year (pg tube-1) 2003
Act
ive
sam
pler
(pg
m-3
air)
HCB
a-HCHPCAS
OCSd-HCH
b-HCH
PeCB
g-HCH
R2 = 0,86
0
10
20
30
40
50
60
70
0 2000 4000 6000 8000 10000 12000SPMD 1/2 year (pg tube-1) 2003
Act
ive
sam
pler
(pg
m-3
air)
Figure 3-3: Correlations of SPMD ½ year exposure (n=2) and 3 months active sampling at Haidel. a) DDT family b) HCH isomers, OCS, PCAS, PeCB and HCB. Sampling October 2003. Good correlations between air concentrations and SPMD ½ year exposure for the DDT family
were also obtained in the sampling campaigns, 2005 and 2006 (Figure 3-4). DDD compounds
were not always detected by means of active sampling but were sequestered in the SPMD
a) b)
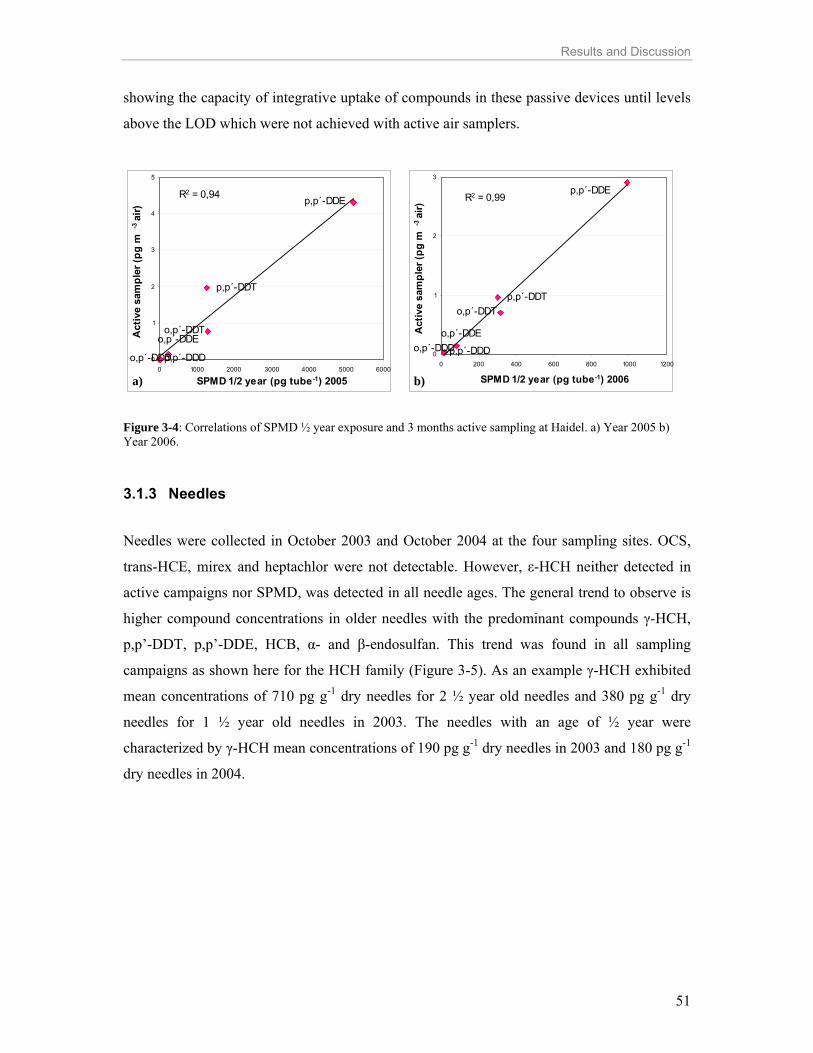
Results and Discussion
51
showing the capacity of integrative uptake of compounds in these passive devices until levels
above the LOD which were not achieved with active air samplers.
o,p´-DDD
p,p´-DDT
o,p´-DDTo,p´-DDE
p,p´-DDE
p,p´-DDD
R2 = 0,94
0
1
2
3
4
5
0 1000 2000 3000 4000 5000 6000
SPMD 1/2 year (pg tube-1) 2005
Act
ive
sam
pler
(pg
m-3
air)
p,p´-DDD
p,p´-DDE
o,p´-DDE
o,p´-DDTp,p´-DDT
o,p´-DDD
R2 = 0,99
0
1
2
3
0 200 400 600 800 1000 1200
SPMD 1/2 year (pg tube-1) 2006
Act
ive
sam
pler
(pg
m-3
air)
Figure 3-4: Correlations of SPMD ½ year exposure and 3 months active sampling at Haidel. a) Year 2005 b) Year 2006.
3.1.3 Needles
Needles were collected in October 2003 and October 2004 at the four sampling sites. OCS,
trans-HCE, mirex and heptachlor were not detectable. However, ε-HCH neither detected in
active campaigns nor SPMD, was detected in all needle ages. The general trend to observe is
higher compound concentrations in older needles with the predominant compounds γ-HCH,
p,p’-DDT, p,p’-DDE, HCB, α- and β-endosulfan. This trend was found in all sampling
campaigns as shown here for the HCH family (Figure 3-5). As an example γ-HCH exhibited
mean concentrations of 710 pg g-1 dry needles for 2 ½ year old needles and 380 pg g-1 dry
needles for 1 ½ year old needles in 2003. The needles with an age of ½ year were
characterized by γ-HCH mean concentrations of 190 pg g-1 dry needles in 2003 and 180 pg g-1
dry needles in 2004.
a) b)

Results and Discussion
52
0
150
300
450
600
750
900
a-HCH b-HCH g-HCH d-HCH e-HCHHCH isomers
Con
cent
ratio
n (p
g g
-1 d
ry n
eedl
es) H 0.5
B 0.5
R 0.5
M 0.5
0
150
300
450
600
750
900
a-HCH b-HCH g-HCH d-HCH e-HCH
HCH isomers
Con
cent
ratio
n (p
g g
-1 d
ry n
eedl
es) H 1.5
B 1.5
R 1.5
M 1.5
0
150
300
450
600
750
900
a-HCH b-HCH g-HCH d-HCH e-HCHHCH isomers
Con
cent
ratio
n (p
g g
-1 d
ry n
eedl
es) H 2.5
B 2.5
R 2.5
M 2.5
Figure 3-5: HCH isomer concentrations (pg g-1 dry weight needles) in a) needles ½ year b) needles 1 ½ years and c) 2 ½ years of age at 4 sampling sites in 2003. H: Haidel, B: Boubin, R: Ruckowitzschachten, M: Mitterfels, 0.5: ½ year, 1.5: 1 ½ years and 2.5: 2 ½ years old needles. The pattern among compounds was the same in the different years and ½ year old needles in
Mitterfels showed a tendency to higher pesticide concentrations when compared to the other
sampling sites (Figure 3-6). In contrast, SPMD accumulation at Mitterfels was lower for the
DDT family (Figure 3-2c) than at the other sampling sites. DDT distributed in the atmosphere
at continental scale, exhibit different concentrations at these remote sampling sites (even to 5
times in concentration as seen in figure 3-6). If it is assumed no recent use of DDT, these
concentration differences indicate the influence of the local conditions in the needle uptake
not allowing a “standard needle matrix” among the different sampling sites. However, the
recent use of DDT cannot be discarded due to historical facts that indicate the use of DDT at
regional level. On the other hand, errors inherent to the laboratory procedures should not be
disregarded. In conclusion, sample repetitions are necessary to confirm these findings.
a) b)
c)

Results and Discussion
53
Nevertheless, needles are a useful qualitative tool for detecting atmospheric contaminants and
estimating their distribution and patterns.
0
50
100
150
200
250
300
350
400
H 0.5 B 0.5 R 0.5 M 0.5 H 0.5 B 0.5 R 0.5 M 0.5 H 0.5
2003 2004 2005Sampling years
Con
cent
ratio
n (p
g g
-1 d
ry n
eedl
es) HCB PCAS p, p’-DDT g-HCH
Figure 3-6: HCB, PCAS, p,p´-DDT and γ-HCH concentrations (pg g-1 dry needles) in needles ½ year of age at 4 sampling sites. H: Haidel, B: Boubin, R: Ruckowitzschachten, M: Mitterfels.
Organochlorine accumulation in needles did correlate neither with the active sampling nor
with SPMD uptakes.
3.1.4 Soil Comparing concentrations in humus and mineral soil, humus presents a higher accumulation
of OCP due to higher amounts of organic matter (Table 3-1). High amounts of organic content
are observed in the soil defined as a mineral soil. This is due to the non-classical type of soil
sampling described in Section 2.2.3. The mineral soil is defined as the layer sampled after
removing the forest humus until 10 cm depth below the humus soil but not beyond this depth,
implying in some cases higher amounts of organic matter when not all the mineral soil profile
was sampled. This is observed for the B and R mineral soil (samples with high organic
content). Organochlorine compounds are hydrophobic and are attracted to the organic matter
where they are accumulated. This effect is even more important in forest soils characterised
by high amounts of organic matter (Wania and McLachlan, 2001). Due to this, the OCP
amounts normalised to the organic content were calculated to achieve a better comparison
among sampling sites (Table 3-1).

Results and Discussion
54
Boubin and Ruckowitzschachten presented more than twice the pesticide accumulation in
their humus layer than in the mineral layer, whereas Haidel and Mitterfels showed 7 and 14
times more, respectively. This is related to the organic carbon content differences.
Table 3-1: Organic carbon content (%), total OCP concentration (pg g-1 dry soil) and OCP normalized (ng g-1 organic carbon content) in humus and mineral soil at 4 sampling sites.
Sample code Soil type Organic carbon content (%)
OCP (pg g-1)
OCP normalized (ng g-1
organic carbon content ) Boubin mineral 34.5 33656 98 Haidel mineral 7.6 7222 95
Ruckowitzschachten mineral 12.1 19467 161 Mitterfels mineral 7.2 3618 50 Boubin humus 46.4 72139 155 Haidel humus 41.4 53827 130
Ruckowitzschachten humus 30.3 44870 148 Mitterfels humus 45.0 52763 117
The lower ratio humus/mineral soil due to a higher mean concentration in the mineral layer in
Ruckowitzschachten could be seen as an indicator of a higher load of contaminants in the
past. In addition, the higher organic content of Boubin in comparison to the other mineral
soils is in agreement with the higher accumulations obtained. Differences in soil texture may
have had influence on the different ratios obtained for OCP in the mineral and humus soils at
Mitterfels (silt loamy and loamy sand textures) in comparison to the other sampling sites
(sandy loam and silt loam textures).
All the compounds analysed were detected in the soils, including mirex and trans-HCE,
neither detected in needles nor in active campaigns. p,p´-DDT, o,p´-DDT and p,p´-DDE,
represented on average more than 74 % of the total pesticides in mineral soil and 67 % in the
humus soil. Analysing the DDT compounds in detail, p,p´-DDT was on average 50 % and 60
% of the total DDT family in the mineral and humus soil, respectively. o,p´-DDT remained
without significant changes in both types of soil at 12 % of the total DDT compounds. p,p´-
DDE, the main degradation product of DDT, was around 37 % (mineral soil) and 27 %
(humus soil). o,p´-DDE was only found as a minor component in the mineral soil. Taking into
consideration that the technical mixture contains approximately 77 % of p,p´-DDT and 15 %
of o,p´-DDT, a decrease in the p,p´-DDT percentage in the soil related to the original mixture
was observed (77 % to 50-60 %). This decrease was not so clear for the o,p´-DDT compound
which decreased from 15 % (technical mixture) to 12 % (soil). In addition, the ratio
ΣDDT/ΣDDE averaged 1.7 in mineral soil and 2.9 in the humus soil. This indicates the higher

Results and Discussion
55
DDT depletion in the mineral than in the humus soil. One possible reason for the higher ratio
ΣDDT/ΣDDE in the humus soil is the higher DDT concentrations that can auto-inhibit the
DDT biodegradation processes (Pereira et al., 1996). Other possibility is recent DDT input
due to its use as a pesticide in the region. Relatively high amounts of DDT in relation to its
metabolites were found in this study in comparison to other studies (Minh et al., 2006). The
almost negligible amounts of DDD isomers could be related to the type of degradation
pathway that DDT undergoes. The formation of DDD metabolites is favoured under anaerobic
conditions, and DDD is almost not present in the superficial oxygenated organic layer and
exhibit low concentrations in the mineral soil (Heberer and Dünnbier, 1999). On the other
hand, it has to be considered that DDD metabolites are not as persistent as DDE metabolites
under aerobic conditions.
Despite the ban on DDT since the end of the 1980s in Western Germany, DDT values are
considerably high. DDT mean values in mountainous agricultural areas in China are ΣDDT
9.46 ng g-1dry weight (Wang et al., 2006) and with long term DDT usage are ΣDDT 56.0 ng
g-1dry weight (Gong et al., 2004), whereas in the German-Czech forested areas the mean
value in mineral soils is ΣDDT 12.9 ng g-1 dry weight. ΣDDT represents the sum of the six
metabolites. In the humus soil the mean value is even higher: 118.2 ng g-1 dry weight. This
can be related to stronger pesticide adsorption to organic particles in this layer and thus less
bioavailability. It is important to remark that DDT import was allowed until 2001 in the
Czech Republic (PAN Pesticide Database). This could be a possible recent DDT input source
to the mountain forest ecosystem, but also long-range atmospheric transport in the past from
other areas like the former German Democratic Republic can not be excluded. Studies in the
Czech Republic conducted by Kosubová et al. (2005), in a forest soil close to the Czech site
Boubin showed a ΣDDT concentration of 61.4 ng g-1 which agrees to the higher amounts
detected in the context of this work in Boubin (ΣDDT 27.7 ng g-1 dry weight). Boubin
exhibited the highest DDT loadings, followed by Ruckowitzschachten, a site located at the
central mountainous crest between Germany and the Czech Republic. The lower loaded
sampling sites are located at the western side of the mountainous barrier, on the German side.
The other major components detected in soil were dieldrin, HCB and γ-HCH. γ-HCH
decreased on average from 8 % in organic soil to 2 % in mineral soil. In the case of β-HCH,
the percentage decrease observed was from 3 % (humus soil) to 1.4 % (mineral soil). Studies
in soils have shown a higher biodegradation of α- and γ- isomers than for the β-isomer
(Quintero et al., 2005). This could explain the similar γ- and β-HCH accumulation in mineral
soils in spite of the lower air concentrations of β-HCH. The mean γ-HCH/α-HCH ratio was
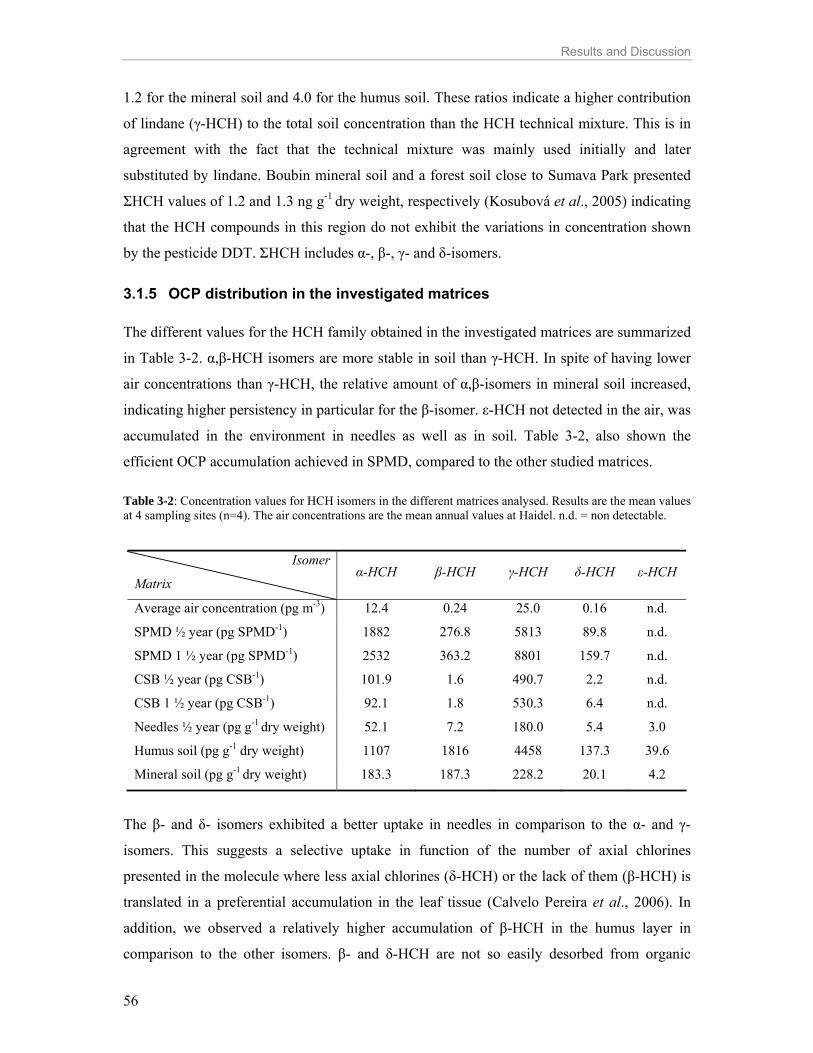
Results and Discussion
56
1.2 for the mineral soil and 4.0 for the humus soil. These ratios indicate a higher contribution
of lindane (γ-HCH) to the total soil concentration than the HCH technical mixture. This is in
agreement with the fact that the technical mixture was mainly used initially and later
substituted by lindane. Boubin mineral soil and a forest soil close to Sumava Park presented
ΣHCH values of 1.2 and 1.3 ng g-1 dry weight, respectively (Kosubová et al., 2005) indicating
that the HCH compounds in this region do not exhibit the variations in concentration shown
by the pesticide DDT. ΣHCH includes α-, β-, γ- and δ-isomers.
3.1.5 OCP distribution in the investigated matrices The different values for the HCH family obtained in the investigated matrices are summarized
in Table 3-2. α,β-HCH isomers are more stable in soil than γ-HCH. In spite of having lower
air concentrations than γ-HCH, the relative amount of α,β-isomers in mineral soil increased,
indicating higher persistency in particular for the β-isomer. ε-HCH not detected in the air, was
accumulated in the environment in needles as well as in soil. Table 3-2, also shown the
efficient OCP accumulation achieved in SPMD, compared to the other studied matrices.
Table 3-2: Concentration values for HCH isomers in the different matrices analysed. Results are the mean values at 4 sampling sites (n=4). The air concentrations are the mean annual values at Haidel. n.d. = non detectable.
Isomer
Matrix α-HCH β-HCH γ-HCH δ-HCH ε-HCH
Average air concentration (pg m-3) 12.4 0.24 25.0 0.16 n.d.
SPMD ½ year (pg SPMD-1) 1882 276.8 5813 89.8 n.d.
SPMD 1 ½ year (pg SPMD-1) 2532 363.2 8801 159.7 n.d.
CSB ½ year (pg CSB-1) 101.9 1.6 490.7 2.2 n.d.
CSB 1 ½ year (pg CSB-1) 92.1 1.8 530.3 6.4 n.d.
Needles ½ year (pg g-1 dry weight) 52.1 7.2 180.0 5.4 3.0
Humus soil (pg g-1 dry weight) 1107 1816 4458 137.3 39.6
Mineral soil (pg g-1 dry weight) 183.3 187.3 228.2 20.1 4.2
The β- and δ- isomers exhibited a better uptake in needles in comparison to the α- and γ-
isomers. This suggests a selective uptake in function of the number of axial chlorines
presented in the molecule where less axial chlorines (δ-HCH) or the lack of them (β-HCH) is
translated in a preferential accumulation in the leaf tissue (Calvelo Pereira et al., 2006). In
addition, we observed a relatively higher accumulation of β-HCH in the humus layer in
comparison to the other isomers. β- and δ-HCH are not so easily desorbed from organic

Results and Discussion
57
matter as α- and γ-HCH (Quintero et al., 2005). This can cause less availability in this layer to
undergo degradation. The isomer ratios changed significantly depending on the matrix
analysed, but some similarities were found between the passive samplers, needles and SPMD
(Table 3-3). In both of them diffusion processes are involved.
The β-HCH is more easily accumulated in SPMD than the other isomers. This is caused by its
Koa, the highest among isomers. In contrast, CSB display more affinity for the γ-HCH than for
the β-HCH such as determined by the γ-HCH/β-HCH ratio in table 3-3. It is possible that
higher air concentrations, implying a higher concentration gradient for the mass transfer in
coated bars, influence positively in the uptake. This assumption could be valid if the coated
bar is still acting as an infinite sink.
Table 3-3: Isomer ratios related to the γ-HCH isomer at the different matrices.
Ratio related to γ-HCH
Matrix γ-HCH/
α-HCH
γ-HCH/
β-HCH
γ-HCH/
δ-HCH
γ-HCH/
ε-HCH
Air 2.0 104.2 156.3 -
SPMD ½ year 3.1 21.0 64.7 -
SPMD 1 ½ year 3.5 24.2 55.1 -
CSB ½ year 4.8 300 226 -
CSB 1 ½ year 5.8 290 82 -
Needles ½ year 3.5 25.0 33.4 60.2
Humus soil 4.0 2.5 32.5 112.6
Mineral soil 1.2 1.2 11.4 54.8
HCB is almost exclusively found in the gas phase. Its particle association is estimated to be
less than 30 % at -10 °C (Shoeib and Harner, 2001). The mean annual value at the Bavarian
Forest 67.4 pg m-3 is concordant with average air concentrations for the north hemisphere (89
pg m-3). Thus, these values are related to global spreading values for HCB in the Northern
hemisphere. HCB is very stable, not only in air but also in soil, due to its completely chlorine
substituted aromatic ring. Its hydrophobic properties make it suitable to be accumulated in
SPMD as shown in Table 3-4. PeCB with lower Koa than HCB (7.18 and 8.04, respectively) is
sequestered in a lower relative amount compared to HCB in SPMD.
Pentachloroanisole is a stable metabolite of HCB, PeCB and pentachlorophenol. As a
consequence, it is present in all matrices, in spite of not being used as a pesticide or
chemically any more. Octachlorostyrene, a by-product in industry, it is also wide-spread in
the environment and detected in all matrices except for needles. SPMD and CSB present

Results and Discussion
58
different behaviours regarding these compounds as it was already observed when analysing
the HCH family.
Table 3-4: Concentration values for PeCB, HCB, PCAS and OCS in the different matrices analysed. Results are the mean values of the 4 sampling sites (n=4). The air concentrations are the mean annual values at Haidel. n.d. = non detectable.
Compound Matrix PeCB HCB PCAS OCS
Mean air concentration (pg m-3) 32.8 67.4 9.9 0.89 SPMD ½ year (pg SPMD-1) 524.9 9768 3718 382.8 CSB ½ year (pg CSB-1) 51.2 326.1 60.1 10.9 Needles ½ year (pg g-1 dry weight) 0.5 85.9 19.0 n.d. Humus soil (pg g-1 dry weight) 723.0 3058 39.6 93.6 Mineral soil (pg g-1 dry weight) 297.1 1106 5.5 26.1
The distribution of the chlordane family changed depending on the studied matrix. The
metabolite oxy-chlordane was already detected in air at concentrations comparable to the
compounds of the technical mixture (Table 3-5). HC and trans-HCE, which are
environmentally unstable, were detected in lower amounts or even not at all. Cis-CHL was
accumulated at higher concentrations in SPMD than trans-CHL. This could be related to its
spatial distribution that favours the transport through the membrane.
Table 3-5: Concentration values for trans-CHL, cis-CHL, oxy-CHL, HC, trans-HCE and cis-HCE in the different matrices analysed (n=4). The air concentrations are the mean annual value at Haidel. n.d. = non detectable.
Compound Matrix
trans-CHL
cis-CHL
oxy-CHL HC trans-
HCE cis-
HCE Mean air concentration (pg m-3) 0.40 0.66 0.50 0.11 0.02 1.68 SPMD ½ year (pg SPMD-1) 179 535 302 2.9 n.d. 852 CSB ½ year (pg CSB-1) 6.4 22.9 7.7 n.d. n.d. 43.0 Needles ½ year (pg g-1 dry weight) 2.0 4.0 2.3 n.d. n.d. 12.6 Humus soil (pg g-1 dry weight) 438 377 264 6.1 11.3 1345 Mineral soil (pg g-1 dry weight) 63.4 45.2 52.9 2.0 2.5 219
Dieldrin concentrations in the environment are not only a consequence of direct historical use
as a pesticide but also to the use of aldrin because dieldrin is a breakdown product of it.
Dieldrin residues in the mineral soil result from both pesticides and are in higher amounts
than the aldrin residues (Table 3-6). The air concentrations of endosulfan were α- dominant,
not only because the technical mixture has a major quantity of it, but also because the β- is
transformed slowly to the α-isomer at aqueous-air interfaces (Schmidt et al., 2001). In
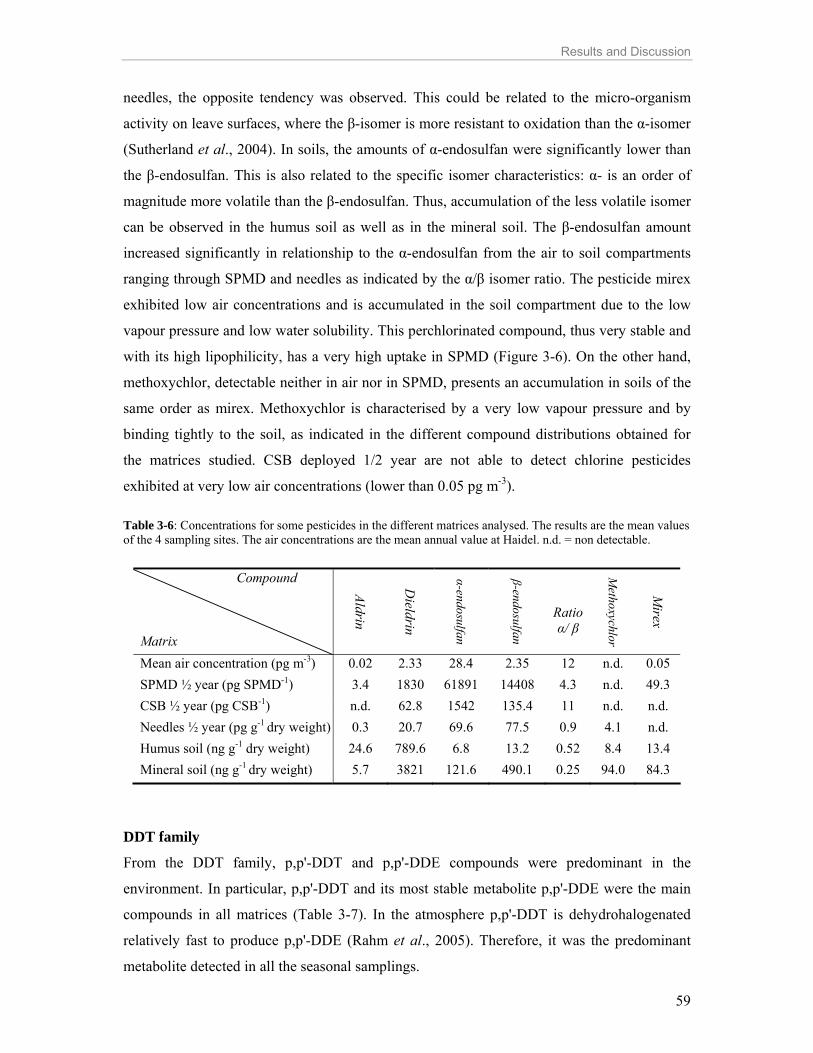
Results and Discussion
59
needles, the opposite tendency was observed. This could be related to the micro-organism
activity on leave surfaces, where the β-isomer is more resistant to oxidation than the α-isomer
(Sutherland et al., 2004). In soils, the amounts of α-endosulfan were significantly lower than
the β-endosulfan. This is also related to the specific isomer characteristics: α- is an order of
magnitude more volatile than the β-endosulfan. Thus, accumulation of the less volatile isomer
can be observed in the humus soil as well as in the mineral soil. The β-endosulfan amount
increased significantly in relationship to the α-endosulfan from the air to soil compartments
ranging through SPMD and needles as indicated by the α/β isomer ratio. The pesticide mirex
exhibited low air concentrations and is accumulated in the soil compartment due to the low
vapour pressure and low water solubility. This perchlorinated compound, thus very stable and
with its high lipophilicity, has a very high uptake in SPMD (Figure 3-6). On the other hand,
methoxychlor, detectable neither in air nor in SPMD, presents an accumulation in soils of the
same order as mirex. Methoxychlor is characterised by a very low vapour pressure and by
binding tightly to the soil, as indicated in the different compound distributions obtained for
the matrices studied. CSB deployed 1/2 year are not able to detect chlorine pesticides
exhibited at very low air concentrations (lower than 0.05 pg m-3).
Table 3-6: Concentrations for some pesticides in the different matrices analysed. The results are the mean values of the 4 sampling sites. The air concentrations are the mean annual value at Haidel. n.d. = non detectable.
Compound Matrix
Aldrin
Dieldrin
α-endosulfan
β-endosulfan
Ratio α/ β
Methoxychlor
Mirex
Mean air concentration (pg m-3) 0.02 2.33 28.4 2.35 12 n.d. 0.05 SPMD ½ year (pg SPMD-1) 3.4 1830 61891 14408 4.3 n.d. 49.3 CSB ½ year (pg CSB-1) n.d. 62.8 1542 135.4 11 n.d. n.d. Needles ½ year (pg g-1 dry weight) 0.3 20.7 69.6 77.5 0.9 4.1 n.d. Humus soil (ng g-1 dry weight) 24.6 789.6 6.8 13.2 0.52 8.4 13.4 Mineral soil (ng g-1 dry weight) 5.7 3821 121.6 490.1 0.25 94.0 84.3
DDT family
From the DDT family, p,p'-DDT and p,p'-DDE compounds were predominant in the
environment. In particular, p,p'-DDT and its most stable metabolite p,p'-DDE were the main
compounds in all matrices (Table 3-7). In the atmosphere p,p'-DDT is dehydrohalogenated
relatively fast to produce p,p'-DDE (Rahm et al., 2005). Therefore, it was the predominant
metabolite detected in all the seasonal samplings.

Results and Discussion
60
Table 3-7: Concentration of DDT and its derivatives in the different matrices analysed (n=4). The air concentrations are the mean annual values at Haidel. n.d. = non detectable.
Compound Matrix
p, p'-DDT
o, p'-DDT
p, p'-DDD
o, p'-DDD
p, p'-DDE
o, p'-DDE
Mean air concentration (pg m-3) 1.05 1.09 0.22 0.20 6.3 0.38 SPMD ½ year (pg SPMD-1) 460 354 129 66 2208 47 CSB ½ year (pg CSB-1) 56.4 14.0 n.d. n.d. 129.3 4.4 Needles ½ year (pg g-1 dry weight) 87.7 21.9 2.0 0.9 59.5 0.7 Humus soil (pg g-1 dry weight) 23543 4662 119 n.d. 10070 118 Mineral soil (pg g-1 dry weight) 6441 1509 39.5 12.2 4856 39.4
The semi permeable device showed to be the matrix with most similarities to the air pool.
This can be seen in Table 3-8 by comparing the calculated ratios. Very similar ratios were
also found in semi-rural Canadian areas using passive samplers. The ratios p,p'-DDT/p,p'-
DDE and p,p'-DDT/o,p'-DDT were 0.43 and 1.25, respectively (Harner et al., 2004). Both
ratios, in the same range, were obtained in air (0.2 and 1.0) and SPMD (0.4 and 1.4) in this
study. In needles, the pattern is different. This could be related to the waxy reaction matrix at
the needle surface where photolysis of DDT occurs (Dolinováa et al., 2004). In humus, a high
amount of parent compounds is observed. This can be explained by the soil characteristics.
The higher amount of organic matter causes more absorption of the pesticide into it which is
thereby sequestered and not available for soil degradation processes. This effect increases in
the humus soil, a fact that has also been observed in another forest sampling site close to the
actual site under investigation (Kosubová et al., 2005).
Table 3-8: Amount of DDT compounds related to o, p'-DDT in the matrices analysed. The results are the ratios of the concentrations.
Ratio o,p'-DDT/compound
Matrix o, p'-DDT/
p, p'-DDT
o, p'-DDT/
p, p'-DDD
o, p'-DDT/
o, p'-DDD
o, p'-DDT/
p, p'-DDE
o, p'-DDT/
o, p'-DDE
Mean air concentration 1.0 4.9 5.3 0.20 2.7
SPMD ½ year 0.71 5.6 8.6 0.29 8.6
CSB ½ year 0.25 - - 0.56 3.3
Needles ½ year 0.25 10.8 23.5 0.38 33.8
Humus soil 0.20 39.4 - 0.46 39.8
Mineral soil 0.23 37.9 122 0.30 37.9

Results and Discussion
61
3.2 PAH in the Bavarian and Bohemian forests The section 3.2.1 is based on unpublished data and section 3.2.2 in paper I.
3.2.1 PAH distribution in the investigated matrices The percent values obtained in the studied matrices for each compound are summarized in
Table 3-9. Higher percentage of high molecular weight PAH was accumulated in soil than in
the other matrices. High molecular weight PAH presented higher values of organic-carbon
partition coefficient than low molecular weight PAH (Wong et al., 2004). Elevated organic-
carbon partition coefficients cause more retention of the compound to the soil. This effect was
observed in both soils analysed: mineral and humus. The increasing vapour pressure at lower
molecular weight PAH is also a property that determines the observed pattern.
Table 3-9: Percentage values for selected PAH in the different matrices analysed. Results are given considering the mean of the 4 sampling sites excepting the air concentrations (only at Haidel). n.d. = not detectable.
Matrix Compound
Air SPMD ½ SPMD 1 ½ Needles ½ CSB ½ Mineral Humus
AC 2.1 0.87 0.27 0.60 1.0 0.31 0.30
ACL 2.7 n.d. n.d. 0.35 0.23 0.07 0.14
FL 19.6 7.6 5.4 2.3 15.7 0.13 0.21
PHE 41.0 50.1 37.7 11.3 45.8 2.9 4.3
AN 0.4 n.d. n.d. 0.36 n.d. 0.35 0.39
FA 14.1 27.0 44.7 23.0 31.7 7.6 11.8
PY 5.7 6.9 6.7 12.6 3.2 4.8 6.8
BbnT 0.1 0.52 0.16 0.75 0.08 0.58 0.81
BaA 1.2 0.44 0.38 3.4 0.10 2.0 2.4
Chr 2.0 1.46 1.75 8.0 0.88 13.7 10.6
BbFA 3.9 1.62 0.55 11.3 0.52 30.9 29.6
BkFA 1.3 1.20 0.99 4.1 0.23 6.8 5.5
BeP 1.7 0.78 0.53 6.0 0.16 9.6 9.1
BaP 1.4 0.35 0.26 4.6 0.05 2.0 2.9
PE 0.2 0.06 0.05 0.75 0.02 0.44 0.58
IP 1.3 0.70 0.34 5.8 0.16 9.3 7.3
DBahA 0.3 0.03 0.03 1.1 0.09 3.5 2.3
BghiP 1.1 0.31 0.19 3.7 0.15 4.9 4.9
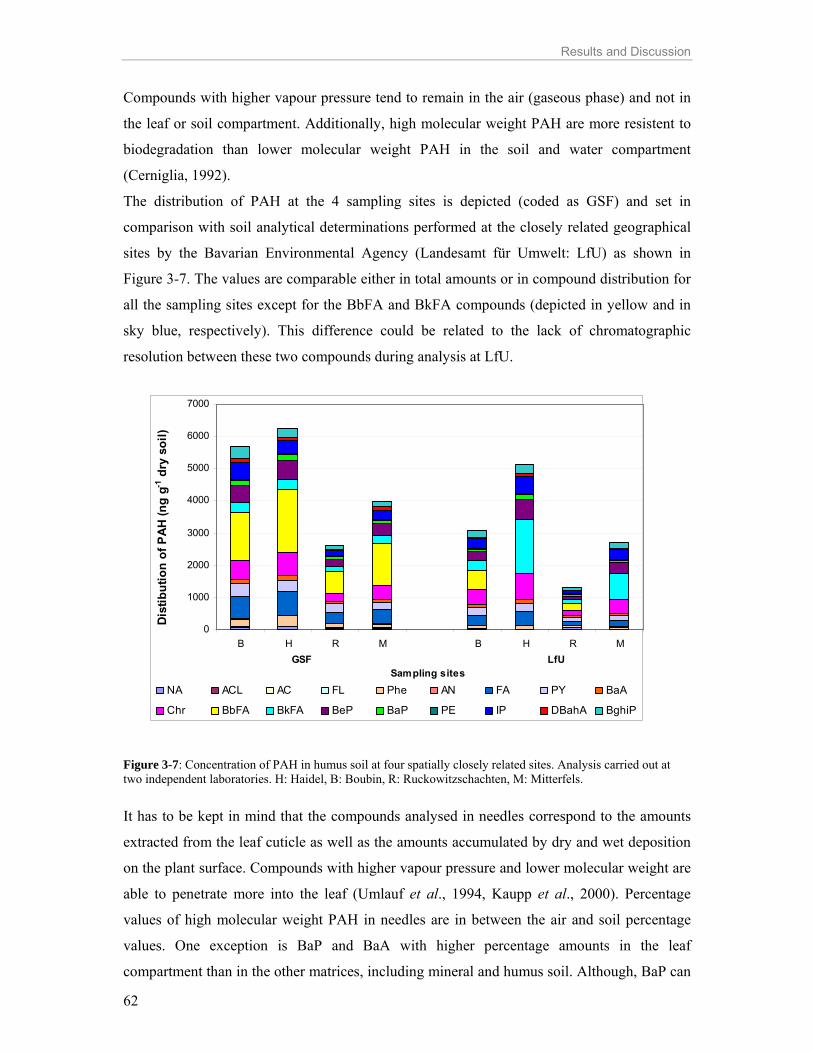
Results and Discussion
62
Compounds with higher vapour pressure tend to remain in the air (gaseous phase) and not in
the leaf or soil compartment. Additionally, high molecular weight PAH are more resistent to
biodegradation than lower molecular weight PAH in the soil and water compartment
(Cerniglia, 1992).
The distribution of PAH at the 4 sampling sites is depicted (coded as GSF) and set in
comparison with soil analytical determinations performed at the closely related geographical
sites by the Bavarian Environmental Agency (Landesamt für Umwelt: LfU) as shown in
Figure 3-7. The values are comparable either in total amounts or in compound distribution for
all the sampling sites except for the BbFA and BkFA compounds (depicted in yellow and in
sky blue, respectively). This difference could be related to the lack of chromatographic
resolution between these two compounds during analysis at LfU.
0
1000
2000
3000
4000
5000
6000
7000
B H R M B H R MGSF LfU
Sampling sites
Dis
tibut
ion
of P
AH (n
g g-1
dry
soi
l)
NA ACL AC FL Phe AN FA PY BaA
Chr BbFA BkFA BeP BaP PE IP DBahA BghiP
Figure 3-7: Concentration of PAH in humus soil at four spatially closely related sites. Analysis carried out at two independent laboratories. H: Haidel, B: Boubin, R: Ruckowitzschachten, M: Mitterfels. It has to be kept in mind that the compounds analysed in needles correspond to the amounts
extracted from the leaf cuticle as well as the amounts accumulated by dry and wet deposition
on the plant surface. Compounds with higher vapour pressure and lower molecular weight are
able to penetrate more into the leaf (Umlauf et al., 1994, Kaupp et al., 2000). Percentage
values of high molecular weight PAH in needles are in between the air and soil percentage
values. One exception is BaP and BaA with higher percentage amounts in the leaf
compartment than in the other matrices, including mineral and humus soil. Although, BaP can

Results and Discussion
63
be degraded by photolysis and oxidation, biodegradation is the main degradation process for
this compound (Dzul-Puc et al., 2005). This could be one reason why this compound
exhibited lower amounts in the soil compartment in relation to other high molecular weight
PAH at similar air concentrations.
In the case of PHE, FA and PY the amounts in the leaf compartment were also higher than in
the soil compartment. PHE percentage decreased abruptly in the soil in comparison to the air
percentage. Biodegradation studies with PHE, FA and PY showed a faster biodegradation for
PHE than FA and PY (Pagnout et al., 2006). This is congruent with the relative lower amount
of PHE detected in soil than for FA and PY.
Analysing the percentage distribution of PAH in SPMD reveals a predominance of low
molecular weight PAH that were also predominant in air. The sampling based on diffusion
processes through the membrane determines this characteristic pattern. The size selection
favours the mass transfer of low molecular weight PAH through the membrane. As a
consequence, compounds with lower molecular volume and mainly associated to the vapour
phase as PHE, PY and FA were well detected with this device. It is worth to mention the good
uptake that FA presented in the SPMD device which proves to be an ideal device to detect this
compound (Koa=8.76). Under these conditions also higher concentrations of FL in the SPMD
device would be expected but such an accumulation effect was not observed (Koa=6.90). On
the other hand, FL showed a very efficient uptake in CSB where sorption mechanisms are
predominant. Fluorene biodegradation occurs quickly under oxygenated conditions and this
determined its readily biodegradation in soil and needles. Its biodegradation probably also
influenced the lower accumulation obtained in SPMD where FL uptake is not as fast as FL
degradation. Additionally, compounds with higher Koa and lower Henry's Law constant were
well collected not only in SPMD but also in needles. In needles, a separation related to the
molecular weight of PAH as in SPMD was not observed. It is remarkable, that high molecular
weight compounds, present only in the particulate phase, were found in the needle samples.
To exemplify and reinforce this observation, PAH results from the Bavarian Forest carried out
independently at the German Research Center for Environmental Health (coded as GSF) and
at the Federal Environmental Agency of Germany (coded as UBA) are shown below. Both
sampling sites are located close to each other and to the mountainous barrier (Kirchner et al.
2006, Rappolder et al. 2007). Spruce needles from the sampling site Haidel (1160 m a. s. l.)
and the Federal Environmental Agency site R5 (1240 m a. s. l.) were collected consecutively
for 3 years. In spite of the good uptake of high molecular weight PAH, the compounds, PHE,
FA and PY predominated in the samples independently of the needle age (Figures 3-8 and

Results and Discussion
64
3-9). This compound distribution was also observed by Schröter-Kermani et al. (2006) at
urban and rural areas in Germany.
11/21 1/2
Phe FA Py BnT BaA Chr BeP BaP IP BghiP
0
1000
2000
3000
4000
Con
cent
ratio
n of
PAH
(ng
kg-1
wet
ne
edle
s)Age of needles
Spruce neeldes from the Bavarian Forest collected in 2005
Figure 3-8: Selected PAH quantified in 1 year old needles at R5 and ½ and 1 ½ years old needles at Haidel. Needles collected in 2005. This similarity is detected not only spatially but also temporally. The samplings in the years
2004 and 2005 presented the same trend as shown below for the year 2003 (Figure 3-9).
0,0
0,2
0,4
0,6
0,8
1,0
UBA 1 year old GSF 1/2 year old GSF 1 1/2 year old
Spruce needles from the Bavarian Forest collected in 2003
Am
ount
of s
elec
ted
PAH
s (%
) BghiP
IP
BaP
BeP
Chr
BaA
BnT
Py
FA
Phe
Figure 3-9: Percentage distribution of selected PAH in needles collected at different ages at the Bavarian Forest. UBA 1 year old: needles of 1 year of age at R5. GSF: ½ and 1 ½ years old needles at Haidel.

Results and Discussion
65
3.2.2 Comparison of PAH concentrations in SPMD, active sampler, and spruce needles PAH: Needles and active sampler
Regarding the active samplers, the whole PAH family showed the same trend to a
concentration increase in early and late winter and a decrease of concentration in the warmer
seasons. This is for instance, particularly remarkable for the heavy molecular weight PAH,
e.g.: BbFA, BkFA, BeP and BaP presenting a strong correlation between them with at least
r2=0.93. The low molecular weight PAH correlated, neither among them nor with the heavier
molecular weight PAH. Higher concentrations of PAH are determined during the coldest
periods (blue circle), whereas the lower concentrations are detected in summer (red circle) as
shown in Figure 3-10.
PCA case scores
PC 2
PC 1
A NE
A SEA SWA NW
A Calm
B NE
B SE
B SW
B NW
B Calm
C NE
C NW
C Calm
E NE
E SE
E SWE NW
E Calm
F NEF SE
F SWF NW
F Calm
K NEK SE
K SW
K NW
K Calm
L NEL SEL SWL NW
L Calm
-0.1
-0.2
-0.4
-0.5
-0.6
0.1
0.2
0.4
0.5
0.6
-0.4-0.9 0.4 0.9 1.3 1.8 2.2
Figure 3-10: PCA case scores (33) of PAH (16) for the active sampling campaigns A, B, C, E, F, K and L. PC 1 accounts for 80.4 % and PC 2 for 8.4 % of the variability (88.8 % of the total).
To illustrate this with an example, PHE reached the highest air concentrations in late winter
with 4.7 ng m-3 in comparison to 0.8 ng m-3 observed in summer, meanwhile the carcinogenic
BaP fluctuated from 0.12 to 0.014 ng m-3 in air. In addition, we notice a low variation of PAH
concentrations in the warmer periods where all the wind directions for campaigns are grouped

Results and Discussion
66
inside the red circle. This cluster indicates PAH background values in the air concentrations
and no specific advective input during the warmer seasons. However, winter campaigns
showed higher PAH air concentrations as well as higher loading fluctuations in the different
wind directions than in summer. We can conclude that the air concentrations in winter are
influenced by local and regional input sources related to winter activities such as domestic
heating not present during the warmer periods.
Previous studies in a semi urban zone showed as well such a temporal trend (Kaupp and
McLachlan, 1999). FL and PHE are the compounds detected in higher concentrations in all
sampling campaigns. PHE represents in the studied campaigns between 33-50 % of the whole
PAH. The compounds FA and PY are also present in all the sampling campaigns with
percentages between 9.5-14.5 % and 4.5- 6.8 %, respectively. The low molecular weight PAH
are in higher concentrations than high molecular weight PAH.
In needles, no general trend is observed, but some correlations are found between compounds
with similar physicochemical properties. We observe for instance, a correlation between
Pyrene (PY) and Fluoranthene (FA) in needles with r2=0.93. These compounds have similar
properties such as surface area, molecular volume, water solubility and Koa. The prediction of
vegetation-atmosphere partition coefficients, gave very similar values for them (Simonich and
Hites, 1994, Maddalena et al., 2002). Consequently, this can explain the similar behaviour
found in needles for these compounds. Perylene (PE) correlates with BaP (r2= 0.95), which
was to be expected due to their physicochemical similarities as well as to their similar
vegetation-atmosphere partition coefficients (Alves de Lima Ribeiro et al., 2003). PAH
relative distribution in needles is different to the one determined in air (Figure 3-11).
0
10
20
30
40
50
60
Needles 1/2 year Needles 1 1/2 years Needles 2 1/2 years Active sampler
Haidel
PAHs
(%)
2 rings 3 rings 4 rings 5-6 rings
Figure 3-11: PAH distribution (%) in needles ½, 1 ½ and 2 ½ years old and active sampler at Haidel. Sampling October 2003. Classification according to the number of benzene rings (BbFA, BkFA included in 5-6 rings).

Results and Discussion
67
Low molecular weight PAH, such as PHE, FL and ACL are present in air in relatively higher
concentrations than in needles. However, intermediate and high molecular weight PAH tend
to accumulate in higher percentages in needles than low molecular weight PAH. The
predominant compound in needles is FA, representing more than 20 % of the whole PAH
concentration, while PHE, one of the predominant compounds in air, decreases in the leaf
compartment to a value around 12 % of the whole PAH. This percentage distribution is
observed at the four sampling sites during the periods October 2003 and October 2004. If we
compare the PAH concentration distribution in needles and air at Haidel, we see that higher
amounts of 5 and 6 ring PAH are found in needles of all ages than in air. Furthermore, the 2
benzene ring compounds are in lower percentage in needles than in air. Thus, less
accumulation of low molecular weight PAH is observed in the leaf compartment compared to
the high molecular weight PAH. There is no correlation between concentrations of PAH in air
and in needles.
Performing PCA, we observe a tendency to higher accumulations at older needle ages but also
high fluctuations among sampling sites and the year of collection (Figure 3-12).
PCA case scores
PC 2
PC 1
H 2.5-3
H 1.5-3H 0.5-3
B 2.5-3B 1.5-3
B 0.5-3
R 2.5-3
R 1.5-3
R 0.5-3
M 2.5-3
M 1.5-3
M 0.5-3
H 0.5-4
H 1.5-4H 2.5-4
B 0.5-4
B 1.5-4
B 2.5-4R 0.5-4 R 1.5-4R 2.5-4
M 0.5-4M 1.5-4
M 2.5-4
-0.2
-0.4
-0.6
-0.7
-0.9
0.2
0.4
0.6
0.7
-0.3-0.6-0.9-1.2 0.3 0.6 0.9 1.2 1.5
Figure 3-12: PCA case scores (24) of PAH (18) for needles. 2.5: 2 ½ years old, 1.5: 1 ½ years old and 0.5: ½ year old. 3: year 2003 and 4: year 2004. PC 1 accounts for 59.3 % and PC 2 for 13.8 % of the variability (73.1 % of the total).

Results and Discussion
68
PAH: SPMD and needles as abiotic and biotic samplers
In SPMD, two groups presented correlations: Chrysene and Fluoranthene on the one hand and
BaA, BeP, BaP, PE and BghiP on the other hand. The correlation in both groups can be
explained by similar chemical physical properties: Chr and FA are characterized by
comparable hardness values (Alves de Lima Ribeiro et al., 2003) implying similar chemical
stability. In addition, properties such as surface area, volume and Koa are similar among the
compounds in both groups. This suggests that properties like spatial molecular distribution,
stability of the compound and hydrophobicity, influence the PAH uptake process in the
SPMD for these compounds.
When analysing the distribution of PAH related to their number of aromatic rings in SPMD,
no significant differences for ½ year and 1 ½ years exposure were found (Figure 3-13).
Moreover, three aromatic rings PAH exhibited in major proportions in air, result to be also
dominant in SPMD devices (Figure 3-13).
0
10
20
30
40
50
60
70
80
90
H B R M B R M H
SPMDs 1/2 year exposure SPMDs 1 1/2 years exposure Active 3 months
PAH
s (%
)
2 rings
3 rings
4 rings
5-6 rings
Figure 3-13: PAH distribution (%) in SPMD for ½ year and 1 ½ years exposure at 4 sampling sites and active sampler at Haidel. Site codes: H: Haidel, B: Boubin, R: Ruckowitzschachten and M: Mitterfels. Comparing SPMD with needles we see that more low molecular weight PAH are accumulated
in SPMD than in needles in the same time period. Actually, the heavy molecular weight PAH
are mainly found in the particulate phase, being this characteristic an impediment for the
uptake of these compounds through the membrane device. This explains why more percentage
of 3 aromatic ringed PAH related to the whole sample are found in SPMD than in needles. In
spite of this fact, the compound Benzo(b)naphtho(2,1-d)thiophene (3 aromatic ringed PAH) is
found in needles and SPMD 1 ½ years exposed but not in SPMD of shorter exposition time.
This compound is characterized by being the only studied compound containing sulphur. The

Results and Discussion
69
electrophilicity of this element creates a negative charge and as a consequence higher
molecular polarity than in the other studied PAH. As a consequence, the uptake through the
SPMD membrane can be hindered.
The 3 aromatic ringed PAH group is composed of Phenanthrene and Fluoranthene
(Anthracene is not considered due to lack of chromatographic resolution and their small
quantities) where PHE represents in average almost 50 % of the whole PAH presented in the
samples and FA around 25 % in SPMD exposed for ½ year. Bartkow et al. (2004) quantified
PHE as the main compound of PAH (around 40 %) in SPMD deployed for 32 days. In SPMD
exposed 1 ½ years the increased proportional amount of 3 ringed PAH is due to an increase of
FA that reached more than 30 % of the total PAH in the sample.
Low molecular PAH presented a correlation between active and SPMD sampling. Even high
molecular weight PAH, bound to particular material, correlated in both, SPMD and active
samplers. Nonetheless, due to the low concentration of high molecular weight PAH, more
studies for these compounds are necessary for SPMD (Figure 3-14).
FL
PHE
FA
PYACLChr
R2 = 0,90
0
200
400
600
800
1000
0 30 60 90 120 150 180
SPMD 1/2 year (ng SPMD-1)
Act
ive
sam
pler
(pg
m-3
air)
BbFA
BeP
BkFA
IP
BaP
DBahAPE
BghiP
R2 = 0,92
0
20
40
60
80
100
0,0 0,4 0,8 1,2 1,6 2,0
SPMD 1/2 year (ng SPMD-1)
Act
ive
sam
pler
(pg
m-3
air)
Figure 3-14: PAH concentrations in SPMD ½ year exposure (n=2) and active sampler 3 month exposure at Haidel. a) Low molecular weight PAH b) High molecular weight PAH.
a) b)
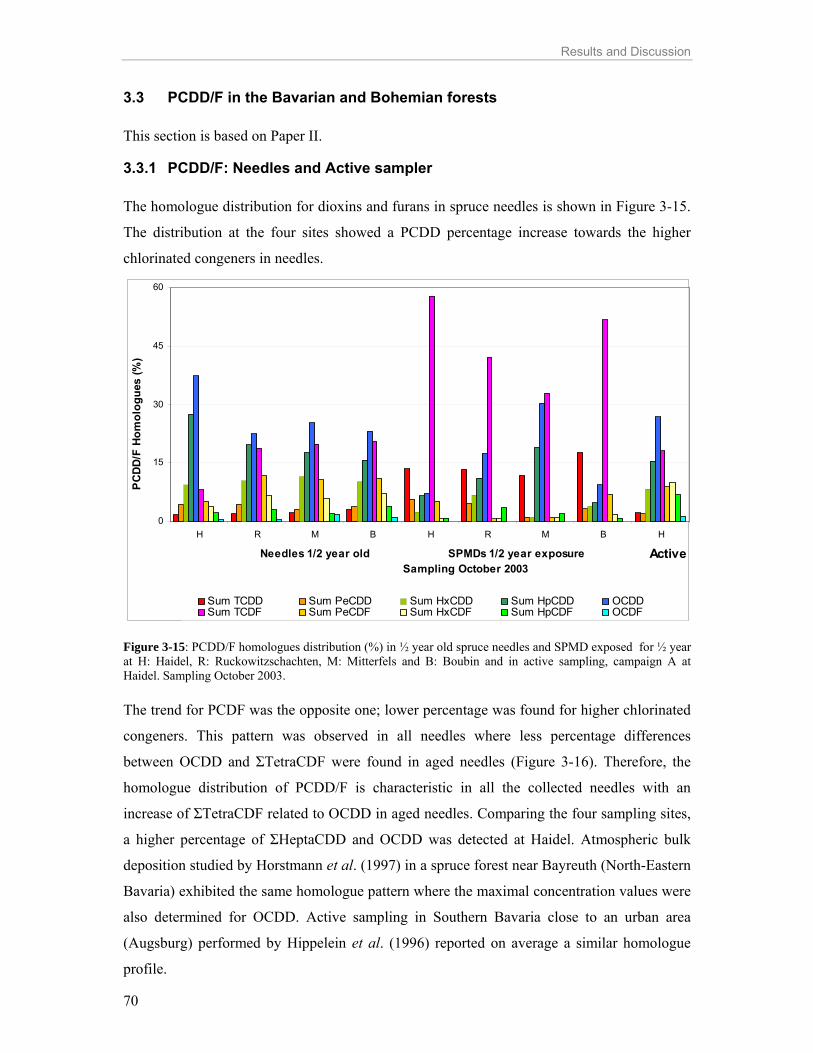
Results and Discussion
70
3.3 PCDD/F in the Bavarian and Bohemian forests This section is based on Paper II.
3.3.1 PCDD/F: Needles and Active sampler The homologue distribution for dioxins and furans in spruce needles is shown in Figure 3-15.
The distribution at the four sites showed a PCDD percentage increase towards the higher
chlorinated congeners in needles.
0
15
30
45
60
H R M B H R M B H
Needles 1/2 year old SPMDs 1/2 year exposure Active Sampling October 2003
PCD
D/F
Hom
olog
ues
(%)
Sum TCDD Sum PeCDD Sum HxCDD Sum HpCDD OCDDSum TCDF Sum PeCDF Sum HxCDF Sum HpCDF OCDF
Figure 3-15: PCDD/F homologues distribution (%) in ½ year old spruce needles and SPMD exposed for ½ year at H: Haidel, R: Ruckowitzschachten, M: Mitterfels and B: Boubin and in active sampling, campaign A at Haidel. Sampling October 2003. The trend for PCDF was the opposite one; lower percentage was found for higher chlorinated
congeners. This pattern was observed in all needles where less percentage differences
between OCDD and ΣTetraCDF were found in aged needles (Figure 3-16). Therefore, the
homologue distribution of PCDD/F is characteristic in all the collected needles with an
increase of ΣTetraCDF related to OCDD in aged needles. Comparing the four sampling sites,
a higher percentage of ΣHeptaCDD and OCDD was detected at Haidel. Atmospheric bulk
deposition studied by Horstmann et al. (1997) in a spruce forest near Bayreuth (North-Eastern
Bavaria) exhibited the same homologue pattern where the maximal concentration values were
also determined for OCDD. Active sampling in Southern Bavaria close to an urban area
(Augsburg) performed by Hippelein et al. (1996) reported on average a similar homologue
profile.
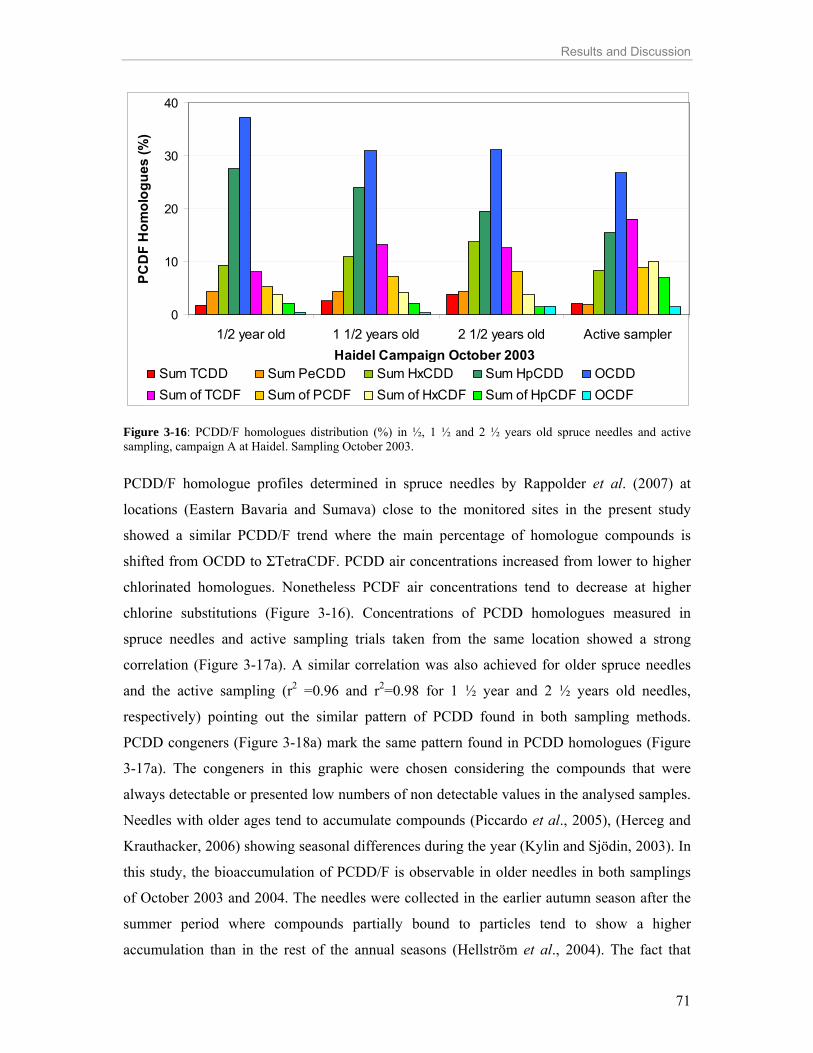
Results and Discussion
71
0
10
20
30
40
1/2 year old 1 1/2 years old 2 1/2 years old Active samplerHaidel Campaign October 2003
PCD
F H
omol
ogue
s (%
)
Sum TCDD Sum PeCDD Sum HxCDD Sum HpCDD OCDDSum of TCDF Sum of PCDF Sum of HxCDF Sum of HpCDF OCDF
Figure 3-16: PCDD/F homologues distribution (%) in ½, 1 ½ and 2 ½ years old spruce needles and active sampling, campaign A at Haidel. Sampling October 2003. PCDD/F homologue profiles determined in spruce needles by Rappolder et al. (2007) at
locations (Eastern Bavaria and Sumava) close to the monitored sites in the present study
showed a similar PCDD/F trend where the main percentage of homologue compounds is
shifted from OCDD to ΣTetraCDF. PCDD air concentrations increased from lower to higher
chlorinated homologues. Nonetheless PCDF air concentrations tend to decrease at higher
chlorine substitutions (Figure 3-16). Concentrations of PCDD homologues measured in
spruce needles and active sampling trials taken from the same location showed a strong
correlation (Figure 3-17a). A similar correlation was also achieved for older spruce needles
and the active sampling (r2 =0.96 and r2=0.98 for 1 ½ year and 2 ½ years old needles,
respectively) pointing out the similar pattern of PCDD found in both sampling methods.
PCDD congeners (Figure 3-18a) mark the same pattern found in PCDD homologues (Figure
3-17a). The congeners in this graphic were chosen considering the compounds that were
always detectable or presented low numbers of non detectable values in the analysed samples.
Needles with older ages tend to accumulate compounds (Piccardo et al., 2005), (Herceg and
Krauthacker, 2006) showing seasonal differences during the year (Kylin and Sjödin, 2003). In
this study, the bioaccumulation of PCDD/F is observable in older needles in both samplings
of October 2003 and 2004. The needles were collected in the earlier autumn season after the
summer period where compounds partially bound to particles tend to show a higher
accumulation than in the rest of the annual seasons (Hellström et al., 2004). The fact that
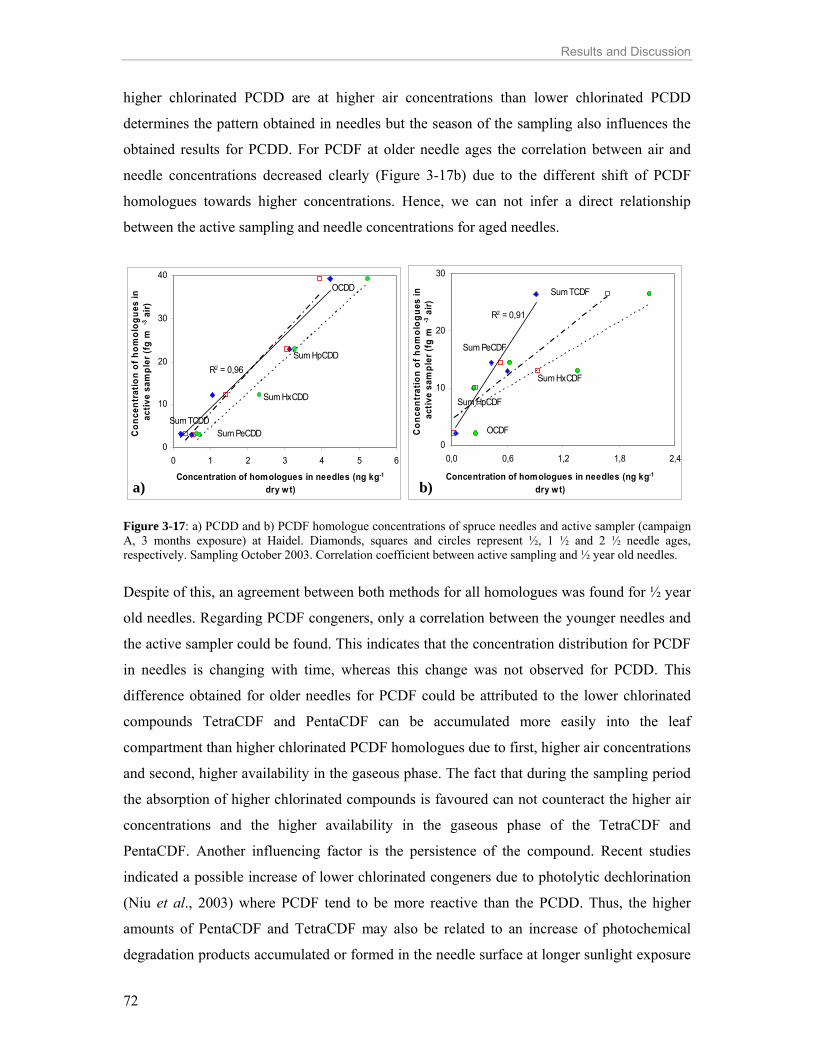
Results and Discussion
72
higher chlorinated PCDD are at higher air concentrations than lower chlorinated PCDD
determines the pattern obtained in needles but the season of the sampling also influences the
obtained results for PCDD. For PCDF at older needle ages the correlation between air and
needle concentrations decreased clearly (Figure 3-17b) due to the different shift of PCDF
homologues towards higher concentrations. Hence, we can not infer a direct relationship
between the active sampling and needle concentrations for aged needles.
Sum PeCDD Sum TCDD
Sum HxCDD
OCDD
Sum HpCDD R2 = 0,96
0
10
20
30
40
0 1 2 3 4 5 6
Concentration of homologues in needles (ng kg-1
dry wt)
Con
cent
ratio
n of
hom
olog
ues
in
activ
e sa
mpl
er (f
g m
-3 a
ir)
Sum PeCDF
Sum TCDF
Sum HxCDF
OCDF
Sum HpCDF
R2 = 0,91
0
10
20
30
0,0 0,6 1,2 1,8 2,4
Concentration of homologues in needles (ng kg-1
dry wt)
Con
cent
ratio
n of
hom
olog
ues
in
activ
e sa
mpl
er (f
g m
-3 a
ir)
Figure 3-17: a) PCDD and b) PCDF homologue concentrations of spruce needles and active sampler (campaign A, 3 months exposure) at Haidel. Diamonds, squares and circles represent ½, 1 ½ and 2 ½ needle ages, respectively. Sampling October 2003. Correlation coefficient between active sampling and ½ year old needles. Despite of this, an agreement between both methods for all homologues was found for ½ year
old needles. Regarding PCDF congeners, only a correlation between the younger needles and
the active sampler could be found. This indicates that the concentration distribution for PCDF
in needles is changing with time, whereas this change was not observed for PCDD. This
difference obtained for older needles for PCDF could be attributed to the lower chlorinated
compounds TetraCDF and PentaCDF can be accumulated more easily into the leaf
compartment than higher chlorinated PCDF homologues due to first, higher air concentrations
and second, higher availability in the gaseous phase. The fact that during the sampling period
the absorption of higher chlorinated compounds is favoured can not counteract the higher air
concentrations and the higher availability in the gaseous phase of the TetraCDF and
PentaCDF. Another influencing factor is the persistence of the compound. Recent studies
indicated a possible increase of lower chlorinated congeners due to photolytic dechlorination
(Niu et al., 2003) where PCDF tend to be more reactive than the PCDD. Thus, the higher
amounts of PentaCDF and TetraCDF may also be related to an increase of photochemical
degradation products accumulated or formed in the needle surface at longer sunlight exposure
a) b)
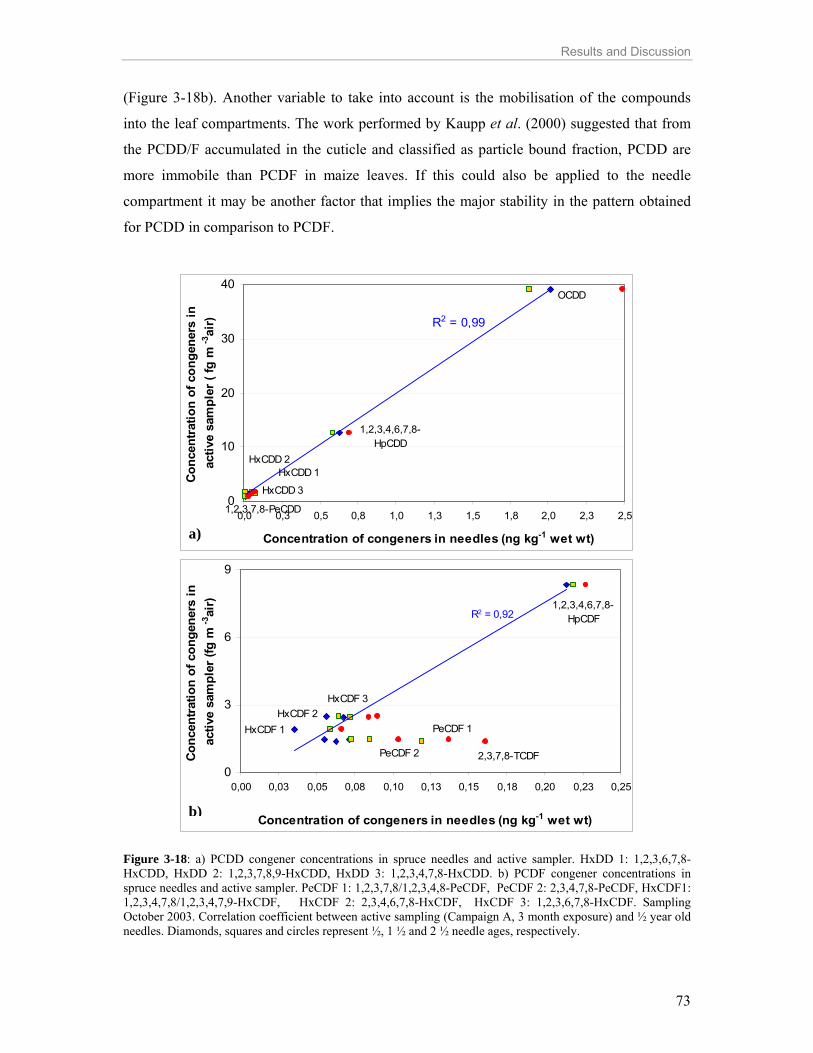
Results and Discussion
73
(Figure 3-18b). Another variable to take into account is the mobilisation of the compounds
into the leaf compartments. The work performed by Kaupp et al. (2000) suggested that from
the PCDD/F accumulated in the cuticle and classified as particle bound fraction, PCDD are
more immobile than PCDF in maize leaves. If this could also be applied to the needle
compartment it may be another factor that implies the major stability in the pattern obtained
for PCDD in comparison to PCDF.
OCDD
1,2,3,4,6,7,8- HpCDD
HxCDD 2HxCDD 1
1,2,3,7,8-PeCDD
HxCDD 3
R2 = 0,99
0
10
20
30
40
0,0 0,3 0,5 0,8 1,0 1,3 1,5 1,8 2,0 2,3 2,5
Concentration of congeners in needles (ng kg-1 wet wt)
Con
cent
ratio
n of
con
gene
rs in
ac
tive
sam
pler
( fg
m-3
air)
1,2,3,4,6,7,8-HpCDF
HxCDF 1HxCDF 2
PeCDF 1
PeCDF 2 2,3,7,8-TCDF
HxCDF 3
R2 = 0,92
0
3
6
9
0,00 0,03 0,05 0,08 0,10 0,13 0,15 0,18 0,20 0,23 0,25
Concentration of congeners in needles (ng kg-1 wet wt)
Conc
entr
atio
n of
con
gene
rs in
ac
tive
sam
pler
(fg
m-3
air)
Figure 3-18: a) PCDD congener concentrations in spruce needles and active sampler. HxDD 1: 1,2,3,6,7,8-HxCDD, HxDD 2: 1,2,3,7,8,9-HxCDD, HxDD 3: 1,2,3,4,7,8-HxCDD. b) PCDF congener concentrations in spruce needles and active sampler. PeCDF 1: 1,2,3,7,8/1,2,3,4,8-PeCDF, PeCDF 2: 2,3,4,7,8-PeCDF, HxCDF1: 1,2,3,4,7,8/1,2,3,4,7,9-HxCDF, HxCDF 2: 2,3,4,6,7,8-HxCDF, HxCDF 3: 1,2,3,6,7,8-HxCDF. Sampling October 2003. Correlation coefficient between active sampling (Campaign A, 3 month exposure) and ½ year old needles. Diamonds, squares and circles represent ½, 1 ½ and 2 ½ needle ages, respectively.
a)
b)

Results and Discussion
74
3.3.2 PCDD/F: SPMD and Needles as abiotic and biotic passive samplers The PCDD/F homologue concentrations obtained from SPMD samples were different from
those related to spruce needles. The PCDD/F homologue distribution (in % of the total
amount of PCDD/F) is shown in Figure 3-13. OCDF was not detectable in the majority of the
samples. Taking into account that the SPMD is able to sample mainly the gaseous and the
nano-particulate phase but not the contaminants attached to macro-particulate aerosol the
different homologue distribution obtained is not surprising. Homologues with comparable air
concentrations but different partitioning behaviour had different distributions in these two
passive samplers. This is the case for HeptaCDD and TetraCDF homologues where their air
concentrations are similar (and the highest after OCDD air concentrations). However, their
distribution in both passive samplers is clearly different. HeptaCDD tends to be mainly bound
to particles (69 to 100 %) during all seasons meanwhile TCDF is mainly present in the
gaseous phase (Hippelein et al., 1996). For this reason, HeptaCDD homologues able to
achieve similar percentage amounts as the TetraCDF homologues in needles are significantly
different in the SPMD pattern. Experimental studies in a semi rural field station showed that
2,3,7,8 TetraCDD/Fs present a higher proportion in the gaseous phase in comparison to the
Penta to OCDD/F (Harner et al., 2000). Therefore, higher concentrations of the tetra
congeners in the gas phase reflect the pronounced uptake of these compounds into SPMD in
comparison to the spruce needles. The tetra homologues peaked in the distribution of all
sampling sites. An increase for the Penta and HexaCDD/F in comparison to the HeptaCDD/Fs
and OCDD is also observable (Figure 3-17). Harner et al. (2000) suggested the division of
PCDD/Fs in two groups, according to their chlorine substitution pattern where the group 2
(any Tetra to HexaCDD/F with 3 or 4 chlorines in the 2,3,7,8 substitution) is characterised for
uniform charge distribution in comparison to the group 1 (the rest of PCDD/F). The lower
polarity exhibited in group 2 reflects a higher octanol solubility, and thus a higher Koa for this
PCDD/F group. This implies a better uptake into the SPMD device for the group 2 in
comparison to HeptaCDD/Fs and OCDD/F that belong to the group 1. On the other hand,
SPMD exposed for 1 ½ years do not show linear increase of PCDD/F concentrations
compared to the 1/2 year exposed devices but a relative increasing of Tetra to HexaCDF
compounds (Figure 3-17). ΣTetraCDD and ΣPentaCDF increase significantly, even the
ΣHexaCDF, close to the limit of detection after ½ year exposure is well determined at longer
exposure periods. This is in agreement with the study of Schröder et al. (1997) where it was
determined that of the whole PCDD/Fs homologues dry gaseous deposition occurs for
TetraCDD and Tetra to HexaCDFs. A comparison of the homologue patterns of SPMD
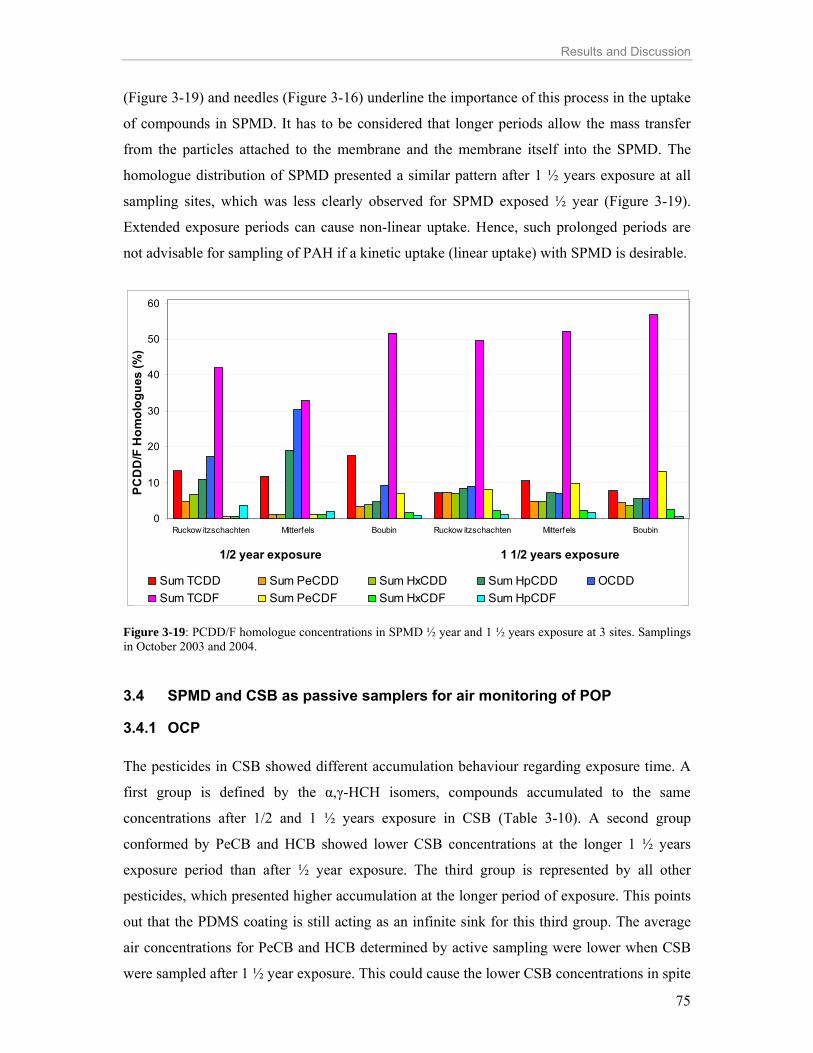
Results and Discussion
75
(Figure 3-19) and needles (Figure 3-16) underline the importance of this process in the uptake
of compounds in SPMD. It has to be considered that longer periods allow the mass transfer
from the particles attached to the membrane and the membrane itself into the SPMD. The
homologue distribution of SPMD presented a similar pattern after 1 ½ years exposure at all
sampling sites, which was less clearly observed for SPMD exposed ½ year (Figure 3-19).
Extended exposure periods can cause non-linear uptake. Hence, such prolonged periods are
not advisable for sampling of PAH if a kinetic uptake (linear uptake) with SPMD is desirable.
0
10
20
30
40
50
60
Ruckow itzschachten Mitterfels Boubin Ruckow itzschachten Mitterfels Boubin
1/2 year exposure 1 1/2 years exposure
PCD
D/F
Hom
olog
ues
(%)
Sum TCDD Sum PeCDD Sum HxCDD Sum HpCDD OCDDSum TCDF Sum PeCDF Sum HxCDF Sum HpCDF
Figure 3-19: PCDD/F homologue concentrations in SPMD ½ year and 1 ½ years exposure at 3 sites. Samplings in October 2003 and 2004.
3.4 SPMD and CSB as passive samplers for air monitoring of POP
3.4.1 OCP The pesticides in CSB showed different accumulation behaviour regarding exposure time. A
first group is defined by the α,γ-HCH isomers, compounds accumulated to the same
concentrations after 1/2 and 1 ½ years exposure in CSB (Table 3-10). A second group
conformed by PeCB and HCB showed lower CSB concentrations at the longer 1 ½ years
exposure period than after ½ year exposure. The third group is represented by all other
pesticides, which presented higher accumulation at the longer period of exposure. This points
out that the PDMS coating is still acting as an infinite sink for this third group. The average
air concentrations for PeCB and HCB determined by active sampling were lower when CSB
were sampled after 1 ½ year exposure. This could cause the lower CSB concentrations in spite

Results and Discussion
76
of the longer period of exposure. However, this fact alone can not explain the observed
behaviour since compounds of the other groups, e. g. air concentrations of γ-HCH and p-p´-
DDE also decreased in air significantly when both active campaigns are compared (see
Campaigns A and E in Table 3-10) but not their accumulation in coated bars. Focusing on the
compound properties (Xiao et al., 2004; Shen and Wania, 2005) the Koa and octanol-solubility
(So) are lower for PeCB, HCB and the α,γ-HCH isomers than for the others OCP analysed.
This could imply that an equilibrium stage or saturation in CSB is achieved more rapidly
during the exposure period for these compounds. Pesticide concentrations in SPMD exposed
the same period of time as the CSB showed a similar, even though less remarkable tendency.
A trend to a concentration increase for the α- and γ-HCH isomers (first group) was observed
in the longer exposed SPMD. Concentrations of the second group decreased, whereas
concentrations of the third set of compounds increased at longer exposure periods as observed
in coated bars. In conclusion, the performance of the PDMS-coated bars seems to have a
lower capacity than the membrane devices, being this capacity in dependence on the
compound solubility to the PDMS coating. On the other hand, both devices are able to detect
all the OCP compounds under study in both exposure periods. In summary, the time of
deployment has to be chosen taking into account the Koa and So of the compounds to monitor.
½ year deployment seems to be more adequate than 1 ½ year deployment to determine
compounds of the three groups. When considering compounds of the third group longer
exposure allows determining an average concentration value after 1 ½ year deployment. This
is not possible for other compounds such as PeCB and HCB due to the deviation from the
linear uptake stage in SPMD and saturation in CSB.
3.4.2 PAH The family of PAH analysed in CSB showed, in general, an increase in their concentrations at
longer exposure time. The exceptions were Acenaphthene and Fluorene, where a decrease at
their concentrations was observed at longer exposure periods. Analysing the PAH properties
such as compound lipophilicity (Alves de Lima Ribeiro et al., 2003; Odabasi et al., 2006)
these compounds present lower Koa than the rest of analysed PAH. This did not explain the
contrary tendency obtained for ACL. The compounds AC, FL and ACL with similar log Koa
(6.52, 6.90 and 6.34, respectively) and molecular weight exhibited a different concentration
behaviour related to exposure time. These three molecules are characterized by two aromatic
rings as well as a third pentacyclic ring that in the case of ACL has a double bond. This
difference in the molecular structure influences the compound solubility (Martin et al., 2007)
and thus may determine the different accumulation behaviour obtained for ACL in

Results and Discussion
77
comparison to FL and AC. When comparing PAH with OCP, the compounds with lower Koa,
like HCB and PeCB, were also those compounds that exhibited a concentration decrease at
longer exposure periods as seen for AC and FL.
Figure 3-20 depicts FL and PHE as an example of different accumulation with time of
exposure in coated bars. Exhibiting similar air concentrations and being both mainly in the
gaseous phase, FL with lower Koa than PHE, is not sequestered as efficient as PHE. This
effect is even more pronounced in SPMD where the accumulated amounts of FL in
percentage of the total accumulated PAH are even much lower than in CSB. These
percentages are around 7 and 6 % in SPMD and 21 and 10 % in coated bars after ½ and 1 ½
year exposure, respectively.
0
2000
4000
6000
8000
10000
12000
H 0.5 H 1.5 B 0.5 B 1.5 R 0.5 R 1.5 M 0.5 M 1.5 A E
Coated stir bars Active
Con
cent
ratio
n PA
H (
pg C
SB -1
and
pg m
-3 )
Fluorene Phenanthrene
Figure 3-20: Fluorene and Phenanthrene concentrations (pg CSB-1) in coated bars (n=2) after ½ and 1 ½ year exposure at four sampling sites and air concentrations (pg m-3 air) at Haidel. 0.5: ½ year exposure, 1.5: 1 ½ years exposure. H: Haidel, B: Boubin, R: Ruckowitzschachten and M: Mitterfels. A and E: Campaigns A and E, respectively. High molecular weight PAH, in spite of being bound almost completely to airborne particles,
were sampled in CSB, not only after 1 ½ years but also after ½ year exposure. Determining
the percentage of each compound within the total PAH sequestered in both passive samplers,
SPMD were more prone to accumulate high molecular weight PAH than coated bars. There is
no correlation between the concentrations achieved in SPMD and CSB neither after ½ year
nor 1 ½ years exposure. Accumulation in CSB and 3 months average air concentrations
showed also no correlation but the predominant PAH in air (Fluorene, Phenanthrene and
Fluoranthene) were also elevated in coated stir bars. FL, PHE and FA represented more than

Results and Discussion
78
90 % of the total sequestered amount for CSB with ½ and 1 ½ year exposure. Concentrations
sequestered in SPMD after ½ year exposure and air concentrations presented a high
correlation such as it was already seen in Figure 3-14.
In summary, due to the broad range of properties such as Koa, vapour pressure and gas-
particle coefficient partition of PAH, a commitment for the PAH family as a whole has to be
considered when choosing deployment time and passive sampling device. The use of PRC can
be helpful to differentiate the uptake stages for each monitored compound in the pooled
sample.
3.4.3 PCB All studied PCB were detected in SPMD devices with the exception of PCB 169 that was
neither detected at ½ nor after 1 ½ years exposure. CSB sampled all PCB with the exception
of 169 and 126, congeners with the highest toxicological potency regarding PCB. It is
important to mention that the PCB 126 and PCB 169 were detected in the average air
concentrations in the first period and PCB 126 in the second active sampling period (Table 3-
11). The sequestered amounts of PCB in CSB increased with exposure time for all the
analysed compounds. However, PCB accumulated in SPMD display different patterns. The
congeners PCB 28, PCB 52 and PCB 101 decreased their concentrations at longer exposure
periods and none of the other analysed congeners reveal a significant accumulation increase at
longer exposure. The lower sequestered amounts of the congeners 28, 52 and 101 at longer
exposure time are related to two reasons: the achieved equilibrium for these compounds and
the lower mean air concentrations of PCB when the longer SPMD deployment was finished.
Previous studies have shown that lower chlorinated PCB congeners reach equilibrium after
200 days exposure (Ockenden et al., 2001). In the case of higher chlorinated PCB congeners
like PCB 167 and PCB 189 the equilibrium may still have not been met. Factors such as
higher chlorinated PCB tend to be retained more on particles and have to be desorbed before
being available to diffuse through the membrane, and thus may imply more time to achieve
the equilibrium. In addition, higher Koa values indicating more accumulation capacity could
cause longer exposure times to achieve the equilibrium. It could also be possible that for some
compounds such as PCB 101 and PCB 105 despite having the same degree of chlorination,
the different molecular substitution structure determine the different behaviour obtained. For
instance, air concentrations of PCB 105 decreased but the amounts sequestered in SPMD
remained almost constant during the different deployment times, whereas PCB 101 decreased
at longer deployments. PCB 101 has two ortho-chlorines, whereas PCB 105 has only one. A
study performed by Falconer and Bidleman (1994) showed that within one homologue group,
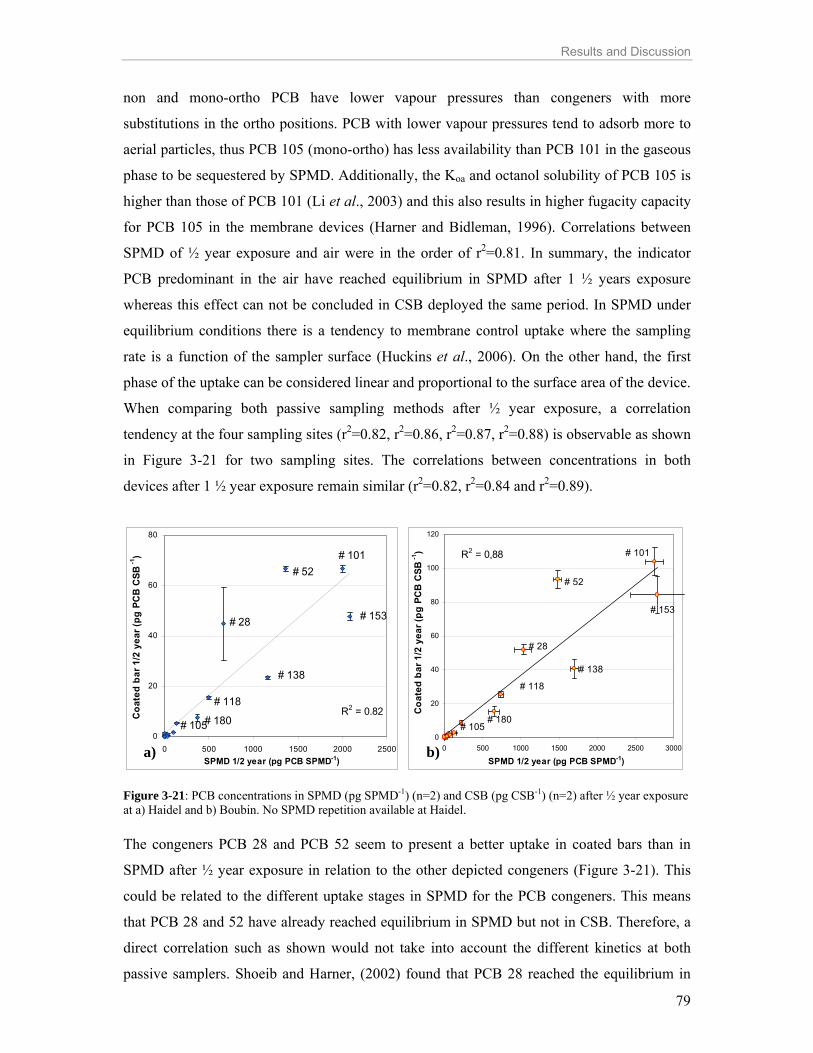
Results and Discussion
79
non and mono-ortho PCB have lower vapour pressures than congeners with more
substitutions in the ortho positions. PCB with lower vapour pressures tend to adsorb more to
aerial particles, thus PCB 105 (mono-ortho) has less availability than PCB 101 in the gaseous
phase to be sequestered by SPMD. Additionally, the Koa and octanol solubility of PCB 105 is
higher than those of PCB 101 (Li et al., 2003) and this also results in higher fugacity capacity
for PCB 105 in the membrane devices (Harner and Bidleman, 1996). Correlations between
SPMD of ½ year exposure and air were in the order of r2=0.81. In summary, the indicator
PCB predominant in the air have reached equilibrium in SPMD after 1 ½ years exposure
whereas this effect can not be concluded in CSB deployed the same period. In SPMD under
equilibrium conditions there is a tendency to membrane control uptake where the sampling
rate is a function of the sampler surface (Huckins et al., 2006). On the other hand, the first
phase of the uptake can be considered linear and proportional to the surface area of the device.
When comparing both passive sampling methods after ½ year exposure, a correlation
tendency at the four sampling sites (r2=0.82, r2=0.86, r2=0.87, r2=0.88) is observable as shown
in Figure 3-21 for two sampling sites. The correlations between concentrations in both
devices after 1 ½ year exposure remain similar (r2=0.82, r2=0.84 and r2=0.89).
# 153
# 101
# 138
# 28
# 52
# 118
# 180# 105R2 = 0.82
0
20
40
60
80
0 500 1000 1500 2000 2500SPMD 1/2 year (pg PCB SPMD-1)
Coa
ted
bar 1
/2 y
ear (
pg P
CB
CSB
-1)
# 105# 180
# 118
# 52
# 28
# 138
# 101
# 153
R2 = 0,88
0
20
40
60
80
100
120
0 500 1000 1500 2000 2500 3000
SPMD 1/2 year (pg PCB SPMD-1)
Coa
ted
bar 1
/2 y
ear (
pg P
CB
CSB
-1)
Figure 3-21: PCB concentrations in SPMD (pg SPMD-1) (n=2) and CSB (pg CSB-1) (n=2) after ½ year exposure at a) Haidel and b) Boubin. No SPMD repetition available at Haidel. The congeners PCB 28 and PCB 52 seem to present a better uptake in coated bars than in
SPMD after ½ year exposure in relation to the other depicted congeners (Figure 3-21). This
could be related to the different uptake stages in SPMD for the PCB congeners. This means
that PCB 28 and 52 have already reached equilibrium in SPMD but not in CSB. Therefore, a
direct correlation such as shown would not take into account the different kinetics at both
passive samplers. Shoeib and Harner, (2002) found that PCB 28 reached the equilibrium in
a) b)

Results and Discussion
80
SPMD within a 3 month deployment and PCB 52 approximately after 1 year deployment.
Concentrations of PCB congeners in air and CSB after ½ year deployment present a good
correlation (r2=0.95) (Figure 3-22). Excluding the tri- and tetrachlorobiphenyl congeners PCB
28 and PCB 52, sound correlations between coating stir bars after 1 ½ year deployment and
mean air concentrations were also achieved (r2=0.99) as depicted in Figure 3-22. For these
correlations, it was assumed that the TWA concentration of PCB compounds in the studied
period were similar to the annual average concentrations. In summary, PCB determined by
PDMS coated bars are in agreement with the time averaged air concentrations. Nonetheless,
PCB 126, having importance due to its high toxicity, was not detectable by coated bars but in
the SPMD after ½ year exposure.
# 105 # 180
# 118
# 52
# 28
# 138
# 101
# 153
R2 = 0.95
0
20
40
60
80
0 500 1000 1500 2000 2500 3000 3500 4000
Air concentration (fg PCB air m-3)
Coa
ted
bars
1/2
yea
r (pg
PC
B C
SB-1
)
# 153
# 101
# 138
# 189# 156
# 118
# 180# 105
R2 = 0.99
0
40
80
120
160
0 300 600 900 1200 1500 1800
Air concentration (fg PCB air m-3)
Coa
ted
bars
1 1
/2 y
ear (
pg P
CB
CSB
-1)
Figure 3-22: PCB concentrations in active sampler and coated stir bars (n=2) after a) ½ year and b) 1 ½ year deployment at Haidel. Note that PCB 28 and 52 were excluded for the 1 ½ exposure correlation.
a) b)

Table 3-10: Concentration of OCP in SPMD (pg SPMD-1) and CSB (pg CSB-1) after ½ and 1 ½ years exposure at four sampling sites. Air concentrations for the A and E campaigns at Haidel are also depicted. SPMD data at Haidel after 1 ½ exposure is not available due to triolein losses. n.d. = not detectable, n. a. = not analysable
Site Haidel Boubin Ruckowitz- schachten Mitterfels Haidel Boubin Ruckowitz-
schachten Mitterfels Active at Haidel
Exposure period ½ ½ 1 ½ ½ 1 ½ ½ 1 ½ ½ 1 ½ ½ 1 ½ ½ 1 ½ ½ 1 ½ A E
Compound Concentration in SPMD (pg SPMD-1) Concentration in CSB (pg CSB-1) Air concentration (pg m-3)
α-HCH 1842 1920 2632 1795 2521 1971 2444 99.1 99.4 129 118 89.4 76.5 90.0 74.9 15.1 14.3
β-HCH 184 201 385 208 374 509 331 1.2 1.7 2.9 3.9 1.5 0.4 1.0 1.3 0.37 0.25 γ-HCH 6444 4984 8434 4720 8382 7102 9586 474 610 596 620 424 397 469 494 34.1 26.2 PeCB 525 589 394 510 438 475 375 50.9 31.1 57.5 32.7 47.2 19.0 49.3 24.8 26.4 24.0 HCB 10282 10896 5012 9972 5066 7925 4906 318 259 384 306 294 181 308 226 65.8 40.3
4-4’-DDT 1106 2077 4849 1978 4533 1430 3328 35.0 84.7 95.9 210 59.1 130 35.6 84.3 1.6 1.0 2-4’-DDT 726 1441 3681 1456 3252 1021 2647 n.a. 31.7 37.9 132 16.7 78.5 1.5 31.9 1.4 0.9 4-4’-DDE 2743 6980 9613 5405 9068 2346 4625 71.6 201 220 500 143 308 82.7 223 4.6 3.1 2-4’-DDE 88.4 191 438 145 384 100 333 2.2 9.5 7.6 22.4 5.4 15.0 2.5 9.7 0.4 0.2 Cis-HCL 445 565 1029 618 1230 513 1143 30.5 77.3 65.2 123 40.8 80.7 35.4 75.1 0.6 0.6 Dieldrin 1401 2127 3495 2060 2970 1732 3005 41.6 116 96.8 228 60.6 173 52.1 127 2.5 2.0
α-Endosulfan 32651 41497 66653 43073 50577 40233 68445 1106 2481 2309 4312 1560 3068 1193 2542 30.3 31.3 β-Endosulfan 4059 6520 15635 62990 12533 5707 15054 92.9 307 196 585 155 516 98 228 2.4 3.7
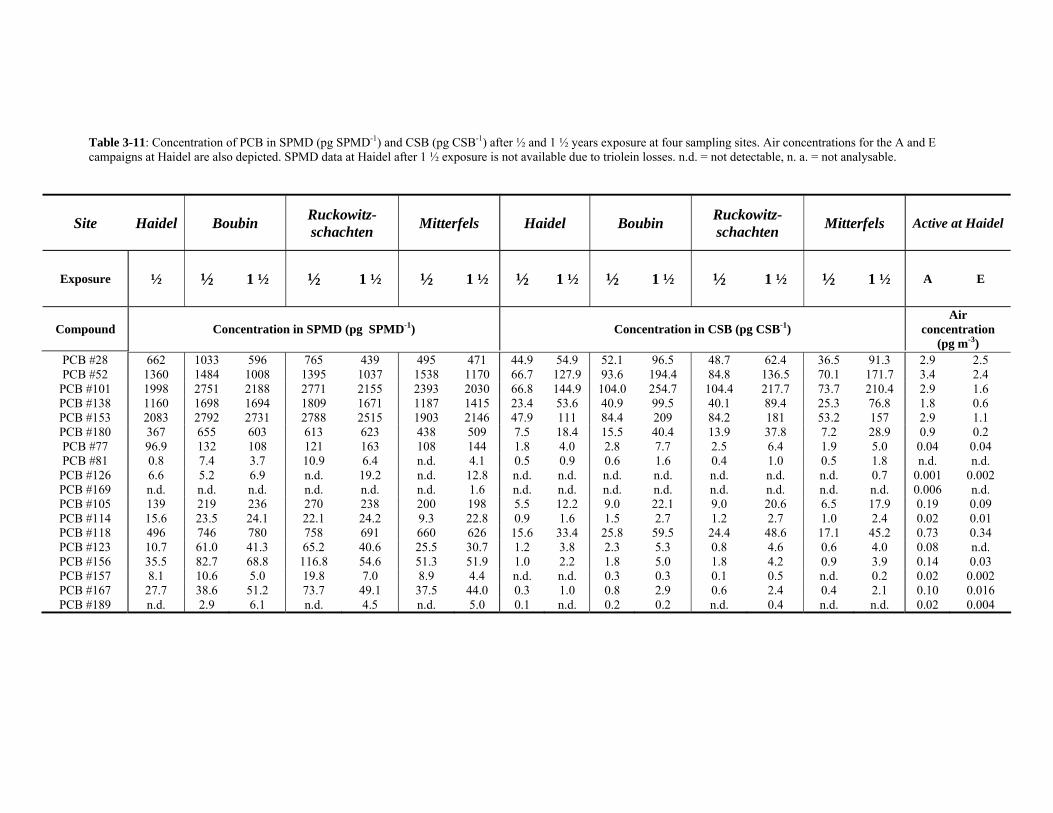
Table 3-11: Concentration of PCB in SPMD (pg SPMD-1) and CSB (pg CSB-1) after ½ and 1 ½ years exposure at four sampling sites. Air concentrations for the A and E campaigns at Haidel are also depicted. SPMD data at Haidel after 1 ½ exposure is not available due to triolein losses. n.d. = not detectable, n. a. = not analysable.
Site Haidel Boubin Ruckowitz- schachten Mitterfels Haidel Boubin Ruckowitz-
schachten Mitterfels Active at Haidel
Exposure ½ ½ 1 ½ ½ 1 ½ ½ 1 ½ ½ 1 ½ ½ 1 ½ ½ 1 ½ ½ 1 ½ A E
Compound Concentration in SPMD (pg SPMD-1) Concentration in CSB (pg CSB-1) Air
concentration (pg m-3)
PCB #28 662 1033 596 765 439 495 471 44.9 54.9 52.1 96.5 48.7 62.4 36.5 91.3 2.9 2.5 PCB #52 1360 1484 1008 1395 1037 1538 1170 66.7 127.9 93.6 194.4 84.8 136.5 70.1 171.7 3.4 2.4
PCB #101 1998 2751 2188 2771 2155 2393 2030 66.8 144.9 104.0 254.7 104.4 217.7 73.7 210.4 2.9 1.6 PCB #138 1160 1698 1694 1809 1671 1187 1415 23.4 53.6 40.9 99.5 40.1 89.4 25.3 76.8 1.8 0.6 PCB #153 2083 2792 2731 2788 2515 1903 2146 47.9 111 84.4 209 84.2 181 53.2 157 2.9 1.1 PCB #180 367 655 603 613 623 438 509 7.5 18.4 15.5 40.4 13.9 37.8 7.2 28.9 0.9 0.2 PCB #77 96.9 132 108 121 163 108 144 1.8 4.0 2.8 7.7 2.5 6.4 1.9 5.0 0.04 0.04 PCB #81 0.8 7.4 3.7 10.9 6.4 n.d. 4.1 0.5 0.9 0.6 1.6 0.4 1.0 0.5 1.8 n.d. n.d.
PCB #126 6.6 5.2 6.9 n.d. 19.2 n.d. 12.8 n.d. n.d. n.d. n.d. n.d. n.d. n.d. 0.7 0.001 0.002 PCB #169 n.d. n.d. n.d. n.d. n.d. n.d. 1.6 n.d. n.d. n.d. n.d. n.d. n.d. n.d. n.d. 0.006 n.d. PCB #105 139 219 236 270 238 200 198 5.5 12.2 9.0 22.1 9.0 20.6 6.5 17.9 0.19 0.09 PCB #114 15.6 23.5 24.1 22.1 24.2 9.3 22.8 0.9 1.6 1.5 2.7 1.2 2.7 1.0 2.4 0.02 0.01 PCB #118 496 746 780 758 691 660 626 15.6 33.4 25.8 59.5 24.4 48.6 17.1 45.2 0.73 0.34 PCB #123 10.7 61.0 41.3 65.2 40.6 25.5 30.7 1.2 3.8 2.3 5.3 0.8 4.6 0.6 4.0 0.08 n.d. PCB #156 35.5 82.7 68.8 116.8 54.6 51.3 51.9 1.0 2.2 1.8 5.0 1.8 4.2 0.9 3.9 0.14 0.03 PCB #157 8.1 10.6 5.0 19.8 7.0 8.9 4.4 n.d. n.d. 0.3 0.3 0.1 0.5 n.d. 0.2 0.02 0.002 PCB #167 27.7 38.6 51.2 73.7 49.1 37.5 44.0 0.3 1.0 0.8 2.9 0.6 2.4 0.4 2.1 0.10 0.016 PCB #189 n.d. 2.9 6.1 n.d. 4.5 n.d. 5.0 0.1 n.d. 0.2 0.2 n.d. 0.4 n.d. n.d. 0.02 0.004

Results and Discussion
83
3.5 Results in the Alpine Region In this section based on Papers III and V, the SPMD performance is described regarding
different periods of deployment and different altitude profiles in the Alpine region. Two
sampling campaigns were carried out consecutively: May - November 2005 (Period 1) and
December 2005 - May 2006 (Period 2). A third campaign embracing the Period 1 and 2, thus
from May 2005 to May 2006 (Period 3) was also performed. Compounds with SPMD blank
percentage values higher than 50 % were not considered in the results. Consequently, from all
the quantified PAH, the following analysis is based only on the compounds that fulfil this pre-
requisite; Phenanthrene (PHE), Fluoranthene (FA) and Pyrene (PY). All the analysed OCP
presented satisfactory blank values. Unpublished data regarding the matrices soil and needles
are also included.
3.5.1 Monitoring of PAH by SPMD in the alpine region: altitude profiles PAH: SPMD regarding time and season of deployment The analyzed PAH, characterized by being mainly in the gaseous phase, are sequestered in
higher amounts in the first period than in the second or the third period. Comparing the first
and the second ½ year deployment period, higher concentrations are determined when the
sampling is conducted in early winter (Period 1). PAH in air in a mountainous spruce stand
site were also detected in higher concentrations in winter than in summer as previously
discussed in Section 3.2.2 as well as in other studies. These findings are in concordance with
the data obtained here. This also means that the SPMD deployed for ½ year give a qualitative
pattern of the seasonal air changes at two different annual seasons. In the aim to determine
whether a quantitative determination is possible, we compared the sum of the two consecutive
1/2 year SPMD deployments (Period 1 + Period 2) with the sequestered amount determined in
the annual SPMD deployment (Period 3) as seen in Figures 3-23, 3-24 and 3-25. The values
obtained after 1 year deployment (Period 3) resemble the last ½ year sequestering (Period 2)
and therefore, not representative as a mean annual value (blue and green lines, respectively).
On the other hand, as the uptake amounts of Period 1 tend to be much higher than Period 2,
the sum of both periods (dashed line) resembles Period 1 (red line).
Period 2 and 3 finished in late spring where the mean temperatures are higher in comparison
to the end of Period 1. Lower temperatures influence the SPMD-air coefficient partition that is
expected to be similar to the octanol-air coefficient partition. The Koa values increase at lower
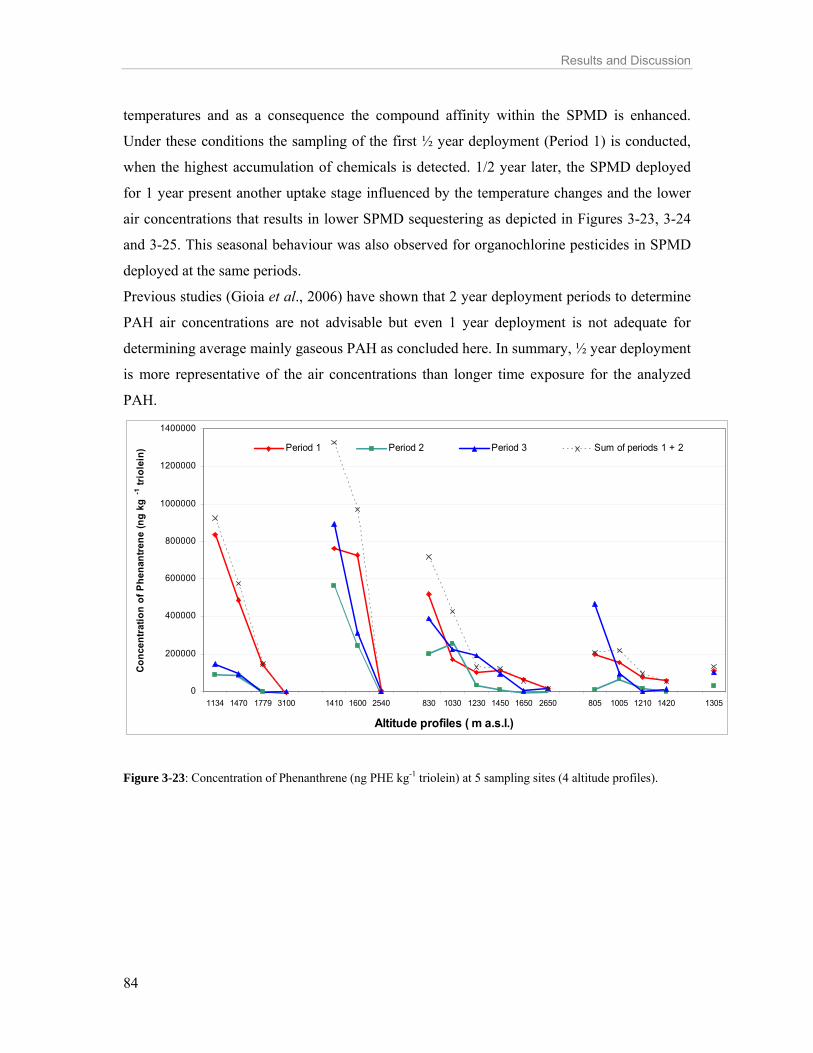
Results and Discussion
84
temperatures and as a consequence the compound affinity within the SPMD is enhanced.
Under these conditions the sampling of the first ½ year deployment (Period 1) is conducted,
when the highest accumulation of chemicals is detected. 1/2 year later, the SPMD deployed
for 1 year present another uptake stage influenced by the temperature changes and the lower
air concentrations that results in lower SPMD sequestering as depicted in Figures 3-23, 3-24
and 3-25. This seasonal behaviour was also observed for organochlorine pesticides in SPMD
deployed at the same periods.
Previous studies (Gioia et al., 2006) have shown that 2 year deployment periods to determine
PAH air concentrations are not advisable but even 1 year deployment is not adequate for
determining average mainly gaseous PAH as concluded here. In summary, ½ year deployment
is more representative of the air concentrations than longer time exposure for the analyzed
PAH.
0
200000
400000
600000
800000
1000000
1200000
1400000
1134 1470 1779 3100 1410 1600 2540 830 1030 1230 1450 1650 2650 805 1005 1210 1420 1305
Altitude profiles ( m a.s.l.)
Con
cent
ratio
n of
Phe
nant
rene
(ng
kg-1
trio
lein
) Period 1 Period 2 Period 3 Sum of periods 1 + 2
Figure 3-23: Concentration of Phenanthrene (ng PHE kg-1 triolein) at 5 sampling sites (4 altitude profiles).

Results and Discussion
85
0
100000
200000
300000
400000
1134 1470 1779 3100 1410 1600 2540 830 1030 1230 1450 1650 2650 805 1005 1210 1420 1305
Altitude profiles (m a.s.l.)
Con
cent
ratio
n of
Flu
oran
then
e (n
g kg
-1 tr
iole
in)
Period 1 Period 2 Period 3 Sum of periods 1 + 2
Figure 3-24: Concentration of Fluoranthene (ng FL kg-1 triolein) at 5 sampling sites (4 altitude profiles).
0
50000
100000
150000
1134 1470 1779 3100 1410 1600 2540 830 1030 1230 1450 1650 2650 805 1005 1210 1420 1305
Altitude profiles (m a.s.l.)
Con
cent
ratio
n of
Pyr
ene
(ng
kg-1
trio
lein
)
Period 1 Period 2 Period 3 Sum of periods 1 + 2
Figure 3-25: Concentration of Pyrene (ng PY kg-1 triolein) at 5 sampling sites (4 altitude profiles). PAH: SPMD regarding altitude profiles At higher altitudes Phenanthrene, Fluoranthene and Pyrene concentrations decrease until
being not detected in SPMD at altitudes higher than 1400 m a.s.l. in the Periods 2 and 3 and at
approximately altitudes higher than 1600 m a.s.l. for Period 1. This tendency along the
altitude is opposite to that determined for pesticides. PAH can undergo wet and dry deposition

Results and Discussion
86
as well as photodegradation which can cause the faster elimination from the atmosphere of
these compounds resulting in a strong decrease with increasing distance from potential
primary sources (energy production and traffic) at the bottom of the alpine valleys. Studies
performed by Kiss et al. (1998), showed that at lower temperatures PAH tend to shift their
abundance in air from the gaseous to the particulate phase. The deposition increases at larger
particle size distribution and dry deposition is favored in presence of these particles, hindering
the atmospheric transport along the altitude profile. This could only in part explain the
enhanced decrease in PAH concentrations in summer to winter (Period 1) in comparison to
winter to summer periods (Period 2) along the altitude profiles (Figures 3-23, 3-24 and 3-25)
because PHE, FA and PY, are mainly in the gaseous phase, exhibiting on average 1.9, 19.1
and 29.6 % in the particulate phase, respectively. One important factor to mention is that the
inversion layer occurrences are more frequent in winter, hindering the PAH atmospheric
transport, particularly in the season of higher PAH generation.
In conclusion, the analysed PAH decreased their concentrations along all the altitude profiles
and higher amounts of PAH are sequestered in Period 1, coincidently with the higher PAH
production at the bottom of the valleys. SPMD deployments longer than ½ year are not
advisable, at least not for PAH that are mainly in the gaseous phase. Seasonal differences play
an important role in the uptake of SPMD due to temperature changes and to changes in the
physicochemical properties such as the gas-particle distribution for PAH. The fact that the
PAH production varies considerably during the different seasons can not be disregarded. Due
to this, SPMD deployments considering just the season (approximately 4 to 6 months) are
recommended to determine accurately the average air concentrations of the current analysed
PAH compounds.
3.5.2 SPMD: Data interpretation regarding exposure time for OCP
All analysed compounds present higher accumulation in the Period 1 than in the Period 2
(Table 3-12). Both periods correspond to ½ year exposure but different seasons at the end of
the sampling. The higher sequestering in Period 1 is related to the lower temperatures
governing the end of the exposure period in comparison with the temperatures at the end of
Period 2. Lower temperatures (but > -4 °C) cause an increase in Koa values, implying a higher
compound affinity for the triolein, which explains the higher sequestering in Period 1. This
effect, favours the accumulation of compounds, acting the triolein phase as an infinite sink.
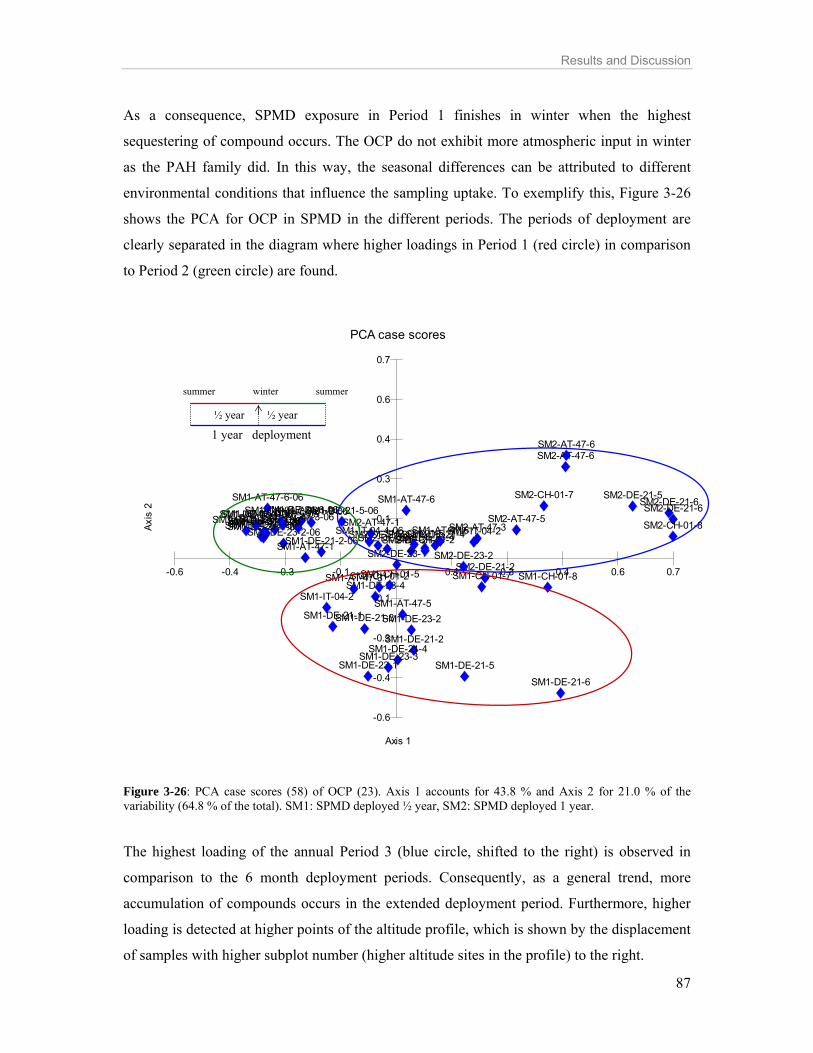
Results and Discussion
87
As a consequence, SPMD exposure in Period 1 finishes in winter when the highest
sequestering of compound occurs. The OCP do not exhibit more atmospheric input in winter
as the PAH family did. In this way, the seasonal differences can be attributed to different
environmental conditions that influence the sampling uptake. To exemplify this, Figure 3-26
shows the PCA for OCP in SPMD in the different periods. The periods of deployment are
clearly separated in the diagram where higher loadings in Period 1 (red circle) in comparison
to Period 2 (green circle) are found.
Figure 3-26: PCA case scores (58) of OCP (23). Axis 1 accounts for 43.8 % and Axis 2 for 21.0 % of the variability (64.8 % of the total). SM1: SPMD deployed ½ year, SM2: SPMD deployed 1 year.
The highest loading of the annual Period 3 (blue circle, shifted to the right) is observed in
comparison to the 6 month deployment periods. Consequently, as a general trend, more
accumulation of compounds occurs in the extended deployment period. Furthermore, higher
loading is detected at higher points of the altitude profile, which is shown by the displacement
of samples with higher subplot number (higher altitude sites in the profile) to the right.
PCA case scores
Axis
2
Axis 1
SM1-DE-21-1-06SM1-DE-21-2-06
SM1-DE-21-3-06SM1-DE-21-4-06SM1-DE-21-5-06SM1-DE-21-6-06
SM2-DE-21-1
SM2-DE-21-2
SM2-DE-21-3SM2-DE-21-4
SM2-DE-21-5SM2-DE-21-6SM2-DE-21-6
SM1-DE-23-1-06SM1-DE-23-2-06
SM1-DE-23-3-06SM1-DE-23-4-06
SM2-DE-23-1 SM2-DE-23-2
SM2-DE-23-3SM2-DE-23-4
SM1-AT-47-1-06SM1-AT-47-3-06SM1-AT-47-5-06
SM1-AT-47-6-06
SM2-AT-47-1 SM2-AT-47-3SM2-AT-47-5
SM2-AT-47-6SM2-AT-47-6
SM1-CH-01-2-06SM1-CH-01-5-06SM1-CH-01-7-06SM1-CH-01-8-06
SM2-CH-01-2SM2-CH-01-5
SM2-CH-01-7
SM2-CH-01-8SM1-IT-04-2-06SM1-IT-04-4-06 SM2-IT-04-2
SM1-DE-21-1
SM1-DE-21-2
SM1-DE-21-3
SM1-DE-21-4SM1-DE-21-5
SM1-DE-21-6
SM1-DE-23-1
SM1-DE-23-2
SM1-DE-23-3
SM1-DE-23-4SM1-CH-01-2SM1-CH-01-5 SM1-CH-01-7 SM1-CH-01-8
SM1-AT-47-1
SM1-AT-47-3
SM1-AT-47-5
SM1-AT-47-6
SM1-AT-47-6
SM1-IT-04-2 -0.1
-0.3
-0.4
-0.6
0.1
0.3
0.4
0.6
0.7
-0.1-0.3-0.4-0.6 0.1 0.3 0.4 0.6 0.7
summer winter summer
½ year ½ year
1 year deployment

Results and Discussion
88
Analyzing the results obtained at the altitude profiles for both ½ year deployment periods
(Period 1 and 2), a similar pattern is observed for each altitude profile for the compounds
o,p´-DDT, p,p´-DDT, and the cyclodiene pesticides cis-chlordane, dieldrin and α- and β-
endosulfan. The Period 3 also presents the same pattern at each altitude profile as the Periods
1 and 2 for these specified compounds (Figure 3-27). It is also remarkable that the sum of
compounds accumulated in Period 1 and Period 2 approaches very well the amount of these
chemicals accumulated in the whole year (Period 3). We can infer for these compounds that
the membrane devices are still working as kinetic samplers due to the additivity of the Period
1 and 2 when comparing to Period 3. By use of these passive devices, the total accumulation
for these chemicals through the year can be measured in order to obtain an annual average
value for them. They have high Koa values (Koa >8 at 5° C) that determine large affinity for the
triolein phase and also lower vapour pressure in comparison to other pesticides such as PeCB
and HCB. The accumulation of these compounds is also characterized by a tendency to higher
values at heights above 1400 m a.s.l. in the altitude profile. As an example, the altitude
profiles for p,p´ DDT and dieldrin are plotted in Figure 3-27.
In the case of p,p´-DDE the Period 3 assembles the pattern of Period 2 where the
accumulation of compounds in the Period 3 is even lower than the accumulation in Period 1.
o,p´-DDE shows an intermediate behaviour between the DDT isomers and p,p´-DDE; the
profile patterns are similar for periods 1, 2 and 3 but the amount of o,p´-DDE accumulated in
the annual period is lower than the sum of both ½ year exposure periods (Figure 3-28). It may
be that DDE compounds are more easily exchanged through the membrane device than e.g.
DDT compounds and the elimination rate acquires importance. The passive sampler devices
of Periods 2 and 3 are sampled together and a similarity in the pattern of the height profile in
these periods is determined. This similarity can be related to the stage of the uptake
(curvilinear uptake or proximity to the equilibrium) for DDE compounds in passive samplers
of Periods 2 and 3.

Results and Discussion
89
0
1000
2000
3000
4000
5000
6000
1134 1470 1779 3100 1410 1600 2540 2663 830 1030 1230 1450 1650 2650 805 1005 1210 1420 1305
Altitude profiles (m a.s.l.)
Con
cent
ratio
n of
p,p
´ DD
T (n
g kg
-1 tr
iole
in) Period 1 Period 2 Period 3 Sum of periods 1 + 2
0
1000
2000
3000
4000
1134 1470 1779 3100 1410 1600 2540 2663 830 1030 1230 1450 1650 2650 805 1005 1210 1420 1305
Altitude profiles (m a.s.l.)
Con
cent
ratio
n of
Die
ldrin
(ng
kg-1
trio
lein
)
Period 1 Period 2 Period 3 Sum of period s 1 + 2
Figure 3-27: a) p,p´-DDT and b) dieldrin concentrations at the altitude profiles for the periods 1, 2 and 3. The sum of periods 1 and 2 is also depicted. Consequently, the results achieved after one year exposure for p,p´-DDE tend to be similar to
the last ½ year exposure (Period 2) in the whole height profile (Figure 3-28). Therefore, we
can not consider the obtained accumulation (Period 3) as the annual accumulation for these
compounds to estimate average concentrations. Proceeding that way it would underestimate
the real concentrations reached at these sampling sites for the DDE isomers.
b)
a)

Results and Discussion
90
0
1000
2000
3000
4000
1134 1470 1779 3100 1410 1600 2540 2663 830 1030 1230 1450 1650 2650 805 1005 1210 1420 1305
Altitude profiles (m a.s.l.)
Con
cent
ratio
n of
p,p
´ DD
E (n
g kg
-1 tr
iole
in) Period 1 Period 2 Period 3 Sum of period s 1 + 2
Figure 3-28: p,p´-DDE concentrations at the altitude profiles for the periods 1, 2 and 3. The sum of periods 1 and 2 is also depicted. PeCB and HCB have similar profile patterns and concentration values for the Periods 2 and 3,
as an example HCB is illustrated (Figure 3-29).
5000
11000
17000
23000
29000
1134 1470 1779 3100 1410 1600 2540 2663 830 1030 1230 1450 1650 2650 805 1005 1210 1420 1305
Altitude profiles (m a.s.l.)
Con
cent
ratio
n of
HC
B (n
g kg
-1 tr
iole
in)
Period 1 Period 2 Period 3 Sum of periods 1 + 2
Figure 3-29: HCB concentrations at the altitude profiles for the periods 1, 2 and 3. The sum of periods 1 and 2 is also depicted.
Due to the lower Koa values of these compounds in comparison to DDT and cyclodiene
pesticides, a membrane controlled uptake could be expected. Low Koa values increase the

Results and Discussion
91
membrane resistance for the mass transfer regarding the overall resistance. This implies that
the whole mass transfer process is limited by this step generating a membrane control uptake
stage.
Regarding α-HCH and γ-HCH there is no similarity between the patterns of the periods 1, 2
and 3. As a general tendency both isomers decreased in their concentrations in the Period 2
meanwhile the annual period (Period 3) increases significantly at altitudes above 1600 m a.s.l.
(Figure 3-30). There is an accumulation increase in the period 3 at higher points of the altitude
profile and this accumulation tends to reach the sum of the concentrations in Periods 1 and 2
(above 1600 m a.s.l.). In spite of Period 3 not having pattern similarities with the other
periods, it describes the same pattern at both profiles for both isomers; higher SPMD
sequestering at higher sites of the altitude profile.
Applying the division for OCP in 3 groups concerning the different uptake stage used in
Section 3.4.1, it is confirmed the same grouping at the different seasons and also at the
different altitudes. The first group was defined as the α,γ-HCH isomers which accumulated
similar amount of compounds after ½ and 1 ½ year deployment in CSB and showed an
accumulation increase in SPMD. This accumulation is non linear after 1 year deployment.
However, it is remarkable the tendency to the linear uptake stage at higher altitude sites in the
profile where the annual accumulation (Period 3) resembles the sum of the other two periods.
This could be related to the lower mean temperatures at higher sites (Sites above 1600 m a. s.
l.) that favour the uptake and retention of these compounds within the membrane.
Following with this classification, PeCB and HCB (second group), accumulated in SPMD at
lower amounts at longer deployment periods are only representative for average air
concentrations for periods of ½ year or even shorter. Even ½ year deployments seem to
indicate a deviation from the linear uptake stage. The use of Performance Reference
Compounds would be useful to determine the current uptake stage for these compounds in
SPMD. The third group defined as the rest of OCP are in the linear uptake stage after ½ year
deployment but the loss of linearity after 1 year deployment is observable for some
compounds, such as DDE, situation discussed above.

Results and Discussion
92
500
1500
2500
3500
4500
5500
1134 1470 1779 3100 1410 1600 2540 2663 830 1030 1230 1450 1650 2650 805 1005 1210 1420 1305
Altitude profiles (m a.s.l.)
Con
cent
ratio
n of
alfa
-HC
H (n
g kg
-1 tr
iole
in) Period 1 Period 2 Period 3 Sum of periods 1 + 2
Figure 3-30: α-HCH concentrations at the altitude profiles for the periods 1, 2 and 3. As a general conclusion, lower temperatures imply more compound accumulation where
lower temperatures can be determined by seasonal or altitudinal conditions. In case of
compounds that exhibit a steady state in the SPMD, this relationship is direct because the
compound accumulation is direct proportional to the Koa of the compound (equation 11, page
25). As higher Koa are observed at lower temperatures for a determined compound, higher
compound accumulation is achieved. In case of linear uptake, at lower temperatures the
uptake of compounds tends to be membrane controlled. The transient cavities of the LDPE
membrane are thermally mediated cavities, decreasing the polymer movement at lower
temperatures. As a consequence, the LDPE membrane is the most difficult barrier to
overcome in the overall mass transfer process, generating membrane control uptake
conditions. Therefore, the general mass transfer equation (equation 5) indicates also an
increase of sequestering capacity at lower temperatures. According to the mass transfer
coefficient model (equations 4 and 5), more membrane resistance causes higher membrane
resistance coefficient (Km) that generates higher overall resistance (Ko), implying higher total
mass coefficient (KT). As a result, the exponential negative term of equation 5 decreases,
generating an increase in the overall equation values, thus higher device accumulation
capacities. In the altitudinal gradients, this effect is generated by two factors: lower
temperatures and generally, higher wind speeds at the higher altitude sites of the profiles. The
highest wind speeds are expected to be at the highest points of the latitude profile, generating
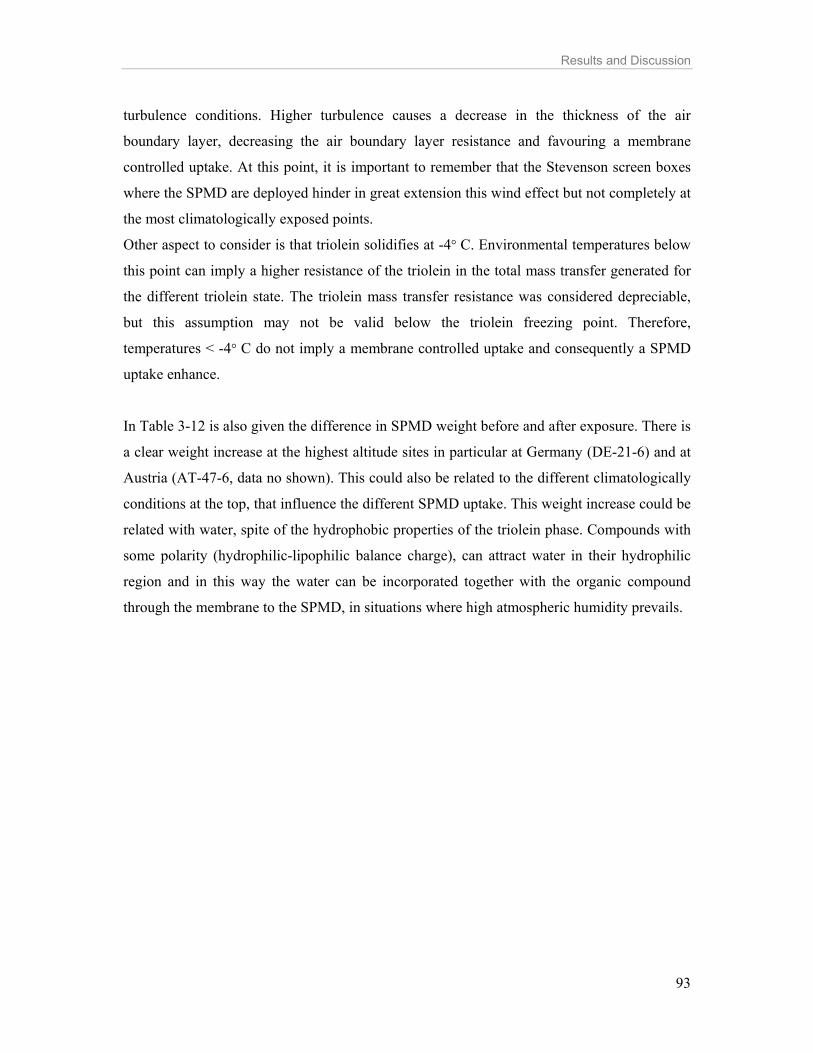
Results and Discussion
93
turbulence conditions. Higher turbulence causes a decrease in the thickness of the air
boundary layer, decreasing the air boundary layer resistance and favouring a membrane
controlled uptake. At this point, it is important to remember that the Stevenson screen boxes
where the SPMD are deployed hinder in great extension this wind effect but not completely at
the most climatologically exposed points.
Other aspect to consider is that triolein solidifies at -4° C. Environmental temperatures below
this point can imply a higher resistance of the triolein in the total mass transfer generated for
the different triolein state. The triolein mass transfer resistance was considered depreciable,
but this assumption may not be valid below the triolein freezing point. Therefore,
temperatures < -4° C do not imply a membrane controlled uptake and consequently a SPMD
uptake enhance.
In Table 3-12 is also given the difference in SPMD weight before and after exposure. There is
a clear weight increase at the highest altitude sites in particular at Germany (DE-21-6) and at
Austria (AT-47-6, data no shown). This could also be related to the different climatologically
conditions at the top, that influence the different SPMD uptake. This weight increase could be
related with water, spite of the hydrophobic properties of the triolein phase. Compounds with
some polarity (hydrophilic-lipophilic balance charge), can attract water in their hydrophilic
region and in this way the water can be incorporated together with the organic compound
through the membrane to the SPMD, in situations where high atmospheric humidity prevails.
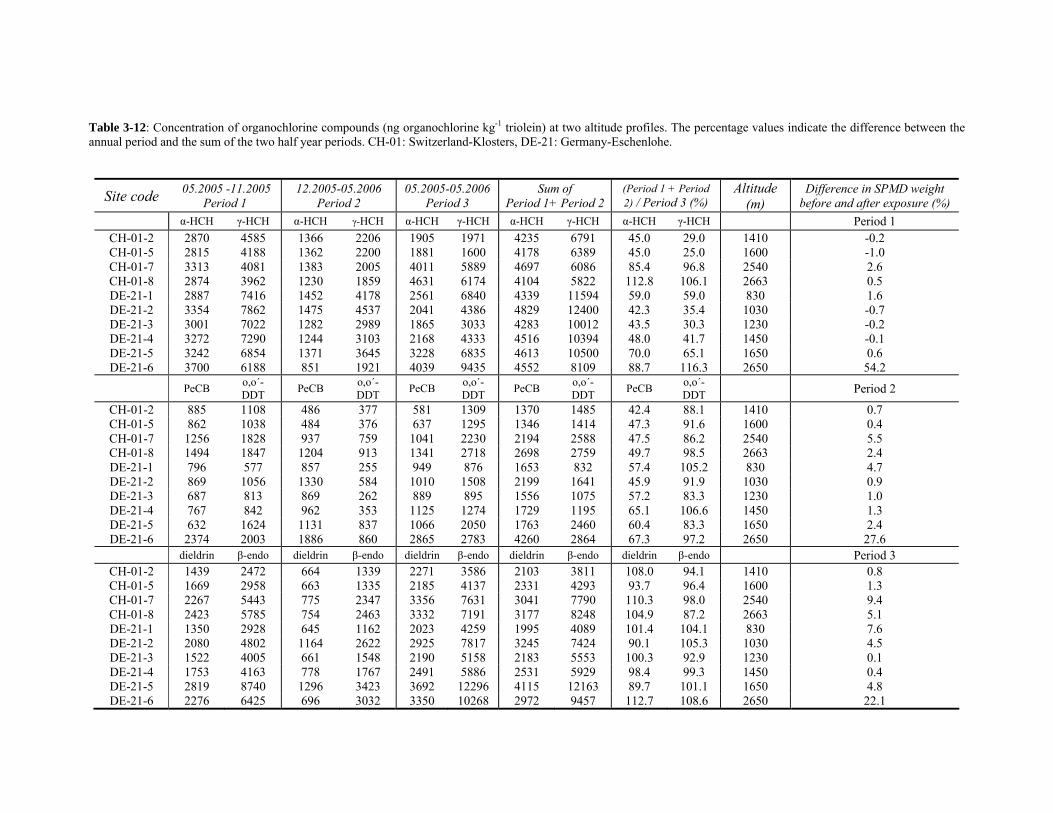
Table 3-12: Concentration of organochlorine compounds (ng organochlorine kg-1 triolein) at two altitude profiles. The percentage values indicate the difference between the annual period and the sum of the two half year periods. CH-01: Switzerland-Klosters, DE-21: Germany-Eschenlohe.
Site code 05.2005 -11.2005 Period 1
12.2005-05.2006 Period 2
05.2005-05.2006 Period 3
Sum of Period 1+ Period 2
(Period 1 + Period 2) / Period 3 (%)
Altitude (m)
Difference in SPMD weight before and after exposure (%)
α-HCH γ-HCH α-HCH γ-HCH α-HCH γ-HCH α-HCH γ-HCH α-HCH γ-HCH Period 1 CH-01-2 2870 4585 1366 2206 1905 1971 4235 6791 45.0 29.0 1410 -0.2 CH-01-5 2815 4188 1362 2200 1881 1600 4178 6389 45.0 25.0 1600 -1.0 CH-01-7 3313 4081 1383 2005 4011 5889 4697 6086 85.4 96.8 2540 2.6 CH-01-8 2874 3962 1230 1859 4631 6174 4104 5822 112.8 106.1 2663 0.5 DE-21-1 2887 7416 1452 4178 2561 6840 4339 11594 59.0 59.0 830 1.6 DE-21-2 3354 7862 1475 4537 2041 4386 4829 12400 42.3 35.4 1030 -0.7 DE-21-3 3001 7022 1282 2989 1865 3033 4283 10012 43.5 30.3 1230 -0.2 DE-21-4 3272 7290 1244 3103 2168 4333 4516 10394 48.0 41.7 1450 -0.1 DE-21-5 3242 6854 1371 3645 3228 6835 4613 10500 70.0 65.1 1650 0.6 DE-21-6 3700 6188 851 1921 4039 9435 4552 8109 88.7 116.3 2650 54.2
PeCB o,o´-DDT PeCB o,o´-
DDT PeCB o,o´-DDT PeCB o,o´-
DDT PeCB o,o´-DDT Period 2
CH-01-2 885 1108 486 377 581 1309 1370 1485 42.4 88.1 1410 0.7 CH-01-5 862 1038 484 376 637 1295 1346 1414 47.3 91.6 1600 0.4 CH-01-7 1256 1828 937 759 1041 2230 2194 2588 47.5 86.2 2540 5.5 CH-01-8 1494 1847 1204 913 1341 2718 2698 2759 49.7 98.5 2663 2.4 DE-21-1 796 577 857 255 949 876 1653 832 57.4 105.2 830 4.7 DE-21-2 869 1056 1330 584 1010 1508 2199 1641 45.9 91.9 1030 0.9 DE-21-3 687 813 869 262 889 895 1556 1075 57.2 83.3 1230 1.0 DE-21-4 767 842 962 353 1125 1274 1729 1195 65.1 106.6 1450 1.3 DE-21-5 632 1624 1131 837 1066 2050 1763 2460 60.4 83.3 1650 2.4 DE-21-6 2374 2003 1886 860 2865 2783 4260 2864 67.3 97.2 2650 27.6
dieldrin β-endo dieldrin β-endo dieldrin β-endo dieldrin β-endo dieldrin β-endo Period 3 CH-01-2 1439 2472 664 1339 2271 3586 2103 3811 108.0 94.1 1410 0.8 CH-01-5 1669 2958 663 1335 2185 4137 2331 4293 93.7 96.4 1600 1.3 CH-01-7 2267 5443 775 2347 3356 7631 3041 7790 110.3 98.0 2540 9.4 CH-01-8 2423 5785 754 2463 3332 7191 3177 8248 104.9 87.2 2663 5.1 DE-21-1 1350 2928 645 1162 2023 4259 1995 4089 101.4 104.1 830 7.6 DE-21-2 2080 4802 1164 2622 2925 7817 3245 7424 90.1 105.3 1030 4.5 DE-21-3 1522 4005 661 1548 2190 5158 2183 5553 100.3 92.9 1230 0.1 DE-21-4 1753 4163 778 1767 2491 5886 2531 5929 98.4 99.3 1450 0.4 DE-21-5 2819 8740 1296 3423 3692 12296 4115 12163 89.7 101.1 1650 4.8 DE-21-6 2276 6425 696 3032 3350 10268 2972 9457 112.7 108.6 2650 22.1

Results and Discussion
95
3.5.3 Accumulation of OCP in the matrices soil, needles and SPMD in the altitude profiles
In the previous section 3.5.2, a tendency to higher sequestering of OCP at higher elevated
sites of profiles was observed in SPMD (Figure 3-26). If PCA is performed with humus
results, the same tendency is achieved as seen in figure 3-31.
PCA case scores
PC 2
PC 1
DE-21-1
DE-21-2
DE-21-3
DE-21-4
DE-21-5
DE-23-1
DE-23-2
DE-23-3
DE-23-4
AT-47-1
AT-47-2 AT-47-3
AT-47-4
AT-47-5
AT-57-1
AT-57-2
AT-57-3
AT-57-4
AT-57-5
CH-01-1
CH-01-2CH-01-4
CH-01-5
CH-01-6IT-04-1
IT-04-3IT-04-4
SL-34-1
SL-34-2
SL-34-3
SL-34-4
-0.2
-0.4
-0.5
-0.7
-0.9
0.2
0.4
0.5
0.7
0.9
-0.5-0.9 0.5 0.9 1.4 1.9 2.4
Figure 3-31: PCA case scores (31) of OCP (18). PC 1 accounts for 65.5 % and PC 2 for 9.2 % of the variability (74.7 % of the total). Higher subplots numbers indicate higher sites at the altitude profile.
The blue circle on the right of the graphic embraces the highest altitude sites of the profiles
where soil samples were taken. Two outliers are also observed (orange circles). These two
sampling sites (DE-21-02: Germany, 1030 m a.s.l. and Sl-34-02: Slovenia, 1354 m a.s.l.)
exhibit higher pollutant loading and different distribution of pollutants than the rest of the soil
samples. This could indicate punctual sources of OCP pollutants at these two points, thus
these sites are not remote sampling points regarding pesticides or the soil matrix is
significantly different and no comparable to the rest of the samples. Regarding organic carbon
content, nitrogen content and pH, these soil samples are similar to the others (data no shown).
Therefore, possible local sources of OCP in these areas, in the present or in the last decade,
altitude increase

Results and Discussion
96
have to be checked out. Different geographical characteristics for these altitude profiles could
also determine the observed differences.
Performing a cluster analysis with the same humus soil samples, the previous result is
confirmed and a new observation can be added (Figure 3-32). The blue circle indicates the
higher altitude profile sites, the orange circles, the 2 outliers and the green circle points out a
cluster related to samples at an intermediate height (1400 to 1600 m a.s.l.), where also a
tendency to different SPMD uptake behaviour was found. The exception within this last
mentioned group is the sample IT-04-1.
Figure 3-32: Cluster analysis of OCP in humus soil samples (UPGMA). Altitude profiles, sampling 2004.
If OCP concentrations along the altitude profiles where the outliers belong to; are depicted,
higher loadings at the outlier sites (DE-21-2 and Sl-34-2) are observed (Figure 3-33). As an
example, HCH isomer concentrations are represented, but these higher loadings at these
intermediate heights were also observed for other pesticides.
highest altitude sites
outliers
possible inversion layer
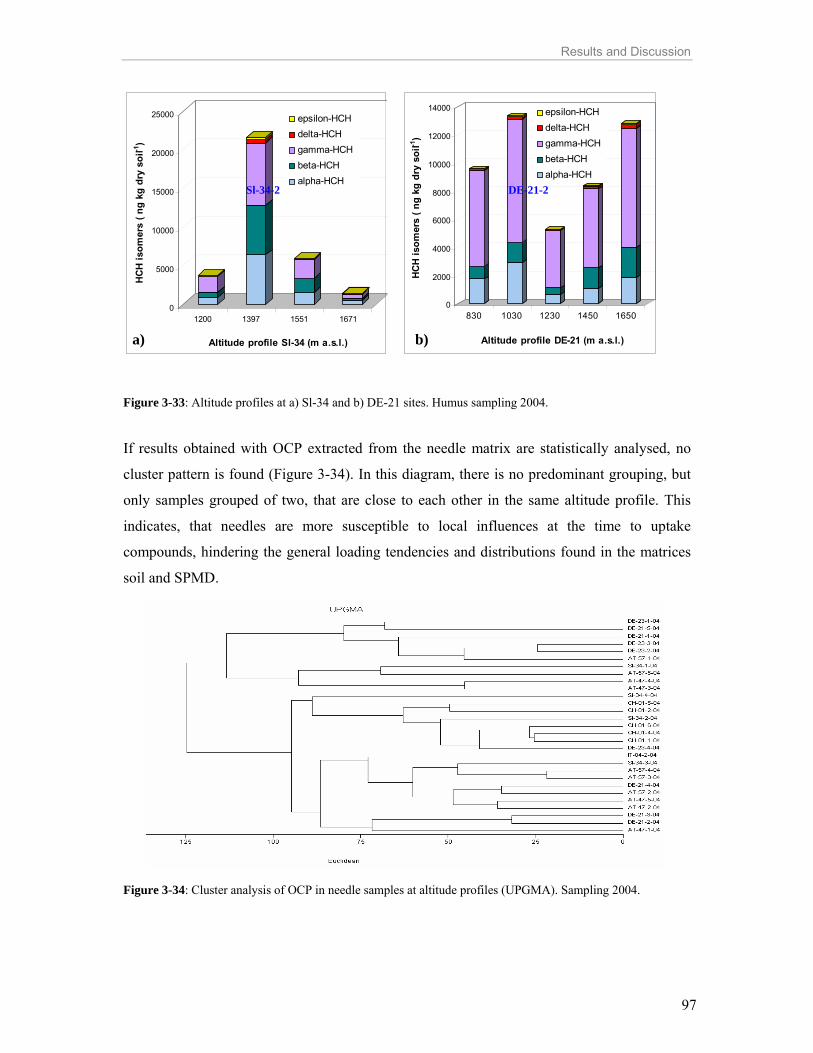
Results and Discussion
97
0
5000
10000
15000
20000
25000
HC
H is
omer
s ( n
g kg
dry
soi
l-1)
1200 1397 1551 1671
Altitude profile Sl-34 (m a.s.l.)
epsilon-HCHdelta-HCH gamma-HCH beta-HCH alpha-HCH
0
2000
4000
6000
8000
10000
12000
14000
HCH
isom
ers
( ng
kg d
ry s
oil-1
)
830 1030 1230 1450 1650
Altitude profile DE-21 (m a.s.l.)
epsilon-HCHdelta-HCH gamma-HCH beta-HCH alpha-HCH
Figure 3-33: Altitude profiles at a) Sl-34 and b) DE-21 sites. Humus sampling 2004.
If results obtained with OCP extracted from the needle matrix are statistically analysed, no
cluster pattern is found (Figure 3-34). In this diagram, there is no predominant grouping, but
only samples grouped of two, that are close to each other in the same altitude profile. This
indicates, that needles are more susceptible to local influences at the time to uptake
compounds, hindering the general loading tendencies and distributions found in the matrices
soil and SPMD.
Figure 3-34: Cluster analysis of OCP in needle samples at altitude profiles (UPGMA). Sampling 2004.
a) b)
Sl-34-2 DE-21-2

Results and Discussion
98
3.6 Brief approach to the passive sampling performance
3.6.1 Use of performance reference compounds in SPMD SPMD, spiked with 13C-PAH and 13C12-PCDD PRC, were deployed for different periods. The
table 3-13 shows the recovery percentage of 13C-PAH PRC in the analysed SPMD after
different exposure times. Also included is an unexposed spiked SPMD (control) deployed in a
sealed flask and analysed after 404 hours.
Table 3-13: 13C-PAH recovery (%) after different deployment times.
Deployment (hours) PRC 19 44 116 188 404 Control
(404 hours)
Anthracene-13C6 77 82 77 68 31 72 Benzo(a)pyrene-13C4 58 62 61 58 62 69 Benz(g,h,i)perylene-13C12 73 72 73 72 81 91
Regarding the high molecular weight PAH, 13C-BaP and 13C-BghiP, the amounts of recovery
standards are constant during all the deployment periods. Comparing these percentages with
the control percentages, there are no noticeable PCR losses for the high molecular weight
PAH in the studied period. The low molecular weight PAH 13C-AN, for the analysed period,
seems to be adequate. Regarding PCDD-PRC, the lower molecular weight PCDD showed a
decrease of 50 % at the end of the exposure period. Surprisingly, the higher chlorinated
PCDD were not detectable even after 19 hours exposure (Table 3-14). The results were
proven by duplicate analyses.
This fact is in disagreement with the PAH results, considering the higher MW of the Hepta-
and HexaCDD in comparison to BaP and BghiP that are not released significantly from the
SPMD. Taking into account the higher lipophilicity of PCDD for the triolein phase and their
lower volatility no clear explanation has been found to assume that these compounds are
released so fast to the environment in comparison to the lower chlorinated PCDD. One
possibility is that these compounds undergo indirect photodegradation. These compounds are
usually attached to particles in the atmosphere, but in the present experiment these
compounds are not sorpted to any surface. This could imply a higher vulnerability to undergo
degradation. Photodegradation studies (UV radiation, wave length range 300-400 nm,
irradiation intensity 50 W m-2) carried out in different oils with HpCDD demonstrated the fast
degradation of this congener (Isosaari et al., 2005).
This photodegradation-effect was already suggested by Bartkow et al., (2004) for the PRC
anthracene and pyrene in studies performed in the field, even assuming degradation of the
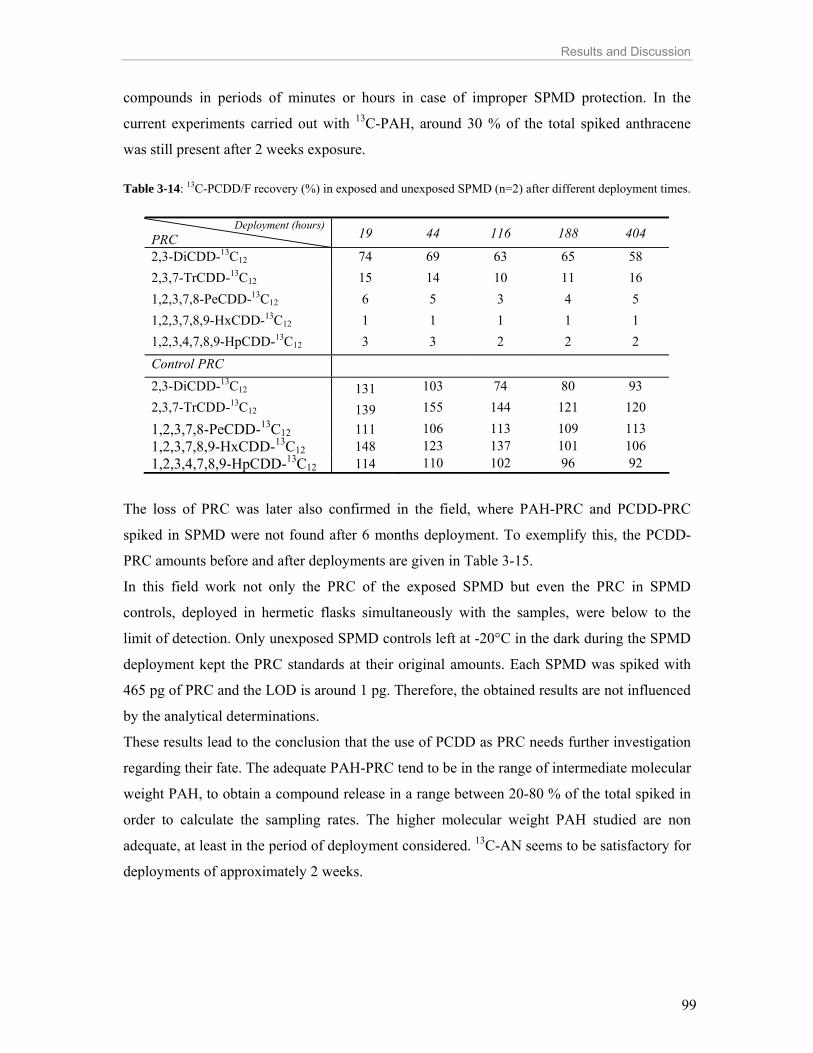
Results and Discussion
99
compounds in periods of minutes or hours in case of improper SPMD protection. In the
current experiments carried out with 13C-PAH, around 30 % of the total spiked anthracene
was still present after 2 weeks exposure.
Table 3-14: 13C-PCDD/F recovery (%) in exposed and unexposed SPMD (n=2) after different deployment times.
Deployment (hours) PRC 19 44 116 188 404
2,3-DiCDD-13C12 74 69 63 65 58 2,3,7-TrCDD-13C12 15 14 10 11 16 1,2,3,7,8-PeCDD-13C12 6 5 3 4 5 1,2,3,7,8,9-HxCDD-13C12 1 1 1 1 1 1,2,3,4,7,8,9-HpCDD-13C12 3 3 2 2 2 Control PRC 2,3-DiCDD-13C12 131 103 74 80 93 2,3,7-TrCDD-13C12 139 155 144 121 120 1,2,3,7,8-PeCDD-13C12 111 106 113 109 113 1,2,3,7,8,9-HxCDD-13C12 148 123 137 101 106 1,2,3,4,7,8,9-HpCDD-13C12 114 110 102 96 92
The loss of PRC was later also confirmed in the field, where PAH-PRC and PCDD-PRC
spiked in SPMD were not found after 6 months deployment. To exemplify this, the PCDD-
PRC amounts before and after deployments are given in Table 3-15.
In this field work not only the PRC of the exposed SPMD but even the PRC in SPMD
controls, deployed in hermetic flasks simultaneously with the samples, were below to the
limit of detection. Only unexposed SPMD controls left at -20°C in the dark during the SPMD
deployment kept the PRC standards at their original amounts. Each SPMD was spiked with
465 pg of PRC and the LOD is around 1 pg. Therefore, the obtained results are not influenced
by the analytical determinations.
These results lead to the conclusion that the use of PCDD as PRC needs further investigation
regarding their fate. The adequate PAH-PRC tend to be in the range of intermediate molecular
weight PAH, to obtain a compound release in a range between 20-80 % of the total spiked in
order to calculate the sampling rates. The higher molecular weight PAH studied are non
adequate, at least in the period of deployment considered. 13C-AN seems to be satisfactory for
deployments of approximately 2 weeks.

Results and Discussion
100
Table 3-15: 13C-PCDD/F amounts in exposed and unexposed SPMD.
Initial concentration (pg SPMD-1)
SPMDfield exposed
SPMDfield unexposed
SPMD-20°C unexposed
2,3-DiCDD-13C12 465 465 465 2,3,7-TrCDD-13C12 465 465 465 1,2,3,7,8-PeCDD-13C12 465 465 465 1,2,3,7,8,9-HxCDD-13C12 465 465 465 1,2,3,4,7,8,9-HpCDD-13C12 930 930 930
Final concentration (pg SPMD-1)
SPMDfield exposed
SPMDfield unexposed
SPMD-20°C unexposed
2,3-DiCDD-13C12 < 1 < 1 465 2,3,7-TrCDD-13C12 < 1 < 1 465 1,2,3,7,8-PeCDD-13C12 < 1 < 1 465 1,2,3,7,8,9-HxCDD-13C12 < 1 < 1 465 1,2,3,4,7,8,9-HpCDD-13C12 < 1 < 1 930
3.6.2 Calculation of sampling rates Sampling rates were calculated with field data at 2 sampling sites located at the top of altitude
profiles (CH-01-8 and AT-47-6). The compounds chosen were those that exhibited the
highest concentrations in all the active campaigns and those that were still in the linear
uptake. The α- and γ-HCH isomers were included, because as discussed before, they seem to
be still in the linear uptake stage at these altitude profile sites. This is a semi-quantitative
approach because no PRC were used to perform the calculations. Anyway, the study allows us
to analyse the sampling rates in different seasons at 2 different sampling sites, in order to
detect possible differences. The sampling rates can be regarded as a theoretic amount of air
exchanged in a determined time, where higher values reflect more air exchange capacity of
the SPMD. These deployment periods were already described in section 3.5, where higher
SPMD accumulation in the Period 1 in comparison with Period 2 was observed for
compounds in the linear uptake stage. This is also concordant with the sampling rate values
depicted in Table 3-16, where higher sampling rates are observed in Period 1 than in Period 2,
being the Period 3 (that embraces the other two periods) an intermediate situation.
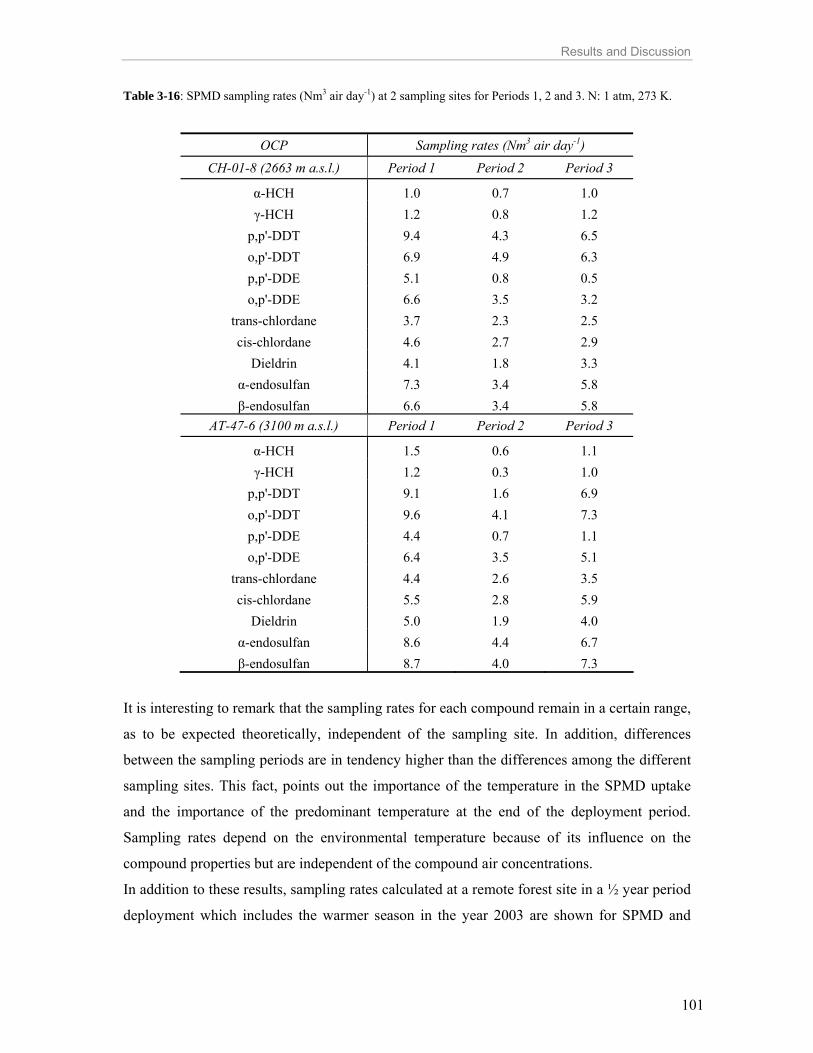
Results and Discussion
101
Table 3-16: SPMD sampling rates (Nm3 air day-1) at 2 sampling sites for Periods 1, 2 and 3. N: 1 atm, 273 K.
OCP Sampling rates (Nm3 air day-1)
CH-01-8 (2663 m a.s.l.) Period 1 Period 2 Period 3
α-HCH 1.0 0.7 1.0 γ-HCH 1.2 0.8 1.2
p,p'-DDT 9.4 4.3 6.5 o,p'-DDT 6.9 4.9 6.3 p,p'-DDE 5.1 0.8 0.5 o,p'-DDE 6.6 3.5 3.2
trans-chlordane 3.7 2.3 2.5 cis-chlordane 4.6 2.7 2.9
Dieldrin 4.1 1.8 3.3 α-endosulfan 7.3 3.4 5.8 β-endosulfan 6.6 3.4 5.8
AT-47-6 (3100 m a.s.l.) Period 1 Period 2 Period 3
α-HCH 1.5 0.6 1.1 γ-HCH 1.2 0.3 1.0
p,p'-DDT 9.1 1.6 6.9 o,p'-DDT 9.6 4.1 7.3 p,p'-DDE 4.4 0.7 1.1 o,p'-DDE 6.4 3.5 5.1
trans-chlordane 4.4 2.6 3.5 cis-chlordane 5.5 2.8 5.9
Dieldrin 5.0 1.9 4.0 α-endosulfan 8.6 4.4 6.7 β-endosulfan 8.7 4.0 7.3
It is interesting to remark that the sampling rates for each compound remain in a certain range,
as to be expected theoretically, independent of the sampling site. In addition, differences
between the sampling periods are in tendency higher than the differences among the different
sampling sites. This fact, points out the importance of the temperature in the SPMD uptake
and the importance of the predominant temperature at the end of the deployment period.
Sampling rates depend on the environmental temperature because of its influence on the
compound properties but are independent of the compound air concentrations.
In addition to these results, sampling rates calculated at a remote forest site in a ½ year period
deployment which includes the warmer season in the year 2003 are shown for SPMD and

Results and Discussion
102
coated bars (Table 3-17). Note that these sampling rates were calculated directly with the field
values and were not standardised at normal conditions (N) of 1 atm and 273 K.
Table 3-17: SPMD and coated bar sampling rates (m3 air day-1) at Haidel, ½ year deployment.
Haidel (1160 m a.s.l.) Sampling rates (m3 air day-1)
Compound SPMD (26.05.03-16.10.03) Coated bars (26.05.03-16.10.03)
α-HCH 0.86 0.05 γ-HCH 1.3 0.10
p,p'-DDT 4.9 0.16 o,p'-DDT 3.6 - p,p'-DDE 4.2 0.11 o,p'-DDE 1.5 0.04
trans-chlordane 2.6 0.10 cis-chlordane 5.1 0.23
Dieldrin 4.0 0.12 α-endosulfan 7.6 0.26 β-endosulfan 12.1 0.28
The SPMD sampling rates are similar to those obtained at higher sites in mountainous areas.
These sampling rates are representative of the summer period and are in tendency higher than
those obtained in Period 2 (November 2005-May 2006) that finished in late spring (Table 3-
16). For the compounds still expected to be in the linear stage at lower altitude sites, DDT,
chlordane, dieldrin and endosulfan, except for this last one, lower sampling rates than in
Period 1 (May-November 2005) are determined. It is possible, that in spite of the favoured
mass transfer through the membrane at higher temperatures, the lower Koa values also
determined by higher temperatures cause lower sampling rates as a predominant effect.
Regarding stir bars, the Rs obtained are lower than the rates obtained in SPMD. As the
sampling rate is related to the sampler design, this is concordant with the fact of the lower
surface area (approximately 50 times) and accumulation volume (around 4.5 times) of coated
stir bars in relation to SPMD.

Results and Discussion
103
3.6.3 Calculation of fugacity values
Compounds in equilibrium between two compartments exhibit equal fugacity values in them.
The compounds HCB and PeCB are supposed to be in steady stage in SPMD after ½ year
deployment. Therefore, calculating the fugacity values for these compounds in SPMD and air,
this assumption can be evaluated (Table 3-18). The calculation of fugacity values is based on
the theory described in Appendix I.
Table 3-18: Fugacity values (Pa) in air and SPMD.
OCP Fugacity values (Pa)
CH-01-8 (2663 m a.s.l.) fair fSPMD Period 1 fSPMD Period 2
HCB 4.4 x 10⁻¹⁰ 1.1 x 10⁻¹¹ 5.1 x 10⁻¹² PeCB 2.9 x 10⁻¹⁰ 1.3 x 10⁻¹¹ 1.1 x 10⁻¹¹
AT-47-6 (3100 m a.s.l.) fair fSPMD Period 1 fSPMD Period 2
HCB 4.1 x 10⁻¹⁰ 1.0 x 10⁻¹¹ 7.5 x 10⁻¹² PeCB 2.9 x 10⁻¹⁰ 1.4 x 10⁻¹¹ 1.3 x 10⁻¹¹
Haidel (1160 m a.s.l.) fair fSPMD autumn
HCB 5.3 x 10⁻¹⁰ 1.0 x 10⁻¹¹ - PeCB 2.4 x 10⁻¹⁰ 7.3 x 10⁻¹² -
Although air fugacities are slightly higher than SPMD fugacities, they can be considered
equivalent if it is taken into account the errors generated during the environmental sampling,
analytical measurements and calculation estimations. Lower SPMD than air fugacity values
indicate higher affinity of the compounds to be sequestered in the SPMD. The air fugacity
values are very similar for all the analysed sites. This is concordant with the fact that these
compounds are wide-spread and homogeneously distributed in the atmosphere. As the air
fugacity is a function of the air concentration and compound properties, the similar air
concentrations caused the similar air fugacity values obtained. Air fugacities were calculated
with the autumn TWA concentrations. In the case of SPMD, the SPMD fugacities were
calculated in the Period 1 (May 2005-November 2005) and the Period 2 (November 2005-
May 2006). The SPMD fugacities of HCB and PeCB were higher in the Period 1 than in
Period 2 indicating the minor feasibility to be released from the triolein phase in the Period 2.
In conclusion, fugacity values in SPMD of Period 1 and air are comparable (steady state). In

Results and Discussion
104
addition, lower fugacity values when the temperature over the deployment time increases
(Period 2) were determined.
3.7 Bioassay Determinations In this part of the study, the micro-EROD bioassay results are discussed and compared to the
analytical determinations (Paper IV). Following this, the results obtained after participating in
an inter-laboratory trial to assess and validate the new yeast-based assay are shown. At last,
results of environmental samples using both bioassays are interpreted as a final example.
3.7.1 Dioxin-like compounds in soils: Comparison of analytical measurements and bioassay determinations Forest systems are able to uptake organic lipophilic compounds into the needle compartment
(McLachlan and Horstmann, 1998) and these are transferred to the forest litter, being
accumulated in the soil (Howsam et al., 2001). Due to this, forested mountainous areas act as
deposition regulators of POP. This section describes the results of a micro-EROD bioassay
conducted in humus and mineral soil samples from the Bavarian forest and the Alpine
regions. In addition, the quantitative analysis of PCDD/F, PCB and PAH family of
compounds is carried out and set in comparison with the bio-analytical results. The analytical
results are given as Toxic Equivalent values (TEQ) according to WHO (1998) in order to
compare them with the EROD results calculated as toxicity equivalent values (TE values) ng
TCDD kg-1dry soil. Compounds that still elicit a response after 72 hours incubation in the
EROD bioassay are defined as persistent and the results are compared with the TEQ-WHO
sum of PCDD/F and PCB. After 24 hours incubation the TE value is related to all the
compounds able to elicit a response (persistent and non-persistent compounds) and the EROD
results are compared with the TEQ-WHO sum of PCDD/F, PCB and also PAH. Finally, it is
important to remark, that the toxicological potential of the environmental sample is much
more complex than the theoretically defined TEQ values, and thus the following comparison
is an approximation. A direct relationship is not necessarily expected due to the potential
presence of further compounds of similar agonism and/or antagonism.
Bioassays performed with extracts from needles and SPMD matrices were not able to give a
quantifiable response. All humus samples as well as the mineral soil samples elicited a
response in the micro-EROD bioassay. As an example, the induction after 24 hours is
depicted for two altitudinal profiles in the alpine region (Figure 3-35).
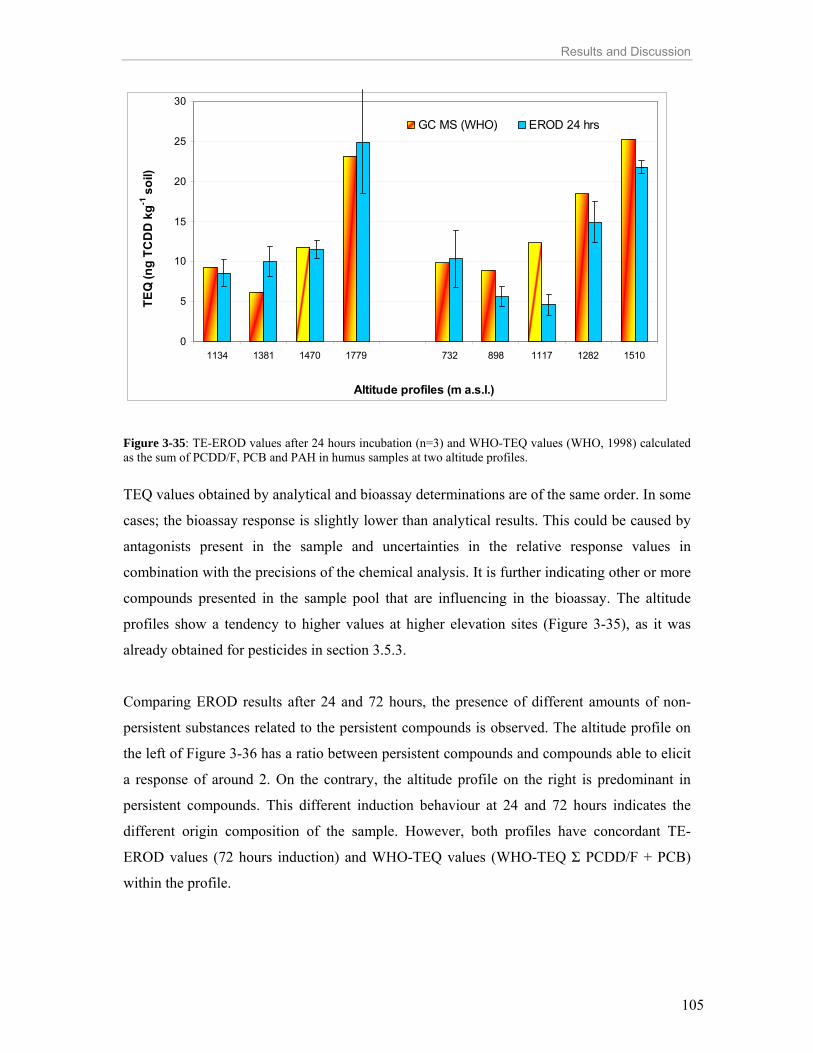
Results and Discussion
105
0
5
10
15
20
25
30
1134 1381 1470 1779 732 898 1117 1282 1510
Altitude profiles (m a.s.l.)
TEQ
(ng
TCD
D k
g-1 s
oil)
GC MS (WHO) EROD 24 hrs
Figure 3-35: TE-EROD values after 24 hours incubation (n=3) and WHO-TEQ values (WHO, 1998) calculated as the sum of PCDD/F, PCB and PAH in humus samples at two altitude profiles. TEQ values obtained by analytical and bioassay determinations are of the same order. In some
cases; the bioassay response is slightly lower than analytical results. This could be caused by
antagonists present in the sample and uncertainties in the relative response values in
combination with the precisions of the chemical analysis. It is further indicating other or more
compounds presented in the sample pool that are influencing in the bioassay. The altitude
profiles show a tendency to higher values at higher elevation sites (Figure 3-35), as it was
already obtained for pesticides in section 3.5.3.
Comparing EROD results after 24 and 72 hours, the presence of different amounts of non-
persistent substances related to the persistent compounds is observed. The altitude profile on
the left of Figure 3-36 has a ratio between persistent compounds and compounds able to elicit
a response of around 2. On the contrary, the altitude profile on the right is predominant in
persistent compounds. This different induction behaviour at 24 and 72 hours indicates the
different origin composition of the sample. However, both profiles have concordant TE-
EROD values (72 hours induction) and WHO-TEQ values (WHO-TEQ Σ PCDD/F + PCB)
within the profile.

Results and Discussion
106
0
5
10
15
20
25
1410 1520 1700 1123 1553 1656
Altitude profiles (m a.s.l.)
TEQ
(ng
TCD
D k
g-1 s
oil)
Total (WHO) EROD 72 EROD 24
Figure 3-36: TE-EROD values after 24 hours and 72 incubation (n=3) and WHO-TEQ values (WHO, 1998) calculated as the sum of PCDD/F and PCB WHO-TEQ in humus samples at two altitude profiles. TEQ values of PCDD/F were higher than the TEQ values of PCB in all samples. In Figure 3-
37 the results obtained for humus samples in TE values for EROD in comparison to WHO-
TEQ calculated for the analytical determinations are plotted. Higher values in the EROD
bioassays are expected than in the analytical determinations because the bioassay quantifies
the response of the environmental sample as a whole. As a consequence, more chemicals than
those calculated by means of the analytical determinations are eliciting response in the
bioassay. This is the general trend observed in Figure 3-37 where the majority of the plotted
points are found close or above the dividing line that indicates the equivalence for both
determinations. TE values of persistent compounds (those that are still present after 72 hours
incubation in the bioassay) are similar to the TE values determined by analytical
determinations. Therefore, there is not an important loading of unknown compounds in the
studied areas and there is major concordance between the bioassay results and the analytical
determinations.

Results and Discussion
107
0
2
4
6
8
10
12
14
16
18
20
0 2 4 6 8 10 12 14 16 18 20
WHO-TEQ GC MS
TE v
alue
(ng
TCD
D K
g-1 d
ry s
oil)
ERO
D
Figure 3-37: TE-EROD values (n=3) after 72 hours incubation and WHO-TEQ values (WHO, 1998) calculated as the sum of PCDD/F and PCB WHO-TEQ from the analytical determinations of 31 humus samples from Norway spruce forest sites. However, 3 points are clearly located below the line of equivalence. We have to consider that
some compounds found in the sample can elicit a slight antagonistic response in the EROD
bioassay (Hofmaier, 1999). In this situation, the total induction of the AhR decreases,
resulting in lower bioassay activity. These humus samples with higher TEQ values obtained
by quantitative determination than in the bioassay are representing three samples with higher
concentrations of PCB. PCB are known to act as weak antagonistic substances when they are
found at high concentrations (Schlezinger et al., 2006). The WHO-TEQ PCB values (ng PCB
kg-1 dry soil) for these 3 samples are, 4.3, 3.9 and 4.6 in comparison to the mean of the
samples 1.7 ± 1.2 (WHO-TEQ ng PCB kg-1dry soil). Analysing the isomer concentration
distribution in the samples, higher PCB concentrations in particular for the non-ortho isomers
PCB 77 and PCB 126 are observed in these outlying samples. This could be a reason of
slightly lower values obtained in the EROD bioassay. Hoffmaier, (1999) analyse the effect of
some non-ortho and mono-ortho PCB in the micro-EROD bioassay finding an inhibitory
effect in the bioassay activation when these compounds were added with the inducer TCDD.
The concentrations of PCB used by Hoffmaier in the EROD bioassay, were of equivalent
order than the PCB concentrations here found. Subsequent studies showed that some non-

Results and Discussion
108
ortho PCB as PCB 77, PCB 126 and PCB 153 inactivate the cytochrome CYP1A1 and this
inactivation is dependent on the PCB concentration (Binelli et al., 2006; Schlezinger et al.,
2006).
In the case of the humus and mineral soil samples analysed from the Bavarian and Bohemian
forests, higher concentrations of PCB and TCDD/F were found. Figure 3-38 shows that the
humus samples from these sites with higher PCB concentrations show a tendency to lower TE
values in the EROD activity than the total WHO-TEQ of the analytical results.
0
10
20
30
40
50
60
Bh Bm Hh Hm Rh Rm Mh Mm
Sampling sites
TEQ
(ng
com
poun
d kg
-1 dr
y so
il)
WHO-TEQ PCDD/F+PCB WHO-TEQ PCB TE EROD 72 hrs
Figure 3-38: TE-EROD values after 72 hours incubation and WHO-TEQ values (WHO, 1998) for PCDD/F and PCB. EROD data points are the mean values of 3 replicates. Site codes: H: Haidel, B: Boubin, R: Ruckowitzschachten and M: Mitterfels. h: humus and m: mineral soil. A tendency to lower EROD values than TEQ values is observed, especially in samples with
relatively high non-ortho PCB to mono-ortho PCB concentrations (See samples Hh and Mh in
Figures 3-38 and 3-39). This finding indicates that variations in the amounts of non-ortho
PCB could have more influence on the EROD activity, although being at lower concentrations
(at least 10 fold less) than mono-ortho PCB. However, it is also probable that the combination
of mono- and non-ortho PCB compounds have an influence in the obtained results. Non-ortho
PCB have a similar molecular structure (coplanar) as PCDD/F and this implies that this kind
of compounds interact more easily in the mechanisms of Ah receptor affinity compared to
other PCB congeners. This interaction seems to generate a larger inhibitory effect than the
EROD activation generated by other PCB compounds at much higher concentrations.

Results and Discussion
109
0
200
400
600
800
Bh Bm Hh Hm Rh Rm Mh Mm
Sampling sites
non-
orth
o PC
B (n
g kg
-1 d
ry s
oil )
0
1000
2000
3000
4000
5000
6000
7000
8000
mon
o-or
tho
PCB
(ng
kg-1dr
y so
il)
non-orthomono-ortho
Figure 3-39: non-ortho PCB and mono-ortho PCB concentration values in humus and mineral soils at H: Haidel, B: Boubin, R: Ruckowitzschachten and M: Mitterfels 4. h: humus and m: mineral soil. To exemplify and reaffirm this, concentrations of PCB 126 and TE-EROD values in humus
soils from the Alpine region are plotted. Higher concentrations of this co-planar PCB are
associated to lower EROD inductions (Figure 3-40).
0
10
20
30
40
1 3 5 7 9 11 13 15 17 19 21 23 25 27 29
Sampling sites
PCB
#12
6 (n
g PC
B k
g-1dr
y so
il)
0
2
4
6
8
10
12
14
16
18
20
ERO
D a
ctiv
ity (n
g TC
DD
kg-1
dry
soil)
PCB #126EROD 72
Figure 3-40: Concentrations of PCB 126 and TE-EROD values in 29 humus samples form the alpine region.
In this work, the relationship between analytical and bio-analytical results for persistent
compounds is discussed with respect to PCB and PCDD/F present in the sample. Despite of a
good correlation between PCDD/F and PCB concentrations and EROD activity, deviations

Results and Discussion
110
from the expected results indicate additional factors influencing them. We can infer that the
EROD activity decreases at high concentrations of PCB or other antagonists detected in the
sample. On the other hand, in remote places far away from sources, the EROD bioassay gives
a proper estimation of the overall CYP1A1 induction potential of the samples. The
comparison between bio-analytical and analytical results allows us to identify samples where
additional contamination with other chemicals is indicated. When the bio-analytical results
are lower than the analytical PCB-PCDD/F equivalent results, the presence of high
concentrations of PCB compounds or antagonistic modulators could be possible.
3.7.2 Inter-comparison of estrogenicity in water by means of yeast-based assays The objective of the participation in this inter-laboratory was to determine the suitability,
robustness and variability of the new yeast-based bioassay to assess endocrine disrupters in
environmental samples. Results obtained at the Institute of Ecological Chemistry are shown
together with other participant laboratories which used others recombinant yeast strains and
methods for the reference standard 17β-Estradiol 10 nM. This standard was provided as an
“unknown sample” to all participating laboratories. Results are the mean value of 6 batches
and the results obtained at the Institute of Ecological Chemistry correspond to laboratory 7
(Figure 3-41, red arrow). A good performance in accuracy and precision in the standard
measurement was achieved.
Mean values (n=6) of the 11 environmental samples analysed are plotted against the expected
values. It is observed again the good accuracy obtained using the new developed bioassay at
the Institute of Ecological Chemistry (Figure 3-42). These two graphics were provided after
the inter-laboratory report deadline by Dr. Rikke Brix (SWIFT deliverable D23: Inter-
comparison of estrogenicity in water determined by yeast-based bioassays). Department of
Environmental Chemistry, IIQAB-CSIC, Spain.

Results and Discussion
111
Estradiol 10 nM
0
2
4
6
8
10
12
14
16
18
20
0 1 2 3 4 5 6 7 8
Laboratories
Mea
sure
d va
lues
(nM
)
Figure 3-41: Inter-laboratory reported results on the sample 10 nM Estradiol (n=6). Laboratory 7 corresponds to results obtained at the German Research Center of Environmental Health.
y = 0,932xR² = 0,992
0
5
10
15
20
25
30
0 5 10 15 20 25 30
Ave
rage
of m
easu
red
valu
es (n
M)
Expected values (EEF for NP and Genistein determined by lab)
Laboratory 7
Figure 3-42: Correlation between expected and measured values for laboratory 7.
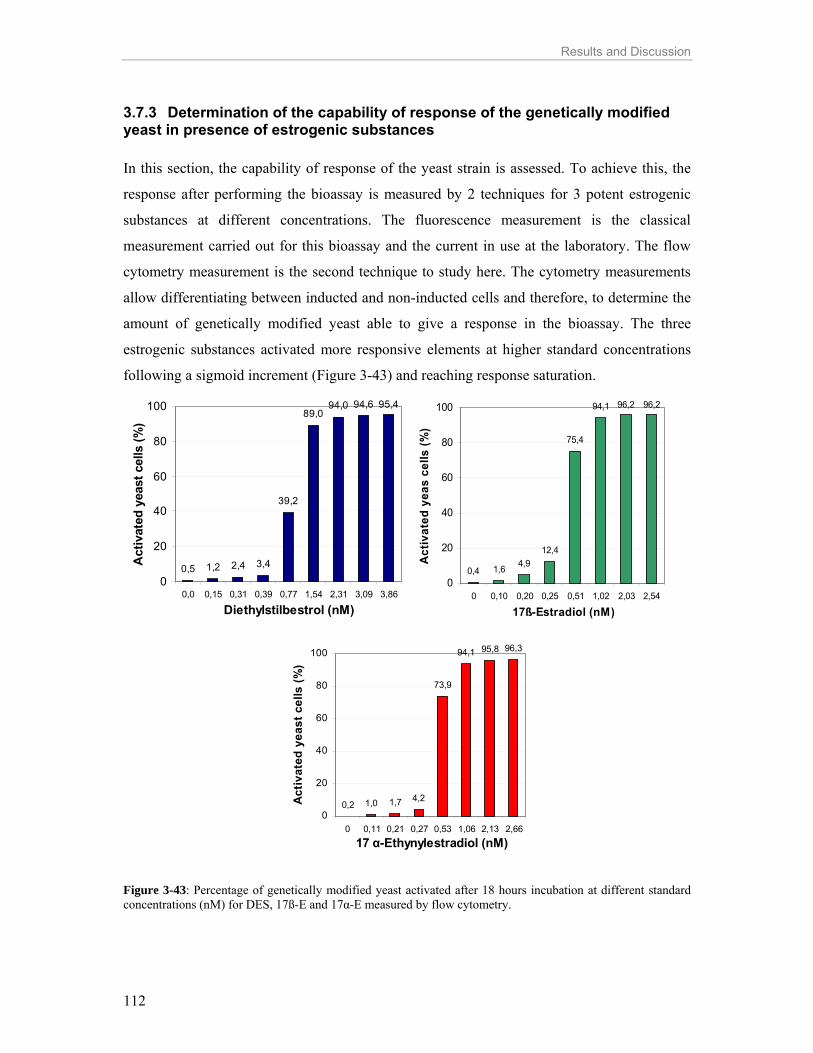
Results and Discussion
112
3.7.3 Determination of the capability of response of the genetically modified yeast in presence of estrogenic substances In this section, the capability of response of the yeast strain is assessed. To achieve this, the
response after performing the bioassay is measured by 2 techniques for 3 potent estrogenic
substances at different concentrations. The fluorescence measurement is the classical
measurement carried out for this bioassay and the current in use at the laboratory. The flow
cytometry measurement is the second technique to study here. The cytometry measurements
allow differentiating between inducted and non-inducted cells and therefore, to determine the
amount of genetically modified yeast able to give a response in the bioassay. The three
estrogenic substances activated more responsive elements at higher standard concentrations
following a sigmoid increment (Figure 3-43) and reaching response saturation.
0,5 1,2 2,4 3,4
39,2
89,094,0 94,6 95,4
0
20
40
60
80
100
0,0 0,15 0,31 0,39 0,77 1,54 2,31 3,09 3,86
Diethylstilbestrol (nM)
Act
ivat
ed y
east
cel
ls (%
)
0,4 1,6 4,912,4
75,4
94,1 96,2 96,2
0
20
40
60
80
100
0 0,10 0,20 0,25 0,51 1,02 2,03 2,54
17ß-Estradiol (nM)
Act
ivat
ed y
eas
cells
(%)
0,2 1,0 1,7 4,2
73,9
94,1 95,8 96,3
0
20
40
60
80
100
0 0,11 0,21 0,27 0,53 1,06 2,13 2,6617 α-Ethynylestradiol (nM)
Act
ivat
ed y
east
cel
ls (%
)
Figure 3-43: Percentage of genetically modified yeast activated after 18 hours incubation at different standard concentrations (nM) for DES, 17ß-E and 17α-E measured by flow cytometry.

Results and Discussion
113
For the flow cytometry measurements two populations are defined after excitation; population
1 (P1) is the inactivated population and population 2 (P2) is the activated population. Each
measurement included approximately 2 x 10⁵ yeast cells. The measurement of fluorescence
given for the activated P2 in the total measured population (P1+P2) determines the specific
activation of the sample (Fluorescence per 2 x 10⁵ cell counts). The background level of
excitation after incubation (amount of P2 population in the blank) was up to 0.5 % of the total
yeast population and is considered acceptable. Dose-response curves are calculated by iteration with fluorescence measurements performed
in the luminescence multi-well plate reader (Figure 3-44a) and by flow cytometry (Figure 3-
44b). The results showed the lower potency of DES in comparison to 17ß-E and 17α-E in
both type of measurements. Higher concentrations of DES standards were necessary to
achieve similar responses in the dose-response curves to those achieved with 17ß-E and 17α-
E standards. Higher sensitivity in the induction is related to lower EC50 values and better
sensitivity was obtained by flow cytometry as shown in Table 3-19. Lower EC50 values also
mean higher drug potency. The drug potency for 17ß-E and 17α-E are close enough that the
different measurement methods determine different order in their drug potency (Table 3-19).
One explanation to this result is the measurement error inherent to the applied methods.
Another possible reason is the incubation time. The estrogenic standards have a maximal
response that is time dependant and this optimal incubation time is not coincident for all of
them. The fluorescence measurements are not only considering the amount of cells that are
fluorescing but fluorescence per well simultaneously for the 3 substances in the 96 well plate.
As a consequence, it is possible that the response decreases for 17ß-E because of the shift
from the optimal read out. Therefore, the slope of the 17ß-E has lost steepness due to the loss
of response as seen in Figure 3-44a. Further studies at different incubation times would be
necessary to verify these results.
Table 3-19: EC50 values for dose-response curves after 18 hours incubation for DES, 17ß-E and 17α-E (nM). Response determined as fluorescence per well (n=6) and activated cells in the total cell population.
Compound DES 17ß-E 17α-E EC50 flow cytometry 0.84 0.39 0.50 EC50 fluorescence 1.21 0.83 0.60

Results and Discussion
114
0
400
800
1200
1600
2000
2400
0,01 1
log Conc(nM )
Ex/E
m 5
35-4
85DES
17 ß
17 α
STDs DES
STDs 17 ß
STDs 17 α
EC50 DES
EC50 17 ß
EC50 17 α
0
5000
10000
15000
20000
0,01 1
log Conc(nM )
Act
ivat
ed y
east
pop
ulat
ion
(Ex/
Em 5
35-4
85) DES
17 ß
17 α
STDs DES
STDs 17 ß
STDs 17 α
EC50 DES
EC50 17 ß
EC50 17 α
Figure 3-44: Dose-response curves after 18 hours incubation for DES, 17ß-E and 17α-E (nM). a) Fluorescence per well (n=6). b) Activated cells P2 in the total cell population.
a)
b)

Results and Discussion
115
3.7.4 AhR inducers and endocrine disrupters in forested mountain areas The general trend is higher responses in bioassays performed with humus soils than with
mineral soils. Table 3-20 gives the mean response values for the EROD bioassay (n=3) and
the yeast based estrogenic bioassay (n=3).
Table 3-20: EROD results after 72 hours incubation ( pg TCDD EQ/ g dry soil) and estrogenic activity ( pg 17ß- Estradiol/ g dry soil) in humus (HUM) and mineral (MSL) soils (n=3).
Sampling Code EROD TE-value (pg TCDD/g dry soil) SD Estrogenicity
(pg 17ß-E EQ/g dry soil) SD
HUM-CH-01-2 9.6 0.9 0.45 0.05 HUM-CH-01-4 5.1 1.2 0.24 0.01 HUM-CH-01-6 9.5 0.5 0.39 0.10 HUM-SL-33-0 6.8 1.5 0.61 0.24 HUM-SL-34-1 3.1 0.8 0.34 0.01 HUM-SL-34-2 5.3 1.9 0.36 0.03 HUM-SL-34-3 3.7 0.9 0.30 0.01 HUM-SL-34-4 5.2 0.9 0.25 0.01 HUM-IT-04-1 2.7 0.8 0.26 0.03 HUM-IT-04-3 5.9 0.5 0.28 0.07 HUM-IT-04-4 2.6 0.2 0.19 0.07 HUM-AT-47-1 2.7 0.5 0.59 0.14 HUM-AT-47-2 4.0 0.2 0.54 0.13 HUM-AT-47-3 2.4 0.6 0.44 0.13 HUM-AT-47-5 14.5 4.2 0.47 0.13 MSL-AT-47-1 < 1 - n.d. - MSL-AT-47-3 3.0 0.9 n.d. - MSL-AT-47-5 3.2 1,1 n.d. - HUM-AT-57-1 3.8 1.1 0.42 0.06 HUM-AT-57-2 2.1 0.6 0.37 0.04 HUM-AT-57-3 3.0 0.6 0.35 0.04 HUM-AT-57-4 4.1 1.1 0.31 0.03 HUM-AT-57-5 6.1 0.2 0.37 0.02 MSL-AT-57-2 < 1 - n.d. - MSL-AT-57-4 6.3 1.2 0.18 0.01 MSL-AT-57-5 4.6 1.1 0.18 0.04 HUM-DE-21-1 6.9 1.8 0.43 0.07 HUM-DE-21-2 17.7 0.1 0.42 0.01 HUM-DE-21-3 9.8 2.6 0.34 0.03 HUM-DE-21-4 11.7 3.4 0.37 0.07 HUM-DE-21-5 14.4 4.3 0.42 0.07 HUM-DE-23-1 5.0 0.5 0.44 0.17 HUM-DE-23-2 6.5 0.6 0.45 0.07 HUM-DE- 23-3 4.5 1.8 0.44 0.12 HUM-DE-23-4 8.5 3.0 0.39 0.01 MSL-DE-23-3 13.4 4.1 0.09 0.02
This effect was also observed in the analytical determinations, where humus soil
concentrations were higher than mineral soil concentrations. There is no correlation between
both bioassays but the samples that were below the limit of quantification in the EROD
bioassay were also the same samples difficult to detect the estrogenic response in the yeast-

Results and Discussion
116
based assay. There is no trend in concentrations at the altitude profiles for estrogenic response
results. The tendency to higher EROD values at the highest points of the altitude profiles is
not observed for the estrogenicity values. EROD and estrogenic yeast based studies performed
by Xiao et al. (2006) in soils from an industrialised area gave a mean of 2.5 ± 2.6 pg 17ß-E
EQ g-1 dry soil and 10.4 ± 7.6 pg TCDD g-1 dry soil, meanwhile the mean values obtained in
the current study are 0.37 ± 0.12 pg 17ß-E EQ g-1 dry soil and 6.1 ± 4.2 pg TCDD g-1 dry soil.
Lower values in the remote areas were expected, but it is clear the higher relative amounts of
AhR inducers than ER disrupters, indicating the higher abundance of persistent dioxin-like
compounds than endocrine inducers in the studied forested areas.

Conclusions
117
4. CONCLUSIONS
4.1 Sampling techniques to detect and monitor POP This study revealed the suitability of semi permeable membrane devices and coated stir bars
as passive air samplers in mountainous regions for qualitative and semi-quantitative
determinations of persistent organic pollutants. It is also shown that the results obtained by
the passive sampling methods depend on several parameters, such as the physicochemical
properties of the compounds of interest, time of exposure, temperature and variations of the
temperature (seasonal periods) at which the sampling is performed.
SPMD
Lower chlorinated compounds, ΣTetraCDD/Fs and ΣPentaCDD/Fs, presented a good uptake
in SPMD devices, whereas higher chlorinated homologues, OCDF in particular, were hardly
detectable or not present in SPMD after 6 month exposure. SPMD accumulate lower
chlorinated PCDD/Fs, in particular TetraCDD/Fs, due to their ability to uptake compounds
with high Koa values from the gaseous phase.
SPMD deployed consecutively for ½ year, showed a seasonal air variation for PAH
compounds, with higher PAH uptake in winter than in summer. The suitability of the ½ year
deployment as a direct correlation with air concentrations needs supplementary studies with
PRC but the uptake of PAH in SPMD and active samplers after ½ year exposure correlated
linearly. However, SPMD exposed for 1 year exhibited a decrease of low molecular PAH
concentration, in comparison to the 1/2 year exposure. This point out the deviation from the
linear kinetic uptake at longer exposure periods mainly for vapour phase related PAH.
Therefore, for the analyzed PAH, in particular for PAH in the gaseous phase, SPMD
deployments longer than ½ year are not advisable to calculate time weighted average
concentrations. The differences in gas-particle distribution in the two different periods studied
seem to have influenced the uptake of compounds in SPMD due to changes in the dry
deposition process and presence of the PAH in the gaseous phase together with the
temperature differences. A PAH decrease in SPMD was observed in altitude profiles, and no
PAH could be detected at the highest elevated sites, independently of the season and the
deployment time. This is related to the lower concentration of this type of pollutants far from
Conclusions
118
the sources of origin. SPMD was a very feasible tool to accumulate low molecular weight
PAH but high molecular weight PAH (particle bounded) were also detected.
In this study, OCP were divided in 3 groups according to their uptake stage in passive
samplers. The least lipophilic compounds (Koa ≤ 8 at 5° C) with higher volatility were no
longer in the linear phase even before the 1/2 year deployment was over (Group 2: PeCB and
HCB). The most lipophilic compounds were still found in the linear uptake stage, even after 1
year deployment (Group 3: the rest of the analysed OCP with Koa > 8 at 5° C and low
volatility). The Group 1 (α- and γ-HCH isomers) formed an intermediate group between the
other two groups, where the uptake stage was more influenced by the geographical
characteristics (temperature altitudinal gradient) due to the intermediate properties of this
group. To exemplify this, α- and γ- HCH isomers in SPMD deployed for 1 year at higher
altitude sites (above 2000 m a. s. l.) tend to be still in the linear uptake stage, while SPMD
deployed below this altitude height did not. In contrast, compounds that belong to Group 3
were still in the linearly uptaking and Group 2 was close to or in steady state independently of
the site's altitude profile. SPMD deployed 1 year at higher altitude sites tend to act as kinetic
samplers. As a general tendency, an increase of concentration above 1400 m a. s. l. was
observed in all compounds independently of their kinetic behaviour. In particular, pesticides
tend to accumulate at the highest locations of the altitude profiles indicating the long-range
origin of these contaminants.
In summary, SPMD were in different kinetic stages regarding OCP, the SPMD being very
differently influenced by the temperature (thus season of exposure and altitude height of the
sampling site) and inherent properties.
Coated stir bars
PAH, OCP as well as PCB were all accumulated by CSB and the change in the concentrations
after two different exposure times were closely related to the compound properties in
particular Koa and their presence in the gaseous phase. There was no good correlation between
air concentrations determined by active sampling and coated bar accumulation for OCP or
PAH, but for the PCB congeners. CSB and SPMD exhibited a similar performance for the
OCP and PCB families but a very different one for PAH. This confirms that these two passive
samplers were acting differently regarding the mass transfer, which determined the
differences in uptake behaviour. After 1 ½ year deployment, OCP with Koa values higher than
8 were still in the linear uptake so a semi quantitative determination of these compounds

Conclusions
119
would be possible in CSB and SPMD. This could not be applied to the rest of the OCP family,
where deployment times lower than ½ year would be necessary for quantitative or semi-
quantitative determinations. Indicator and mono-ortho PCB presented more accumulation
capability in CSB than in SPMD. Thus, CSB seem to be a promising tool to quantify PCB
after ½ year exposure and for high chlorinated PCB even after 1 ½ year exposure. Regarding
the non-ortho PCB # 126 and # 169, longer exposure deployments are required in CSB to
detect adequately these compounds.
Low molecular weight PAH were not in the linear stage uptake after 1 ½ year exposure in
CSB and as a consequence, a direct extrapolation of air concentrations from the uptake in the
passive sampler was not possible. Shorter deployment periods (1/2 year exposure) are
advisable for PAH determination in these devices.
Natural matrices: needles and soil
½ year old needles collected compounds from all the studied PCDD/F homologue groups and
PCDD/F concentrations determined by active air campaigns and ½ year old needles correlated
well. PCDD/F showed similar distributions at all sampling sites with a shift to lower
chlorinated homologues in aged needles. In the case of PAH, needles exposed longer times
accumulate compounds without significant changes in their distribution patterns.
Needles were less “selective” than SPMD, nonetheless they were able to uptake PCDD/F,
PAH and OCP compounds from both the particle bound and gaseous phase. The
heterogeneity of the matrix leaf did not allow determining tendencies regarding altitudinal
profiles, but the needles gave a qualitative estimation of the existent compounds and tendency
patterns with the time at the local sites.
The matrices humus and soil were the only matrices where all the studied compounds were
found. A tendency to higher loadings at the highest altitudinal points was determined in the
forest soils generating an accumulation of persistent organic pollutants in these remote areas.
Conclusions
120
4.2 Bioassays The matrices SPMD and needles accumulated estrogenic compounds below or close to the
limit of quantification, whereas humus and mineral soil loaded the highest estrogenic
concentrations. Persistent compounds able to induce the AhR receptor were well detected in
soil and in aged needles but not in SPMD. In sum, the best matrices to detect AhR inducers
and ER inducers in the studied areas were humus and mineral soil and therefore, these are the
recommended matrices to perform these bioassays in remote areas.
The new yeast-based estrogenic bioassay was implemented successfully. The estrogenic
values were lower than the EROD values in relation to soils from inhabited regions, and thus,
mountain forested areas accumulated in comparison more AhR inducers than ER disrupters.
In remote areas, the EROD bioassay gave a proper estimation of the overall CYP1A1
induction potential of the sample. The comparison between TEQ of bio-analytical and
analytical results allows identifying additional contamination sources in the soil. As a trend,
these values showed to be higher than the analytical determinations but in the same order of
magnitude. This indicates the existence of lower concentrations of other AhR inducers in
these remote areas not determined by the analytical determinations. In more loaded soils, the
EROD activity decreased at high concentrations of non-ortho PCB or other antagonistic
modulators. In conclusion, lower TEQ-WHO values in the analytical determinations than TE
values in the EROD bioassay indicated contaminant sources acting as AhR agonists in the
studied forested areas.

Future Research Options
121
5. FUTURE RESEARCH OPTIONS
Regarding the passive sampler techniques, a better understanding of the uptake of persistent
organic compounds in these devices, for example by using performance reference compounds,
will be necessary to achieve more precise quantification. In this way, the air concentrations
could be related to the accumulated amounts in SPMD, accomplishing complete
independency of active air sampling. PRC would also allow the optimization of the
deployment periods for CSB and SPMD. The calculation of sampling rates under different in
situ conditions led to an understanding of climatological effects, due to the temperature
variations. Consequently, further studies with PRC should be executed to allow a posterior
quantification of POP in air by the passive techniques coated sir bar and SPMD.
Regarding SPMD, the following points could be addressed in the future to better comprehend
the mechanisms of importance during the compound uptake:
The strong selectivity of SPMD for the gas phase might open new opportunities to distinguish
between gas phase and aerosol by a combination of SMPD and active air sampling. Some
facts, such as the good uptake of high molecular weight PAH and the poor uptake of higher
chlorinated PCDD/F, all of them particle bound compounds, are interesting to address and to
understand.
Unusual findings, such as the increase of more than 25-50 % of the total weight in SPMD
after aerial deployment are worth to be investigated, in particular the climatological
conditions that favour this extra uptake and the possible influences on the accumulation of
compounds into the device.
The possible indirect photodegradation of performance reference compounds in triolein, as
well as possible secondary products, would be important to understand in order to assure a
correct calculation of SPMD rates, and therefore, accurate determination of the concentrations
in air of POP.
Regarding bioassays, flow cytometry can be seen as a future possibility to perform yeast-
based estrogenic measurements. EROD responses in relationship to the analytical
determinations deserve further research in order to determine persistent compounds that at
different concentrations (environmental levels) give agonistic or slightly antagonistic
responses.
Bibliography
122
6. BIBLIOGRAPHY
Alves de Lima Ribeiro F, Ferreira M, Castro M. 2003. QSPR models of boiling point, octanol-water partition coefficient and retention time index of polycyclic aromatic hydrocarbons. Journal of Molecular Structure, 663: 109-126. Arey J, Zielinska B, Atkinson R, Winer A M. 1987. Polycyclic aromatic hydrocarbon and nitroarene concentrations in ambient air during a wintertime high-NOx episode on the Los Angeles basin. Atmospheric Environment, 21: 1437-1444. Arthur C L, Pawliszyn J. 1990. Solid Phase Microextraction with thermal desorption using fused silica optical fibers. Analytical Chemistry, 62: 2145-2148. Andersson P L, Blom A, Johannisson A, Pesonen M, Tysklind M, Berg A H, Olsson P-E, Norrgren L. 1999. Assessment of PCBs and hydroxylated PCBs as potential xenoestrogens: In vitro studies based on MCF-7 cell proliferation and induction of vitellogenin in primary culture of rainbow trout hepatocytes. Archives of Environmental Contamination and Toxicology, 37: 145-150. Ballschmiter K, Zell M. 1980. Analysis of polychlorinated biphenyls (PCB) by glass capillary gas chromatography. Fresenius Journal of Analytical Chemistry, 302: 20-31. Baltussen E, Sandra P, David F, Cramers C. 1999. Stir Bar Sorptive Extraction (SBSE), a Novel Extraction Technique for Aqueous Samples: Theory and Principles. Journal of Microcolumn Separations, 11: 737-747. Baltussen E, Cramers C A, Sandra P J F. 2002. Sorptive sample preparation - a review. Analytical and Bioanalytical Chemistry, 373: 3-22. Barber J L, Gareth O T, Kerstiens G, Jones K C. 2004. Current issues and uncertainties in the measurement and modeling of air-vegetation exchange and within plant processing of POPs. Environmental Pollution, 128: 99-138. Bartkow M E, Huckins J N, Müller J F. 2004. Field based evaluation of semipermeable membrane devices (SPMD) as passive air samplers of polyaromatic hydrocarbons (PAHs). Atmospheric Environment, 38: 5983-5990. Bartkow M E, Booij K, Kennedy K E, Müller J F, Hawker D W. 2005. Passive air sampling theory for semivolatile organic compounds. Chemosphere, 60: 170-176. Binelli A, Ricciardi F, Riva C, Provini A. 2006. New evidences for old biomarkers: Effects of several xenobiotics on EROD and AChE activities in Zebra mussel (Dreissena polymorpha) Chemosphere, 62: 510-519. Blair R M, Fang H, William S B, Hass B S, Dial S L, Moland C L, Tong W, Shi L, Perkins R S, Daniel M. 2000. The Estrogen Receptor Relative Binding Affinities of 188 Natural and Xenochemicals: Structural Diversity of Ligands. Toxicological Sciences, 54: 138-153. Bovee T F H, Helsdingen R J R, Koks P D, Kuiper H A, Hoogenboom R L A P, Keijer J. 2004a. Development of a rapid yeast estrogen bioassay, based on the expression of green fluorescent protein. Gene, 325:187-200. Bovee T F H, Helsdingena R J R, Rietjensb I M C M, Keijer J , Hoogenboom R L A P. 2004b. Rapid yeast estrogen bioassays stably expressing human estrogen receptors α and β, and green fluorescent protein: a comparison of different compounds with both receptor types. The Journal of Steroid Biochemistry and Molecular Biology, 91: 99-109. Bovee Toine F H, Heskamp Henri H, Hamers Astrid R M, Hoogenboom Ron L A P, Nielen Michel W F 2005. Validation of a rapid yeast estrogen bioassay, based on the expression of green fluorescent protein, for the screening of estrogenic activity in calf urine. Analytica Chimica Acta, 529: 57-64.

Bibliography
123
Böhme F, Welsch-Pausch K, McLachlan M S. 1999. Uptake of Airborne Semivolatile Organic Compounds in Agricultural Plants: Field Measurements of Interspecies Variability. Environmental Science and Technology, 33: 1805-1813. Breithofer A, Graumann K, Scicchitano M S, Karathanasis S K, Butt T R, Jungbauer A. 1998. Regulation of human estrogen receptor by phytoestrogens in yeast and human cells. The Journal of Steroid Biochemistry and Molecular Biology, 67: 421-429. Calvelo Pereira R, Camps-Arbestain M, Rodríguez Garrido B, Macías F, Monterroso C. 2006. Behaviour of α-, β-, γ-, and δ-hexachlorocyclohexane in the soil–plant system of a contaminated site. Environmental Pollution, 144: 210-217. Cerniglia C E. 1992. Biodegradation of polycyclic aromatic hydrocarbons. Biodegradation, 3: 351-368. Céspedes R, Petrovic M, Raldúa D, Saura U, Lacorte S, Piña B, Viana P, Barceló D. 2004. Integrated procedure for determination of endocrine-disrupting activity in surface waters and sediments by use of the biological technique recombinant yeast assay and chemical analysis by LC-ESI-MS. Analytical and Bioanalytical Chemistry, 378: 697-708. Chen J W, Harner T, Schramm K-W, Quan X, Xue X Y, Wu W Z, Kettrup A. 2002. Quantitative relationships between molecular structures, environmental temperatures and octanol-air partition coefficients of PCDD/Fs. The Science of the Total Environment, 300: 155-166. Chen Y, Pawliszyn, J. 2003. Time-weighted average passive sampling with a solid-phase microextraction device. Analytical Chemistry, 75: 2004-2010. Daly G L, Lei Y D, Teixeira C, Muir D C G, Wania F. 2007. Pesticides in western Canadian mountain air and soil. Environmental Science and Technology, 41: 6020-6025. Dolinováa J, Klánováa J, Klán P, Holoubek I. 2004. Photodegradation of organic pollutants on the spruce needle wax surface under laboratory conditions. Chemosphere, 57: 1399-1407. Días-Cruz M S, López de Alda M J, López R, Barceló D. 2003. Determination of estrogens and progestogens by mass spectrometric techniques (GC/MS, LC/MS and LC/MS/MS). Journal of Mass Spectrometry, 38: 917-923. Donato M T, Gomez-Lechon M J, Castell J V. 1993. A micro assay for measuring cytochrome P450IA1 and P450IIB1 activities in intact human and rat hepatocytes cultured on 96-well plates. Analytical Biochemistry, 213: 29-33. Dzul-Puc J D, Esparza-García F, Barajas-Aceves M, Rodríguez-Vázquez R. 2005. Benzo[a]pyrene removal from soil by Phanerochaete chrysosporium grown on sugarcane bagasse and pine sawdust. Chemosphere, 58: 1-7. Estabrook RW. 1996. The remarkable P450s: a historical overview of these versatile hemoprotein catalysts. FASEB Journal, 10: 202-4. Falconer R L, Bidleman T F. 1994. Vapour pressures and predicted particle/gas distributions of polychlorinated biphenyl congeners as functions of temperature and ortho-chlorine substitution. Atmospheric Environment, 28: 547-554. Finizio A, Mackay D, Bidleman T, Harner T. 1997. Octanol-air partition coefficient as a predictor of partitioning of semi-volatile organic chemicals to aerosols. Atmospheric Environment, 31: 2289-2296. Fujii-Kuriyama Y, Mimura J, Baba T, Morohashi K, Ohtake F, Kato S, Kobayashi Y, Kawajiri K. 2007. Mechanisms of Toxicological and Physological Actions of Arylhydrocarbon Receptor (AhR) in mice. Organohalogen Compounds, 69:10-13. Gioia R, Steinnes E, Thomas G O, Meijer S N, Jones K C. 2006. Persistent organic pollutants in European background air: derivation of temporal and latitudinal trends. Journal of Environmental Monitoring, 8: 700-710.

Bibliography
124
Gong Z M, Tao S, Xu F L, Dawson R, Liu W X, Cui Y H, Cao J, Wang X J, Shen W R, Zhang W J, Qing B P, Sun R. 2004. Level and distribution of DDT in surface soils from Tianjin, China. Chemosphere, 54: 1247-1253. Gorecki T, Namiesnik J. 2002. Passive sampling. Trac-Trends in Analytical Chemistry, 21: 276-291. Hankinson O. 1995. The Aryl Hydrocarbon Receptor Complex. Annual Review of Pharmacology and Toxicology, 35: 307-340. Harner T, Bidleman T F. 1996. Measurements of Octanol-Air Partition Coefficients for Polychlorinated Biphenyls. Journal of Chemical and Engineering Data, 41: 895-899. Harner T, Green N J L, Jones K C. 2000. Measurements of Octanol-Air Partition Coefficients for PCDD/Fs: A Tool in Assessing Air-Soil Equilibrium Status. Environmental Science and Technology, 34: 3109-3114. Harner T, Bidleman T F, Jantunen L M, Mackay D. 2001. Soil-air exchange model of persistent pesticides in the United States Cotton Belt. Environmental Toxicology and Chemistry, 20: 1612-1621. Harner T, Shoeib M, Diamond M, Stern G, Rosenberg B. 2004. Using Passive Air Samplers To Assess Urban-Rural Trends for Persistent Organic Pollutants. I. Polychlorinated Biphenyls and Organochlorine Pesticides. Environmental Science and Technology, 38: 4474-4483. Harner T, Bartkow M, Holoubek I, Klanova J, Wania F, Gioia R, Moeckel C, Sweetman A J, Jones K C. 2006. Passive air sampling for persistent organic pollutants: Introductory remarks to the special issue. Environmental Pollution, 144: 361-364. Heberer T, Dünnbier U. 1999. DDT Metabolite Bis(Chlorophenyl)acetic Acid: The neglected Environmental Contaminant. Environmental Science and Technology, 33: 2346-2351. Hellström A, Kylin H, Strachan W M J, Jensen S. 2004. Distribution of some organochlorine compounds in pine needles from Central and Northern Europe. Environmental Pollution, 128: 29-48. Henkelmann B, Schramm K-W, Klimm C, Kettrup A. 1996. Quality criteria for the isotope dilution method with HRGC/MS. Fresenius Journal of Analytical Chemistry, 354: 818-822. Henkelmann B, Barka A, Schramm K-W. 2007. Evaluation of PDMS-coated stir bars fro the use as passive samplers in the analysis of organochlorine pesticides and polycyclic hydrocarbons in air. Organohalogen Compounds, 69: 718-721. Herceg R S, Krauthacker B. 2006. Distribution of Persistent Organochlorine Compounds in One-Year and Two-Year-Old Pine Needles. Bulletin of Environmental Contamination and Toxicology, 77: 143-148. Hippelein M, Kaupp H, Dörr G, McLachlan M, Hutzinger O. 1996. Baseline contamination assessment for a new resource recovery facility in Germany part II: atmospheric concentrations of PCDD/F. Chemosphere, 32: 1605-1616. Hofmaier A M. 1999. “Evaluierung eines Testsystems auf zellulärer Basis zur Detektion von Dioxinen und verwandten Verbindungen in Matrizes der metallrecyclenden Industrie sowie die Bestimmung der gentoxischen Wirkung dieser Proben“ PhD Thesis. Technical University Munich. Horstmann M, Bopp U, McLachlan M S. 1997. Comparison of the bulk deposition of PCDD/F in a spruce forest and an adjacent clearing. Chemosphere, 34: 1245-1254. Horstmann M, McLachlan M S. 1998. Atmospheric deposition of semivolatile organic compounds to two forest canopies. Atmospheric Environment, 32: 1799-1809. Howsam M, Jones K C, Ineson P. 2001. Dynamics of PAH deposition, cycling and storage in a mixed-deciduous (Quercus-Fraxinus) woodland ecosystem. Environmental Pollution, 113: 163-173. Huckins J N, Manuweera G K, Petty J D, Mackay D, Lebo J A. 1993. Lipid-Containing Semipermeable Membrane Devices for Monitoring Organic Contaminants in Water. Environmental Science and Technology, 27: 2489-2496.

Bibliography
125
Huckins J N, Petty J D, Lebo J A, Almeida F V, Booij K, Alvarez D A, Clark R C, Mogensen B. 2002a. Development of the permeability/performance reference compound approach for in situ calibration of semipermeable membrane devices. Environmental Science and Technology, 36: 85-91. Huckins J N, Petty J D, Prest H F, Clark R, Alvarez D A, Orazio C E, Lebo J A, Cranor W L, Johnson B T. 2002b. A guide for the use of semipermeable membrane devices (SPMDs) as samplers of waterborne hydrophobic organic contaminants. Washington D.C. API no. 4690. Huckins J N, Petty J D, Booij K. 2006. Monitors of Organic Chemicals in the Environment Semipermeable Membrane Devices 1st ed. Ed. Springer, New York. Isosaari P, Tuhkanen T, Vartiainen T. 2004. Photo degradation of polychlorinated dibenzo-p-dioxins and dibenzofurans in soil with vegetable oil. Environmental Science and Pollution Research, 11: 181-185. Jaward F M, Di Guardo A, Nizzetto L, Cassani C, Raffaele F, Ferretti R, Jones K C. 2005. PCBs and Selected Organochlorine Compounds in Italian Mountain Air: the Influence of altitude and Forest Ecosystem Type. Environmental Sciences and Technology, 39: 3455-3463. Katzenellenbogen J A, O’Malley B W, Katzenellenbogen B S. 1996. Tripartite steroid hormone receptor pharmacology: Interaction with multiple effector sites as a basis for the cell- and promoter-specific action of these hormones. Molecular Endocrinology, 10:119-131. Kaupp H, McLachlan M S. 1999. Atmospheric particle size distributions of polychlorinated dibenzo-p-dioxins and dibenzofurans (PCDD/Fs) and polycyclic aromatic hydrocarbons (PAHs) and their implications for wet and dry deposition. Atmospheric Environment, 33: 85-95. Kaupp H, Blumenstock M, McLachlan M S. 2000. Retention and Mobility of Atmospheric Particle-Associated Organic Pollutant PCDD/Fs and PAHs in Maize Leaves. New Phytologist, 148: 473-480. Keith L H. 1997. Environmental endocrine disruptors. A Handbook of Property Data. Ed: Interscience, New York. (p. 419, 429, 504, 576, 593-594, 622 and 639). Kirchner M, Henkelmann B, Gert J, Kotalik J, Fischer N, Oxynos K, Schramm K-W. 2006. Concentration measurements of PCDD/F in air and spruce needles in the Bavarian Forest and Bohemian Forest (Sumava): First results. Ecotoxicology and Environmental Safety, 63: 68-74. Kiss G, Varga-Puchony Z, Rohrbacher G, Hlavay J. 1998. Distribution of polycyclic aromatic hydrocarbons on atmospheric aerosol particles of different sizes. Atmospheric Research, 46: 253-261. Kosubová P, Grabic R, Holoubek I. 2005. Toxaphene and other chlorinated pesticides in the Czech mountain and lowland forest ecosystems. Fresenius Environmental Bulletin, 14:160-166. Kylin H, Hellström A, Nordstrand E, Zaid A. 2003. Organochlorine pollutants in Scots pine needles-biological and site related variation within a forest stand. Chemosphere, 51: 669-675. Kylin H, Sjödin A. 2003. Accumulation of Airborne Hexachlorocyclohexanes and DDT in Pine Needles. Environmental Science and Technology, 37: 2350-2355. Lee R G M, Green N J L, Lohmann R, Jones K C. 1999. Seasonal, Anthropogenic, Air Mass, and Meteorological Influences on the Atmospheric Concentrations of Polychlorinated Dibenzo-p-dioxins and Dibenzofurans (PCDD/Fs): Evidence for the Importance of Diffuse Combustion Sources. Environmental Science and Technology, 33: 2864-2871. Li N, Wania F, Lei Y D, Daly G L. 2003. A comprehensive and critical compilation, evaluation and selection of physical-chemical property data for selected polychlorinated biphenyls. Journal of Physical and Chemical Reference Data, 32: 1545-1590. Lohmann R, Harner T, Thomas G O, Jones K C. 2000. A comparative study of the gas-particle partitioning of PCDD/Fs, PCBs, and PAHs. Environmental Science and Technology, 34: 4943-4951.

Bibliography
126
Lohmann R, Corrigan B P, Howsam M, Jones K C, Ockenden W A. 2001. Further developments in the use of Semipermeable Membrane Devices (SPMDs) as Passive Air Samplers for Persistent Organic Pollutants: Field Application in a Spatial Survey of PCDD/FS and PAHs. Environmental Science and Technology, 35: 2576-2582. Lohmann R, Breivik K, Dachs J, Muir D. 2007. Global fate of POPs: Current and future research directions. Environmental Pollution, 150: 150-165. Mackay D. 1979. Finding fugacity feasible. Environmental Science and Technology, 13: 1218-1223. Maddalena R L, McKone T E, Kado N Y. 2002. Exposure Chamber Measurements of Mass Transfer and Partitioning at the Plant/Air Interface. Environmental Science and Technology, 36: 3577-3585. Martin D, Maran U, Sild S, Karelson M. 2007. QSPR Modelling of Solubility of Polyaromatic Hydrocarbons and Fullerene in 1-Octanol and n-Heptane. Journal of Physical Chemistry B, 111: 9853-9857. McLachlan M S, Horstmann M. 1998. Forests as Filters of Airborne Organic Pollutants: A Model. Environmental Science and Technology, 32: 413-420. Meijer S N, Ockenden W A, Steinnes E, Corrigan B P, Jones K C. 2003. Spatial and temporal trends of POPs in Norwegian and UK background air: Implications for global cycling. Environmental Science and Technology, 37: 454-461. Minh N H, Minh T B, Kajiwara N, Kunisue T, Subramanian A, Iwata H, Tana T S, Baburajendran R, Karuppiah S, Viet P H, Tuyen B C, Tanabe S. 2006. Contamination by persistent organic pollutants in dumping sites of Asian developing countries: implication of emerging pollution sources. Archives of Environmental Contamination and Toxicology, 50: 474-481. Motelay-Massei A, Harner T, Shoeib M, Diamond M, Stern G, Rosenberg B. 2005. Using Passive Air Samplers To Assess Urban-Rural Trends for Persistent Organic Pollutants and Polycyclic Aromatic Hydrocarbons. 2. Seasonal Trends for PAHs, PCBs, and Organochlorine Pesticides. Environmental Science and Technology, 39: 5763-5773. Müller S O. 2002. Overview of in vitro tools to assess the estrogenic and antiestrogenic activity of phytoestrogens. Journal of Chromatography B, 777:155-165. Niu J, Chen J, Henkelmann B, Quan X, Yang F, Kettrup A, Schramm K-W. 2003. Photodegradation of PCDD/Fs adsorbed on spruce (Picea abies (L.) Karst.) needles under sunlight irradiation. Chemosphere, 50: 1217-1225. Ockenden W A, Prest H F, Thomas G O, Sweetman A, Jones K C. 1998. Passive air sampling of PCBs: Field calculation of atmospheric sampling rates by triolein-containing semipermeable membrane devices. Environmental Science and Technology, 32: 1538-1543. Ockenden W A, Corrigan B P, Howsam M, Jones K C. 2001. Further Developments in the use of Semipermeable Membrane Devices as Passive Air Samplers: application to PCBs. Environmental Science and Technology, 35: 4536-4543. Odabasi M, Centin E, Sofuoglu A. 2006. Determination of octanol-air partition coefficients and supercooled liquid vapor pressures of PAHs as a function of temperature: Application to gas-particle partitioning in an urban atmosphere. Atmospheric Environment, 40: 6615-6625. Oheme M. Handbuch Dioxine: Quellen, Vorkommen, Analytik. 1998. Ed Spektrum Akad. Berlin, Germany. Opperhuizen A, van der Volde E W, Gobas F A P C, Liem D A K, van der Steen J M V. 1985. Relationship between bioconcentration in fish and steric factors of hydrophobic chemicals. Chemosphere, 14: 1871-1896. Pagnout C, Rast C, Veber A-M, Poupin P, Férard J-F. 2006. Ecotoxicological assessment of PAHs and their dead-end metabolites after degradation by Mycobacterium sp. strain SNP11. Ecotoxicology and Environmental Safety, 65: 151-158.

Bibliography
127
Pereira W E, Hostettler F D, Rapp J B. 1996. Distributions and fate of chlorinated pesticides, biomarkers and polycyclic aromatic hydrocarbons in sediments along a contamination gradient from a point-source in San Francisco Bay, California. Marine Environmental Research, 41: 225-314. PAN Pesticide Database: http://www.pesticideinfo.org/Index.html Pesticide Data Sheets: http://www.inchem.org/pages/pds.html Petty J D, Huckins J N, Zajicek L. 1993. Application of semipermeable membrane devices (SPMDs) as passive air samplers. Chemosphere, 27: 1609-1624. Petty J D, Orazio C E, Huckins J N, Gale R W, Lebo J A, Meadows J C, Echols K R. Cranor W L. 2000. Considerations involved with the use of semipermeable membrane devices for monitoring environmental contaminants. Journal of chromatography A, 879: 83-95. Piccardo M T, Pala M, Bonaccurso B, Stella A, Redaelli A, Gaudenzio P, Valerio F. 2005. Pinus nigra and Pinus pinaster needles as passive samplers of polycyclic aromatic hydrocarbons. Environmental Pollution, 133: 293-301. Prest H F, Jacobson L A, Huckins J N. 1995. Passive sampling of water and coastal air via semipermeable membrane devices. Chemosphere, 30: 1351-1361. Quintero J C, Moreira M T, Feijoo G, Lema J M. 2005. Effect of surfactants on the soil desorption of hexachlorocyclohexane (HCH) isomers and their anaerobic biodegradation. Journal of Chemical Technology and Biotechnology, 80: 1005-1015. Rahm S, Green N, Norrgran J, Bergman Å. 2005. Hydrolysis of Environmental Contaminants as an Experimental Tool for Indication of Their Persistency. Environmental Science and Technology, 39: 3128-3133. Rappolder M, Schröter-Kermani C, Schädel S, Waller U, Körner W. 2007. Temporal trends and spatial distribution of PCDD, PCDF and PCB in pine and spruce shoots. Chemosphere, 67: 1887-1896. Reynolds G W, Hoff J T, Gillham R W. 1990. Sampling bias caused by materials used to monitor halocarbons in groundwater. Environmental Science and Technology, 24: 135-142. Routledge E J, Sumpter J P. 1996. Estrogenic activity of surfactants and some of their degradation products assessed using a recombinant yeast screen. Environmental Toxicology and Chemistry, 15: 241-248. Routledge E J, Sumpter J P. 1997. Structural features of alkylphenolic chemicals associated with estrogenic activity. Journal of Biological Chemistry, 272: 3280-3288. Rusina T P, Smedes F, Klanova J, Booij K, Holoubek I. 2007. Polymer selection for passive sampling: A comparison of critical properties. Chemosphere, 68: 1344-1351. Schlezinger J J, Struntz W D J, Goldstone J V, Stegeman J J. 2006. Uncoupling of cytochrome P450 1A and stimulation of reactive oxygen species production by co-planar polychlorinated biphenyl congeners. Aquatic Toxicology, 77: 422-432. Schmidt W F, Bilboulian S, Rice C P, Fettinger J C, McConnell L L, Hapeman C J. 2001. Thermodynamic, spectroscopic, and computational evidence for the irreversible conversion of beta- to alpha-endosulfan Journal of Agriculture and Food Chemistry, 49: 5372-5376. Schramm K-W. Reischl A, Hutzinger O. 1987. UNITTree A Multimedia Compartment Model to Estimate the Fate of Lipophilic Compounds in Plants. Chemosphere, 16: 2653-2663. Schröder J, Welsch-Pausch K, McLachlan M S. 1997. Measurement of atmospheric deposition of polychlorinated dibenzo-p-dioxins (PCDDs) and dibenzofurans (PCDFs) to a soil. Atmospheric Environment, 31: 2983-2989.

Bibliography
128
Schröter-Kermani C, Kreft D, Schilling B, Herrchen M, Wagner G. 2006. Polycyclic aromatic hydrocarbons in pine and spruce shoots-temporal trends and spatial distribution. Journal of Environmental Monitoring, 8: 806-811. Schwirzer S M G, Hofmaier A M, Kettrup A, Nerdinger P E, Schramm K-W, Thoma H, Wegenke M, Wiebel F J. 1998. Establishment of a simple cleanup procedure and bioassay for determining 2,3,7,8-Tetrachlorodibenzo-p-dioxin toxicity equivalents of environmental samples. Ecotoxicology and Environmental Safety, 41: 77-82. Shen L, Wania F. 2005. Compilation, evaluation and selection of physical-chemical property data for organochlorine pesticides. Journal of Chemical and Engineering Data, 50: 742-768. Shen L, Wania F, Lei Y D, Teixeira C, Muir D C G, Bidleman T F. 2005. Atmospheric Distribution and Long-Range Transport Behavior of Organochlorine Pesticides in North America. Environmental Science and Technology, 39: 409-420. Shibata H, Spencer T E, Onate S A, Jenster G, Tsai S Y, Tsai M J, O'Malley B W. 1997. Role of co-activators and co-repressors in the mechanism of steroid/thyroid receptor action. Recent Progress in Hormone Research, 52: 141-165. Shoeib M, Harner T. 2001. Using measured octanol-air partition coefficients to explain environmental partitioning of organochlorine pesticides. Environmental Toxicology and Chemistry, 21: 984-990. Shoeib M, Harner T. 2002. Characterization and Comparison of three Passive Air Samplers for Persistent Organic Pollutants. Environmental Science and Technology, 36: 4142-4151. Simonich S L, Hites R A. 1994. Vegetation-Atmosphere Partitioning of Polycyclic Aromatic Hydrocarbons. Environmental Science and Technology, 28: 939-943. Simpson E R, Mahendroo M S, Means G D, Kilgore M W, Hinshelwood M M, Graham- Lorence S, Amarneh B, Ito Y, Fisher C R, Michael M D 1994. Aromatase cytochrome P450, the enzyme responsible for estrogen biosynthesis. Endocrine Reviews, 15: 342-355. Simpson E R, Misso M, Hewitt K N, Hill R A, Boon W C, Jones M E, Kovacic A, Zhou J, Clyne C D. 2005. Estrogen-The Good the Bad and the Unexpected. Endocrine Reviews, 26: 322-330. Sittig, M. 1985. Handbook of toxic and hazardous chemicals and carcinogens. 2nd Edition. N. D. Corporation. Park Ridge, NJ, USA: 487-488. Smith K E C, Jones K C. 2000. Particles and vegetation: implications for the transfer of particle-bound organic contaminants to vegetation. The Science of the Total Environment, 246: 207-236. Söderström H S, Bergqvist P A. 2004. Passive air sampling using semipermeable membrane devices at different wind-speeds in situ calibrated by performance reference compounds. Environmental Science and Technology, 38: 4828-4834. Strotmann U J, Butz B, Bias W R. 1993. The dehydrogenase assay with resazurin: practical performance as a monitoring system and pH-dependent toxicity of phenolic compounds. Ecotoxicology and Environmental Safety, 25: 79-89. Sutherland T D, Home I, Weir K M, Russell R J, Oakeshott J G. 2004. Toxicity and residues of endosulfan isomers. Reviews of Environmental Contamination and Toxicology, 18: 99-113. Thielen D R, Olsen G. 1988. Optimization of Alumina Selectivity for Tetrachlorodibenzo-p-dioxins and the Isomer-Specific Determination of 2,3,7,8-Tetrachlordibenzo-p-dioxin. Analytical Chemistry, 60: 1332-1336. Toppari J, Larsen J C, Christiansen P, Giwercman A, Grandjean P, Guillette L J, Jegou J, Bernard, J T K, Jouannet P, Keiding N, Leffers H, McLachlan J A, Meyer O, Muller J, Rajpert-De M E, Scheike T, Sharpe R, Sumpter J, Skakkebaek N E. 1996. Male Reproductive Health and Environmental Xenoestrogens Environmental Health Perspectives, 104: 741-803. Thrane K E, Mikalsen A. 1981. High-volume sampling of airborne polycyclic aromatic hydrocarbons using glass fiber filters and polyurethane foam. Atmospheric Environment, 15: 909-918.

Bibliography
129
Umlauf G, Hauk H, Reissinger M. 1994. The distribution of semivolatile organic compounds in conifer needles following gas phase contamination. Chemosphere, 28: 1689-1699. Umlauf G, McLachlan M. 1994. Deposition of Semivolatile Organic Compounds to Spruce Needles. Environmental Science and Pollutant Research, 1: 146-150. Van den Berg M, Birnbaum L, Bosveld A T C, Brunström B, Cook P, Feeley M, Giesy J P, Hanberg A, Hasegawa R, Kennedy S W, Kubiak T, Larsen J C, Rolaf van Leeuwen F X, Liem A K D, Nolt C, Peterson R E, Poellinger L, Safe S, Schrenk D, Tillitt D, Tysklind M, Younes M, Wærn F, Zacharewski T. 1998. Toxic Equivalency Factors (TEFs) for PCBs, PCDDs, PCDFs for Humans and Wildlife. Environmental Health Perspectives, 106: 775-792. Wang T-Y, Lu Y-L, Dawson R, Shi Y-J, Zhang H, Xing Y. 2006. Effects of Environmental Factors on Organochlorine Pesticide Residues in Soils of the Guanting Reservoir Area, China. Journal of Environmental Science and Health, Part B: Pesticides, Food Contaminants, and Agricultural Wastes, 41: 309-321. Wania F, McLachlan M S. 2001. Estimating the Influence of Forests on the Overall Fate of Semivolatile Organic Compounds Using a Multimedia Fate Model. Environmental Science and Technology, 35: 582-590. Wania F. 2003. Assessing the potential of persistent organic chemicals for long-range transport and accumulation in polar regions. Environmental Science and Technology, 37: 1344-1351. Wenzel K-D, Hubert A, Weissflog L, Kühne R, Popp P, Kindler A, Schüürmann G. 2006. Influence of different emission sources on atmospheric organochlorine patterns in Germany. Atmospheric Environment, 40: 943-957. Whitlock J P, Okino S T, Dong L, Ko H P, Clarke-Katzenberg R, Ma Q, Li H. 1996. Induction of Cytochrome P4501A1: A model for analyzing mammalian gene transcription. FASEB, 10: 809-818. Whitlock J P. 1999. Induction of Cytochrome P4501A1. Annual Review of Pharmacology and Toxicology, 39: 103-125. Willett K L, Ulrich E M, Hites R A. 1998. Differential Toxicity and Environmental Fates of Hexachlorocyclohexane Isomers. Environmental Science and Technology, 32: 2197-2207.
Wong F, Harner T, Liu Q-T, Diamond M L. 2004. Using experimental and forest soils to investigate the uptake of polycyclic aromatic hydrocarbons (PAHs) along an urban-rural gradient. Environmental Pollution, 129: 387-398.
Xiao H, Li N, Wania F. 2004. Compilation, evaluation and selection of physical-chemical property data for α, β and γ-hexachlorocyclohexane. Journal of Chemical and Engineering Data, 49: 173-185. Xiao R, Wang Z J, Wang C, Yu G. 2006. Soil screening for identifying ecological risk stressors using a battery of in vitro cell bioassays. Chemosphere, 64: 71-78.
Zhu X, Pfister G, Henkelmann B, Kotalik J, Fiedler S, Schramm K-W. 2007. Simultaneous monitoring of PCDD/Fs and PCBs in contaminated air with semipermeable membrane devices and fresh spruce needles. Chemosphere, 68: 1623-1629.
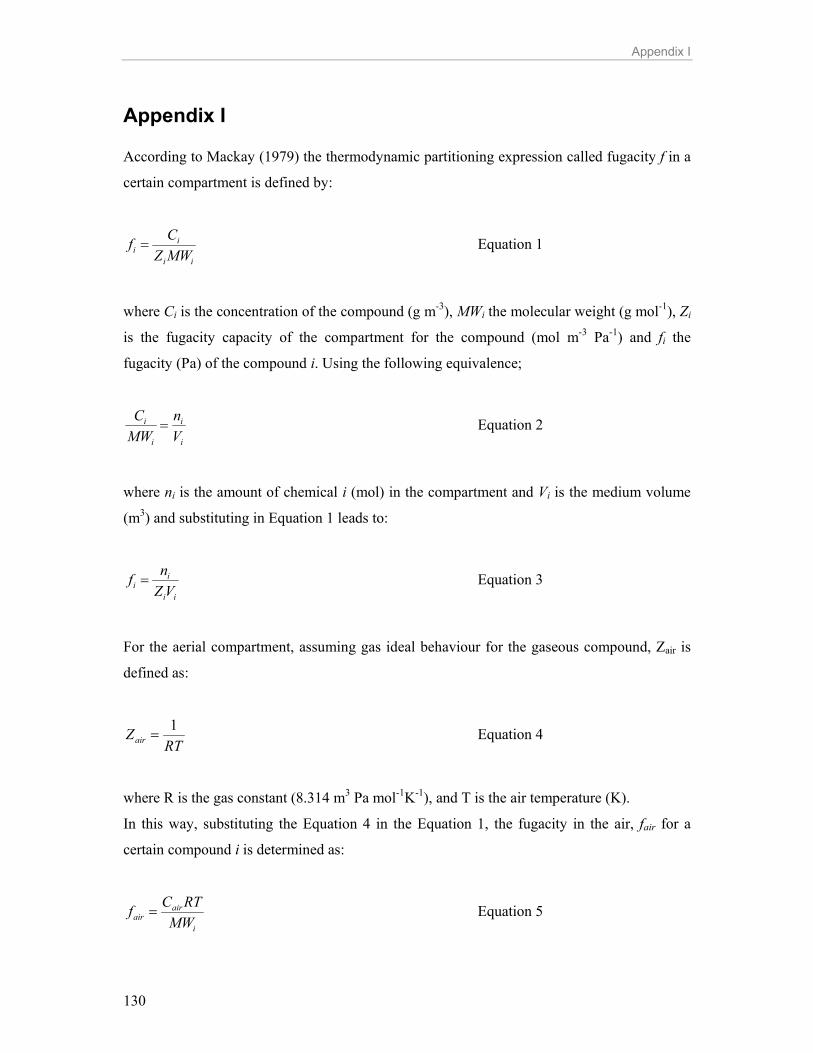
Appendix I
130
Appendix I According to Mackay (1979) the thermodynamic partitioning expression called fugacity f in a
certain compartment is defined by:
ii
ii MWZ
Cf = Equation 1
where Ci is the concentration of the compound (g m-3), MWi the molecular weight (g mol-1), Zi
is the fugacity capacity of the compartment for the compound (mol m-3 Pa-1) and fi the
fugacity (Pa) of the compound i. Using the following equivalence;
i
i
i
i
Vn
MWC
= Equation 2
where ni is the amount of chemical i (mol) in the compartment and Vi is the medium volume
(m3) and substituting in Equation 1 leads to:
ii
ii VZ
nf = Equation 3
For the aerial compartment, assuming gas ideal behaviour for the gaseous compound, Zair is
defined as:
RTZair
1= Equation 4
where R is the gas constant (8.314 m3 Pa mol-1K-1), and T is the air temperature (K).
In this way, substituting the Equation 4 in the Equation 1, the fugacity in the air, fair for a
certain compound i is determined as:
i
airair MW
RTCf = Equation 5

Appendix I
131
where Cair is the compound concentration in the gaseous phase (g m-3).
At equilibrium equal fugacity f exists between two phases and using the Equation 1 for the air
and SPMD compartments leads to:
SPMD
SPMD
air
air
iSPMD
SPMD
iair
airSPMDair Z
CZC
MWZC
MWZCff =⇒=⇒= Equation 6
As the SPMD-air partition coefficient Ksa under steady state is given by:
air
SPMDsa C
CK = Equilibrium partitioning Equation 7
Regrouping Equation 6 and equalling to Equation 7 is obtained:
air
SPMD
air
SPMDsa Z
ZC
CK == Equation 8
Under steady state, a partition coefficient is thus, the ratio of two Z values. The Z values,
which are both functions of the chemical and the medium, can be viewed as a chemical’s
solubility in, or affinity to a phase (Mackay, 1979). Therefore, high concentrations are
reached in phases for which Z is large. Considering depreciable the membrane fugacity
capacity (Zmembrane<< Ztriolein), ZSPMD can be approximated as:
trioleintrioleinmembraneSPMD ZZZZ ≈+= Equation 9
Considering the SPMD such as an “aerial fat compartment” able to accumulate compounds
and bearing in mind that Ksa can be approximated by Koa, Ztriolein can be defined as:
H
oa
H
satriolein K
KK
KZ
)1()1( Φ−≈
Φ−= Equation 10
KH is the Henry’s law constant (Pa m3 mol-1) and Φ is the particulate-phase fraction of the
compound (thus, 1-Φ is the gas-phase fraction). According to Harner et al. (2000), Φ can be
estimated using the equation:
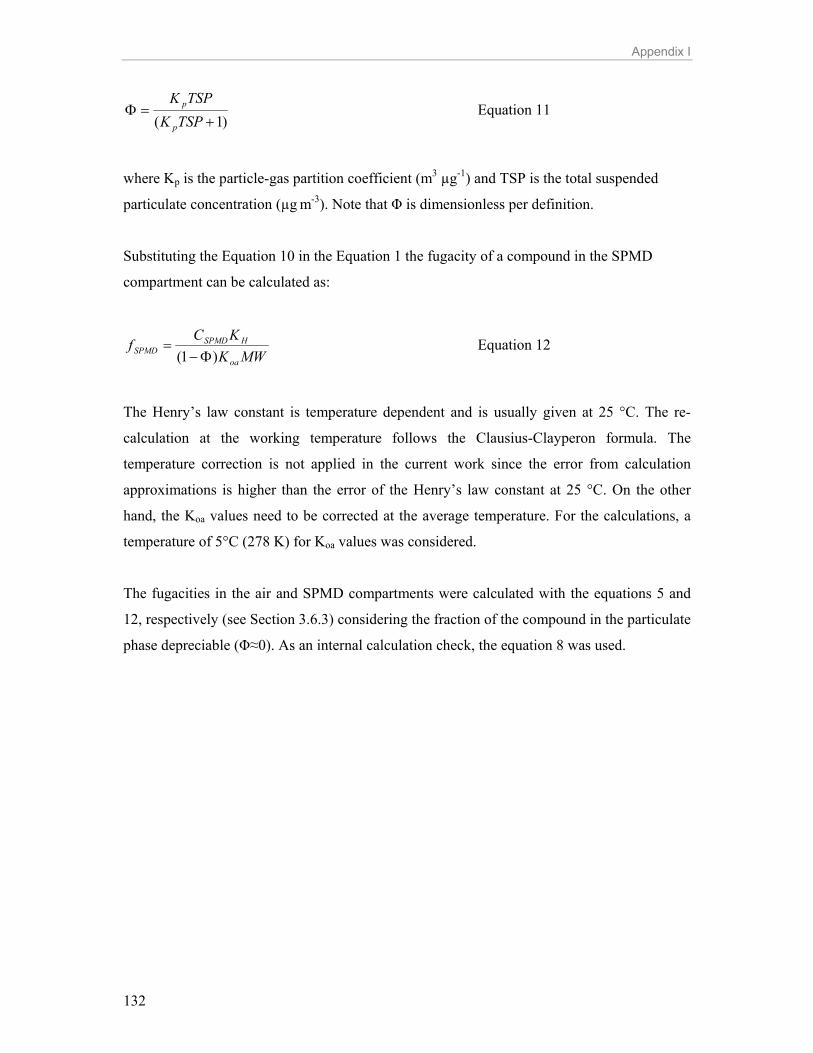
Appendix I
132
)1( +=Φ
TSPKTSPK
p
p Equation 11
where Kp is the particle-gas partition coefficient (m3 µg-1) and TSP is the total suspended
particulate concentration (µg m-3). Note that Φ is dimensionless per definition.
Substituting the Equation 10 in the Equation 1 the fugacity of a compound in the SPMD
compartment can be calculated as:
MWKKC
foa
HSPMDSPMD )1( Φ−
= Equation 12
The Henry’s law constant is temperature dependent and is usually given at 25 °C. The re-
calculation at the working temperature follows the Clausius-Clayperon formula. The
temperature correction is not applied in the current work since the error from calculation
approximations is higher than the error of the Henry’s law constant at 25 °C. On the other
hand, the Koa values need to be corrected at the average temperature. For the calculations, a
temperature of 5°C (278 K) for Koa values was considered.
The fugacities in the air and SPMD compartments were calculated with the equations 5 and
12, respectively (see Section 3.6.3) considering the fraction of the compound in the particulate
phase depreciable (Φ≈0). As an internal calculation check, the equation 8 was used.

Appendix II
133
Appendix II Scanning electron microscopies of SPMD deployed at a) DE-23-1 (830 m a.s.l.) and b) DE-23-4 1420 (m a.s.l.) for 1 year. Courtesy of the IFEM: Institut für Raster-Elektronenmikroskopie "Dr. Rudolf Hünert" (Hamburg, Germany). Scale 1mm.
a) b)