Case Study Analysis of a Heavily Loaded Road Pavement Structure Constructed on Black Cotton Soil
10
Case Study Analysis of a Heavily Loaded Road Pavement Structure Constructed on Black Cotton Soil John MUKABI a,1 , Mitsuo YAMADA b , Makur DABIER c Wyckliffe OCHIENG’ d , Bernard NJOROGE e , Leonard NGIGI f and John WAMBUGU g a,f Kensetsu Kaihatsu Consultants, Nairobi, Kenya b Urban/Siam Tone Corporation, Bangkok, Thailand c Ministry of Transport, Roads & Bridges, Juba, South Sudan d Louis Berger, Juba, South Sudan e College of Architecture & Engineering, University of Nairobi, Nairobi, Kenya g BP Contractors Ltd., Nairobi, Kenya Abstract. Under “The Emergency Study on The Planning And Support for Basic Infrastructure in Juba and The Surroundings in South Sudan”, a Project which was implemented under the Japanese Grant Aid through the Japan International Cooperation Agency(JICA), Juba River Port Access Road was designed and constructed as part of the Port Development Pilot Project. Sophisticated State of the Art engineering concepts and principles were employed during the study, to realize model design and method of construction as part of introducing appropriate technologies in Southern Sudan in order to foster rapid sustainable infrastructure development. OPMC stabilization and the Recap Methods, which realized cost savings of approximately 40% on the pavement layer components (base and sub-base courses) were employed in the construction. Due to the culture of overloading in Developing Countries and Africa in particular, coupled with the fact that the Juba River Port would be the main entry point and landing hub for bulk goods into South Sudan, a country which still has limited land transportation network and facilities, the Design ESAL was determined at a higher value of 14.25 × 10 6 (Traffic Class T7 of the TRL Road Note 31). Post-construction comprehensive monitoring, evaluation and analysis were undertaken, whereof the Case Study Analysis (CSA) is reported herein. The results of the Case Study Analysis indicate that the OPMC and Recap Methods were effective in containing the deformation of the heavily loaded pavement structure constructed on the partially improved Black Cotton Soil (BCS). Keywords. Pavement, structure, OPMC, ReCap, analysis, BCS, CSA Introduction The Juba River Port Access Road traverses areas that are predominantly overlain with BCS within swampy stretches. During the implementation of the stated Emergency Project, it was necessary to adopt cost-effective methods of improving the existing ground for purposes of reducing the quantities that would be required for the upper pavement layers (subbase and base courses) 1 John MUKABI: CEO, Kensetsu Kaihatsu Limited, A6 Mac Apts., Lavington, P. O. Box 35246- 00200, Nairobi, KENYA; E-mail: [email protected].
-
Upload
independent -
Category
Documents
-
view
1 -
download
0
Transcript of Case Study Analysis of a Heavily Loaded Road Pavement Structure Constructed on Black Cotton Soil

Case Study Analysis of a Heavily Loaded Road Pavement Structure Constructed on Black Cotton Soil
John MUKABIa,1, Mitsuo YAMADAb, Makur DABIER c Wyckliffe OCHIENG’ d,
Bernard NJOROGEe, Leonard NGIGIf and John WAMBUGUg a,f
Kensetsu Kaihatsu Consultants, Nairobi, Kenya b
Urban/Siam Tone Corporation, Bangkok, Thailand c Ministry of Transport, Roads & Bridges, Juba, South Sudan
d Louis Berger, Juba, South Sudan e College of Architecture & Engineering, University of Nairobi, Nairobi, Kenya
g BP Contractors Ltd., Nairobi, Kenya
Abstract. Under “The Emergency Study on The Planning And Support for Basic Infrastructure in Juba and The Surroundings in South Sudan”, a Project which was implemented under the Japanese Grant Aid through the Japan International Cooperation Agency(JICA), Juba River Port Access Road was designed and constructed as part of the Port Development Pilot Project. Sophisticated State of the Art engineering concepts and principles were employed during the study, to realize model design and method of construction as part of introducing appropriate technologies in Southern Sudan in order to foster rapid sustainable infrastructure development. OPMC stabilization and the Recap Methods, which realized cost savings of approximately 40% on the pavement layer components (base and sub-base courses) were employed in the construction. Due to the culture of overloading in Developing Countries and Africa in particular, coupled with the fact that the Juba River Port would be the main entry point and landing hub for bulk goods into South Sudan, a country which still has limited land transportation network and facilities, the Design ESAL was determined at a higher value of 14.25 × 10⁶ (Traffic Class T7 of the TRL Road Note 31). Post-construction comprehensive monitoring, evaluation and analysis were undertaken, whereof the Case Study Analysis (CSA) is reported herein. The results of the Case Study Analysis indicate that the OPMC and Recap Methods were effective in containing the deformation of the heavily loaded pavement structure constructed on the partially improved Black Cotton Soil (BCS).
Keywords. Pavement, structure, OPMC, ReCap, analysis, BCS, CSA
Introduction
The Juba River Port Access Road traverses areas that are predominantly overlain with BCS within swampy stretches. During the implementation of the stated Emergency Project, it was necessary to adopt cost-effective methods of improving the existing ground for purposes of reducing the quantities that would be required for the upper pavement layers (subbase and base courses)
1 John MUKABI: CEO, Kensetsu Kaihatsu Limited, A6 Mac Apts., Lavington, P. O. Box 35246-
00200, Nairobi, KENYA; E-mail: [email protected].
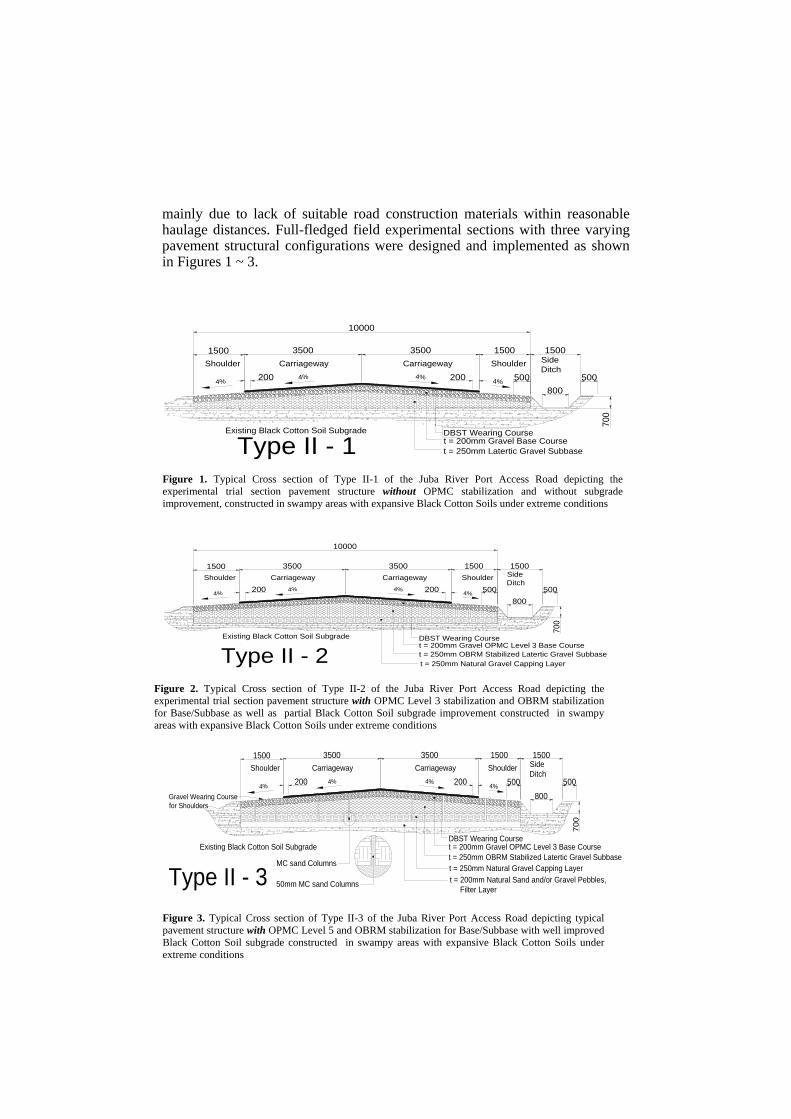
mainly due to lack of suitable road construction materials within reasonable haulage distances. Full-fledged field experimental sections with three varying pavement structural configurations were designed and implemented as shown in Figures 1 ~ 3.
Type II - 1Existing Black Cotton Soil Subgrade
t = 250mm Latertic Gravel Subbase
DBST Wearing Courset = 200mm Gravel Base Course
3500 3500 15001500 1500Shoulder Shoulder Side
DitchCarriagewayCarriageway
4%4%
4%4%
10000
800
700
200 200 500500
t = 250mm Natural Gravel Capping LayerType II - 2Existing Black Cotton Soil Subgrade
t = 250mm OBRM Stabilized Latertic Gravel Subbase
DBST Wearing Courset = 200mm Gravel OPMC Level 3 Base Course
3500 3500 15001500 1500Shoulder Shoulder Side
DitchCarriagewayCarriageway
4%4%
4%4%
10000
800
700
200 200 500500
Existing Black Cotton Soil Subgradet = 250mm OBRM Stabilized Latertic Gravel Subbase
DBST Wearing Courset = 200mm Gravel OPMC Level 3 Base Course
3500 3500 15001500 1500Shoulder Shoulder Side
DitchCarriagewayCarriageway
4%4%
4%4%
800
700
200 200 500500
t = 250mm Natural Gravel Capping Layert = 200mm Natural Sand and/or Gravel Pebbles, Filter Layer
MC sand Columns
Gravel Wearing Coursefor Shoulders
50mm MC sand ColumnsType II - 3
Figure 1. Typical Cross section of Type II-1 of the Juba River Port Access Road depicting the experimental trial section pavement structure without OPMC stabilization and without subgrade improvement, constructed in swampy areas with expansive Black Cotton Soils under extreme conditions
Figure 2. Typical Cross section of Type II-2 of the Juba River Port Access Road depicting the experimental trial section pavement structure with OPMC Level 3 stabilization and OBRM stabilization for Base/Subbase as well as partial Black Cotton Soil subgrade improvement constructed in swampy areas with expansive Black Cotton Soils under extreme conditions
Figure 3. Typical Cross section of Type II-3 of the Juba River Port Access Road depicting typical pavement structure with OPMC Level 5 and OBRM stabilization for Base/Subbase with well improved Black Cotton Soil subgrade constructed in swampy areas with expansive Black Cotton Soils under extreme conditions

As depicted in Figures 2 and 3, the ReCap, MCI and OPMC Strut Imbedding Techniques [1] were applied in improving the subgrade while the subbase and base courses were stabilized using the OBRM and OPMC methods respectively. The Comprehensive Method of Design (CMD) was employed [2].
1. Survey, Monitoring and Testing Procedures
Details of the survey, monitoring and testing procedure are reported in the “Innovative Laboratory and In-situ Methods of Testing in Geotechnical Engineering” [3] and the Juba River Port Access Road Engineering Report No. SST1[4]. A summary of the main tests citing the purpose of the test and the engineering parameters determined in relation to the Case Study Analysis is presented in Table 1.
Table 1 Summary of main tests, purpose and engineering parameters determined Prop. Description of Test Purpose of Test/Engineering Parameters
Determined in Reference to this Case Study Analysis Ref. Eq.
1 (BPP)
1.1 Moisture Content Variation
1.2 Field and Lab. Density
Comparative Analysis for mainly quantifying Moisture-Suction Variation, ΔMc, ρ
1
2 (MS)
Sieve Analysis Comparative Analysis to determine state of Mechanical Stabilization, η, δ, Ms
f, Bc, fBSR, foptRrc
2,3
3 (SC)
3.1 Field Deflection Testing 3.2 Innovative Soil Profiling 3.3 ST Geophysical Sounding
1. Determine Existing Structural Capacity, fSCe
2. Predict Structural Capacity Soundness, fSCt
3. Compute Maintenance Requirement Ratio, MRR
9 to 15
4 (UCS) (SS)
(EM)
4.1 Dynamic Cone Penetration 4.2 Laboratory UCS 4.3 Laboratory CUTC 4.4 Modified Laboratory VDL
1. Determine Consolidation Properties, SC, STC, LTC, Creep ( aε ), CAS (
aσc), CLS ( rσ c), CSRF(δCSR)
2. CS (qu, Cu), Modulus of Deformation (E50), EEM (EE), 3. Deviator Stress, (q), Axial Stress, ( aσ ), Lateral Stress,
( rσ ), Angle of Shearing Resistance, (Φ), Elastic Modulus, (E), Shear Modulus (G), Modulus of Deformation, (Eε, Gγ), Secondary Yield Strain, YS, Mean Effective Stress (p΄)
4.Degree of Particle Interlocking(Iφ′ ), uI Cφ′ ratio( S
I ),
Shear Strength (fτ ), Dynamic Modulus (ED),
16
to
23
5 (EM)
In-situ Geophysical Testing 1. Initial Elastic Modulus, (E0), Shear Modulus (G0) 2. Geophysical Profile (GP)
21 32
6 Innovative Stage Loading Tests
Refer to Mukabi et al. (2013) [3]
Notes: Prop – Property, BPP - Basic Physical Properties, SC – Structural Capacity, ST - Structural Thickness, SS- Shear Strength, UCS – Unconfined Compressive Strength, CUTC – Consolidation Undrained Triaxial Compression, VDL – Vibrational Dynamic Loading, SC , STC, LTC, – Secondary , Short Term and Long Term Consolidation, CAS – Consolidation Axial Stress, CLS – Consolidation Lateral Stress, CSRF – Consolidation Shear Stress Factor, US – Compressive Strength, EEM – Empirical Elastic Modulus, EM - Elastic Modulus

2. Theories and Concepts Adopted for Case Study Analysis
The fundamental theories and concepts adopted for the comprehensive Case Study Analysis are discussed in detail in [3] and [4], whilst some of the derived basic functions are presented this section. The basic functions were derived to characterize the impact of environmental factors on the performance of the road pavement to evaluate the change in the intrinsic material characteristics influenced by nature, mode and degree of stabilization in relation to the reciprocal impact and intensity of loading.
2.1. Analysis of Strength, Deformation Resistance, Mechanical Stability and Structural Capacity
The analyses for strength, deformation resistance, mechanical stability and structural capacity were undertaken mainly through the application of Eqs. (1) ~ (15).
• Quantitative Analysis of impact of moisture ~ suction variation on the performance of the varying pavement structural configurations
𝐸𝑚𝑎𝑥 = {𝐴𝐸𝑚𝑠∆𝑀𝑐
4 + 𝐵𝐸𝑚𝑠∆𝑀𝑐3 + 𝐶𝐸𝑚𝑠∆𝑀𝑐
2 − 𝐷𝐸𝑚𝑠∆𝑀𝑐} × 𝑓𝑃𝐼 × 10𝑚 + 𝐸𝑖𝑚𝑎𝑥
(MPa) (1)
where Emaxis the elastic modulus and AEms = 8 × 10⁻⁴, BEms = 1 × 10⁻³, CEms= 2.3 × 10⁻² and DEms = 0.32 are constants
The results of this analysis are presented in Table 2.
• Quantative Analysis of contribution of enhanced mechanical stabilization
η161.exp−= MSf
S AM (2)
fSBN MA
CB expδ= (3) when, 0<η<0.5 where, Mf
S is the Mechanical Stability factor, and in this case, AMS is the MS constant=178.6, η is the gradation index = log0.01P/log(d/dmax), MS
ideal =100, BC is the bearing capacity factor, ABN is the BC constant=130. The results of the quantitative analysis of the mechanical stability and bearing capacity are summarized in Table 2.
• Particle agglomeration characteristics during consolidation
𝛿𝐶𝑆𝑅 = 𝐴𝛿𝑙𝑛𝑎𝑤 + 𝛿𝐶𝑆𝑅𝑖 (4)
where δCSRis the consolidation stress ratio factor, Aδ = 7.6

• Contribution of particle agglomeration in enhancing strength and elastic modulus due to cementation
𝑞𝑚𝑎𝑥 = 𝐴𝑞𝑙𝑛𝑎𝑤 + 𝑞𝑚𝑎𝑥𝑖 (MPa) (5)
where qmaxis the deviator stress from CUTC tests and Aq = 1.06 𝛷′ = 𝐴𝛷𝑎𝑤2 + 𝐵𝛷𝑎𝑤 + 𝛷′
𝑖 (6)
where Φ′ is the angle of shearing resistance and AΦ = 0.05 and BΦ = 0.95
𝐸𝑚𝑎𝑥 = 𝐴𝐸𝑀𝑎𝑤2 + 𝐵𝐸𝑀𝑎𝑤 + 𝐸𝑚𝑎𝑥𝑖 (MPa) (7)
where Emaxis the elastic stiffness, AEM = 62.4 and BEM = 690
• Influence of curing and ageing
𝑞𝑢𝑓 = [𝑞𝑢𝑖 /𝐴𝑞] × 𝑙𝑛𝐶𝑝 + 𝐵𝑞 (8)
where quf , qui are the final and initial UCS, Aq8.3, Cpis the curing period in hrs.
and Bq = 3.4.
• Magnitude of Representative Rebound Deflection for structural analysis
The magnitude of the (RRD), δRD was computed from;
[ ] fc
tc
avRD LV f ××+=δ
δδ 502 ..
(9)
where, δav. is the average value of deflection measured under a wheel load of 5tons, V is the variance of the measurements and f tc
δ is the temperature correction factor.
t
RTtcf δ
δδ= (10)
where, RTδ is the RRD determined at t=21°C and tδ , which is computed from:
δδδδδ PtCtBtAt −+−= 33 (11)
where, Aδ=7.2X10⁻⁵, Bδ=7.6X10⁻³, Cδ=0.27 and Dδ=2.7 are deflection-temperature related constants, while t is the average temperature of the asphaltic layers; t >16.5°C.
• Prediction of deterioration of structural capacity with time progression
The deterioration with time of the structural capacity is predicted by adopting Eqs. (12) ~ (15). The results for this Case Study are plotted in Figure 2.
𝑓𝑠𝑐𝑡 = 𝑓𝑠𝑐𝑖 × (ℓ𝓃𝑁𝑡0.62)−1 × �1 + 0.1𝑙𝑜𝑔𝑁𝑡𝑅
𝑓𝑠𝑐𝑅� × ℮0.01𝑁𝑡
(12)

where fscR = Reference Structural Capacity when Nt = 2.2Years.
Environmental factors such as moisture-suction variation due to seasonal changes, inferior material intrusion as a result of the combined effects of dynamic loading and water infiltration (pumping) and land use, which are known to affect the structural capacity and pavement structural layer thickness, are quantitatively analyzed and factored into the generalized Eq. (12) by applying Eqs. (13) and (14).
𝑓𝑑𝑓𝑡 𝑓𝑑𝑓𝑡 = �℮�0.01𝑓𝑑𝑓𝑑 𝑁𝑡��
−1 (13)
The factor 𝑓𝑣𝑓𝑑 , which defines the variation with time in environmental factors is
computed as,
𝑓𝑣𝑓𝑑 = 𝑓𝑚𝑠𝑣
𝑑 × 𝑓𝑖𝑛𝑡.𝑑 × 𝑓𝑡ℎ𝑑 (14)
where, 𝑓𝑚𝑠𝑣𝑑 = moisture~suction depreciating factor,𝑓𝑖𝑛𝑡𝑑 = BCS intrusion depreciating
factor, 𝑓𝑡ℎ𝑑= pavement layer thickness depreciating factor.
• Computation of Maintenance Requirement Ratio (MRR) The computation of the MRR was made from Eq. (15) based on the results of the Structural Capacity and Deformation Resistance (SCDR) model by adopting the TA parameter over a loading period Nt and Design Life, DL.
𝑀𝑅𝑅 = 𝑇𝐴{𝑁𝑡=𝐷𝐿}
𝑇𝐴{𝑁𝑡=2.2} × 𝑓𝑆𝐶
𝑑{𝑁𝑡=10} × 𝑇𝐴{𝑁𝑡=0.5𝐷𝐿}
𝑇𝐴{𝑁𝑡=2.2} × [𝑁𝑡=0.5𝐷𝐿
𝑁𝑡=𝐷𝐿] × 𝐹𝑆 (15)
2.2. GECPROM modules and functions adopted for Case Study Analysis and Modeling
• Structural recoverability modules and functions
𝐸𝑜𝑆𝑅 = 𝒜𝑆𝑅𝐸 ln 𝑡𝑆𝐶𝑆𝑅 + 𝐸𝑜𝑃𝑑(𝑡𝑆𝑇𝐶)(MPa) (16)
The Secondary Consolidation Time (SCT) required to achieve the structural recoverability initial modulus is computed from Eq. (17).
𝑡𝑆𝑐𝑆𝑅(𝐸𝑜𝑆𝑅) = 𝑒𝑥𝑝. �𝐸𝑜𝑆𝑅−𝐸𝑜𝑃𝑑(𝑡𝑆𝑇𝐶)
𝒜𝑆𝑅�(˟10-2days) (17)
where, 𝐸𝑜𝑆𝑅 is the initial modulus after quasi structural recoverability, 𝐸𝑜𝑃𝑑(𝑡𝑆𝑇𝐶) is the post-destructuration initial modulus determined after Short-Term Consolidation (STC) and 𝒜𝑆𝑅
𝐸 =19.3˟10(m-2) is LTC related material constant.
• Destructuration caused by excessive densification
During this Study, prolonged heavy dynamic loading was observed to cause destructuration in the BCS layers. This phenomenon was simulated in the laboratory by adopting the SHANSEP concept. The basic definition functions of this characterization

are presented in the following equations where the degree of destructuration due to excessive densification is expressed as a function of OCR.
𝐸𝑜𝑅 =(𝐸𝑜)𝑦𝑅
(𝐸𝑜)𝑅𝑒𝑓.× 104 × � 𝒜𝑂𝐶𝑅𝑂𝐶𝑅4 − ℬ𝑂𝐶𝑅𝑂𝐶𝑅3
+𝒞𝑂𝐶𝑅𝑂𝐶𝑅2 − 𝒟𝑂𝐶𝑅𝑂𝐶𝑅 + ℰ𝑂𝐶𝑅� (MPa) (18)
where, ( )R
oE is the resulting initial modulus, ( )refoE = 915 (Mpa) is the reference
initial modulus, ( )PyoE is the pseudo-yield initial modulus determined at the stress level
(pseudo-yield stress) which is higher than the yield stress ( )yaσ ′ and from which the
specimen is rebound defined as;
( ) ( ) ( ) ( )[ ] 390.NCyao
Pyao
Pyo ao
EE σσσ ′′×= ′(MPa) (19)
and, 𝒜𝑂𝐶𝑅=0.225, ℬ𝑂𝐶𝑅=1.78, 𝒞𝑂𝐶𝑅=5.22, 𝒟𝑂𝐶𝑅=6.85 and ℰ𝑂𝐶𝑅=4.1 are constants for stiff to hard Pleistocene and OPMC treated geomaterials.
• For OCR>2.5
( ) 390.−×= OCREE Pyo
Ro (MPa)
(20)
• Destructuration caused by remolding (reconstitution)
Reconstitution of natural clays results in total remolding and destructuration of the vital structural components, fabric, diagenetic properties, inherent anisotropy and transformation to enhanced rheological behavior of otherwise well cemented and highly structured clays. On the other hand, road construction materials are, in practically all cases, always remolded prior to use. Furthermore, since most of the existing theories and models that define deformation and strength characteristics of clays are based on remolded clays, extensive study of this subject to facilitate for the necessary modification of such constitutive models is certainly vital. In this analysis, a Destructuration Index, 𝒟𝐼 which defines the degree of destructuration as a result of persistent heavy dynamic and/or seismic loading, is introduced as:
[𝐺𝑜]𝐼 = � 𝜇𝑒𝑅𝜂𝑐𝐾𝑐𝑓𝑅 −�𝜇𝑒𝑅𝐴𝜙𝑓𝐶𝑆𝑅
𝑅 �� × 𝒟−1 × [𝐺𝑜]𝑅(MPa) (21)
where, [𝐺𝑜]𝐼 is the initial shear modulus of the intact ground and [𝐺𝑜]𝑅 is the initial shear modulus determined from CUTC/CDTC laboratory tests performed on specimens reconstituted from the original clayey geomaterial.
The corresponding elastic yield strain is determined as:
[𝜀𝑎]𝑌𝐼𝐼 = � 𝜇𝑒𝑅𝜂𝑐
𝐾𝑐𝑓𝑅 −�𝜇𝑒𝑅𝐴𝜙𝑓𝐶𝑆𝑅
𝑅 �� × 𝒟−1 × [𝜀𝑎]𝑌𝐼
𝑅 (%) (22)
The peak shear strength defined in terms of deviatoric stress, 𝑞𝐼, mean effective stress, 𝑝𝐼′ and angle of internal resistance, 𝜙𝐼′ are computed from Eq. (23).
[𝑞𝑚𝑎𝑥]𝐼 = � 𝜇𝑒𝑅𝜂𝑐𝐾𝑐𝑓𝑅 −�𝜇𝑒𝑅𝐴𝜙𝑓𝐶𝑆𝑅
𝑅 �� × 𝒟−1 × [𝑞𝑚𝑎𝑥]𝑅 (23)

3. Summary of some Case Study Analysis Results
A summary of some of the results of the Case Study Analysis is presented in Table 2. It can be noted that Type II-3 pavement structure exhibits the most superior behavior, whilst Type II-1 is most susceptible to moisture-suction changes. On the other hand, Table 3 summarizes the analytical results that show the influence of particle agglomeration on strength and deformation resistance as a result of time dependent cementation and consolidation, the characteristics of which are depicted in Figure 1 for the base course layer. It can be observed that particle agglomeration and consolidation effects are more predominant in the base course layers that were stabilized by applying the OPMC technology (Type II-2 and Type II-3).
Table 2 Summary of vital Geotechnical Engineering parameters
Table 3 Influence of particle agglomeration on strength and deformation resistance as a result of time dependent cementation and consolidation
POST CONSTRUCTION PERIOD (DAYS) TYPE PARA 1 3 7 14 28 56 224 448 896 1092 TYPE II-1
UCS (MPa)
0.4 0.55 0.59 0.63 0.66 0.69 0.76 0.79 0.83 0.84 TYPE II-2 0.71 1.91 2.47 3.47 5.61 6.78 10.8 11.4 12.0 12.1 TYPE II-3 1.12 3.10 3.92 4.92 7.06 8.23 18.2 19.4 20.6 20.9 TYPE II-1
Emax (MPa)
693 786 928 1044 1160 1276 1508 1625 1741 1774 TYPE II-2 1432 3492 6160 10223 18993 23368 27953 29553 31154 31623 TYPE II-3 2062 8670 11556 15967 24556 29806 34451 36858 39665 40123 TYPE II-1 (εa)ELS˟
10-3(%)
0.086 0.098 0.116 0.131 0.146 0.161 0.191 0.206 0.221 0.225 TYPE II-2 0.155 0.165 0.266 0.427 0.790 0.982 1.153 1.238 1.323 1.344 TYPE II-3 0.326 0.692 0.936 1.262 1.548 1.838 2.193 2.354 2.515 2.579
GEOTECHNICAL ENGINEERING PARAMETERS Moisture~Suction Variation MS Particle Agglomeration Ageing Load TYPE OF PAV.
Layer Type
𝒒𝒒𝒖𝒖(𝑴𝑴𝑴𝑴𝑴𝑴) @ΔMc=
𝑬𝑬𝒎𝒎𝑴𝑴𝒎𝒎(𝑴𝑴𝑴𝑴𝑴𝑴) @ΔMc=
𝑴𝑴𝒔𝒔𝒇𝒇
% 𝑩𝑩𝒄𝒄 %
𝜹𝜹𝑪𝑪𝑪𝑪𝑪𝑪 𝒒𝒒𝒎𝒎𝑴𝑴𝒎𝒎 𝑴𝑴𝑴𝑴𝑴𝑴
𝞥𝞥′ (˚)
𝑬𝑬𝟎𝟎 𝑴𝑴𝑴𝑴𝑴𝑴
𝒒𝒒𝒖𝒖𝑪𝑪 MP
𝑬𝑬𝒎𝒎𝑴𝑴𝒎𝒎𝑳𝑳𝑳𝑳𝑪𝑪 MPa
𝑰𝑰𝑮𝑮𝒇𝒇 𝑳𝑳𝑰𝑰𝒇𝒇
˗5%
0%
+5%
0 % +5% DT
DT
CUTC
CUTC
CUTC
GEO
DCP
CUTC
DT
DT
TYPE II-1
BC 1.1 .8 .7 1625 1179 67 63 34 1.3 25 1854 1.1 1901 - -
SB 0.7 .55 .32 1331 946 59 54 23 .88 22 1519 .73 1606 - -
CL - - - - - - - - - - - - - - -
ISG - - - - - - - - - - - - - - -
NSG .05 .04 .03 82 56 31 29 1.7 .06 15.5
295 .14 357 - -
TYPE II-2
BC 15 11 9.9 29953
23295 84 79 67 18 33 30122
14 30228
- -
SB 8.9 6.7 5.1 21189
18331 79 74 34 11 25 21272
11 21464
- -
CL 3.6 2.7 2.1 8481 6615 56 53 14 4.3 19 8638 3.3 8756 - -
ISG - - - - - - - - - - - - - - -
NSG .05 .04 .03 84 56 31 29 1.7 .06 16 294 .14 363 - -
TYPE II-3
BC 26 19 18 36859
31330 93 87 63 31 35 36943
22 37134
- -
SB 8.9 6,7 5.1 26073
22868 89 84 34 11 25 26231
12 26348
- -
CL 3.6 2.7 2.1 8481 6615 70 66 14 4.3 19 12187
3.7 12712
- -
ISG .95 .72 .55 3794 2417 63 59 2.4 1.2 17 3993 .81 4069 - -
NSG .05 .04 .03 84 56 31 29 1.7 .06 16 294 .14 363 - -
COMPO. PAVE
TYPE II-1
.25 .19 .14 418 246 43 41 8.1 .31 18 477 .23 693 17 3
TYPE II-2
3.4 2.6 1.9 1332 947 57 53 13 4.1 18 1428 3.2 1607 17 3
TYPE II-3
5.1 3.9 2.9 12714
10399 72 68 34 6.2 20 12329
4.8 12989
17 3
REF. Eq. (1) (1) (1) (2) (2) (4) (8) (9) 10 11 12 13 21 37 38
Notes : PAV. – Pavement, MS – Mechanical Stabilization, IGf - Intensity Growth Factor, LIf - Load Intensity Factor, BC – BaseCcourse, SB – Subbase, ISG – Improved Subgrade, NSG – Natural Subgrade, COMPO. PAVE– Composite Pavement

4. In-situ Modeling of Response of Varying Pavement Structural Configurations
The behavior of the three types of varying pavement structures was modeled by using the GECPROM [5]. Basically, for Type II-2 and Type II-3 pavement structures, the initial phase of loading is seen to progressively enhance intrinsic particle agglomeration (ref. to Eqs. (4) ~ (8), and secondary consolidation as a result of the heavy traffic loading (ref. to Figure 1).
Table 4 Summary of GECPRO/SCDR Model Parameters
Figure 1. Variation in elastic stiffness with pavement layer quality- measured vs. predicted
It can be derived from Figure 1 that; 1) Type II-1 pavement structure shows extremely low deformation resistance, 2) the OPMC stabilized layers exhibit high deformation resistance, 3) the ground improvement method for the black cotton soil subgrade achieved significant results contributing immensely to the enhanced performance of Type II-3 composite pavement structure and, 4) the modeled and measured curves show an appreciably good agreement.
GECPROM/SCDR MODELING PARAMETERS Quasi-Structural Recoverability Destructuration TYPE OF PAV.
Layer Type
𝑬𝑬𝟎𝟎𝑪𝑪𝑪𝑪 (MPa)
𝒕𝒕𝑪𝑪𝑪𝑪𝑪𝑪𝑪𝑪 Days
[𝜺𝜺𝑴𝑴]𝒀𝒀𝑰𝑰𝑪𝑪𝑪𝑪 (%)
𝑬𝑬𝟎𝟎𝑴𝑴𝑪𝑪 (MPa)
[𝜺𝜺𝑴𝑴]𝒀𝒀𝑰𝑰𝑪𝑪𝑪𝑪 (%)
𝑬𝑬𝟎𝟎𝑪𝑪 (MPa)
[𝜺𝜺𝑴𝑴]𝒀𝒀𝑰𝑰𝑪𝑪 (%) ˟10-3
(𝑮𝑮𝟎𝟎)𝑰𝑰 (MPa)
[𝜺𝜺𝑴𝑴]𝒀𝒀𝑰𝑰𝑰𝑰 (%)
𝒒𝒒𝒎𝒎𝑴𝑴𝒎𝒎𝑰𝑰 (MPa)
(𝒑𝒑𝒇𝒇′ )𝑰𝑰 (MPa)
𝞥𝞥𝒇𝒇′𝑰𝑰
(˚)
˟10-3 ˟10-3 SHANSEP Remolding TYPE II-1
BC 1634 1065 .488 1686 .513 1063 .366 524 .488 1.2 1.3 25 SB 1356 1038 .377 1392 .389 787 .271 423 .367 0.8 1.0 22 CL - - - - - - - - - - - - ISG - - - - - - - - - - - - NSG 86 477 .026 89 .033 4.7 .014 23 .038 .068 .12 15
TYPE II-2
BC 30312 3833 .184 30570 1.92 23659 1.49 9973 2.01 17.8 13.4 33 SB 22146 722 .516 22244 .556 15059 .396 7182 .583 10.2 10.4 25 CL 8544 272 .347 8675 .373 5126 .242 2748 .392 4.1 5.62 19 ISG - - - - - - - - - - - - NSG 92 503 .031 96 .037 49 .016 26 .042 .069 .13 16
TYPE II-3
BC 37126 2015 2.38 37256 2.45 32298 2.08 12396 2.63 30.7 21.8 35 SB 26583 3244 .633 26593 .667 18342 .501 8761 .688 10.6 11.1 24 CL 12677 555 .381 12956 .396 7862 .269 4126 .411 4.7 6.74 18 ISG 3823 207 .174 3943 .181 2217 .109 1254 .172 1.21 1.83 17 NSG 97 523 .036 99 .039 52 .019 31 .045 .07 .15 16
COMPO.
TYPE II-1
454 124 .126 493 .132 271 .092 147 .136 .33 .49 17
TYPE II-2
1363 171 .367 1401 .386 911 .289 423 .392 4.54 6.29 18
TYPE II-3
12924 372 .527 13133 .574 11163 .488 4108 .516 6.57 8.89 19
REF. Eq. (21) (22) (23) (25) (26) (27) (30) (32) (33) (34) (35) 36
0
200
400
600
800
1000
0 10000 20000 30000 40000 50000
Dept
h (m
m)
Type II-1: Geophysical MeasurementsType II-2: Geophysical MeasurementsType II-3: Geophysical MeasurementsType II-1: Predicted by GECPROMType II-2:Predicted by GECPROMType II-3: Predicted by GECPROM
Notes : PAV. – Pavement, MS – Mechanical Stabilization, IGf - Intensity Growth Factor, LIf - Load Intensity Factor, BC – Base Course, SB – Subbase, ISG – Improved Subgrade, NSG – Natural Subgrade, COMPO. PAVE– Composite Pavement
Elastic Stiffness (MPa)

5. Analysis of Predicted and Actual Pavement Structural Performance
Figure 6 shows a comparison of the predicted and actual performance based on the results from deflection testing and prediction made from the Structural Capacity Depreciation (SCDR) model for the three varying pavement structural configurations. It can be inferred that Type II-1 approaches the critical zone, which is an indication of the requirement of fully-fledged rehabilitation, after only 4.6 years, whereas Type II-3 is structurally sound over the whole period of the Design Life (DL).
Figure 2. Progressive time dependent structural capacity depreciation of three types of pavement structures
On the other hand, based on Eq. (15) and the SCDR results, the Maintenance
Requirement Ratio (MRR), was generated for the three varying pavement configurations over the entire period of the Design Life (DL=20years). The results indicated that; {Type II-1}MRR=2.86, {Type II-2}MRR=0.88, {Type II-3}MRR=0.43.
6. Conclusions
Comprehensive Case Study Analyses were carried out consistently over a post-construction period of approximately 4 years employing sophisticated geotechnical engineering concepts and advanced analytical tools. It can be inferred that the innovative technologies applied for the Type II-3 design realized significant increase in the strength, deformation resistance, mechanical stability and structural capacity.
References
[1] Mukabi J.N., Kotheki S., Ngigi A., Gono K., Njoroge B.N., Murunga P.A., Sidai V. (2010e). Characterization of Black Cotton Soil under static and dynamic loading. Published in Proceedings of the International Conference on Geotechnical Engineering (ICGE), Tunis, Tunisia.
[2] Mukabi J.N 2007a. Unique Methods of Enhancing Engineering Properties of Geomaterials for Slopes, Embankments and Pavement Structures. Proceedings of the 23rd World Road Congress. Paris, France.
[3] Mukabi J.N (2013). Innovative Laboratory and In-situ Methods of Testing in Geotechnical Engineering, to be published in the Proceedings of the Int. Conference of the Institute of Engineers of Kenya.
[4] Kensetsu Kaihatsu Consultants. (2007). Juba River Port Access Road Design. A Comprehensive Study, Design and Method of Construction, Engineering Report No. SST1. Juba, South Sudan
[5] Mukabi J.N., (2011d) Characterization and Modeling of Various Aspects of Pre-failure Deformation Clayey Geomaterials, to be published.
0.4
0.5
0.6
0.7
0.8
0.9
1
1.1
1.2
0 2 4 6 8 10 12 14 16 18 20 22
SCD F
acto
r, fsc
Time Progression, Nt (Years)
Structural Capacity Depreciation Factor Vs. Time Progression
TYPE II-1 PREDICTEDTYPE II-2 PREDICTEDTYPE II-3 PREDICTEDTYPE II-2 ACTUALTYPE II-3 ACTUALTYPE II-1 ACTUAL
Terminal Level Line
Critical Zone